


Abstract
At the Ity gold deposit (Ivory Coast), carbonate-buffered tropical weathering fundamentally controlled the redistribution and enrichment of gold and associated metals within the Flotouo weathering profile. Primary mineralisation formed through skarn development at quartz diorite contacts, followed by mesothermal stages around 2 Ga, establishing the initial Au and trace-metal endowment. Hypogene processes alone, however, cannot explain the present distribution and concentration of Au, Cu, Mo, Bi, Sn, and W. Cenozoïc tropical weathering profoundly transformed the ores through coupled sulphide oxidation and carbonate dissolution. Oxidation of sulfides releases metals into circulating fluids. At the same time, dissolution of marble lenses buffered the pH towards near-neutral conditions, limiting long-distance metal transport and favouring local residual enrichment and secondary immobilisation. These processes, together with leaching of Ca, S, and Si, increased porosity and permeability, promoted fluid flow through karstic voids and collapse breccias. A lateritic blanket extends above the saprolitised hypogene ores. A systematic vertical mineralogical zonation developed across the profile, with goethite-dominated laterite at the top, kaolinite-rich saprolite in the middle, and smectite-bearing horizons at depth. This study highlights the key role of pH-buffered tropical lateritisation in upgrading pre-existing skarn-related mineralisation and producing atypical trace-metal enrichments in Birimian gold systems, providing a mechanistic framework relevant for regional exploration models.
1. Introduction
The Ity deposit in the Ivory Coast is one of the most significant gold resources in West Africa, with reserves exceeding 1 million oz Au. The lateritic weathering profiles exerted a substantial influence on economic enrichment, as the prothore is only subeconomic. Although the Ity gold deposit has been the focus of several geological and metallogenic studies [1,2,3,4,5], most work has concentrated on the primary skarn-related mineralisation and its hydrothermal overprint. In contrast, the mineralogical and geochemical characteristics of the lateritic profile remain poorly constrained, despite their importance for understanding supergene enrichment and the final metal budget.
Since the 1980s, such weathered gold deposits have garnered worldwide attention due to their advantages [6]: large scale, readily exploitable (loose ore and open-pit), easy milling and metallurgy, especially higher extraction ratios (larger than 75%), and significant investment returns. In fact, several lateritic-type gold deposits worldwide have been studied, and their ore-forming mechanisms have been revealed: Australia [7,8], Brazil [9,10], Cameroon [11], Gabon [12], China [6,13], and French Guiana [14,15]. A synthetic overview of the main factors controlling the enrichment, dispersion, and reconcentration processes was recently proposed by Iglesias-Martinez et al. [16] as a function of climate and landforms.
In the Ivory Coast, the first gold survey at Ity began in 1957, leading to the discovery of the deposit. It has been considered a weathered Au skarn deposit [1,4]. Thus, Lajoinie and Fonteilles [1] found that the geochemical features of the weathered rocks excluded a purely lateritic origin of the mineralisation and strongly favoured its endogenous character. For these authors, before being submitted to weathering, the Ity gold deposit could be related to the magnetite skarn type with low-grade gold. Recent fluid inclusion studies have shown that Ity is likely a mesothermal Au deposit associated with a hot spot, formed during later deformation stages than the skarn formation [5].
Several studies were carried out on the lateritic part of this deposit, where the most economic ores are located: (i) Granier et al. [17] studied the shape of geochemical anomalies of gold and copper in the lateritic part of the deposits. They conclude that these two elements exhibit identical dispersion aureoles, characterised by a “mushroom effect” of surface gold dispersion in laterite, an observation confirmed by Camus et al. [18]. They described fine gold particles in saprolite and increasing particle size in nodular laterite horizon; (ii) the composition and microcrystal morphology of gold were studied by Naho [19]. He found primary characters: a high-grade silver and a very irregular morphology of native gold. Mine reports [20,21] document a thick saprolite layer (50–120 m) overlying skarn, overlain by a lateritic horizon (minimum ~10 m), and consider supergene zones (“terres noires”, e.g., “black earth” lenses) as the most economic horizons.
Since the opening of the pit in 1991, and with the possibility of 3D observation, new weathered ore facies located below the lateritic crust have become available. Mining reports [20,21] summarise the targeting of the supergene blanket, the resource estimation, and the mining strategy, based on drilling logs, macroscopic mineralogical observations, and technical considerations. However, few detailed mineralogical characterisations of the supergene assemblages are available. Mathian et al. [22] developed a methodological study specifically designed for the use of IR spectroscopy on laterite clays, with an application to Ity. Previous accounts have broadly recognised weathering effects such as carbonate dissolution, karstification, sulphide oxidation, and residual concentration [4,17,20], but the precise mass balance of major and trace elements during lateritisation at Ity remains unresolved. In particular, the contrasting behaviours of Au, Cu, Mo, W, and Bi relative to immobile elements such as Fe and Al, and the controls exerted by different protoliths (skarn versus intrusive), have not been systematically investigated. Similarly, the distribution of secondary clay minerals (kaolinite, smectite, and illite) across weathering horizons remains undocumented, despite significant implications for metal mobility and fluid–rock interactions. Although the broad picture is established (deep lateritisation, mixed residual and transported gold enrichment), detailed quantitative constraints are still limited in the open literature: (i) precise mass-balance and mobility pathways for Au and associated elements during saprolitisation at Ity, (ii) microscale mineralogical transformations that fix gold or other metals in oxide/clay matrices, and (iii) temporal evolution of the supergene profile.
This lack of detailed mineralogical and geochemical data hampers our ability to reconstruct the precise sequence of processes that generated the present lateritic profile and to assess the extent to which supergene enrichment controlled the final gold endowment at Ity. Moreover, there is no consensus on whether the economic enrichment observed in laterite results primarily from local residual concentration, large-scale fluid-mediated redistribution, or a combination of both. Addressing these issues is essential for clarifying the role of lateritisation in generating exploitable ore bodies in West African Birimian terrains. The present study was conducted on the example of the Flotouo and Zia open pits.
2. Geological Setting and Mine History
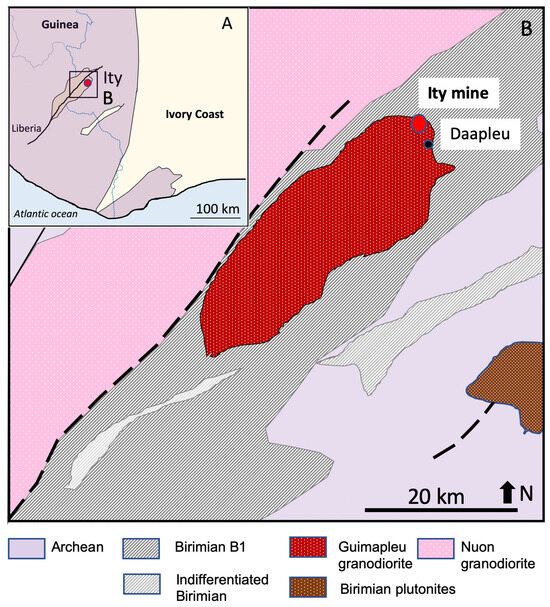
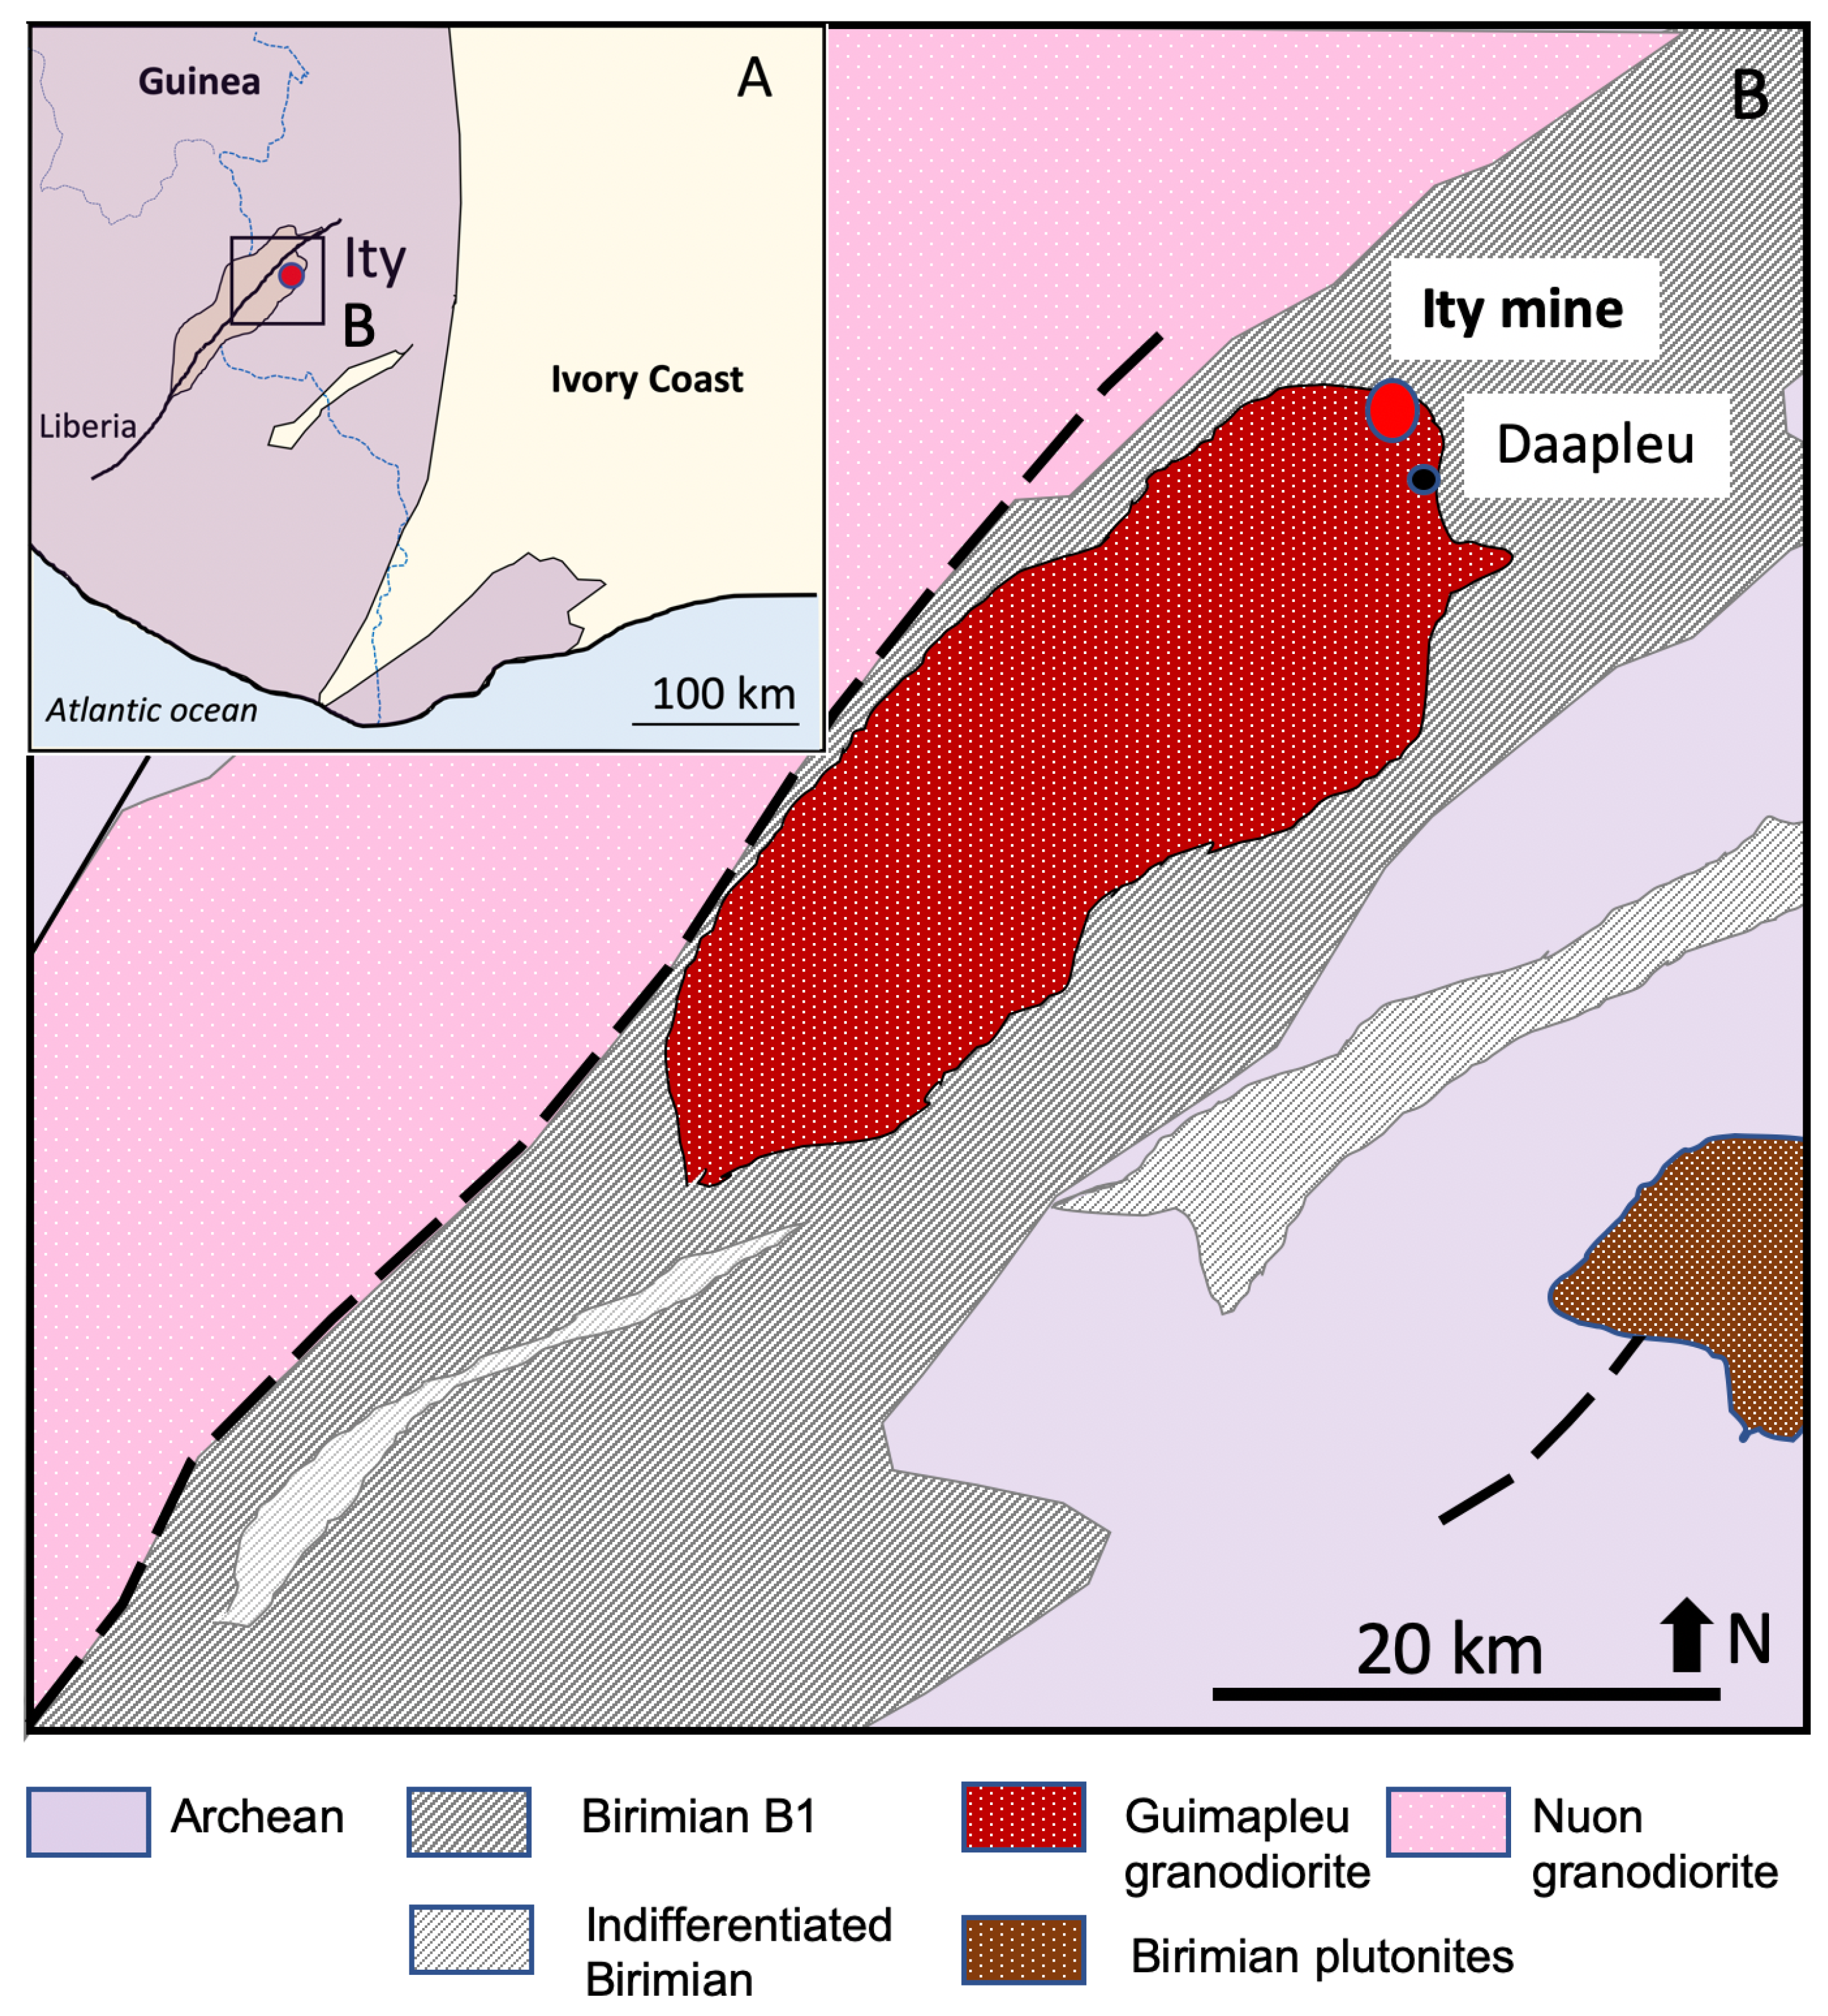
The Ity deposit (N7°01′8.7″ and W5°31′18.1″) is located near the village of Ity in the western part of the Ivory Coast (Figure 1), approximately 30 km South of Man Town (Figure 1). The study area is located in the Kenema–Man domain of the West African craton but belongs to the Toulépleu–Ity volcano-clastic unit of Birimian age [23]. The Birimian units formed as part of a significant crust-forming event between 2.25 and 2.05 Ga [24,25,26], accompanied by the intrusion of several granitoid suites [27]. The Toulépleu–Ity unit, approximately 8 to 30 km in width, lies in tectonic contact over Archean supracrustal rocks (<2.68 Ga; [27,28]; Figure 1). This unit displays an NNE-SSE trending, up to 100 km in length in the Ivorian territory, and is extended into Liberia [29].
Figure 1.
(A) Inset locates the Toulépleu–Ity klippe in the Ivory Coast with the location of the Archean domain in violet and Birimian terranes and intrusives in yellow. (B): Regional geological map of the Ity area simplified from data in [17,20,21]. Main dashed line corresponds to a faulted contact.
The Toulépleu–Ity unit, defined as the “Toulépleu-Ity klippe” [23], is interpreted as a strip of Lower Proterozoic (Birimian) rocks, thrusted during the collisional phase of the Eburnean orogenesis (D1) and preserved in its centre from a later D2 deformation affecting the Kenema–Man terranes. The Toulépleu–Ity klippe consists of Birimian sedimentary series, including shales and carbonates with volcano-sedimentary intercalations, which are intruded by the Guimapleu massif [27,28,29]. Dykes and sills of quartz microdiorite intersect this succession. These formations were successively affected by amphibolite–facies metamorphism and intense skarn formation at the contact of the intrusive bodies.
The contact between these two units passes through the weathering zone that hosts the deposit [30,31]. Lajoinie and Fonteilles [1] interpreted the lenses of ferruginous rocks with magnetite as old skarn that had been transformed by lateritic weathering. In fact, weathering and subsequent land movements (cavity collapse) have redefined the deposit’s geometry. This supergene alteration is thought to be relatively young in age (<100 Ma). The main effect of weathering on the mineralised rocks is the dissolution and oxidation of all sulphides and the transformation of the host rocks into saprolite. It also caused significant karstification of carbonate horizons at the surface and at depth.
This mineralisation is considered particularly distinctive in the West African Birimian gold deposits because the gold ore is entirely concentrated in the weathered rock [18,31,32]. This deposit, exploited by the “Société des Mines d’Ity”, has produced 16.98 tons of gold from its opening in 1991 to the end of 2008. New estimates at the beginning of 2009 indicated a resource increase to 22.3 tons of gold (La Mancha Resources data). In December 2024, Endeavour estimated its proven and probable reserves at approximately 79 million tons, grading 1.4 g per ton (about 111 tons Au). In the first semester of 2025, Ity produced 2600 tons of Au ore, at 1.6 g/t and recovery rates of 90%, equivalent to 4,2 tons of gold. The future goal of Endeavour is to sustain production above 250 koz Au (7.1 ton)/year over a 10-year life-of-mine (Endeavour website).
Gold at Ity is considered mainly as residual. According to Naho’s work [18], gold particles have two distinct morphologies. Xenomorphic gold grains are predominant, particularly at depth, and are considered to be inherited from the primary mesothermal gold assemblage, e.g., the magnetite-dominant ore that gives the soil its blackish-brown colour during weathering. Sometimes, striations may indicate the effect of movements on initial textures during brecciation resulting from skarn carbonate dissolution and subsequent block movements. In the brown clay facies, Ag contents of gold particles are in the range of 15 to 25% Ag, and in the whitish kaolinite-rich facies, between 27 and 35 wt.% Ag. A small portion of the gold particles is thought to have resulted from dissolution–recrystallisation processes with micro-cubes on the grain surface, spongy textures indicating dissolution, and newly formed rims around the primary grains [18]. These neoformations are characterised by higher gold purity, with Ag content below 5% and often below 2%. It should be noted that native silver particles have also been observed and may result from the destabilisation of silver–bismuth–gold tellurides. According to the mining data, the Ag/Au ratio in the Ity ores is 2 to 4 [19], confirming the existence of a significant initial silver stock, of which Ag-Au tellurides and Cu-Sb sulfosalts are the most visible mineralogical expression [5]. Thus, tellurides may contain around 67% Ag and up to 2% Au, and Cu-Sb sulfosalts up to 10% Ag.
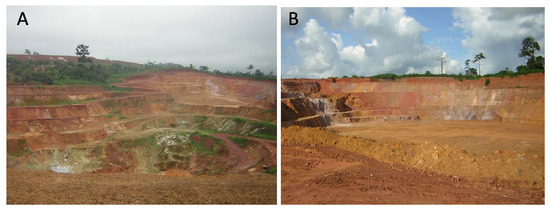
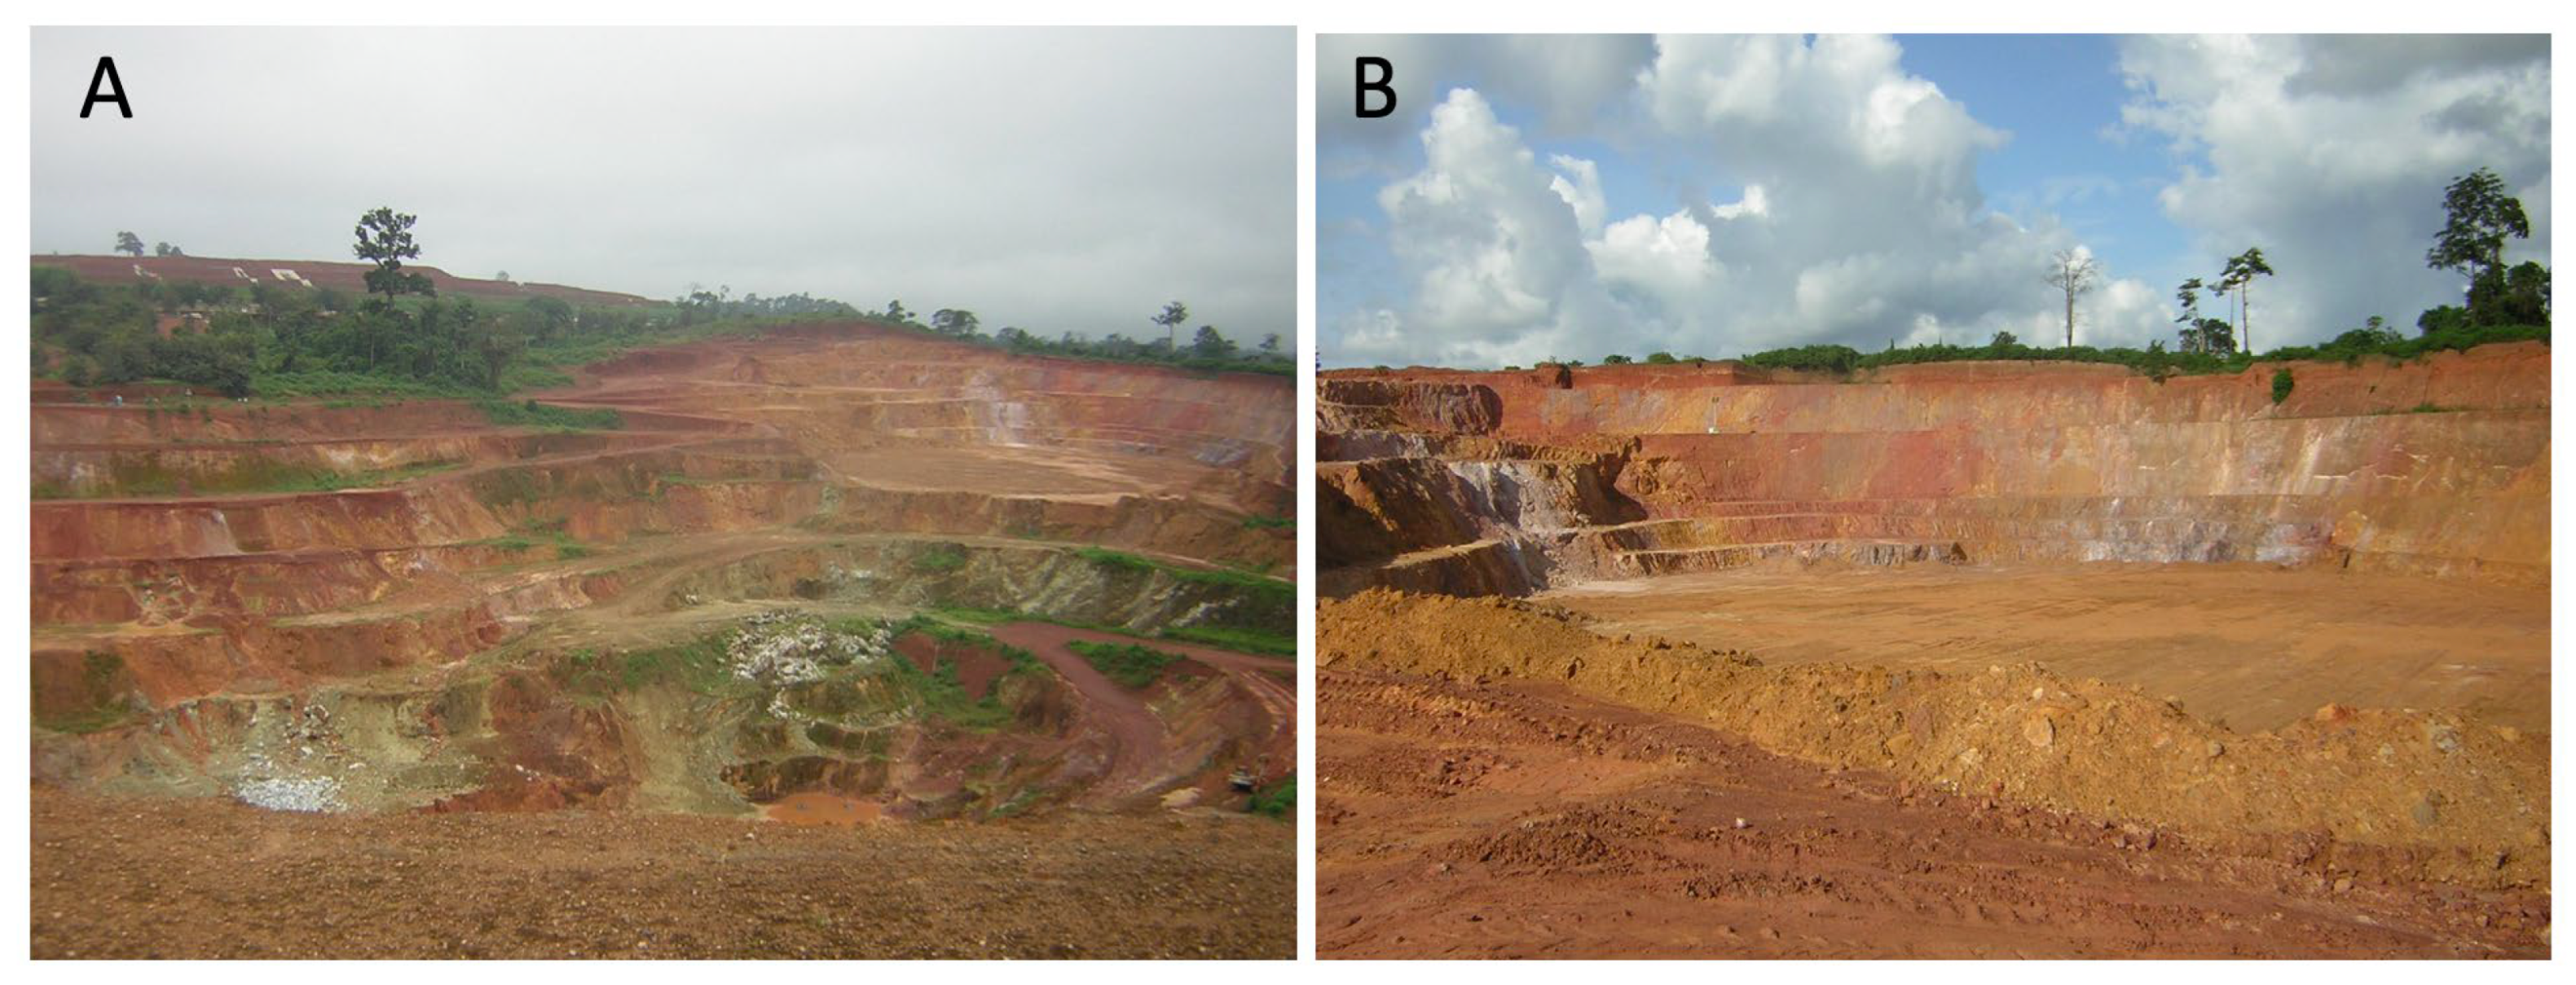
Four small mineralised hills (Flotouo, Ziatouo, Ity, and Tontouo) constitute the Ity gold deposit. They exhibit various mineralised facies, best described at the Flotouo pit (Figure 2), where mining has provided a three-dimensional exposure of the deposit [17,33]. The Zia and Mont Ity deposits are thought to be equivalent to some variations in the Flotouo mineralisation. From west to east, the studied Flotouo-Zia mineralisation forms three ore-heaping series, separated by barren intrusives: the Flotouo West, Flotouo East, and Zia zones. All three ore heaps are bowl-shaped and plunge varying degrees to the northwest. All deposits are located above the late-D2 Le Plaque granodiorite in a skarnified carbonate sequence at or near the contact with the underlying mafic to ultramafic unit.
Figure 2.
Two panoramic views of the Flotouo (A) and Zia (B) open pits where the sampling has been carried out.
3. Materials and Methods
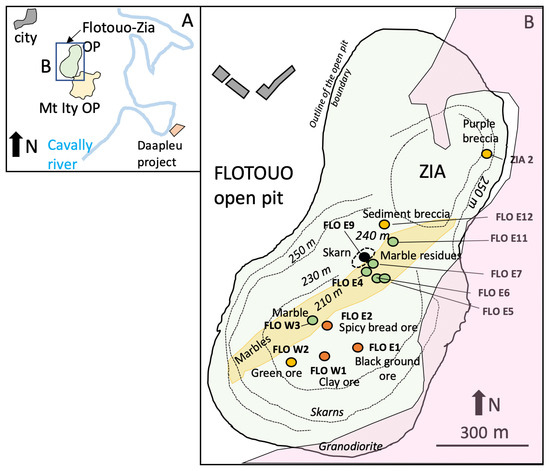
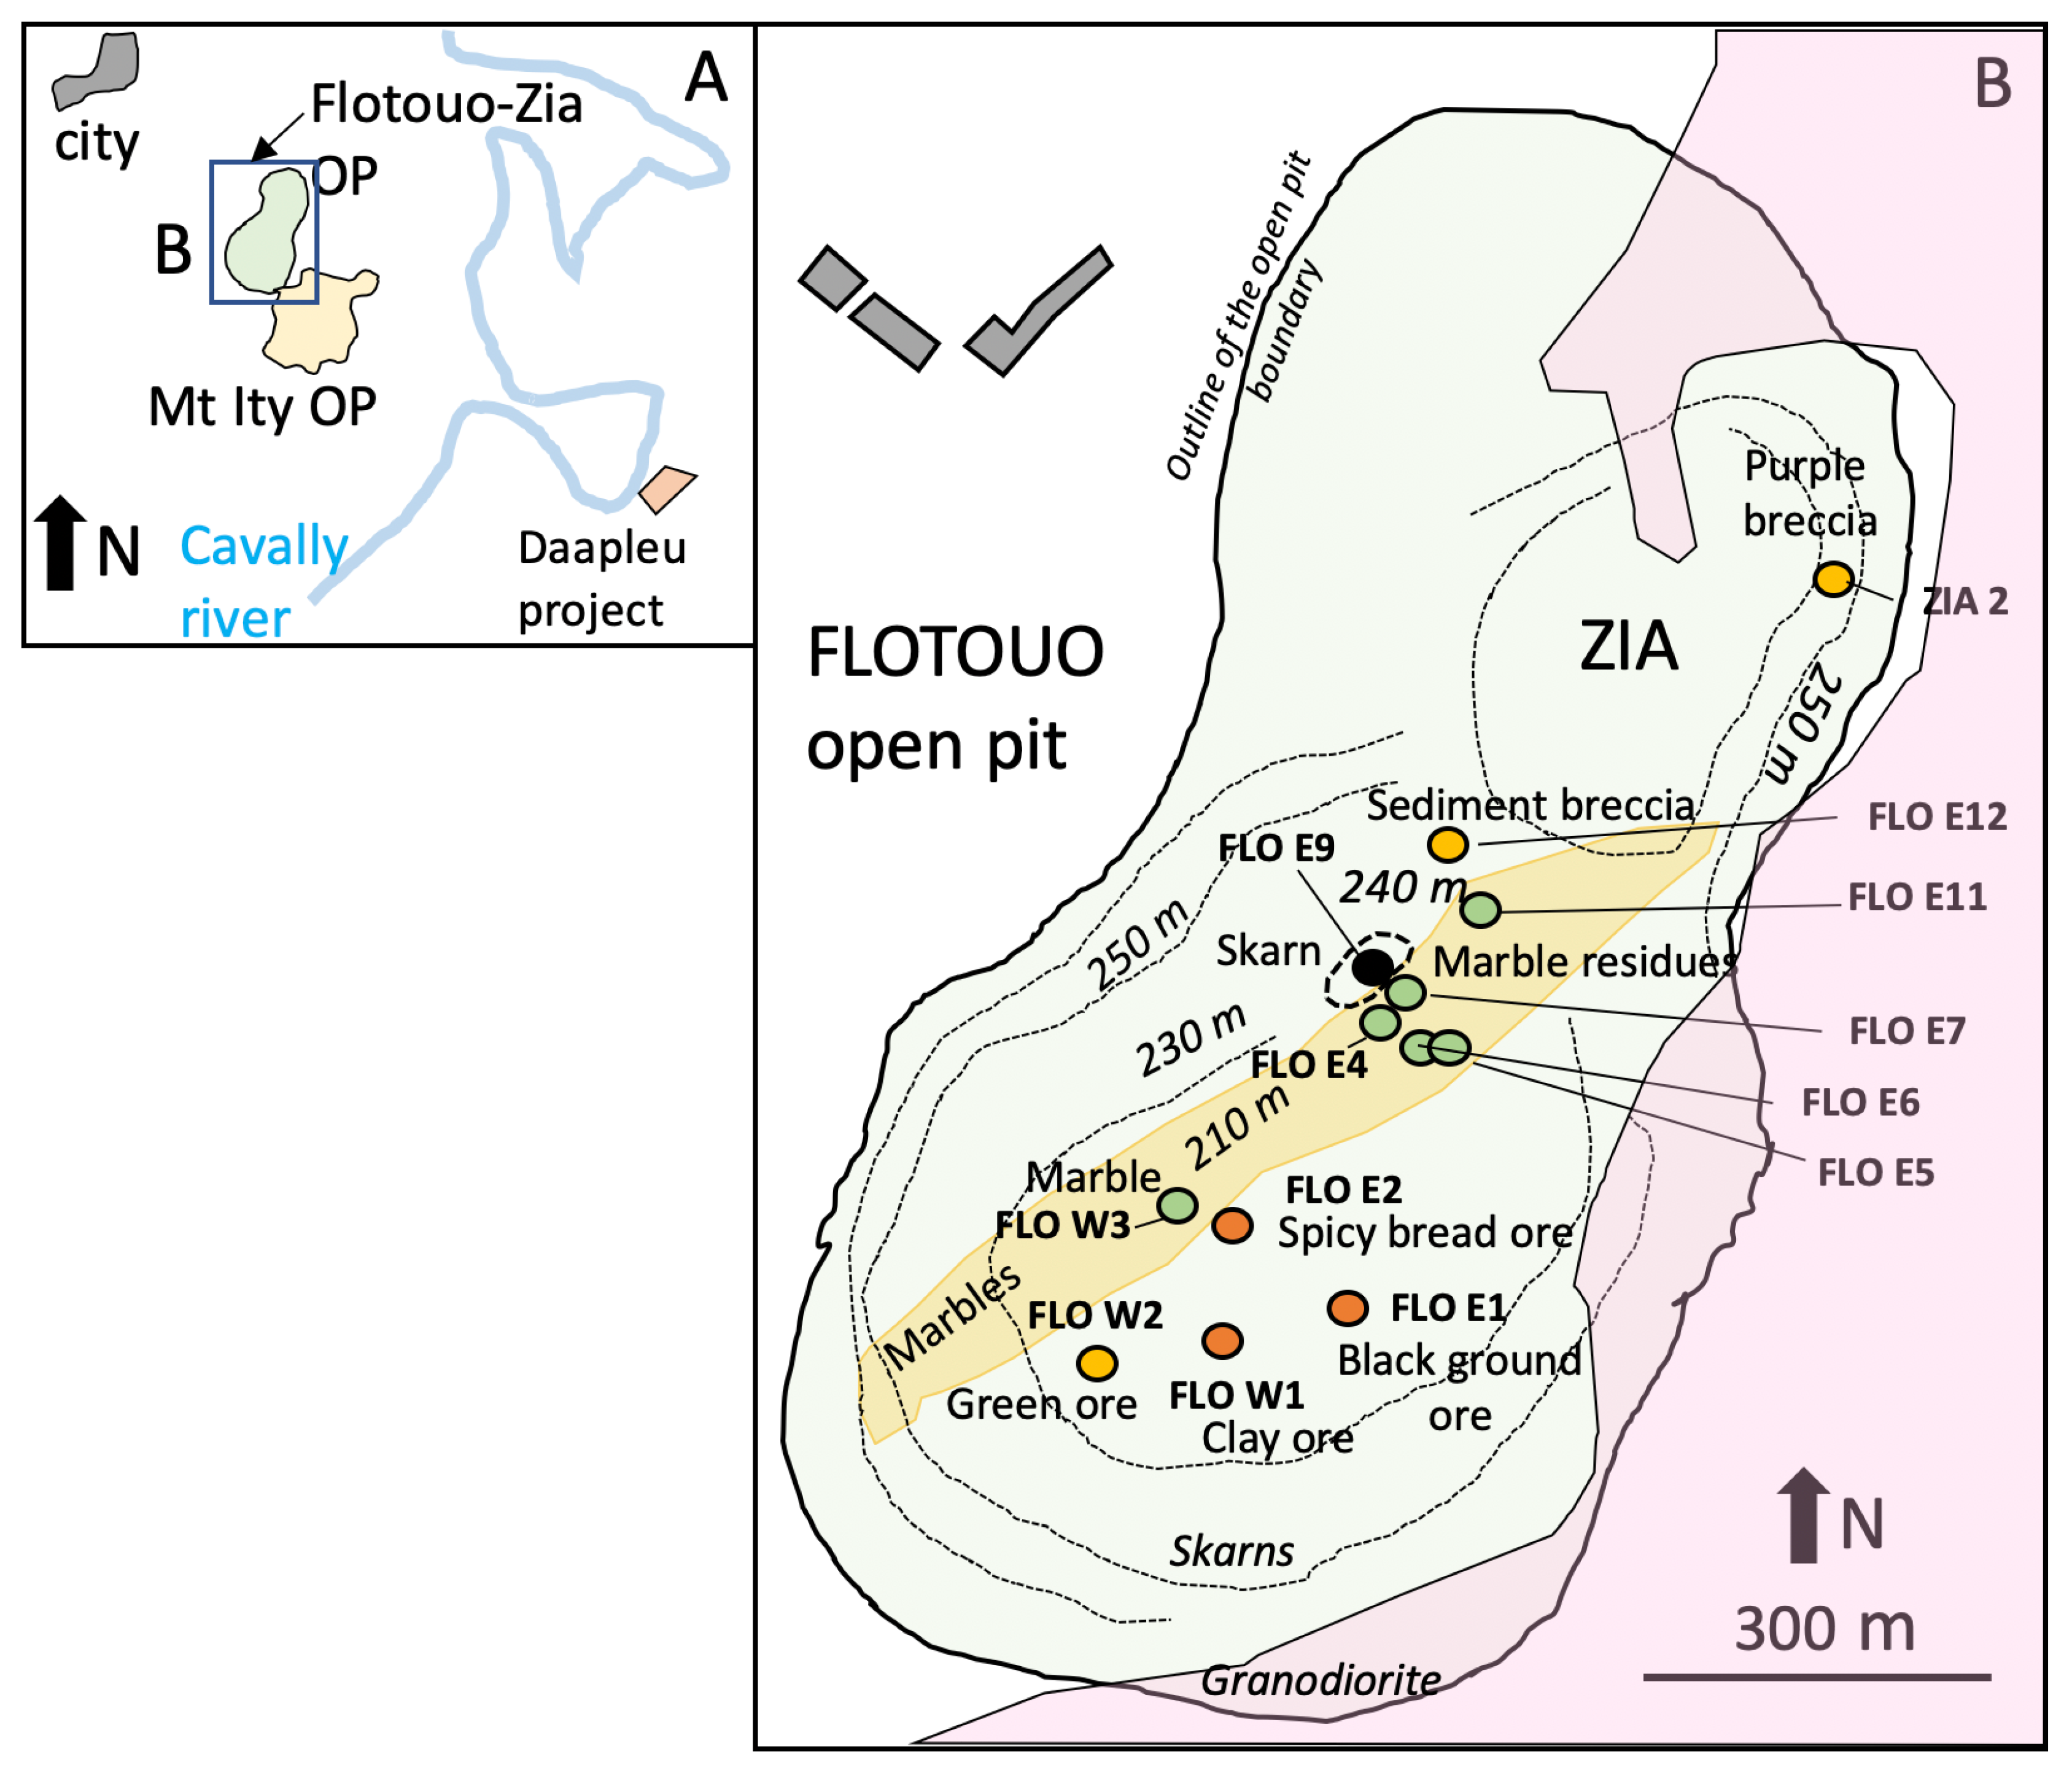
Representative samples of protolith and saprolitic mineralised facies were collected from the open pits for the present study: the Flotouo and Ziatouo open pits (Table 1; Figure 2 and Figure 3).
Table 1.
Characteristics of the selected altered ore samples from the Ity deposit (Flotouo and Ziatouo open pits). The sample location is shown in Figure 3.
Figure 3.
(A) Flotouo-Zia and Mount Ity open pits near the Cavally river. (B) Location of samples taken in the Flotouo and Zia open pits (OP) for whole rock analysis (based on the SMI map in 2006). The dotted lines indicate the location of the level boundaries with indication of altitude above sea level. In pink, the granodiorite; in green, skarn and metamorphic units; in yellow, marbles.
At Flotouo, five samples of saprolites were taken from the East ore heap, and two from the West ore heap. For comparison, five unaltered rocks were also sampled from Flotouo pit: a mineralised skarn and four marbles. In the Zia open pit, breccias, particularly those with a purple colour, were sampled.
A multi-technique analytical approach, including XRD, scanning electron microscopy (SEM) of minerals, and inductively coupled plasma atomic emission spectroscopy (ICP-AES) and inductively coupled plasma mass spectrometry (ICP-MS) of whole rocks, was used to characterise altered ore.
The XRD data were collected with a D8 Bruker diffractometer with Co-Kα1 radiation (λ = 1.7902). General operating conditions are 35 kV accelerating voltage, 45 mA intensity, step-scanning at 0.035°(2θ) intervals, 3-sec counting time, 3–75° (2θ) for disoriented powder. Diffractograms of natural starting clays were recorded in the air-dried state at ambient relative humidity after solvation with ethylene glycol (EG) under low vacuum for at least 12 h. Swelling clay samples were also heated to 110 °C overnight before EG solvation according to the procedure published by [34], and heated up to 480 °C
A scanning electron microscope (SEM) was used to identify the different minerals present in the samples. SEM was useful for studying clay morphology. SEM photographs were obtained using a HITACHI S2500 instrument equipped with a KEVEX (delta system) energy dispersive detector (Hitachi High Technologies Corporation, Tokyo, Japan).
Significant element concentrations were determined by ICP-AES, and trace element concentrations by ICP-MS at CRPG-CNRS (Nancy, France). Analytical uncertainties are estimated at 2% for major elements and at 5% or 10% for trace element concentrations (except REE) above or below 20 ppm, respectively. Precision for REE is estimated at 5% when chondrite-normalised concentrations are greater than 10 and at 10% when they are lower.
4. Results
4.1. Geometry of the Deposit in the Weathered Zone
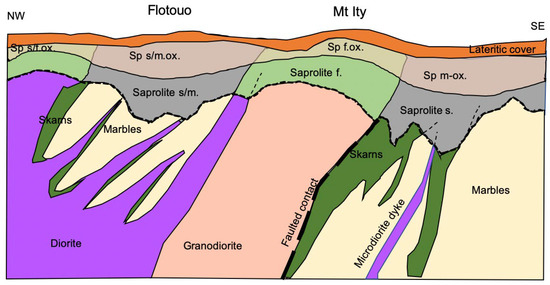
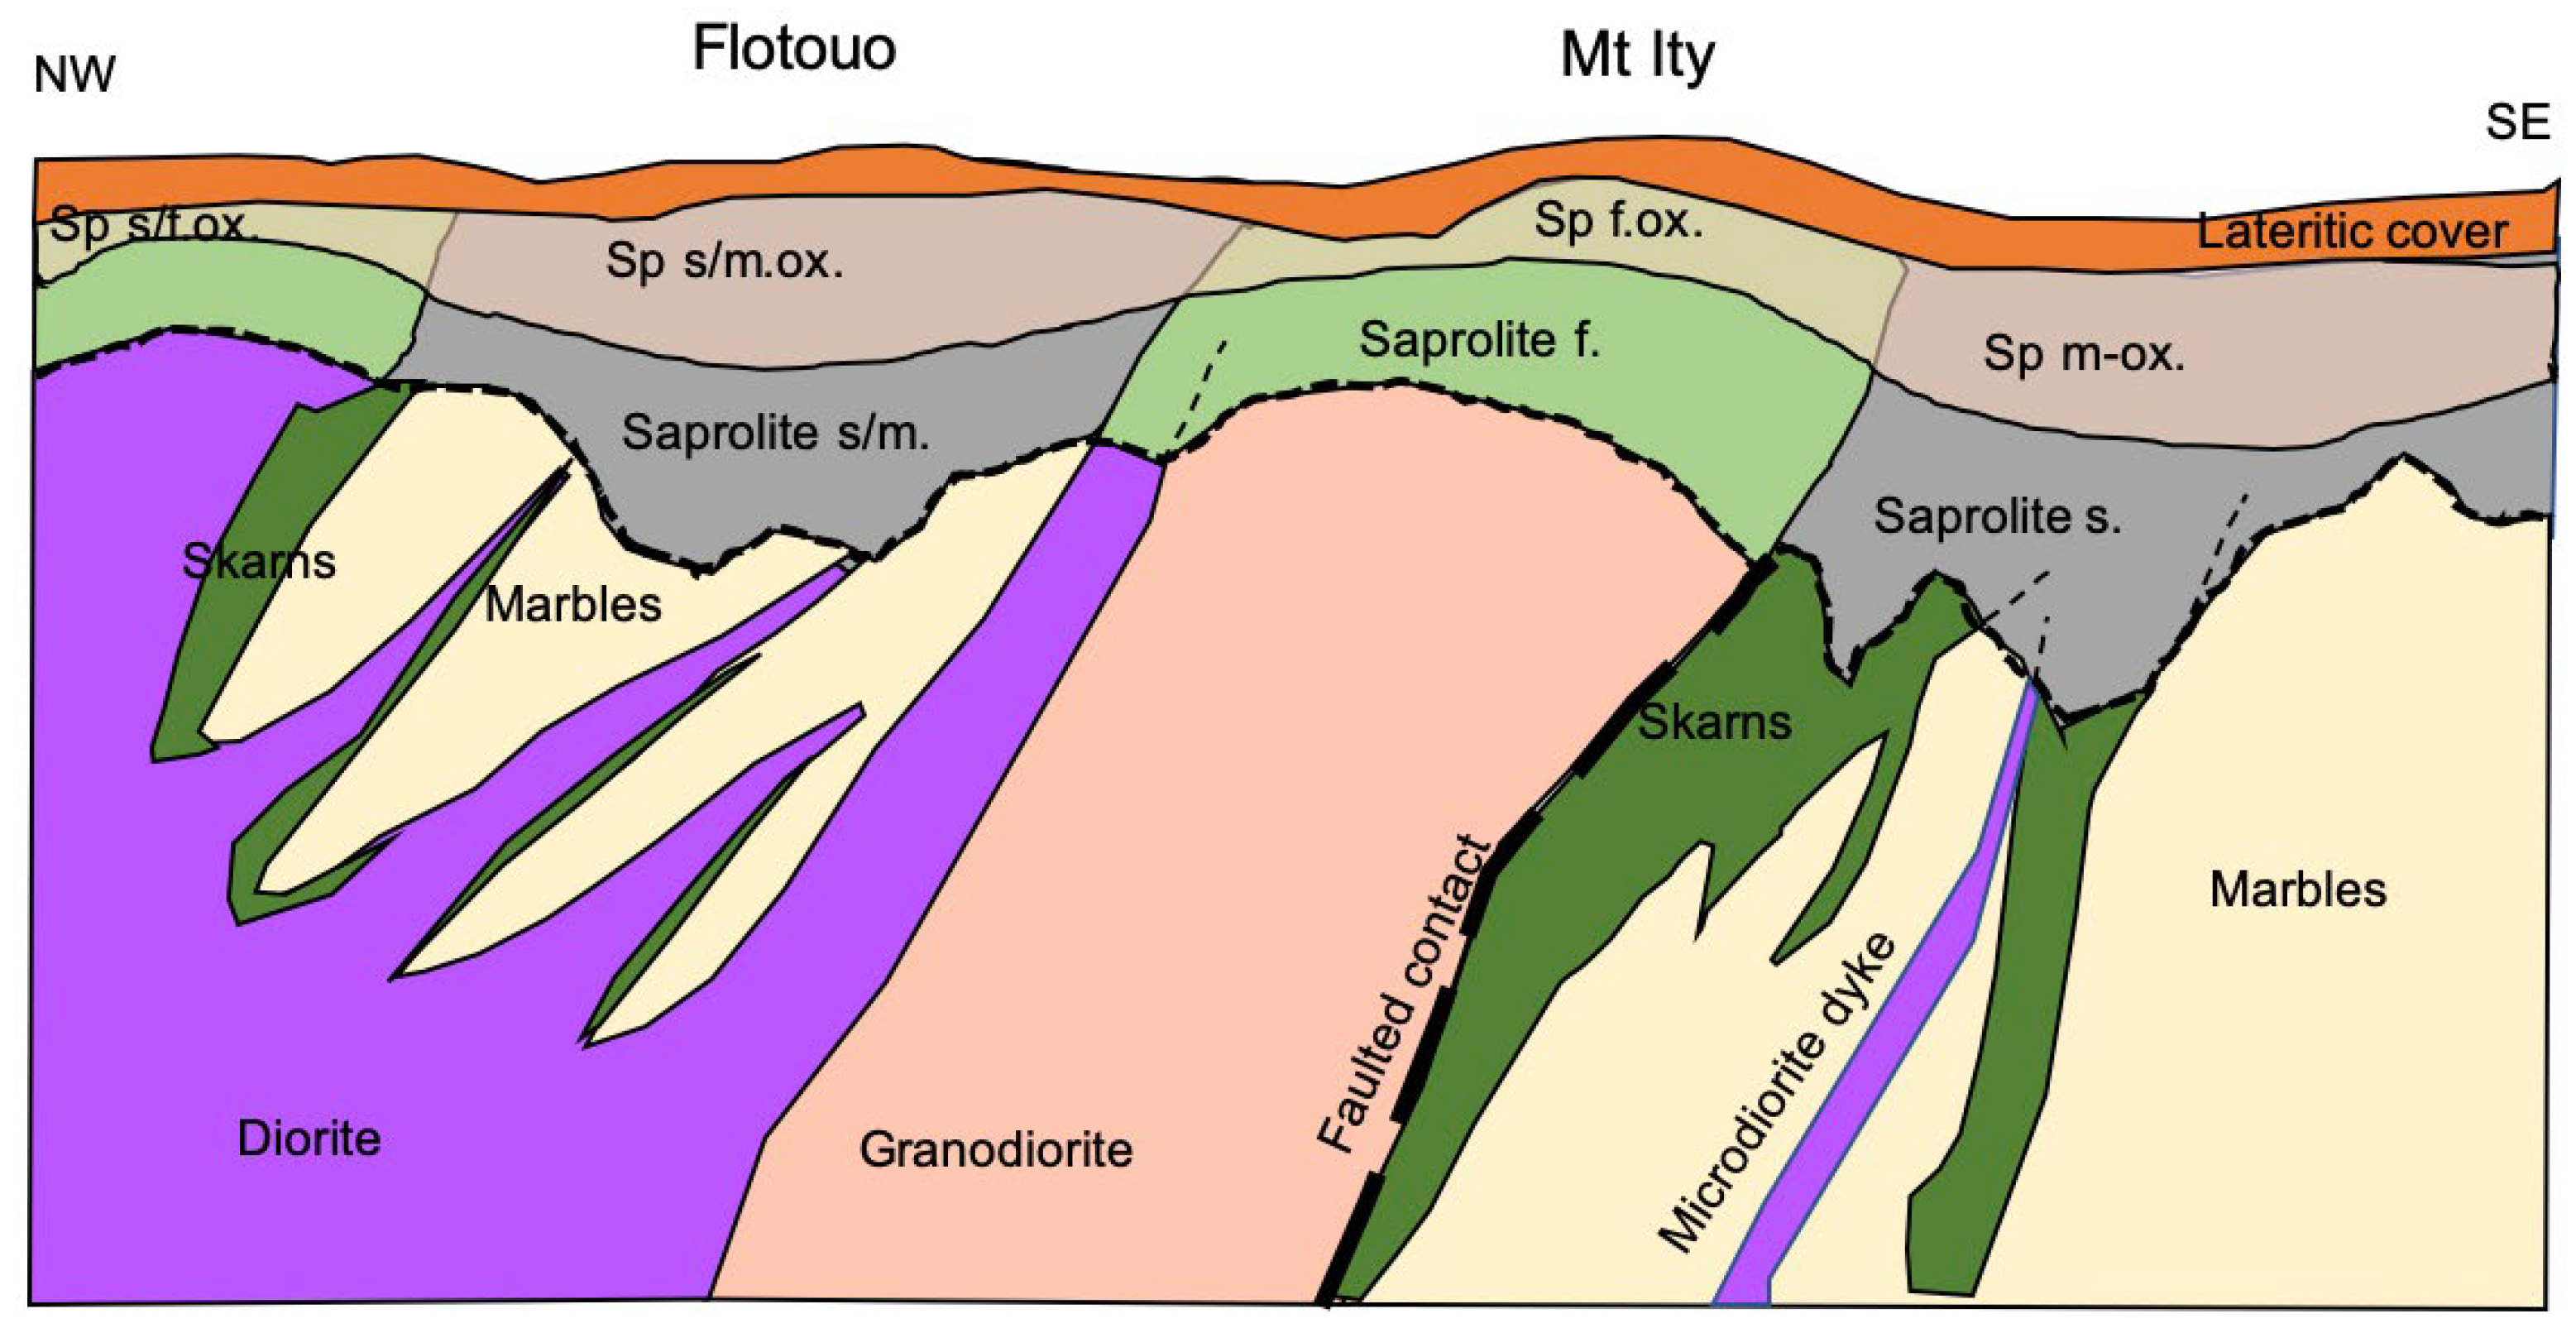
The geometry of the deposit can be vertically separated into two main divisions: an umbrella of laterite ore overlying a tabular zone of saprolite ore (Figure 4). Below the saprolite, protoliths are marbles and skarns formed at the contact with intrusive granodiorite bodies, and laterally, the volcano-sedimentary sequence.
Figure 4.
Schematic cross-section with indication of the location of laterite and saprolite above the three main lithofacies: f: felsic intrusions—diorite and granodiorite; m: marbles; s: skarns (endo-skarn and exo-skarn). The saprolite in the oxidised zone is marked “ox.” The cross-section is simplified from previous data [4,17] and the Endeavour report [19]. Sp: saprolite; ox: oxidised.
Saprolite orebody: The saprolite layer is 50–120 m thick and hosts a variety of mineralised facies. Three of the main facies are found at Flotouo. They are described below, moving from footwall mineralisation towards the surface:
The principal mineralised body (CP), so-called “black earth,” initially consists of lenticular magnetite–sulphide–garnet skarns and associated stockworks. It constitutes the richest part of the mine, with gold grades ranging from 15 to 20 g/t Au. Brecciated and schistosed volcanoclastic facies, the “pillow facies,” are observed at the base of this body.
The panel breccia (BP) consists of various polygenic and monogenic breccias, intrakarstic sediments, and panels (tabular to subtabular blocks) of barren gabbroic saprolite. This facies is the product of in situ carbonate dissolution and infilling by collapsed overlying units. Mineralised terra rossa, a residual clay matrix, fills the space around barren panels. The grade is highly variable in this unit, ranging from 2 to 6 g/t Au when barren panels are excluded.
The sediment breccia (BS) is younger than the panel breccia and typically consists of polygenic breccia containing clasts derived from the CP and BP mineralised units described above, as well as from the overlying lateritic horizons, which can extend to depths of 50 m below the surface. Classic sedimentary features are often observed in this unit, including normal grading, slumps, and load structures. Panels of barren material are also found in the breccia facies. The average gold content of these formations is high near the surface, ranging from 6 to 10 g/t. It decreases with depth until it reaches uneconomic content.
In the Zia pit, breccias are prominent. In addition to the sediment breccia facies described above, two additional mineralised facies are found at Zia: (i) deep purple breccia is restricted to the northern part of Zia. This breccia is monogenic, has a highly deformed matrix, and may be tectonic in nature. Its grade ranges from 4 to 6 g/t Au and is proportional to the abundance of oxide nodules. (ii) A caramel-coloured unit, characterised by a crumpled and laminated microbreccia, is rich in manganese and iron oxides. It generally grades between 4 and 30 g/t Au.
Lateritic ore: The laterite ore sheet follows the topography and has a greater extent than the saprolite orebody. At Flotouo, the laterite ore covered an area measuring 400 m by 400 m and was 10–15 m thick. Grade was typically 2–7 g/t Au. Observations done during sampling confirm those from [1]: the lateritic part of the deposit shows the following succession (from top to base): (i) a thin climatic soil (about 10 cm); (ii) a red heterogeneous lateritic mantle, composed of kaolinic clays including cuirasse blocks and varied quartz and tourmaline fragments.
4.2. Petrography and Mineralogy of the Saprolite Facies
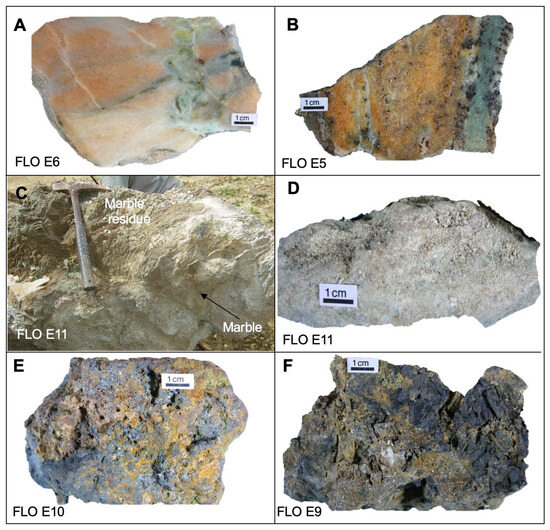
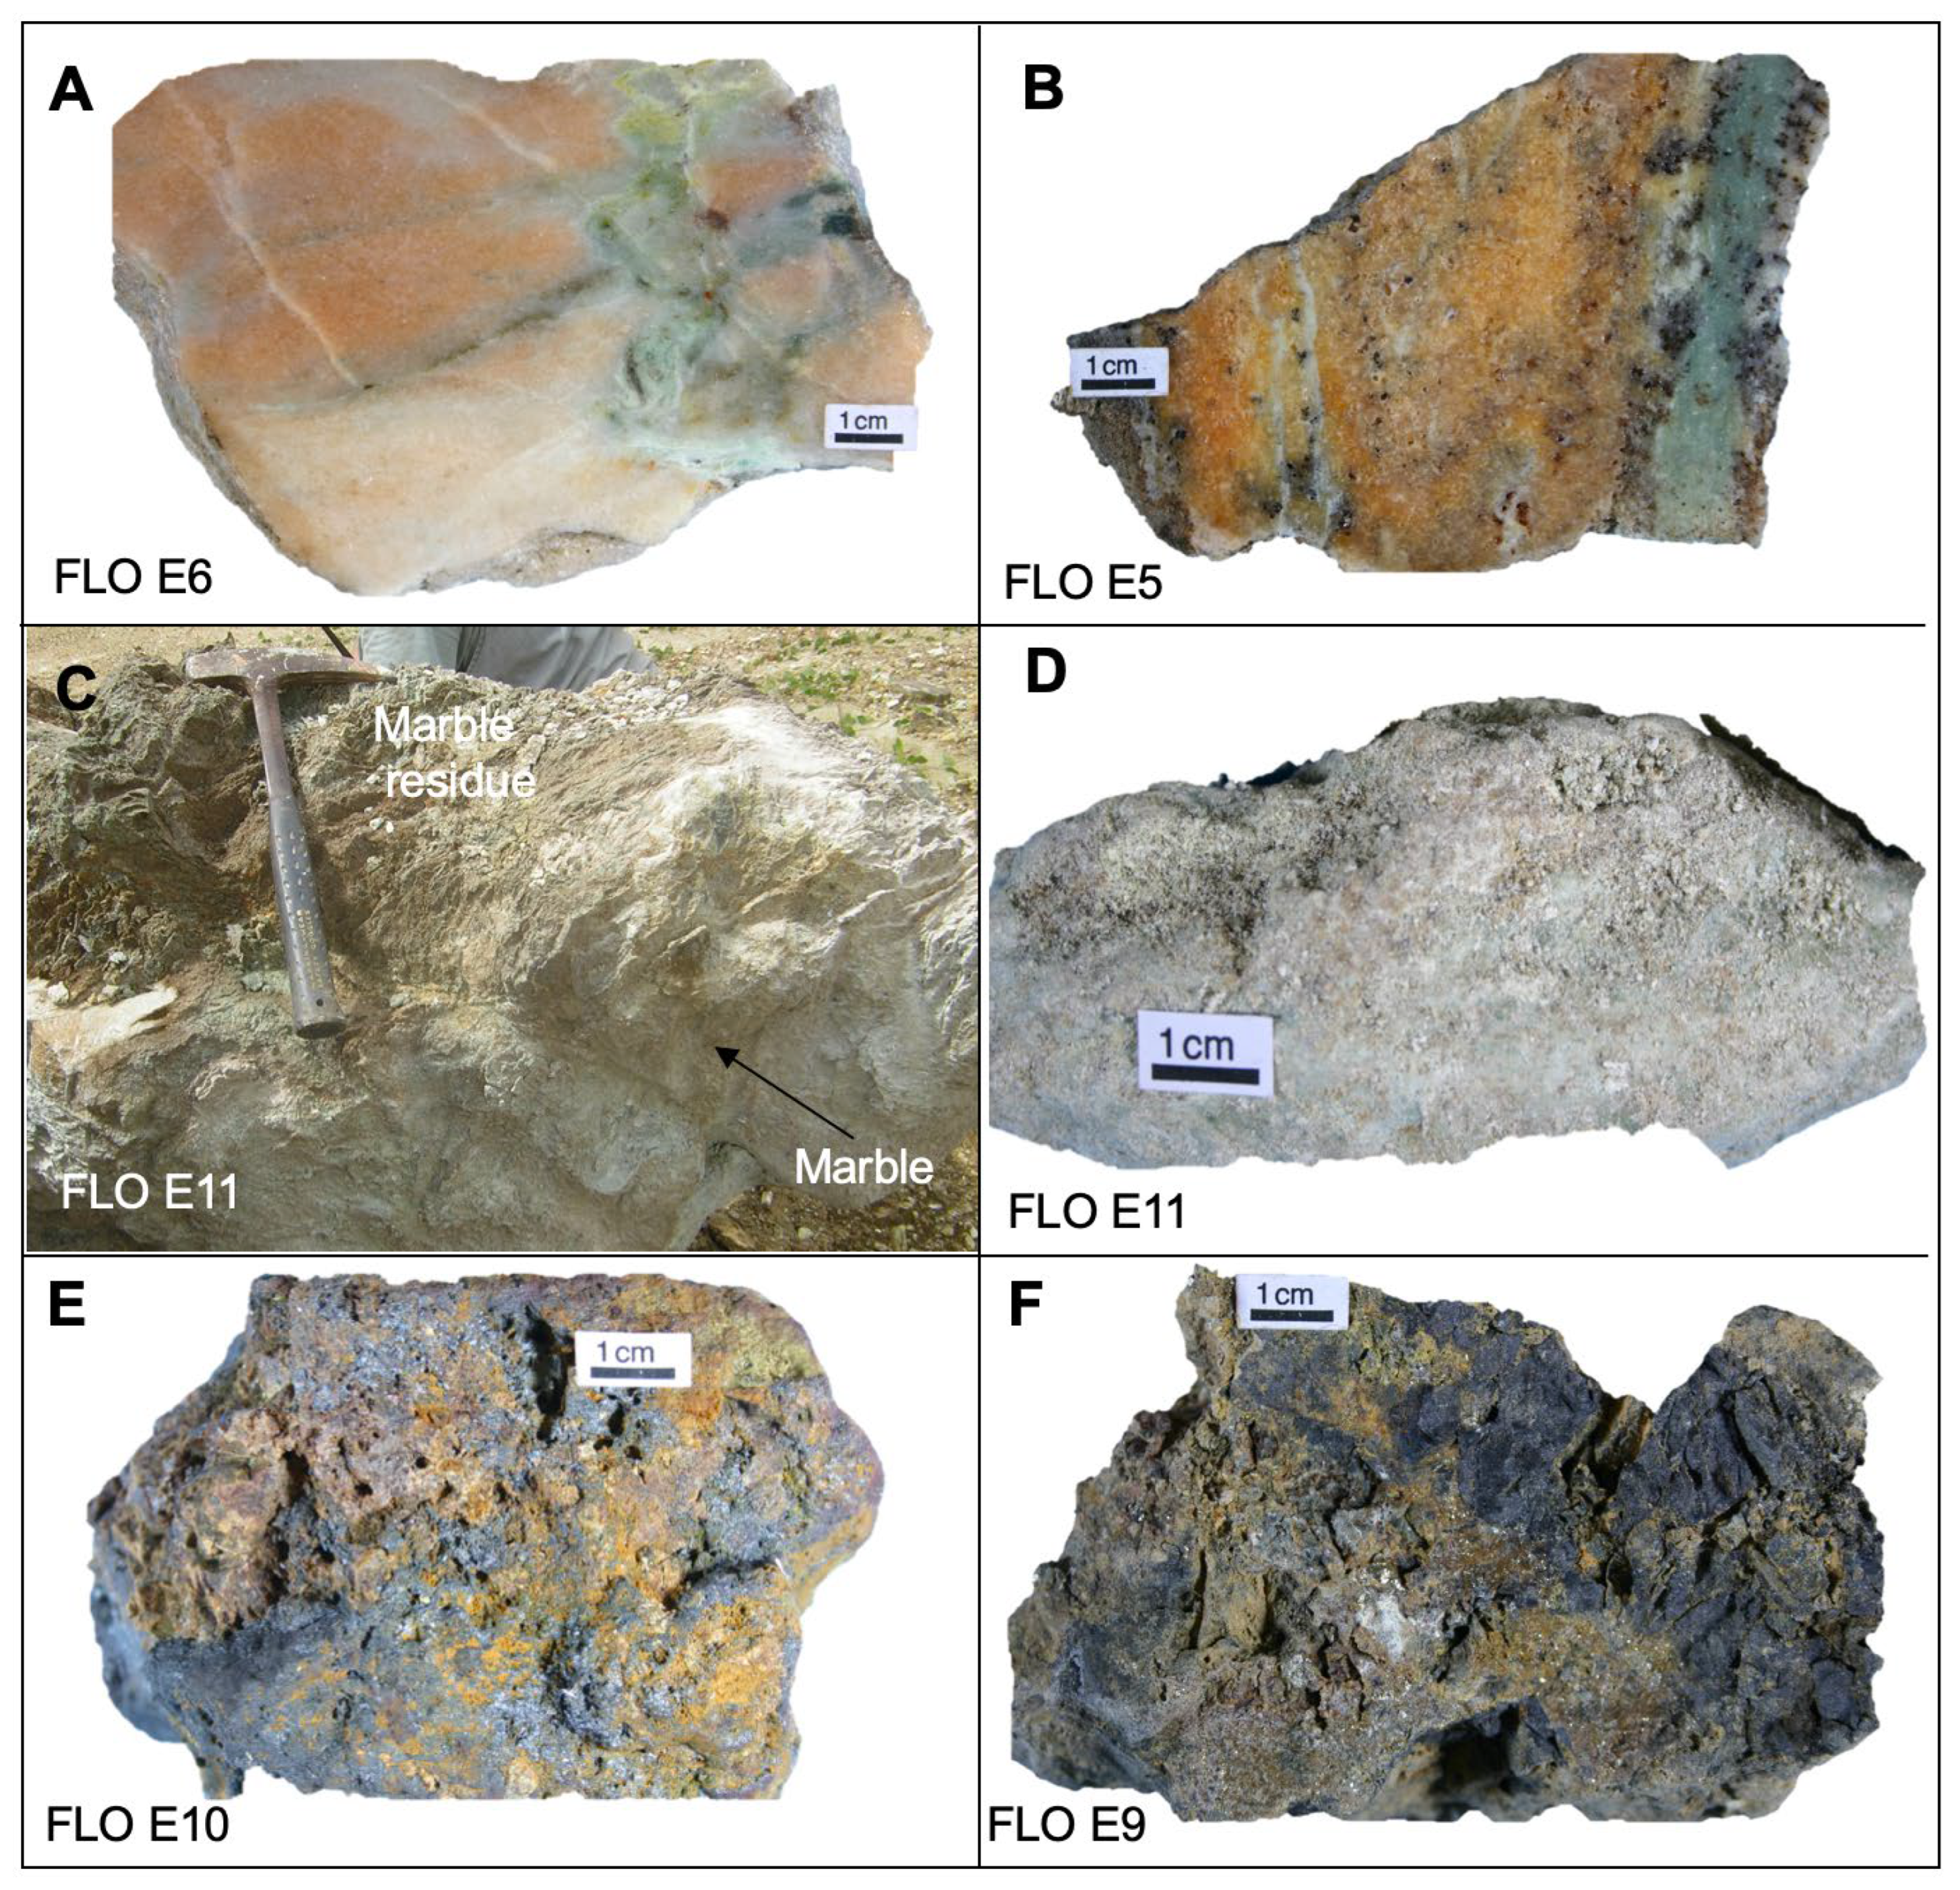
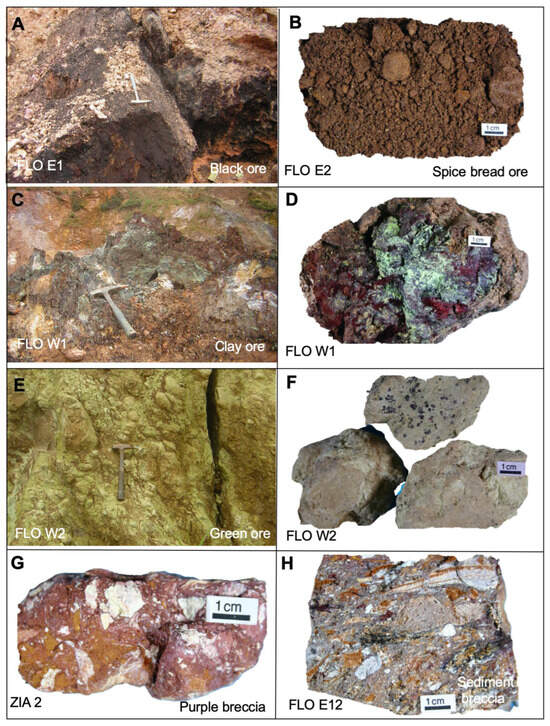
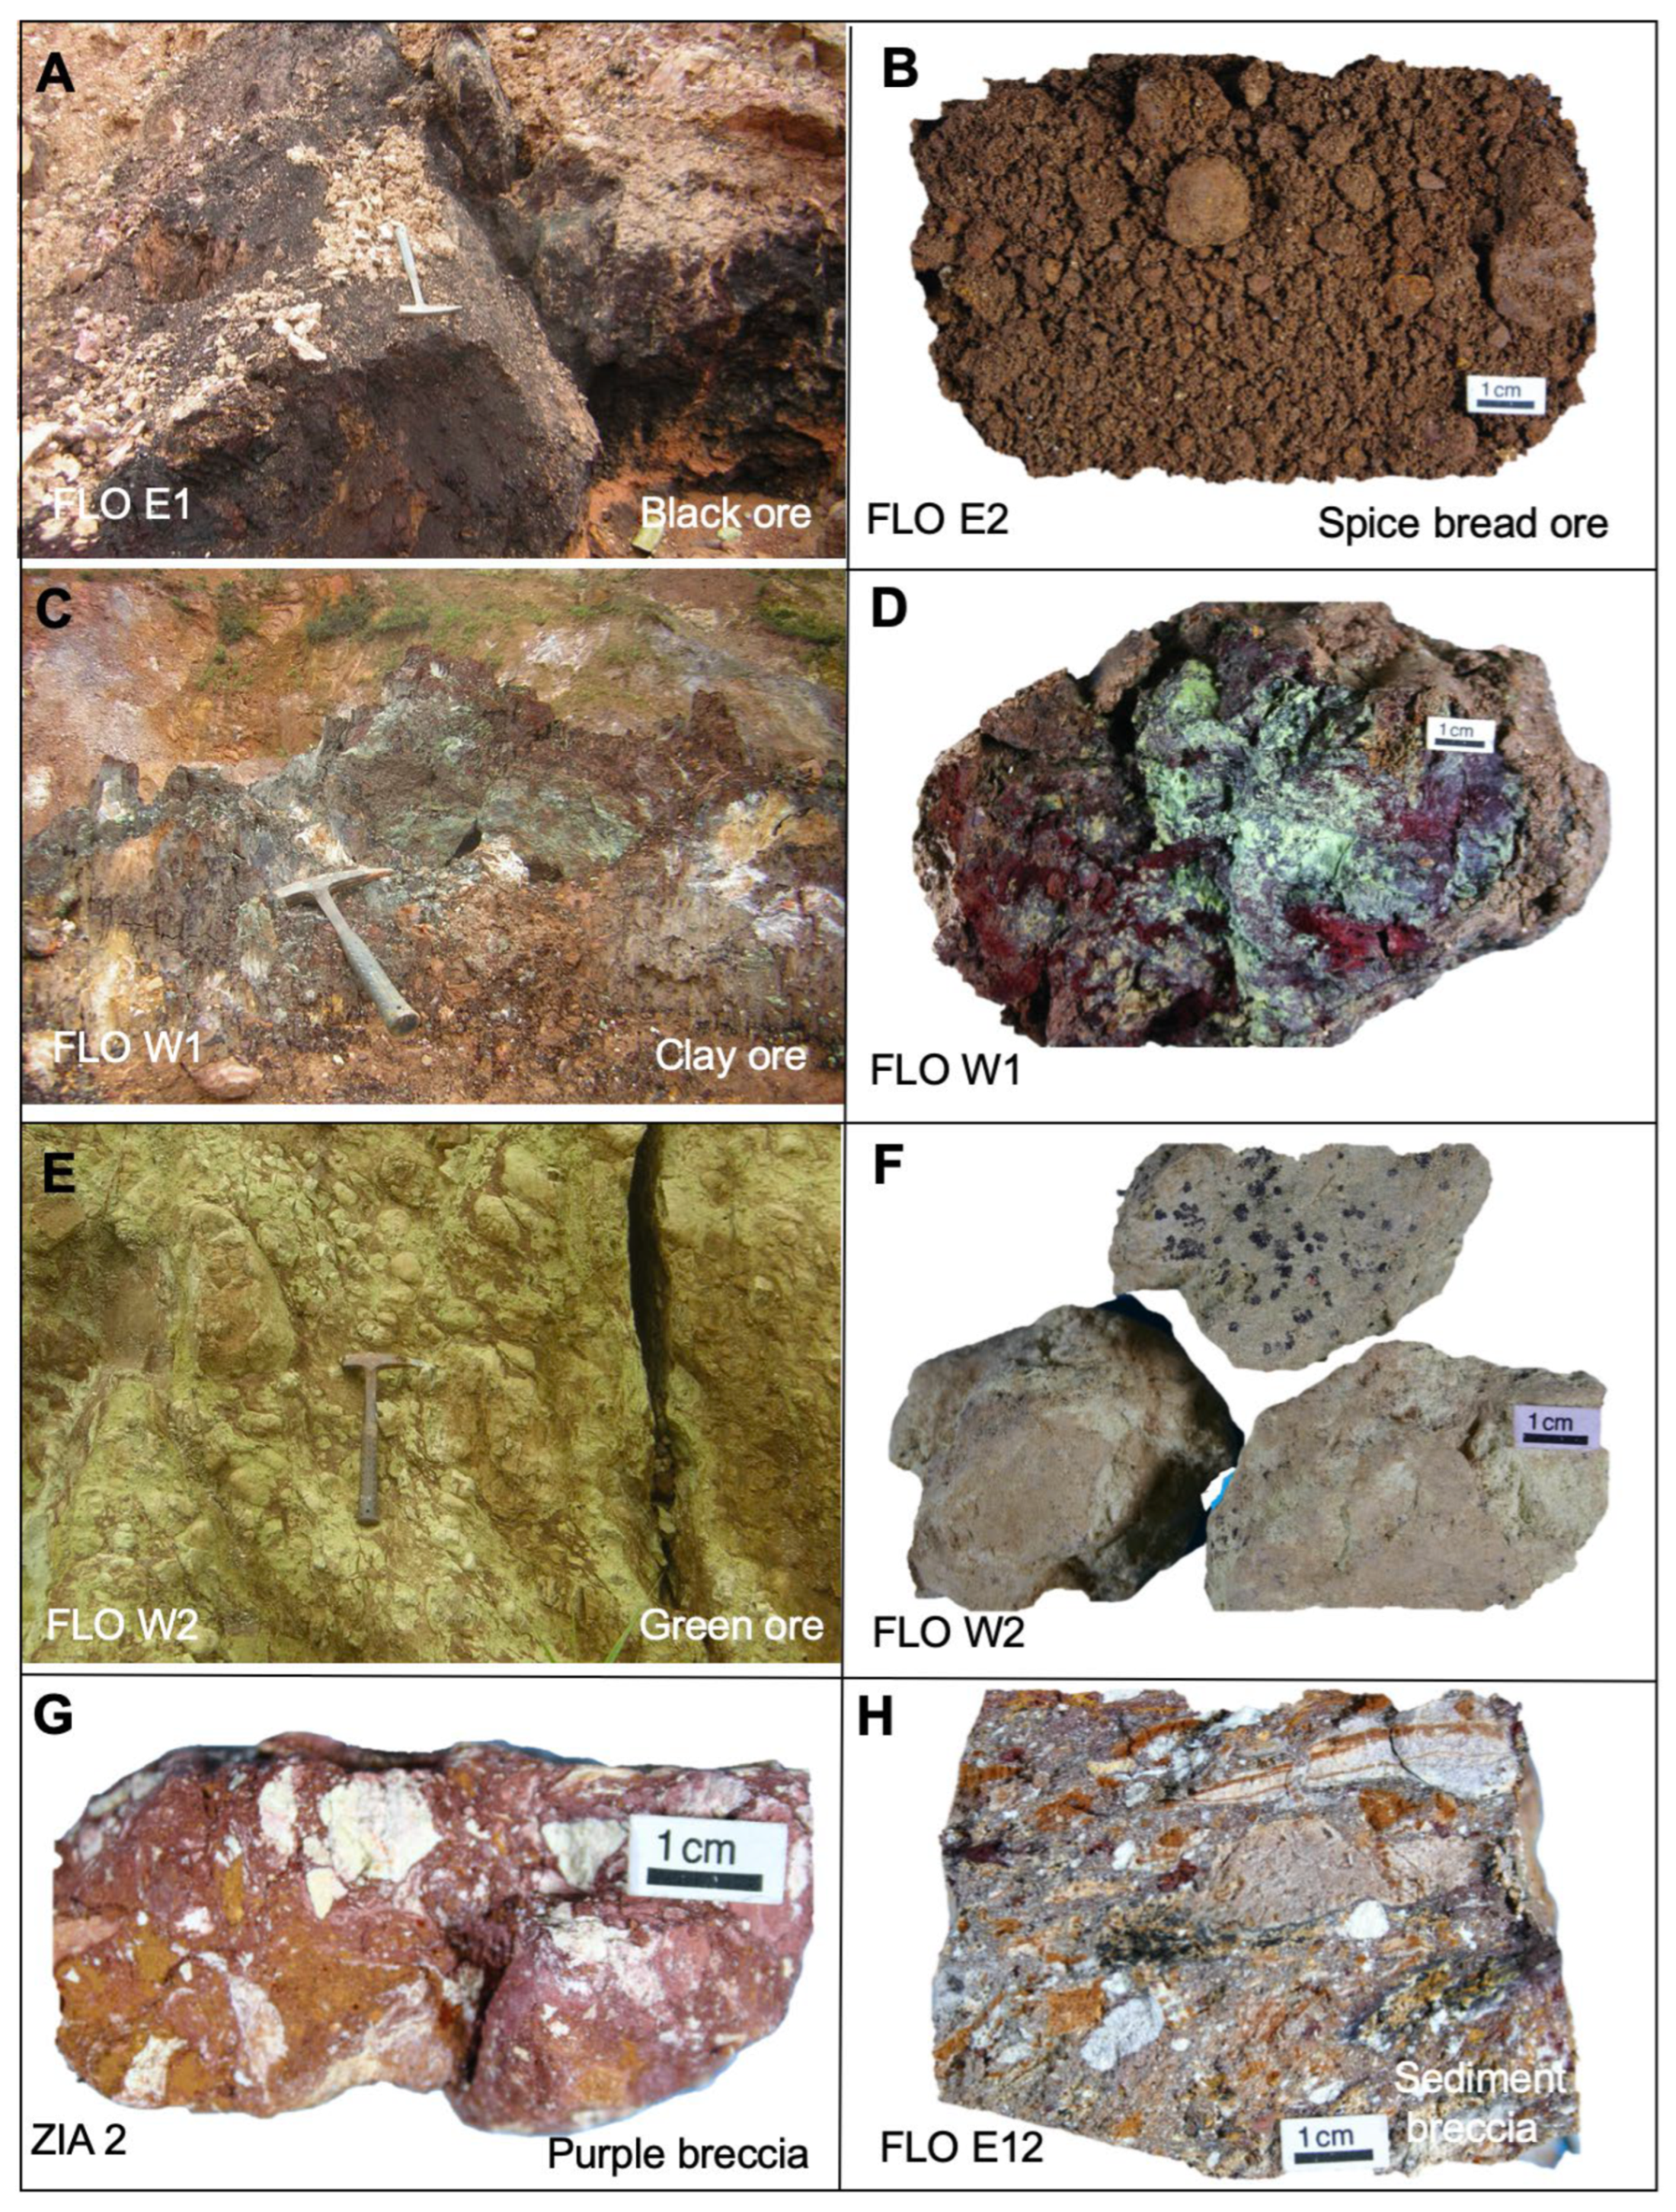
The mineralogy of the saprolite is obviously controlled by the protolith mineralogy, which is summarised before the description of the resulting saprolite facies. Macroscopic features in open pits, as well as at the sample scale, are presented in Figure 5 and Figure 6. The SEM images of clays and silicates are shown in Figure 7, and the clay identification is illustrated in Figure 8 and Figure 9.
Figure 5.
Macroscopic features of the marbles and skarns: (A,B) unaltered marble, (C,D) marble residues from the supergene dissolution zone, (E,F) garnet–magnetite skarns.
Figure 6.
Main ore types in the Floutouo-Zia open pits: (A,B) black and spice-bread ore; (C,D) clay-rich ore; (E) green ore; (F) green ore with dots of Mn-oxides; (G) purple breccia; (H) sediment breccia.
Figure 7.
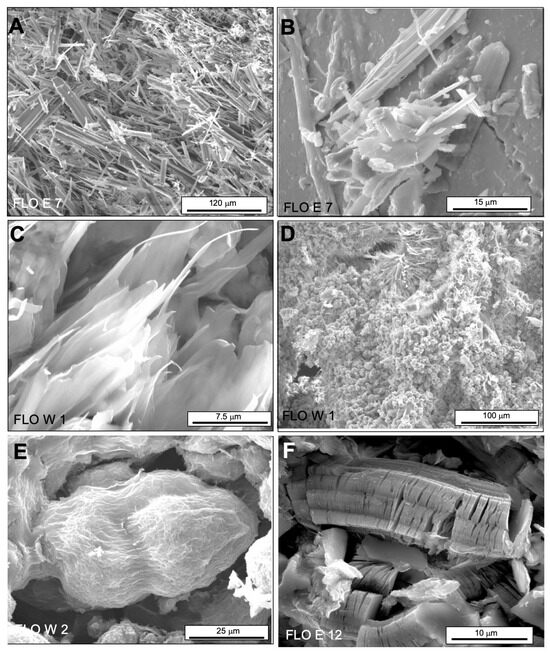
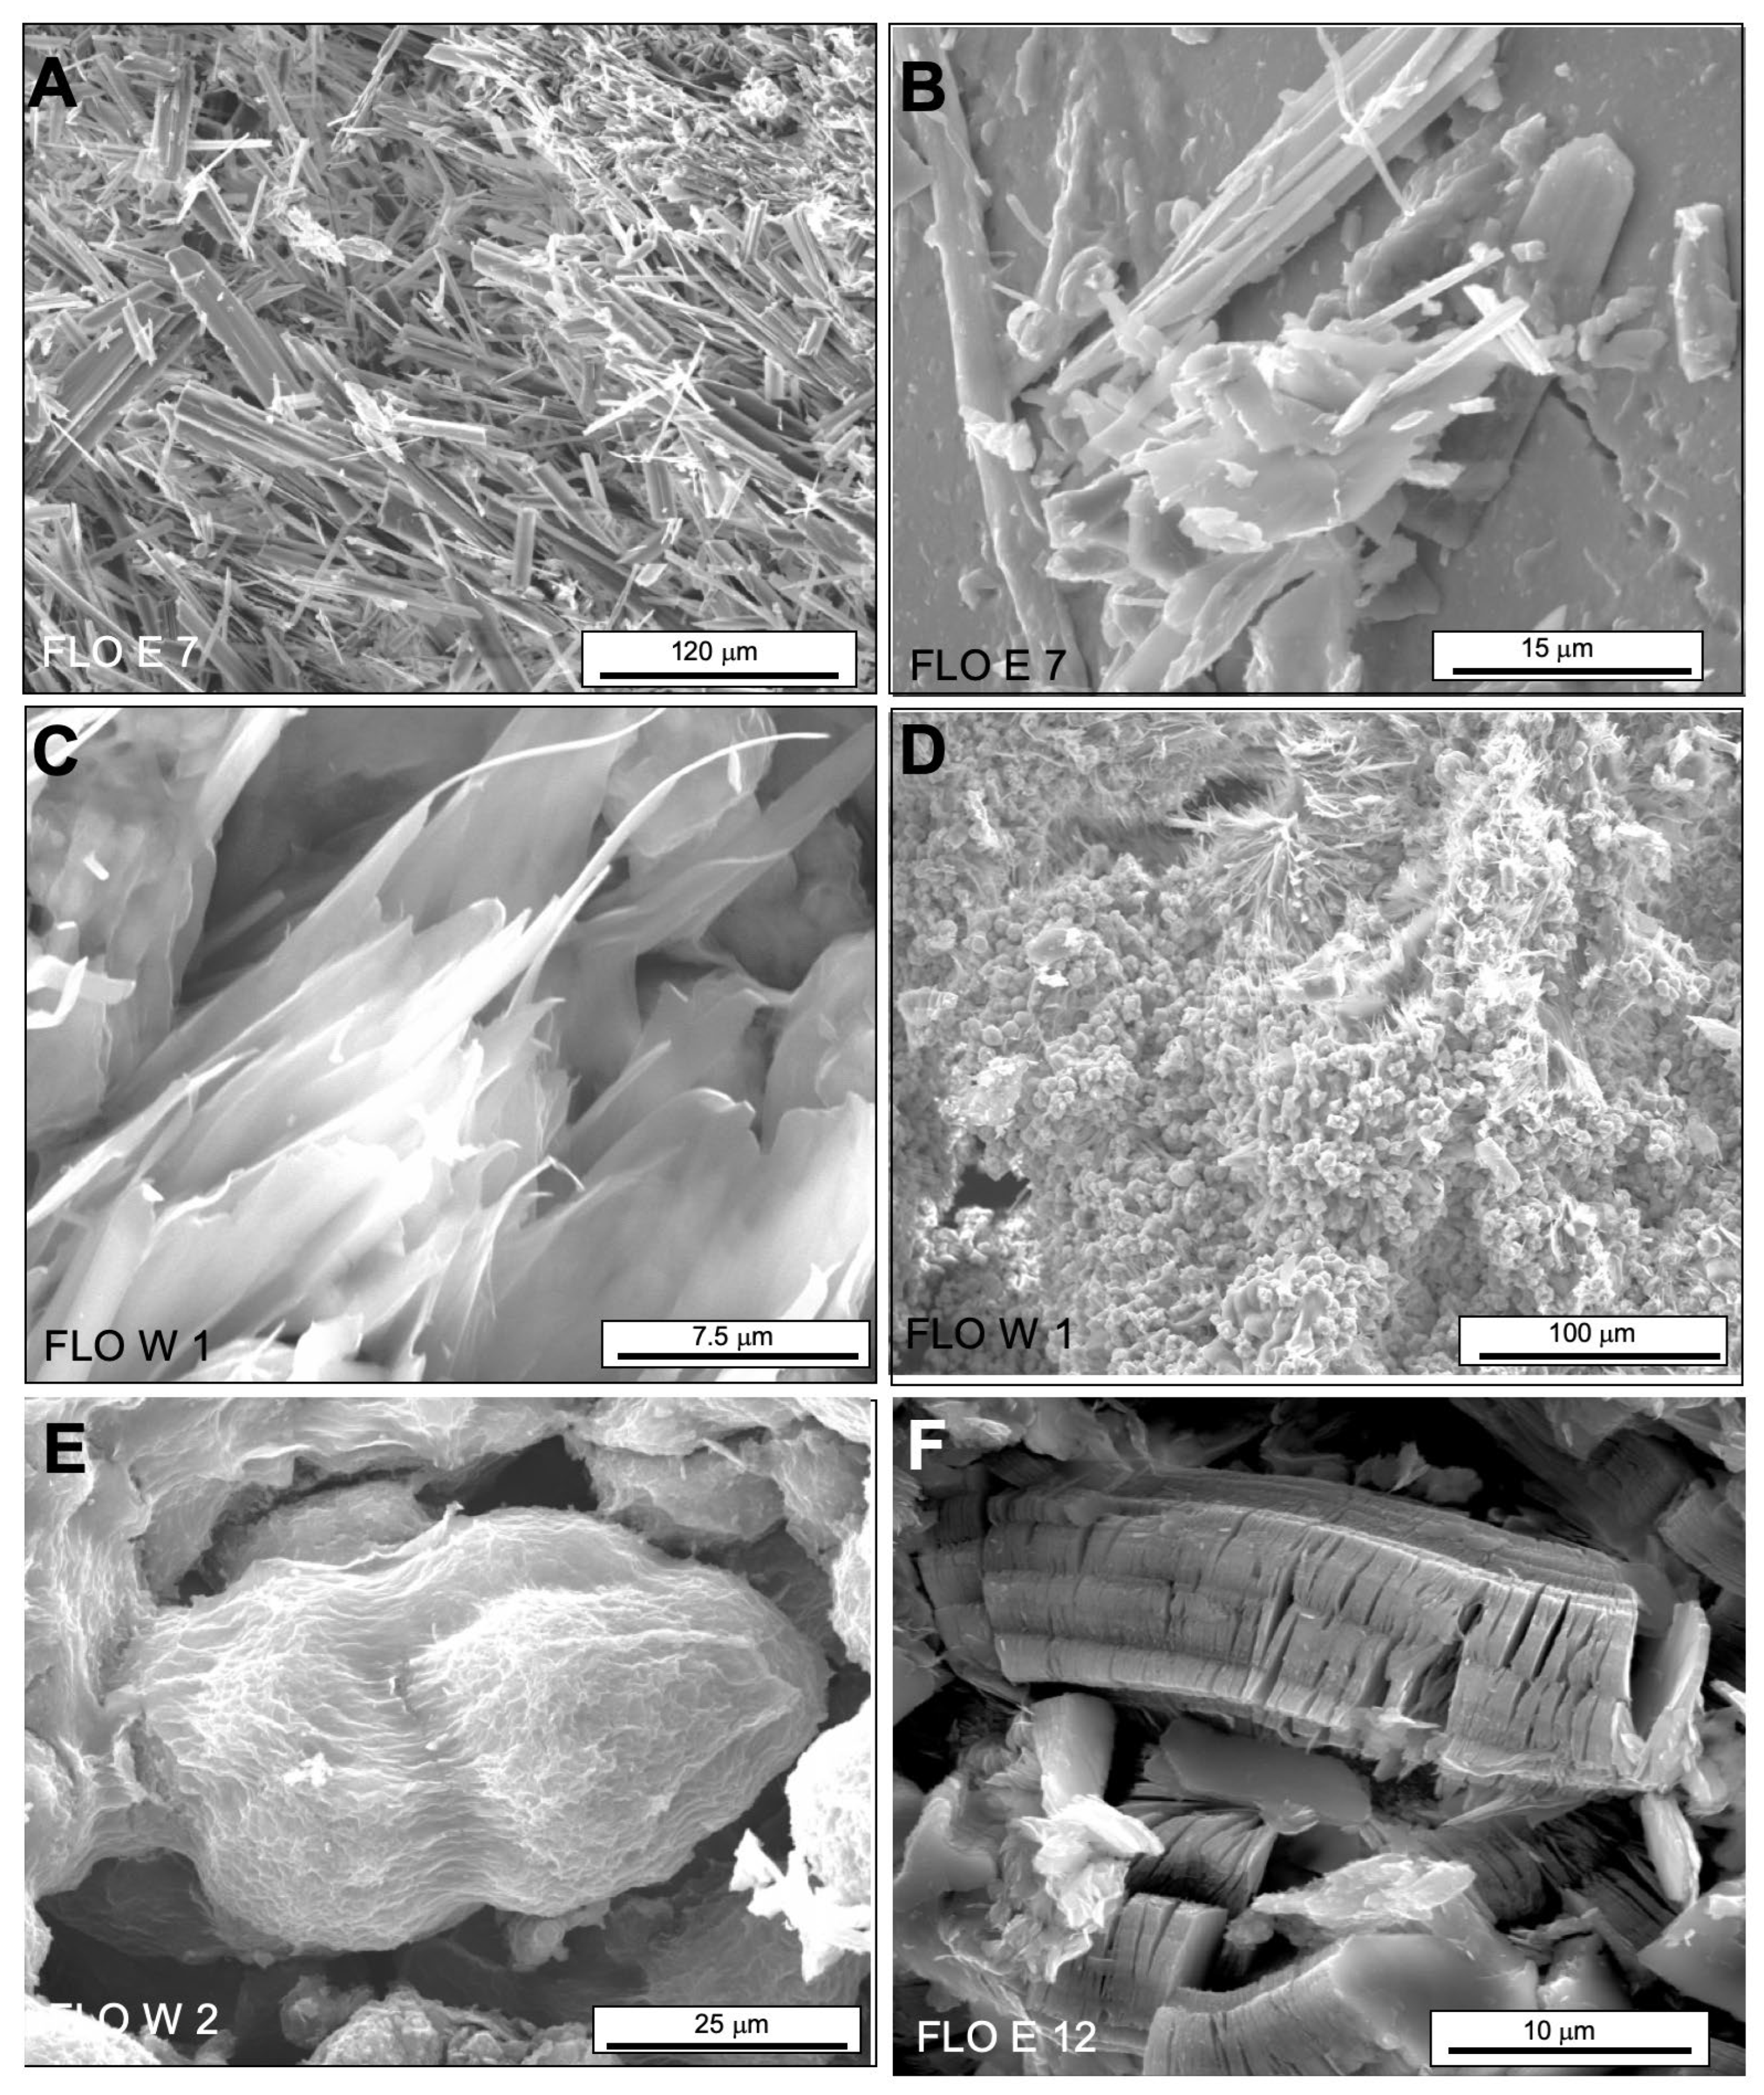
SEM microphotographs of supergene crystallisations observed at the Ity deposit. (A) Accumulation of chrysotile crystals in residues of marbles; (B) chrysotile on a calcite grain; (C) smectite layers; (D) Goethite within smectite clusters; (E) spheroïd psilomelane enclosed in clay; (F) euhedral kaolinite crystals with accordion-like stacking pattern.
Figure 8.
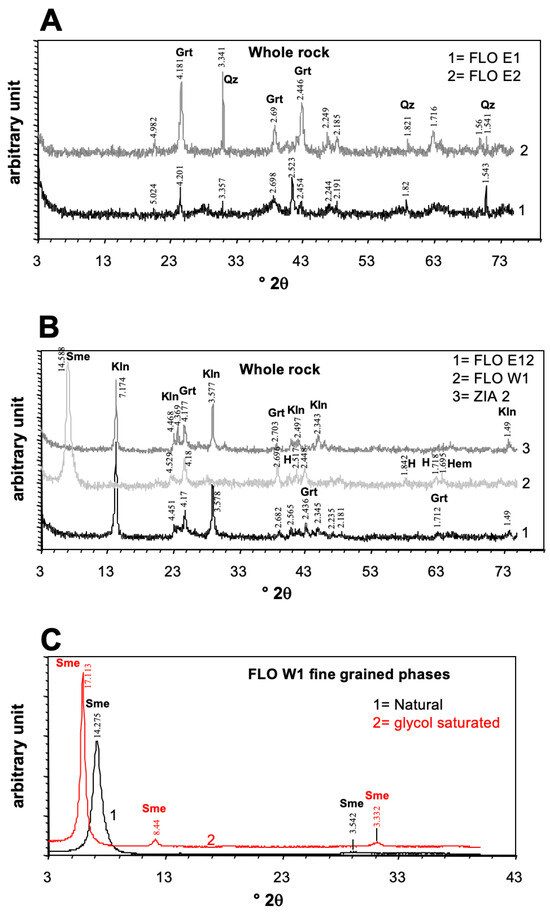
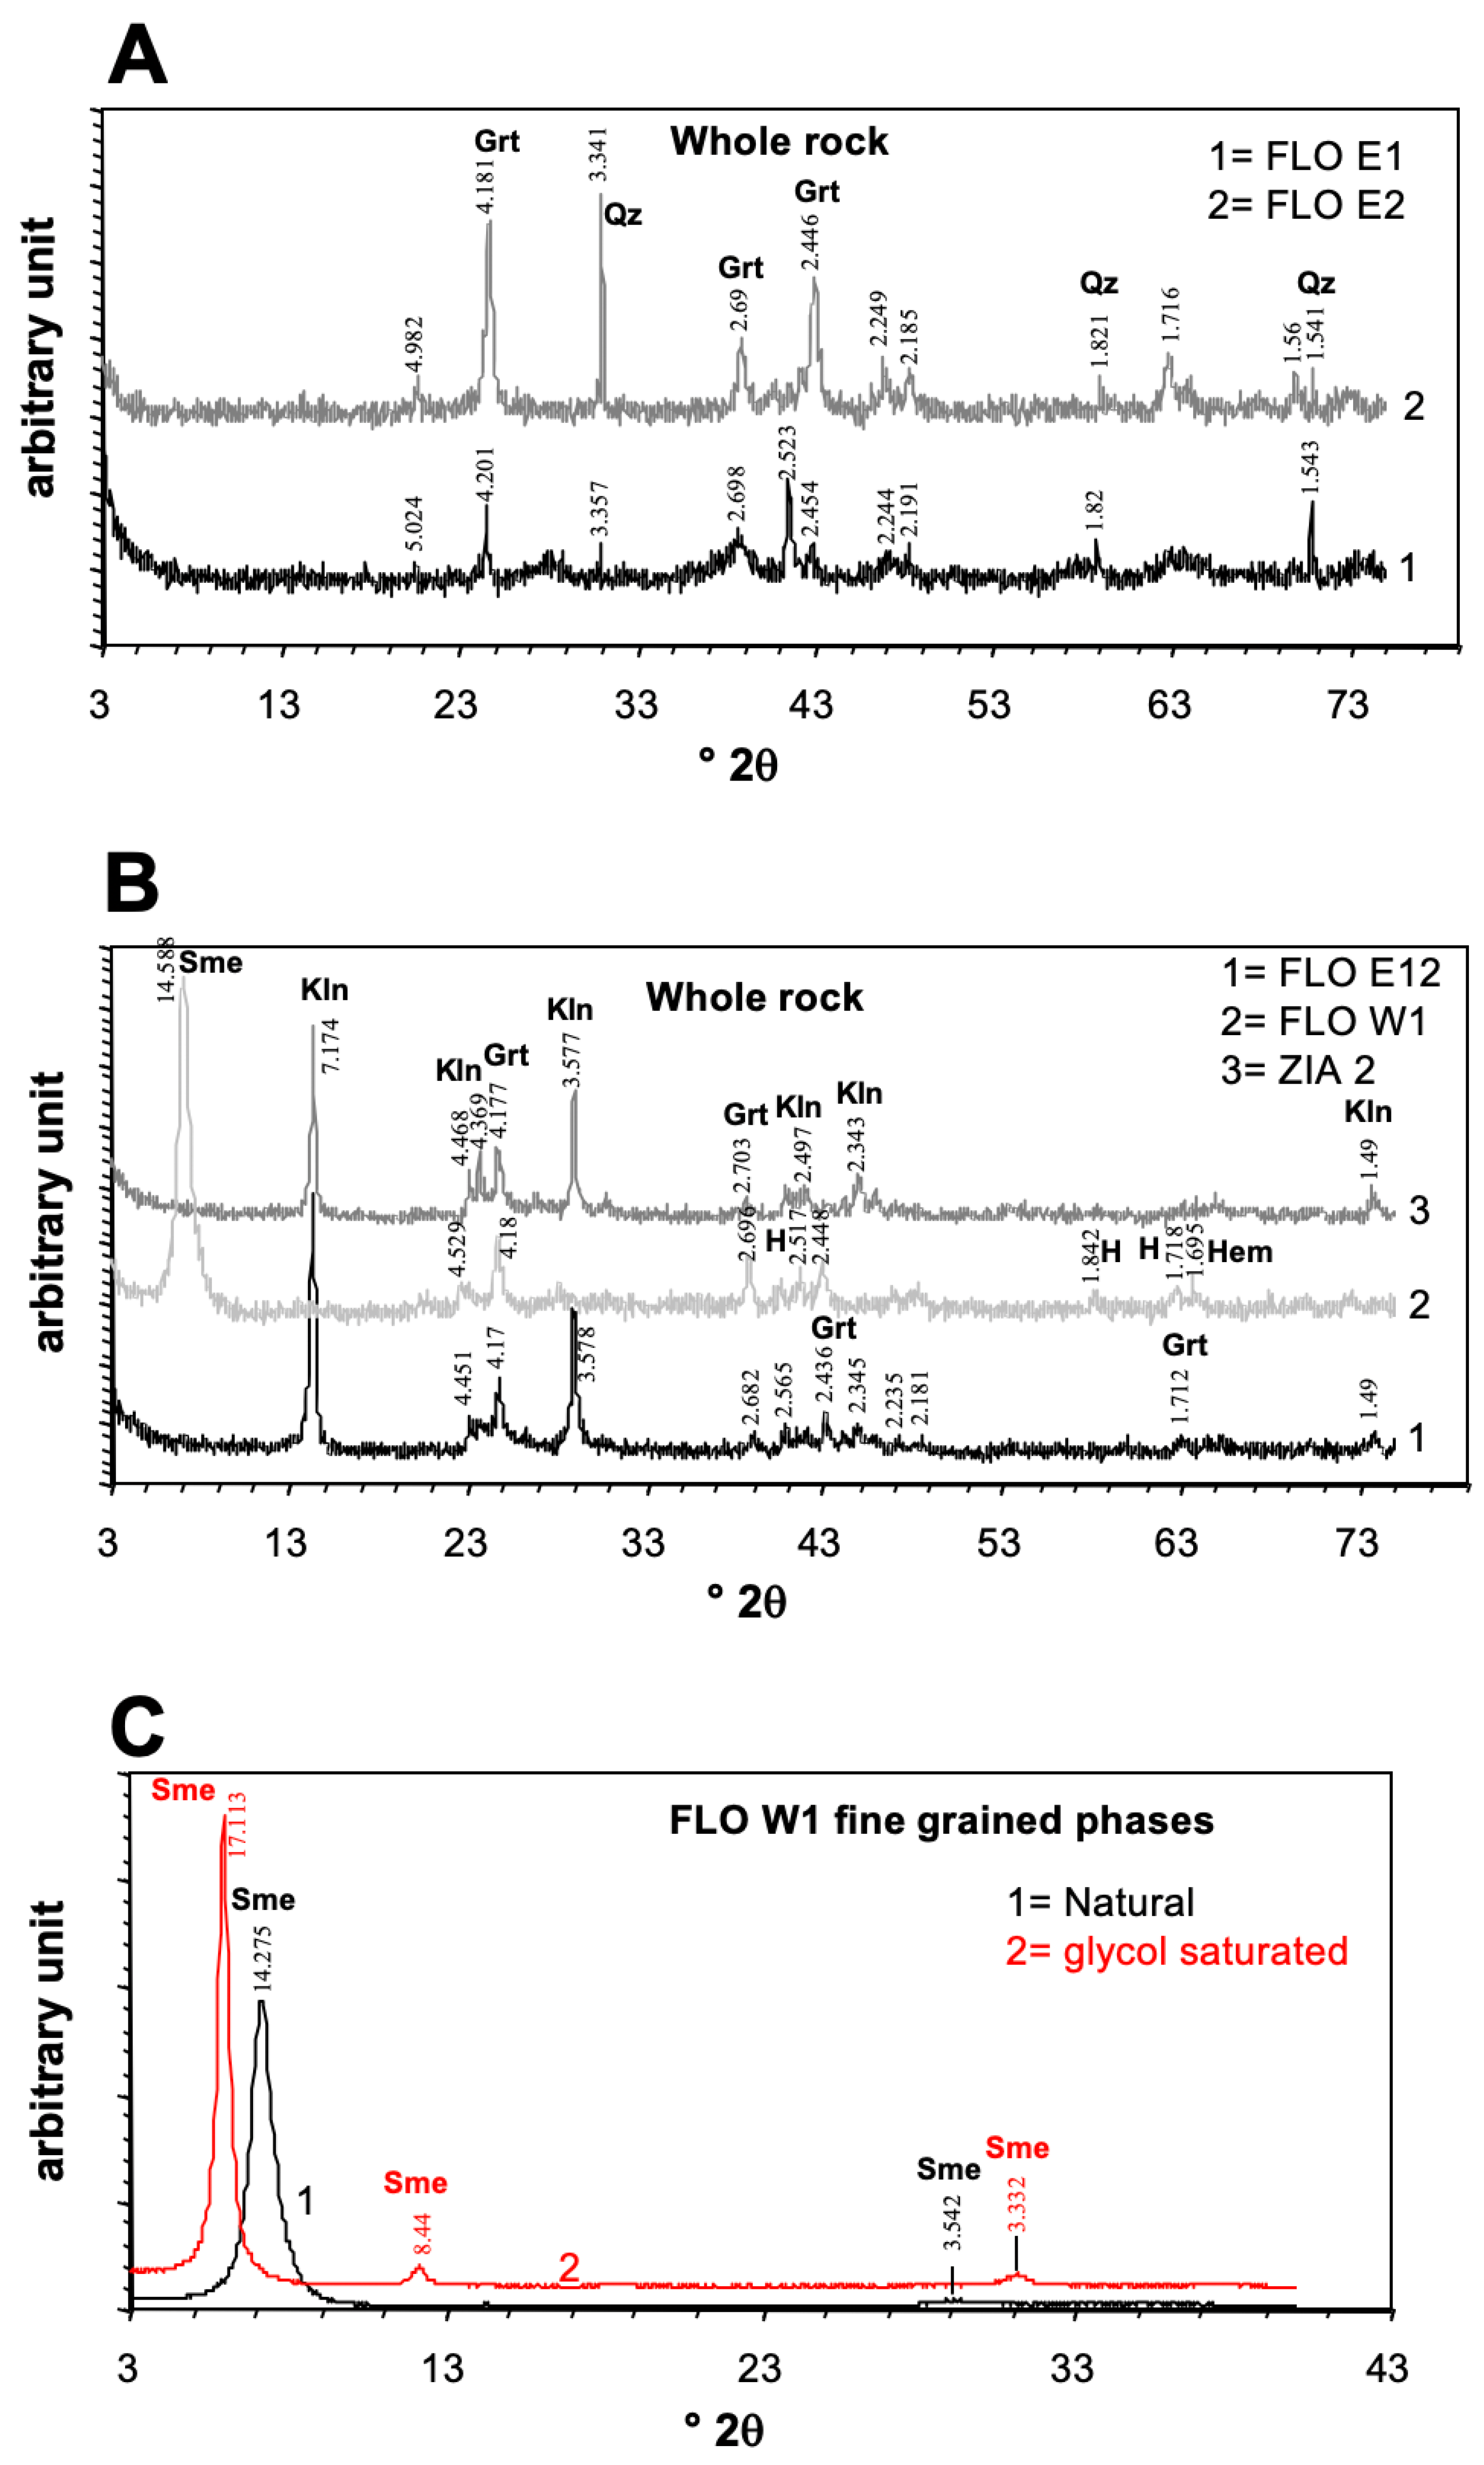
XRD patterns of representative bedrock and saprolite samples. (A) Whole rock diffractograms of FLO 1 and FLO 2. (B) Whole rock diffraction patterns of FLO E12, FLOW1, and ZIA 2. (C) Diffractograms of fine fractions of FLO W1 (normal and glycol saturated) showing the displacement of the 001 peak from 14.2 to 17.1 Å. Values near the diffraction peaks correspond to d values (in Å). Grt: garnet; Qz: quartz; Sme: smectite; Kln: kaolinite; Hem: hematite (abbreviated as H when place lacks).
Figure 9.
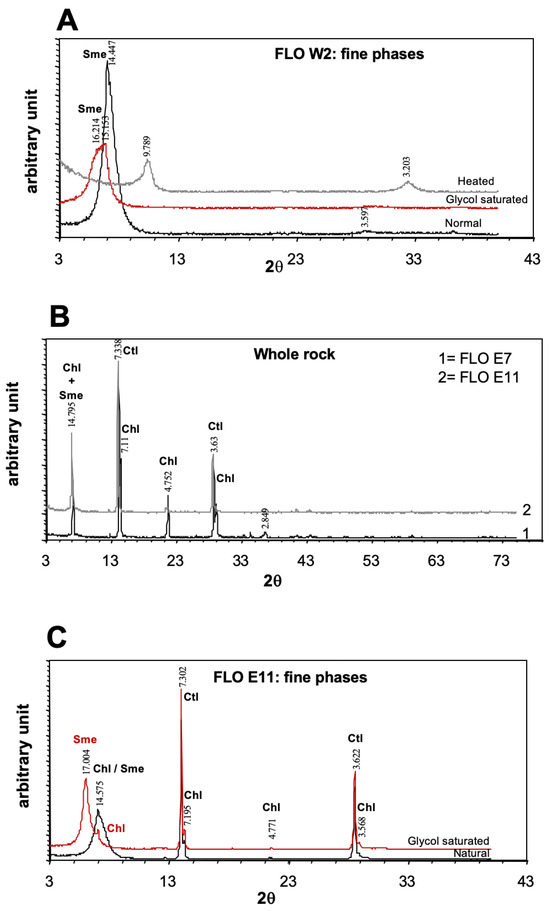
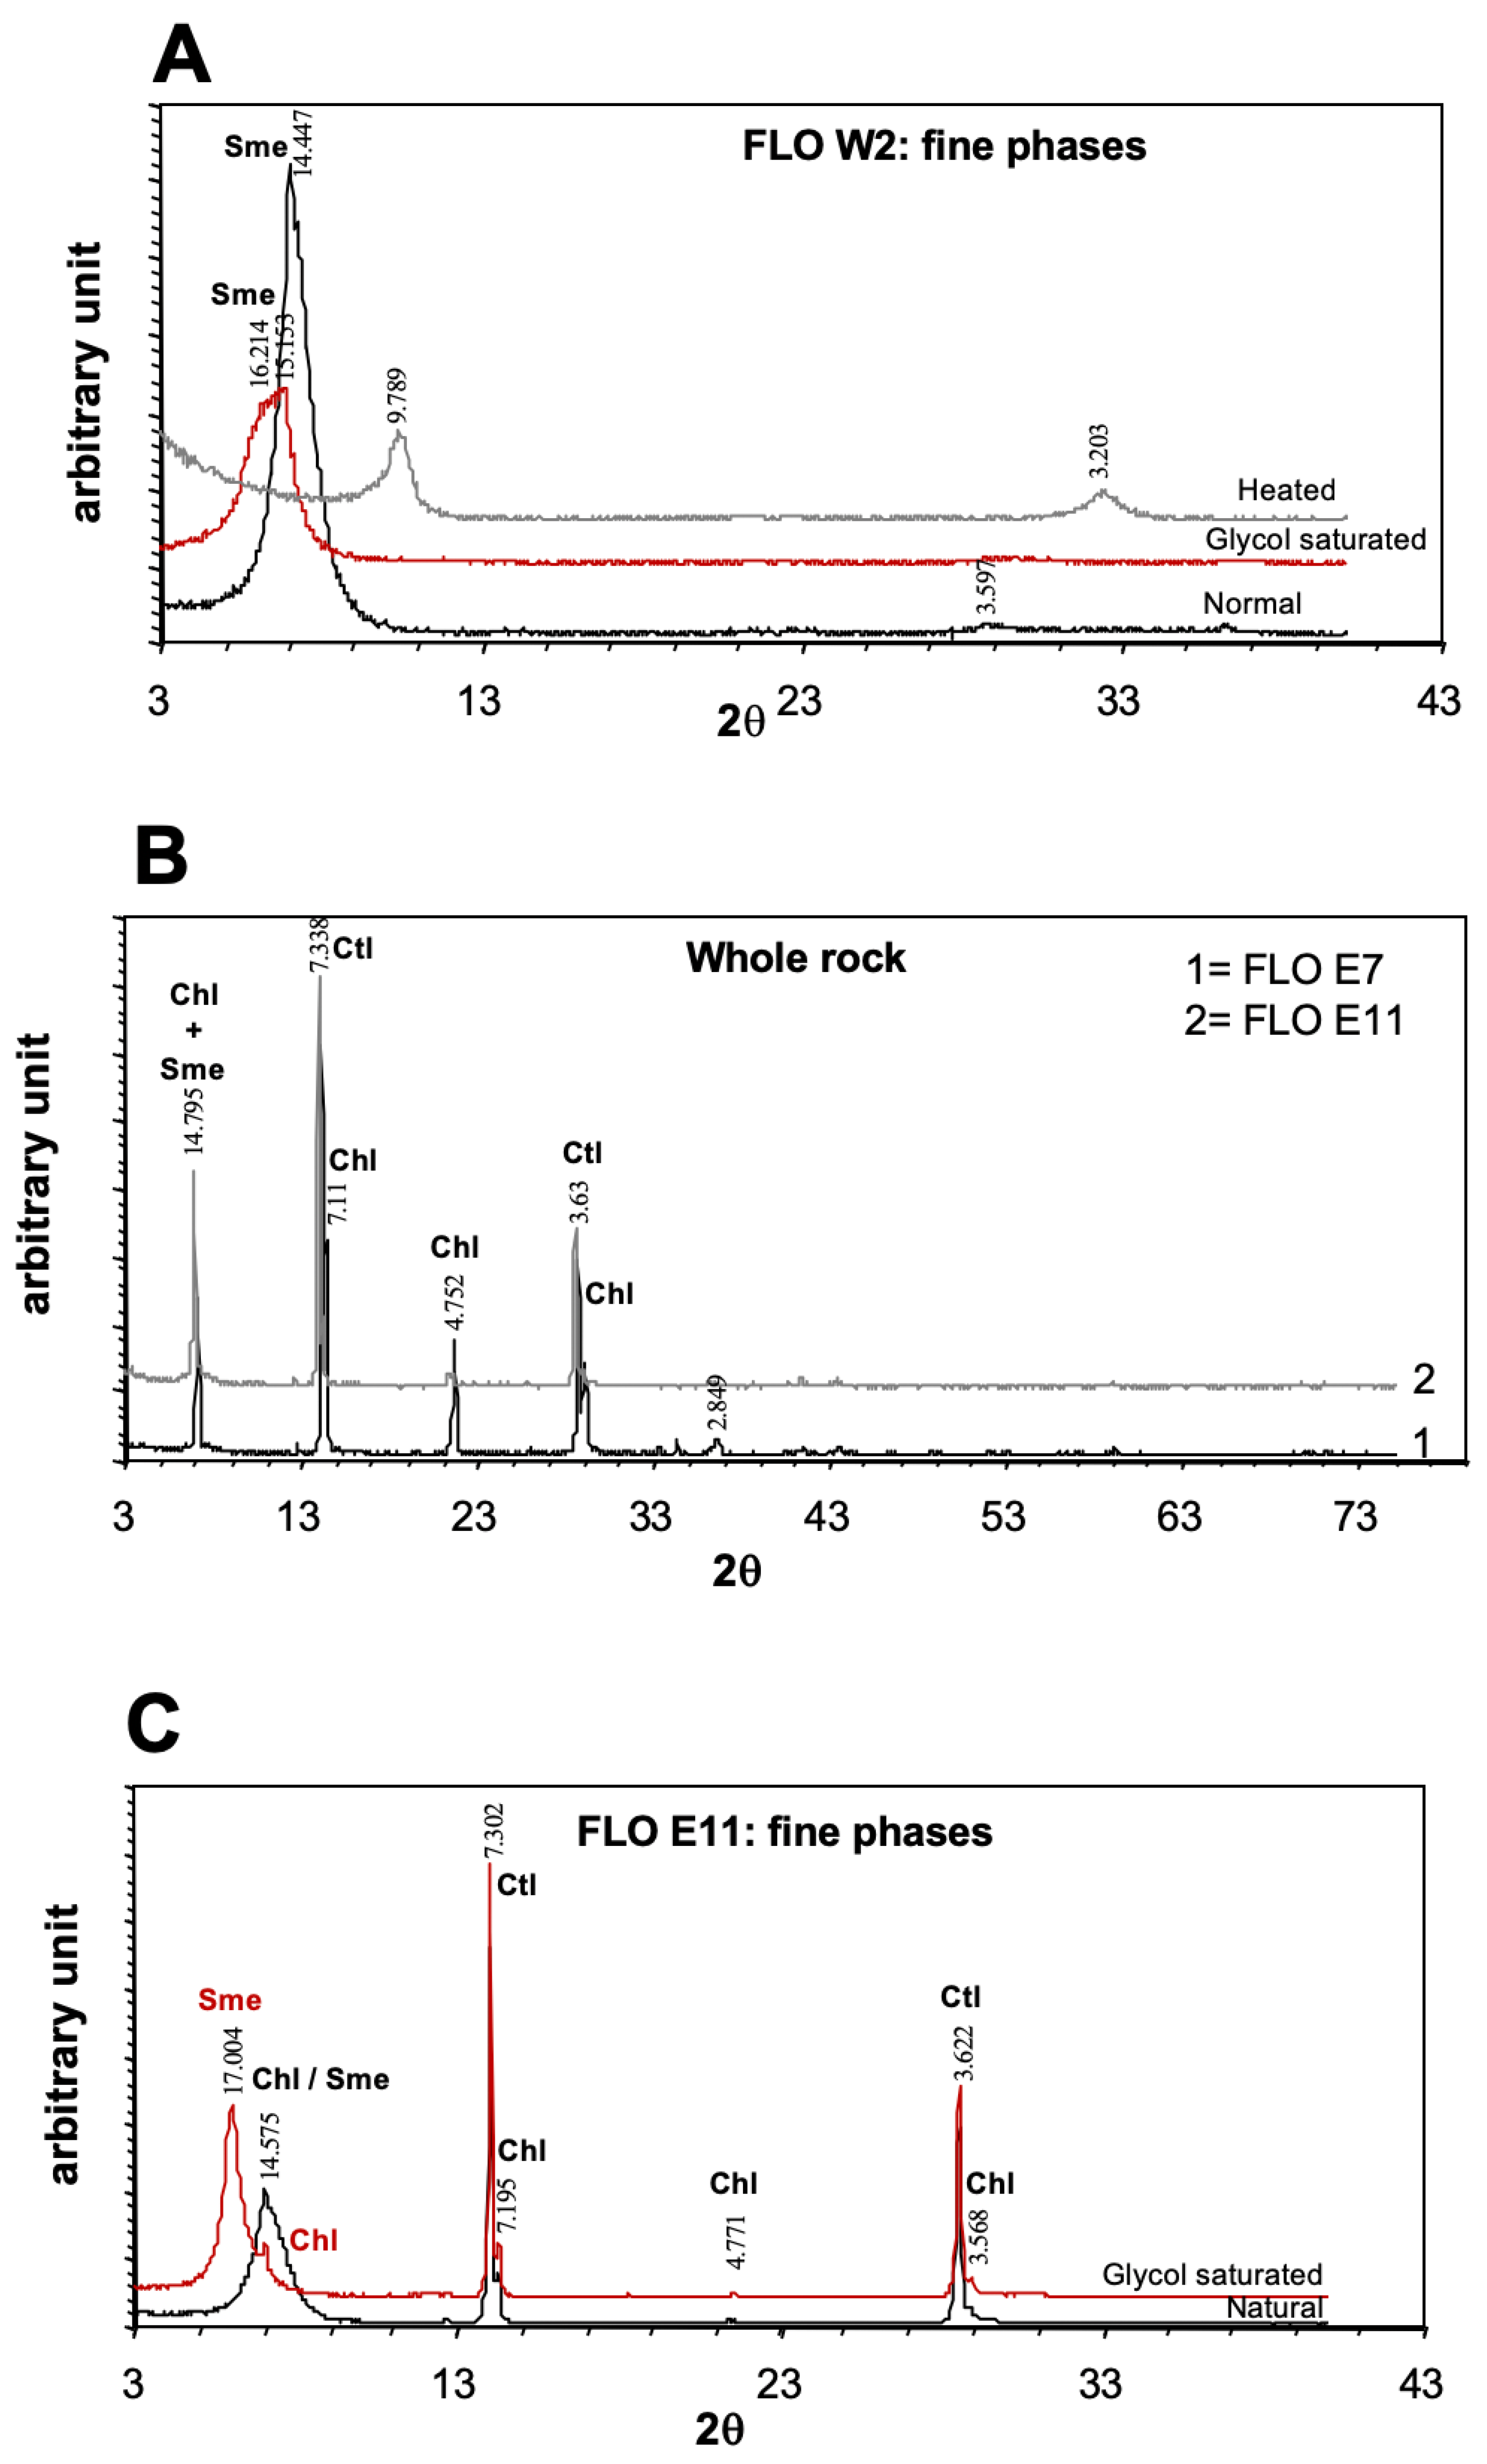
(A) Diffractograms of fine fractions of FLO W2. (B) Whole rock diffractogram of sample FLO E11. (C) Diffractograms of fine fractions of FLO E11. Sme: smectite; Chl: chlorite; Ctl: chrysotile.
4.2.1. Marbles and Their Residues After Dissolution
Marbles are characterised by massive calcite affected by veins containing some green silicates (amphibole–pyroxene, followed or altered by epidote–chlorite–chrysotile) (Figure 5A,B). The insoluble residues of marble weathering are shown in Figure 5C,D. They are friable, green-coloured, and exhibit a high gold content (approximately 20 g/t). SEM analysis shows that sample FLO E7 is mainly composed of chrysotile (Figure 7A,B and Figure 8A,B). Additional phases are smectite, chlorite, and relic calcite. Sample FLO E11 shows a similar composition with prevailing chrysotile acicular crystals associated with smectites, chlorite, and quartz grains.
4.2.2. Skarns and Their Alteration Products
The garnet (andradite) magnetite skarn contains sulphides (pyrite, pyrrhotite, chalcopyrite) and quartz, and is rich in metals, including gold. The black ground ore results from magnetite weathering. It shows slight macroscopic variation and has been studied in a representative sample noted FLO E1 (Figure 6). More locally, the spice bread ore (FLO E2) consists of pockets with a more reddish-brown colour.
Black ground facies (FLO E1): This mineralised kind of saprolite developed onto black skarns rich in magnetite, is fine-grained and has a black colour (Figure 6A). Its gold content is around 10 g/t. It is mainly composed of goethite with residual quartz.
Spice bread ore (FLO E2): This ore, observed as a pocket bunch filled with altered skarnoid material and having reddish colour, is called “spice bread” (Figure 6B). Gold content of sample FLO E2 is 13.1 g/t. This sample is primarily composed of goethite and contains residual undissolved quartz grains.
4.2.3. Smectite-Rich Clay Saprolites
Clayey ore (FLO W1): This ore is clayey and rich in altered pyrite showing greenish zones alternating with reddish zones (Figure 6C,D). Gold contents are around 3 g/t. This facies is mainly composed of smectite clusters forming a clay matrix (Figure 7C) and contains goethite concretions (Figure 7D).
The blue-greenish colour seen in Figure 6C,D corresponds to a mixture of several secondary products of weathering of the Cu sulphides (chalcopyrite, covellite): malachite volumetric abundance reaches up locally to 20%, sometimes associated with spherulitic chalcedony, and poorly crystallised other Cu carbonates were found. Native Cu was also found locally.
Green ore (FLO W2): This rock, yellow-greenish coloured and containing blackish inclusions, is called “green ore” (Figure 6E). It was sampled at the footwall of the western ore heap. The gold content exceeds 2 g/t. This sample consists of smectite, quartz, and newly formed goethite and psilomelane concretions (Figure 6F and Figure 7F).
4.2.4. Kaolinised Breccias
Purple breccia (ZIA 2): This breccia, fully argillised and referred to as “purple breccia”, shows purplish-blue cement (Figure 6G). The clasts are always deformed, with sizes ranging from millimetric to centimetric and variable colours (white to milky, pinkish). This purple breccia is the primary ore type in the Ziatouo pit, with an average gold content of 4–5 g/t. XRD and SEM analyses show that this ore is mainly composed of kaolinite phases associated with goethite.
Sediment breccias (FLO E12): This polygenic breccia, called “sediment breccias”, is totally argillised and constitutes the primary ore type with an average gold content of 5 g/t. The sediment is brown, and the clasts exhibit variable colours (white, milky, white-greyish, and reddish) and sizes (ranging from millimetres to 5 centimetres). The reddish clast represents relictual quartz diorite. These breccias are caused by the accumulation of weathering products from deposits located above residual marbles. XRD and SEM analyses indicate they are dominated by kaolinite (Figure 7F) and contain a minor amount of illite. These clay phases contain important concretions of iron hydroxides (mostly goethite).
4.3. XRD Results
XRD analyses of the protholith rocks and their saprolites are shown in Figure 8 and Figure 9, respectively. Results indicate that the skarns are dominated by garnet and quartz (Figure 8A). The whole-rock diffraction patterns of the purple breccia ZIA 2 and sediment breccia FLO E12 show the predominance of kaolinite (Figure 8B).
In the green–brown clay ores (FLO W1), the predominant clay is a smectite which swells from 14 to 17 Å after glycolation (Figure 8C). In the green ore, the fine-grained fraction is also dominated by smectite which swells from 14.5 (air-dried) to 16.3 Å when glycolated, and collapses at 9.7 Å when heated (Figure 9A).
The silicate fraction of the marble residues is constituted of chlorite and chrysotile (Figure 9B). In the case of sample E11, the smectite amount was suspected to be more significant. After separation of the <2 micrometre fraction and glycolation, the smectite swells from 14.6 Å to 17.0 Å, leaving a smaller peak at 14.6 Å, confirming the predominance of smectite in this sample (Figure 9C).
4.4. Geochemistry Results
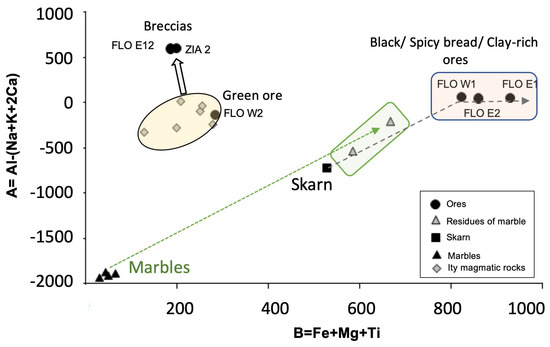
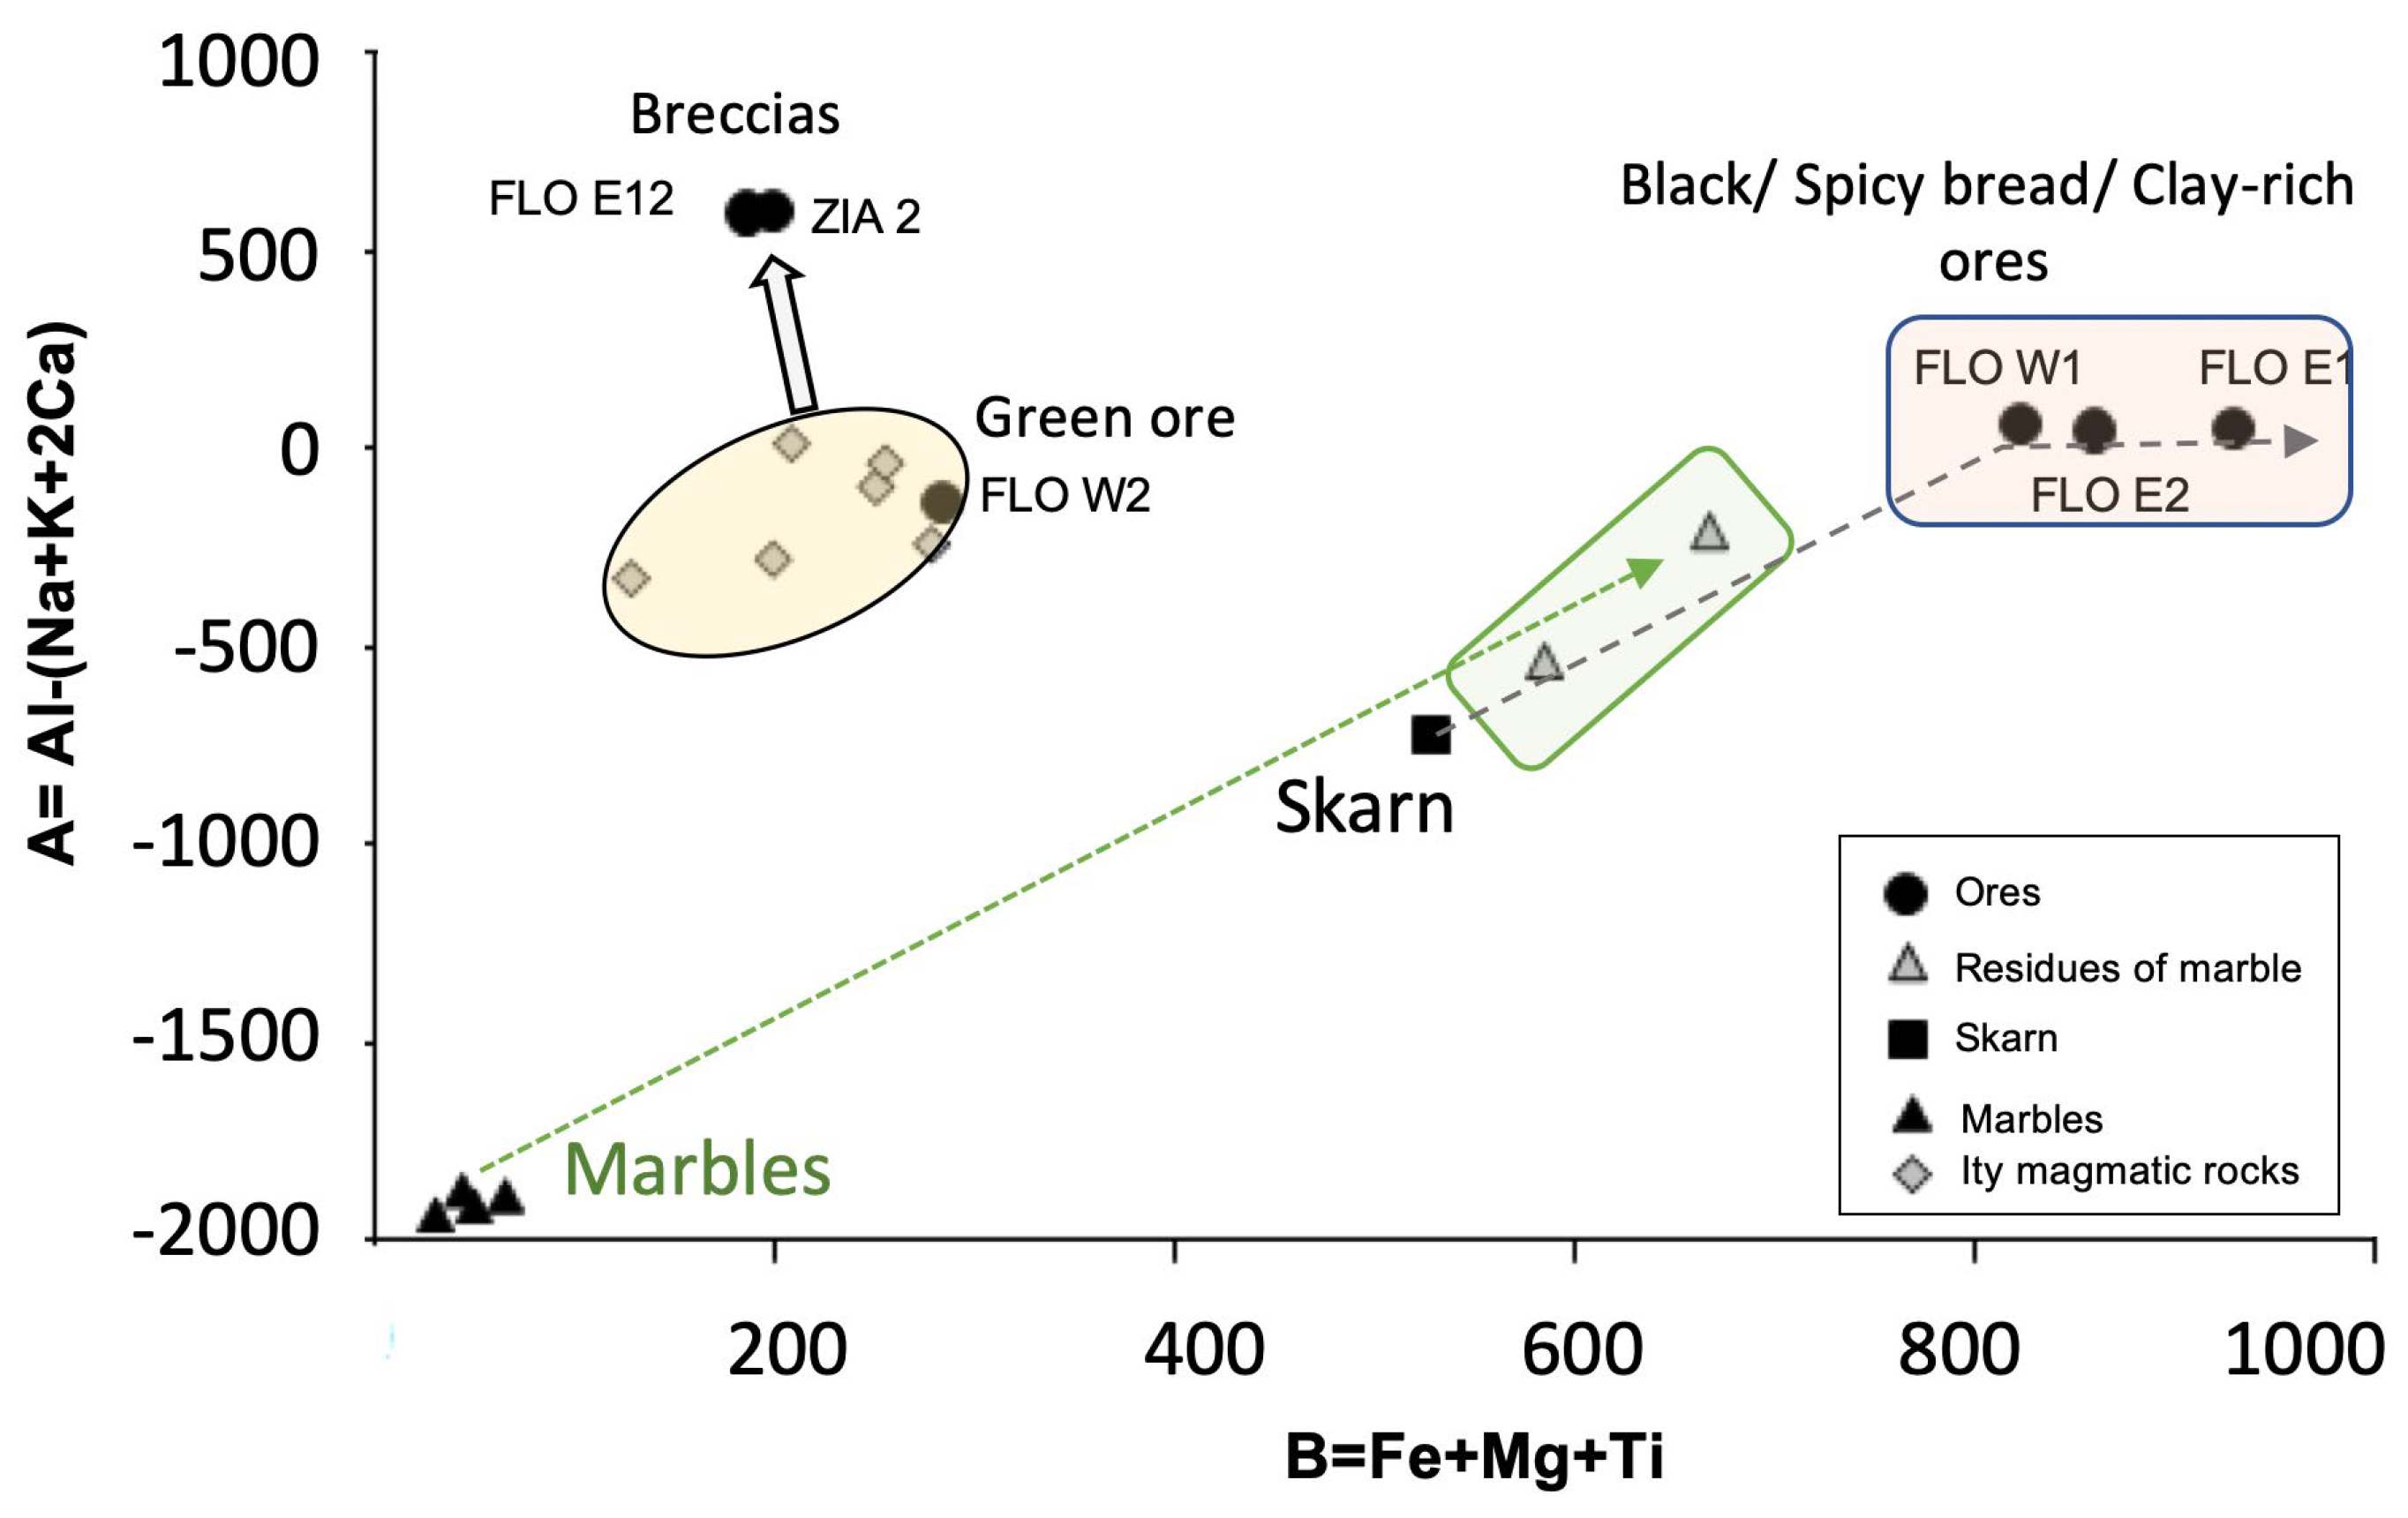
Six different types of ore and two residues of weathered marbles have been analysed (Table 2, for major elements, Table 3 for trace elements, and Table 4 for REE). Results are presented in Figure 10 (major chemical elements) and Figure 11 (significant trace elements). Normalisation of whole-rock analysis to the closest facies preserved from weathering is shown in Figure 12 and Figure 13. Finally, REE spectra, normalised to chondrites (using data from [35]), are shown in Figure 14. The weathered ore samples of Ity are distributed from preserved primary ores in three main geochemical envelopes, as shown in the Debon and Lefort [36] diagram: (i) the black earth ores, the spicy bread, (ii) the clay-rich ores, the residues of marbles, and (iii) the breccias (Figure 10). The two first groups are significantly enriched in Al, Fe, and Mg, as they are derived from skarns rich in garnet and magnetite, and the third group in Al has a lower enrichment in Fe and Mg and displays features close to the Ity granodiorites, confirming the hypotheses about their protolith.
Table 2.
Representative major elements and total sulfide (wt.%) analyses of representative rock samples from the Ity deposit. Italic and bold legends correspond to the main lithologies.
Table 3.
Representative trace element analyses (in ppm) of representative rock samples from the Ity deposit. Italic and bold legends correspond to the main lithologies. d.l.: detection limit.
Table 4.
Rare earth elements (ppm) analyses of the representative rock samples from the Ity deposit. Italic and bold legends correspond to the main lithologies.
Figure 10.
Diagram A versus B (from [36]) applied to representative samples of Ity ore facies (data and location of samples in Table 2 and Figure 2). Green dashed arrow shows the evolution between marbles and their residues, and black dashed arrow the evolution from skarn to its alteration products. Analyses of Ity magmatic rocks (granodiorite) data are from [33].
Figure 11.
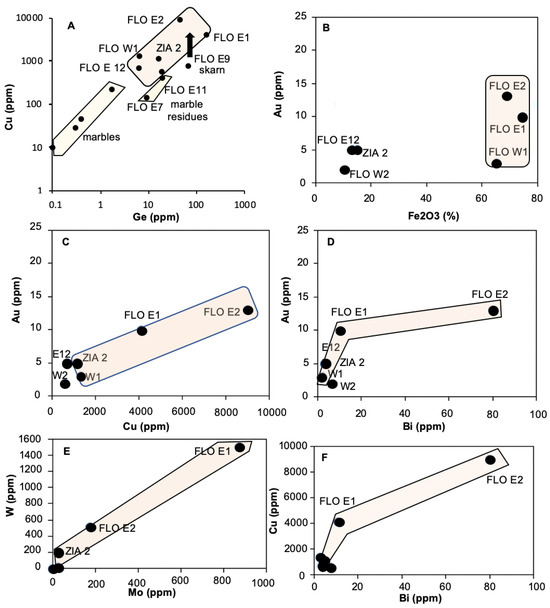
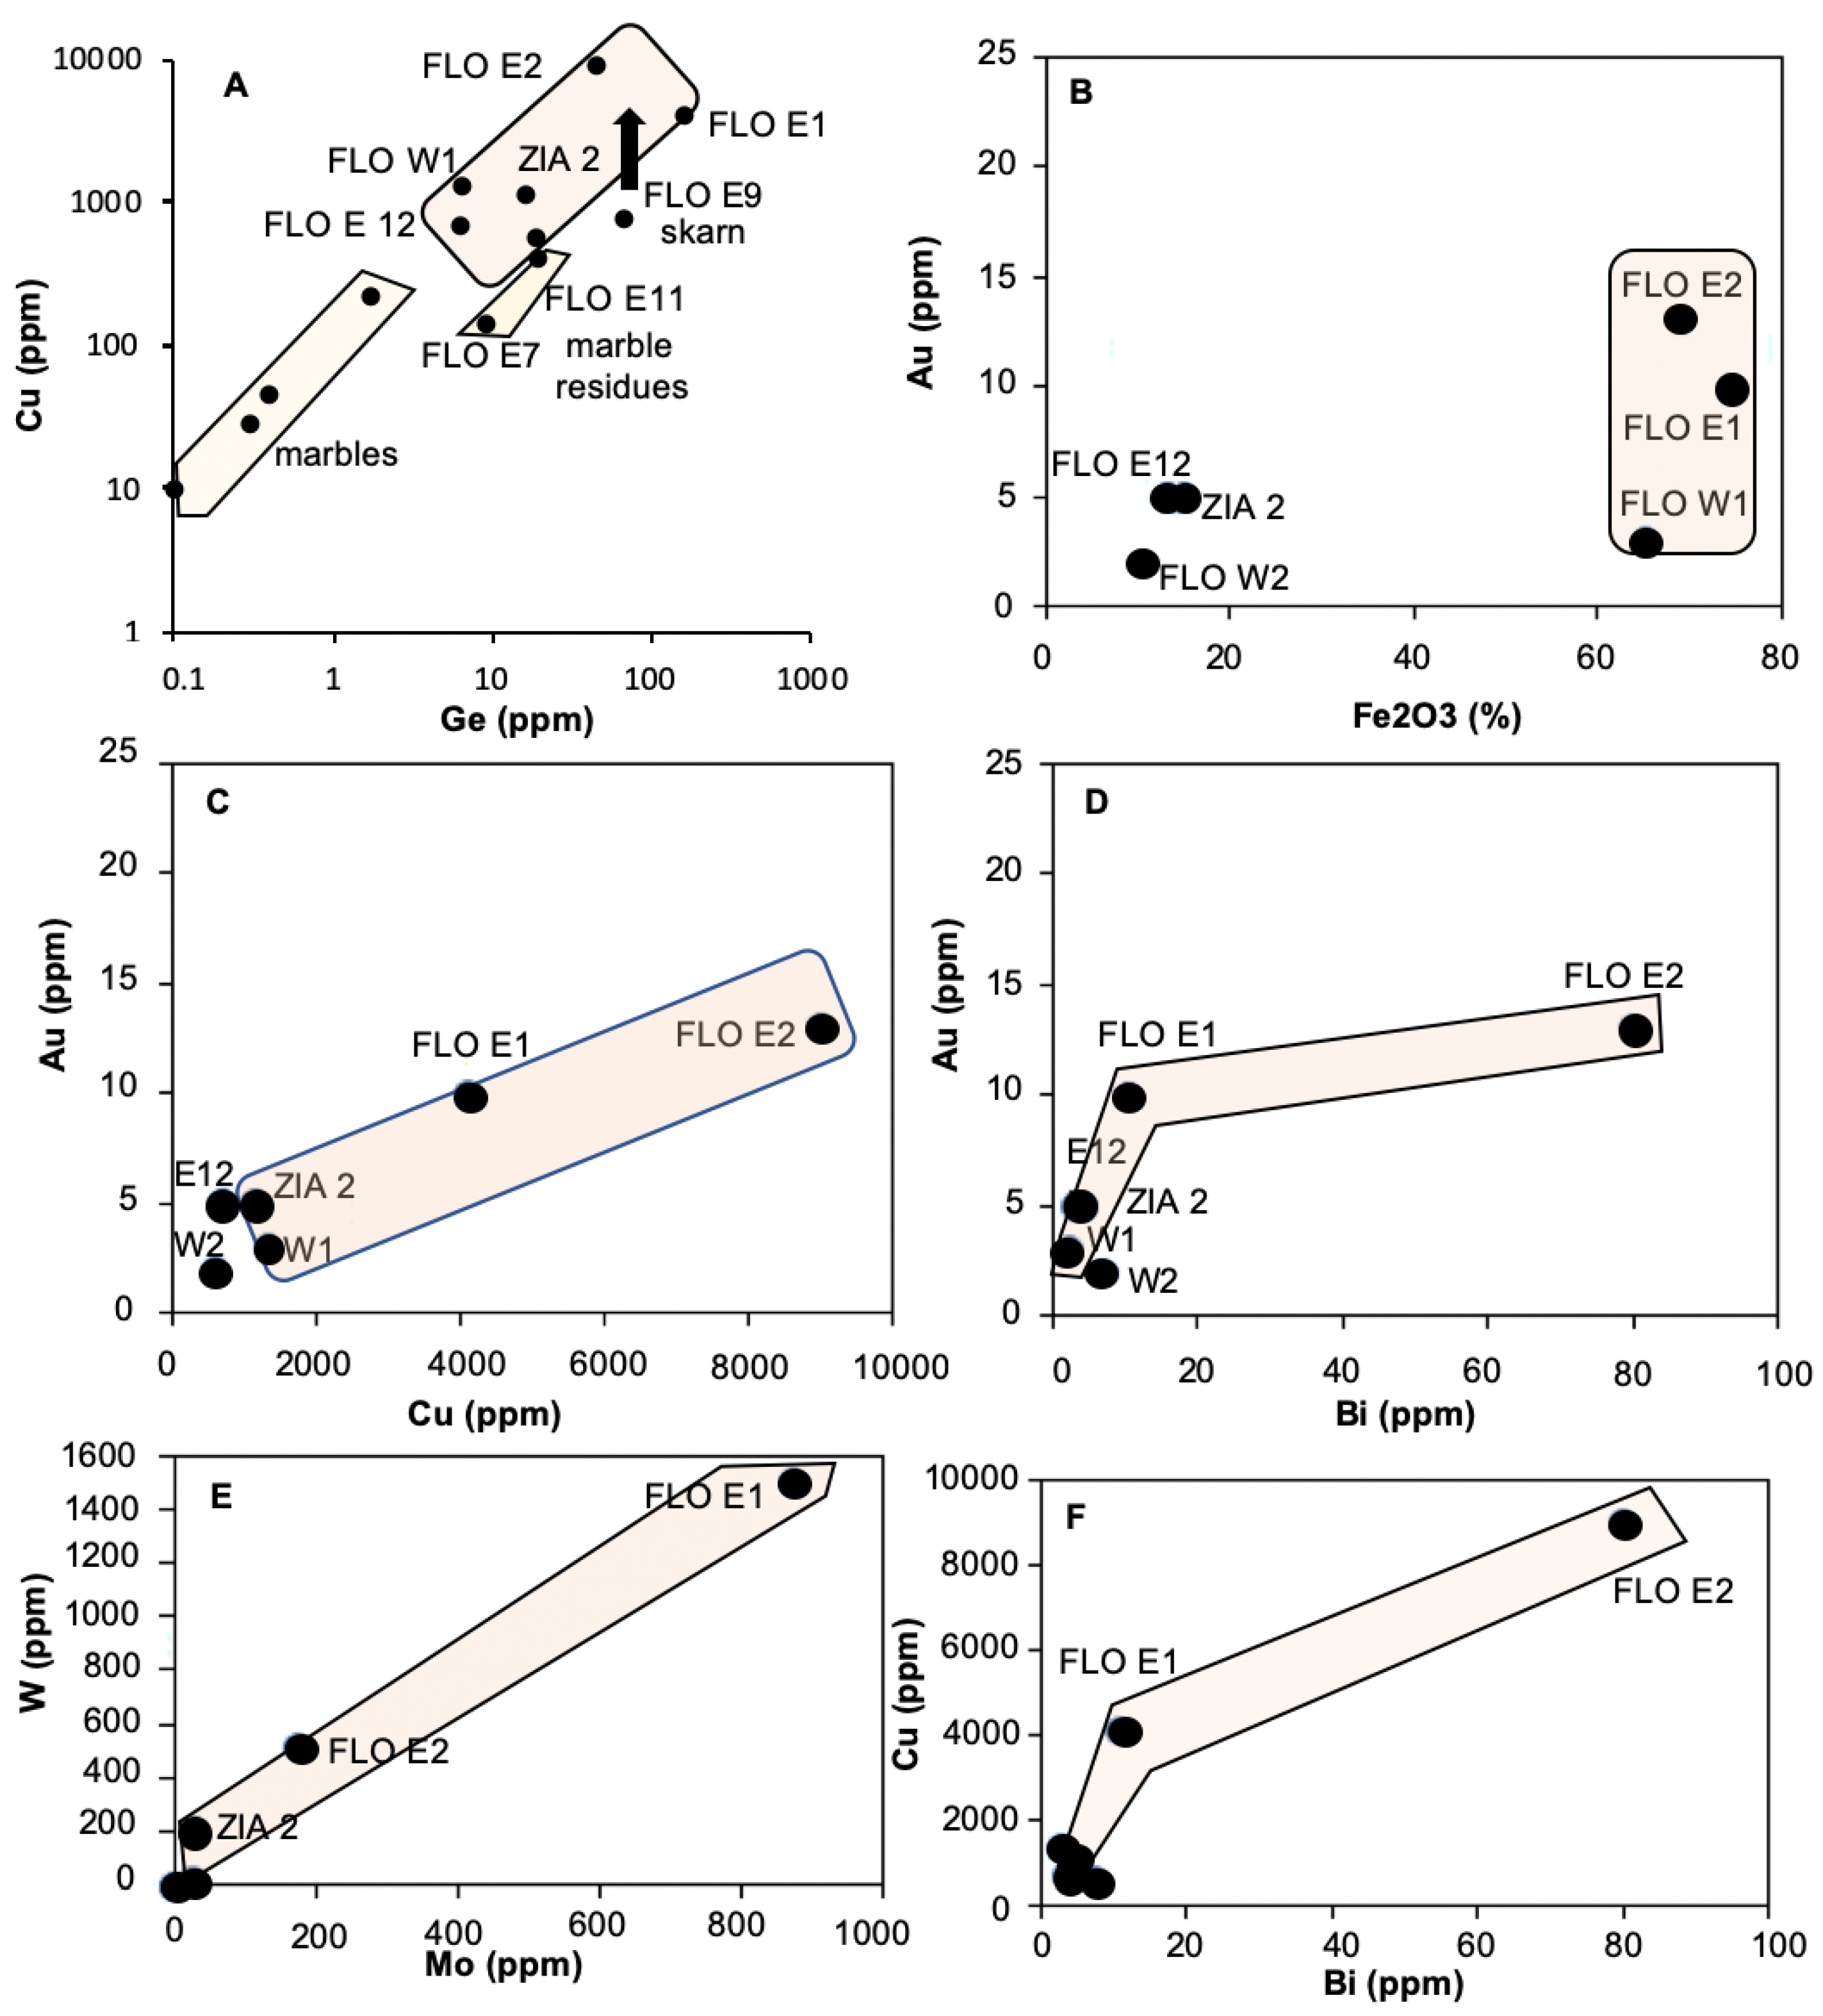
Cu vs Ge (A), Au vs Fe2O3 (B), and binary plots (Au vs Cu, Au vs Bi, W vs Mo, and Cu vs Bi) for primary and weathered facies from Ity (C–F).
Figure 12.
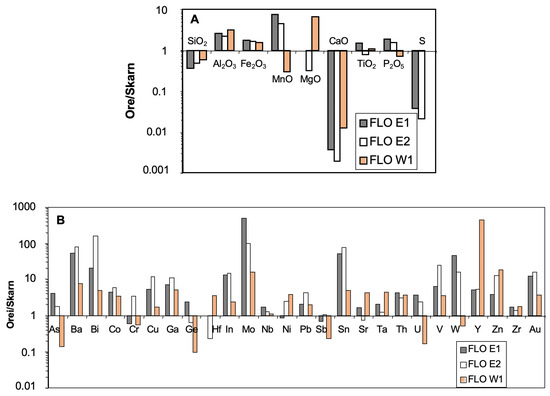
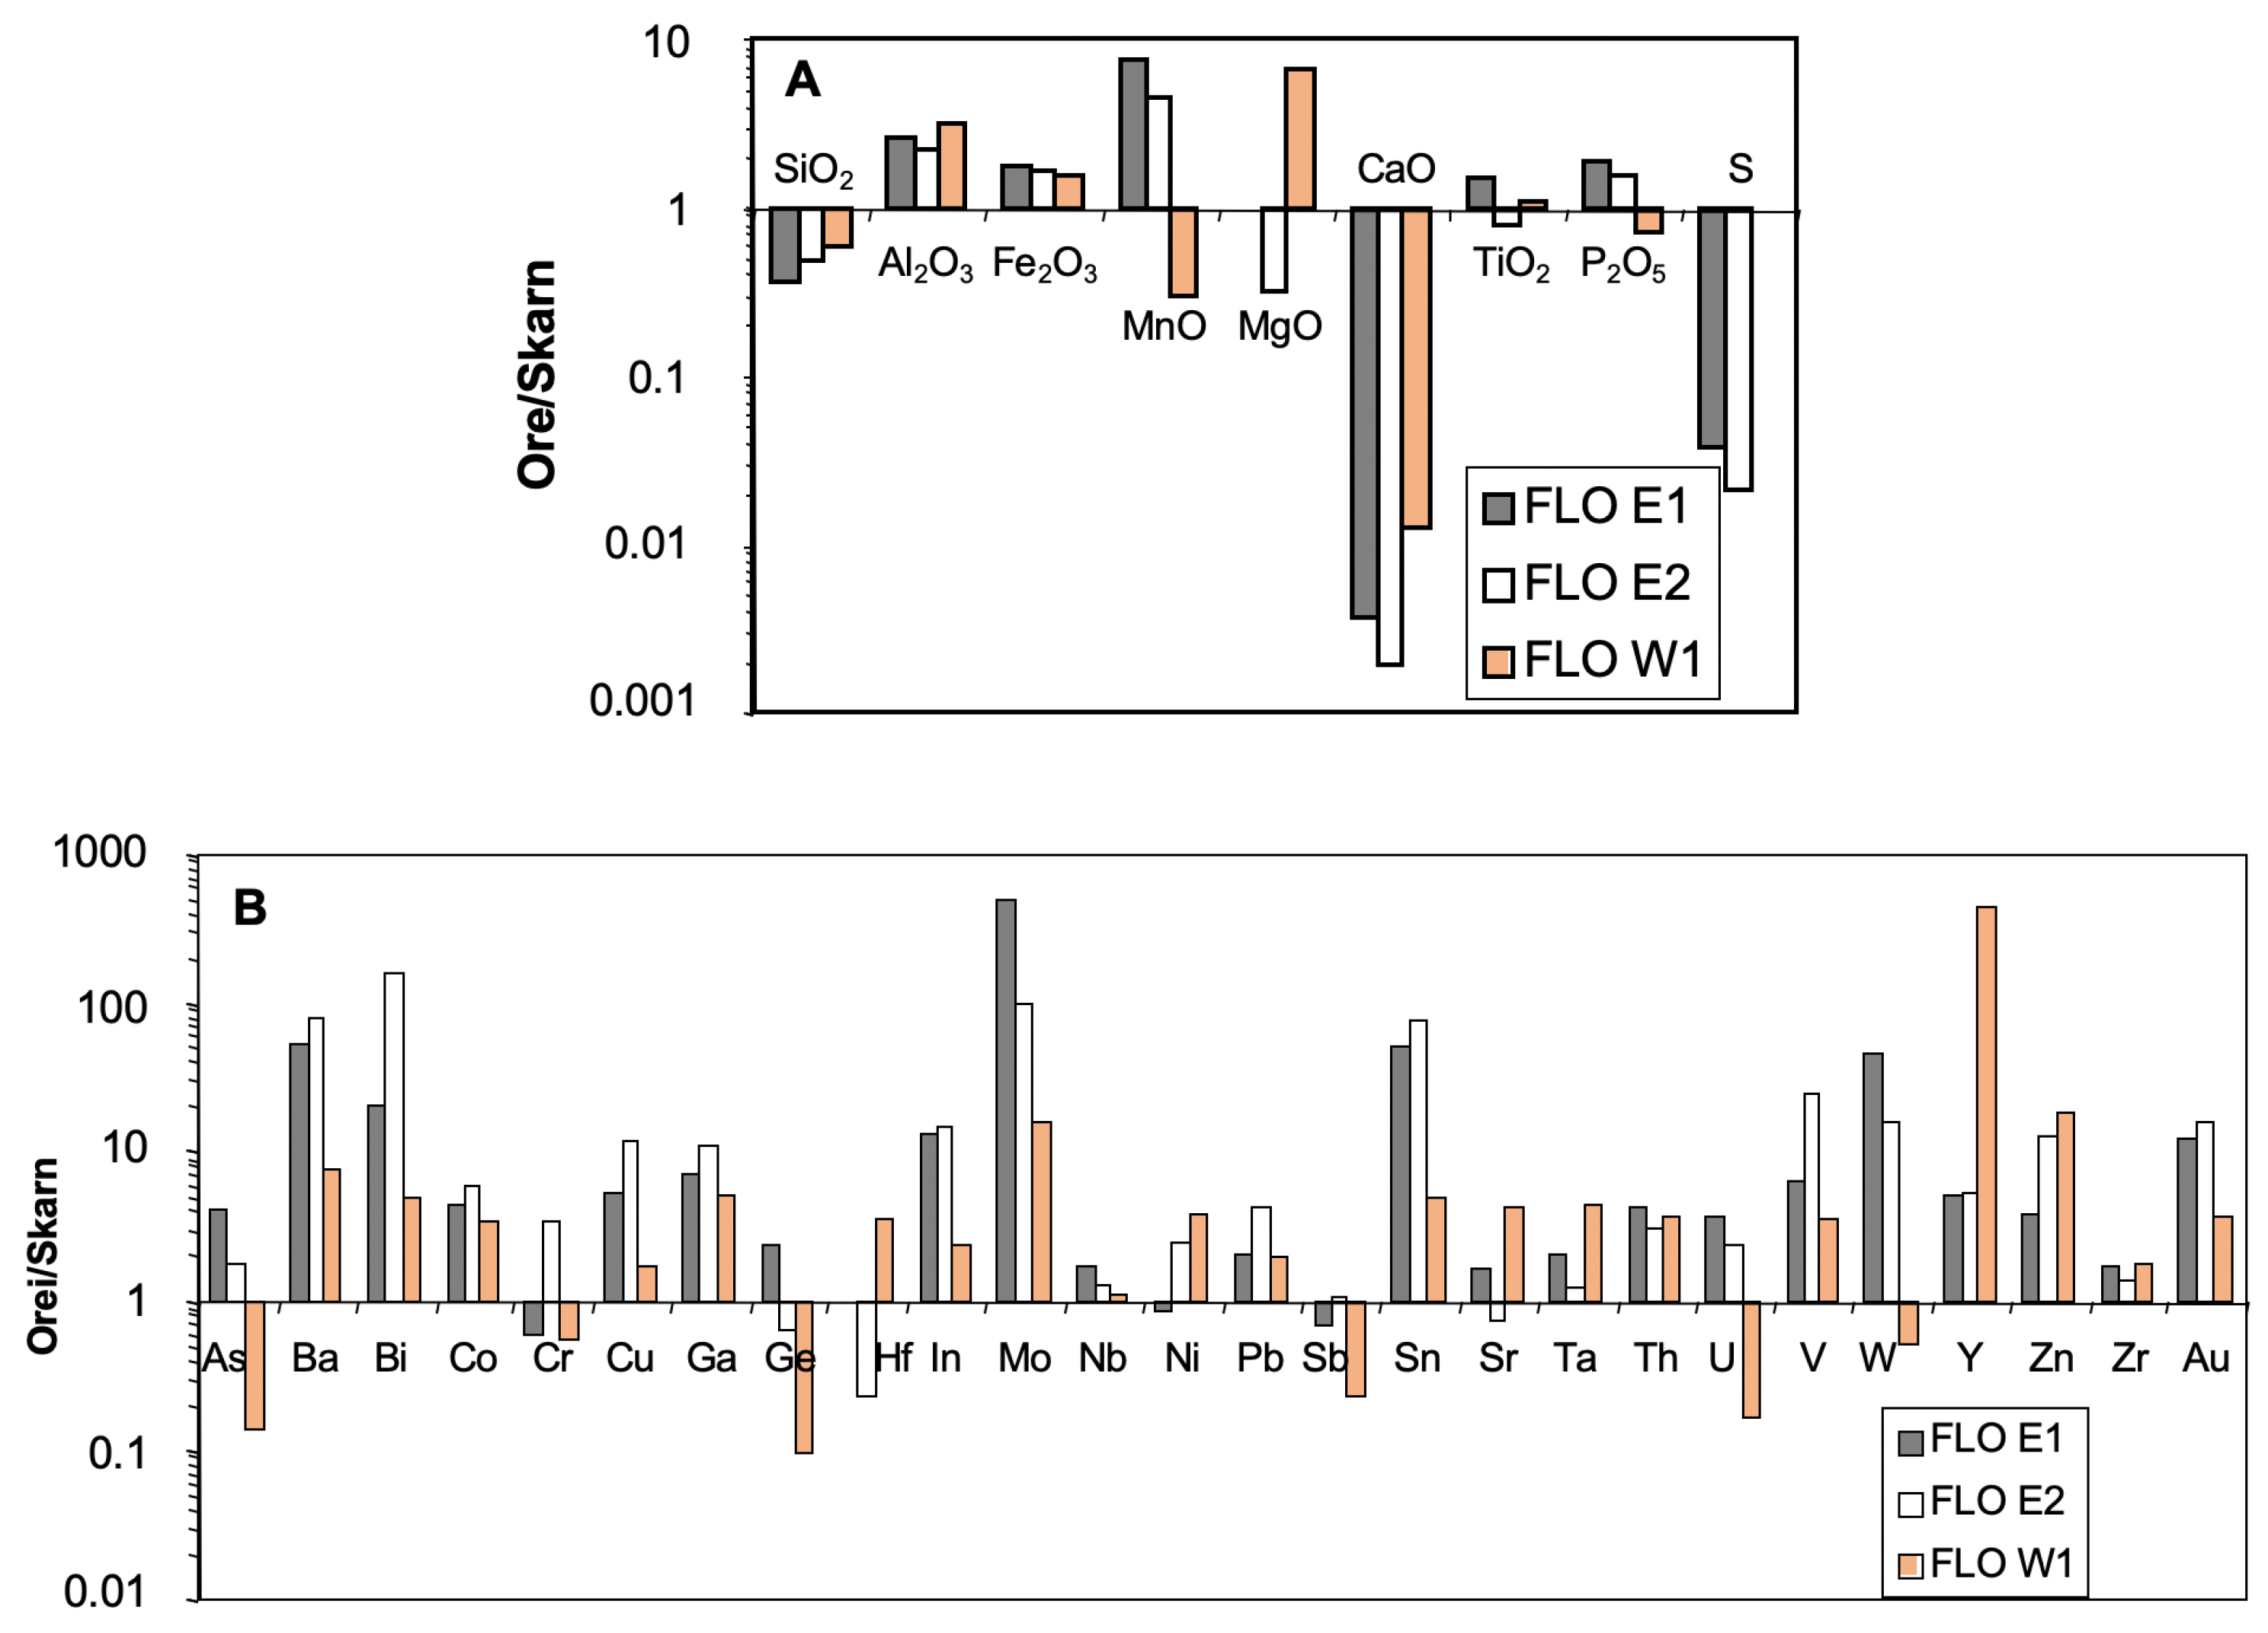
Skarn-normalised major element (A) and trace element (B) abundances in the ores (black ore (FLO E1), spicy bread ore (FLO E2), and clay-rich ore (FLO W1)).
Figure 13.
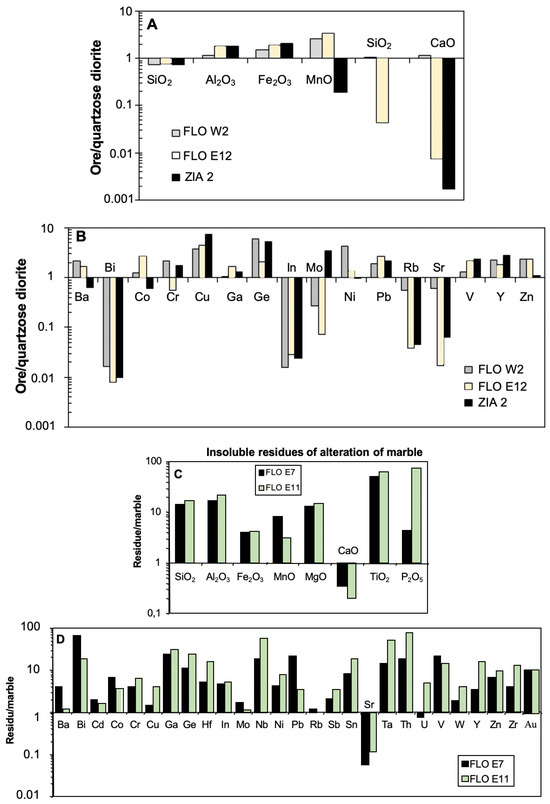
Quartz-diorite-normalised major elements (A) and trace elements (B) of green ore (FLO W2), breccias (purple breccia (ZIA2) and sediment breccia (FLO E12)). Marble-normalised major elements (C) and trace element (D) abundances in the insoluble residues of marbles (E7 and E11).
Figure 14.
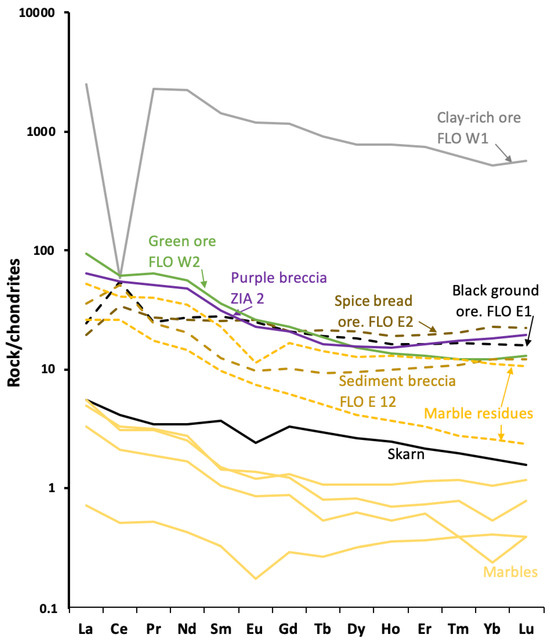
Chondrite-normalised REE patterns of the Ity ore samples (normalisation using values from [5]): skarn and their alteration products; alteration products of quartz diorite (breccias); marbles and their residues (in yellow).
4.4.1. Ore Facies Possibly Deriving from a Skarn
The “black earth”, “spice bread”, and clay-rich ores form a coherent group characterised by very low SiO2 (<20 wt%), very low Al2O3 (<4 wt%), and high Fe2O3 (>64 wt%), compositions consistent with derivation from the neighbouring magnetite-rich skarn. All three facies lack feldspars and K-phyllosilicates (K2O, Na2O, Rb below detection) and display systematic Au–Cu–Bi–Ge-Mo–W correlations (Figure 11A,C–F), indicating coupled remobilisation during weathering. Gold correlates with Cu, reflecting the presence of chalcopyrite in the primary ore (Figure 11C) and with Bi, which occurs as Bi-sulphides and Bi-tellurides in mineralised skarn (Figure 11D). This explains the robust Au-Cu–Bi association (Figure 11C,D,F). In addition, W correlates with Mo.
Black earth ore (FLO E1): This facies is the most Fe-rich (74 wt% Fe2O3) and strongly depleted in SiO2 (12 wt%) and CaO due to garnet–calcite dissolution. It shows marked enrichments in Cu (4093 ppm), W (1505 ppm), Mo (873 ppm), Ba (504 ppm), Ge (154 ppm), and minor As and Sn. Relative to skarn, it is enriched in Al2O3 (×2.6), Fe2O3 (×1.8), and several trace metals, with extreme enrichment factors for Mo (×512), Sn (×51), Ba (×54), and W (×46). These patterns reflect intense leaching of silicates/carbonates and cementation by Fe-rich weathering products.
Spice bread ore (FLO E2): Like the black earth ore, this ore is Fe-dominated (68.7 wt% Fe2O3) and depleted in SiO2 (16.5 wt%) and Al2O3 (2.6 wt%). It contains very high Cu (8996 ppm) and abundant W, Zn, V, Mo, Bi, Cr, Sn, and Ba (759 ppm). Immobile elements (Al2O3, Fe2O3) are enriched by a factor close to two, whereas CaO is fully leached. Trace-element enrichments relative to skarn are extreme, notably Bi (×158), Mo (×102), Ba (×81), Sn (×75), and V (×25), with depletions in Ge, Hf, and Si.
Clay-rich ore (FLO W1): it is characterised by high Fe2O3 (64.9 wt%) and contains SiO2 (19.8 wt%) and Al2O3 (3.7 wt%). It contains high Cu (1314 ppm), Zn (283 ppm), and moderate Ni and Mo. It is enriched in Al2O3 (×3.2), Fe2O3 (×1.5), and most trace elements (notably Mo ×16), but is depleted in SiO2, CaO, and several skarn-related elements (As, Ge, Sb, U, W) in comparison with the skarn.
Together, these three facies represent skarn-derived residues profoundly modified by weathering, combining carbonate and silicate dissolution, iron-oxide accumulation, and strong metal remobilisation, particularly for Cu, Mo, W, Sn, Bi, and Ba.
4.4.2. Ores Derived from Quartz Diorite: Synthesised Interpretation
Breccias interpreted as derived from the intrusive quartz diorite (sediment breccia FLO E12 and purple breccia ZIA 2) share a common geochemical fingerprint: high SiO2 (37–38 wt%), elevated Al2O3 (~31 wt%), and significant Fe2O3 (13–15 wt%), together with the highest Ti and Hf contents among all ore types (×2 relative to quartz diorite) (Figure 10 and Figure 13A). Their position on the A–B diagram (A ≈ 603–606) clearly separates them from other ore groups (Figure 10).
Sediment Breccia (FLO E12): Highly altered (LOI 14.2 wt%), the sediment breccia is characterised by high SiO2 and Al2O3 (30.9 wt%) and moderate Fe2O3 (13.2 wt%). Trace element concentrations are lower than in skarn-derived ores but moderately enriched relative to the quartz diorite. Enrichment factors range 1.5–5× for Ba, Co, Cu, Ge, V, Zn, and ~2× for Al2O3 and Fe2O3. Conversely, strong depletions affect Mo (−14×), Rb (−25×), In (−35×), Sr (−57×), Bi (−124×), and CaO (−131×), alongside a moderate SiO2 decrease (−1.4×) (Figure 13A,B).
Purple Breccia (ZIA 2): Geochemically similar to the sediment breccia—high SiO2, Al2O3, and Fe2O3—this facies shows higher Cu, W, V, Zr, and Zn, and contains substantial kaolinite (LOI 13.8 wt%). Compared to quartz diorite, it is enriched in Al2O3 (×1.8), Fe2O3 (×2.1), Pb, V, Y (×2), Mo (×3.4), Ge (×5), and Cu (×7) (Figure 13A,B). Strong depletions affect SiO2 (−1.3×), Sr (−15×), Rb (−22×), In (−40×), Bi (−102×), and CaO (−588×).
Green Ore (FLO W2): Although sharing some affinities with quartz-diorite-derived ores, the green ore displays a distinct composition dominated by high CaO (14.5 wt%) and MgO (5.7 wt%), lower SiO2, and intermediate Al2O3 (19–20 wt%). Its low A parameter (−131) closely matches quartz diorite signatures. Trace element concentrations are lower overall, but still show mild enrichments in Al2O3, Fe2O3, CaO, Ba, Co, Cr, Cu, Pb, Y (<×3), Zn (×3), Ni (×4), and Ge (×6) (Figure 13A,B). Significant depletions include SiO2 (−1.4×), Sr (−1.6×), Rb (−1.7×), Mo (−3.7×), Bi (−60×), and In (−64×). The strong CaO–MgO enrichment distinguishes this ore from all other facies and breccias.
4.4.3. Residues of Marble Dissolution
Two samples (FLO E7 and FLO E11) have been analysed, and their composition has been compared to the average composition of the four studied marbles (Table 2 and Table 3). They exhibit very high values of LOI (12–22 wt%) in relation to carbonate residues. The two samples (FLO E7 and FLO E11) are rich in silica (25 to 31 wt% SiO2), magnesium (22–25 wt% MgO), and calcium (11–19% wt% CaO), and contain minor amounts of iron (2.7–2.8 wt% Fe2O3). Metal concentrations are low, below 150 ppm for As and Pb, and slightly higher for Cu (140–400 ppm). Compared to the marbles, these residues show a loss of Ca and Sr, but a clear enrichment in almost the entire major and trace elements by a factor close to 10 (except for U and Rb) (Figure 13C,D).
4.4.4. Rare Earth
The different supergene and residual ore types at Ity display a wide range of REE and Y concentrations, but all share weakly fractionated REE patterns, with La[N]/Yb[N] ratios between ~0.8 and 9.6. Overall, REE and Y contents increase from marble residues and breccias toward clay-rich ores, reflecting progressive concentration during carbonate dissolution and lateritic weathering.
Residual “black earth” and “spice bread” ores show low ΣREE (65–77 ppm) and Y (≈21–23 ppm), but remain 4–13 times richer in REE than the parental skarn, with very weak fractionation (La[N]/Yb[N] ≈ 0.8–1.4).
The clay-rich ore represents the most enriched material, with exceptionally high ΣREE (2932 ppm) and Y (1880 ppm)—up to 300–650× other REE, and 437× Y relative to skarn. REE patterns remain weakly fractionated (La[N]/Yb[N] ≈ 4.5). The substantial Ce depletion could indicate that cerium was either leached or remained trapped as cerium oxides in the oxidised part of the profile.
Among the breccias, sediment breccia exhibits moderate ΣREE (63.7 ppm) and Y (18 ppm), with lower LREE but slightly higher HREE than quartz diorite, and weak fractionation (La[N]/Yb[N] ≈ 2.8). The purple breccia is slightly richer (ΣREE ≈ 98 ppm; Y ≈ 28 ppm) with La[N]/Yb[N] ≈ 3.3. The green ore shows intermediate REE contents (ΣREE ≈ 114 ppm), driven by elevated La–Ce–Pr–Nd, with a slightly more fractionated pattern (La[N]/Yb[N] ≈ 7.2).
Finally, marble residues contain ΣREE = 36–74 ppm and Y = 6–31 ppm—values markedly higher than those of the parental marbles (1–6 ppm ΣREE; 1–3 ppm Y), consistent with carbonate dissolution and residual concentration. Their REE patterns remain weakly fractionated (La[N]/Yb[N] ≈ 4.4–9.6).
5. Discussion
5.1. Overall Weathering Facies Distribution and Related Metal Mobility
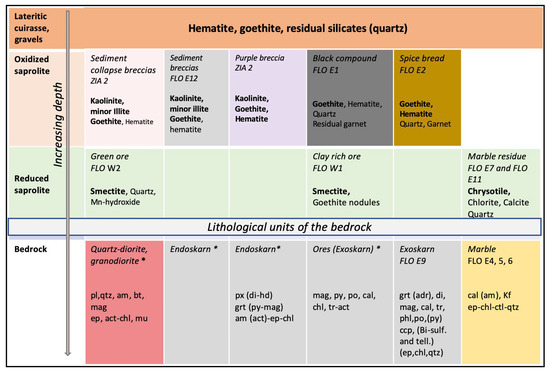
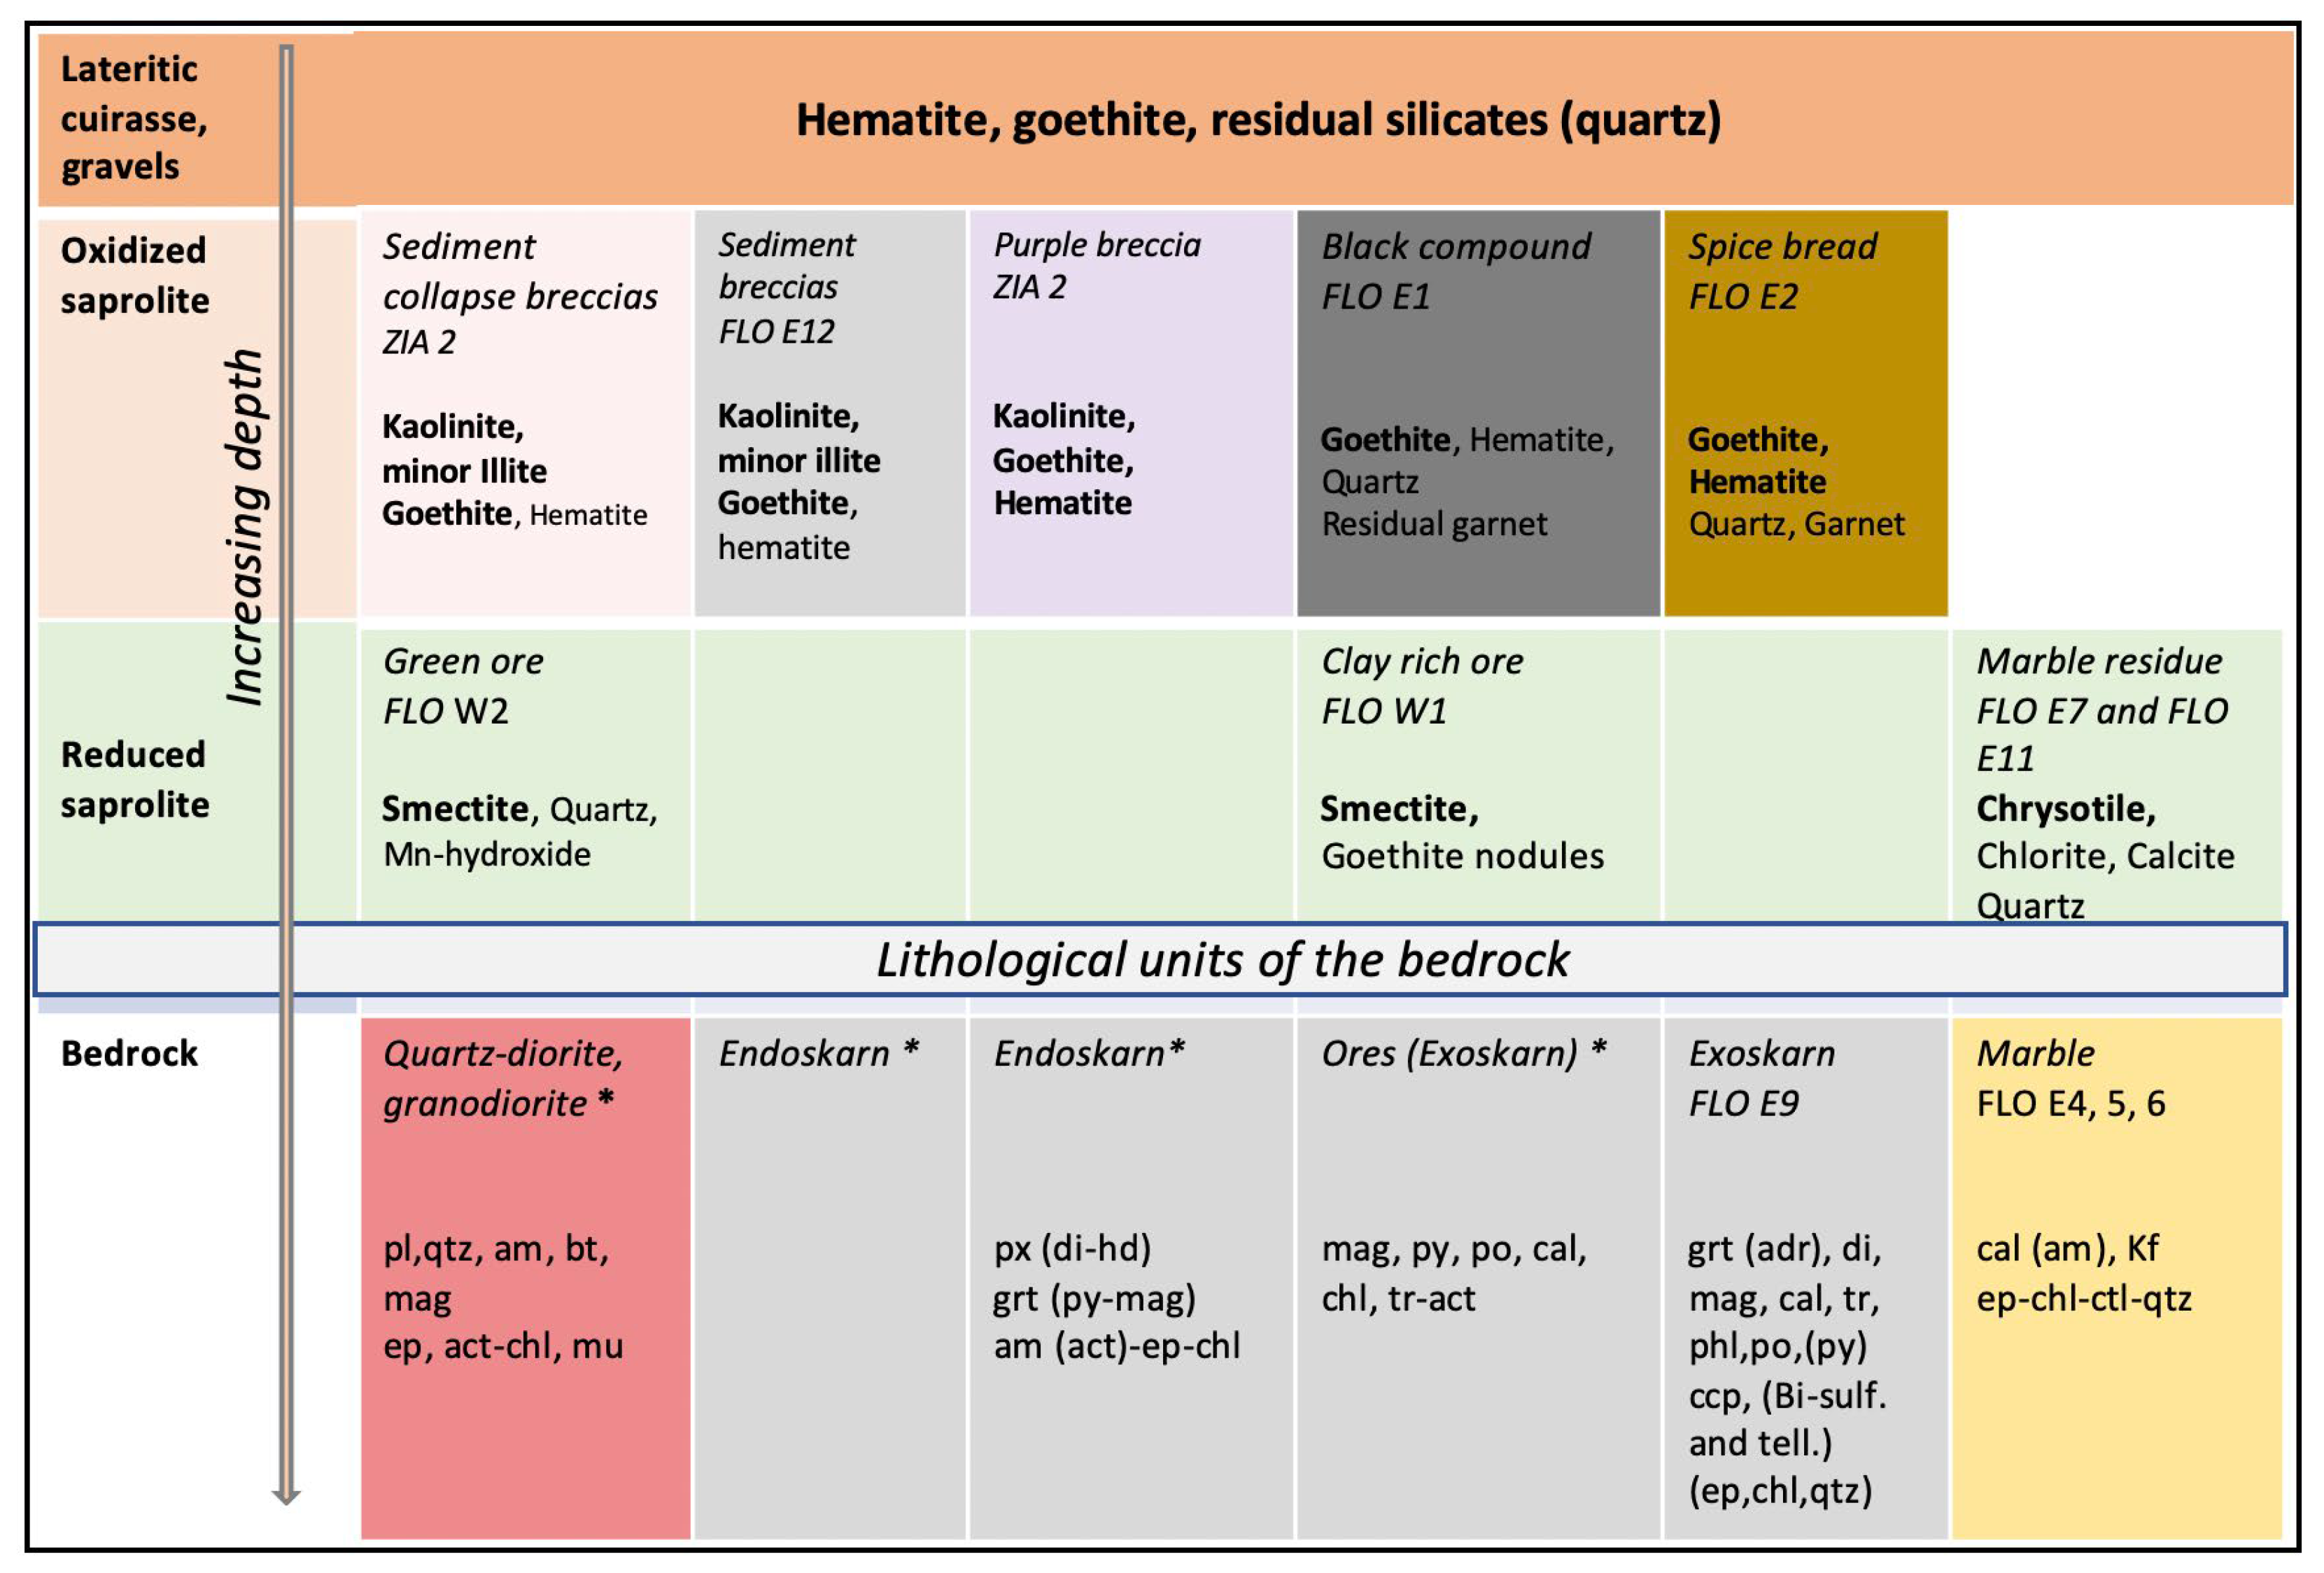
Figure 15 summarises the mineralogical distribution in the saprolite facies. Saprolite characteristics are primarily controlled by the nature of the protolith and by depth within the profile, particularly whether the material belongs to reduced saprolite or to more oxidised levels.
Figure 15.
Main mineralogical features of protoliths, saprolites in the reduced and oxidised part of the profile and overlaying red laterite in the Ity deposit weathering profile. Mineral abbreviations: pl: plagioclase; qtz: quartz; am: amphibole; bt: biotite; ep: epidote; mag: magnetite; tr: tremolite; act: actinote; chl: chlorite; mu: muscovite; px: pyroxene; di: diopside; hd-hedenbergite; grt: garnet; and: andradite; py: pyrite; po: pyrrhotite; ccp: chalcopyrite; phl: phlogopite; Bi-sulf and tell.: Bi sulfides and tellurides; Kf: K-feldspar. * samples described in [5].
At Ity, weathering was particularly intense in sulphide-bearing marbles and skarns, where sulphide oxidation generated acidic fluids that enhanced calcite dissolution. Carbonate dissolution was markedly more efficient than silicate weathering in surrounding lithologies (granodiorite, quartz diorite, and volcano-sedimentary formations). This preferential dissolution of karstic voids subsequently leads to the collapse, brecciation and accumulation of unconsolidated material (sands, gravels, clays).
5.2. Global Geochemical Balance of the Profile
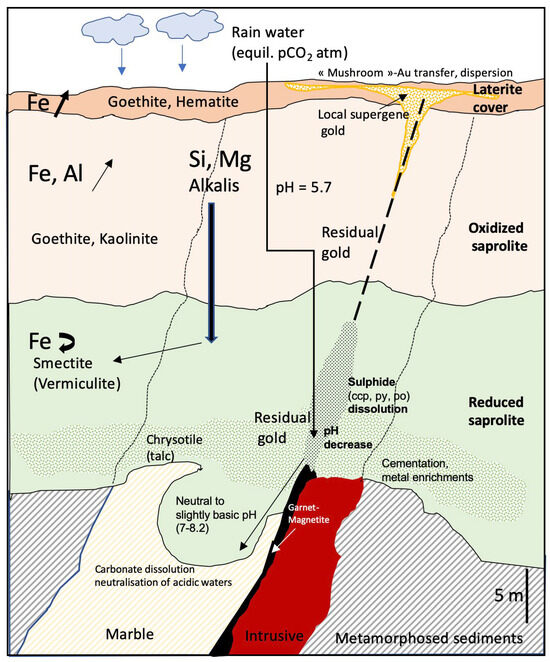
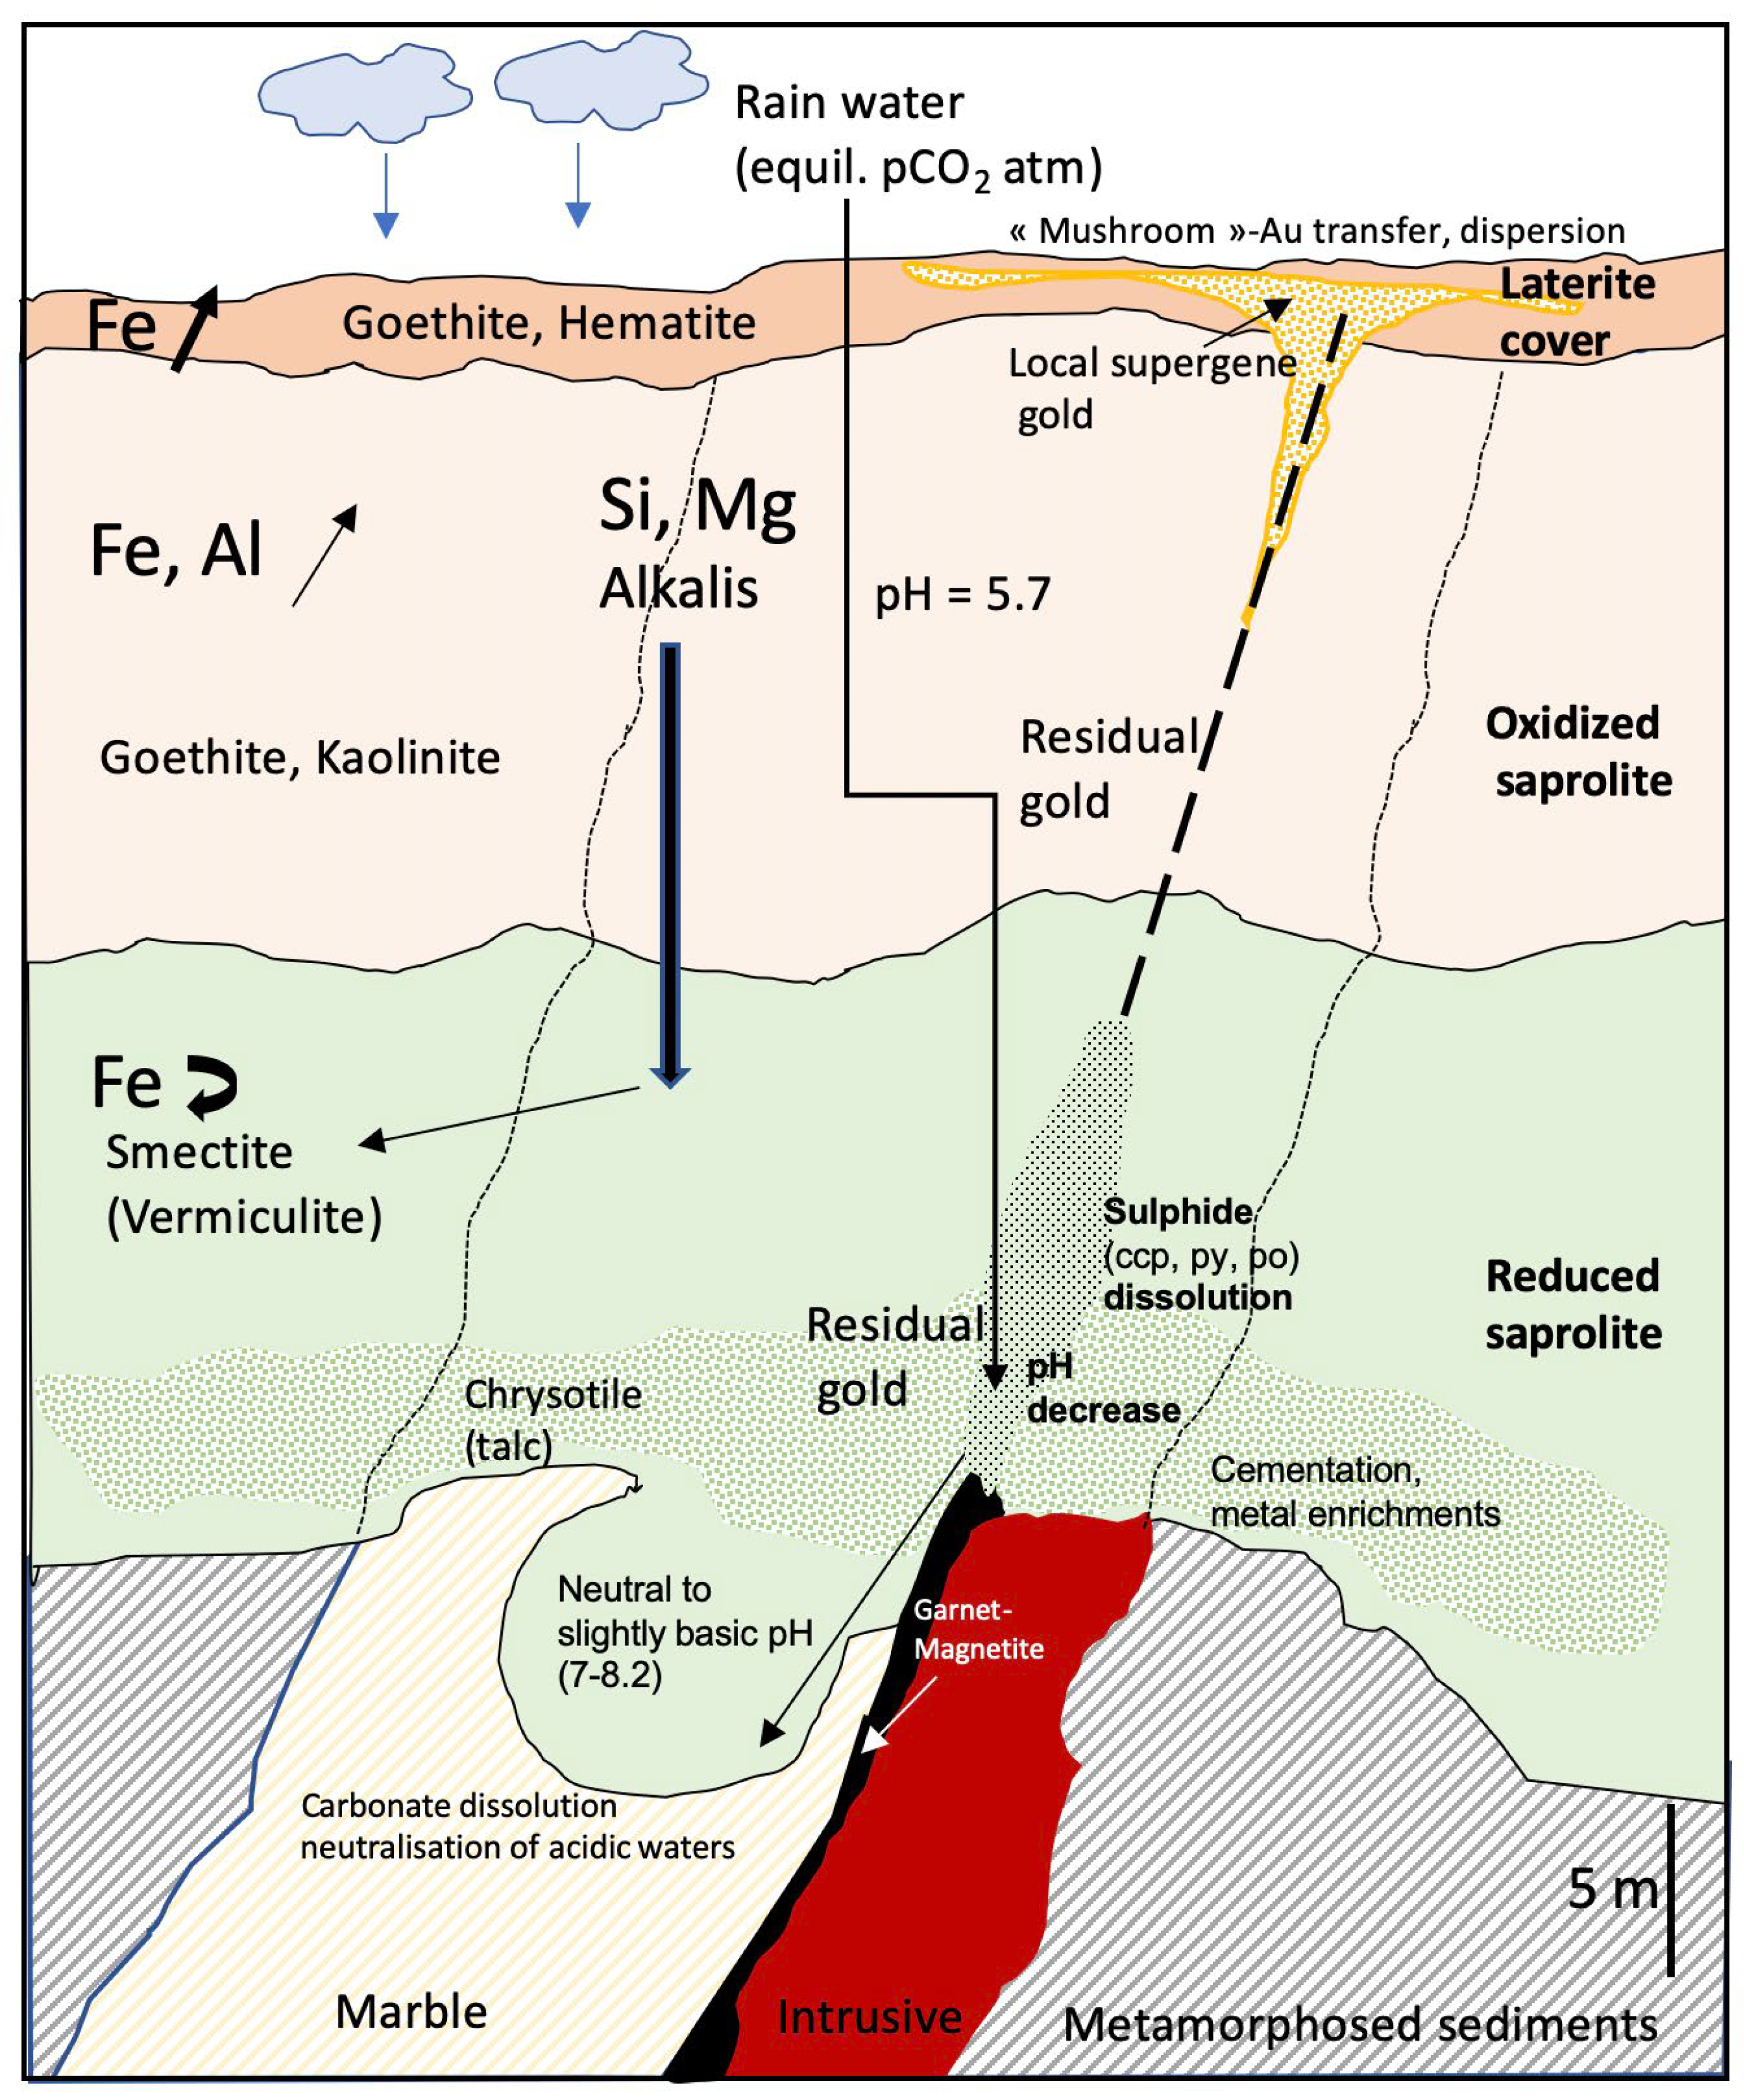
In tropical lateritic environments, weathering is dominated by the extensive leaching of silicates and carbonates, leading to strong mass loss and residual enrichment of poorly mobile elements ([15,37] and references herein). Silica, alkalis, and alkaline-earth elements are progressively removed, whereas Fe and Al are retained instable secondary phases such as goethite, hematite, and kaolinite. Mobile elements were in part integrated in the newly formed phyllosilicate below in the reduced saprolite. Figure 16 shows the main geochemical processes occurring along the weathering profile. The clay-rich ore is enriched in Al, Mg and Fe in agreement with the crystallisation of smectite within the reduced saprolite. Close to the skarn protore, Fe-oxides are abundant and partly inherited from the oxidation of magnetite. Weathering of magnetite–garnet skarns explains characteristic geochemical signature of the black ground ores.
Figure 16.
Schematic profile through the different horizons with indication of the main processes governing dissolution and reprecipitation in a deposit, such as at Flotouo (Ity deposit). ccp: chalcopyrite, py: pyrite, po: pyrrhotite. Inclined bold dashed line figures the prolongation of the skarn location along a major contact zone. The fine black dashed lines correspond to a possible location of previous lithological contacts within the saprolite. Vertical down arrows indicate main fluid and element transfers.
Enrichment factors for major oxides in the Flotouo samples are moderate (1.6 ± 0.1 for Fe2O3 and 2.5 ± 0.5 for Al2O3), consistent with residual concentration of immobile elements during tropical silicate dissolution.
Gold enrichment in laterites is classically attributed to residual concentration following sulphide oxidation, although limited short-range mobilisation may occur via chloride or thiosulfate complexes before Au is trapped by Fe-oxides or clays [38,39]. In West African Birimian deposits (e.g., Ashanti, Sadiola, Obuasi), such processes commonly generate economic gold concentrations in saprolite and laterite horizons.
Most other trace metals display enrichment factors ranging from 1.5 to 6, reflecting both uncertainty in skarn reference compositions and local redistribution or reprecipitation. Tungsten and molybdenum show a strong mutual correlation, consistent with their occurrence as scheelite and molybdenite in the primary ore. Their preserved correlation indicates limited mobility during oxidation and silicate dissolution. Similarly, Sn remained stable as cassiterite.
Unexpectedly, Cu, normally mobile under oxidising acidic conditions [40,41], is enriched by a factor of 5–10 at Ity. This behaviour indicates local retention or reprecipitation during supergene rather than efficient leaching. Copper mobility during weathering was controlled by secondary mineral assemblages, fluid chemistry, and physicochemical gradients within the profile. Tropical meteoric waters dominated the alteration system, making Cu behaviour strongly dependent on pH and dissolved concentrations. Oxidative dissolution of sulphides released Cu into percolating fluids, but dissolution of marble lenses buffered fluid pH to near-neutral or slightly alkaline values (pH > 7 up to 8.2) as represented in Figure 16. Such conditions favour Cu immobilisation through precipitation or adsorption onto secondary carbonates, silicates, or oxides, rather than long-range transport. Ge is correlated with Cu, suggesting that chalcopyrite was the main host for Ge. The correlation also indicates that Germanium behaves in the same way as Cu during skarn alteration.
Where drainage was limited and fluid residence times were long, elevated Cu concentrations combined with buffered pH may also have promoted Cu association with silica released during garnet dissolution. Although chrysocolla was not identified in the analysed samples, this mechanism provides a plausible explanation for Cu retention. The presence of malachite further indicates partial reprecipitation of Cu as carbonates. Overall, carbonate buffering, limited drainage, and the availability of secondary trapping phases constrained Cu dispersion within saprolitic and lateritic horizons.
In summary, coupled sulphide oxidation and carbonate dissolution enhanced porosity and permeability within the weathering profile, promoting metal redistribution through karstic voids, collapse breccias, and lateritic overprints. These processes account for systematic depletion in Ca, S, and Si, contrasted with pronounced residual to over-residual enrichment in Au and associated metals (Cu, Ge, Mo, Bi, Sn, and W). The resulting profiles record the combined effects of intense leaching, residual concentration, and local secondary reprecipitation during prolonged tropical weathering.
5.3. Age of Weathering Processes
No direct geochronological data are available to constrain the timing of supergene alteration at the Ity deposit. However, numerous geochronological studies conducted across the West African Craton provide a robust regional framework for tropical weathering and lateritisation, based mainly on 40Ar–39Ar dating of Mn oxides, K–Mn oxides, and newly formed oxyhydroxides [42,43,44,45,46,47,48].
These studies consistently identify several major periods favourable to intense chemical weathering. The first occurred during the Paleocene–Eocene (~59–45 Ma), under warm and humid climatic conditions, leading to widespread development of bauxites and cryptomelane-rich laterites and the formation of early lateritic paleo-land surfaces. Weathering was reactivated during the late Oligocene to early Miocene (~29–24 Ma), and again during the mid-Miocene (18–11 Ma), following intervening phases of mechanical denudation and sedimentary accumulation. Younger episodes at ~6–7 Ma and 3.4–2 Ma are associated with the development of duricrusts and ferruginous lateritic horizons.
Although these ages were obtained from sites located at some distance from Ity and in different geological contexts, they define a coherent regional chrono-climatic framework applicable to large parts of West Africa. At Ity, the geomorphological setting—located ~500 km north of the Atlantic coast, within the transition zone between northern plateaus and coastal lowlands—suggests that the lateritic surface cover corresponds to intermediate to high glacis, commonly attributed to post-Miocene weathering phases [42,45,47,48]. In contrast, the deep saprolite may represent an older weathering product, potentially inherited from Paleogene (Late Eocene–Oligocene) alteration phases.
For metals such as Au, Bi, and In, the precise timing of supergene redistribution remains difficult to constrain, as most available ages relate to Mn oxides or duricrust formation rather than to oxidation fronts affecting mineralised bodies. Nevertheless, the observed mineralogical and geochemical features at Ity are fully consistent with a multi-stage weathering history, involving deep saprolite development during Paleogene humid periods, followed by later modification and metal redistribution during Neogene lateritisation.
5.4. Geological Evolution of the Mineralisation
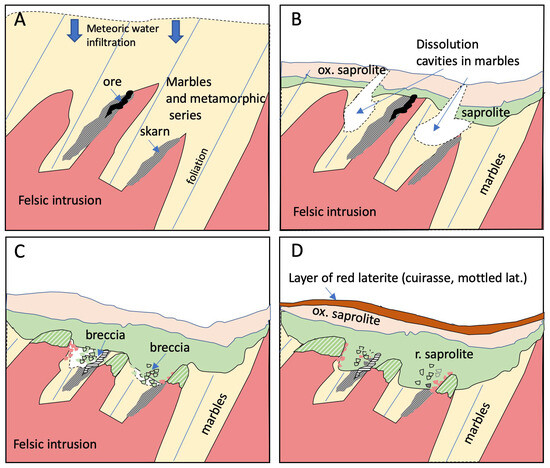
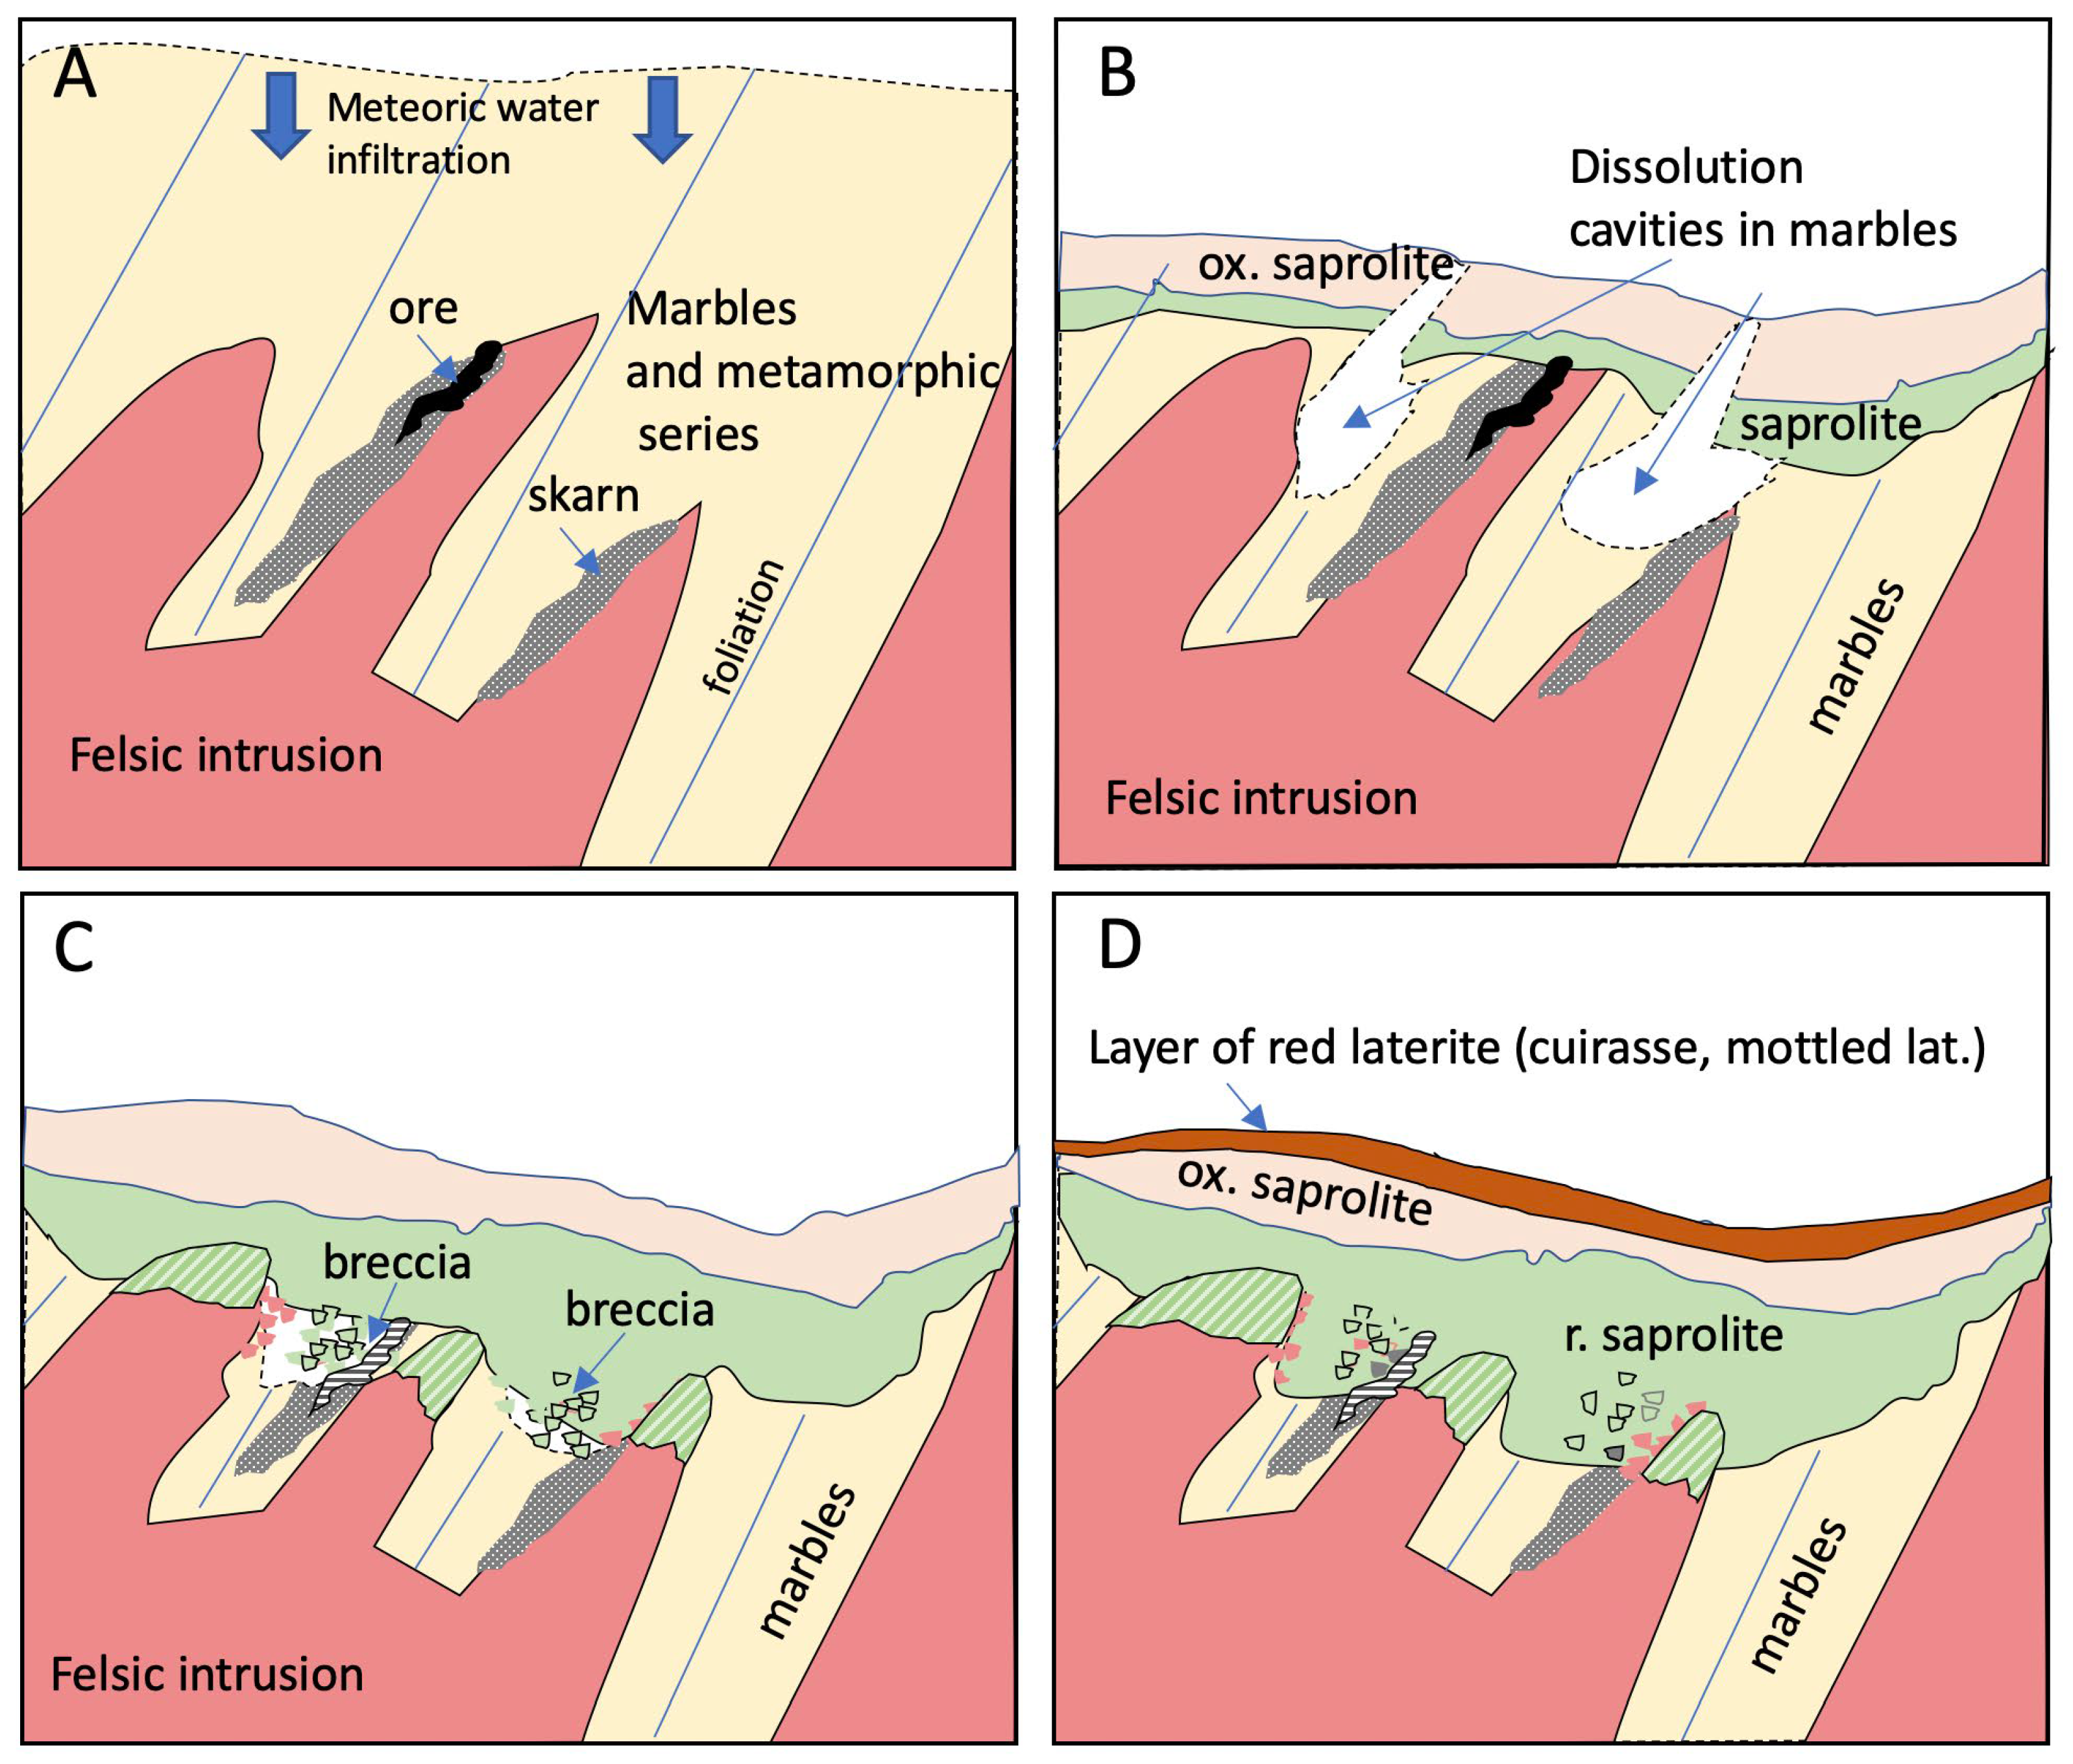
From the genetic point of view, the evolution of the ore process can be summarised as follows (Figure 17). The primary mineralisation is undoubtedly related to the retrograde alteration of Birimian skarn (with garnet, magnetite, sulphides), in contact with a quartz diorite mega-sill [1,3] in the presence of mesothermal fluids [5]. Later on, the primary mineralisation was modified by supergene alteration.
Figure 17.
Conceptual model of the evolution of the lateritic profile at Ity during Cenozoïc. (A) Bedrock issued from the Birimian cycle after exhumation and erosion affected by downward migration of the rain waters; the weathering starts; (B) dissolution cavities in marbles due to infiltration of slightly acidic waters equilibrated with atmospheric pCO2, and more acidic waters linked to the oxidation of sulphides. (C) brecciation resulting from the cavity collapse and gathering together clasts of felsic intrusion, skarns, and residues. (D) At the very end of Cenozoïc, middle glacis and associated red laterite horizon, containing both mottle material, pieces of cuirasse, and fine-grained iron oxides, cover the deposit. lat.: laterite; Ox. saprolite: oxidised saprolite.
Supergene alteration during post-Cretaceous tropical weathering and Cenozoïc profoundly modified the ore bodies. The dissolution of marbles led to karstification and collapse breccias, while the oxidation of sulphides produced acidic fluids that enhanced the leaching of carbonates and silicates. These processes created both porosity and permeability, which favoured redistribution of metals and residual enrichment. Mineralogical transformations testify to these conditions: kaolinite and goethite dominate in lateritic horizons, smectite typifies saprolitic zones, and chrysotile reflects marble alteration. Chemical patterns confirm this evolution.
During this episode, a deep saprolite horizon developed, characterised by a reduced green part, where smectites formed and are the predominant mineral phase. In the upper level of the saprolite, more oxidised, kaolinite and iron hydroxide (Al, Fe, Si) are the only stable phases. Kaolinite and iron hydroxide are typical phases of an oxidising environment where the rate of mass exportation after silicate dissolution is significant. The smectite horizon, in contrast, reflects a longer residence time for percolating water, allowing it to reach saturation with respect to more complex aluminosilicates. There was thus a strong contrast in redox and water residence time between the upper horizons and the lowest ones. From the point of view of clays, the results agree with those of [22]. The exception concerns the presence of vermiculite, as suggested by the IR spectra in [22]. Although expected in reduced saprolite, this mineral phase has not been identified in our samples by either SEM or XRD. Vermiculite results from the weathering of biotite and its hydrothermal alteration products (chlorite). Its abundance, therefore, depends on lithology, which can locally be rich in tri-octahedral phyllosilicates in the protoliths.
During the saprolite formation, gold behaves mostly as a residual phase, resisting the main processes governing primary silicate dissolution and the formation of smectite and kaolinite. A small part of the gold probably underwent mechanical effects, and in rare cases dissolution and recrystallisation. Lastly, late weathering episodes led to the development of a glacis, forming a surficial umbrella. The dispersion of gold within the most surficial part of the deposit, as proposed by [17] in their cross-section, indicates that only the five shallowest metres host a more extended surficial lens with Au contents reaching 10 to 20 ppm. This horizon corresponds to the red surficial grounds with ferruginous nodules, which may imply both mechanical transport and chemical redistribution. Such a process occurs later than saprolite development, as it is synchronous with one of the late episodes of glacis formation.
In addition, the other metals have been redistributed and sorbed onto fine-grained particles, including iron hydroxides. The enrichment of poorly mobile elements such as Al and Fe contrasts with the pronounced concentration of trace metals, including Cu, Bi, Mo, Sn, and W. Particularly notable are the anomalously high enrichments in Cu and In, metals usually leached during oxidative weathering but here retained or reprecipitated, likely due to local geochemical micro-environments. Conversely, the limited mobility of Bi, W, and Sn ensured that their residual concentrations remained alongside gold. These divergent behaviours explain the absence of systematic Au-Fe correlations, replaced by robust associations of Au with Cu, Bi, Mo, and W in altered ores. Detailed mineralogical and microanalytical studies, combining in situ techniques (e.g., LA-ICP-MS, TEM, synchrotron-based X-ray mapping), could help identify the mineral hosts of these elements and their speciation in the future.
6. Conclusions
This study presents the first integrated mineralogical and geochemical characterisation of the Flotouo weathering profile at the Ity gold deposit, highlighting the contrasted supergene evolution of skarn- and diorite-derived ores and the key mechanisms controlling metal redistribution during tropical weathering.
Primary skarn formation at quartz diorite contacts and subsequent mesothermal mineralisation established the initial Au and metal inventory. However, the present distribution of Au and associated elements largely reflects supergene processes. Cenozoïc tropical weathering profoundly modified the ores through coupled sulphide oxidation and carbonate dissolution. While sulphide oxidation generated acidic fluids that promoted metal release, dissolution of marble lenses efficiently buffered these fluids to near-neutral pH.
This pH buffering played a critical role in controlling metal mobility. Near-neutral conditions limited long-distance metal transport and favoured the local immobilisation and residual enrichment of several metals, particularly Cu, through adsorption onto Fe oxides and precipitation as secondary carbonates, silicates, or oxides. These reactions, combined with intense leaching of Ca, S, and Si, enhanced porosity and permeability, promoted fluid circulation through karstic voids and collapse breccias, and resulted in residual to over-residual enrichment of Au, Cu, Mo, Bi, Sn, and W.
Mineralogical zonation from kaolinite–goethite laterite to smectite-rich saprolite and chrysotile-bearing altered marbles records the progressive evolution of these weathering conditions. Supergene alteration thus generated a lateritic enrichment blanket extending beyond the hypogene ore zones, substantially upgrading the primary mineralisation.
The Ity deposit, therefore, provides a clear example of how tropical lateritisation, combined with carbonate-buffered pH conditions, can strongly modify metal mobility and enhance Birimian gold systems. These results emphasise the need to explicitly integrate supergene geochemical mechanisms into regional exploration models for West African gold deposits.
Author Contributions
Conceptualisation, Y.C. and M.-C.B.; methodology, Y.C. and M.-C.B.; validation, Y.C., M.-C.B. and M.C.; Y.C. investigation, Y.C. and M.-C.B.; resources, Y.C. and M.-C.B.; data curation, Y.C., M.-C.B. and M.C.; writing—original draft preparation, Y.C. and M.-C.B.; writing—review and editing, M.C.; project administration, Y.C.; funding acquisition, Y.C., M.-C.B. and M.C. All authors have read and agreed to the published version of the manuscript.
Funding
This study was financially supported by EGIDE (French cooperation agency), thanks to the Cultural Service from the French Embassy in Abidjan and MC Marchal from EGIDE (Nancy), for Prof. Y. Coulibaly’s stay in Nancy at UMR 7566 (G2R). CREGU has assumed responsibility for the analytical fees.
Data Availability Statement
Data are available on request to the authors.
Acknowledgments
The Authors express their sincere gratitude to Philippe Palanque and Pol Urien, Société des Mines d’Ity, for their assistance in accessing the Ity open pit during sampling and for their discussions about the Ity geology. R. Mathieu is acknowledged for his help in providing technical data and maps. R. Mosser-Ruck is thanked for her help during the XRD analysis. Three anonymous reviewers are thanked for their constructive remarks.
Conflicts of Interest
The authors declare that they have no conflicts of interest.
References
- Lajoinie, J.P.; Fonteilles, M. Un gîte de skarns latéritisés: Le gîte aurifère d’Ity (Côte d’Ivoire). Chron. Outre Mer. Rech. Min. 1968, 378, 143–153. [Google Scholar]
- Monthel, J.; Eulry, M.; Michel, J.C. Le gisement aurifère d’Ity, déjà une longue histoire! Géochronique 2002, 83, 27–28. [Google Scholar]
- Billa, M. Calage des minéralisations aurifères et guides de prospection pour de nouveaux objectifs sur les permis d’exploration Ity (Côte d’Ivoire). In Note BRGM-La Source; BRGM: Orléans, France, 1998; Volume 2717, 44p. [Google Scholar]
- Béziat, D.; Siebenaller, L.; Salvi, S.; Chevalier, P. A weathered skarn-type mineralisation in the Ivory Coast: The Ity gold deposit. Ore Geol. Rev. 2016, 78, 724–730. [Google Scholar] [CrossRef] [Scilit]
- Coulibaly, Y.; Cathelineau, M.L.; Boiron, M.-C. Multistage Fluid Evolution and P-T Path at Ity Gold Deposit and Dahapleu Prospect (Western Ivory Coast). Minerals 2025, 15, 918. [Google Scholar] [CrossRef] [Scilit]
- Yang, Y.; Liu, S.; Jin, Z. Laterization and its control to gold occurrence in Laowanchang gold deposit, Guizhou Province, Southwest of China. Geochem. Explor. 2009, 100, 67–74. [Google Scholar] [CrossRef] [Scilit]
- Mann, A.W. Mobility of gold and silver in lateritic weathering profiles: Some observations from Western Australia. Econ. Geol. 1984, 79, 38–47. [Google Scholar] [CrossRef] [Scilit]
- Davy, R.; El Anssary, M. Geochemical patterns in the laterite profile at the Boddington gold deposit, Western Australia. J. Geochem. Explor. 1986, 26, 119–144. [Google Scholar] [CrossRef] [Scilit]
- Costa, M.L. Gold distribution in lateritic profiles in South America, Africa and Australia: Application to geochemical exploration in tropical regions. J. Geochem. Explor. 1993, 37, 143–163. [Google Scholar] [CrossRef] [Scilit]
- Zang, W.S.; Fyfe, W.S. A three-stage genetic model for the Igarape Bahia lateritic gold deposit, Carajas, Brazil. Econ. Geol. 1993, 88, 1768–1779. [Google Scholar] [CrossRef] [Scilit]
- Freyssinet, P.; Lecomte, P.; Edimo, A. Dispersion of gold and base metals in the Mborguene lateritic profile, east Cameroon. J. Geochem. Explor. 1989, 32, 99–116. [Google Scholar] [CrossRef] [Scilit]
- Colin, F.; Vieillard, P. Behaviour of gold in the lateritic equatorial environment: Weathering and surface dispersion of residual gold particles, at Dondo Mobi, Gabon. Appl. Geochem. 1991, 6, 279–290. [Google Scholar] [CrossRef] [Scilit]
- Rao, W.; Gao, Z.; Yang, Z.; Luo, T. Geology and geochemistry of the Shangmanggang red clay-type gold deposit in West Yunnan. J. Geochem. Explor. 2004, 84, 105–125. [Google Scholar] [CrossRef] [Scilit]
- Freyssinet, P. Gold mass balance in lateritic profiles from savanna and rain forest zones. Catena 1994, 21, 159–172. [Google Scholar] [CrossRef] [Scilit]
- Combes, V.; Teitler, Y.; Eglinger, A.; Andre-Mayer, A.-S.; Heuret, A.; Pochon, A.; Cathelineau, M.; Gibert, P. Diversity of supergene gold expressions and implications for gold targeting in an equatorial regolith (AMG’s Couriège exploration prospect, French Guiana). Geol. Soc. Lond. Spec. Publ. 2022, 516, 353–381. [Google Scholar] [CrossRef] [Scilit]
- Iglesias-Martínez, M.; Salama, W.; Anand, R.R.; Butt, C.R.M.; Espí, J.A. Exploration and mining of lateritic gold deposits (Part I): Ore formation, characterisation, and sampling of ferruginous gravel and duricrust. Ore Geol. Rev. 2024, 170, 106146. [Google Scholar] [CrossRef] [Scilit]
- Granier, C.; Lajoinie, J.-P.; Vitali, C. Géochimie de l’or et du cuivre dans les formations latéritiques argileuses du Mont Flotouo (Ity, Côte d’Ivoire). Bull. Soc. Franç. Minér. Crist. 1963, 86-3, 253–258. [Google Scholar] [CrossRef] [Scilit]
- Camus, Y.; Rousseau, G.; Gagnon, G.; Duplessis, C. Technical Preliminary Feasibility Study & Certification of Reserves of the Ity Mine—Ivory Coast. Int. Report; La Mancha Resources Inc.: Montreal, QC, Canada, 2008; 103p. [Google Scholar]
- Naho, J. Cycle Supergène de L’or en Milieu Ferralitique. Exemple du Gisement D’or D’Ity en Côte D’Ivoire. Ph.D. Thesis, Institute National Polytechnique de Lorraine (INPL), Nancy, France, 1988; 32p. [Google Scholar]
- Body, K.J.; Mudau, M.; Cunningham, G.I.; Bosc, R.; Perez, P.; Baker, J.; Gauthier, D.; Larochelle, P.; Sangam, H.P. Technical Report for the Ity Gold Mine, Côte D’Ivoire; Coffey Mining South Africa, for Endeavour Mining: Gauteng, South Africa, 2015; 256p, Available online: https://s21.q4cdn.com/954147562/files/doc_downloads/technical_report/Ian-Hamilton-technical-report-ity.pdf (accessed on 1 September 2025).
- Endeavour Mining Corporation Technical Report on the Ity Mine, Republic of Côte D’Ivoire. 2019. 372p. Available online: https://s21.q4cdn.com/954147562/files/doc_downloads/technical_report/2020/06/200615_Ity-Amended-Restated-Technical-Report.pdf (accessed on 1 September 2025).
- Mathian, M.; Hebert, B.; Baron, F.; Petit, S.; Lescuyer, J.-L.; Furic, R.; Beaufort, D. Identifying the phyllosilicate minerals of hypogene ore deposits in lateritic saprolites using the near-IR spectroscopy second derivative methodology. J. Geochem. Explor. 2018, 186, 298–314. [Google Scholar] [CrossRef] [Scilit]
- Feybesse, J.L.; Milési, J.P.; Verhaeghe, P.; Johan, V. Le domaine de Toulépleu-Ity (Côte d’Ivoire): Une unité birimienne charriée sur les gneiss archéens du domaine de Kénéma-Man lors des premiers stades de l’orogène éburnéen. C. R. Acad. Sci. Paris 1990, 310, 285–291. [Google Scholar]
- Abouchami, W.; Boher, M.; Michard, A.; Albarède, F. A major 2.1 Ga event of mafic magmatism in West Africa: An early stage of crustal accretion. J. Geophys. Res. 1990, 95, 17605–17629. [Google Scholar] [CrossRef] [Scilit]
- Boher, M.; Abouchami, W.; Michard, A.; Albarède, F.; Arndt, N.T. Crustal growth in West Africa at 2.1 Ga. J. Geoph. Res. 1992, 97, 345–369. [Google Scholar] [CrossRef] [Scilit]
- Taylor, P.N.; Moorbath, S.; Leube, A.; Hirdes, W. Early Proterozoic crustal evolution in the Birimian of Ghana: Constraints from geochronology and isotope geochemistry. Precambrian Res. 1992, 56, 97–111. [Google Scholar] [CrossRef] [Scilit]
- Hirdes, W.; Davis, D.W.; Eisenlohr, B.N. Reassessment of Proterozoic granitoid ages in Ghana based on U/Pb zircon and monazite dating. Precambrian Res. 1992, 56, 89–96. [Google Scholar] [CrossRef] [Scilit]
- Kouamélan, A.N. Geochronologie et Geochimie des Formations Archeennes et Proterozoïques de la Dorsale de Man en Côte D’ivoire. Ph.D. Thesis, University of Rennes, Rennes, France, 1996; 289p. [Google Scholar]
- Ouattara, Z.; Gouédji, G.F.E.; Ouattara, G.; Kanga, K.O.; Boffoué, O.M.; Coulibaly, Y. Petro-structural Evaluation of the Toulépleu-Guéya Section on the Toulépleu-Ity Gold District, West Côte d’Ivoire. J. Geosci. Geomat. 2022, 10, 153–161. [Google Scholar] [CrossRef] [Scilit]
- Verhaeghe, P.; Nguyen, V.H.; Ayme, Y.; Madelaine, B.; Ollando, V. Mission EM Côte d’Ivoire 1982. In Contrôle d’anomalies et d’indices aurifères. Phase II; Rap. BRGM, Fr., 82 RDM 052 AF; BRGM: Orléans, France, 1982. [Google Scholar]
- Milési, J.-P.; Feybesse, J.-L. Le Gisement D’lty (Côte-d’lvoire): Calage Lithologique et Structural. In Note BRGM DMM/DEX/UR/93/029; BRGM: Orléans, France, 1993; 10p. [Google Scholar]
- Milési, J.P.; Feybesse, J.L.; Ledru, P.; Domanget, A.; Ouédraogo, M.F.; Marcoux, E.; Prost, A.E.; Vinchon, C.; Sylvain, J.P.; Johan, V.; et al. Les minéralisations aurifères de l’Afrique de l’Ouest. Leurs relations avec l’évolution lithostructurale au protérozoïque inférieur. Chron. Rech. Min. 1989, 497, 3–98. [Google Scholar]
- Mathieu, R. Etude Pétrographique, Métallographique et Lithogéochimique 9304; Rapport COGEMA–BUM-DEX-GT-9304; SMI: Ity-Mont Flotouo, Côte d’Ivoire, 2005; 84p. [Google Scholar]
- Bouchet, A.; Meunier, A.; Sardini, P. Minéraux argileux: Structure cristalline, identification par diffraction de rayons X. In Bullétin Centre Recherches Elf Exploration Production Mémoire; Editions Technip: Paris, France, 2000; 136p. [Google Scholar]
- Evensen, N.M.; Hamilton, P.J.; O’nions, R.K. Rare earth abundances in chondritic meteorites. Geochim. Cosmochim. Acta 1978, 42, 1199–1212. [Google Scholar] [CrossRef] [Scilit]
- Debon, F.; Le Fort, P. A chemical-mineralogical classification of common plutonic rocks and associations. Trans. R. Soc. Edimburgh. Earth Sci. 1983, 73, 135–149. [Google Scholar] [CrossRef] [Scilit]
- Anand, R.R.; Butt, C.R.M.; Salama, W.S.; Porto, C.G. Supergene gold deposits in intensely weathered regolith. In Geology, Geochemistry and Formation of Supergene Mineral Deposits in Deeply Weathered Terrain, Springer, Mineral Resource Reviews; Bowell, R.J., Butt, C.R.M., Eds.; Springer: Berlin/Heidelberg, Germany, 2025; Chapter 5; pp. 147–178. [Google Scholar] [CrossRef] [Scilit]
- Bowell, R.J. Supergene gold mineralogy at Ashanti, Ghana: Implications for the supergene behaviour of gold. Min. Mag. 1992, 56, 545–560. [Google Scholar] [CrossRef] [Scilit]
- Anand, R.R.; Butt, C.R.M. A guide for mineral exploration through the regolith in the Yilgarn Craton, Western Australia. Aust. J. Earth Sci. 2010, 57, 1015–1114. [Google Scholar] [CrossRef] [Scilit]
- Golightly, J.P. Progress in Understanding the Evolution of Nickel Laterites. In The Challenge of Finding New Mineral Resources, Global Metallogeny, Innovative Exploration, and New Discoveries; Society of Economic Geologists: Littleton, CO, USA, 2010; Volume 15, pp. 1–26. [Google Scholar]
- Hou, H.; Takamatsu, T.; Koshikawa, M.K.; Hosomi, M. Migration of silver, indium, tin, antimony, and bismuth and variations in their chemical fractions on addition to uncontaminated soils. Soil Sci. 2005, 170, 624–639. [Google Scholar] [CrossRef] [Scilit]
- Vasconcelos, P.M.; Brimhall, G.H.; Becker, T.A.; R Enne, P.R. 40Ar/39Ar analysis of supergene jarosite and alunite: Implications to the paleoweathering history of the western USA and West Africa. Geochim. Cosmochim. Acta 1994, 58, 401–420. [Google Scholar] [CrossRef] [Scilit]
- Colin, F.; Beauvais, A.; Ruffet, G.; Hénocque, O. First 40Ar/39Ar geochronology of lateritic manganiferous pisolites: Implications for the Palaeogene history of a West African landscape. Earth Planet. Sci. Lett. 2005, 238, 172–188. [Google Scholar] [CrossRef] [Scilit]
- Chardon, D.; Chevillotte, V.; Beauvais, A.; Grandin, G.; Boulangé, B. Planation, bauxites and epeirogeny: One or two paleosurfaces on the West African margin? Geomorphology 2006, 82, 273–282. [Google Scholar] [CrossRef] [Scilit]
- Beauvais, A.; Ruffet, G.; Henocque, O.; Colin, F. Chemical and physical erosion rhythms of the West African Cenozoïc morphogenesis: The 39Ar–40Ar dating of supergene K-Mn oxides. J. Geophys. Res. 2008, 113, F04007. [Google Scholar] [CrossRef] [Scilit]
- Beauvais, A.; Chardon, D. Modes, tempo and spatial variability of Cenozoïc cratonic denudation: The West African example. Geochem. Geophys. Geosyst. 2013, 14, 1590–1608. [Google Scholar] [CrossRef] [Scilit]
- Grimaud, J.L.; Rouby, D.; Chardon, D.; Beauvais, A. Cenozoïc sediment budget of West Africa and the Niger delta. Basin Res. 2018, 30, 169–186. [Google Scholar] [CrossRef] [Scilit]
- Grimaud, J.L.; Chardon, D.; Metelka, V.; Beauvais, A.; Bamba, O. Neogene cratonic erosion fluxes and landform evolution processes from regional regolith mapping (Burkina Faso, West Africa). Geomorphology 2015, 241, 315–330. [Google Scholar] [CrossRef] [Scilit]

Disclaimer/Publisher’s Note: The statements, opinions and data contained in all publications are solely those of the individual author(s) and contributor(s) and not of MDPI and/or the editor(s). MDPI and/or the editor(s) disclaim responsibility for any injury to people or property resulting from any ideas, methods, instructions or products referred to in the content. |
© 2026 by the authors. Licensee MDPI, Basel, Switzerland. This article is an open access article distributed under the terms and conditions of the Creative Commons Attribution (CC BY) license.