


Abstract
Efficient thickening of unclassified tailings slurry (UTS) is critical for enhancing mine backfill efficiency and reducing operational costs. Ultrasonic technology has emerged as a promising approach to facilitating the solid–liquid separation process in such slurries. In this study, systematic experiments were conducted using a 20 kHz ultrasonic concentrator. The effects of ultrasonic treatment timing (applied at 0, 5, 10, 15, 20, 25, 30, and 35 min during free settling) and power (50 to 400 W in eight levels) were investigated by monitoring the solid–liquid interface settling velocity and underflow concentration. The key findings are as follows: Ultrasonic application at the 5 min mark yielded the optimal thickening performance, increasing the final mass concentration by 1.3% compared to free settling alone. The average settling velocity generally increased with ultrasonic power (with the exception of 50 W), and the final underflow concentration exhibited a steady rise. Notably, the 400 W treatment induced a significant settlement acceleration, attributed to the formation of drainage channels. Mechanistic analysis revealed that these drainage channels undergo a dynamic process of formation, expansion, contraction, and closure, driven by ultrasonically induced directional water migration, particle compaction, and energy boundary effects. This research not only enriches the theoretical framework of ultrasonic-assisted thickening but also provides practical insights for optimizing mine backfill operations.
1. Introduction
With the continuous growth of global demand for mineral resources, the mining industry is facing increasingly severe challenges in resource utilization efficiency and environmental protection. Backfill mining, as an environmentally friendly and safe mining method, has been widely promoted and applied in metal mines and non-metal mines worldwide [1,2,3,4]. This technique involves filling the underground voids created by ore extraction with suitable materials such as tailings, waste rock, or cemented paste. By providing structural support to the surrounding rock mass, it helps maintain ground stability and mitigates the risk of surface subsidence. This method not only realizes the efficient recycling of tailings—reducing the environmental pressure caused by tailings storage—but also effectively controls surface subsidence, ensuring the safety of mining operations and the surrounding ecological environments [5,6,7]. In the backfill process, the thickening and settlement of unclassified tailings slurry (UTS) in the silo is a key link that directly affects the continuity and efficiency of backfill operations [8,9]. Key indicators of tailings slurry, such as settlement velocity and underflow concentration, determine the stability of the filling system and the quality of filling bodies [10]. Therefore, improving the settlement and thickening performance of tailings in the silo is of great significance for ensuring the continuous operation of mine backfilling, optimizing the filling process, and reducing engineering costs [11].
In recent years, researchers at home and abroad have conducted extensive studies on the influencing factors of the settlement and thickening performance of filling slurry, aiming to find effective ways to regulate its settlement efficiency [12]. Wen et al. [13] addressed low underflow concentration (UC) and slow settling velocity (SV) in fine unclassified tailings in Angang Mine, optimizing parameters like tailings slurry concentration via Response Surface Methodology–Box–Behnken Design (RSM-BBD); optimal conditions yielded UC 69.55% and SV 10.39 m/h, meeting requirements. Yin et al. [14] studied the static/dynamic flocculation settlement of fine tailings slurry and flocculant’s effect on thickening settlement via lab tests, finding anionic flocculant optimal, a dynamic settlement enhancing underflow concentration, and higher flocculant dosage reducing compressive strength. Wang et al. [15] studied the effect of temperature on the settlement velocity (SV) of mine tailings during flocculation settlement (FS) and found that SV showed an “N”-shaped curve at 5–40 °C, with mechanisms related to electric double-layer repulsion, etc., benefiting tailings dewatering and filling cost reduction. Common methods include adjusting tailings properties (e.g., mass concentration and cement–sand ratio), adding chemical additives (e.g., flocculants), and optimizing environmental conditions (e.g., temperature and pH value). However, these methods often suffer from limitations such as high cost, complex operation, or limited applicability, highlighting the need for more efficient and flexible technical approaches.
Ultrasonic technology, as a green and efficient physical regulation method, has been widely used to improve solid–liquid separation and thickening settlement efficiency in various fields due to its unique cavitation effect, acoustic streaming effect, and vibration effect [16]. Vikulina and Vikulin [17] studied ultrasound’s effect on suspended solid sedimentation in water (treating clay-containing water before coagulant addition), finding that longer ultrasound treatment enhanced sedimentation efficiency and reduced coagulant dosage. Peng and Zhao [18] established a multiphysics coupling model via COMSOL 6.0 to study ultrasonic-assisted tailing slurry sedimentation, finding that optimal ultrasound frequency enhances particle stress for better settling, and staggered transducers improve sound pressure distribution density to boost settling effect, clarifying parameter-efficiency correlations. Zhu et al. [10] studied ultrasound’s effects on unclassified tailings (UTs) flocculation–sedimentation and thickening via the response surface method (RSM) and E-SEM, finding that ultrasound significantly improved final underflow concentration (FUC) to 71.75% (4.31% higher) under optimal parameters. However, research on applying ultrasonic technology to improve the settlement and concentration of mine filling slurry is still in the preliminary stage, and the influence mechanisms of key parameters, such as ultrasonic application timing and power, on the settlement thickening of UTS remain unclear. Given its advantages of low energy consumption, no pollution, and flexible operation, ultrasonic technology has broad application prospects in optimizing the settlement thickening process of filling slurry.
Accordingly, this study focuses on regulating the settlement and thickening of UTS via a 20 kHz ultrasonic concentrator (Baoding Ikeda Trading Co., Ltd., Baoding, China). Systematic experiments were conducted with ultrasonic application at eight timing points (0–35 min) and eight power levels (50–400 W), monitoring solid–liquid interface settlement velocity and underflow concentration to clarify their influence laws, and elucidating the drainage fault formation mechanism to provide theoretical and technical support for ultrasonic application in mine backfilling.
2. Materials and Methods
2.1. Materials
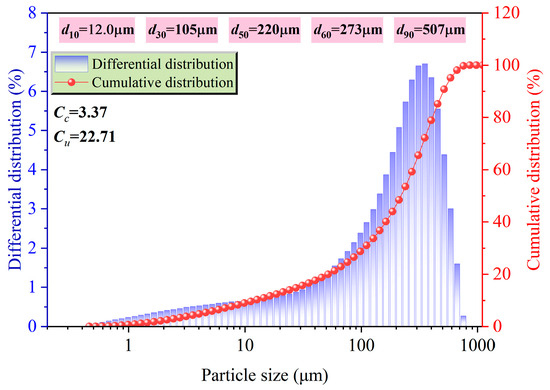
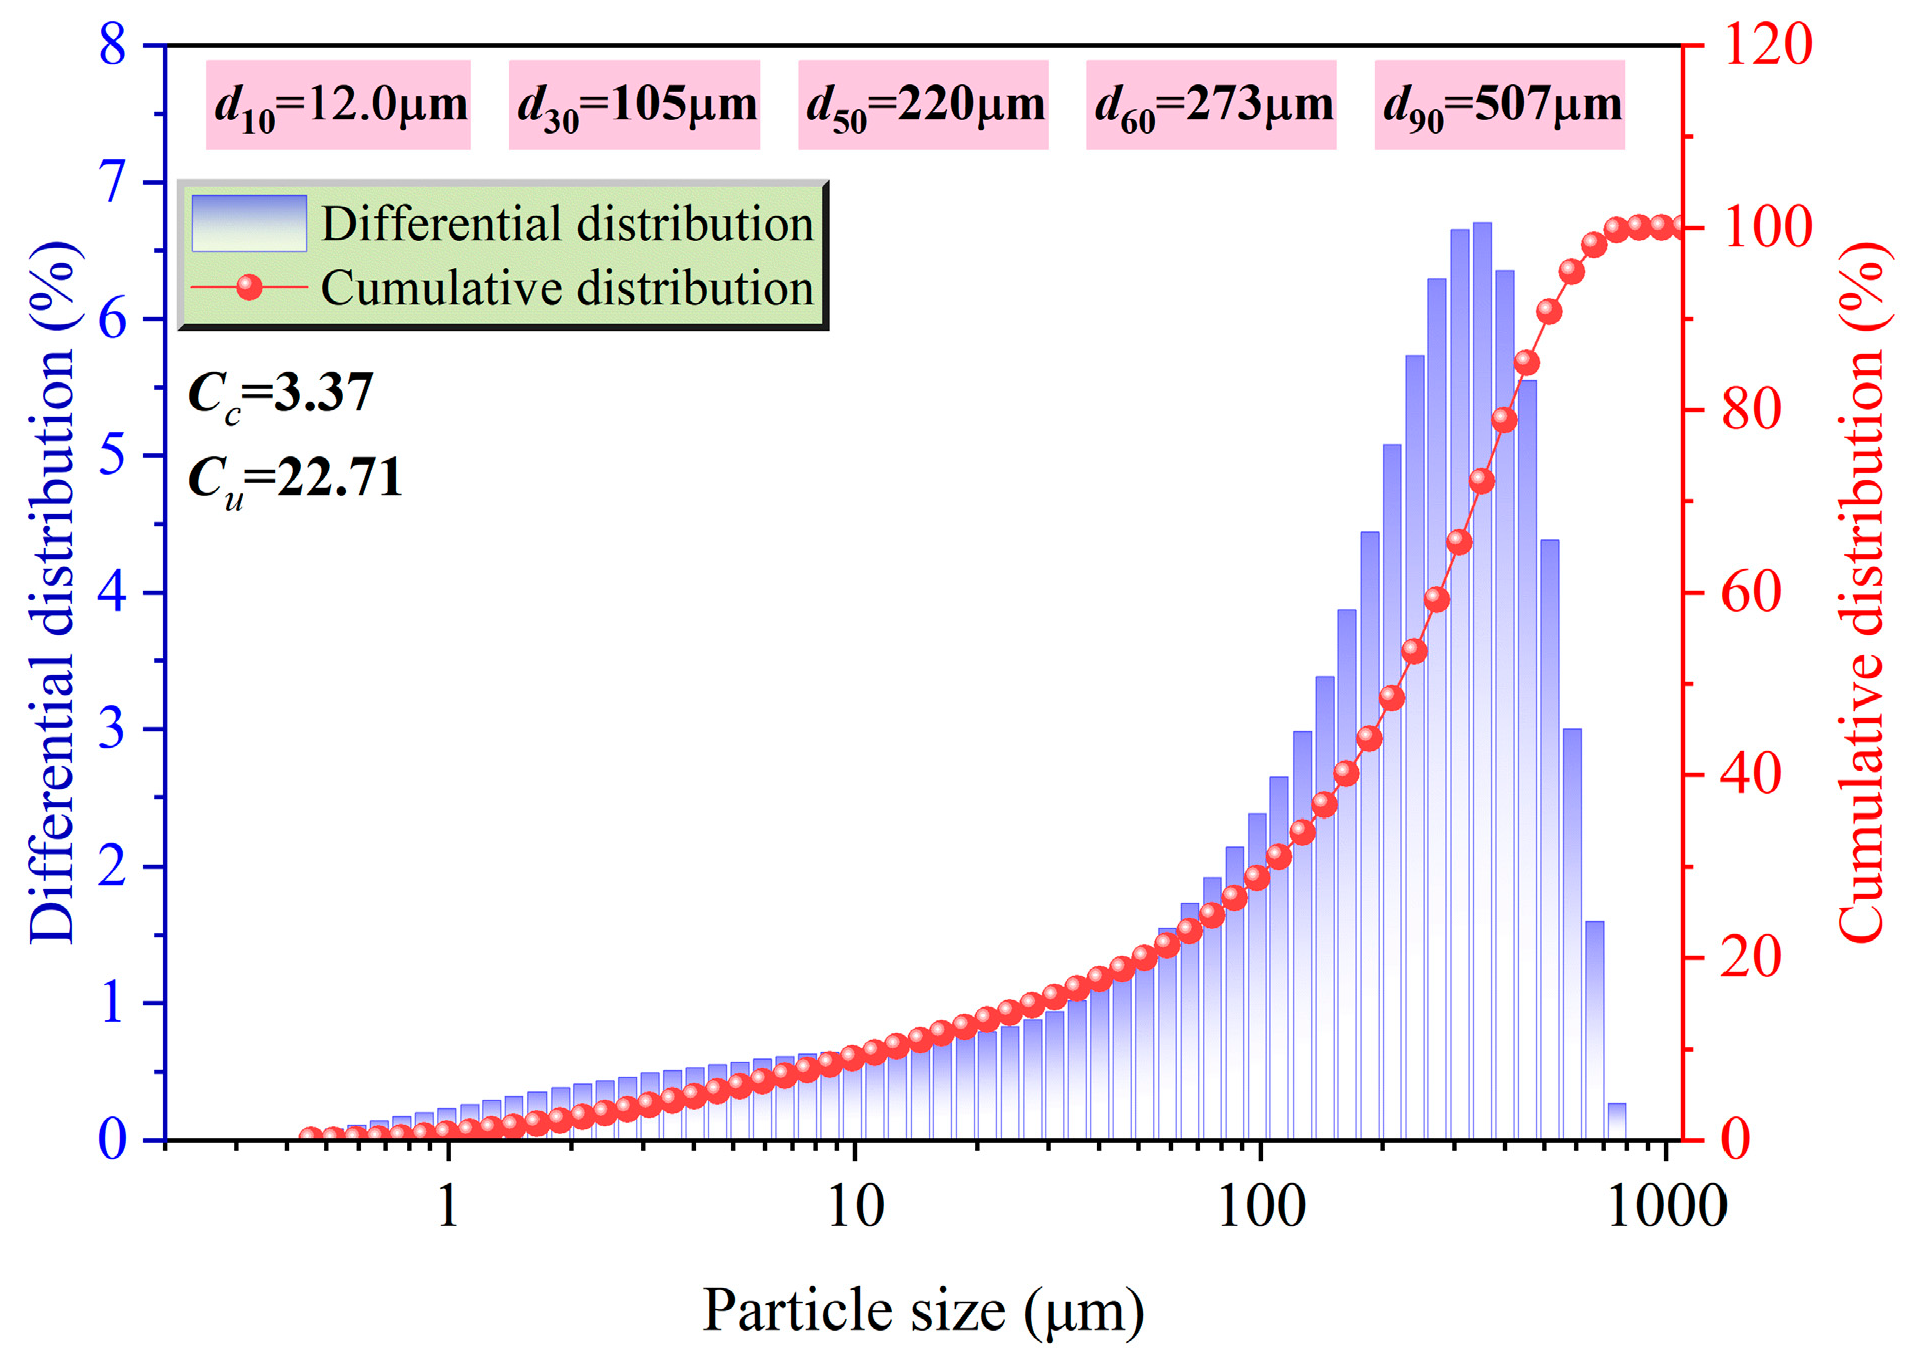
The unclassified tailings used in this experiment were sampled from a gold mine in Shandong Province. Its physical properties were characterized as follows: the bulk density was 1.394 g·cm−3, determined by the graduated cylinder filling and weighing method; the porosity was 48%, calculated from the bulk density and particle density; the particle density was 2.667 g·cm−3, measured using a pycnometer (AccuPyc II 1340, Dianrui Chemical Glass Laboratory Instruments Co., Ltd., Guangzhou, China). The particle size distribution (PSD) was obtained by laser diffraction analysis (Malvern Mastersizer 3000, Malvern Panalytical Ltd., Malvern, UK), as shown in Figure 1. The. Based on the PSD, the characteristic particle sizes d10, d30, and d60 are 12.0 μm, 105 μm, and 273 μm, respectively. The coefficient of uniformity, Cu, is 22.71, indicating that the unclassified tailings have a well-graded particle size distribution, and the coefficient of curvature, Cc, is 3.37, suggesting poor continuity of its particle size.
Figure 1.
Particle size distribution of unclassified tailings.
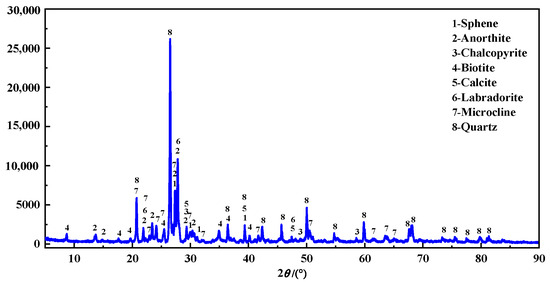
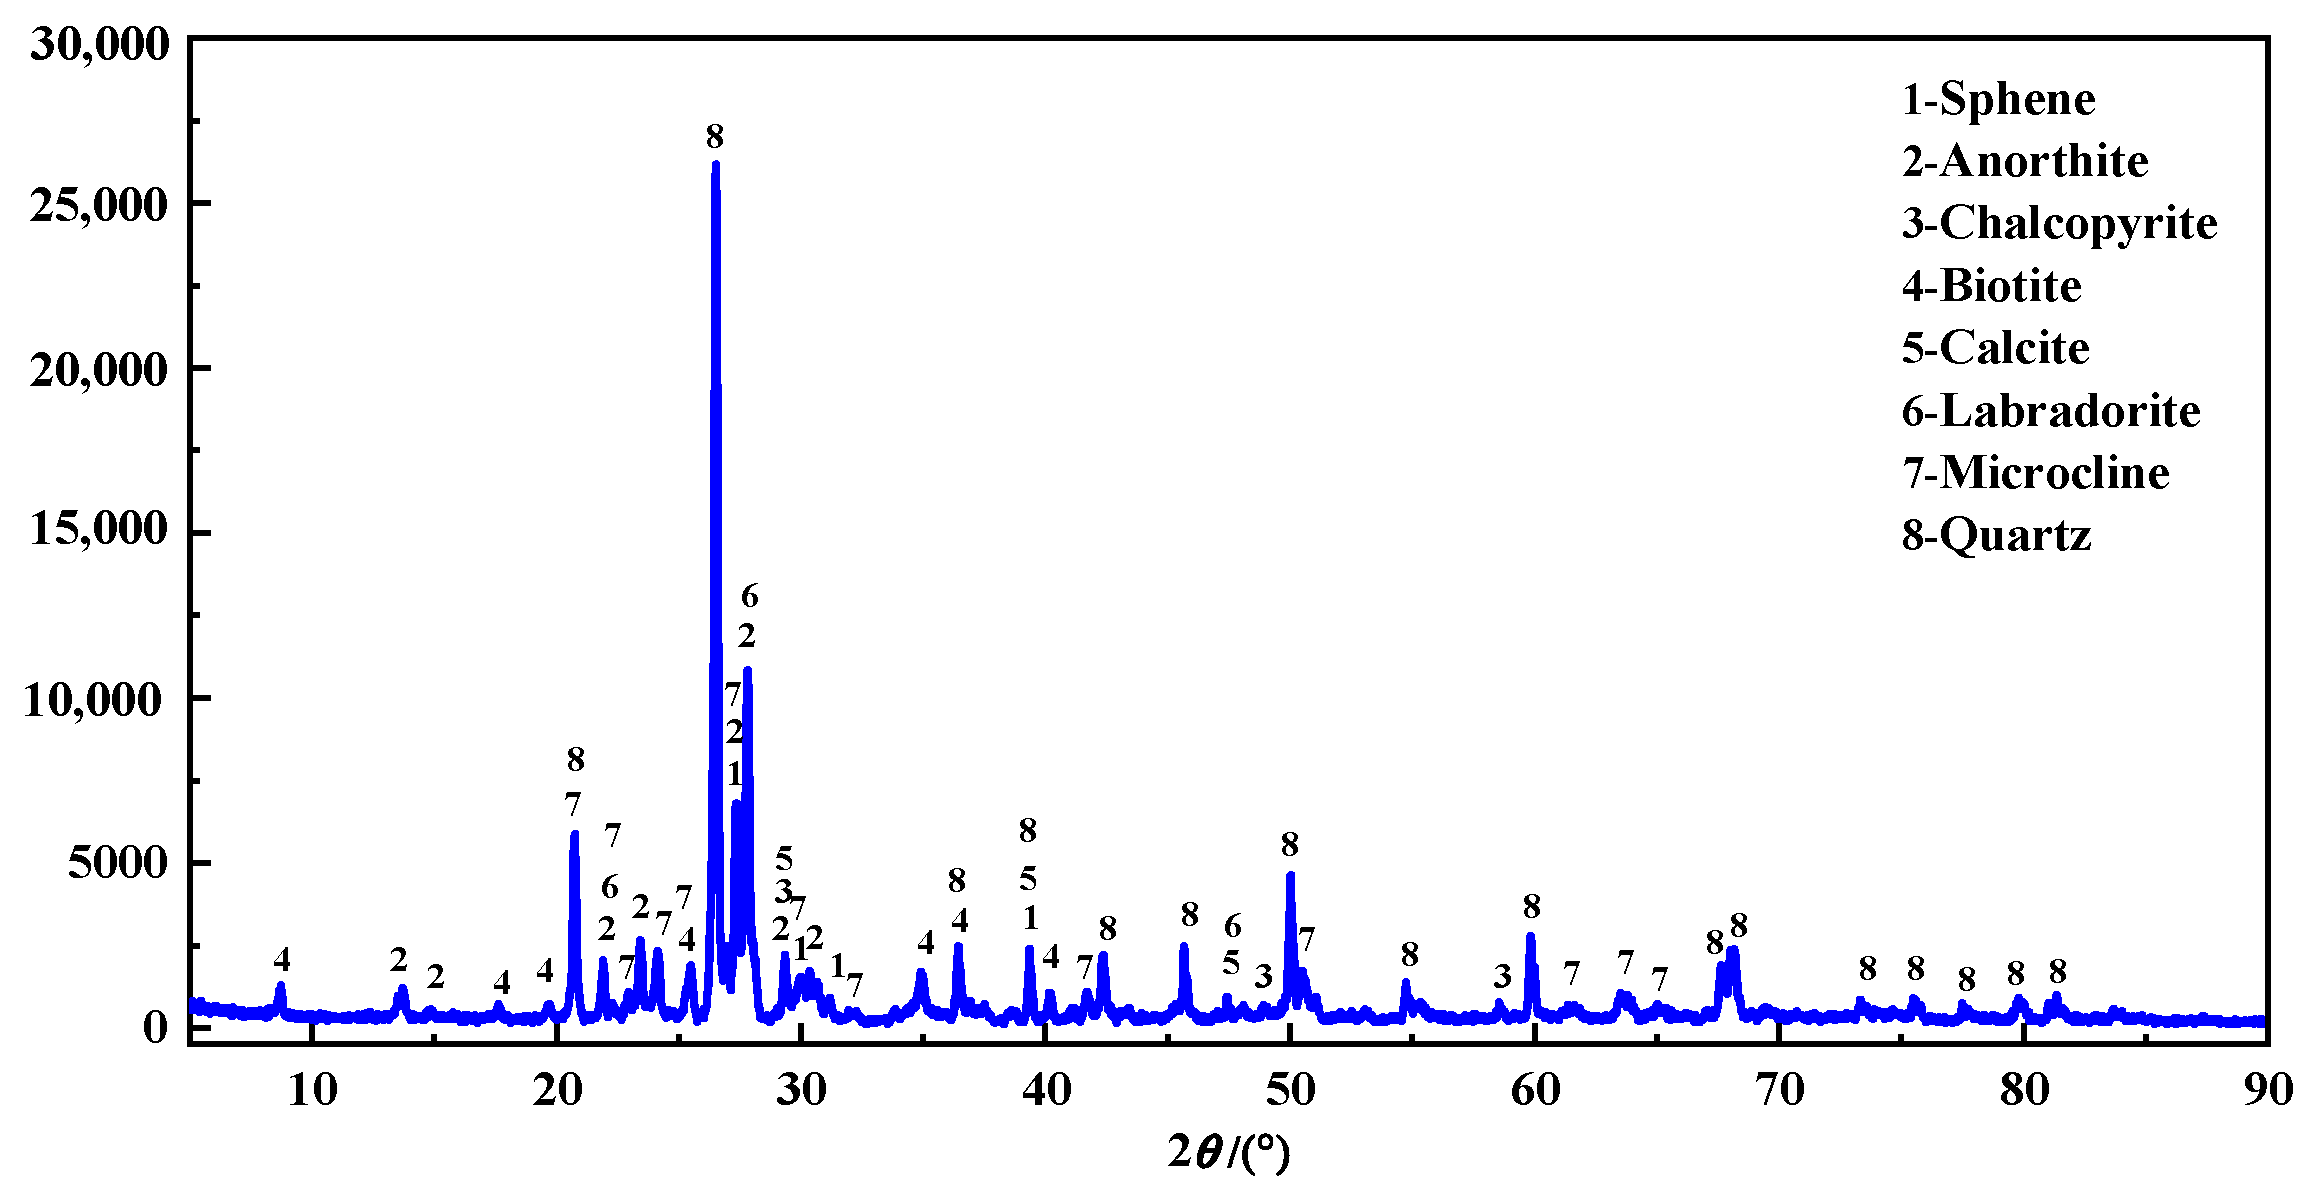
The tailings were subjected to XRD analysis and XRF analysis, respectively, to obtain the XRD spectrum and chemical composition of the tailings. The results are shown in Figure 2 and Table 1. As shown in Figure 2 and Table 1, the tailings primarily consist of quartz, feldspar, biotite, sphene, and calcite. This indicates that the tailings composition comprises silica, alumina, silicate minerals, and aluminate minerals. These minerals exhibit low reactivity and essentially do not participate in hydration reactions throughout the entire experimental process.
Figure 2.
XRD patterns of unclassified tailings.
Table 1.
Chemical composition of unclassified tailings (mass fraction, %).
2.2. Experimental Equipment and Procedures
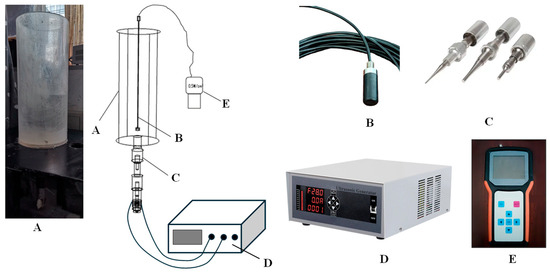
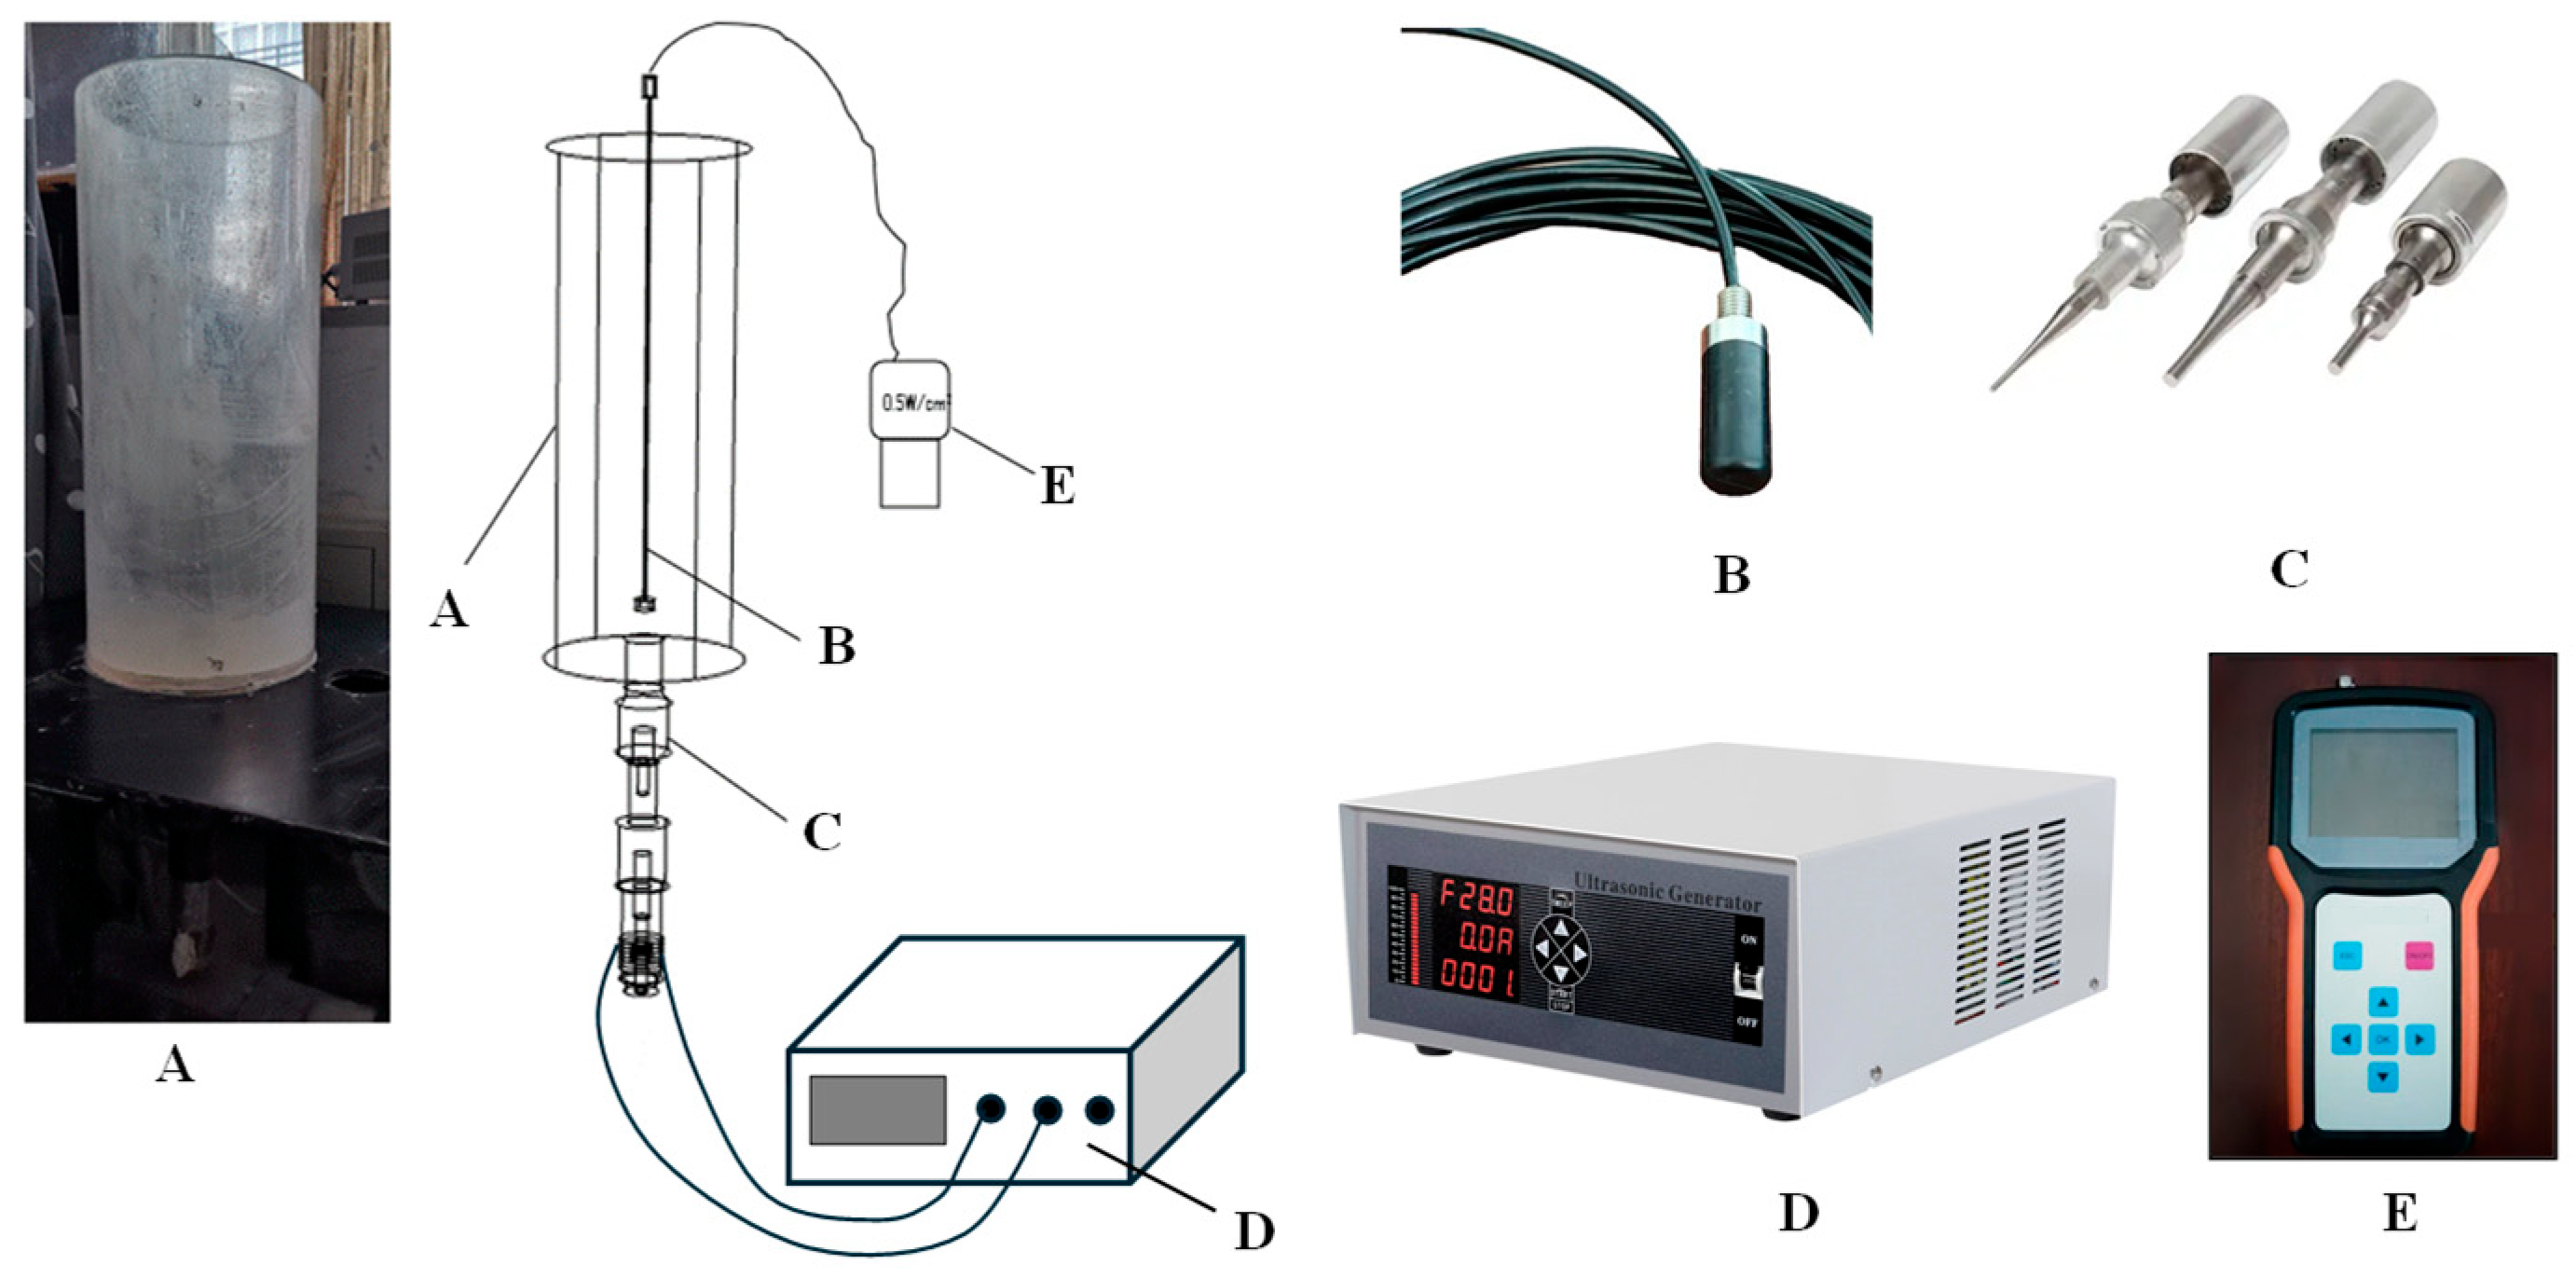
The experimental equipment comprises three main components: a backfilling silo, an ultrasonic vibration system, and measuring equipment (Figure 3). This study is primarily focused on investigating the influence of ultrasonics directly emitted by an ultrasonic concentrator on the thickening and settling process of tailings slurry and the final underflow concentration. Therefore, the ultrasonic concentrator is directly inserted into the backfilling silo, with an insertion depth determined as 10 mm. To better align with actual on-site production scenarios, the backfilling silo is designed in a cylindrical shape. Through a literature review and preliminary experiments, the radius of the backfilling silo is ultimately set at 20 cm and its height at 50 cm.
Figure 3.
Experimental equipment. (A) Backfilling silo; (B) hydrophone; (C) ultrasonic transducer; (D) ultrasonic generator; (E) sound intensity meter.
The ultrasonic vibration system consists of an ultrasonic generator and an ultrasonic concentrator. The ultrasonic generator, a vital part of high-power ultrasonic systems, converts commercial power into high-frequency alternating current suitable for the transducer to drive its operation. It generates high-power, high-frequency alternating current to enable the ultrasonic transducer to work. This experiment utilized an ultrasonic generator with a rated frequency of 20 kHz, manufactured by Baoding Ikeda Trading Co., Ltd. in Baoding, China. The device only supports frequency fine-tuning, with a maximum output power of 400 W.
The mechanism by which the ultrasonic concentrator generates ultrasonic vibration is the electrical signal from the ultrasonic generator, which is applied to a piezoelectric ceramic plate to form a potential difference and convert it into mechanical energy. This mechanical energy is transmitted to a horn, which amplifies and concentrates the energy. The amplification effect of the horn is related to its shape and length. Through research on the literature, Baoding Ikeda Trading Co., Ltd., China, was commissioned to produce a common cylindrical tool head and an inverted conical horn tool head with an amplification function. Both the ultrasonic generator and the ultrasonic concentrator have a rated operating frequency of 20 kHz.
The measuring equipment is a sound intensity measuring instrument, also known as a handheld sound intensity measuring instrument, which consists of two parts: a sound intensity probe with a length of 60 cm and a sound intensity display for reading. The model of this sound intensity measuring instrument is R28045C (Gaozhi Precision Instruments Co., Ltd., Shanghai, China), with a measurable sound intensity range of 0–150 W/cm2, a measurable frequency range of 5 kHz–1 mHz, and a probe length of 60 cm.
The experimental procedures are detailed as follows.
(1) A free settling test was conducted. The prepared UTS was prepared at a designed mass concentration of 28% by mixing dry tailings and deionized water based on weight measurements, and this concentration was confirmed by calculation. The slurry was poured into the backfilling silo, and after stirring the tailings slurry thoroughly for 2 min, it was allowed to undergo free settling. The settling process was monitored using a digital camera to track the descent of the solid–liquid interface (mud line). Immediately after stirring stopped, the initial height of the interface (H) was recorded, marking the start time (t = 0). Subsequently, the interface height was recorded at specified time intervals: every 5 min for the first hour, every 10 min for the second hour, and every 30 min for the third hour. The settling velocity and final underflow concentration of the UTS were calculated based on the data obtained.
(2) An experiment was performed to investigate the effect of applying ultrasonics at different time points during the free settling of the tailings slurry on its thickening and settling process. An ultrasonic concentrator operating at a fixed frequency of 20 kHz and a power of 100 W was used to apply ultrasonics with a duration of 5 min at different time points (0, 5, 10, 15, 20, 25, 30, and 35 min) after the start of the free settling of the UTS, and the experimental data were recorded following the same method as described in the first step.
(3) An experiment was conducted to explore the influence of ultrasonics with different power levels on the thickening and settling of the UTS. Five minutes after the initiation of free settling, ultrasonics with a fixed frequency of 20 kHz and varying power levels (50 W, 100 W, 150 W, 200 W, 250 W, 300 W, 350 W, and 400 W) were applied for a duration of 5 min using the ultrasonic concentrator, and the experimental records were obtained in accordance with the procedure outlined in the first step.
(4) To ensure the reliability of the results, each experiment was repeated three times to obtain accurate and reproducible results.
2.3. Experimental Methods
(1) Characterization method for the settling velocity of UTS.
In the research on the thickening and settling test of UTS, the settling velocity of the solid–liquid interface of the UTS is used to characterize the settling velocity of the UTS particles. There are mainly three representation methods for the settling velocity of the solid–liquid interface, namely, the instantaneous maximum velocity during the settling process, the average velocity throughout the entire descending process, and the initial settling velocity in the linear settling stage. Among them, the solid flux calculated based on the maximum velocity is relatively large, the solid flux calculated based on the average velocity is relatively small, and the solid flux calculated based on the initial settling velocity falls between the above two. In this study, the average velocity throughout the entire settling process and the initial settling velocity are used to characterize the settling velocity of the interface of the UTS, aiming to characterize certain laws by analyzing the differences between the two. The average velocity is the ratio of the settling height generated by the UTS particles settling in the backfilling silo for 3 h to the settling time, while the initial settling velocity is the absolute value of the slope obtained by fitting the linear settling stage of the height-time variation curve of the solid–liquid interface.
(2) Calculation of the underflow concentration of UTS.
The underflow concentration of UTS refers to the mass concentration of the lower turbid slurry after removing the upper clear supernatant during the settling process of the UTS in the backfilling silo. Its specific calculation process can be obtained by the following formula:
where Cd is the mass concentration of the slurry at the bottom of the backfilling silo, %; ms is the mass of unclassified tailings in the backfilling silo, kg; m1 is the total mass of water in the backfilling silo, kg; and m2 is the mass of the upper clear water in the backfilling silo, kg, which is calculated by the following formula:
where ρ is the density of water, kg/m3; r is the radius of the backfilling silo, m; H is the height of the uniform UTS with an initial mass concentration of 28% in the backfilling silo, m; and h is the height of the lower slurry during the thickening and settling process, m.
3. Results and Discussion
3.1. Settlement Velocities Under Different Application Times
3.1.1. The Average Settlement Velocity at Each Settlement Stage
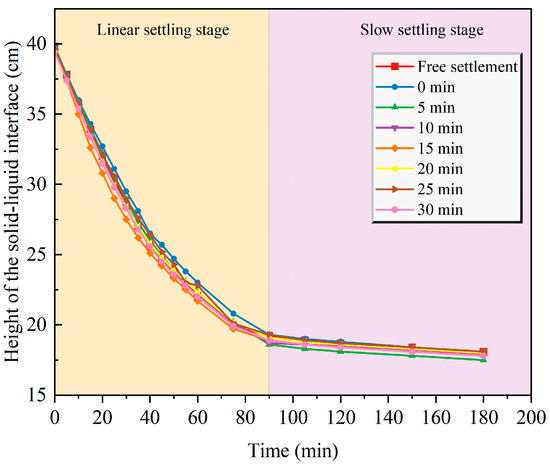
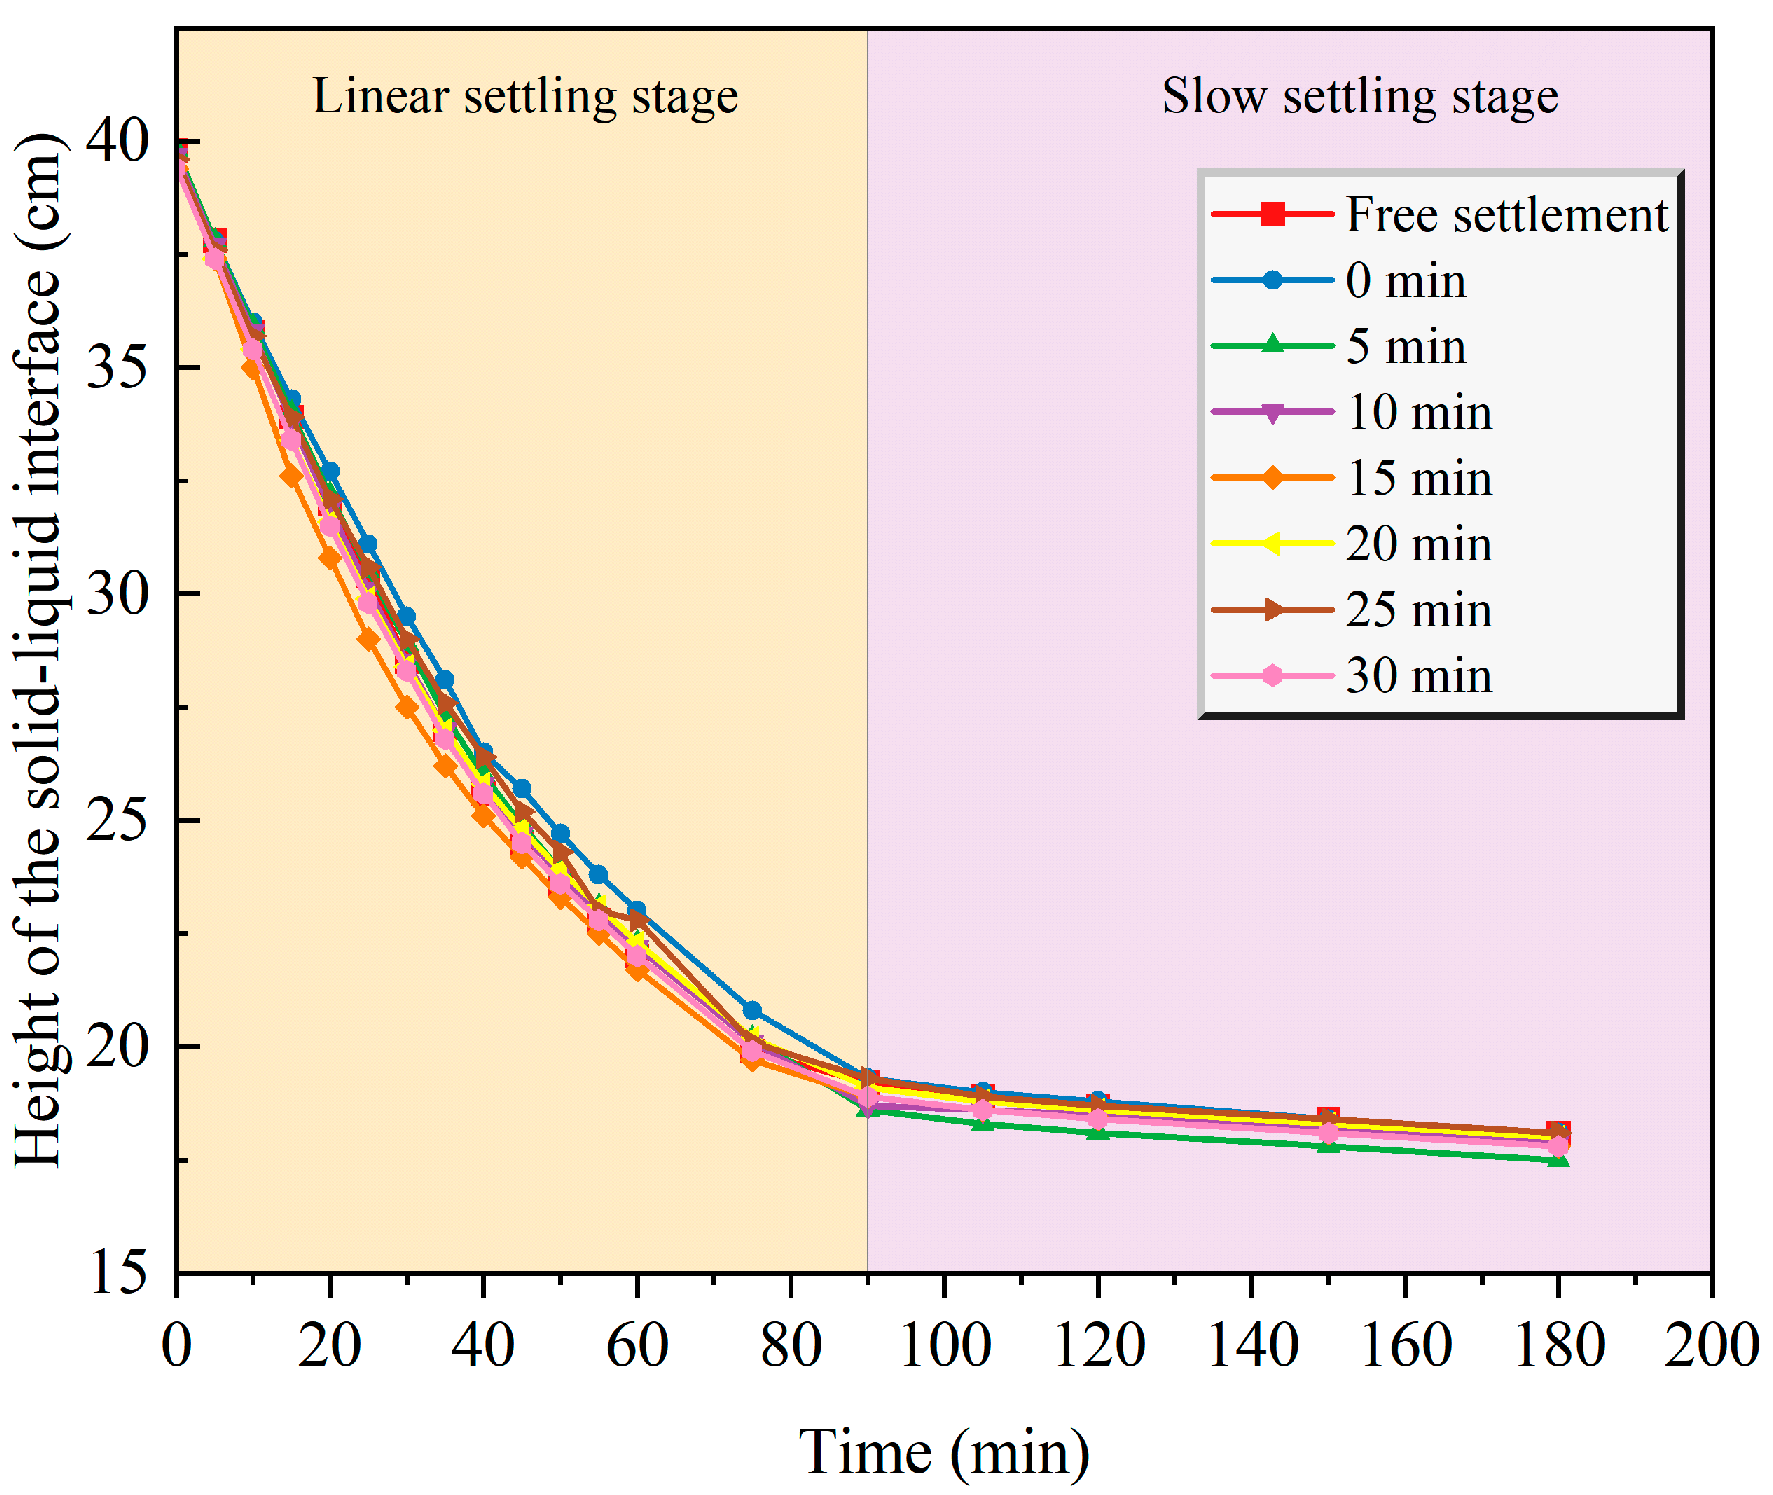
Figure 4 illustrates the time-varying curve of the solid–liquid interface height when ultrasonics are applied at different moments during the free settlement process of UTS. It can be seen that this curve can be divided into two stages according to the settlement time: a “linear settling stage” within 0–90 min and a “slow settling stage” for the remaining period. By performing linear fitting on the “linear settling stage”, a linear function can be derived, and the absolute value of the slope of this function is taken as the initial stage settling velocity.
Figure 4.
The curve of the height of the solid–liquid interface varying with time under the application of ultrasonics at different sedimentation times.
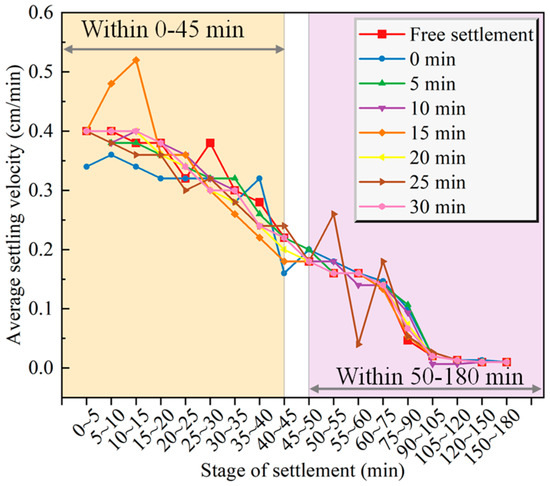
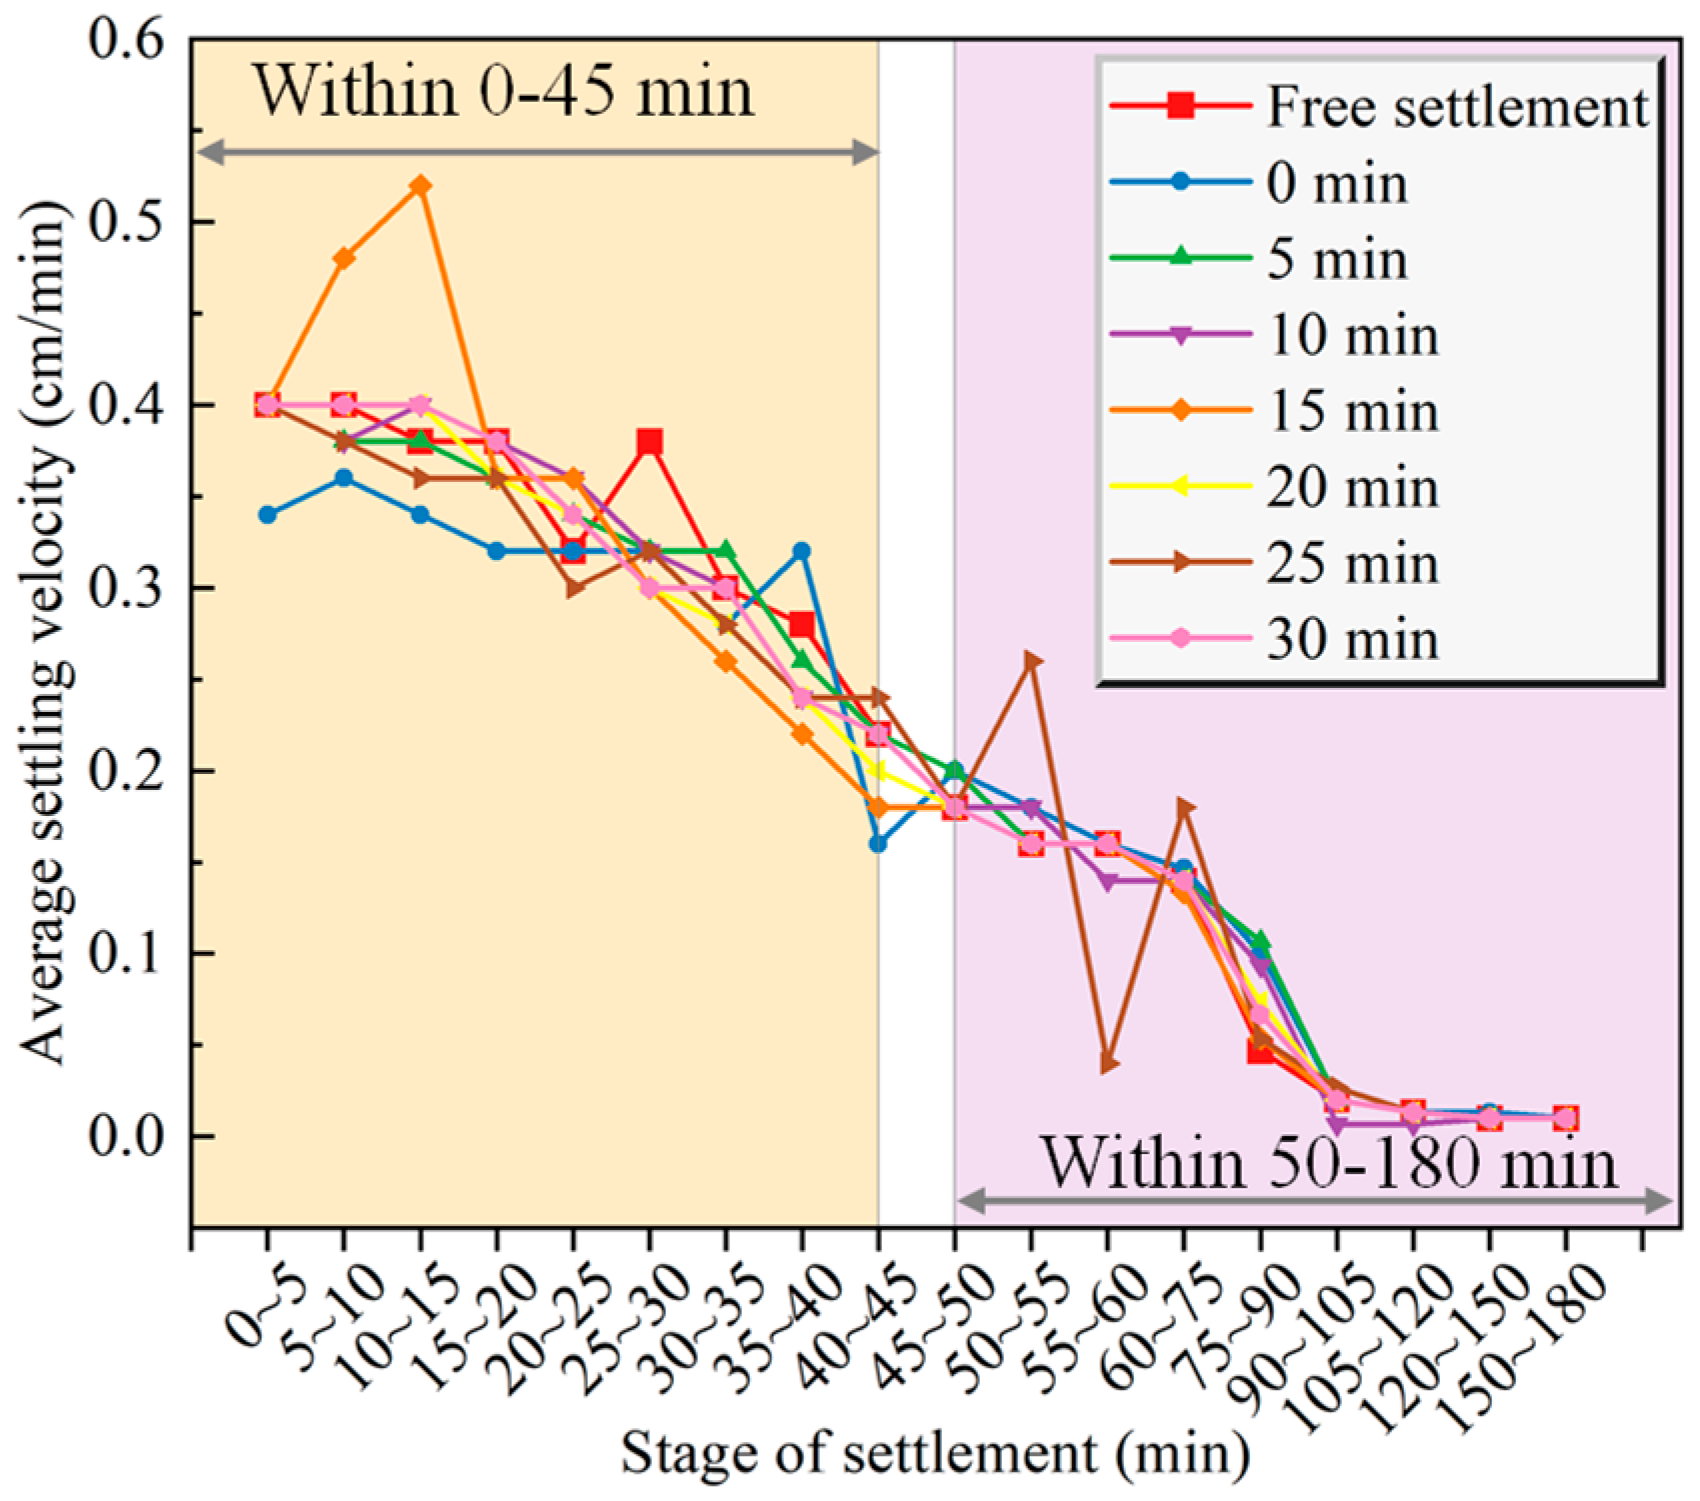
Figure 5 depicts the average settlement velocity of each settlement stage with ultrasonics applied at different timings. Specifically, an ultrasonic concentrator with a frequency of 20 kHz and a power of 100 W was employed to apply ultrasonics for 5 min at various time points (0~35 min) during the free settlement of the UTS. The height of the solid–liquid interface of the UTS was recorded every 5 min, and the average settlement velocity within each 5 min interval was calculated based on the height difference, leading to the time-varying curve of the average settlement velocity in each time period as presented in Figure 5. It is evident that the settlement velocity fluctuates, yet it shows an overall decreasing trend.
Figure 5.
The average settlement velocity at each settlement stage when ultrasonic is applied at different time points.
The average settlement velocity of the solid–liquid interface of the UTS within 0–45 min after ultrasonic application is mostly lower than that under free settlement. However, a reversal of this trend is observed during the 50–105 min period (the reasons for this change are discussed below). Notably, as shown in Figure 4, the descent of the interface between 60 and 90 min is more pronounced under ultrasonic treatment. Specifically, the reduction in interface height (i.e., the settlement distance) during this 30 min interval ranges from 2.8 to 3.7 cm for ultrasonically treated samples, compared to only 2.8 cm for the free-settling sample. This indicates that the settlement was accelerated by ultrasound within this specific window.
We hypothesize that the ultrasonic action (mechanical and cavitation effects) disrupts the drainage channels within the underflow tailings bed, potentially creating a localized structural discontinuity or “fault.” When the overlying slurry layer (i.e., the slurry above this disrupted zone) settles to this stage, it experiences a larger settlement displacement (amplitude) than it would under free settlement. For the subsequent period (105–180 min), the settlement velocities under both conditions converge and gradually stabilize as the primary consolidation phase concludes, and the system approaches its final compaction.
3.1.2. Overall Average Settlement Velocity and Initial Settlement Velocity of Ultrasonic Applied at Different Times
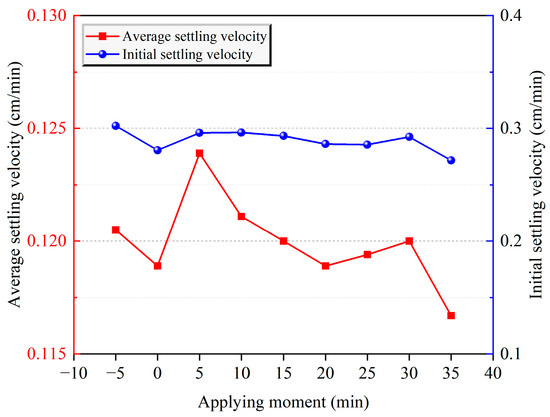
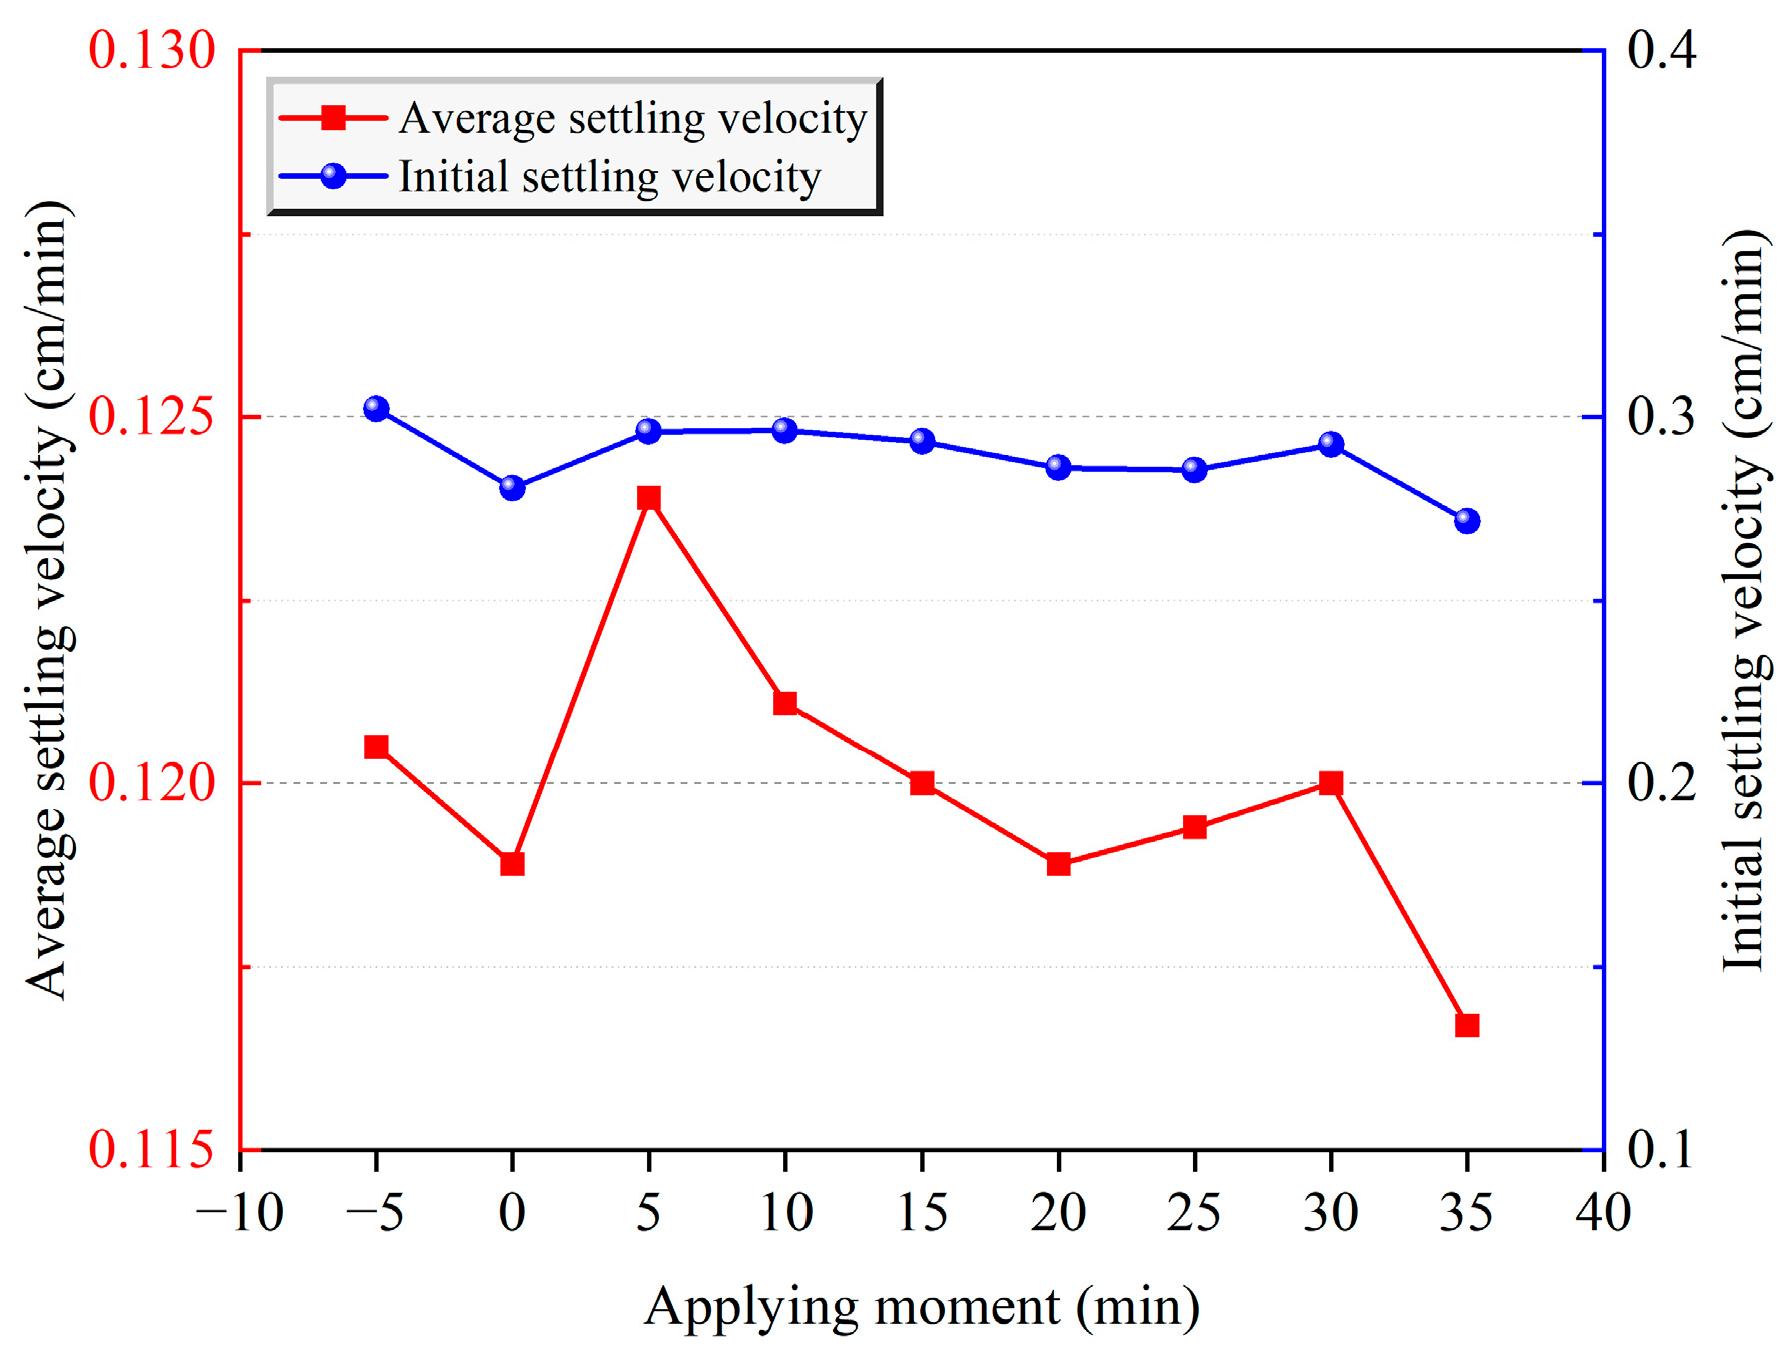
This section aims to investigate how the timing of ultrasonic intervention influences both the initial and the overall settlement behavior of UTS. As illustrated in Figure 6, the trends for the average settlement velocity and the initial settlement velocity in response to different ultrasonic application times are broadly similar.
Figure 6.
The overall average settling velocity and initial settling velocity of ultrasonic applied at different times.
As can be seen from Figure 6, the application of ultrasound at the fifth minute of free settlement was found to be most effective in accelerating the average settlement velocity throughout the entire process. This indicates a critical window where ultrasonic energy optimally disrupts the forming particle network to enhance subsequent consolidation. A notable finding is that the initial settlement velocity under all ultrasonic conditions was lower than that of free settlement. This demonstrates that the immediate effect of ultrasound at the onset of sedimentation is to disrupt the initial rapid, gravity-driven flocculation or settling of coarse particles, thereby slowing down the early linear settlement stage. Despite suppressing the initial velocity, ultrasound applied at the 5th and 10th minutes resulted in a higher average velocity than free settlement. This reversal implies that the ultrasonic treatment significantly accelerated the later, non-linear settlement stage (e.g., compression settling). We hypothesize that the earlier disruption of the particle structure by ultrasound facilitated water drainage channels, leading to more efficient consolidation in the later phase.
For application times other than 5 and 10 min, the average velocity remained lower than that of free settlement. This underscores that the beneficial effect of ultrasound on overall settling is highly timing-dependent and is not guaranteed by arbitrary application during the process. The energy input must coincide with a specific structural state of the slurry to transform initial disruption into long-term drainage improvement.
3.2. The Underflow Concentration Under Different Application Times
3.2.1. The Underflow Concentration Varying with Time
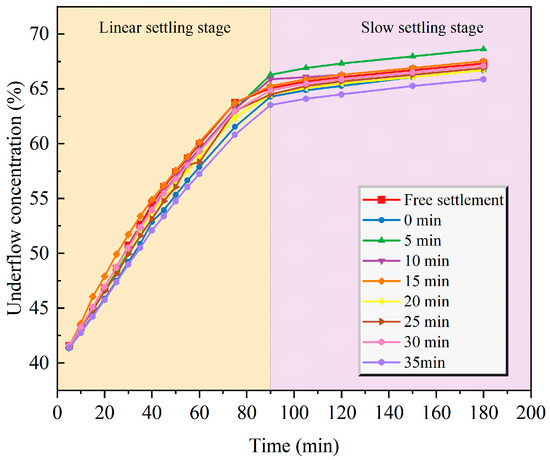
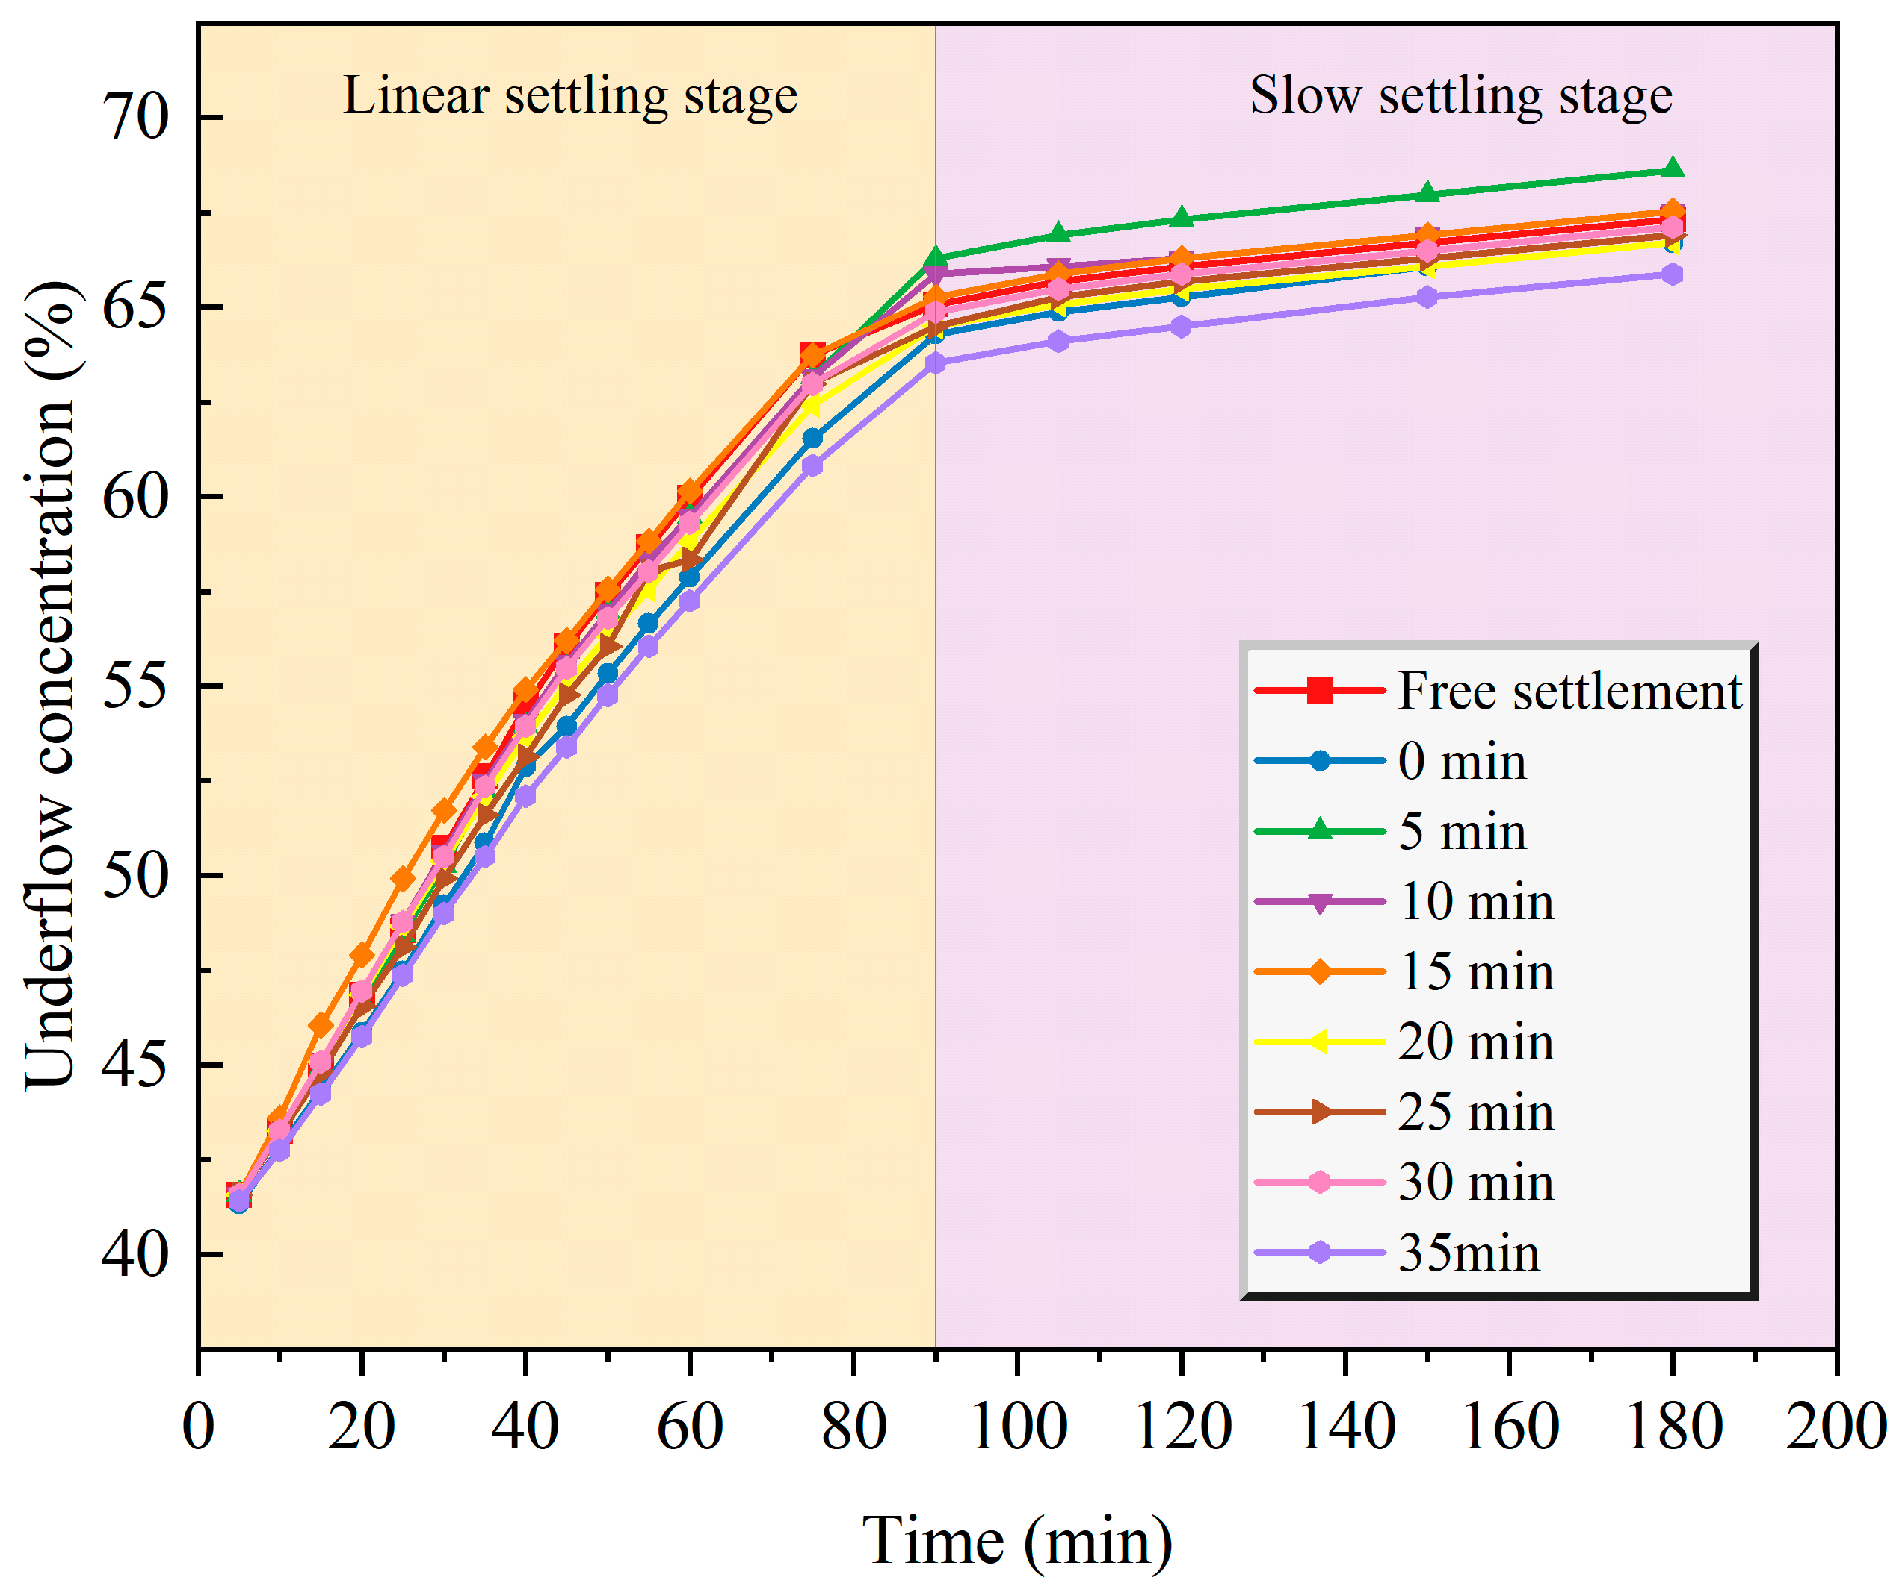
An ultrasonic concentrator with a frequency of 20 kHz and a power of 100 W was used to apply ultrasonics for 5 min at various time points (0, 5, 10, 15, 20, 25, 30, and 35 min) during the free settlement of the UTS. The resulting time-varying underflow concentration of the UTS is depicted in Figure 7.
Figure 7.
Time-dependent variation in underflow concentration following ultrasound application at different time points.
It can be observed from Figure 7 that the underflow concentration of the UTS increases continuously with time. The variation process can be divided into two stages: a “linear settling stage” within 0–90 min, where the underflow concentration increases approximately proportionally with time, followed by a “slow settling stage” from 90 to 180 min, exhibiting a near-linear but slower increase.
In the experiments where ultrasound was applied at the 20th, 25th, 30th, and 35th minutes, the underflow concentration—which was initially higher than that of free settlement—decreased after the ultrasonic application. This suggests that applying ultrasound during the mid-to-late stages of the linear settling phase can disrupt the already-formed, denser particle network and drainage channels. The introduced vibration and cavitation may break up beneficial flocs or resuspend fine particles, thereby weakening the consolidation process and temporarily reversing the thickening trend.
Comparing the curves for ultrasound applied at the 10th and 15th minutes reveals a more complex relationship. Within 0–90 min, the concentration for the 10th-minute application is consistently lower. This may be attributed to the ultrasound significantly disrupting the initial, rapid flocculation settlement, similar to its effect on initial velocity (Section 3.1.2). However, from 90 to 180 min, the concentration for the 10th-minute application slightly surpasses that of the 15th-minute case, and they converge by the 180th minute. This indicates that the earlier intervention, while hindering immediate compaction, might have created a more open particle structure that facilitated more efficient long-term drainage and consolidation in the slow settling stage.
These results underscore that the impact of ultrasound on underflow concentration is highly timing-dependent and non-monotonic. It is not simply a matter of earlier application leading to better final outcomes. Instead, there exists a critical window where the disruptive energy of ultrasound can be transformed into a long-term drainage advantage, whereas application outside this window (especially too late) can be counterproductive to the thickening process.
3.2.2. Final Underflow Concentration After Applying Ultrasonics at Different Times
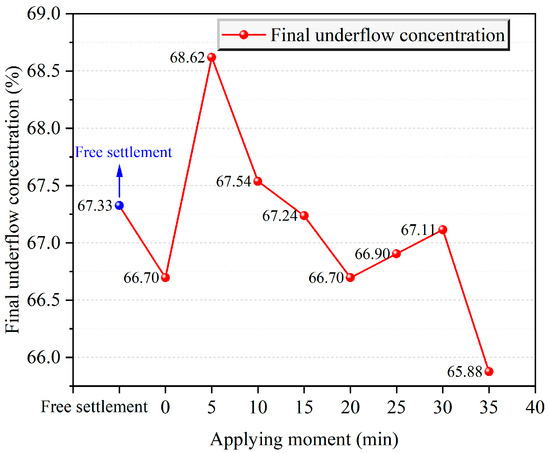
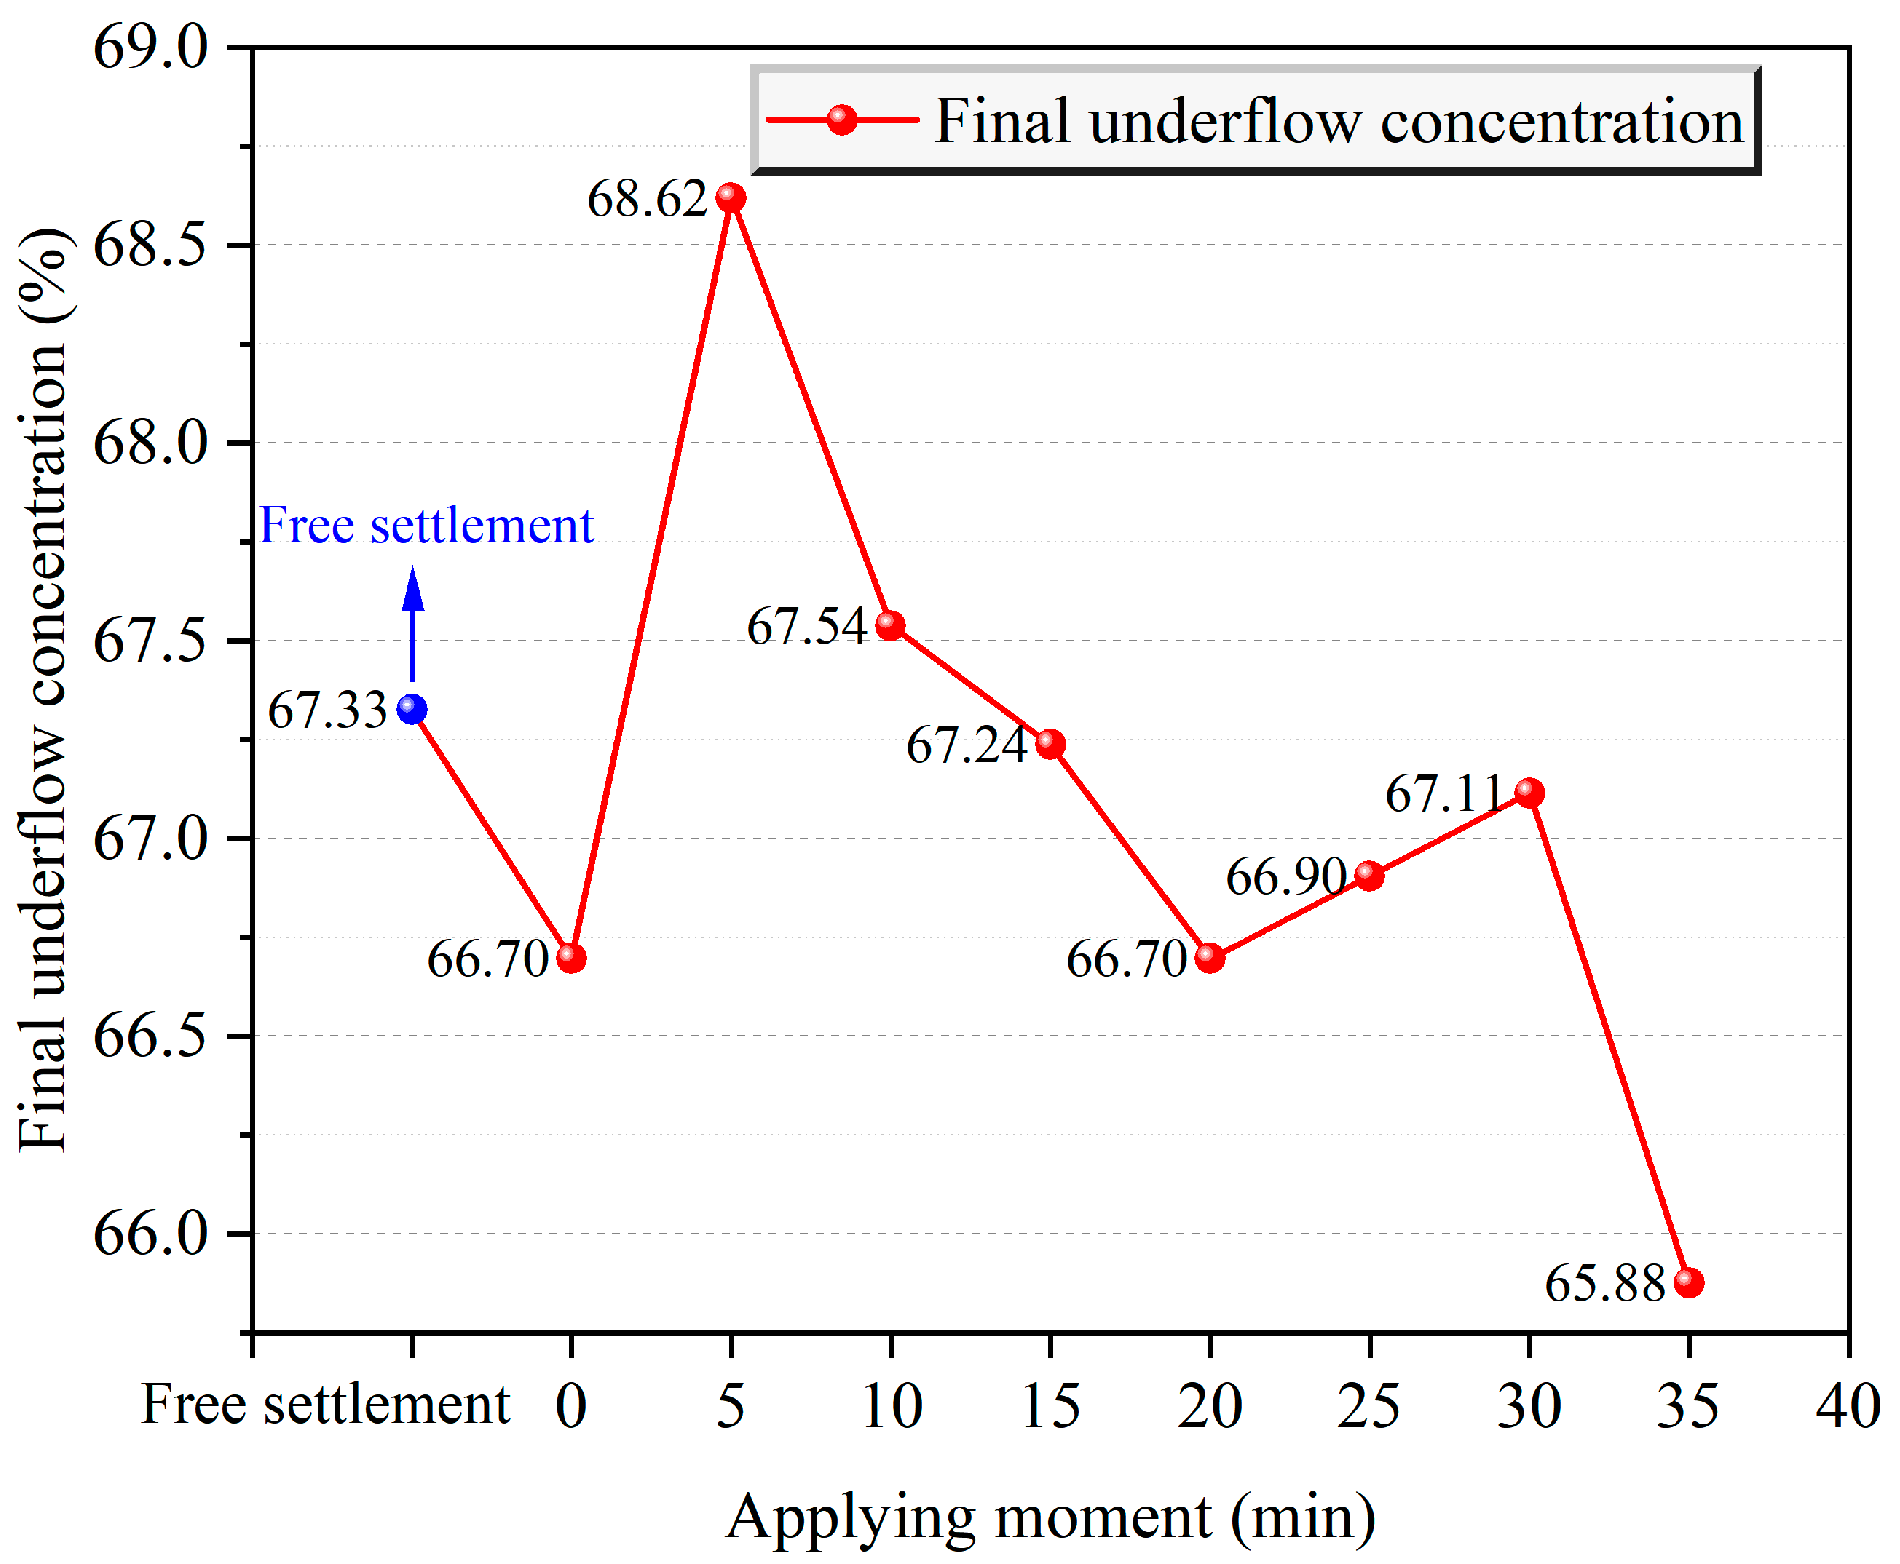
Figure 8 shows the final underflow concentration after 3 h of settlement, encompassing free settlement and the application of ultrasonics for 5 min at different times. It can be seen that only when ultrasound is applied at the 5th and 10th minutes does the thickening effect surpass that of free settlement, with the 5th minute being optimal (final mass concentration increased by 1.3% compared to free settlement). This confirms that the beneficial effect of ultrasound on UTS thickening is highly dependent on the application timing.
Figure 8.
The final underflow concentration of the UTS after applying ultrasonics at different times.
The existence of an optimal application window (5–10 min) can be attributed to the dual role of ultrasonic energy in the settling process. At the very early stage (e.g., 0 min), the slurry structure is loose, and ultrasonic cavitation and vibration primarily cause dispersive disruption, breaking up initial flocs and thereby slowing down the early linear settlement without immediately benefiting consolidation. Conversely, when applied too late (after 15 min), the particle network has already formed a denser, more consolidated structure. Ultrasound at this stage can destructively break the established drainage channels and resuspend fine particles, weakening further compaction.
Application at around the fifth minute, however, coincides with a critical transition period where the initial rapid flocculation is largely complete, and a semi-stable network begins to form. The judicious energy input at this point can selectively disrupt weak agglomerations and create micro-channels within the network, thereby enhancing water release during the subsequent slow compression stage without causing excessive structural damage. This leads to a more efficient overall consolidation and a higher final solids concentration. Thus, the optimal timing represents a balance between achieving sufficient microstructural modification and avoiding detrimental over-dispersion or structural collapse.
3.3. Sedimentation Velocity Under the Action of Ultrasonics of Different Powers
3.3.1. Average Settlement Velocity in Each Settlement Period
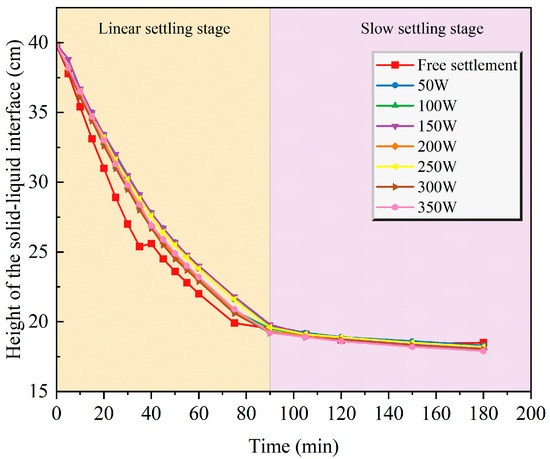
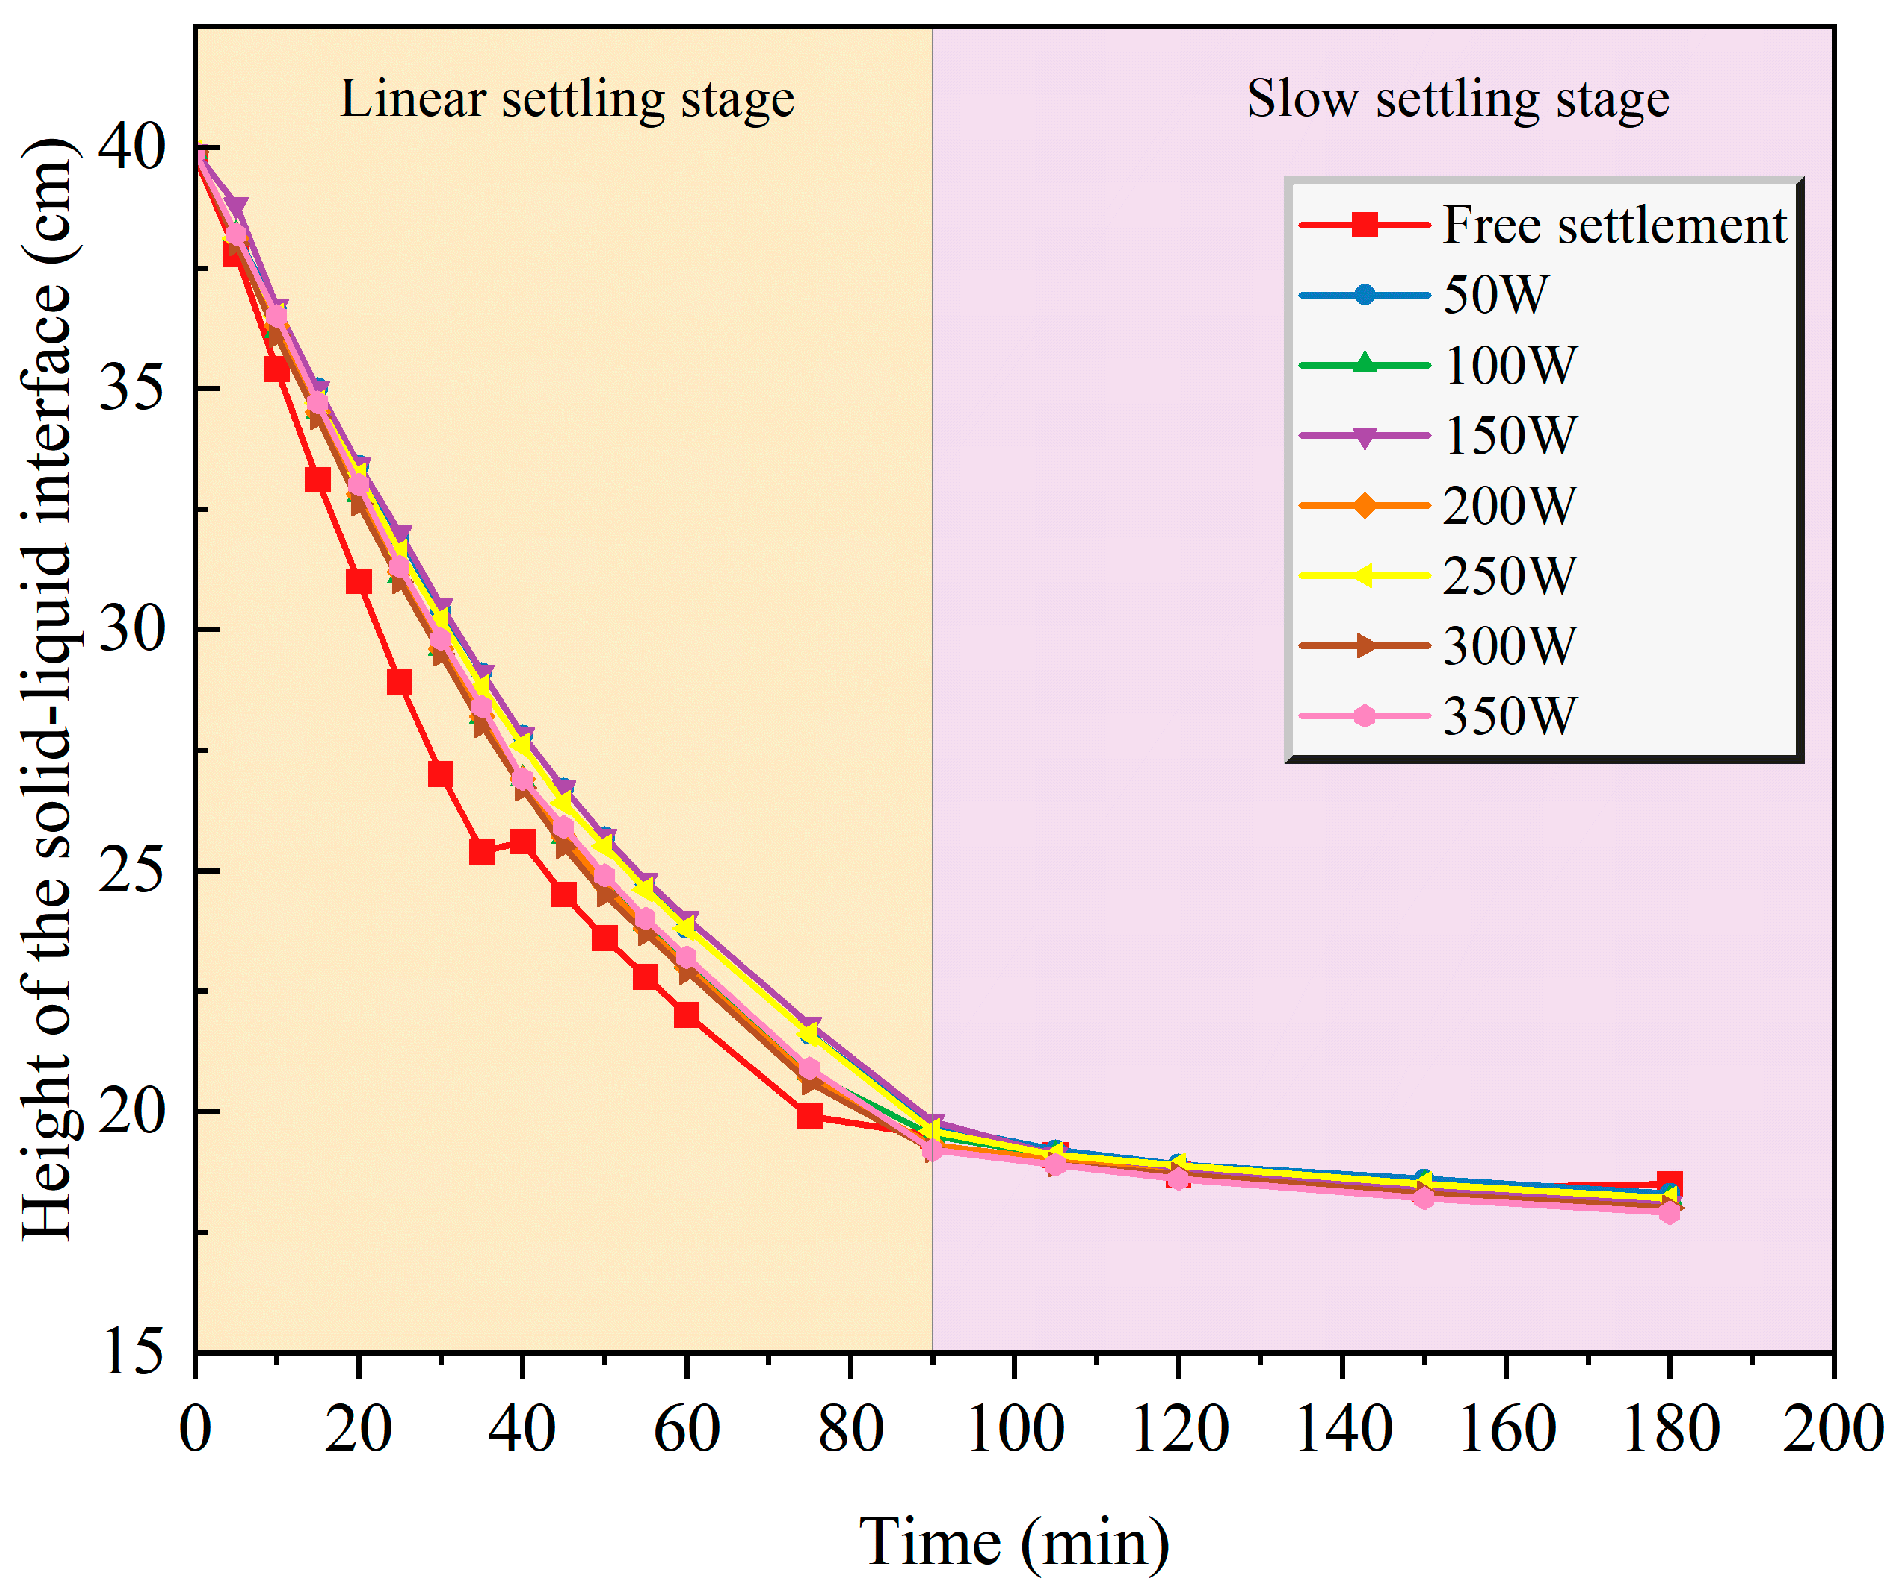
Figure 9 depicts the time-varying curve of the solid–liquid interface height under different ultrasonic power levels. It can be observed that the curve is divided into two stages: a “linear settling stage” (0–90 min) and a “slow settling stage” (beyond 90 min). This division reflects the distinct settlement behaviors of the UTS under ultrasonic actions with varying power, providing a clear visual representation of how ultrasonic power influences the temporal evolution of the solid–liquid interface during the thickening and settling process.
Figure 9.
The curve of the height of the solid–liquid interface varying with time under the action of different ultrasonic powers.
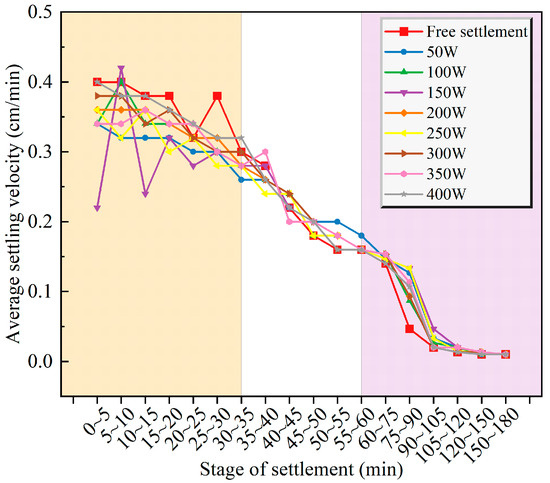
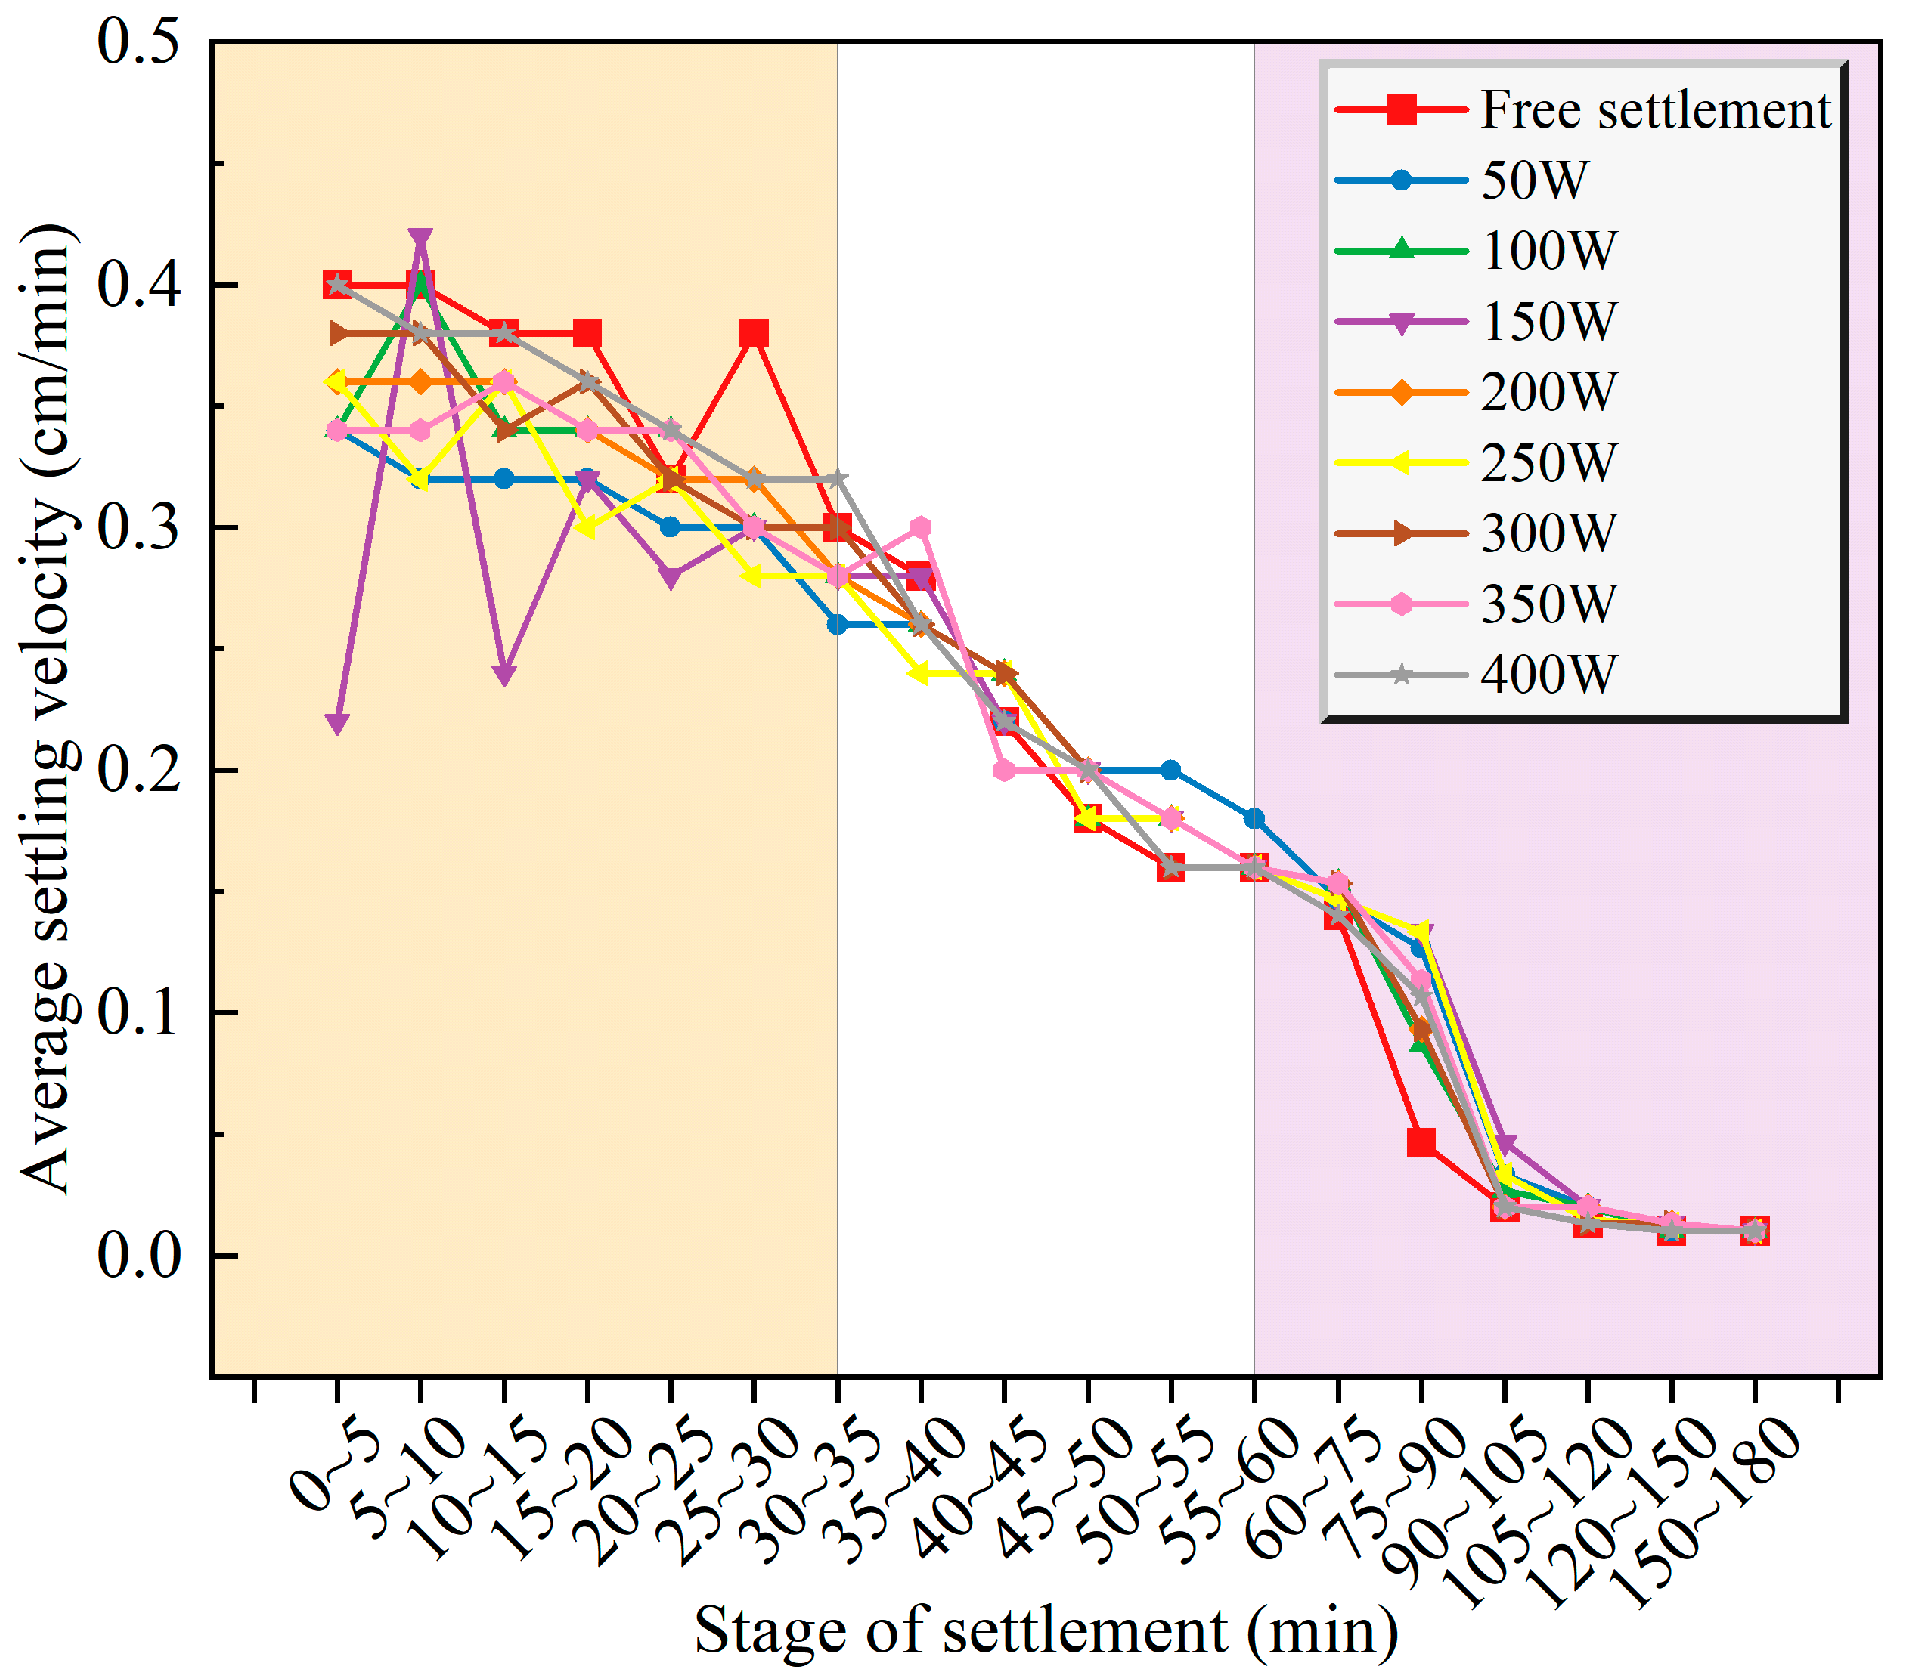
An ultrasonic concentrator with a frequency of 20 kHz and various powers (50 W, 100 W, 150 W, 200 W, 250 W, 300 W, 350 W, and 400 W) was applied to the UTS for 5 min after 5 min of free settlement. During the settlement, the height of the solid–liquid interface was recorded every 5 min, and the settlement velocity within each 5 min interval was calculated. Based on these data, the time-varying curves of the settlement velocity of the solid–liquid interface in the UTS under different power levels were plotted, as shown in Figure 10.
Figure 10.
Average settling velocity diagram of each settling period under different power effects.
It can be seen from Figure 10 that the settlement velocity of the solid–liquid interface in the UTS under free settlement is higher than that with ultrasonic application within 0–35 min, while within 60–105 min, the settlement velocity under free settlement is lower than that with ultrasonic application. This indicates that applying ultrasonics with different powers first decreases the settlement velocity of the UTS, but the settlement velocity increases after a certain settlement period.
This observed phenomenon can be explained by a hypothesized differential effect of ultrasound on particles of different sizes within the settling slurry. The proposed mechanism is as follows. During the settlement of UTS, larger particles settle rapidly to form a preliminary compacted layer at the bottom. The overlying layer consists of finer particles settling slowly under gravity. The applied ultrasonic vibration is hypothesized to exert two distinct effects: (1) on the finer particles in the upper layer, the vibration may impart an upward impulse or enhance Brownian motion, thereby retarding their net settling velocity; (2) on the coarser particles in the lower compacted layer, the vibration is thought to disrupt interparticle bonds and capillary forces, facilitating the drainage of pore water and allowing for further rearrangement and compaction.
This hypothesis is consistent with the key experimental trends presented in this work. Specifically, the observed initial suppression of the settlement velocity (Section 3.1.2) aligns with the proposed retarding effect on fine particles. Conversely, the eventual increase in the average settlement velocity and the final underflow concentration under optimal ultrasonic timing and power (Section 3.1.2 and Section 3.2.2) support the notion of enhanced compaction of the coarse particle bed. While this study provides indirect evidence supporting the differential mechanism, direct experimental visualization remains a valuable future direction. Techniques such as in situ Particle Image Velocimetry (PIV) or X-ray computed tomography (CT) could be employed to non-invasively track the velocity fields and structural evolution of particles of different sizes during ultrasonic treatment, which would offer conclusive validation of the proposed model.
3.3.2. Overall Average Settlement Velocity and Initial Settlement Velocity at Different Ultrasonic Power Levels
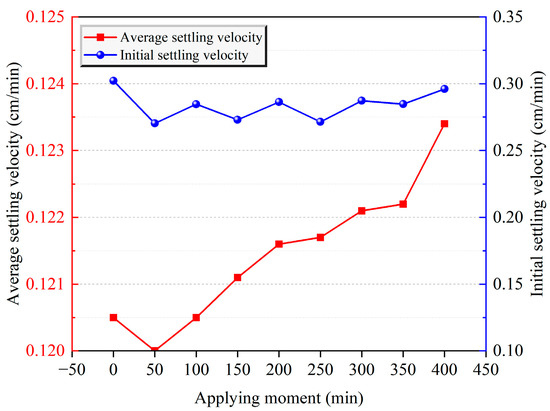
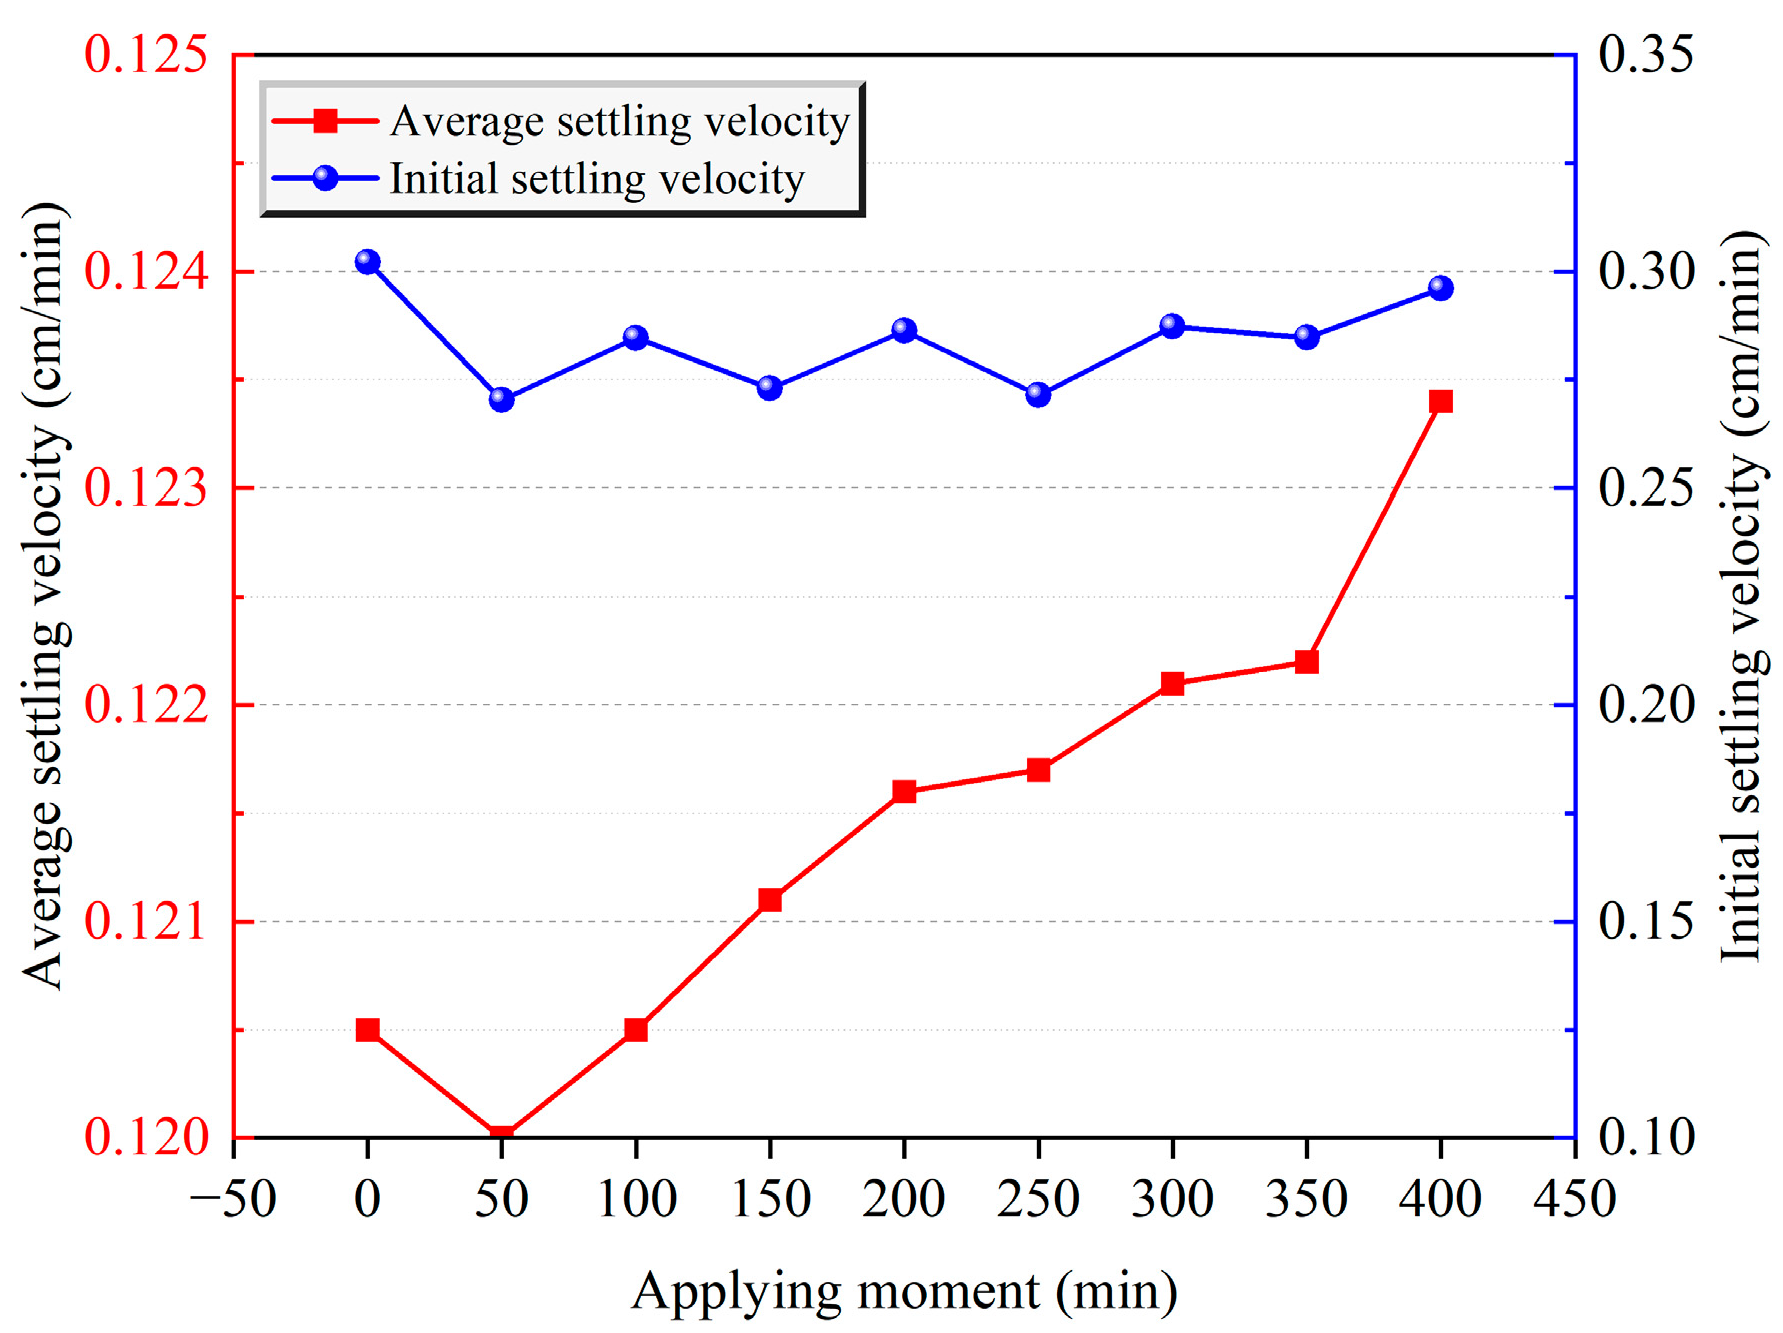
Figure 11 shows the curves of the overall average settlement velocity and the initial settlement velocity in the linear settlement stage of the solid–liquid interface in UTS under different power levels. It can be seen that for the UTS acted upon by ultrasonic concentrators with different powers, the variation trends of the average velocity throughout the entire settlement process and the initial stage velocity with power are different. The average velocity increases as the power increases, whereas the initial settling velocity exhibits no significant variation with power changes, fluctuating instead within the range of 0.25–0.3 cm/min. In terms of the average velocity, except when the power is 50 W, where the average velocity of the solid–liquid interface throughout the entire settlement process is lower than that under free settlement, the average velocities under other power levels are all higher than that under free settlement. This indicates that when the application moment is the same, the power level also influences the average settlement velocity of the UTS. From the perspective of the initial settlement velocity, the linear initial velocities of the solid–liquid interface of the UTS under all power levels are lower than those under free settlement, which is consistent with the conclusion that the initial stage velocities under ultrasonic application at different moments are all lower than those under free settlement. This shows that the application of ultrasonics reduces the initial settlement velocity of the solid–liquid interface of the UTS, that is, the velocity in the initial settlement stage.
Figure 11.
The overall average settling velocity and initial settling velocity under different ultrasonic powers.
The initial settlement velocities under different power levels are lower than those under free settlement, while the overall average velocities, except for the case with 50 W, are higher than those under free settlement. This can be explained by the combined effects of the acoustic streaming effect and the vibration effect of ultrasonics. Specifically, the acoustic streaming effect caused by ultrasonics generates an upward jet flow, which slows down the settlement velocity of the solid–liquid interface of the UTS. At the same time, under the vibration effect of ultrasonics, water molecules in the pores of coarse-grained unclassified tailings at the bottom are discharged, resulting in the formation of a drainage fault in the bottom slurry. When the solid–liquid interface reaches this drainage fault, a significant settlement occurs, thereby increasing the overall thickening effect and the average velocity.
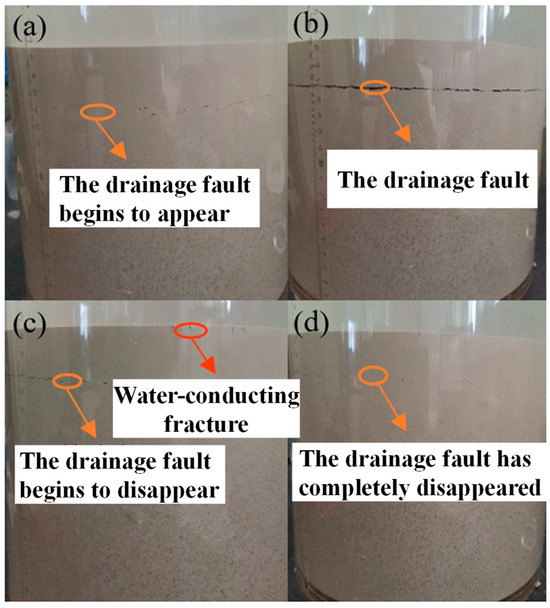
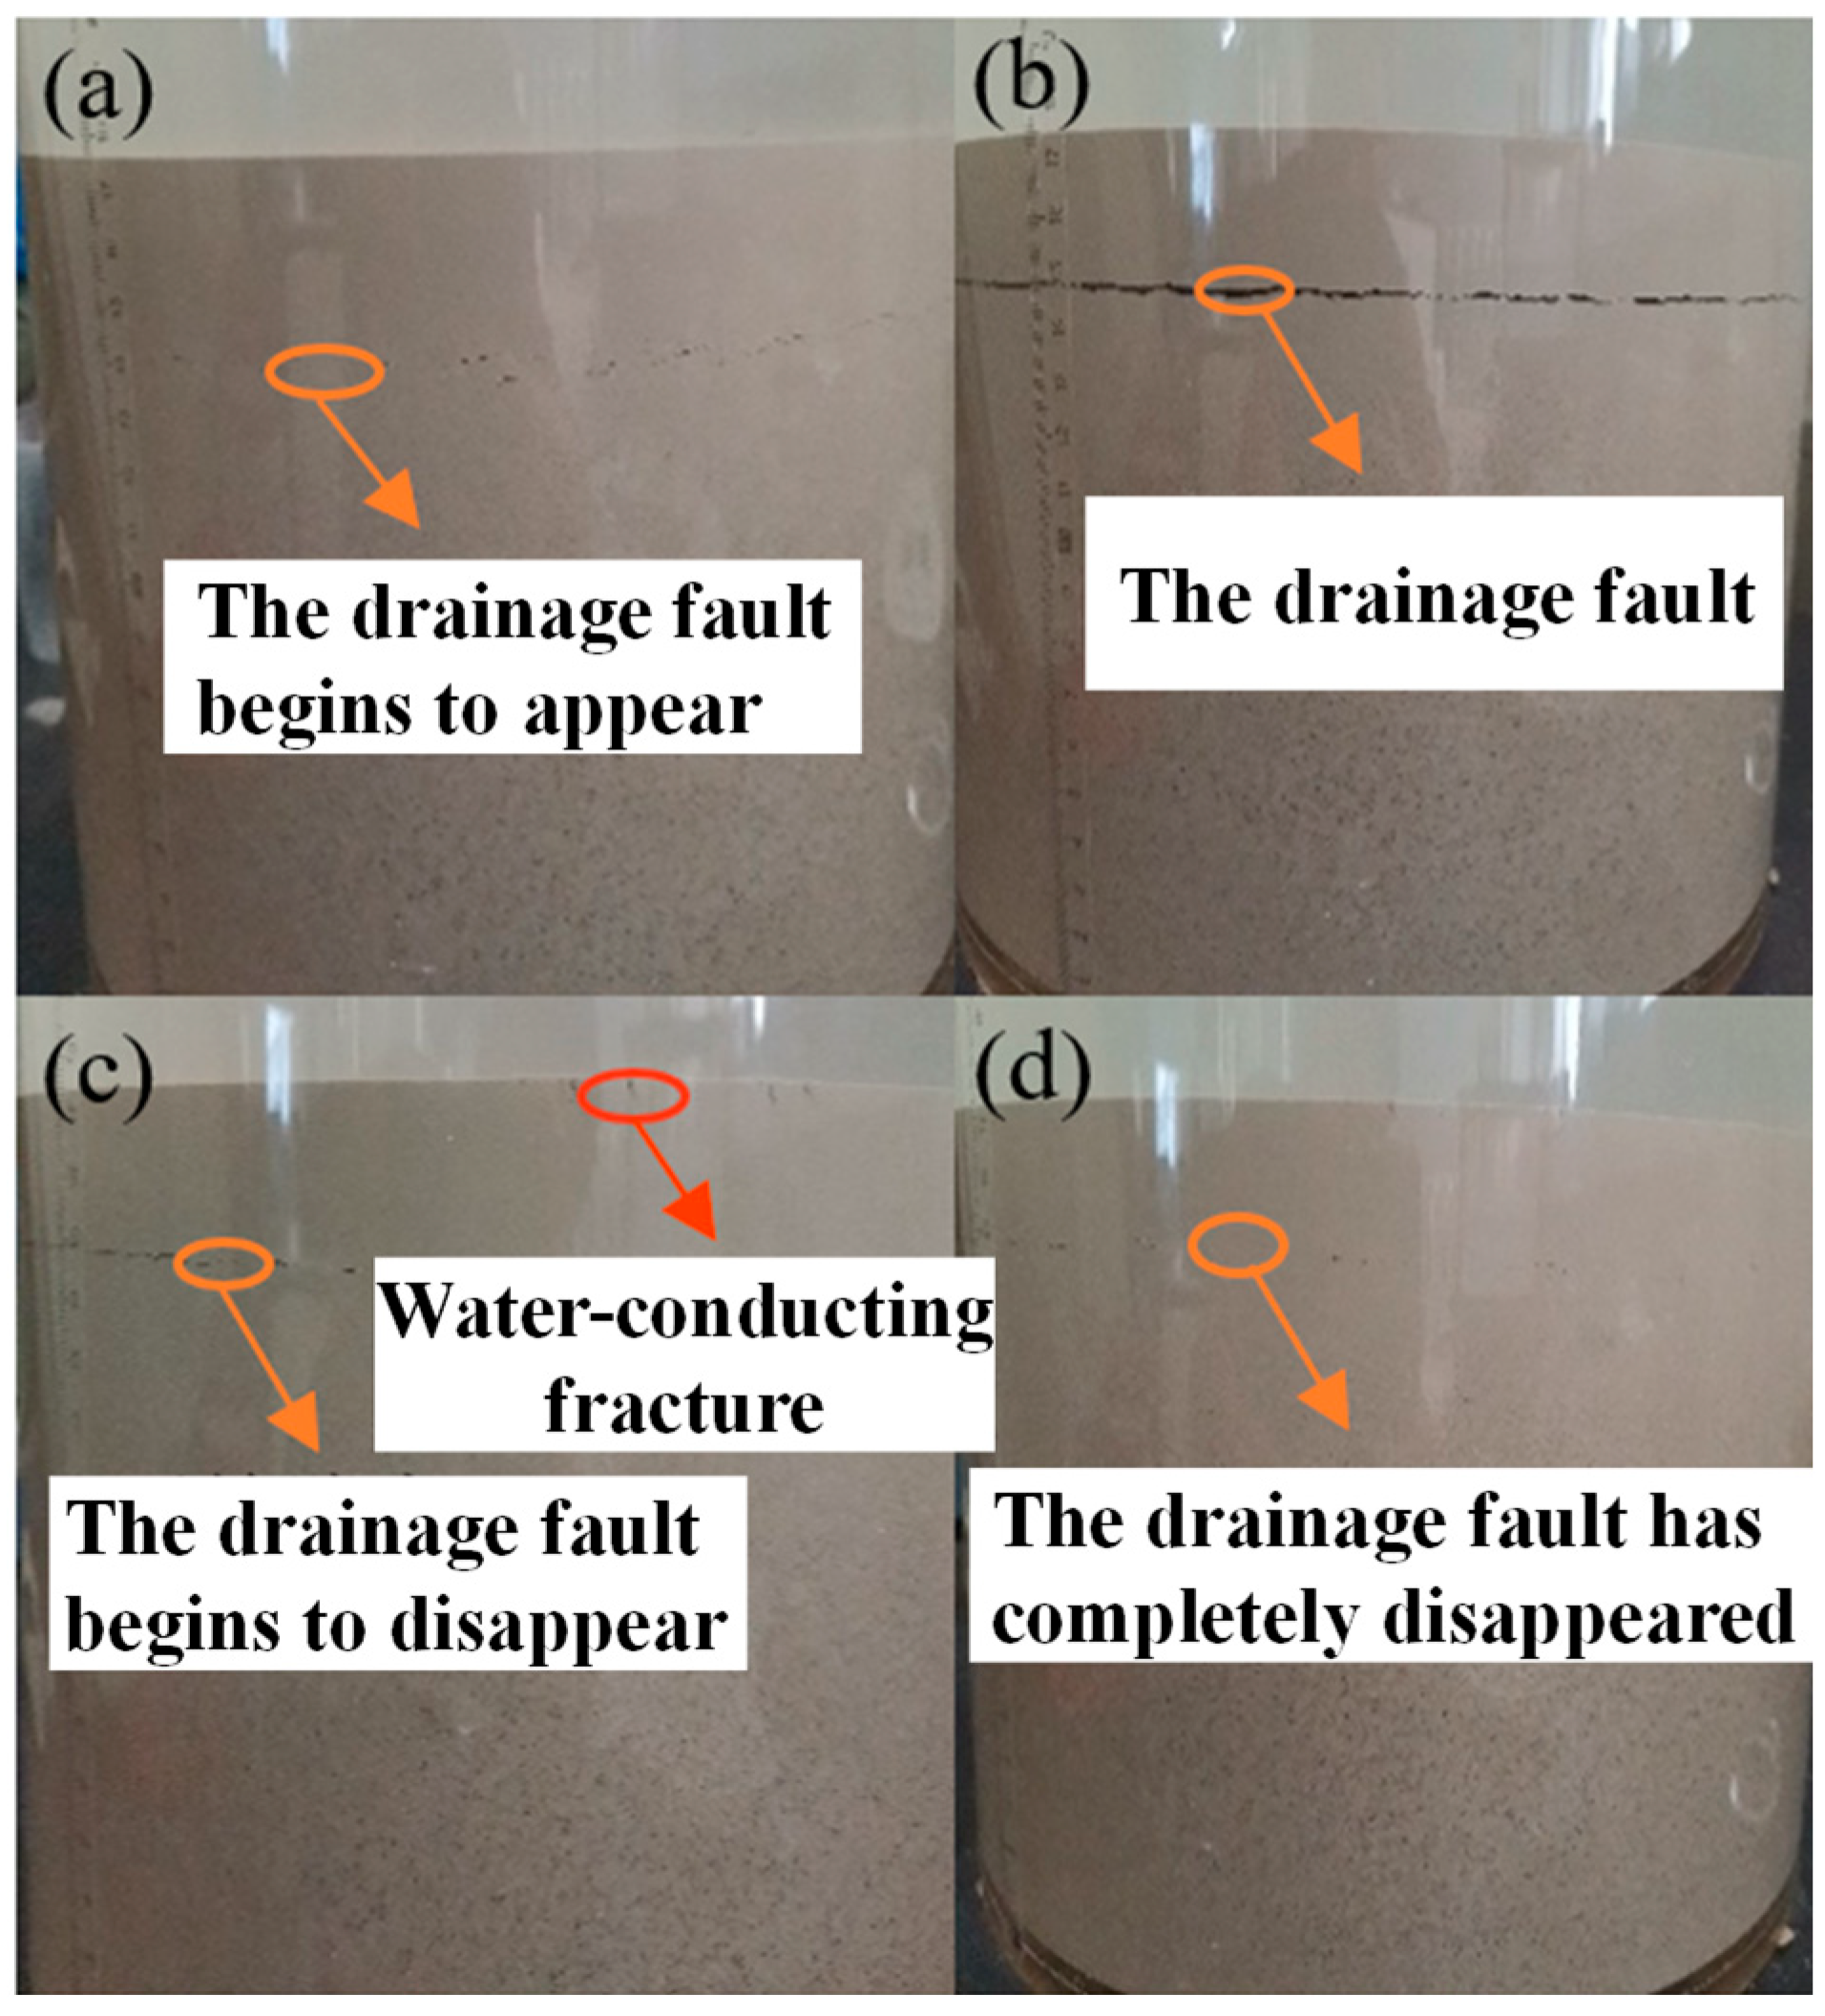
In sedimentation experiments of tailings slurry under ultrasonic influence (particularly at medium-to-high power levels), we repeatedly observed the macroscopic phenomenon of distinct “drainage faults” forming within the bottom slurry mass. This provides intuitive, repeatable, and direct visual evidence for the mechanism of “drainage channel formation” described in the explanation. Relevant photographs, as shown in Figure 12, corroborate that this physical process indeed occurs.
Figure 12.
Process of drainage fault formation in tailings slurry following ultrasonic application. (a) The drainage fault begins to appear; (b) The drainage fault; (c) Water-conducting fracture, The drainage fault begins to disappear; (d) The drainage fault has completely disappeared.
This explanatory framework maintains logical coherence with the data throughout the paper. The general reduction in initial velocity aligns with the inference that “acoustic streaming generates upward flow”; conversely, the increase in average velocity and the rise in final concentration at optimal power (Section 3.2.2) correspond to the anticipated outcome that “vibratory effects promote drainage and compaction”. The variation in effects across different power levels further supports the fundamental physical principle that effect intensity depends on the magnitude of energy input.
In summary, this discussion is directly supported by observable experimental phenomena and aligns with the overall data trends of the study. While we acknowledge that quantitative, in situ measurements of the acoustic flow field and micro-scale pore water discharge represent future avenues for refinement, the current interpretation based on macroscopic phenomena and data logic provides a reasonable and verifiable physical mechanism for the observed power effect.
3.4. Underflow Concentration Under the Action of Ultrasonics of Different Powers
3.4.1. The Underflow Concentration Varies with Time
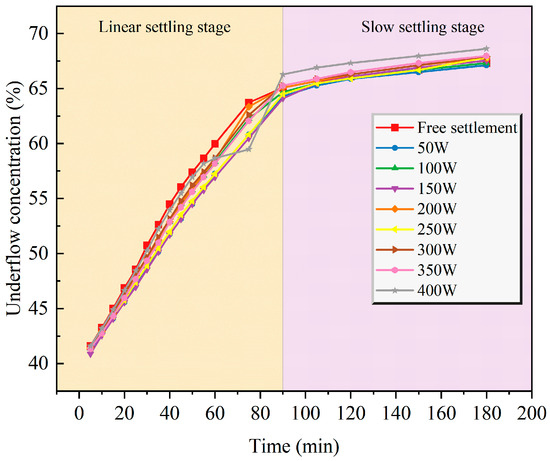
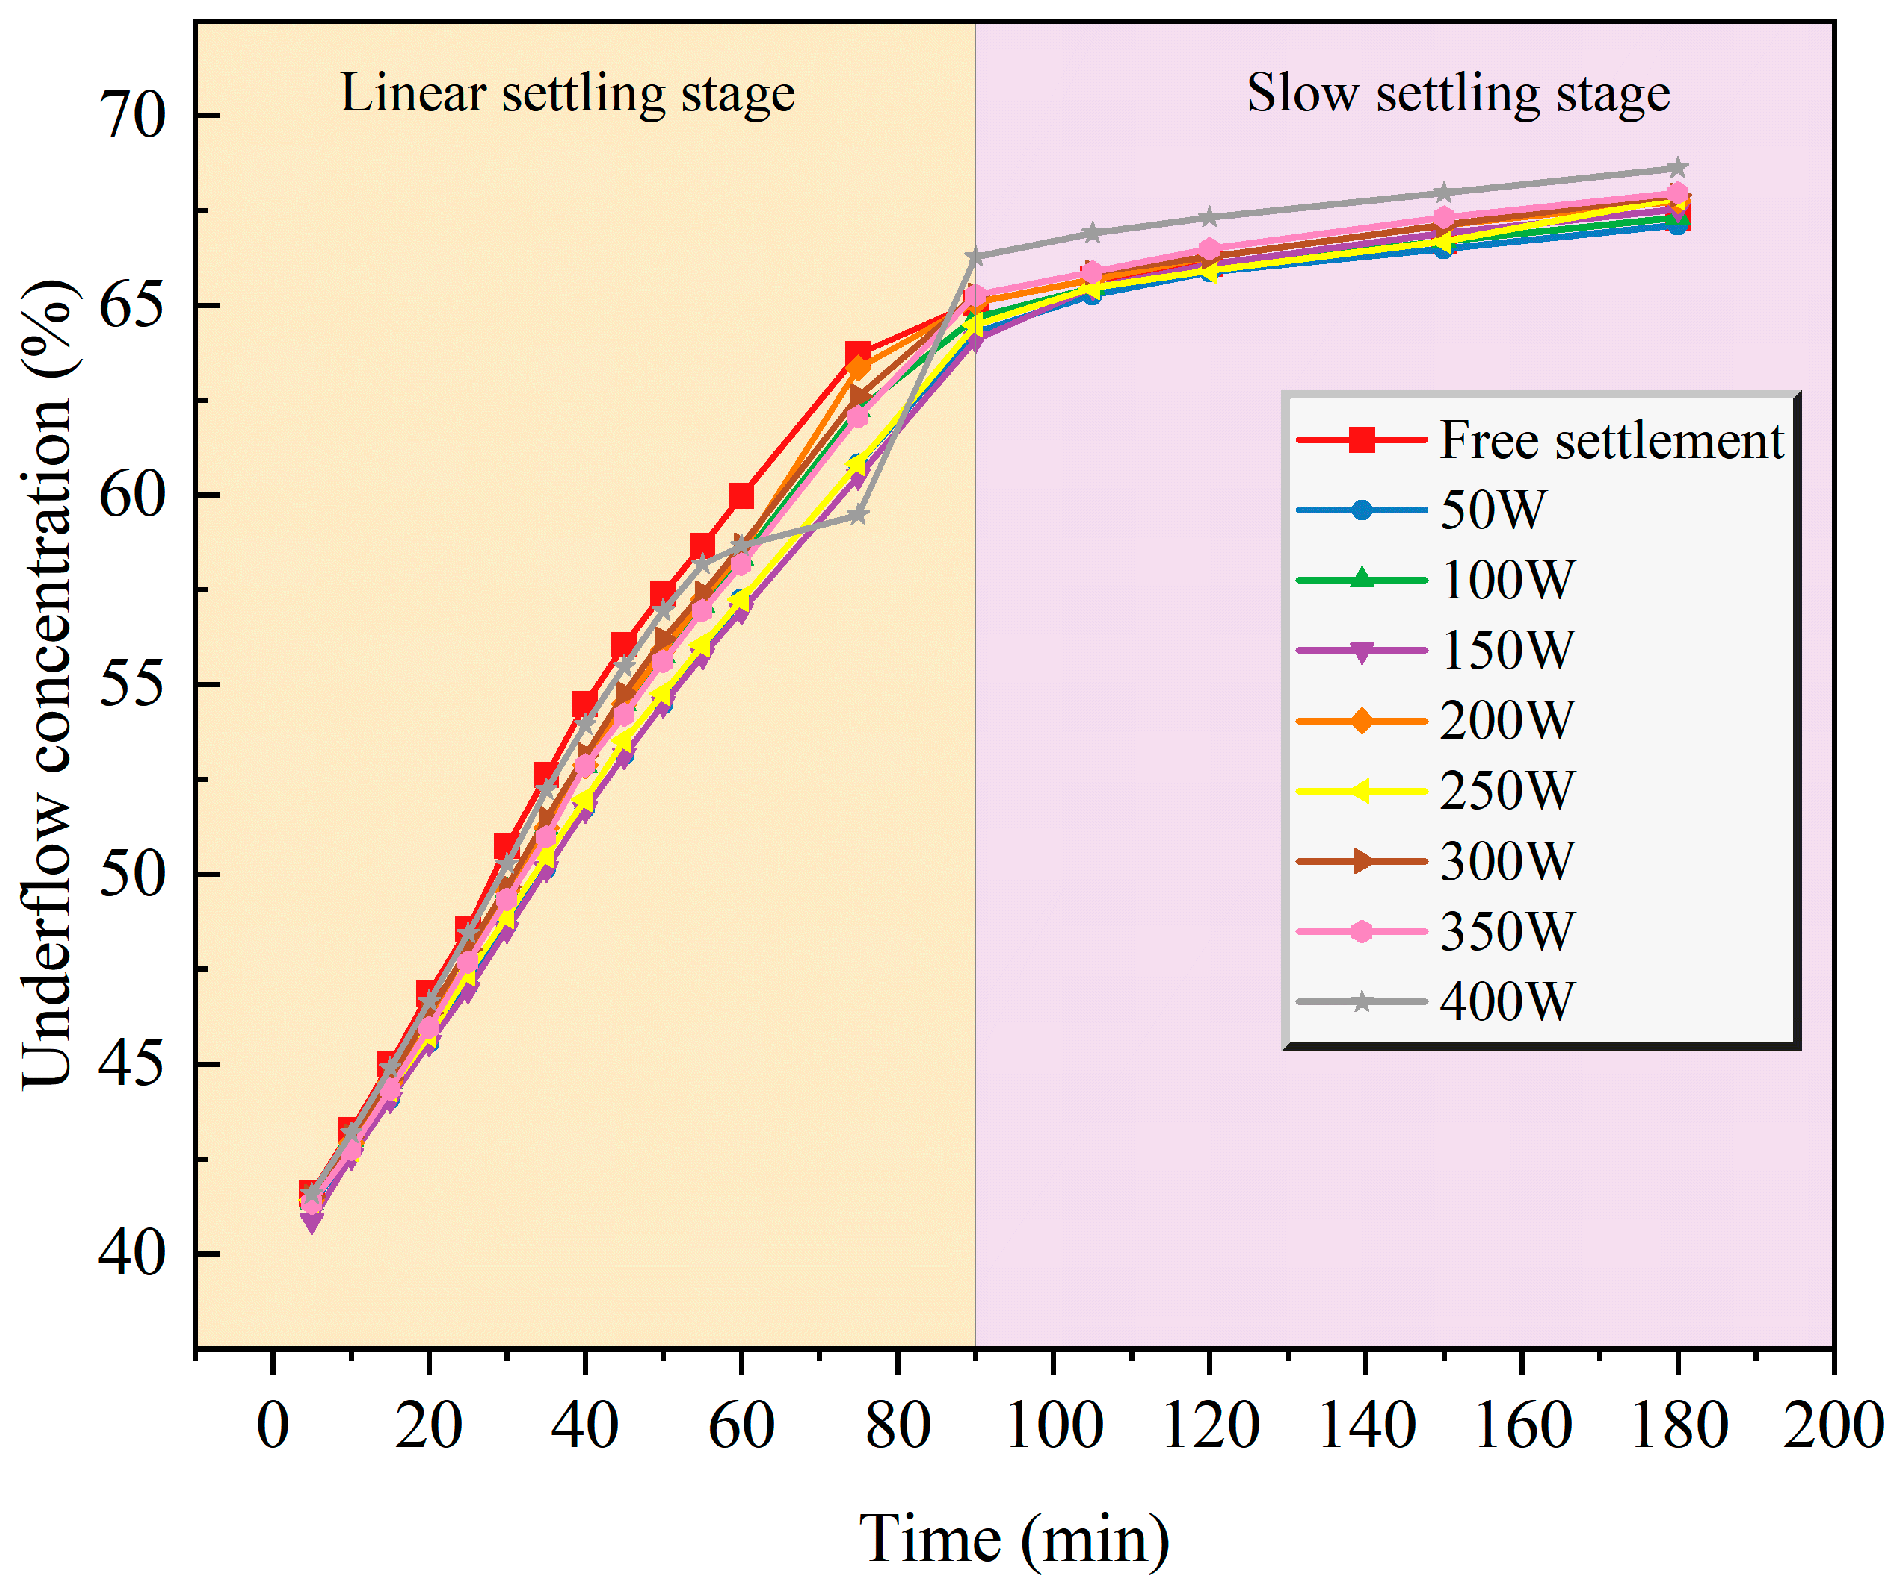
Figure 13 presents the time-varying curves of underflow concentration obtained by applying ultrasonic concentrators with a frequency of 20 kHz and different powers (50 W, 100 W, 150 W, 200 W, 250 W, 300 W, 350 W, and 400 W) for 5 min after 5 min of free settlement of UTS.
Figure 13.
Graph of the variation in underflow concentration with time under the action of ultrasonics of different powers.
It can be observed that the time-varying curves of underflow concentration of UTS under the action of ultrasonic concentrators with different powers are similar to those under ultrasonic application at different moments, both of which can be divided into two stages: a “linear settling stage” and a “slow settling stage”. Notably, the time-varying curve of underflow concentration of UTS under the action of an ultrasonic concentrator with a power of 400 W shows a “linear settling stage” within 0–60 min, during which its underflow concentration is lower than that under free settlement. However, the final underflow concentration of unclassified tailings under the action of the 400 W ultrasonic concentrator is higher than that under free settlement. This is attributed to the occurrence of a “large settlement” between the 75th and 90th minutes of the settlement process. This phenomenon may be caused by the existence of a “drainage fault” in the interface position corresponding to this settlement moment, i.e., between 18.6 and 20.2 cm.
3.4.2. Final Underflow Concentration Under Different Powers
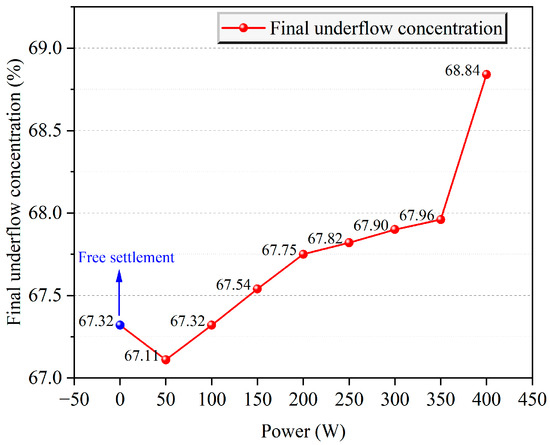
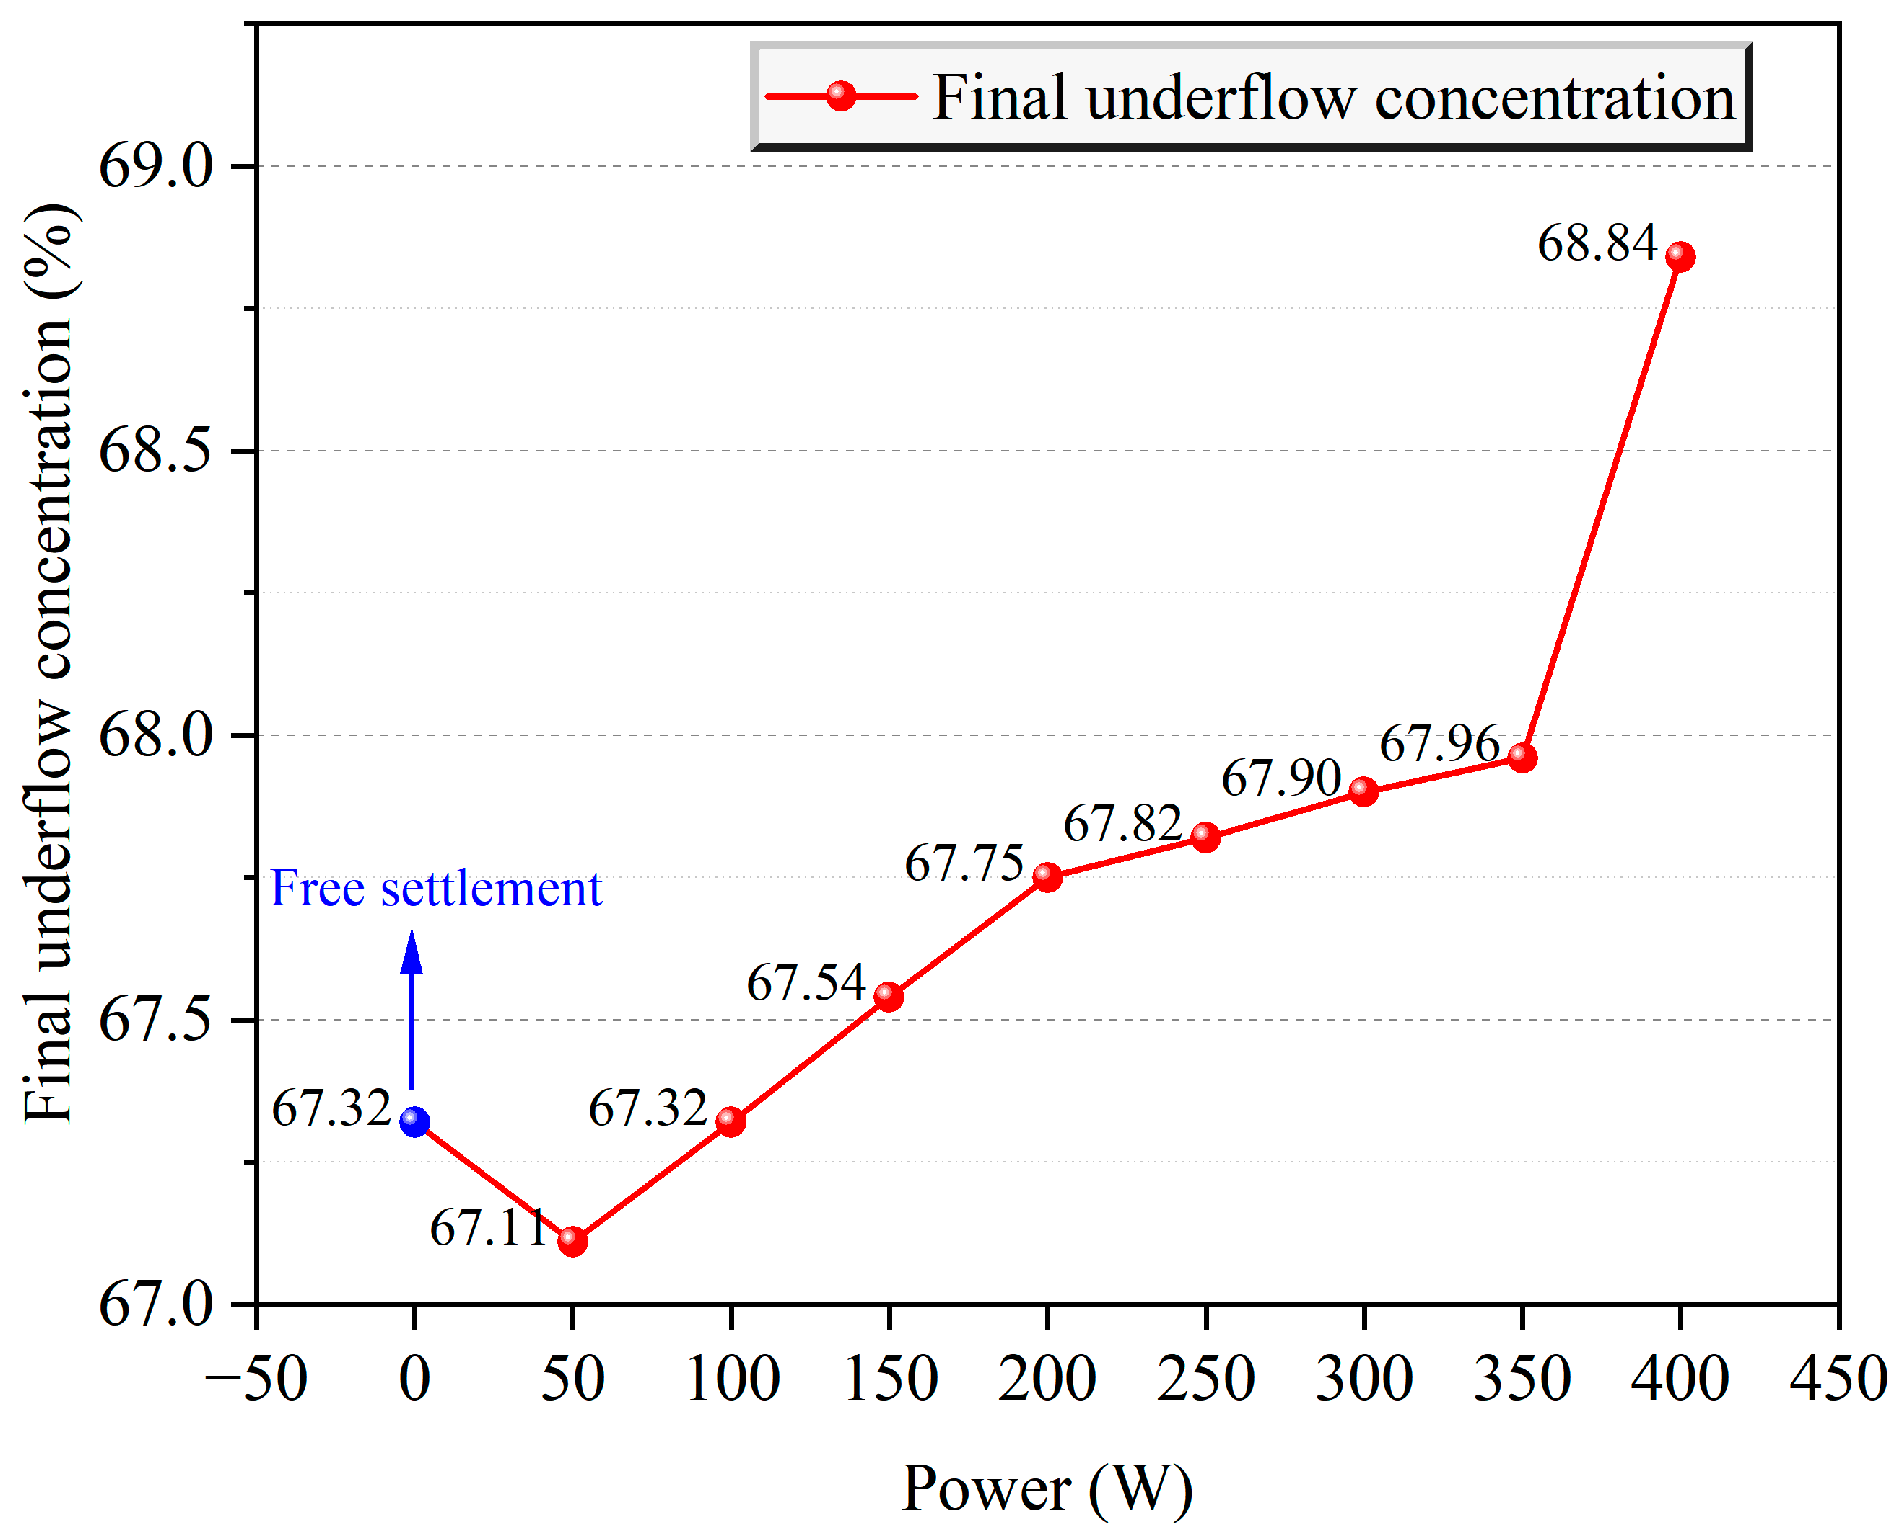
Figure 14 depicts the curve of the final underflow concentration of UTS as a function of power. It can be observed that the final underflow concentration, achieved by applying ultrasonics for 5 min after 5 min of free settlement of UTS under ultrasonic concentrators with different powers, increases consistently with the increase in power. Furthermore, the underflow concentration after 3 h of free settlement is higher than that when ultrasonics with a power of 50 W are applied at the 5th minute. This suggests that applying ultrasonics does not necessarily enhance the final underflow concentration of UTS. In practical production, selecting an appropriate power is essential to both promote the thickening and settling of UTS and reduce mine filling costs.
Figure 14.
The final underflow concentration of the UTS under different powers.
3.5. Mechanism of Ultrasonic-Driven Tailings Dewatering and Thickening
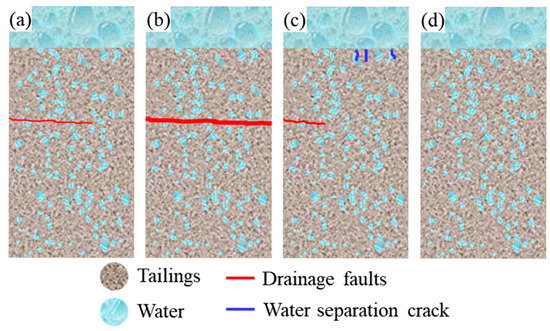
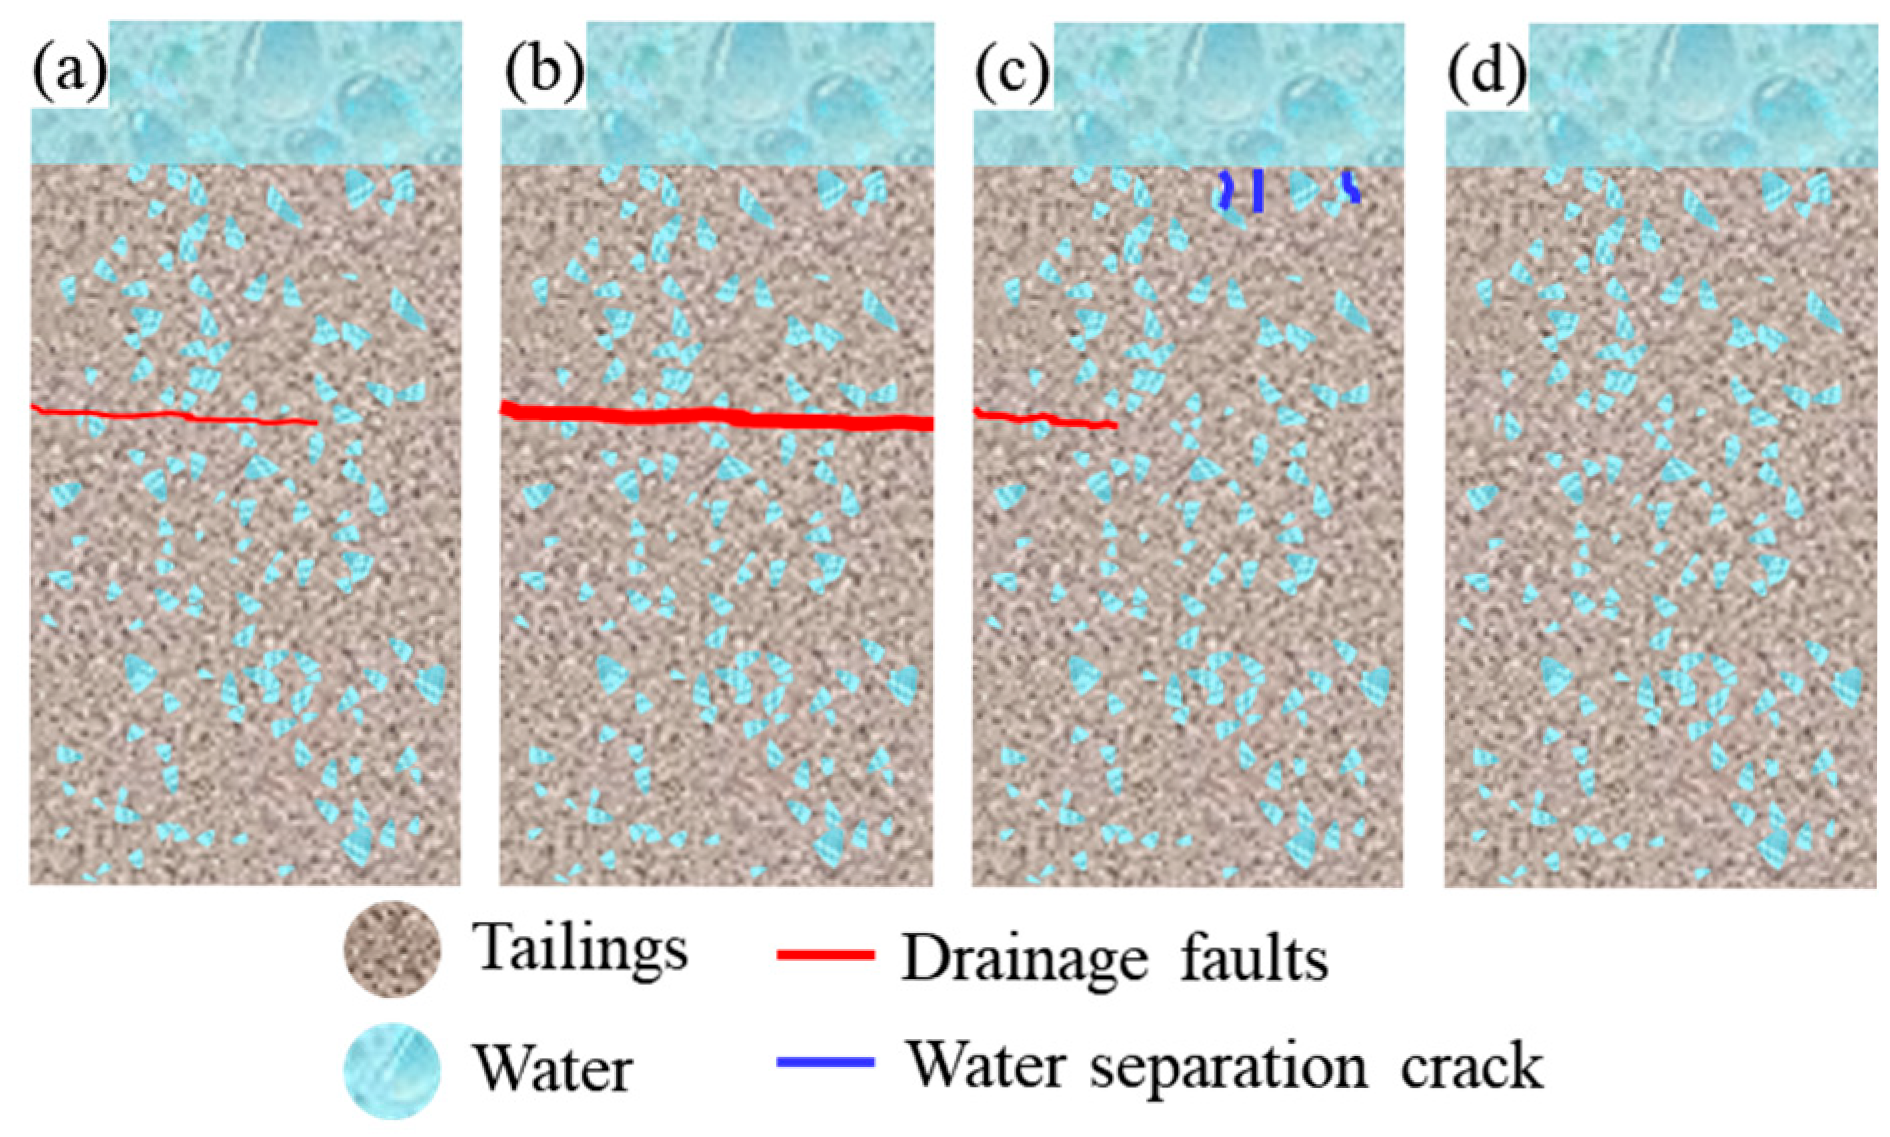
The formation and evolution of drainage faults are jointly driven by the dynamic response of tailings particles and water under ultrasonic energy and the spatial boundary effect of energy propagation. As elucidated with reference to Figure 15, the mechanism is as follows.
Figure 15.
Drainage fault fracture diagram: (a) begins to appear; (b) fracture width is the maximum; (c) begins to disappear; (d) completely disappears.
When ultrasonics are applied to the tailings system, the ultrasonic energy forces the water between tailings particles to surge upward continuously, making the tailings particles gradually compact. Owing to the limited propagation range of ultrasonic energy, its influence attenuates significantly at a certain radial parallel plane. With this plane as a boundary, the compaction processes of the upper and lower tailings layers diverge, giving rise to the initial drainage faults (Figure 15a). As the water between tailings particles at the lower end of the fault is continuously discharged upward through the fissures, the width of the fissures increases gradually (Figure 15b) until a temporary mechanical equilibrium is achieved between water migration and particle forces.
After the ultrasonic application stops, the upward movement of water between tailings particles does not cease immediately. The continuous water migration breaks the original mechanical equilibrium of the fault, causing the drainage fault to contract gradually (Figure 15c). During the instantaneous closure of the fault, collisions occur between the upper and lower tailings particles, and the instantaneous energy from these collisions induces water separation cracks in the upper part of the fissures. Eventually, the drainage fault disappears completely (Figure 15d), and the tailings become denser due to the sufficient discharge of water, resulting in the decline of the overall solid–liquid interface and an increase in underflow concentration.
In conclusion, the entire “formation–expansion–contraction–closure” process of drainage faults is a dynamic mechanical process driven by ultrasonically induced directional water migration, particle compaction, and energy boundary effect, accompanied by the generation of water separation cracks and the improvement of tailings concentration.
4. Conclusions
The main conclusions drawn from this study are as follows:
(1) The application time significantly affects the settlement velocity of the solid–liquid interface of UTS, with the optimal overall settlement velocity achieved at the fifth minute of free settlement, and the velocity being lower than that of free settlement in the early stage (0–45 min) but higher in the later stage (50–105 min).
(2) Only ultrasonic application at the 5th and 10th minutes of free settlement improves the thickening effect of UTS (with the 5th minute being the best), and the underflow concentration increases continuously in two stages (linear settling: 0–90 min; slow settling: 90–180 min).
(3) The settling velocity of the UTS first decreased and then increased; the overall average settlement velocity rises with increasing power (except 50 W), while all powers reduce the initial settlement velocity compared to free settlement.
(4) The underflow concentration of UTS shows a two-stage variation under different powers; the final underflow concentration increases with power, and the 400 W group achieves a higher final concentration due to “large settlement” caused by drainage faults.
(5) The “formation–expansion–contraction–closure” process of drainage faults in UTS is jointly driven by ultrasonic-induced directional water migration, particle compaction, and energy boundary effect.
Author Contributions
Conceptualization, L.Z. and W.L.; methodology, L.Z., Z.W. and J.Z.; software, Z.W., J.Z. and Z.L.; validation, L.Z. and K.W.; investigation, Z.W., J.Z., X.Q. and P.L.; resources, L.Z., P.Y., X.Q., P.L. and W.L.; data curation, Z.W. and J.Z.; writing—original draft, L.Z., J.Z. and Z.W.; writing—review and editing, L.Z., Z.W., J.Z. and K.W.; visualization, L.Z.; supervision, P.Y. and W.L.; project administration, L.Z.; formal analysis, L.Z. and Z.W.; funding acquisition, L.Z. All authors have read and agreed to the published version of the manuscript.
Funding
This project was supported by Deep Earth Probe and Mineral Resources Exploration—National Science and Technology Major Project of China (2025ZD1010905), the China National Postdoctoral Program for Innovative Talents (BX20240036), the China Postdoctoral Science Foundation (2025M771817), and the International Exchange and Development Program for Young Teachers at the University of Science and Technology of Beijing (QNXM20250044).
Data Availability Statement
Data will be made available upon request.
Conflicts of Interest
Authors Xiaofei Qiao and Penglin Lang were employed by Inner Mongolia Shandong Gold Changtai Mining Co., Ltd. The remaining authors declare that the research was conducted in the absence of any commercial or financial relationships that could be construed as a potential conflict of interest.
References
- Dong, H.Z.; Aziz, N.A.; Mohd Shafri, H.Z.; Bin Ahmad, K.A. Computational fluid dynamics study on cemented paste backfill slurry: Review. Constr. Build. Mater. 2023, 369, 130558. [Google Scholar] [CrossRef] [Scilit]
- He, W.; Liu, L.; Wei, B.N.; Wang, R.F.; Fang, Z.Y.; Qu, H.S.; Zhuang, D.D.; Gao, Y.H.; Xia, L.; Wang, Z.H. Study on mechanical properties and toughness characteristics of fiber reinforced storage backfill after carbonation curing. Structures 2025, 77, 108996. [Google Scholar] [CrossRef] [Scilit]
- Yin, S.H.; Zeng, J.L.; Yan, Z.P.; Wang, L.M.; Chen, W.; Chen, D.P.; Yang, J. Damage constitutive models and damage evolution of cemented tailings and waste-rock backfill under impact loading. Constr. Build. Mater. 2025, 460, 139838. [Google Scholar] [CrossRef] [Scilit]
- Zhu, L.Y.; Yang, P.; Lyu, W.S.; Wang, Q.X.; Wang, K. Electrochemical Corrosion Characteristics of 316L Stainless Steel in Simulated Coastal Gold Mine Wastewater under Different pH. Int. J. Electrochem. Sci. 2022, 17, 22099. [Google Scholar] [CrossRef] [Scilit]
- Yang, J.; Yang, X.B.; Yin, S.H.; Zhang, X.Z.; Li, G.C.; Chen, X.; Qi, Y.B. Damage characteristics and constitutive model of magnesium slag-based cemented backfill based on energy dissipation. Constr. Build. Mater. 2024, 449, 138443. [Google Scholar] [CrossRef] [Scilit]
- Yin, S.H.; Yan, Z.P. The effect of coarse aggregate on the bleeding and mechanical properties of cemented paste backfill. J. Cent. South Univ. 2023, 30, 555–567. [Google Scholar] [CrossRef] [Scilit]
- Yin, S.H.; Yan, Z.P.; Chen, X.; Yan, R.F.; Chen, D.P.; Chen, J.W.; Li, G.C. Active roof-contact: The future development of cemented paste backfill. Constr. Build. Mater. 2023, 370, 130657. [Google Scholar] [CrossRef] [Scilit]
- Wang, K.; Yang, P.; Yu, G.M.; Yang, C.; Zhu, L.Y. 3D Numerical Modelling of Tailings Dam Breach Run Out Flow over Complex Terrain: A Multidisciplinary Procedure. Water 2020, 12, 2538. [Google Scholar] [CrossRef] [Scilit]
- Wang, L.M.; Cheng, L.; Yin, S.H.; Chen, J.W. Flocculation, dewatering and sedimentation behaviour of mine backfill slurry in deep cone thickener (DCT). J. Environ. Chem. Eng. 2024, 12, 112168. [Google Scholar] [CrossRef] [Scilit]
- Zhu, L.; Lyu, W.; Yang, P.; Wang, Z. Effect of ultrasound on the flocculation-sedimentation and thickening of unclassified tailings. Ultrason. Sonochem. 2020, 66, 104984. [Google Scholar] [CrossRef] [Scilit] [PubMed]
- Lyu, W.; Zhu, L.; Yang, P.; Lin, Z.; Wang, Z.; Wang, K. Corrosion Behavior of Steel Rebar in Cemented Tailings Backfill in Brine. Int. J. Electrochem. Sci. 2021, 16, 210367. [Google Scholar] [CrossRef] [Scilit]
- Zhu, L.; Wang, K.; Wang, Z.; Lyu, W.; Yang, P. Rheology of ultrafine tailings cemented paste backfill: The effect of the aqueous solution pH and superplasticiser dosage. Constr. Build. Mater. 2023, 404, 133270. [Google Scholar] [CrossRef] [Scilit]
- Wen, Z.; Yang, X.; Li, L.; Gao, Q.; Wang, Z. Selection and optimization of flocculation sedimentation parameters of unclassified tailings slurry based on RSM-BBD. Chin. J. Nonferrous Met. 2020, 30, 1437–1445. [Google Scholar]
- Yin, S.; Hou, Y.; Yang, S.; Chen, X. Study on static and dynamic flocculation settlement characteristics of fine tailings slurry and influence of flocculant on strength of fine tailings backfill. Case Stud. Constr. Mater. 2022, 17, e01525. [Google Scholar] [CrossRef] [Scilit]
- Wang, D.-L.; Zhang, Q.-L.; Chen, Q.-S.; Qi, C.-C.; Feng, Y.; Xiao, C.-C. Temperature variation characteristics in flocculation settlement of tailings and its mechanism. Int. J. Miner. Metall. Mater. 2020, 27, 1438–1448. [Google Scholar] [CrossRef] [Scilit]
- Zhu, L.; Lyu, W.; Mao, X.; Zhao, Z.; Yang, D.; Zhang, H.; Wang, K.; Yang, P.; Zeng, H. Effect of solution pH and polyethylene oxide concentration on surface/interface properties, flocculation and rheology of concentrated monodisperse ultrafine synthetic tailings slurry. Powder Technol. 2023, 430, 119002. [Google Scholar] [CrossRef] [Scilit]
- Vikulina, V.; Vikulin, P. Effect of ultrasound on sedimentation of suspended solids in water. In Proceedings of the 21st International Scientific Conference on Advanced in Civil Engineering Construction—The Formation of Living Environment (FORM), Moscow, Russia, 25–27 April 2018. [Google Scholar]
- Peng, L.; Zhao, C. Multiphysics-Coupled Simulation of Ultrasound-Assisted Tailing Slurry Sedimentation. Materials 2025, 18, 3430. [Google Scholar] [CrossRef] [Scilit] [PubMed]

Disclaimer/Publisher’s Note: The statements, opinions and data contained in all publications are solely those of the individual author(s) and contributor(s) and not of MDPI and/or the editor(s). MDPI and/or the editor(s) disclaim responsibility for any injury to people or property resulting from any ideas, methods, instructions or products referred to in the content. |
© 2026 by the authors. Licensee MDPI, Basel, Switzerland. This article is an open access article distributed under the terms and conditions of the Creative Commons Attribution (CC BY) license.