


Abstract
To investigate the fatigue performance of a novel green low-carbon steel–AAUHPC (Alkali Activated Ultra-high Performance Concrete, AAUHPC) composite bridge deck and achieve its structural optimization, this paper proposes a steel–AAUHPC composite bridge deck structure featuring double-sided welding of U-shaped ribs. Firstly, the numerical model of a symmetrical composite bridge deck is established by ABAQUS finite element software. The stress response of key fatigue structural details is analyzed, and the fatigue life is evaluated based on the S-N curve method. At the same time, the calculation results are compared with the orthotropic steel bridge deck and the steel–UHPC composite bridge deck. Secondly, the CCD method and RSM method are used to construct a mathematical regression model with the structural weight W per unit area and the fatigue stress amplitude of key details as the target. Finally, NSGA-III is used to optimize structural parameters such as AAUHPC thickness, top plate thickness, diaphragm thickness and spacing to obtain the Pareto-optimal solution set. The results show that the AAUHPC material has both environmental protection and excellent mechanical properties, and its compressive and splitting tensile strength is significantly higher than that of ordinary concrete, which is close to the UHPC level. The steel–AAUHPC composite bridge deck can significantly improve the fatigue performance of the orthotropic steel bridge deck. After laying the AAUHPC layer, the stress amplitude of each fatigue detail decreases, and the C1 detail decreases by up to 69.4%. Except for the C6 detail, the rest of the structural details meet the infinite-life design criteria, and the overall improvement effect is comparable to that of the steel–UHPC composite bridge deck. The constructed response surface model has good prediction accuracy. The optimization results show that the fatigue stress amplitude and the structural weight W are mutually restricted. Among the 15 sets of Pareto-optimal solutions obtained, solution U8 achieves weight minimization under the premise of satisfying the infinite-fatigue-life criterion. The optimal parameter combination is: AAUHPC thickness of 40 mm, top plate thickness of 10 mm, diaphragm thickness of 16 mm, and diaphragm spacing of 2400 mm. The research results can provide a theoretical basis for the fatigue design and engineering application of a new green steel–AAUHPC composite bridge deck.
1. Introduction
The orthotropic steel bridge deck has the advantages of light weight, high bearing capacity and strong spanning ability, and it is widely used in various long-span steel structure bridges. However, this kind of structure has many welds; the stress characteristics and the connection structure of the plate are very complicated. It is prone to fatigue cracking under vehicle loading, and a large number of bridge fatigue cracking cases have appeared, so it has become a difficult problem in design [1,2,3,4].
The main reasons for the fatigue failure of steel bridge decks are the insufficient fatigue strength of materials and the insufficient local stiffness of structures. Therefore, the methods to solve such problems can be roughly divided into two categories, namely, the strength method and the stiffness method. The strength method focuses on improving the fatigue resistance of the material itself, such as the use of high-toughness steel, the full penetration of U-rib double-sided fillet welds, and the use of edged U-ribs. Restricted by past technology, most existing steel bridges adopt a single-sided welding process, which is prone to cracking under the continuous action of vehicle loading. Cracks in the root and roof of the weld will not only affect the bridge deck pavement layer but also allow sludge to flow into the steel box girder through the cracks. Traditional single-sided welding also has problems such as insufficient weld penetration or unqualified weld quality, which will lead to initial defects at the root of the weld, crack initiation and subsequent fatigue strength reduction [5,6].
Since Sakano et al. [7] first introduced the double-sided welding process into the connection structure of the orthotropic steel bridge deck top plate and longitudinal ribs, domestic and foreign scholars have made a series of advances in the study of the double-sided welding structure of the top plate and longitudinal ribs [8,9,10,11]. Liu et al. [12] found that the maximum stress intensity factor of cracks in the double-sided welded joint of the longitudinal rib and the top plate is 29.6% smaller than that of the single-sided welded joint, which can effectively improve the fatigue performance of the welded joint of the longitudinal rib and the top plate. Heng et al. [13] carried out an experimental study on the fatigue performance of a thick-sided U-rib steel bridge deck and pointed out that the fatigue life of the thick-sided U-rib steel bridge deck was 105% higher than that of an equal-thickness U-rib steel bridge deck. Zhang et al. [1] carried out experimental and numerical simulation studies on the welding residual stress of double-sided welded joints in steel bridge decks. The study pointed out that the residual stress on the top plate and weld surface was greatly affected by the welding speed but was relatively less affected by the weld penetration rate, assembly gap and plate thickness. Li et al. [14] compared the fatigue failure mode and fatigue life of double-sided welded joints under different stress ranges and average stresses. The results show that the fatigue life of double-sided welded joints is more than 30% higher than that of single-sided welded joints.
Different from the strength method, the stiffness method mainly reduces the stress amplitude by improving the stress and deformation characteristics of the structure. The specific measures usually include increasing the thickness of the plate, optimizing the geometric structure, and adding stiffeners. Scholars have done a lot of research work on improving the stiffness of the steel bridge deck and have achieved remarkable results. Using a UHPC (ultra-high-performance concrete) layer as a pavement layer can reduce the stress concentration of key fatigue-vulnerable parts by increasing the stiffness of the bridge deck, thus significantly improving the fatigue cracking of the orthotropic steel bridge deck and the vulnerability of the bridge deck pavement [15,16,17]. Concrete is cheaper than steel, so composite bridge decks are widely used. However, Portland cement is the most widely used cementitious material in concrete, which causes huge energy consumption in the process of high-temperature production of cement [18,19]. According to a report on the status quo of global construction and the construction industry from 2024 to 2025, a UHPC layer can reduce the stress concentration of key fatigue-vulnerable parts by increasing the stiffness of the bridge deck. The construction and operation of buildings are still the main source of global CO2 emissions, accounting for 34% of total emissions. Global cement demand is expected to increase by 12~23% by 2050 [20]. Therefore, exploring a new type of cement material with low carbon and low energy consumption to replace traditional Portland cement has become an important issue in the field of materials. The use of alkali-activated materials can reduce the use of ordinary Portland cement and improve the recycling of industrial solid waste materials [21]. Existing research mainly focuses on the steel–UHPC composite bridge deck, but the UHPC material itself has high carbon emissions and high cost. Research on the fatigue performance of green low-carbon alternative materials in composite bridge decks has not been reported. The research methods for fatigue performance also need to be deepened. Most of the analysis is still limited to the influence of a single factor, and the fatigue response under the coupling of multiple parameters, such as the thickness of the paved layer, the thickness of the roof, and the thickness of the diaphragm, has not been comprehensively considered. Studies have shown that the sustainability of structures can be improved through innovative materials, durability enhancement, and optimization-based design [22].
In a previous study, the authors [23] used RHA (Rice Husk Ash) instead of slag and fly ash to prepare an environmentally friendly AAUHPC (alkali-activated ultra-high-performance concrete). Based on this, this paper innovatively proposes a steel–AAUHPC composite bridge deck with U-rib double-sided welding, which uses AAUHPC with green and low-carbon advantages instead of traditional concrete and UHPC for the orthotropic steel bridge deck. The finite element software ABAQUS 2019 was used to study the fatigue performance, and the fatigue performance of the orthotropic steel bridge deck and the steel–UHPC composite bridge deck was compared and analyzed to evaluate the fatigue life of the three bridge decks. The mathematical regression model of the target response was constructed by the RSM (response surface method), and the fatigue structural details were optimized by NSGA-III to determine the optimal steel–AAUHPC composite bridge deck structure, in order to provide theoretical guidance for bridge design.
2. Design of Steel–AAUHPC Composite Bridge Deck
2.1. Comparison of Mechanical Properties of Materials
Through the research of the author’s team, it was found that the AAUHPC in this paper has better comprehensive performance than other AAUHPCs and UHPC in terms of four indicators, carbon emissions, economy, energy and compressive strength [23], and its mechanical properties are shown in Table 1. In Table 1, the mechanical properties of NC (Normal Concrete), UHPC and AAUHPC are listed and compared. Among them, the mechanical properties of commonly used UHPC refer to the literature [24]. From the comparison in Table 1, it can be seen that although the elastic modulus of AAUHPC is close to that of NC, its compressive strength and splitting tensile strength are significantly higher than those of NC. The compressive strength is about 3 times that of NC, and the splitting tensile strength is about 4 times that of NC, which is close to the level of UHPC.
Table 1.
Comparison of mechanical properties of different concretes.
2.2. Design of Composite Bridge Deck
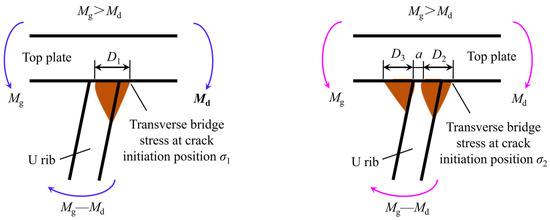
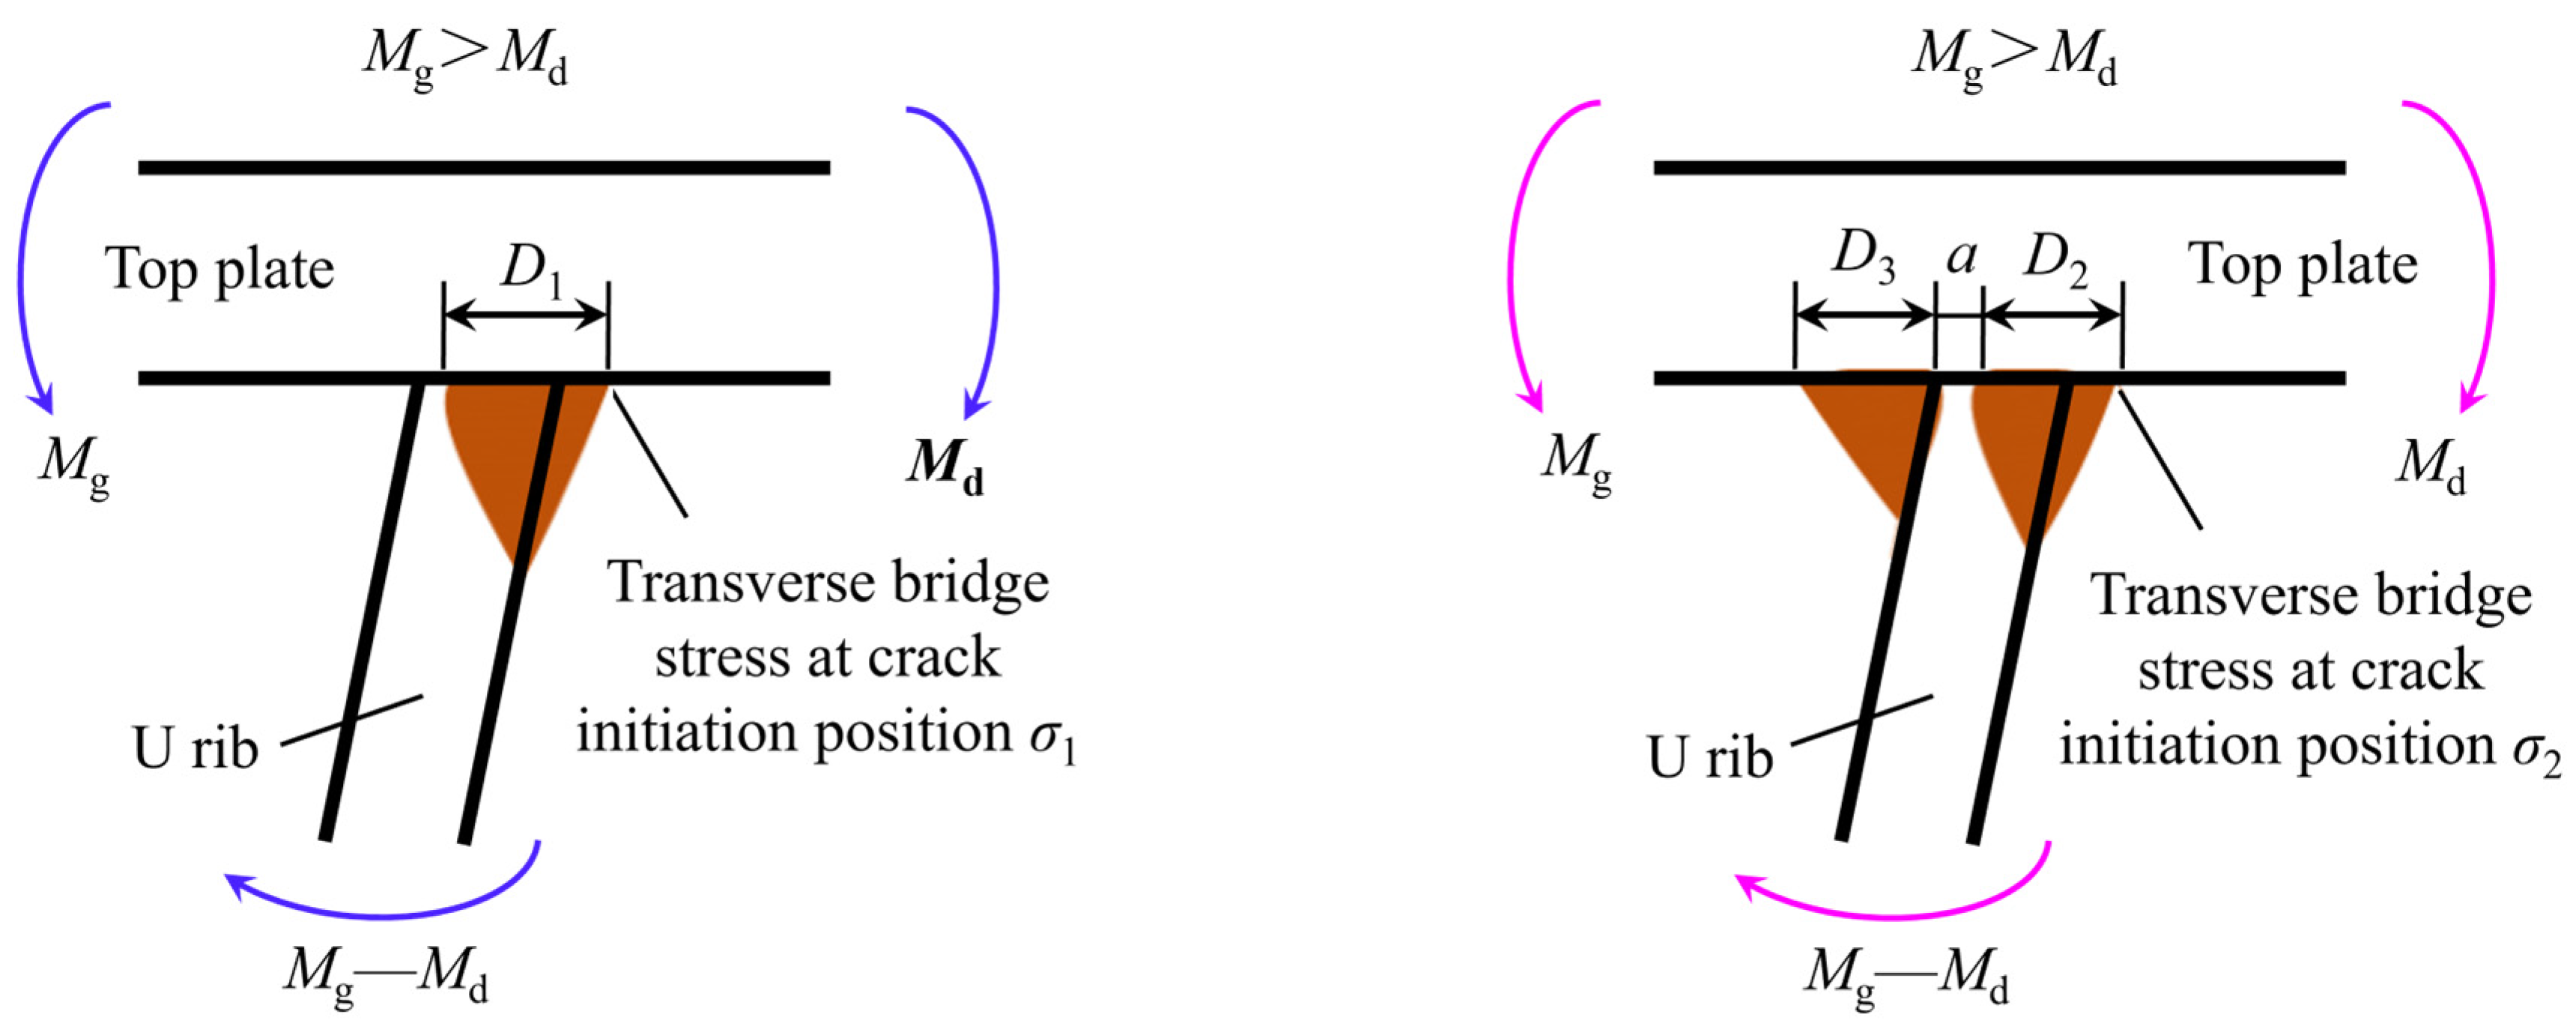
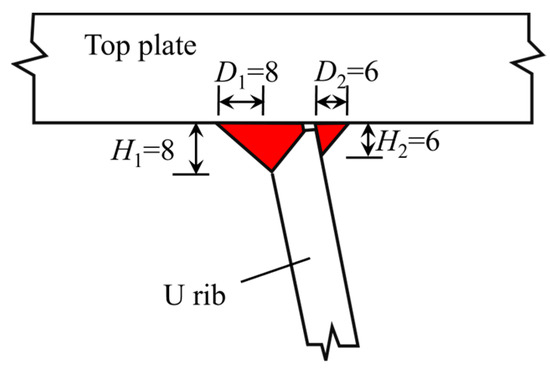
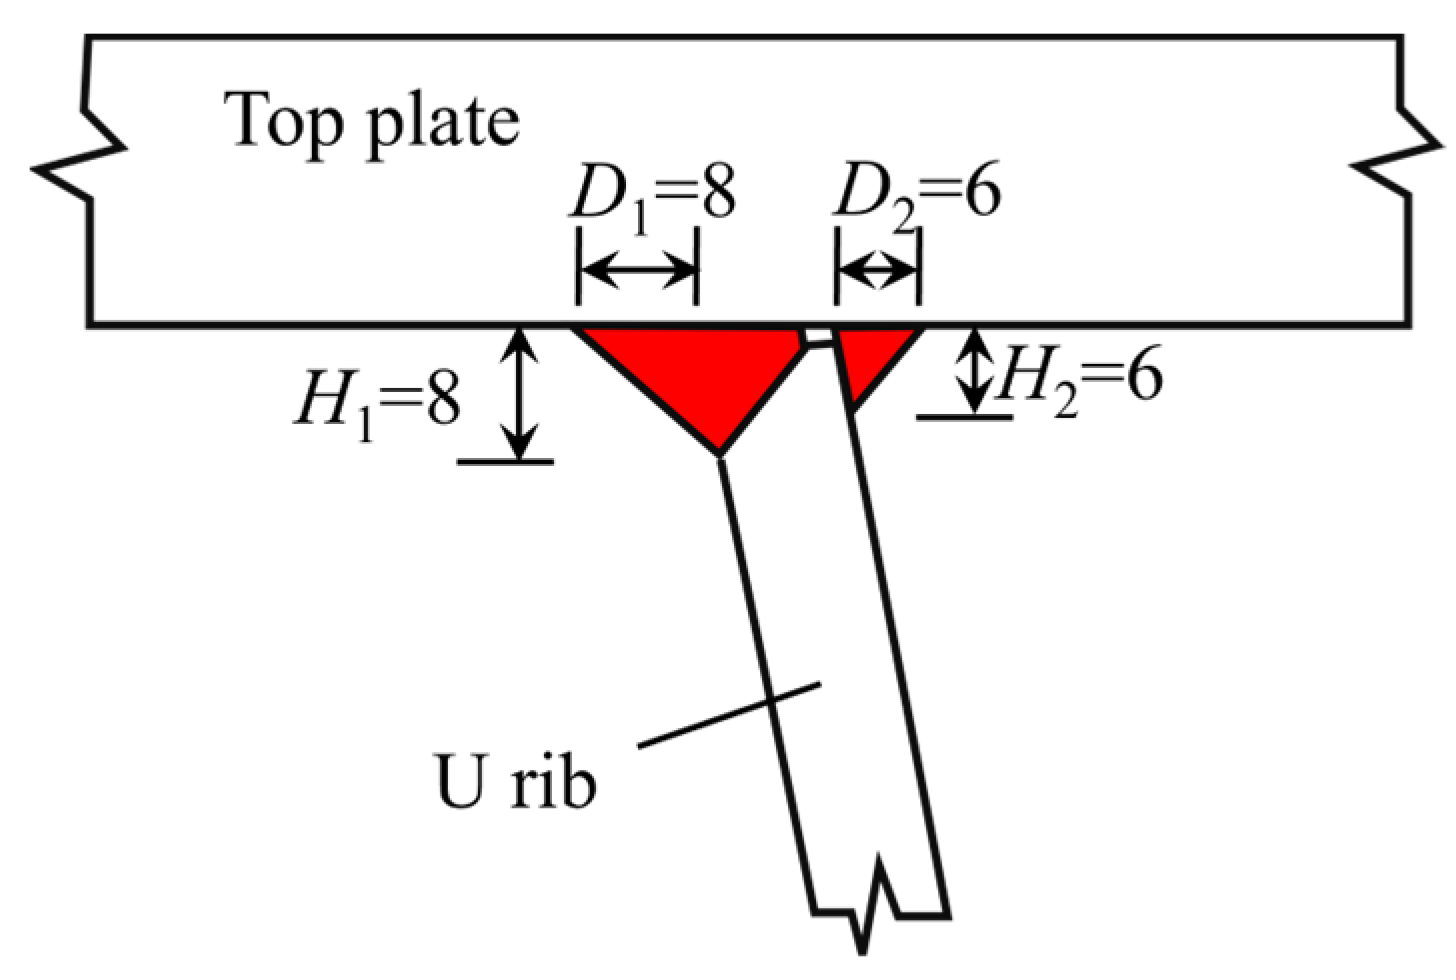
The stress analysis of single-sided welding and double-sided welding is shown in Figure 1. The tensile stress σ at the weld toe of the two U-rib fillet welds is shown in Equation (1). By comparing the forces of the two welding forms, it is found that D1 < 4D2 + D3; obviously, when double-sided welding is used, the D value is larger, so σ2 < σ1; that is, under the same wheel load, the tensile stress at the weld toe of the U-rib double-sided fillet weld bridge deck is significantly smaller than that of the U-rib single-sided fillet weld, which helps to improve fatigue resistance. Considering this, in the new bridge, the U-rib and the bridge deck adopt the double-sided welding process, which can effectively avoid weld root defects. In this paper, the closed U-rib steel–AAUHPC composite bridge deck adopts the U-rib double-sided welding design (as shown in Figure 2), the red part in Figure 2 indicates the weld. The outer weld sizes H1 and D1 are 8 mm, and the inner weld sizes H2 and D2 are 6 mm.
where M is torque; d is the equivalent arm.
Figure 1.
Stress analysis and comparison of single-sided welding and double-sided welding.
Figure 2.
Double-sided welding size design (units: mm).
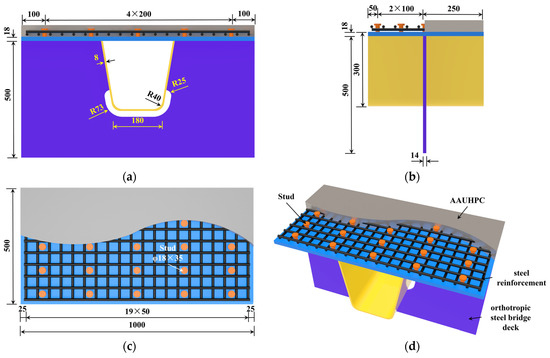
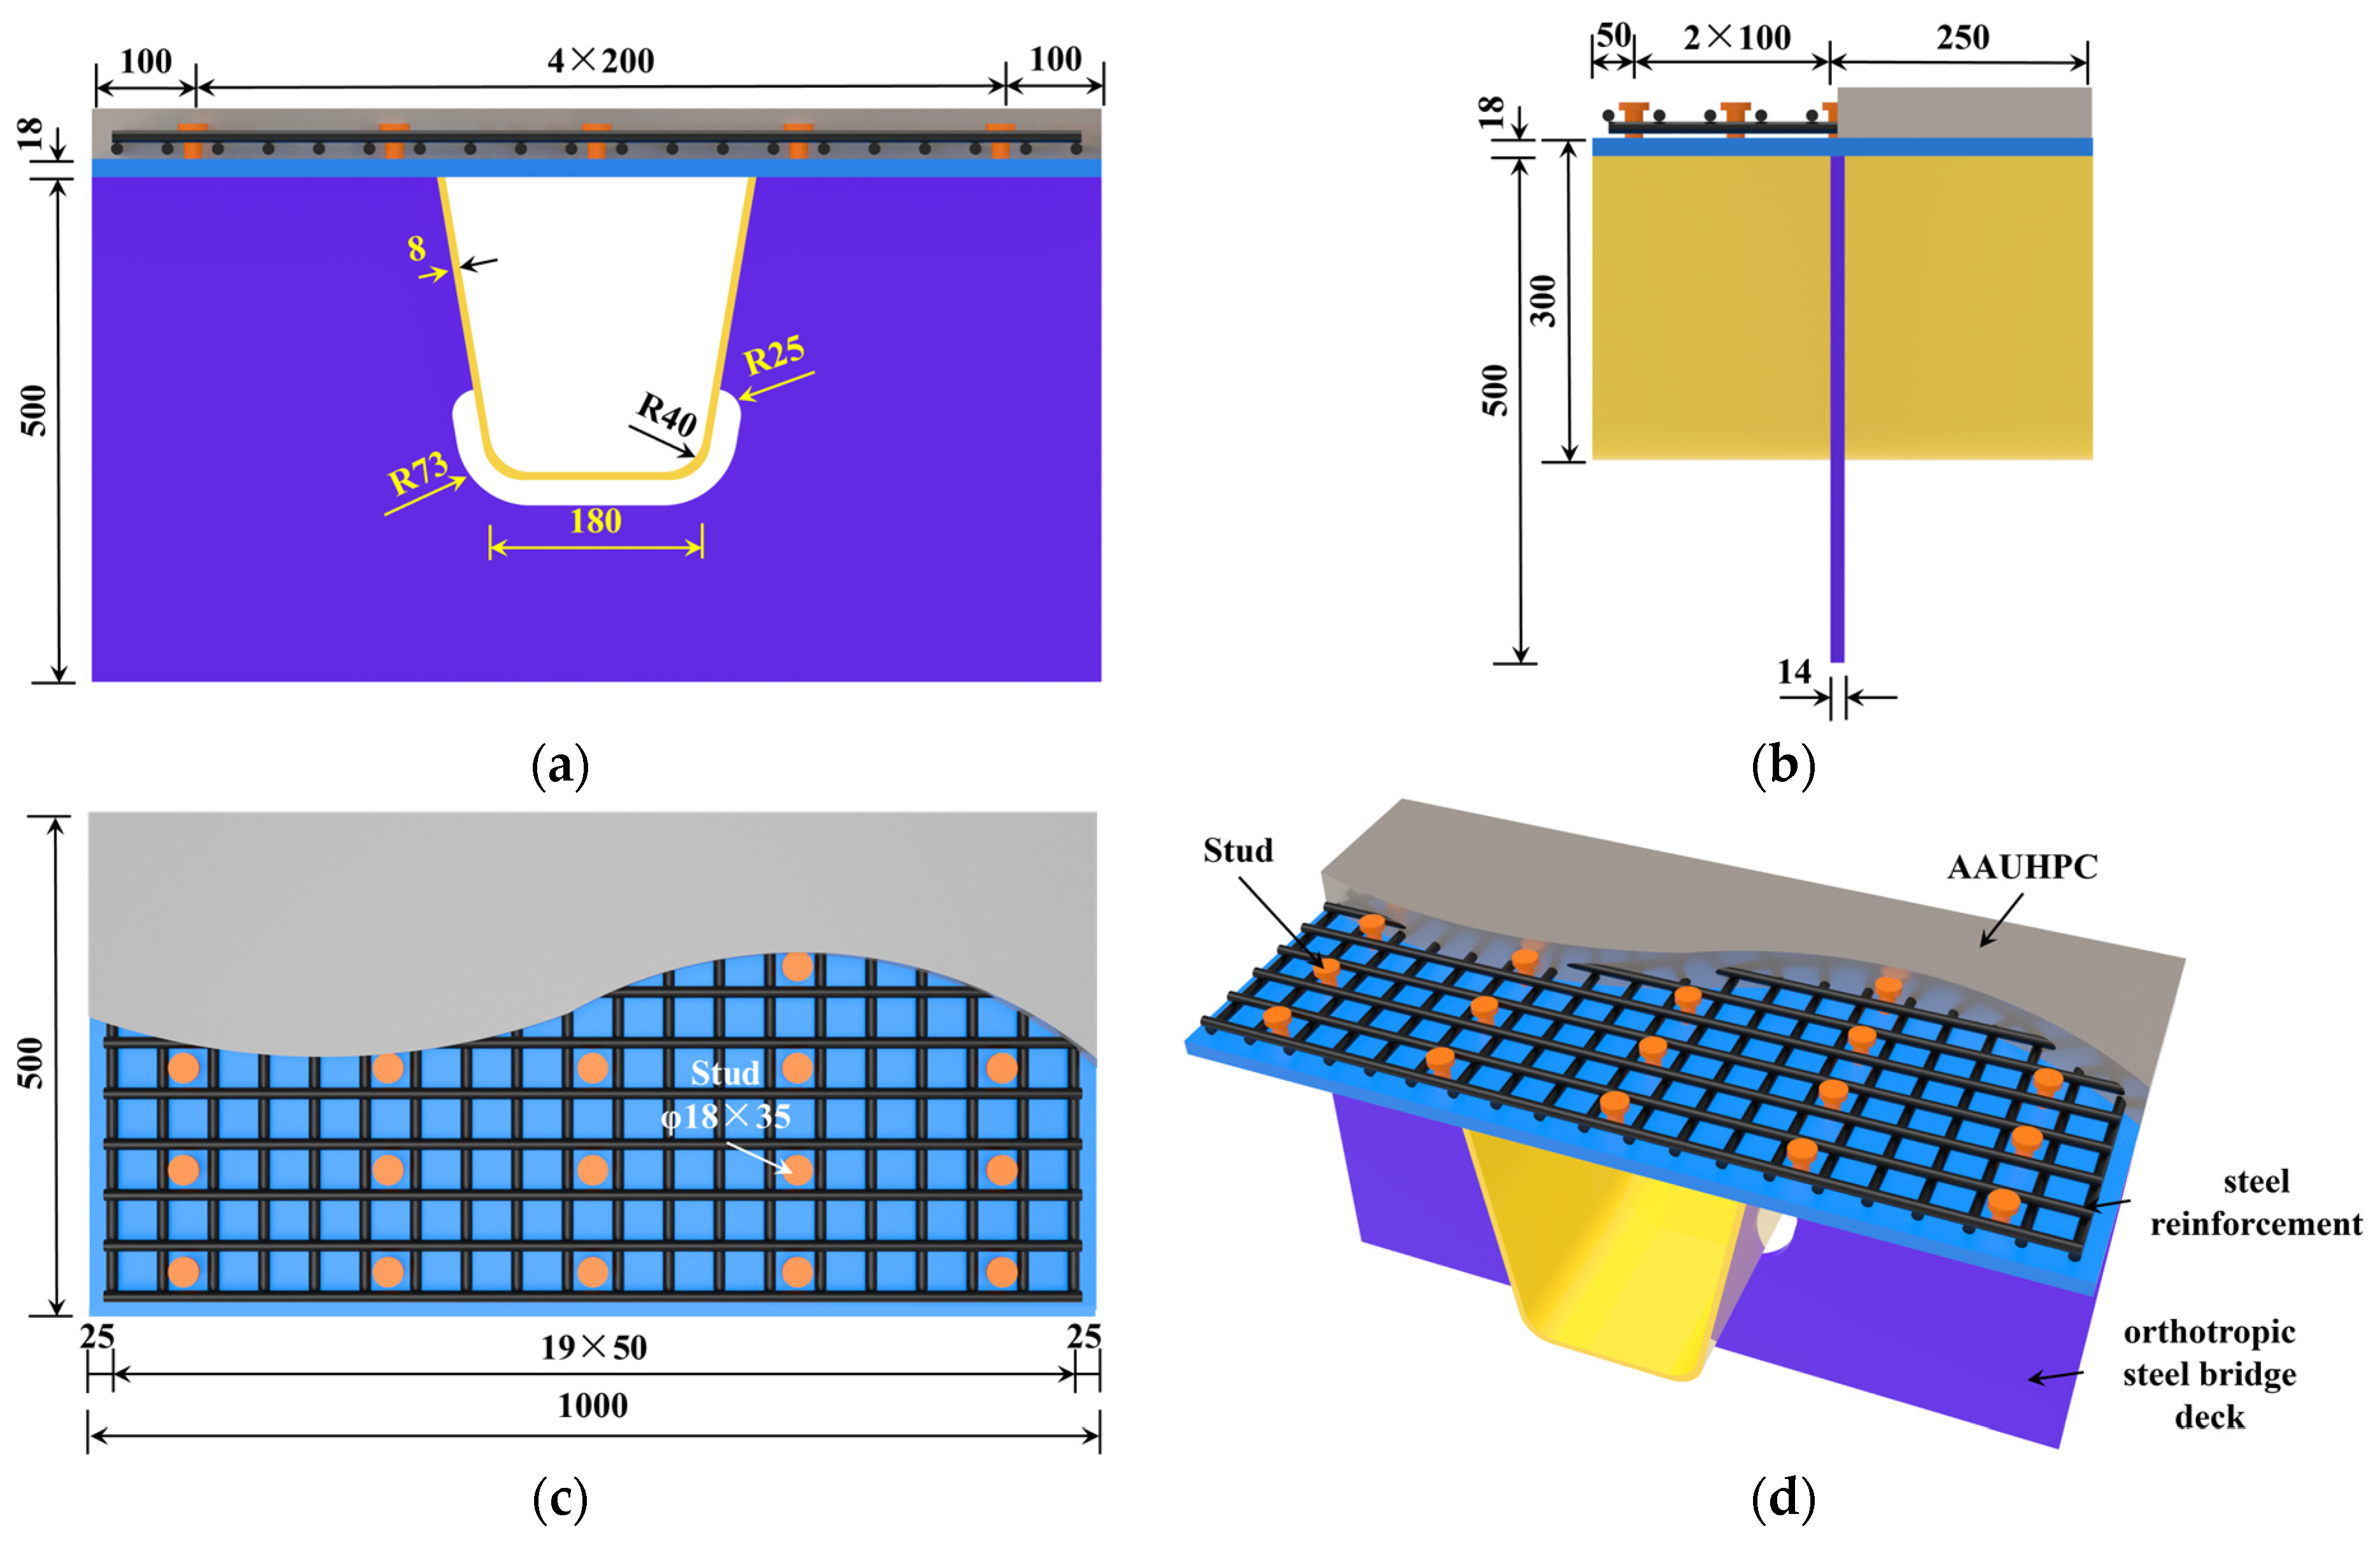
Scholars have proved the improvement effect of a UHPC layer with a given thickness on the fatigue performance of the orthotropic steel bridge deck, but the influence curve of UHPC thickness in the commonly used size range of engineering has not yet been formed. At the same time, considering that UHPC is expensive in practical engineering, thin-layer UHPC should be used as much as possible on the premise of ensuring structural safety. Considering this comprehensively, in this paper, the thickness of the AAUHPC layer is 40 mm. Combined with practical engineering experience, the spacing of studs in the composite bridge deck is 200 mm × 100 mm (transverse bridge direction × longitudinal bridge direction), the spacing of steel bars is 50 mm, the thicknesses of the top plate, U-rib and diaphragm are 18 mm, 8 mm and 14 mm, respectively, and the spacing of the diaphragm is 3200 mm. The structural parameters of the diaphragm steel–AAUHPC composite bridge deck are shown in Figure 3, In Figure 3, the grey part represents AAUHPC pavement, the blue part represents steel deck, the yellow part represents U rib and the purple part represents diaphragm.
Figure 3.
Double-sided welded steel–AAUHPC composite bridge deck structure diagram (units: mm): (a) cross-section; (b) elevation; (c) plan view; and (d) structural details.
3. Fatigue Performance Analysis
3.1. Determination of Fatigue Structural Details
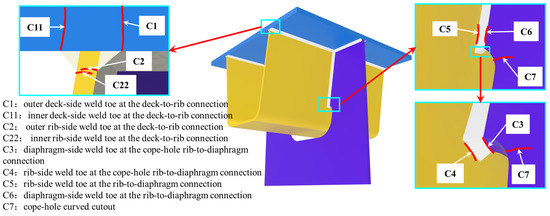
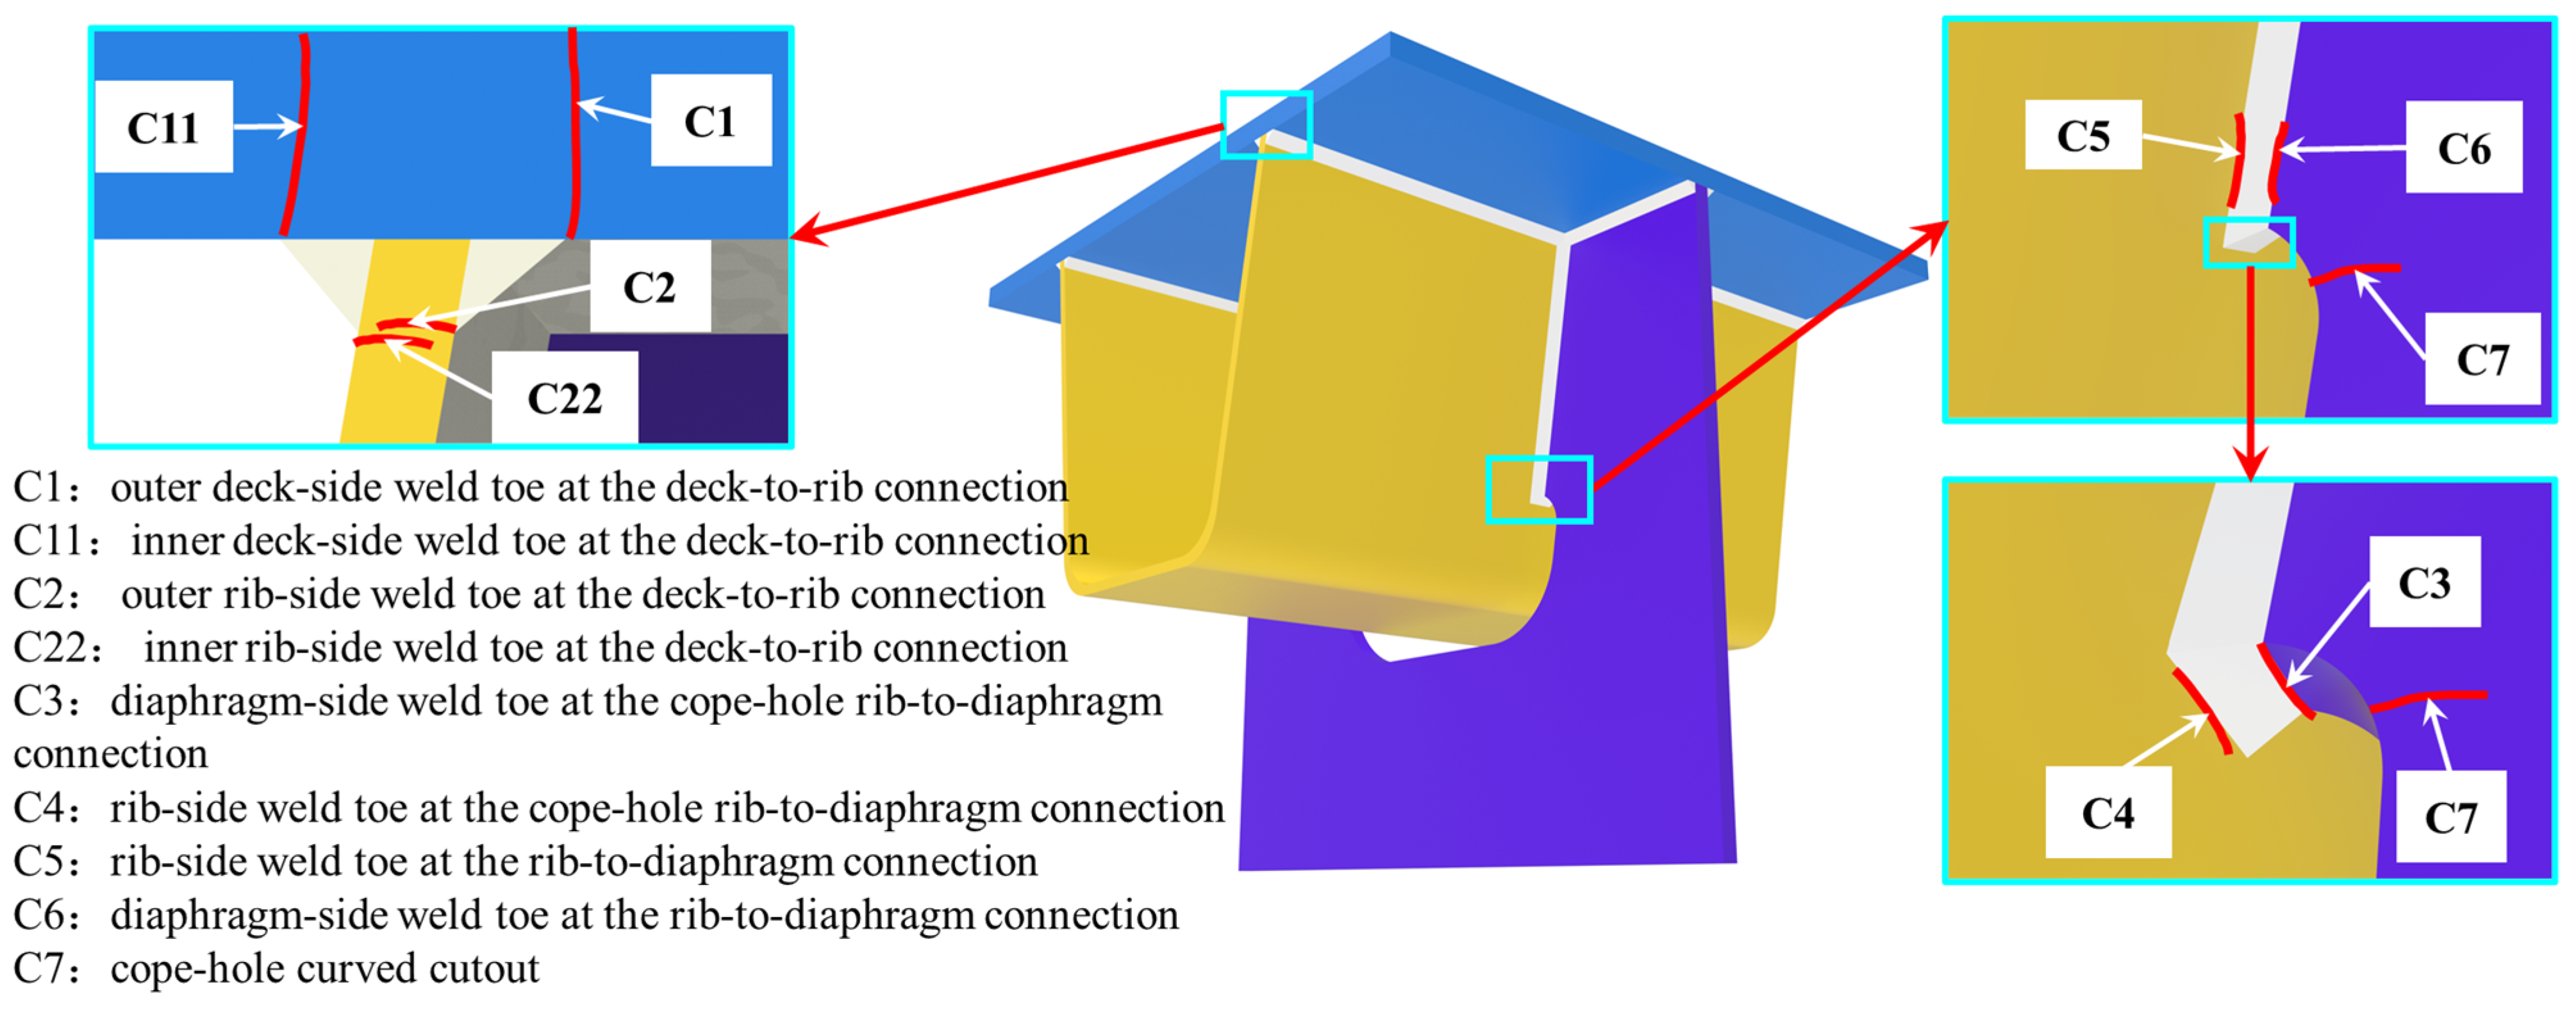
Due to the complex connection structure of the orthotropic steel bridge deck, there are many possible fatigue structural details. In reference [25], the fatigue damage of about 7000 closed longitudinal rib orthotropic steel bridge decks on two representative expressways in Tokyo, Japan, was statistically analyzed, and a total of 9 fatigue structural details were given. In this paper, 9 structural details were selected for analysis, as shown in Figure 4.
Figure 4.
Schematic diagram of the location of fatigue structural details.
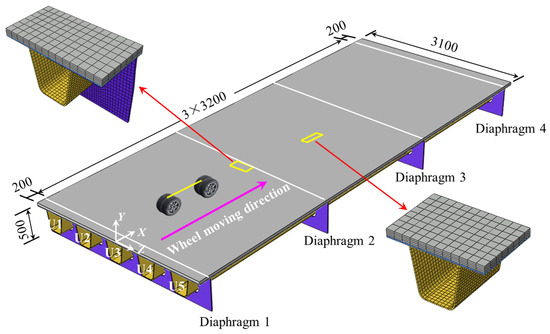
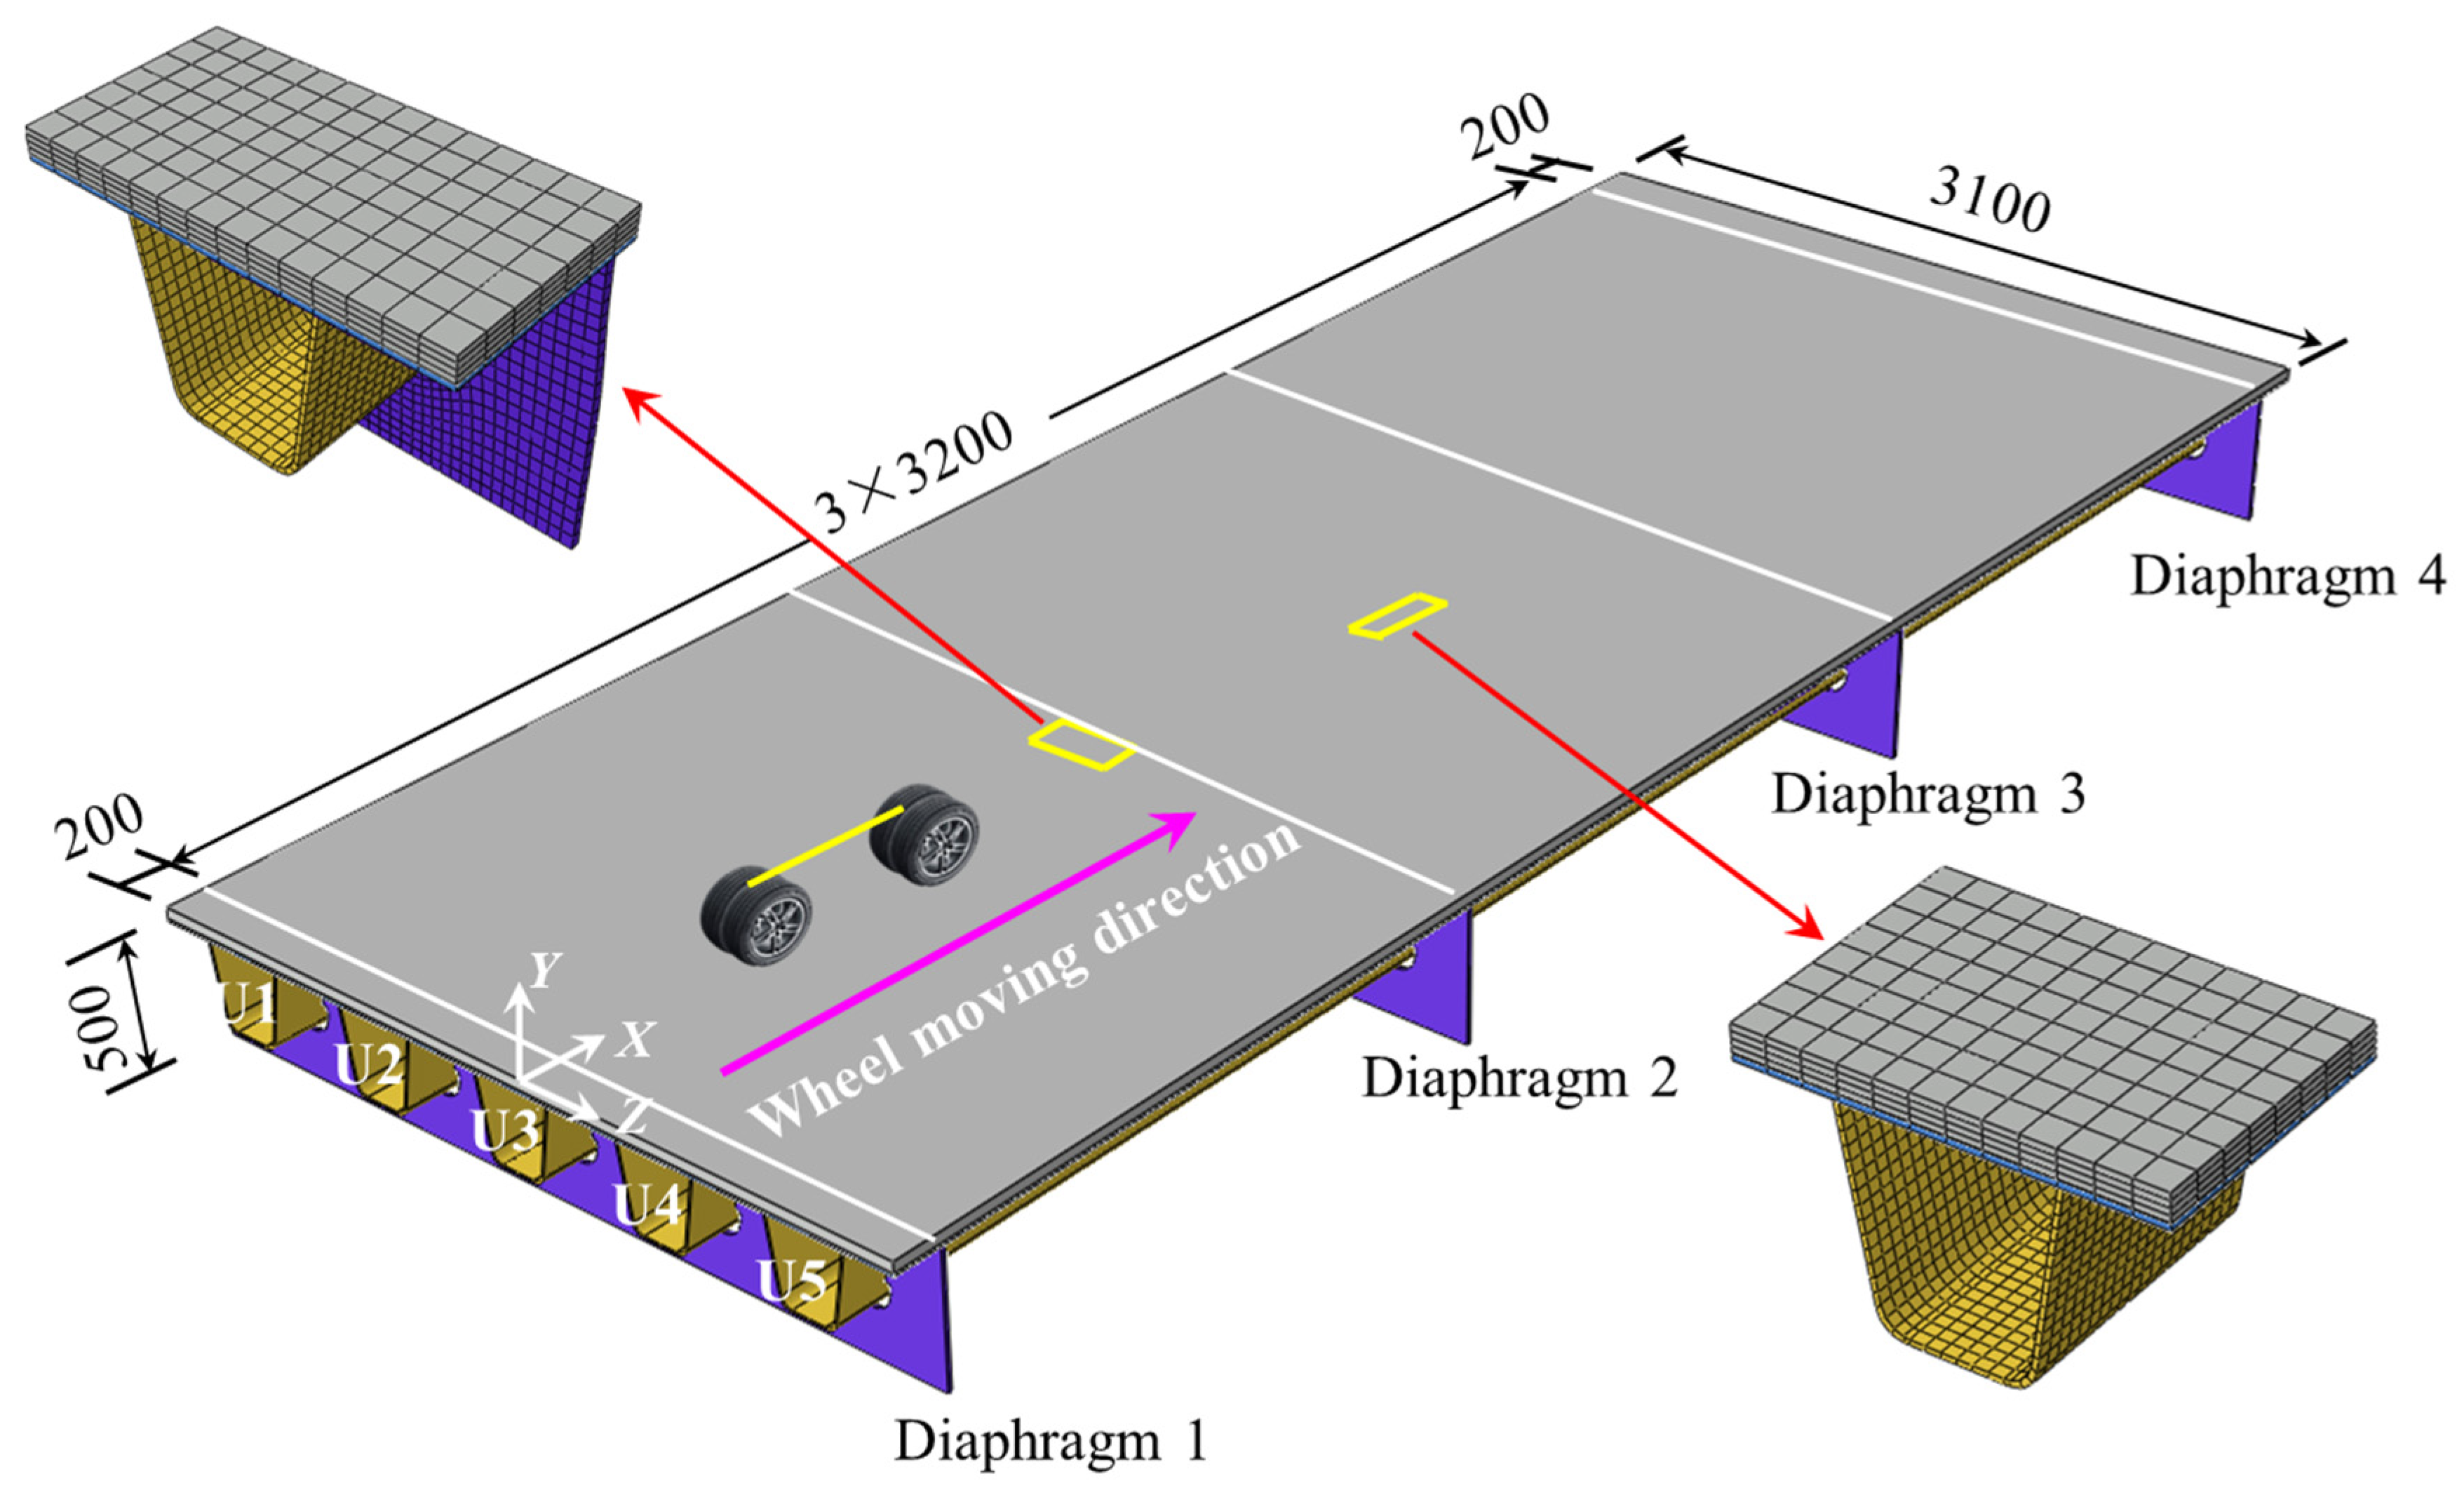
In the finite element modeling, the right position of diaphragm 2 and stiffener U3 (as shown in Figure 5) is selected as the detailed analysis position of C3~C7; the middle of diaphragm 2 and diaphragm 3 and the right position of stiffener U3 are selected as the analysis positions of C1, C2 and C11, C22. In Figure 5, the white line indicates the position of the diaphragm, the black arrow indicates the size line, the white arrow indicates the coordinate axis, and the pink arrow indicates the wheel moving direction.
Figure 5.
Finite element model (units: mm).
3.2. Finite Element Model
For comparison and analysis, the finite element software ABAQUS is used to establish the solid models of the orthotropic steel bridge deck, steel–AAUHPC composite bridge deck and steel–UHPC composite bridge deck, and the fatigue effect calculation is carried out. The modeling parameters are consistent with Section 2.2, and the finite element model is shown in Figure 5.
3.2.1. Geometrical Parameters
Through research, it was found that the influence area of vehicle load on the stress response of fatigue details of the orthotropic plate is quite limited [26]. Therefore, the local finite element model of the orthotropic plate is enough to accurately obtain the stress level of fatigue details required for fatigue analysis [27]. Considering the influence of the loading length of the vehicle load influence line, the longitudinal length of the segment model is 10,000 mm, including the spacing of three diaphragms, and the two ends extend outward by 200 mm. The width of five U-ribs in the transverse direction of the bridge is 3100 mm. The whole finite element model is a symmetrical structure.
3.2.2. Material Properties
In the finite element model, the steel adopts an elastic constitutive relation. The elastic modulus of steel is 206 GPa, and Poisson’s ratio is 0.28. The elastic modulus of AAUHPC is 29.2 Gpa, and Poisson’s ratio is 0.2. The elastic modulus of UHPC is 42.6 Gpa, and Poisson’s ratio is 0.2.
It should be pointed out that this paper uses a linear elastic constitutive model to describe the mechanical behavior of steel, which is based on the standard practice of the Eurocode 3 specification. The local plastic deformation of the weld zone is not directly simulated, but the S-N curve of the specification has implied the influence of local plasticity through the experimental data. For stress concentration areas such as the weld toe, the stress amplitude given by the linear elastic assumption is safer.
3.2.3. Element Types and Mesh Schemes
The eight-node linear hexahedral reduced integral solid element (C3D8R) is used to simulate the plate in the model. In order to save calculation cost and improve the calculation accuracy, the model is meshed by local mesh refinement. The mesh size of the weld area is 1 mm, and a transition mesh is used in other parts, with the size gradually increasing from 1 mm to 20 mm.
3.2.4. Steel–Concrete Interfaces and Boundary Conditions
The focus of this paper is on the influence of the AAUHPC structural layer on the fatigue performance of the steel bridge deck. Therefore, in order to simplify the analysis, the steel bars and shear studs are not considered in the modeling process, but the pavement layer and the steel plate are connected as a whole through the coupling command. The bottom of the diaphragm is constrained by consolidation, which constrains the translational degrees of freedom around the roof, at both ends of the stiffener and on both sides of the diaphragm. The weld and the steel plate are constrained in the form of common nodes.
Using the coupling constraint for analysis, there is an ideal joint effect by default. Since interface slip is not considered, the calculation results of the combined stiffness of this method may be slightly higher than the actual value. Although this simplified treatment is generally accepted in conventional fatigue stress analysis, future research should incorporate nonlinear interface elements to fully consider the potential bond deterioration and slip accumulation effects during fatigue loading.
3.2.5. Fatigue Load Models and Loading Conditions
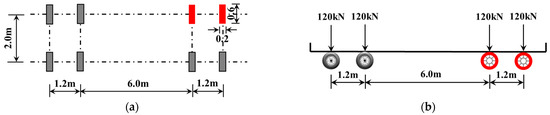
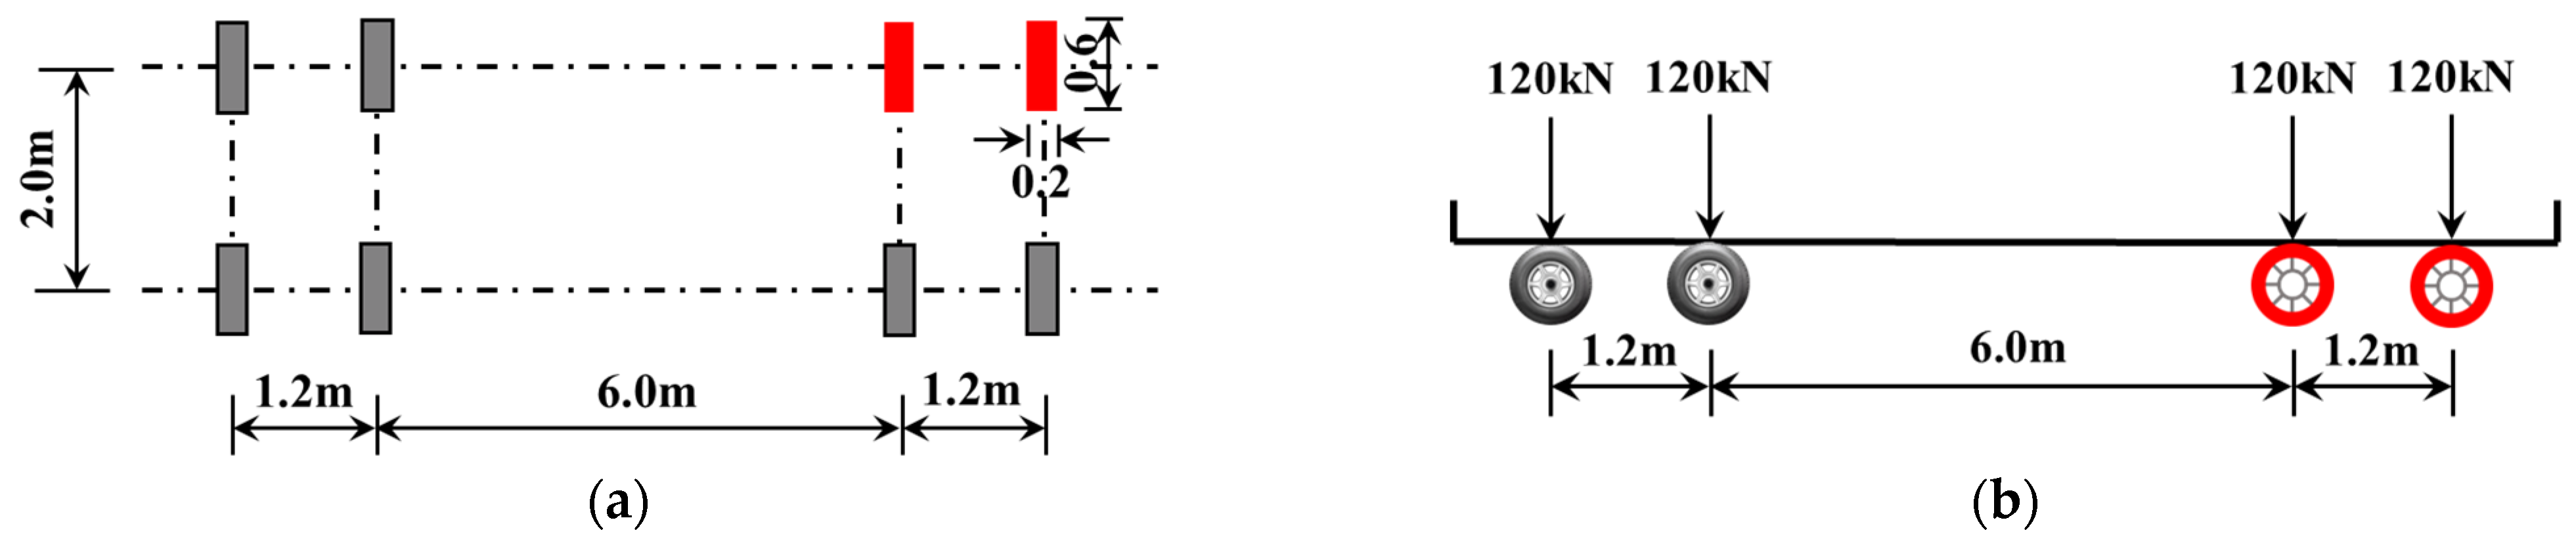
According to the fatigue load model III in the “Code for Design of Highway Steel Structure Bridges” (JTGD64-2015) [28], the load is applied in the finite element model. The uniaxial axle load of the fatigue load model III is 120 kN. The influence line of each fatigue structural detail determined by the stress characteristics of the orthotropic steel bridge deck is short, and the center distance of the front and rear axles in the vehicle model is 7.2 m, which exceeds the spacing of the diaphragms by 3.2 m. Therefore, in order to simplify the calculation and ignore the influence of transverse wheel load, the finite element segment model adopts the method of unilateral biaxial loading (as shown in the red area of Figure 6).
Figure 6.
Fatigue load model III, as specified in JTG D64-2015: (a) plan view and (b) elevation.
After compiling the loading program according to the vehicle load spectrum, the D-load subroutine is called in the ABAQUS software. Firstly, all structural details are loaded transversely (Z-axis direction in Figure 5) in the model to determine the most unfavorable position of longitudinal loading. It is worth noting that real traffic conditions include random changes and lateral distribution of wheel tracks. In general, considering the lateral distribution of wheel load leads to a more dispersed stress cycle, so the cumulative fatigue damage is lower than that of fixed lane loading. However, since this study mainly focuses on the comparison of fatigue performance between different steel bridge decks and the multi-objective optimization of the steel–AAUHPC system, the load conditions in this paper can provide a unified and safe standard for all analyzed steel bridge decks.
After verification, it is found that each structural detail has the maximum stress response when the wheel passes directly above it. During longitudinal loading, the front axle of the fatigue car’s biaxial enters from one end of the bridge deck (X = 0 mm), and the rear axle leaves from the other end of the bridge deck (X = 1000 mm) and moves forward by 100 mm for each load step (1 s) for moving loading. During the movement of the fatigue vehicle, the stress of the bridge deck changes with the position of the model vehicle.
3.3. Mesh Convergence Study
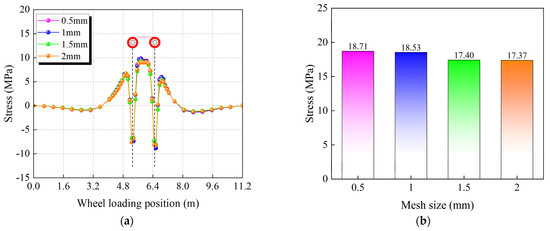
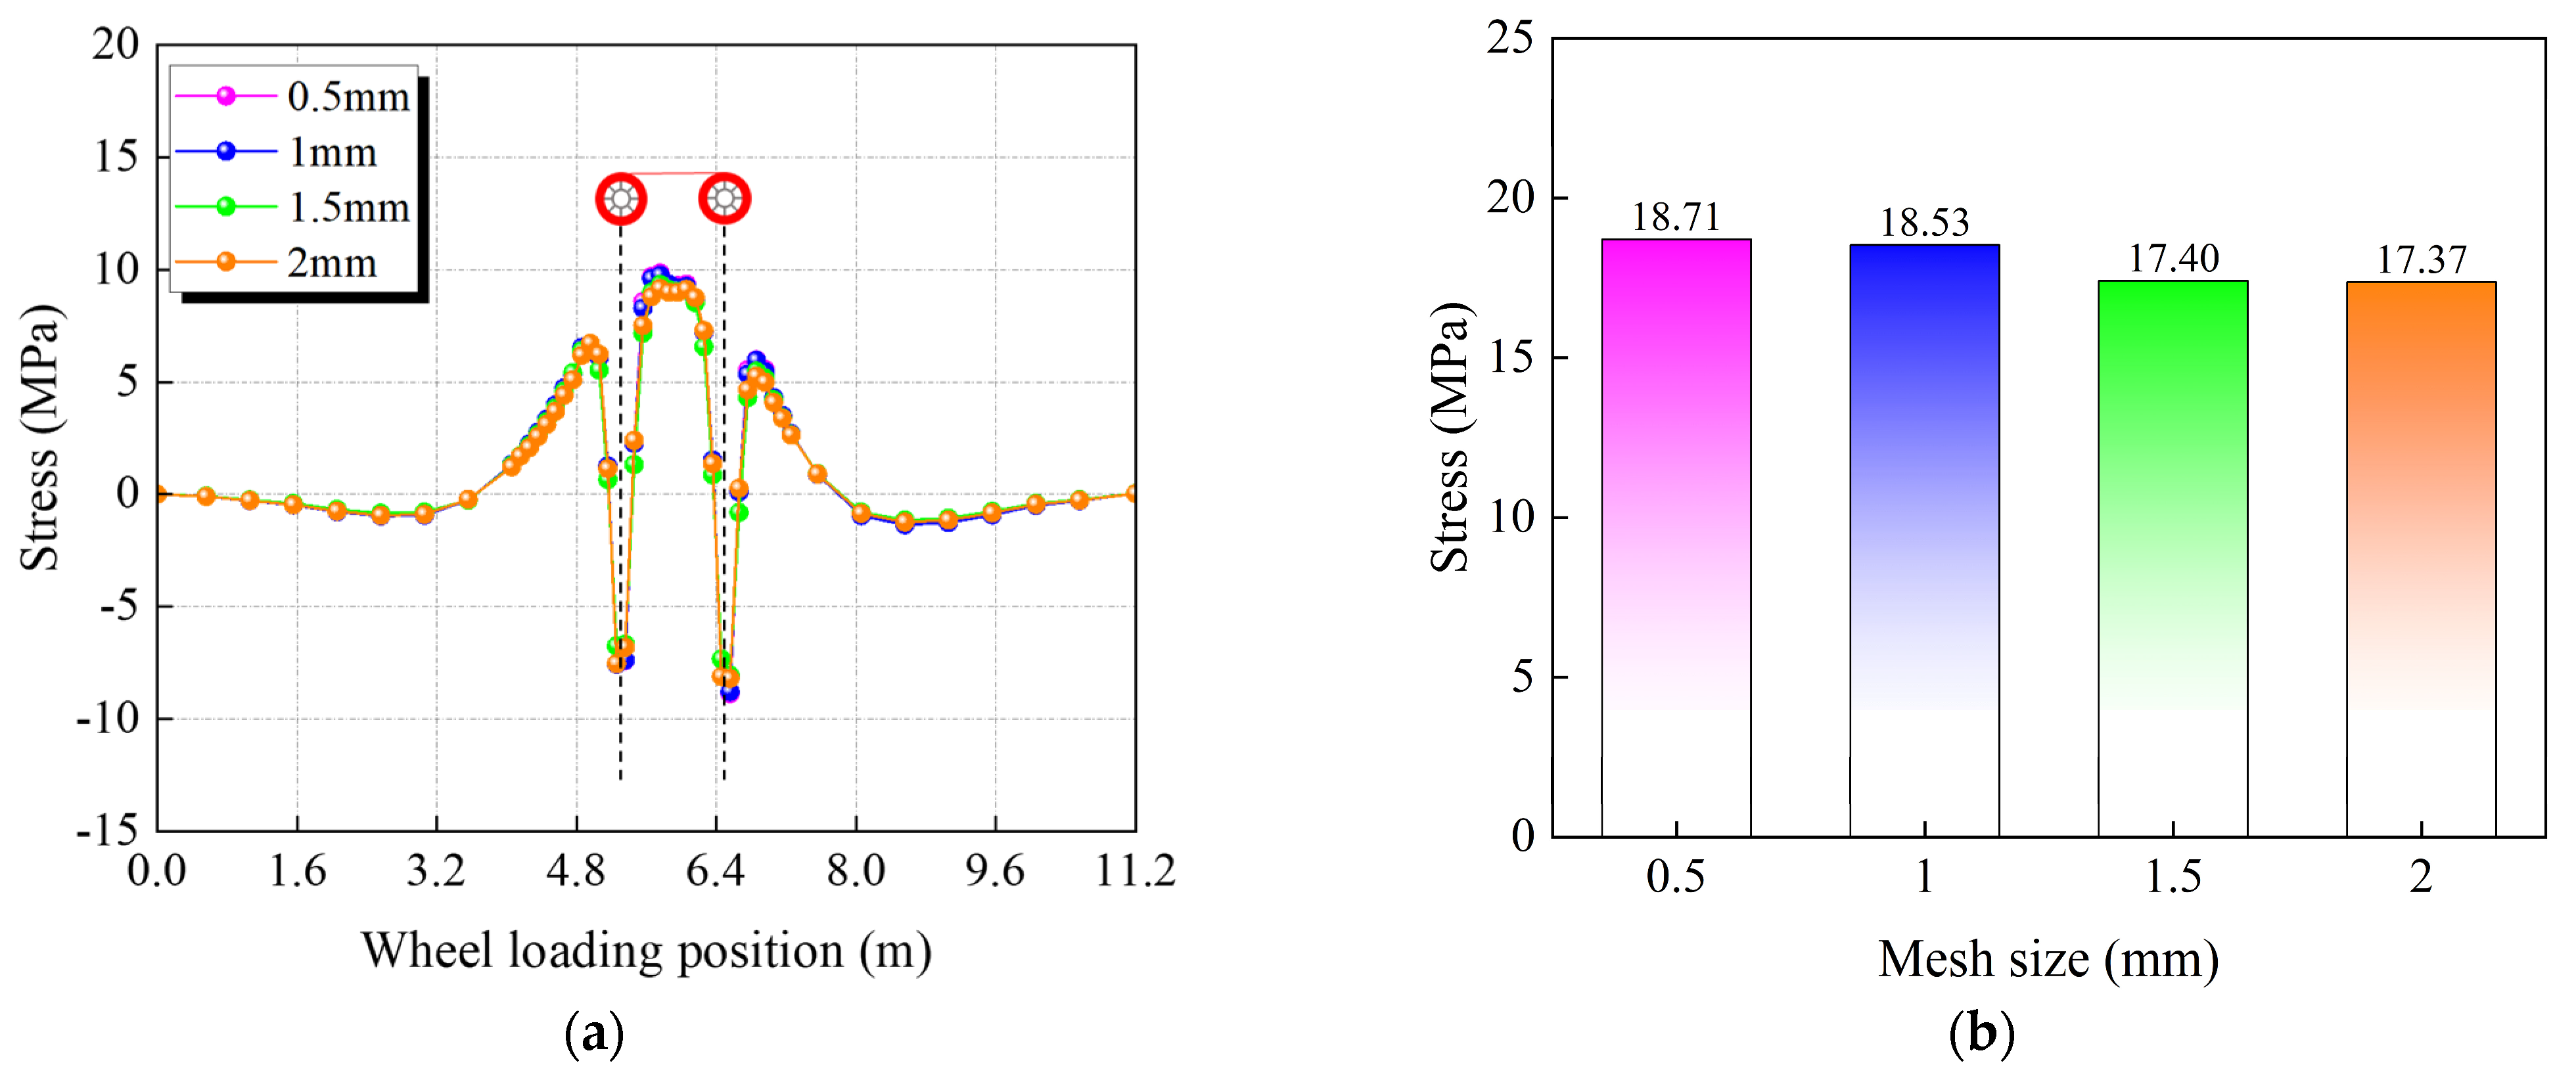
To verify the influence of mesh size on the stress calculation results, C1 details are taken as the object, and four mesh sizes of 0.5 mm, 1 mm, 1.5 mm and 2 mm are used for comparative analysis. The stress time-history curves of the C1 detail under four grid sizes are shown in Figure 7a, and the fatigue stress amplitude is shown in Figure 7b. The red wheels in Figure 7a represent the standard fatigue vehicle model III with unilateral biaxial. It can be seen from Figure 7 that the difference in stress amplitude calculated by the 1mm mesh and 0.5 mm mesh is far less than 5%, while the difference in stress amplitude calculated by the 2 mm mesh and 1.5 mm mesh is about 6.1% and 6.3% compared with the 1mm mesh. Considering the calculation accuracy and efficiency, this paper uses a 1 mm local refinement mesh.
Figure 7.
Mesh convergence study: (a) stress time-history curves for C1 detail and (b) bar chart of fatigue stress amplitude for C1 detail.
3.4. Fatigue Life Assessment
According to the Eurocode3 specification [29], the fatigue life of the steel–AAUHPC composite bridge deck is evaluated. The S-N curve method [29,30,31,32] is used for fatigue evaluation. The fatigue strength of the weld details of the top plate and the longitudinal rib is FAT90, and the cut-off stress amplitude is 33.2 MPa. The fatigue strength of the cross-weld details of the longitudinal rib and the diaphragm is FAT71, and the cut-off stress amplitude is 28.7 Mpa. For the arc notch details at the weld hole, the fatigue performance level can be comparable to that of the base metal [33]. This fatigue strength level corresponds to FAT160, and its cut-off stress amplitude is 64.8 Mpa.
The fatigue life evaluation results of the steel–AAUHPC composite bridge deck are shown in Table 2. From the results in Table 2, it can be seen that only the C6 details of the steel–AAUHPC composite bridge deck do not achieve infinite life, and the remaining details achieve infinite life.
Table 2.
Evaluation of stress amplitude and fatigue performance of structural details of steel–AUHPC composite bridge deck (MPa).
A possible reason for why the details of C6 do not achieve infinite life is that C6 is located at the connection root of the diaphragm and the U-rib, and the weld toe is located at the maximum deformation position. Under the action of wheel load, the diaphragm produces out-of-plane bending deformation, which generates additional bending stress at C6 and superimposes on the axial stress.
3.5. Fatigue Performance Comparison
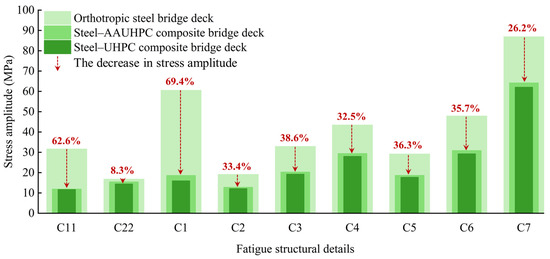
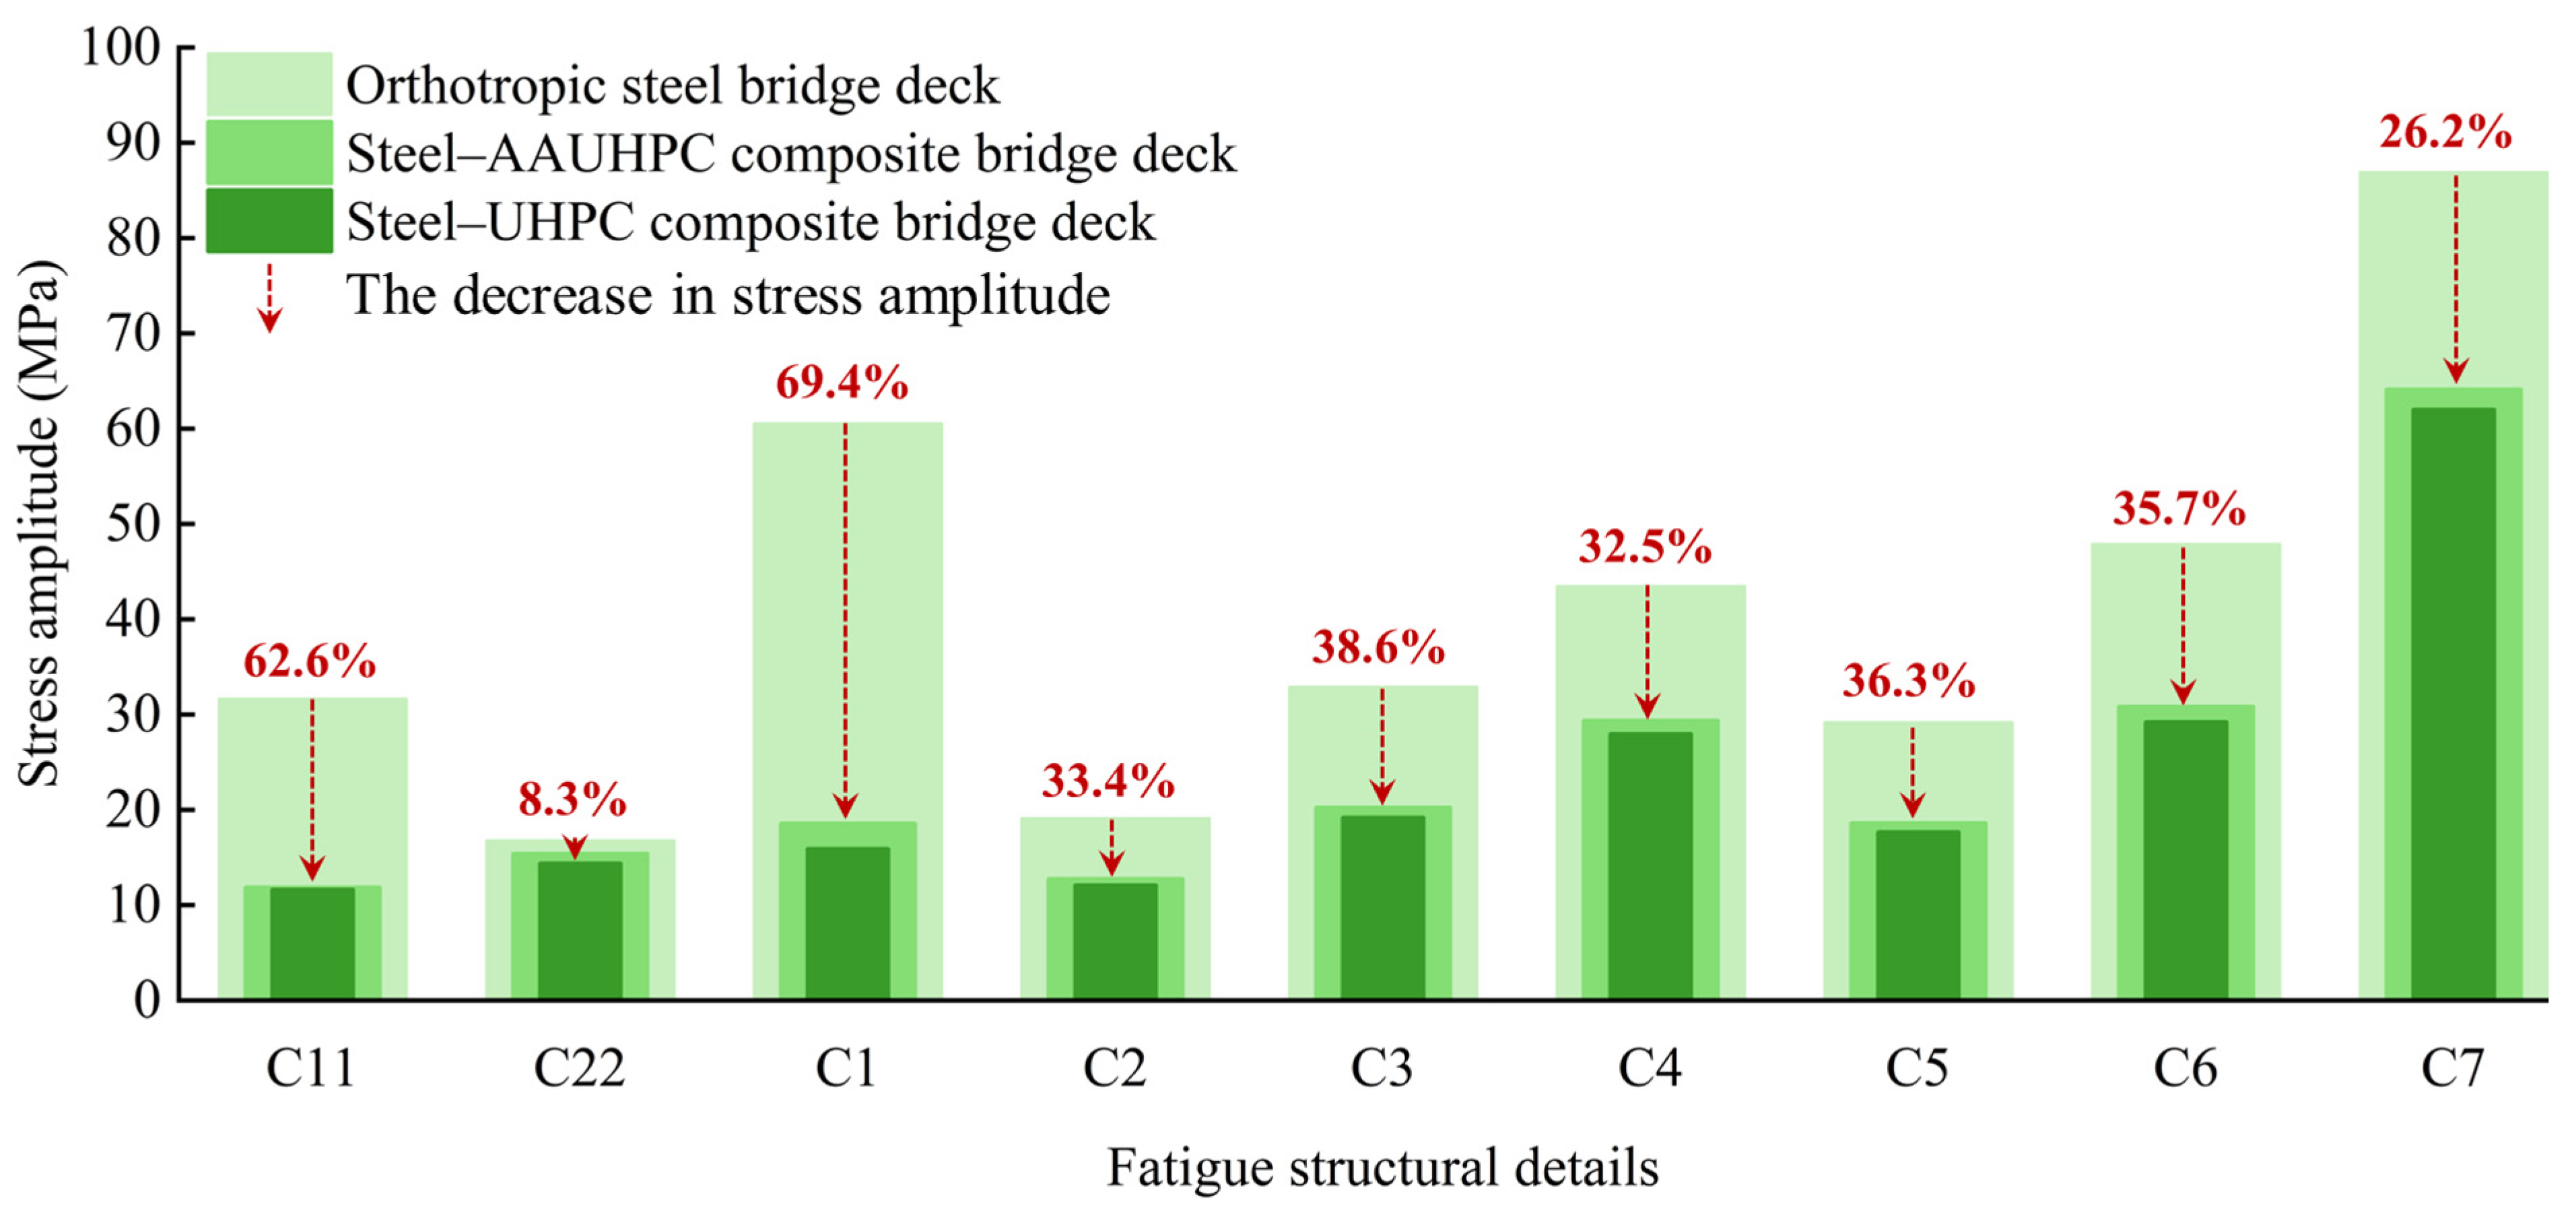
To analyze the fatigue performance of the steel–AAUHPC composite bridge deck, the fatigue detail stress responses of the orthotropic steel bridge deck, steel–UHPC composite bridge deck and steel–AAUHPC composite bridge deck were compared. The comparison results of the maximum stress amplitude of each fatigue detail of the three types of steel bridge decks are shown in Figure 8. From Figure 8, it can be seen that setting AAUHPC and UHPC pavement layers can greatly reduce the fatigue stress of the structural details of orthotropic steel bridge decks. Among them, the C1 detail has the largest decrease, which is 69.4% and 73.7%, respectively, and the C22 detail has the smallest decrease, which is 8.3% and 14.35%, respectively.
Figure 8.
The maximum stress amplitude comparison histogram of each structural detail of the three types of steel bridge decks.
4. Response Surface Model
It can be seen from Table 2 that, for the steel–AAUHPC composite bridge deck in this paper, the stress amplitude of the weld toe C6 on the side of the longitudinal rib and the diaphragm is greater than the cut-off limit of the corresponding fatigue strength curve, and the infinite-life design cannot be realized. Therefore, it is necessary to further optimize the design parameters, reduce the stress amplitude and improve the fatigue life.
Based on the initial design scheme verified in Section 3, that is, AAUHPC thickness of 40 mm, deck thickness of 18 mm, diaphragm thickness of 14 mm, and diaphragm spacing of 3200 mm, this section is based on the initial scheme. Four key parameters are used as design variables for response surface experimental design and optimization to explore better structural combinations.
4.1. Experimental Design
Among response surface design methods, CCD (Central Composite Design), BBD (Box–Behnken Design) and so on are commonly used experimental design methods. In the response surface method, CCD is generally used. Based on a two-level factorial design, the CCD method can construct a second-order model by introducing a center point and an extreme point. It does not require a complete three-level factorial experiment and can effectively fit the quadratic response surface. More information can be obtained through fewer experiments, which is more effective for exploring complex nonlinear relationships [34,35]. Therefore, this paper uses the CCD method in Design Expert version 13 to realize a five-level experimental design.
Combined with practical engineering experience, this paper determines the four parameters shown in Table 3 for the experimental design. Considering that the weight of the bridge deck determined by the parameters of each test sample is different, the target responses of the test are the fatigue stress amplitude of 9 fatigue details and the weight of the composite bridge deck.
Table 3.
Design variable value range (units: mm).
4.2. Mathematical Model
Using the response surface software, combined with the fatigue stress results of each structural detail obtained by finite element analysis of 29 CCD test samples, the regression model polynomial between the composite bridge deck weight W, the structural detail C6 stress amplitude and the design parameters can be established as shown in Equations (2)–(11):
The unified regression equation of Equations (2)–(11) can be expressed as Equation (12). The physical meaning of each part is as follows:
: This reflects the main effect of the parameters. The positive and negative coefficients indicate whether the stress amplitude increases or decreases when the parameter increases. : This reflects the nonlinear effect of the parameters. The negative quadratic coefficient indicates that there is an optimal value, and the positive quadratic coefficient indicates that the stress amplitude increases with the increase in the parameter. : This reflects the interaction between the two parameters. For example, a positive cross term indicates that an increase in one parameter will amplify the influence of another parameter.
where y is the response target; β0 is the constant term; xi is the design variable; and ε represents the observation error of the response value y.
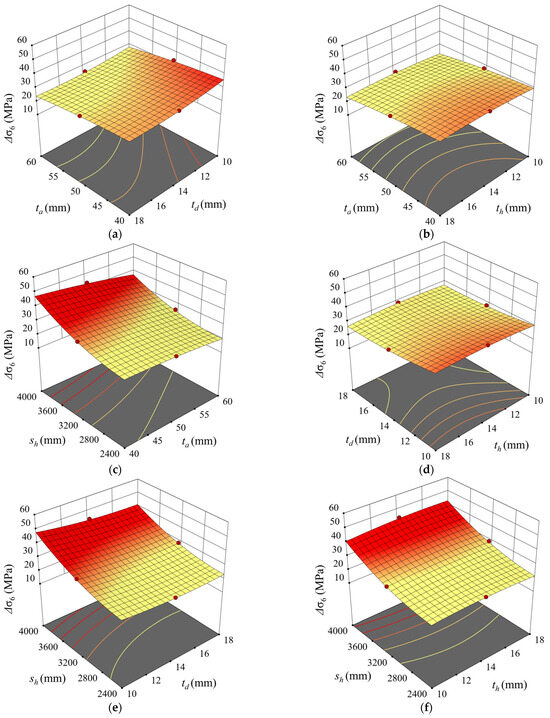
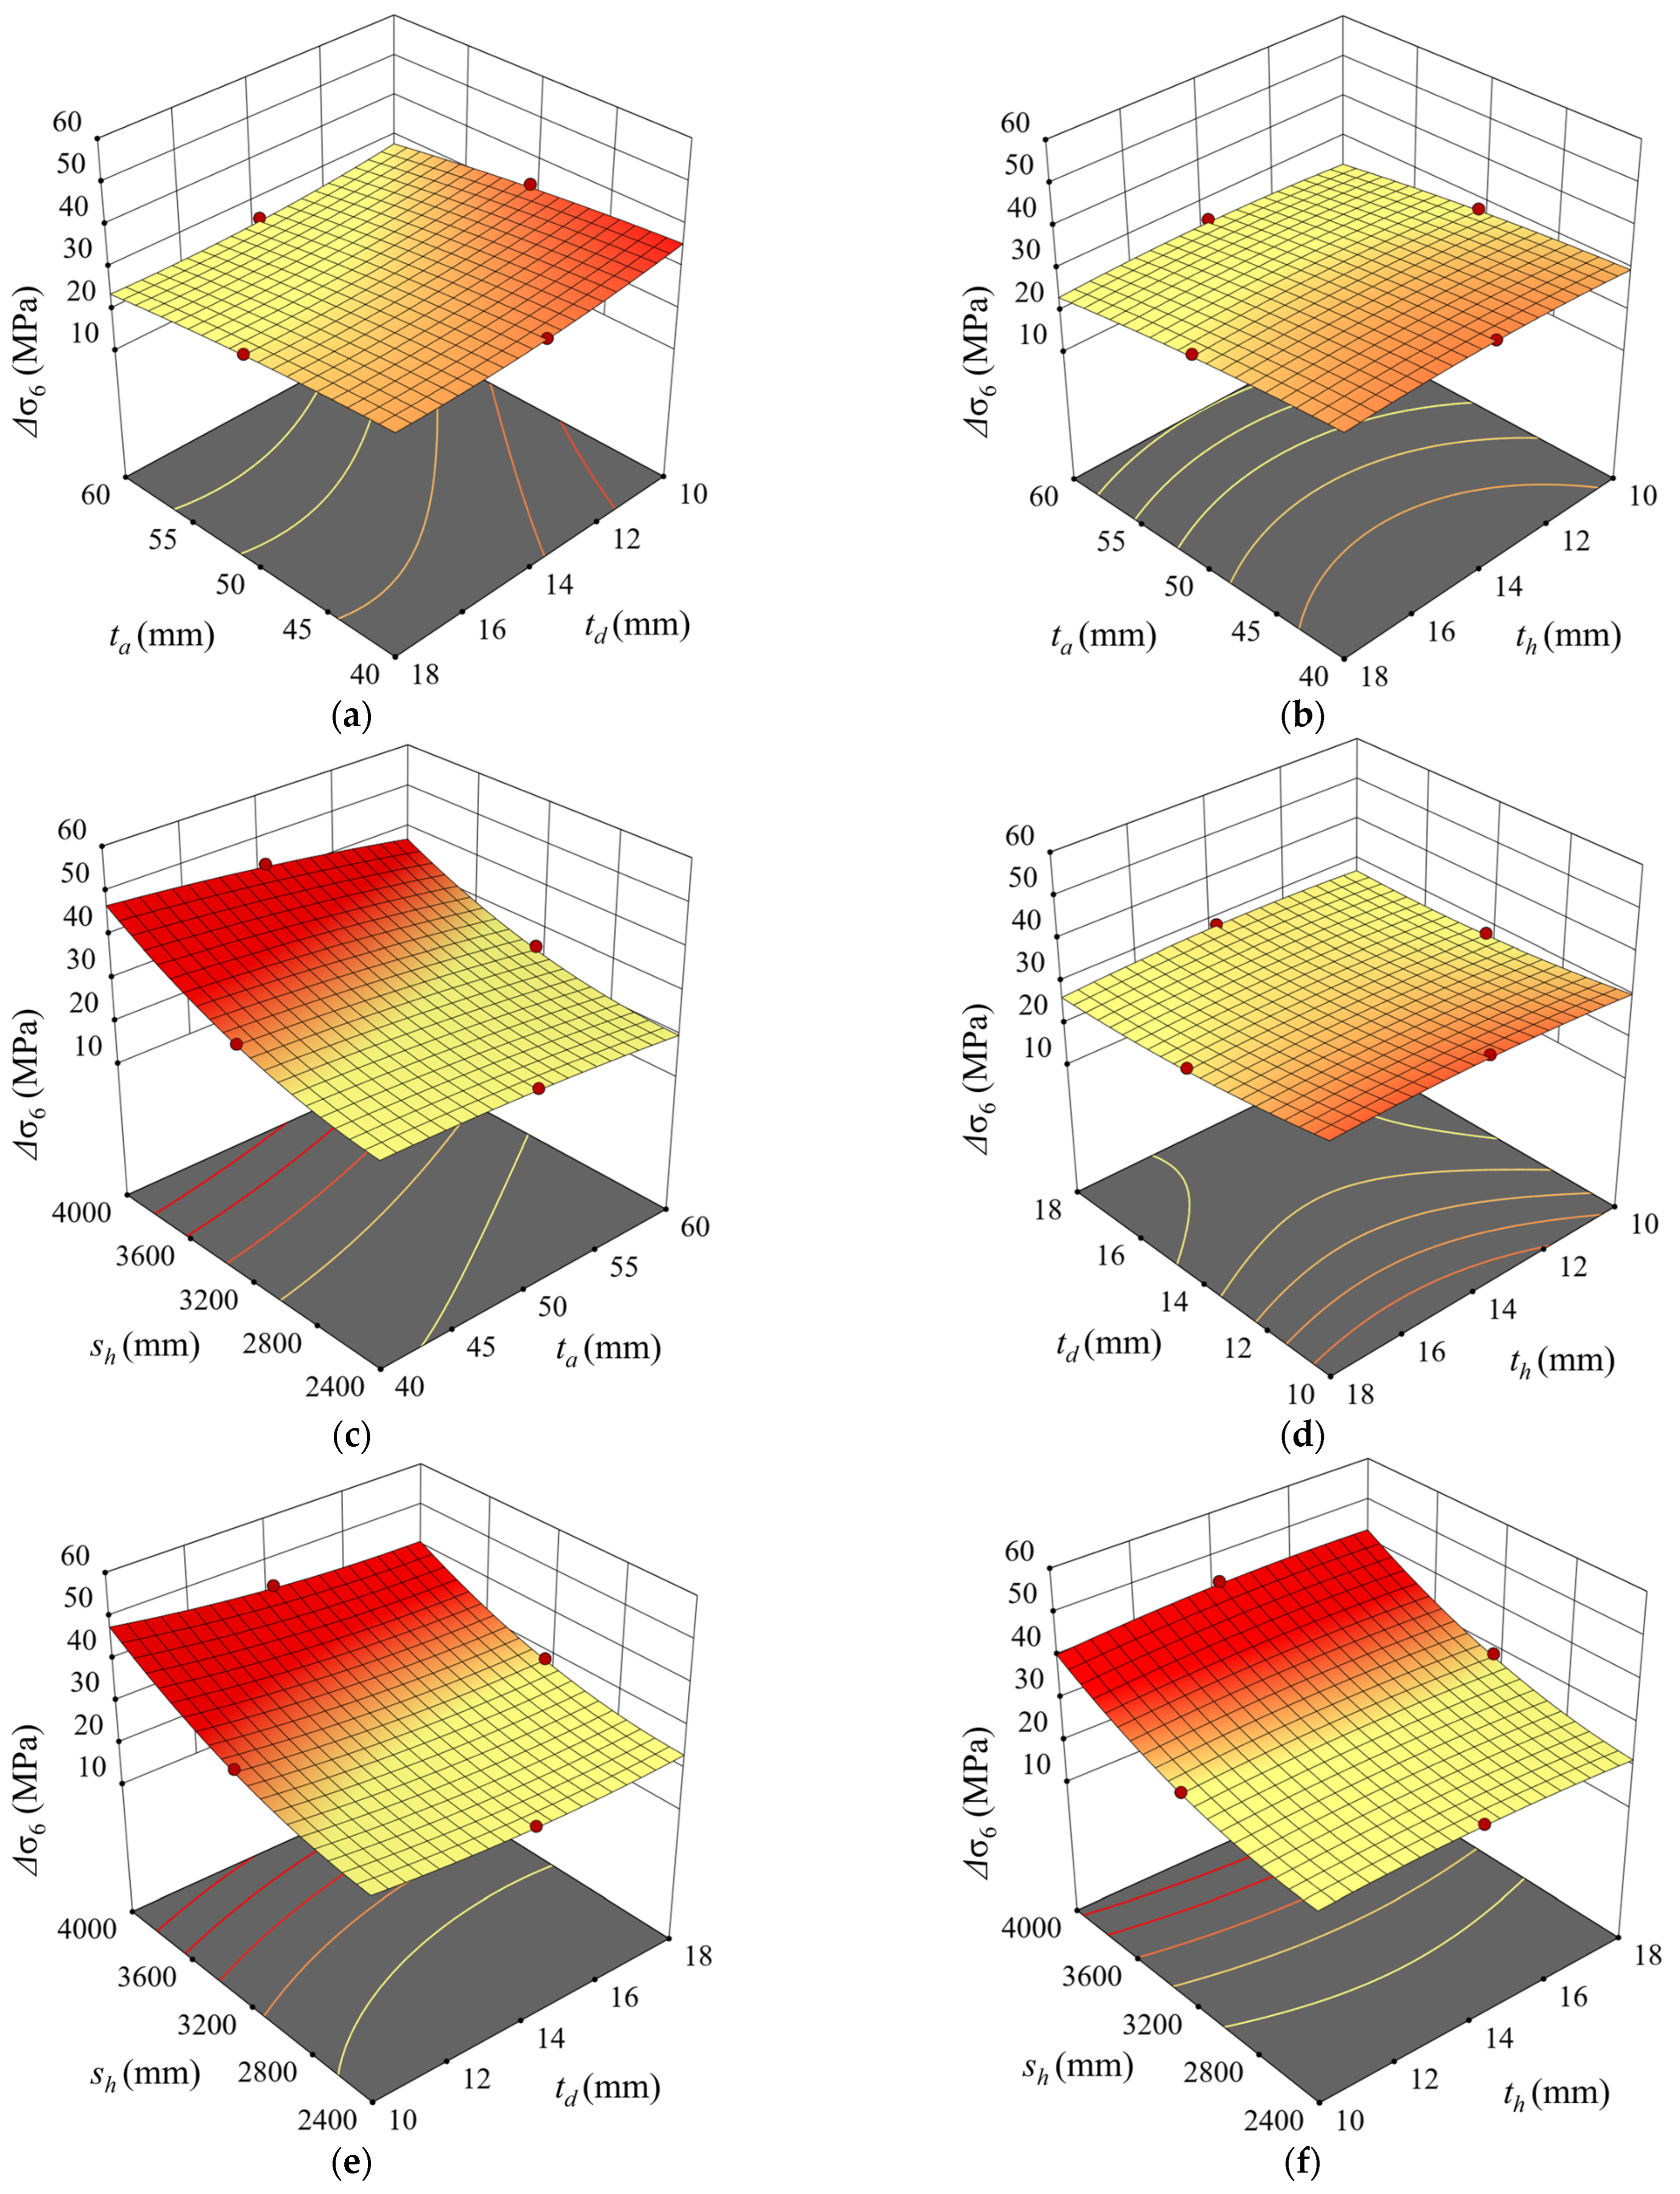
Considering space limitations, the C6 details that do not achieve infinite life are selected to display the response surface model. The response surface model is shown in Figure 9. In Figure 9, the red circle represents the intermediate value of each variable. The color of the response surface gradually changes from yellow to red, and the stress increases from small to large. From the three-dimensional model diagram of the response surface, it can be seen that the stress of C6 shows a trend of changing with the thickness of each plate, but the thickness of the diaphragm th has the least influence on C6, and the spacing of the diaphragm sh has the greatest influence on C6.
Figure 9.
Response surface model: (a) ta and td; (b) ta and th; (c) ta and sh; (d) td and th; (e) td and sh; and (f) th and sh.
4.3. Model Verification
To ensure the accuracy, reliability and practicability of the response surface model, model validation is needed. The verification process calculates the multiple correlation coefficient and the adjusted multiple correlation coefficient, compares the test value with the model prediction value, and determines whether the model fully captures the data law and avoids over-fitting or under-fitting.
4.3.1. Correlation Analysis
The multiple correlation coefficient is used to measure the fitting degree of the model to the data. The adjusted multiple correlation coefficient introduces a correction for the number of independent variables on the basis of the model, which can more objectively evaluate the goodness of fit of the model. When the values of the two are closer to 1 and close to each other, it shows that the increase in the independent variables in the model is reasonable for improving the goodness of fit. The expressions of and are shown in Equations (13) and (14):
where is the approximate value calculated from the response surface model; is the true value at the design point; is the average of the true values; M is the number of sample points; and N is the number of model basis functions.
The correlation analysis results of the response surface model of the steel–AAUHPC composite bridge deck are shown in Table 4. From Table 4, it can be seen that the weight W of the bridge deck and the sum of the structural details are close to 1, indicating that the established mathematical surrogate model has a high degree of fitting.
Table 4.
Correlation analysis of second-order response surface model.
4.3.2. Variance Analysis
In the analysis of variance, the F value and p value are often used to evaluate the statistical significance of the response surface model, so as to judge the fitting effect of the model and the contribution of each factor. The F value reflects the explanatory power of the model or an item on the variation in the response variable. The larger the value, the stronger the explanatory power. The p value represents the probability that the model effect is caused by random factors under the current data conditions. The smaller the p value, the more statistically significant the impact of the response variable and the higher its relative importance in the model. In general, if the p value is less than 0.05, the model term can be considered to have a significant effect; if the p value is greater than 0.10, it indicates that the effect of this item on the response variable is not obvious and can be regarded as not significant. Through the comprehensive analysis of the above indicators, the reliability of the response surface model and the validity of each factor can be judged.
The variance analysis of the response surface model of the steel–AAUHPC composite bridge deck is shown in Table 5. It can be seen from Table 5 that the F value of C6 is the smallest. When the F value is 64.75, the probability that the model is affected by noise is only 0.01%, indicating that the above response surface model is statistically significant.
Table 5.
Variance analysis for the second-order response surface model.
4.3.3. Residual Analysis
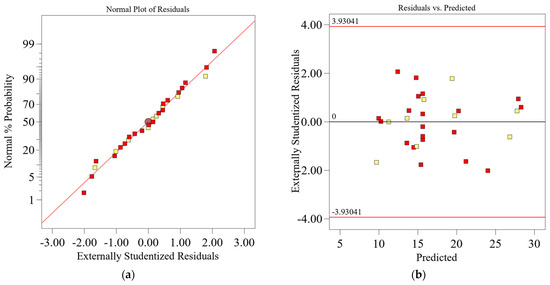
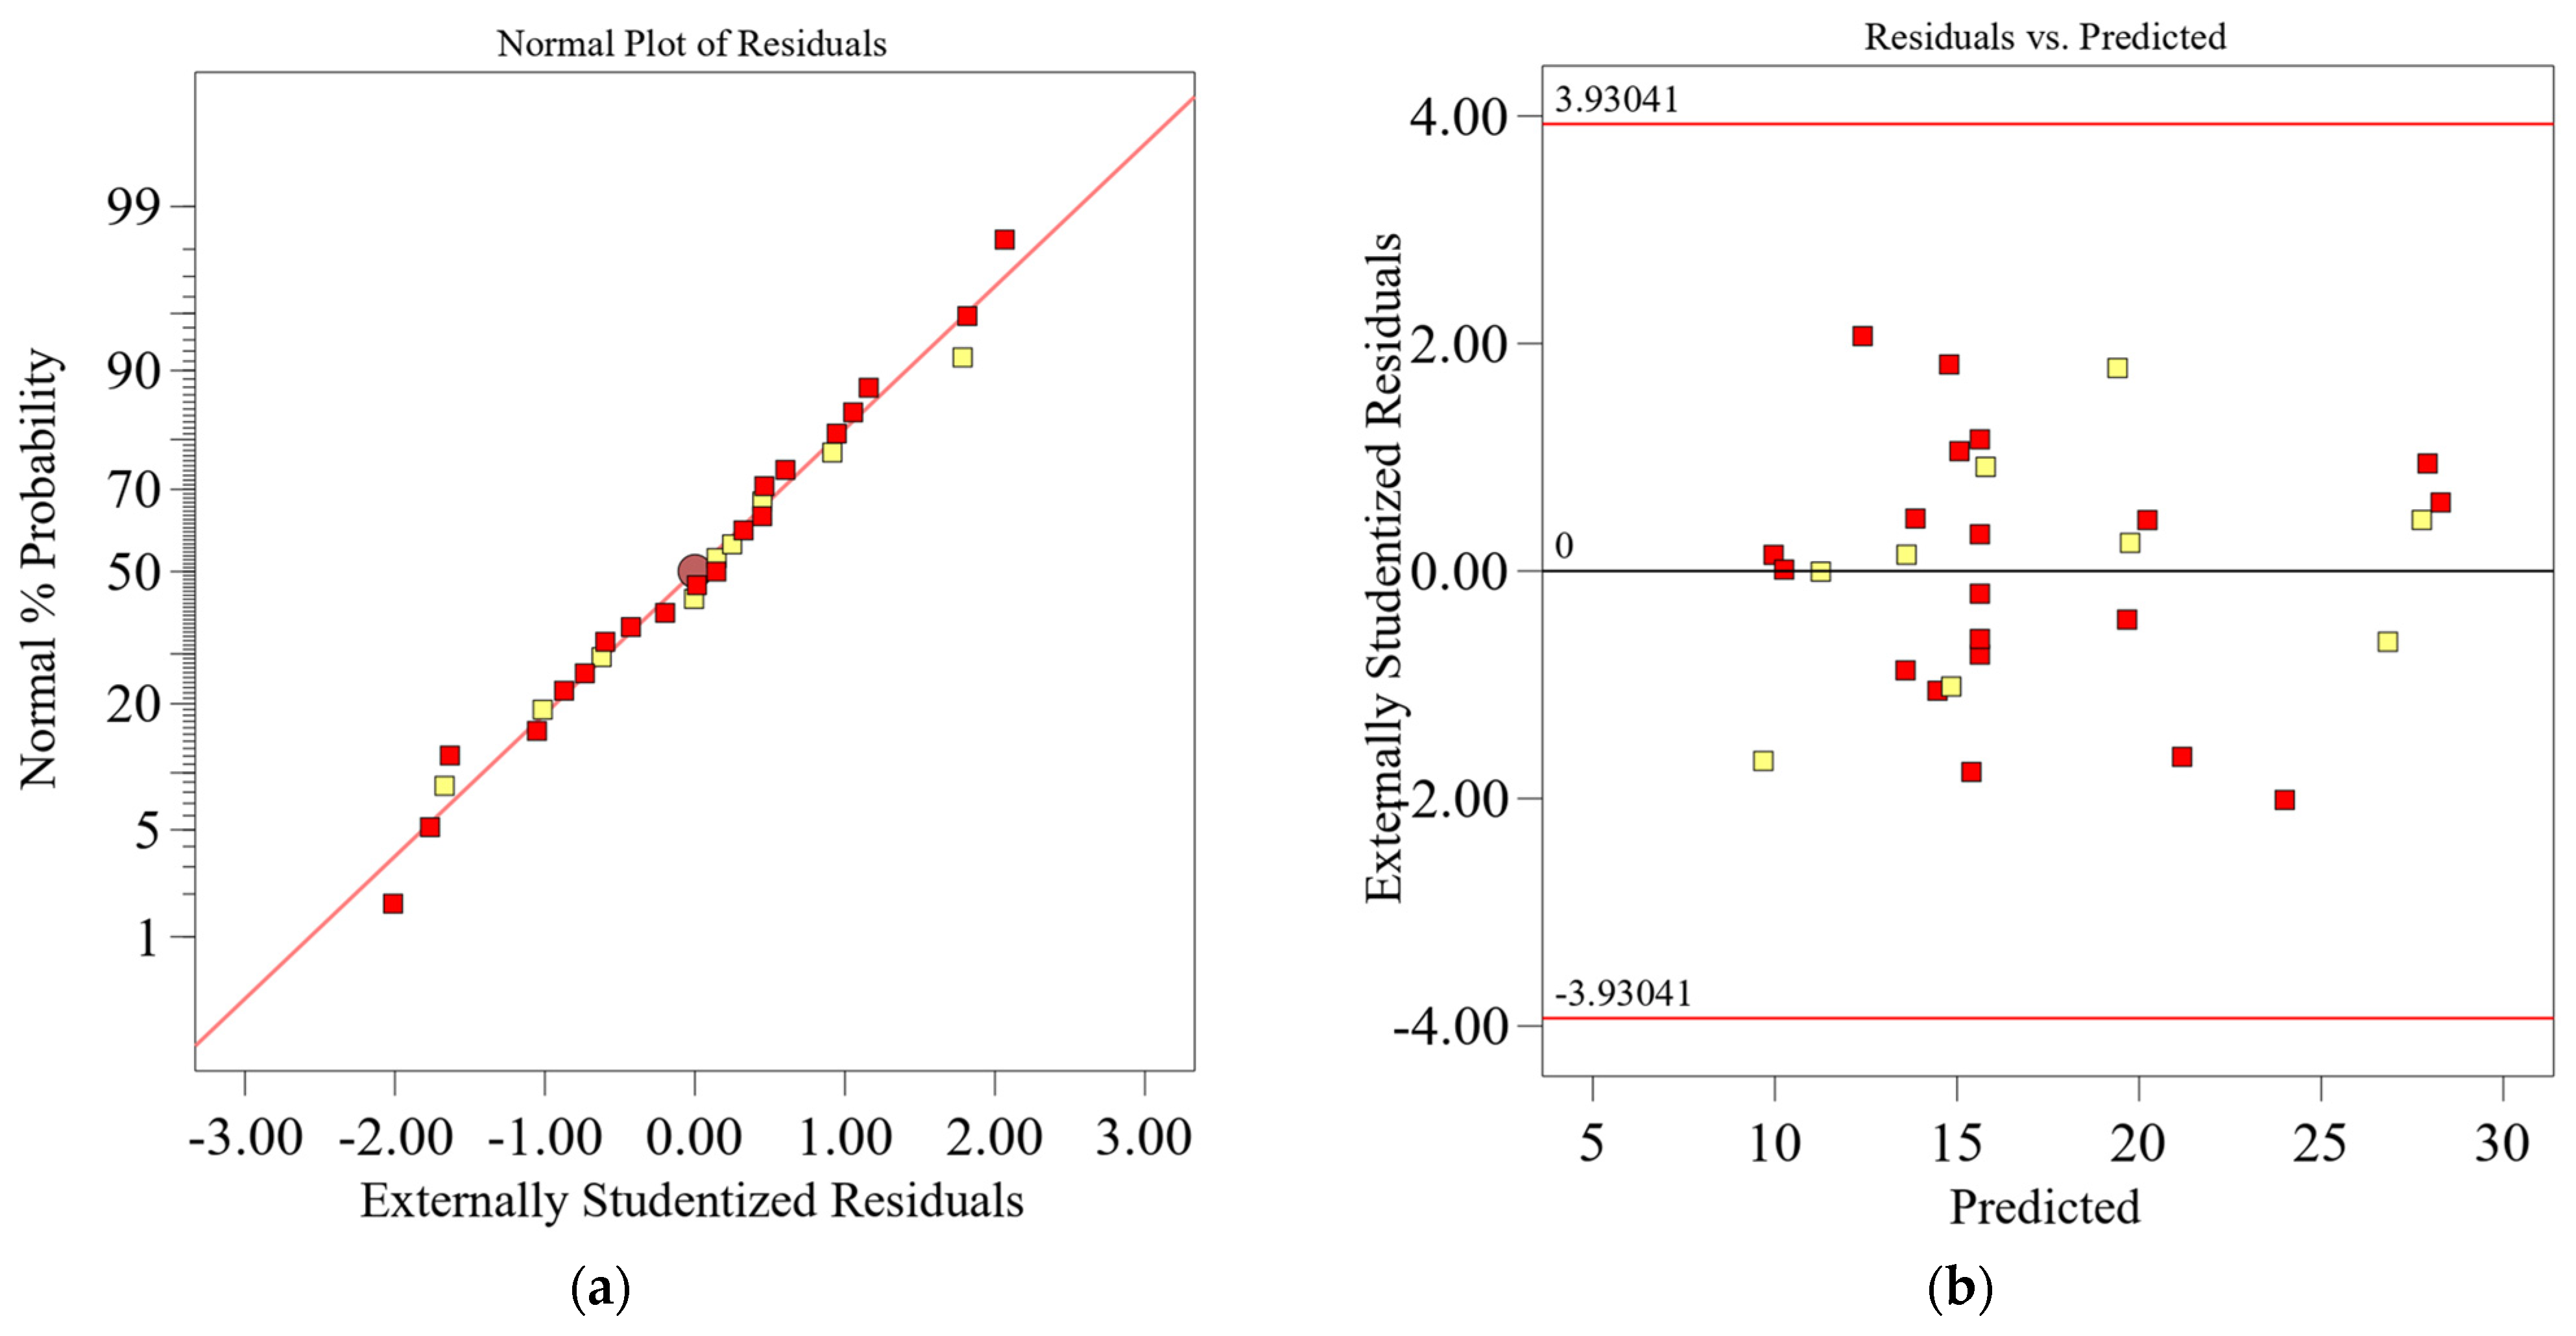
To verify the statistical adequacy of the developed response surface model, a diagnostic residual analysis was performed. Due to space limitations, only the diagnostic results of C11 detail fatigue stress with a small R2 value are given. The residual analysis is shown in Figure 10. The yellow and red squares in the Figure 10 correspond to Figure 9. Red represents the parameter combination with larger stress amplitude, and yellow represents the stress combination with smaller stress amplitude. The red line in Figure 10a is the theoretical normal distribution reference line, which is used to test whether the residual obeys the normal distribution. The red horizontal line in Figure 10b represents the critical value of the residual, which is used to determine which observation points may be outliers.
Figure 10.
Residual analysis of C11: (a) normal probability plot of residuals and (b) plot of residuals versus predicted response.
As shown in Figure 10a, the normal probability diagram of the residual indicates that the data points are approximately distributed along a straight line. This shows that the residuals obey the normal distribution and meet the basic assumptions of regression analysis. As shown in Figure 10b, the plot of residuals versus predicted values shows that the points in a horizontal band are randomly distributed without any obvious pattern or funnel shape. This confirms the constant variance of the error and shows that there is no systematic bias in the second-order model.
5. Multi-Objective Optimization of Structural Details
NSGA-III (Non-dominated Sorting Genetic Algorithm III) is an evolutionary algorithm for multi-objective optimization problems, especially for optimization scenarios with high target dimensions. As an extension of NSGA-II, NSGA-III shows stronger approximation ability when dealing with high-dimensional multi-objective optimization problems and can approach the real Pareto front more accurately [36,37,38,39]. The core idea of NSGA-III is to guide the evolution of the population by introducing Reference Points and Reference Directions, so that the solutions are evenly distributed along the Pareto front. In this paper, NSGA-III is used to solve the multi-objective optimization problem.
5.1. Multi-Objective Optimization Model
In this paper, the weight of the composite bridge deck W and the stress amplitude of 9 fatigue failure modes are selected as 10 objectives for structural optimization. Therefore, the multi-objective mathematical model of the steel–AAUHPC composite bridge deck can be expressed as Equation (15):
For the complex structural system of the steel–AAUHPC composite bridge deck, its fatigue performance is restricted by a variety of structural details, each of which corresponds to a variety of potential fatigue failure modes. This multiple failure mechanism is highly similar to the “bucket effect”—the overall fatigue life of the structure is often dominated by the failure mode with the lowest fatigue strength and the highest likelihood of failure. Due to the significant differences in the fatigue strength evaluation S-N curves applicable to different failure modes, it is difficult to accurately reflect the essential differences and control factors of structural fatigue performance if only the absolute value of stress amplitude of each structural detail under different failure modes is used as the optimization index in the multi-objective parameter optimization process. In view of this, this study proposes that the stress amplitude of the structural details under each fatigue failure mode ∆σi (i = 1, 2, ⋯⋯ 7) and the ratio S0 of the fatigue cut-off stress amplitude ∆σL corresponding to the respective failure mode are taken as the optimization objectives, and the maximum value of the ratio across the nine fatigue failure modes is defined as a key objective function, in order to realize the reasonable characterization and optimization control of the fatigue performance of the composite bridge deck.
Accordingly, the objective function can be expressed as Equation (16):
The constraint is imposed to ensure that the stress range of each structural detail does not exceed its corresponding cut-off stress range for any of the 9 fatigue failure modes. In other words, this condition guarantees that all structural details meet the criteria for infinite fatigue life across all 9 failure modes.
In summary, S0 converts the fatigue assessment based on absolute stress amplitude in Section 3 into a normalized relative index, which not only retains the engineering judgment criterion of “infinite life” but also reduces the dimension of the multi-objective optimization problem from 10 objectives to 2 objectives, making it possible to solve and explain the Pareto frontier.
5.2. Pareto Solution Set
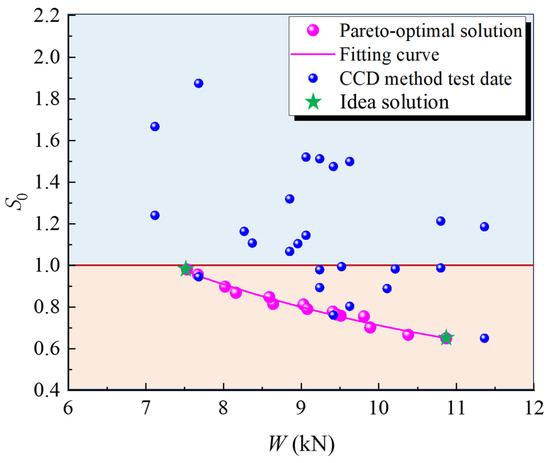
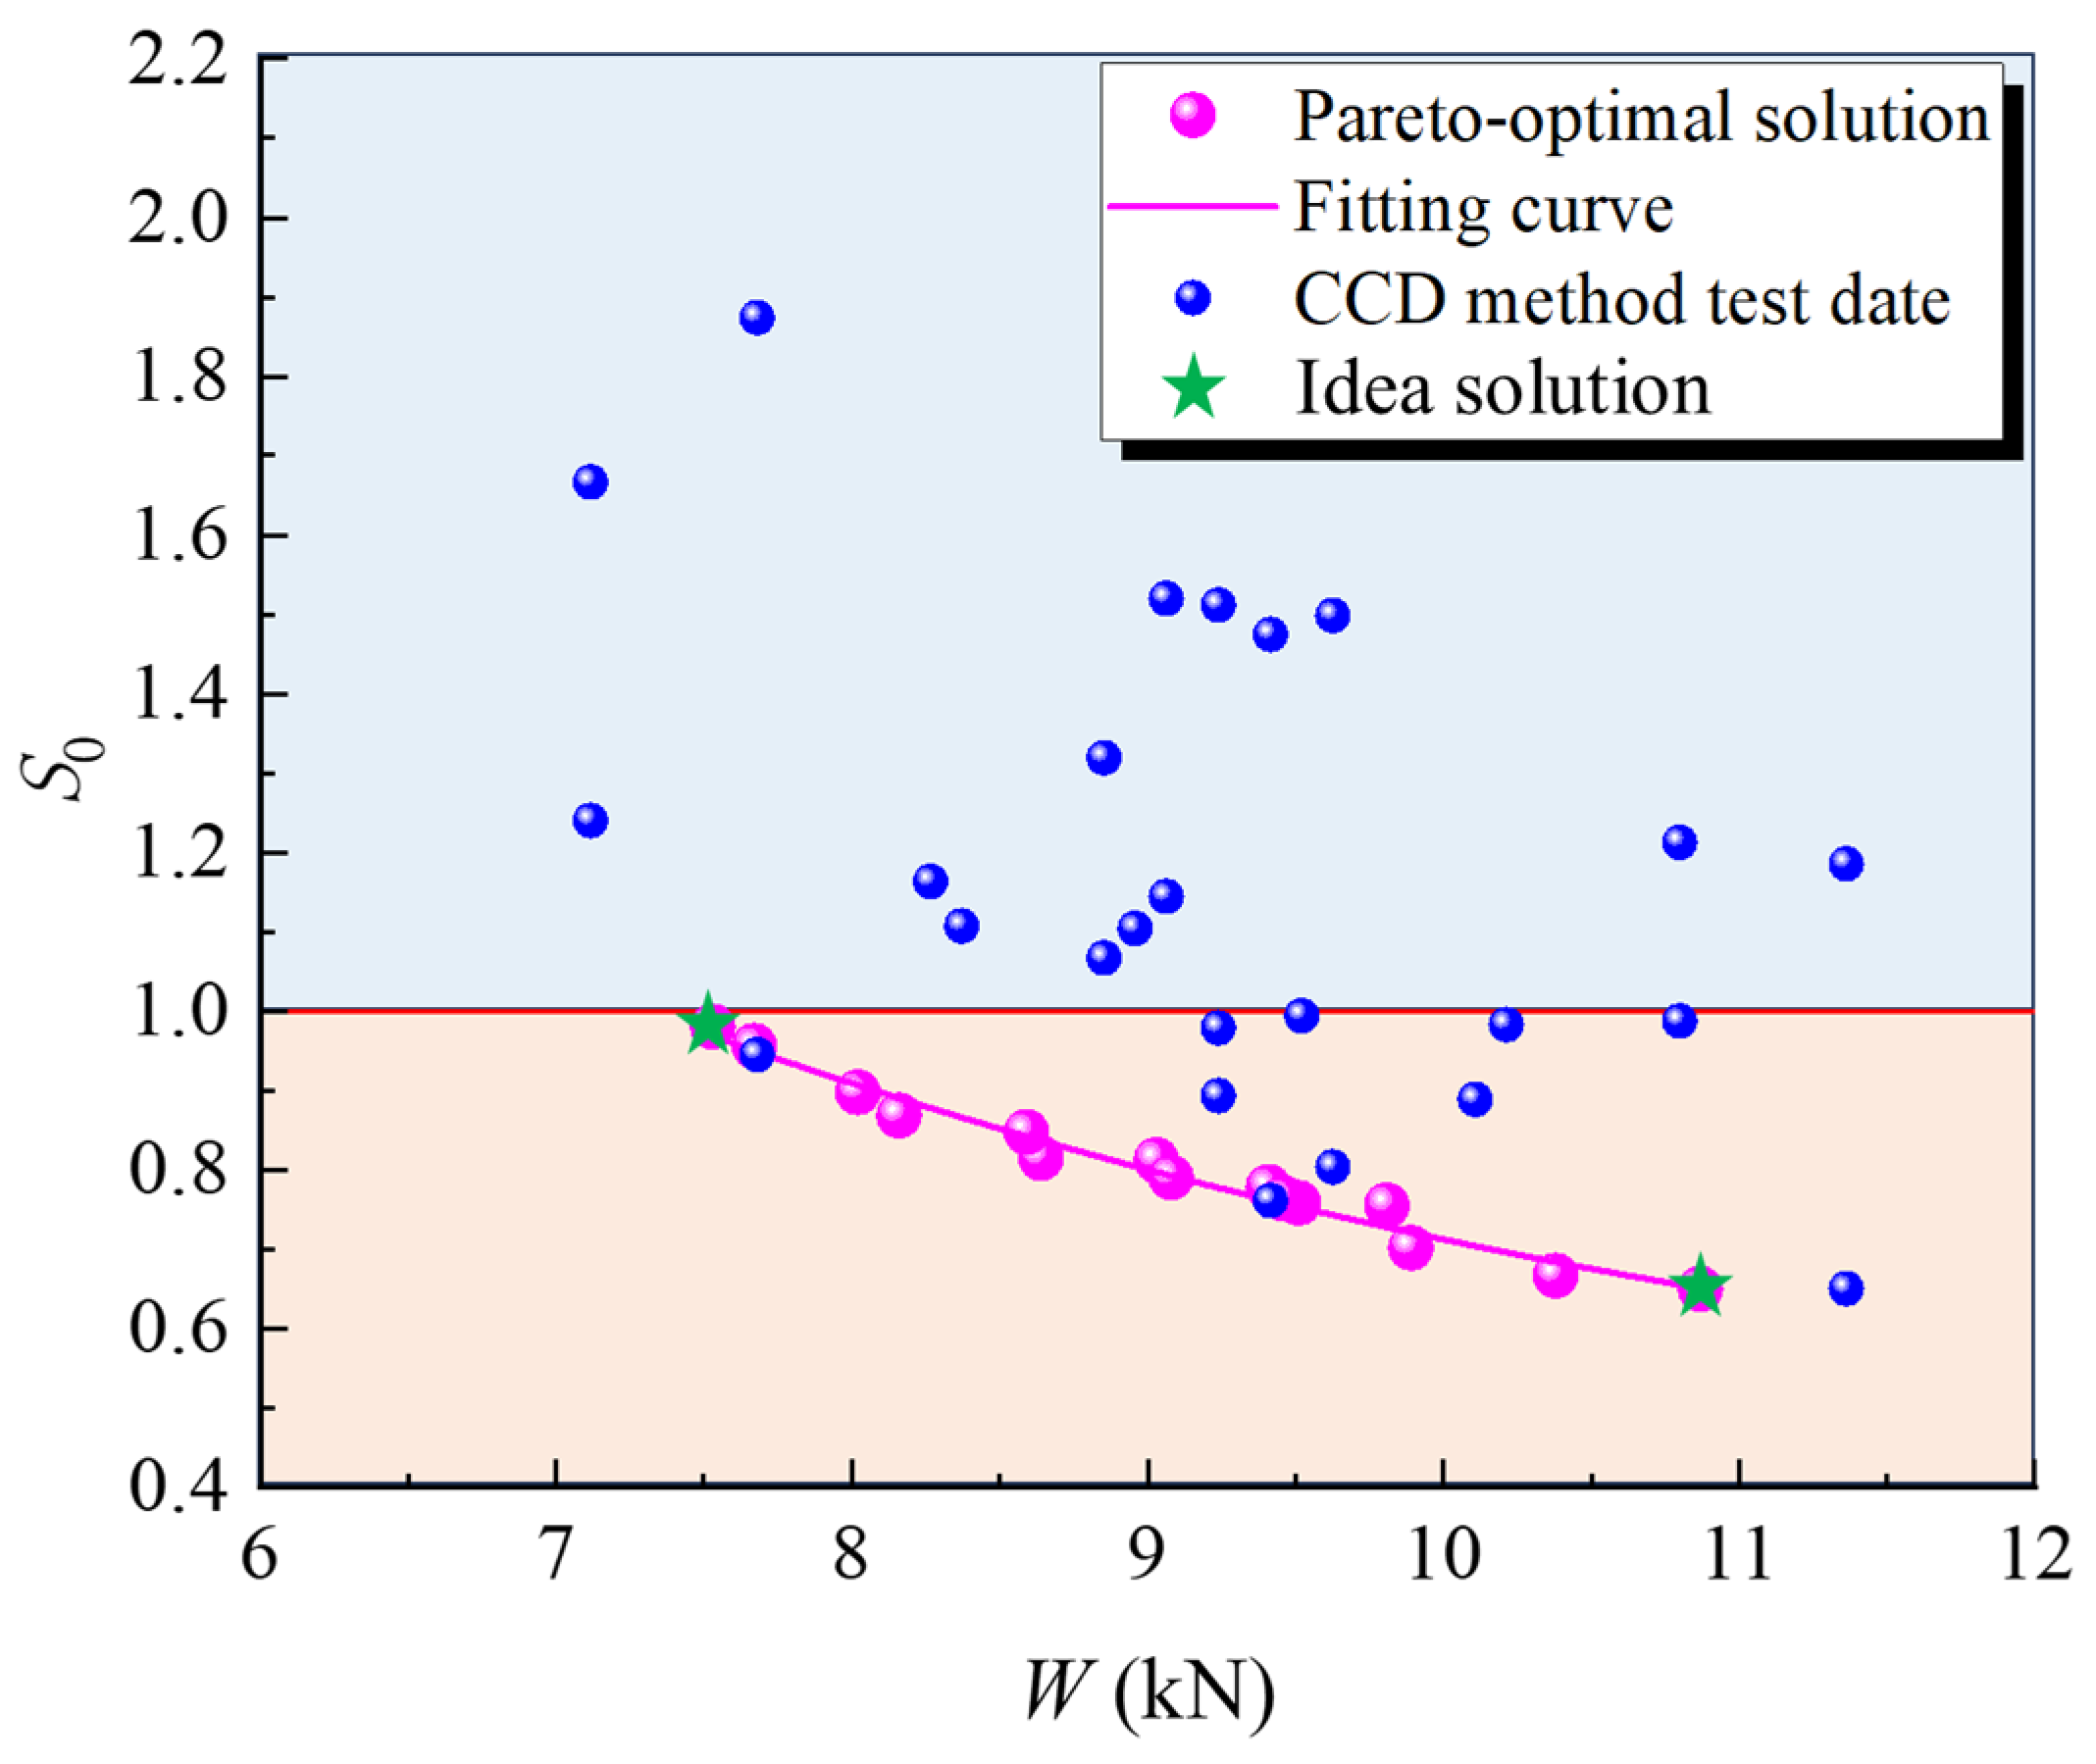
Based on the established mathematical surrogate model of the optimization target response surface, NSGA-III is used for optimization. The population size is 200; the crossover probability and mutation probability are 0.5 and 0.2, respectively. After 200 iterations, the Pareto solution set obtained by the result optimization tends to be stable, as shown in Figure 11. In the Figure 11, the red line is the boundary between infinite fatigue life and finite fatigue life. The blue and orange backgrounds are used to distinguish whether the test combination is in infinite fatigue life or finite fatigue life. The ideal solution represents the extreme-value solution under the limitation of the bridge deck weight W and S0, and the ideal solution of the bridge deck weight and S0 in the feasible region is located at the head and end of the Pareto front solution set. The fitting curve of the Pareto solution set is given in the figure. When S0 increases, W decreases. When S0 decreases, W increases. That is to say, the fitting curve clearly reflects the contradictory relationship between S0 and W.
Figure 11.
Pareto front solutions.
It can also be seen from Figure 11 that, for the Pareto front solution set, the target value of the two parameter combinations adopted by the CCD experimental design falls exactly on the global Pareto front obtained by NSGA-III (the two blue points and red points in Figure 11 overlap). This indicates that the test point itself is a global non-dominated optimal solution. This coincidence is a relatively positive signal. It first verifies the objective function for NSGA-III optimization; that is, the complex regression equation based on CCD data is accurate and reliable. Secondly, it establishes a strong correlation between the local experimental design and the global optimization results, which proves that the high-quality experimental data contains the Pareto-optimal solution, indicating that the CCD experimental design is successful.
In the Pareto front solution set, each solution corresponds to a design parameter combination that achieves optimal equilibrium under multiple optimization objectives. In practical engineering applications, the appropriate design scheme can be selected from the Pareto front according to the control requirements of structural weight for different span bridges and the specific requirements for fatigue performance. Specifically, for bridges with higher fatigue design standards and more stringent requirements for fatigue performance, it is appropriate to select the Pareto front solution concentrated on the right side, which usually corresponds to a lower fatigue stress amplitude or higher fatigue resistance and can better meet fatigue safety requirements. For long-span bridges, because the structural weight has a significant impact on the overall force and economy, the design should pay more attention to lightweight control. Therefore, the solution on the left side of the Pareto front solution set can be selected. This kind of solution usually corresponds to a lighter structural weight, which helps to achieve the weight control goal.
The design parameters corresponding to the Pareto front solution of W and S0 multi-objective optimization are shown in Table 6. In Table 6, U8 and U12 correspond to the ideal solution of the Pareto front solution set; that is, U12 corresponds to the lowest stress amplitude of various structural details, while the weight of the composite bridge deck is the highest. U8 corresponds to the lowest weight of the composite bridge deck, and the corresponding structural details have the highest stress amplitude.
Table 6.
Pareto solution sets and construction parameter combinations.
It is worth acknowledging that the multi-objective optimization process in this study is only carried out for four key geometric parameters, without considering factors such as shear stud spacing and material discreteness. Therefore, the optimization results obtained in this paper are only a conditional optimal solution in the current design space, which is not equivalent to the global optimal solution after considering all parameters.
6. Conclusions
In this paper, a steel–AAUHPC composite bridge deck with green and low-carbon advantages using U-rib double-sided welding is proposed. The fatigue detail stress amplitude of the composite bridge deck is obtained by ABAQUS finite element software analysis. The S-N curve method is used to evaluate its fatigue life, and the fatigue performance is compared with the orthotropic steel bridge deck and the steel–UHPC composite bridge deck. A mathematical regression model of the structural weight W and fatigue stress amplitude of each structural detail of the composite bridge deck is constructed by the response surface method, and the multi-objective optimization of structural details of the steel–AAUHPC composite bridge deck is carried out by NSGA-III. The following main conclusions can be drawn:
- AAUHPC is more economical and environmentally friendly. Compared with ordinary concrete, AAUHPC maintains a similar elastic modulus to ordinary concrete, and its compressive strength and splitting tensile strength are significantly improved. The compressive strength is about three times that of ordinary concrete, and the splitting tensile strength is about four times that of ordinary concrete, and it is close to the level of UHPC.
- Steel–AAUHPC can significantly improve the fatigue performance of the orthotropic steel bridge deck, and the improvement effect is close to that of the steel–UHPC composite bridge deck. After laying the AAUHPC layer, the maximum decrease in the fatigue stress amplitude of the orthotropic steel bridge deck is at fatigue structural detail C1, and the stress amplitude decreases by 69.4%. The decrease in detail C22 is the smallest, and the stress amplitude decreases by 8.3%. The steel–AAUHPC composite bridge deck shows infinite fatigue life for all details except C6.
- The response surface model was established by the CCD method and response surface method, and the weight W of the composite bridge deck and the stress of nine fatigue structural details were extracted. After model verification, the response surface regression model was statistically significant, and the model could be predicted intuitively and accurately.
- NSGA-III was used to optimize the structural details of the steel–AAUHPC composite bridge deck, and the Pareto-optimal solution set was obtained. The Pareto frontier shows that there is a significant mutual restriction relationship between the stress amplitude of the structural details and the structural weight W: the smaller the stress amplitude, the greater the structural weight; on the contrary, the larger the stress amplitude, the smaller the structural weight. Among the 15 sets of Pareto-optimal solutions obtained, U8 and U12 are the ideal solutions in the frontier solution set. Among them, solution U8 minimizes the weight of the bridge deck under the premise of satisfying the infinite-fatigue-life design criterion. The corresponding optimal combination of structural parameters is: pavement layer thickness of 40 mm, steel roof thickness of 10 mm, diaphragm thickness of 16 mm, and diaphragm spacing of 2400 mm.
Due to limitations in test conditions, only numerical analysis of the steel–AAUHPC composite bridge deck is carried out in this study, and the fatigue performance of the AAUHPC composite bridge deck has not been directly verified by experiments. In the future, full-scale model tests and theoretical research should be carried out, focusing on potential new fatigue hotspots such as the AAUHPC–steel interface and stud connection area, carbon emissions, and economic aspects associated with connection parts and construction required for AAUHPC application in real bridges, so as to further improve the evaluation method.
Author Contributions
Conceptualization, L.J. and M.Y.; methodology, L.J. and M.Y.; software, M.Y.; formal analysis, Y.S.; resources, L.J.; data curation, L.C.; writing—original draft preparation, M.Y.; writing—review and editing, J.L. and. B.L.; visualization, B.L.; supervision, B.L.; project administration, L.J.; funding acquisition, L.J. All authors have read and agreed to the published version of the manuscript.
Funding
This research was funded by the National Natural Science Foundation of China (52478125); Fundamental Research Funds for the Central Universities (300102213207); Construction Science and Technology Project of Department of Housing and Urban-rural Development of Gansu Province (JK2023-39); and Science and Technology Program of CSCEC AECOM Consultants Co., Ltd. (XBSZKY2207).
Data Availability Statement
Data are contained within the manuscript.
Conflicts of Interest
Author Bin Liu was employed by CSCEC AECOM Consultants Co., Ltd. The authors declare that this study was funded by the Science and Technology Program of CSCEC AECOM Consultants Co., Ltd. The funder was not involved in the study design, collection, analysis, or interpretation of data, the writing of this article, or the decision to submit it for publication.
References
- Zhang, Q.; Ma, Y.; Cui, C.; Chai, X.-Y.; Han, S.-H. Experimental investigation and numerical simulation on welding residual stress of innovative double-side welded rib-to-deck joints of orthotropic steel decks. J. Constr. Steel Res. 2021, 179, 106544. [Google Scholar] [CrossRef] [Scilit]
- Jiang, L.; Yuan, M.; Zou, B.; Liu, Y.; Yang, W. Study on the fatigue behaviour of orthotropic steel bridge deck with open T-shaped stiffeners. J. Southeast Univ. (Nat. Sci. Ed.) 2025, 55, 78–88. (In Chinese) [Google Scholar]
- Di, J.; Ruan, X.; Zhou, X.; Wang, J.; Peng, X. Fatigue assessment of orthotropic steel bridge decks based on strain monitoring data. Eng. Struct. 2021, 228, 111437. [Google Scholar] [CrossRef] [Scilit]
- Zhu, Z.; Xiang, Z.; Zhou, Y. Fatigue behavior of orthotropic steel bridge stiffened with ultra-high performance concrete layer. J. Constr. Steel Res. 2019, 157, 132–142. [Google Scholar] [CrossRef] [Scilit]
- Luo, P.; Zhang, Q.; Bao, Y.; Bu, Y. Fatigue performance of welded joint between thickened-edge U-rib and deck in orthotropic steel deck. Eng. Struct. 2019, 181, 699–710. [Google Scholar] [CrossRef] [Scilit]
- Kainuma, S.; Yang, M.; Jeong, Y.; Inokuchi, S.; Kawabata, A.; Uchida, D. Experimental investigation for structural parameter effects on fatigue behavior of rib-to-deck welded joints in orthotropic steel decks. Eng. Fail. Anal. 2017, 79, 520–537. [Google Scholar] [CrossRef] [Scilit]
- Masahiro, S.; Naoto, N.; Akiko, T. Effect of inside fillet weld on fatigue durability of orthortropic steel deck with trough ribs. Anthol. Steel Struct. Theory 2014, 21, 65–77. [Google Scholar]
- Dung, C.; Sasaki, E.; Tajima, K.; Suzuki, T. Investigations on the effect of weld penetration on fatigue strength of rib-to-deck welded joints in orthotropic steel decks. Int. J. Steel Struct. 2015, 15, 299–310. [Google Scholar] [CrossRef] [Scilit]
- Li, M. Fatigue Evaluation of Rib-to-Deck Joint in Orthotropic Steel Bridge Decks. Ph.D. Thesis, Southeast University, Nanjing, China, 2014. [Google Scholar]
- Mei, D.; Liao, G. Notch Stress Analysis of Welded Connection of New Type of Edge Upset U-Rib and Deck Plate. Bridge Constr. 2017, 47, 65–70. [Google Scholar]
- Guo, S.; Lei, J.; Huang, Z. Study on initial crack characteristics of inside weld in both-side welded U-rib. J. Cent. South Univ. (Sci. Technol.) 2021, 52, 3581–3594. (In Chinese) [Google Scholar]
- Liu, Y.; Chen, F.; Lu, N.; Wang, L.; Wang, B. Fatigue performance of rib-to-deck double-side welded joints in orthotropic steel decks. Eng. Fail. Anal. 2019, 105, 127–142. [Google Scholar] [CrossRef] [Scilit]
- Heng, J.; Zheng, K.; Gou, C.; Zhang, Y.; Bao, Y. Fatigue performance of rib-to-deck joints in orthotropic steel decks with thickened edge U-ribs. J. Bridge Eng. 2017, 22, 04017059. [Google Scholar] [CrossRef] [Scilit]
- Li, X.; Fu, Z.; Ji, B.; Sun, G. Fatigue performance of deck-rib double-side welded joints considering asymmetric stress cycling. J. Constr. Steel Res. 2024, 221, 108913. [Google Scholar] [CrossRef] [Scilit]
- Ya, S.; Yamada, K.; Ishikawa, T. Fatigue evaluation of rib-to-deck welded joints of orthotropic steel bridge deck. J. Bridge Eng. 2011, 16, 492–499. [Google Scholar] [CrossRef] [Scilit]
- Shao, X.; Yi, D.; Huang, Z.; Zhao, H.; Chen, B.; Liu, M. Basic performance of the composite deck system composed of orthotropic steel deck and ultrathin RPC layer. J. Bridge Eng. 2013, 18, 417–428. [Google Scholar] [CrossRef] [Scilit]
- Murakoshi, J.; Yanadori, N.; Ishii, H. Research on steel fiber reinforced concrete pavement for orthotropic steel deck as a countermeasure for fatigue. Stress 2008, 1, 1–13. [Google Scholar]
- Liu, Y.; Shi, C.; Zhang, Z.; Li, N.; Shi, D. Mechanical and fracture properties of ultra-high performance geopolymer concrete: Effects of steel fiber and silica fume. Cem. Concr. Compos. 2020, 112, 103665. [Google Scholar] [CrossRef] [Scilit]
- Zhao, S.; Yang, Y.; Liu, J.; Liu, R. Rice husk ash and recycled sand as synergistic substitutes in ultra-high performance concrete: Microstructural, mechanical performance, and eco-economic analysis. Constr. Build. Mater. 2024, 453, 138945. [Google Scholar] [CrossRef] [Scilit]
- Hou, M.; Li, Z.; Li, V. Green and durable engineered cementitious composites (GD-ECC) with recycled PE fiber, desert sand, and carbonation curing: Mixture design, durability performance, and life-cycle analysis. Constr. Build. Mater. 2024, 414, 134984. [Google Scholar] [CrossRef] [Scilit]
- Zhang, Z.; Zhu, H.; Zhou, C.; Wang, H. Geopolymer from kaolin in China: An overview. Appl. Clay Sci. 2016, 119, 31–41. [Google Scholar] [CrossRef] [Scilit]
- Rabi, M.; Abarkan, I.; Sarfarazi, S.; Ferreira, F.P.V.; Alkherret, A.J. Automated design and optimization of concrete beams reinforced with stainless steel. Struct. Concr. 2025. [Google Scholar] [CrossRef] [Scilit]
- Pu, B.; Liu, B.; Li, L.; Jiang, L.; Zhou, J.; Ding, P. Using rice husk ash in alkali-activated ultra-high-performance concrete: Flowability, early age strength and elasticity modulus. Constr. Build. Mater. 2024, 443, 137771. [Google Scholar] [CrossRef] [Scilit]
- Shao, X.; Qiu, M.; Li, X.; Chen, B.; Zhang, L. A Review on the Research and Application of Ultra-high Performance Concrete in Bridge Engineering Around the World. China Civ. Eng. J. 2021, 54, 1–13. (In Chinese) [Google Scholar]
- Zhang, Q.; Pu, Y.; Chen, C.; Yi, Z. Review on Fatigue Problems of Orthotropic Steel Bridge Deck. China J. Highw. Transp. 2017, 30, 14–30. (In Chinese) [Google Scholar]
- Xiao, Z.; Yamada, K.; Ya, S. Stress analyses and fatigue evaluation of rib-to-deck joints in steel orthotropic decks. Int. J. Fatigue 2008, 30, 1387–1397. [Google Scholar] [CrossRef] [Scilit]
- Wang, Y.; Li, Z.; Li, A. Combined use of SHMS and finite element strain data for assessing the fatigue reliability index of girder components in long-span cable-stayed bridge. Theor. Appl. Fract. Mech. 2010, 54, 127–136. [Google Scholar] [CrossRef] [Scilit]
- JTG D64-2015; Standard Chinese, Specifications for Design of Highway Steel Bridge. China Communications Press: Beijing, China, 2015. (In Chinese)
- BS EN 1993-1-9; Standard British, Eurocode 3: Design of Steel Structures—Part 1-9: Fatigue. British Standards Institution: London, UK, 2005.
- Huang, Y.; Zhang, Q.; Bao, Y.; Bu, Y. Fatigue assessment of longitudinal rib-to-crossbeam welded joints in orthotropic steel bridge decks. J. Constr. Steel Res. 2019, 159, 53–66. [Google Scholar] [CrossRef] [Scilit]
- Wu, W.; Veljkovic, M.; Kolstein, H.; Maljaars, J.; Pijpers, R. Fatigue behaviour of toe and root stiffener cracks in stiffener-to-deck plate weld of orthotropic bridge decks. Eng. Struct. 2024, 305, 117740. [Google Scholar] [CrossRef] [Scilit]
- Jiang, L.; Liu, Y.; Liu, B.; Zhang, L.; Wang, H. Joint fatigue assessment of concrete-filled steel tubular arch bridge based on hot spots tress method. Bridge Constr. 2022, 52, 69–76. [Google Scholar]
- Connor, R.J. Manual for Design, Construction, and Maintenance of Orthotropic Steel Deck Bridges; Federal Highway Administration (FHWA): McLean, VA, USA, 2012. [Google Scholar]
- Kallias, A.; Rafiq, M. Performance assessment of corroding RC beams using response surface methodology. Eng. Struct. 2013, 49, 671–685. [Google Scholar] [CrossRef] [Scilit]
- Zeng, J.; Sun, H.; Xia, J.; Feng, S.-Z.; Zhao, B.; Zhou, J.-K.; Zhuge, Y. Bond behavior between concrete and thermoplastic GFRP bars with novel surface features. Eng. Struct. 2025, 343, 121161. [Google Scholar] [CrossRef] [Scilit]
- Cui, Z.; Chang, Y.; Zhang, J.; Cai, X.; Zhang, W. Improved NSGA-III with selection-and-elimination operator. Swarm Evol. Comput. 2019, 49, 23–33. [Google Scholar] [CrossRef] [Scilit]
- Yi, J.; Xing, L.; Wang, G.; Dong, J.; Vasilakos, A.V.; Alavi, A.H.; Wang, L. Behavior of crossover operators in NSGA-III for large-scale optimization problems. Inf. Sci. 2020, 509, 470–487. [Google Scholar] [CrossRef] [Scilit]
- Ma, H.; Zhang, Y.; Sun, S.; Liu, T.; Shan, Y. A comprehensive survey on NSGA-II for multi-objective optimization and applications. Artif. Intell. Rev. 2023, 56, 15217–15270. [Google Scholar] [CrossRef] [Scilit]
- Wang, Z.; Sun, S.; Ding, Y. Fatigue Optimization of Structural Parameters for Orthotropic Steel Bridge Decks Using RSM and NSGA-II. Math. Probl. Eng. 2022, 2022, 4179898. [Google Scholar] [CrossRef] [Scilit]

Disclaimer/Publisher’s Note: The statements, opinions and data contained in all publications are solely those of the individual author(s) and contributor(s) and not of MDPI and/or the editor(s). MDPI and/or the editor(s) disclaim responsibility for any injury to people or property resulting from any ideas, methods, instructions or products referred to in the content. |
© 2026 by the authors. Licensee MDPI, Basel, Switzerland. This article is an open access article distributed under the terms and conditions of the Creative Commons Attribution (CC BY) license.