


Abstract
This paper proposes a multi-strategy hybrid-enhanced Educational Competition Optimizer (MEECO) to improve the performance of swarm-based optimization algorithms in complex search environments. From the perspective of symmetry, population-based optimization algorithms inherently rely on the symmetric distribution and evolution of individuals in the search space, while the imbalance between exploration and exploitation often leads to symmetry breaking, resulting in premature convergence and loss of diversity. Unlike the standard ECO, which suffers from limited information exchange, premature convergence, and boundary stagnation, the proposed method integrates three complementary mechanisms: adaptive differential evolution, vertical crossover, and global-best-guided boundary handling. Specifically, the adaptive differential evolution strategy enhances global exploration and maintains population distribution symmetry through dynamic mutation, the vertical crossover mechanism improves inter-dimensional symmetry and information interaction, and the boundary-handling strategy restores symmetry by guiding infeasible solutions back to promising regions. These strategies jointly improve population diversity, exploration–exploitation balance, and convergence efficiency while preserving structural symmetry in the search process. Extensive experiments on CEC2017 and CEC2022 benchmark suites demonstrate that MEECO consistently achieves superior optimization accuracy, faster convergence speed, and stronger robustness compared with several state-of-the-art algorithms. Statistical analyses further confirm the significance and reliability of the improvements. In addition, the proposed method is applied to a wireless sensor network node deployment problem, where it significantly improves coverage rate and deployment uniformity. The results indicate that MEECO provides an effective, robust, and symmetry-preserving optimization framework for both benchmark problems and real-world engineering applications.
1. Introduction
With the continuous advancement of Internet of Things (IoT) technologies, smart infrastructures, and large-scale monitoring systems, Wireless Sensor Networks (WSNs) have become a fundamental component for distributed information perception and transmission. By integrating sensing, computing, and wireless communication capabilities into compact sensor nodes, WSNs enable collaborative data acquisition over large geographical areas. Owing to these characteristics, WSNs have been extensively deployed in diverse application domains, including precision agriculture, industrial process monitoring, disaster prevention and early warning, healthcare systems, and environmental surveillance [1,2,3]. For instance, in agricultural irrigation systems, WSNs facilitate real-time monitoring of soil moisture and temperature, while in forest fire detection scenarios, sensor nodes can rapidly identify abnormal environmental conditions to trigger early alarms. In industrial environments, continuous monitoring via WSNs helps improve operational reliability and reduce unexpected equipment failures [4,5,6].
From a theoretical perspective, symmetry plays an important role in optimization problems and algorithm design. Many real-world optimization problems exhibit certain forms of structural or spatial symmetry, such as symmetric search spaces, equivalent solution regions, and balanced objective landscapes. In swarm intelligence algorithms, symmetry is reflected in the distribution of individuals, the interaction among agents, and the evolution of populations [7]. Maintaining or exploiting such symmetry can help algorithms achieve more balanced exploration and avoid biased search behaviors. Conversely, the loss of symmetry in population distribution may lead to premature convergence and stagnation in local optima.
Compared with conventional wired monitoring solutions, WSNs offer advantages such as flexible deployment, reduced installation cost, and wide-area coverage. Nevertheless, the effectiveness of a WSN is highly dependent on how sensor nodes are deployed within the target region [8,9]. An inappropriate deployment strategy may significantly degrade network performance, directly affecting coverage quality, sensing accuracy, energy efficiency, and communication connectivity [10,11,12]. Sparse node placement often leads to uncovered regions, resulting in information loss, whereas excessive clustering of nodes can cause redundant sensing, increased energy consumption, communication interference, and shortened network lifetime [13,14,15]. Therefore, under practical constraints such as limited node quantity and finite deployment areas, determining an optimal node deployment strategy that balances coverage performance and resource utilization has become a critical research issue in WSN design and implementation.
From a computational perspective, WSN node deployment optimization is inherently a complex NP-hard problem, characterized by high dimensionality, strong nonlinearity, and conflicting objectives. One of the key challenges lies in balancing coverage maximization with energy efficiency. Sensor nodes are typically powered by limited-capacity batteries, and increasing coverage often requires denser node placement, which in turn accelerates energy depletion and shortens network lifetime [16,17,18,19]. For example, blindly increasing the number of nodes to achieve higher coverage may reduce sensing gaps but simultaneously intensify communication overhead and power consumption, ultimately compromising network stability.
Due to these challenges, traditional optimization techniques such as exhaustive search and gradient-based methods are generally unsuitable for solving WSN deployment problems, especially in large-scale or constrained environments. In contrast, intelligent optimization algorithms have emerged as effective alternatives owing to their strong global search ability, independence from gradient information, and adaptability to complex search spaces [20,21,22,23]. These algorithms typically draw inspiration from biological behaviors or natural processes—such as swarm foraging, predator–prey interactions, or physical phenomena—and achieve optimization through iterative information exchange and cooperative evolution among population members [24,25,26].
Intelligent optimization algorithms exhibit several advantages when applied to WSN node deployment. First, their population-based nature enables broad exploration of the solution space, reducing the likelihood of premature convergence to local optima [27,28,29]. Second, they demonstrate strong robustness and flexibility, allowing them to handle non-convex, discontinuous, and constraint-rich optimization problems without strict assumptions on problem structure. Third, these algorithms possess good scalability, making them suitable for deployment scenarios ranging from small monitoring areas to large-scale smart city environments by adjusting algorithm parameters or strategy components [30,31,32].
In recent years, numerous studies have demonstrated the effectiveness of intelligent optimization algorithms in WSN deployment. For example, Muhammad Suhail Shaikh et al. proposed an Improved Chaotic Gray Wolf Optimization (ICGWO) algorithm to enhance WSN coverage and connectivity while addressing challenges such as high deployment cost, limited coverage, and insufficient network connection [33]. Wang Liang developed a Particle Swarm Optimization (PSO) algorithm to optimize the deployment of electronic information sensing nodes, focusing on maximizing monitoring area coverage while minimizing energy consumption [34]. Yinghua Tong et al. introduced an Enhanced Hybrid Particle Swarm Optimization (EHPSO) algorithm that integrates a Spatial Position Encoding (SPE) strategy to improve coverage performance while dynamically adjusting the number of deployed sensor nodes in the WSN [35]. Bhargavi et al. aimed to improve network coverage by defining the optimal locations of sensor nodes before deployment on a given network topology and proposed an Enhanced Particle Swarm Optimization (EPSO) variant targeting different frequency bands to further expand the coverage area [36]. Ying Li et al., leveraging the strong performance of artificial intelligence algorithms, proposed a Virtual Force-Guided Improved Sand Cat Swarm Optimization (VF-ISCSO) algorithm to enhance sensor node coverage and reduce coverage holes [37]. To address the coverage problem caused by random node deployment in forest fire monitoring systems, Guohao Wang et al. proposed a Modified Marine Predators Algorithm (MMPA) to effectively improve WSN coverage in such environments [38]. Meng et al. [39] proposed an Advanced Secretary Bird Optimization Algorithm (ASBOA) that simulates the predatory behavior of secretary birds to balance coverage and energy consumption; however, it suffers from decreased population diversity when dealing with multimodal solution spaces. These studies collectively indicate that intelligent optimization algorithms provide feasible and effective approaches for WSN node deployment. Nevertheless, existing algorithms still exhibit room for improvement, particularly in balancing global exploration and local exploitation, maintaining population diversity, and enhancing convergence precision in complex optimization environments.
The Educational Competition Optimizer (ECO), proposed by Lian et al. [40] in 2024, is a relatively new swarm intelligence algorithm inspired by the hierarchical learning and competition processes in educational systems. ECO models the population evolution through multiple learning stages corresponding to primary school, middle school, and high school, offering a novel perspective for population-based optimization [41]. Despite its innovative design, the standard ECO algorithm exhibits several shortcomings in practical applications. In particular, its update mechanism relies heavily on following behaviors between schools and students, resulting in limited information exchange among individuals and a rapid decline in population diversity. Moreover, the use of simple boundary truncation strategies may cause individuals to stagnate near search boundaries, negatively affecting convergence performance [42,43].
From the perspective of symmetry, these limitations can be interpreted as a gradual symmetry breaking in the population evolution process. The lack of sufficient information exchange and independent dimension updates disrupts the symmetric distribution of individuals in the search space, leading to biased convergence toward local regions. Therefore, restoring and maintaining symmetry in both population distribution and inter-dimensional interactions are essential for improving the global search capability and robustness of optimization algorithms.
To address these issues and meet the growing demand for optimization algorithms with strong global search capability, high-dimensional adaptability, and engineering applicability, this paper proposes a Multi-Strategy Enhanced Educational Competition Optimizer (MEECO). The proposed algorithm extends the original ECO framework by integrating three complementary improvement strategies. Specifically, an adaptive differential evolution mechanism is introduced to enhance information sharing and dynamically balance exploration and exploitation. A vertical crossover strategy is designed to strengthen coordination among different dimensions within candidate solutions. In addition, a global-best-guided boundary-handling strategy is employed to guide infeasible solutions toward promising regions and alleviate boundary-induced stagnation.
Although several improved variants of ECO and other metaheuristic algorithms have been proposed in recent years [42,43], most existing approaches primarily focus on single-strategy enhancements or loosely coupled hybrid mechanisms. These improvements often lack coordinated design for balancing exploration and exploitation across different search stages.
In contrast, this study proposes a tightly integrated multi-strategy framework, where each component plays a complementary role: adaptive differential evolution enhances global exploration, vertical crossover strengthens intra-individual cooperation, and global-best-guided boundary handling improves convergence behavior near constraints. This coordinated design distinguishes the proposed method from existing hybrid approaches and forms the core contribution of this work.
The main contributions of this study can be summarized as follows:
- (1)
- A multi-strategy enhanced educational competition optimizer (MEECO) is developed by incorporating adaptive differential evolution, vertical crossover, and global-best-guided boundary-handling mechanisms into the ECO framework.
- (2)
- Extensive experiments on the CEC2017 and CEC2022 benchmark suites demonstrate that MEECO significantly outperforms the original ECO and several state-of-the-art metaheuristic algorithms in terms of optimization accuracy, convergence speed, and robustness, with statistical validation using Wilcoxon rank-sum and Friedman tests.
- (3)
- The proposed MEECO is successfully applied to the wireless sensor network node deployment problem, where it achieves higher coverage rates, improved deployment uniformity, and enhanced stability, confirming its practical engineering applicability.
The remainder of this paper is organized as follows. Section 2 introduces the basic principles of the ECO algorithm and details the proposed enhancement strategies in MEECO. Section 3 presents comprehensive experimental evaluations on benchmark test suites. Section 4 applies MEECO to WSN node deployment optimization and analyzes its practical performance. Finally, Section 5 concludes the paper and discusses future research directions.
2. Educational Competition Optimizer (ECO) and the Proposed Methodology
2.1. Educational Competition Optimizer (ECO)
2.1.1. Population Initialization
Unlike other metaheuristic algorithms, the Educational Competition Optimization (ECO) algorithm employs a logistic chaotic mapping mechanism to generate the initial population. This approach is designed to simulate the phenomenon of social disorder that arises from a lack of education. Let the population size be denoted as , and the problem search space be defined by the lower and upper bounds and , respectively. The initialization process using logistic chaotic mapping can be formulated as Equation (1) [40]:
where represents the chaotic value and denotes the previous value. The parameter is a constant, which is set to four in this study. Subsequently, the chaotic sequence is mapped onto the search space using Equation (2):
2.1.2. Primary School Stage
In the elementary school stage, the ECO algorithm divides the population into two distinct sub-populations. At each iteration, individuals are ranked according to their fitness values, with the top 20% designated as school agents and the remaining 80% as student agents. School agents determine their optimal positions by analyzing the average position of the population, while student agents select which school to attend based on their distance to nearby schools. This approach reflects the characteristics of the initial exploration phase, where schools and students face relatively few constraints when searching for potential positions. The mathematical formulations describing the behaviors of school and student agents are presented in Equation (3) [40,43].
where and denote the current and updated positions of the agent, respectively; represents the mean position vector of the school agent; is a random vector following a Lévy distribution; denotes the nearest school position to ; is a normally distributed random variable; and and indicate the current iteration number and the maximum number of iterations, respectively.
2.1.3. Middle School Stage
In the middle school stage, the ECO algorithm continues to divide the population into school agents and student agents. Individuals are ranked according to their fitness values, with the top 10% designated as school agents and the remaining 90% as student agents. School agents adopt a more advanced strategy for position updating, which considers both the average position of the population and the position of the best agent. Similarly, student agents select schools to attend based on their distances to nearby schools. Moreover, student agents are further divided into two groups according to their academic potential. The mathematical expressions describing the behaviors of school and student agents in this stage are given in Equation (5) [43]:
where denotes the position of the best school agent, is the average position of all agents, and is a random number in the range [0, 1] used to simulate different students’ talent. The threshold parameter is set to 0.5.
2.1.4. High School Stage
In the high school stage, the ECO algorithm continues to divide the population into school agents and student agents, maintaining the same sub-population ratio as in the middle school stage. School agents adopt a more cautious strategy when selecting positions, taking into account not only the average position of the population but also the positions of the best and worst agents. This comprehensive evaluation allows schools to make more reasonable decisions, thereby better accommodating the broader needs of the student population. In contrast, student agents choose to attend the currently best-performing school. The mathematical expressions describing the behaviors of school and student agents are given in Equation (8) [43]:
where denotes the position of the worst school agent, and the random number represents the talent of individual students.
2.2. Proposed Multi-Strategy Enhanced Educational Competition Optimizer (MEECO)
2.2.1. Adaptive Differential Evolution Strategy
The standard ECO algorithm tends to fall into local optima in the later stages of iteration due to the decline in population diversity. Its agent updates rely solely on the “School–Students” mechanism (as shown in Equations (3), (5), and (8)), lacking cross-individual information exchange and mutation capabilities, which limits its ability to explore global optima in complex multimodal problems. To address this limitation, the MEECO algorithm incorporates an adaptive Differential Evolution (DE) strategy, which employs a dynamically adjusted mutation factor and a global-best-guided crossover operation to efficiently recombine population information and guide the search, thereby balancing global exploration with local exploitation.
The mutation factor controls the magnitude of mutation and linearly decreases from to over the iterations, as given by the following:
where , denote the minimum and maximum mutation factors, is the maximum number of iterations, and is the current iteration. As the iteration progresses, linearly decreases from to , enabling a smooth transition from global exploration in early iterations to local exploitation in later iterations.
Two distinct individuals and are randomly selected from the population and a mutant vector is generated under the guidance of the global-best individual :
Compared with the traditional DE mutation based solely on random individuals, this formulation directs the mutation toward the global-best region, avoiding ineffective exploration. To balance the information between the mutant and the original individual, a binomial crossover is performed to generate a trial vector , followed by greedy selection to retain the superior individual. The crossover operation is expressed as follows:
where is the offspring after crossover, is the dimension index, is a randomly selected crossover dimension, is the dimension of the original agent, is a uniformly distributed random number in [0, 1], and the crossover probability is set to 0.4 in this study.
As illustrated in Figure 1, this strategy executes a “mutation–crossover–selection” procedure for each individual in the population, with the mutation factor adaptively adjusted over iterations, ensuring broad exploration in the early stage and high convergence accuracy in the later stage.
Figure 1.
Schematic diagram of adaptive differential evolution strategy.
2.2.2. Vertical Crossover Strategy
In the standard ECO algorithm, individual updates follow a “dimension-wise independent adjustment” scheme—each dimension is updated solely based on its own historical position or the corresponding school position, without considering the information correlation between different dimensions within an individual. This often leads to insufficient inter-dimensional cooperation in high-dimensional problems: when some dimensions are trapped in local optima, the optimization potential of other dimensions cannot be effectively utilized, resulting in stagnation of individual evolution. To address this issue, the MEECO algorithm introduces a vertical crossover strategy, which recombines positional information across different dimensions within an individual, thereby achieving inter-dimensional information complementation and cooperative optimization.
The vertical crossover strategy focuses on information interaction and optimization among dimensions within an individual. For each individual in the population, two distinct dimensions and () are randomly selected, and the crossover operation is performed according to the following formula to generate a new solution:
where is a random parameter that flexibly adjusts the weight allocation during dimension crossover. This mechanism allows the algorithm to exploit potential correlations between different dimensions within an individual and to finely tune the solution according to the varying characteristics of each dimension in high-dimensional problems.
As illustrated in Figure 2, this strategy overcomes the limitations of traditional dimension-independent updates by enabling inter-dimensional information sharing and cooperation. The weighting coefficient ensures a smooth transition of information between dimensions. Moreover, the strategy operates solely within each individual, keeping the computational complexity low while enhancing optimization efficiency in high-dimensional scenarios without increasing the overall algorithmic burden.
Figure 2.
Schematic diagram of the vertical crossover strategy.
2.2.3. Global-Best-Guided Boundary-Handling Strategy
In the standard ECO algorithm, out-of-bound individuals are handled using a “hard boundary truncation” strategy—when or , the value is directly truncated to or (the boundary-handling logic is implicit in the original formulation). Although simple, this approach can easily trap individuals at the boundary local optima: truncated positions are fixed at the boundary, losing the ability to converge toward the core population region (where resides). Especially in later iterations, a large number of boundary individuals can reduce the overall optimization efficiency of the population.
To overcome this limitation, the MEECO algorithm proposes a global-best-guided boundary-handling strategy, which adjusts the positions of out-of-bound individuals based on , ensuring their convergence toward the effective search region.
For each out-of-bound dimension , a new value is generated using the position of the global-best individual in that dimension, as follows:
As illustrated in Figure 3, this strategy transforms boundary handling from “passive truncation” to “active convergence toward the optimal region”. For example, when an individual exceeds the upper bound in dimension dim, the adjusted lies between and . This not only avoids position fixation caused by hard truncation but also ensures that the dimension can still optimize toward the global best under the guidance of . Consequently, the occurrence of boundary local optima is effectively reduced, improving the overall convergence efficiency of the population.
Figure 3.
Schematic diagram of the global-best-guided boundary-handling strategy.
Based on the above discussion, the pseudocode for MEECO is presented in Algorithm 1.
| Algorithm 1. Pseudo-Code of MEECO |
|
2.3. Complexity Analysis of the MEECO Algorithm
The computational burden of a standard ECO primarily depends on three key factors: solution initialization, fitness function evaluation, and solution update mechanisms. Assuming N represents the number of solutions, the computational complexity for initializing these solutions is O(N). The update process involves searching for optimal positions and updating the positions of all solutions, with a computational complexity of , where denotes the total number of iterations and dim represents the dimensionality of the given problem. In the proposed MEECO, our improvements do not introduce additional loops or function evaluations. Therefore, the complexity of MEECO remains the same as that of ECO, i.e., .
3. Numerical Experiments
3.1. Competitor Algorithms and Parameter Setting
In this section, the performance of the proposed MEECO algorithm is evaluated using the most challenging numerical optimization benchmark suites, CEC2017 [44] and CEC2022 [45], and compared with several other algorithms. The comparison algorithms include the following: Gray Wolf Optimizer (GWO) [24], Particle Swarm Optimization (PSO) [46], Whale Optimization Algorithm (WOA) [47], Dung Beetle Optimizer (DBO) [48], Animated Oat Optimization (AOO) [49], Holistic swarm optimization (HSO) [50], Rime optimization algorithm (RIME) [51], Secretary Bird Optimization Algorithm(SBOA) [52], and Educational competition optimizer (ECO) [40]. Configuration details for all benchmarked algorithms are presented in Table 1. The parameter settings in Table 1 were determined based on a combination of prior literature recommendations to ensure fair and stable comparisons.
Table 1.
Compare algorithm parameter settings.
To maintain experimental integrity and minimize stochastic influences, consistent testing conditions were established: a fixed swarm size of 30 agents, an upper limit of 500 evolutionary cycles, and 30 repeated trials for each method. Performance metrics were evaluated using statistical measures including arithmetic mean (Ave) and variability index (Std), where optimal values are emphasized through bold formatting. The computational platform for these tests comprised a Windows 10 environment with processing hardware featuring an Intel(R) Core(TM) i5-13400 13th generation processor at 2.5 GHz base frequency and 16 GB memory capacity, utilizing MATLAB 2024b computational software.
3.2. Qualitative Analysis of MEECO
3.2.1. Analysis of the Population Diversity
In optimization algorithms, population diversity describes the degree of variation among candidate solutions within a population [53]. When diversity decreases, algorithms are more likely to converge prematurely to local optima, restricting their ability to explore the global search space. Preserving higher diversity, on the other hand, promotes extensive exploration of possible solutions and improves the probability of locating the global optimum. This section evaluates the population diversity of the MEECO method by applying Equation (15) [54].
where denotes the population diversity, represents the population size, indicates the problem’s dimensionality, and denotes the value of the individual in the dimension at the iteration. quantifies the dispersion degree of the entire population relative to its center of mass at iteration , which is calculated using Equation (16).
Figure 4 shows the evolution of population diversity for the MEECO and the original ECO algorithms on selected functions from the CEC2017 benchmark suite. Overall, the diversity of both algorithms decreases as the number of iterations increases, consistent with the general principle of transitioning from global exploration to local exploitation, but MEECO maintains a higher diversity level throughout the entire process, with a more gradual decay rate. Specifically, in the early stage of iteration (the first 100 generations), MEECO exhibits significantly higher diversity indices than ECO; for example, on the F1 function, the initial diversity of MEECO is close to 1600, whereas ECO is only around 1200, indicating that MEECO, through the adaptive differential evolution and vertical crossover strategies, effectively expands the initial search range and prevents premature population convergence. In the middle stage of iteration (100–300 generations), ECO’s diversity declines rapidly, such as on the F7 function, where it drops from 1400 to 600, while MEECO maintains a level above 800, demonstrating its ability to dynamically regulate population diversity and reduce the risk of becoming trapped in local optima. In the later stage (after 300 generations), MEECO still preserves a certain degree of diversity, for instance on the F28 function, where its final diversity is about 400 compared to 200 for ECO, while simultaneously achieving higher convergence accuracy, confirming its superiority in balancing exploration and exploitation. Moreover, for complex multimodal functions such as F14 and F19, MEECO’s diversity advantage is even more pronounced, with its curves consistently above those of ECO, indicating that it can more effectively maintain population heterogeneity in challenging search spaces and thereby facilitate the discovery of global optima.
Figure 4.
Population diversity curves of MEECO and ECO on CEC2017 functions (dim = 30).
3.2.2. Analysis of the Exploration and Exploitation
In optimization algorithms, both exploration and exploitation are essential components. Exploration refers to the process of broadly searching diverse regions of the solution space to identify promising areas that might contain the global optimum. In contrast, exploitation entails refining and enhancing known high-quality solutions through focused local search, utilizing available information to improve solution accuracy [55,56].
Over-prioritizing exploration may lead to inefficient use of computational resources, as the algorithm might conduct extensive searches without adequately improving candidate solutions, thereby missing chances for local optimization. On the other hand, over-emphasizing exploitation raises the likelihood of premature convergence to local optima, hindering the discovery of potentially superior solutions in unexplored areas [57,58]. Therefore, maintaining a proper balance between these two mechanisms is critical to algorithmic effectiveness. In this section, we analyze the exploration and exploitation characteristics of the MEECO algorithm using Equations (17) and (18) [56].
where denotes the measure of diversity at the th iteration, which is calculated by Equation (19), and denotes the maximum measure of diversity throughout the iteration.
Figure 5 presents the dynamic evolution of exploration and exploitation rates of the MEECO algorithm on selected functions from the CEC2017 benchmark suite, intuitively reflecting the algorithm’s ability to balance global exploration and local exploitation during the iteration process. Overall, the exploration rate gradually decreases while the exploitation rate correspondingly increases as the number of iterations grows, with a smooth transition and no extreme fluctuations, demonstrating precise regulation of exploration and exploitation. Specifically, in the early stage of iteration (first 100 generations), MEECO maintains a high exploration rate—for example, the initial exploration rates on F1 and F4 functions are close to 100%—which benefits from the adaptive differential evolution strategy where the mutation factor decreases from 0.8 to 0.2 over iterations, expanding the search range at the initial stage to efficiently traverse the solution space and uncover potential optimal regions. In the middle stage of iteration (100–300 generations), exploration and exploitation exhibit a balanced transition; for instance, on the F9 function, the two rates converge to around 50% at approximately 300 generations, while on the F13 function, exploration stabilizes at 30% and exploitation rises to 70%, during which the vertical crossover strategy reorganizes intra-dimensional information within solutions to maintain population diversity while enhancing fine-grained local search, thereby preventing premature convergence. In the later stage of iteration (after 300 generations), exploitation dominates—for example, the exploitation rate rises above 100% on F22 and reaches about 95% on F28—where the global-best-guided boundary-handling strategy directs out-of-bound individuals toward optimal regions, focusing on local optimization of high-quality solutions and improving convergence accuracy. Furthermore, MEECO demonstrates strong adaptability across different types of test functions: for unimodal functions such as F1 and F4, exploitation predominates in the later stage, enabling rapid convergence to the global optimum; for complex multimodal functions such as F18 and F25, a certain level of exploration is retained (approximately 30–40%), effectively avoiding local optima and further verifying MEECO’s capability to dynamically adapt the exploration–exploitation balance across diverse search scenarios.
Figure 5.
The analysis of the exploration and exploitation of MEECO.
3.2.3. Parameter Sensitivity Analysis
To verify the robustness of the proposed MEECO algorithm with respect to key control parameters, this subsection conducts a parameter sensitivity analysis on the crossover probability . As a core parameter in the adaptive differential evolution strategy, directly determines the intensity and scope of information exchange among individuals within the population, and its value significantly influences the balance between exploration and exploitation.
To systematically evaluate the impact of this parameter on the overall optimization performance, five comparative parameter settings——were designed. Independent repeated experiments were conducted on the CEC2017 benchmark suite (with dimension ), and the average ranking across all test functions was adopted as the performance metric. The results are illustrated in Figure 6.
Figure 6.
Average ranking values of MEECO under different parameter values.
As shown in Figure 6, the average ranking of the MEECO algorithm exhibits a decreasing-then-increasing trend as increases, indicating a clear sensitivity to this parameter and the existence of an optimal range. Specifically, when , the algorithm achieves the best average ranking of 2.13, corresponding to peak optimization performance. As increases from 0.2 to 0.4, the average ranking improves from 2.50 to 2.13, suggesting that a moderate increase in crossover probability enhances information exchange within the population, thereby improving both solution accuracy and stability. When further increases to 0.6, the average ranking slightly deteriorates to 2.40. Beyond this point, performance degrades significantly: the average ranking rises to 3.00 at , and further worsens to 4.97 at , which is the poorest among all five settings.
These results indicate that when is too small, insufficient crossover among individuals leads to inadequate information fusion, limiting the effectiveness of the differential evolution strategy. Conversely, excessively large values of result in overly frequent crossover operations, which may disrupt high-quality solution structures, cause loss of population diversity control, and degrade convergence performance. Overall, the experimental findings demonstrate that is the optimal crossover probability for the MEECO algorithm. Under this setting, the algorithm achieves the best balance between global exploration and local exploitation, thereby validating both the rationality of the adopted parameter configuration and the robustness of the proposed method.
3.2.4. Impact Analysis of the Strategy
To evaluate the individual contributions and synergistic effects of the three enhancement strategies—Multi-population Synergistic Search Mechanism (S1), Vertical Crossover Mutation Strategy (S2), and Leader-based Boundary Control Strategy (S3)—ablation experiments were conducted using the CEC2017 benchmark suite (dimension d = 30). Five algorithmic variants were designed for comparison, namely the standard ECO, ECO-S1 (incorporating only S1), ECO-S2 (incorporating only S2), ECO-S3 (incorporating only S3), and MEECO, which integrates all three strategies. The experimental results are presented in Figure 7 and Figure 8.
Figure 7.
Comparison of convergence speed of different improvement strategies and enhanced ECO.
Figure 8.
Average ranking of ECO improved by different strategies.
From the convergence curve comparison in Figure 7, on 10 representative functions of the CEC2017 benchmark suite (dim = 30), ECO variants incorporating only a single strategy (ECO-S1, ECO-S2, ECO-S3) all outperform the original ECO but are significantly weaker than MEECO. Moreover, different strategies exhibit differentiated advantages depending on function characteristics: for high-dimensional unimodal functions (e.g., F1, F3), ECO-S1 (only S1) accelerates convergence via multi-population information interaction, with its convergence curve dropping significantly below the original ECO after 100 iterations, yet still remaining above MEECO; for complex multimodal functions (e.g., F9, F18), ECO-S2 (only S2) maintains higher population diversity through intra-dimensional information recombination, preventing ECO from premature convergence, although its late-stage convergence accuracy remains inferior to MEECO; for boundary-sensitive functions (e.g., F22, F30), ECO-S3 (only S3) reduces ineffective aggregation of boundary individuals through global-best-guided boundary handling, achieving better fitness than ECO and other single-strategy variants, yet still lacks global optimization ability in complex search spaces. MEECO, through the synergistic effect of all three strategies, demonstrates superior convergence on all functions: in the early stage, S1 enables rapid exploration across the solution space; in the middle stage, S2 facilitates dimension-wise collaborative optimization to balance exploration and exploitation; in the later stage, S3 guides boundary individuals toward optimal regions to enhance convergence precision, resulting in convergence curves consistently below all variants, with faster convergence and lower final fitness values.
Figure 8 presents the average ranking results, further quantifying the contribution of each strategy: on the CEC2017 (dim = 30) test set, the original ECO ranks lowest (approximately 7.1), single-strategy variants show incremental improvements (ECO-S1 ≈ 5.5, ECO-S2 ≈ 4.4, ECO-S3 ≈ 4.0), and MEECO achieves a leading average rank of 1.3. These results indicate that the three strategies are not simply additive but exhibit significant synergy: S1’s multi-population search provides a broader solution space foundation for S2’s dimension-wise optimization, while S3’s boundary handling ensures effective convergence of the outcomes from the first two strategies, jointly enhancing population diversity, local exploitation precision, and global exploration efficiency, ultimately yielding optimization performance far surpassing any single strategy. Overall, the experimental results in Figure 7 and Figure 8 fully validate the necessity and synergistic effectiveness of MEECO’s enhancement strategies, providing critical support for its performance advantages in complex optimization problems.
3.3. Performance Evaluation on CEC2017 and CEC2022 Benchmark Sets
In this section, the proposed MEECO algorithm is systematically assessed against several representative optimization methods using the CEC2017 and CEC2022 benchmark collections. These test suites include four distinct types of functions, namely unimodal, multimodal, hybrid, and composition functions, each designed to evaluate different aspects of optimization performance. Multimodal functions, which contain numerous local optima, are particularly suitable for examining an algorithm’s global search capability. In contrast, unimodal functions are mainly used to evaluate local refinement ability due to the presence of a single optimal solution. Hybrid and composition functions provide more complex landscapes, further challenging the algorithm’s ability to avoid premature convergence.
To ensure fairness and minimize random variation, every method was tested under the same experimental settings, using 30 individuals and a maximum of 500 iterations. Each method was performed over 30 independent trials to guarantee result credibility. Performance is reported using the average value and standard deviation, and the most competitive results are emphasized in bold for easy comparison.
All simulations were conducted on a workstation operating under Windows 11, featuring an AMD Ryzen 5 5600X processor (3.70 GHz) and 32 GB of RAM, with MATLAB 2024b used as the development environment. Furthermore, the performance of the compared algorithms is visually analyzed in Figure 8 and Figure 9 through convergence curves and boxplot distributions, respectively.
Figure 9.
Comparison of convergence speed of different algorithms on test set.
The numerical experimental results in Table 2, Table 3 and Table 4, together with the convergence curves in Figure 9 and the boxplot in Figure 10, comprehensively validate MEECO’s optimization performance advantages across different benchmark suites and problem dimensions, both from the perspectives of quantitative metrics and dynamic trends, as well as its core competitiveness relative to the comparison algorithms. In the tables, bold values are used to indicate the best-performing result in that row or column.
Table 2.
Experimental results of CEC2017 (dim = 30).
Table 3.
Experimental results of CEC2022 (dim = 10).
Table 4.
Experimental results of CEC2022 (dim = 20).
Figure 10.
Boxplot analysis for different algorithms on the test set.
From the results in Table 2 for the CEC2017 benchmark (30-dimensional), it is evident that MEECO achieves the best mean performance across all 30 test functions, with standard deviations significantly lower than those of the compared algorithms. On unimodal functions (F1–F4), MEECO demonstrates particularly prominent advantages in convergence accuracy. Specifically, for F1, the mean value of MEECO is 6.0575 × 10³, which is substantially lower than ECO’s 1.6222 × 10⁹. For F2, the mean value is 4.4089 × 10¹³, representing a reduction of nearly 19 orders of magnitude compared to ECO’s 8.0793 × 1031. For F3, the mean value is 1.1512 × 10⁴, again significantly outperforming ECO’s 6.0375 × 10⁴. On F4, MEECO achieves a mean value of 4.8414 × 10², which is lower than all competing algorithms, including GWO, PSO, and ECO, highlighting its strong local exploitation capability.
For more complex optimization problems, including multimodal, hybrid, and composite functions, MEECO continues to maintain comprehensive superiority. For instance, the mean value on F9 is 1.1306 × 10³, far below ECO’s 5.7007 × 10³; for F14, the mean is 5.3269 × 10³; and for F30, it is 1.2209 × 10⁴, all representing the best results among the compared algorithms. Moreover, MEECO consistently achieves the smallest standard deviations on these functions—for example, the standard deviation for F6 is only 5.6468 × 10⁻¹, and for F25 it is 6.2481 × 100—indicating highly stable performance with minimal variation across multiple runs.
On the CEC 2022 benchmark suite, as shown in Table 3 and Table 4, MEECO also demonstrates superior performance. Under the 10-dimensional setting, MEECO achieves a mean value of 3.0000 × 10² on F1, approaching the theoretical optimum, and 6.0004 × 10² on F3, outperforming other algorithms. Under the 20-dimensional setting, most comparative algorithms exhibit noticeable performance degradation as dimensionality increases—such as WOA, HSO, and ECO, which show significant declines in convergence accuracy and increased standard deviations. In contrast, MEECO maintains optimal mean values on functions such as F1, F2, F7, and F9, while keeping standard deviations at low levels. For example, the standard deviation on F9 is as low as 3.5237 × 10⁻⁶, demonstrating excellent scalability and robustness in high-dimensional optimization problems.
Figure 9 presents the convergence curves of all algorithms on representative test functions, providing a visual illustration of the iterative optimization process. On both CEC 2017 and CEC 2022 benchmark functions, the convergence curve of MEECO consistently lies at the lowest position and descends more rapidly than those of other algorithms. In the early stages, the adaptive differential evolution strategy employs a relatively large mutation factor to expand the search space, resulting in a rapid decrease in fitness values. During the middle stage, the vertical crossover strategy facilitates inter-dimensional information interaction, preventing rapid loss of population diversity and ensuring a smooth convergence trend without premature stagnation. In the later stage, the global-best-guided boundary-handling strategy effectively pulls out-of-bound individuals back into high-quality solution regions, enabling precise local convergence. In comparison, the original ECO exhibits slow convergence and insufficient final accuracy, while traditional algorithms such as GWO, WOA, and PSO are prone to premature convergence. Although algorithms like SBOA and RIME show some improvements, their overall convergence speed and final accuracy remain inferior to those of MEECO. These observations clearly demonstrate that the synergistic integration of the three proposed strategies significantly enhances both convergence efficiency and solution accuracy.
Figure 10 illustrates box plots comparing the distribution concentration and stability of solutions obtained by different algorithms. On both CEC 2017 and CEC 2022 test functions, MEECO exhibits the shortest box lengths, the lowest medians, and almost no outliers, indicating highly concentrated results and excellent consistency across multiple runs. In contrast, algorithms such as ECO, WOA, and HSO show longer box lengths and greater dispersion, reflecting inferior stability. The superior numerical performance, convergence behavior, and stability of MEECO can be attributed to the effective integration of three key improvement strategies: the adaptive differential evolution strategy dynamically adjusts mutation and crossover intensities to balance global exploration and local exploitation, thereby enhancing convergence accuracy and speed; the vertical crossover strategy breaks the independent update pattern across dimensions, strengthening cooperative evolution in high-dimensional spaces and alleviating premature convergence; and the global-best-guided boundary-handling strategy replaces traditional hard boundary truncation, preventing individuals from being trapped near boundaries and improving search stability and effectiveness. The box plots illustrate the distribution, median, and variability of algorithm performance across multiple runs. MEECO exhibits narrower interquartile ranges and lower median values, indicating higher stability and better optimization accuracy. These characteristics are mainly attributed to the adaptive differential evolution strategy (enhancing global exploration) and vertical crossover mechanism (maintaining diversity).
These three strategies complement each other, enhancing the original ECO from the perspectives of diversity preservation, inter-dimensional interaction, and boundary constraint handling. As a result, MEECO achieves superior performance in terms of convergence accuracy, convergence speed, robustness, and scalability, making it highly effective for solving complex high-dimensional global optimization problems.
3.4. Statistical Analysis
Statistical analysis plays a vital role in algorithm optimization by offering a structured approach for researchers to systematically evaluate and compare the efficacy of various techniques. This facilitates evidence-based decisions when selecting the most suitable method for specific research goals. In this section, the performance of the MEECO algorithm is assessed using both the Wilcoxon rank-sum test and the Friedman test, with detailed explanations of the procedures and results included.
3.4.1. Wilcoxon Rank-Sum Test
In this subsection, the Wilcoxon rank-sum test [59] is employed to assess whether significant differences exist in the performance of the MEECO algorithm, without relying on assumptions of normality. Compared to the traditional t-test, the Wilcoxon test offers greater flexibility, as it remains applicable to data with non-normal distributions or outliers. The test statistic for the Wilcoxon rank-sum test is defined by Equation (20) [56].
where denotes the rank of among all observations. The test statistic is calculated by Equation (21).
For larger sample sizes, is approximately normally distributed by Equations (22) and (23).
where and represent the number of observations in the first and second sample groups, respectively, and the standardized statistic Z is calculated by Equation (24).
A significance level of was used to evaluate whether the outcomes of each MEECO run demonstrated statistically significant differences compared to other algorithms. The null hypothesis () posits that no such difference exists between the two methods. Should the resulting -value fall below 0.05, is rejected, suggesting a notable performance discrepancy; if not, it is upheld.
Table 5 presents the Wilcoxon rank-sum test results (p = 0.05) in the “(+/=/−)” format, quantifying the performance differences between MEECO and nine comparison algorithms across CEC2017 (dim = 30) and CEC2022 (dim = 10/20), thereby confirming the statistical reliability of MEECO’s superiority.
Table 5.
Results for various algorithms on the CEC 2020 and CEC2022.
In CEC2017 (dim = 30), MEECO achieves complete dominance (30/0/0) over five algorithms, including WOA and PSO; against GWO and AOO, it attains (29/0/1), with only one function showing no significant advantage; for SBOA, MEECO is superior in 16 functions, equal in one, and inferior in 13, highlighting its strong performance in high-dimensional scenarios. In CEC2022 (dim = 10), MEECO exhibits full superiority over HSO (12/0/0) and performs as (11/0/1) or (10/0/2) against most other algorithms, indicating excellent low-dimensional adaptability. In CEC2022 (dim = 20), MEECO dominates WOA, PSO, and several others completely (12/0/0), while remaining significantly better than SBOA in 66.7% of the functions, demonstrating robust performance in mid-to-high dimensions.
Overall, these results confirm that MEECO’s advantages over the comparison algorithms are statistically significant and consistently observed across different dimensions and test suites, providing strong evidence for its practical applicability.
3.4.2. Friedman Mean Rank Test
In this subsection, the Friedman test is applied to evaluate the overall performance ranking of the MEECO algorithm against other methods. As a non-parametric method, the Friedman test compares median performance differences across three or more related groups. It is especially appropriate for repeated measures or blocked experimental designs, serving as a robust substitute for ANOVA when normality assumptions are not met. The calculation of the Friedman test statistic follows Equation (25) [54,56].
where is the number of blocks, is the number of groups, and is the rank sum for -th group. When and are large, follows approximately a distribution with degrees of freedom.
From the Friedman mean ranking (M.R) data in Table 6, MEECO consistently ranks first across all test scenarios with a clear margin over the second-best algorithm. In CEC2017 (dim = 30), MEECO achieves an M.R of only 1.30, significantly lower than the second-place SBOA at 2.10, while the original ECO ranks eighth with an M.R of 7.10, highlighting the substantial performance improvement brought by the multi-strategy enhancements. In CEC2022 (dim = 10) and CEC2022 (dim = 20), MEECO maintains first place with M.R values of 1.83 and 1.50, respectively, with the second-best SBOA at 1.92 and 2.08, while other algorithms such as WOA and HSO have M.R values above six, further confirming MEECO’s stability across different dimensional scenarios. Moreover, the rankings of comparison algorithms fluctuate noticeably with dimensional changes (e.g., HSO rises from 5.53 in CEC2017 to 8.42 in CEC2022 dim = 10), whereas MEECO consistently maintains the lowest (best) rank, demonstrating strong robustness.
Table 6.
Friedman mean rank test result.
Figure 11 further visualizes MEECO’s dominance: across CEC2017 (dim = 30) and CEC2022 (dim = 10/20), MEECO’s rankings are almost always first, with minimal fluctuation. In contrast, comparison algorithms such as ECO and GWO exhibit rankings dispersed between 3 and 10, with some functions showing bottom ranks (e.g., WOA ranks 10 in multiple CEC2017 functions). The advantage of MEECO is particularly pronounced in complex multimodal functions (e.g., CEC2017-F12, CEC2022-F11), where other algorithms often suffer from local optima, whereas MEECO maintains superior rankings through its adaptive differential evolution and vertical crossover strategies that balance exploration and exploitation.
Figure 11.
Distribution of rankings of different algorithms.
In summary, the quantitative rankings in Table 6 combined with the distribution patterns in Figure 10 demonstrate that MEECO not only leads in individual test scenarios but also consistently achieves optimal rankings across different dimensions and function types, confirming its overall optimization capability and superiority over original ECO, GWO, WOA, and other mainstream algorithms, providing strong support for its application in global optimization problems.
4. MEECO for Wireless Sensor Network Node Deployment
4.1. WSN Mathematical Model
We consider the sensing model of the sensors, as illustrated in Figure 12, where two circles are drawn around each sensor. The first circle represents the sensing region with radius , while denotes the communication range. We assume that . It has been shown that if the communication range is at least twice the sensing range, full coverage of a convex area is sufficient to guarantee connectivity among active nodes [55,60]. However, this assumption of omnidirectional sensing does not hold for certain types of sensor nodes, such as cameras or ultrasonic sensors with directional sensing regions. As shown in Figure 13, if the circular sensing area is approximated as a square, the circle’s diameter corresponds to the diagonal of the square [39,61].
Figure 12.
Perception model of sensor node.
Figure 13.
The sensing area of sensor in terms of square.
Sensors are powered by batteries and thus can operate only for a limited period. To extend battery life, energy-efficient and coverage-aware protocols are required. The probability of detecting an event is inversely proportional to the Euclidean distance between the sensor and the event. In wireless sensor networks (WSNs), there are two primary sensing models used to determine effective coverage: the deterministic binary detection model, which assumes no uncertainty, and the probabilistic sensing model, which accounts for random detection. Probabilistic coverage better reflects the actual performance of sensors in real environments. The binary sensing model, on the other hand, is the simplest and most extensively analyzed coverage model. In this model, a sensor detects all events within its sensing range. In this work, we adopt the binary detection model described by Equation (26) [39]:
where represents the probability that an event occurring at location is detected by a sensor located at . denotes the Euclidean distance between the sensor and the event.
The objective function proposed in this study primarily considers coverage. First, we assume that the sensor nodes are denoted by , and the deployment space is denoted by . The sensing radius of the sensor is , and the points covered by the sensor are denoted as . The coverage can be expressed by Equation (27) [39]:
where is the Euclidean distance between sensor and point , calculated as follows [39]:
The coverage probability of the deployment area is defined as follows:
where and denote the length and width of the deployment space, respectively. The goal of this problem is to maximize network coverage. Therefore, the function is defined as follows [39]:
4.2. WSN Experiment
In this experiment, wireless sensor network (WSN) nodes were randomly deployed in an area, where the number of nodes , the deployment area is , and the communication radius of each sensor is . To ensure a fair comparison of algorithm performance, the parameters used in the fitness function were kept the same across all algorithms.
Each experiment was independently repeated 30 times under identical environmental and parameter settings to eliminate the effects of randomness, and the corresponding results were recorded. For further statistical analysis, the minimum (Min), maximum (Max), median (Median), mean (Mean), and standard deviation (Std) of each algorithm were computed, with the best values highlighted in bold in Table 7. Figure 14 illustrates the convergence curves of the different algorithms in the WSN, while Figure 15 shows the optimized node deployment patterns achieved by each algorithm.
Table 7.
Statistics of WSN experiment results.
Figure 14.
Fitness value curves of different algorithms in WSN.
Figure 15.
Node deployment distributions obtained by different algorithms.
Based on the statistics presented in Table 6, MEECO achieves the best performance across key metrics for WSN coverage optimization. Its minimum coverage (Min) is 0.8480, median (Median) is 0.8690, maximum (Max) is 0.8880, and mean (Ave) is 0.8680, which is not only significantly higher than the original ECO (Ave = 0.7875) but also surpasses comparison algorithms such as GWO (Ave = 0.8308) and SBOA (Ave = 0.8474). Meanwhile, MEECO exhibits the smallest standard deviation (Std = 0.0076) among all algorithms, indicating minimal performance fluctuations across 30 independent runs and demonstrating excellent stability. The ranking results further confirm its superiority—MEECO achieves a clear first place, whereas the original ECO ranks seventh, and other algorithms such as WOA and HSO fall in the eighth to tenth positions, highlighting MEECO’s efficiency in WSN coverage optimization.
The convergence curves in Figure 14 reveal MEECO’s optimization capability dynamically. In the early iterations (first 50 generations), MEECO’s fitness values (coverage) rapidly rise above 0.82, significantly higher than ECO (≈0.75) and GWO (≈0.78) at the same stage. During the middle iterations (50–200 generations), MEECO continues to improve steadily, approaching a stable value of 0.868 around the 200th generation. In contrast, other algorithms such as WOA and HSO remain at relatively low levels (0.7–0.76) with slower convergence. In the later iterations (after 200 generations), MEECO maintains the highest coverage without noticeable fluctuations, further validating its convergence accuracy and stability. This performance is attributed to MEECO’s globally guided boundary-handling strategy, which prevents sensor nodes from being trapped in local optima near boundaries, and the vertical crossover strategy, which optimizes the dimensional coordination of node positions to enhance coverage efficiency.
The node deployment distributions shown in Figure 15 visually illustrate the differences in optimization results. In the deployment results of ECO and GWO, noticeable coverage gaps (e.g., sparse nodes in certain regions of ECO) and node redundancy (e.g., excessive node clustering in GWO) are observed. By contrast, MEECO achieves a uniform node distribution with no significant gaps or redundancies, fully covering the 50 × 50 target area. This is because MEECO employs multiple coordinated strategies that ensure sufficient exploration of the deployment space while precisely adjusting node positions to maximize coverage, ultimately achieving an “optimal deployment” state with no blind spots and minimal redundancy.
In summary, the quantitative data in Table 6 confirm MEECO’s superiority in WSN coverage optimization metrics, the convergence curves in Figure 14 demonstrate its efficient and stable optimization process, and the deployment patterns in Figure 15 clearly demonstrate its effectiveness by showing more uniform node distribution, reduced coverage gaps, and minimal redundancy compared with other algorithms. This is because MEECO employs multiple coordinated strategies that ensure sufficient exploration of the deployment space while precisely adjusting node positions to maximize coverage, ultimately achieving an “optimal deployment” state with no blind spots and minimal redundancy. Together, these results indicate that MEECO effectively addresses the WSN node deployment problem and provides strong support for its engineering applicability.
5. Summary and Prospect
This study proposes a Multi-strategy Enhanced Educational Competition Optimization algorithm (MEECO) based on the standard Educational Competition Optimization (ECO) algorithm, and validates its performance advantages through theoretical design, numerical experiments, and practical applications. From an algorithmic design perspective, MEECO addresses the limitations of standard ECO, such as susceptibility to local optima, insufficient dimensional coordination, and coarse boundary handling. It innovatively incorporates an adaptive differential evolution strategy, a vertical crossover strategy, and a globally guided boundary-handling strategy to achieve efficient population information recombination, intra-solution dimensional coordination, and precise convergence of boundary-crossing individuals, forming a comprehensive “exploration–exploitation–convergence” optimization mechanism.
Systematic experiments on the CEC2017 and CEC2022 benchmark suites, combined with Wilcoxon rank-sum and Friedman ranking tests, demonstrate that MEECO significantly outperforms the original ECO and eight other mainstream metaheuristic algorithms, including GWO and WOA, across various dimensions (10, 20, and 30) and function types (unimodal, multimodal, and hybrid functions), while exhibiting excellent stability and robustness. In practical applications such as wireless sensor network (WSN) node deployment, MEECO achieves an average coverage rate of 86.8%, with evenly distributed nodes and minimal redundancy, further confirming its engineering applicability.
In addition, the proposed MEECO framework demonstrates strong robustness and adaptability in handling complex optimization scenarios, including nonlinear, high-dimensional, and uncertain problems. The adaptive differential evolution strategy enhances global search capability under complex landscapes, while the vertical crossover mechanism improves diversity and inter-dimensional coordination, which is particularly beneficial for high-dimensional nonlinear problems. Meanwhile, the global-best-guided boundary-handling strategy contributes to stable convergence behavior, even in the presence of constraints or perturbations. These characteristics indicate the potential applicability of MEECO to more challenging scenarios such as noisy, dynamic, and multi-objective optimization problems.
Despite its strong performance in global optimization and WSN deployment, MEECO still has potential avenues for extension. First, the current algorithm is primarily designed for static optimization problems and does not account for scenarios where the solution space changes over time, such as node failures or mobile target monitoring in WSNs. Future work could incorporate dynamic population update mechanisms and environment-aware modules to enhance adaptability to dynamic problems. Second, MEECO’s computational complexity increases moderately in ultra-high-dimensional problems (e.g., dimensions exceeding 100). Subsequent improvements could leverage dimensionality reduction techniques and parallel computing frameworks to enhance computational efficiency while maintaining performance, enabling applications in more complex engineering optimization scenarios, such as multi-objective path planning and large-scale industrial scheduling.
From an application perspective, MEECO’s multi-strategy collaborative optimization approach exhibits strong transferability and can be extended to various domains. In smart homes, it can optimize energy consumption and coverage trade-offs in indoor sensor networks; in smart manufacturing, it can assist in production line parameter scheduling and robotic path planning; in environmental monitoring, it can support the deployment of regional monitoring nodes for UAV swarms. Moreover, emerging problems such as hyperparameter tuning in deep learning models and threshold selection in image segmentation also present promising applications for MEECO. Through continuous algorithmic refinement and scenario adaptation, MEECO has the potential to further demonstrate its core value in solving complex optimization problems.
Author Contributions
Conceptualization, M.S. and S.Z.; methodology, M.S. and S.Z.; software, M.S. and S.Z.; validation, M.S. and S.Z.; formal analysis, M.S. and S.Z.; investigation, W.J. and S.Z.; resources, M.S. and S.Z.; data curation, M.S. and S.Z.; writing—original draft preparation, M.S. and W.J.; writing—review and editing, M.S. and S.Z.; visualization, W.J.; supervision, W.J.; funding acquisition, W.J. All authors have read and agreed to the published version of the manuscript.
Funding
This research received no external funding.
Data Availability Statement
All data in this paper are included in the manuscript.
Conflicts of Interest
The authors declare no conflicts of interest.
References
- Karam, K.; Mansour, A.; Khaldi, M.; Clement, B.; Ammad-Uddin, M. UAV Path Optimization for WSN in Smart Agriculture. IEEE Access 2025, 13, 87526–87544. [Google Scholar] [CrossRef] [Scilit]
- Zhaohui, Z.; Jiaqi, Z.; Jing, L. Q-learning-based semi-fixed clustering routing algorithm in WSNs. Ad Hoc Netw. 2025, 174, 103837. [Google Scholar] [CrossRef] [Scilit]
- Liu, D.; Shen, Q.; Liu, J. The Health-Wealth Gradient in Labor Markets: Integrating Health, Insurance, and Social Metrics to Predict Employment Density. Computation 2026, 14, 22. [Google Scholar] [CrossRef] [Scilit]
- Uthayakumar, C.; Jayaraman, R.; Raja, H.A.; Daniel, K. Implementation and Performance Evaluation of Quantum-Inspired Clustering Scheme for Energy-Efficient WSNs. Sensors 2025, 25, 5872. [Google Scholar] [CrossRef] [Scilit]
- Ahmed, M.K.; Oruba, A.; Pravija Raj, P.V.; Walid, O. Advancing IoT-driven WSNs with context-aware routing: A comprehensive review. Comput. Sci. Rev. 2025, 58, 100803. [Google Scholar] [CrossRef] [Scilit]
- Zhang, J.; Qi, H.; Wu, J.J.; Mao, X.; Zhang, H.; Amin, N.; Xu, F.; Dong, C.; Wang, C.; Wang, P.; et al. Disposable Peptidoglycan-Specific Biosensor for Noninvasive Real-Time Detection of Broad-Spectrum Gram-Positive Bacteria in Exhaled Breath Condensates. Anal. Chem. 2024, 96, 9817–9825. [Google Scholar] [CrossRef] [Scilit]
- Ma, S.; Xu, M.; Zhao, X.; Yan, X. Double-Swarm Grey Wolf Optimizer with Covariance and Dimension Learning for Engineering Optimization Problems. Symmetry 2025, 17, 2030. [Google Scholar] [CrossRef] [Scilit]
- Yan, J.; Cheng, Y.; Zhang, F.; Li, M.; Zhou, N.; Jin, B.; Wang, H.; Yang, H.; Zhang, W. Research on multimodal techniques for arc detection in railway systems with limited data. Struct. Heal. Monit. 2025, 14759217251336797. [Google Scholar] [CrossRef] [Scilit]
- Wu, X.; Wang, H.; Zhang, Y.; Zou, B.; Hong, H. A Tutorial-Generating Method for Autonomous Online Learning. IEEE Trans. Learn. Technol. 2024, 17, 1532–1541. [Google Scholar] [CrossRef] [Scilit]
- Yuting, Y.; Yuelin, G. An adaptive hybrid differential Grey Wolf Optimization algorithm for WSN coverage. Clust. Comput. 2025, 28, 229. [Google Scholar] [CrossRef] [Scilit]
- Zhu, F.; Wang, W. Coverage Optimization Method for WSNs Based on the Improved Weed Algorithm. Sensors 2021, 21, 5869. [Google Scholar] [CrossRef] [Scilit]
- Shen, Q.; Zhang, J. MFTFormer: Meteorological-Frequency-Temporal Transformer with Block-Aligned Fusion for Traffic Flow Prediction. Res. Sq. 2026. [Google Scholar] [CrossRef] [Scilit]
- Lalama, Z.; Boulfekhar, S.; Semechedine, F. Localization Optimization in WSNs Using Meta-Heuristics Optimization Algorithms: A Survey. Wirel. Pers. Commun. 2021, 122, 1197–1220. [Google Scholar] [CrossRef] [Scilit]
- Augustine, S.; Ananth, J.P. A modified rider optimization algorithm for multihop routing in WSN. Int. J. Numer. Model. Electron. Netw. Devices Fields 2020, 33, e2764. [Google Scholar] [CrossRef] [Scilit]
- Chang, Y.; Yuan, X.; Li, B.; Niyato, D.; Al-Dhahir, N. Machine-Learning-Based Parallel Genetic Algorithms for Multi-Objective Optimization in Ultra-Reliable Low-Latency WSNs. IEEE Access 2018, 7, 4913–4926. [Google Scholar] [CrossRef] [Scilit]
- Alsubaei, F.S.; El-Sayed, H.H. Modification and use of a machine learning algorithm to the Z-SEP clustering in WSNs. Alex. Eng. J. 2025, 123, 637–650. [Google Scholar] [CrossRef] [Scilit]
- Ali, S.J.; Iqbal, J.; Khan, F.; Moon, Y.-K. Vigorous technique for augmented lifetime in WSNs. Sci. Rep. 2025, 15, 15400. [Google Scholar] [CrossRef] [Scilit] [PubMed]
- Wu, X.; Dong, J.; Bao, W.; Zou, B.; Wang, L.; Wang, H. Augmented Intelligence of Things for Emergency Vehicle Secure Trajectory Prediction and Task Offloading. IEEE Internet Things J. 2024, 11, 36030–36043. [Google Scholar] [CrossRef] [Scilit]
- Shen, Q.; Zhang, J. AI-Enhanced Disaster Risk Prediction with Explainable SHAP Analysis: A Multi-Class Classification Approach Using XGBoost. Res. Sq. 2025. [Google Scholar] [CrossRef] [Scilit]
- Zhang, Y.; Zhang, Z.; Liu, D.; Zheng, P.; Zhong, Z. Adaptive learning FOA algorithm with energy consumption balancing for coverage optimization in WSNs. Ad Hoc Netw. 2025, 178, 103958. [Google Scholar] [CrossRef] [Scilit]
- Zhang, Q.; Li, H.; Zhu, S.; Dong, X. Differential Evolution Optimized Fuzzy Logic Controller and D-Star Algorithm for Clustering Routing in WSNs. IEEE Sens. J. 2025, 25, 37394–37406. [Google Scholar] [CrossRef] [Scilit]
- Fan, D.; Zhu, X.; Xiang, Z.; Lu, Y.; Quan, L. Dimension-Reduction Many-Objective Optimization Design of Multimode Double-Stator Permanent Magnet Motor. IEEE Trans. Transp. Electrif. 2025, 11, 1984–1994. [Google Scholar] [CrossRef] [Scilit]
- Shen, Q.; Liu, D.; Zou, Y.; Xiao, Z.; Zhang, T. Business Resilience Index (BRI): Evaluating Economic Recovery through Event-Study Heterogeneity. Res. Sq. 2026. [Google Scholar] [CrossRef] [Scilit]
- Mirjalili, S.; Mirjalili, S.M.; Lewis, A. Grey Wolf Optimizer. Adv. Eng. Softw. 2014, 69, 46–61. [Google Scholar] [CrossRef] [Scilit]
- Xu, S.; Zhong, C. Optimization of Relay Node Deployment in Wireless Sensor Communication Networks Based on IGA-RNDP Algorithm. IEEE Access 2025, 13, 139506–139523. [Google Scholar] [CrossRef] [Scilit]
- Zhang, Y.; Liu, Z.; Bi, Y. Node deployment optimization of underwater wireless sensor networks using intelligent optimization algorithm and robot collaboration. Sci. Rep. 2023, 13, 15920. [Google Scholar] [CrossRef] [Scilit]
- Wang, Y.; Peng, Y.; Chen, L.; Duan, Y.; Li, J. WSN node coverage optimization algorithm based on global and neighborhood difference DE. China Commun. 2022, 19, 215–229. [Google Scholar] [CrossRef] [Scilit]
- Fan, D.; Miao, D.; Shan, W.; Xiang, Z.; Zhu, X. Short-Circuit Fault Demagnetization Assessment and Optimization of Double-Electrical-Port Vernier Permanent Magnet Motor. In IEEE Transactions on Industry Applications; IEEE: New York, NY, USA, 2025; pp. 1–10. [Google Scholar] [CrossRef] [Scilit]
- Wang, H.; Song, Y.; Yang, H.; Liu, Z. Generalized Koopman Neural Operator for Data-Driven Modeling of Electric Railway Pantograph–Catenary Systems. IEEE Trans. Transp. Electrif. 2025, 11, 14100–14112. [Google Scholar] [CrossRef] [Scilit]
- Elashry, S.S.; Abohamama, A.S.; Abdul-Kader, H.M.; Rashad, M.Z.; Ali, A.F. A hybrid gazelle optimization and reptile search algorithm for optimal clustering in wireless sensor networks. Sci. Rep. 2025, 15, 14595. [Google Scholar] [CrossRef] [Scilit] [PubMed]
- Alshammri, G.H. Enhancing wireless sensor network lifespan and efficiency through improved cluster head selection using improved squirrel search algorithm. Artif. Intell. Rev. 2025, 58, 79. [Google Scholar] [CrossRef] [Scilit]
- Guo, S.; Song, Y.; Wu, Y.; Hu, J.; Lu, J.; Wang, C.; Jia, Z.; Hua, L. Microscopic mechanism of enhanced strength-plasticity synergy in pre-damaged TC11 titanium alloys via novel electroshock treatment. J. Alloys Compd. 2026, 1052, 186139. [Google Scholar] [CrossRef] [Scilit]
- Shaikh, M.S.; Wang, C.; Xie, S.; Zheng, G.; Dong, X.; Qiu, S.; Ahmad, M.A.; Raj, S. Coverage and connectivity maximization for wireless sensor networks using improved chaotic grey wolf optimization. Sci. Rep. 2025, 15, 15706. [Google Scholar] [CrossRef] [Scilit]
- Liang, W. Energy optimization in intelligent sensor networks: Application of particle swarm optimization algorithm in the deployment of electronic information sensing nodes. Energy Inform. 2025, 8, 95. [Google Scholar] [CrossRef] [Scilit]
- Tong, Y.; Lin, L.; Tian, L.; Wang, Z.; Wu, W.; Wu, J. Coverage optimization and node minimization in WSNs: An enhanced hybrid PSO approach with spatial position encoding. Sci. Rep. 2025, 15, 25332. [Google Scholar] [CrossRef] [Scilit]
- Bhargavi, K.V.N.A.; Varma, G.P.S.; Hemalatha, I.; Dilli, R. An Enhanced Particle Swarm Optimization-Based Node Deployment and Coverage in Sensor Networks. Sensors 2024, 24, 6238. [Google Scholar] [CrossRef] [Scilit] [PubMed]
- Li, Y.; Zhao, L.; Wang, Y.; Wen, Q. Improved sand cat swarm optimization algorithm for enhancing coverage of wireless sensor networks. Measurement 2024, 233, 114649. [Google Scholar] [CrossRef] [Scilit]
- Wang, G.; Li, X. Wireless Sensor Network Coverage Optimization Using a Modified Marine Predator Algorithm. Sensors 2024, 25, 69. [Google Scholar] [CrossRef] [Scilit] [PubMed]
- Meng, Q.; Kuang, X.; Yu, Z.; He, M.; Cui, H. Augmented secretary bird optimization algorithm for wireless sensor network deployment and engineering problem. PLoS ONE 2025, 20, e0329705. [Google Scholar] [CrossRef] [Scilit]
- Lian, J.; Zhu, T.; Ma, L.; Wu, X.; Heidari, A.A.; Chen, Y.; Chen, H.; Hui, G. The educational competition optimizer. Int. J. Syst. Sci. 2024, 55, 3185–3222. [Google Scholar] [CrossRef] [Scilit]
- Tang, X.; Lian, J.J.; Ma, L.; Wu, X.; Zhong, R.; Zhang, Y.; Chen, H. IECO: An improved educational competition optimizer for state-of-the-art engineering optimization. J. Big Data 2025, 12, 200. [Google Scholar] [CrossRef] [Scilit]
- Tang, W.; Shi, S.; Lu, Z.; Lin, M.; Cheng, H. EDECO: An Enhanced Educational Competition Optimizer for Numerical Optimization Problems. Biomimetics 2025, 10, 176. [Google Scholar] [CrossRef] [Scilit]
- Zhao, B.; Yang, X.; Lee, H.; Dong, B. An improved educational competition optimizer with multi-covariance learning operators for global optimization problems. Clust. Comput. 2025, 28, 964. [Google Scholar] [CrossRef] [Scilit]
- Wu, G.; Mallipeddi, R.; Suganthan, P. Problem Definitions and Evaluation Criteria for the CEC 2017 Competition and Special Session on Constrained Single Objective Real-Parameter Optimization. Tech. Rep. 2016. [Google Scholar]
- Luo, W.; Lin, X.; Li, C.; Yang, S.; Shi, Y. Benchmark functions for CEC 2022 competition on seeking multiple optima in dynamic environments. arXiv 2022, arXiv:2201.00523. [Google Scholar] [CrossRef] [Scilit]
- Kennedy, J.; Eberhart, R. Particle swarm optimization. In Proceedings of the ICNN’95—International Conference on Neural Networks; IEEE: New York, NY, USA, 1995; Volume 1944, pp. 1942–1948. [Google Scholar]
- Mirjalili, S.; Lewis, A. The Whale Optimization Algorithm. Adv. Eng. Softw. 2016, 95, 51–67. [Google Scholar] [CrossRef] [Scilit]
- Xue, J.; Shen, B. Dung beetle optimizer: A new meta-heuristic algorithm for global optimization. J. Supercomput. 2022, 79, 7305–7336. [Google Scholar] [CrossRef] [Scilit]
- Wang, R.-B.; Hu, R.-B.; Geng, F.-D.; Xu, L.; Chu, S.-C.; Pan, J.-S.; Meng, Z.-Y.; Mirjalili, S. The Animated Oat Optimization Algorithm: A nature-inspired metaheuristic for engineering optimization and a case study on Wireless Sensor Networks. Knowl.-Based Syst. 2025, 318, 113589. [Google Scholar] [CrossRef] [Scilit]
- Akbari, E.; Rahimnejad, A.; Gadsden, S.A. Holistic swarm optimization: A novel metaphor-less algorithm guided by whole population information for addressing exploration-exploitation dilemma. Comput. Methods Appl. Mech. Eng. 2025, 445, 118208. [Google Scholar] [CrossRef] [Scilit]
- Su, H.; Zhao, D.; Heidari, A.A.; Liu, L.; Zhang, X.; Mafarja, M.; Chen, H. RIME: A physics-based optimization. Neurocomputing 2023, 532, 183–214. [Google Scholar] [CrossRef] [Scilit]
- Fu, Y.; Liu, D.; Chen, J.; He, L. Secretary bird optimization algorithm: A new metaheuristic for solving global optimization problems. Artif. Intell. Rev. 2024, 57, 123. [Google Scholar] [CrossRef] [Scilit]
- Yang, W.; Lai, T.; Fang, Y. Multi-Strategy Golden Jackal Optimization for engineering design. J. Supercomput. 2025, 81, 609. [Google Scholar] [CrossRef] [Scilit]
- Zhang, Y.; Wang, J.; Zhang, X.; Wang, B. ACPOA: An Adaptive Cooperative Pelican Optimization Algorithm for Global Optimization and Multilevel Thresholding Image Segmentation. Biomimetics 2025, 10, 596. [Google Scholar] [CrossRef] [Scilit]
- Wu, Q. An enhanced whale optimization algorithm with inertia weight and dynamic parameter adaptation for wireless sensor network deployment. Computing 2025, 107, 167. [Google Scholar] [CrossRef] [Scilit]
- Cao, L.; Wei, Q. SZOA: An Improved Synergistic Zebra Optimization Algorithm for Microgrid Scheduling and Management. Biomimetics 2025, 10, 664. [Google Scholar] [CrossRef] [Scilit] [PubMed]
- Mohammed, B.O.; Aghdasi, H.S.; Salehpour, P. Dhole optimization algorithm: A new metaheuristic algorithm for solving optimization problems. Clust. Comput. 2025, 28, 430. [Google Scholar] [CrossRef] [Scilit]
- Lyu, L.; Yang, F. MMPA: A modified marine predator algorithm for 3D UAV path planning in complex environments with multiple threats. Expert Syst. Appl. 2024, 257, 124955. [Google Scholar] [CrossRef] [Scilit]
- Shen, Y.; Zhang, C.; Soleimanian Gharehchopogh, F.; Mirjalili, S. An improved whale optimization algorithm based on multi-population evolution for global optimization and engineering design problems. Expert Syst. Appl. 2023, 215, 119269. [Google Scholar] [CrossRef] [Scilit]
- Wang, K.; Zhang, C.; Qin, T.; Chen, C.; Liu, X.; Yang, J. Multi-objective optimization for node deployment of 3D curved surface wireless sensor networks. Phys. Scr. 2025, 100, 095023. [Google Scholar] [CrossRef] [Scilit]
- Tossa, F.; Faga, Y.; Abdou, W.; Ezin, E.C.; Gouton, P. Wireless Sensor Network Deployment: Architecture, Objectives, and Methodologies. Sensors 2025, 25, 3442. [Google Scholar] [CrossRef] [Scilit]
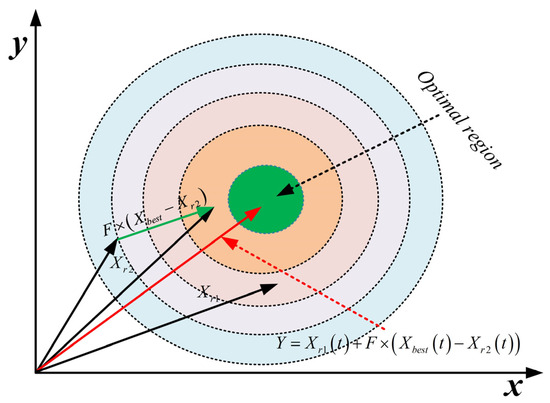
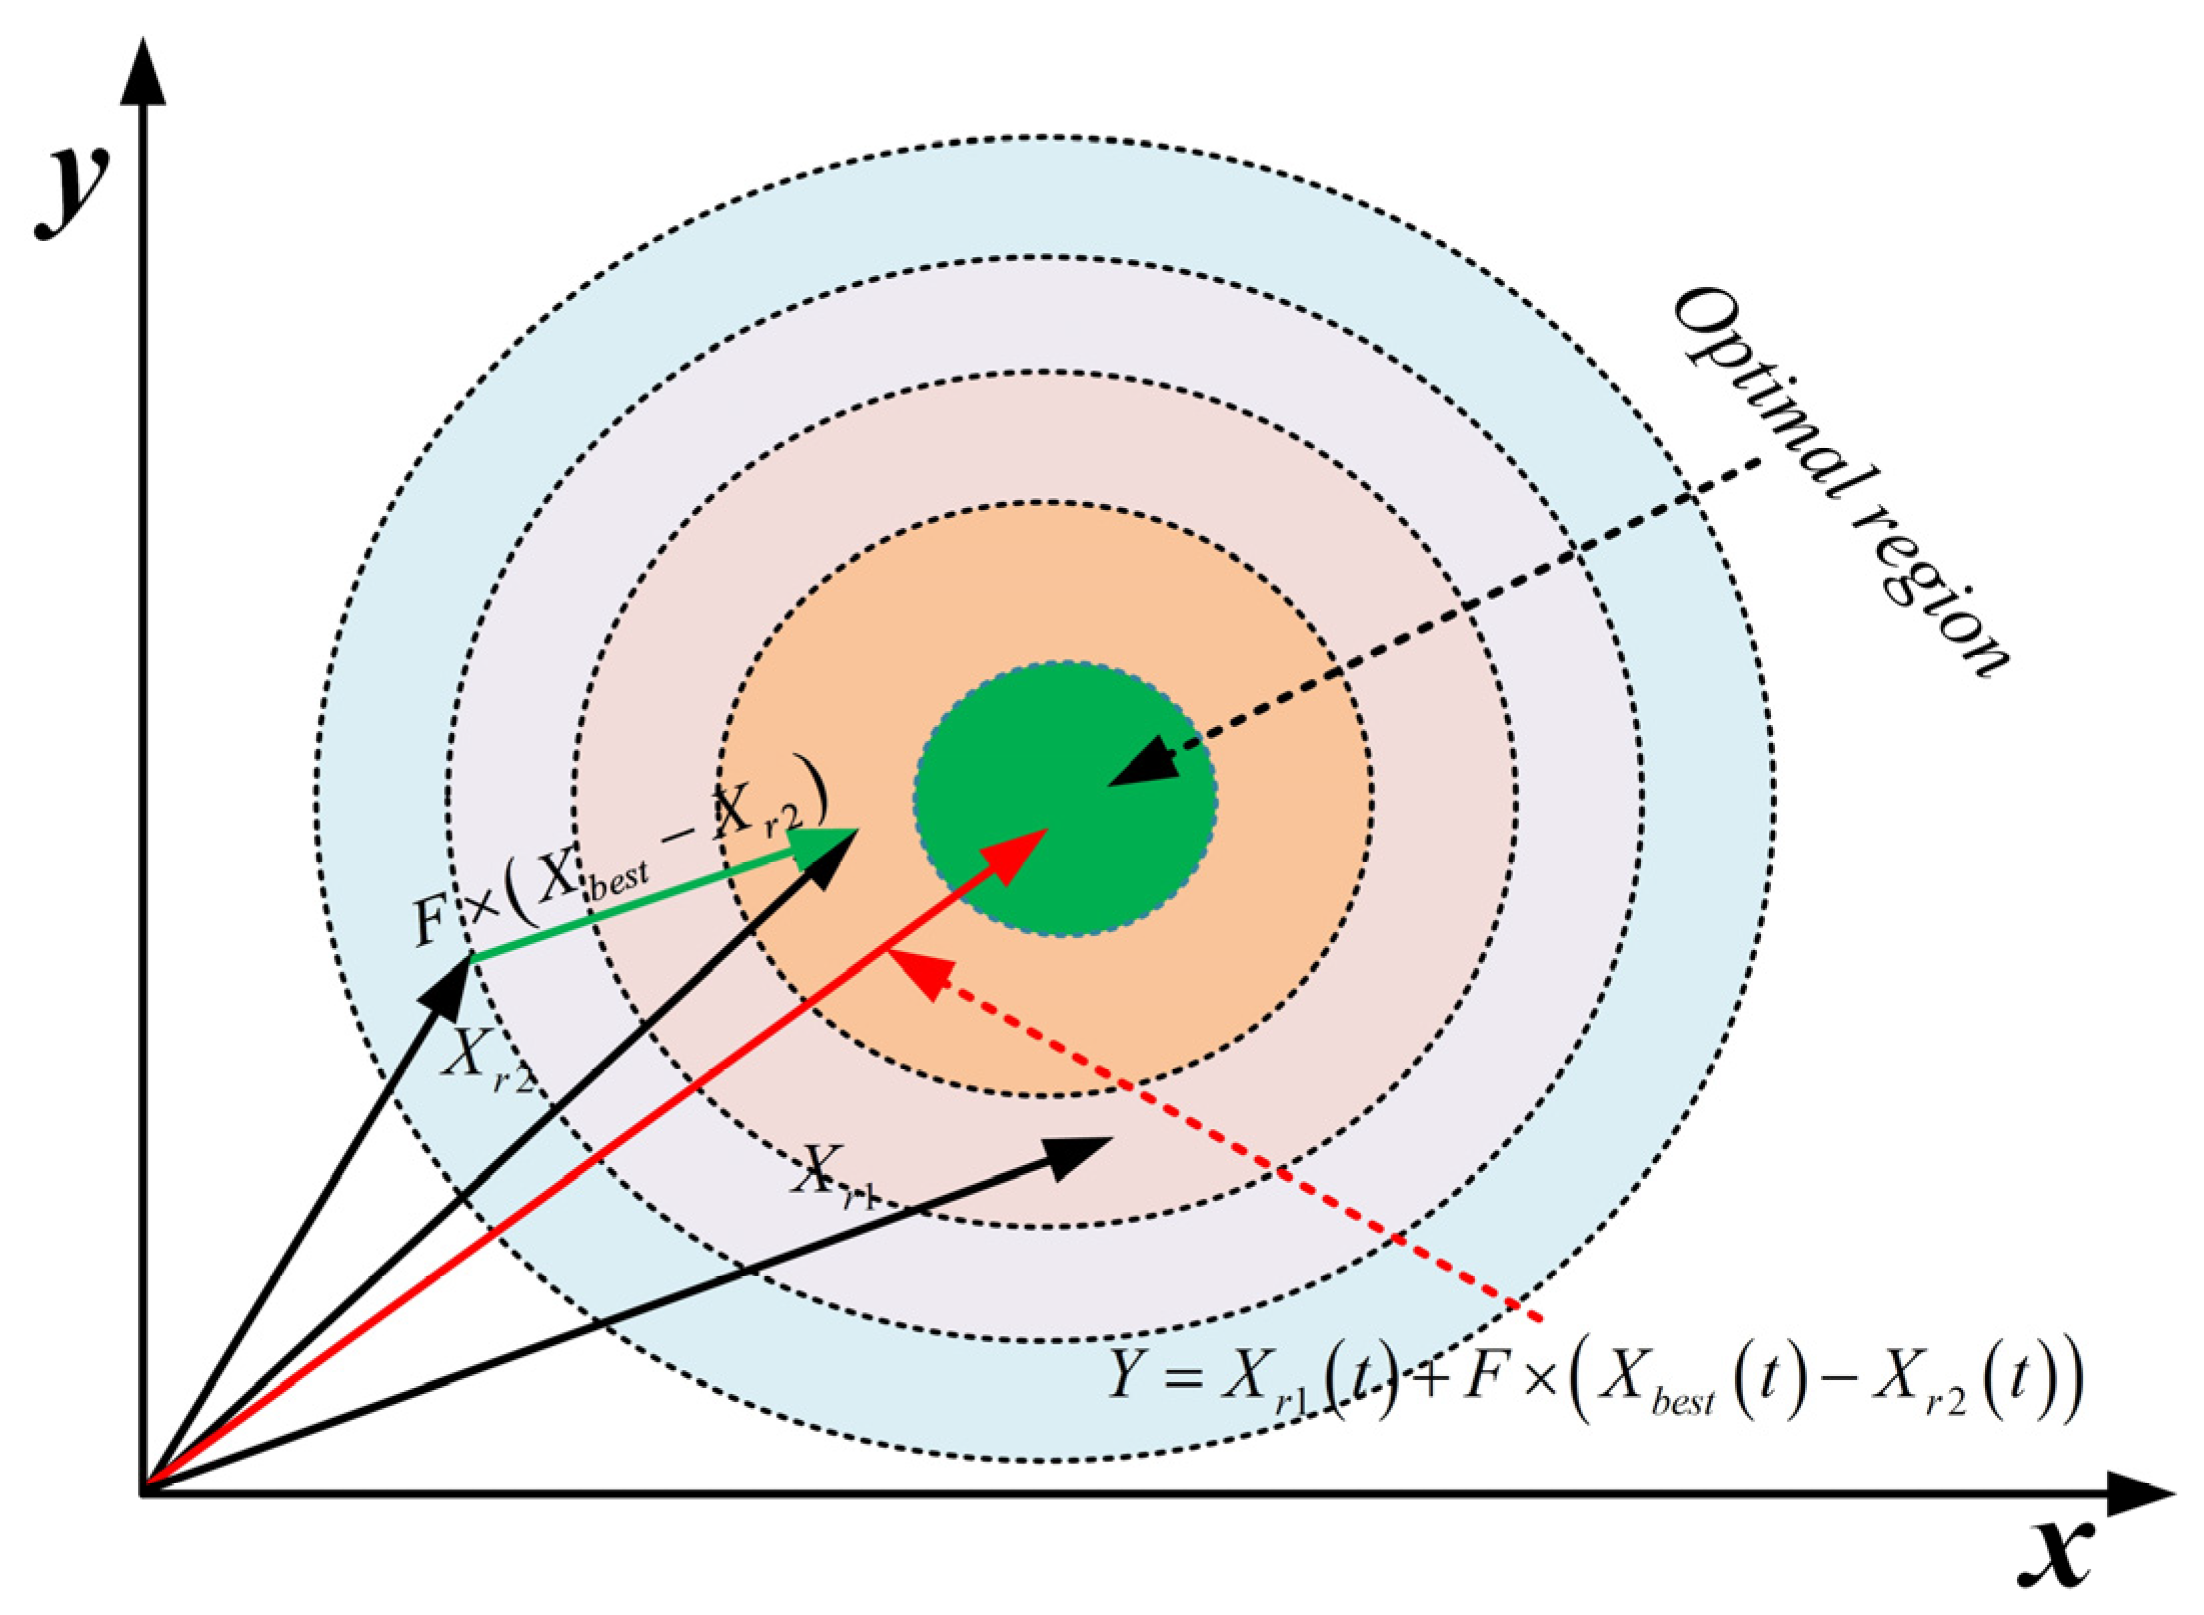
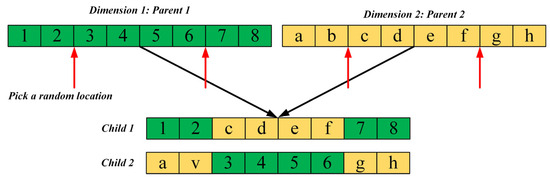
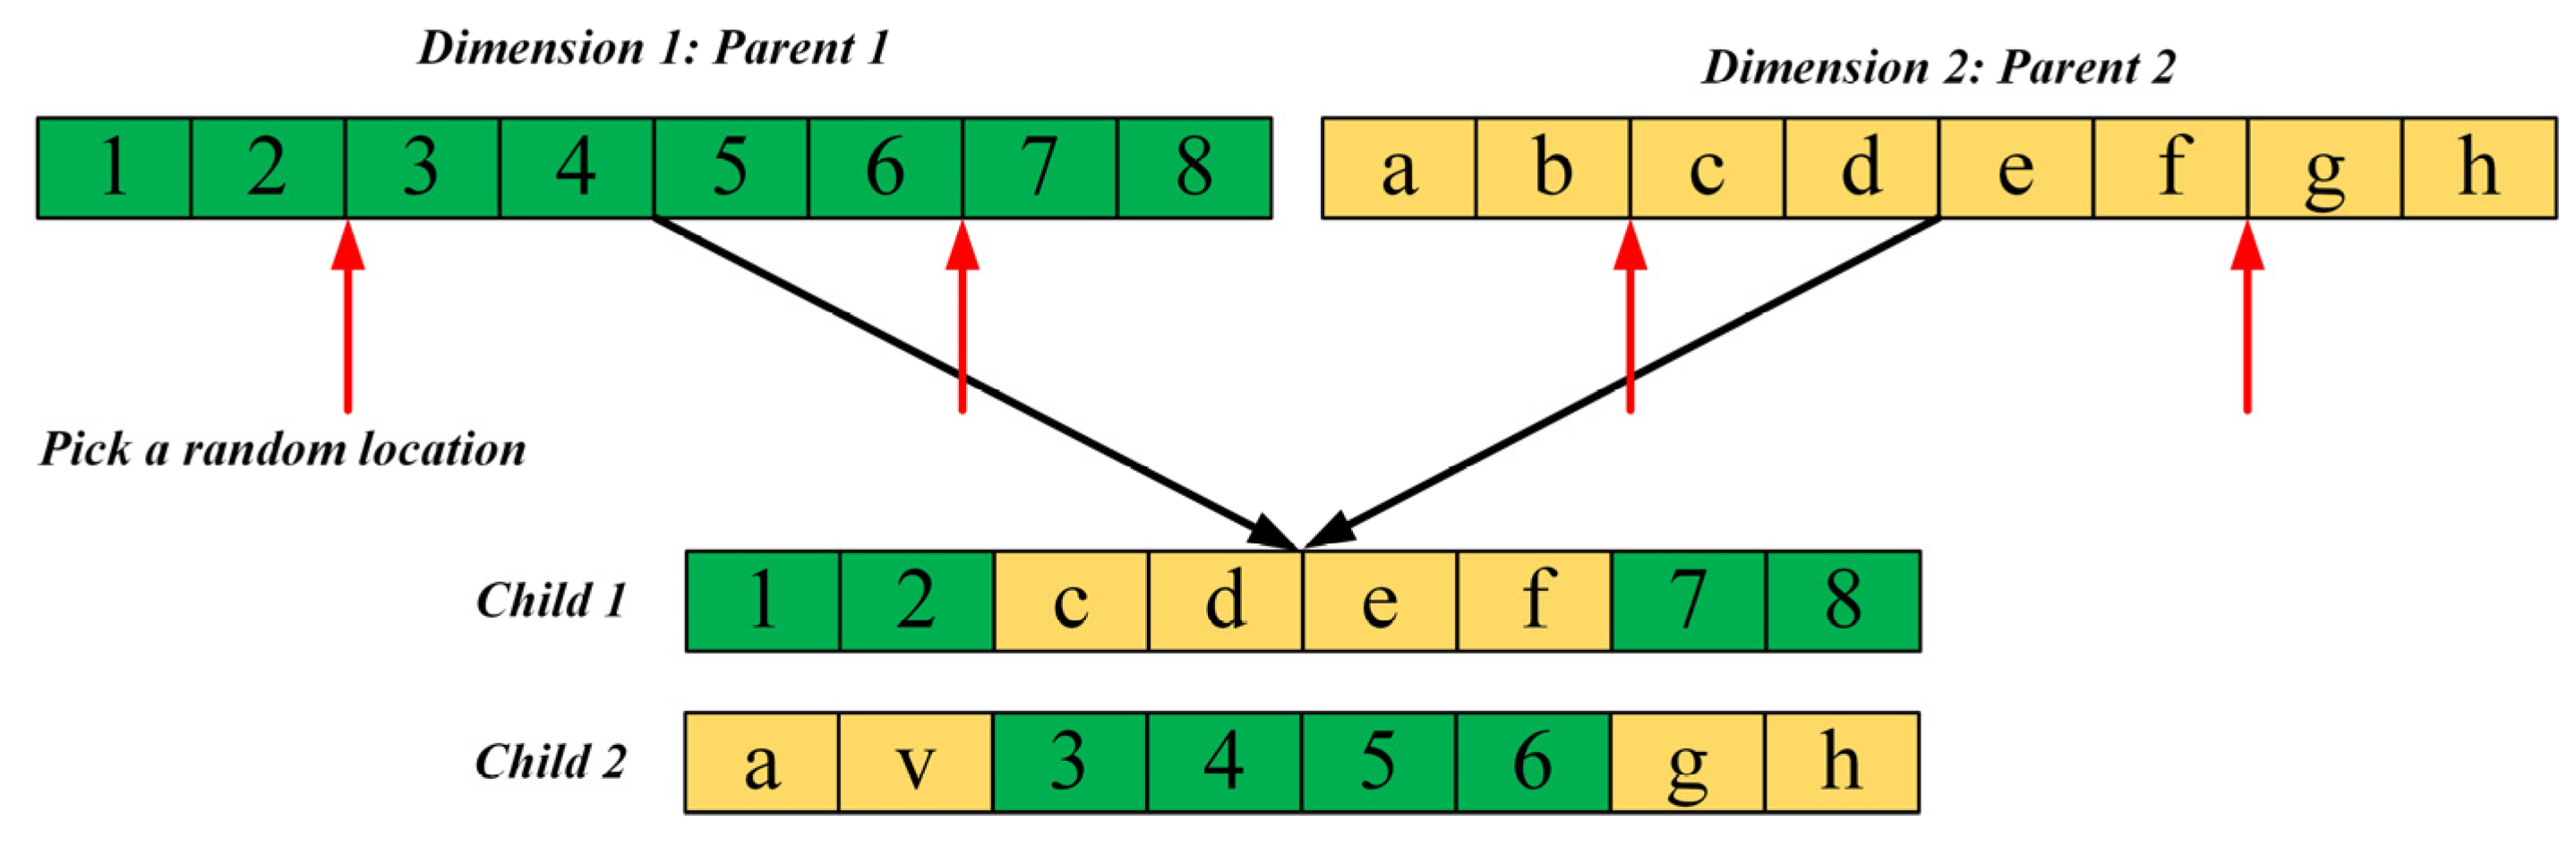
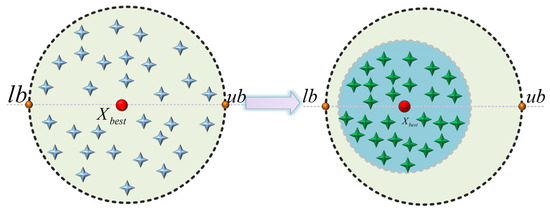
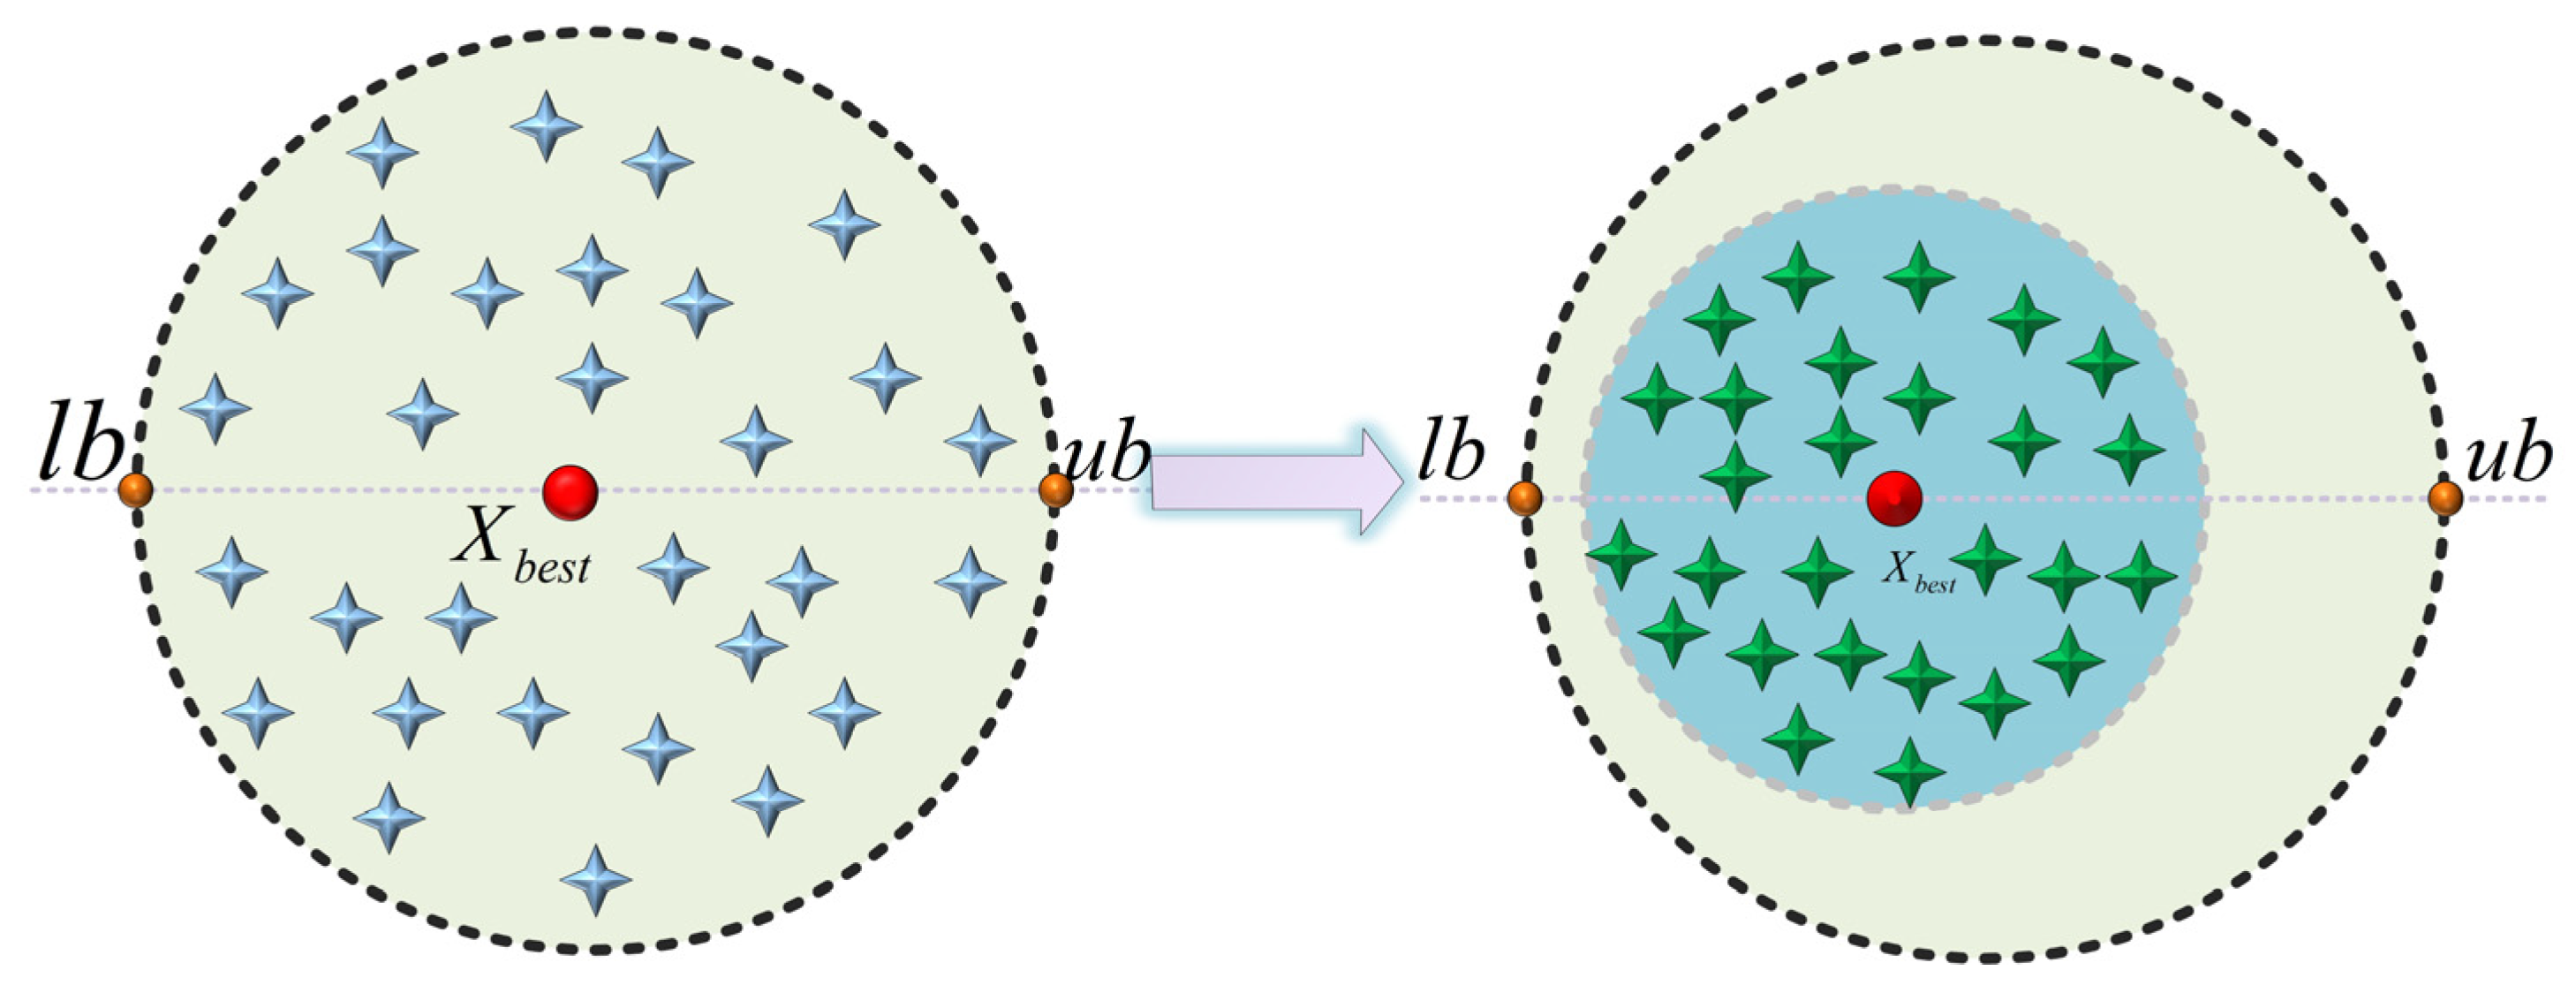
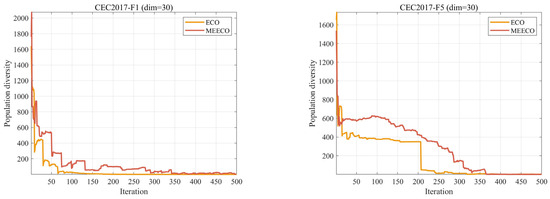
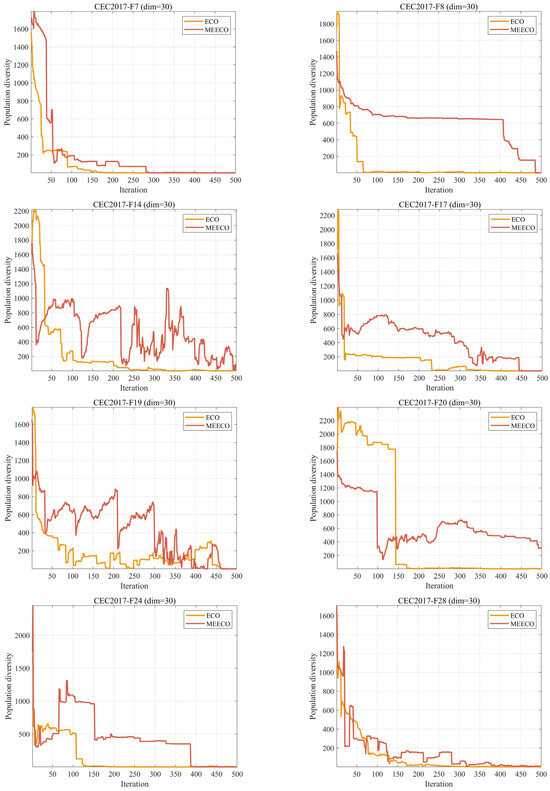
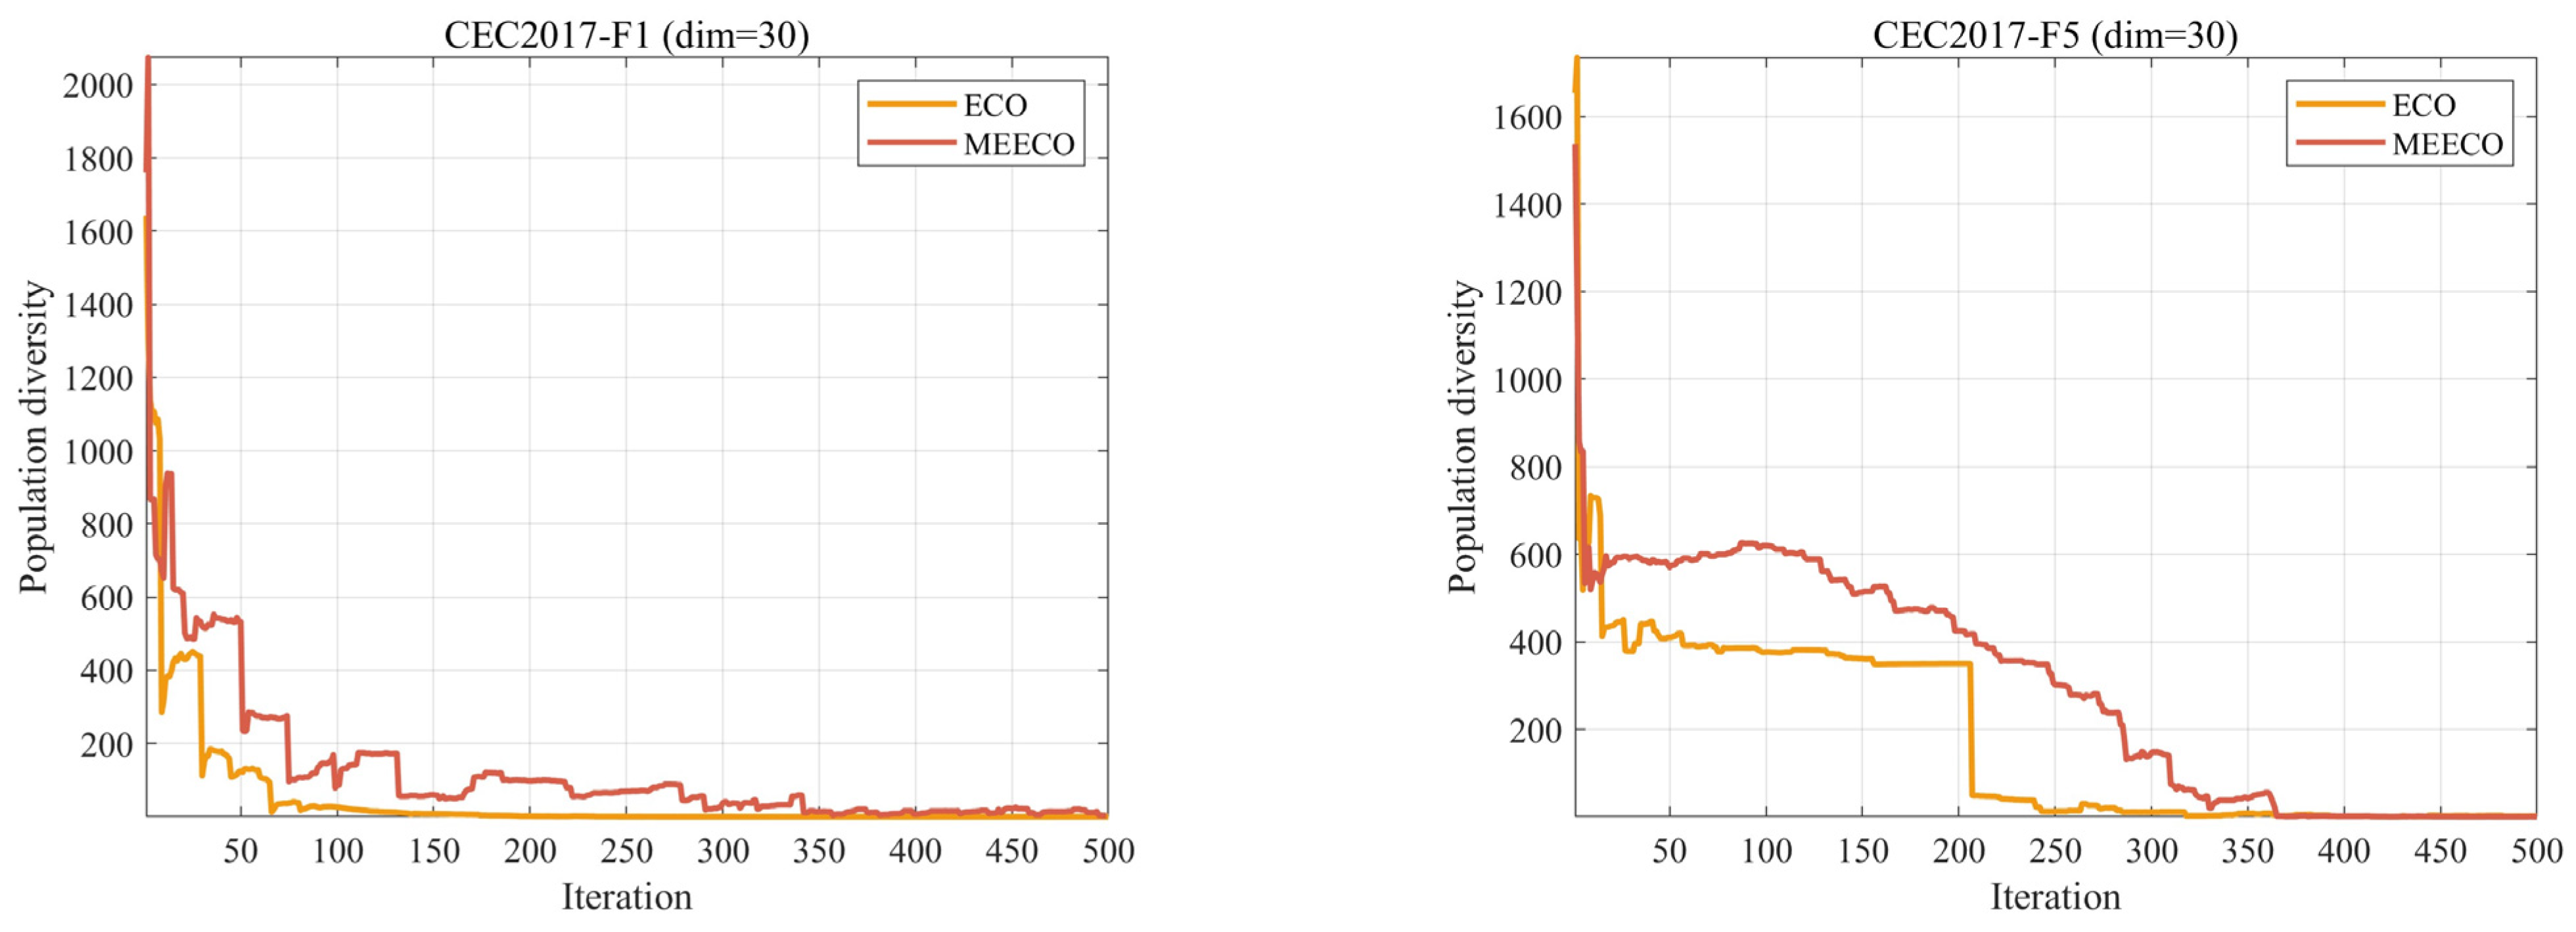
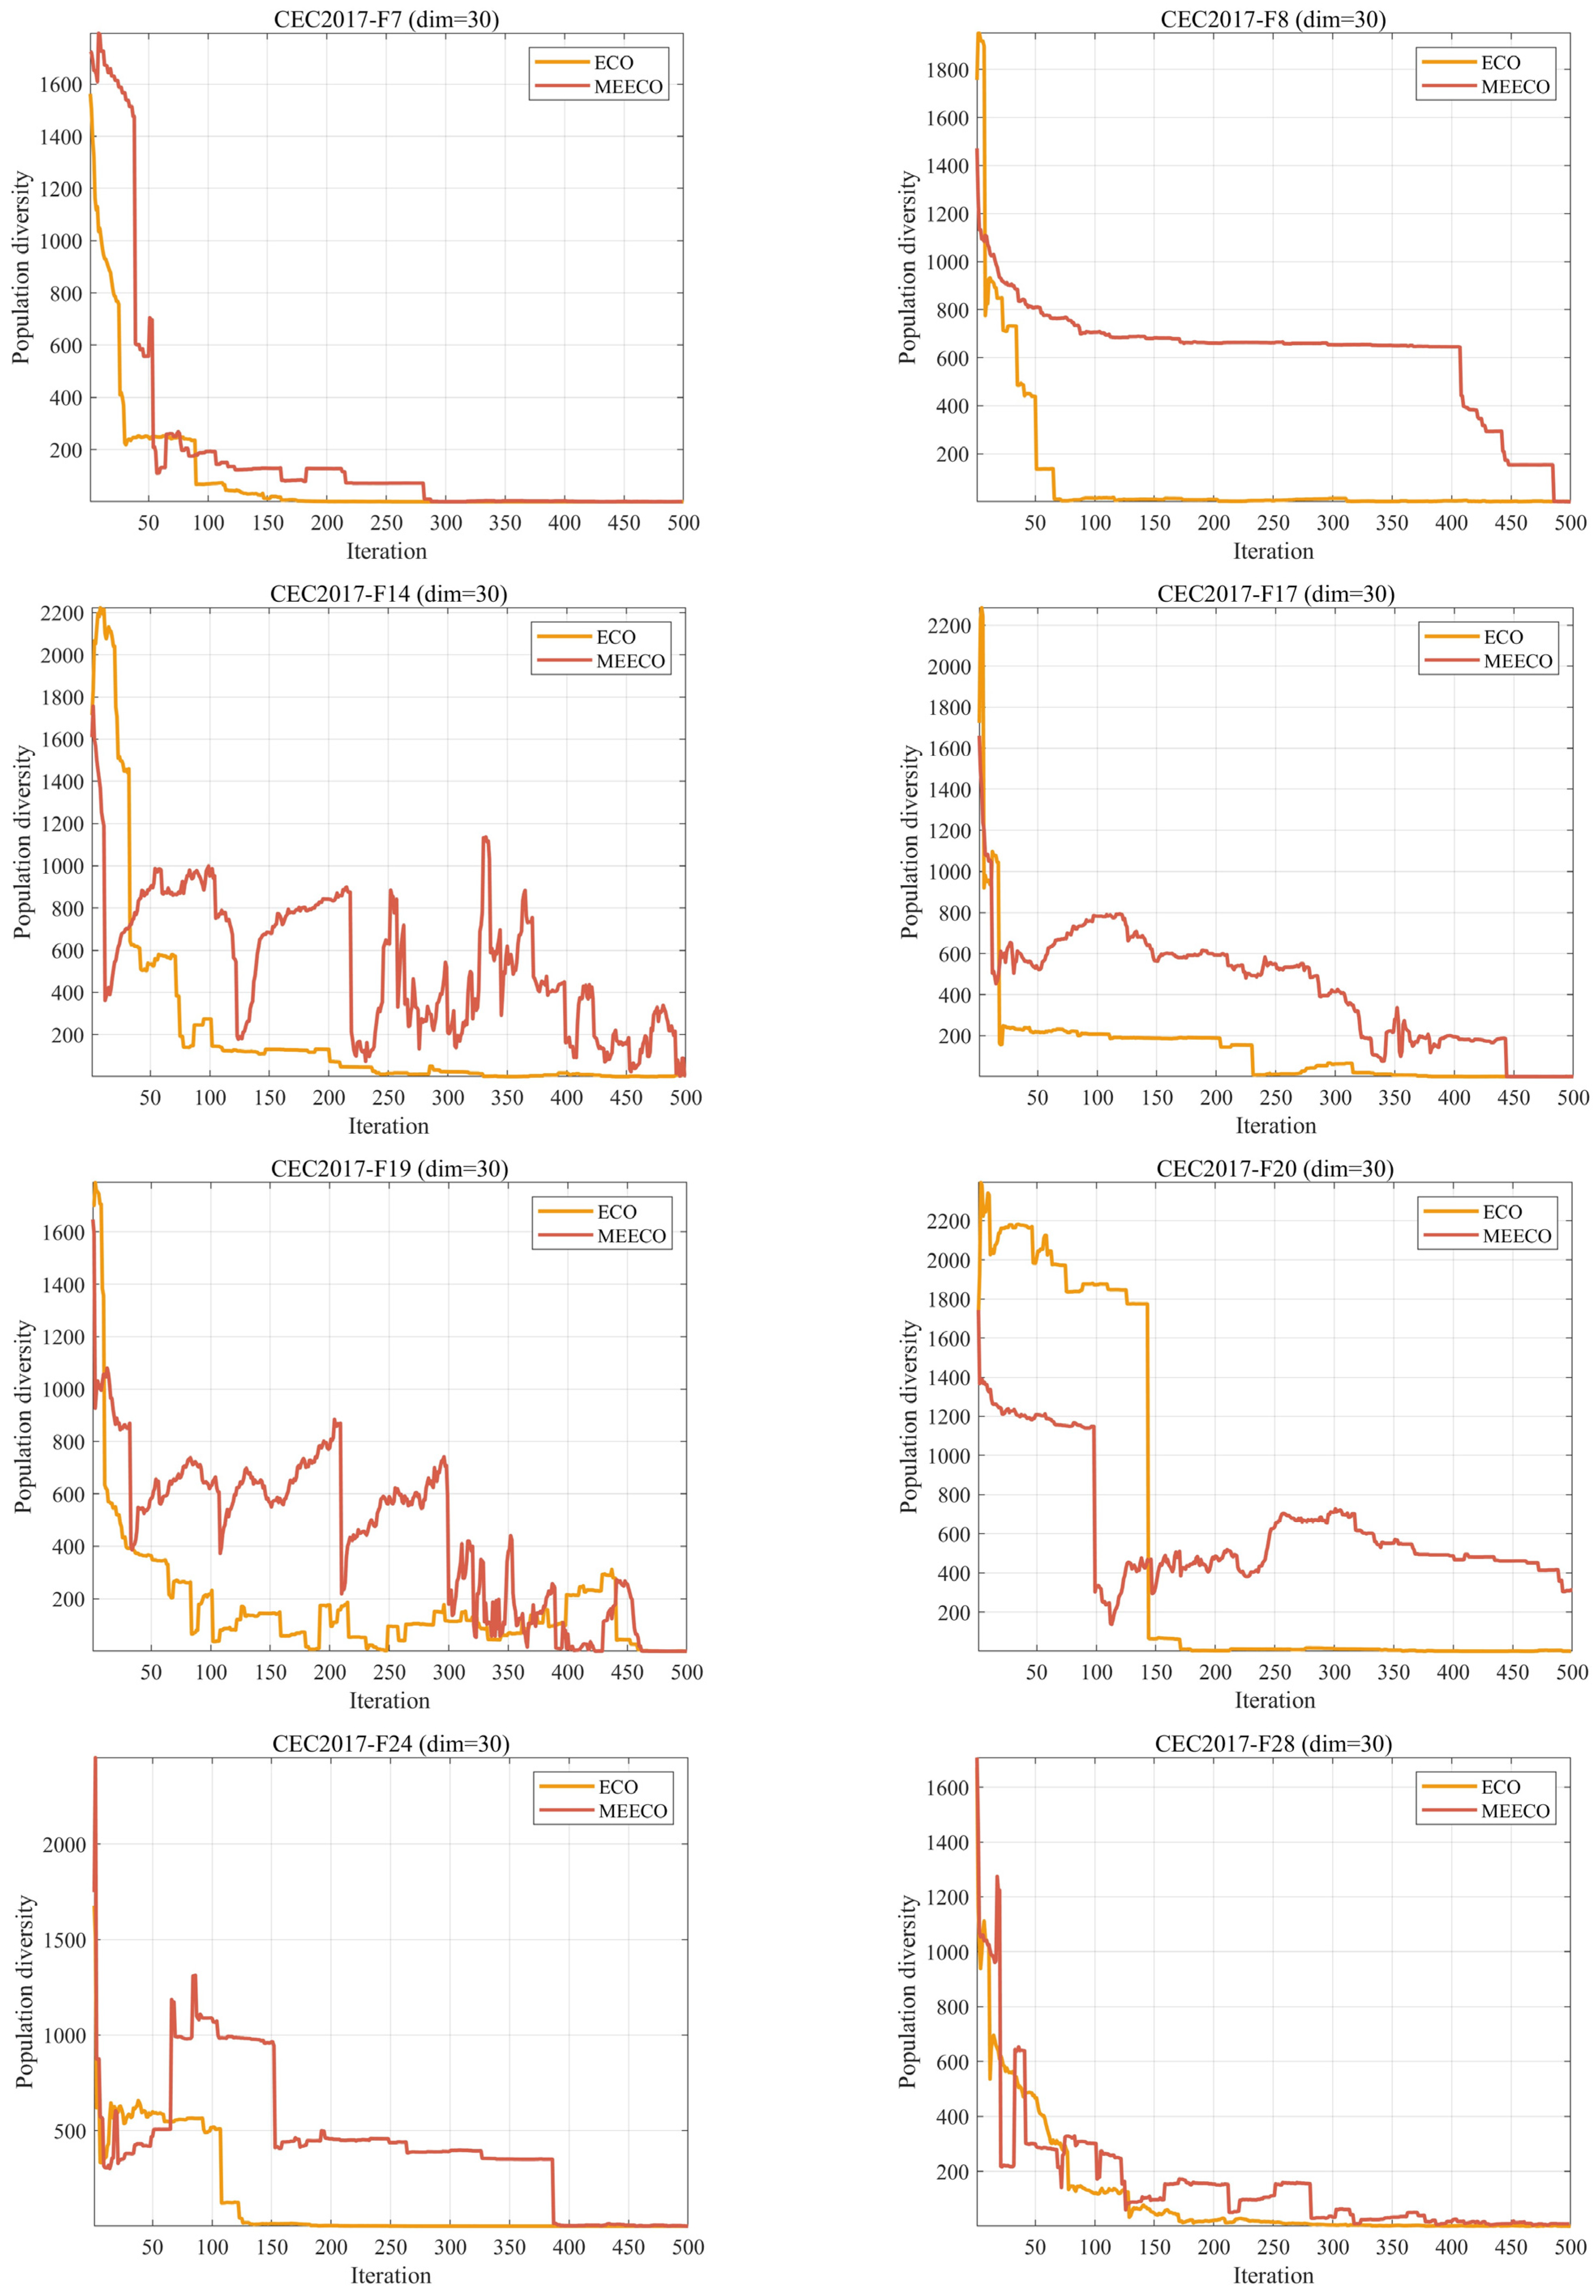
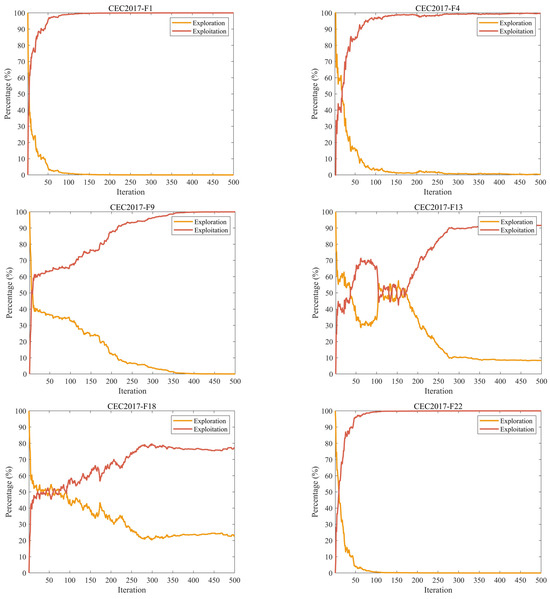
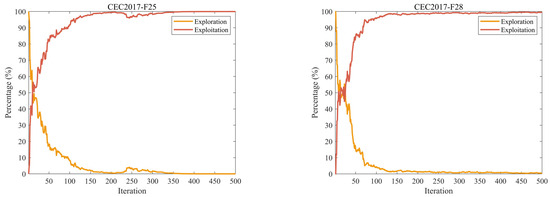
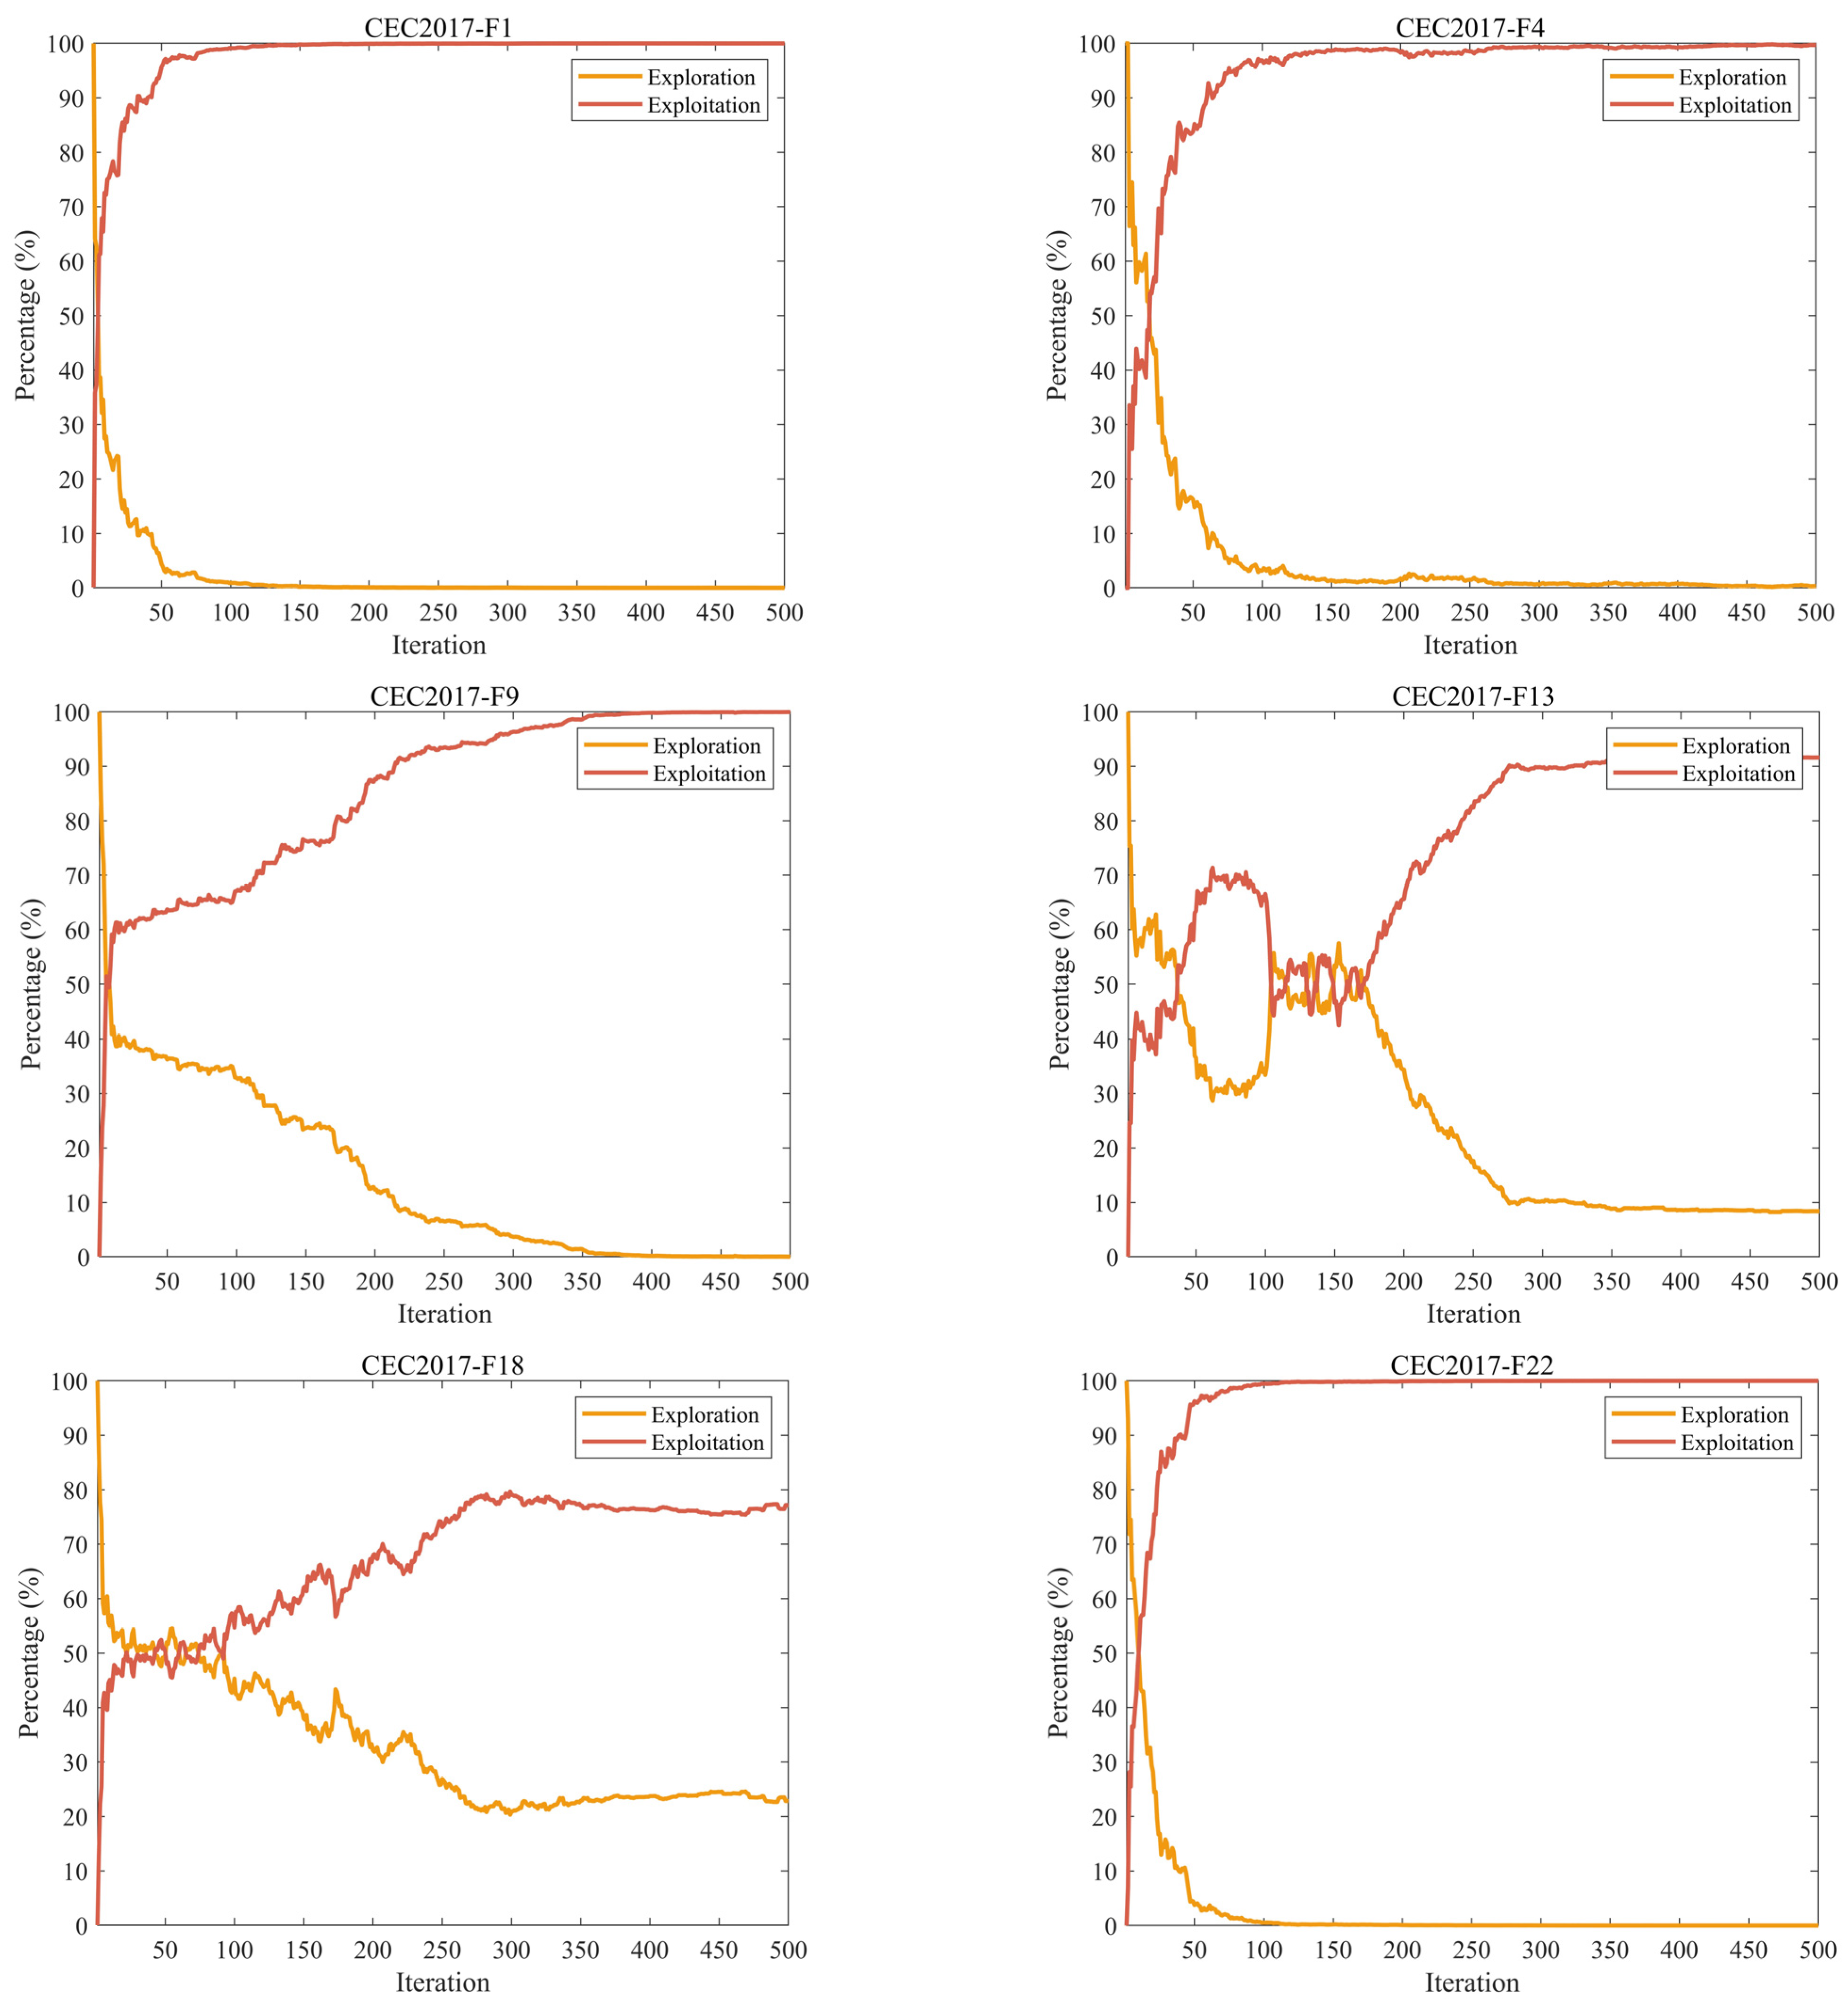
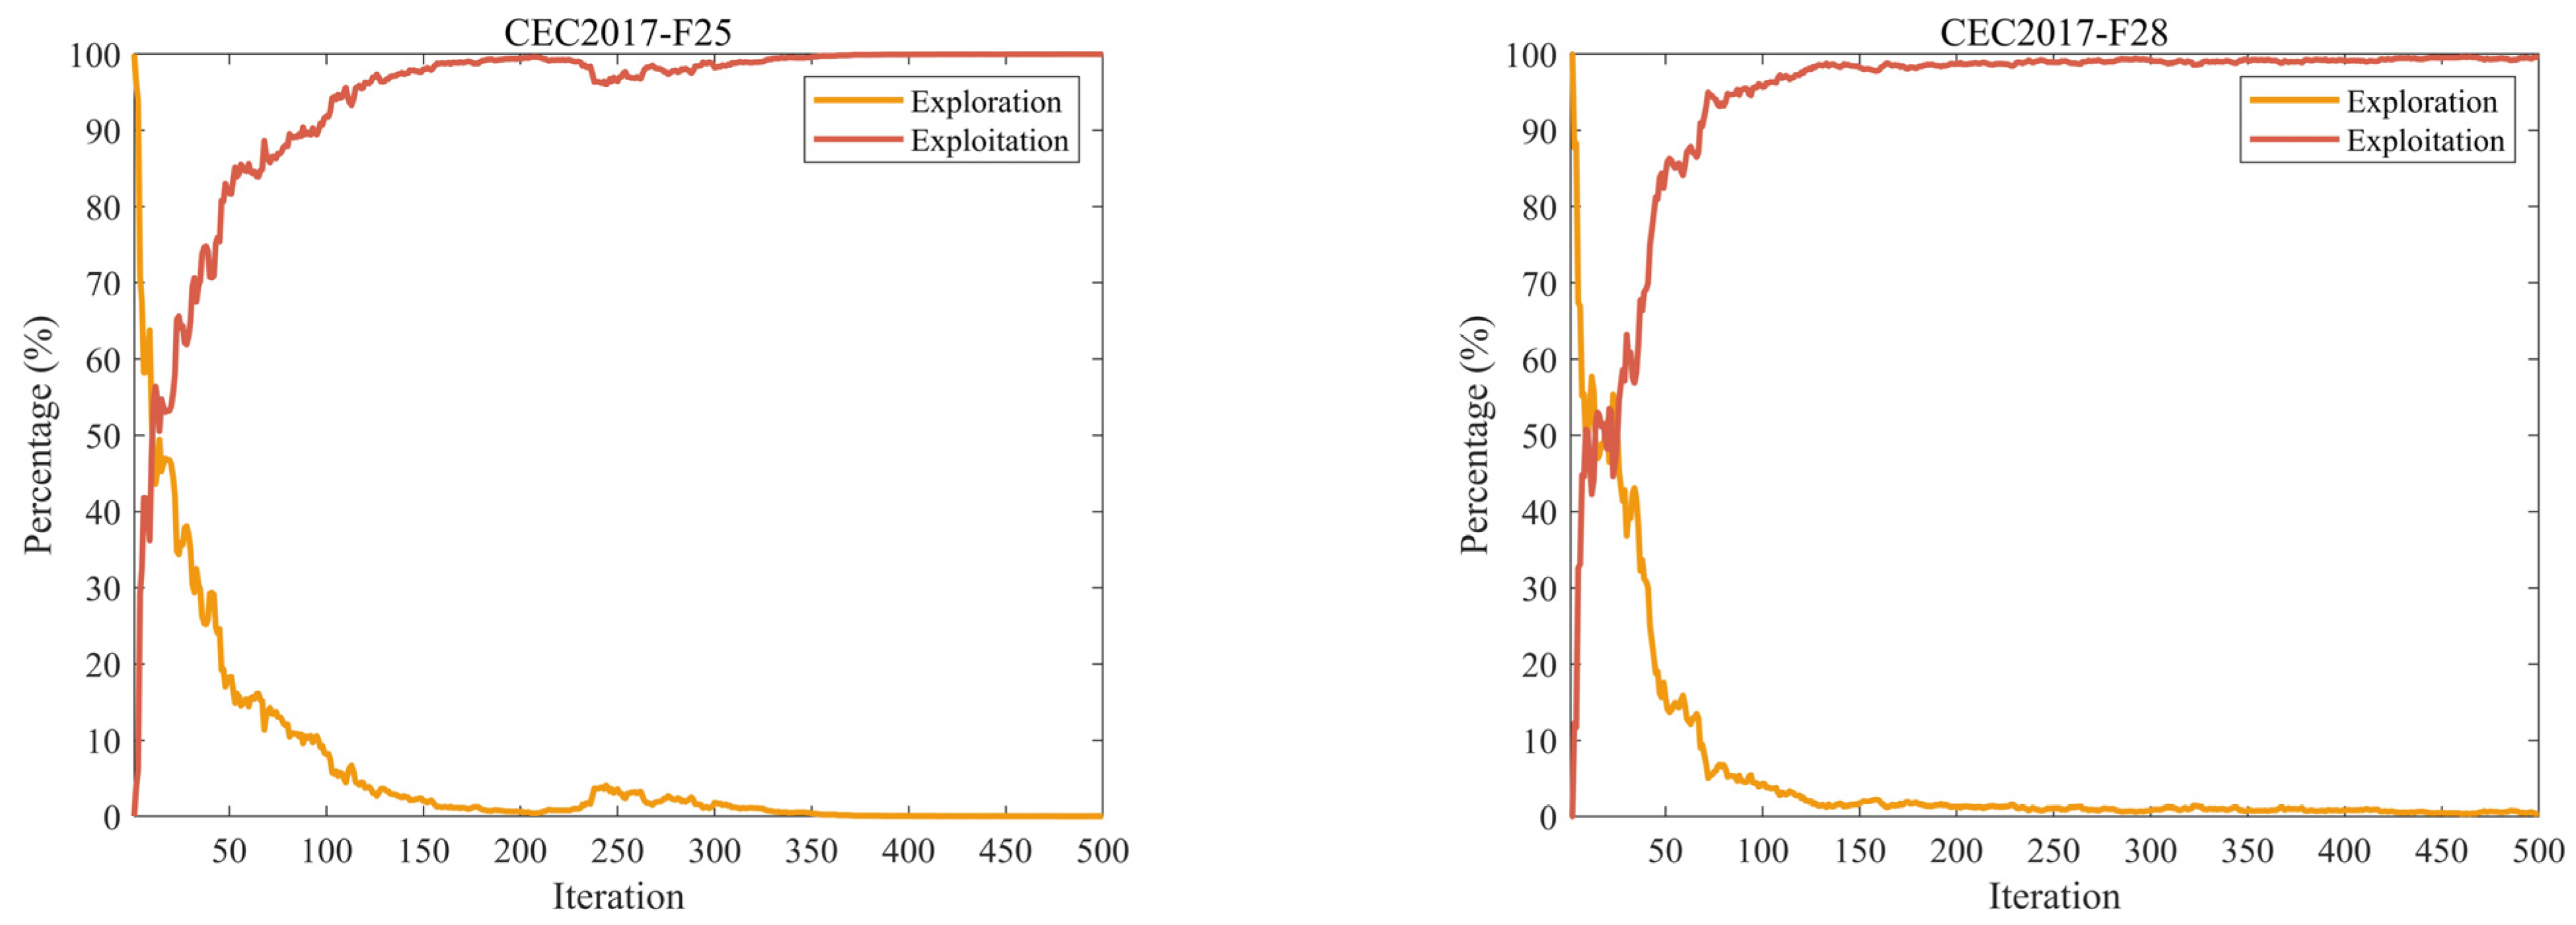
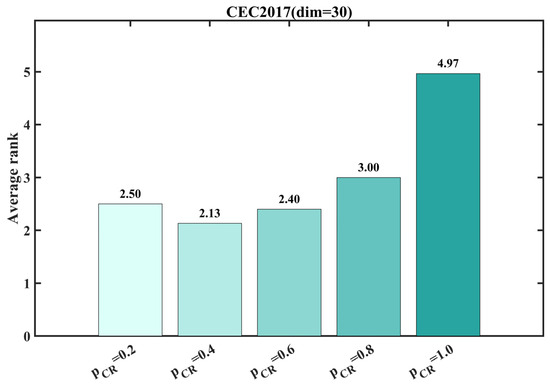
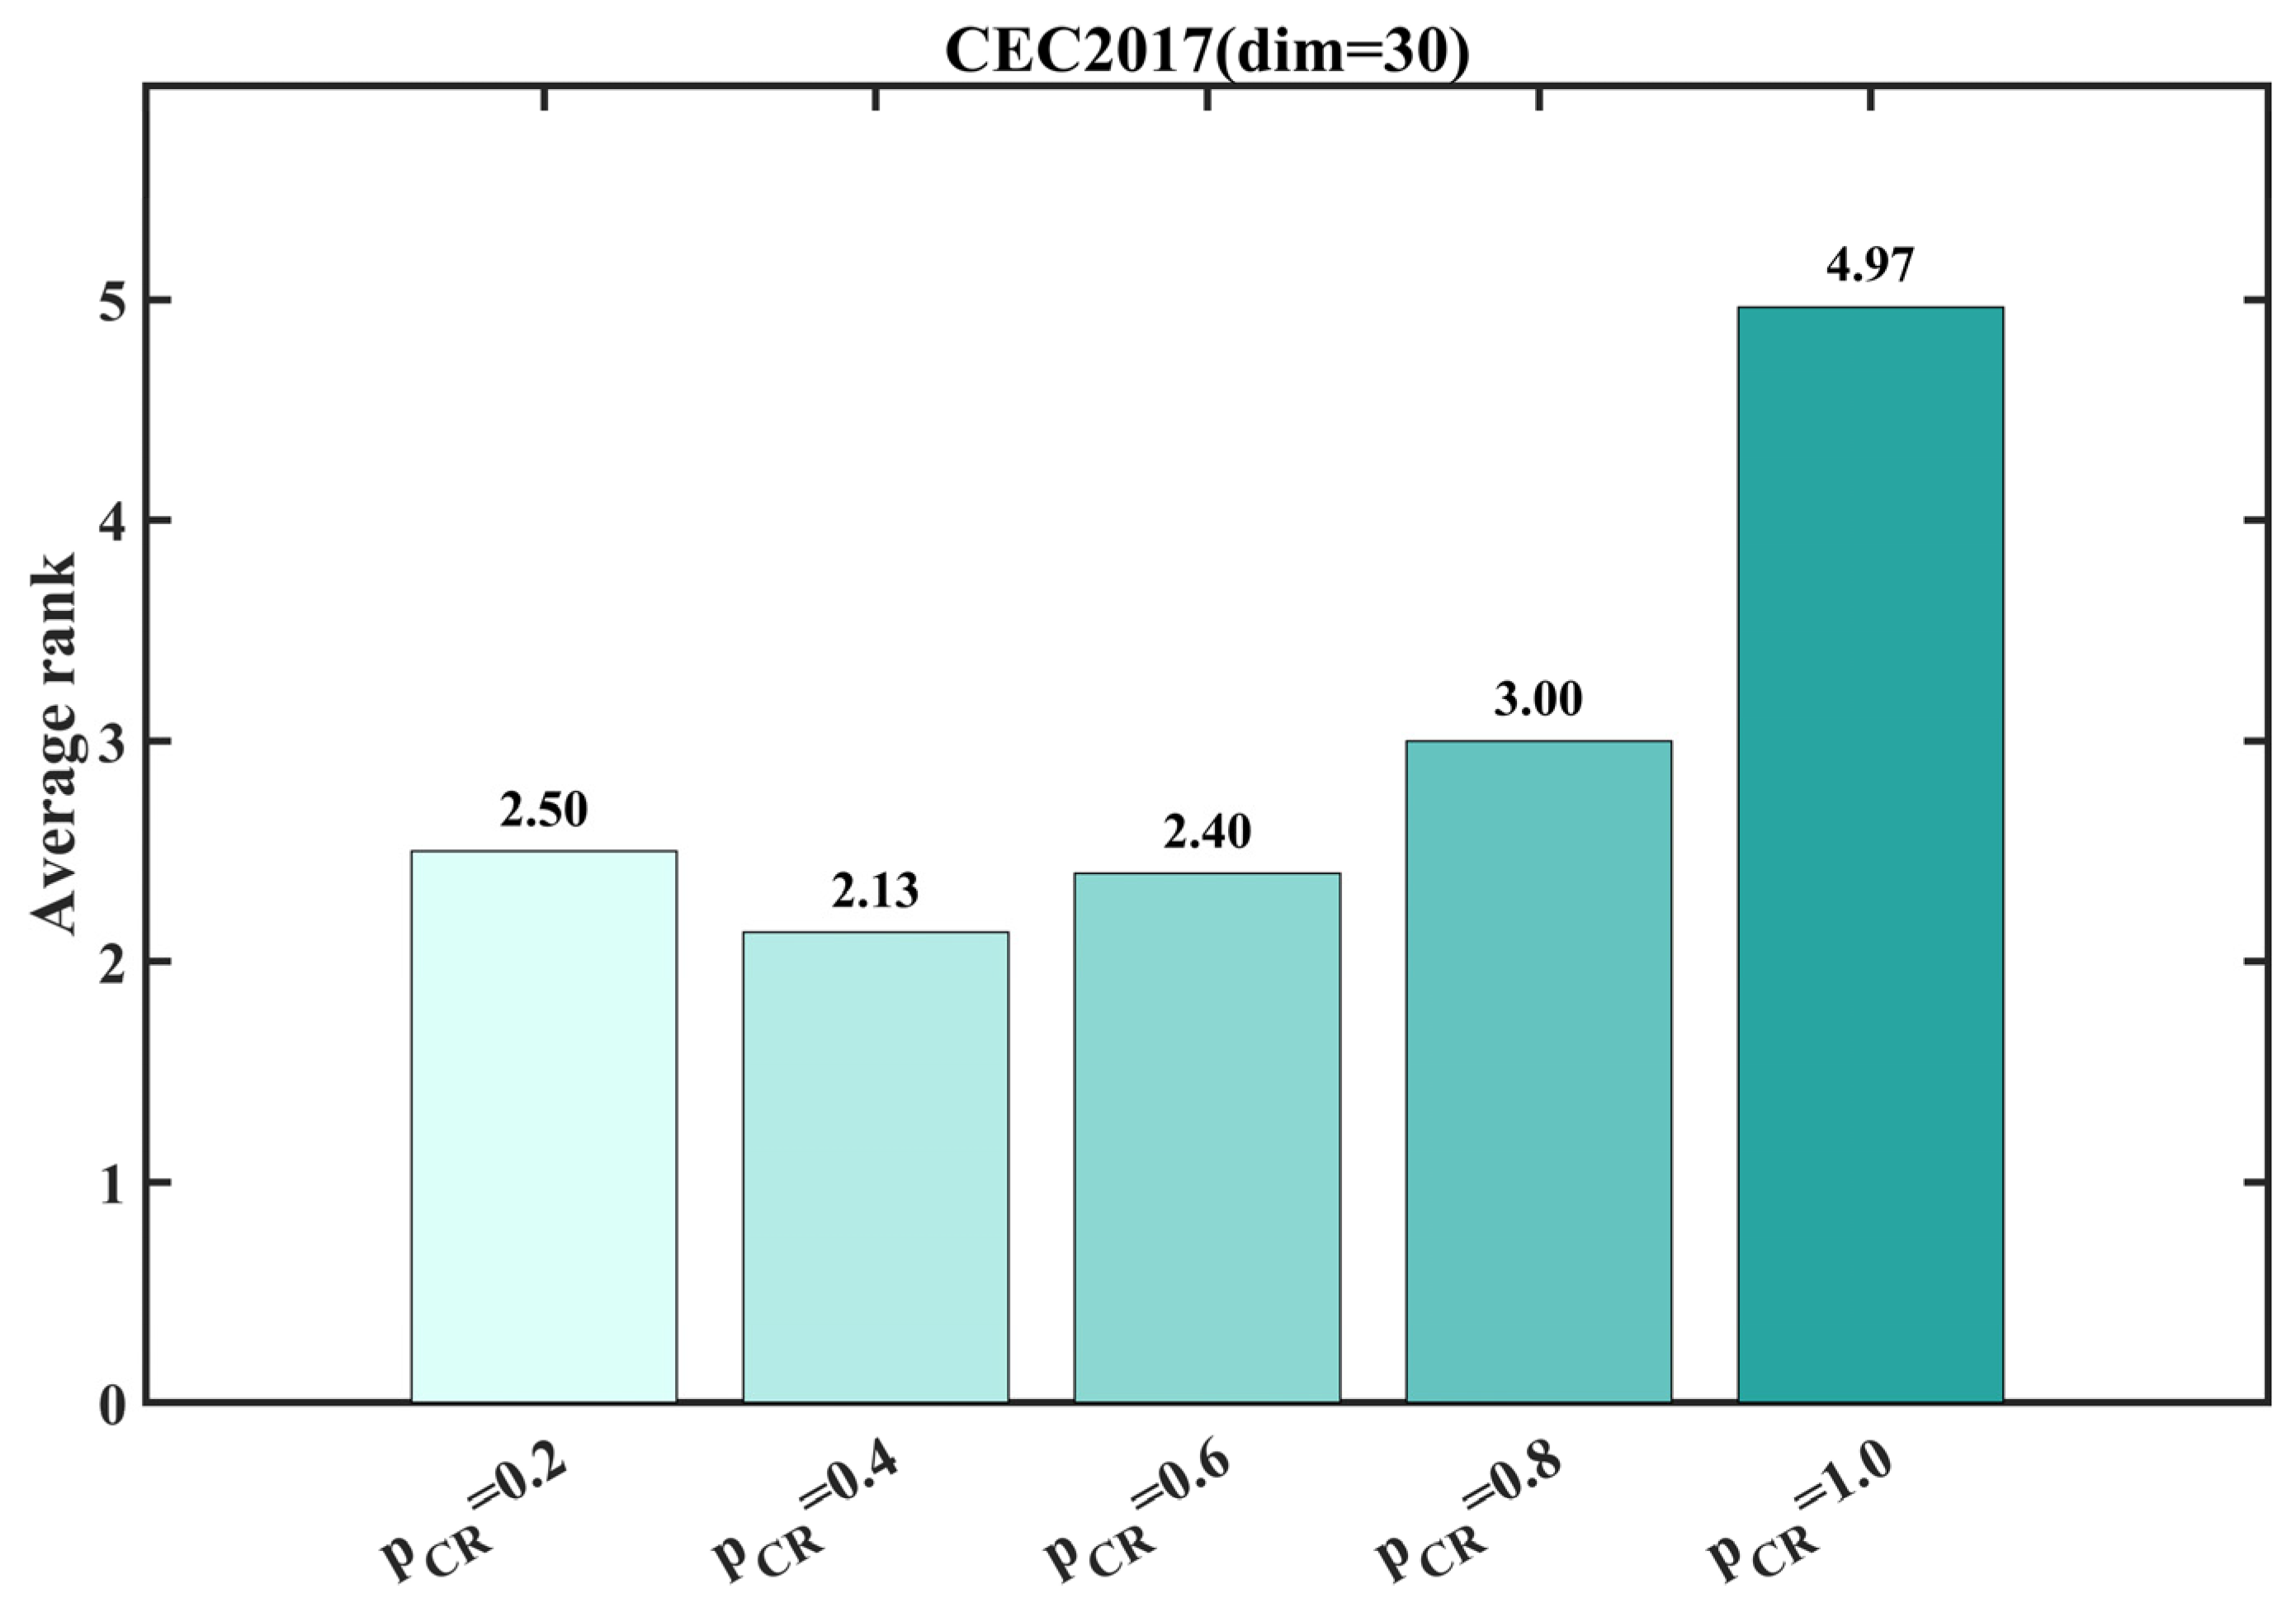
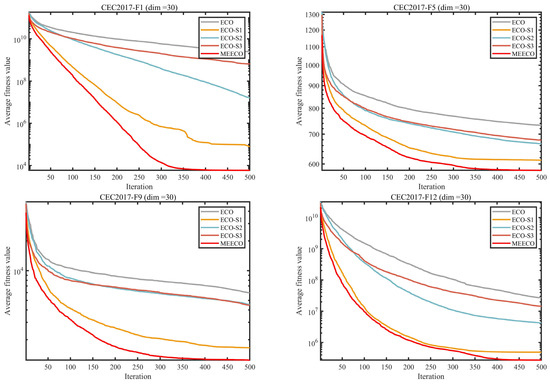
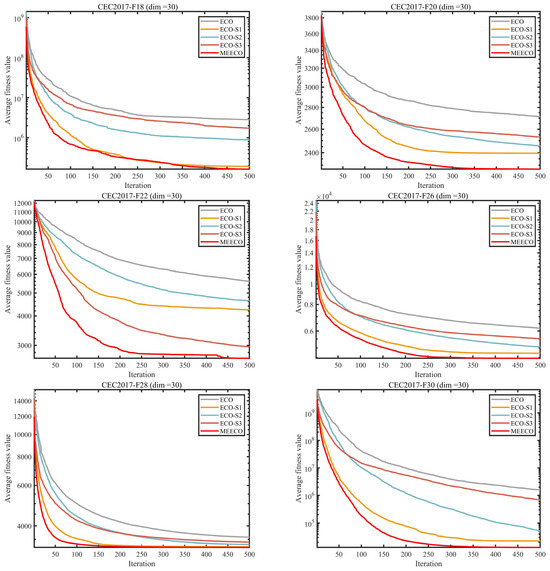
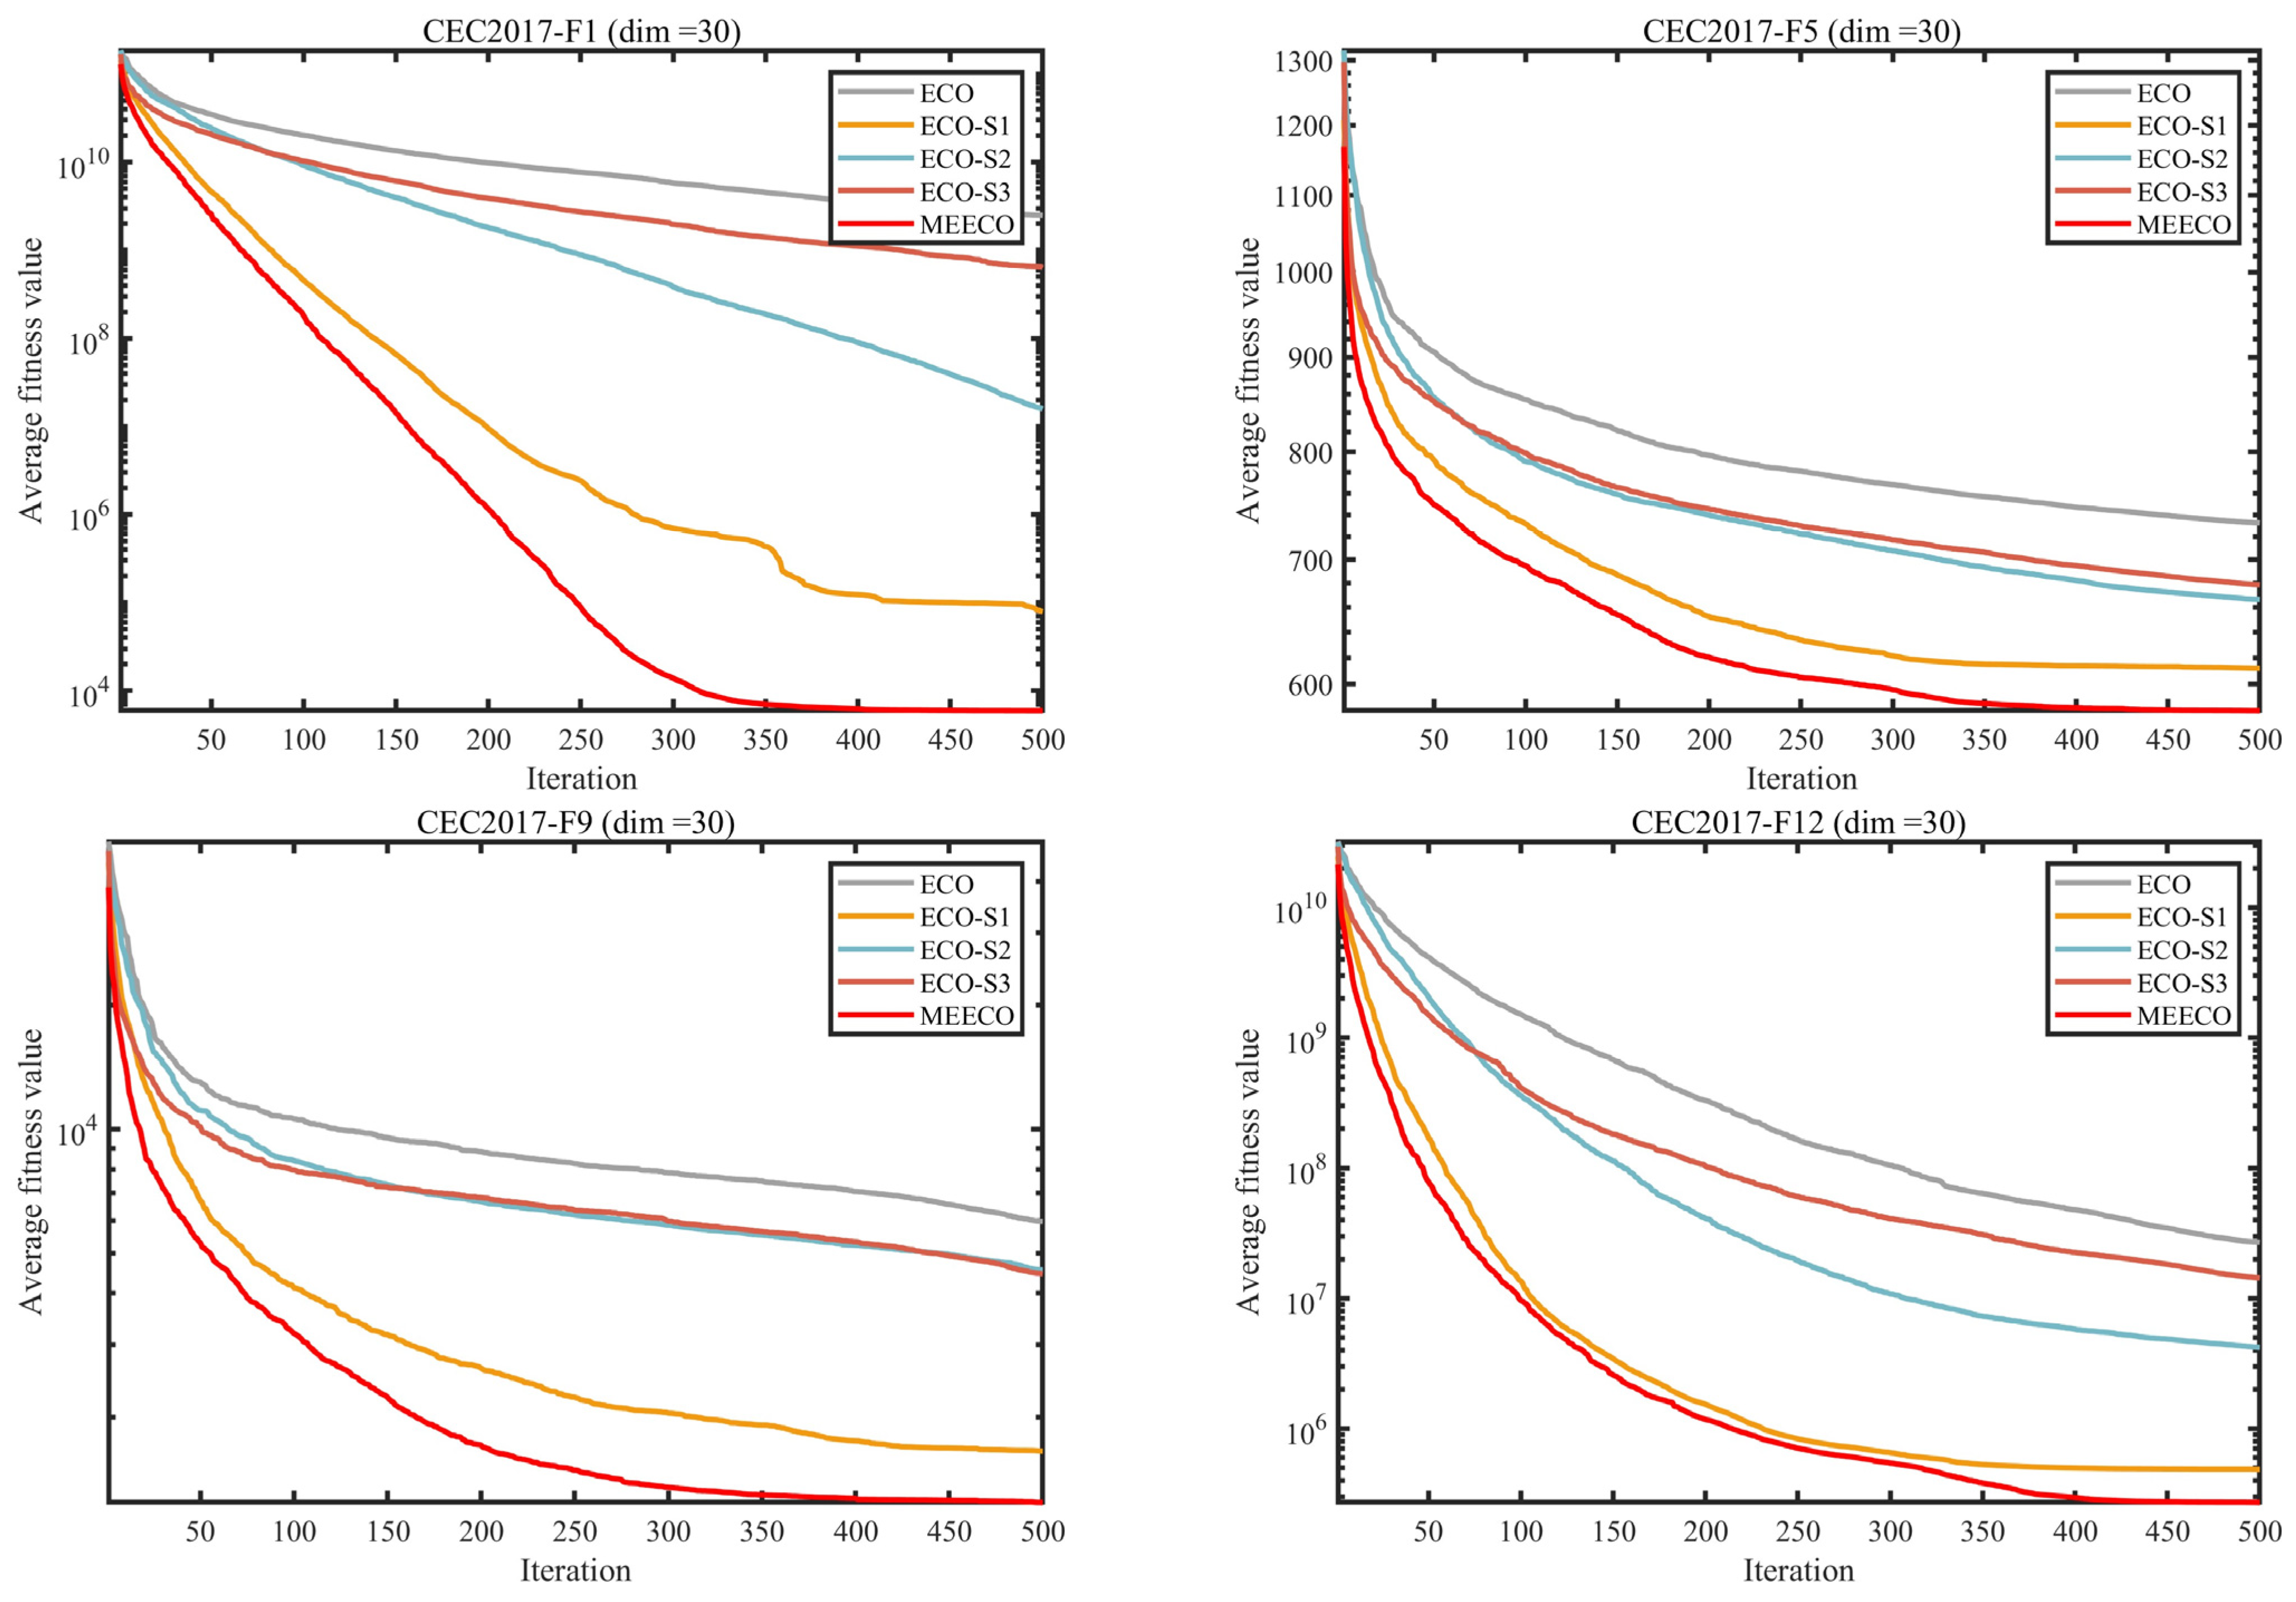
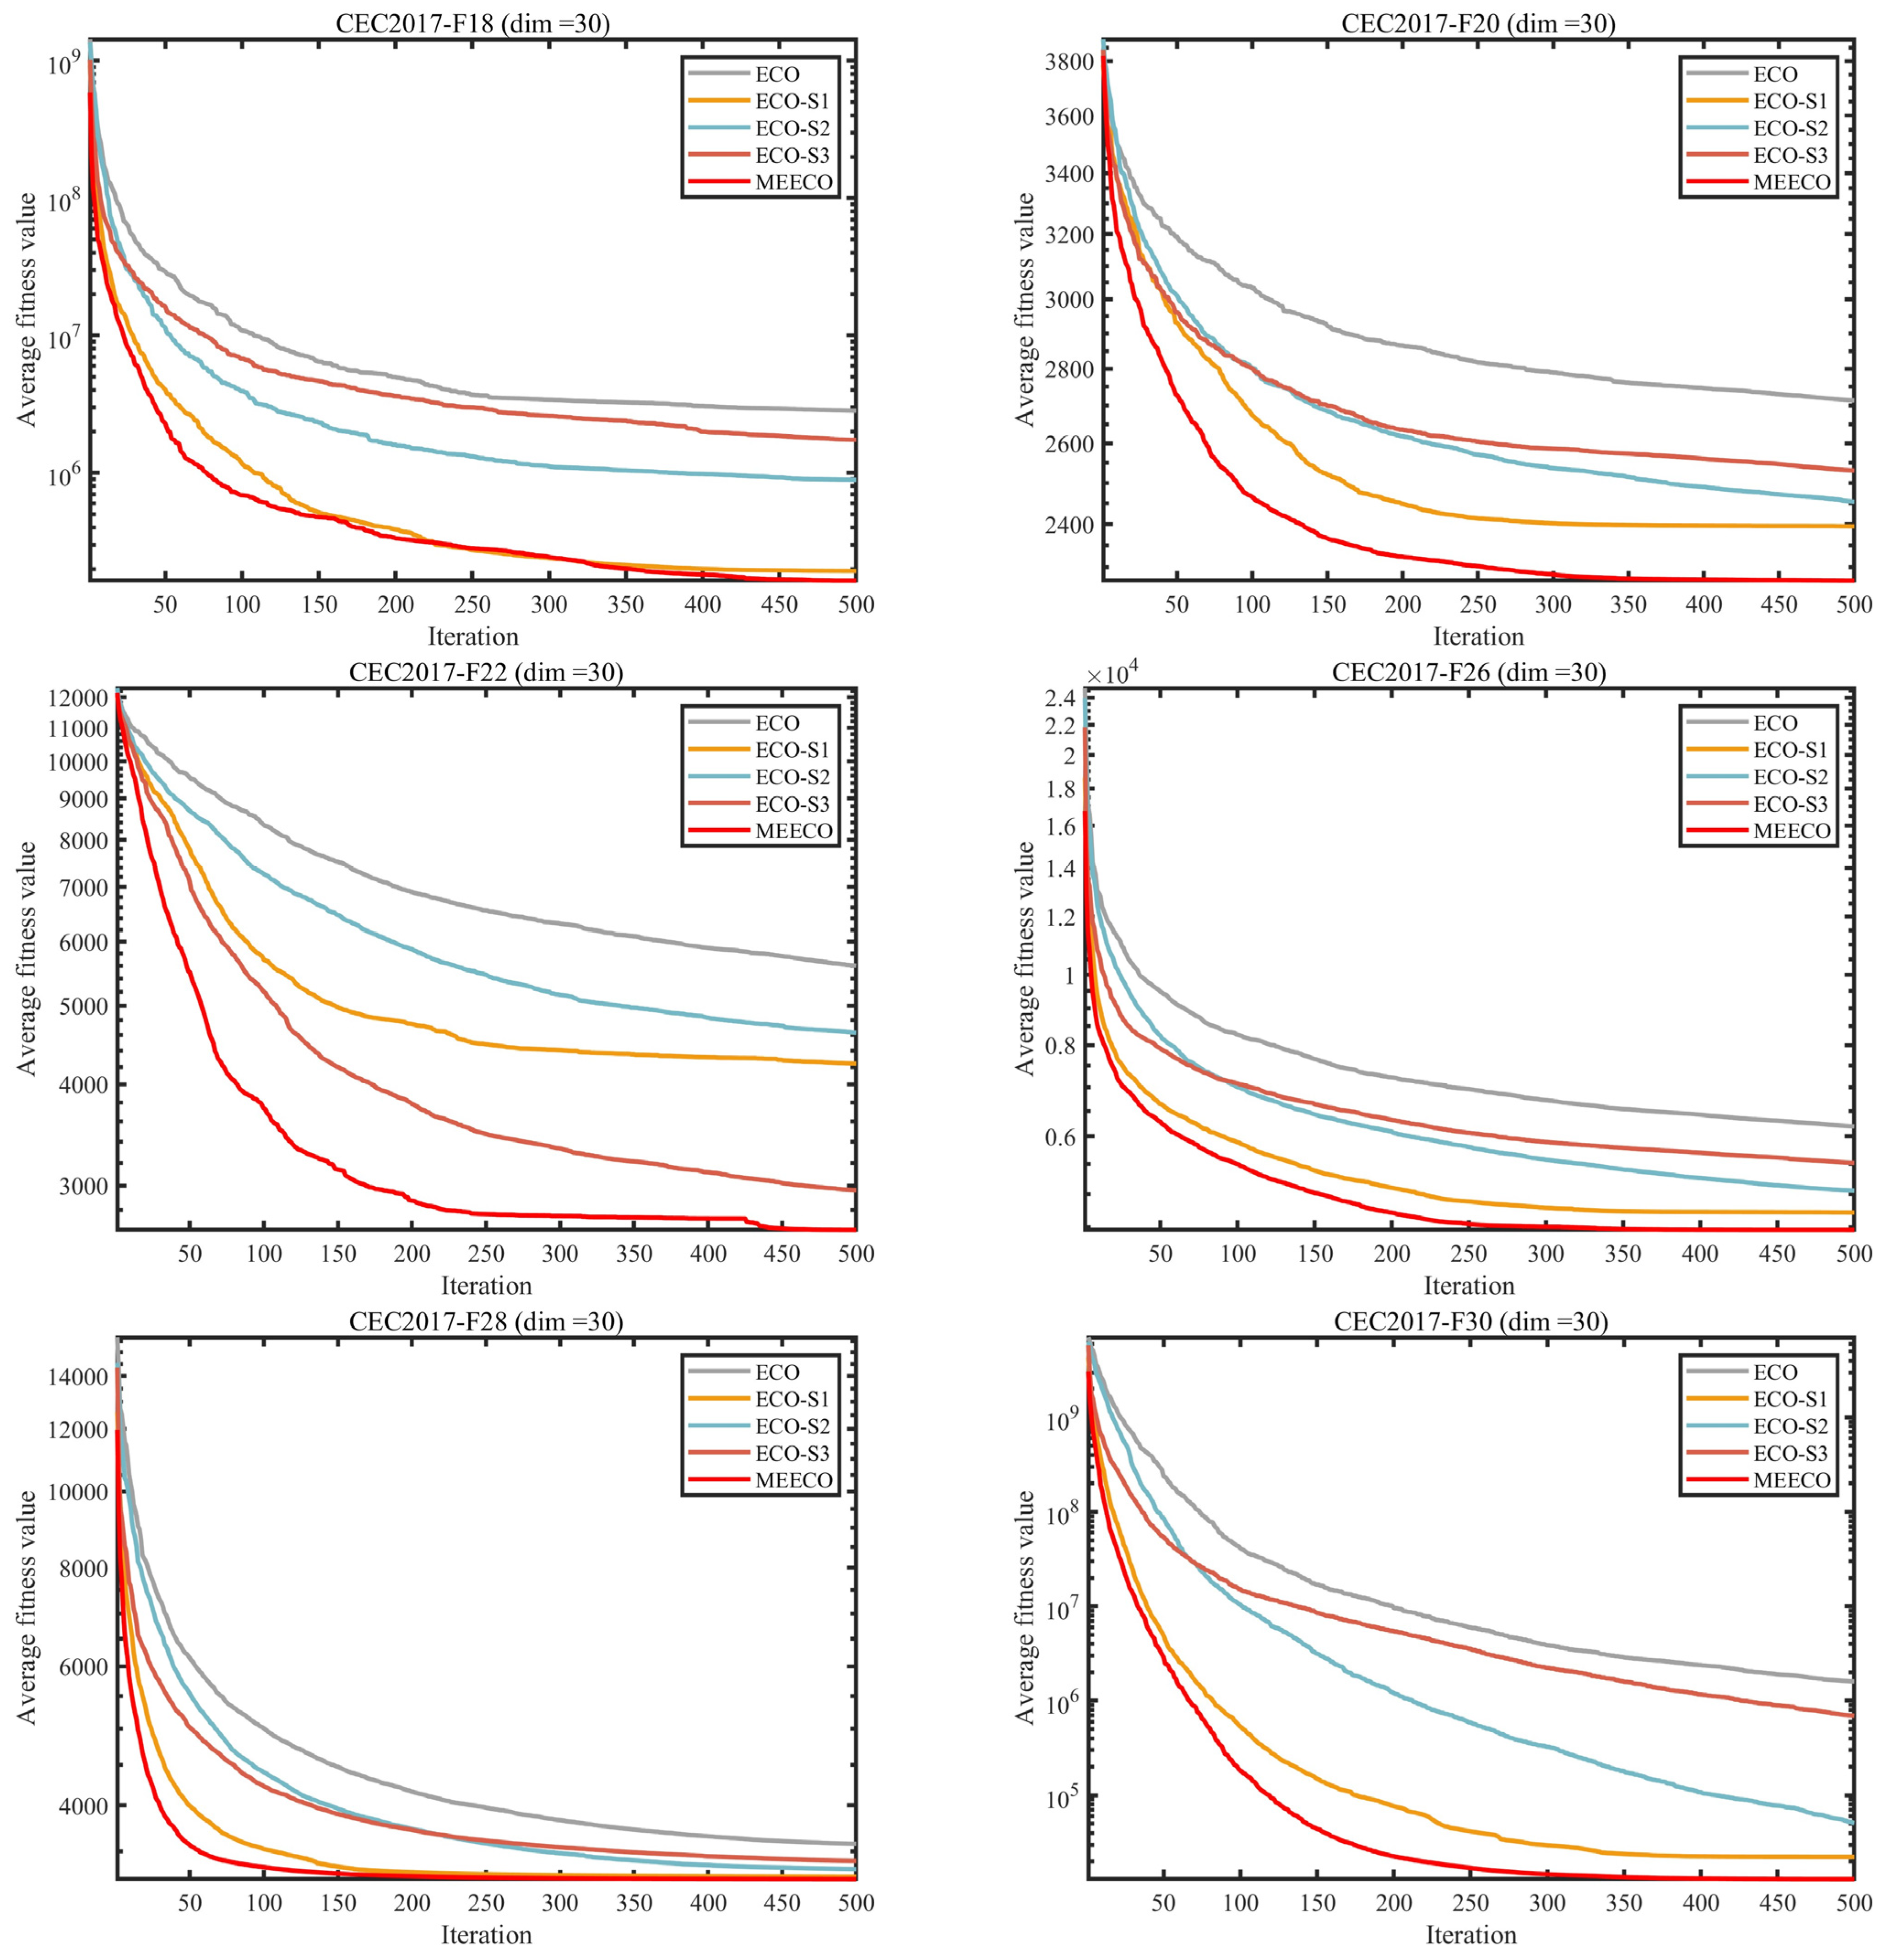
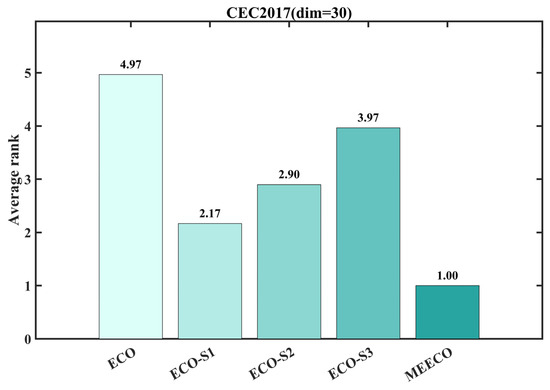
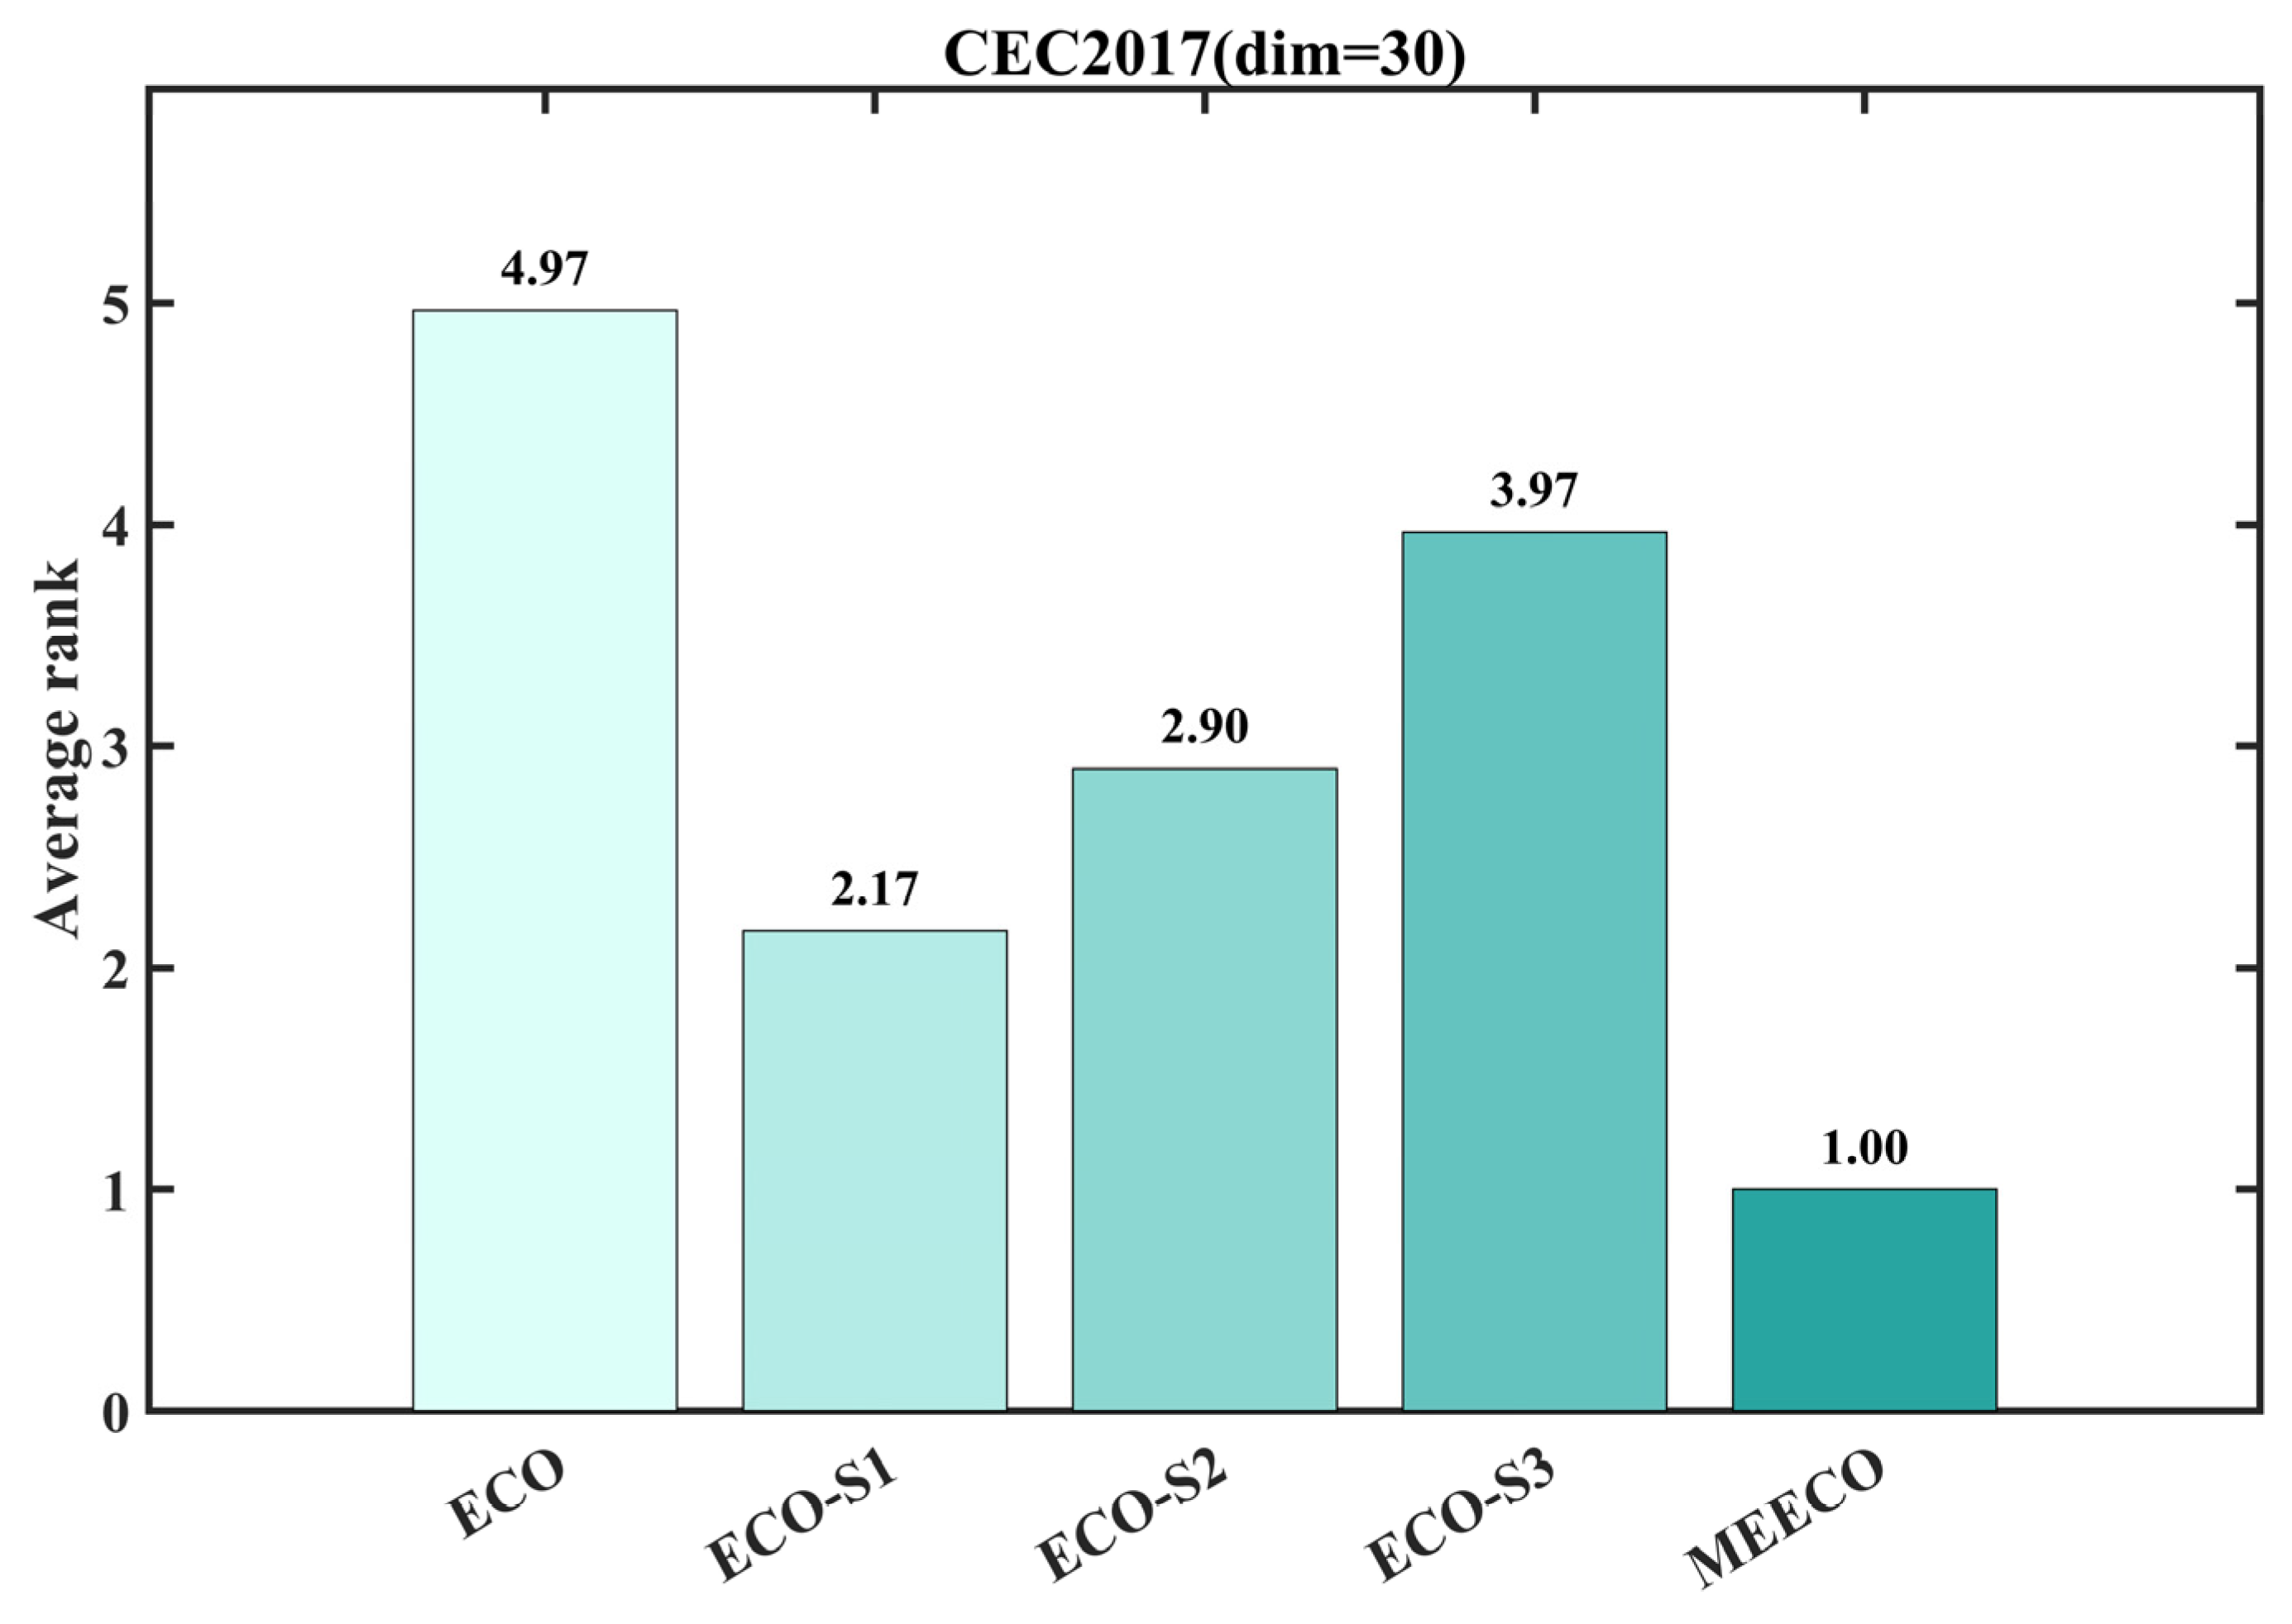
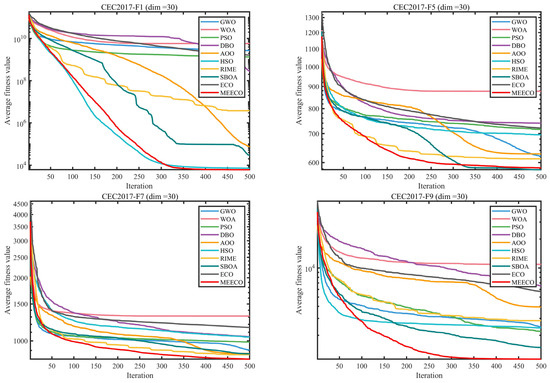
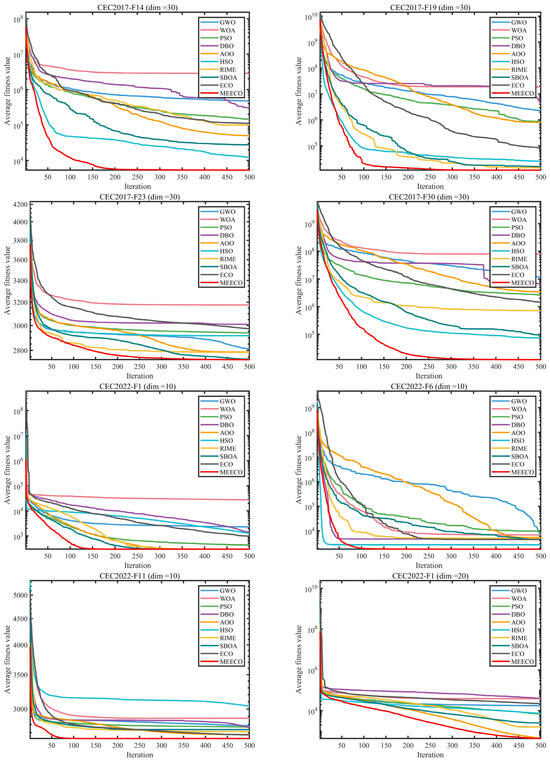
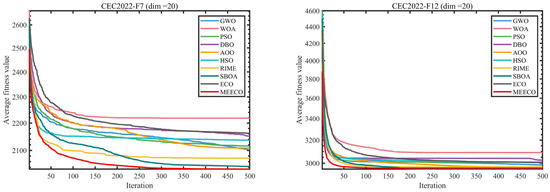
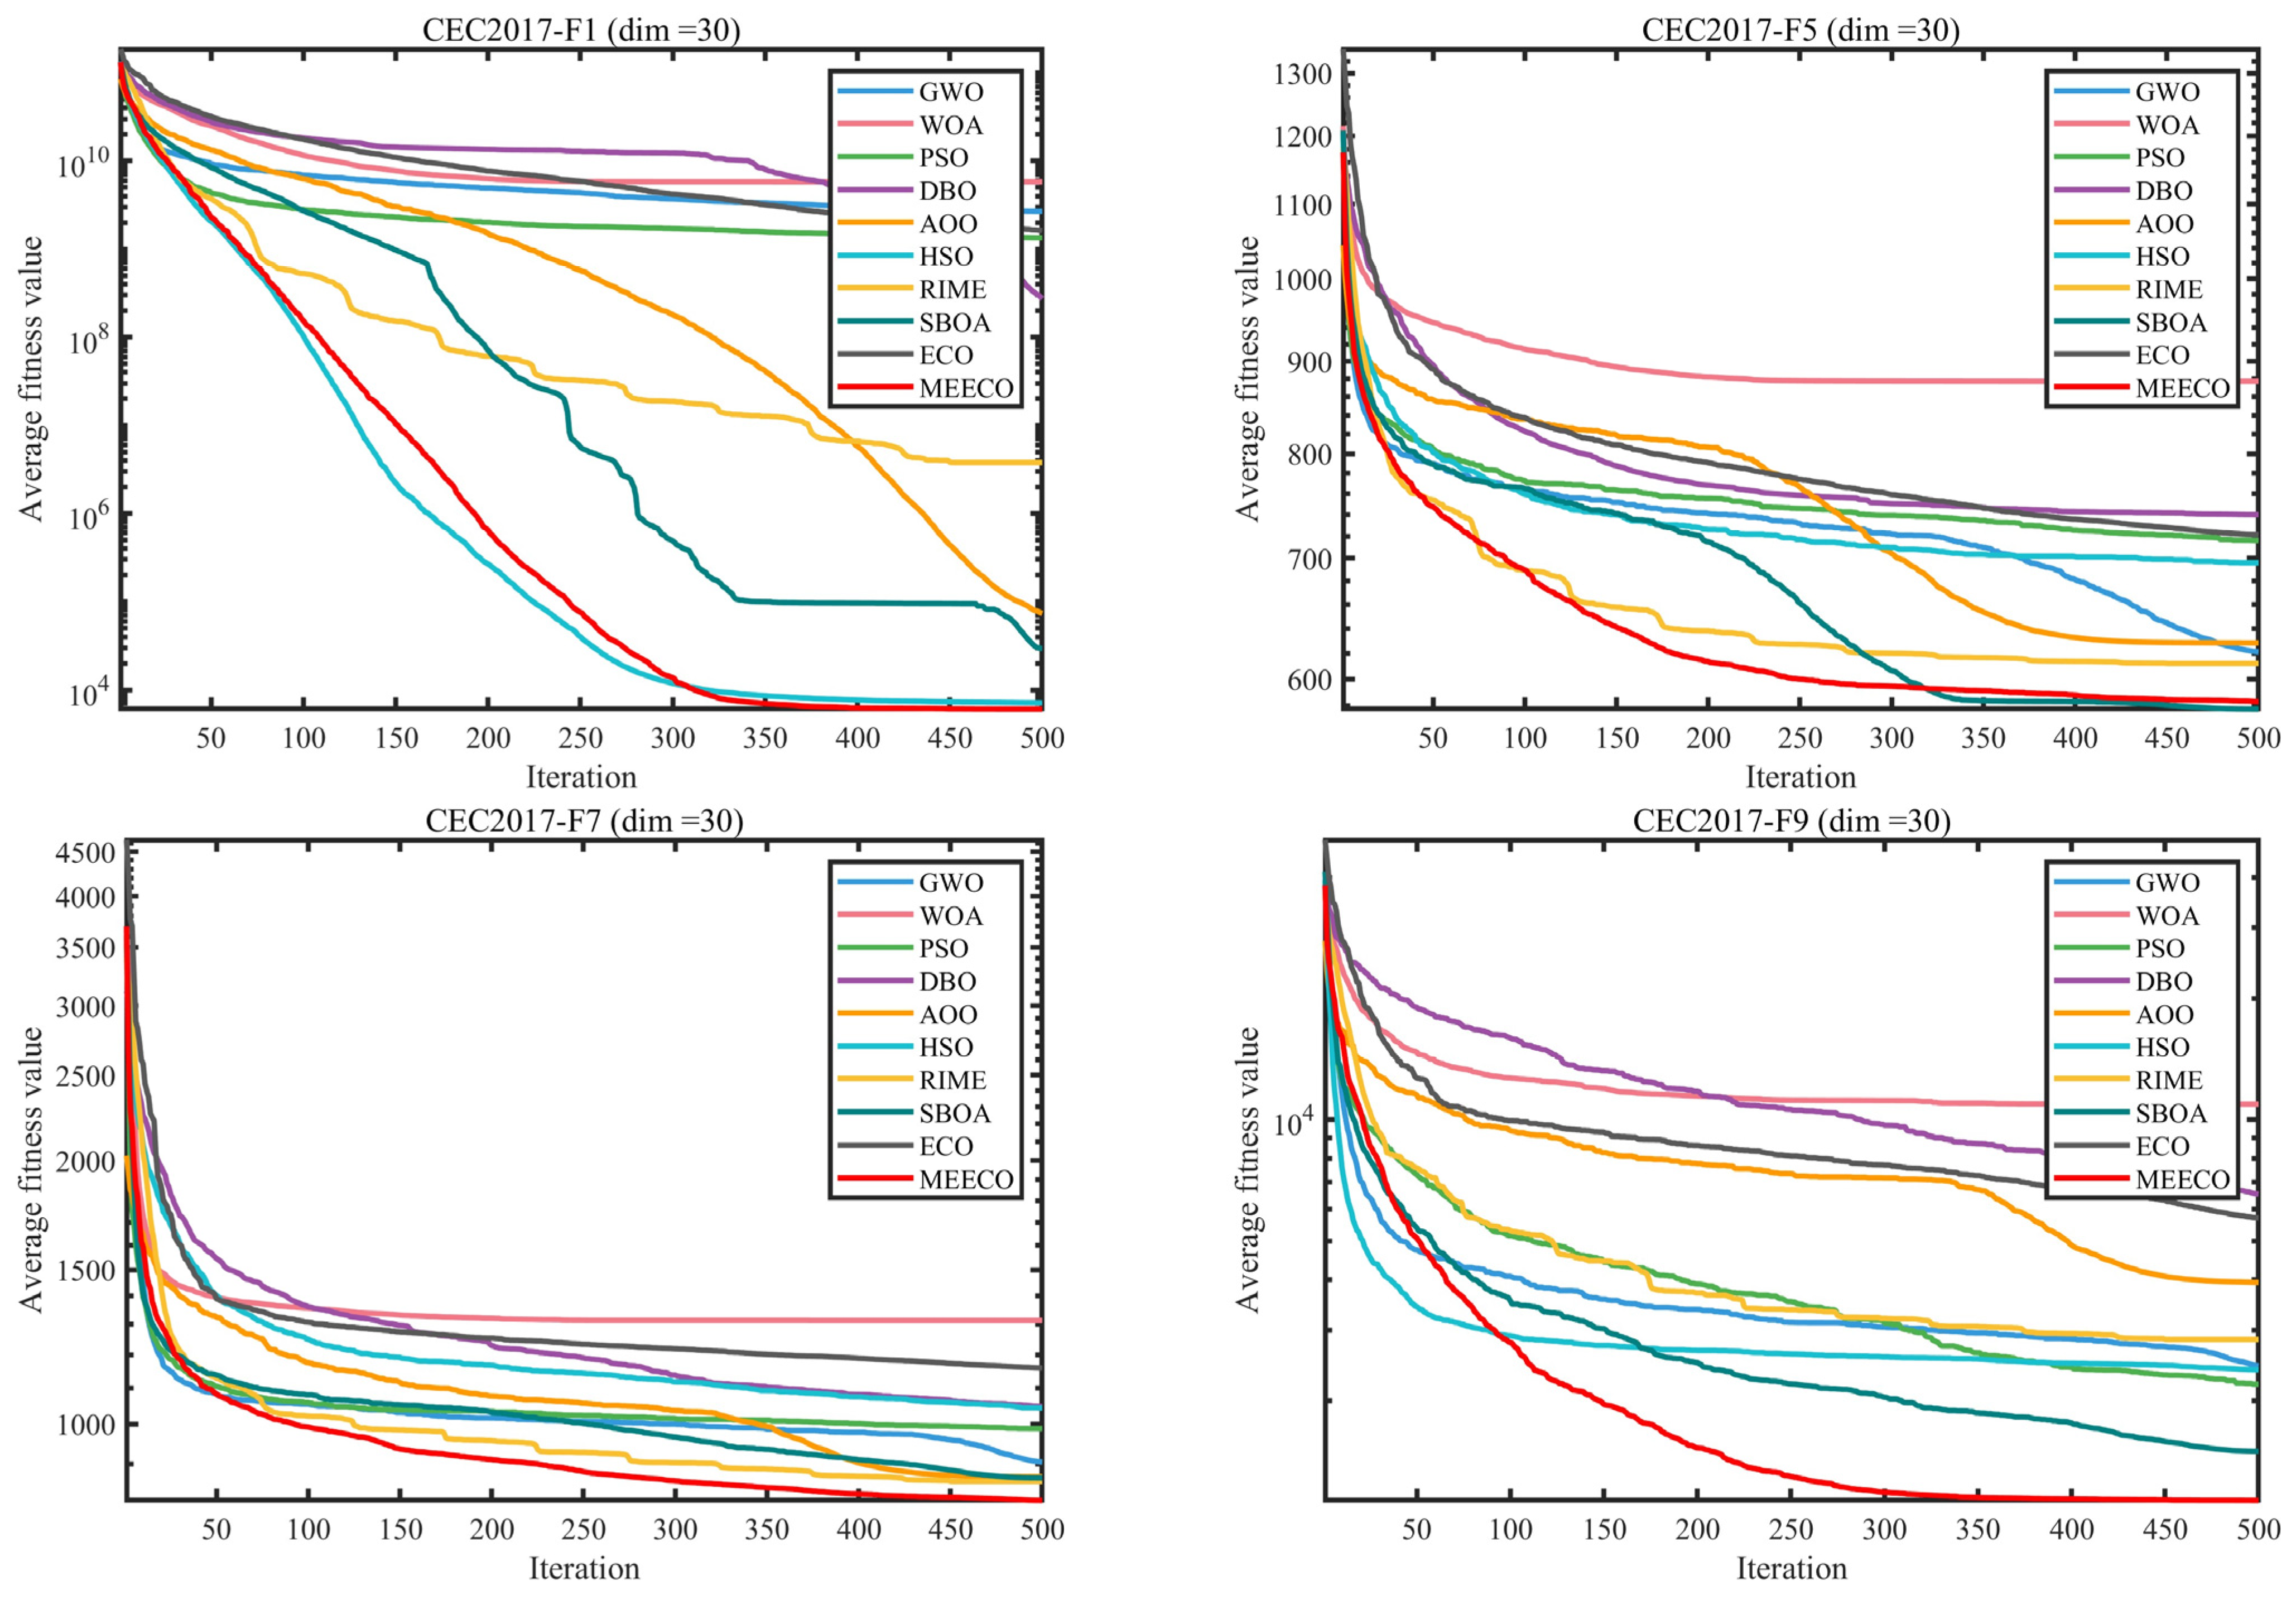
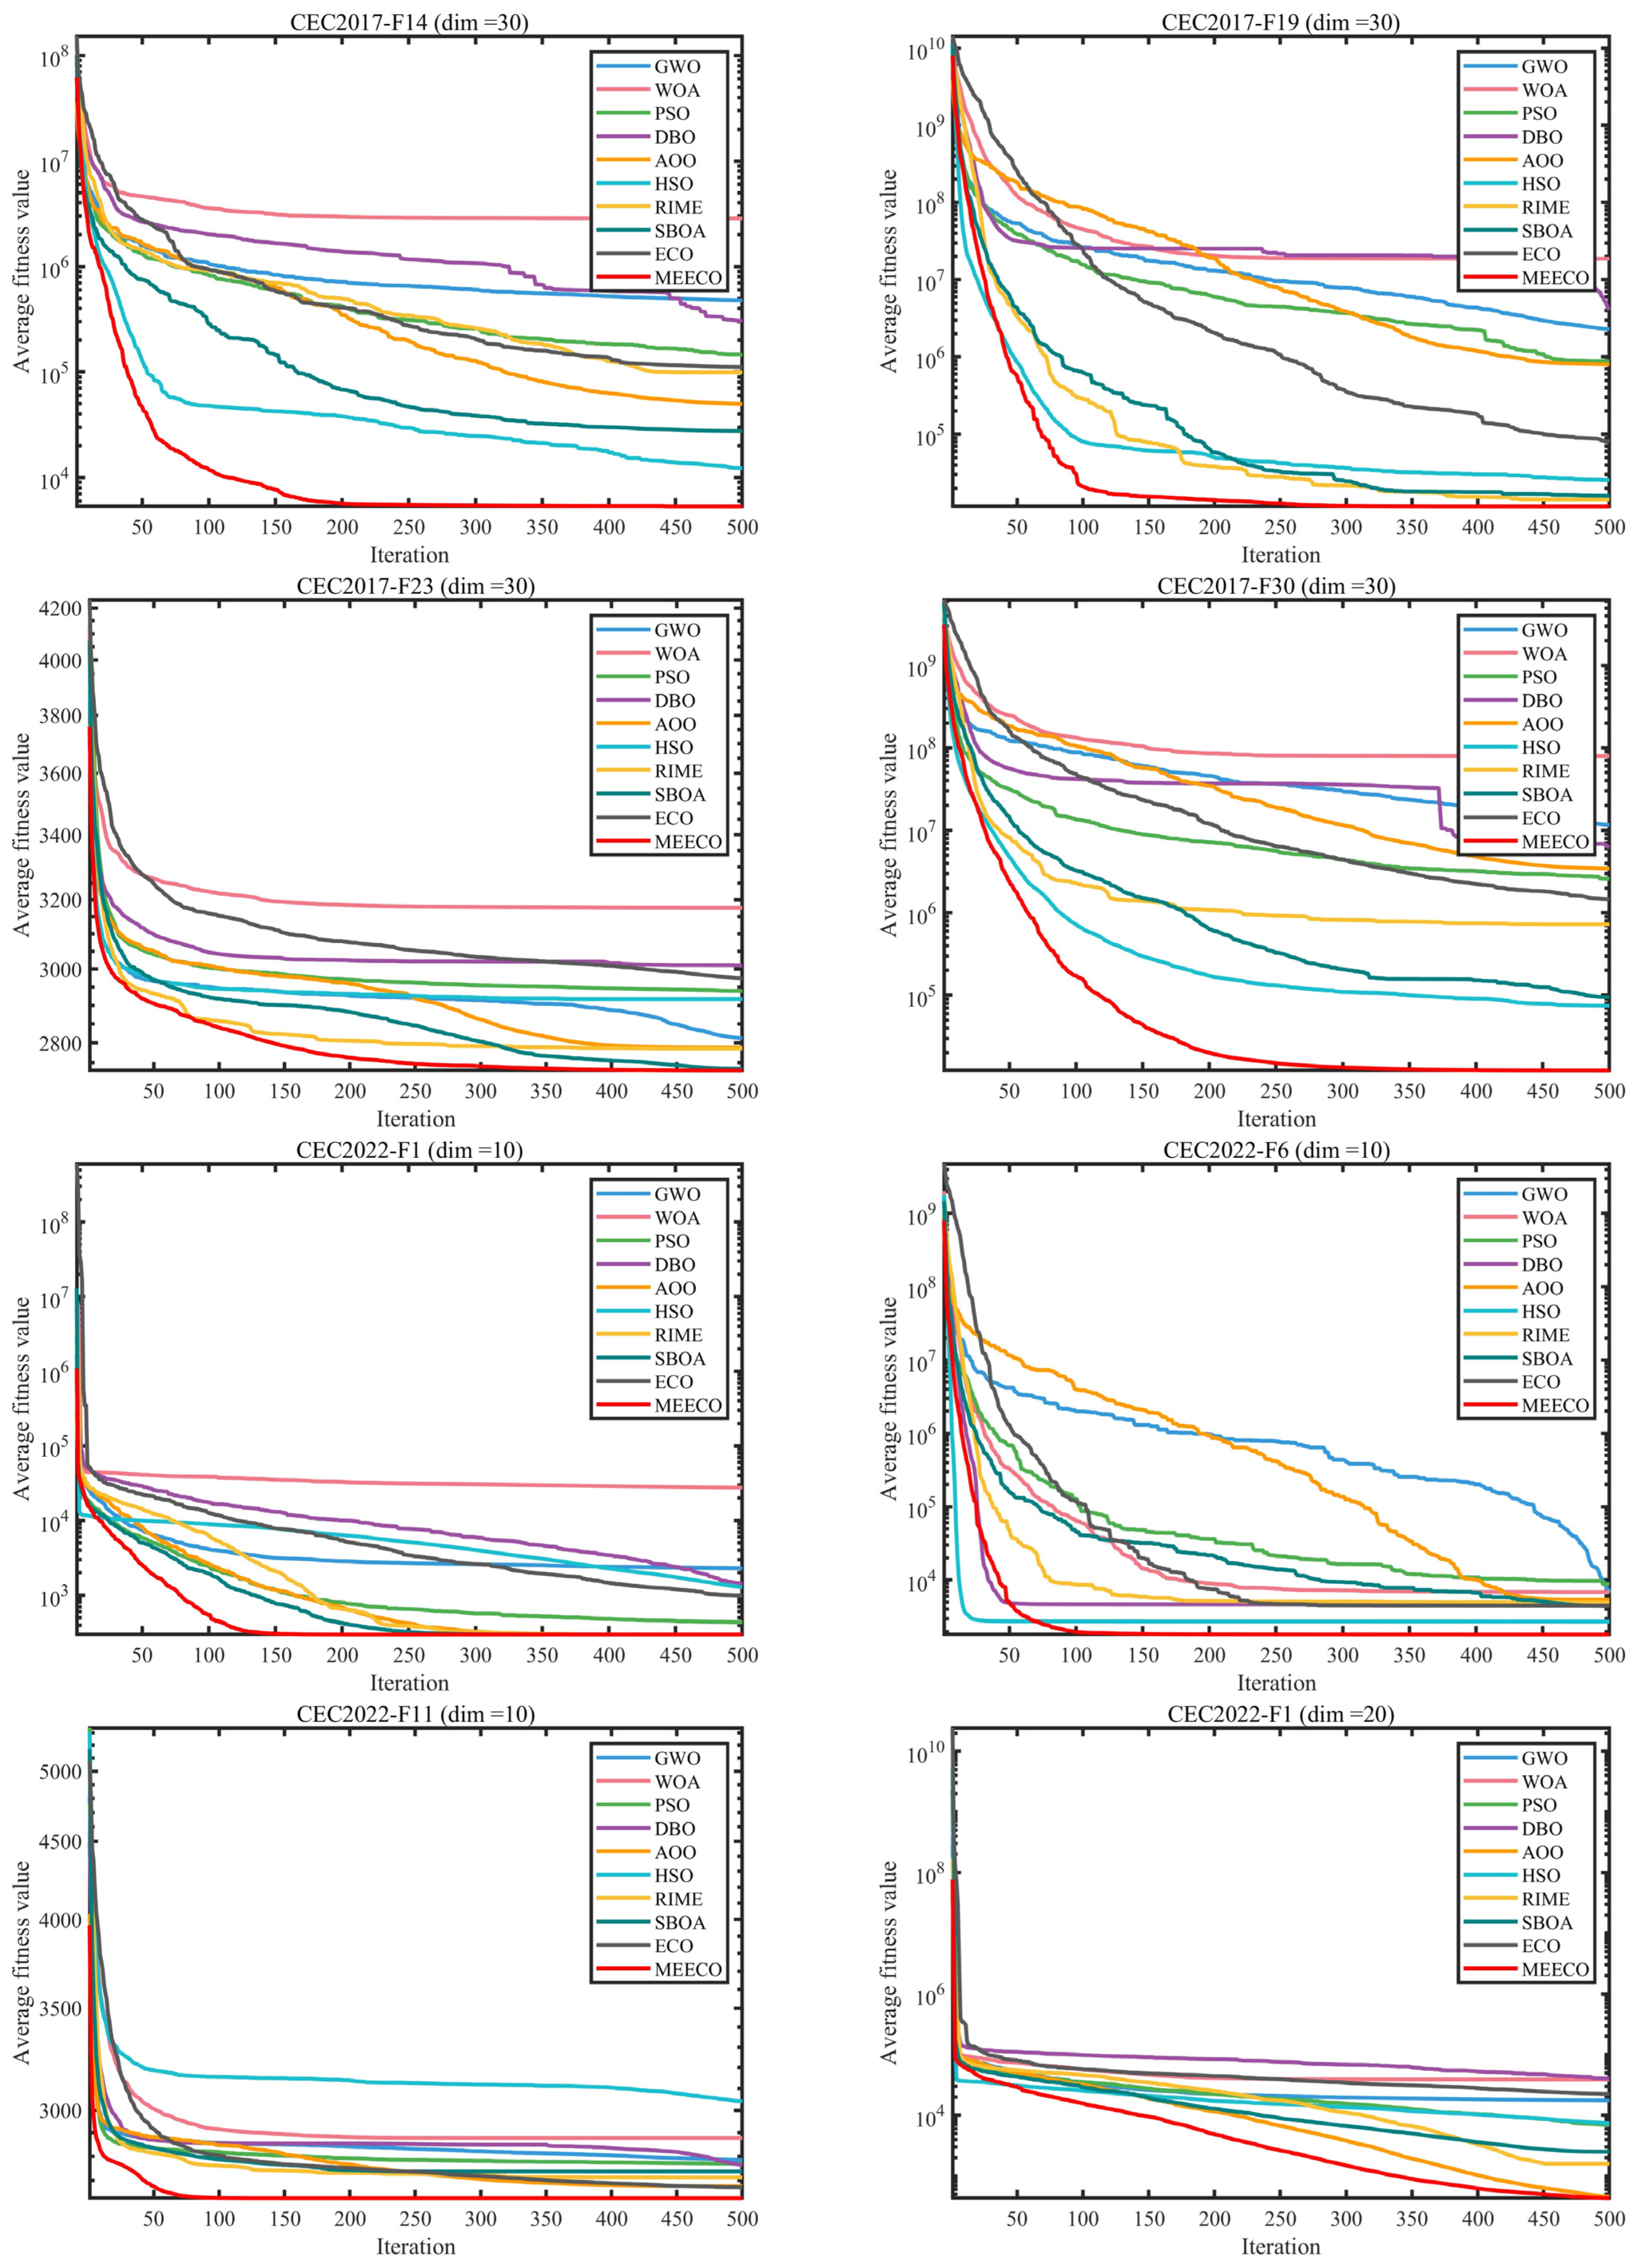
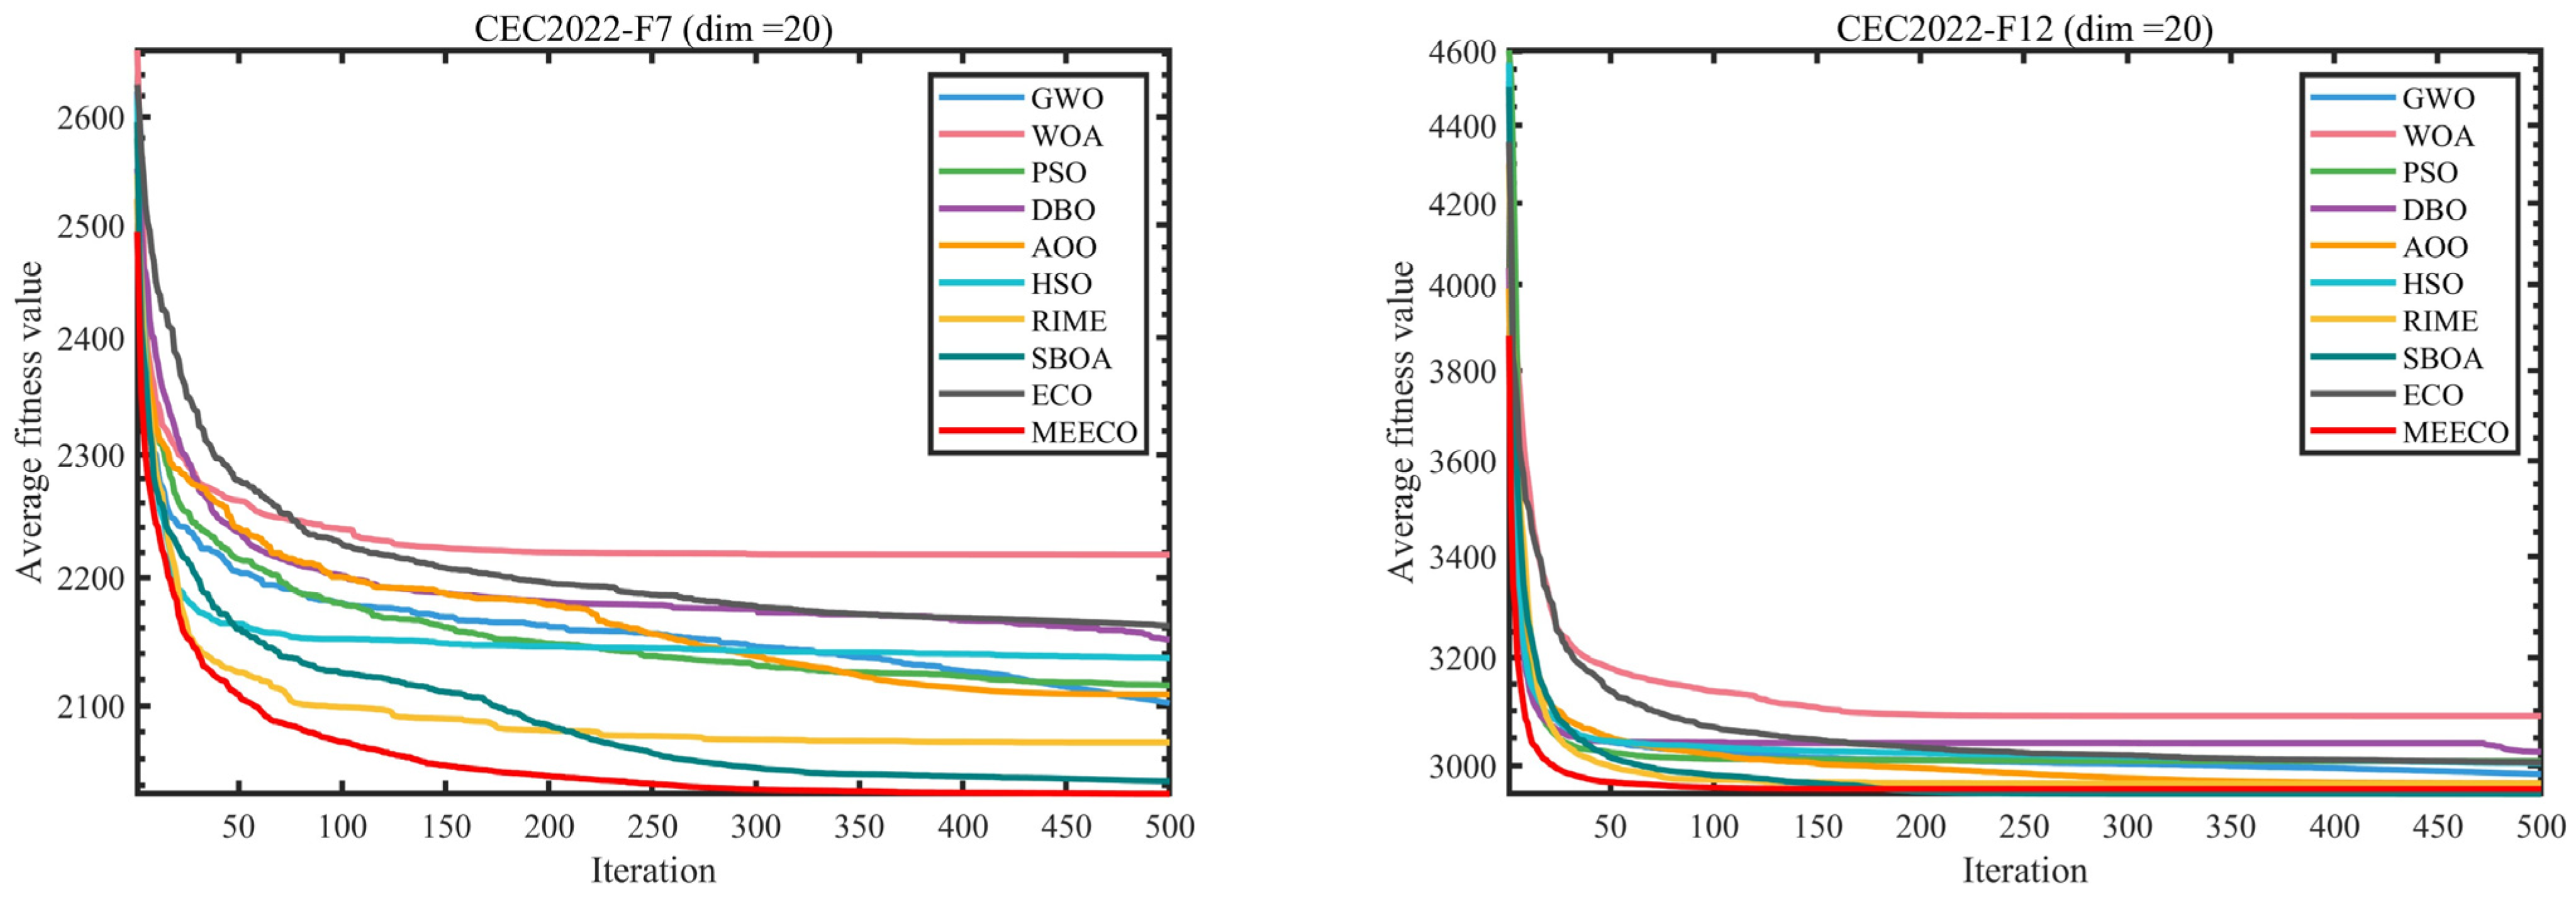
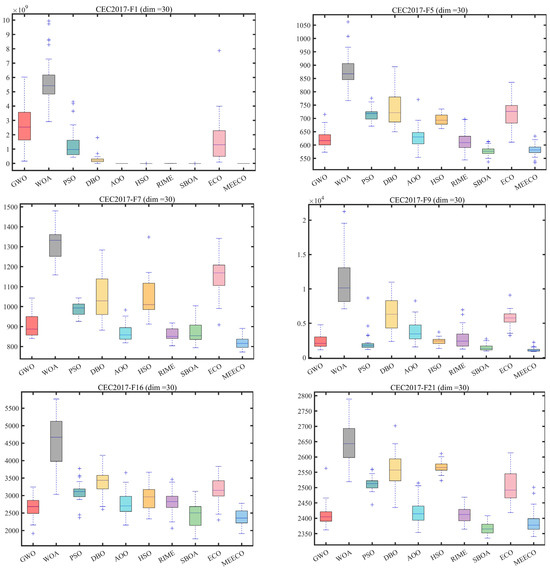
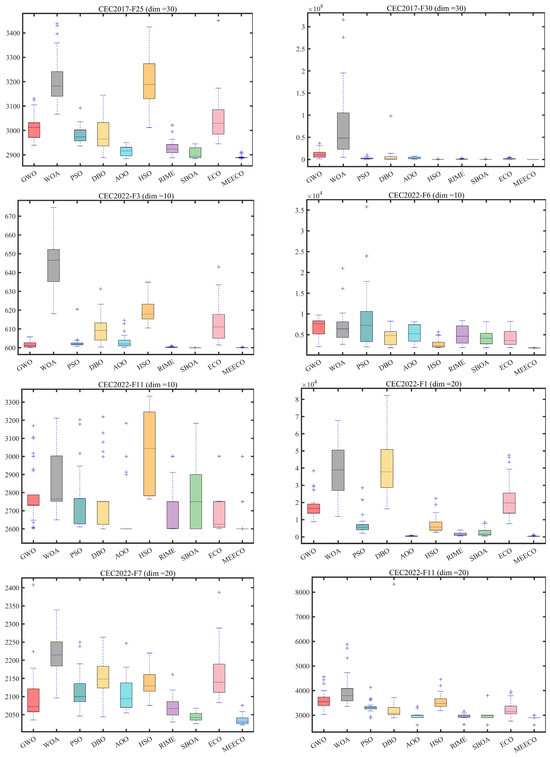
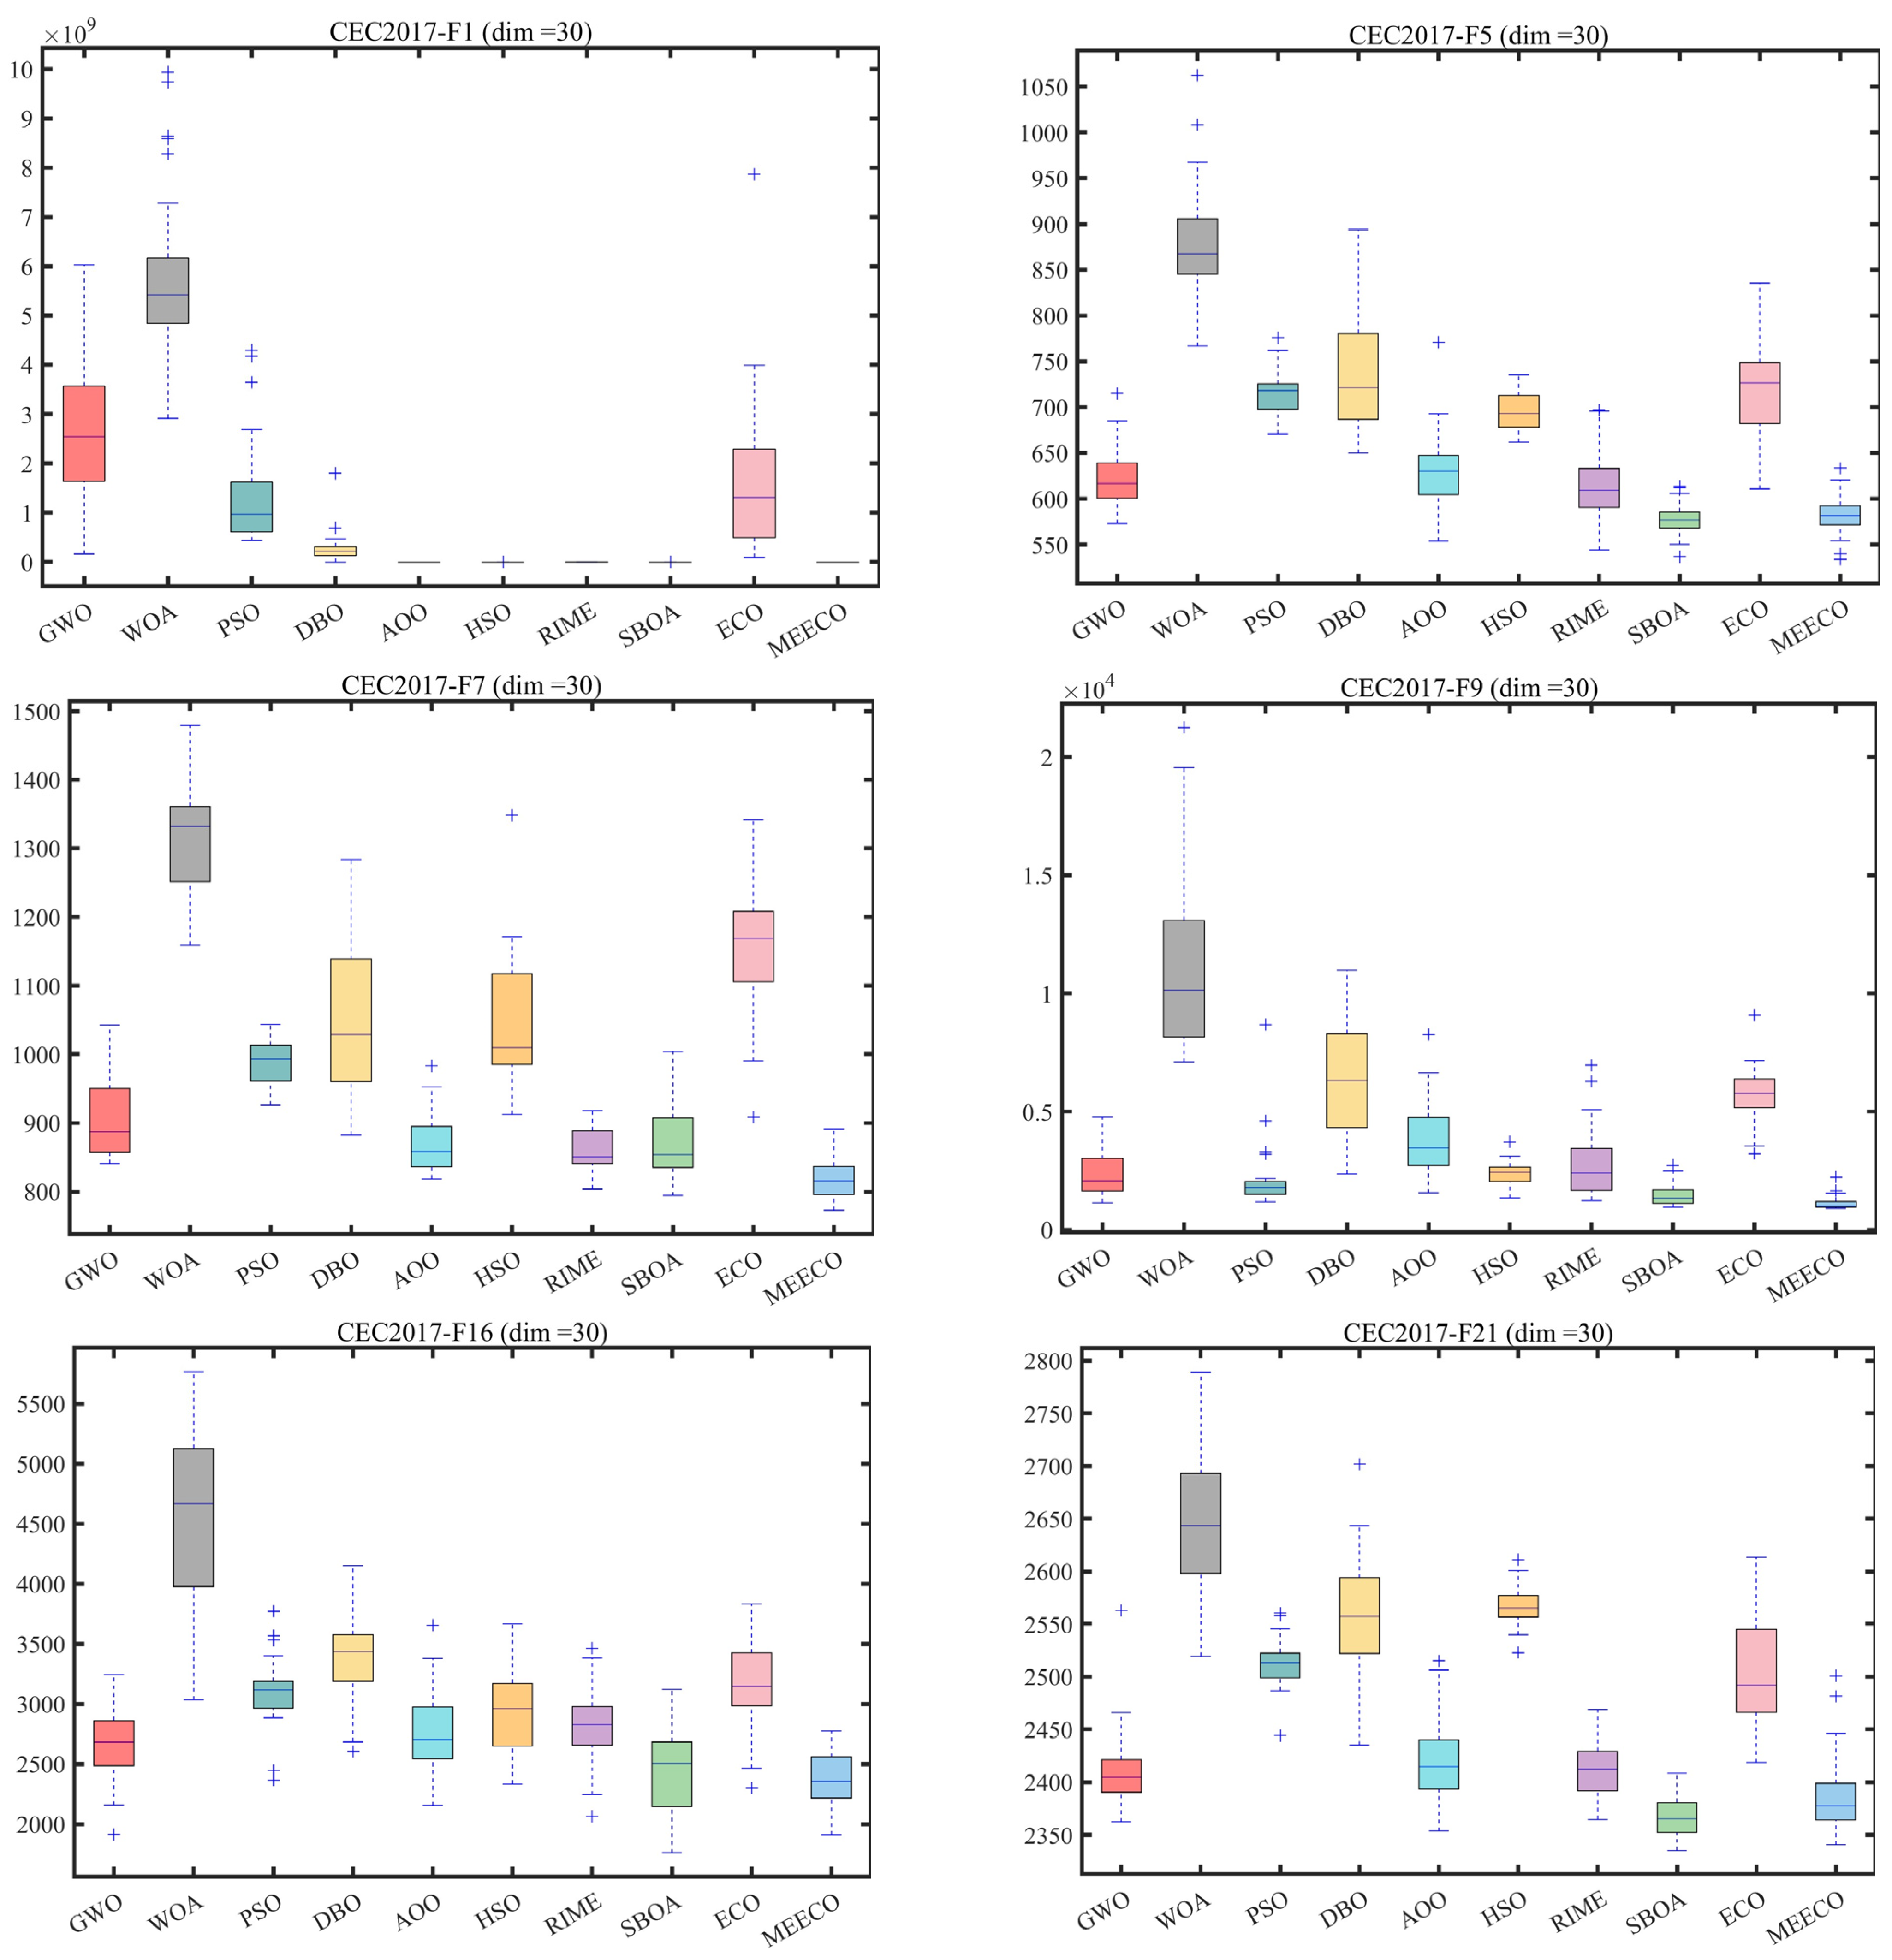
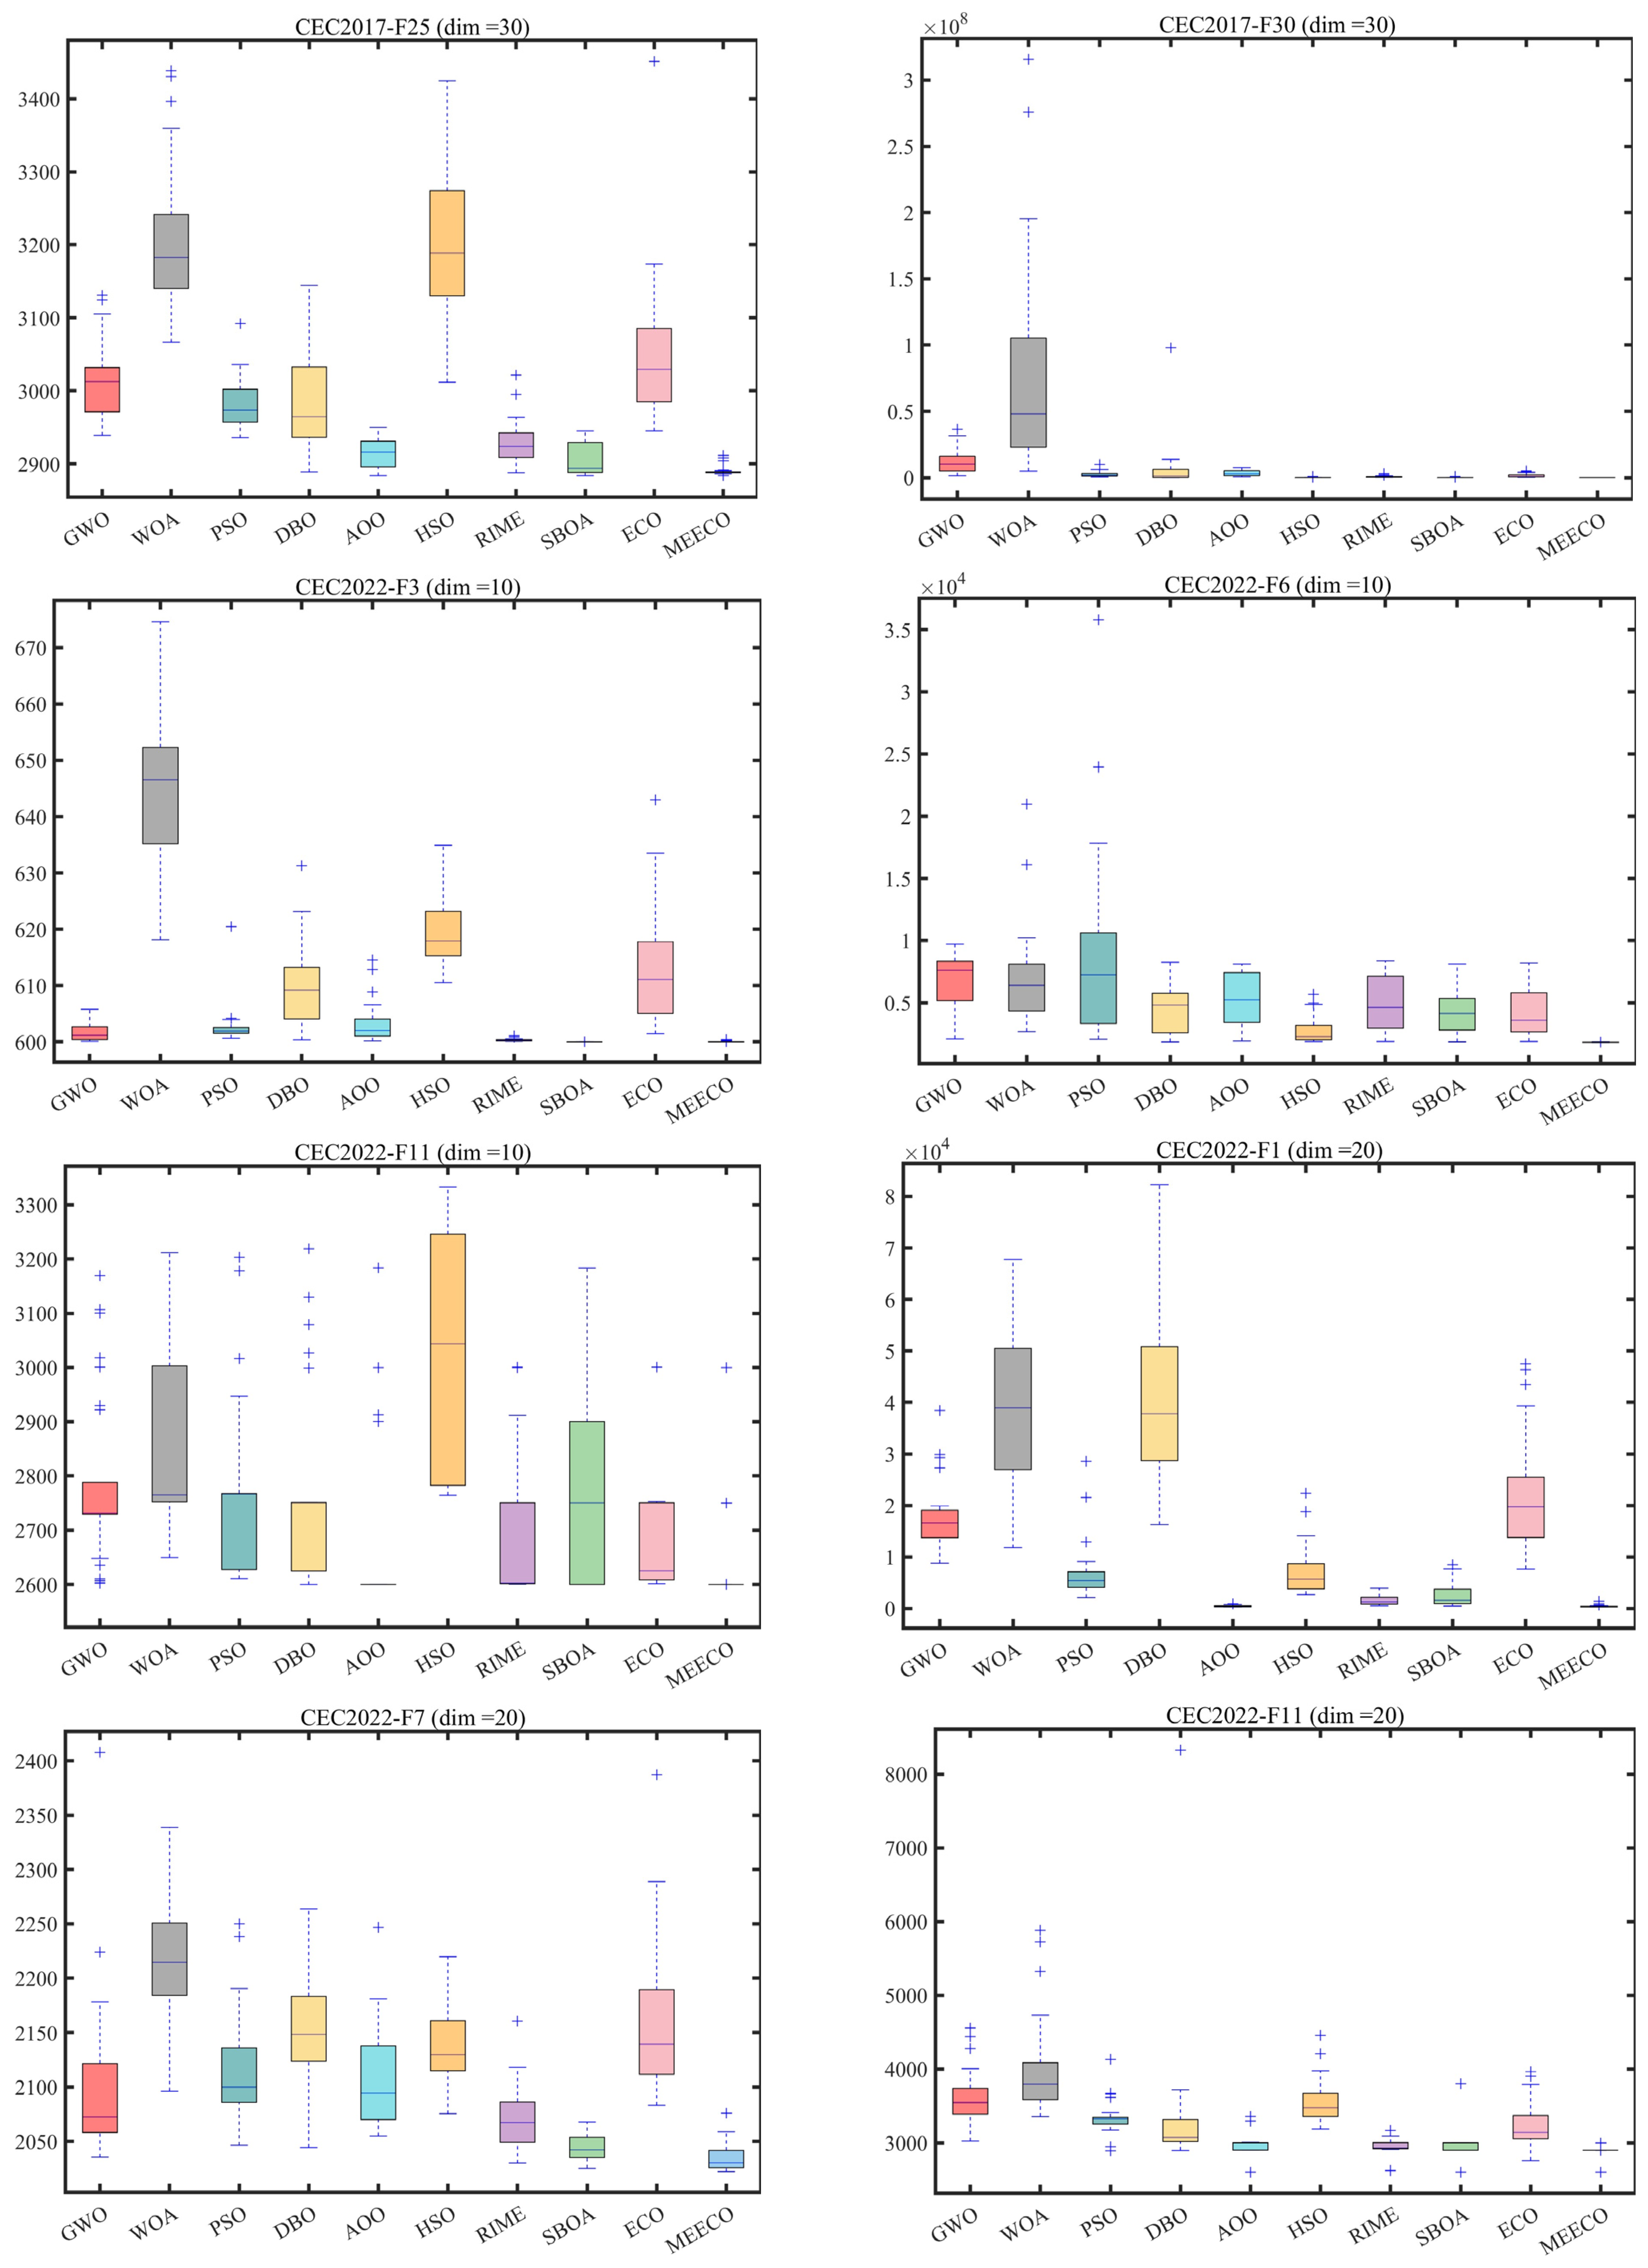
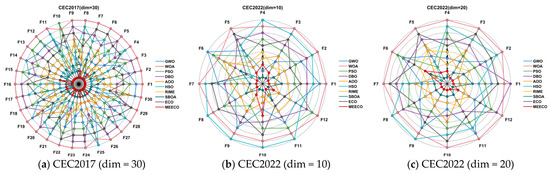
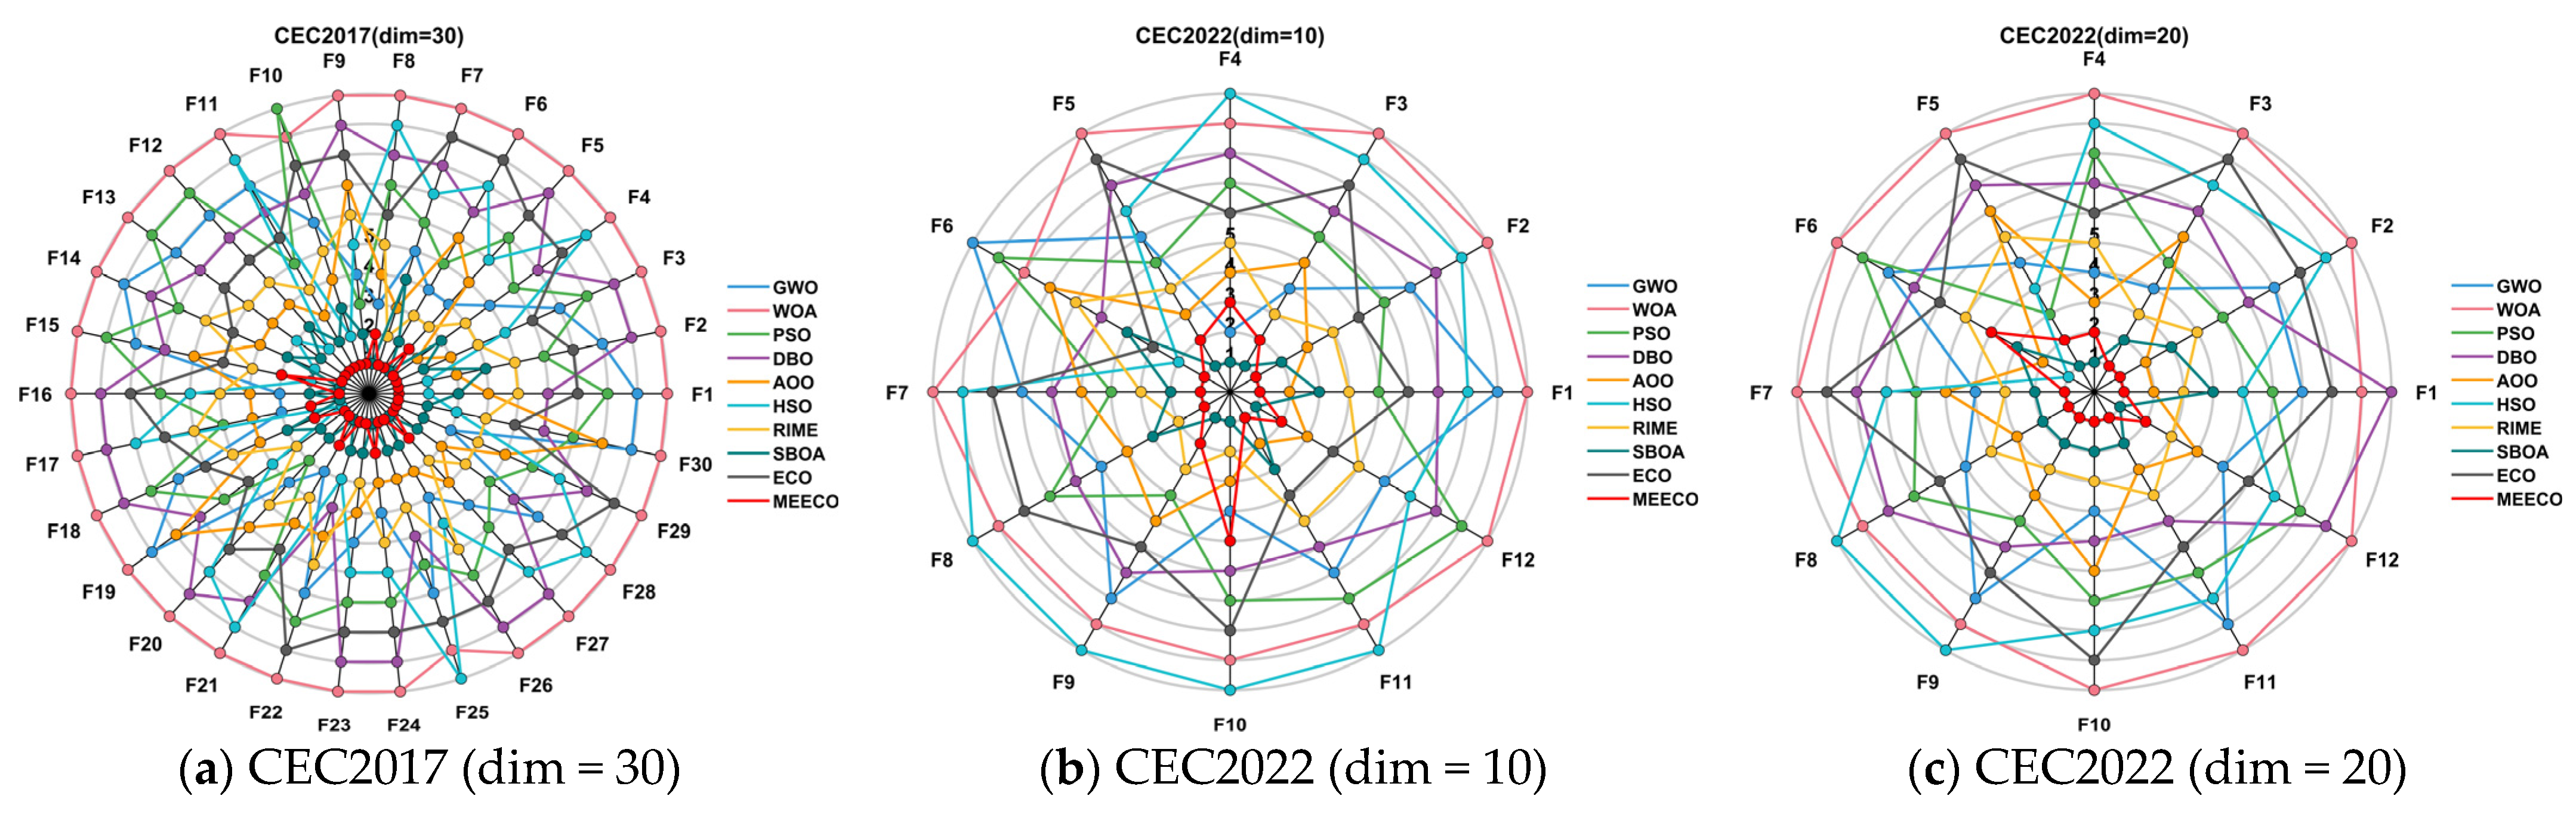
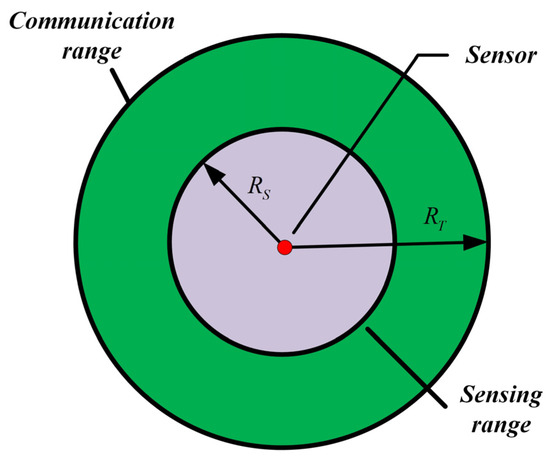
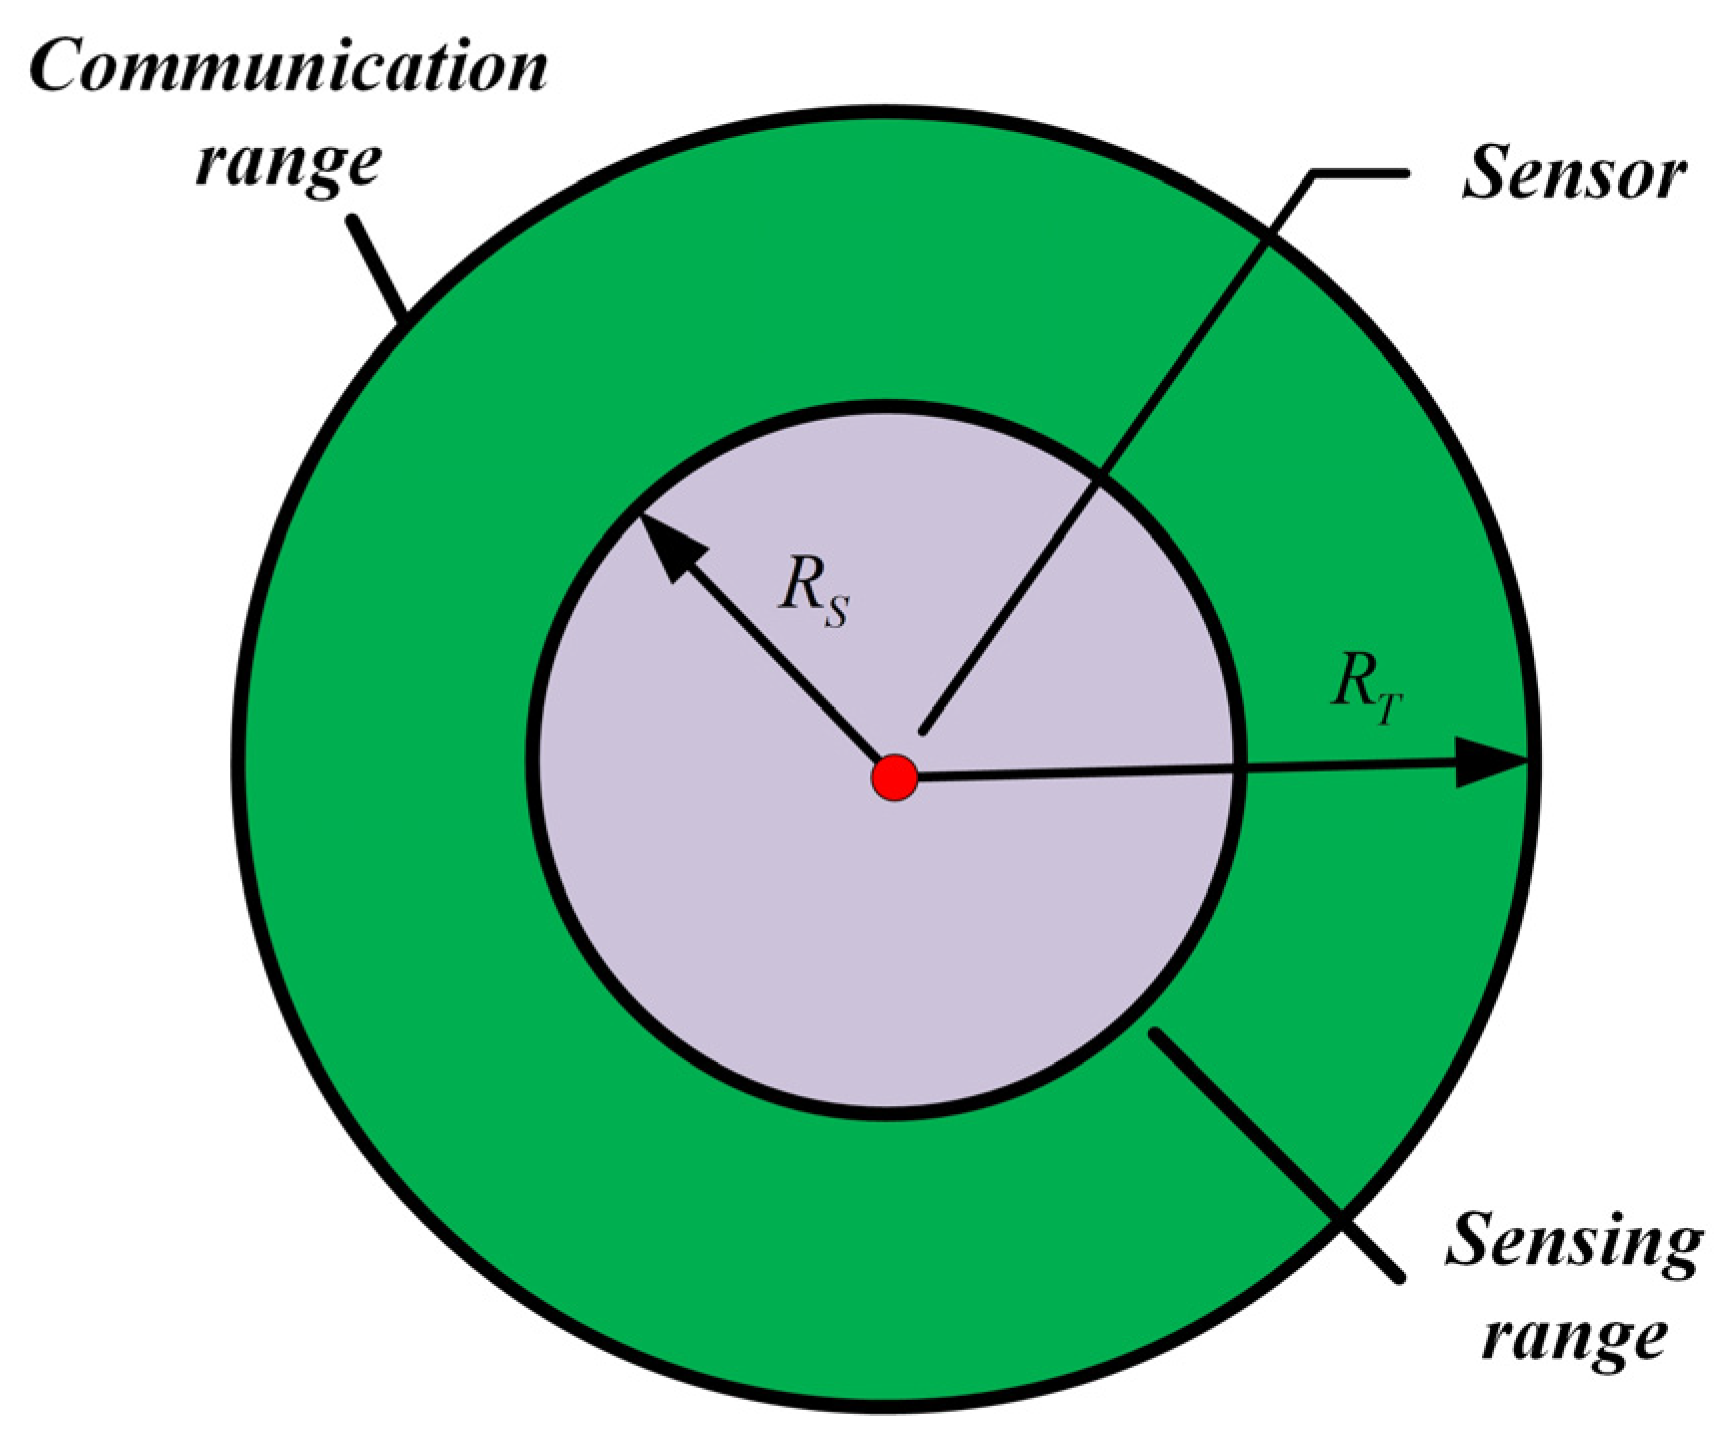
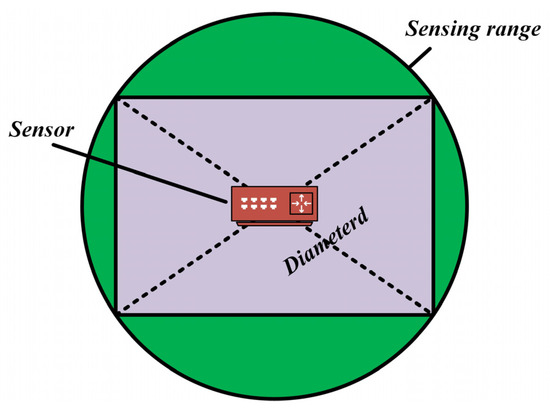
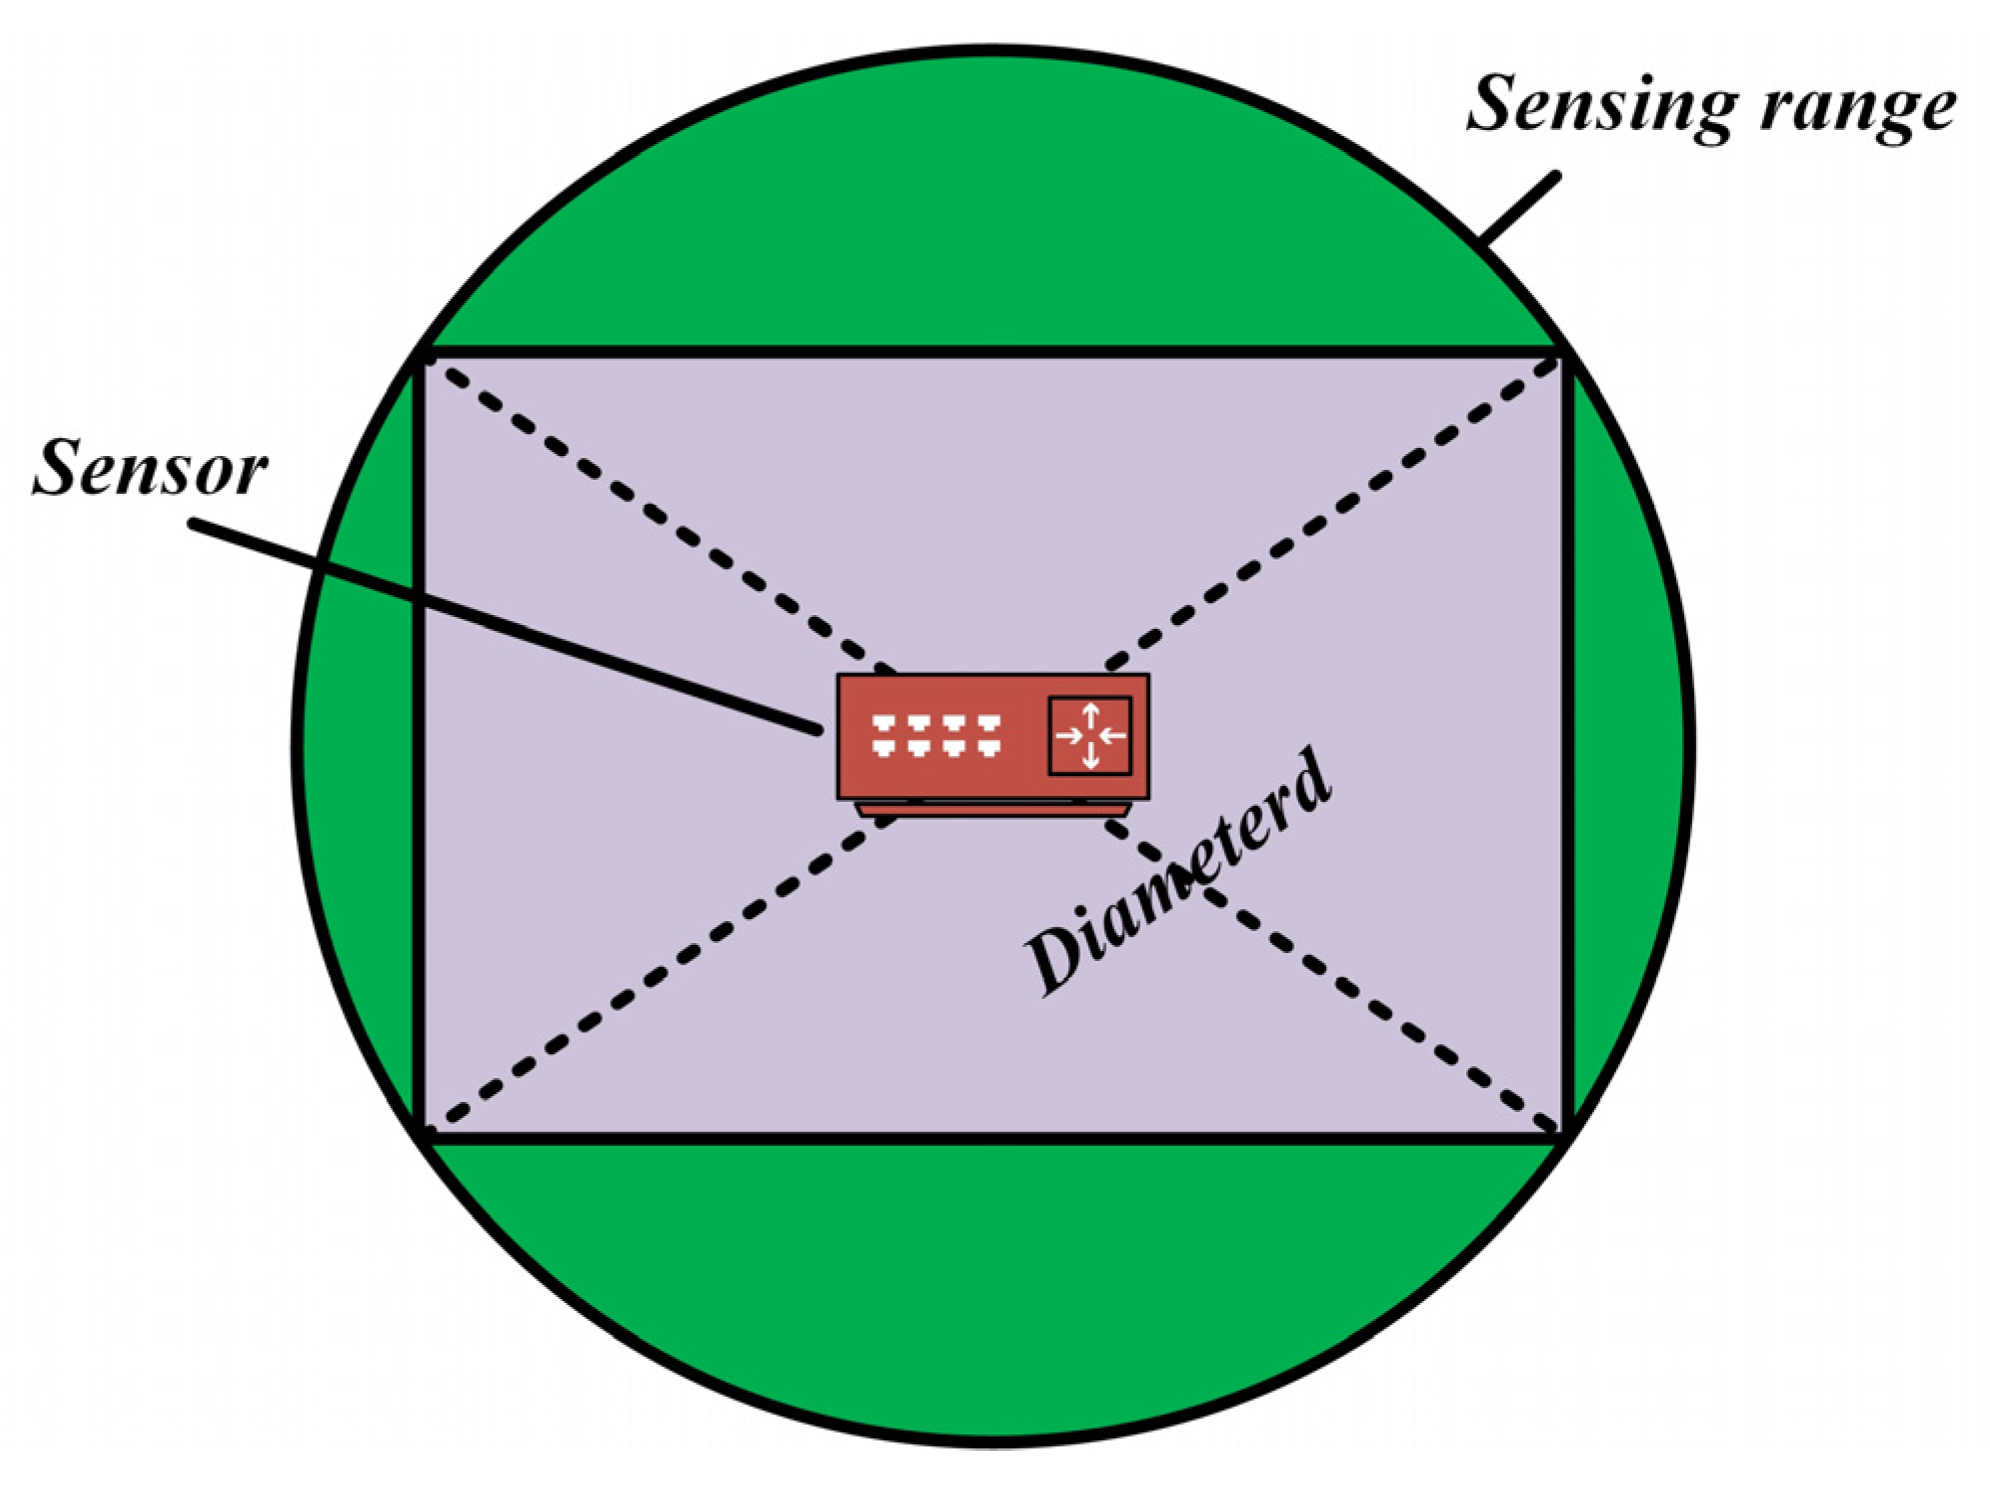
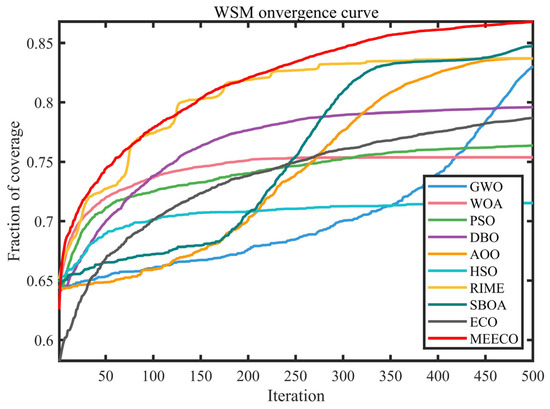
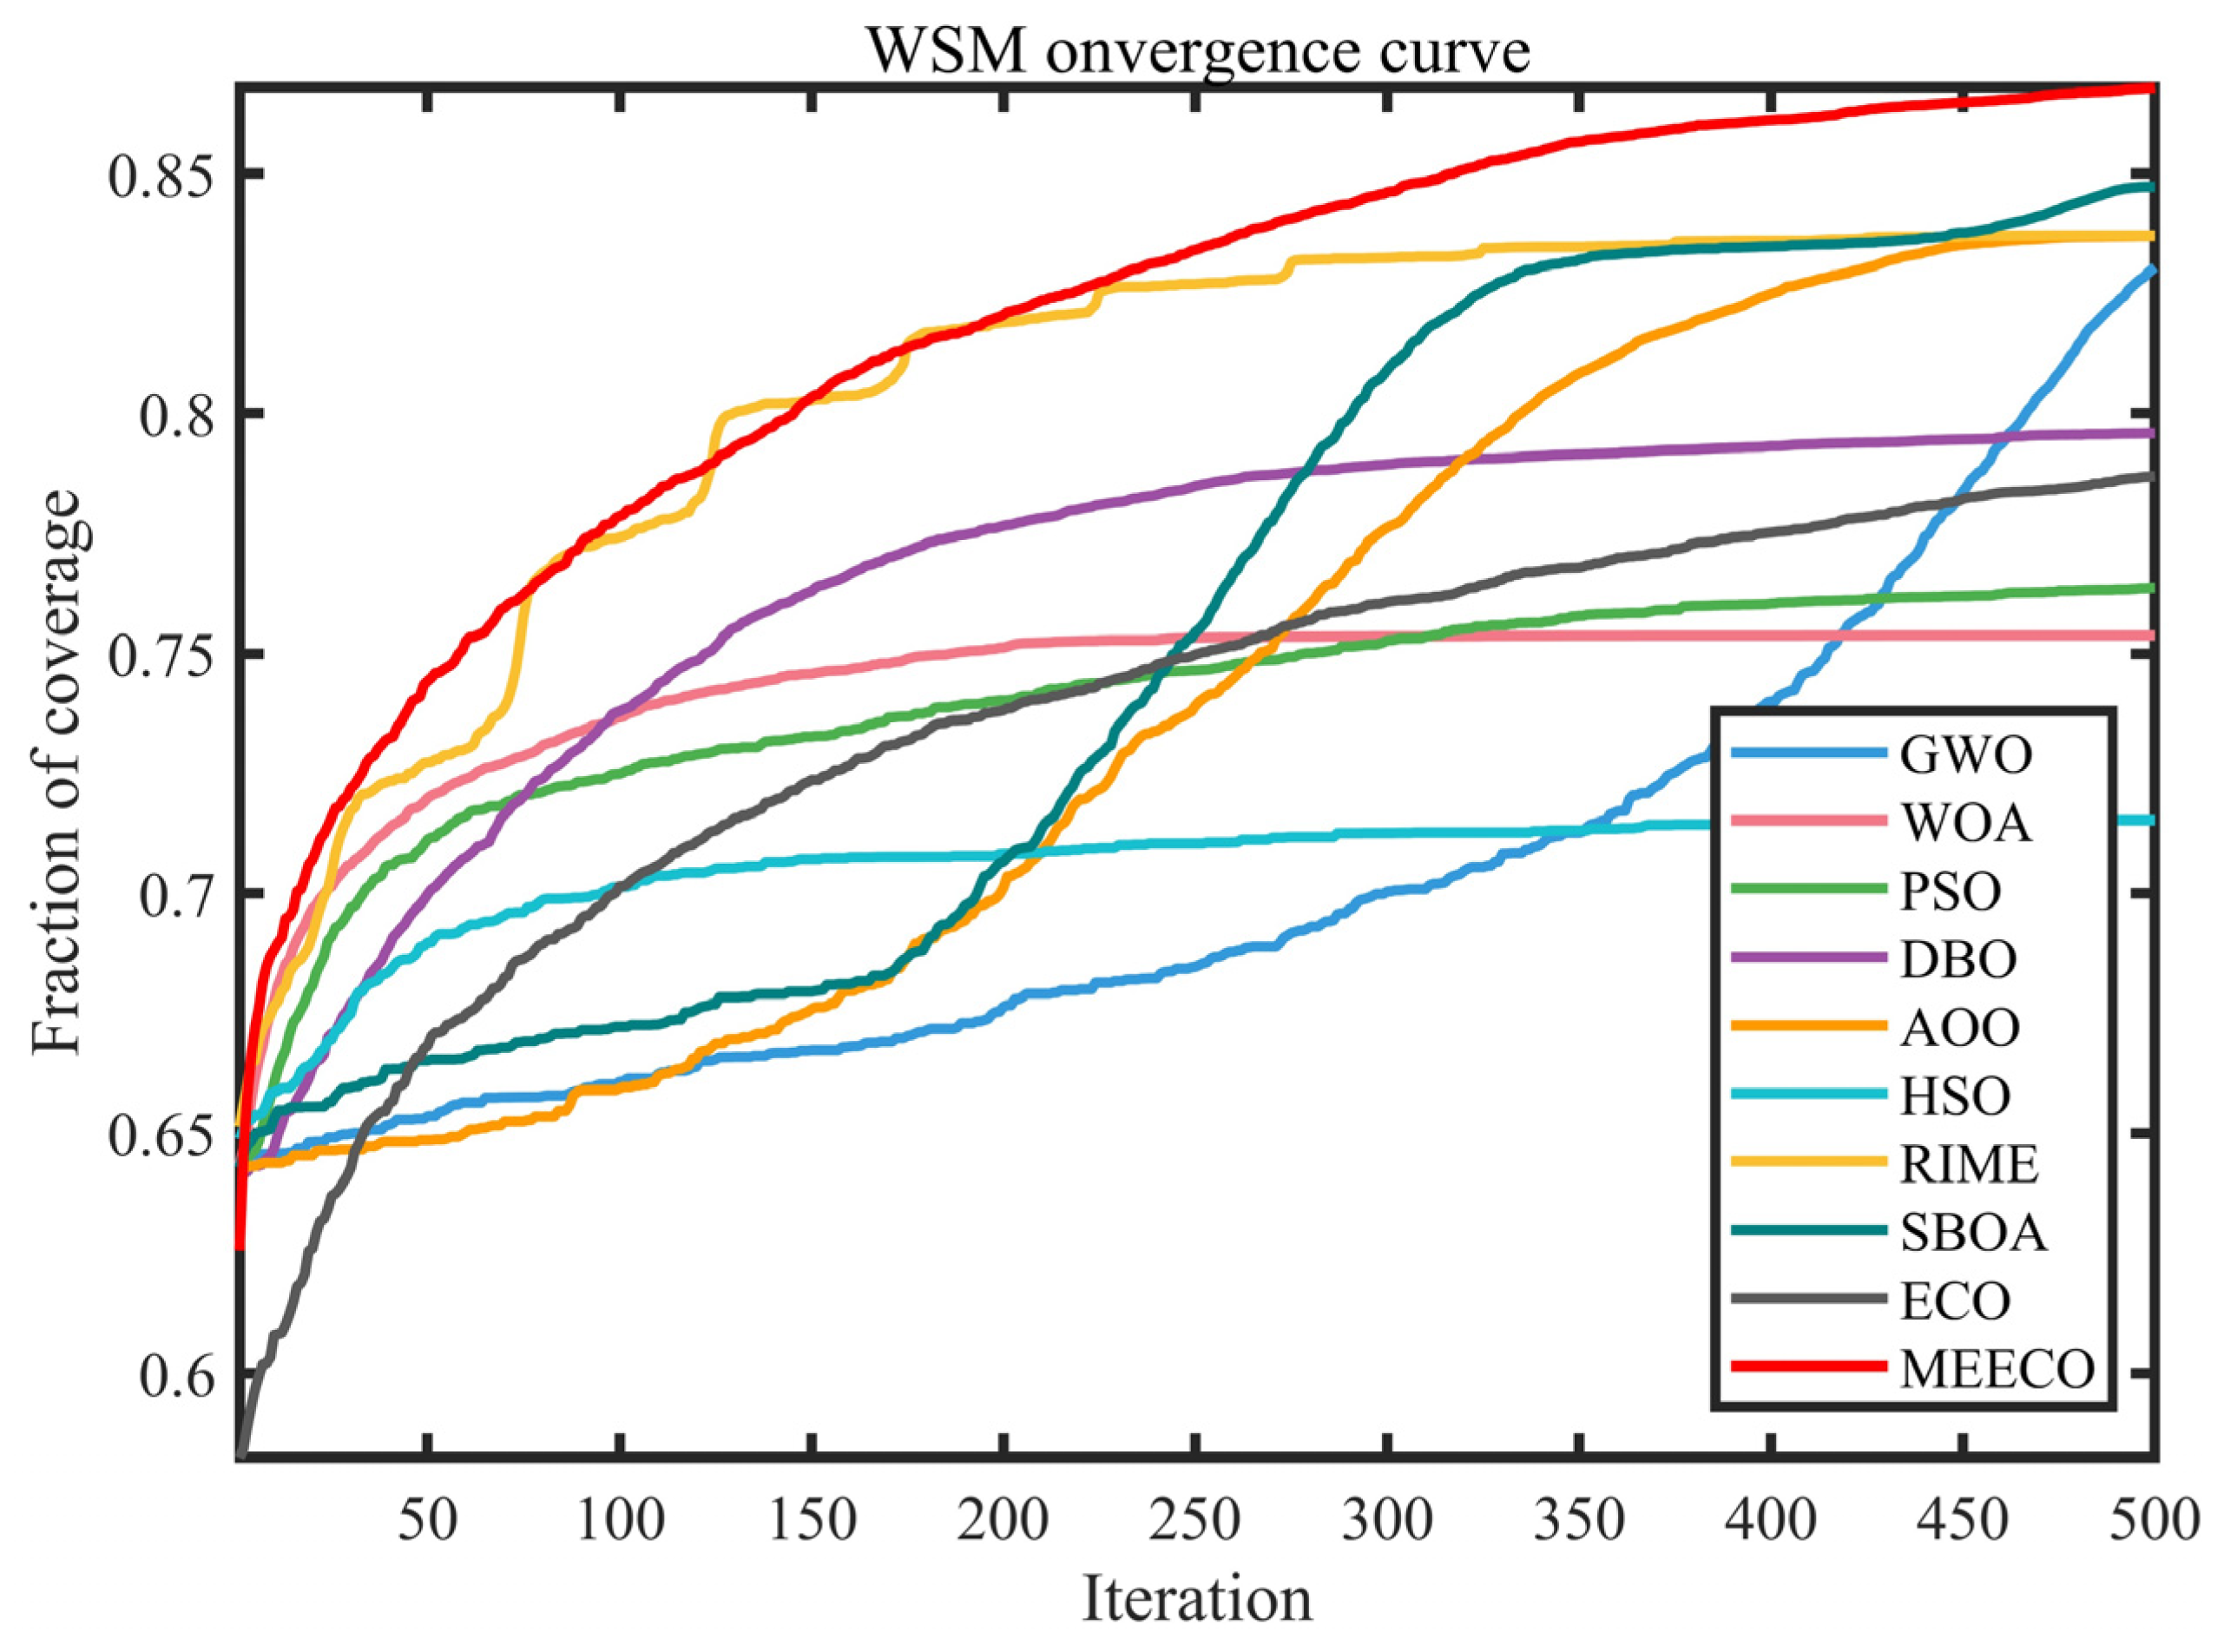
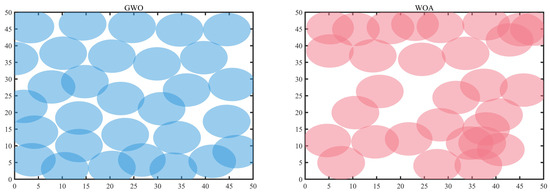
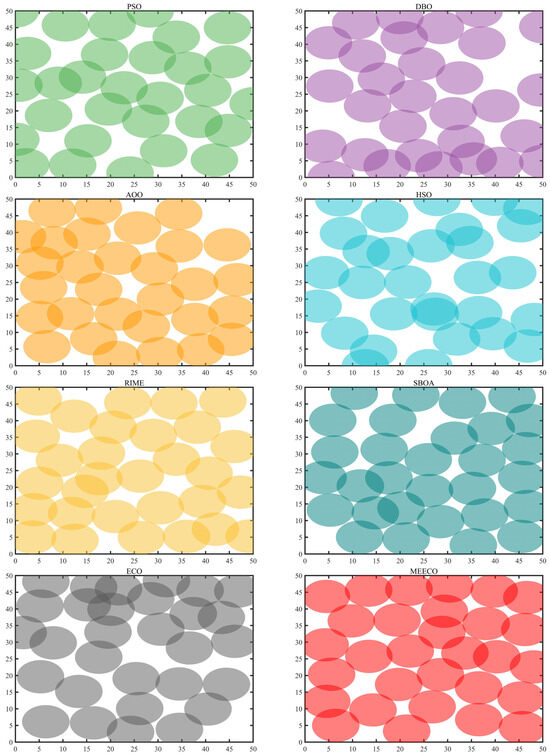
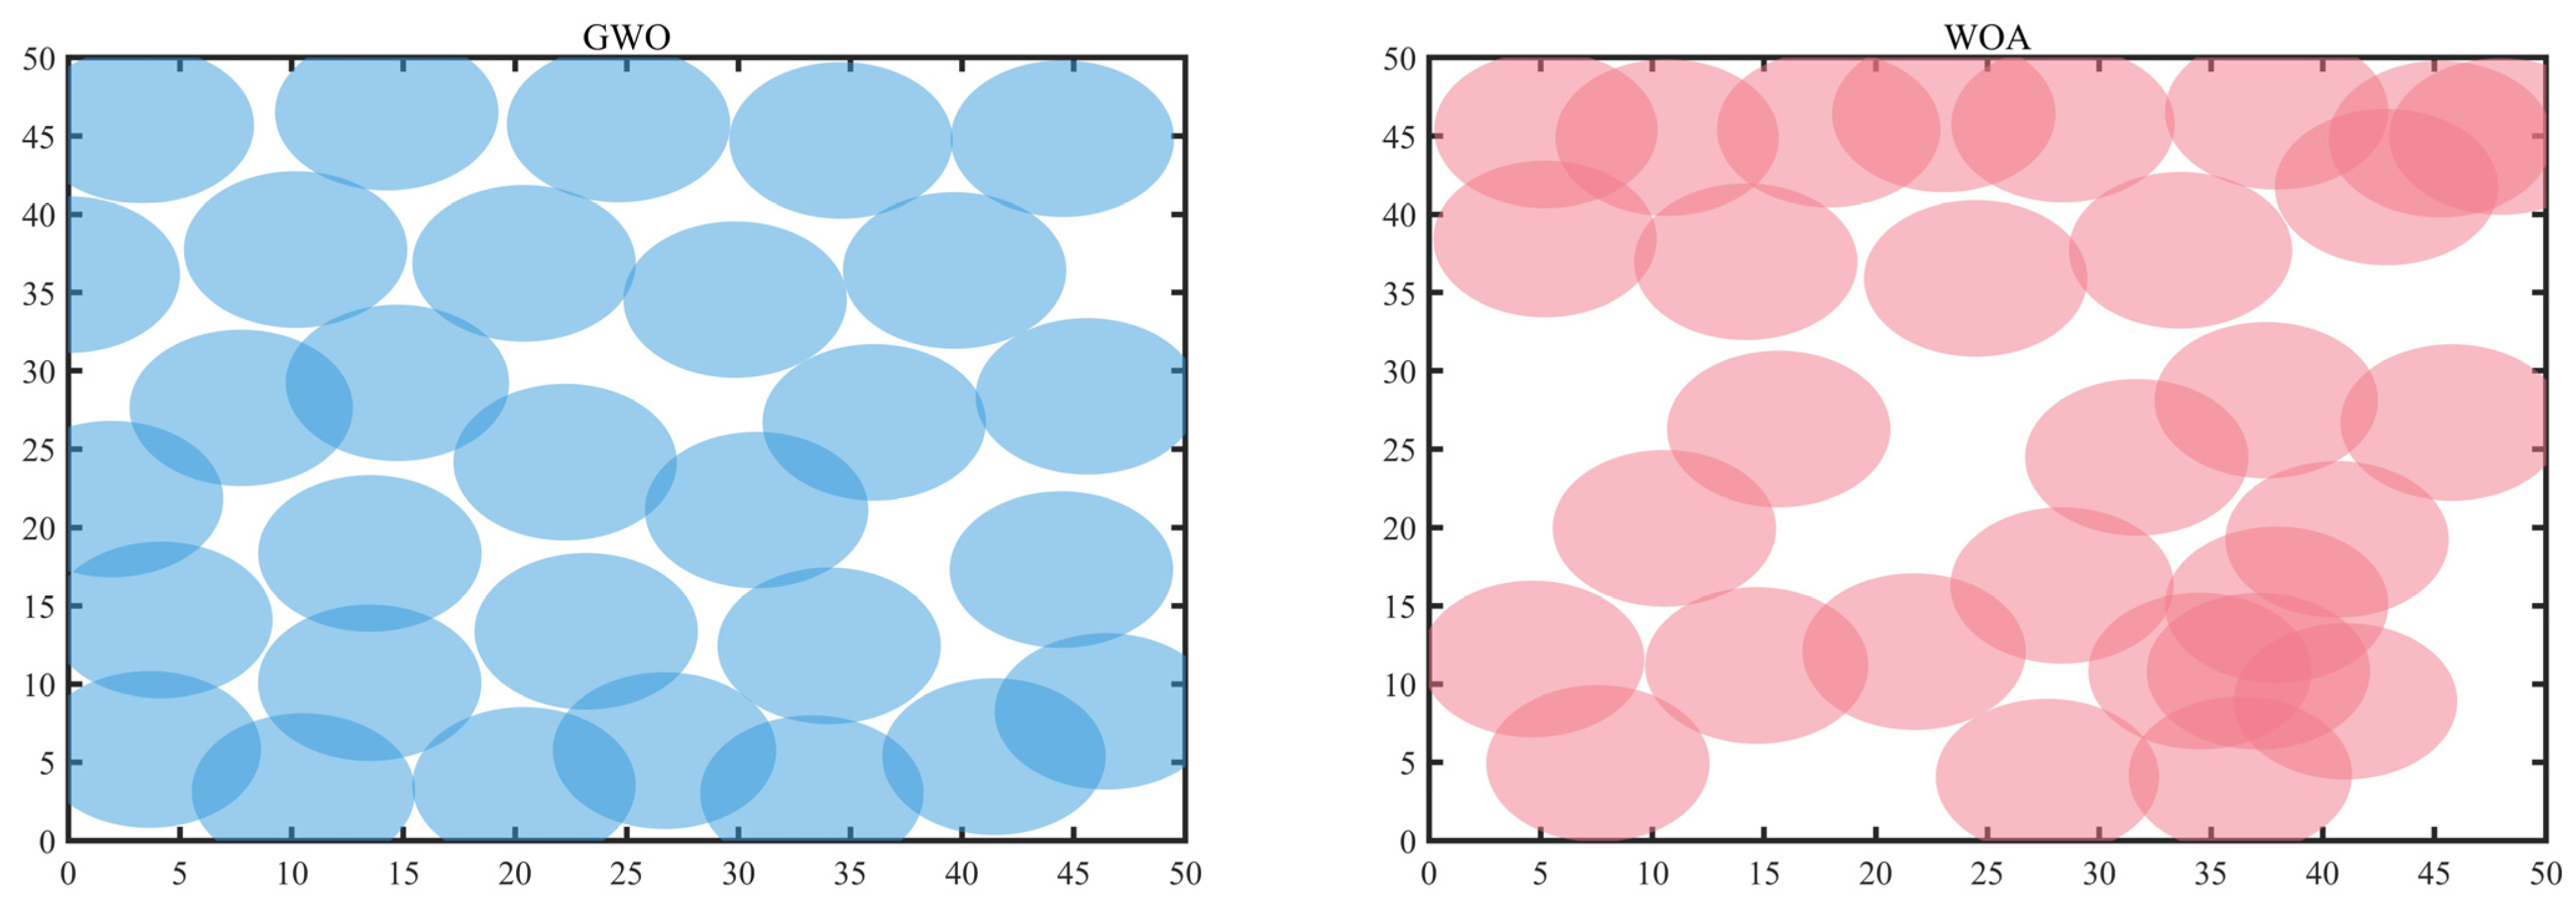
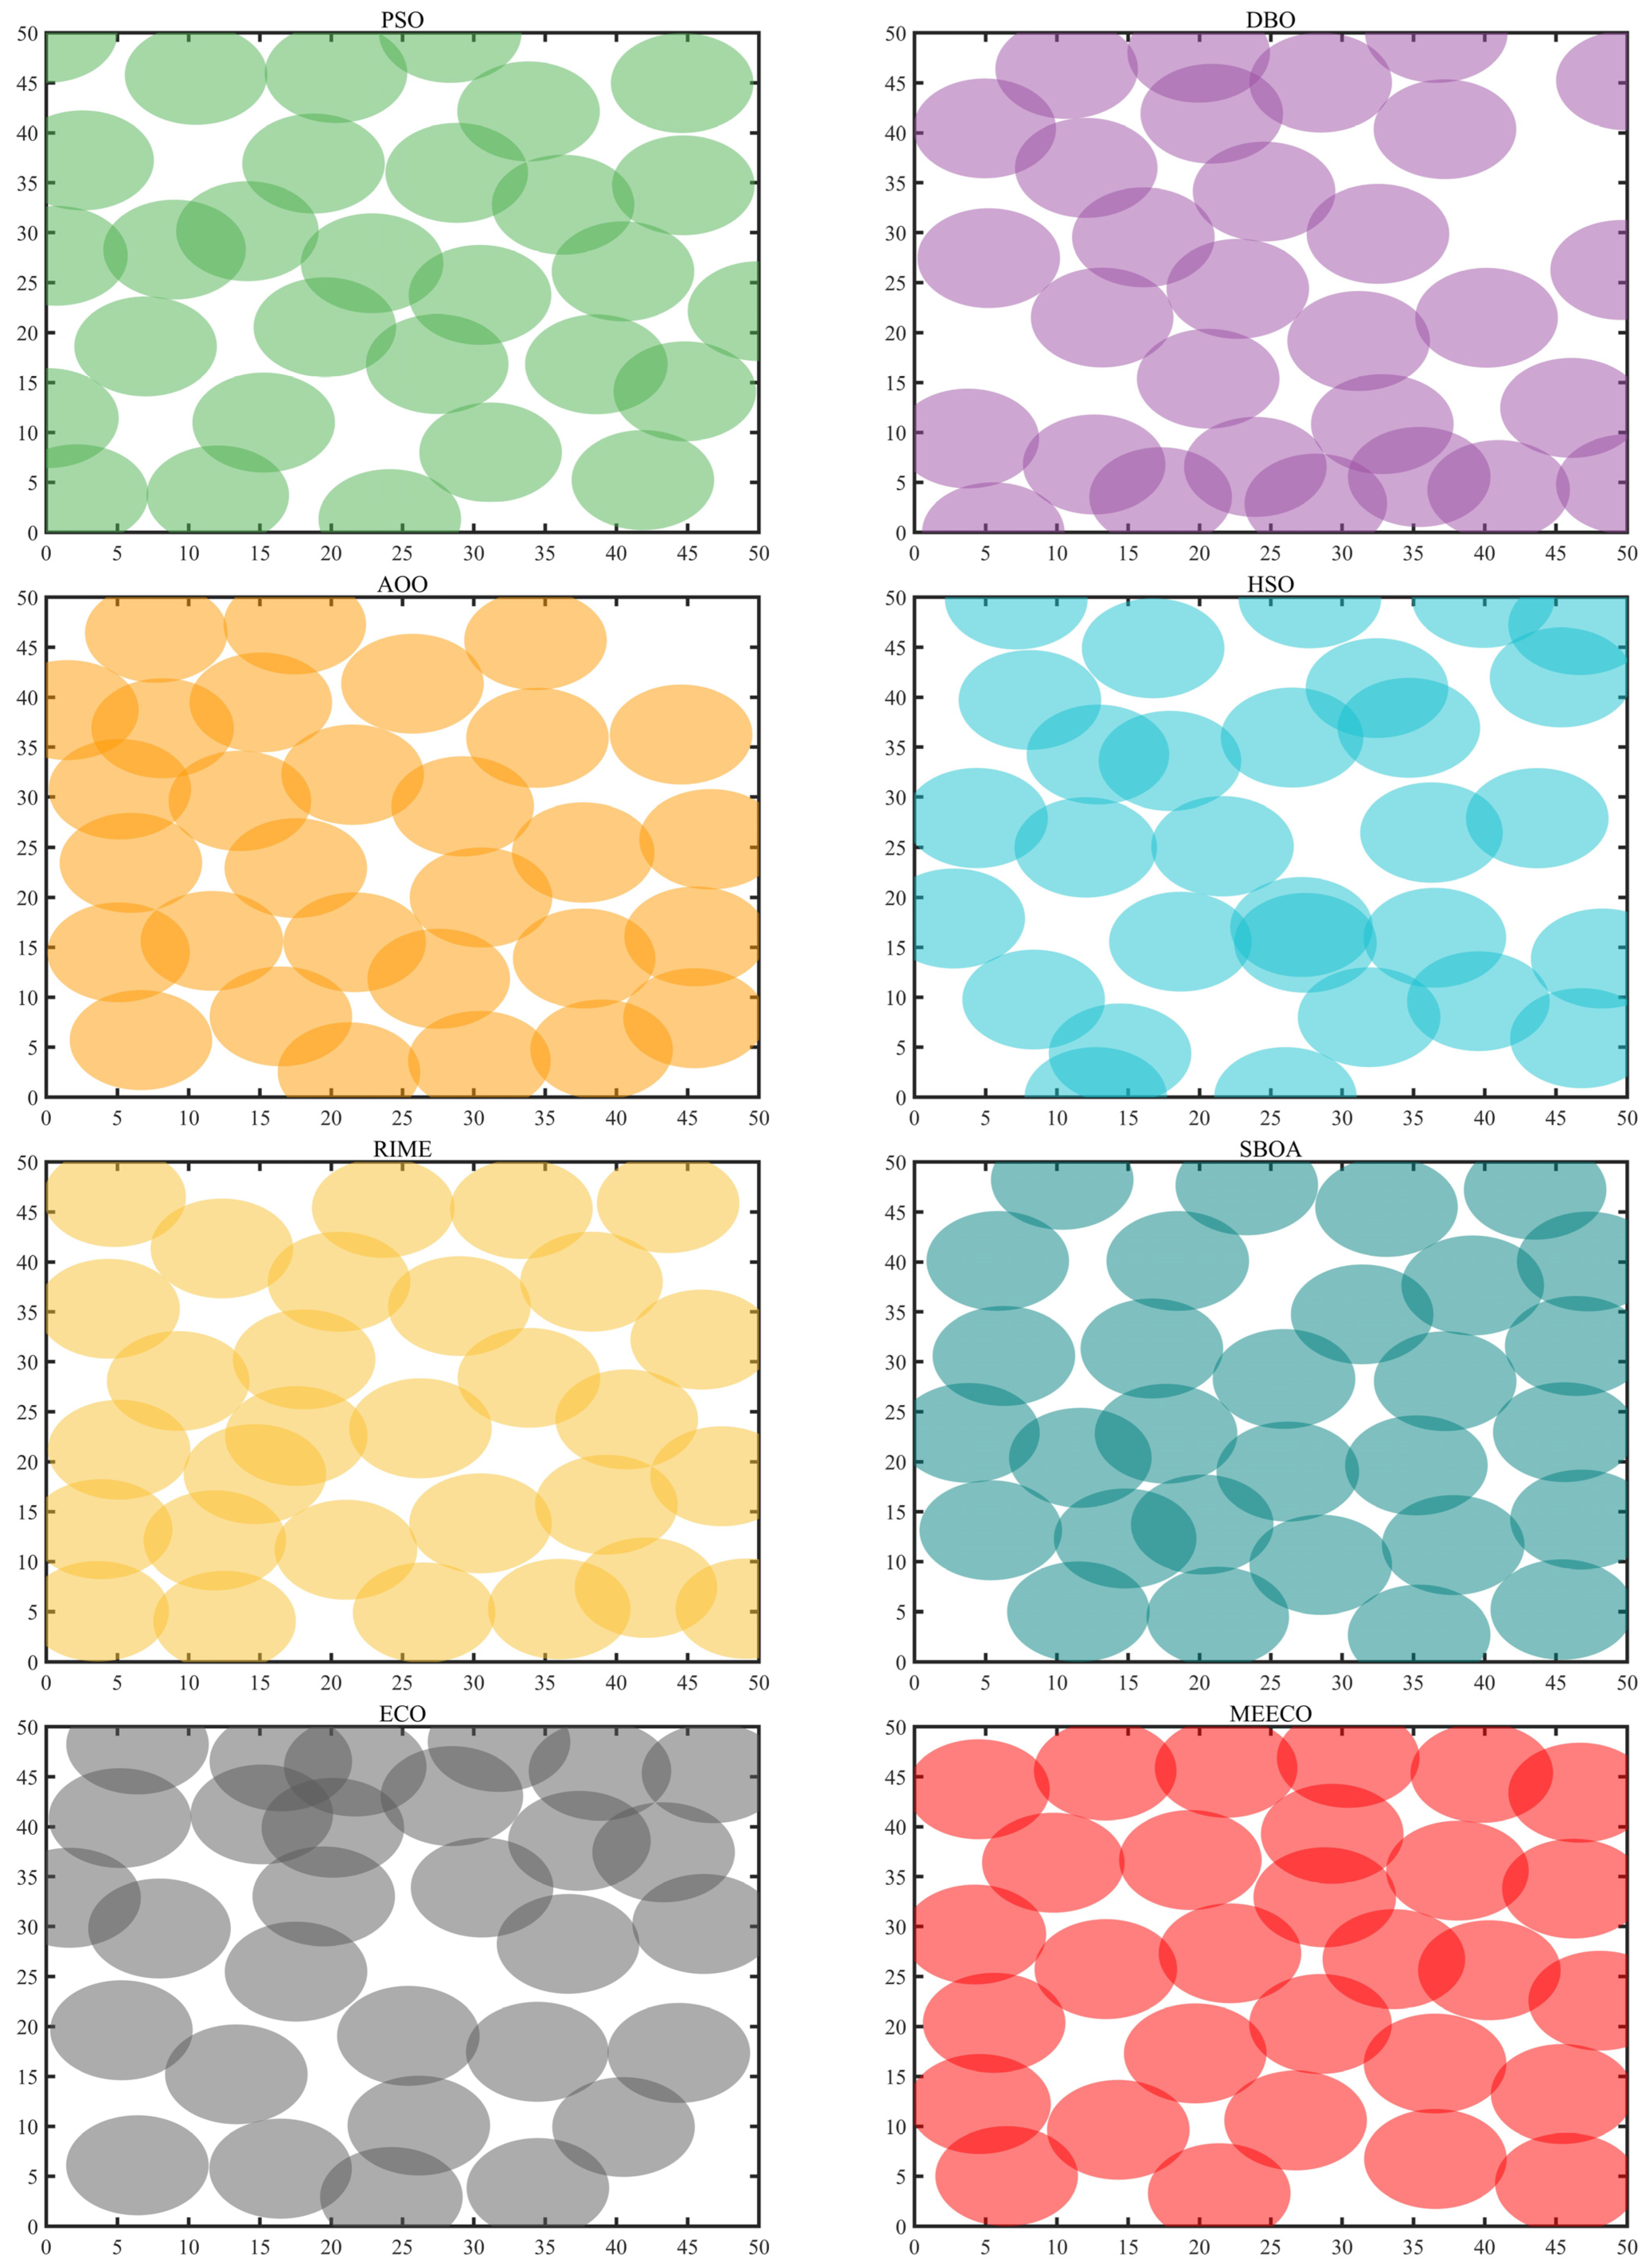

Disclaimer/Publisher’s Note: The statements, opinions and data contained in all publications are solely those of the individual author(s) and contributor(s) and not of MDPI and/or the editor(s). MDPI and/or the editor(s) disclaim responsibility for any injury to people or property resulting from any ideas, methods, instructions or products referred to in the content. |
© 2026 by the authors. Licensee MDPI, Basel, Switzerland. This article is an open access article distributed under the terms and conditions of the Creative Commons Attribution (CC BY) license.