


Abstract
This study proposes an approach for detecting alcohol intoxication from speech based on a combination of audio segmentation and a hybrid neural network architecture that integrates convolution neural network (CNN) and long-short term memory (LSTM) layers. The proposed design enables effective modeling of both local spectral patterns and long-term temporal dependencies in speech signals. By operating on relatively long audio segments, the approach allows the simultaneous analysis of complex speech constructions and pause patterns, which are known to be sensitive to alcohol-induced speech impairments. Each audio signal was divided into two equal-duration segments that are processed sequentially by the model, which helps reduce the impact of asymmetrical distribution of intoxication-related speech artifacts. The approach was evaluated using the GradusSpeech-v1 corpus, which contains more than 1300 recordings of Russian tongue twisters collected from 31 speakers under controlled conditions in both sober and intoxicated states. Experimental results demonstrate that the proposed method achieves high performance. When full recordings are analyzed using median aggregation of segment-level predictions, the model reaches Accuracy, Recall, and F1-score values close to 0.93, indicating the effectiveness of the approach for alcohol intoxication detection in speech.
1. Introduction
According to the World Health Organization (WHO), more than two million deaths in 2019 were caused by alcohol consumption, with about 700,000 of these associated with injuries and accidents that occurred both at workplaces and as a result of road traffic incidents [1,2]. The WHO European region, which includes the Russian Federation, has one of the highest rates of alcohol consumption worldwide. The average per capita consumption is 9.2 L of pure alcohol per year, which is the highest in the world. The Region of the Americas follows with 7.5 L per year. Such high consumption, together with hazardous working environments and environmental conditions such as low temperatures and extended twilight, is associated with an increased risk of occupational injuries and fatalities.
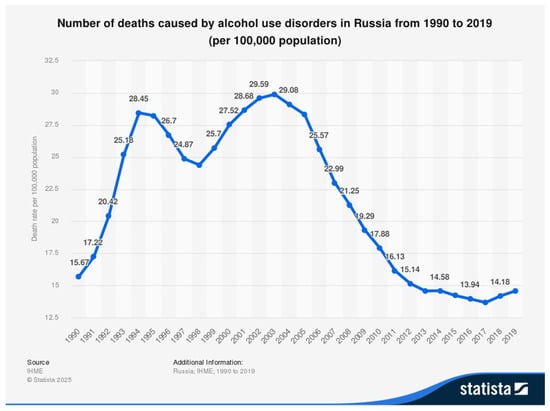
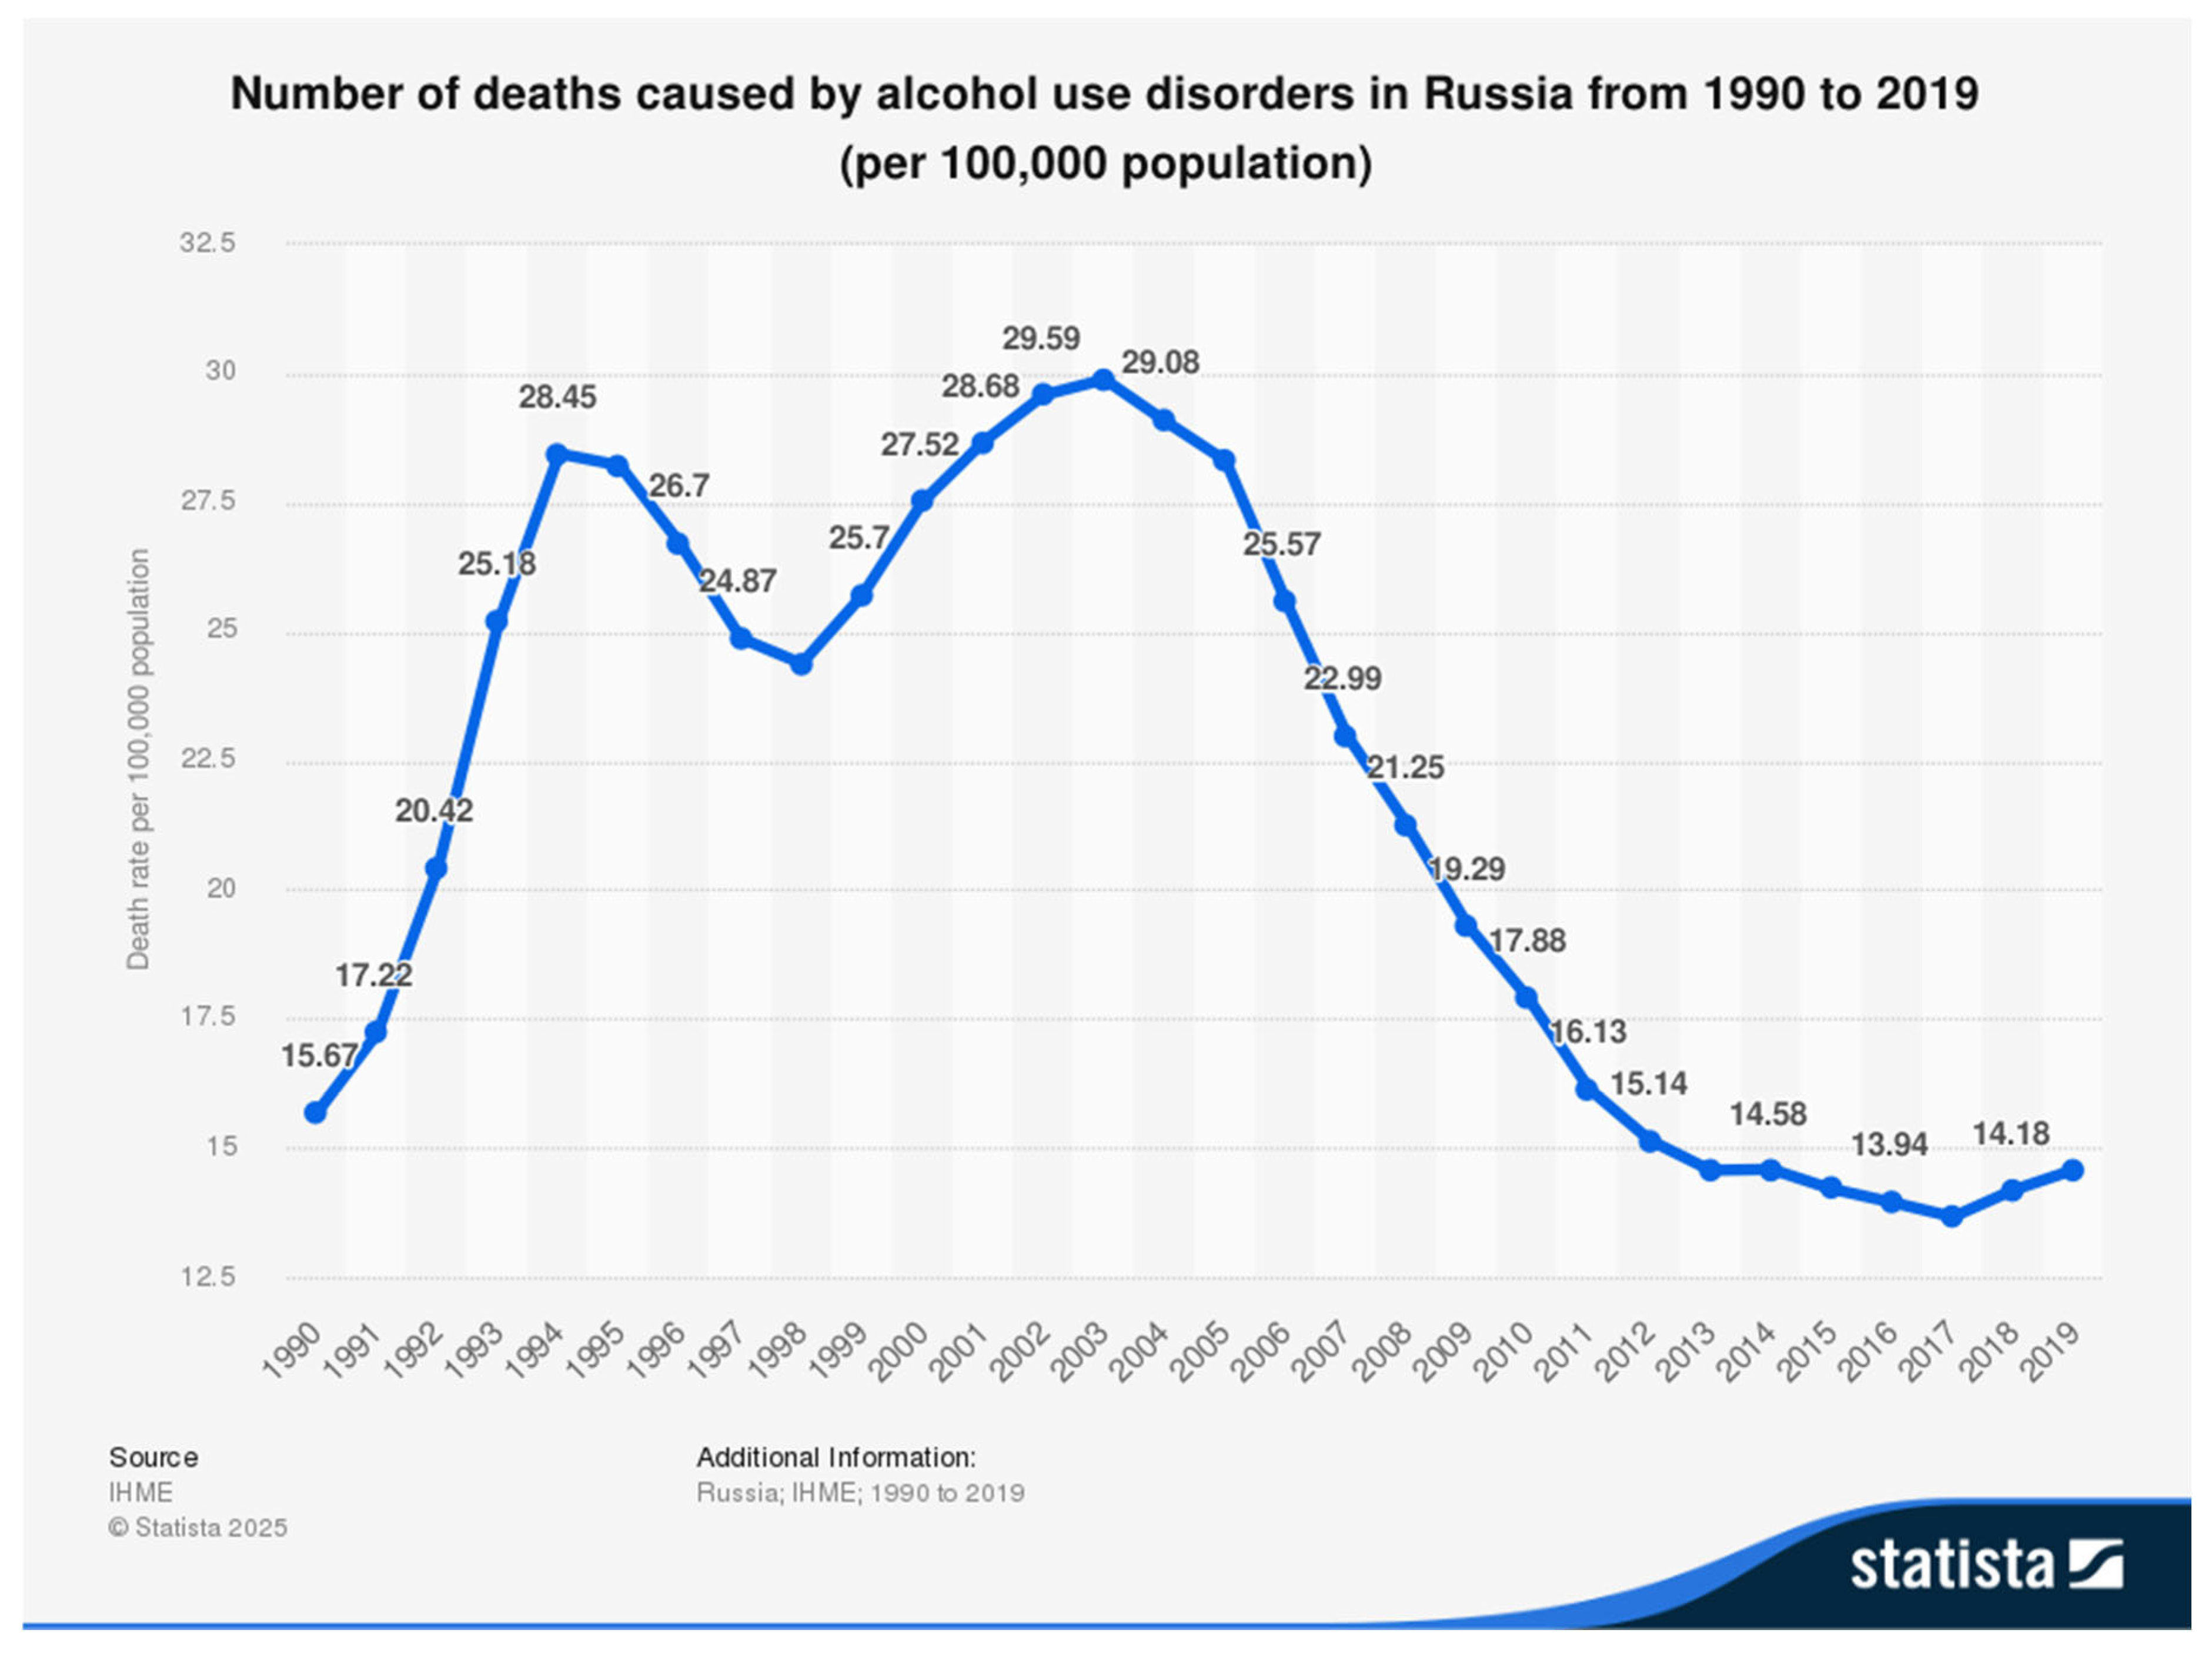
In the Russian Federation, a clear correlation can be observed between alcohol consumption and the rate of occupational accidents. In 2019, there were 14.57 alcohol-related incidents per 100,000 population [3]. Although the overall trend has declined over the last two decades, a temporary increase was observed between 2017 and 2019, as shown in Figure 1. According to the Federal Service for Labor and Employment, many alcohol-related incidents are underreported, suggesting that the true rate may be higher.
Figure 1.
Alcohol-Related Death Trends in Russia [3].
In some countries, access to medical and rehabilitation assistance for alcohol dependence remains limited. This limitation not only increases the risk of accidents but also creates the necessity for continuous employee monitoring and health checks before and during working shifts. The same report by the WHO [1] emphasizes a substantial global treatment gap, underscoring the importance of improving access to evidence-based prevention and care to reduce preventable mortality and related socioeconomic harm.
The condition of employees can be assessed using technical and medical means such as breathalyzers, biochemical analyzers, electronic sensors, and clinical tests assessing coordination, speech, or pupil reaction. However, all these approaches have limitations. Breathalyzers and blood analyzers are expensive, require calibration and certification, and are not convenient for frequent use, for example, in long-distance transportation. Wearable sensors can provide real-time monitoring but are costly and require individual devices. Clinical tests are subjective and are not suitable for all occupations, while the results may be influenced by intentional manipulation by the examinee. Moreover, recent cases have demonstrated that even laboratory-based biological tests may be compromised [4], as results can be deliberately falsified or substituted, undermining the reliability of human-based methods.
Modern technologies that rely on movement analysis, such as video surveillance, accelerometers in mobile devices, or eye-tracking, also have limited applicability, especially for professions such as driving, where movements are restricted and eye behavior depends on road conditions. As an alternative to speech analysis, it is also possible to use other physiological or behavioral indicators, including human gait [5], head inclination or patterns of vehicle control during driving [6,7], non-invasive biosignals [8], or thermal facial images [9,10]. However, these approaches may require more expensive equipment in order to achieve high accuracy in assessing a person’s state. Speech, in contrast, can be analyzed using inexpensive and simple devices such as mobile phones or microcomputers.
The widespread use of speech in authentication and verification systems [11] further increases the potential of this modality for developing new methods of detecting a speaker’s state of alcohol intoxication. The proposed method can also be applied in conjunction with systems for authorship verification or identifying individual author characteristics from text [12,13,14]. All this may allow the creation of new, enhanced authentication systems that can be applied in cyber-physical systems of varying severity [15,16].
Therefore, the goal of this study is to simplify the process of detecting alcohol intoxication among workers by developing an automatic method for analyzing the speech signal using a neural network model. The method is particularly focused on identifying asymmetries in acoustic and temporal structures of speech that emerge under intoxication, which can serve as key indicators of altered physiological states.
2. The Current State of Methods for Determining the Speaker’s Condition
Human speech changes proportionally to the influence of various physiological and psychological factors. These factors include various emotional states, as well as being under the influence of alcohol or drugs. In particular, the influence of alcohol and other psychotropic substances is one of the most important factors in altering a person’s speech, behavior, or thinking, as confirmed by numerous studies.
In his review, Chamoun [17] emphasizes the effect of additive substances on opioid mu receptors. This, in turn, can inhibit dopamine neurons, which can ultimately lead to a secondary release of dopamine. Such releases can subsequently be characterized by a sedative effect, often expressed as a slowing of thought, which directly affects the number and duration of pauses in a person’s speech, as well as a possible increase in pauses at the beginning of speech.
Sulavko [18] also notes the impact of alcohol on human brain function in his work. The authors examined EEG changes in various psychophysiological states, including alcohol intoxication. It was found that alcohol weakens alpha rhythms, which in turn slows human reaction times and impairs concentration. Decreased concentration, in turn, leads to frequent repetitions in a person’s speech or self-corrections. Urazaev [19] also notes a decrease in rationality and self-control in human behavior and speech, as well as a general slowing of thinking, based on his analysis of human speech in various languages. The author analyzed the typological features of lexeme use, identifying corresponding differences after alcohol consumption. Urazaev also notes that under the influence of alcohol, human speech often consists of simpler sentences. Similar conclusions, but based on fractal analysis of brain activity, are formed by Madden [20] in his study, considering, in particular, the Hurst exponent.
Furthermore, human speech may change at the fundamental frequency (F0) level in various psychophysiological states. For example, Geng [21,22] examined the effects of alcohol and drugs using Mandarin speech as an example. He noted an increase in F0 variability and instability, as well as a possible decrease in speech volume, which in turn may be caused by insufficient subglottic pressure. The same author noted changes in jitter and shimmer, which are responsible for controlling vocal cord vibration. Inivatov [23] also reached similar conclusions when examining the impact of alcohol on the quality and stability of biometric authentication systems.
The impact of alcohol and psychophysiological conditions on overall human coordination and micromotor skills is particularly noteworthy [24]. In various conditions, coordination and micromotor skills can be impaired due to permanent abnormalities in brain function. Such abnormalities can be caused by both mental illness and chronic, prolonged alcohol consumption.
Summarizing all of the above, we can highlight the following most significant effects of alcohol on human speech:
- Noticeable reduction in speech rate due to slower cognitive processing;
- The appearance of atypical or extended pauses between words;
- Possible hoarseness and variations in pitch;
- An initial increase in vocal intensity at low alcohol concentrations, followed by a decline at higher levels;
- Reduced fluency and the appearance of hesitations, repetitions, and self-corrections;
- Simplification of syntactic structures, with a shift toward shorter and less complex sentences.
These alterations indicate that alcohol intoxication introduces acoustic asymmetries into speech, such as irregularities in rhythm, pauses, and articulation symmetry.
Sigmund [25] describes two primary methods for estimating the level of intoxication: blood alcohol concentration (BAC) and breath alcohol concentration (BrAC). BAC is considered more reliable. In the cited experiment, 12 male participants aged 20–28, who occasionally consumed alcohol, were recorded both while sober and under intoxication levels ranging from 0.5‰ to 1.5‰. Recordings included vowels and words, each repeated three times. The boundary between the sober and intoxicated states was set at 1‰, since psychomotor changes become noticeable above 0.5‰ and clearly manifest above 1.5‰.
The researchers analyzed glottal airflow using the Iterative Adaptive Inverse Filtering (IAIF) method, which isolates vocal cord activity from the influence of the vocal tract. The experiment revealed measurable changes in vowel production and glottal pulse characteristics. Among the vowels, /o/ (77.0%) and /e/ (76.6%) were the most reliable indicators of intoxication.
Tisljar-Szabo [26] investigated the impact of alcohol intoxication on Hungarian speech using tongue-twisters grouped by phonetic features. A comparison between sober and intoxicated conditions showed a significantly higher number of articulation errors in the intoxicated state, except for tongue-twisters containing foreign words. The number of pauses increased, while articulation rate and fundamental frequency (F0) remained largely unchanged.
Schiel [27] demonstrated that human listeners are capable of identifying intoxicated speech with relatively high accuracy using audio samples from the BAS ALC corpus [28]. The overall classification accuracy reached 71.65%, exceeding that of the automatic ISSC system (67.56%) [29]. Female speech was recognized more accurately than male speech (77% versus 66%), and read speech yielded higher recognition accuracy (75.7%) compared to spontaneous speech (66.2%).
Gong [30] analyzed long-term variations in F0 using median and interquartile range (IQR) values and the ANOVA test. A statistically significant increase in F0 was observed for approximately 79% of intoxicated speakers, while the rest showed a reduction. The IQR increased for 62.8% of speakers, with more pronounced changes in spontaneous speech compared to monotone reading.
The findings of these studies indicate that blood alcohol concentration and binary classification (sober/intoxicated) cannot be reliably predicted using generic statistical models because of substantial interspeaker variability and the influence of external factors such as emotional state and fatigue. The authors recommend developing speaker-specific adaptive models that integrate both acoustic and physiological parameters to achieve more accurate detection.
Bonela [31] introduced a deep learning-based algorithm (ADLAIA) that predicts intoxication using 12 s speech fragments. ADLAIA was trained on the German BAS ALC corpus, which contains 12,360 recordings from 162 speakers. The model achieved 68.1% accuracy and 67.7% precision for BAC ≥ 0.05%, and 75.7% accuracy for BAC > 0.12%. The algorithm can be integrated into mobile applications for rapid intoxication detection in public environments.
Li et al. (2019) [32] sought to improve classification quality through in-batch speaker normalization, which removes speaker-specific variability unrelated to intoxication. Using ResNet18 combined with spectral clustering and normalization, the model achieved an unweighted average recall (UAR) of 0.677 on BAS ALC.
Vital Terlapu P [33] proposed a real-time system for detecting intoxication based on isolated vowel analysis (/a/, /e/, /o/, and others). Using a dataset of 509 recordings from 265 speakers, including 46 habitual drinkers, the authors extracted F0, jitter, shimmer, and harmonic-to-noise ratio (HNR) as features. The incremental hidden-layer neural network (IHLN-ANN) with backpropagation achieved 99.4% accuracy, confirming that vowels provide highly discriminative information for intoxication detection.
Our previous studies explored convolutional neural network (CNN) models for the same task. In the work from SPECOM [34], a fine-tuned VGG16 model was trained on spectrogram images derived from a subset of the GradusSpeech-v1 corpus (10 speakers, sober and intoxicated at BAC > 1.5‰). The resulting model achieved F1-score and UAR values of 0.81 and 0.82, respectively. A subsequent study [35] compared classical machine learning approaches on image-based spectral features and achieved an F1-score of 0.78 using gradient boosting.
Summarizing the related work, the following features of the field of determining the state of alcoholic intoxication of a speaker can be highlighted:
- Shorter speech constructions, such as individual vowels or syllables, are frequently used, but the use of entire phrases or combinations of constructions of varying complexity outside of graphical data formats was not found.
- An analysis of similar studies revealed no examples of the use of dynamic length segments in any language. Furthermore, no studies were found for the analysis of Russian speech that utilized audio segmentation other than for individual sounds.
- The classification studies reviewed do not mention the use of noise suppression methods or do not provide a comparison of data with different noise levels, which raises the question of its impact on the performance of alcohol intoxication classification systems.
Based on the identified gaps in existing studies, the present research is focused on extending alcohol intoxication detection beyond short and isolated speech units toward the analysis of longer speech constructions of varying complexity. Particular emphasis is placed on Russian speech, which remains underrepresented in this research domain despite its phonetic and prosodic specificity. To address these limitations, the proposed approach employs segmentation of audio recordings into dynamically sized segments, enabling the joint analysis of simple and complex speech structures within a unified framework. This strategy aims to capture both local acoustic cues and higher-level temporal patterns, while also allowing a systematic investigation of the influence of segmentation strategy and noise conditions on classification performance.
3. Methodology
3.1. Overall Methodological Pipeline
This study follows a structured methodology designed to ensure a consistent transition from raw speech recordings to the final classification of alcohol intoxication. The proposed approach is formulated as a sequential processing pipeline, where each stage addresses a specific aspect of speech signal analysis, as follows:
- Speech data acquisition
- Signal preprocessing and noise handling
- Temporal segmentation of speech recordings
- Feature extraction using Mel-Frequency Cepstral Coefficients
- Hybrid 1D-CNN + LSTM modeling
- Segment-level prediction and recording-level aggregation
This pipeline allows a step-by-step transformation of the input speech signal into a final decision regarding the speaker’s intoxication state.
3.2. Speech Acquisition and Preprocessing
Speech recordings are collected under controlled conditions using predefined tongue-twisters to ensure phonetic diversity and reproducibility. To evaluate robustness to environmental conditions, two preprocessing configurations are considered: raw recordings and recordings processed with the speech enhancement neural network model. This design enables an explicit analysis of the influence of background noise on classification performance.
3.3. Temporal Segmentation and Feature Extraction
Each recording is divided into a fixed number of equal-duration segments. The number of segments is varied to analyze the impact of speech structure complexity on model performance. For each segment, Mel-Frequency Cepstral Coefficients (MFCC) are extracted using a sliding window approach and normalized using median normalization to reduce inter-segment variability. The segmentation strategy supports the analysis of long-term temporal asymmetries and reduces sensitivity to uneven distribution of intoxication-related speech artifacts.
3.4. Neural Network Modeling and Decision Aggregation
Segment-level MFCC sequences are processed using a hybrid neural network architecture combining one-dimensional convolutional (1D-CNN) layers and a Long Short-Term Memory (LSTM) layer. Convolutional layers capture local spectral patterns, while the recurrent layer models temporal dependencies across speech segments. Although predictions are obtained at the segment level, the final classification decision for each recording is derived by aggregating segment-level outputs using the median value. This aggregation improves robustness and compensates for non-informative or asymmetric segments.
4. Dataset Description
4.1. Dataset Collection and Analysis
This study employs our personal speech corpus GradusSpeech-v1, which contains more than 1300 tongue-twister recordings collected from physically and mentally healthy volunteers. The total duration of the corpus is approximately two hours. The use of a proprietary dataset was motivated by the fact that access to many publicly available corpora on alcohol intoxication is restricted or requires complex administrative procedures, and such datasets often do not include recordings in the Russian language, which is a critical factor for our research. As a result, existing resources are limited in their suitability for studying language specific acoustic patterns of intoxicated speech. The study protocol was approved by the local bioethics committee at the Tomsk National Research Medical Center (Protocol No. 180 dated 15 January 2025) within the framework of a cooperation agreement between Tomsk State University of Control Systems and Radioelectronics and the Tomsk National Research Medical Center of the Russian Academy of Sciences.
The corpus consists of 20 tongue-twisters selected from publicly available lists, with half focusing on sonorant consonants (/s/, /n/, /l/) and the other half focusing on vowel sounds, particularly /a/ and /o/. Each recording contains one tongue-twister lasting between 4 and 16 s. Examples of the tongue-twisters in Russian, English, and transliteration based on International Phonetic Alphabet variants used as a basis for the corpus are presented in Table 1, where targeted sounds are highlighted with bold text and underscored.
Table 1.
Example tongue-twisters used for GradusSpeech-v1 recordings.
The methodology for the data collection followed a six-step procedure:
- Based on each participant’s physiological parameters (sex and weight) and using the Widmark formula [36], the required alcohol volume to achieve a target intoxication level was calculated.
- The speaker read 20 tongue-twisters, each saved as a separate audio file in a sober state.
- The speaker consumed the calculated amount of alcohol.
- After at least 20 min, the level of intoxication was verified using a breathalyzer. Five consecutive measurements were taken, and the median value was used.
- The speaker repeated the same 20 tongue-twisters, with each saved as a new audio file.
- Steps 3–5 were repeated for each target intoxication level.
The process of collecting the speech corpus continued until the speaker had recorded 20 tongue twisters in each condition and at each required level of intoxication. If the speaker’s condition prevented further collection, the speaker recorded 20 tongue twisters, recording their condition, and the process ceased.
It is also worth noting that Widmark’s formula is often criticized for its potential for calculation errors [37]. This is because it does not take into account the time since a meal or a person’s physiological characteristics. However, since we used a breathalyzer to test the speaker’s actual state, we were also able to fine-tune this state. Therefore, the use of Widmark’s formula in this study can be considered acceptable without further adjustments.
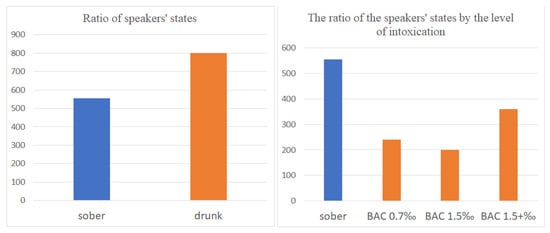
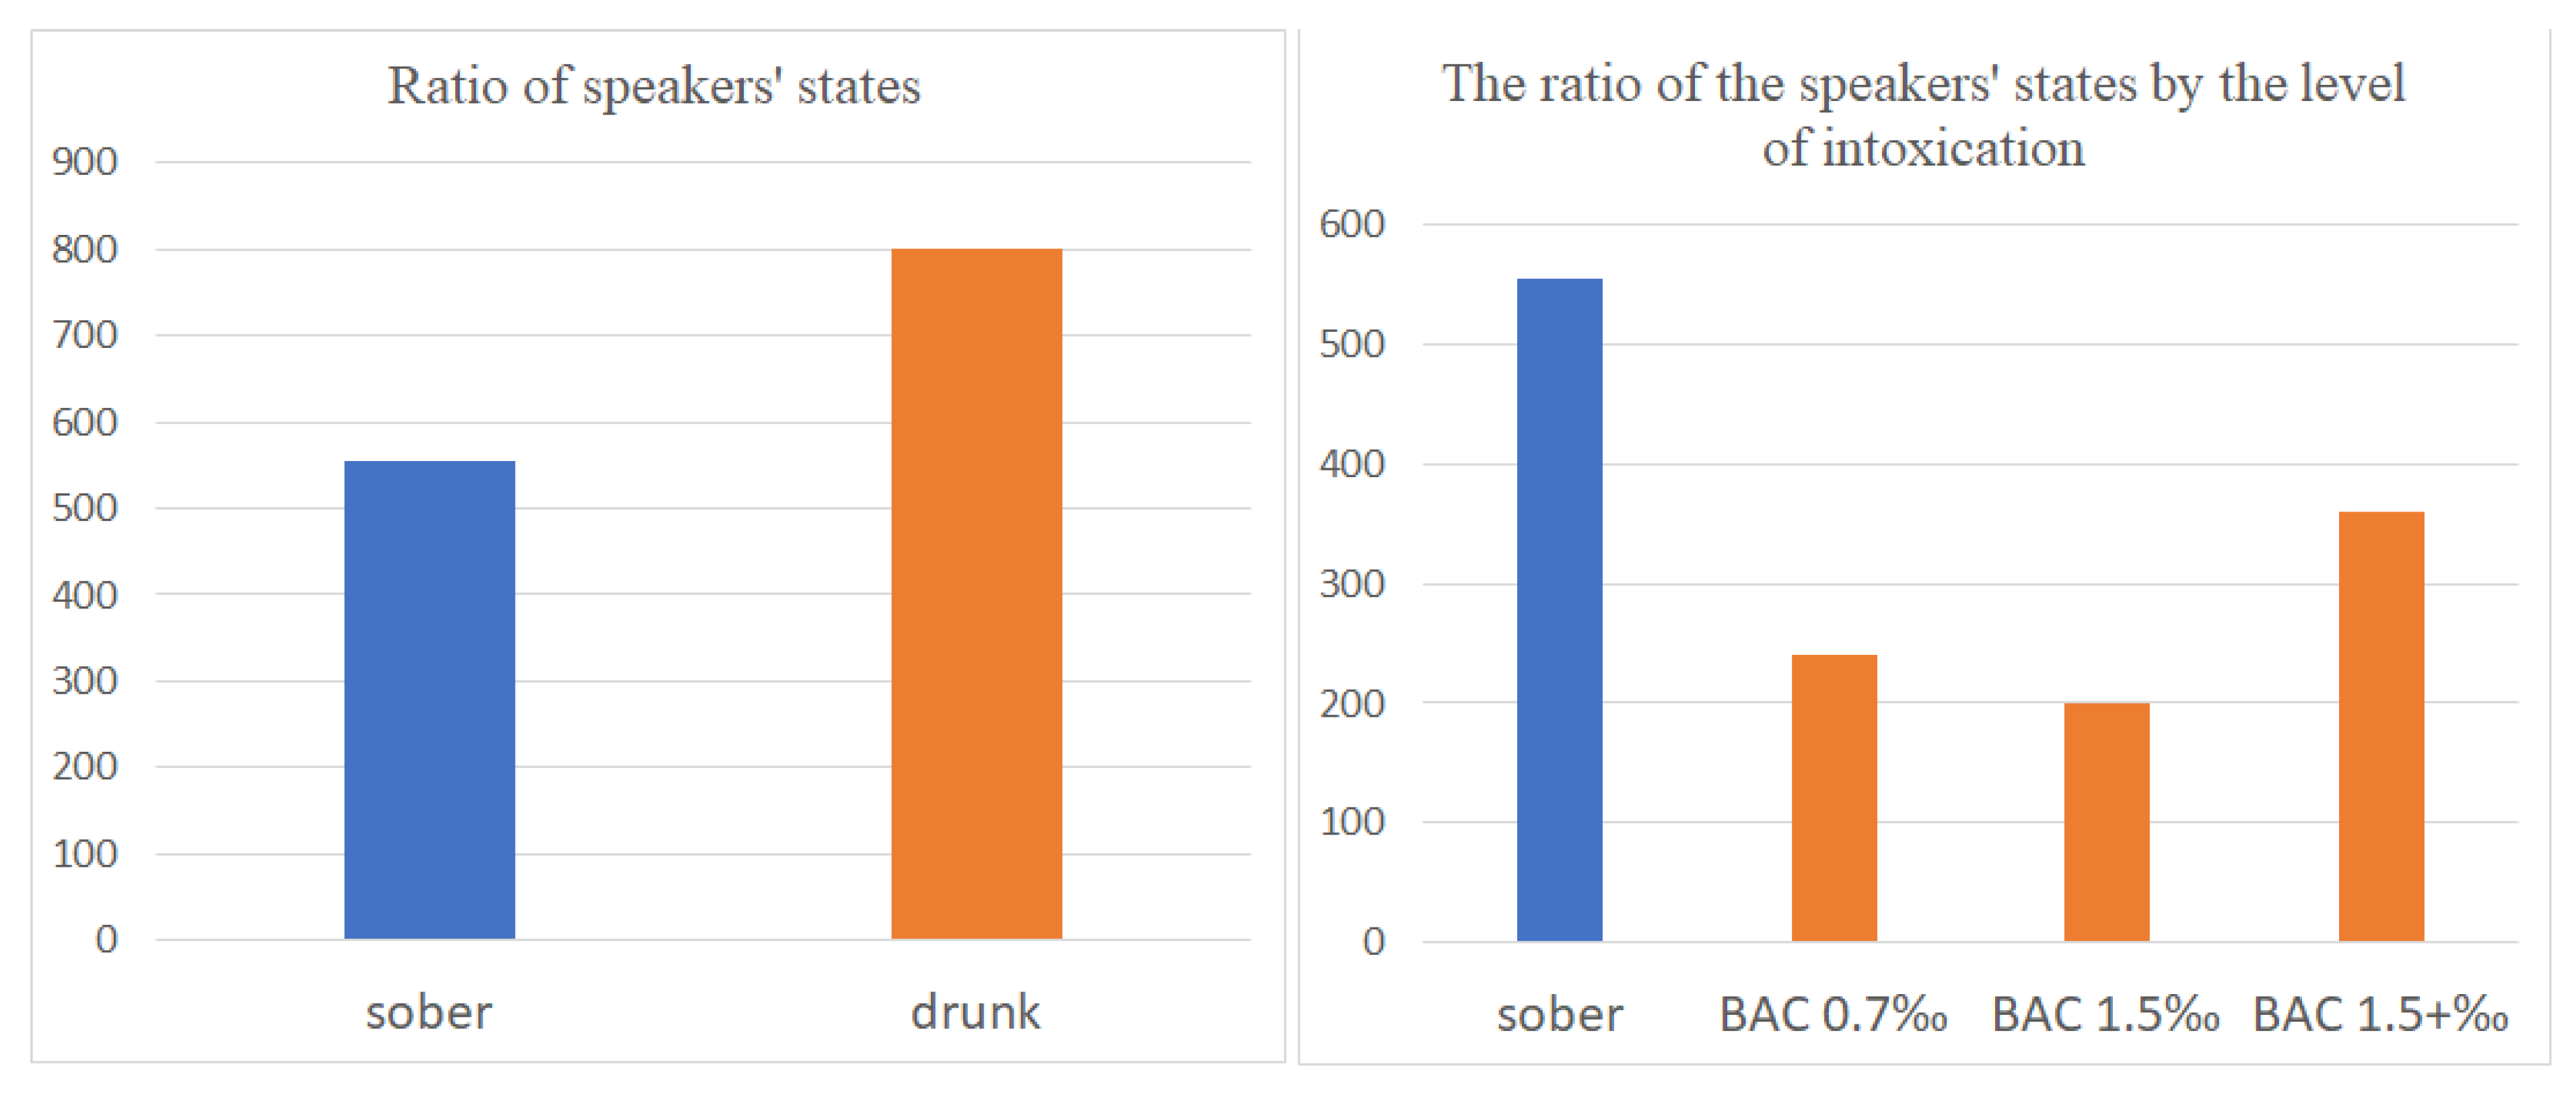
Each audio file in the corpus corresponds to one of four states of the speaker: sober, intoxicated with BAC below 0.7‰, intoxicated with BAC from 0.7‰ to 1.5‰, and intoxicated with BAC above 1.5‰.
Such distribution makes it possible to analyze how the model performance depends on the degree of intoxication and to assess the potential for detecting mild intoxication. Not all participants contributed recordings in all conditions, and about half of the intoxicated samples correspond to BAC levels above 1.5‰, because earlier stages of corpus collection included only the sober and high-intoxication conditions.
Two recording conditions were considered. The first condition was ideal, characterized by the absence of noticeable background noise or interference. The second condition was realistic, containing acoustic interference such as music, conversation, or background machinery noise. This division allows evaluation of the model’s robustness to noise.
The threshold between the sober and intoxicated classes was set at 1.5‰, consistent with previous research [25], which showed that speech changes become clearly audible at that level. The smaller BAC thresholds (<1.5‰) were retained in the corpus to support future regression modeling. A detailed visualization of the speaker state ratios is presented in Figure 2. Furthermore, it is worth noting that the ratio of male to female speakers in the created speech corpus is asymmetrical and equals 19:12, which may impact the quality of generalization of the new data due to a possible shortage of speech samples from female speakers.
Figure 2.
Distribution of speaker states in the GradusSpeech-v1 corpus.
Although GradusSpeech-v1 is smaller than other comparable corpora, for example, it is approximately 11 times smaller than BAS ALC, no artificial data augmentation was applied, as the primary objective of the present study was to investigate whether alcohol-related speech markers can be learned under data-limited conditions. The use of a compact corpus allows a more controlled analysis of intoxication-induced acoustic changes while reducing the influence of uncontrolled variability often present in large-scale datasets. At the same time, we acknowledge that the limited number of speakers may pose a risk of overfitting and may constrain direct generalization to a broader and more diverse population. These limitations are intentionally addressed in the experimental design, which focuses on identifying speaker-independent acoustic patterns rather than modeling individual speaker characteristics.
4.2. Data Preprocessing
To account for background noise and device-related interference, the recordings were processed with the DeepFilterNet neural network model [38,39]. This model combines convolutional and recurrent layers to adaptively suppress non-speech components of the signal while preserving the spectral and temporal features of the voice. DeepFilterNet supports sampling rates up to 48 kHz, allowing effective speech enhancement across a wide frequency range.
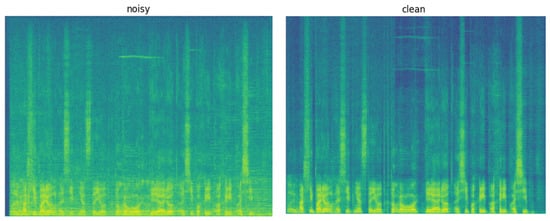
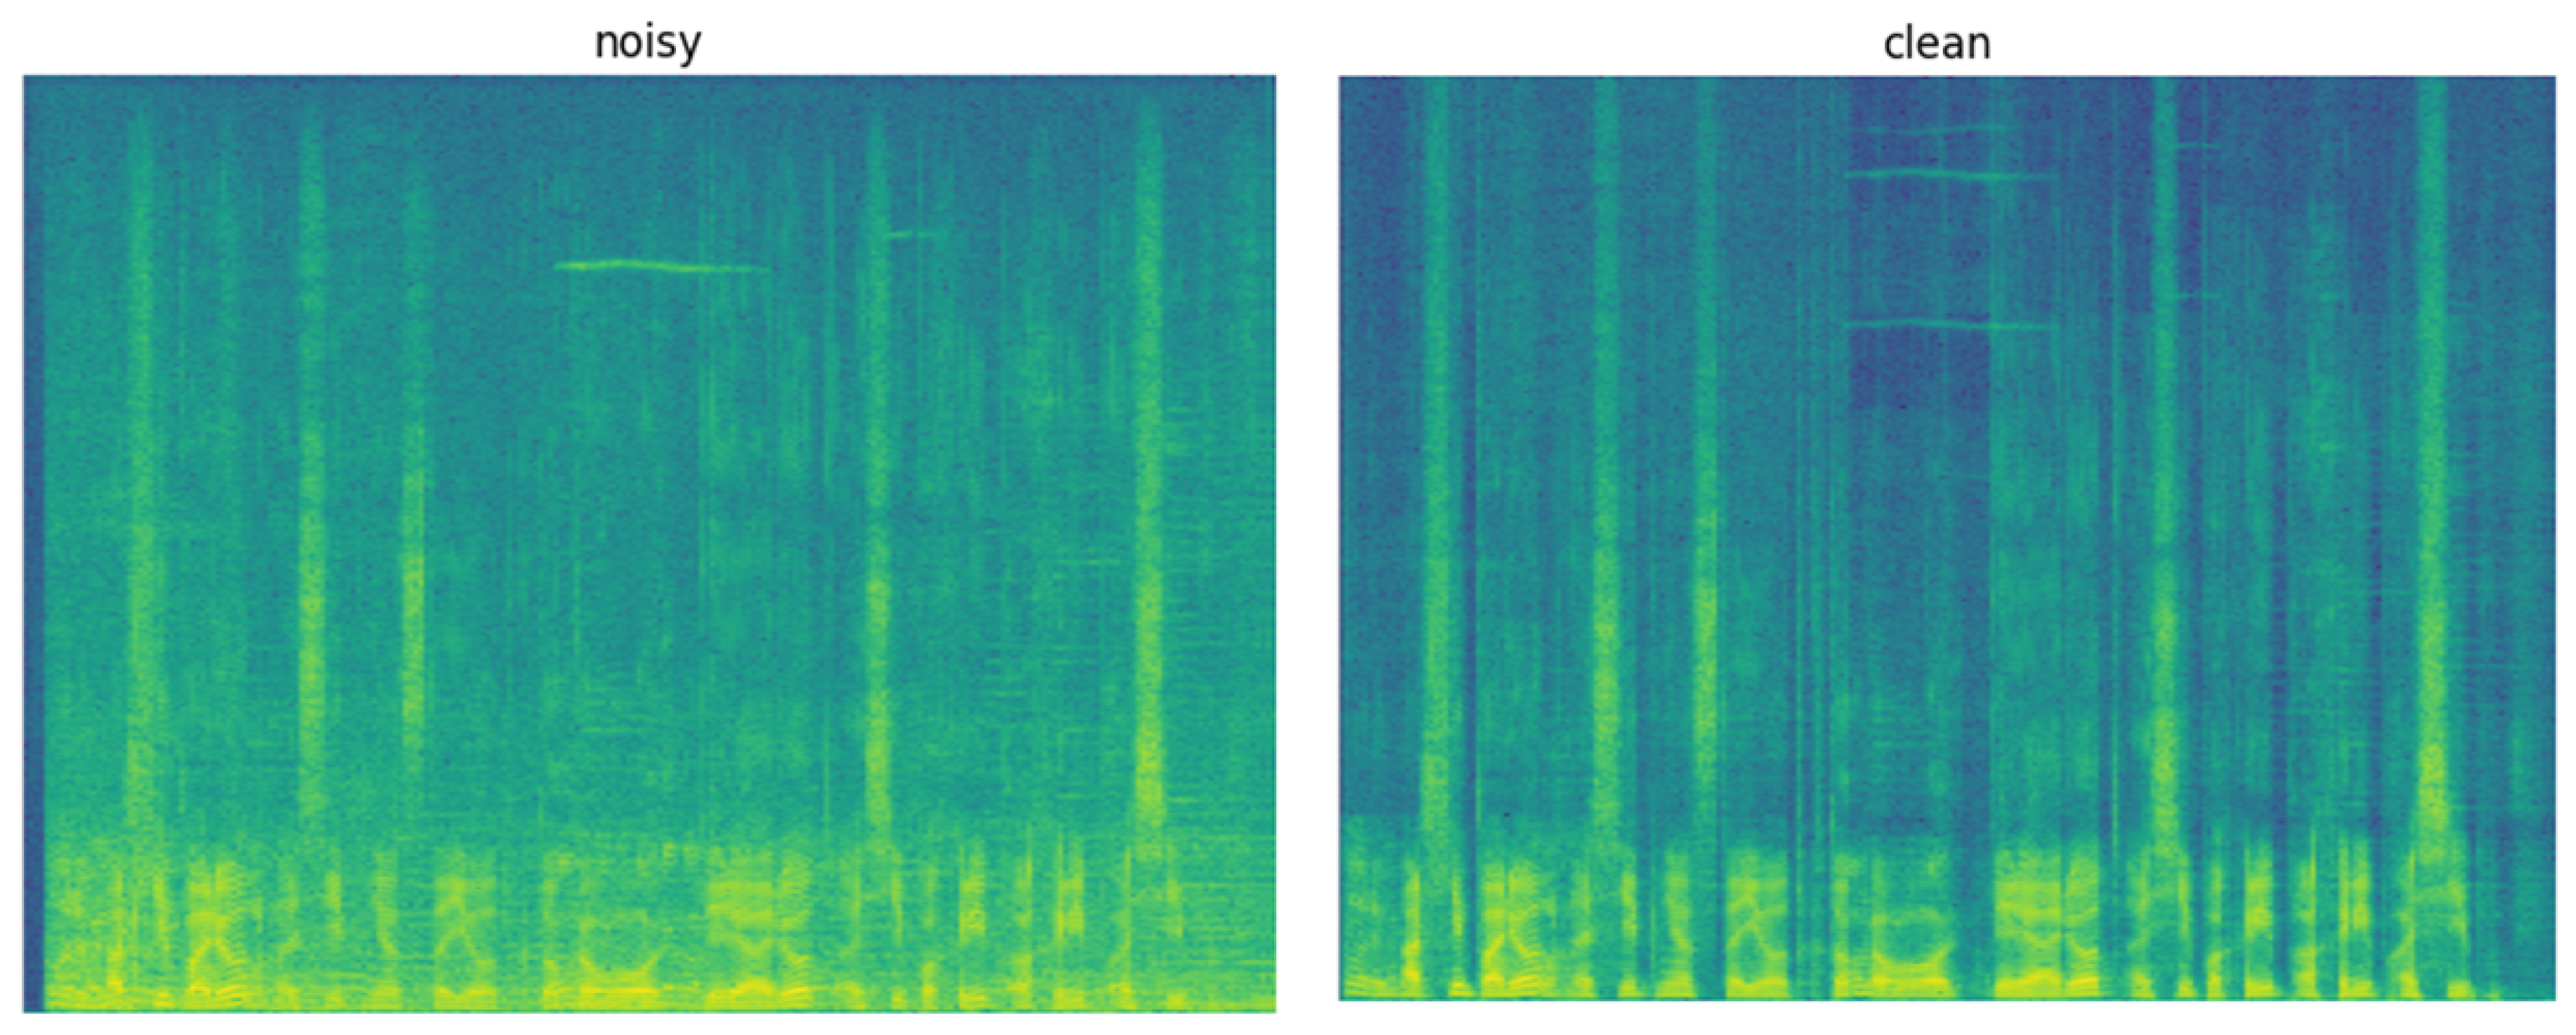
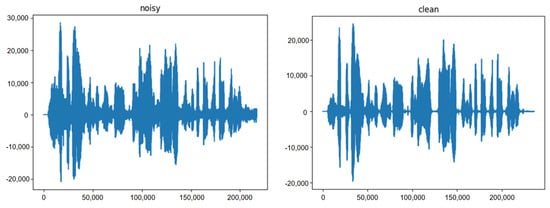
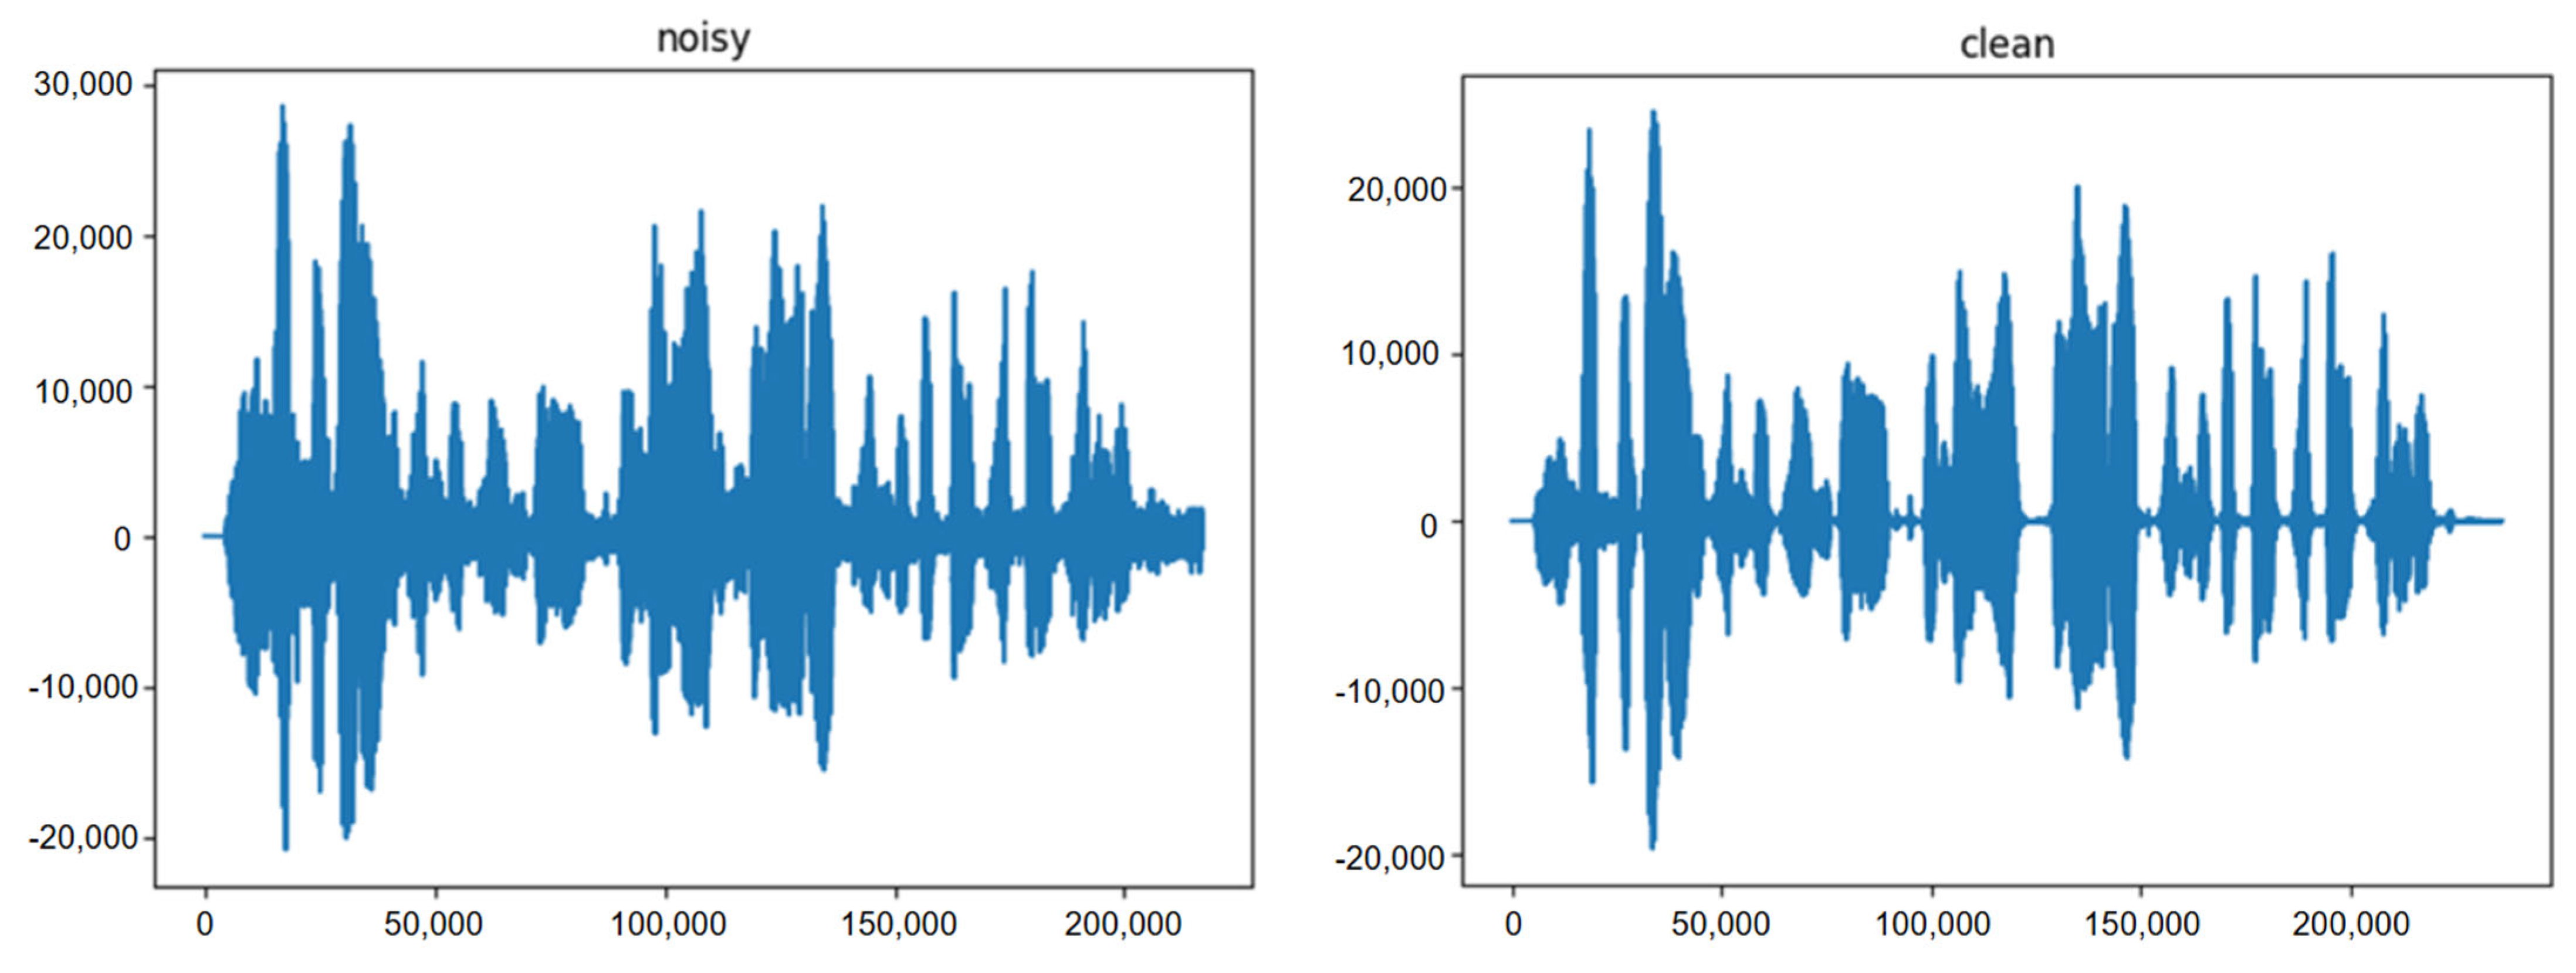
Figure 3 shows a spectrogram of a recording before and after DeepFilterNet processing, and Figure 4 presents the corresponding waveform comparison.
Figure 3.
Spectrograms of a noisy and a cleaned recording after DeepFilterNet processing.
Figure 4.
Waveforms of the original and cleaned recordings.
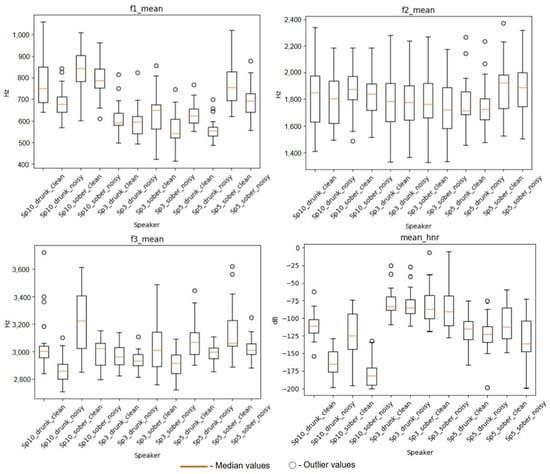
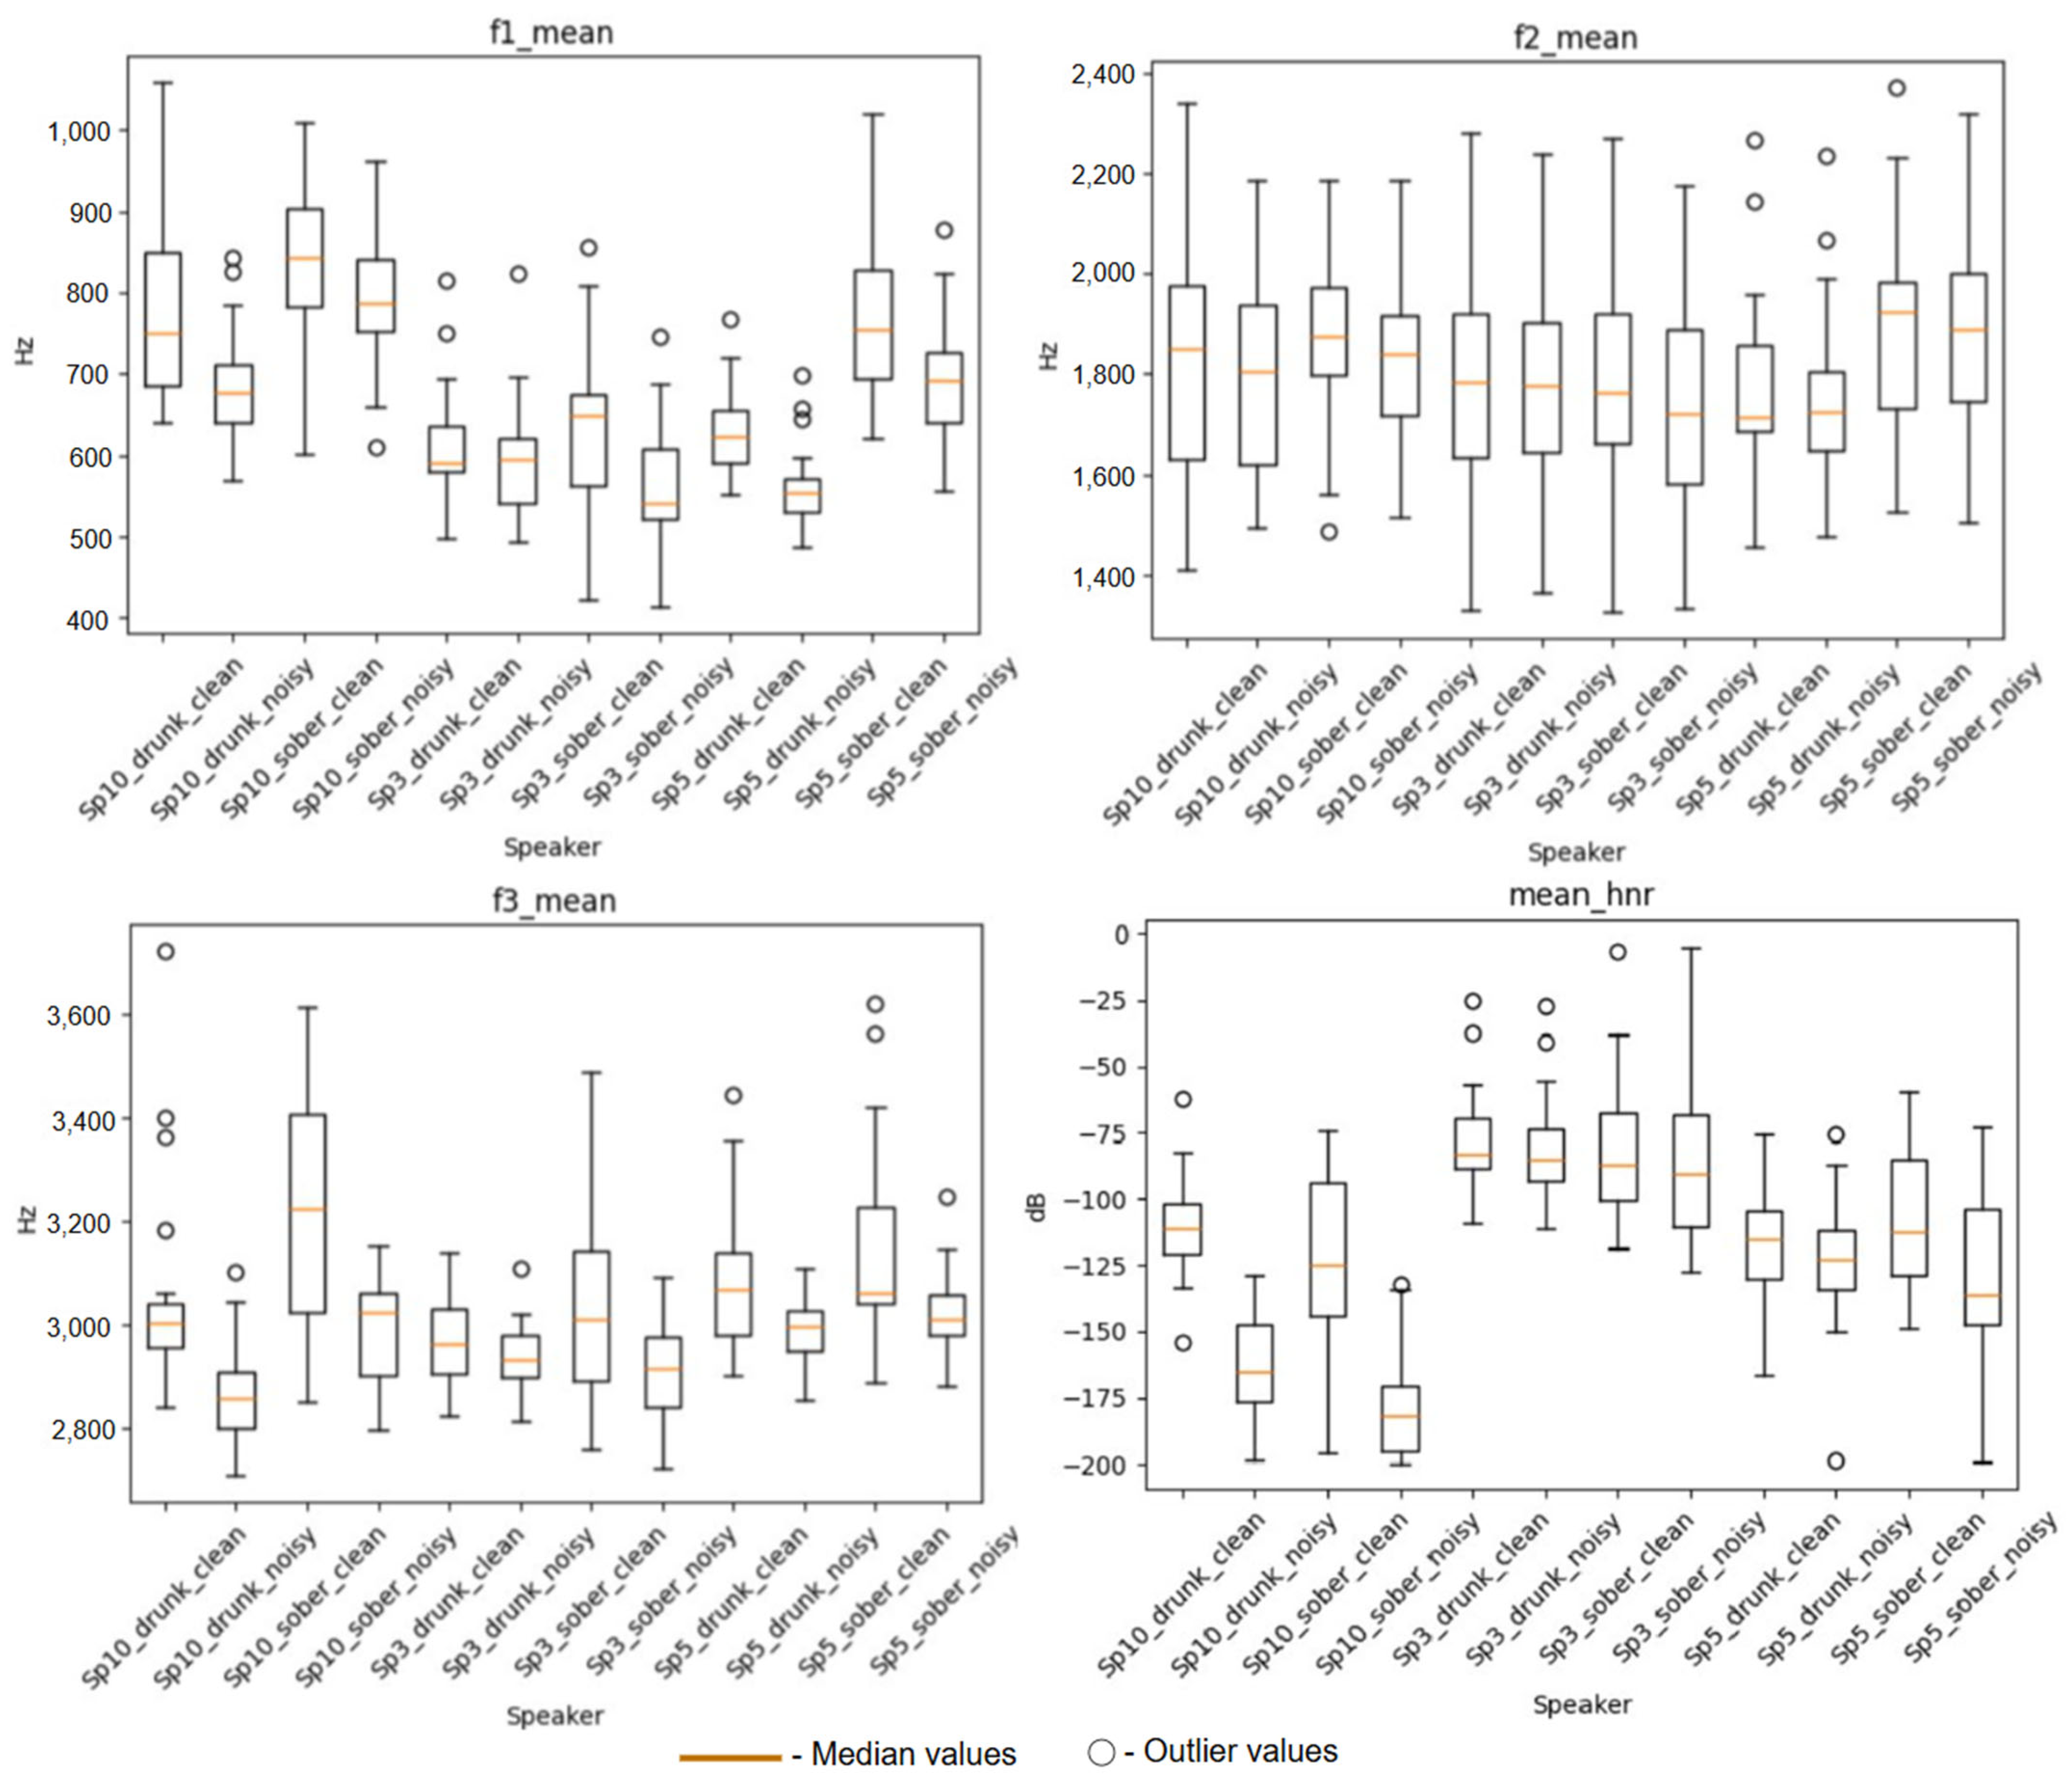
However, upon deeper analysis of parameters such as speech pitch, formants, and HNR, changes in the distributions of these parameter values for individual speakers can be observed. These changes are demonstrated in Figure 5. In particular, the greatest changes are observed among formants and HNR, each of which can be a significant indicator for determining various speaker states. Thus, in the previously described approach [33], the authors used IHNL-ANN in combination with HNR, achieving an accuracy of 99% in determining intoxication. However, clearing the signal of additional noise can also improve the characteristics of individual sounds and speech parameters, which in turn can, conversely, lead to an increase in classification accuracy [40].
Figure 5.
Comparison of speech characteristics before and after noise suppression.
Feature extraction was performed using Mel-Frequency Cepstral Coefficients (MFCCs), a widely used parameterization method that reflects the characteristics of the vocal tract and is effective in speech recognition, speaker state detection, and deepfake analysis [41].
MFCCs are extracted as follows:
- The audio recording is divided into a specified number of segments of variable length;
- For each segment, MFCCs are calculated at a rate of 128 coefficients per sliding window step, as follows:
- 2.1.
- In a 40 ms sliding window, 128 MFCCs are calculated;
- 2.2.
- The sliding window is shifted by 20 ms, after which the coefficient calculation process is repeated;
- 2.3.
- The sliding window continues to traverse the segment of the audio recording until it is completely processed;
- The MFCCs for each segment are normalized to their median values to normalize the dimensionality of the input data;
- The final two-dimensional array for the audio recording with the dimension (seg, n_mfccs) is returned, where seg is the number of segments into which the audio recording is divided, and n_mfccs is the number of allocated mel-frequency cepstral coefficients.
For instance, if seg equals 5 and each recording produces 128 MFCCs, then across 1300 recordings the resulting dataset would have the shape (1300, 5, 128), corresponding to 6500 segments and about 832,000 analyzed elements. Each segment was labeled according to the speaker’s state (sober or intoxicated) for binary classification or according to BAC for regression experiments. The proposed approach of segmentation and median normalization also can help to preserve potential patterns of temporal symmetry and detect asymmetric deviations in frequency response caused by intoxication.
Using described segments allows the model to generalize across speech constructions of varying complexity, including individual syllables, words, and full phrases. We hypothesize that analyzing more complex structures with fewer segments may improve the performance of the neural network model. This hypothesis is based on the ability to independently identify and integrate hidden patterns for structures of varying complexity, such as analyzing both sounds and pause frequency in speech. However, it should be noted that this approach limits its potential application, as accurate analysis may require the use of a strictly limited set of phrases. The number of segments varied from 1 to 10, which corresponds to approximate segment durations of 0.4–1.6 s for seg = 10, duration of 2–8 s for seg = 2, and duration of 4–16 s for seg = 1.
Although classification is performed per segment, the final decision regarding the speaker’s state is derived from aggregated analysis of all segments using statistical functions such as mean, median, or mode. This approach improves robustness and allows flexible threshold adjustment between the segment-level and recording-level predictions.
To ensure strict speaker independence, cross-validation was performed using the Leave-One-Speaker-Out (LOSO) strategy with 10 folds. In each iteration (fold), all recordings from a single speaker were reserved exclusively for validation, while data from the remaining speakers were used for training. This approach guarantees that the model is evaluated only on voices that were entirely unseen during training, thereby providing a reliable assessment of its generalization capability across different speakers. Moreover, the LOSO strategy minimizes the risk that the model relies on speaker-specific acoustic traits, such as timbre or habitual speaking style, rather than on alcohol-related speech distortions. As a result, the training process is focused on learning stable and reproducible markers of alcohol intoxication that are common across speakers, which allows a more objective analysis of intoxication-related speech features and improves the applicability of the proposed method to real-world scenarios involving previously unknown speakers.
5. Recurrent Neural Network for Determining the State of Speaker
The proposed neural network model consists of three primary components: a convolutional block based on one-dimensional convolutional layers (1D-CNN), a recurrent block based on long short-term memory (LSTM) [42] units, and a fully connected block used for final classification. This structure makes it possible to extract local spectral patterns from MFCCs sequences and to model long-term temporal relationships across dynamic-length segments.
The overall architecture is presented in Table 2, which illustrates the sequential arrangement of the convolutional, recurrent, and dense layers as well as detailed hyperparameters. The model architecture was developed by modifying the VGG16 neural network [43,44]. In contrast to classical architectures, the present design uses 1D convolutional layers with kernel size of 3 × 3 that process temporal MFCC sequences instead of 2D spectrograms. In this architecture, convolutional filters ensure a symmetric analysis of local spectral regions, while recurrent connections introduce sensitivity to temporal asymmetries characteristic of intoxicated speech. The fully connected layers transform the LSTM output into final predictions representing the probability that a given speech segment belongs to the intoxicated class with the sigmoid function.
Table 2.
Detailed hyperparameters of the proposed hybrid CNN-LSTM architecture.
Training of the neural network was carried out under different audio processing conditions, specifically as follows: the number of segments into which each audio recording was divided varied within the range seg ∈ [1,10], and both the original unprocessed recordings and the original recordings cleaned of background noise and extraneous sounds were used. Varying these conditions during training made it possible to analyze the behavior of the neural network in greater depth and to identify experimentally the most effective method for preprocessing audio recordings.
Model training was performed using the Adam optimizer with a learning rate of 10−5. The loss function was mean absolute error (MAE), which has been successfully applied in related speech classification tasks [45]. Training was performed for up to 500 epochs, although the training process typically converged earlier because early stopping was applied. If the validation loss did not improve for 20 consecutive epochs, training was stopped and the best model parameters were restored using model checkpointing.
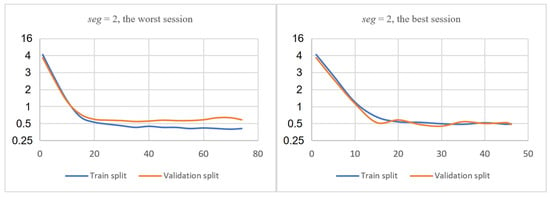
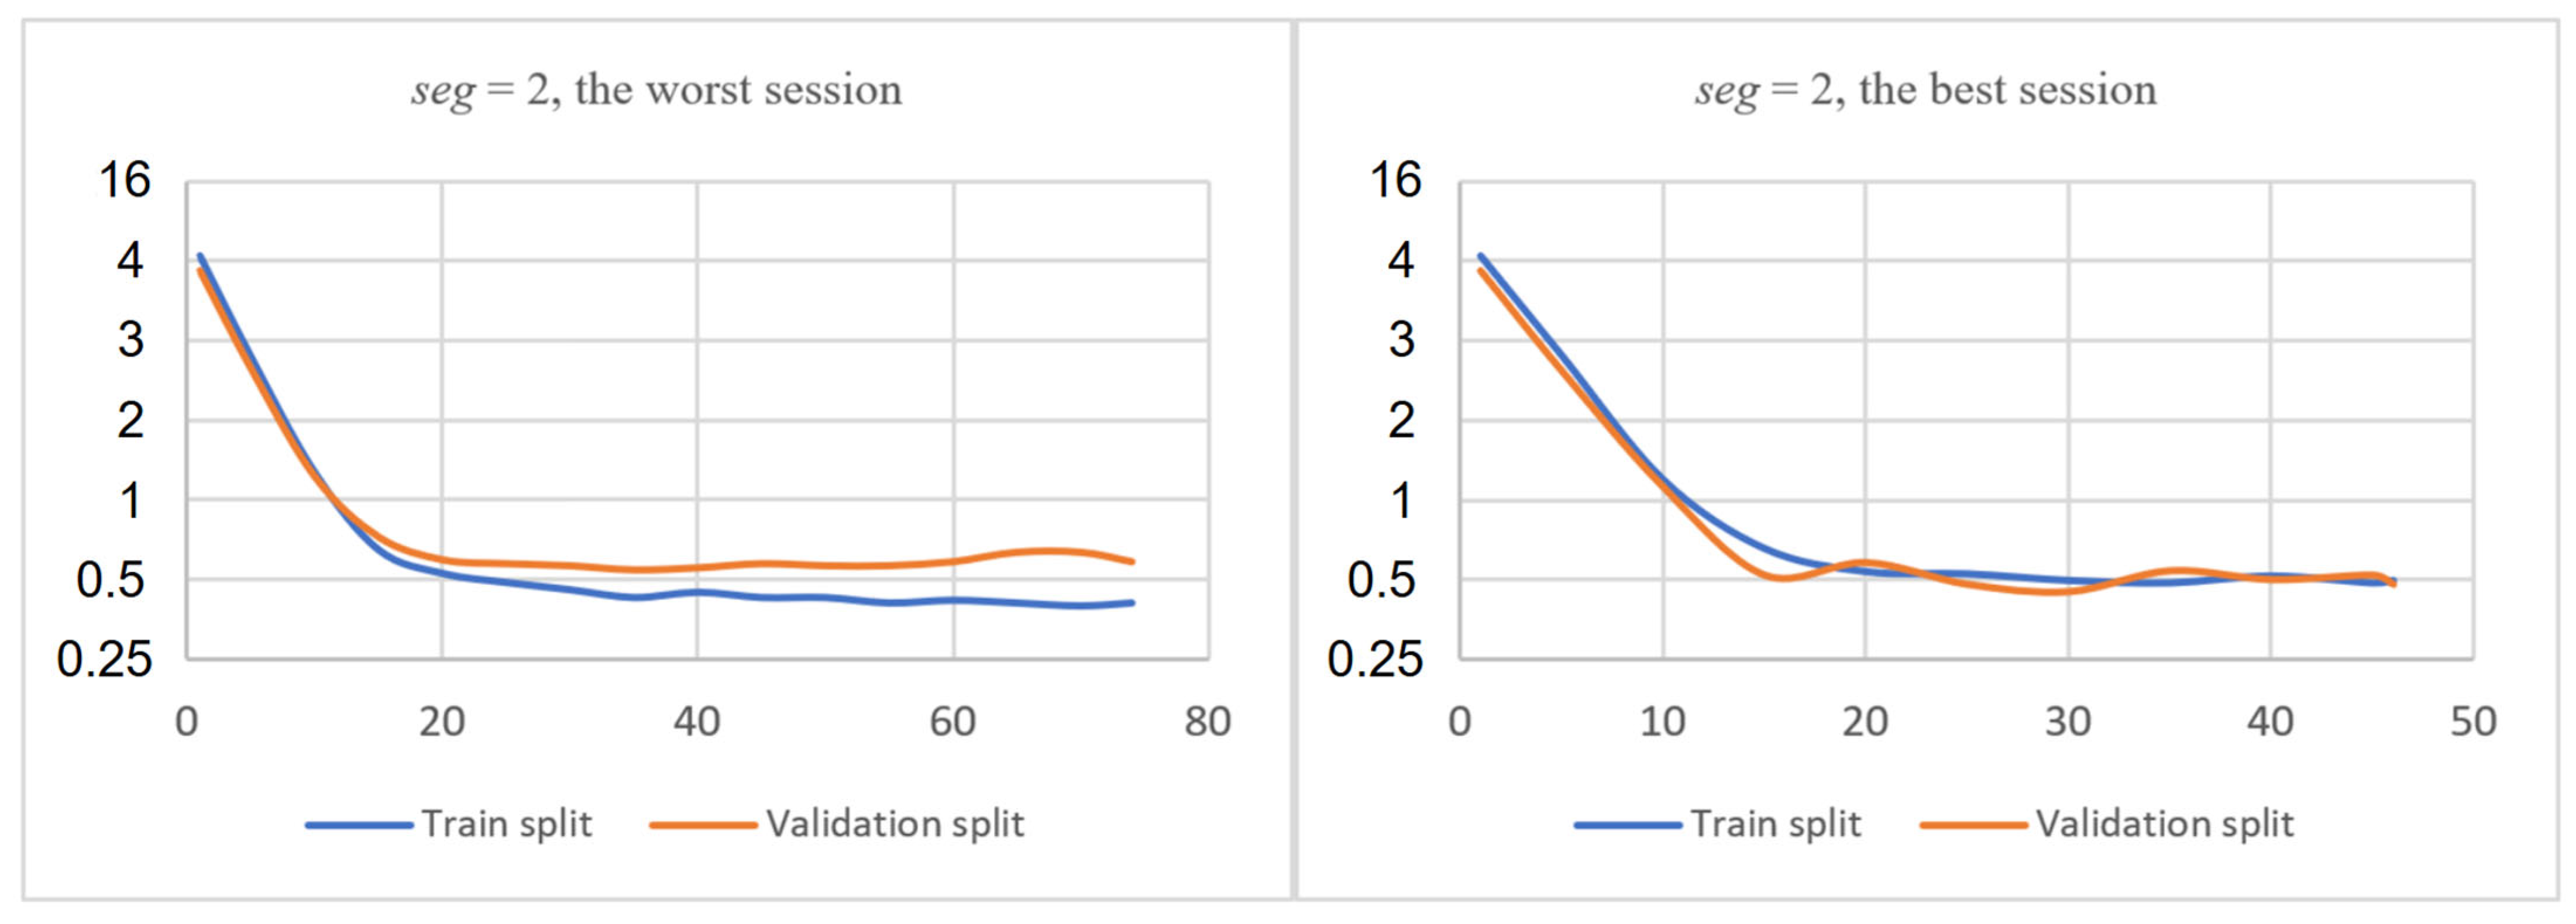
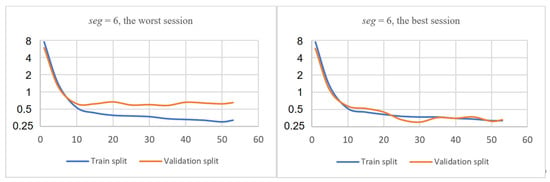
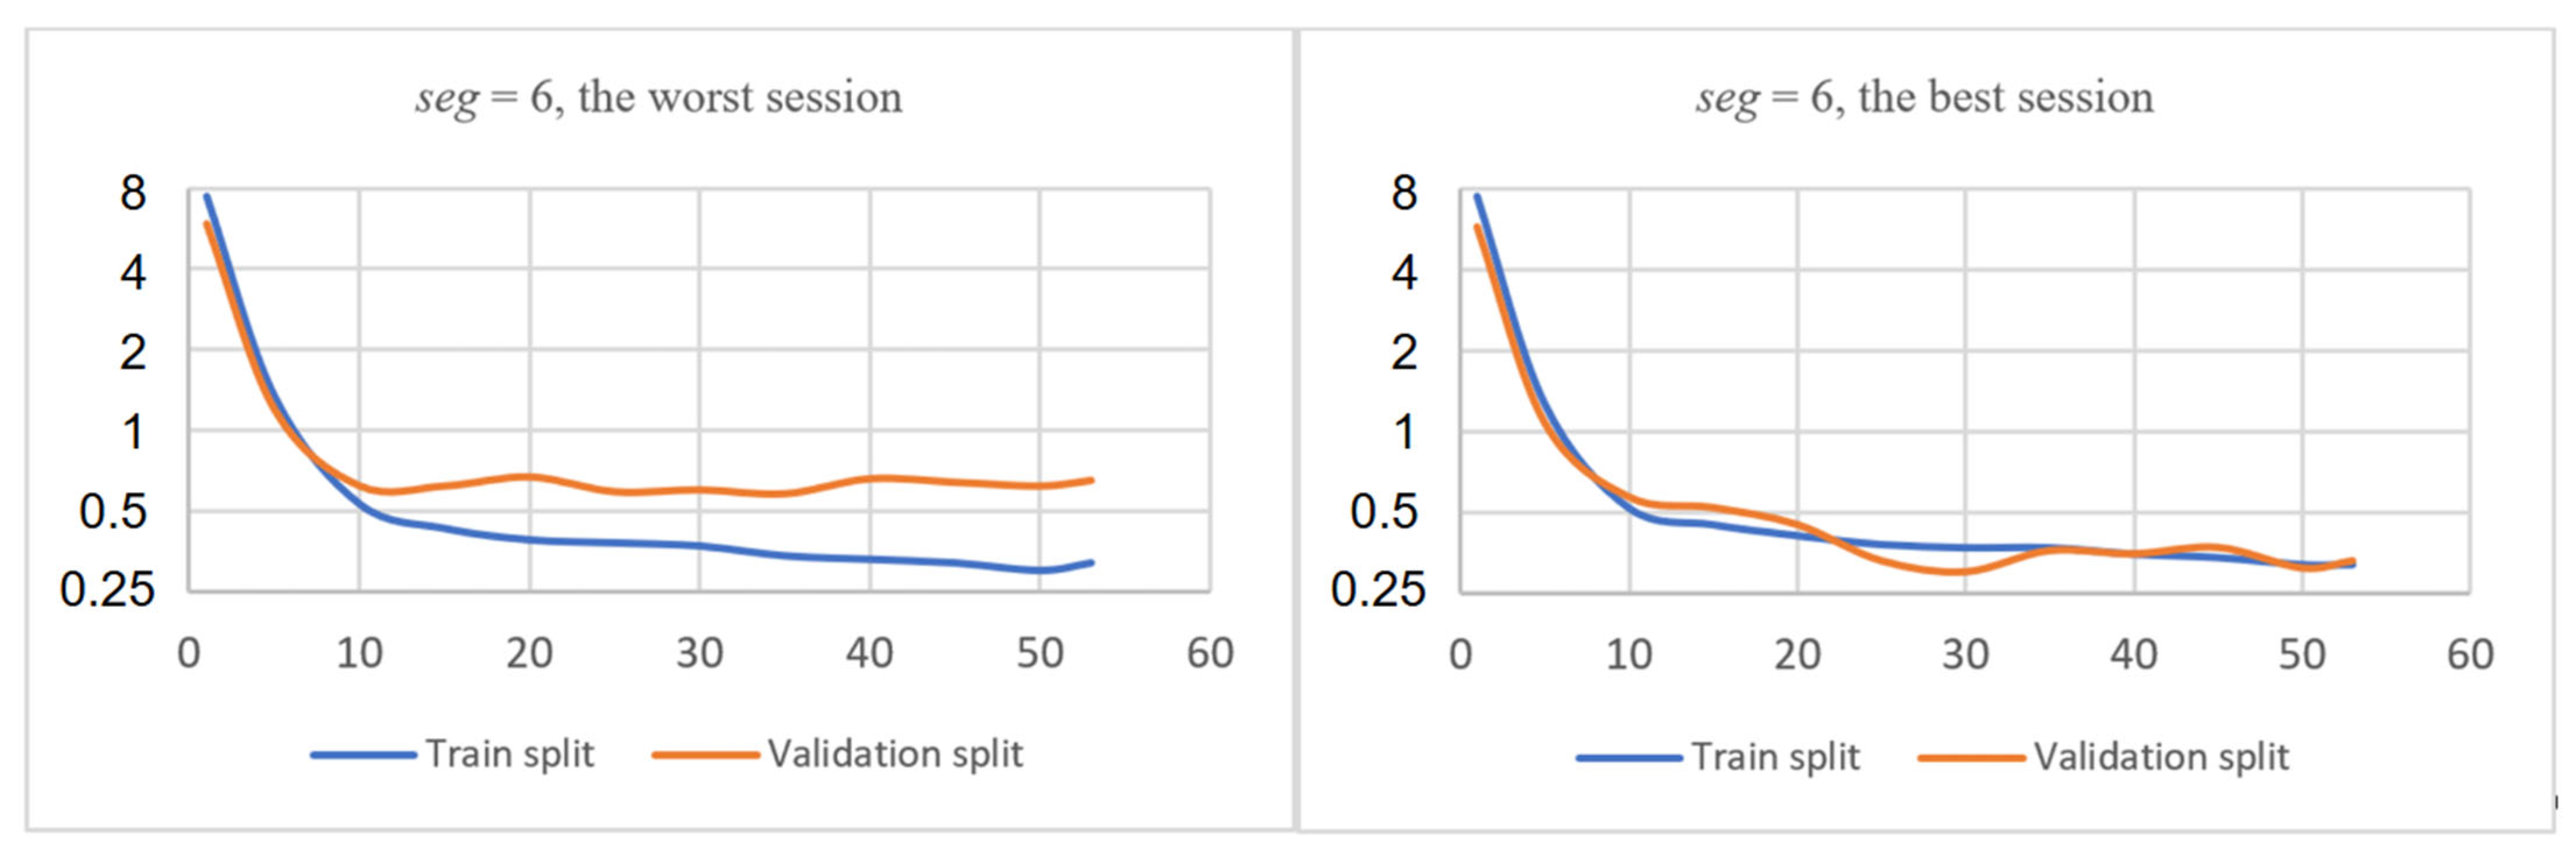
The training and validation loss curves are presented in Figure 6 and Figure 7. Figure 6 shows the loss curves for the configuration with two segments, and Figure 7 presents the curves for six segments. The graphs demonstrate that overfitting becomes more pronounced when the number of segments increases. This may be due to the fact that shorter segments allow for the analysis of simpler speech structures, namely individual sounds. However, since different sounds change to varying degrees during alcohol intoxication, and the ratio of sonorants and vowels, which are most likely to change, to other sounds and silence during pauses is unbalanced, this may lead to overfitting of the model.
Figure 6.
Training and validation loss values for the configuration with seg = 2.
Figure 7.
Training and validation loss values for the configuration with seg = 6.
A quantitative comparison of training and validation losses for all segmentation configurations is provided in Table 3 and Table 4. Table 3 contains results for the dataset that includes background noise, while Table 4 contains results for the dataset after noise reduction. These tables demonstrate that the configuration with two segments produces the most stable and consistent loss values, whereas configurations with six or more segments lead to increased overfitting and higher variance in validation loss.
Table 3.
Training and validation loss for noisy recordings.
Table 4.
Training and validation loss for cleaned recordings.
6. Results
6.1. Evaluation Metrics
Classic classification metrics were used to evaluate the model’s quality: Accuracy (Acc), Recall (Rec), and F1-score (F1). These metrics allow for a detailed analysis of the overall performance of the neural network, as well as a focus on Type I and Type II errors. Type I errors in this problem are defined as situations where the model classifies a sober speaker as intoxicated. Type II errors are situations where the model, conversely, classifies an intoxicated speaker as sober.
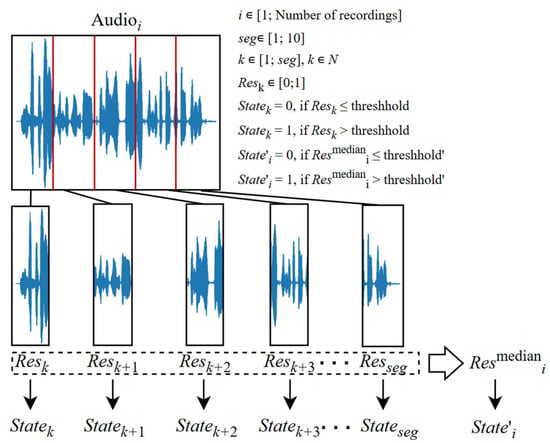
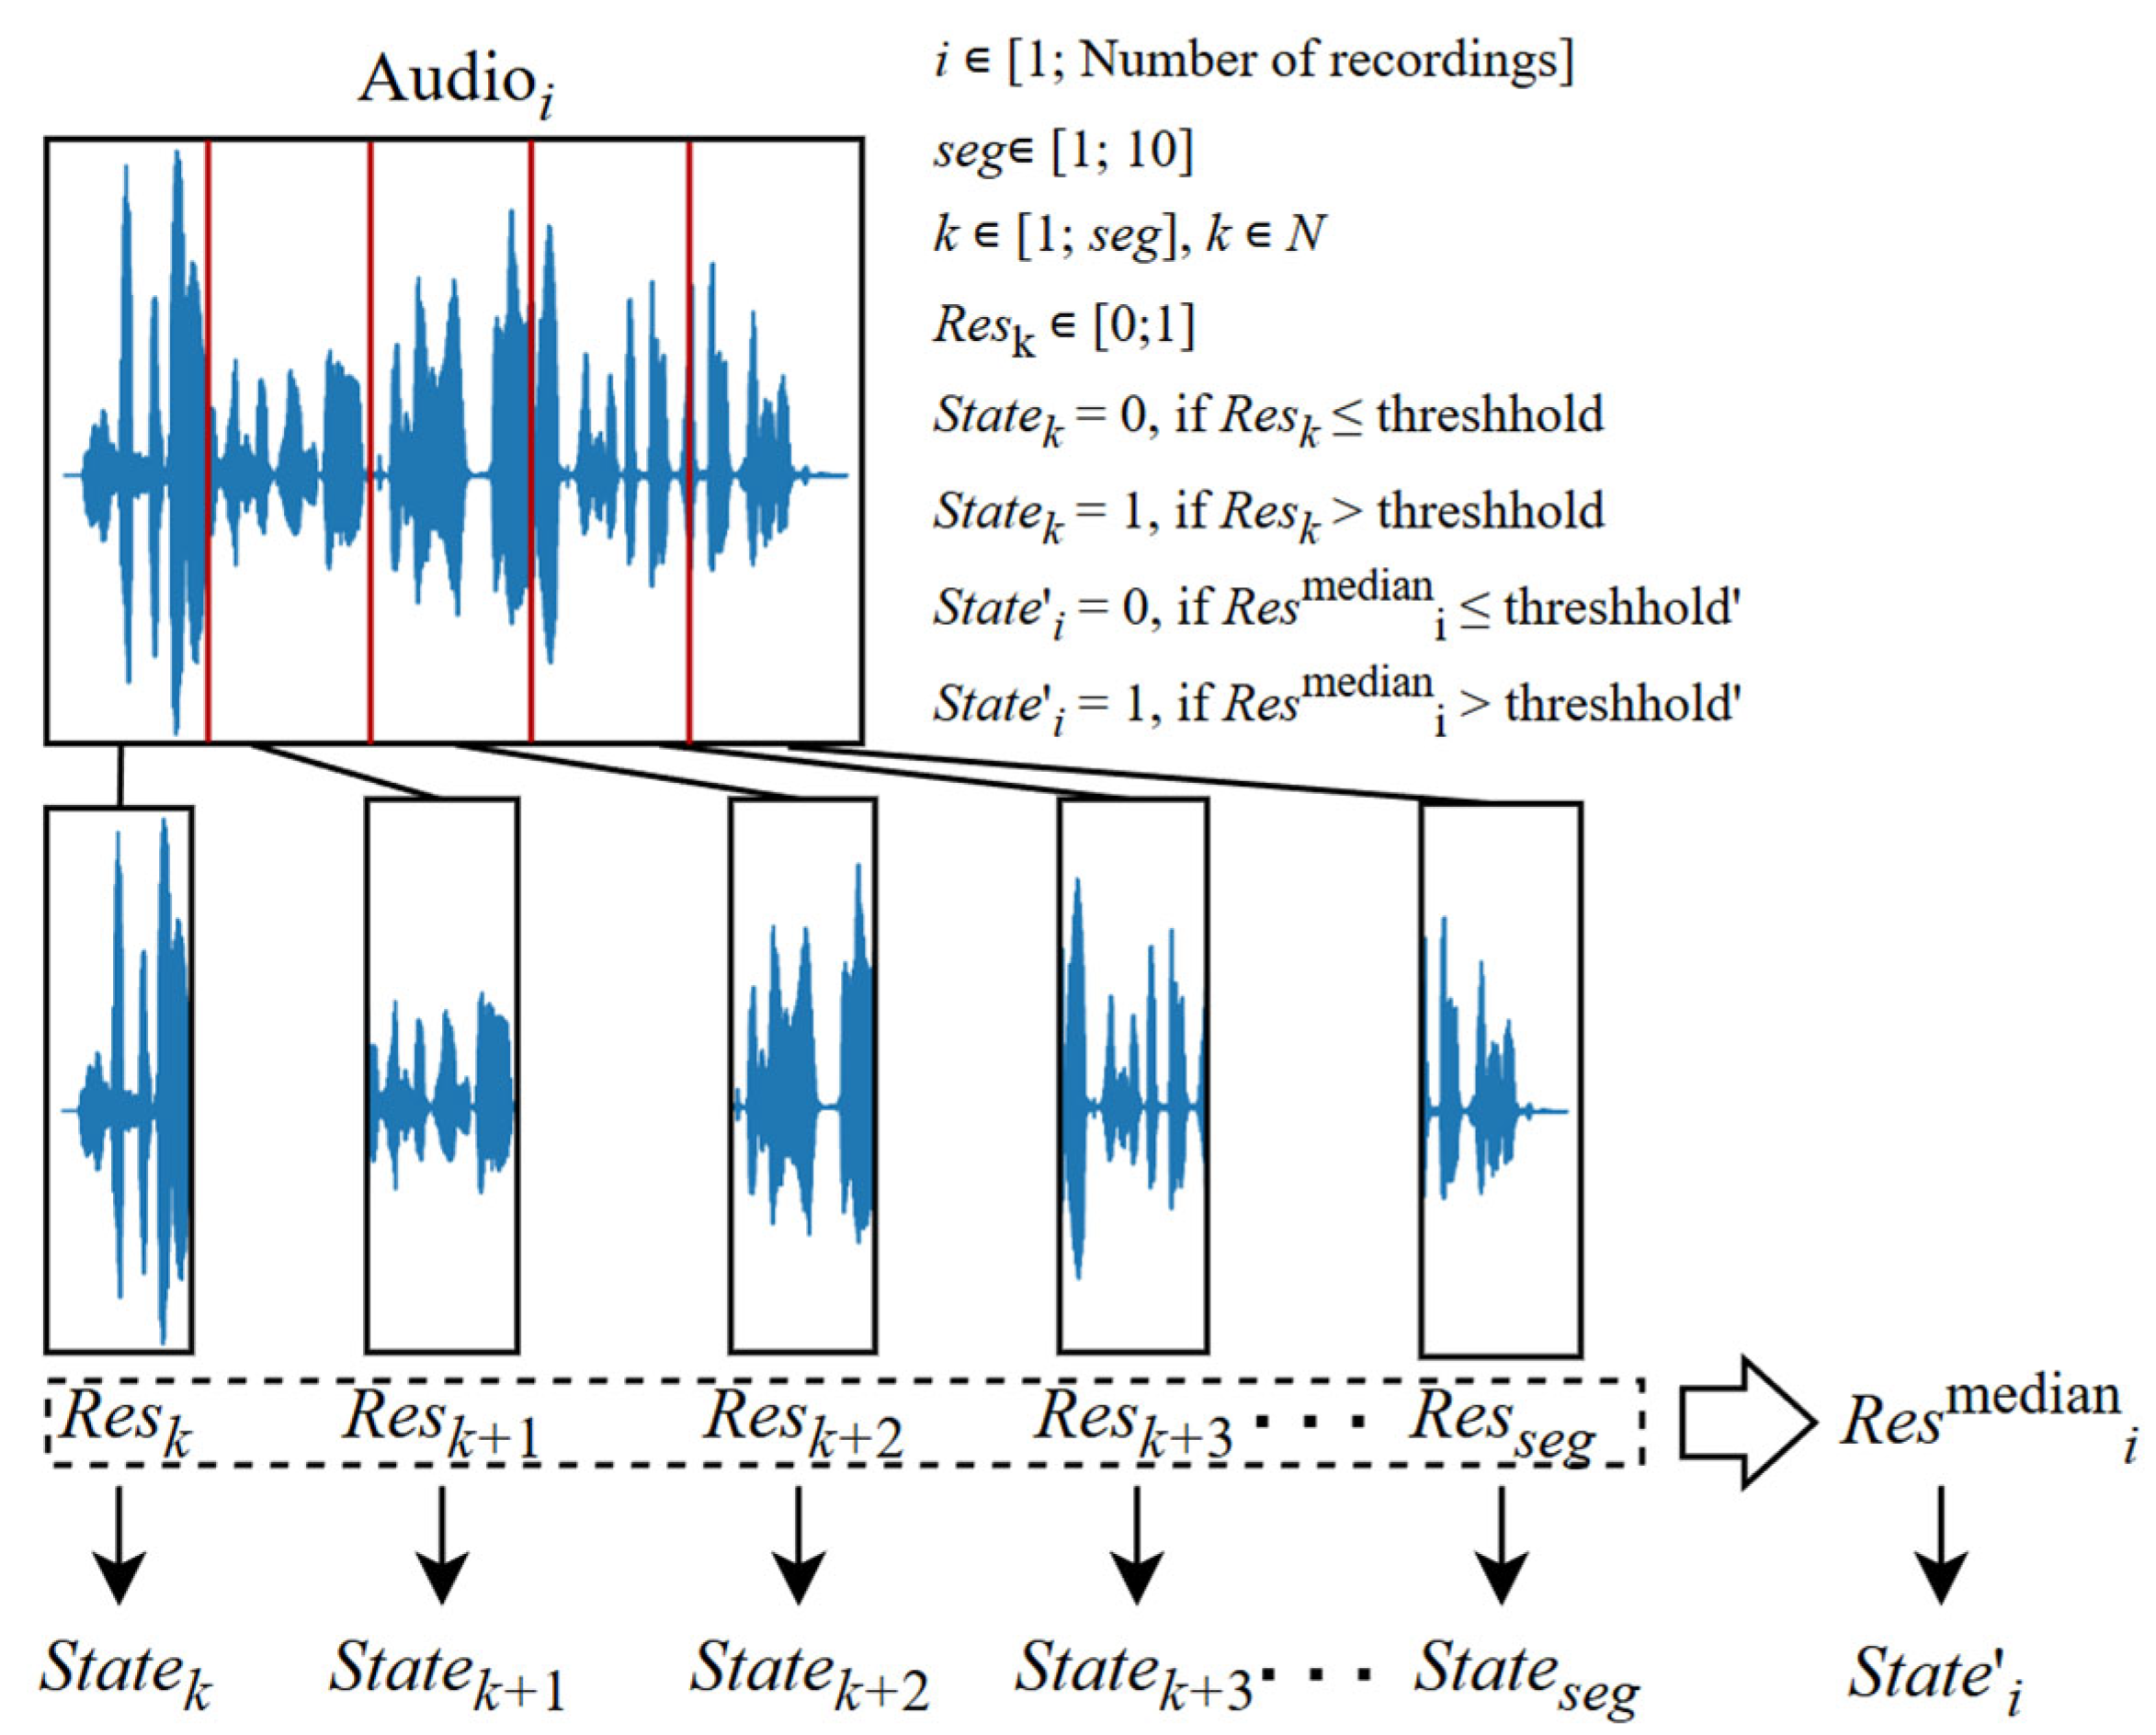
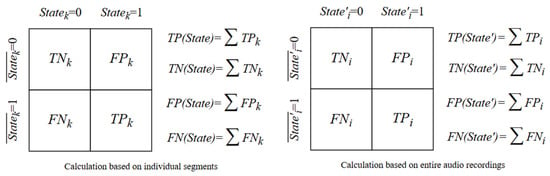
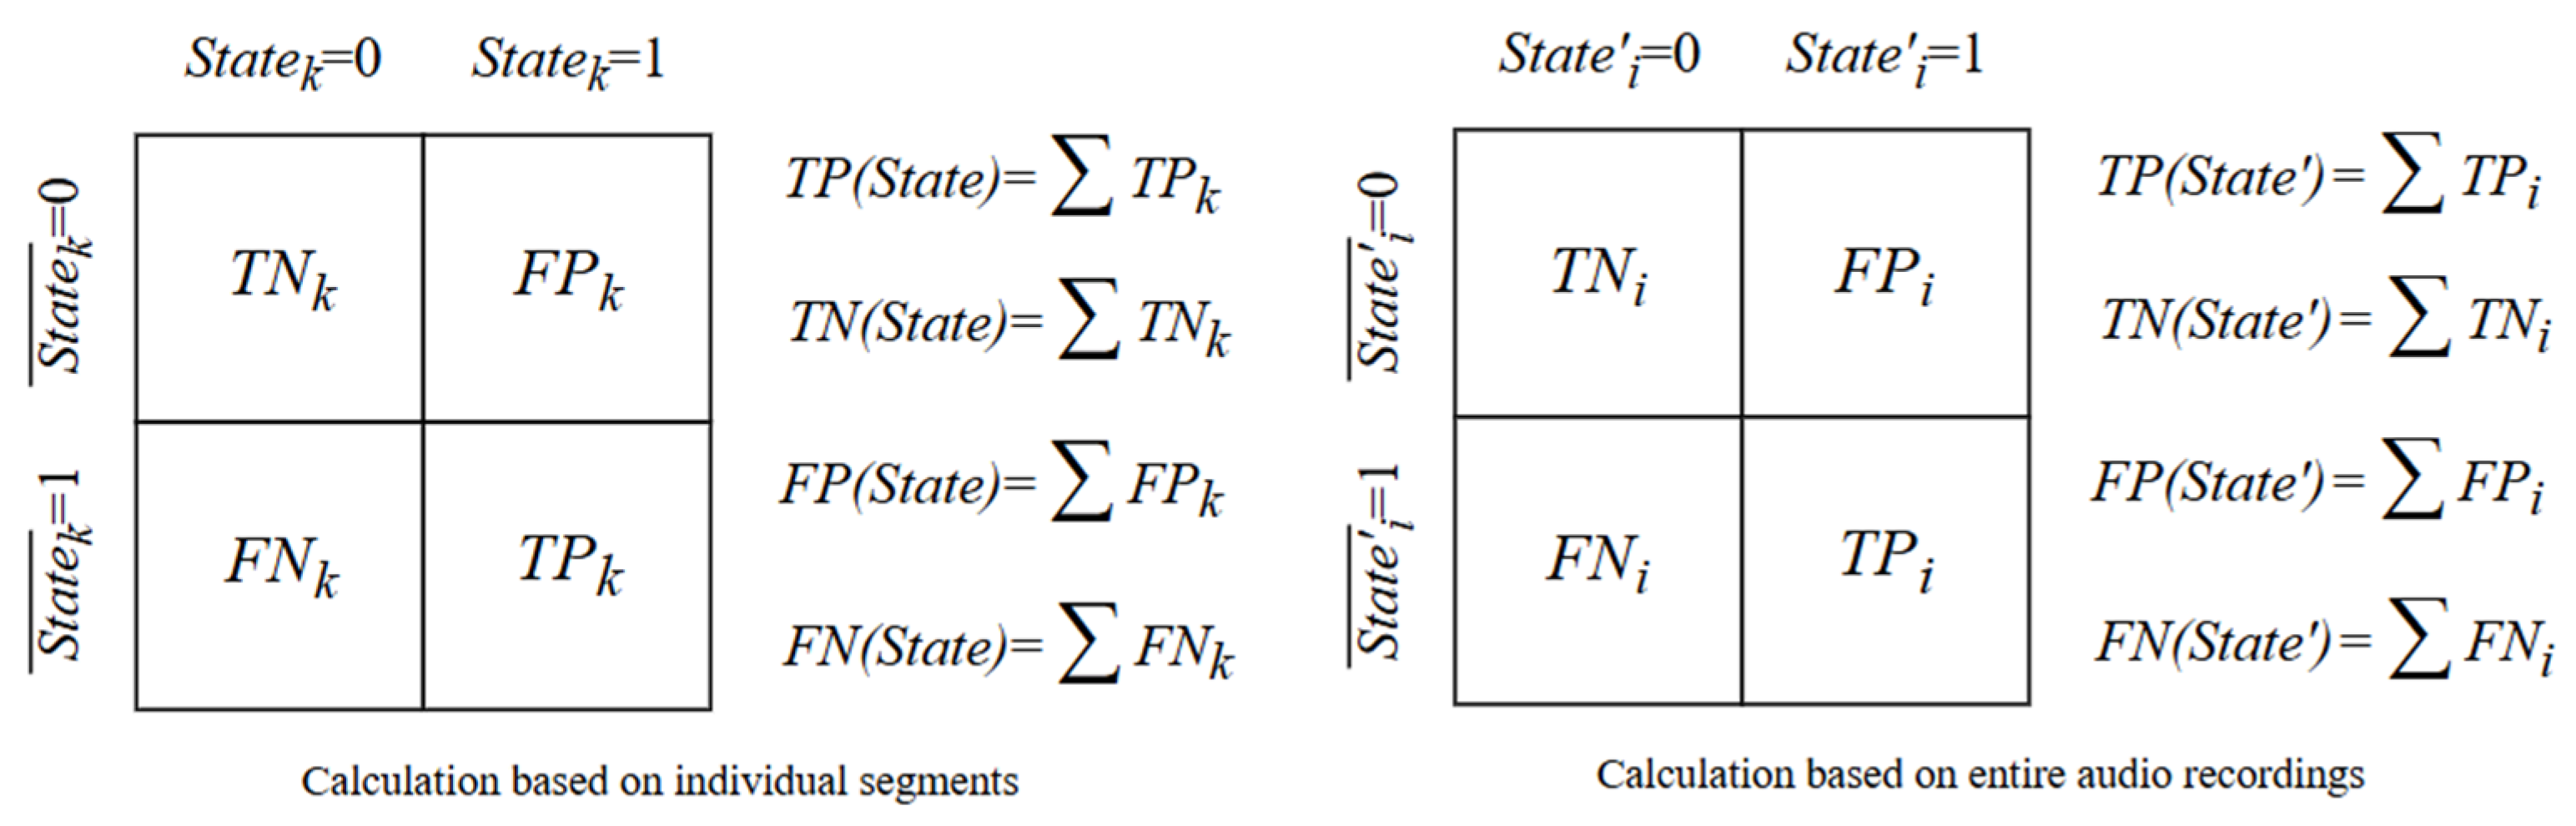
It is important to note the difference in the methods for calculating quality metrics. The Acc, Rec, and F1 metrics are calculated for each individual segment. This means that the evaluation is performed at the level of each segment into which the original recording was divided. Meanwhile, the Acc′, Rec′, and F1′ metrics that we propose for use in this study are calculated for the entire audio recording. Their values are derived from the median values of the corresponding metrics (Acc, Rec, F1), precalculated for all segments of the recording. The median values for calculating the Acc′, Rec′, and F1′ metrics were chosen because the results of the analysis of individual segments may not be symmetrical, and therefore the average value may lead to an underestimation or overestimation of the probability of the speaker being in a state of alcoholic intoxication. Figure 8 demonstrates approach of determining two types of speaker’s state—speaker’s state in individual segment and speaker’s state in whole recording. Figure 9 demonstrates the calculation of standard types of predictions using confusion matrices for both individual segments and entire audio recordings. Equations (1)–(6) demonstrate the formulas for calculating all the metrics used in this study to evaluate the quality of the model’s performance. This approach allows us to evaluate the model’s final accuracy not only at the level of individual fragments but also when making decisions about the entire recording, which better reflects the practical task.
where i is the number of the audio recording being analyzed,
Figure 8.
Examples of prediction probability distributions for two recordings.
Figure 9.
Illustration of confusion matrix categories.
k is the number of the segment being analyzed from the audio recording,
TP—True Positive result,
TN—True Negative result,
FP—False Positive result,
FN—False Negative result,
Resk is the model prediction for a single segment of the audio recording,
Resmediani is the median value of all predictions for the segment of the i-th audio,
State is the set of binary speaker states based on individual segment,
State′ is the set of binary speaker states based on entire audio recordings.
6.2. Impact of Segmentation Strategy on Model Performance
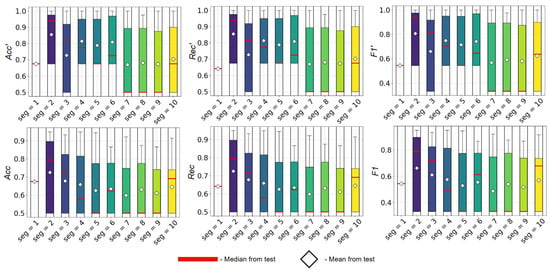
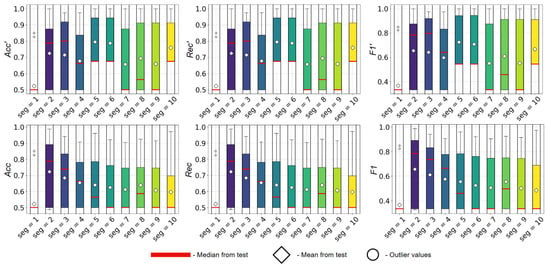
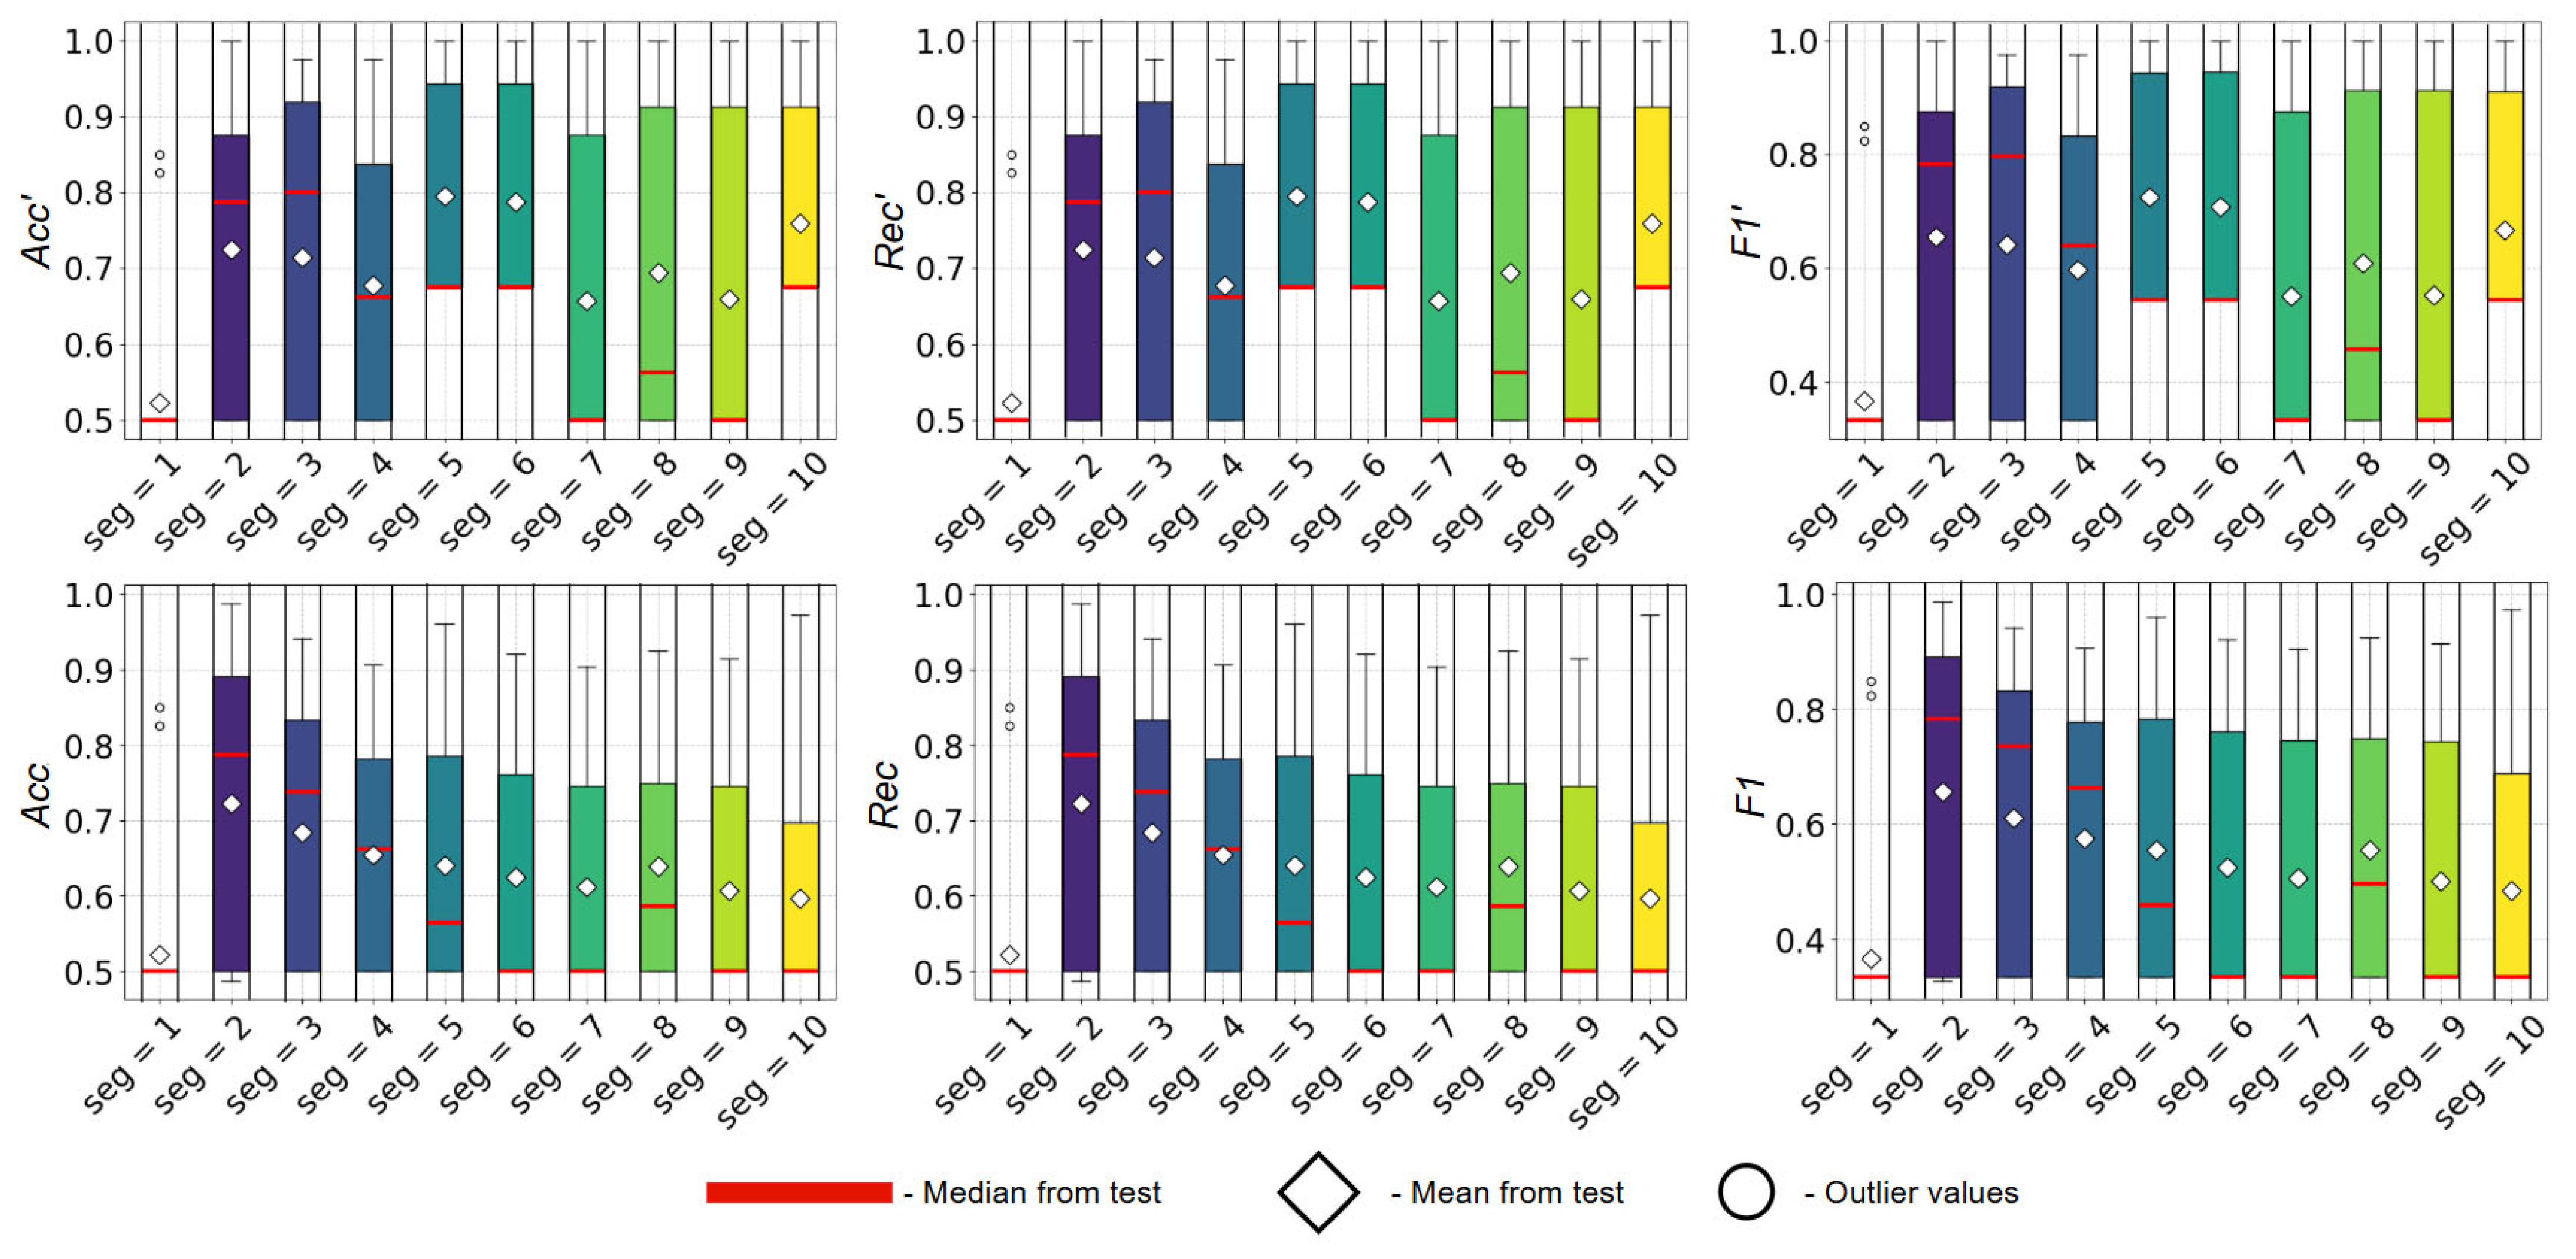
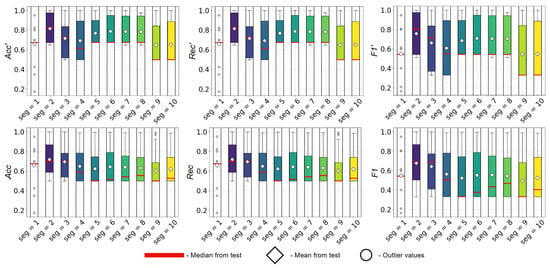
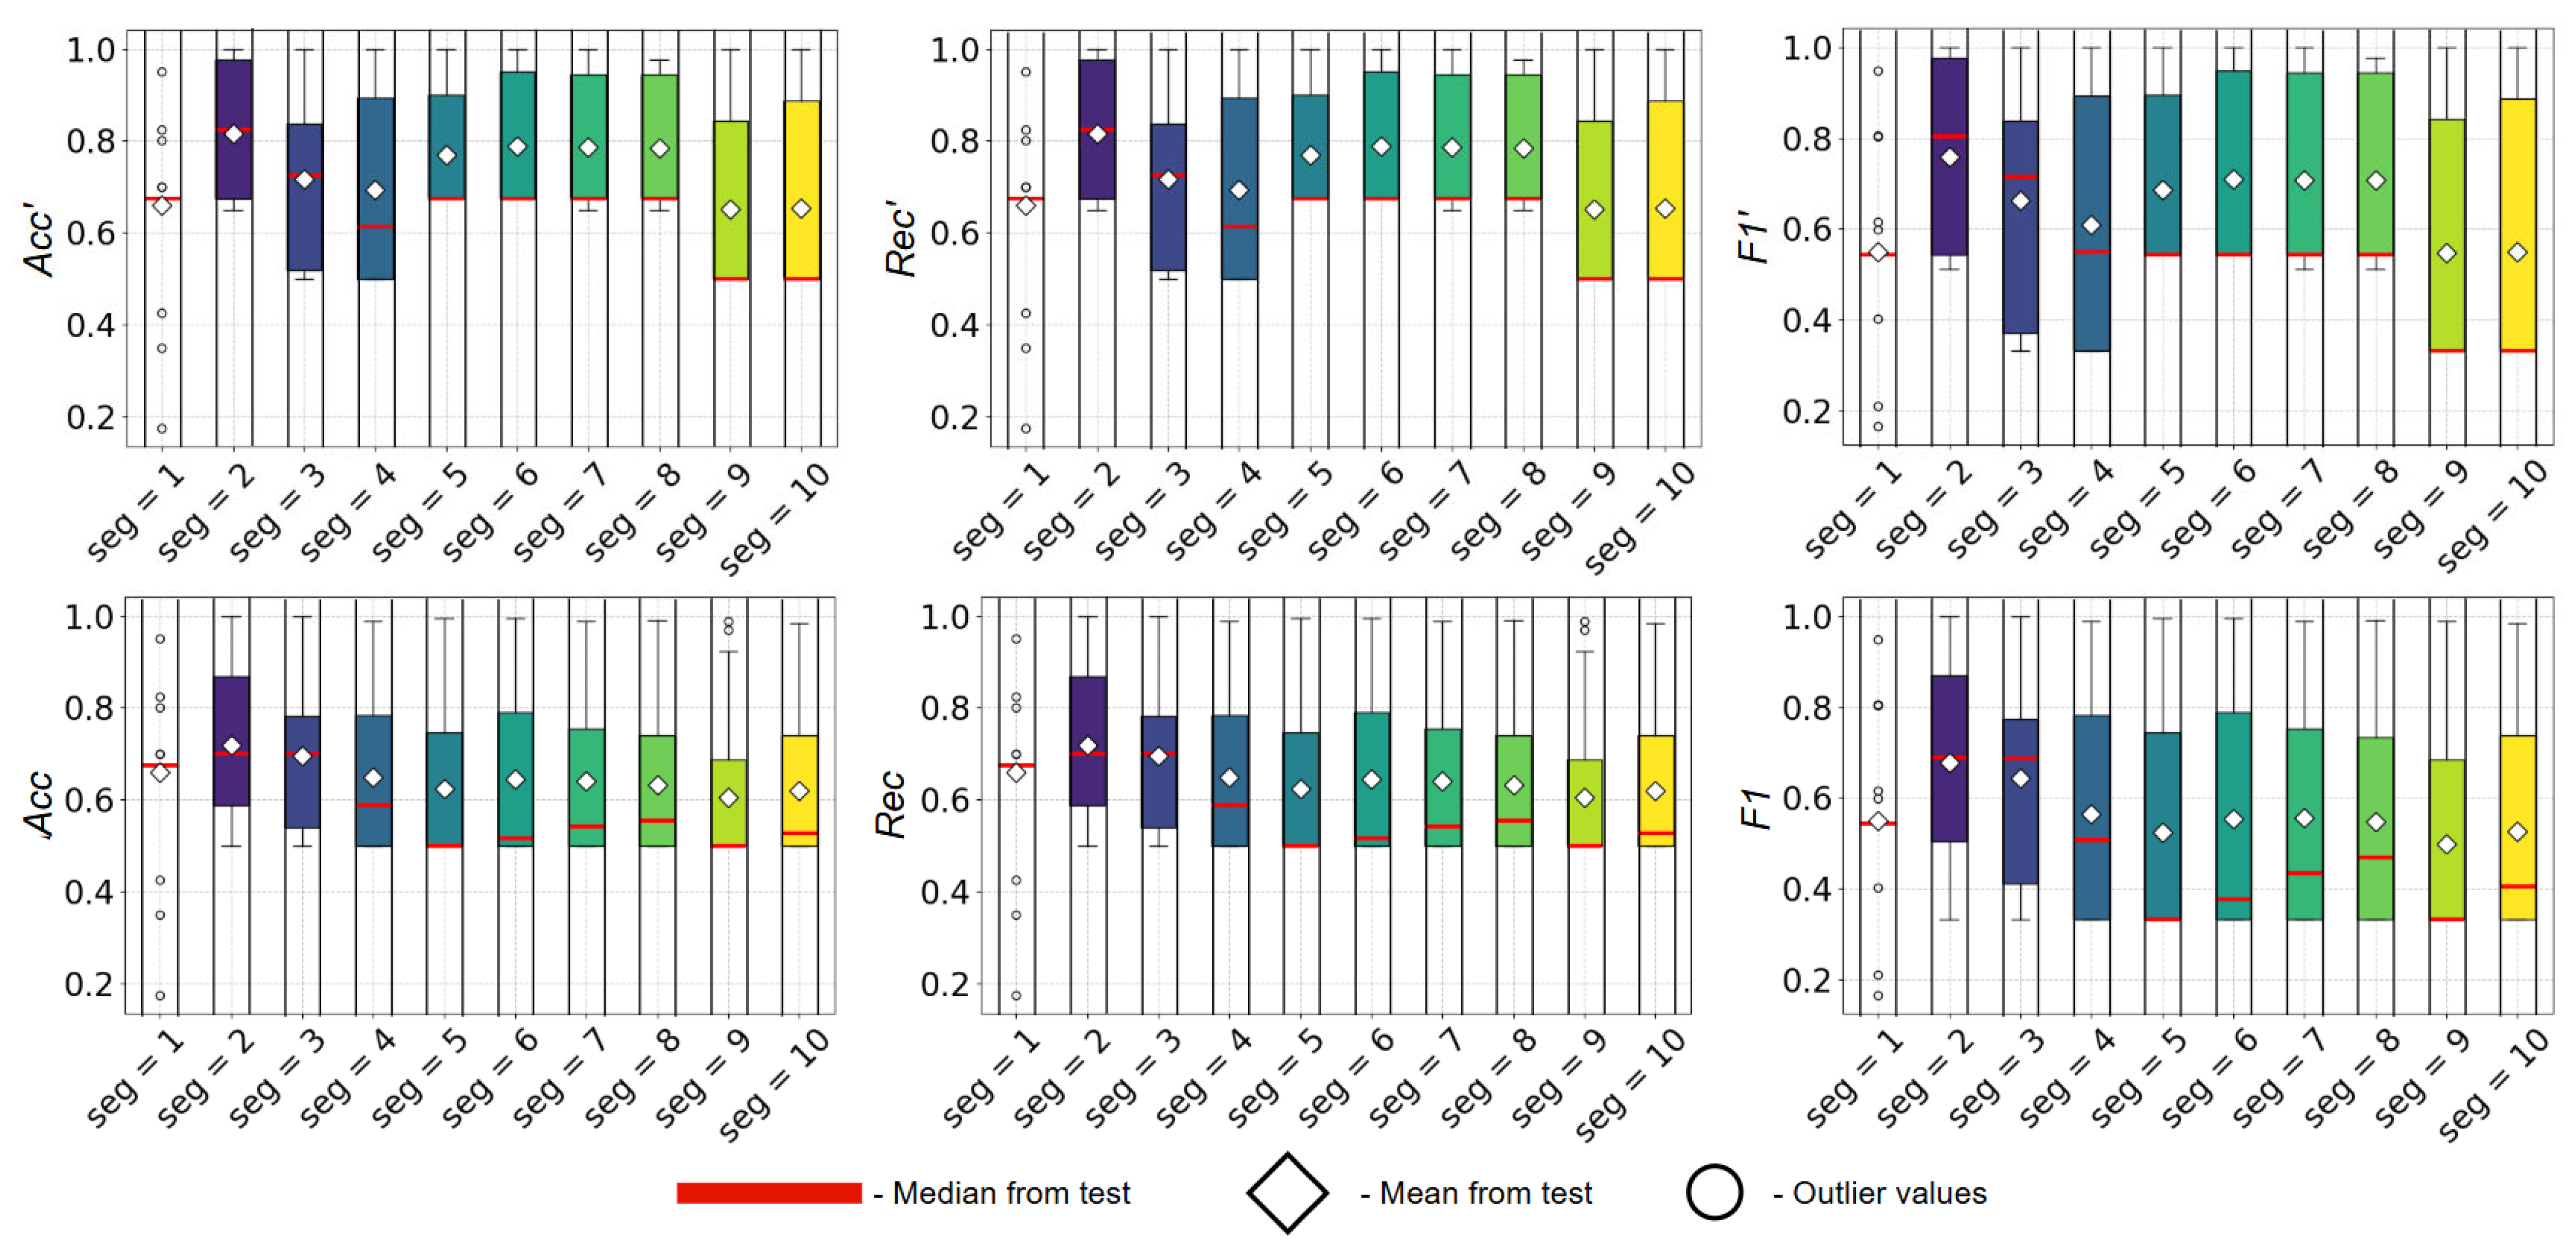
A comprehensive evaluation of the proposed approach was conducted using the defined metrics at the segment level (Acc, Rec, F1) and their corresponding variants for whole-recording classification (Acc′, Rec′, F1′). Aggregation for recording-level metric computation was performed using median pooling of the segment-level predictions. The evaluation results for different segmentation configurations, as well as for noisy and clean datasets, are presented in Figure 10 and Figure 11.
Figure 10.
Evaluation of the performance of trained models depending on the number of segments for noisy dataset.
Figure 11.
Evaluation of the performance of trained models depending on the number of segments for clean dataset.
During model assessment, primary emphasis was placed on the F1 and F1′ metrics due to the class imbalance present in the dataset. Based on the obtained results, several observations can be made. First, the trained models exhibit instability in recording-level decision making, manifested by the absence of a linear relationship between performance metrics and the number of segments. This behavior may be attributed to an increased proportion of non-informative segments dominated by silence, as well as to an imbalance between informative and non-informative syllables and phonetic units as segment duration decreases. Second, the application of the DeepFilterNet model frequently leads to a degradation in performance. As discussed earlier, this effect may be caused by alterations in formant structure and HNR, as well as by an increase in fully silent regions, which collectively reduce model stability. Third, whole-recording analysis without segmentation (seg = 1) results in consistently low performance across all metrics. This phenomenon may be explained by excessive smoothing of local speech patterns and an increased focus on global pronunciation characteristics. Given that pronunciation quality varies across speakers due to individual articulation traits, such behavior is plausible.
Overall, these findings indicate the need for a more detailed analysis of the statistical distributions of both complex and simple speech features under different segmentation strategies and for recordings of varying duration.
6.3. Comparison of Hybrid and Independent Model Architectures
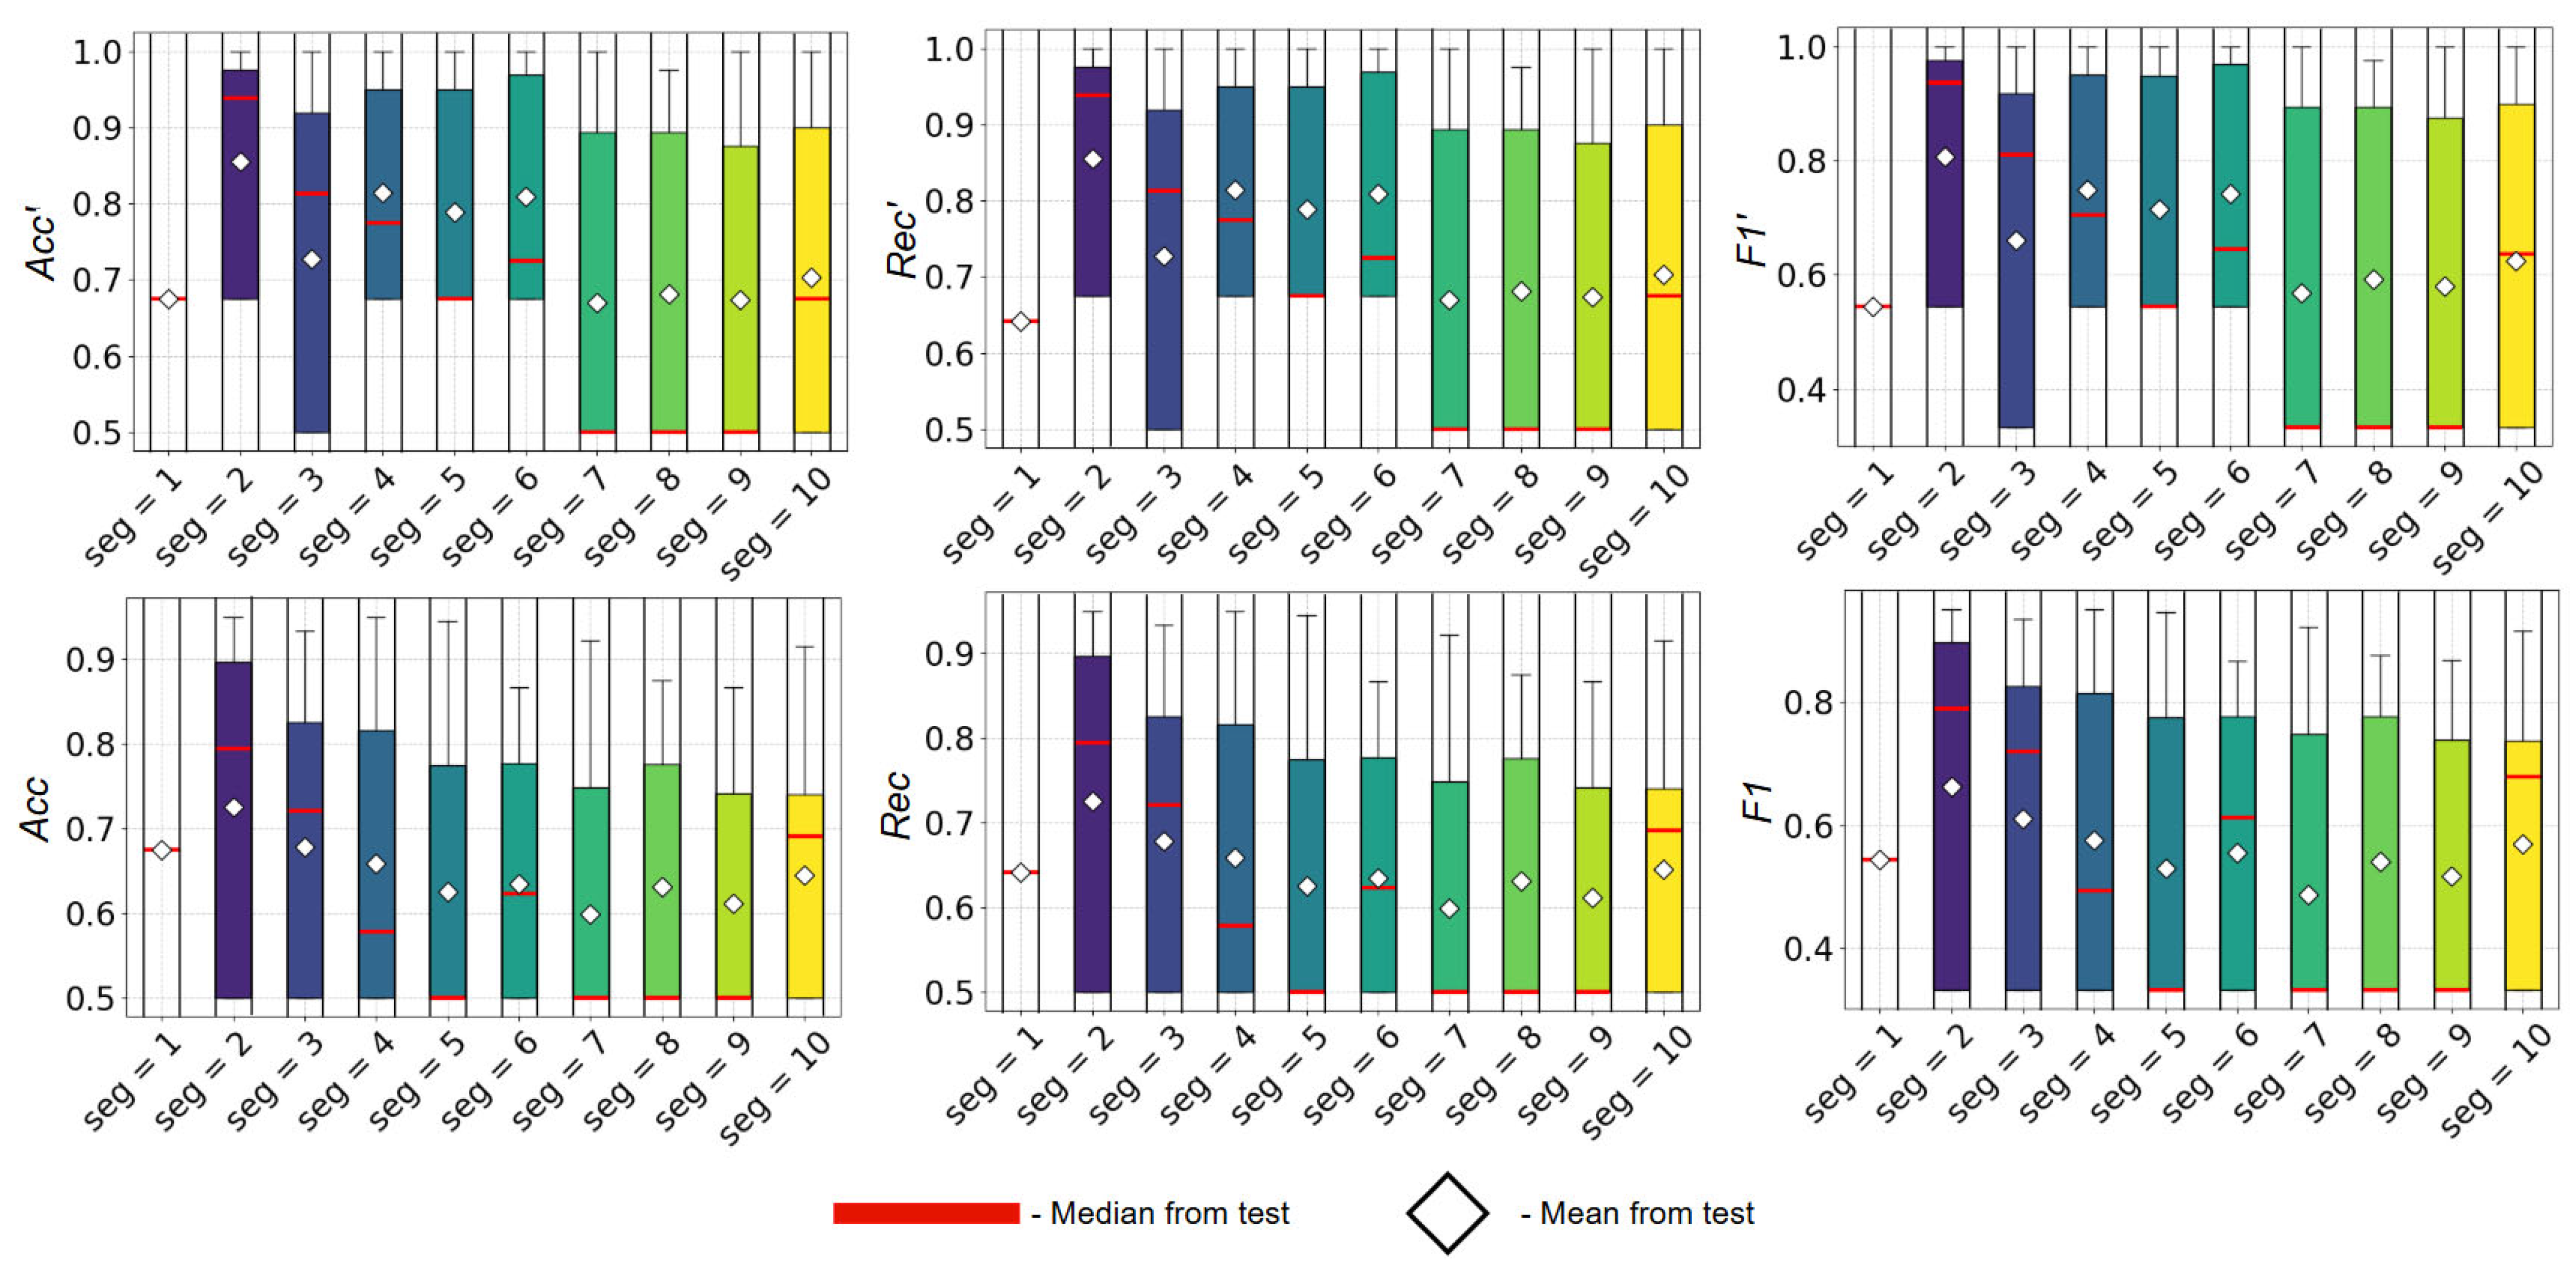
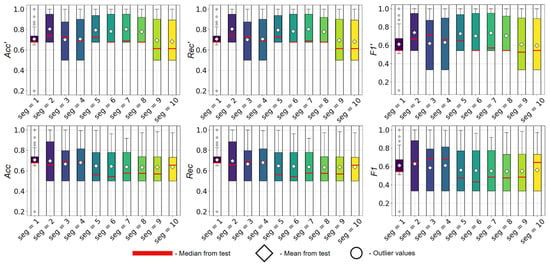
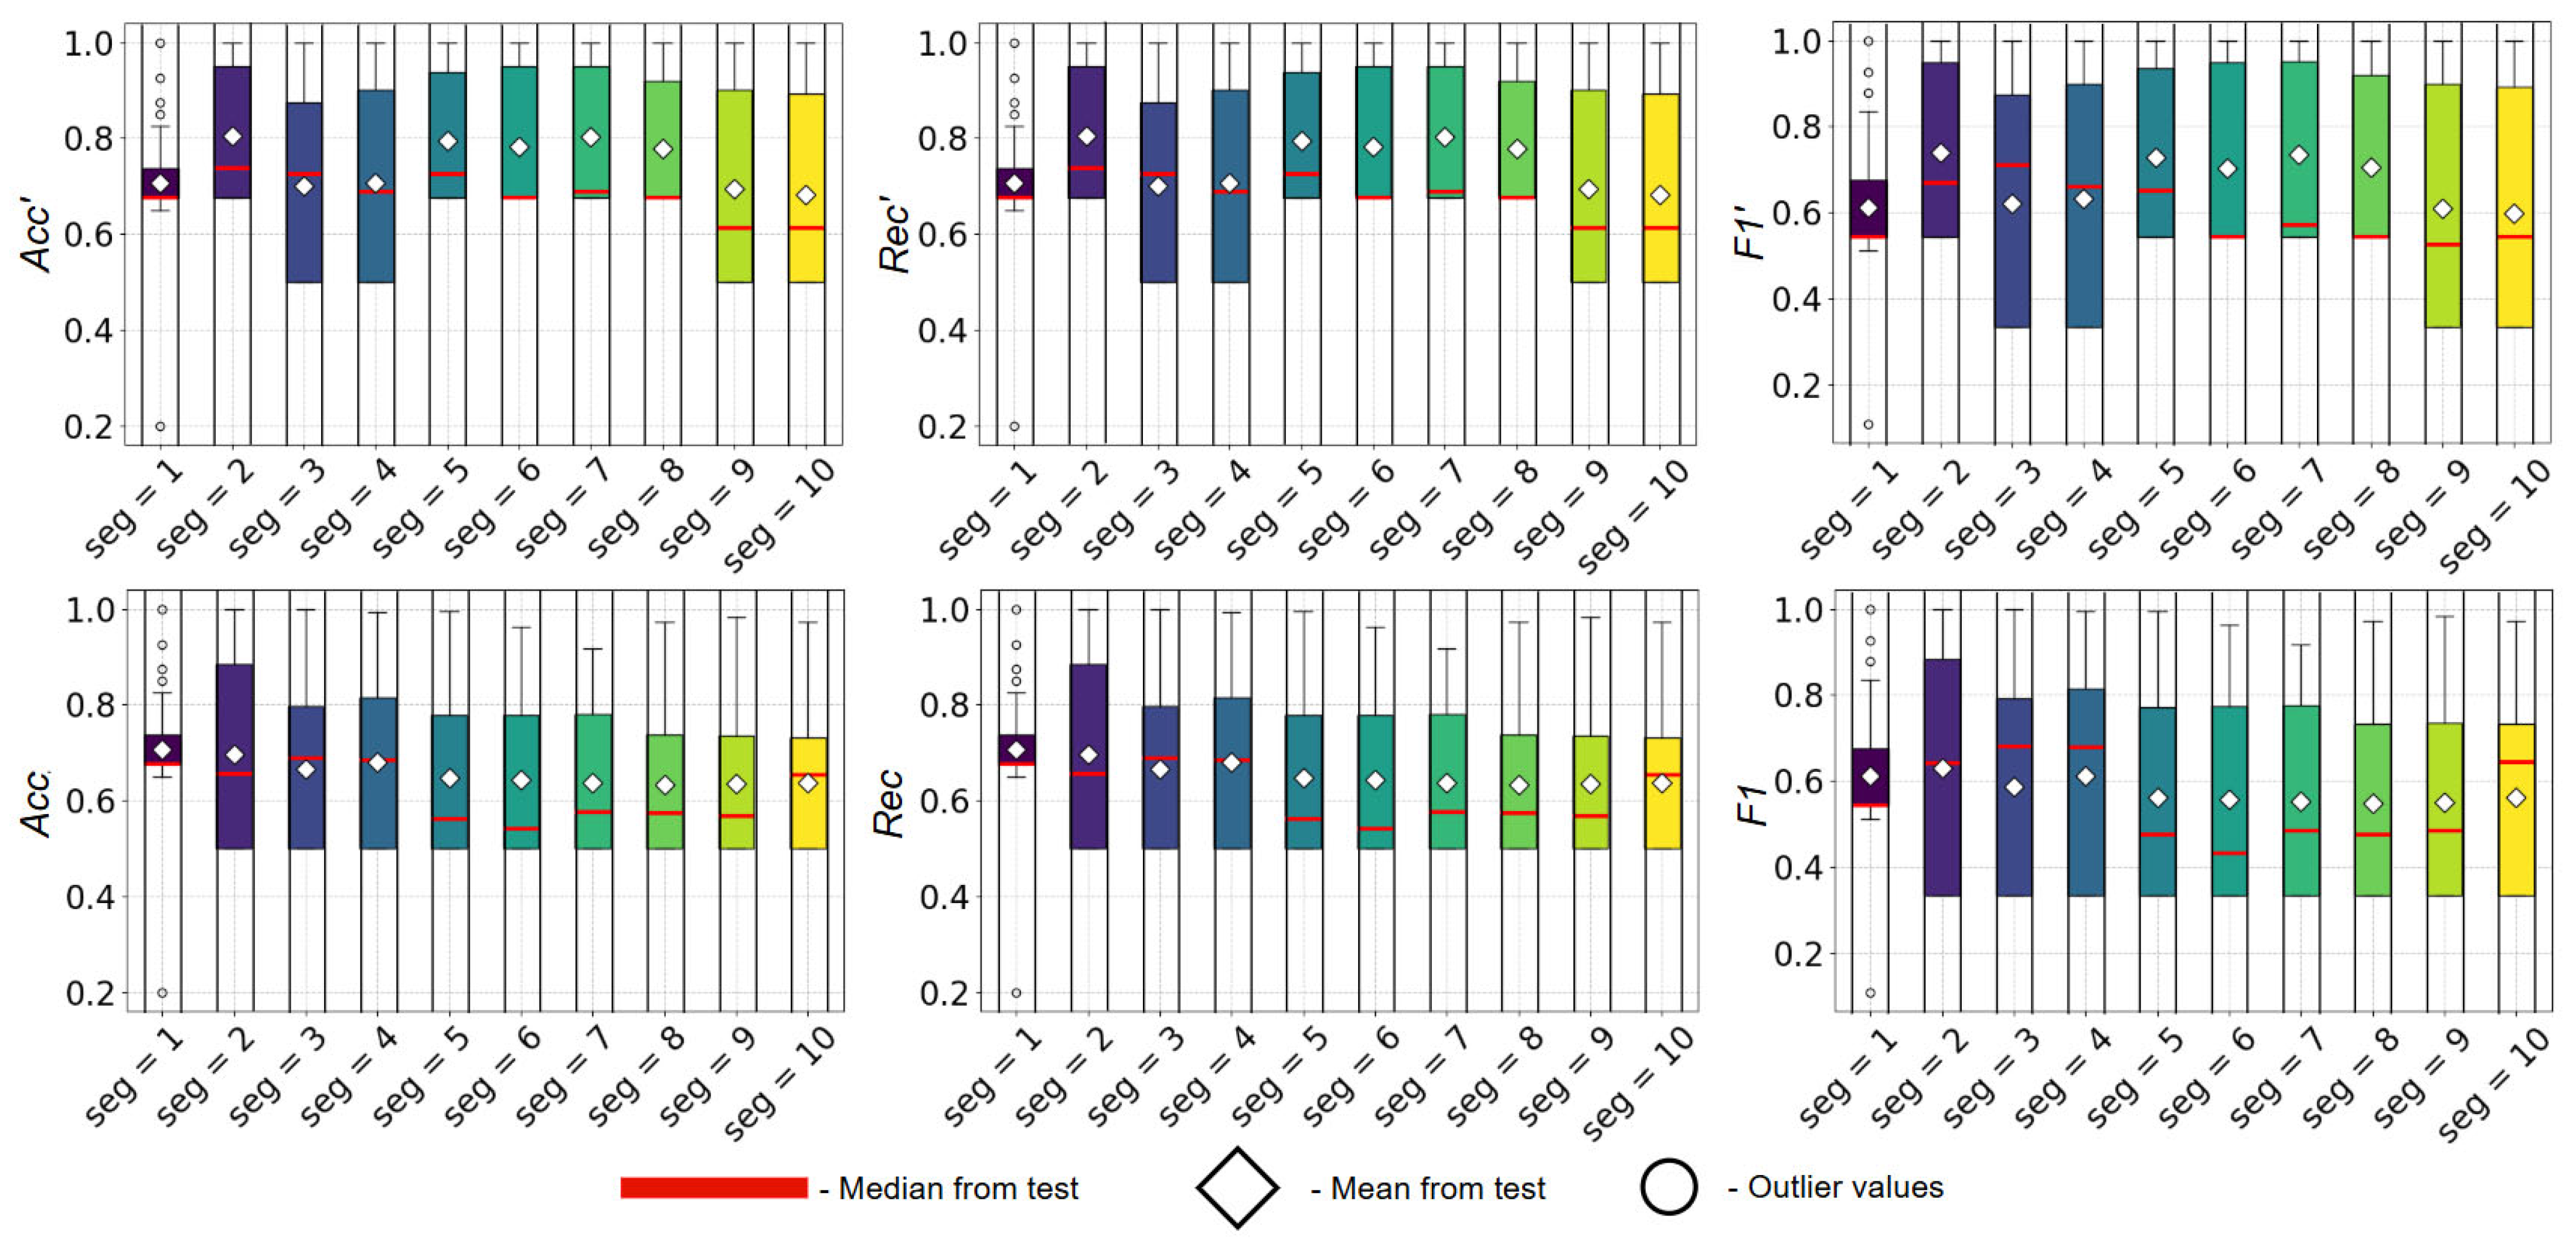
Since the proposed approach employs a hybrid architecture combining 1D-CNN layers with an LSTM layer, this design inevitably increases the computational cost of data analysis. To assess the contribution of the convolutional component independently, a separate training of the CNN-only architecture was conducted using the same experimental protocol. This protocol included identical segmentation strategies, optional DeepFilterNet-based noise reduction, 10-fold cross-validation using the LOSO scheme, and training with three different random weight initialization seeds. The performance of the trained CNN-only models, evaluated using the same metrics at both the segment level (Acc, Rec, F1) and the recording level (Acc′, Rec′, F1′), is presented in Figure 12 and Figure 13. Given the imbalance between sober and intoxicated recordings in the dataset, the comparison between the hybrid CNN + LSTM model and the independent CNN architecture was primarily based on the F1 and F1′ metrics.
Figure 12.
Evaluating the performance of an independent CNN part at different segmentation levels on a noisy dataset.
Figure 13.
Evaluating the performance of an independent CNN part at different segmentation levels on a clean dataset.
The obtained results indicate that the highest mean and median performance values for whole-recording classification, based on aggregated segment-level predictions, are achieved when recordings are divided into a small number of segments, specifically for seg = 2 and seg = 3. This trend is consistent for models trained on both the noisy dataset and its noise-reduced variant obtained using DeepFilterNet. However, in contrast to the hybrid model, the CNN-only architecture benefits more consistently from noise reduction, which suggests that the LSTM layer plays a significant role in capturing latent temporal patterns in human speech. As observed for the hybrid model, whole-recording analysis without segmentation (seg = 1) yields substantially lower performance compared to other configurations. This is reflected in reduced mean and median metric values, as well as lower stability, indicated by the presence of outliers in the corresponding boxplots.
Thus, we can conclude that dividing audio recordings into large segments has a positive effect. Therefore, further testing within this study will be conducted on variations in models trained on a small number of segments, specifically with seg = 2 and seg = 3.
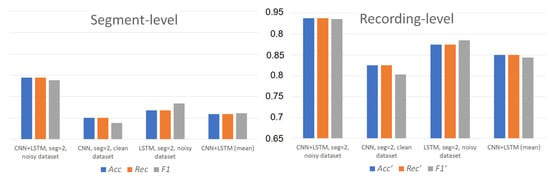
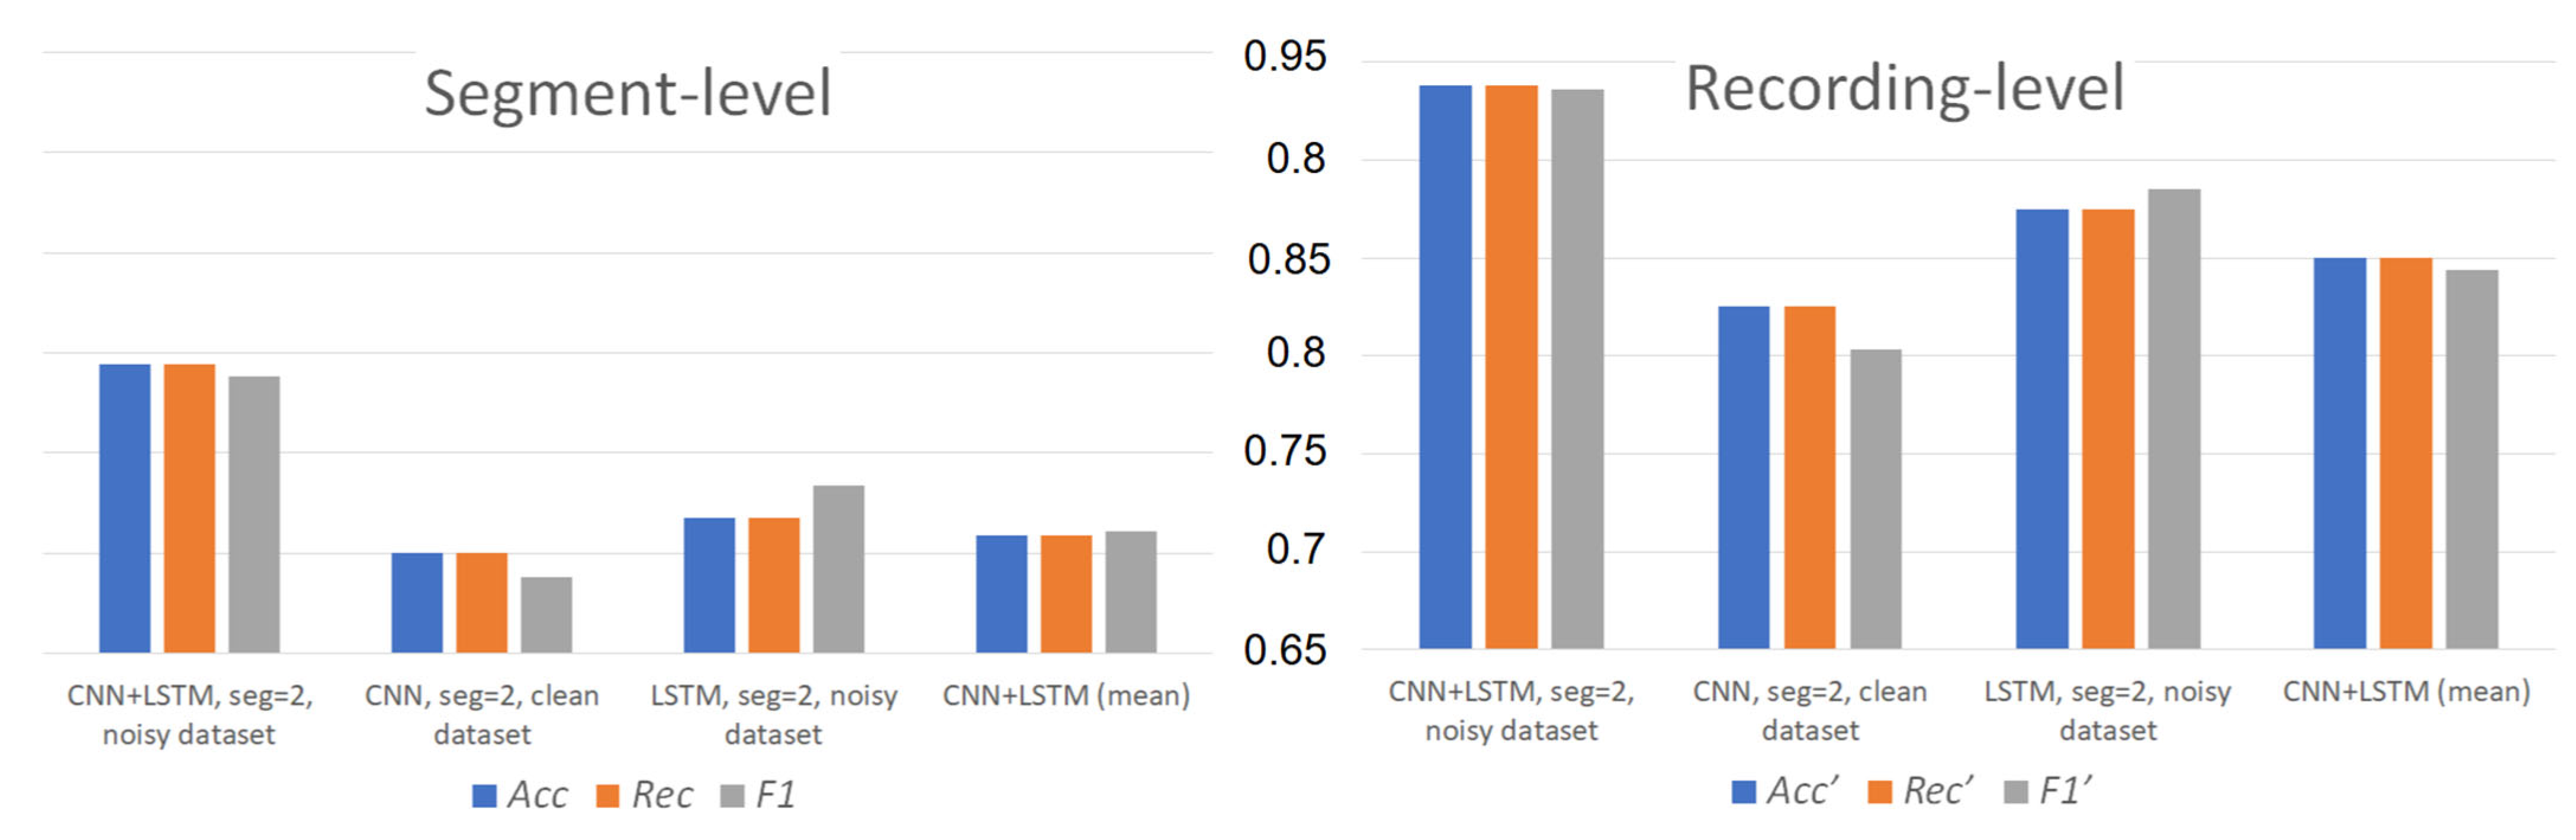
Additionally, a comparative evaluation was conducted between the hybrid model trained on the noisy dataset with seg = 2 and all independent models (the CNN model and the LSTM model), as well as the aggregated variant of the independent models (CNN + LSTM (mean)). The aggregated variant represents a sequential application of the independent models followed by averaging their segment-level predictions to obtain a combined decision. The results of this comparison are presented in Figure 14, while the training parameters used for the independent models are also indicated in Figure 14. As shown, the hybrid model achieves the best performance across all evaluated metrics, both at the segment level and in the whole-recording classification task.
Figure 14.
Comparison of hybrid and independent models’ performance.
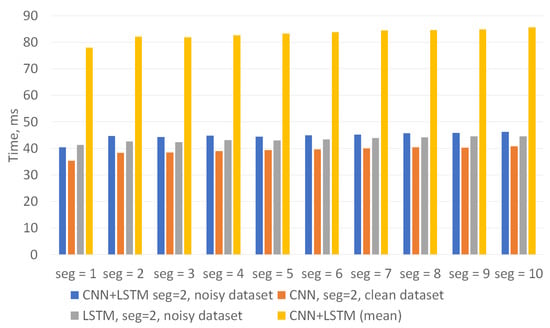
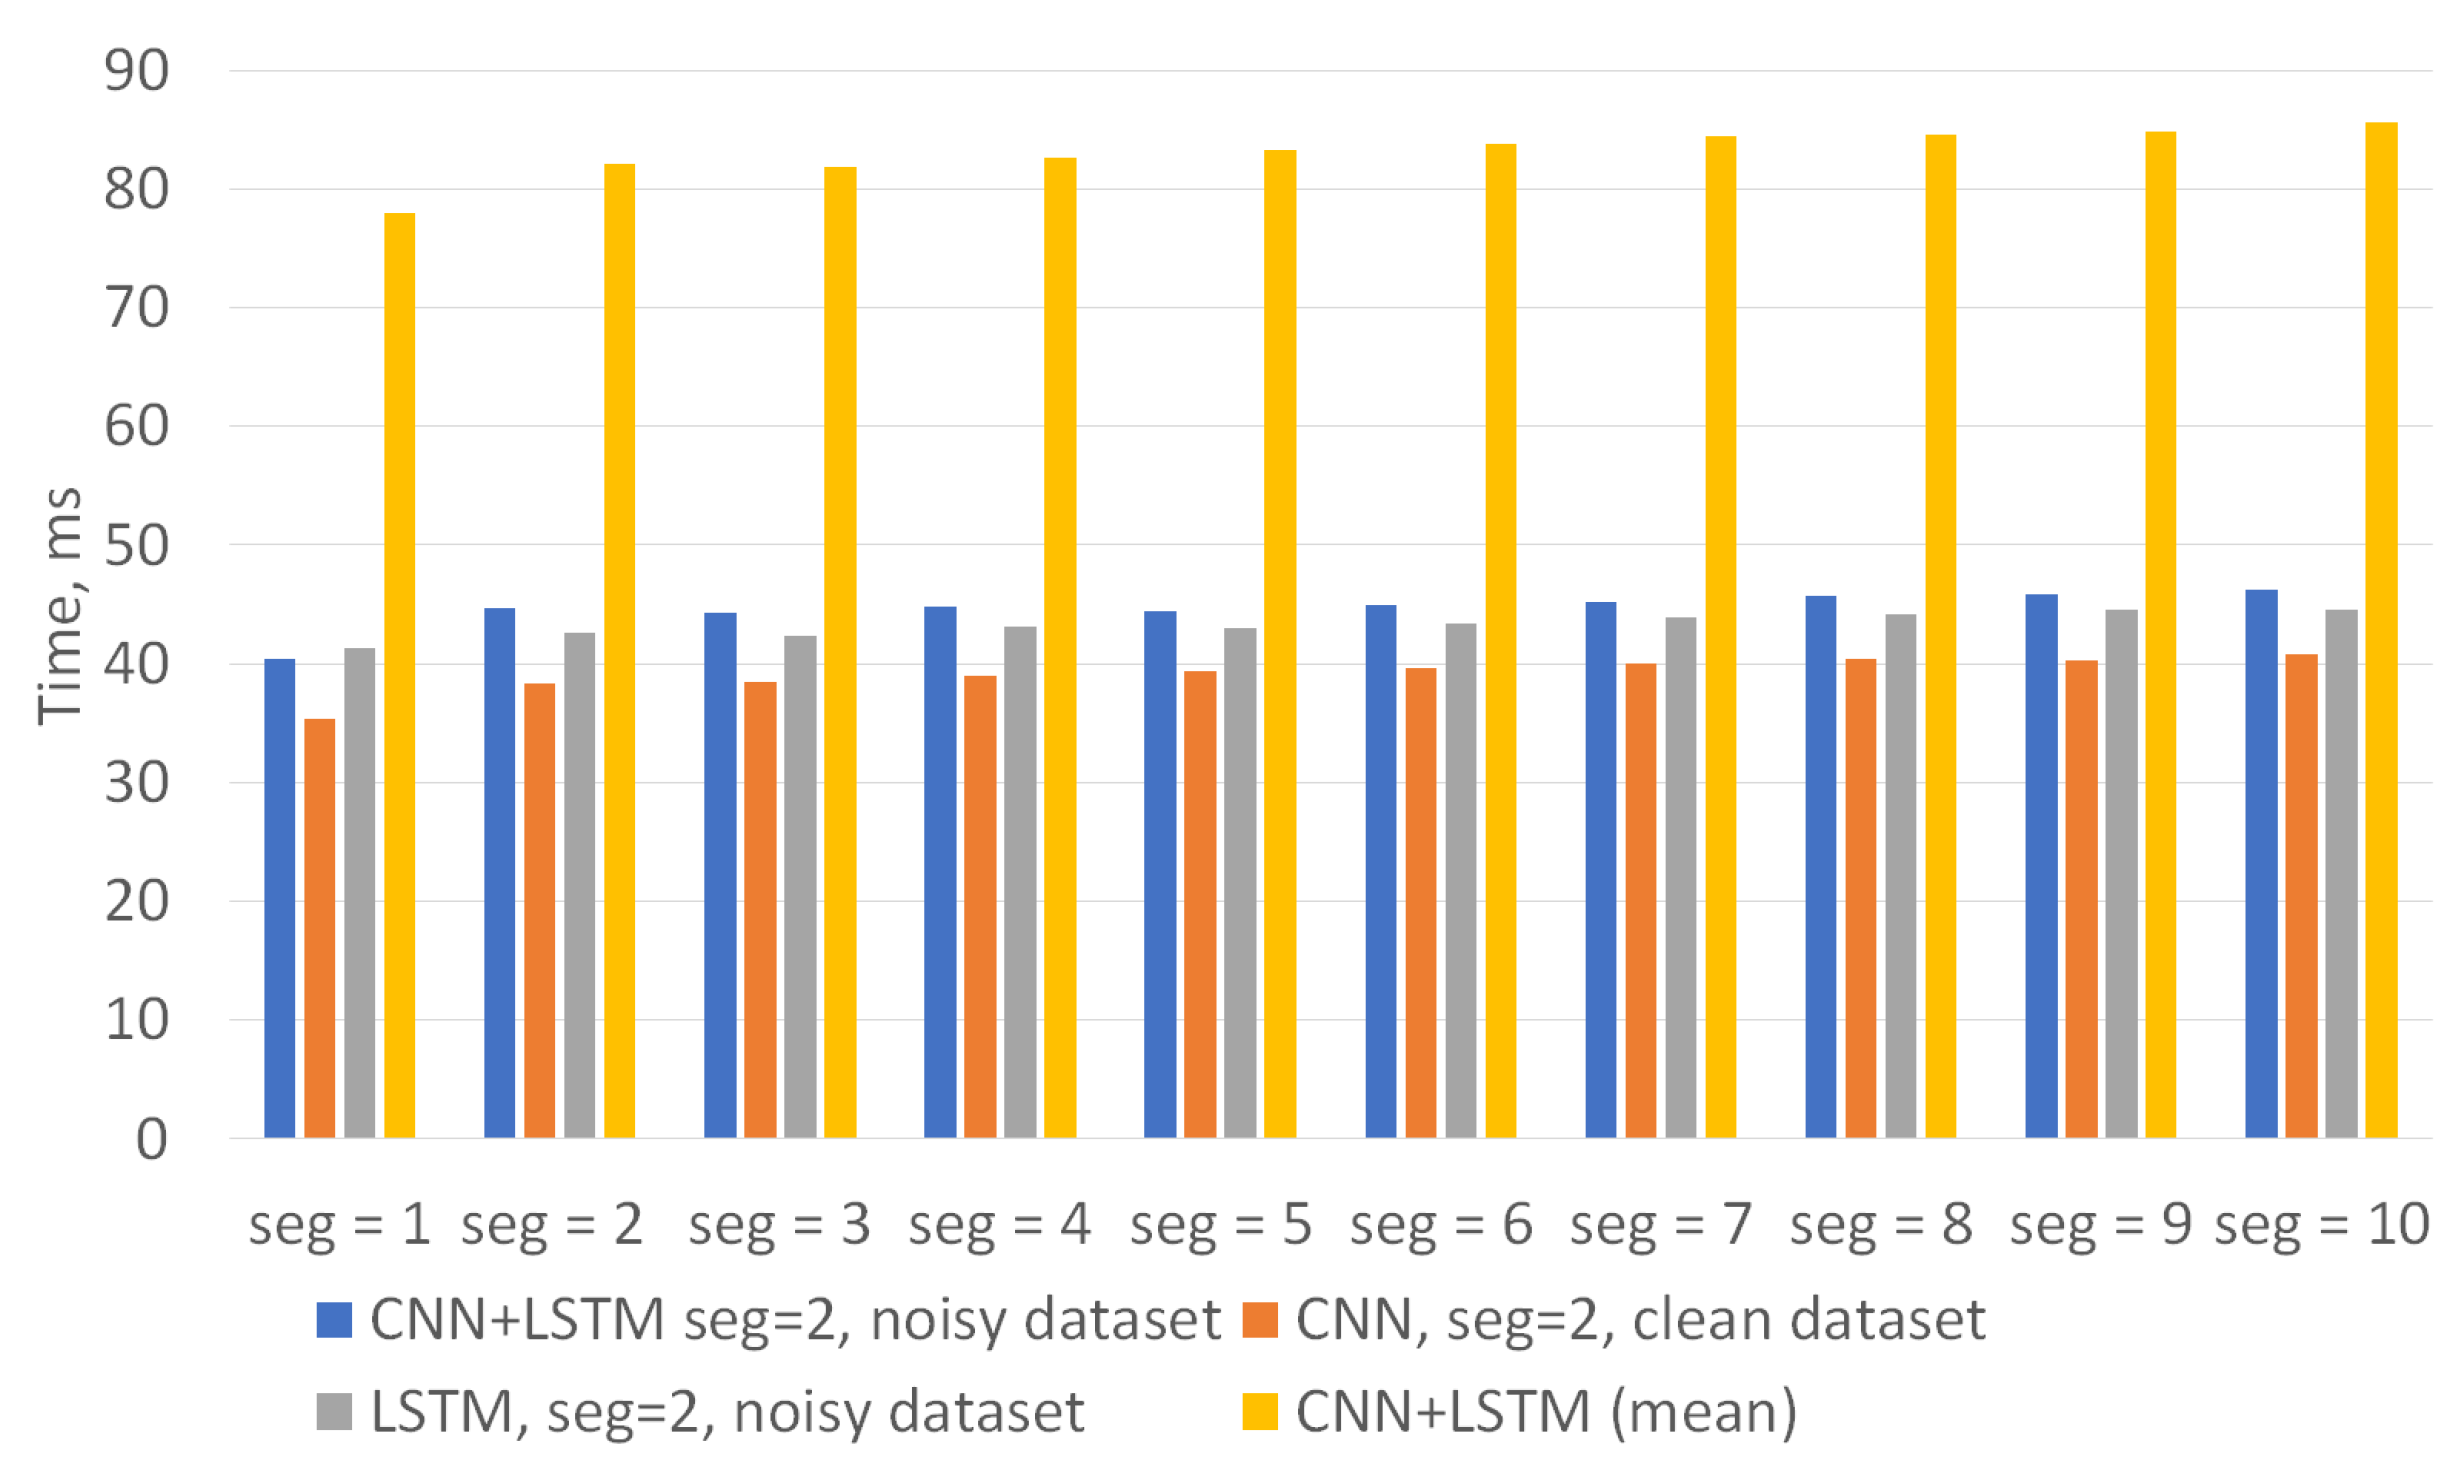
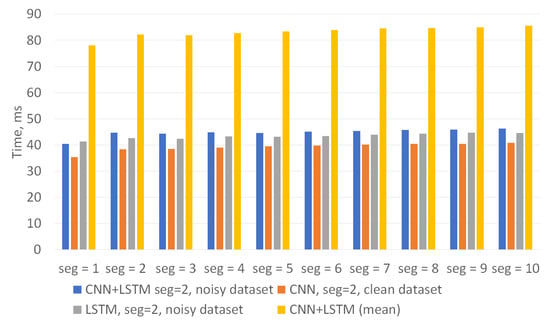
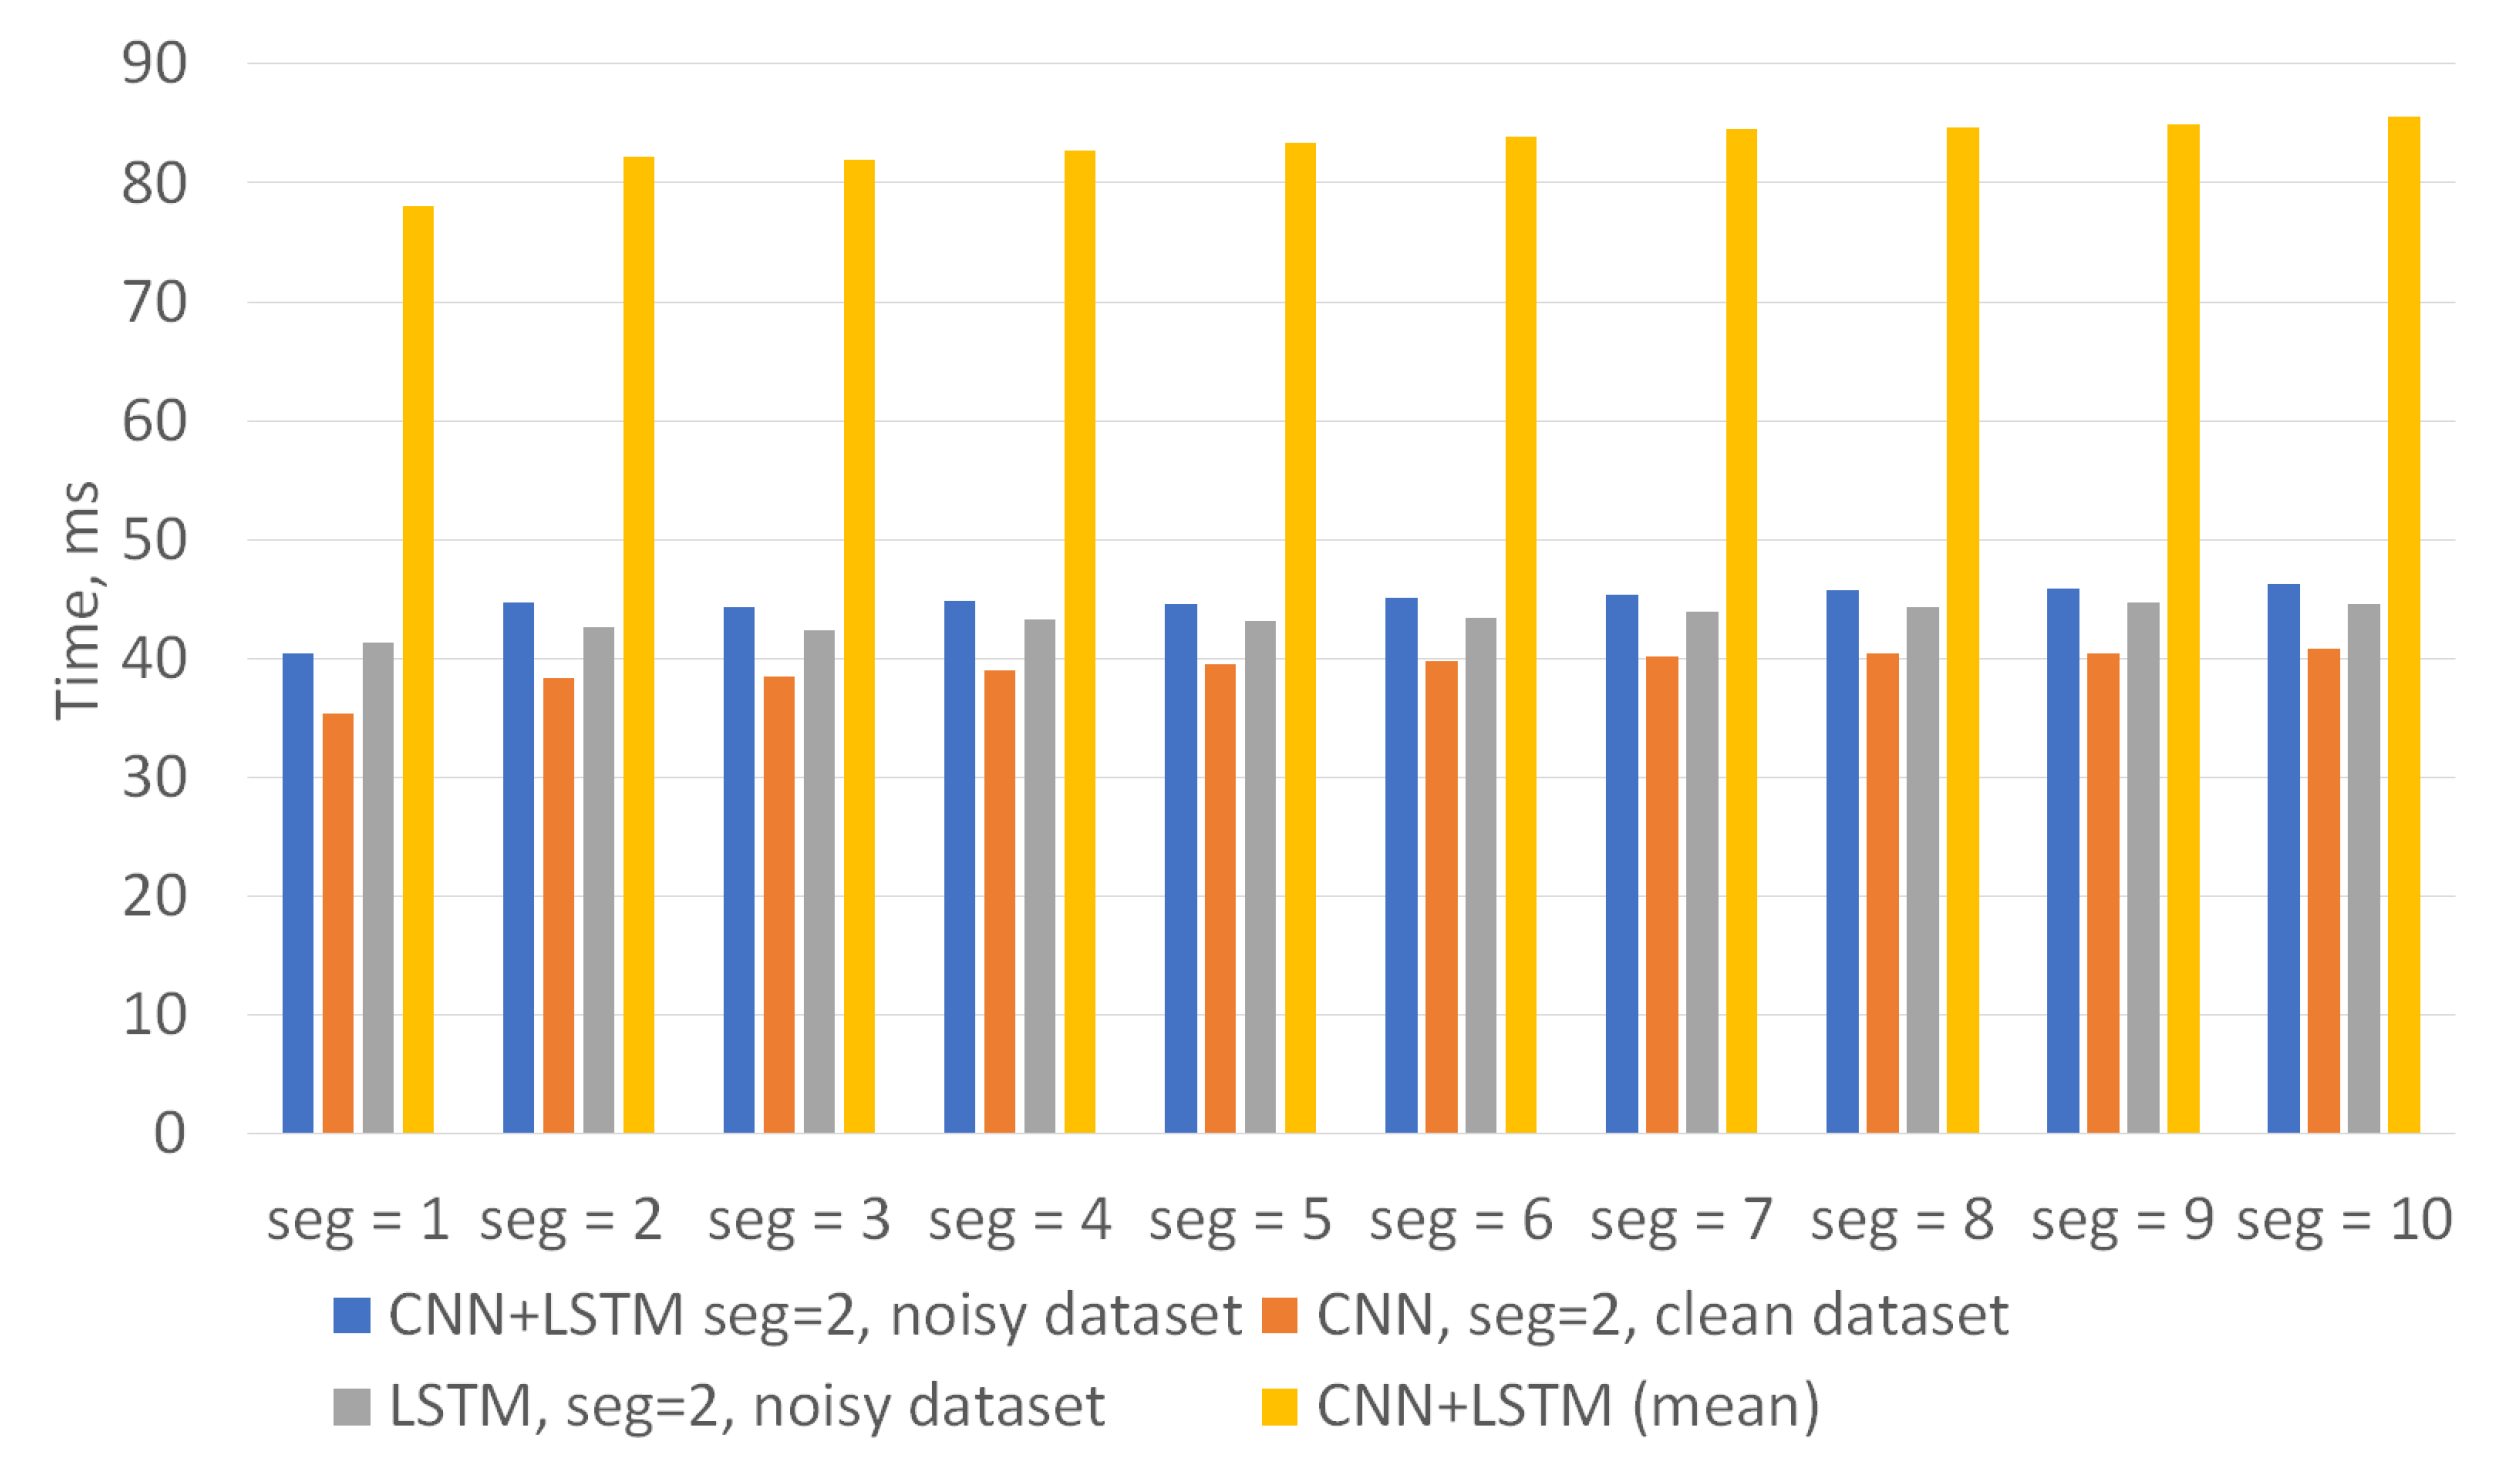
Figure 15 and Figure 16 present a comparative analysis of the processing speed for different model configurations at both the segment and recording levels based on 1000 runs of predicting random audio recordings from unknown data. The comparative analysis of processing speed demonstrates stable and consistent model behavior when analyzing both individual audio segments and complete audio recordings. The CNN architecture exhibits the highest computational efficiency, achieving the lowest processing time for both segment-level and recording-level analysis. The hybrid CNN + LSTM model is the most computationally demanding among the individual architectures, being outperformed only by the two sequentially combined models, CNN and LSTM, represented by the aggregated CNN + LSTM (mean) configuration. As expected, the CNN + LSTM (mean) metric shows the highest processing time, reflecting its aggregated evaluation nature. Both the independent models and the hybrid CNN + LSTM model achieve processing times below 50 ms in both scenarios, indicating their suitability for deployment in near-real-time systems.
Figure 15.
Speed of analysis of individual audio segments by independent and hybrid models.
Figure 16.
Speed of analysis of entire audio recordings by independent and hybrid models.
6.4. Influence of Noise Reduction on Classification Performance
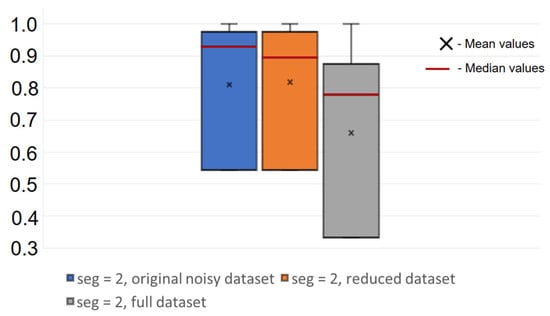
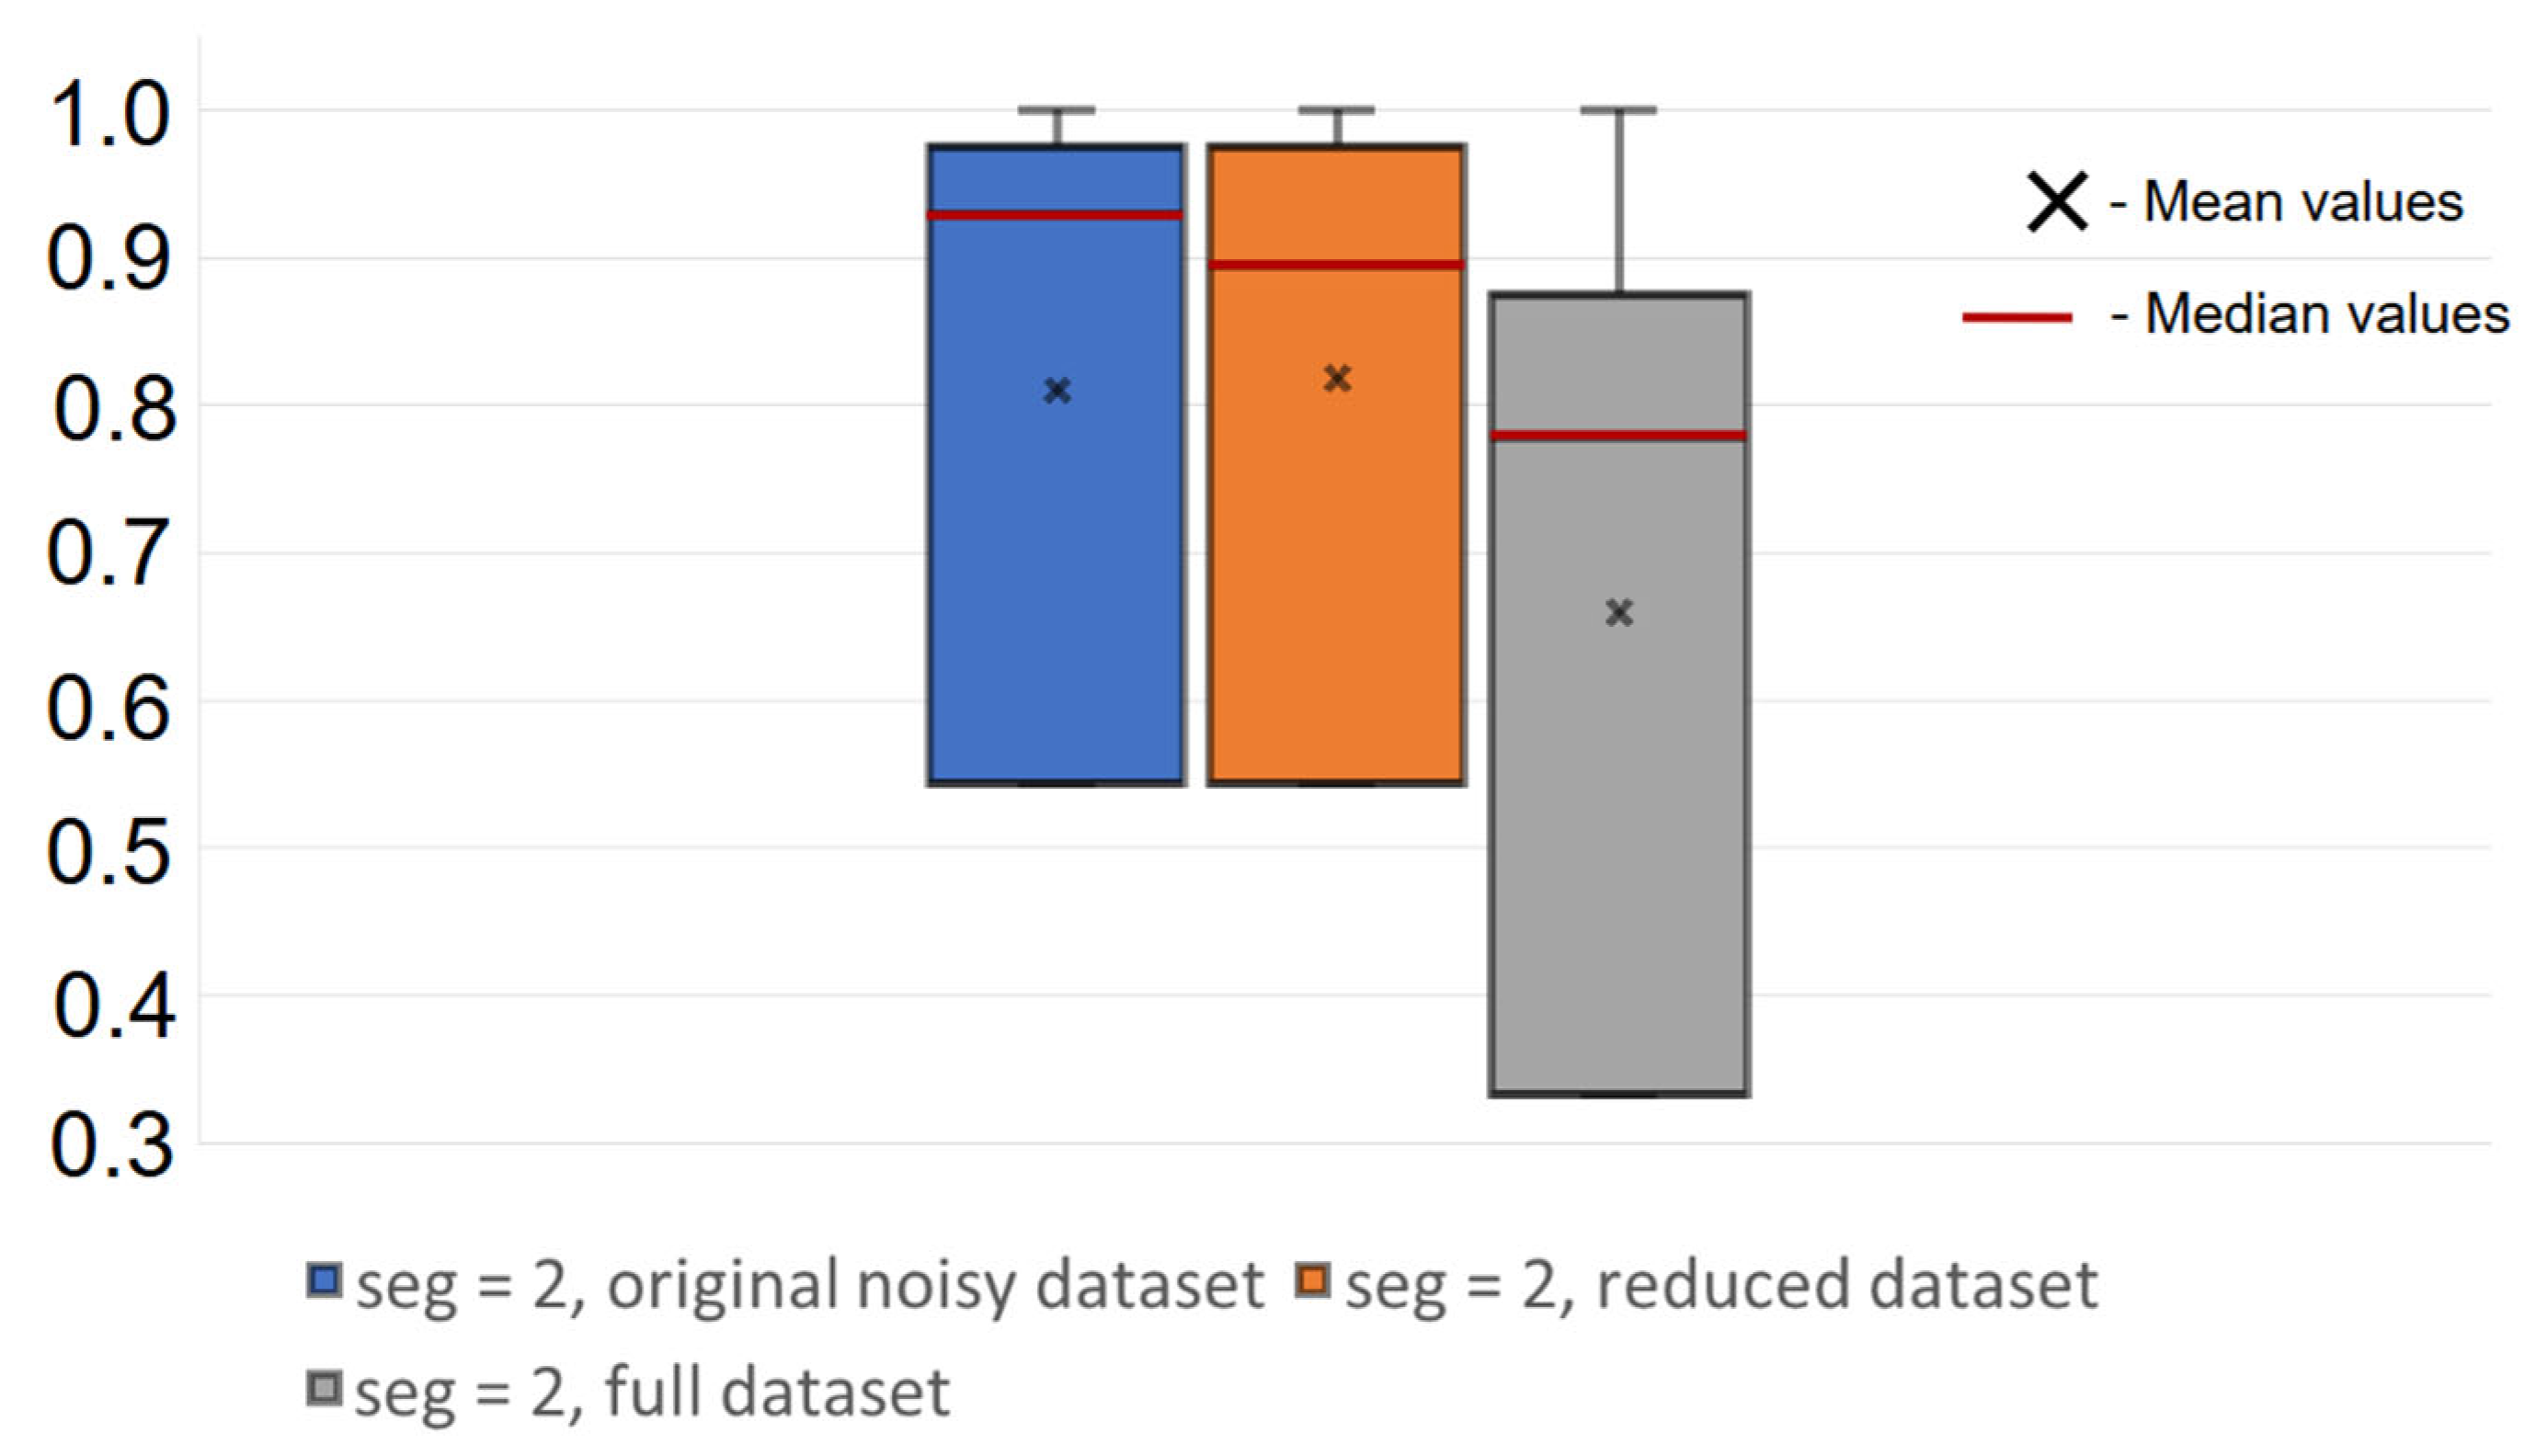
An additional experiment was conducted to evaluate the impact of background noise on hybrid model performance. In this experiment, the models were first trained and evaluated using the complete dataset, which included both clean and noisy recordings. Subsequently, all heavily noise-corrupted samples, which constitute approximately 20% of the corpus, were removed, and the models were retrained and evaluated using the reduced dataset. This design allows a direct comparison of model behavior under identical training conditions with and without strongly degraded audio data. The quantitative differences between these two configurations are summarized in Table 5. The values reported in the table represent the change in performance after noise removal relative to the full dataset, where negative values indicate a degradation in performance caused by excluding the noisy recordings. Only the model trained on the reduced denoised dataset with seg = 2 showed significant performance improvements, while the other four best models did not demonstrate significant gains across all metrics. However, despite this improvement, this model still performed worse than the corresponding model trained on the full noisy dataset with seg = 2, as demonstrated in Figure 17.
Table 5.
Comparison of performance before and after removing noisy recordings.
Figure 17.
Comparative analysis based on the results of excluding heavily noise-corrupted samples.
The evaluation of the best-performing model trained on noisy dataset with seg = 2 reveals gender-dependent differences in classification performance at both the segment level and the recording level, which is shown in Table 6. At the segment level, the model achieves Accuracy and Recall values of 0.658 with an F1-score of 0.569 for male speakers, while higher performance is observed for female speakers, with Accuracy and Recall reaching 0.797 and an F1-score of 0.760. At the recording level, performance improves for both groups, with male speakers reaching Accuracy and Recall values of 0.802 and an F1-score of 0.732, and female speakers achieving Accuracy and Recall of 0.917 with an F1-score of 0.888. These results indicate that the proposed approach is consistently more effective for female speech, which is in line with observations reported in related studies [29].
Table 6.
Analysis of the influence of the speaker’s gender on the quality of state classification.
7. Discussion
In this paper, we proposed and experimentally tested a method for detecting a speaker’s state of intoxication based on Russian language using a neural network combining convolutional layers and a recurrent LSTM layer. A key feature of the method is the preliminary partitioning of audio recordings into segments. The analyzed data was the personal speech corpus GradusSpeech-v1 consisting of over 1300 audio recordings of tongue twisters in Russian, recorded under various conditions. LOSO and cross-validation with 10-fold techniques were used for training and subsequent testing of the alcohol intoxication detection model, ensuring the model’s performance on unknown data.
During training, various parameters for dividing audio recordings into segments were tested, as well as variants with and without the DeepFilterNet-based speech signal separation algorithm. This allowed us to assess the impact of background noise on model accuracy as well as the influence of the complexity of speech structures on the quality of the final trained model. All other training parameters were held constant.
Testing the trained models showed that the best results for alcohol intoxication detection were obtained by dividing the audio recordings into two segments and by not applying the DeepFilterNet noise reduction to the audio files. The median values for the Accuracy, Recall, and F1-score metrics obtained after cross-validating the models in the binary classification task of entire audio recordings were approximately 0.93. Increasing the number of segments, thereby reducing their duration, demonstrates a negative impact on the performance of trained models. We hypothesize that this is due to the large number of segments consisting solely of silence, which cannot be reliably assigned to the desired state. Another identified aspect is the occurrence of overfitting with increasing the number of segments. This may also be due to the large number of segments consisting solely of silence, as well as an imbalance in the types of sounds allocated to individual segments.
It is also worth noting that denoising the audio signal using the DeepFilterNet model often resulted in a decrease in classification accuracy, which may be directly related to changes in the distributions of speech characteristics such as formants and HNR. Removing of approximately 20% of heavily noise-corrupted recordings from the training set demonstrated that this exclusion did not yield significant performance improvements for four best-performing models. The only exception was the model trained on reduced denoised dataset with seg = 2. However, even after training on the filtered data, it exhibited inferior performance compared to the model trained on the full noisy dataset.
A detailed comparison of the results obtained in this work with similar ones is presented in Table 7 and Table 8. It is worth noting that the F1-score, UAR and Accuracy metrics presented in Table 7 and Table 8 are similar to the previously considered F1′, Rec′, and Acc′ metrics, since they are calculated based on the classification of entire audio recordings for both classes.
Table 7.
Comparison of the proposed approach with previously published methods based on GradusSpeech-v1 dataset.
Table 8.
Comparison of the proposed approach with previously published methods based on BAS ALC dataset.
When comparing the obtained results with the results of previous studies on a portion of the GradusSpeech-v1 speech corpus [36,37], an increase in the F1-score metric of 14–17% was noted. Thus, the method of dividing audio recordings into segments shows higher results compared to the method of analyzing the spectrum image of the entire audio recording.
An evaluation was also conducted in comparison with other studies. It was found that the proposed method outperforms the ADLAIA model [33] and the work of Ming Li [34] in the accuracy of speaker state determination by about 20% when compared using metrics obtained from GradusSpeech-v1 dataset. However, the proposed combination of the division method and the application of a 1D-CNN + LSTM neural network show lower accuracy rates for state determination compared to the approach described in [35]. The difference in accuracy was about 4% in favor of a similar study when compared using metrics obtained from GradusSpeech-v1 dataset. Thus, the IHLN-ANN model in combination with the analysis of low-level speech characteristics is capable of achieving a higher quality of speaker intoxication classification compared to the proposed method. This discrepancy may be attributed to several factors. First, the referenced study relies on a substantially larger and more diverse dataset, comprising recordings from 265 speakers, whereas GradusSpeech-v1 includes data from only 31 speakers. Second, the use of low-level acoustic features, such as pitch and HNR, may capture alcohol-induced vocal changes more directly than MFCC-based representations. Finally, the analysis in the referenced work is limited to isolated vowel sounds, which are particularly sensitive to the effects of alcohol, while the present study considers full phrases and a wider range of phonetic content.
When compared to the results of similar studies using the BAS ALC dataset, the model trained in this study demonstrates poor results. This may be due to the fact that, unlike similar studies that consider graphical representations of the signal spectrum, the proposed combination of large segments and the 1D-CNN + LSTM model relies heavily on the spoken text. Since the model was trained on specific Russian tongue twisters, it cannot be used with audio recordings of spontaneous speech or phrases from other phrase banks.
8. Conclusions
In this study, an approach of using hybrid 1D-CNN and LSTM architecture combined with long audio segments containing complex speech structures was proposed for detecting alcohol intoxication from speech. Based on the conducted results, it can be concluded that the proposed approach, enables the training of models that achieve high accuracy in classifying alcohol intoxication status for previously unseen speakers. The results were obtained using a relatively small dataset with a total duration of approximately two hours, which demonstrates the feasibility of the proposed approach in data-constrained scenarios. In addition, the processing time required for a single audio recording is sufficiently low to support near real-time analysis.
At the same time, several limitations of the proposed approach were identified. Model performance is strongly influenced by the type of speech material used, particularly by the phrase-bank of the analyzed recordings. Because the method relies on long segments that capture complex speech structures and pause patterns, the use of speech material that differs substantially from the phrases observed during training may lead to a noticeable degradation in performance. Furthermore, segmentation of recordings into smaller units requires additional filtering steps to exclude segments consisting exclusively of silence. A large proportion of such non-informative segments may also negatively affect model performance.
Despite these limitations, the obtained results indicate that the proposed method, due to its high processing speed and reliable performance under controlled conditions, has practical potential in medical applications and occupational safety systems. Since the approach is based on neural network models, pretrained generalized models can be further adapted to specific user groups through additional training. In addition, personalized models tailored to individual speakers can be developed, potentially achieving higher accuracy. The combination of generalized and specialized models enables the creation of flexible systems for monitoring the condition of narrowly defined populations such as workers of specific company.
Future work will focus on a more detailed investigation of the analysis of both complex and simpler speech structures, as well as on the integration of additional preprocessing techniques. Given the limited size of the current dataset, further research will also explore the effectiveness of artificial data augmentation methods, ranging from simple techniques such as additive noise to more advanced approaches that generate synthetic speech exhibiting intoxication-related characteristics. Another important direction for future research is the development of methods for accurately estimating the degree of alcohol intoxication using both publicly available speech corpora and the GradusSpeech-v1 dataset. Also, since the comparison of the hybrid and independent models revealed that the negative impact of noise removal using DeepFilterNet is specific to the hybrid model, we plan to analyze this pattern in more detail in the future. In particular, we plan to delve deeper into our proposed explanation for the presence of an LSTM layer in the hybrid model’s architecture.
Author Contributions
The work presented here was carried out in collaboration among all authors. Methodology, A.A.K. and P.U.L.; resources, P.U.L.; writing—original draft, P.U.L., A.N.K.; writing—review and editing and formal analysis A.S. and A.A.S.; investigation, P.U.L. and A.N.K.; validation, A.A.S. and A.A.K.; supervision, A.S. and A.A.S. All authors have read and agreed to the published version of the manuscript.
Funding
This research was funded by the Ministry of Science and Higher Education of Russia, Government Order for 2023-2025, project no. FEWM-2023-0015 (TUSUR).
Institutional Review Board Statement
The study was conducted in accordance with the Declaration of Helsinki and approved by the Institutional Review Board of Tomsk National Research Medical Center (protocol code: 180, date of approval: 15 January 2025).
Informed Consent Statement
Informed consent was obtained from all subjects involved in the study.
Data Availability Statement
The original data presented in the study are openly available in Kaggle at https://www.kaggle.com/datasets/octoded/gradusspeech-v1 (accessed on 18 January 2026).
Acknowledgments
During the preparation of this manuscript, the authors used Quillbot (free version) for the purposes of language refinement and paraphrasing as well. The authors have reviewed and edited the output and take full responsibility for the content of this publication.
Conflicts of Interest
The authors declare no conflicts of interest.
References
- WHO. Over 3 Million Annual Deaths Due to Alcohol and Drug Use, Majority Among Men; World Health Organization: Geneva, Switzerland, 2024; Available online: https://www.who.int/news/item/25-06-2024-over-3-million-annual-deaths-due-to-alcohol-and-drug-use-majority-among-men (accessed on 25 June 2025).
- Over Three Million Preventable Deaths Per Year Due to Alcohol and Drug Use|UN News. News.un.org. 2024. Available online: https://news.un.org/en/story/2024/06/1151461 (accessed on 25 June 2025).
- Statista. Death Rate from Alcohol Use Disorders Russia 1990–2019. 2025. Available online: https://www.statista.com/statistics/1016379/deaths-alcohol-disorders-russia/ (accessed on 28 November 2025).
- Kulkarni, S. Sassoon doctors took bribes to change blood sample of minor in Pune Porsche crash case: Police to court. The Indian Express. 28 May 2024. Available online: https://indianexpress.com/article/cities/pune/sassoon-doctors-took-bribes-change-blood-sample-pune-porsche-crash-case-9355042/ (accessed on 15 January 2026).
- Qi, M.; Uche, S.C.; Agu, E. Comprehensive Performance Comparison of Signal Processing Features in Machine Learning Classification of Alcohol Intoxication on Small Gait Datasets. Appl. Sci. 2025, 15, 7250. [Google Scholar] [CrossRef] [Scilit]
- Seva, R.; del Rosario, I.L.; Peñafiel, L.M.; Young, J.M.; Sybingco, E. Predicting Intoxication Using Motorcycle and Head Movements of Riders Wearing Alcohol Intoxication Goggles. Safety 2023, 9, 29. [Google Scholar] [CrossRef] [Scilit]
- Göbel, J.P.; Peuckmann, N.; Kundinger, T.; Riener, A. Fusion of Driving Behavior and Monitoring System in Scenarios of Driving Under the Influence: An Experimental Approach. Appl. Sci. 2025, 15, 5302. [Google Scholar] [CrossRef] [Scilit]
- Kim, S.H.; Son, H.W.; Lee, T.M.; Baek, H.J. Drunk Driver Detection Using Multiple Non-Invasive Biosignals. Sensors 2025, 25, 1281. [Google Scholar] [CrossRef] [Scilit] [PubMed]
- Koukiou, G. Thermal Biometric Features for Drunk Person Identification Using Multi-Frame Image-ry. Electronics 2022, 11, 3924. [Google Scholar] [CrossRef] [Scilit]
- Chai, C.H.; Abdul Razak, S.F.; Yogarayan, S.; Shanmugam, R. Drunk Driver Detection Using Thermal Facial Images. Information 2025, 16, 413. [Google Scholar] [CrossRef] [Scilit]
- Rakhmanenko, I.; Shelupanov, A.; Kostyuchenko, E. Automatic text-independent speaker verification using convolutional deep belief network. Comput. Opt. 2020, 44, 596–605. [Google Scholar] [CrossRef] [Scilit]
- Romanov, A.S.; Shelupanov, A.A.; Bondarchuk, S.S. Generalised methodology for identifying the author of an unknown text. Dokl. Tomsk. Gos. Univ. Sist. Upr. Radioelektron. 2010, 1, 108–112. Available online: https://journal.tusur.ru/storage/46853/108-112.pdf?1467272065 (accessed on 27 January 2026). (In Russian)
- Romanov, A.S.; Kurtukova, A.V.; Sobolev, A.A.; Shelupanov, A.A.; Fedotova, A.M. Determining the age of the author of the text based on deep neural network models. Information 2020, 11, 589. [Google Scholar] [CrossRef] [Scilit]
- Fedotova, A.; Romanov, A.; Kurtukova, A.; Shelupanov, A. Authorship attribution of social media and literary Russian-language texts using machine learning methods and feature selection. Future Internet 2021, 14, 4. [Google Scholar] [CrossRef] [Scilit]
- Sabanov, A.G.; Shelupanov, A.A.; Mescheryakov, R.V. Requirements for authentication systems by levels of strictness. Polzunovskiy Vestn. 2012, 2-1, 61–67. Available online: https://journal.altstu.ru/media/f/old2/pv2012_2_1/pdf/061sabanov.pdf (accessed on 27 January 2026). (In Russian)
- Shelupanov, A.A.; Evsutin, O.; Konev, A.; Kostyuchenko, E.; Kruchinin, D.; Nikiforov, D. Modern trends in development of methods and means for information protection. Proc. Tomsk. State Univ. Control Syst. Radioelectron. 2017, 20, 11–24. [Google Scholar] [CrossRef] [Scilit]
- Chamoun, K.; Chevillard, L.; Hajj, A.; Callebert, J.; Mégarbane, B. Mechanisms of Neurorespiratory Toxicity Induced by Fentanyl Analogs—Lessons from Animal Studies. Pharmaceuticals 2023, 16, 382. [Google Scholar] [CrossRef] [Scilit] [PubMed]
- Sulavko, A.E.; Lozhnikov, P.S.; Choban, A.G.; Stadnikov, D.G.; Nigrey, A.A.; Inivatov, D.P. Evaluation of EEG identification potential using statistical approach and convolutional neural networks. Инфoрмациoннo-Управляющие Системы 2020, 37–49. (In Russian) [Google Scholar] [CrossRef] [Scilit]
- Urazaev, M.D. Studies of the vocabulary of alcohol intoxication in english. Evrazijsk. Nauchnoe Ob”Edinenie. 2021. Available online: https://www.elibrary.ru/item.asp?id=46339026 (accessed on 27 January 2026). (In Russian)
- Madden, D.; Lyday, R.G.; Bahrami, M.; Shappell, H.M.; Burdette, J.H.; Laurienti, P.J. Fractal Analysis of Brain Activity During Risky Drinking in Adolescents and Young Adults. Brain Sci. 2025, 15, 1256. [Google Scholar] [CrossRef] [Scilit] [PubMed]
- Geng, P.; Fan, N.; Ling, R.; Li, Z.; Guo, H.; Lu, Q.; Chen, X. Acoustic characteristics of mandarin speech in male drug users. J. Voice 2023. [Google Scholar] [CrossRef] [Scilit]
- Geng, P.; Fan, N.; Li, Z.; Ling, R.; Yang, K.; Mao, X.; Guo, H. The effect of detoxification on acoustic features of Mandarin speech in male heroin users. PLoS ONE 2024, 19, e0304399. [Google Scholar] [CrossRef] [Scilit]
- Inivatov, D.P.; Sulavko, A.E.; Samotuga, A.E. On assessing the influence of alcohol intoxication on voice parameters in biometric authentication systems. Dyn. Syst. Mech. Mach. 2023, 11, 58–66. (In Russian) [Google Scholar]
- Kornetov, A.N.; Starikova, E.G.; Kaverina, I.S.; Starikov Yu, V.; Soldatov, A.A.; Potapova, N.E.; Tolmachev, I.V. Approaches to automation of diagnostics of mental health of operators of a number of professions. Psychiatry Psychother. Clin. Psychol. 2023, 14, 95–104. (In Russian) [Google Scholar] [CrossRef] [Scilit]
- Sigmund, M.; Zelinka, P. Analysis of voiced speech excitation due to alcohol intoxication. Inf. Technol. Control 2011, 40, 143–150. [Google Scholar] [CrossRef] [Scilit]
- Tisljár-Szabó, E.; Rossu, R.; Varga, V.; Pléh, C. The effect of alcohol on speech production. J. Psycholinguist. Res. 2014, 43, 737–748. [Google Scholar] [CrossRef] [Scilit] [PubMed]
- Schiel, F. Perception of alcoholic intoxication in speech. In Proceedings of the Interspeech 2011, Florence, Italy, 27–31 August 2011. [Google Scholar]
- Schiel, F.; Heinrich, C.; Barfüßer, S.; Gilg, T. ALC: Alcohol Language Corpus. In Proceedings of the Sixth International Conference on Language Resources and Evaluation (LREC’08), Marrakech, Marokko, 26 May–1 June 2008; European Language Resources Association (ELRA): Paris, France, 2008. Available online: https://www.bas.uni-muenchen.de/forschung/publikationen/LREC2008_Heinrich.pdf (accessed on 25 June 2025).
- Schuller, B.; Steidl, S.; Batliner, A.; Schiel, F.; Krajewski, J. The INTERSPEECH 2011 speaker state challenge. In Proceedings of the Interspeech 2011, Florence, Italy, 27–31 August 2011. [Google Scholar]
- Gong, Y.; Chung, Y.A.; Glass, J. Ast: Audio spectrogram transformer. arXiv 2011, arXiv:2104.01778. [Google Scholar]
- Bonela, A.A.; He, Z.; Nibali, A.; Norman, T.; Miller, P.G.; Kuntsche, E. Audio-based deep learning algorithm to identify alcohol inebriation (ADLAIA). Alcohol 2023, 109, 49–54. [Google Scholar] [CrossRef] [Scilit] [PubMed]
- Wang, W.; Wu, H.; Li, M. Deep Neural Networks with Batch Speaker Normalization for Intoxicated Speech Detection. In Proceedings of the 2019 Asia-Pacific Signal and Information Processing Association Annual Summit and Conference (APSIPA ASC), Lanzhou, China, 18–21 November 2019; IEEE: New York, NY, USA, 2019; pp. 1323–1327. [Google Scholar] [CrossRef] [Scilit]
- Vital Terlapu, P.; Prasad Reddy Sadi, R. Real-time speech-based intoxication detection system: Vowel biomarker analysis with artificial neural networks. Int. J. Comput. Digit. Syst. 2024, 15, 1637–1666. [Google Scholar] [CrossRef] [Scilit]
- Laptev, P.; Litovkin, S.; Kostyuchenko, E. Determining alcohol intoxication based on speech and neural networks. In Proceedings of the International Conference on Speech and Computer, Dharwad, India, 29 November–2 December 2023; Springer Nature: Cham, Switzerland, 2023; pp. 107–115. [Google Scholar]
- Laptev, P.; Demareva, V.; Litovkin, S.; Kostuchenko, E.; Shelupanov, A. Machine learning-based detection of alcohol intoxication through speech analysis: A comparative study of AI models. Eur. Phys. J. Spec. Top. 2025, 234, 3793–3803. [Google Scholar] [CrossRef] [Scilit]
- Reiter, G.S.; Boeckle, M.; Reiter, C.; Seltenhammer, M.H. The impact of total body water on breath alcohol calculations. Wien. Klin. Wochenschr. 2020, 132, 535–541. [Google Scholar] [CrossRef] [Scilit]
- Jones, A.W. Evolution of Analytical Methods for the Determination of Ethanol in Blood and Breath for Clinical and Forensic Purposes. Wiley Interdiscip. Rev. Forensic Sci. 2025, 7, e70018. [Google Scholar] [CrossRef] [Scilit]
- Schroter, H.; Escalante-B, A.N.; Rosenkranz, T.; Maier, A. DeepFilterNet: A low complexity speech enhancement framework for full-band audio based on deep filtering. In Proceedings of the ICASSP 2022—2022 IEEE International Conference on Acoustics, Speech and Signal Processing (ICASSP), Singapore, 22–27 May 2022; IEEE: New York, NY, USA, 2022; pp. 7407–7411. [Google Scholar]
- Schröter, H.; Maier, A.; Escalante-B, A.N.; Rosenkranz, T. Deepfilternet2: Towards real-time speech enhancement on embedded devices for full-band audio. In Proceedings of the 2022 International Workshop on Acoustic Signal Enhancement (IWAENC), Bamberg, Germany, 5–8 September 2022; IEEE: New York, NY, USA, 2022; pp. 1–5. [Google Scholar]
- Hancı, N.B.; Erdem, O.; Ulukaya, S.; Güler, S.; Uzun, C. Al-based Parkinson’s Disease Diagnosis with Word Level Speech Data using Advanced Signal Processing Techniques. In Proceedings of the 2025 Signal Processing: Algorithms, Architectures, Arrangements, and Applications (SPA), Poznan, Poland, 17–19 September 2025; IEEE: New York, NY, USA, 2025; pp. 176–181. [Google Scholar] [CrossRef] [Scilit]
- Litovkin, S.; Laptev, P.; Kostyuchenko, E. Application of Machine Learning Techniques for Generated Speech Detection. In Proceedings of the 2024 32nd Telecommunications Forum (TELFOR), Belgrade, Serbia, 26–27 November 2024; IEEE: New York, NY, USA, 2024; pp. 1–4. [Google Scholar]
- DiPietro, R.; Hager, G.D. Deep learning: RNNs and LSTM. In Handbook of Medical Image Computing and Computer Assisted Intervention; Academic Press: Cambridge, MA, USA, 2020; pp. 503–519. [Google Scholar]
- Mascarenhas, S.; Agarwal, M. A comparison between VGG16, VGG19 and ResNet50 architecture frameworks for Image Classification. In Proceedings of the 2021 International Conference on Disruptive Technologies for Multi-Disciplinary Research and Applications (CENTCON), Bengaluru, India, 19–21 November 2021; IEEE: New York, NY, USA, 2021; pp. 96–99. [Google Scholar] [CrossRef] [Scilit]
- Theckedath, D.; Sedamkar, R.R. Detecting affect states using VGG16, RESNEt50 and SE-RESNet50 networks. SN Comput. Sci. 2020, 1, 79. [Google Scholar] [CrossRef] [Scilit]
- Kwasny, D.; Hemmerling, D. Gender and age estimation methods based on speech using deep neural networks. Sensors 2021, 21, 4785. [Google Scholar] [CrossRef] [Scilit]

Disclaimer/Publisher’s Note: The statements, opinions and data contained in all publications are solely those of the individual author(s) and contributor(s) and not of MDPI and/or the editor(s). MDPI and/or the editor(s) disclaim responsibility for any injury to people or property resulting from any ideas, methods, instructions or products referred to in the content. |
© 2026 by the authors. Licensee MDPI, Basel, Switzerland. This article is an open access article distributed under the terms and conditions of the Creative Commons Attribution (CC BY) license.