


Abstract
We envision a minimalist way to explain a number of astronomical facts associated with the unsolved missing mass problem by considering a new phenomenological paradigm. In this model, no new exotic particles need to be added, and the gravity is not modified; it is the perception that we have of a purely Newtonian (or purely Einsteinian) Universe, dubbed the Newton basis or Einstein basis (actually “viewed through a pinhole” which is “optically” distorted in some manner by a so-called magnifying effect). The model is not a theory but rather an exploratory technique that assumes that the sizes of the astronomical objects (galaxies and galaxy clusters or fluctuations in the CMB) are not commensurable with respect to our usual standard measurement. To address this problem, we propose a rescaling of the lengths when these are larger than some critical values, say >100 pc - 1 kpc for the galaxies and ∼1 Mpc for the galaxy clusters. At the scale of the solar system or of a binary star system, the effect is not suspected, and the undistorted Newtonian metric fully prevails. A key point of an ontological nature rising from the model is the distinction which is made between the distances depending on how they are obtained: (1) distances deduced from luminosity measurements (i.e., the real distances as potentially measured in the Newton basis, which are currently used in the standard cosmological model) and (2) even though it is not technically possible to deduce them, the distances which would be deduced by trigonometry. Those “trigonometric” distances are, in our model, altered by the kappa effect, except in the solar environment where they are obviously accurate. In outer galaxies, the determination of distances (by parallax measurement) cannot be carried out, and it is difficult to validate or falsify the kappa model with this method. On the other hand, it is not the same within the Milky Way, for which we have valuable trigonometric data (from the Gaia satellite). Interestingly, it turns out that for this particular object, there is strong tension between the results of different works regarding the rotation curve of the galaxy. At the present time, when the dark matter concept seems to be more and more illusive, it is important to explore new ideas, even the seemingly incredibly odd ones, with an open mind. The approach taken here is, however, different from that adopted in previous papers. The analysis is first carried out in a space called the Newton basis with pure Newtonian gravity (the gravity is not modified) and in the absence of dark matter-type exotic particles. Then, the results (velocity fields) are transported into the leaves of a bundle (observer space) using a universal transformation associated with the average mass density expressed in the Newton basis. This approach will make it much easier to deal with situations where matter is not distributed centrosymmetrically around a center of maximum density. As examples, we can cite the interaction of two galaxies or the case of the collision between two galaxy clusters in the bullet cluster. These few examples are difficult to treat directly in the bundle, especially since we would include time-based monitoring (with an evolving effect in the bundle). We will return to these questions later, as well as the concept of average mass density at a point. The relationship between this density and the coefficient must also be precisely defined.
Keywords:
κ effect; anamorphic; dark matter; galaxy rotation curve; galaxy clusters; bullet cluster; CMB; Hoag’s Object 1. Introduction
Currently, the two concurrent most elaborate models which have been built to eliminate dark matter are the following:
- -
- MOND (alternatively seen as a modified inertia or gravity modified theory) from Mordehai Milgrom [1,2];
- -
- Modified gravity (MOG) from John Moffat [3].
Both of these models have known some success in the interpretation of many observational facts at the galactic and galaxy cluster scales. Both have been the subject of numerous publications. Some relativistic versions of MOND also reflect certain aspects of MOG. Nevertheless, any type of modified gravity introduces new particles associated with scalar and vectorial fields added to the Einstein–Hilbert formalism of general relativity. Then, a question comes up: Where are those new particles in the standard model of particle physics? Introducing new fields in the context of general relativity immediately leads to completing the standard model of particle physics by quantification. Given the sophistication, the approximations or the ambiguities in the calculations, we must ask ourselves whether such a methodology offers a valuable alternative to dark matter. Thus, the path of modified gravity could be fraught with unforeseen pitfalls. In any matter, we believe that modified gravity may one day finally prove to be a false lead in solving the enigma of the missing pseudo-mass. From the outset, any modified law of gravity seems to be hardly acceptable for the following simple reason: at millimeter ranges, the law of gravity has been tested with extremely high accuracy to be the same as between two planets in the solar system (gravitational inverse square law and identical gravitational constant G; see, for instance, [4], although with a massive distance scale factor of ∼1015–1016). Why should this suddenly be different at the scale of a galaxy (although with a much smaller distance scale factor if we compare the interaction between two stars in a galaxy to that governing the motion of two planets in the solar system)?
Other models have more recently emerged [5,6,7,8]. These models spring from altogether different hypotheses, with each of them having advantages and disadvantages:
- -
- According to the approach of Verlinde [5], gravity is an emergent phenomenon, starting from a network of qubits which supposedly encode the Universe. Spacetime and matter are then treated as a hologram. Dark energy, seen as a property of the network of qubits, interacts with matter to create the illusion of gravity.
- -
- In his approach, Maeder [6,7] wonders whether a part of the difference between the total gravitational mass and the baryonic mass could possibly be explained by exploiting the idea of scale invariance of the empty space.
- -
- A totally different way to eliminate dark matter has been also proposed by Gupta [8]. Unfortunately, the model exclusively concerns cosmological items, and important factors such as the flatness of the galaxy rotation profiles or the mass of galaxy clusters are not considered.
On one hand, up to now, all the published models have proposed changing at least one fundamental ingredient in the mainstream physics: inertia, gravity, dynamics, or even the fundamental constants (and even the age of the Universe). On the other hand, we know that, at a “tiny” scale smaller than a few parsecs (planetary systems, binary stars, stellar black holes or even galactic black holes), the predictions made by the Newtonian dynamics or via general relativity (for high velocities and strong gravitational fields) are verified with incredible precision. Thus, we must check that such exotic remodeling of the well-established laws of physics will not affect our immediate environment (i.e., at the scale of the solar system). By contrast, we show here that the famous “missing mass conundrum” can also be challenged without losing any of the well-established principles of the mechanics. Instead of a mechanical origin, we rather propose an “optical” origin [9,10,11,12,13,14]. In that case, the presence of an extremely huge quantity of (non-baryonic) dark matter could quite likely result from an ill-posed problem. This new paradigm (called the effect) appears only when the characteristic dimension of the immense systems studied is much larger than a characteristic length (the domain of galaxies ∼1 kpc or galaxy clusters ∼1 Mpc). It is possible that the dimensions of those extremely huge structures are beyond our direct comprehension, especially if we take for granted at their scale what we know at our small scale. We think that a rescaling of the perceived lengths (and perceived velocities) has to be made. Can we see a kiloparsec as a mere multiple of a meter? This question is currently posed. This is a kind of relativity which supports some analogy with Einsteinian relativity, where the Lorentz factor () is introduced, expressing how much the measurements of time and length change when the velocity is close to the speed of light. Though the approach assumed in the model is quite elementary, it could eventually and surprisingly solve various astrophysical phenomena. The model is Newtonian, but obtaining a relativistic version is straightforward, and it suffices to replace the Newton basis with a pseudo-Riemannian basis.
We start from the well-known observational fact that the rotation profile of a spiral galaxy does not match the Keplerian profile calculated from the observed density distribution. The observed rotation profile strangely appears as a magnification of the Keplerian one. One notable fact is that, following the Sancisi rule, the details of bumps and wiggles are reproduced ([12,15]). Our aim is to reconciliate those profiles with a correspondance principle. We assume a one-to-one correspondance between a domain (called the Newton basis), variable u, where the Newtonian gravity prevails, and a codomain, where the observers reside (a leaf of a bundle, variable r). That correspondance should explain the observed non-Keplerian profile.
To be more specific, in the Newton-basis, a galaxy appears more compact than in the codomain where observers reside, with incredibly tightly winding, quasi-conservative (quasi-solid body rotation) spiral substructure. Under the effect, in the leaves (where the observers reside), the image of this galaxy is distorted via anamorphosis, with strong stretching of the outer regions. The galaxy appears then to have extended untied (and quasi-permanent) arms, which are antinomically associated with a flat profile for the velocities. This is an example of a phenomenon treated by the model.
The effect is not an “optical” illusion as perceived in the classical sense (such as the trivial effect of refraction in any transparent medium); it is rather an effect resulting from some incommensurability between our extremely tiny instrumentation and the massive size of the galaxies. Let us note that other proposals for the dimensionality of extremely huge systems have been made in the literature [16,17]. In these interesting papers, Varieschi invokes that the dimensionality of galaxies plays a major role, while we suggest a relatively similar idea that it is their size that plays a major role.
The effect also has some similarities with refracted gravity [18,19,20], even though in the model, the modification of gravity is a fictitious procedure. Refracted gravity is a kind of gravitational permittivity of the space analog to the permittivity known in electromagnetism.
Even though the proposed procedure seems quite odd, an idea, as daring as it is, should always deserve careful attention.
This type of new reasoning might offer some help in solving the conundrum of the rotation profiles in the spiral galaxies and also other seemingly rather different phenomena.
2. Some Observational Facts
At the present time, many observational facts lead us to conclude that there is a missing mass problem. The four main facts are as follows:
- 1.
- The galaxy rotation profiles
At a large distance from the center, the rotation profile of a typical spiral galaxy does not decrease as predicted by Newtonian mechanics. The addition of a gigantic spherical halo of dark matter [21] or a modification of the inertia or the gravity law solves the problem [1,2,3,22].
- 2.
- The mass of the galaxy clusters
The mass of galaxy clusters appears to be generally quite high, being to the order of about 10 times the visible baryonic mass. Once again, the addition of a halo of dark matter solves this problem, but an adequate modification of gravity accomplishes this too [23].
- 3.
- The Bullet Cluster
The Bullet Cluster apparently represents a quite rare situation in which the lensing diagram is surprinsingly not centered on the baryonic mass (hot temperature gas). The dark matter once again successfully passes the test. By constrast, this observation is not easy to explain in the framework of MOND, whereas MOG manages to accomplish this [24].
- 4.
- The cosmic microwave background
At the present time, all of these observational facts appear to be definitively understood in the framework of the dark matter paradigm and not at all via other models, according to the peremptory assertions of dark matter supporters. How is this so certain? For one, there is the famous determining test of the cosmic microwave background (CMB) anisotropies. However, it has to be said that both MOG [25] and relativistic MOND [26] also easily pass this test.
There in fact exist many models which can explain a wide range of observational facts relative to the missing mass. Dark matter is not the unchallenged leader, as is rather often described in the literature.
3. Mathematical Background
Let M be a differentiable manifold. A Riemannian metric on M is as follows:
where is a definite positive inner product on such that
is smooth (with being the space of smooth tangent vector fields on M).
A structure on a Riemannian manifold is defined by a smooth function with .
When is a structure on the manifold , we have the following:
† The Riemannian metric
is associated to each point o of M, which is a rescaling of the metric g.
† A Riemannian metric on M conformal to g is defined by
Each tangent space is equipped with a set of Euclidean norms:
The norms on associated with the different metrics satisfy
Distances: The distances and on M associated with the metrics g and satisfy
and
Connections: Levi-Civita connections of and satisfy
and
where and is defined by .
Parallel transport and geodesics: Let be a class curve on M.
A tangent vector field along is an application such that
The g covariant derivative along is denoted by . This operator is defined on class tangent vector fields along under two conditions:
† If X is a class tangent vector field defined in a neighborhood of , then the field along has covariant derivative along satisfying
where is the velocity field of .
† If is a function of class , and U is a class tangent vector such that field along
then a tangent vector field U along is g-parallel along when .
For , the parallel transport from to along is the application from to , associating with the tangent vector , where U is the parallel vector field along such that . It is well known that is an isometry from to .
A class curve c is a g geodesic when
It is well known that when c is a g geodesic, the g speed, where , is constant.
As , we have
Let c be a g geodesic. The g-speed and -speed of c are linked by
The geodesic is a class curve solution to
The geodesics are a priori altogether different from the g geodesic curves not even sharing the same supports.
The class curve is solved as follows:
In other words,
has the same supports as g geodesics, but they are parametrized with a constant speed .
For the structure on , if , where is the Euclidean metric, then for all , we have , , and is trivial.
In local coordinates, for two tangent vector fields and , we have
Let be a class curve and be a class tangent vector field along . If , then
A tangent vector field along is parallel when each function is constant.
Let be the parallel transport along from to such that
Then, when the tangent vector field along is g-parallel, we have
and
The geodesics and the geodesics are curves c such that the velocity vector field is parallel along c. They are straight lines parametrized with constant velocities , while solutions to
are straight lines parametrized with a constant .
4. Applications
Let be a structure wherethe follwoing are true:
- (1)
- Each trivial cross-section of the trivial bundleis equipped with the flat Riemannian metrics .
For , we call an o leaf the trivial cross-section equipped with the metric .
- (2)
- We also obtain an a priori non-flat Riemannian metric on
4.1. Postulate of the Kappa-Model
For any point o in the universe, we associate a “sitting observer” O, where its phase space is assumed to be Euclidean. We assume that the physics locally experienced by a sitting observer does not depend on its location. For example, two sitting observers that are far apart and holding a hydrogen atom would agree on its size or on its emission spectrum. Therefore, an itinerant standard meter can be defined using an “apparently” non-deformable object an itinerant observer would carry while traveling.
A effect appears when a sitting observer uses its local tools of measurement to measure the distances between objects located in a region R, where the rescaling coefficient is different from its own.
4.1.1. Consequences of the Postulate on Metrology
Metrology of Distances and Consequences
Let E be an Earth-based sitting observer at the location e (the Earth). Let be objects in the Universe. The sitting observer E interprets the locations of those objects and their possible motions as if they were taking place in the e leaf (Figure 1).
Figure 1.
The objects and appear to E as being in the e leaf.
Technically, there are different ways to estimate the distances :
- -
- For close objects (up to about 1 ), the sitting observer E uses trigonometric parallax methods to estimate radial distances; in other words, the sitting observer uses his or her local tools and obtains . If and are close enough to e, then some trigonometry gives the distance (i.e., the distance in the e leaf between the “replicas” of and seen by E).
- -
- When an object is located too far away to use parallax methods to evaluate its distance to Earth, metric information is retreived from information carried by light, such as the ratios between the intrinsic magnitude and observed magnitude (Cepheid method). Furthermore, the number of stars in a given region is not subjected to the effect. In other words, the luminosity is not affected by the effect. The distances measured by these kinds of methods are the distances that an itinerant observer would obtain, which we denote by and call the photometric distance. They are valid for close galaxies and are distances on the Newton basis (see Figure 1). To find an estimate of the distance between two distant objects and , the sitting observer E has no choice but to use the effect independent angle and the photometric distances and , obtaining an “apparent” distance proportional to .
Aside from the apparent distance , we also have the (non-measurable) distances or 2) in the and leaves fulfilling the relation
If is a segment located in a region R where the rescaling coefficient is constant, then we have
Let us now consider and , two segments located in two different regions R and , where the rescaling coefficients are constant, with in R and in . The segments S and have the same length in the “Newton basis” whenever
To any sitting observer O located at o, S and appear to have different lengths:
This induces a distorted perception of the “transverse” shape of distant objects for any sitting observer, as shown in Figure 2:
Figure 2.
To sitting observers, the regions where appear dilated with respect to the regions where . In the case of an inner region with a higher value, the outer region seems to expand (and may generate a gap if has discontinuity). In the case of an inner region with a lower value, the inner region seems to overlap the outer region.
Let and be two segments with same length in the Newton basis located in a galaxy far enough from e that can be considered independent of . The ratio of apparent lengths of those segments equals the ratio of the rescaling coefficients of the regions containing them. For two regions having same size in the Newton basis, the region with the lower rescaling coefficient appears wider. As shown in Figure 1, this induces the shape of obtained by a sitting observer being anamorphic relative to its shape in the Newton basis.
Another effect could be a radial deformation. Assuming that the sitting observer E measures the radial distances using trigonometric techniques, a region with a low rescaling coefficient would appear further away than a region where the rescaling coefficient is higher, even though the photometric distances are the same. These “trigonometric” distances are fictitious (they are not distances in the Newton basis) and not measurable because we observe the Universe through a “pinhole” suppressing perspective (such as in the Ames room). To see these effects (if they exist), a device with two telescopes separated by more than a few parsecs would be necessary. Nevertheless, this would imply a radial distortion in the leaf of the sitting observer E. In Figure 3, this distortion is shown in the case of a galaxy with a density that decreases from its center.
Figure 3.
(blue) Density of a galaxy in the Newton basis. (red) Density of its anamorphic counterpart in the e leaf (photometric image). (green) Secondary image (an artificial process, fictitious and non-observable, for constructing a photometric image which is fictitious but observable). (orange) The trigonometric image, located behind the photometric image when . From an angular point of view, both the photometric and trigonometric images are perfectly superimposed.
When observing an object with a lower density in its central part, like the Bullet Cluster, the deformation shown in Figure 3 would be reversed; trigonometrically, the outer part would appear closer than the central part of such an object.
Metrology of Velocities
As time is effect free, frequencies are too, and then the spectroscopic measurements of the radial velocity are evaluated as in the Newton basis.
Transverse velocities are not often technically observable, but when and if they are, they would be affected by the effect.
Metrology of Masses and Densities
We assume that the mass of a given region R of the Universe is unaffected by the effect. This means that whether a given region is considered in the Newton basis or in a leaf, it has the same mass. On the other hand, volumetric mass densities and areal mass densities are, of course, affected by the effect (with a factor or ).
The model has no real consequences for what happens in a hidden reality, dubbed the Newton basis. Its consequences are metrologic and not directly perceived at our tiny scale, yet they exist at an extremely large scale.
According to the model, measurements of physical quantities which rely in one way or another on the use of a standard meter far away from the observer are affected by the effect. On the other hand, mass, time and luminosity are not subjected to this effect.
As measurements of the areal mass densities are affected by the effect but spectroscopic velocities are not, the effect could explain the discrepancy between the Keplerian velocity profile predicted by the observed density profile (apparent transverse distances) of spiral galaxies and the observed velocity profile (radial velocity). This might also explain the discrepancies in the evaluations of the dark matter/baryon ratio in the Milky Way obtained by different methods. (As a matter of fact, the estimate of the content in dark matter strongly varies, depending on the method used [27,28]. On the contrary, in the model, the proper motions (tangential motions) and the radial motions estimated for the Earth have to be treated differently. In the framework of this model, the proper motions which are seen are fictitious (considerably magnified in the region where the mean density is weak), while the measured-by-spectroscopy radial motions are real quantities (even though the line of sight can be displaced; see Appendix B). However, this suggestion remains difficult to verify, as it would require an incredibly good understanding of the average surface density in the Milky Way along a galactic radius. However, we can think that the rotation curve determined by using the model will probably be a compromise between a flat curve (such as that predicted by the dark matter paradigm (MOND or MOG)) and a purely Keplerian curve. In order to validate this, however, much work remains to be undertaken, requiring a reinterpretation of satellite data from GAIA, particularly the proper motions, the evaluation of which now depends on the mean density. In other words, the rotation profile of a galaxy is not seen in the same manner, depending on whether one is inside a galaxy or outside. The great interest of this work would thus be to be able to discriminate between MOND and the model, which both give fairly similar rotation curves with regard to other galaxies [12] while producing a different rotation curve in the special case of the Milky Way.). Eventually, the transverse anamorphosis described in Figure 2 might also give an explanation for some anomalous shape observations, like Hoag’s Object.
4.1.2. Consequences on the Dynamics
- -
- The usual dynamic equation is changed:
- -
- For a free motion constant, we find that .
- -
- During a displacement, the invariant reference length is . However, a terrestrial observer measures , and if this measurement could be made, then he or she would conclude that the reference length varies in the Universe! ( effect). Obviously, this effect is an illusion, and the true reference length does not vary (the displacement of an atom does not modify its size).
Some physical quantities are measurable, but others are not.
| Measurable | Non-measurable |
| Photometric measurement | (fictitious) |
| Spectroscopic velocity measurement | (fictitious) |
| proper motion measurement |
Here, is the outer region of the galaxy, and is the extragalactic medium.
4.2. Calibration of the Kappa Effect
We now attempt to reconcile Newtonian mechanics and observations of the velocity profiles in the outer rims of spiral galaxies. It happens that the observed velocity profiles do not match the velocity profiles predicted by the apparent distribution of mass. We propose here an adjustment of the effect such that the velocity distribution and the mass distribution are related, in agreement with the effects of Newtonian gravity. The dark matter approach reconciliates the observed and predicted velocity profiles by introducing a “missing” mass and consequently modifying the mass distribution, while MOND and MOG approaches modify the Newtonian mechanics. On the other hand, the model approach is different because it modifies the sole perception of geometry, whose consequence is a modification of the mass distribution; but unlike the dark matter model, the adjustment of the effect is directly linked with the observed mass densities.
We request that for objects moving in his or her immediate vicinity (a few parsecs), a sitting-observer O experiences no discrepancy between the predictions of Newtonian gravity and the distribution of masses as he or she measures it, while for far away objects (in regions with a rescaling coefficient different from ), the effect acts and explains the discrepancy between the Newtonian predictions and observations.
4.2.1. Mass Distribution and Velocity Profile in a Spiral Galaxy
Mass Distribution in a Leaf Versus Mass Distribution in the Newton Basis
We assume that to an Earth-based sitting observer E, a spiral galaxy appears as a flat disk with a center C and a centrosymmetric apparent mass distribution.
For as a point in , the following statements apply:
- -
- Let denote the distance in the e leaf between and the center C of .
- -
- Let be the areal mass density profile apparent to E.
- -
- Let be the velocity profile predicted by the Newtonian mechanics according to the density profile (which is problematically not observed).
A Newton basis-based observer (itinerant observer) would measure geometric quantities in an altogether different manner.
The following apply for Box 1:
- -
- The distance between and C would be
- -
- Assuming conservation of local mass, the mass of a given region does not depend on whether it is measured by a sitting observer or an itinerant observer.
The areal mass density (This relationship univocally links and .) would be
- -
- A velocity profile is predicted by the Newtonian mechanics according to the profile .
By normalizing , we find that
Box 1. Postulate
The space phase associated with any observer O located at o is assumed to be Euclidean. A local scaling is made:
where is a strictly positive coefficient depending on the location of the observer.
Both the function and the distribution are non-observable and therefore unknown. What is observable is the velocity profile associated with the density profile . It should then match, after the anamorphosis , the typical velocity profile observed by E.
Having no direct way of observing either or makes it difficult to obtain them.
Looking for a biunivocal pairing reconciling the observed and theoretical velocity profiles would be quite interesting because the model would then rely on a single postulate without the addition of a series of auxiliary (and ad hoc) parameters, as is the case for the dark matter paradigm.
However, for now, a complete adaptation producing a mass distribution in the Newton basis corresponding to an exponential mass profile observed in the leaves remains an unproven conjecture. We will be working on this in the next project, but before then, some preliminary tests are presented here.
We impose supplementary (reasonable) conditions on the functions and :
- -
- The distribution must be stable against gravitational perturbations.
- -
- The distribution and the rescaling should produce the observed velocity profiles.
It has been well known for a long time that a self-gravitating Newtonian thin disk is rather unstable [29]. A compact disk with a McLaurin distribution (or quite close to it) in the Newton basis could be more stable than the thin and highly extended exponential disk which is fictitiously seen in the leaves. This statement has yet to be checked. On the other hand, in the Newton basis, if the objects described are now more compact, then they are therefore necessarily subject to greater friction [30]. Likewise, if the galaxies are rounder and appear as more or less flattened ellipsoids, then the razor-thin disk hypothesis employed here in the Newton basis is a rather crude approximation. Making use of more refined techniques, such as a thickened disk like the one presented in the Miyamoto–Nagai model [31], would be more appropriate. Furthermore, employing two parameters instead of only one would enable more precise control over the resulting velocity field, a task that will need to be completed in the future.
Coupled with a rescaling function close to the one already used in our previous works [10,11,12], the mass distribution should produce a velocity profile close to the observed profile.
Another difficulty is that a spiral galaxy is not composed of an unique disk but of two disks (gas and stars), and in a number of cases, a (small or big) bulge must also be added.
When we examine the observed velocity profiles listed in SPARC or other catalogues [32], we can see that a small series of archetypical profiles appears. Another approach to pursue is to build a catalogue of theoretical cases, assuming a McLaurin-type mass distribution in the Newton basis. In order to produce a predictive observed velocity profile, we do not want to introduce arbitrary parameters (as is unfortunately the case for dark matter). Nevertheless, we impose some conditions on the couple for each disk (Box 2).
Box 2. Conditions
For a function associating with each point of a galaxy with a decreasing centrosymmetric mass distribution, its rescaling coefficient should satisfy the following:
(C1) It has strictly a positive infimum and maximum;
(C2) It is centrosymmetric;
(C3) It has the same variations as ;
(C4) .
Condition (C4) springs from the fact that we assume that for a point moving radially inward, the galaxy should be seen moving radially inward by any sitting observer.
We required that in the Newton basis, the mass distribution of a spiral galaxy has compact support. Following condition (C1), the mass distribution of the same galaxy in the sitting observer leaf must have compact support. This is the reason why we use the usual exponential distribution (where is the density at the center measured by the sitting observer E), with a strong cut-off at :
Here, we normalized the maximal density and chose , but this condition is not restrictive and does not alter the generality of our purpose. In other words, the quantity is not an arbitrary parameter of the model. We could have choosen any value (likewise for the large cut-off exponent 100). We started then with an observed mass distribution profile with the support . For the sitting observers located in a region with , the observed profile is displayed in Figure 4.
Figure 4.
A real density profile of the same spiral galaxy seen by three sitting observers and B at and b with .
The McLaurin-type function has the form given below:
With the support and maximal densities , where is the rescaling coefficient at the center, the total mass conservation imposes a relation between a and A. For instance, for , we would find . The corresponding density curve is displayed in red in Figure 5.
Figure 5.
Mass density in the Newton basis.
For the McLaurin function, we have
The conservation of the total mass in this case yields .
Unfortunately, in both cases, the function satisfying both Equations (1) and (2) does not fulfill condition (C4).
On the contrary, we can choose a rescaling coefficient function fulfilling conditions (C1–C4) and compute the density distribution in the Newton basis accordingly. The function such that with
satisfies conditions (C1–C4). We have with , and the “-adapted” density distribution in the Newton basis corresponding to the profile (Equation (2)) is
This density profile is displayed in blue in Figure 5.
In Figure 5, we also display with a dashed red line the quadratic mean of the density profile and the McLaurin-type profile.
In the case of a galaxy modeled by two disks (stars and gas), the areal mass densities in the Newton basis and in the leaves are the sum of two areal mass densities with different parameters:
where for each component ()
and they are completed with the closure relation
for or the inverse ratio when .
The reference density is the mean density in the vicinity of the Sun (∼). Another condition which has to imperatively be respected is the invariance in the total masses for each component.
Velocity Profiles in the Newton Basis Versus in the Leaves
The relation between the velocity profiles in the Newton basis and in the e leaf is then obtained by using the following relationship, which is valid for a thin disk:
where is the rescaled length r seen in the Newton basis (we use here the more manageable relation ). The symbols and represent the complete elliptic integrals of first and second kind, respectively.
Figure 6 shows the rotation velocity profiles. We see that the velocity profile corresponding to the -adapted profile is a replica of the Keplerian curve (following the Sancisi rule; see also [12], where this rule is thoroughly checked), but it is now magnified by a factor of 1.5–3 while also appearing a little flatter. In order to compare our universal profiles with MOND, we took 100 km/s and as reference units for the velocities and distances, respectively (These values are the reference values chosen in [12].) for a massive disk with and ).
Figure 6.
Velocity profiles.
Whereas a fairly good agreement could be obtained for large distances (r = 10–20 ) between the -adapted and MOND profiles, for small distances, the -adapted profile presented a hump which was practically absent in the MOND profile. However, while this hump in the Keplerian profile is high (peak velocity over terminal velocity to the order of three), this ratio was lowered to 1.5 in the -adapted profile.
We can see in Figure 5 that the -adapted mass density curve is relatively close to the McLaurin-type one. By contrast, in Figure 6, we note that by modifying the density distribution even slightly (to the order of 15 percent) in the Newton basis, we obtained a quite substantial change in the shape for the rotation profile seen in the bundle where any observer had access (to the order of 40 percent for the terminal velocities). Let us also note that the quadratic means of both the -adapted and McLaurin-type (case ) surface density curves would give a quasi-flat rotation profile with a tiny hump, despite being above the MOND profile by (profile displayed as a dashed red line).
Acceleration Profiles
To start with, it is worth noting that the model checks the Tully–Fisher relation (similar to MOND). By referring to the diagram presented in Figure 2 of [12], the asymptotic rotation velocity is displayed as a function of the asymptotic Newtonian velocity. The latter is proportional to the total mass of the galaxy. Expressed as a log-log relation, the diagram of this figure leads to the Tully–Fisher empirical relation. However, it is also interesting to compare the terminal accelerations. The results are superimposed onto the observational data supplied in [32]. The -adapted velocity profile was a close match to a radial acceleration relation (RAR)-like (displayed as a blue line), whereas this was not the case with the McLaurin-type profile (displayed as a red line), which can be seen located quite far above the observational data (this is due to the fact that the magnification factor for the velocities was too high in the case of the McLaurin-type density profile, being to the order of four instead of the order of ≤2–3 as observed). However, this is not a real surprise, because a perfect McLaurin density profile for a disk (taken in the Newton basis) was already excluded from the outset by the non-fulfillment of Condition (C4) and Equations (1) and (3) simultaneously.
For most of the rotation profiles of the SPARC catalogue [33], corresponding to galaxies small in size (), deprived of a bulge, and with a Keplerian hump (when it exists) smaller than 1.25, we must then limit the universal curves presented in Figure 7 to the range [0, 7]. As references we take the following:
- 1.
- km/s and (for and );
- 2.
- km/s and (for and ).
Figure 7.
Radial acceleration relation (RAR). (a) [32]. (b) [34]. We surimposed the RAR-like curves of our models (blue = -adapted; red = McLaurin type).
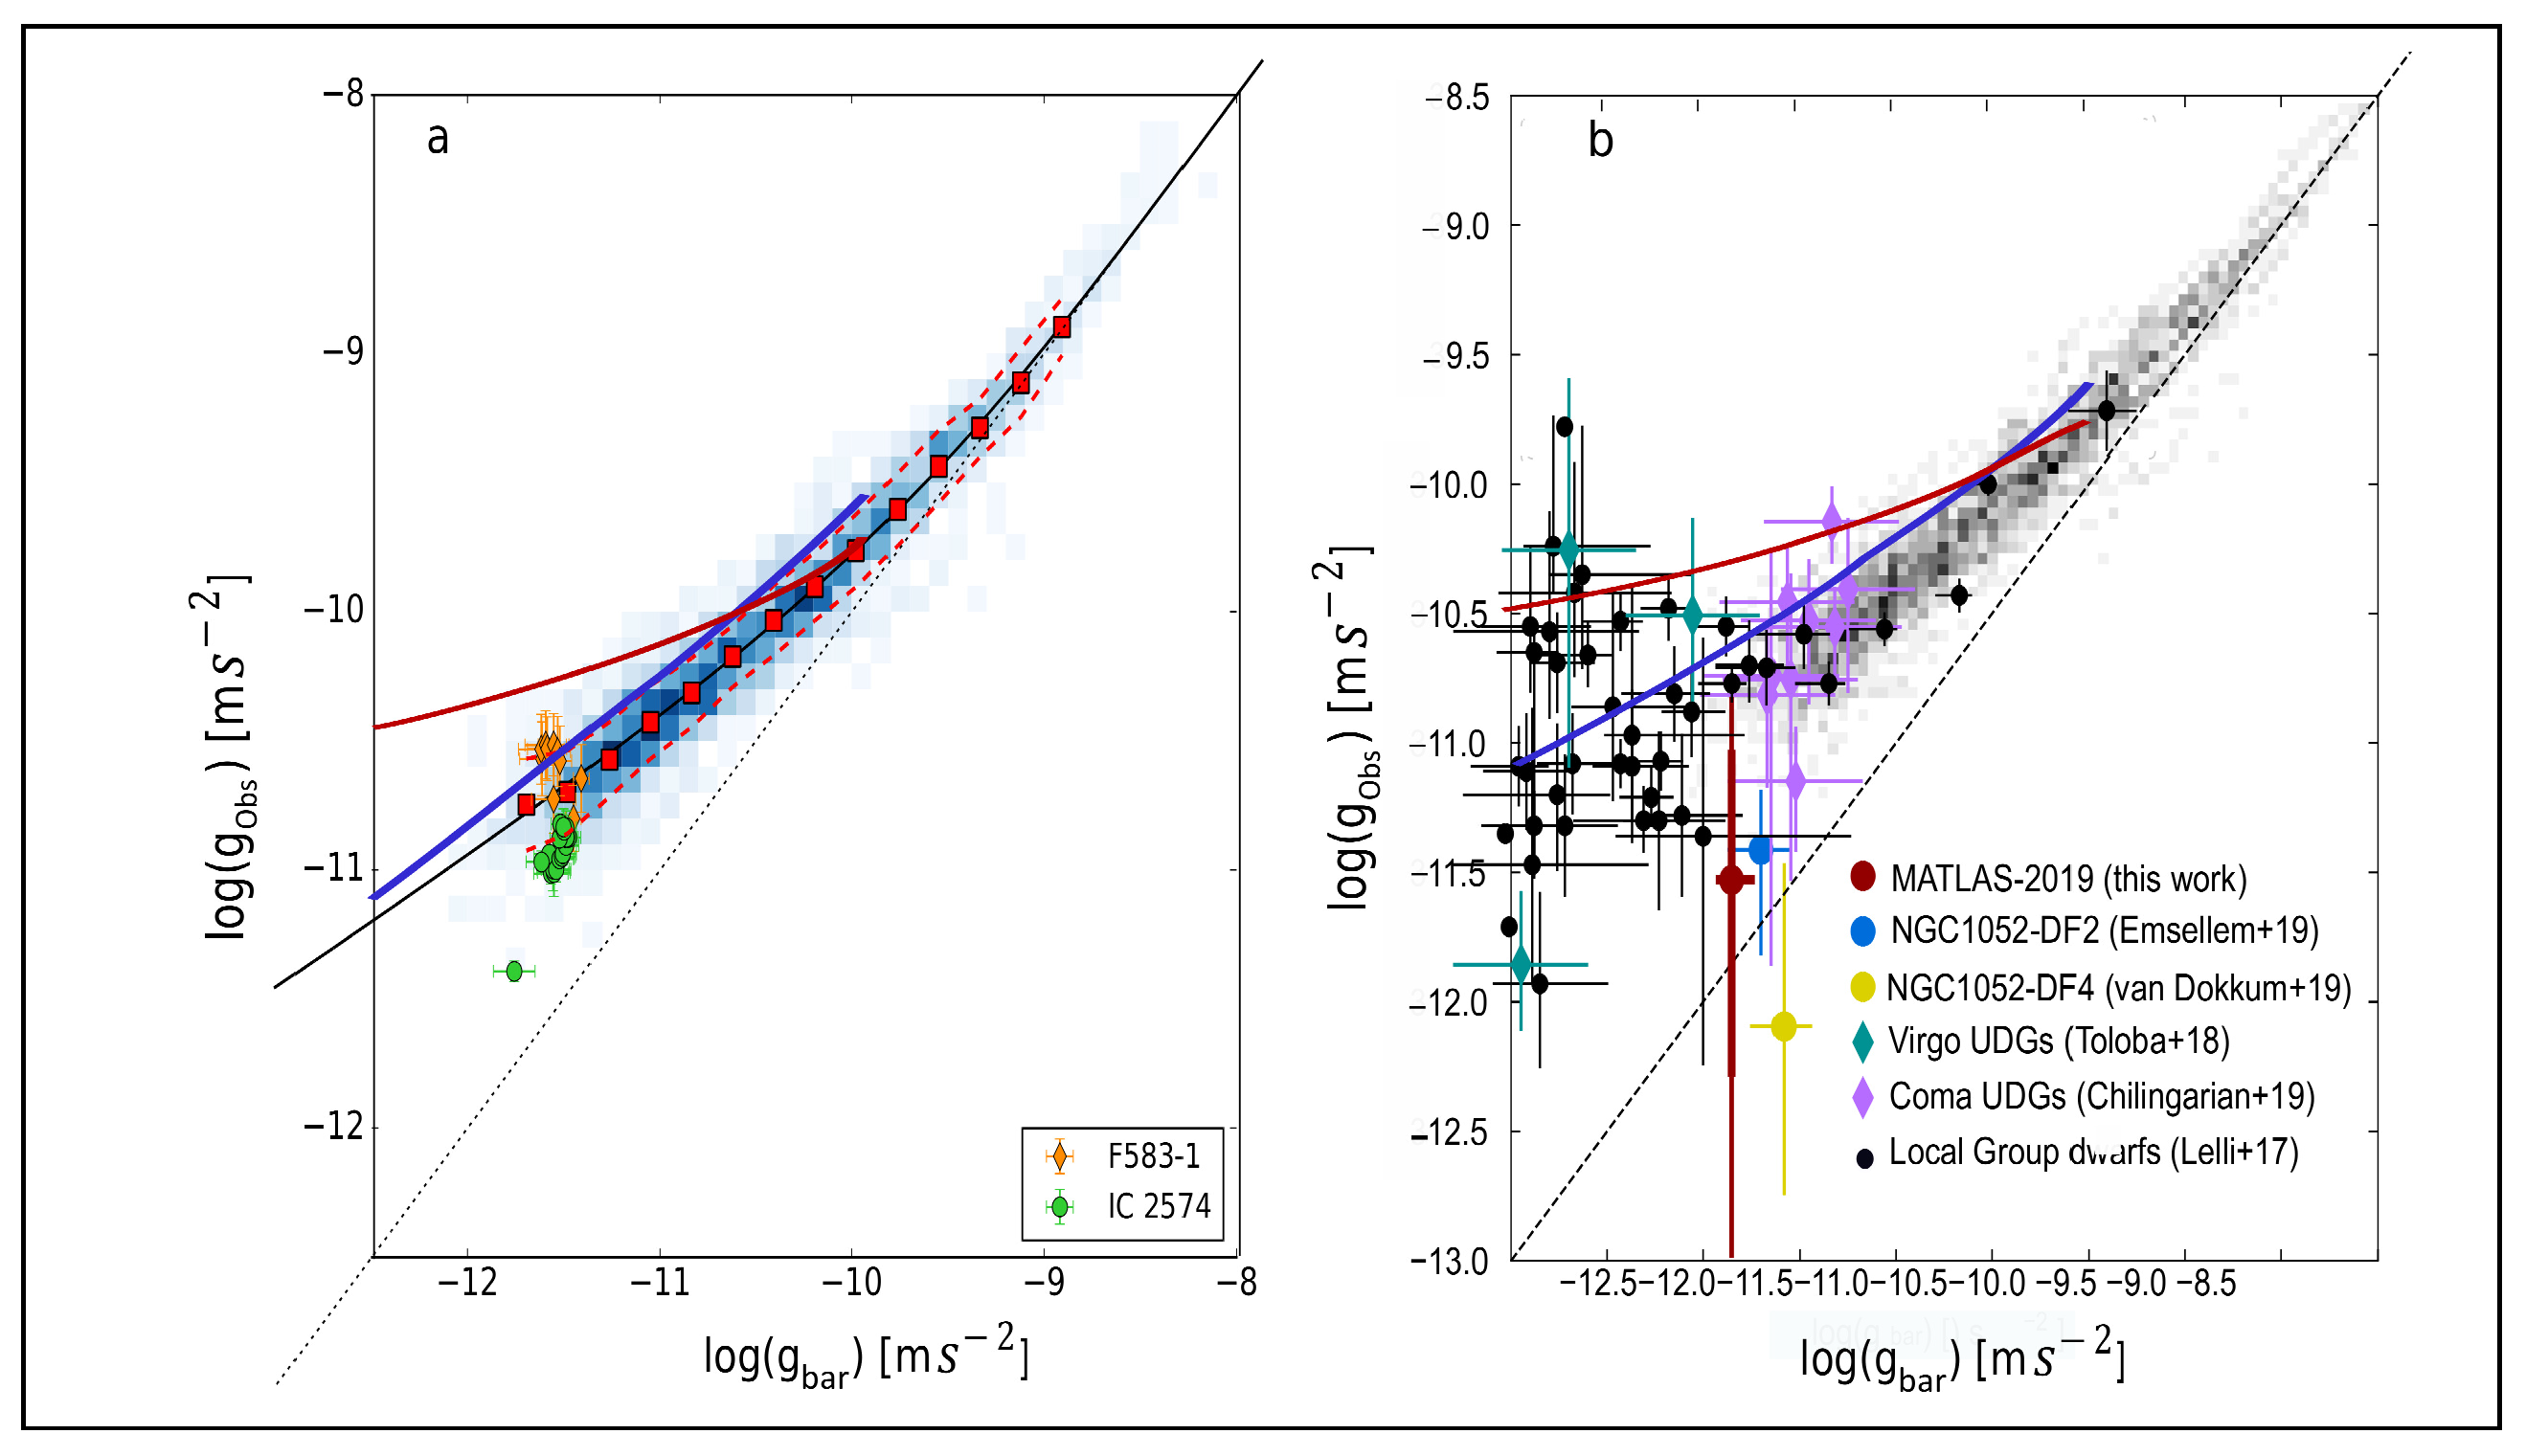
In both of these cases, the magnification ratio was high, as observed for most of diffuse galaxies (case 1 = 2.5 (2.0 for MOND); case 2 = 3.8 (3.3 for MOND)). Such high magnification ratios appeared for low accelerations (≪ ms−2) in MOND and low densities () in the model. The dark matter paradigm was not able to predict such a statement, apart from an ad hoc manner. In any event, the low density ( model) and low accelerations (MOND) seemed to be well correlated in the galaxies. The main reason for this is that the parameter itself in MOND seems to be associated with the mean mass density taken in the Sun’s vicinity in the Milky Way (solar mean mass density) (More rigorously, this value is not equal to but relatively close (within a factor two) to the galactic surface mass density estimated in the solar region, that being ∼ (in comparison with the high range of surface densities seen in a disk galaxy, varying from ∼ in the inner regions to from the center to in the outskirts from the center).), which is considered as a density reference for all the densities in model. Let
MOND and the model give similar profiles for the galaxies [12], especially for the prediction of terminal velocities (Figure 8). However, we know that MOND cannot be extended to the galactic clusters without reintroducing some quantity of dark matter, whereas the formalism of the model can be directly applied to these objects [13].
Figure 8.
McLaurin-type, -adapted and MOND velocity profiles for Case 1 (continuous lines) and Case 2 (dashed lines).
However, another clear difference is that while in MOND, is seen as a cosmological parameter [15], in the model, this paramater is rather seen as a local parameter. In addition, we recall that within the dark matter paradigm, two or three free parameters per galaxy and an empirical relationship are needed, whereas in MOND, just one unique parameter (i.e., ) and an empirical relationship are needed. For the model, there are no longer free parameters but just an empirical relationship linking the mean density to the scale factor (assuming that in the three models, observational measurements lead to the same set of data).
The predicted curves (McLaurin, -adapted and MOND) differ between each other by . This seems to offer predictions of low quality. Admittedly, it was not expected that the observational data would be much better (the Milky Way, M33, etc). However, the agreement between MOND and the model was found to be better in [12], but we reasoned directly with the bundle without involving the Newton basis, for which information on the mass density profile is still not well known.
The following applies to the galaxies with an observed Keplerian rotation profile.
Eventually, expressing the ratio as a function of showed fairly good agreement with the observational data from SPARC when . When (ultra-diffuse galaxies), both MOND and the model predicted values higher than the observed ratios. Sometimes, this ratio was close to the unit (mimicking an absence of dark matter). This represents some tension for MOND or modified gravity. On the contrary, the model is more flexible and can solve this difficulty by noticing that such low ratios appear for galaxies with a size smaller than . In this case, the geometrical thickness is smaller, the volume density is much higher (for the same surface density), and the ratio is lowered. This statement can even be used as a criterion to predict the geometrical thickness of these galaxies (Figure 9).
Figure 9.
Ratio as a function of . The blue dots are the SPARC data.
4.2.2. Shape of a Spiral Galaxy and the Winding Problem
There are two ways to describe the shape of a spiral galaxy : the shape seen by a (far away) sitting observer E (observable) and the shape that would be deduced from measurements made in situ in a non-observable hidden Newton basis. In the latter case, the mass distribution is much more concentrated than in the e leaf (Figure 10 and Figure 11).
Figure 10.
Representation of a spiral galaxy in the Newton basis with different inclinations (not observable).
Figure 11.
Visualization of a spiral galaxy in a leaf (e.g., by a terrestrial observer). The observed galaxy is obtained by transport from the Newton basis.
The Winding Problem
Another intriguing question is the winding problem of spiral galaxies. In a spiral galaxy, the outer matter (stars and gas) lags behind the inner matter, causing the spiral substructure to wind up tighter and tighter until ultimately disappearing. This conundrum is solved by various models such as density waves, stochastic self-propagating star formation, or still swing amplification theory. However, the model also offers a simple, though partial, solution [10]. The criterion is based on a measurement of the logarithmic derivative of the angular velocity let into the Newton basis and the bundle within the outer region of any galaxy . Figure 12 displays the ratio of these logarithmic derivatives (using the -adapted rotation profile). We can notice that this ratio was smaller than the unity by a factor when (i.e., the spiral substructure can be seen to have persisted much longer). The winding problem was thus strongly lessened, although not fully eliminated (the wave density phenomenon has to still be present, but it can now act more efficiently). An interesting conclusion is that both the flat rotation profile and the almost steady nature of the spiral design are correlated in the model. Let us still note that the angular velocity is an invariant of the transformed Newton basis toward the bundle. It would seem then that the angular momentum is not conserved in the process, but this fundamental law of physics is in fact saved when we know that this transport does not represent a “mechanical” reality but a fictitious transport.
Figure 12.
Ratio of the logarithmic derivatives bundle/Newton basis, expressed as a function of r.
Another Approach to Calibration of the Effect
From the point of view of an itinerant observer, the mass invariance when we transition from the Newton basis to the leaves is written as
We must solve this differential equation. As an example, we take now, always in the hypothesis of the thin disk, the archetypical McLaurin function (A McLaurin profile (quadratic in u) slightly differs from the McLaurin-type (linear in u) profiles used above.)
Let us note again that the numerical factor introduced here and there in the model ( here) is not an arbitrary (ad hoc) parameter. It is automatically determined when we normalize the total mass to the unity (as in the bundle, by mass conservation). We also take (for the velocities, corresponds to 50 km/s, and for the distances, corresponds to ). Figure 13a displays the velocity profile in the Newton basis, and Figure 13b shows the corresponding profile in the bundle (what is seen by the terrestrial observer). In the Newton basis, the galaxy possesses a solid-body rotation (and any spiral substructure is conservative), while by contrast, in the bundle, the velocity profile (measured via spectroscopy) can be seen to be flat beyond . (In some cases, this flatness can be followed up to massive distances from the galaxy’s center through weak gravitational lensing measurement [35,36]. This type of observational data is uneasy to explain with dark matter because a massive quantity of this exotic matter would be needed for that. On the other hand, it is rather easy to explain this with MOND or the model. In the framework of the model, the phenomenon is located beyond the mass density galaxy cut-off (quite well determined in the Newton basis but not in the bundle). In this region, the mass density is extremely weak, and the (fictitious) stretching of space incredibly strong. An extended and flat weak gravitational lensing appears in the bundle. To put it more precisely, let us consider the possibility that an isolated galaxy is embedded in an extended, spherical halo of baryonic matter with a rather low density, whose radius is an order of magnitude larger than that of the galaxy itself (defined in the Newton basis). Rather than assuming a constant mean density, we suppose that the (volume) density profile scales as , where u denotes the radial distance in the Newton basis. For values of the exponent a close to unity, this configuration is somewhat analogous to a galaxy cluster surrounded by a diffuse, low-density baryonic halo, transposed here to the case of an isolated galaxy. Under transport to the bundle (where the observers are located), such a halo undergoes strong differential stretching, owing to the weakness of its mean density. If the coefficient is assumed to be proportional to in the Newton basis, and is proportional to , then any function of u (for example, the distortion field of background galaxies) is mapped into a function independent of the radial coordinate r in the bundle. This transformation naturally leads to an amplified and approximately flat gravitational lensing in the bundle (where the observers reside). Using the laws and (an order of magnitude estimate of the distortion due to gravitational lensing), we have and , respectively.) Obviously, the mass density in the Newton basis is not a perfect McLaurin profile, as the velocity curve is also not perfectly linear. The spiral arms wrap around, but the characteristic winding time is now increased by a factor of 3–4, i.e., it is ∼ instead of ∼.
Figure 13.
The velocity v is the spectroscopic velocity. (a) in the Newton-basis, (b) in the Bundle.
Let us note two interesting points. First, the ratio (reported from the Newton basis to the bundle) is to the order of two. This is the mean ratio observed in the SPARC catalogue (Figure 9). The second point is that the velocity curve in the Newton basis is a linear function of u (as a first approximation, the profile in the Newton-basis is not a perfect McLaurin type). Knowing the measured spectroscopic velocity (SPARC catalogue) as a function of the distance r, we can deduce (link between u and r) and then automatically the mean density in the bundle (the inverse of the method used in [37], where the spectroscopic velocities were obtained from the mean density). This work remains to be performed.
This illustrates again the deep difference between the trigonometric (not technically measurable, as galaxies appear as frozen images on a sky background) and spectroscopic (real) measurements.
4.3. Other Phenomena Interpreted in the Framework of the Kappa Effect
The model was initially built to match a galaxy’s rotation profiles without any free parameter. In most cases, the mean profiles are represented by monotonous curves, and it is easy to separately fit each of them with two or three parameters, which differ from one case to another. This is the proposal of the dark matter paradigm, and therefore its predictive power is weak. This situation is difficult to accept, and many authors have tried to conceive models with a minimal number of free parameters. We concede that the fits obtained with those models are generally not as good as those with the dark matter paradigm, but those models remain sufficiently predictive. Today, the best model is MOND with just one external parameter. Another criterion is that this model has the same degree of simplicity as the dark matter model. The models of modified gravity recently built by some authors do not always respect this criterion. On the contrary, the model is a phenomenological model. The cause of the apparent magnification of lengths is not explicit and remains undetermined, but this magnification is fictitious and depends on the observer.
The model produces rotation profiles for spiral galaxies substantially similar to MOND [12] (Figure 14). Other differences exist with dark matter. It is difficult to make any conclusions at this stage, because dark matter follows an ad hoc path which runs in any situation, even if the observed curve is biased (such as due to a bad inclination or distance). For instance, for M33 (Figure 14), a clear break in the profile appears at , likely because the inclination suddenly changed. This effect is not taken into account by the theoretical curves. In this case, what is the best profile? In contrast to dark matter, MOND, MOG and the model supply predictive, although imperfect, methods. A larger sample of galaxies is presented in [12].
Figure 14.
Observed rotation curve of the galaxy M33 is displayed ([38], Figure 9, where red dots are the results for the receding side and blue dots are those for the approaching side), together with the theoretical curves predicted by the dark matter model (black line) and (hydro)simulation of MOND [39] (green line). Our added contribution ( model) is represented by the blue line. This is an example where, when following the observational data (with different inclination and distance values), the rotation profile can be fitted better or worse by MOND or the model than dark matter. Another problem is that the receding and approaching side profiles are sensibly different ([38], Figure 9).
On the other hand, in the dense bulges of galaxies and in elliptical galaxies, the model predicts a return to classical Newtonian gravity, consistent with MOND at high accelerations above the critical value . By contrast, in the satellite galaxies of massive hosts, the central densities are often low. The model predicts enhanced rotation velocities even near the core, similar to MOND, where modified dynamics emerges in low-acceleration regions.
Surprisingly enough, the model also applies to a rather heterogeneous set of phenomena that is seemingly not connected. Indeed, at the present time, these phenomena have been explored through rather different theoretical methods:
4.3.1. The Mass of the Galaxy Clusters
The model was also applied to the missing mass of galaxy clusters. Once again, it succeeded in predicting the apparent Newtonian mass, and it can rival MOG [23] (Figure 15) but without the need to modify the gravity. A larger sample of galaxy clusters is presented in [13].
Figure 15.
COMA cluster profile (reproduced from [13]). The horizontal axis is the radius in , and the vertical axis is the mass in units of the solar mass . The black curve is the ICM gas mass derived from X-ray observations (compilation of [40]). The short, dashed blue curve is the Newtonian dynamic mass, the dashed-dotted cyan curve is the MOND dynamic mass, the solid black curve is the dark matter profile, and the dashed red line is the MOG results. Our added contribution is displayed as the amber curve, showing the model’s dynamic mass with the temperature T = 8.38 keV. The solid green curve displays the model’s dynamic mass, assuming a non-isothermal temperature profile.
4.3.2. The Bullet Cluster
The gravitational lensing of the Bullet Cluster ([41,42]) illustrates an unusual aspect of the model, namely the possibility of having superimposed images when a region with a weak density is surrounded by a region with a much higher density [13]. This effect is fictitious, but the “reality” for us is what we observe (i.e., the images received by our telescopes). In Figure 16, the dark matter and kappa model diagrams are compared and appear rather similar, even though the interpretations provided were quite different. Figure 17 displays the gravitational lensing diagram observed for the Bullet Cluster.
Figure 16.
A comparison between the gravitational lensing diagrams supplied by both the dark matter paradigm and the model [13]. (left) The total weak gravitational lensing. It is the product of the weak gravitational lensing in the basis (the well-known Einstein effect). (It is much simpler to make the model relativistic, unlike in the case of the MOND. Replacing the Newton basis with the Einstein basis is enough. We start from the (fictitious) associated with the proper leaf of the terrestrial observer . We apply the transform (or corresponding principle) to the quadratic form (the time is left unchanged by the -transform), () and , ). Here, and do not reside in the same space ( is in the tangent space) and are independant. Thus, more generally, they can even be multiplied by a different factor. Then, we obtain the true , which is to say the one expressed in the Einstein basis . In addition, let us note that the scaling coefficient depends on the mean density via a logarithm law. The reference for the density is the maximum value taken in the object under study (galaxy, galaxy cluster or CMB spot). As an illustrative example, let us take the case of a photon moving along the axis in the basis. In a region where the gravitational field is negligible, , which we usually set as . We have , and a local sitting observer measures , i.e., the universal speed of light (as required by the special relativity). On the other hand, from the point view of the terrestrial observer, whom is expected to also measure c (as in his or her local proper environment), he or she instead measures , which can be superluminal when (however, it is a fictitious speed).) The curvature of the photon geodesic initially generated in the Einstein basis is then strongly amplified in the leaves by the effect (mainly where the mean density is lowest). In addition, let us note that the pseudo-Riemannian curvature in the Einstein basis and the curvature in the bundle are deeply distinct in nature.
Figure 17.
Gravitational lensing diagram observed for the Bullet Cluster (from Wikipedia).
4.3.3. The Anisotropies of the Cosmic Background (CMB)
Up until now, application of the model to the anisotropies of the cosmic background has not been carried out. The Newtonian theory of small fluctuations presented by Moffat and Toth [25] is easily transposable to the model. By manipulating three fundamental equations (the continuity equation, the Euler equation and the Poisson equation), these authors obtained the equation for every Fourier mode of the fractional amplitude of the density perturbation (in [25], Equation (34) (Newtonian gravity) and Equation (64) (modified gravity) are similar):
where H is the Hubble constant, the speed of sound and is the co-moving wavenumber. The constant G is the gravitational constant, i.e., in Newtonian gravity, but G becomes variable in modified gravity (in this case, the notation is ). In this equation, the modification made by the kappa model affects the density . Let be the measurement of volumic density made by a terrestrial observer and be the volumic density that would be measured locally (in other words, in the Newton-basis). The relationship between the two is given by , where the exponent 3 expresses the dimensionality change (2 (spiral galaxy) (one imprinted spot in the CMB)). We found that . Let us note that with . The substitution of with mimicks a change in the value of G (in the sense of ) as it does in MOG: . Let us remark, however, that the magnified value of the gravitational constant is fictitious in the model, whereas this magnification is real in MOG. At this stage, we have not performed the detailed calculation of the angular power spectrum of the CMB. This work remains to be performed, but we very likely should arrive at the same conclusion as in the paper by Moffat and Toth, namely that the kappa model should be able to reproduce the CMB acoustic power spectrum.
It is commonly agreed today that the finite age of the universe is too short to account for the transition from the initially smooth, highly uniform early universe to the highly clumpy and structured local universe (hence the astute idea of certain authors to extend this age, as exemplified by Gupta [8]). However, in the context of the model, the fluctuations in the CMB are seen in the bundle (where the observer resides). On the other hand, when expressed in the Newton basis, these fluctuations become significantly more pronounced, being amplified by a multiplicative factor to the order of , and this considerably reduces the time required to produce the highly clumpy structures observed in the local universe without pre-collapsed DM halos and without changing the accepted age of the universe.
4.3.4. Hoag’s Object
The Hoag’s Object morphology can be explained in the sole context of the model. Several varied and interesting scenarios have also been provided by other authors [43,44,45,46]. Bannikova [45] explained quite clearly why the hole does not fill up, which is because the trajectory of any particle located in it is definitely unstable. However, how did Hoag’s Object form and when? The usual scenario for describing ring formation relies on the action of a central bar on a spiral substructure. Unfortunately, as for this otherwise interesting scenario, what is enigmatic here is that the bulge appears perfectly circular. The model can supply a solution. Hoag’s object is a distorted image of a common spiral galaxy, but it is characterized by an unusual and incredibly strong gradient of density between a highly dense bulge and a rather thin disk.
Hypotheses
Hoag’s Object is assumed here to be centrosymmetric. From the center, the radial coordinate is denoted by u in the Newton basis and in the e leaf. At a point , the density in the Newton basis is denoted by , while the apparent density in the E leaf is denoted by .
Hoag’s object appears to be divided into three regions (Figure 18):
- 1.
- A bulge B with a constant projected apparent mass density along the line of view , constant rescaling coefficient and apparent radius , where according to Box 1, the radii of the bulge in the e leaf and in the Newton basis are linked by , its density in the Newton basis is constant and .
- 2.
- A bulge-disk transition annulus T which is quite narrow when seen in the Newton basis, extending from radii to with (), with the density decreasing from ( in the e-leaf) to ( in the E-leaf).
- 3.
- An annulus A with a constant projected apparent mass density along the line of view and constant rescaling coefficient , extending from the apparent radii to when we normalize .
Figure 18.
Schematic density profile for Hoag’s Object as seen in the Newton basis.
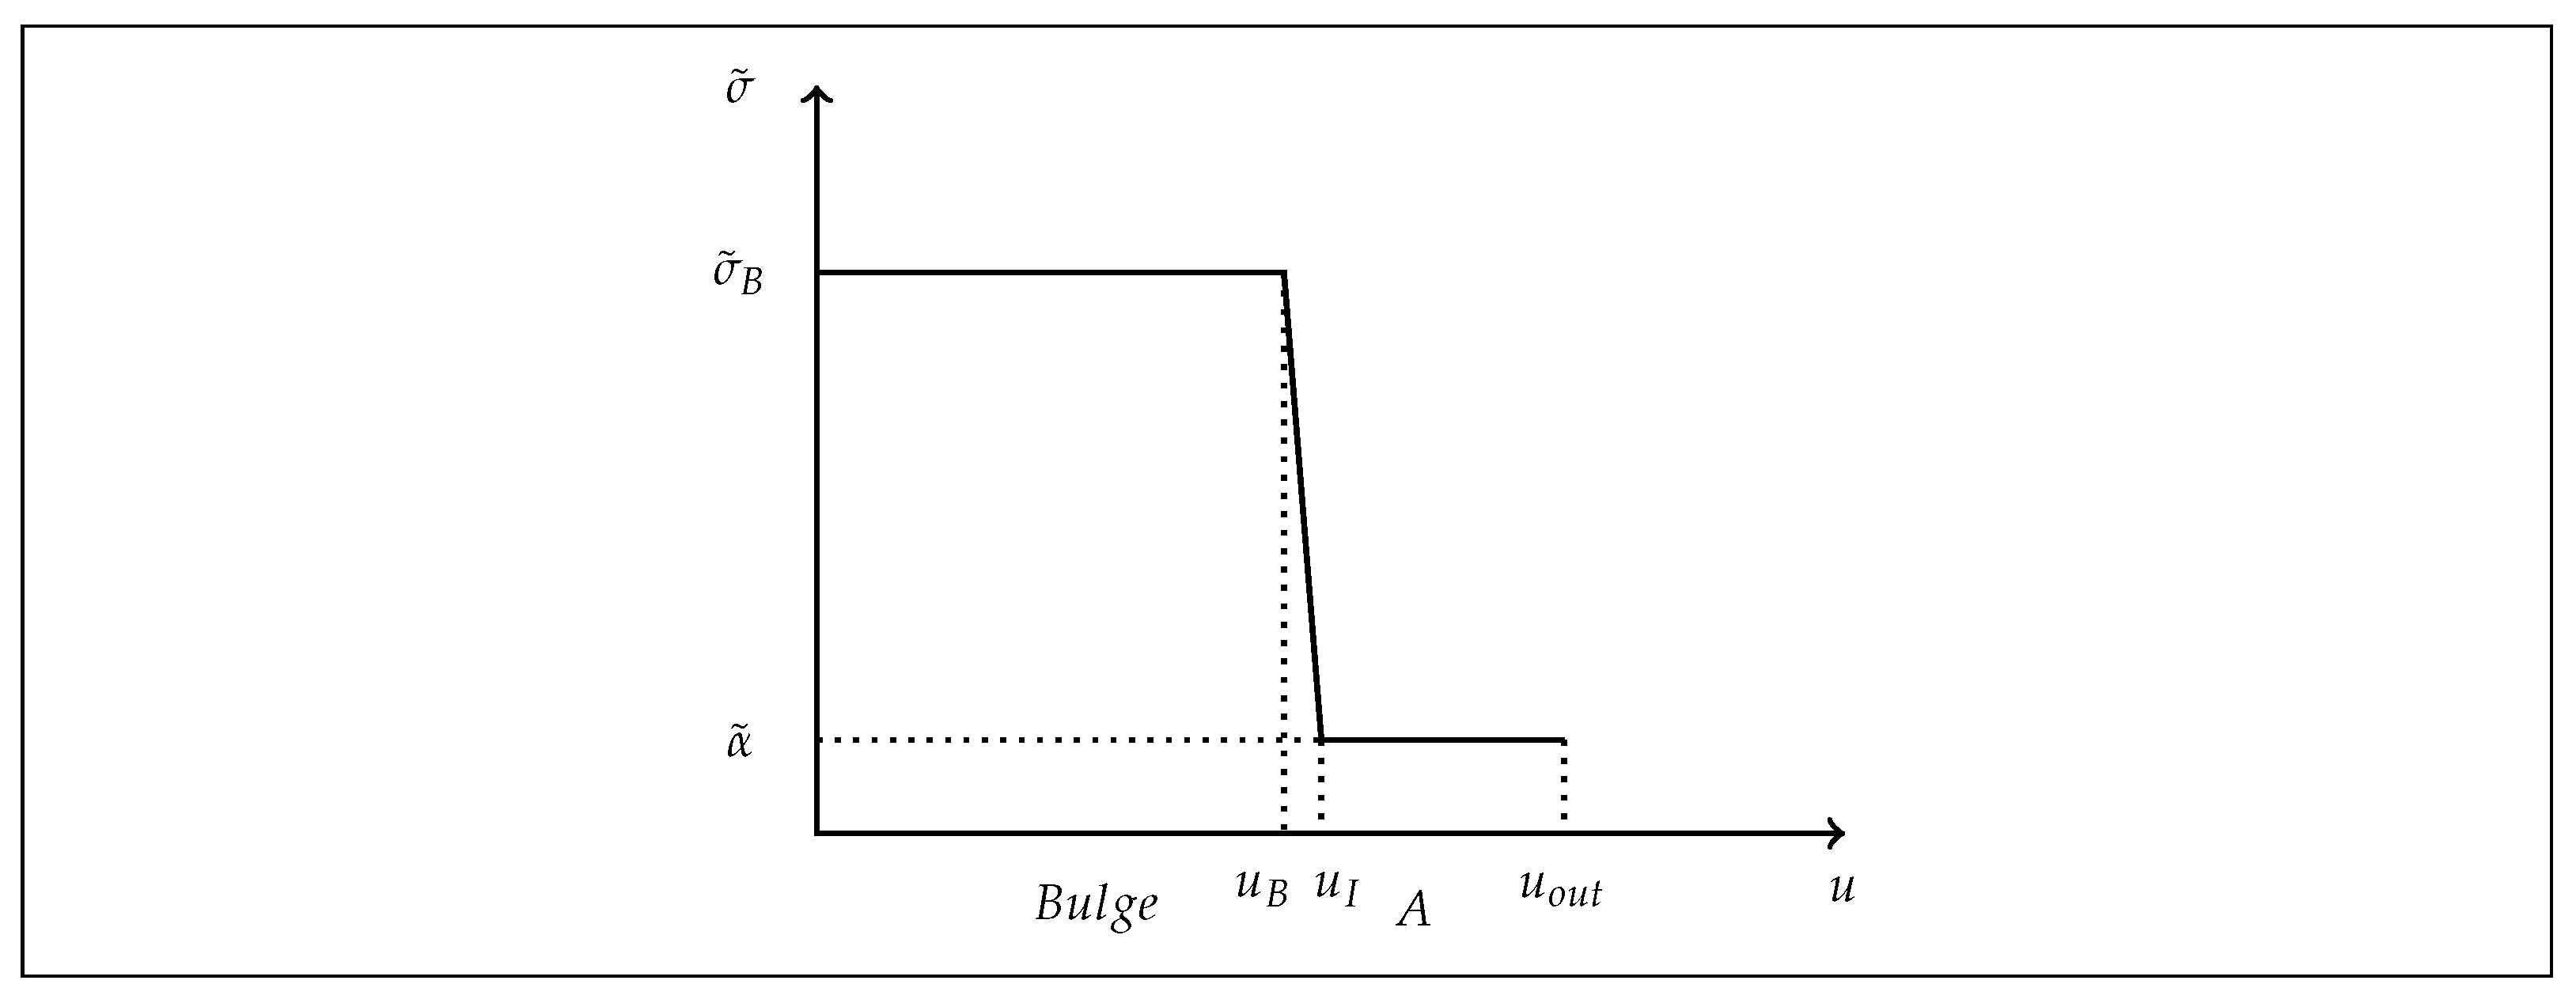
According to Box 1, for points in the bulge, we have , and for points , we have . This gives
We obtain , which gives
For the densities, we obtain
We also find that
Concluding Remarks
The condition over expresses a rather steep front for the density, which is difficult to obtain (hence the extreme rarity of Hoag’s Object). The left image in Figure 19 displays the appearance of Hoag’s Object in the Newton basis. We can see it as a spiral galaxy with a rather big bulge surrounded by a narrow disk (type SAa of the de Vaucouleurs classification).
Figure 19.
Hoag’s Object in the Newton basis and as seen by the Hubble Space Telescope (Image credit: R.Lucas (STScI/AURA), Hubble Heritage Team, NASA).
We have tried to apply the model to Hoag’s Object, for which no process of formation has been clearly identified. A first explanation was proposed by Hoag himself [46], who suggested that the phenomenon was due to a gravitational lensing. Unfortunately, in that case, the radial velocities of both the bulge and the ring would be quite different, whereas the observations show the contrary. On the other hand, the effect is a kind of lensing in which the radial velocities are left unchanged. In this case, the velocities are the same for the bulge and the ring, in agreement with the observations, with the luminosity distance also being the same for the two objects. The lensing differs from the gravitational lensing that bends the trajectory of light rays. The lensing appeared when we tried to relate an immense length (the size of a galaxy) to a standard length adapted to our rather modest scale.
For the possibility for two superimposed images of a same galaxy, the model predicts the existence of a unique photometric image. Perhaps a much more complete version of this model could support the intriguing possibility, in some exceptional circumstances, to have two photometric images of the same galaxy. This suggestion is, at this stage, entirely speculative. (A couple of values are indeed associated with each galaxy (inner and outer [14]).) Before we investigate further, and even if this statement seems highly unlikely, it would be quite interesting to measure the radial velocity of the former with an extremely low-luminosity annular galaxy seen inside the gap region of Hoag’s Object.
4.4. MOND Versus MOG Versus Kappa Model
Each of the three models—MOND, MOG and the model—aim to understand the dynamics of galaxies and galaxy clusters, even though deep differences exist. A key feature of MOND is that it is a theory governed by a unique fixed-acceleration scale named . A model with a low number of parameters is better than one with a large number of parameters, but this can also be a weakness. Thus, MOND faces difficulties when the scale of objects is drastically changed (galaxy clusters). (This seems to be reducible to a hierarchical problem, which can be addressed by using a density-dependent relationship (as suggested by the model). As a result, the model is more flexible and can adapt to many different situations. On the other hand, if we now look for a density equivalent for , then we obtain , a value close to the mean density measured in the solar neighborhood (). (These two numbers are close when compared with the extensive range of mean densities observed in the Universe.) Thus, in the galaxy, the turning point between the Newtonian regime (inner regions) and the MOND regime (outer regions) is in the vicinity of the Sun. This coincidence seems rather strange for a parameter that is supposed to be universal.) By comparison, MOG is more flexible. In MOG, gravity is stronger than it would be in general relativity. However, this excess of gravity is canceled out in part by a repulsive force due to a vector field interaction with a finite range. This cancellation is produced in the inner regions of galaxies, where the behavior is demonstrated by the general relativity. At a great distance from the center, galaxies rotate faster because the repulsion vector is absent there, and thus gravity becomes stronger. The coupling and mass parameters governing the range of the vector force are scalar fields whose values vary from system to system. MOG is governed by a hierarchy of scales which is determined by the mass and distance from the source. Unfortunately, the counterpoint is that MOG introduces extra fields and new particles (not predicted by the standard model of particle physics). Another characteristic of MOG is the variation in the gravitational constant G. This coud be a significant problem, because changing G necessarily implies a change in the other physical constants (such as the speed of light). What then are the consequences for MOG? At the solar system level, regions where the net acceleration approaches zero are promising sites for looking for signatures of MOND dynamics, such as regions close to Lagrange points, and Saturn’s satellite Yimir especially is an example of a solar system object that regularly undergoes the MOND regime [10]. More specifically, MOND predicts that the dynamics of a system deviates from Newtonian when the acceleration a is smaller than ∼1.2 10−10 ms−2. This deviation ought to be detectable in wide binaries [47]. In contrast to MOND, both MOG and the model (tiny system regime) predict that the gravitational dynamics of wide binary star systems follows Newton’s law. Various investigations have been performed relative to this important issue [47,48,49], but a conclusion is still pending.
5. Conclusions
The model is supported by an alternative line of investigation designed to solve many astrophysical problems which, according to us, have not received satisfying explanations thus far. The great point of interest of this model is that the physics of gravity, quite accurately proved at the scale of the solar system, is left unchanged (following the Newtonian or Einsteinian version, according to the chosen basis). The distances calculated via luminosity measurements (following the usual methods) and the velocities resulting from spectroscopy are left unchanged. In contrast, the angular measurements and trigonometric distances (the latter ones not being accessible today) are both strongly affected by the effect. This effect produces a magnification of all astrophysical objects taken individually and projected on the sky plane, such as spiral galaxies, galaxy clusters and spots of the CMB. The effect acts as a kind of invisible giant lens distorting the Universe in a seemingly anamorphic manner. Is there a hidden reality where the usual physics fully prevails (pure Newtonian mechanics or general relativity) with no dark matter and to which we would only have visual access through a distorted (stretched) copy? This question was asked in this paper.
The recent discovery that the flat, weak lensing profile for spiral galaxies appears to continue over extremely large distances [36,38] also warrants examination within the framework of the model. Analysis of this issue is progressing, and its importance lies in its potential to differentiate between the model and MOND theory.
Finally, it should be noted that the model retains dark energy, a necessary ingredient to explain the acceleration of the Universe. The concept of dark energy is much more credible than that of dark matter because dark energy can be linked to vacuum energy, which has been proven to exist both theoretically and in the laboratory at the atomic scale (even if there is a serious quantitative disagreement between the two).
Author Contributions
Conceptualization, G.P.; methodology, G.P. and L.P.; software, G.P.; validation, G.P. and L.P.; formal analysis, G.P. and L.P.; investigation, G.P. and L.P.; resources, G.P. and L.P.; data curation, G.P.; writing—original draft preparation, G.P. and L.P.; writing—review and editing, G.P. and L.P.; visualization, G.P. and L.P.; supervision, G.P.; project administration, G.P. All authors have read and agreed to the published version of the manuscript.
Funding
This research received no external funding.
Data Availability Statement
The authors confirm that the data supporting the findings of this study are available within the article and the reference list.
Acknowledgments
The authors wish to thank the anonymous reviewers for useful comments and suggestions. We are grateful to three anonymous reviewers for their comments and incredibly useful suggestions for improving our manuscript.
Conflicts of Interest
The authors declare no conflicts of interest.
Appendix A. Trigonometric Distances and κ Curvature
Let and be two regions in which the rescaling coefficients are constant, with in and in . Let A and B be two sitting observers in the leaf and leaf, respectively. We assume that and are small enough and far apart enough that for a in and b in , we can consider that the luminosity distances are constant. Let be in and be in such that , ℓ can be seen as a distance unit common to A and B. We have and . In the small angle approximation, if two photons start from b and and converge toward A, then the angle measured by A is , whereas the angle between the trajectories of the two photons measured by B is , , and the angle is the aberration angle. If the sitting observers B and A then use those angles and the common unit distance to measure the distance , then the results are found to be different:
The distance is seen asymmetrically by the two sitting observers.
If between the two regions, the environment is characterized by a constant value of the rescaling coefficient , (the situation we have in mind is two regions in two distant galaxies separated by a homogenoous extragalactic medium), then the sitting observers measure
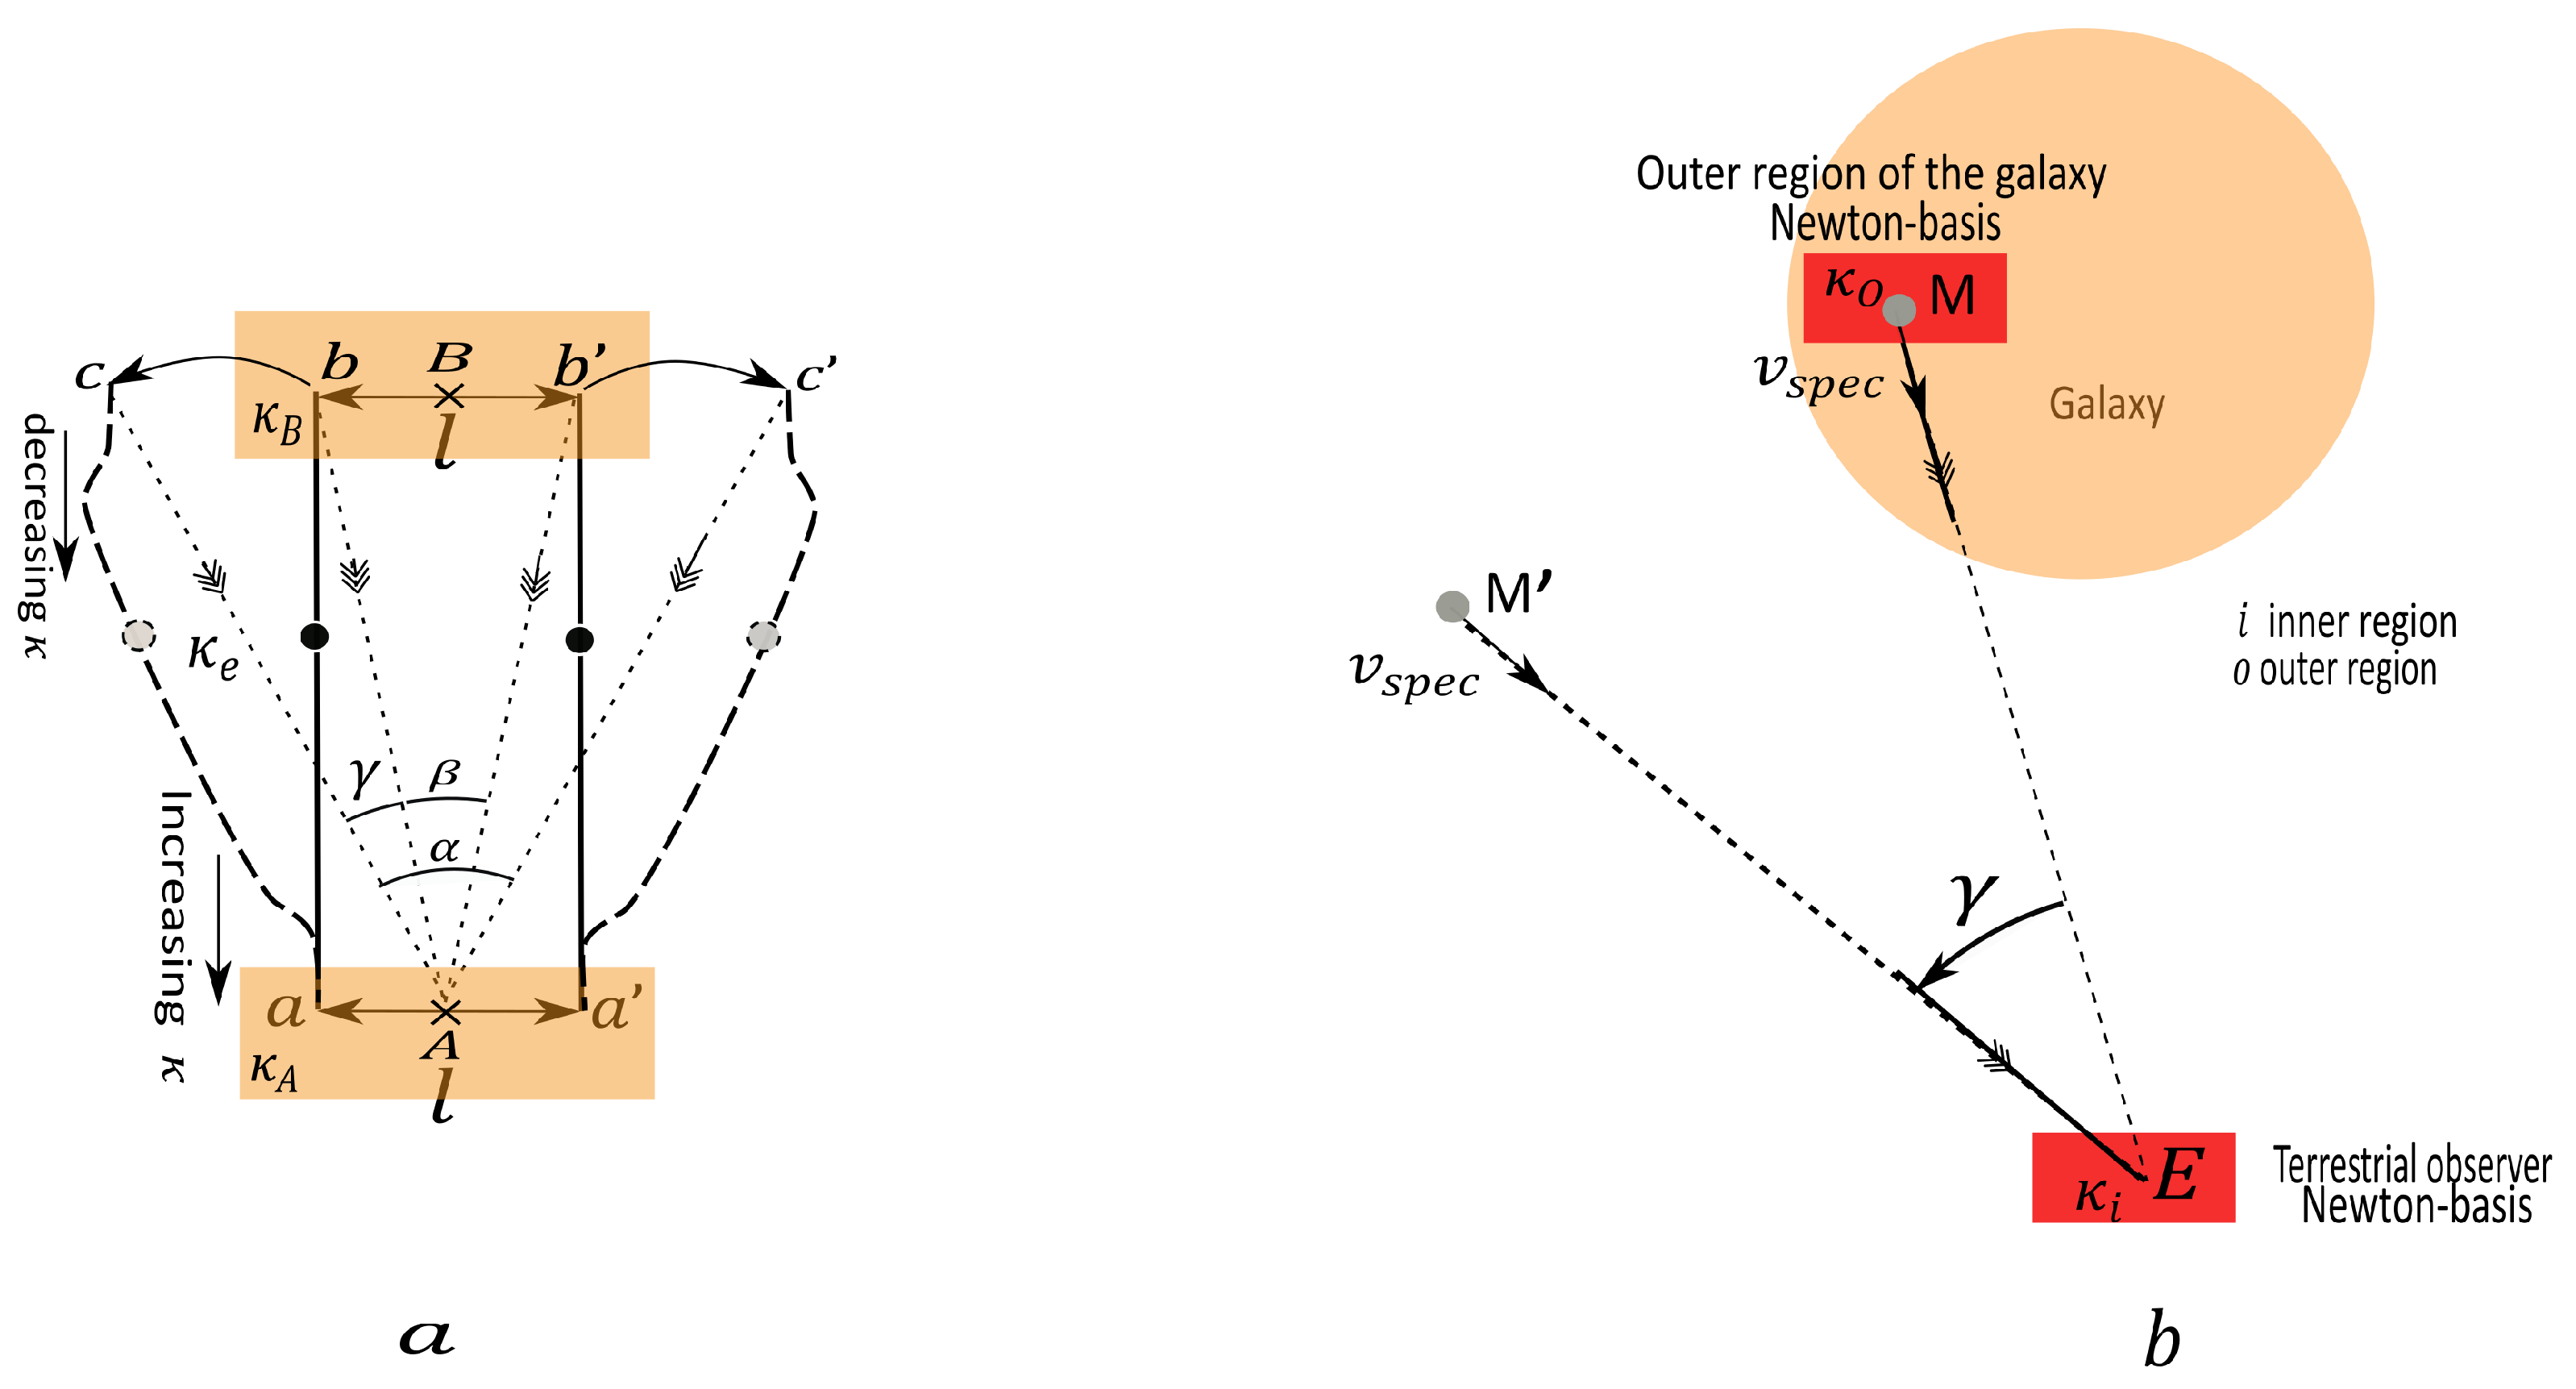
The motion of a particle in the bundle has two components: one component in the basis space and one virtual component in (where and are the minimal and maximal values of on ). The latter component depends directly on the function and the component in the basis space. Consider two particles whose motions are rectilinear when projected on (solid lines), starting parallel from the observer B. The particles arrive parallel at observer A (but nobody can see the real trajectories in the totality). Yet, for observer A, the projected trajectories (dashed lines) on his or her proper sheet (constant ) appear curved along some portions of the trajectories (Figure A1a). This fictitious curvature is due to the fact that the particle passes from leaf to leaf during its motion in the bundle.
A simpler way to describe this would be to consider an itinerant observer I traveling from Earth E to distant points D and in carrying a bag full of standard meters. Upon arriving, he or she leaves one of them at D and another at and then comes back home to Earth. I has two ways of measuring the distance between E and . By counting how many standard meters he or she traveled to reach the luminosity distance or, once back home, using trigonometry via the solid angle subtended by the standard meters he or she left at D and , he or she finds the trigonometric distance . The ratio can be seen as a “curvature”.
In Figure A1b, we have a representation of two pieces of the Newton basis. However, these pieces (or rather their counterparts reported in the bundle here) are not located in the same sheet of the bundle. The trajectory of the photon appears to be discontinous to any sitting-observer. It would be of great interest to know the physical origin of this phenomenon (see Appendix B). Two explanations can be suggested: the incommensurability of cosmical distances when compared with those at our tiny scale or a new and unknown property of light when propagating over an incredibly large distance. When administered, we can see that the kappa effect acts as a kind of giant lens for the terrestrial observer. The real point M located in the outskirts of a galaxy is seen to be displaced at the virtual position (Figure A1b). The size of the observed galaxy (disk) is magnified, whereas the spectroscopic velocity not being affected by the effect is transported from M to without change.
Figure A1.
Trajectories of photons. (a) Representation of two pieces of the Newton-basis, (b) Location of a real point M in the outskirts of a galaxy and its counterpart at the virtual position M′.
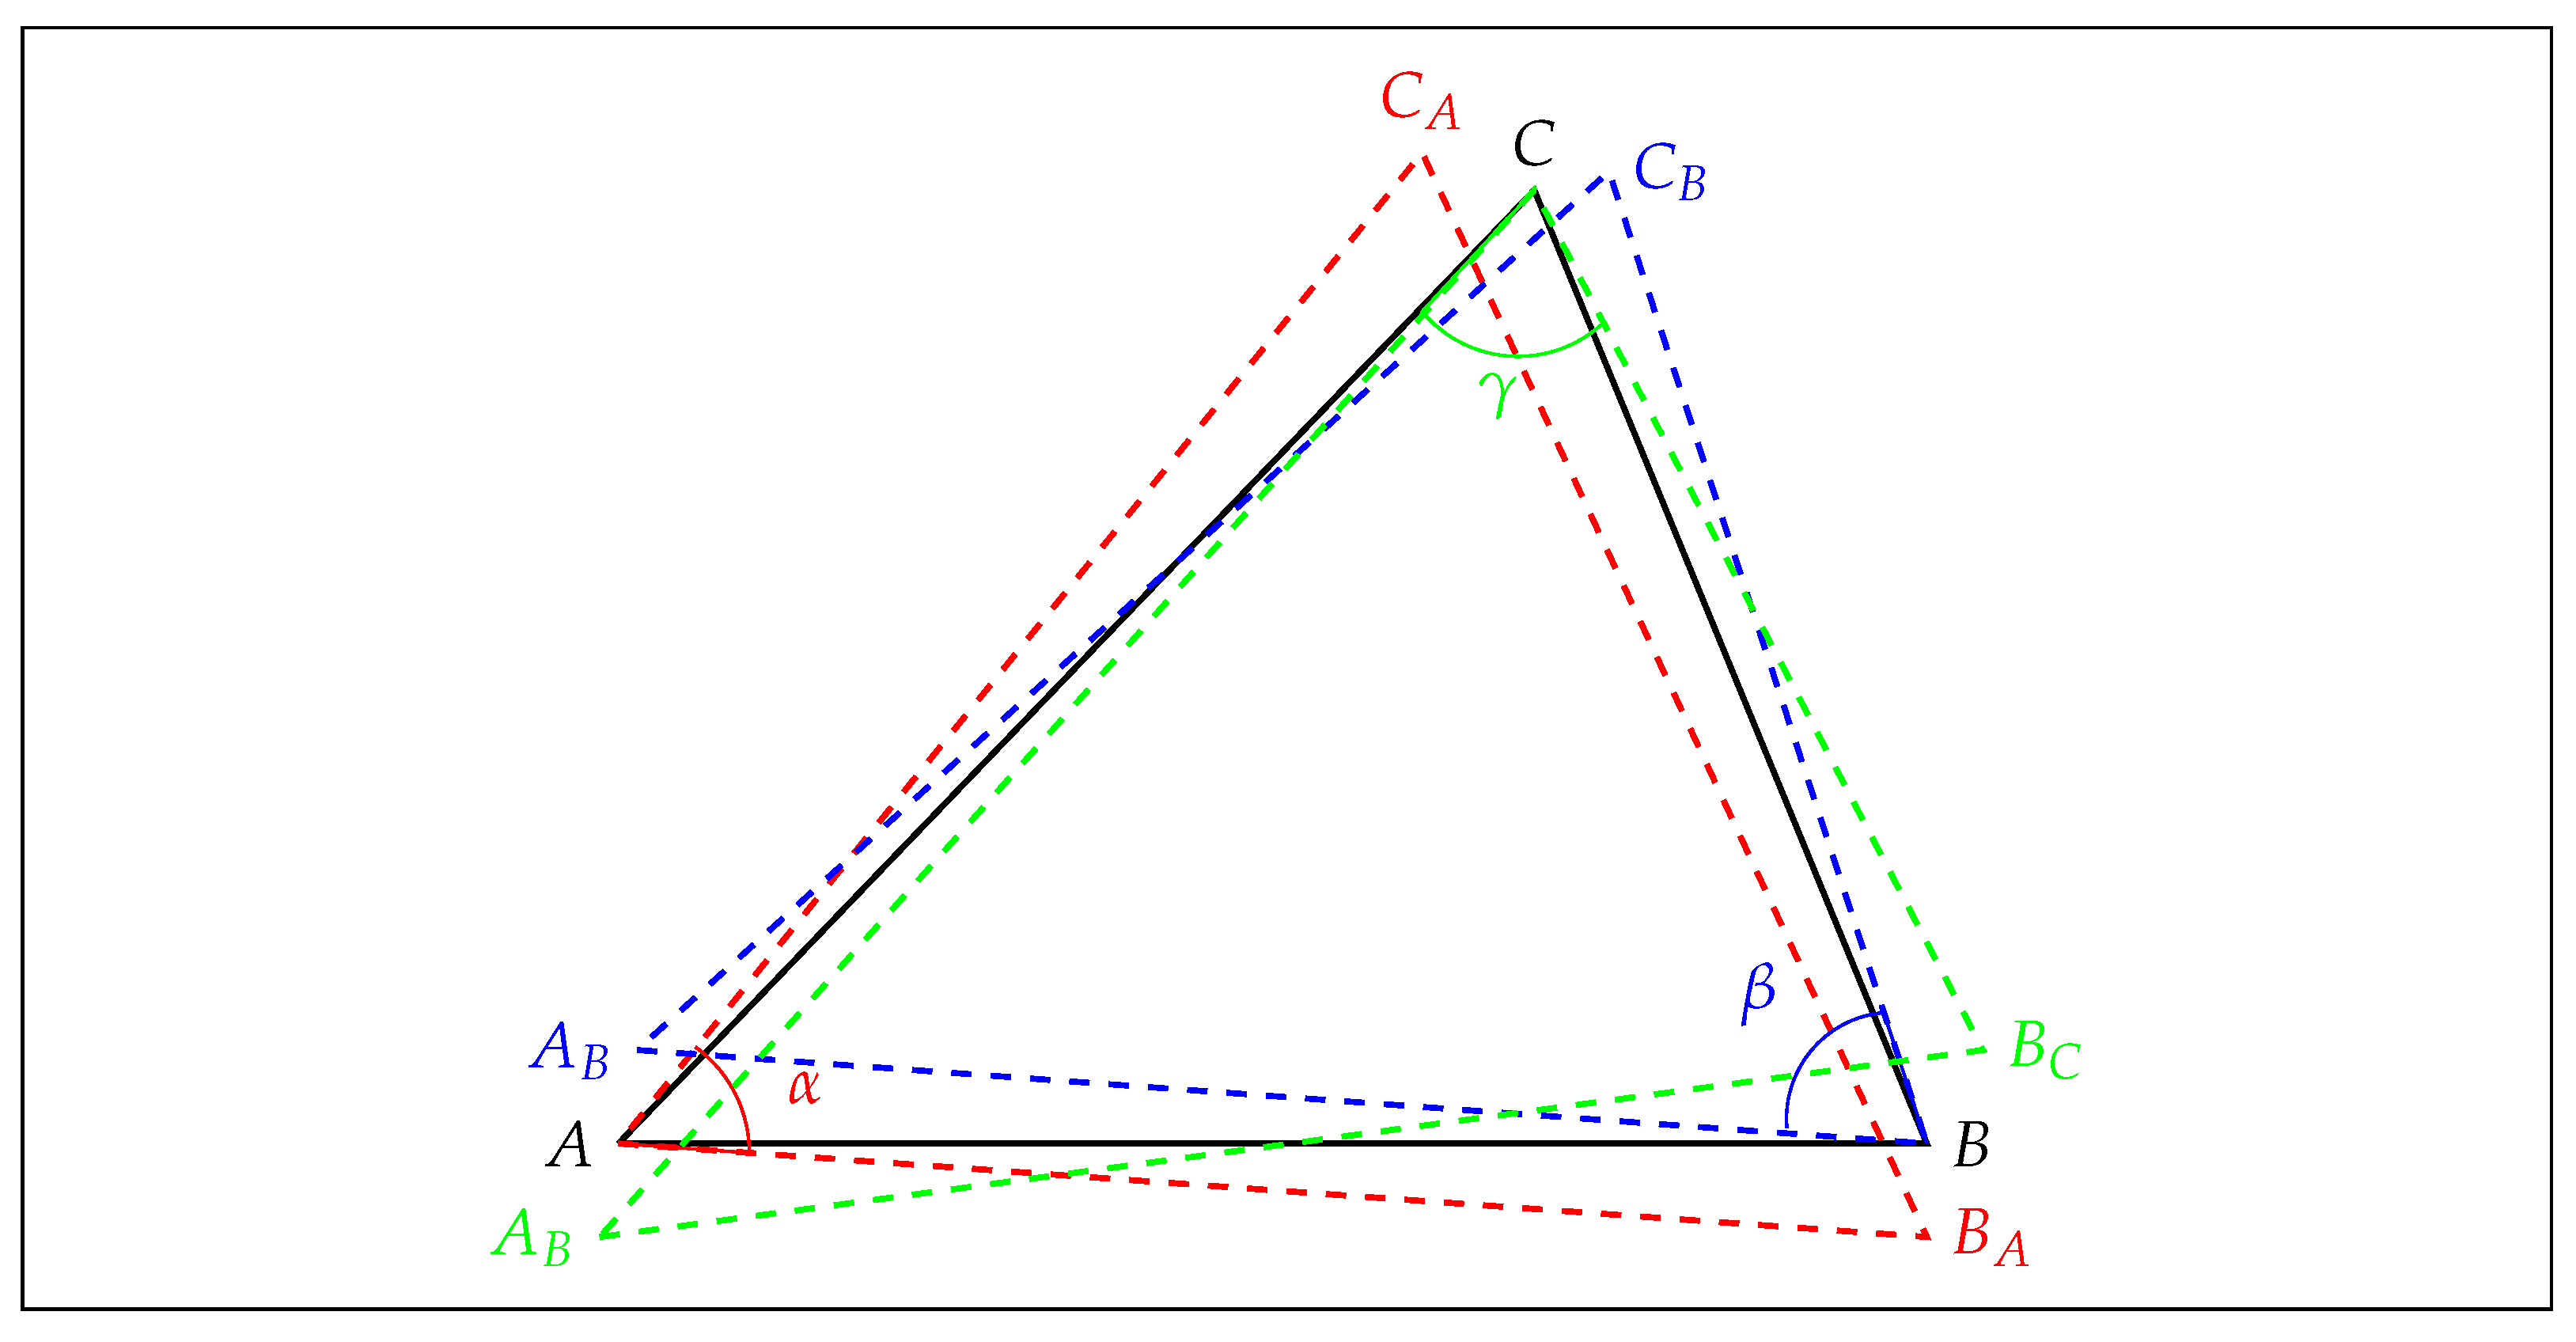
Let us consider three sitting observers and C in regions with different rescaling coefficients (Figure A2). In each leaf, photons propagate along straight lines. B and C emit photons in the direction of A, where the angle between the reception direction at A is , but in its leaf, A sees B at and C at . Via permutation of and C, we can define in the same way the angles of reception () at B and C. The angles and are the angles at and C of the triangles and , respectively, and we have , which can be interpreted as the existence of a curvature.
Figure A2.
Triangle in the basis and in the leaves.
Appendix B. The Origin of the κ Aberration
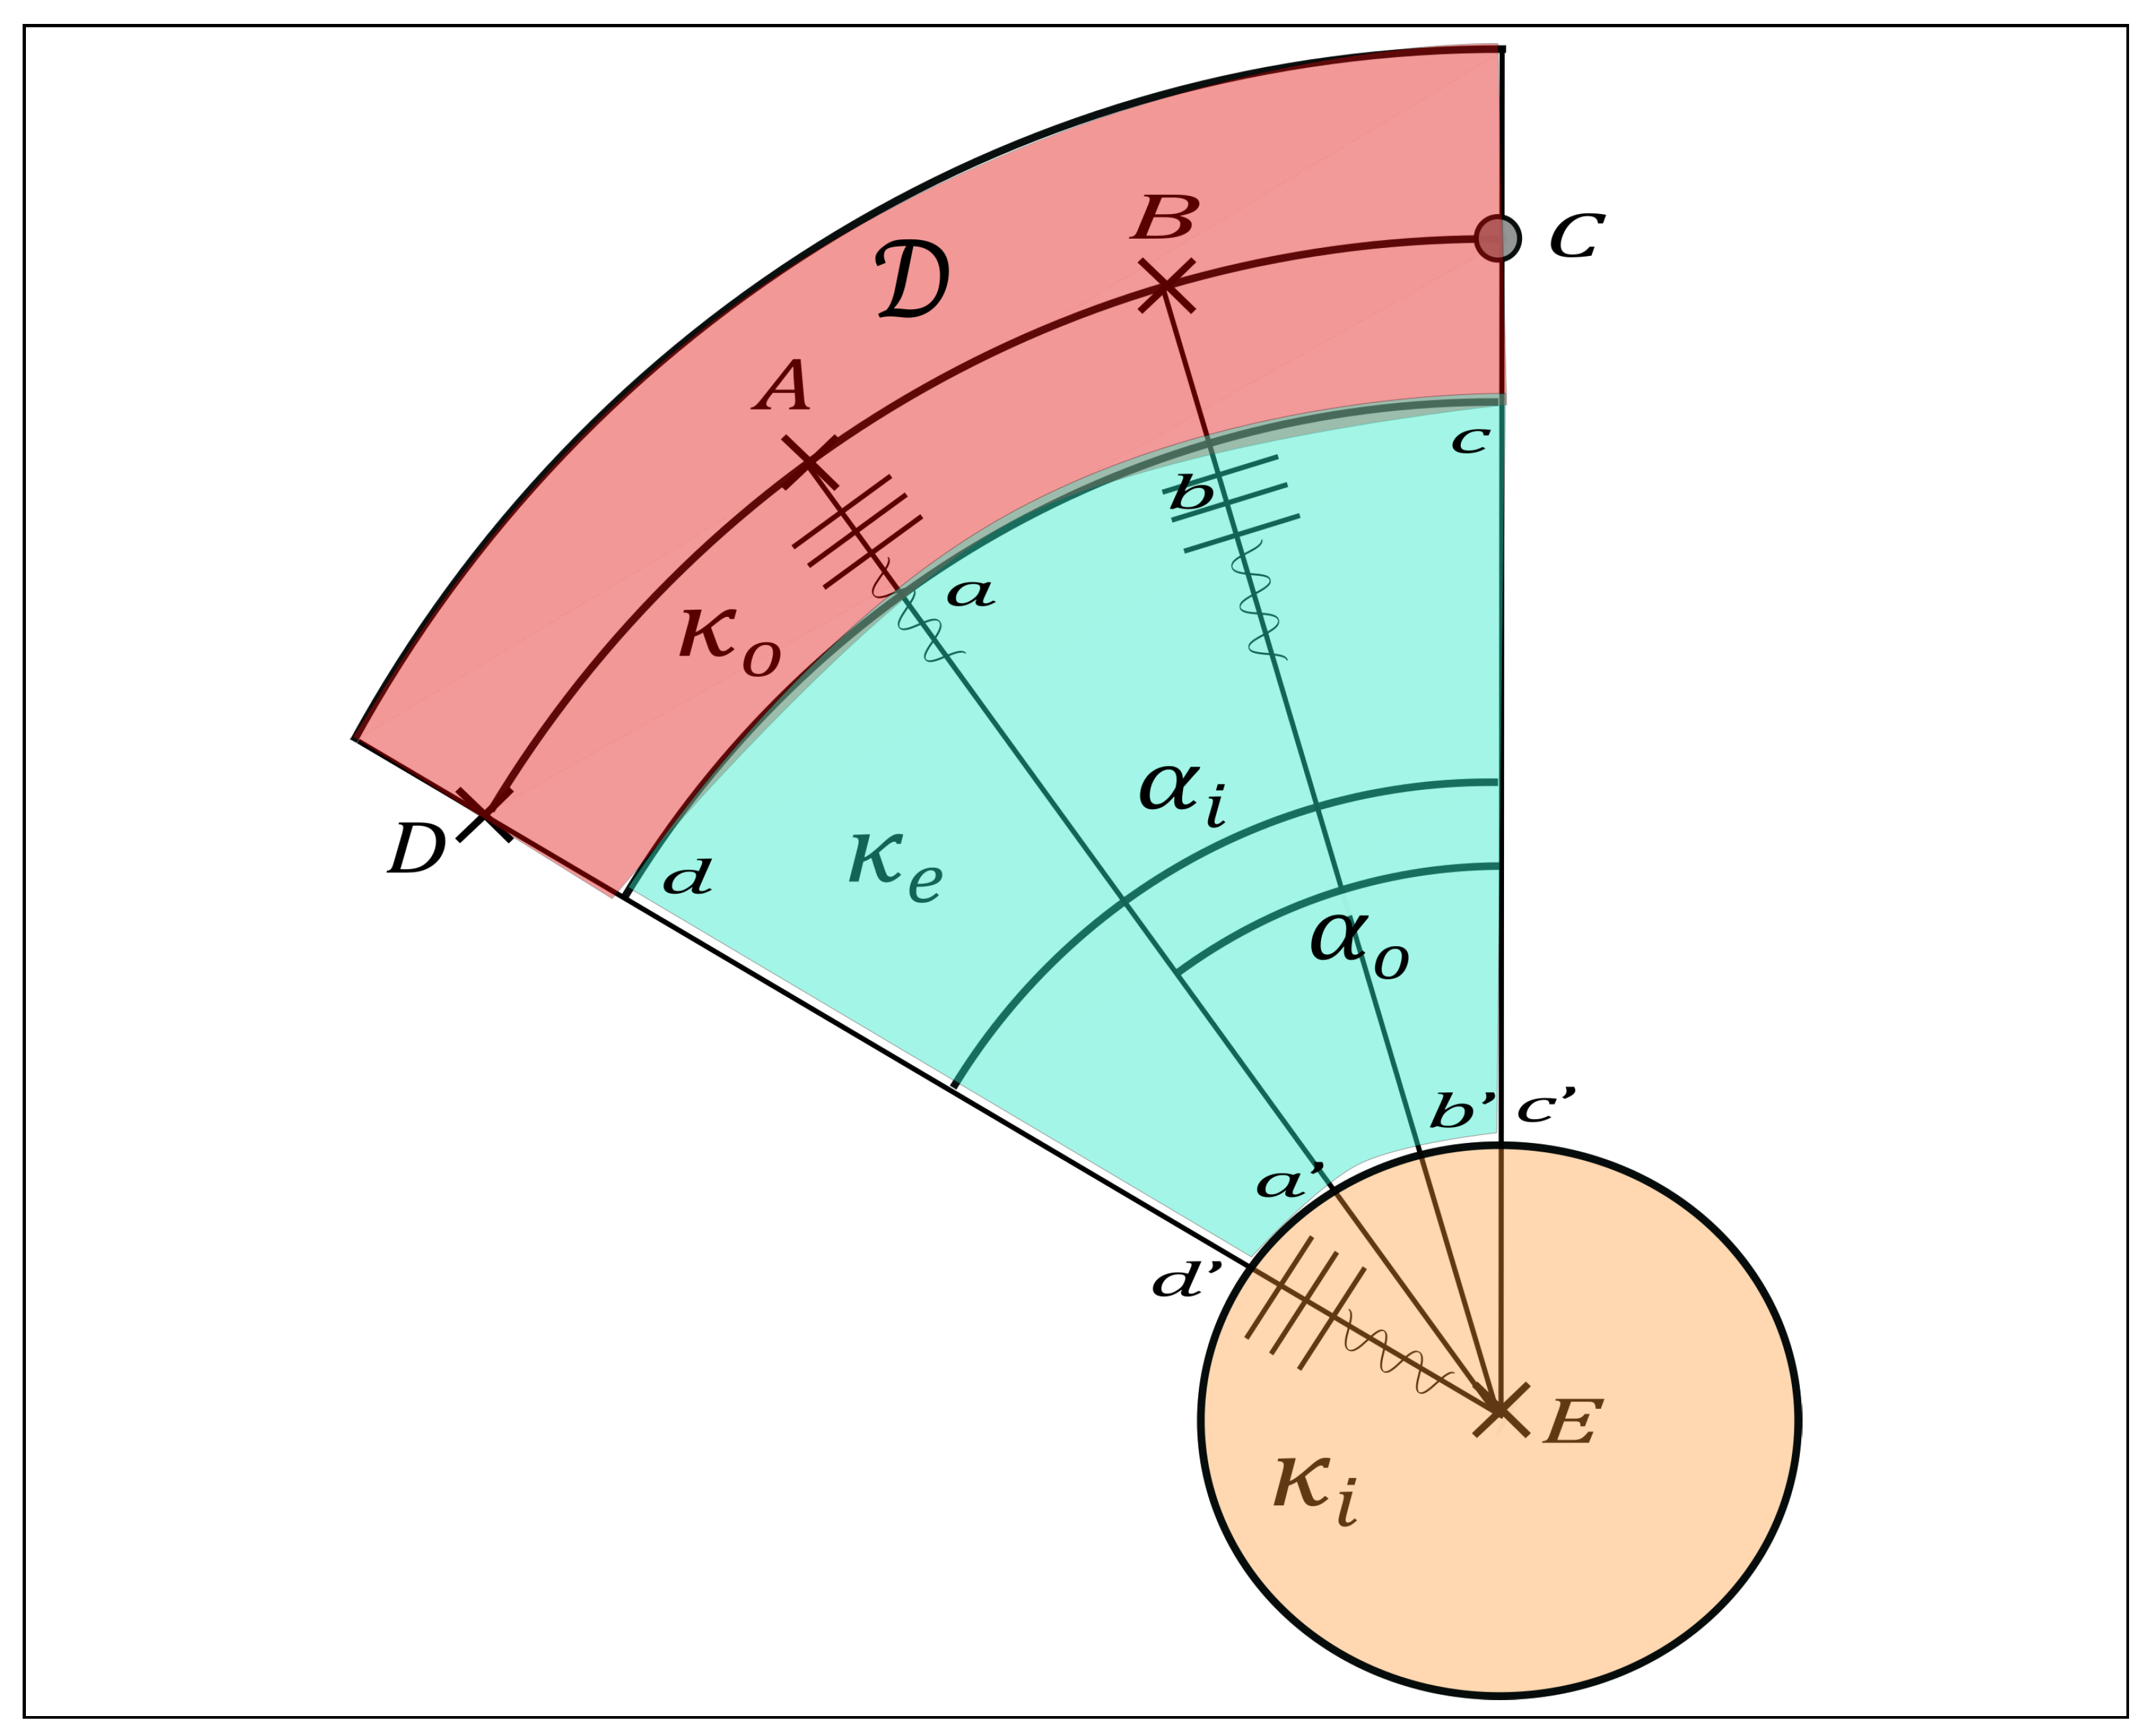
The aberration is intriguing because it seems to underline a real change in the direction of the emitted photon, whereas paradoxically enough, the light propagates in a straight line in the Newton basis. This statement is not amenable to easy visualization when the dimensions of the objects are extremely large. This is the same at the atomic scale; in the quantum world, the objects are no longer directly visualizable. Let be a domain representing a piece of a spiral galaxy (center C) (Figure A3). The linear dimension of is assumed to be extremely small with respect to the distance (∼a few arc-min). This region is separated from the terrestrial observer (coefficient ) by a rather extensive extragalactic domain (coefficient ). The emitter is located at A in the outer region of the galaxy (coefficient , with the hierarchy ). This emitter is seen at B by any sitting observer located in the intermediary extragalactic region and at D by the Earth-based sitting observer E. Yet, in reality, points and D coincide in the Newton basis, while these points (or rather their replicas) appear separated in the bundle. Inversing the travel of a photon emitted by A and reaching E is more interesting. If E emits a photon (in the form of a spherical wave) toward the observed galaxy, then the photon will be received at A (real), B (fictitious) and D (fictitious but appearing real for E) simultaneously (the distances , and are assumed to be equal), but in any matter, A, B, and D correspond to a unique point in the Newton-basis.
An analogy with the refraction phenomenon in a medium with a variable index can be made. With the help of Figure A3, we have
and with the Thales theorem, we have
We obtain a revisited Snell law:
where the ratio plays the role of a refraction index. However the analogy must not be taken at face value because there is no light-refracting medium.
Figure A3.
aberration.
Appendix C. The Translation of an Extended Object (Galaxy) Within the Framework of the Kappa Model
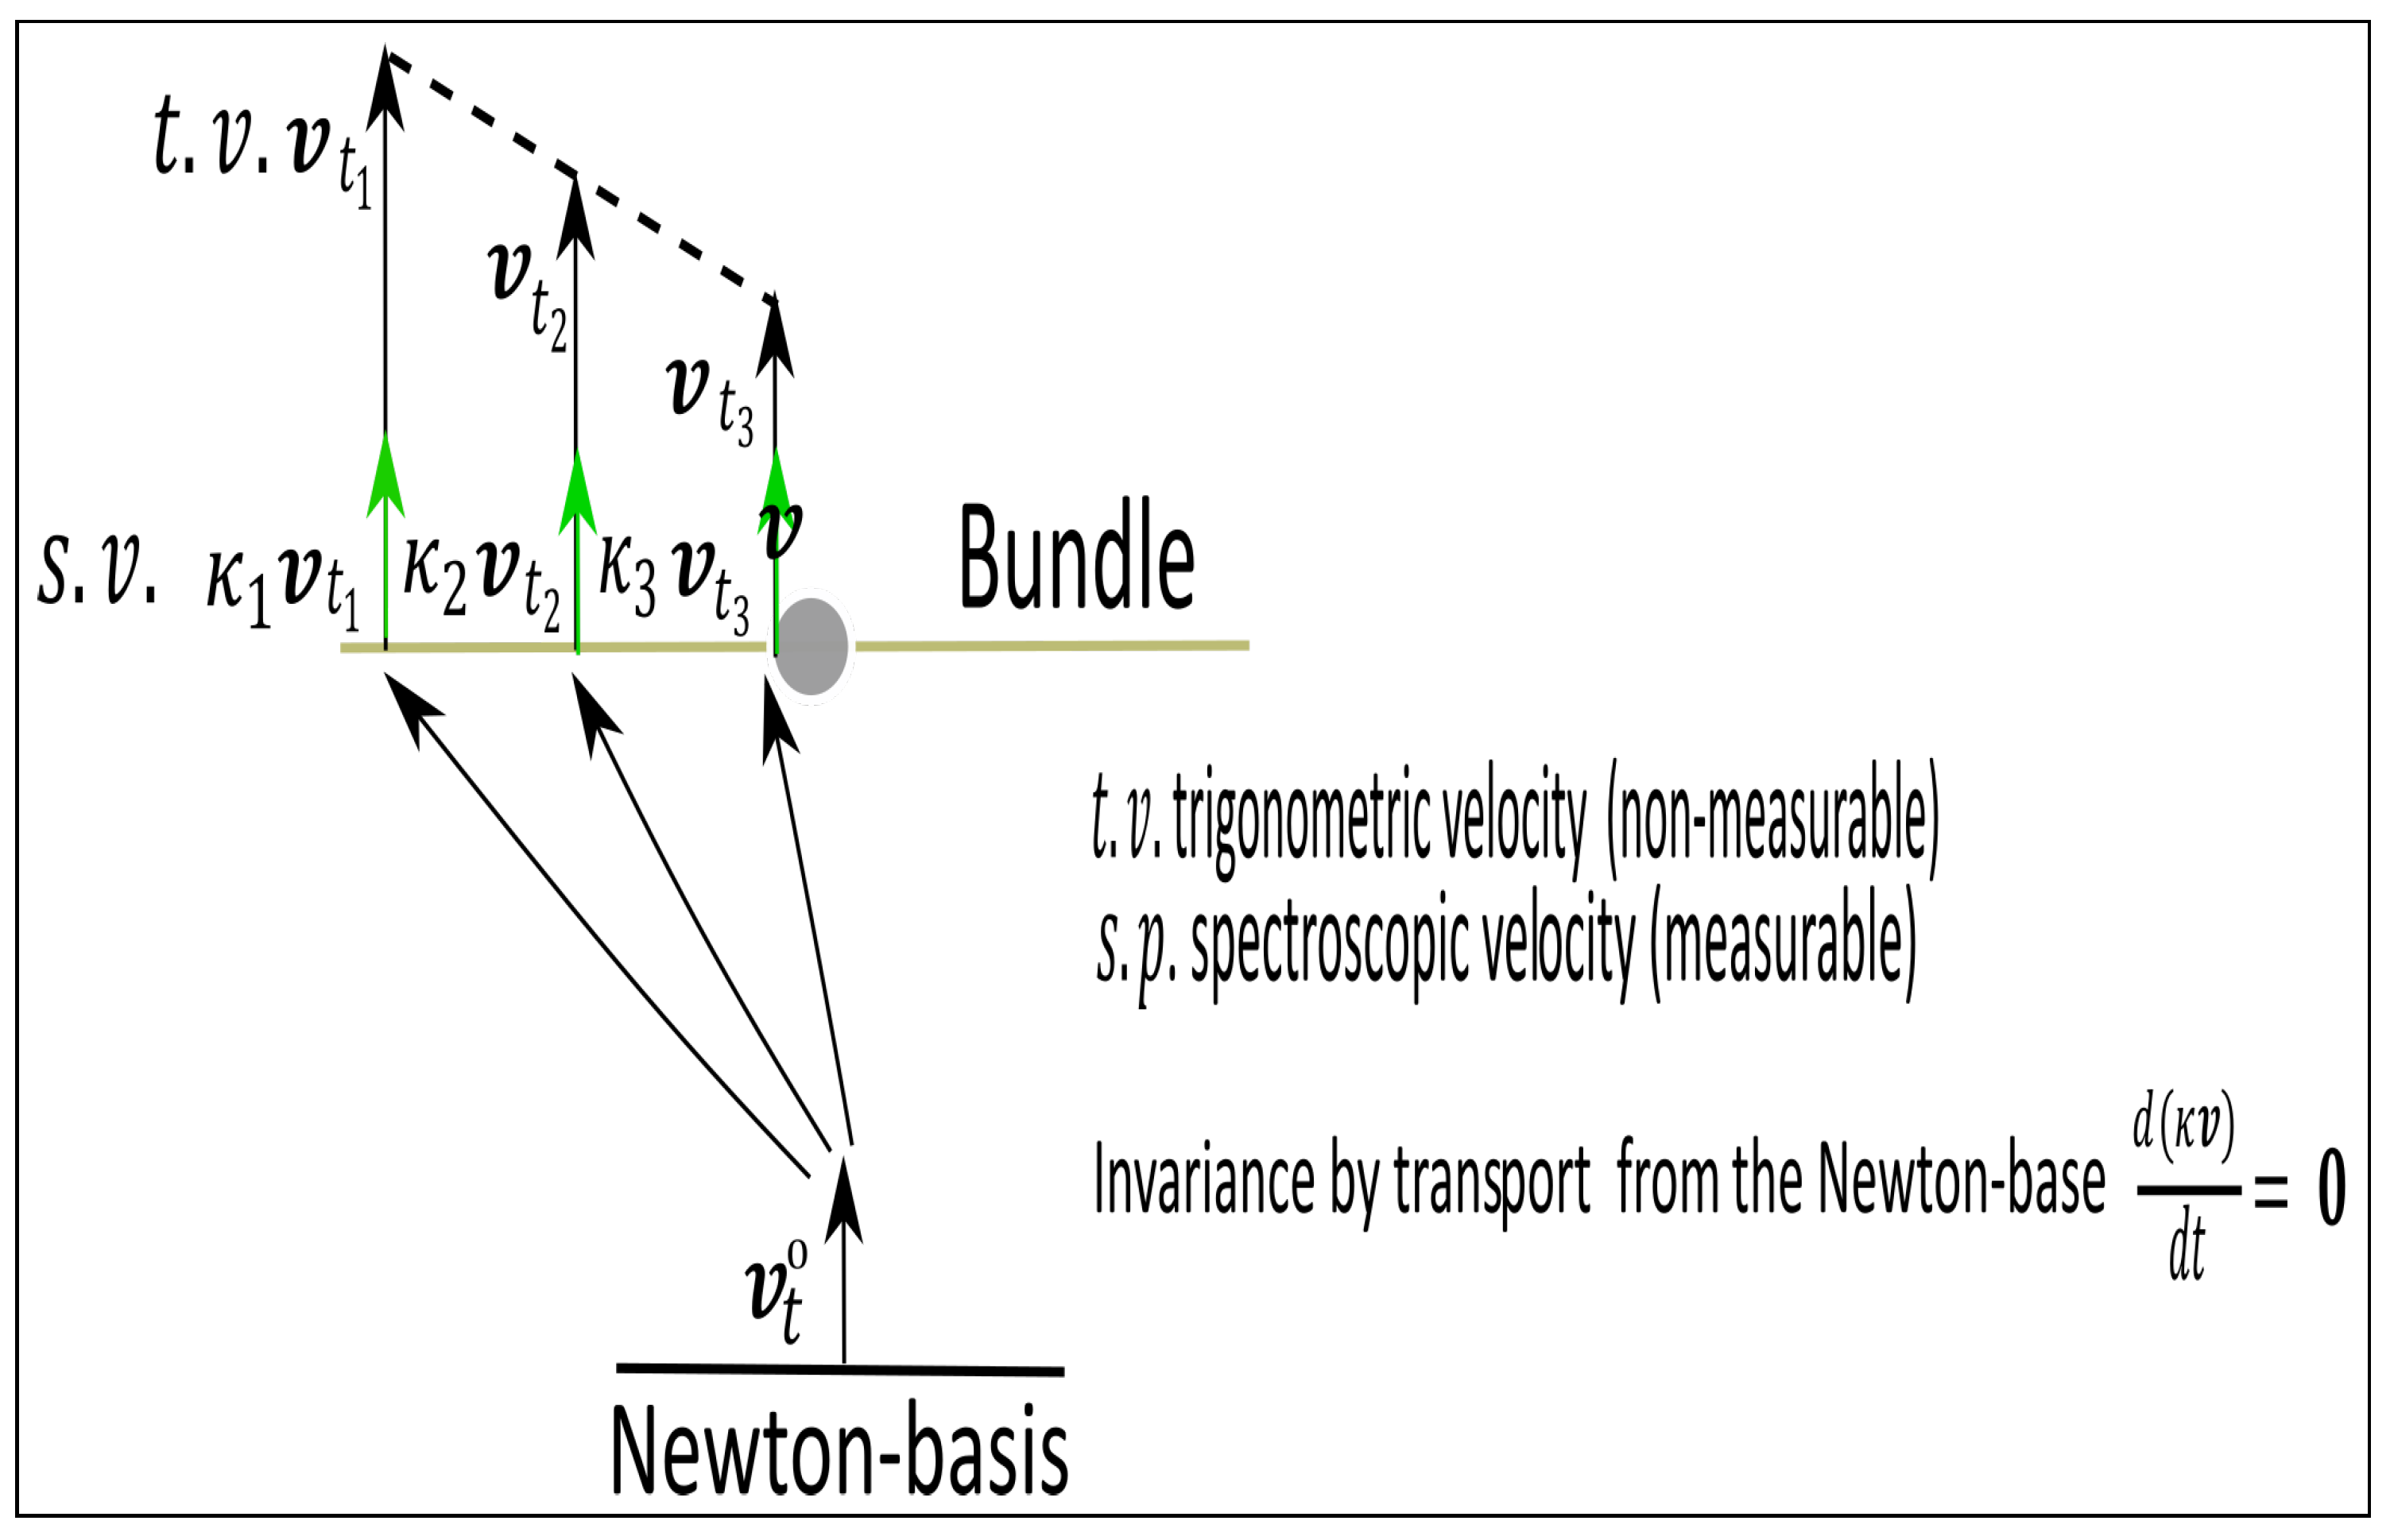
The analysis of the global motion of a system (a galaxy or an individual galaxy cluster) is becoming interesting. An essential point is that if we can measure the trigonometric velocities, we would have the impression of seeing the galaxy distort with time. This effect is obviously fictitious in the kappa model; only the spectroscopic velocities represent a reality (a local observer assumed to be present in the observed galaxy at a given instant and to be at rest with respect to the terrestrial observer would measure the same spectroscopic velocity).
Figure A4.
Translational motion of a galaxy seen pole-on. A terrestrial observer is associated with a piece of the Newton basis.
References
- Milgrom, M. A modification of the newtonian dynamics: Implications for galaxy systems. Astrophys. J. 1983, 270, 384. [Google Scholar] [CrossRef] [Scilit]
- Milgrom, M. MOND theory. Can. J. Phys. 2015, 93, 107. [Google Scholar] [CrossRef] [Scilit]
- Moffat, J. Scalar–tensor–vector gravity theory. J. Cosmol. Astropart. Phys. 2006, 3, 004. [Google Scholar] [CrossRef] [Scilit]
- Yang, S.-Q.; Zhan, B.G.; Wang, Q.L.; Shao, C.G.; Tu, L.C.; Tan, W.H.; Luo, J. Test of the Gravitational Inverse Square Law at Millimeter Ranges. Phys. Rev. Lett. 2012, 108, 081101. [Google Scholar] [CrossRef] [Scilit]
- Verlinde, E.P. Emergent Gravity and the Dark Universe. SciPost Phys. 2017, 2, 016. [Google Scholar] [CrossRef] [Scilit]
- Maeder, A. Dynamical Effects of the Scale Invariance of the Empty Space: The Fall of Dark Matter? Astrophys. J. 2017, 849, 158. [Google Scholar] [CrossRef] [Scilit]
- Gueorguiev, V.G.; Maeder, A. The Scale-Invariant Vacuum Paradigm: Main Results and Current Progress Review. Symmetry 2024, 16, 657. [Google Scholar] [CrossRef] [Scilit]
- Gupta, R. Testing CCC+TL Cosmology with Observed Baryon Acoustic Oscillation Features. Astrophys. J. 2024, 964, 55. [Google Scholar] [CrossRef] [Scilit]
- Pascoli, G.; Pernas, L. Some Considerations about a Potential Application of the Abstract Concept of Asymmetric Distance in the Field of Astrophysics. 2020. Available online: https://hal.science/hal-02530737 (accessed on 16 November 2025).
- Pascoli, G. The κ-model, a minimal model alternative to dark matter: Application to the galactic rotation problem. Astrophys. Space Sci. 2022, 367, 62. [Google Scholar] [CrossRef] [Scilit]
- Pascoli, G. An empirical analysis of the dynamics of both individual galaxies and gravitational lensing in galaxy clusters without dark matter. arXiv 2022, arXiv:2210.12380. [Google Scholar] [CrossRef] [Scilit]
- Pascoli, G. The κ-Model under the Test of the SPARC Database. Universe 2024, 10, 151. [Google Scholar] [CrossRef] [Scilit]
- Pascoli, G. A comparative study of MOND and MOG theories versus the κ-model: An application to galaxy clusters. Can. J. Phys. 2023, 101, 11. [Google Scholar] [CrossRef] [Scilit]
- Pascoli, G.; Pernas, L. Is Dark Matter a Misinterpretation of a Perspective Effect? Symmetry 2024, 16, 937. [Google Scholar] [CrossRef] [Scilit]
- Famey, B.; McGaugh, S.S. Modified Newtonian Dynamics (MOND): Observational Phenomenology and Relativistic Extensions. Living Astron. 2012, 15, 10. [Google Scholar] [CrossRef] [Scilit]
- Varieschi, G.U. Relativistic Fractional-Dimension Gravity. Universe 2021, 7, 387. [Google Scholar] [CrossRef] [Scilit]
- Varieschi, G.U. Newtonian fractional-dimension gravity and the external field effect. Eur. Phys. J. Plus 2022, 137, 1217. [Google Scholar] [CrossRef] [Scilit]
- Cesare, V.; Diaferio, A.; Matsakos, T.; Angus, G. Dynamics of DiskMass Survey galaxies in refracted gravity. Astron. Astrophys. 2020, 637, A70. [Google Scholar] [CrossRef] [Scilit]
- Cesare, V.; Diaferio, A.; Matsakos, T. The dynamics of three nearby E0 galaxies in refracted gravity. Astron. Astrophys. 2022, 657, A133. [Google Scholar] [CrossRef] [Scilit]
- Cesare, V. Dark Coincidences: Small-Scale Solutions with Refracted Gravity and MOND. Universe 2023, 9, 56. [Google Scholar] [CrossRef] [Scilit]
- Li, P. The Dark Matter Problem in Rotationally Supported Galaxies. Ph.D. Thesis, Case Reserve Western University, Cleveland, OH, USA, 2020. [Google Scholar]
- Moffat, J.W.; Rahvar, S. The MOG weak field approximation and observational test of galaxy rotation curves. Mon Not. R. Astron. Soc. 2013, 436, 1439. [Google Scholar] [CrossRef] [Scilit]
- Browstein, J.R.; Moffat, J.W. Galaxy cluster masses without non-baryonic dark matter. Mon. Not. R. Astron. Soc. 2006, 367, 527. [Google Scholar] [CrossRef] [Scilit]
- Browstein, J.R.; Moffat, J.W. The Bullet Cluster 1E0657-558 evidence shows modified gravity in the absence of dark matter. Mon. Not. R. Astron. Soc. 2007, 382, 29. [Google Scholar] [CrossRef] [Scilit]
- Moffat, J.W.; Toth, V.T. Cosmological Observations in a Modified Theory of Gravity (MOG). Galaxies 2013, 1, 65. [Google Scholar] [CrossRef] [Scilit]
- Skordis, C.; Zlosnik, T. New Relativistic Theory for Modified Newtonian Dynamics. Phys. Rev. Lett. 2021, 127, 161302. [Google Scholar] [CrossRef] [Scilit]
- Beordo, W.; Crosta, M.; Lattanzi, M.G. Exploring Milky Way rotation curves with Gaia DR3: A comparison between ΛCDM, MOND, and general relativistic approaches. J. Cosmol. Astropart. Phys. 2024, 12, 024. [Google Scholar] [CrossRef] [Scilit]
- Jiao, O.; Hammer, F.; Wang, H.; Wang, J.; Amram, P.; Chemin, L.; Yang, Y. Detection of the Keplerian Decline in the Milky Way Rotation Curve. Astron. Astrophys. 2023, 678, A208. [Google Scholar] [CrossRef] [Scilit]
- Ostriker, J.P.; Peebles, P.J.E. A Numerical Study of the Stability of Flattened Galaxies: Or, can Cold Galaxies Survive? Astrophys. J. 1973, 186, 467. [Google Scholar] [CrossRef] [Scilit]
- Hernandez, X.; Kroupa, P. Dynamical Friction Constraints on the Dark Matter Hypothesis Across Astronomical Scales. Universe 2025, 11, 367. [Google Scholar] [CrossRef] [Scilit]
- Miyamoto, M.; Nagai, R. Three-dimensional models for the distribution of mass in galaxies. Pub. Astron. Soc. Japan 1975, 27, 533. [Google Scholar] [CrossRef] [Scilit]
- Lelli, F.; McGaugh, S.S.; Schombert, J.M.; Pawlowski, M.S. One Law to Rule Them All: The Radial Acceleration Relation of Galaxies. Astrophys. J. 2017, 836, 152. [Google Scholar] [CrossRef] [Scilit]
- Lelli, F.; McGaugh, S.S.; Schombert, J.M. VizieR Online Data Catalog: Mass models for 175 disk galaxies with SPARC. Astron. J. 2016, 152, 157L. [Google Scholar] [CrossRef] [Scilit]
- Müller, O.; Marleau, F.R.; Duc, P.; Habas, R.; Fensch, J.; Emsellem, E.; Poulain, M.; Lim, S.; Agnello, A.; Durrell, P.; et al. Spectroscopic study of MATLAS-2019 with MUSE: An ultra-diffuse galaxy with an excess of old globular clusters. Astron. Astrophys. 2020, 640, A106. [Google Scholar] [CrossRef] [Scilit]
- Mistele, T.; McGaugh, S.S.; Lelli, F.; Schombert, J.M.; Li, P. Indefinitely Flat Circular Velocities and the Baryonic Tully-Fisher Relation from Weak Lensing. Astrophys. J. Lett. 2024, 969, L3. [Google Scholar] [CrossRef] [Scilit]
- Chan, M.H.; Zhang, Y.; Del Popolo, A. Are the Galaxies with Indefinitely Flat Circular Velocities Located Inside Large Dark Matter Haloes? Universe 2025, 11, 4. [Google Scholar] [CrossRef] [Scilit]
- Galianni, P.; Feix, M.; Zhao, H.; Horne, K. Testing quasilinear modified Newtonian dynamics in the Solar System. Phys. Rev. D 2012, 86, 044002. [Google Scholar] [CrossRef] [Scilit]
- Kam, S.Z.; Carignan, C.; Chemin, L.; Foster, T.; Elson, E.; Jarrett, T.H. H i Kinematics and Mass Distribution of Messier 33. Astrophys. J. 2017, 154, 41. [Google Scholar] [CrossRef] [Scilit]
- Banik, I.; Thies, I.; Famaey, B.; Candlish, G.; Kroupa, P.; Ibata, R. The Global Stability of M33 in MOND. Astrophys. J. 2020, 905, 135. [Google Scholar] [CrossRef] [Scilit]
- Reiprich, T.H.; Böhringer, H. The Mass Function of an X-Ray Flux-limited Sample of Galaxy Clusters. Astrophys. J. 2002, 567, 716. [Google Scholar] [CrossRef] [Scilit]
- Bradač, M.; Schneider, P.; Lombardi, M.; Erben, T. Strong and weak lensing united. I. The combined strong and weak lensing cluster mass reconstruction method. Astron. Astrophys. 2005, 437, 39. [Google Scholar] [CrossRef] [Scilit]
- Bradač, M.; Clowe, D.; Gonzalez, A.H.; Marshall, P.; Forman, W.; Jones, C.; Markevitch, M.; Randall, S.; Schrabback, T.; Zaritsky, D.; et al. Strong and Weak Lensing United. III. Measuring the Mass Distribution of the Merging Galaxy Cluster 1ES 0657–558. Astrophys. J. 2006, 652, 937. [Google Scholar] [CrossRef] [Scilit]
- Finkelman, I.; Moiseev, A.; Brosch, N.; Katkov, I. Hoag’s Object: Evidence for cold accretion on to an elliptical galaxy. Mon. Not. R. Astron. Soc. 2011, 418, 1834. [Google Scholar] [CrossRef] [Scilit]
- Brosch, N.; Finkelman, I.; Tom Oosterloo, T.; Gyula Jozsa, G.; Moiseev, A. HI in HO: Hoag’s object revisited. Mon. Not. R. Astron. Soc. 2013, 435, 475. [Google Scholar] [CrossRef] [Scilit]
- Bannikova, E.Y. The structure and stability of orbits in Hoag-like ring systems. Mon. Not. R. Astron. Soc. 2018, 476, 3269. [Google Scholar] [CrossRef] [Scilit]
- Hoag, A. A peculiar object in Serpens. Astron. J. 1950, 55, 170. [Google Scholar] [CrossRef] [Scilit]
- Hernandez, X.; Cookson, S.; Cortés, R.A.M. Internal kinematics of Gaia eDR3 wide binaries. Mon. Not. R. Astron. Soc. 2022, 509, 2304. [Google Scholar] [CrossRef] [Scilit]
- Chae, K.H. Breakdown of the Newton–Einstein Standard Gravity at Low Acceleration in Internal Dynamics of Wide Binary Stars. Astrophys. J. 2023, 952, 128. [Google Scholar] [CrossRef] [Scilit] [PubMed]
- Banik, I.; Pittordis, C.; Sutherl, W.; Famaey, B.; Ibata, R.; Mieske, S.; Zhao, H.S. Strong constraints on the gravitational law from Gaia DR3 wide binaries. Mon. Not. R. Astron. Soc. 2024, 527, 4573. [Google Scholar] [CrossRef] [Scilit]
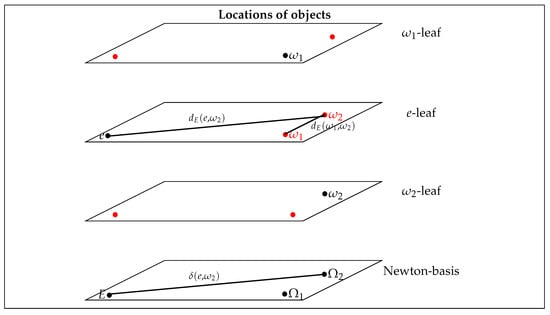
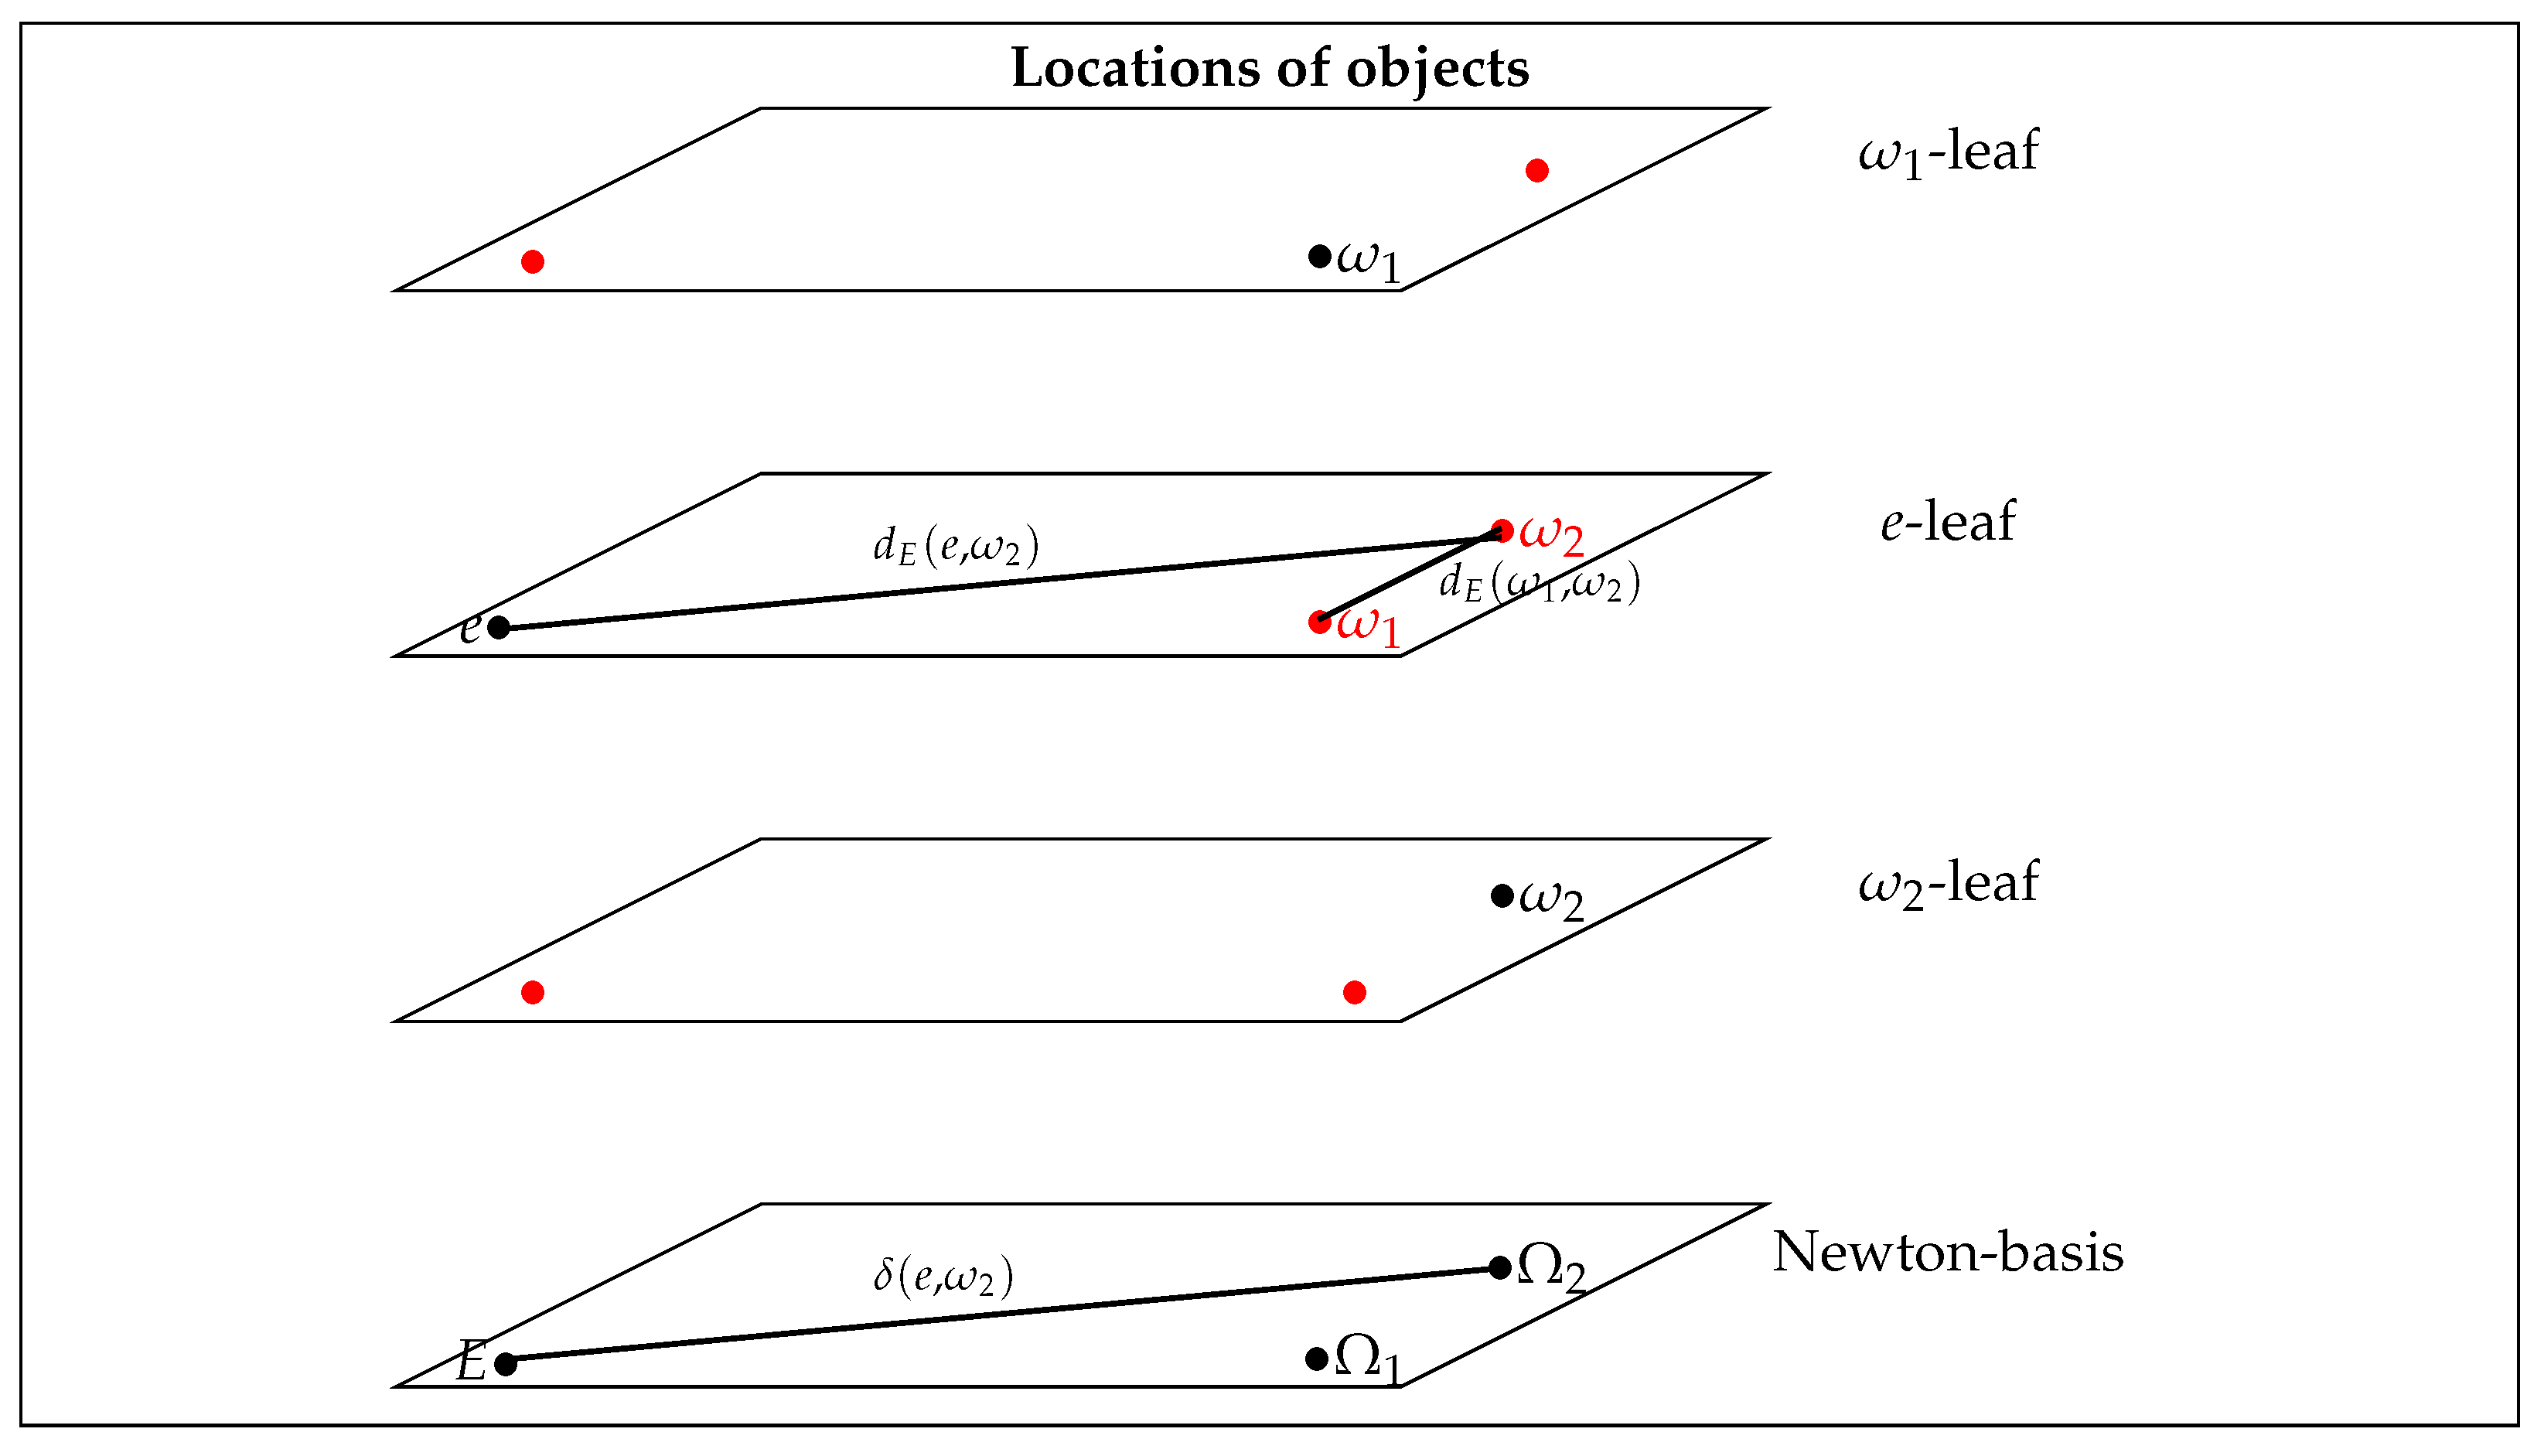
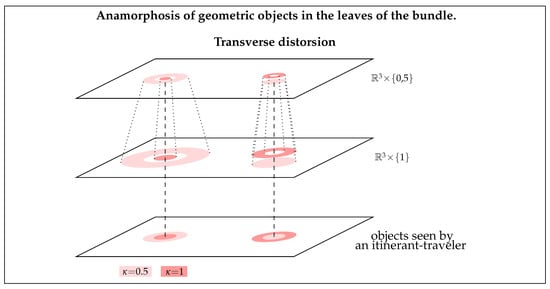
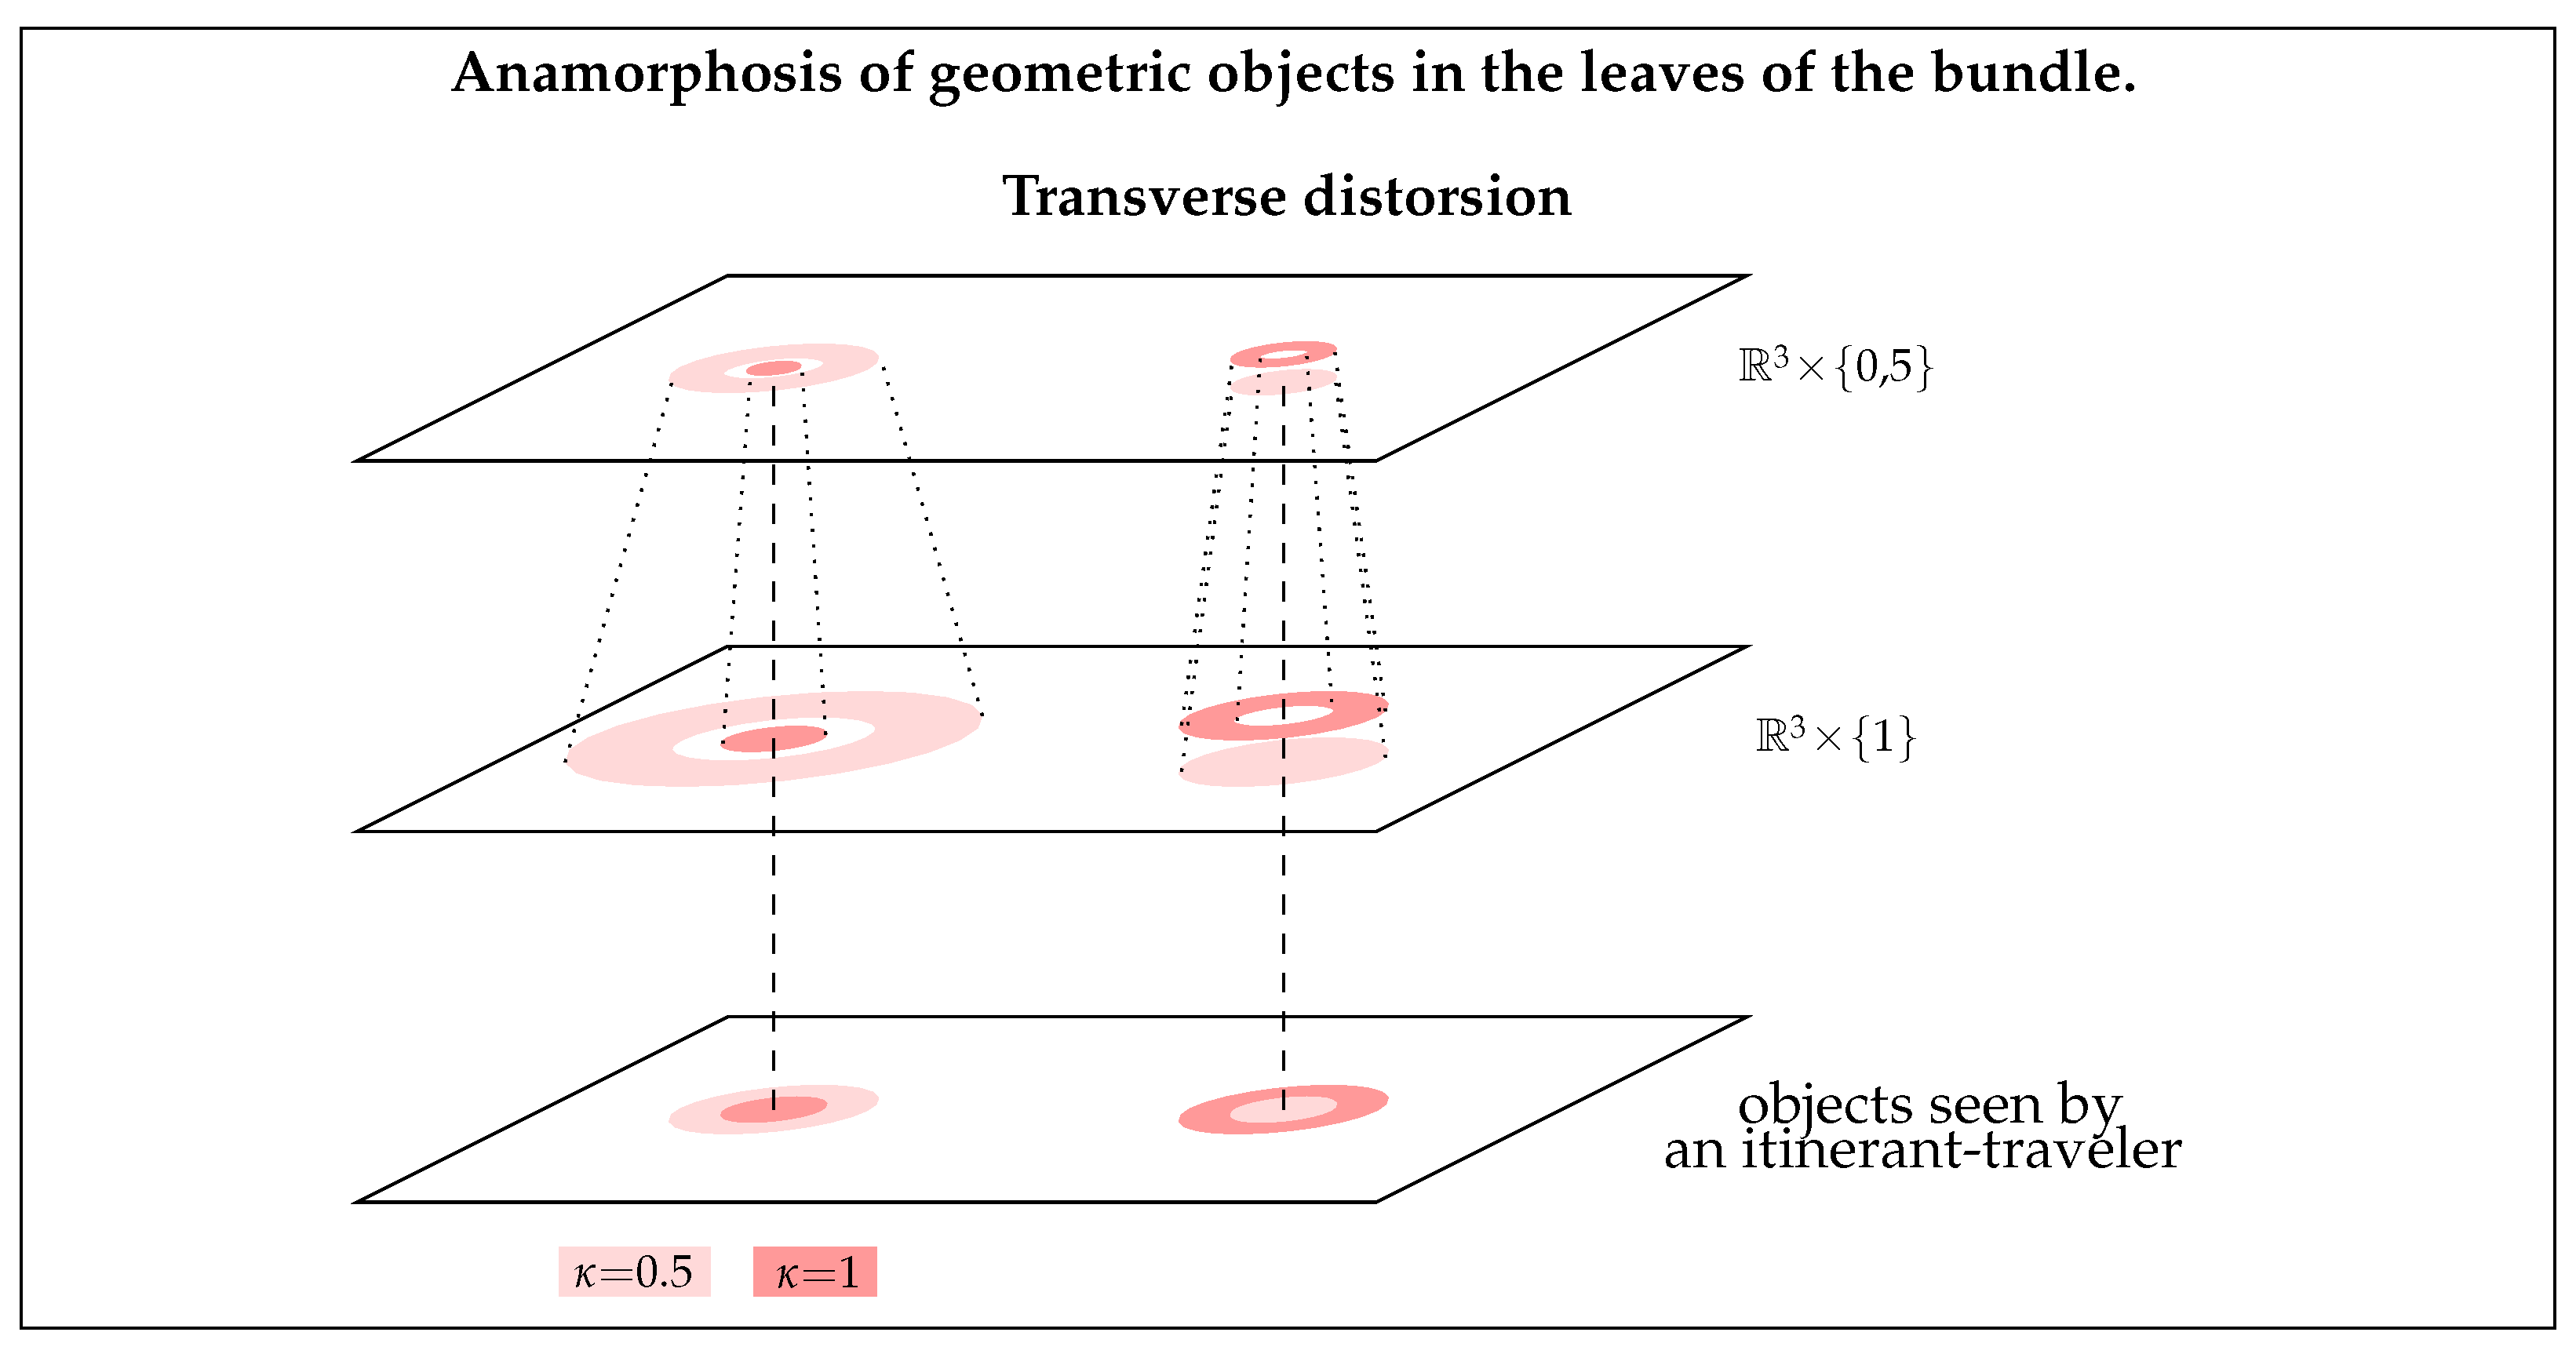
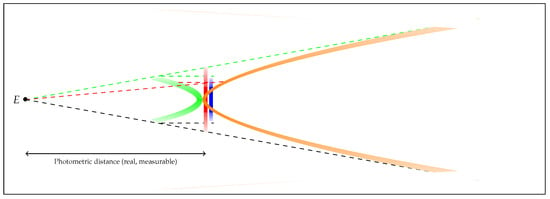
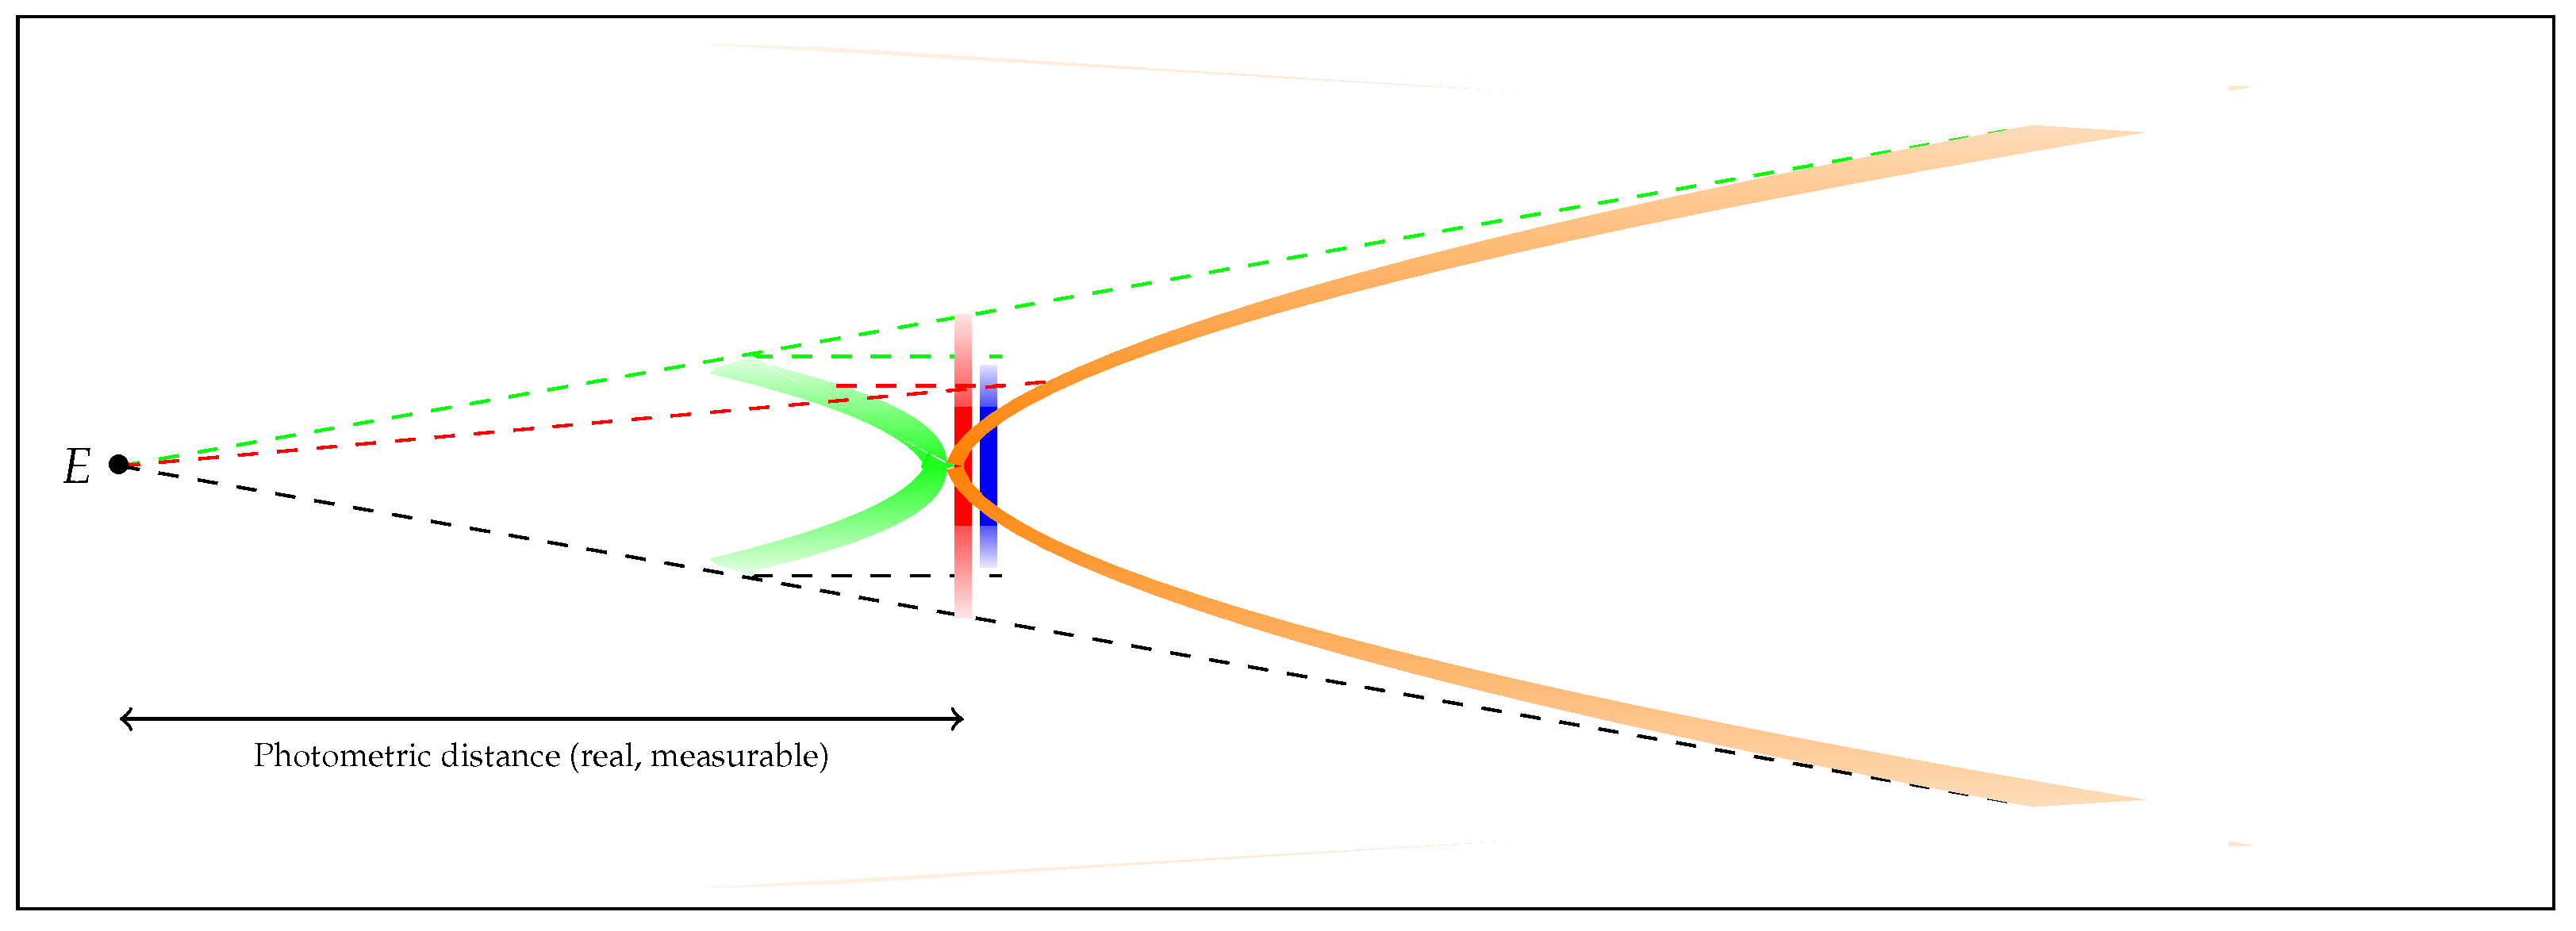
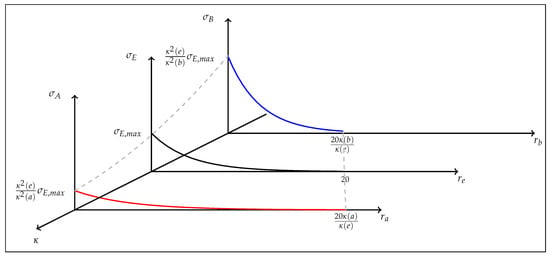
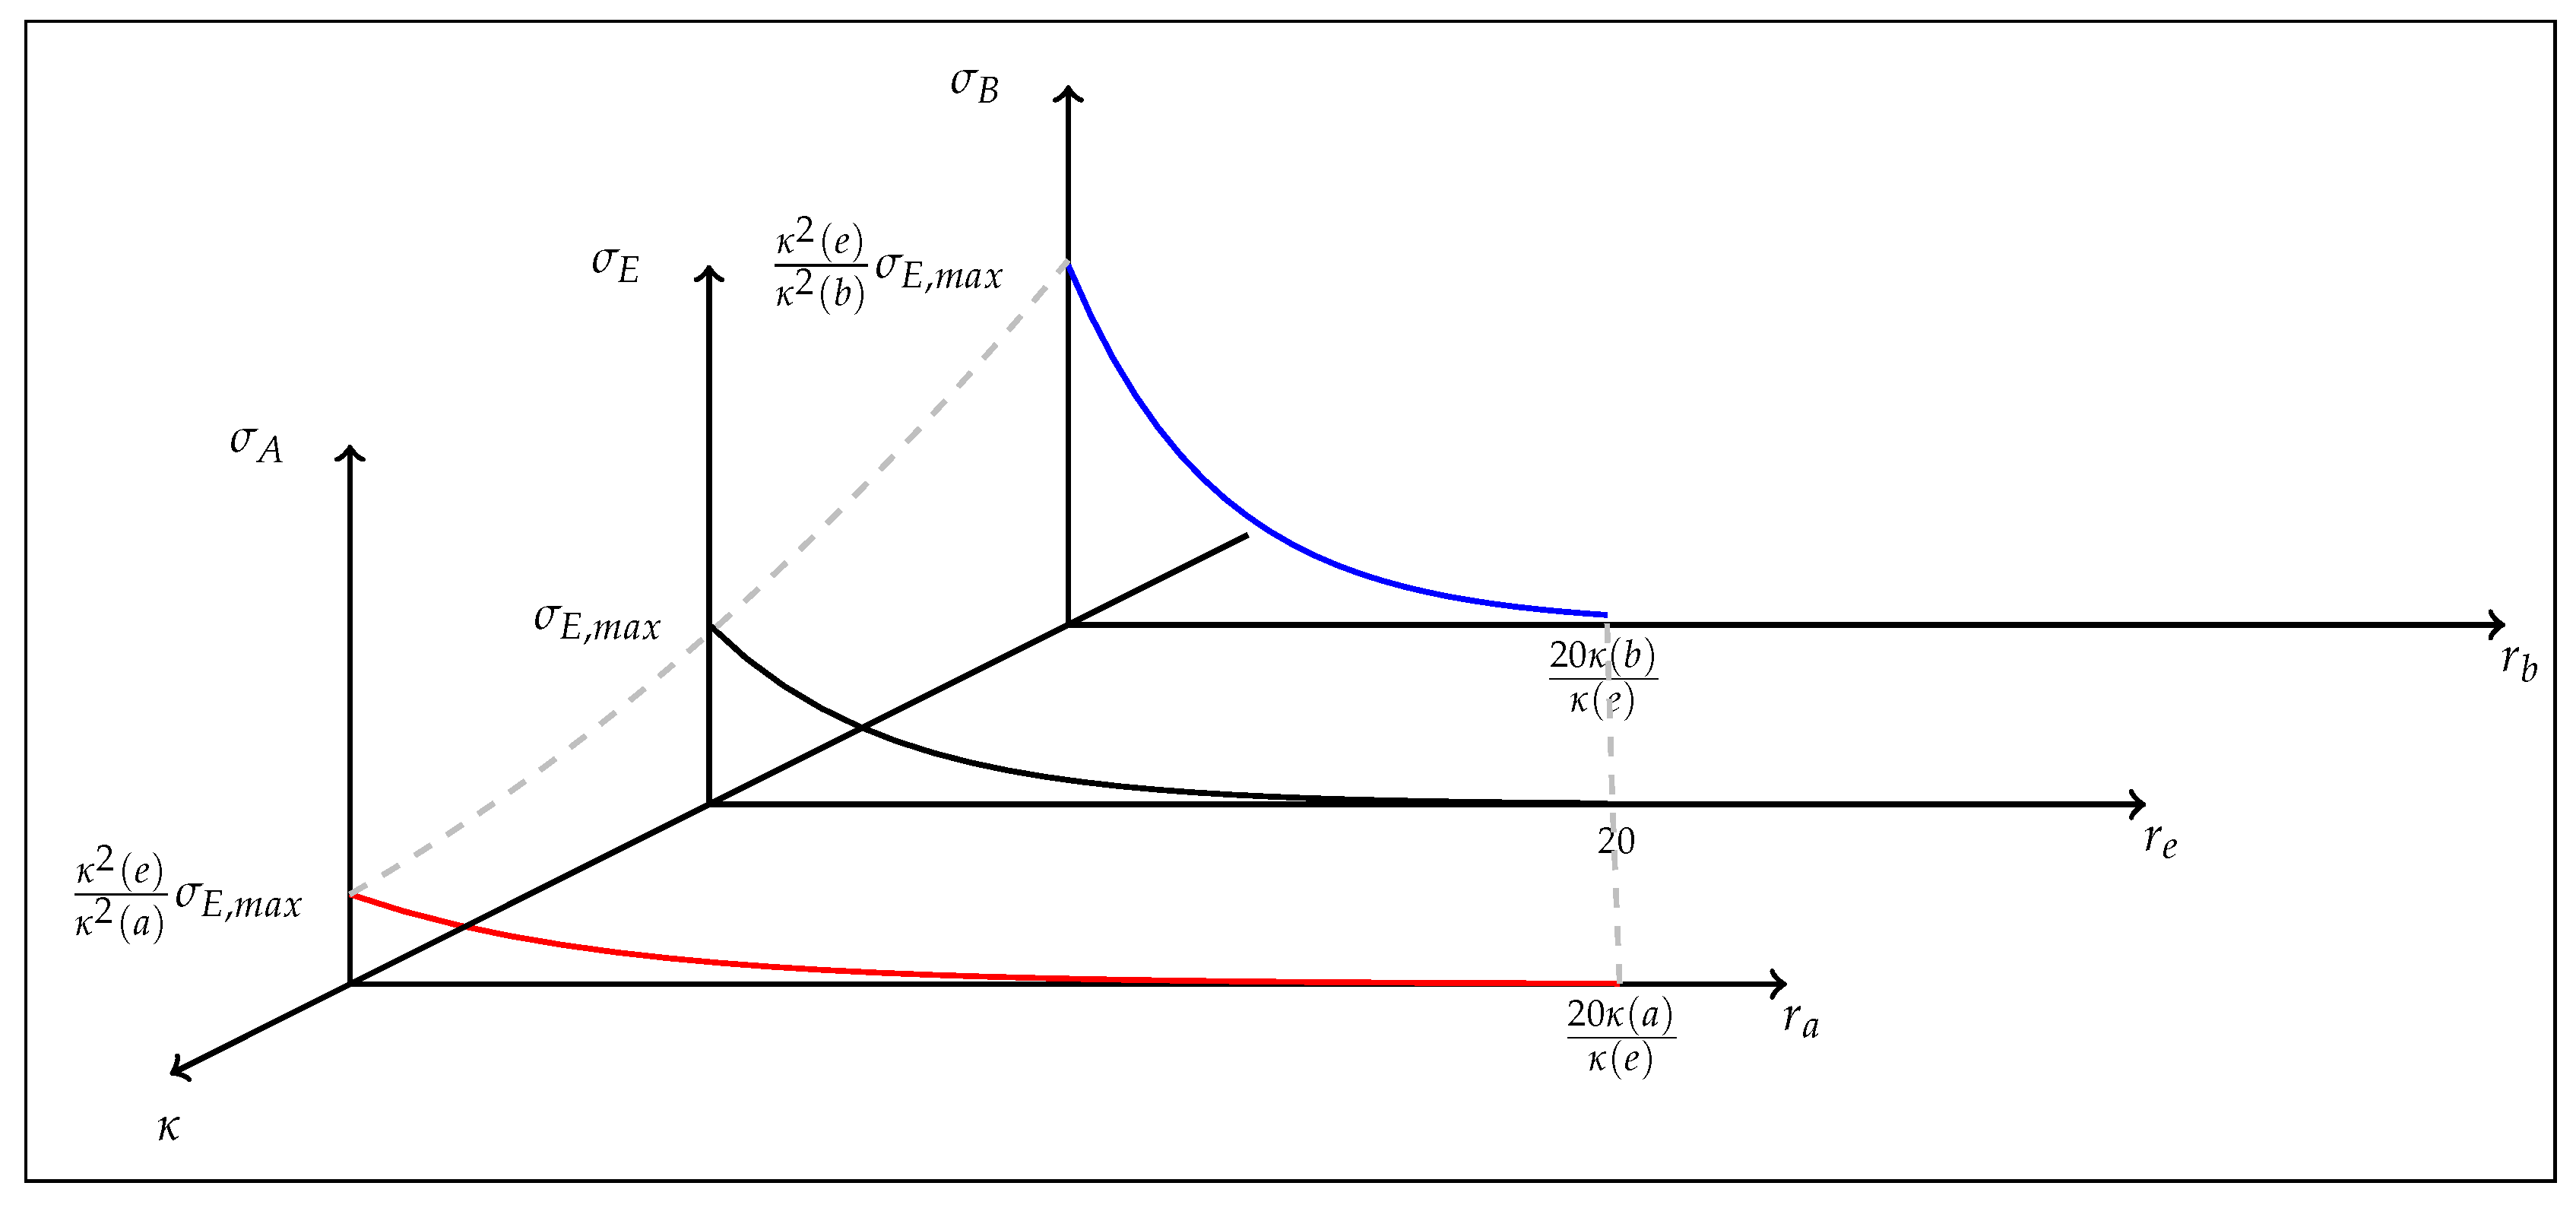
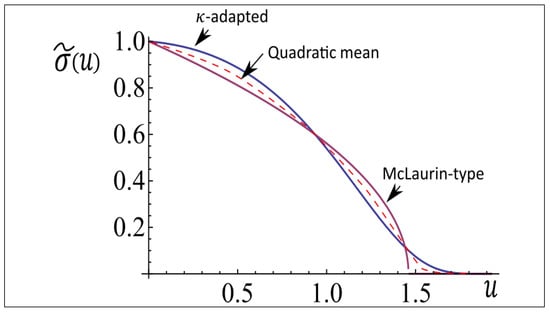
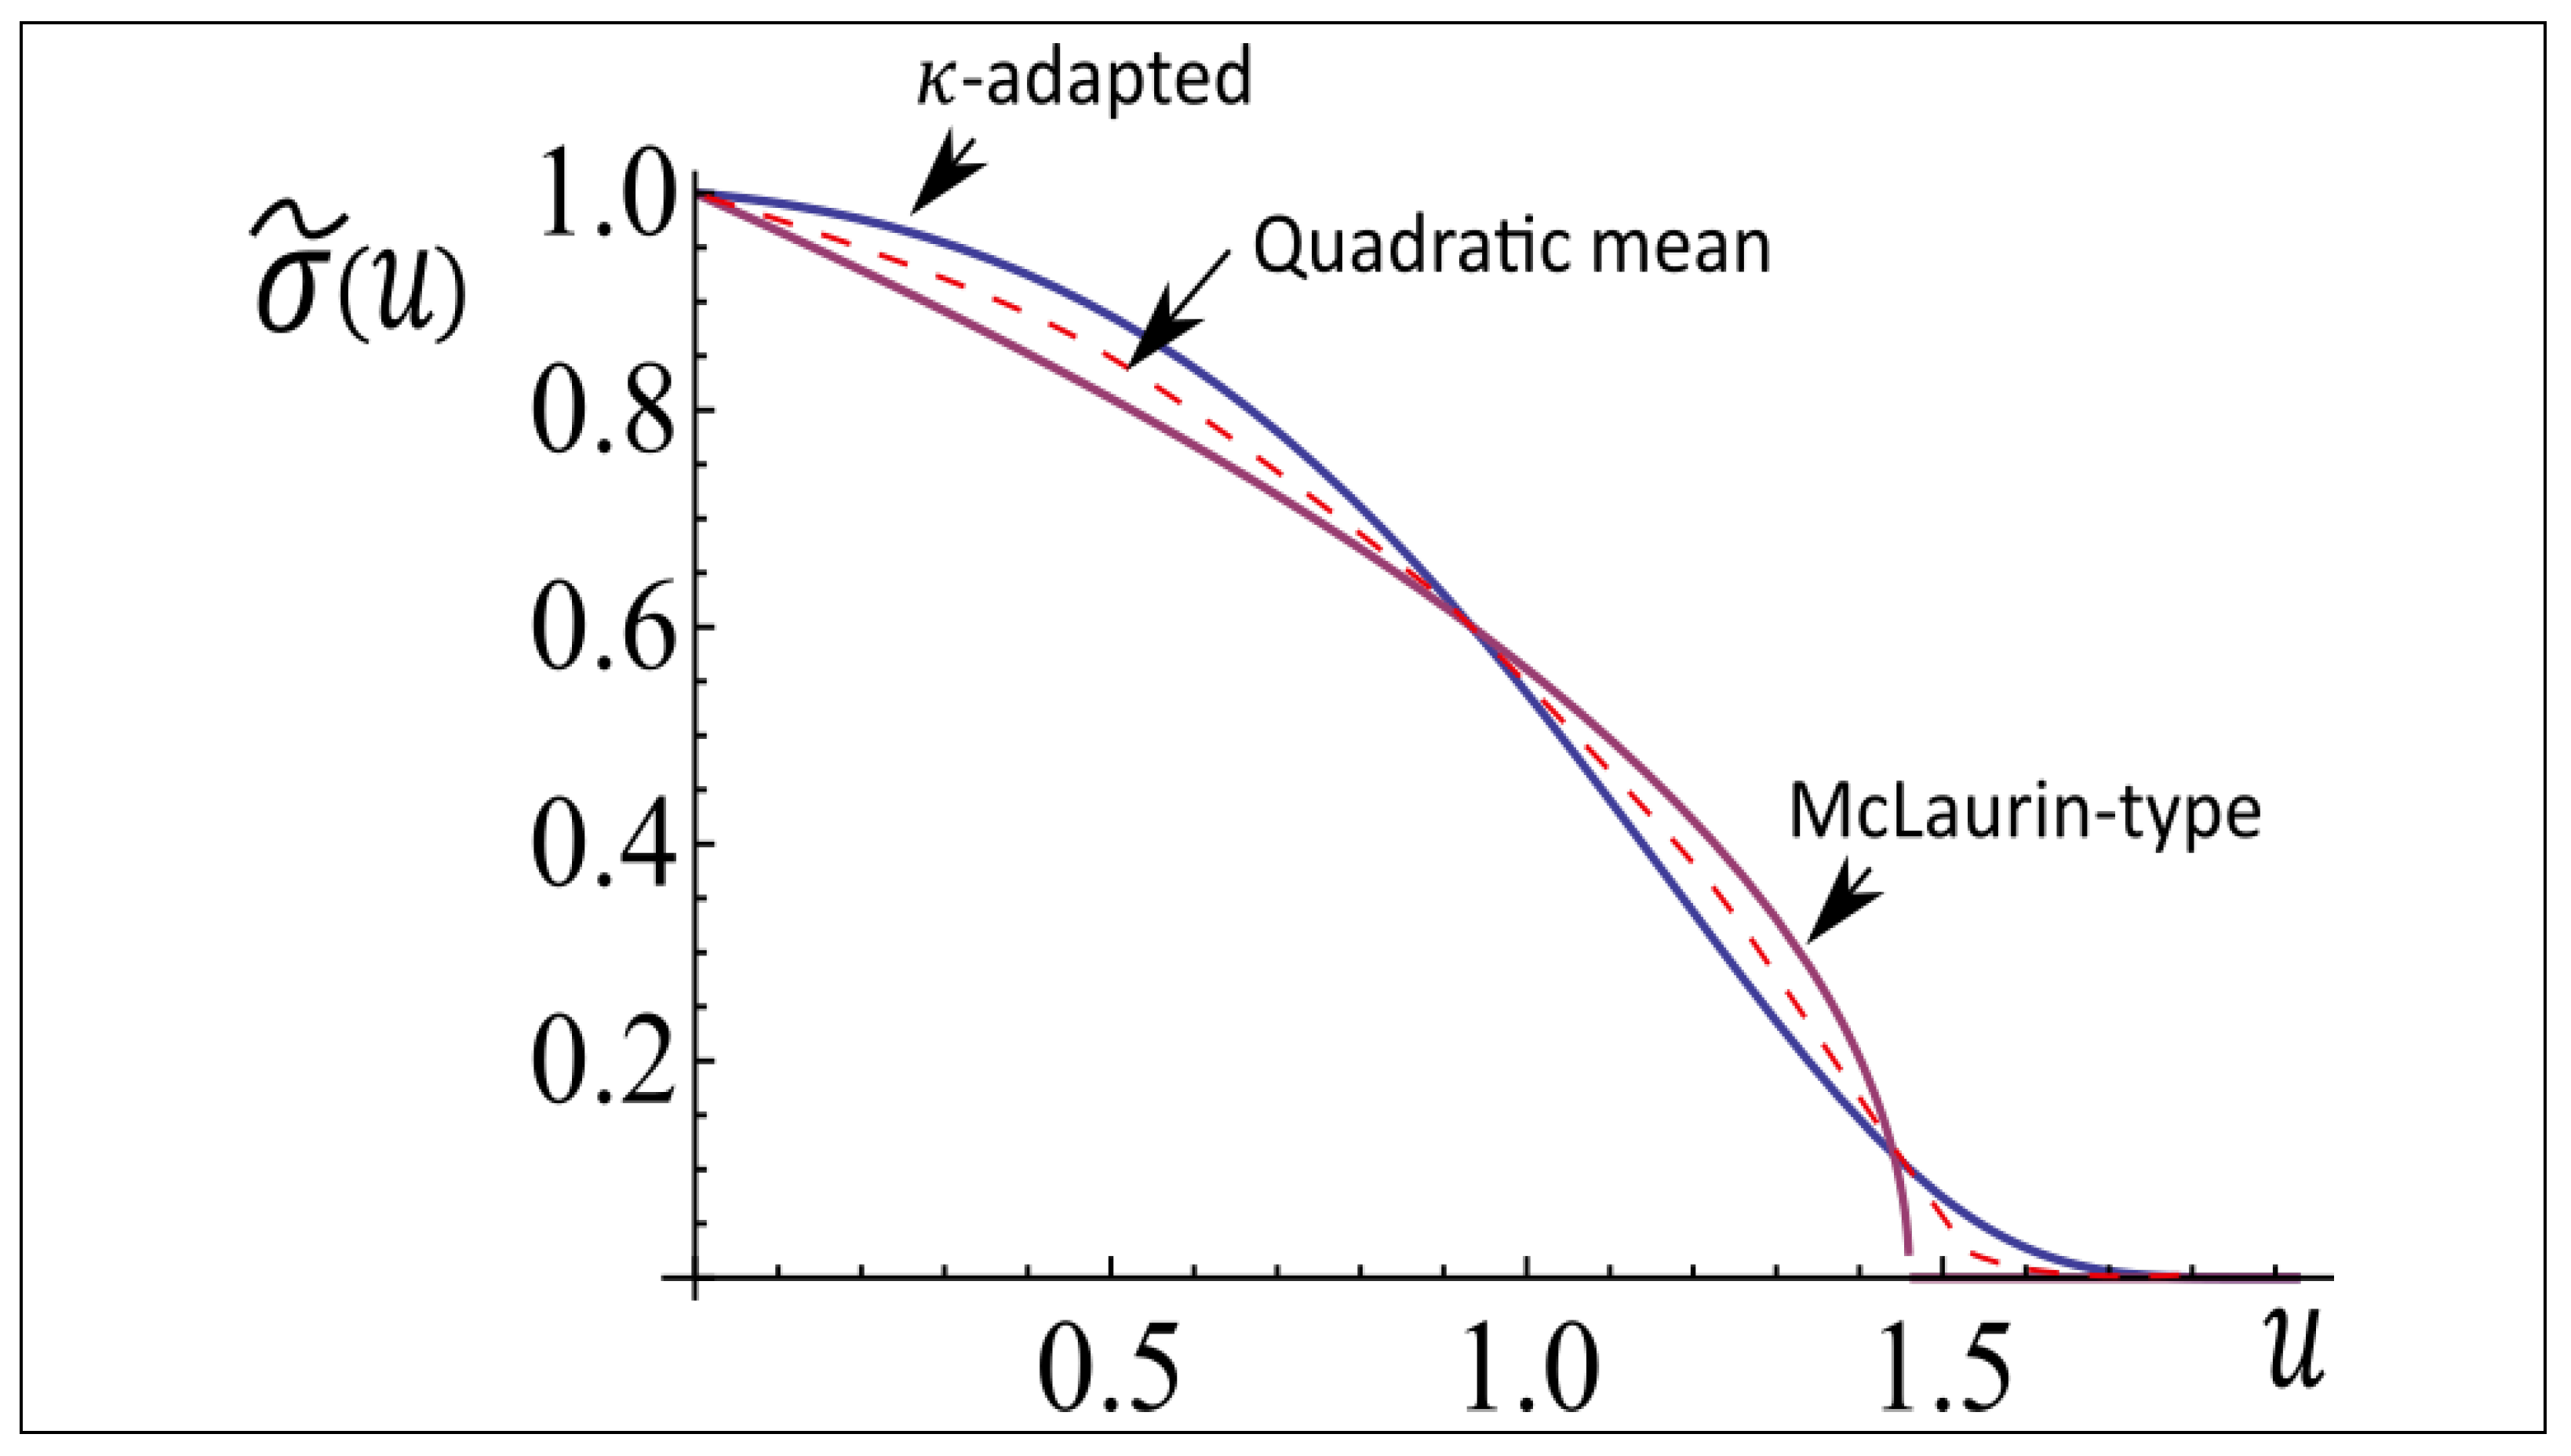
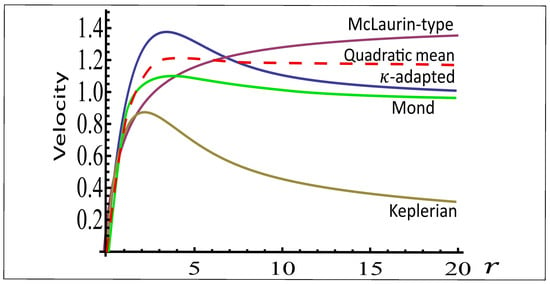
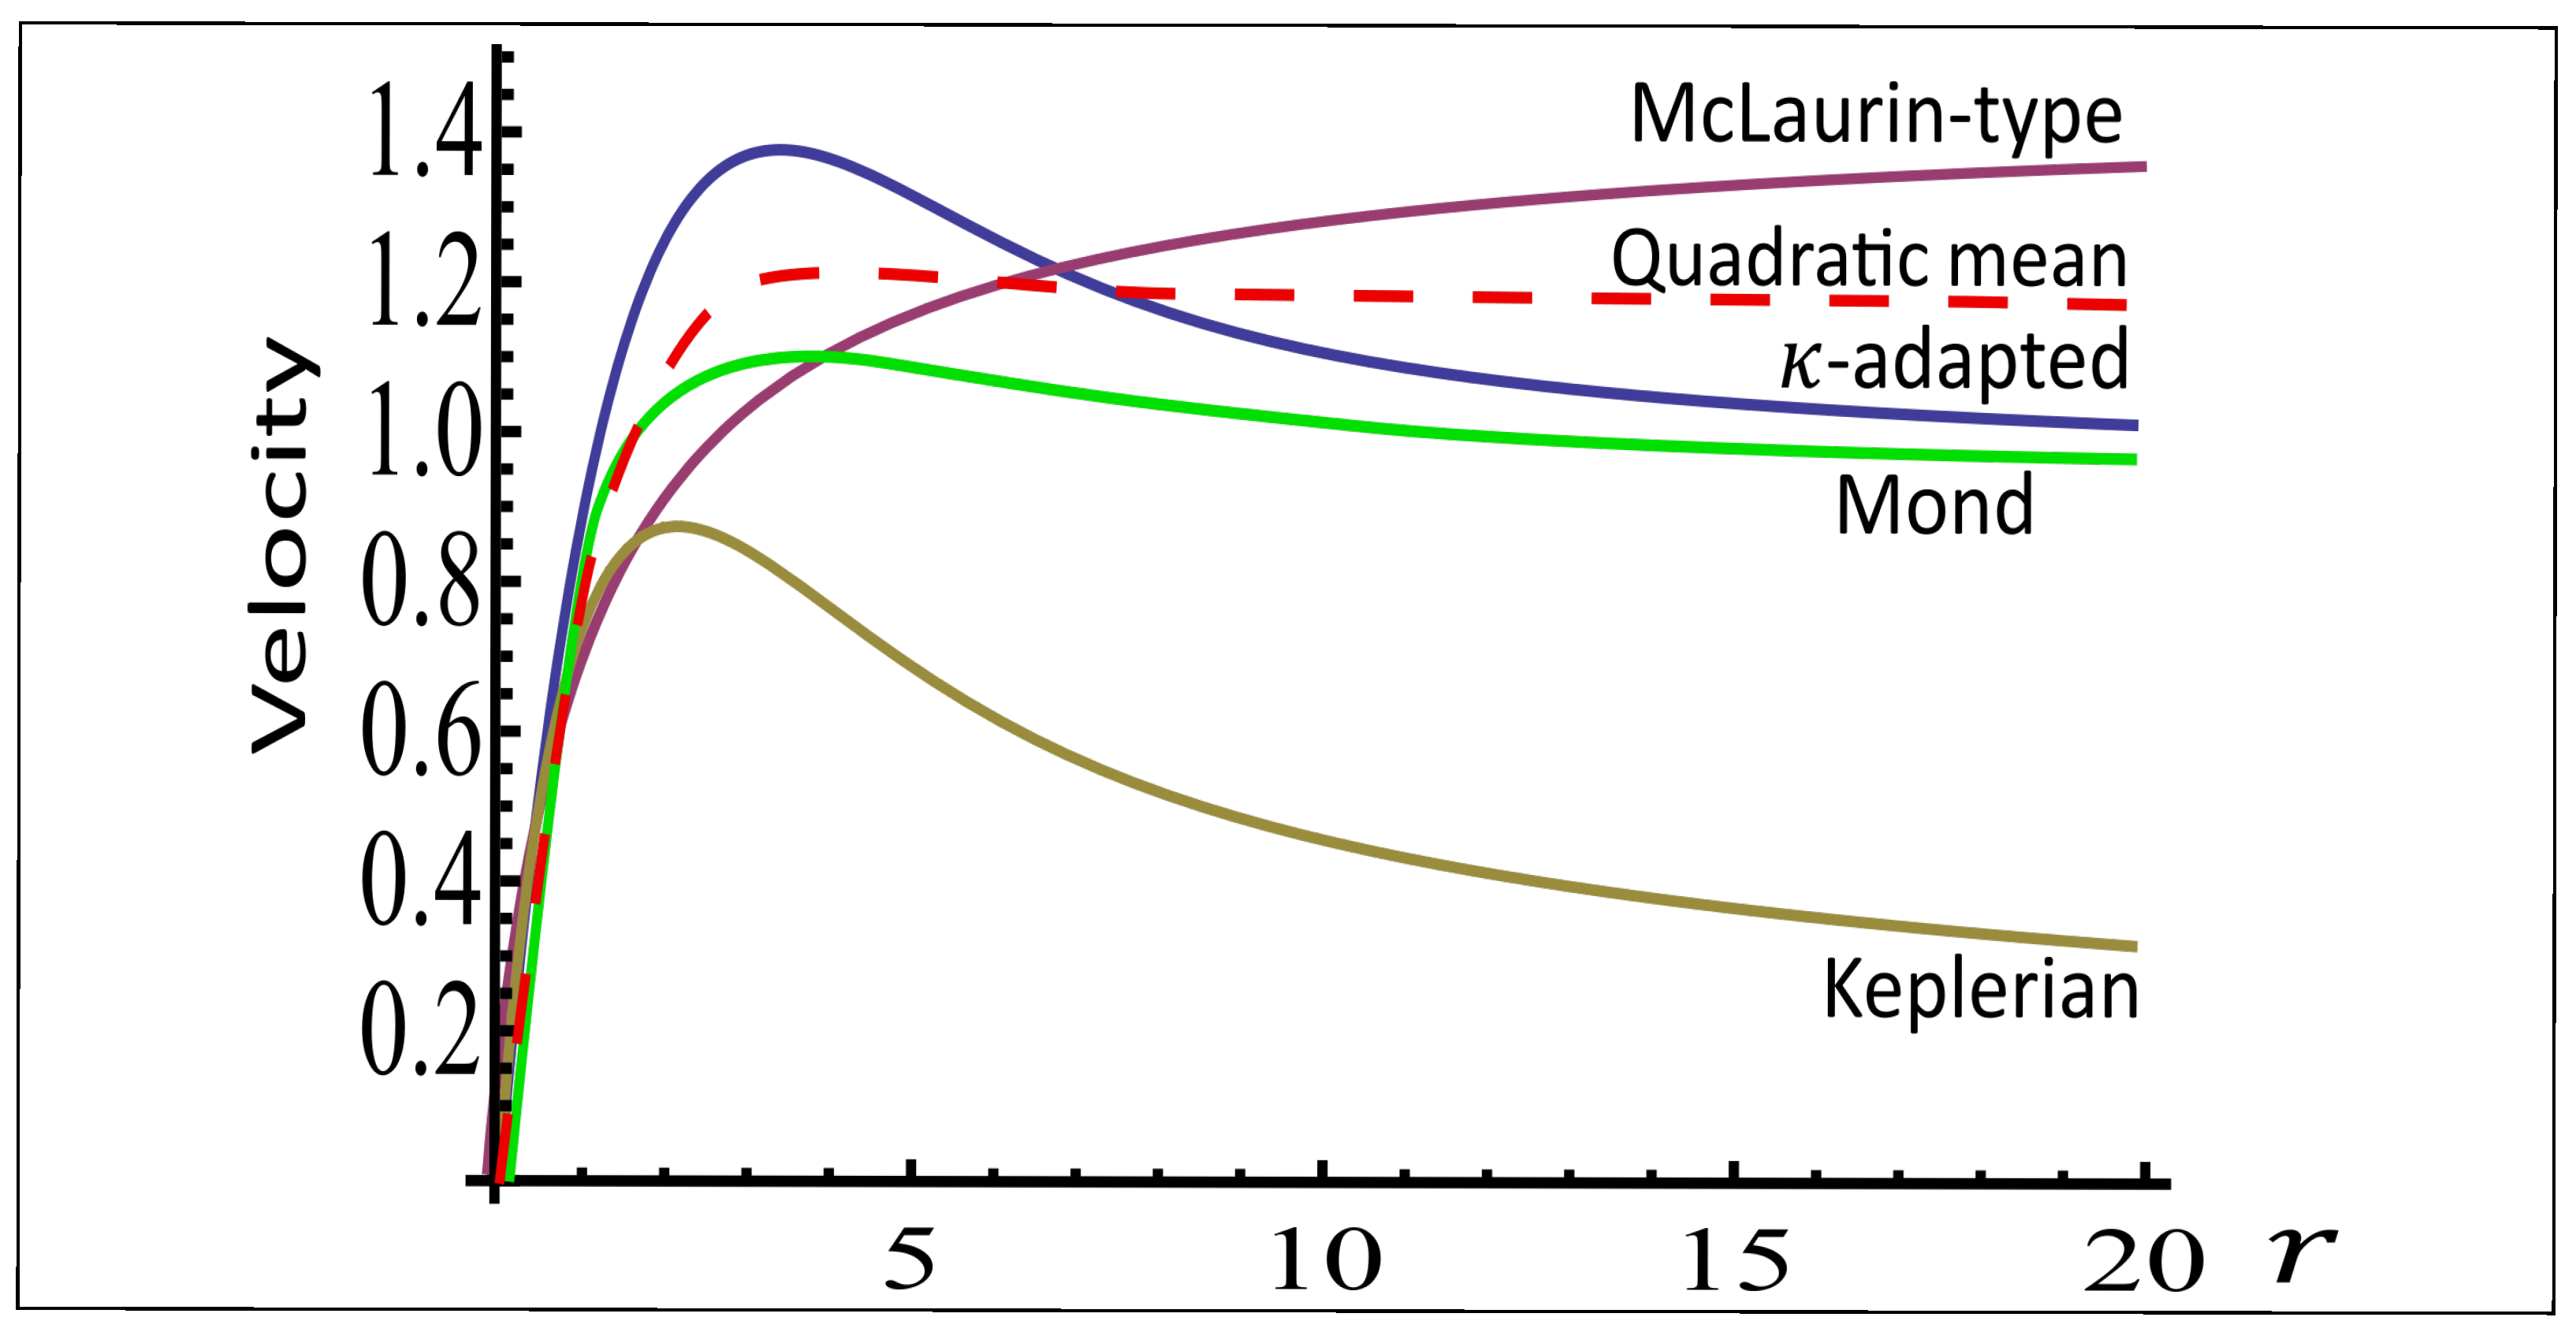
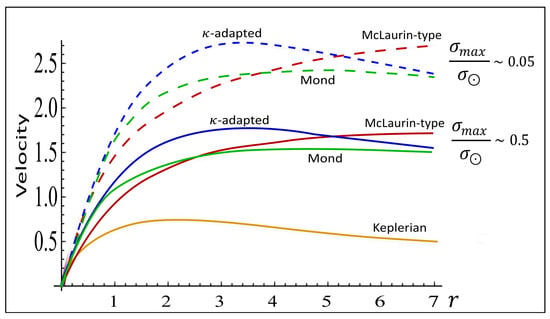
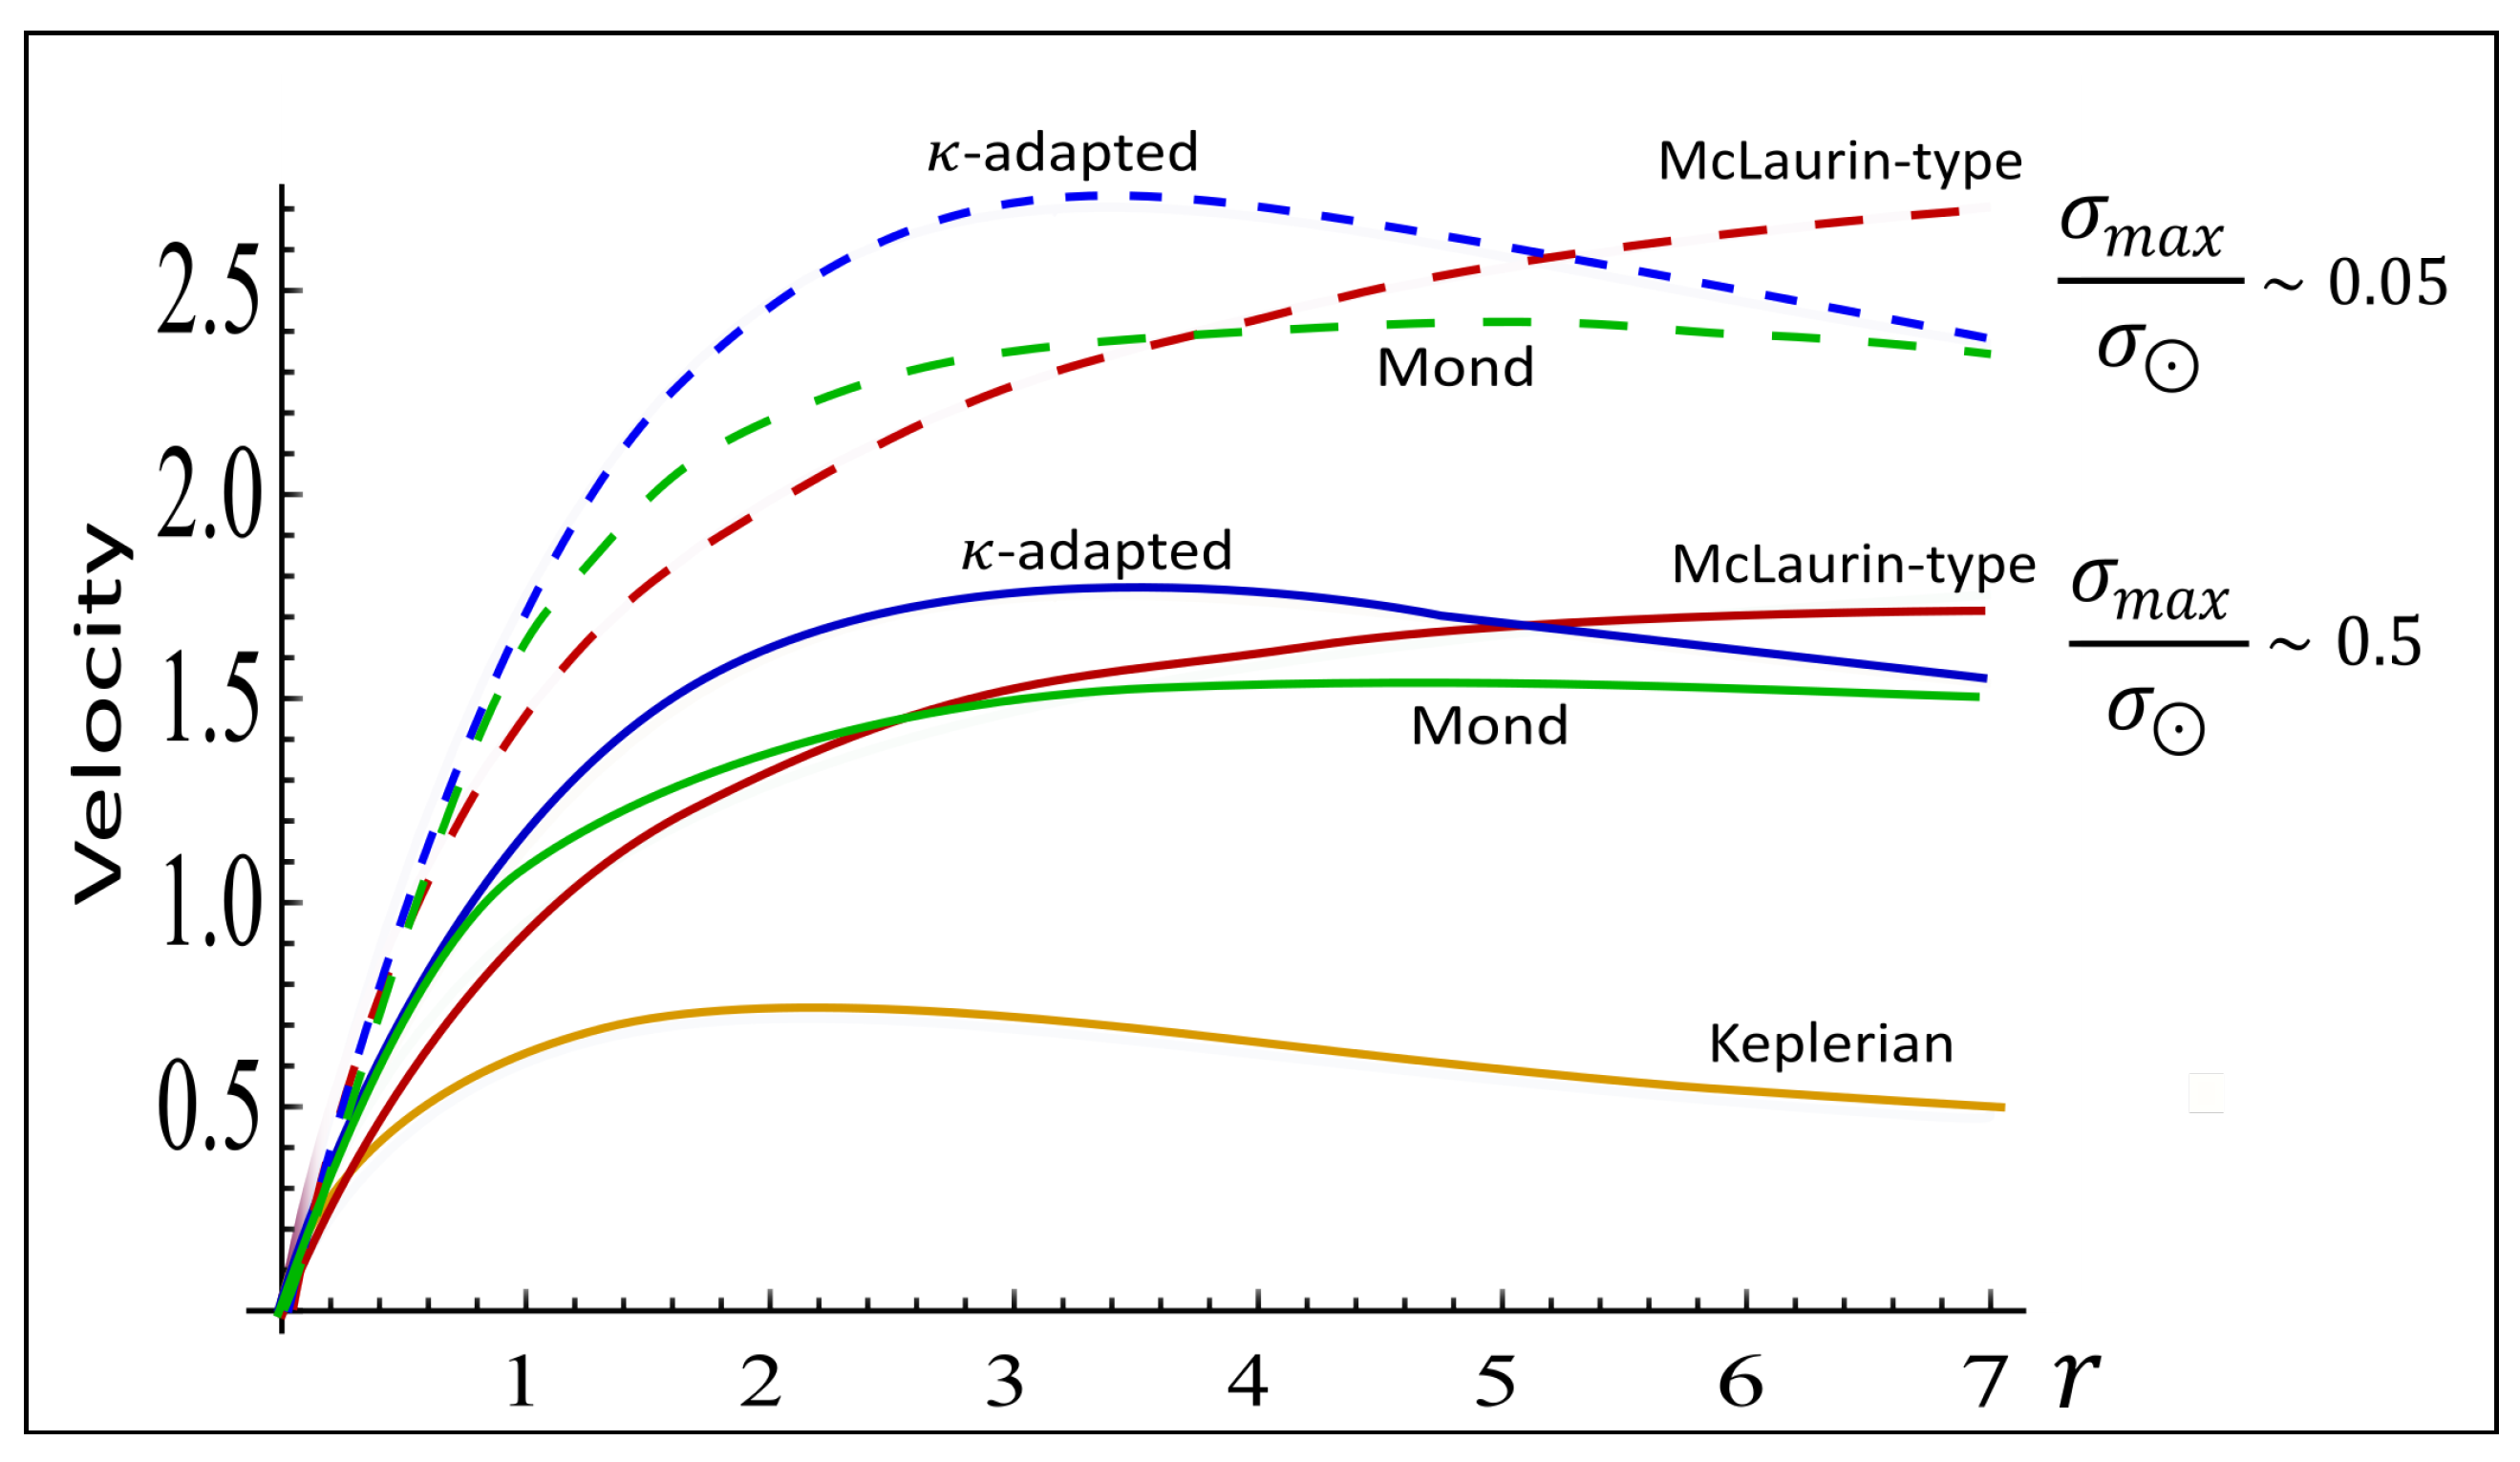
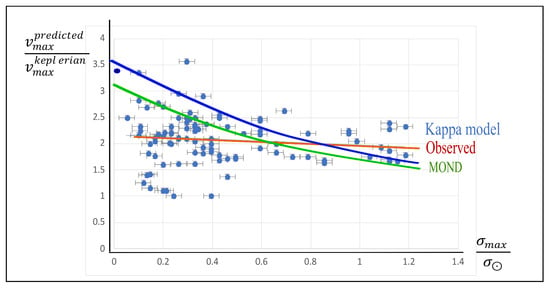
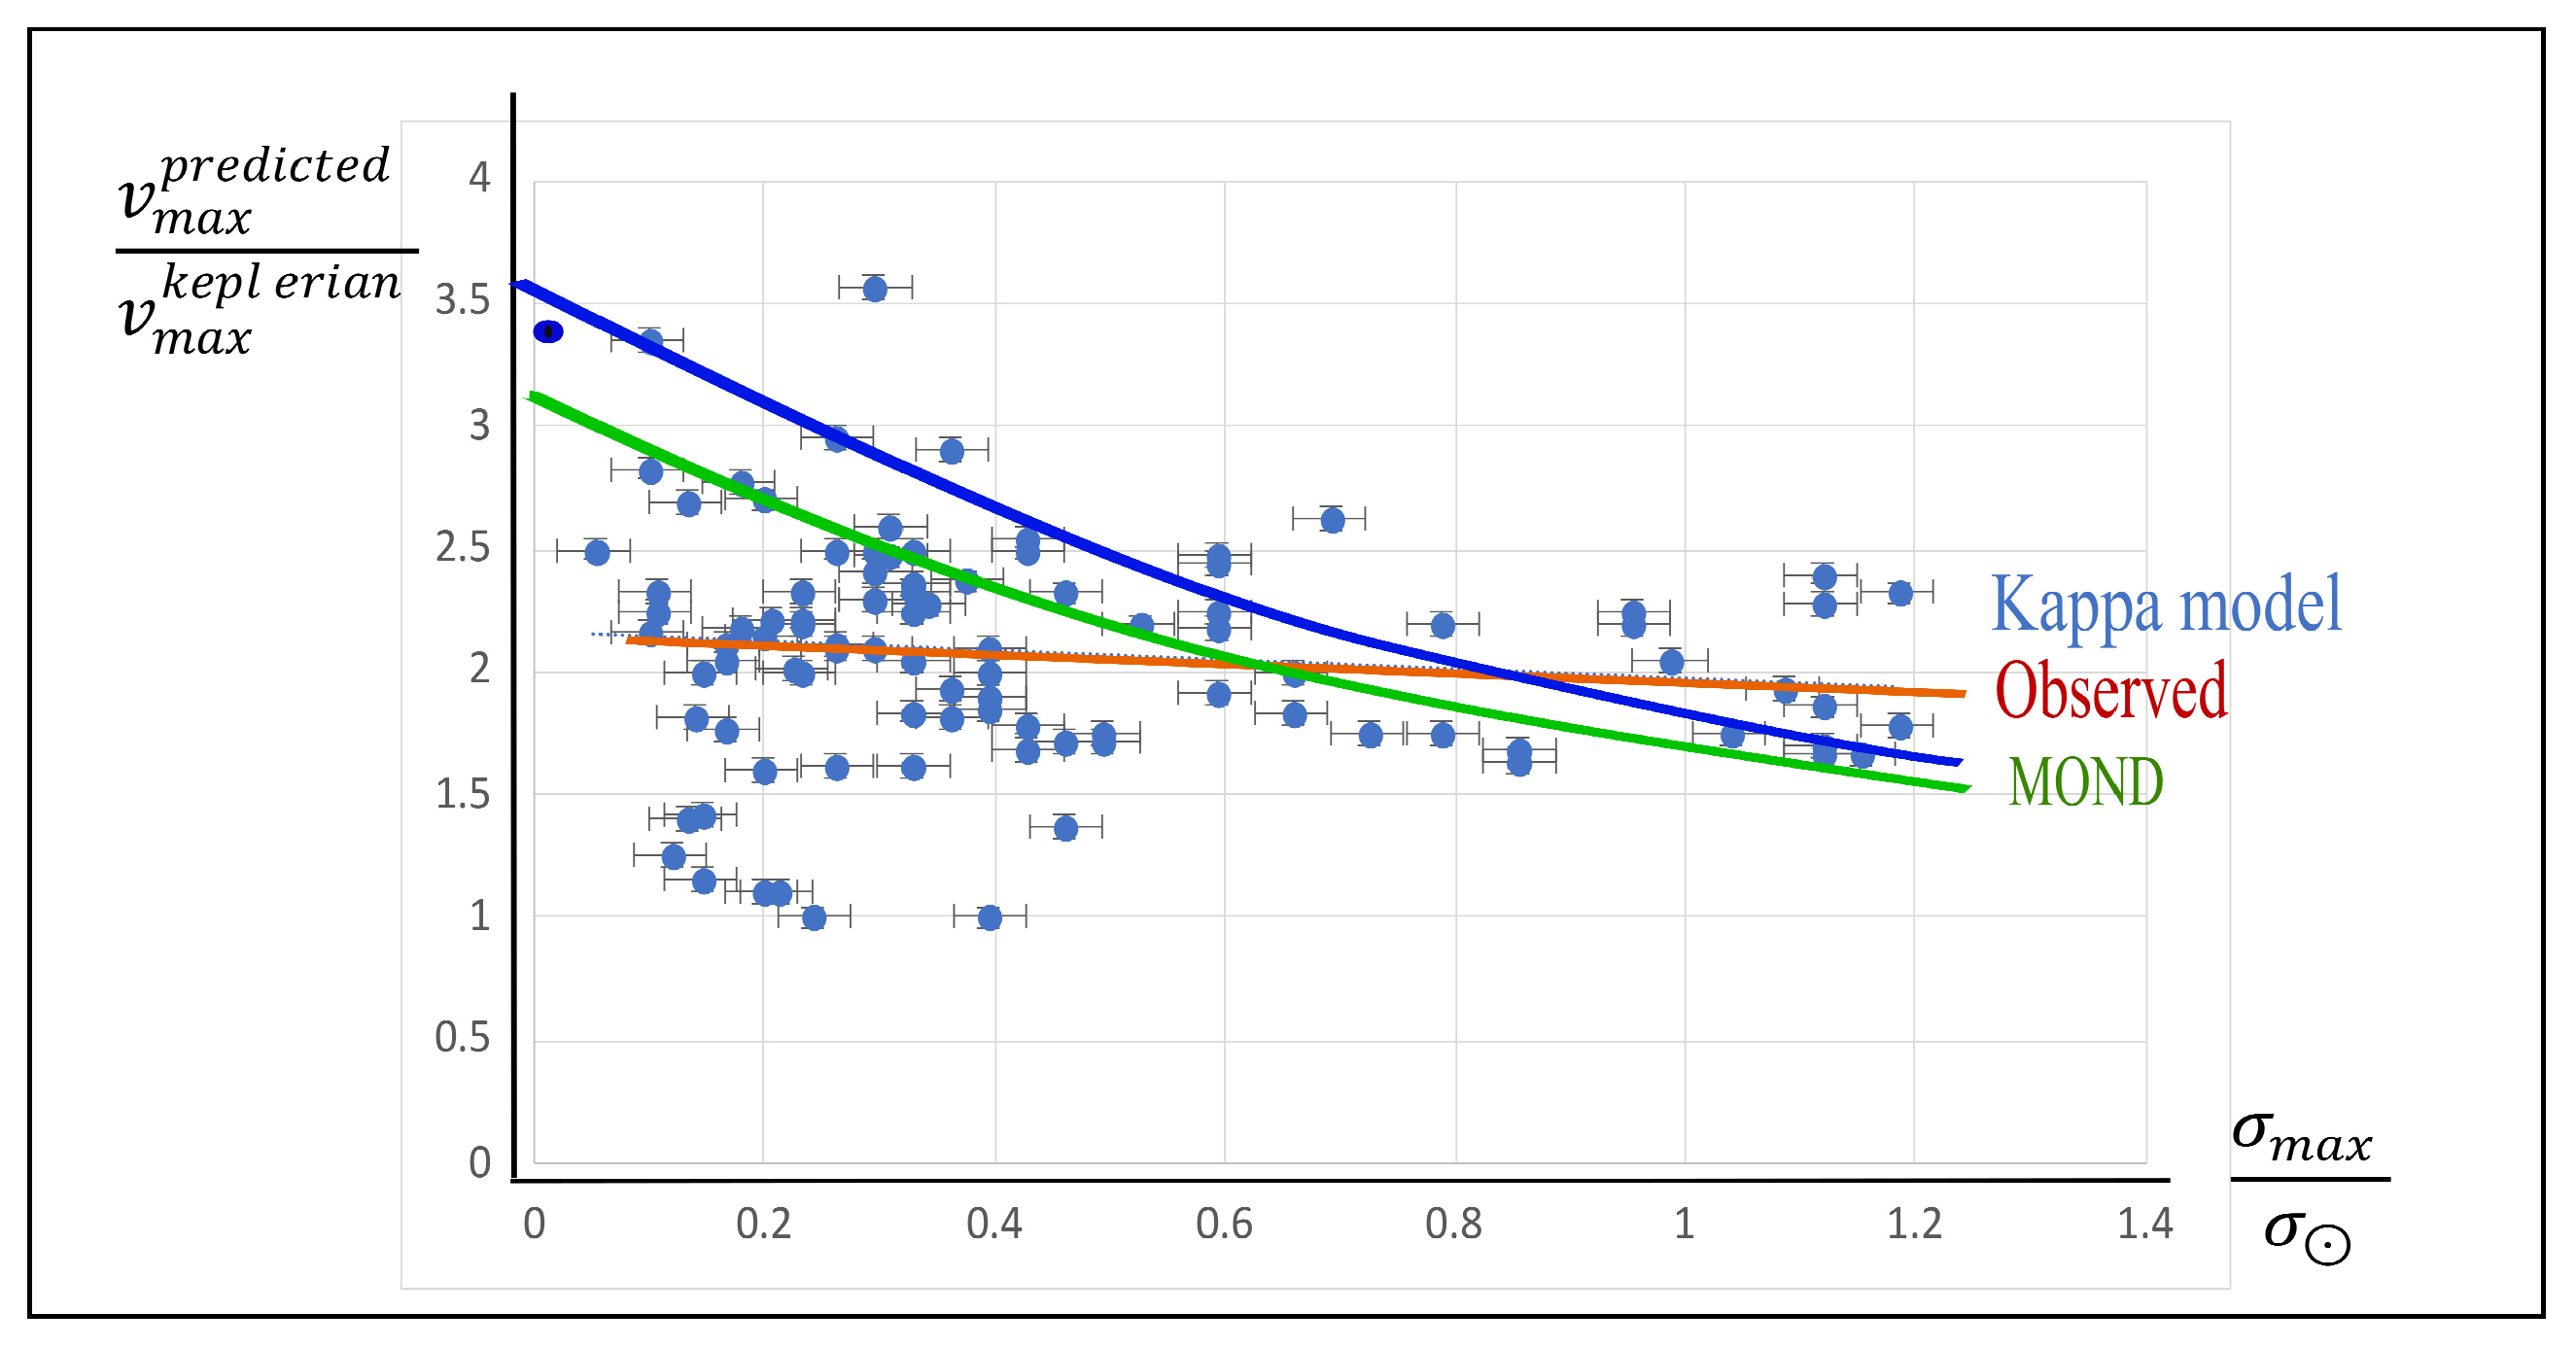
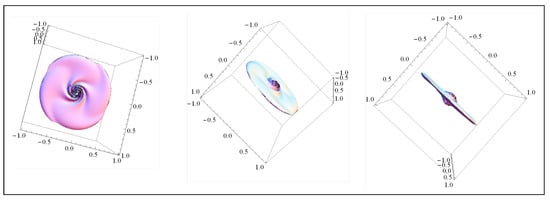
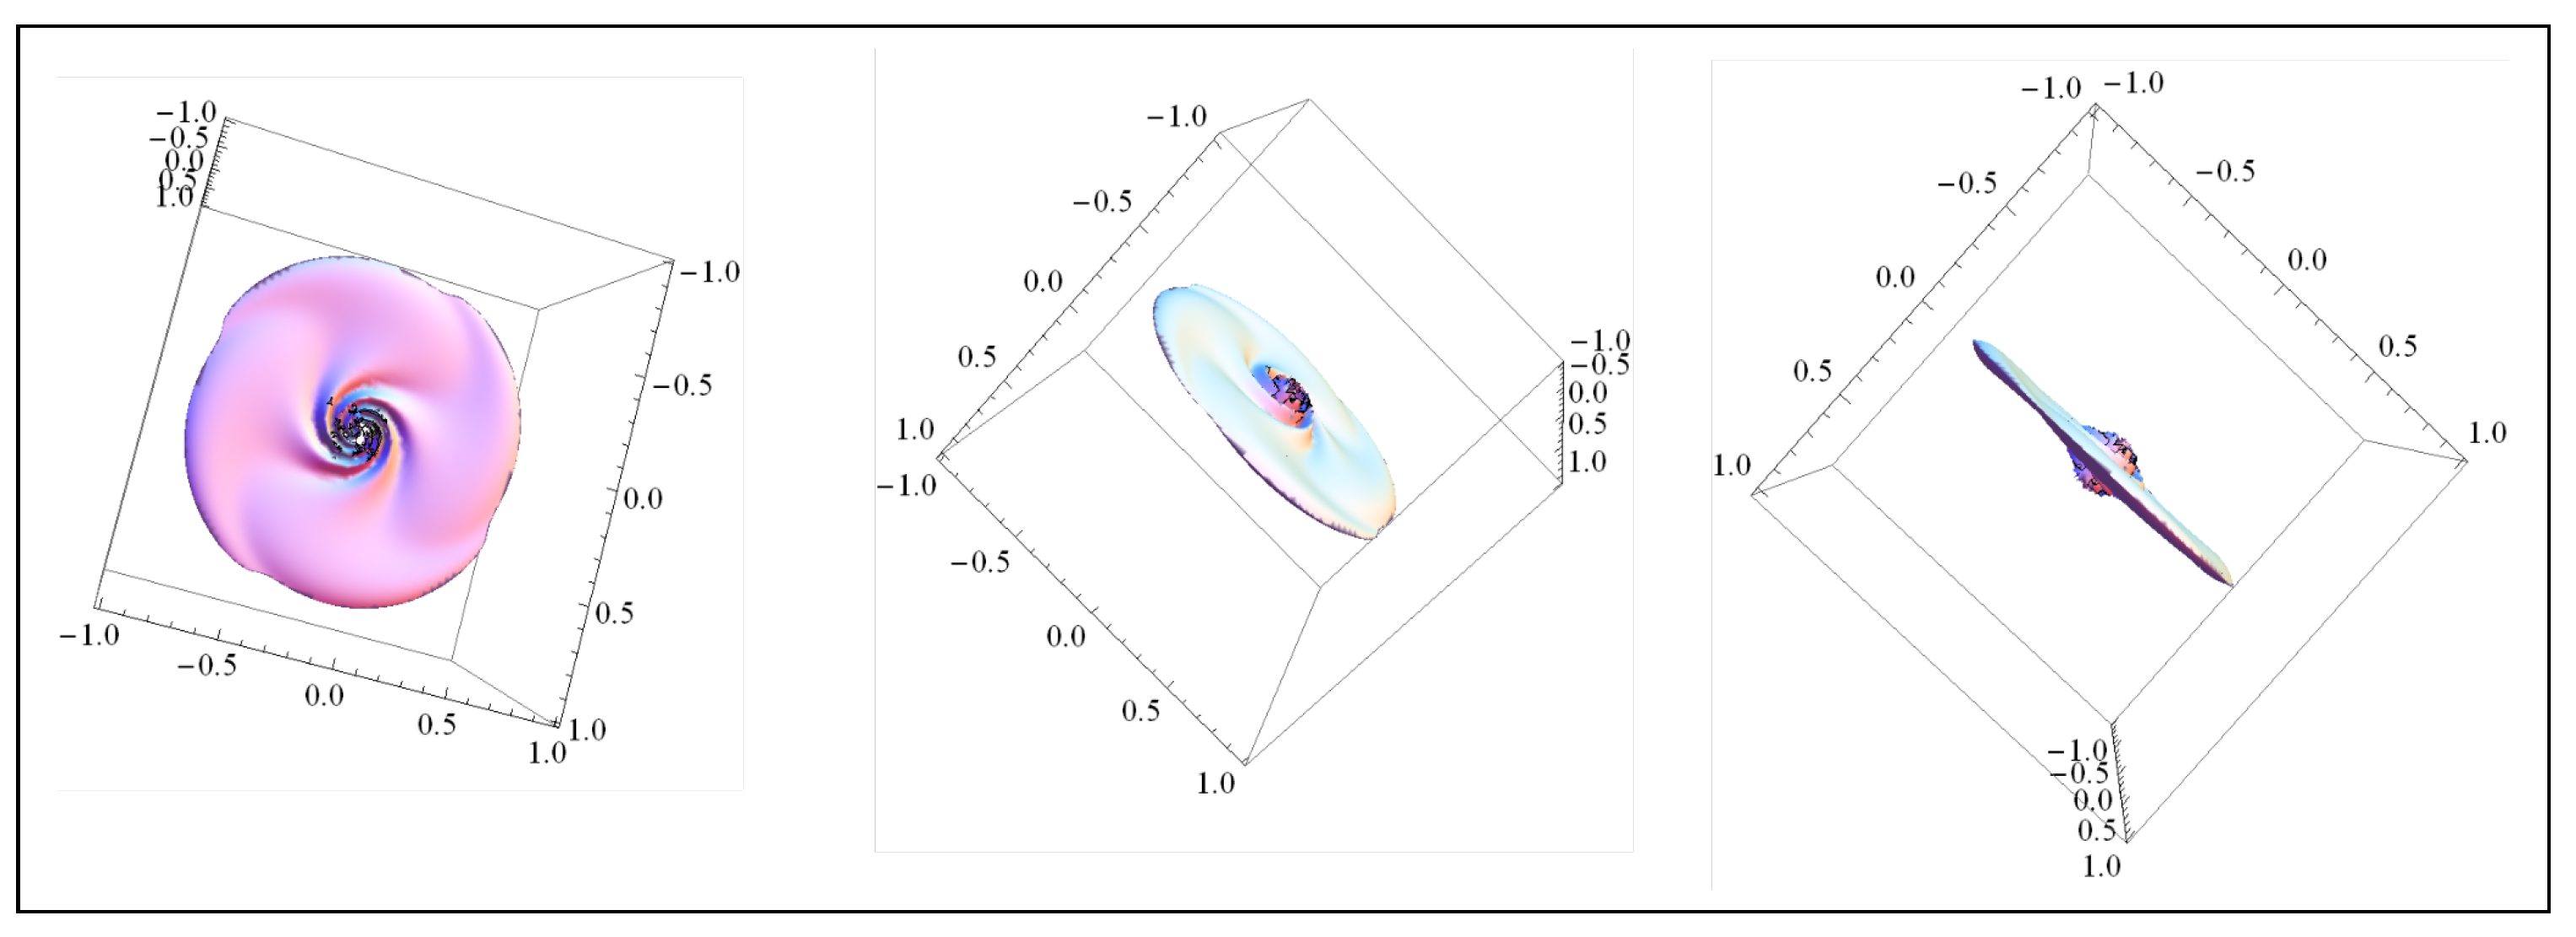
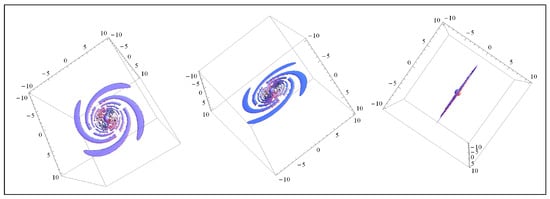
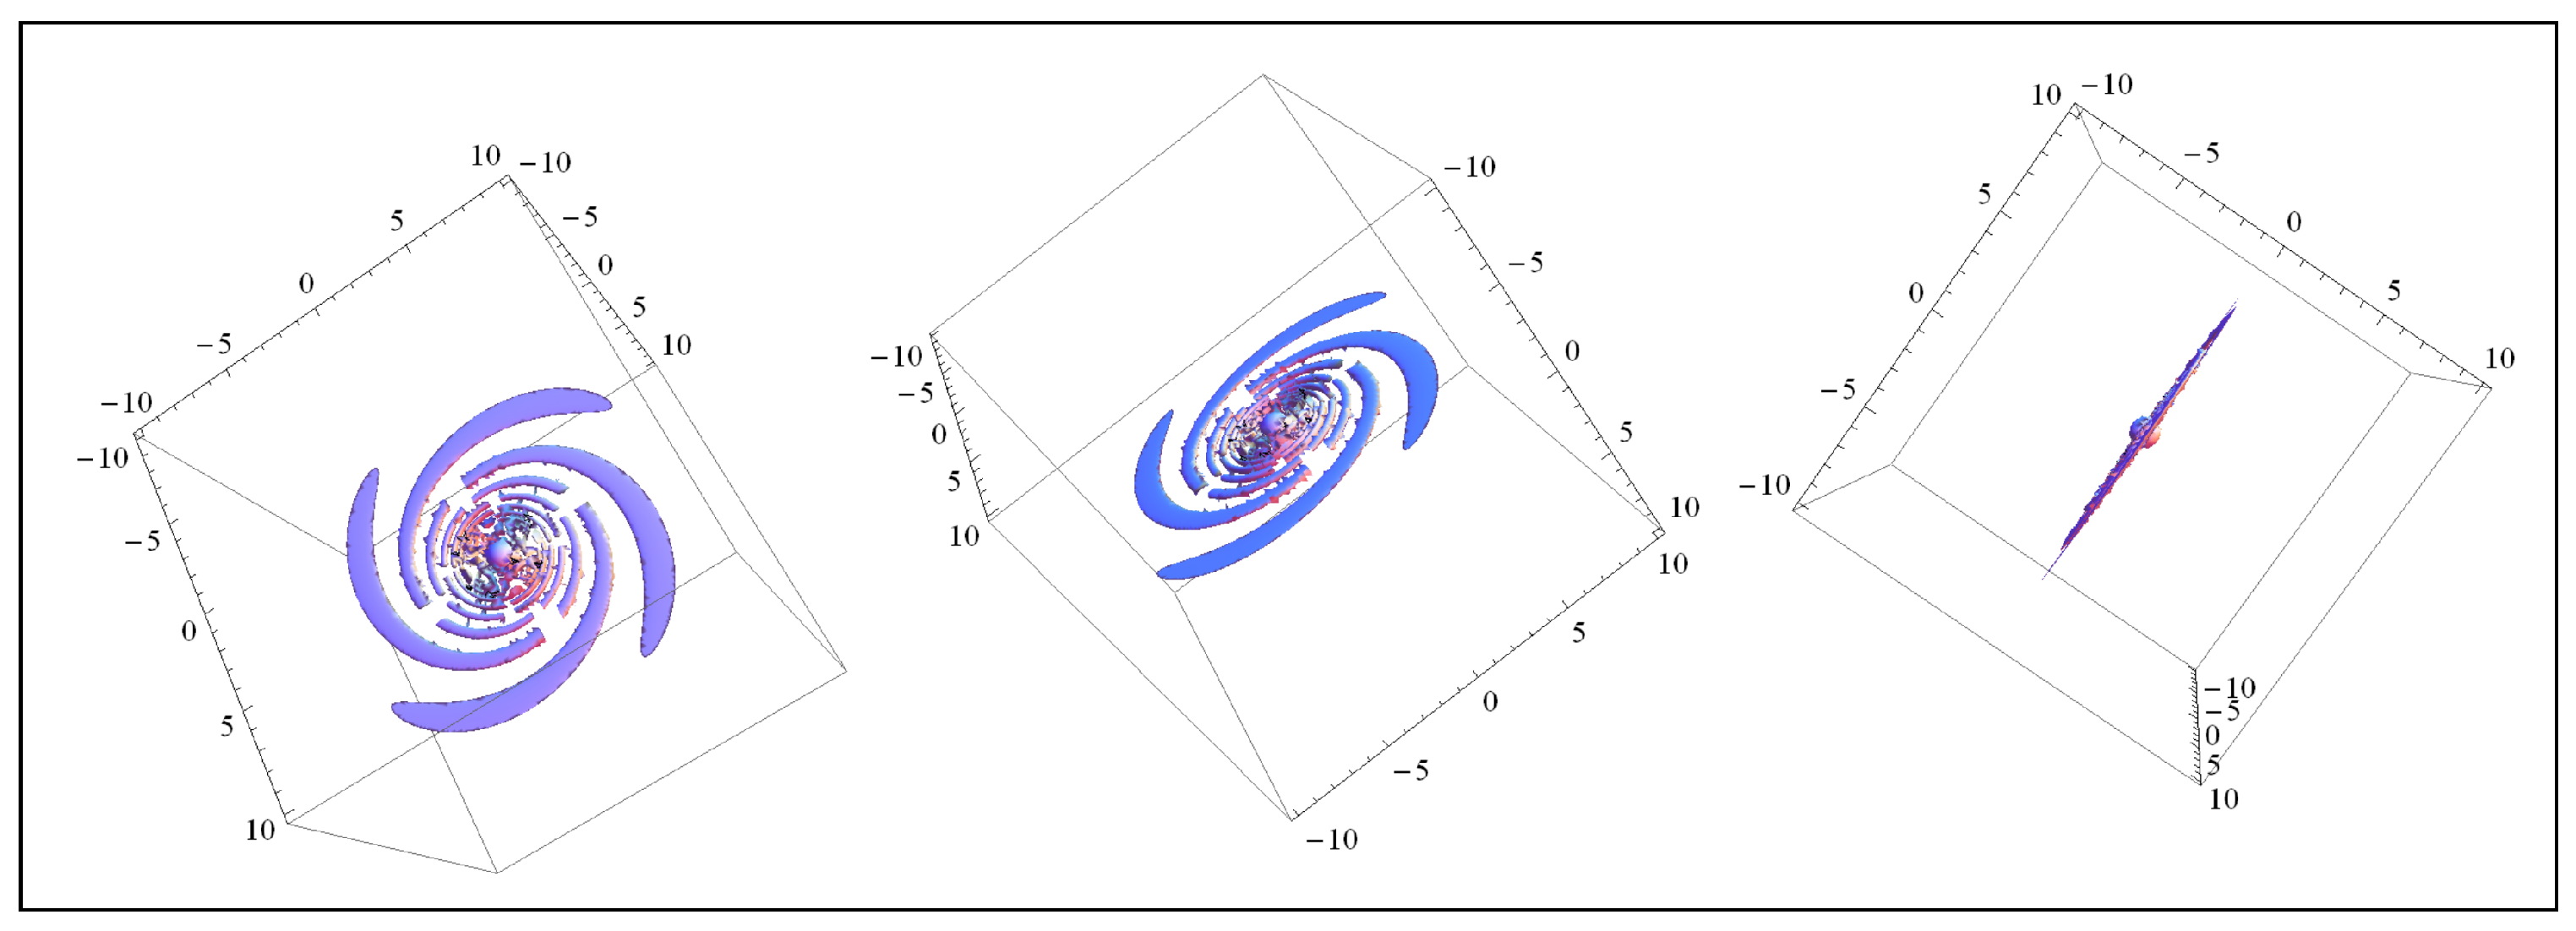
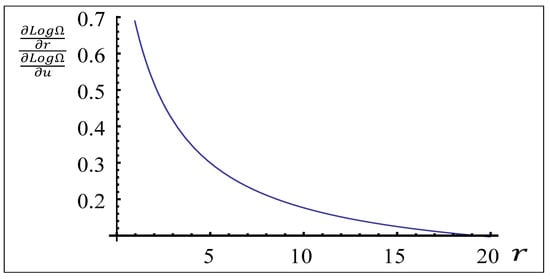
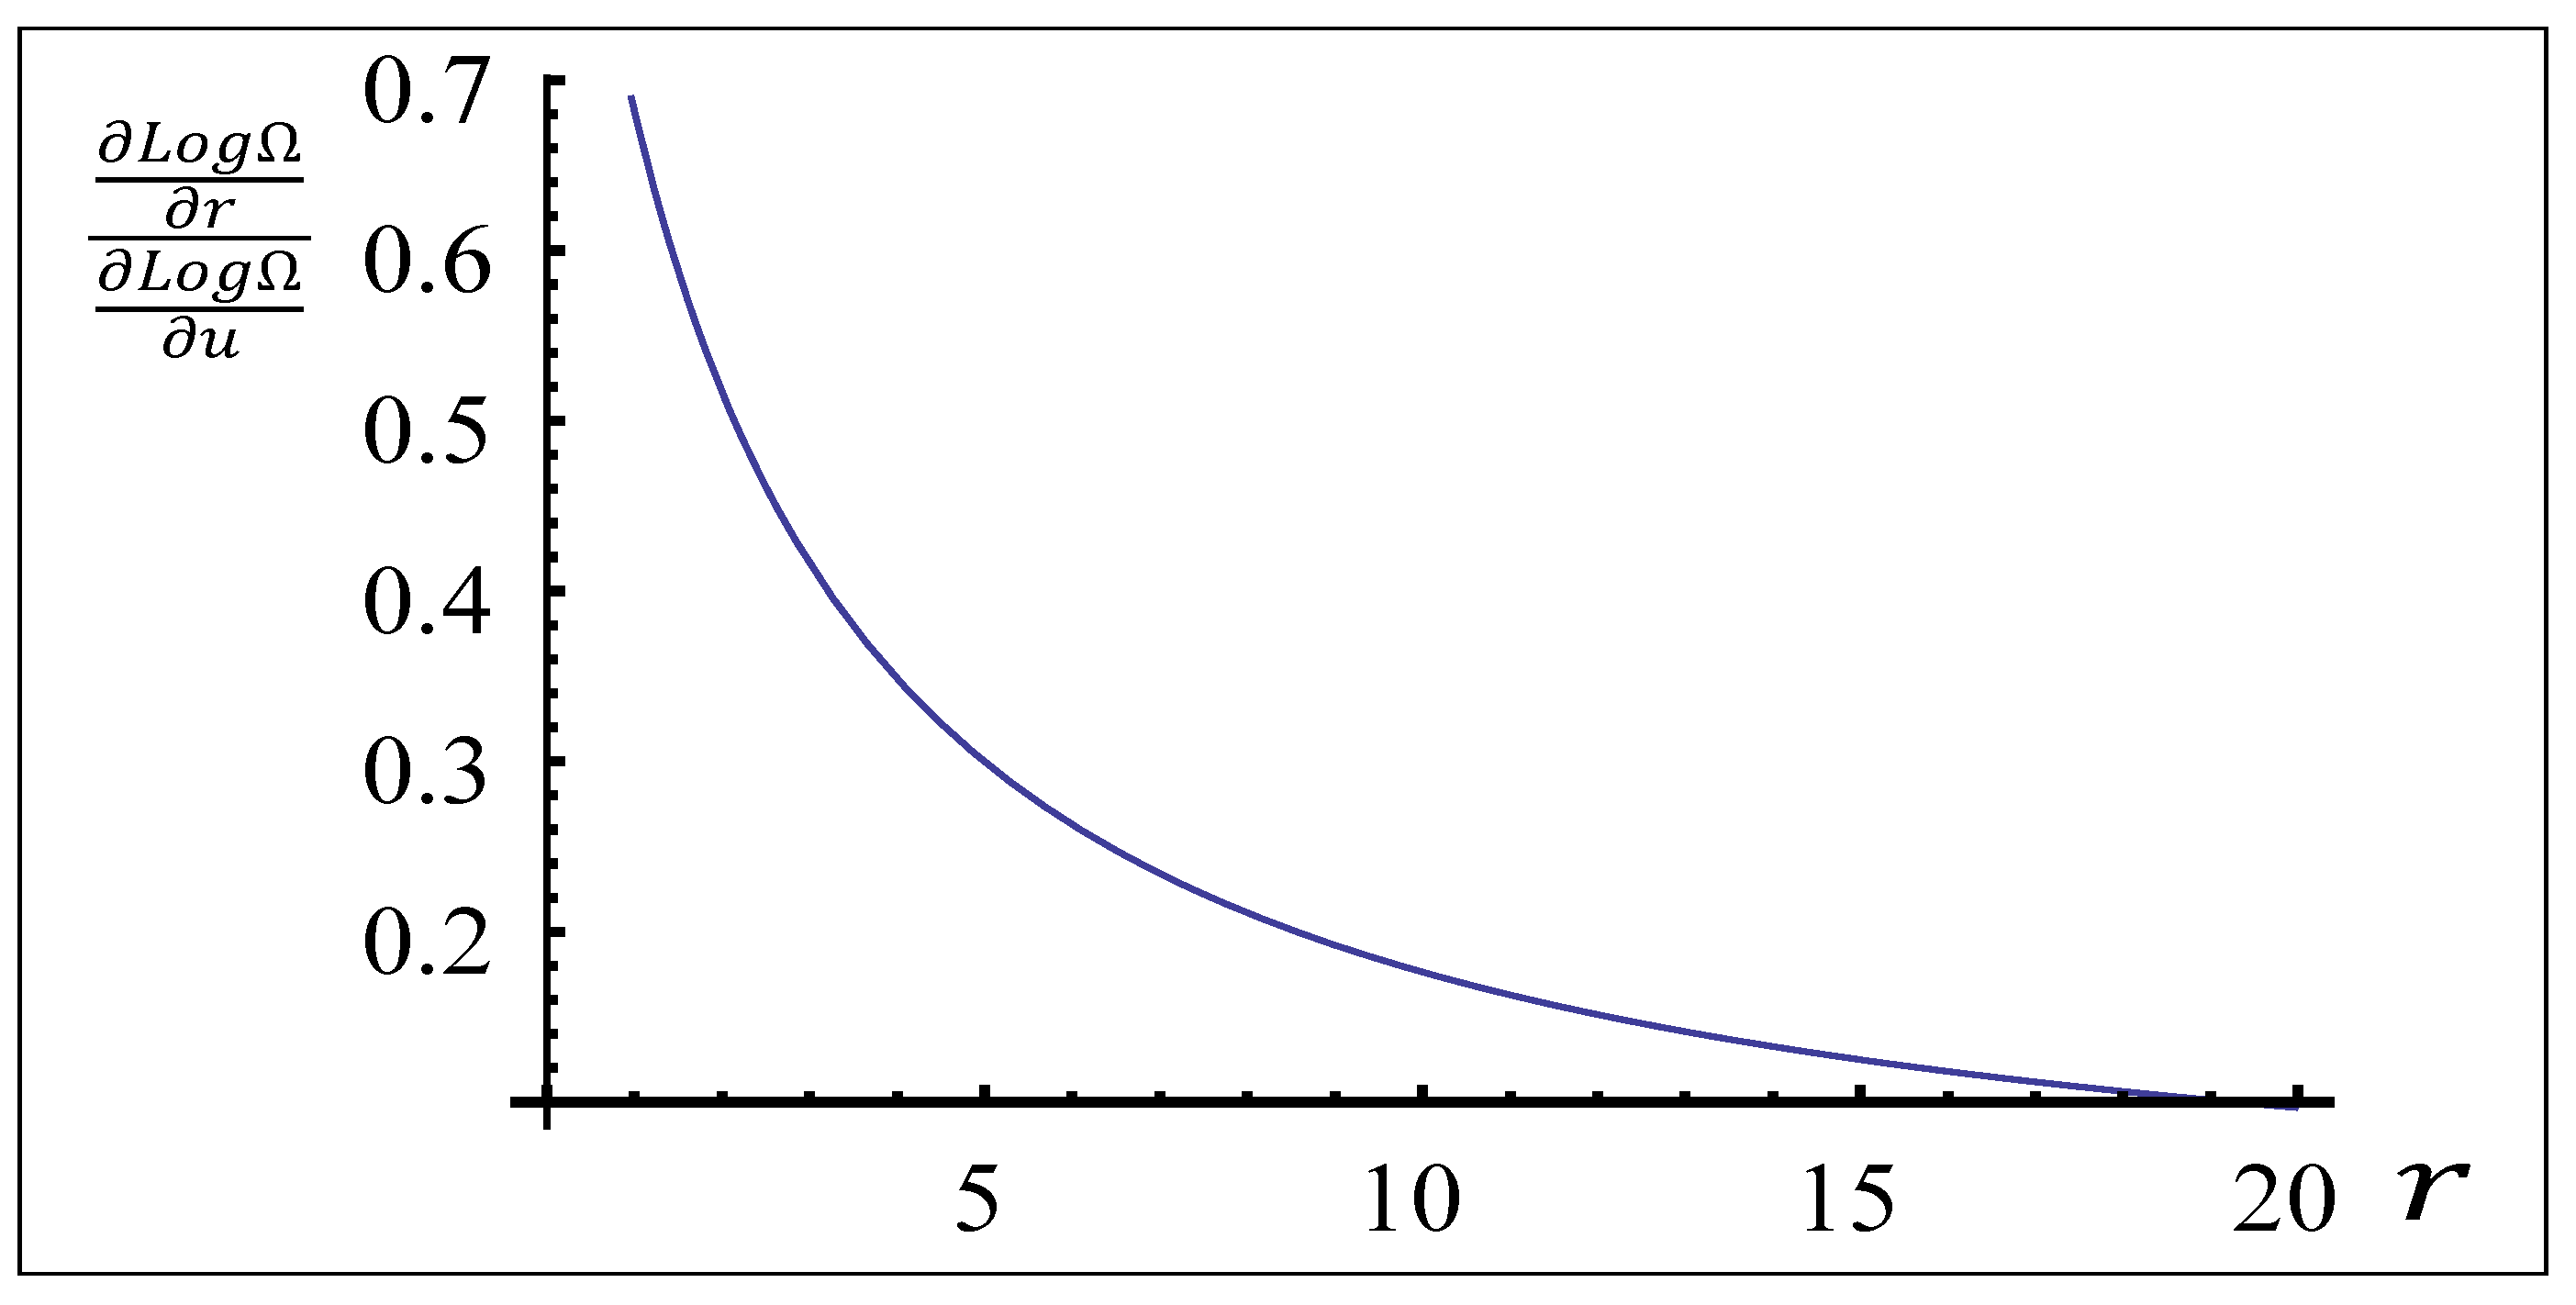
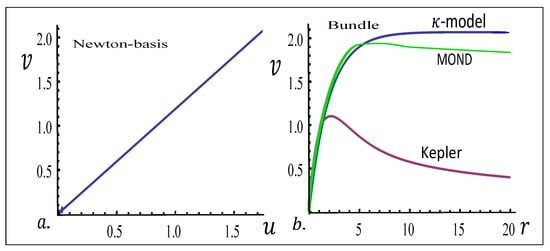
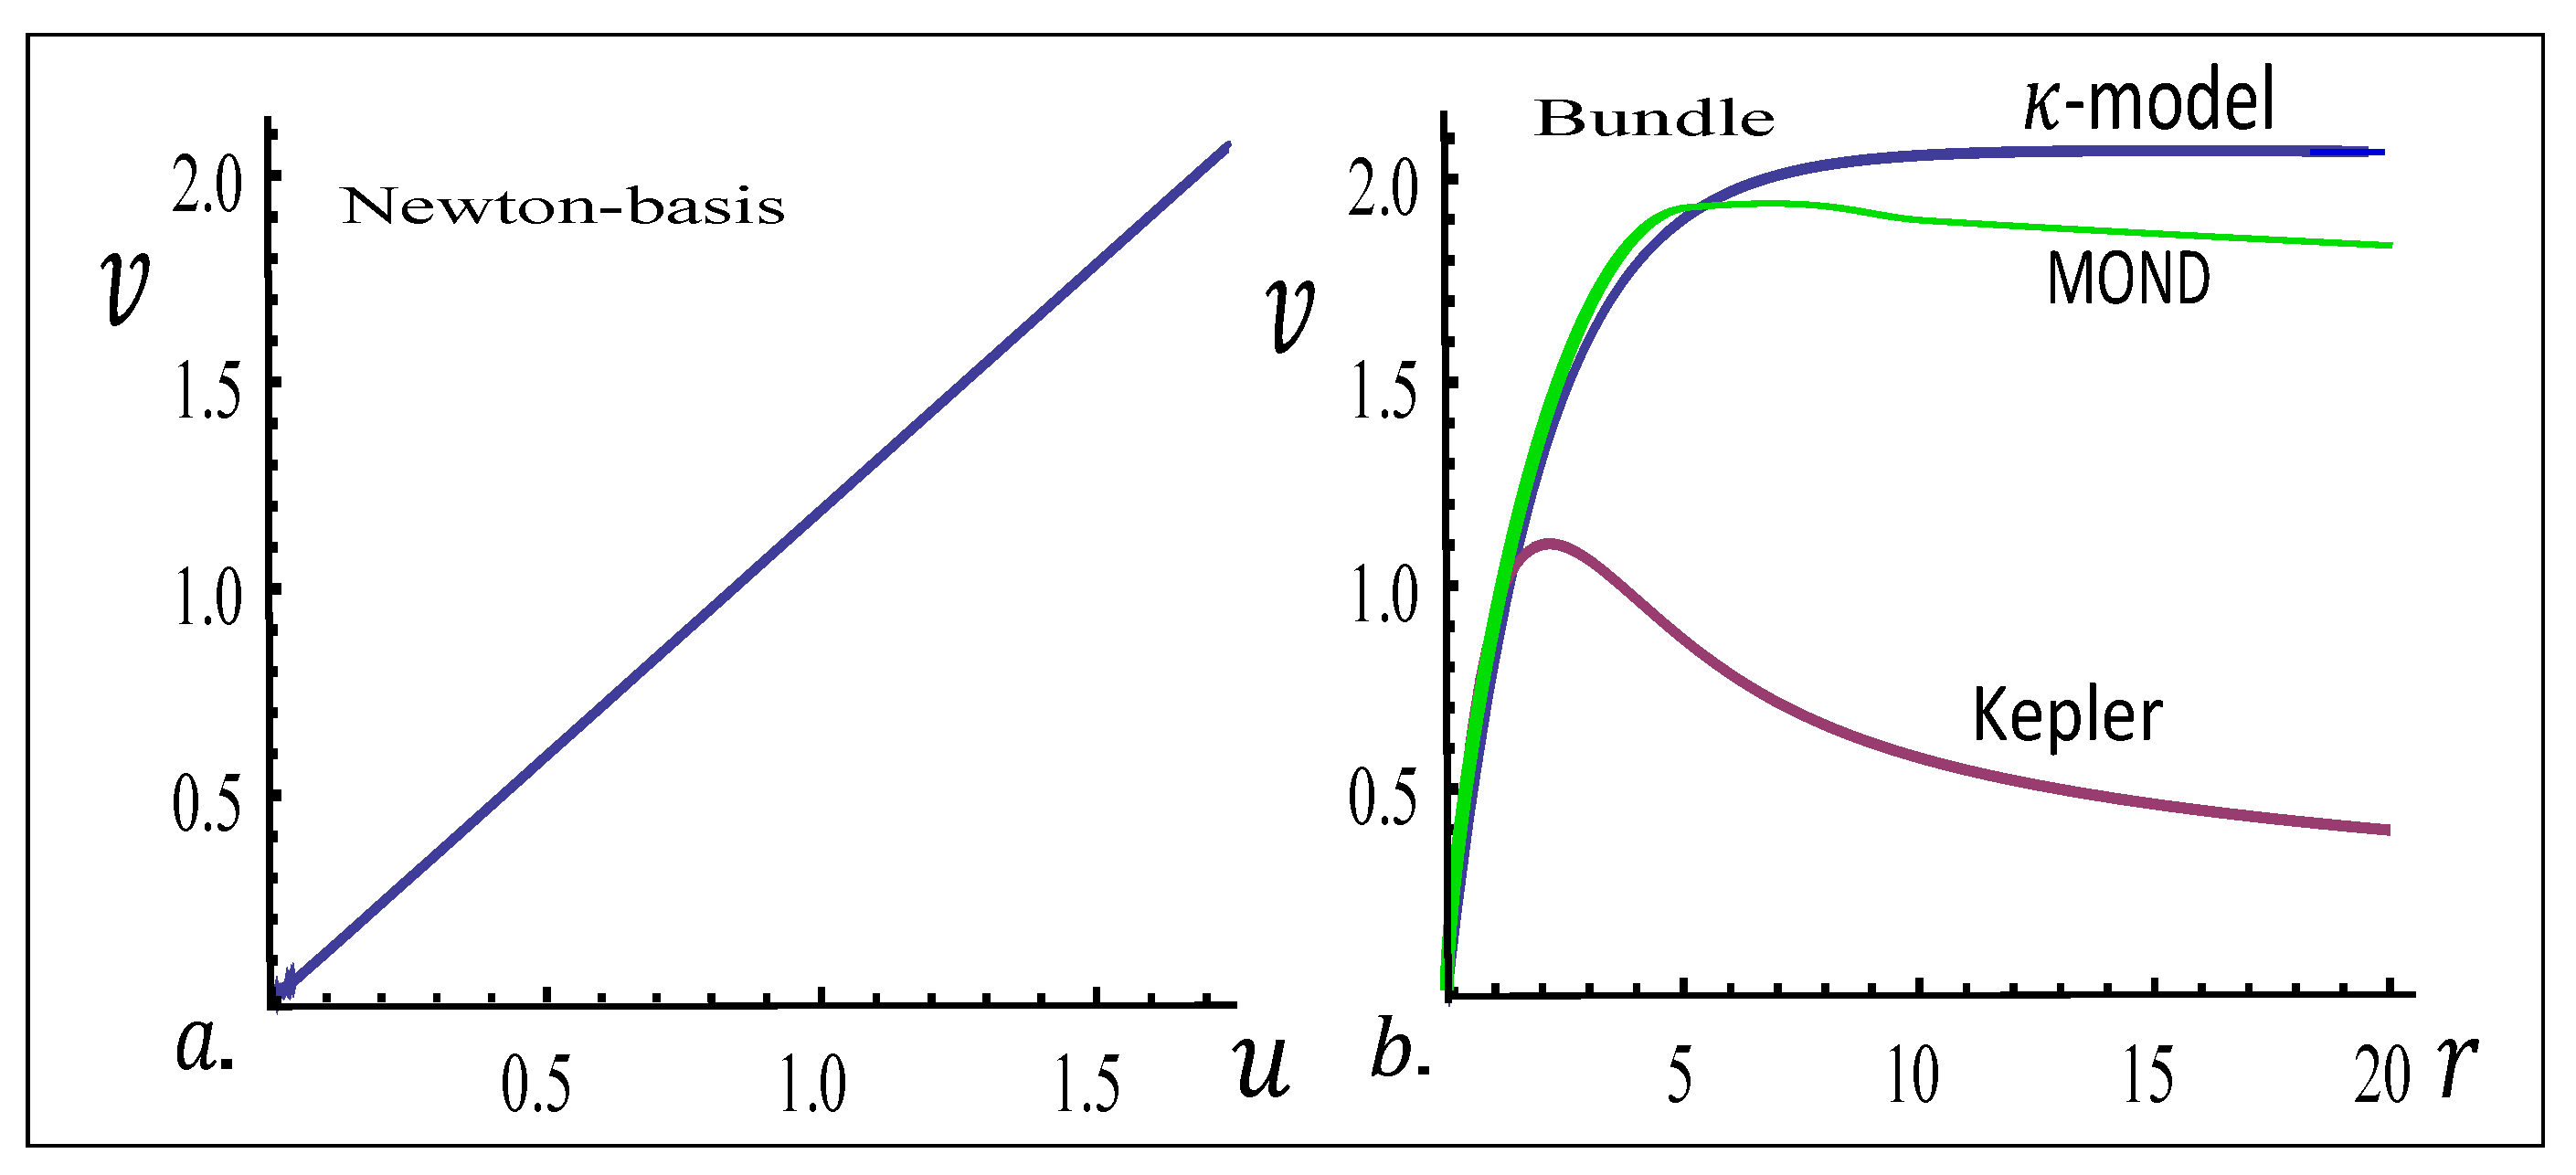
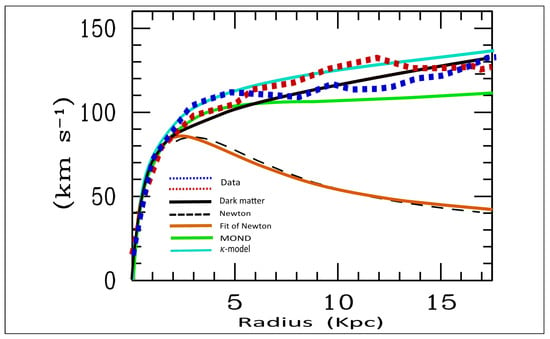
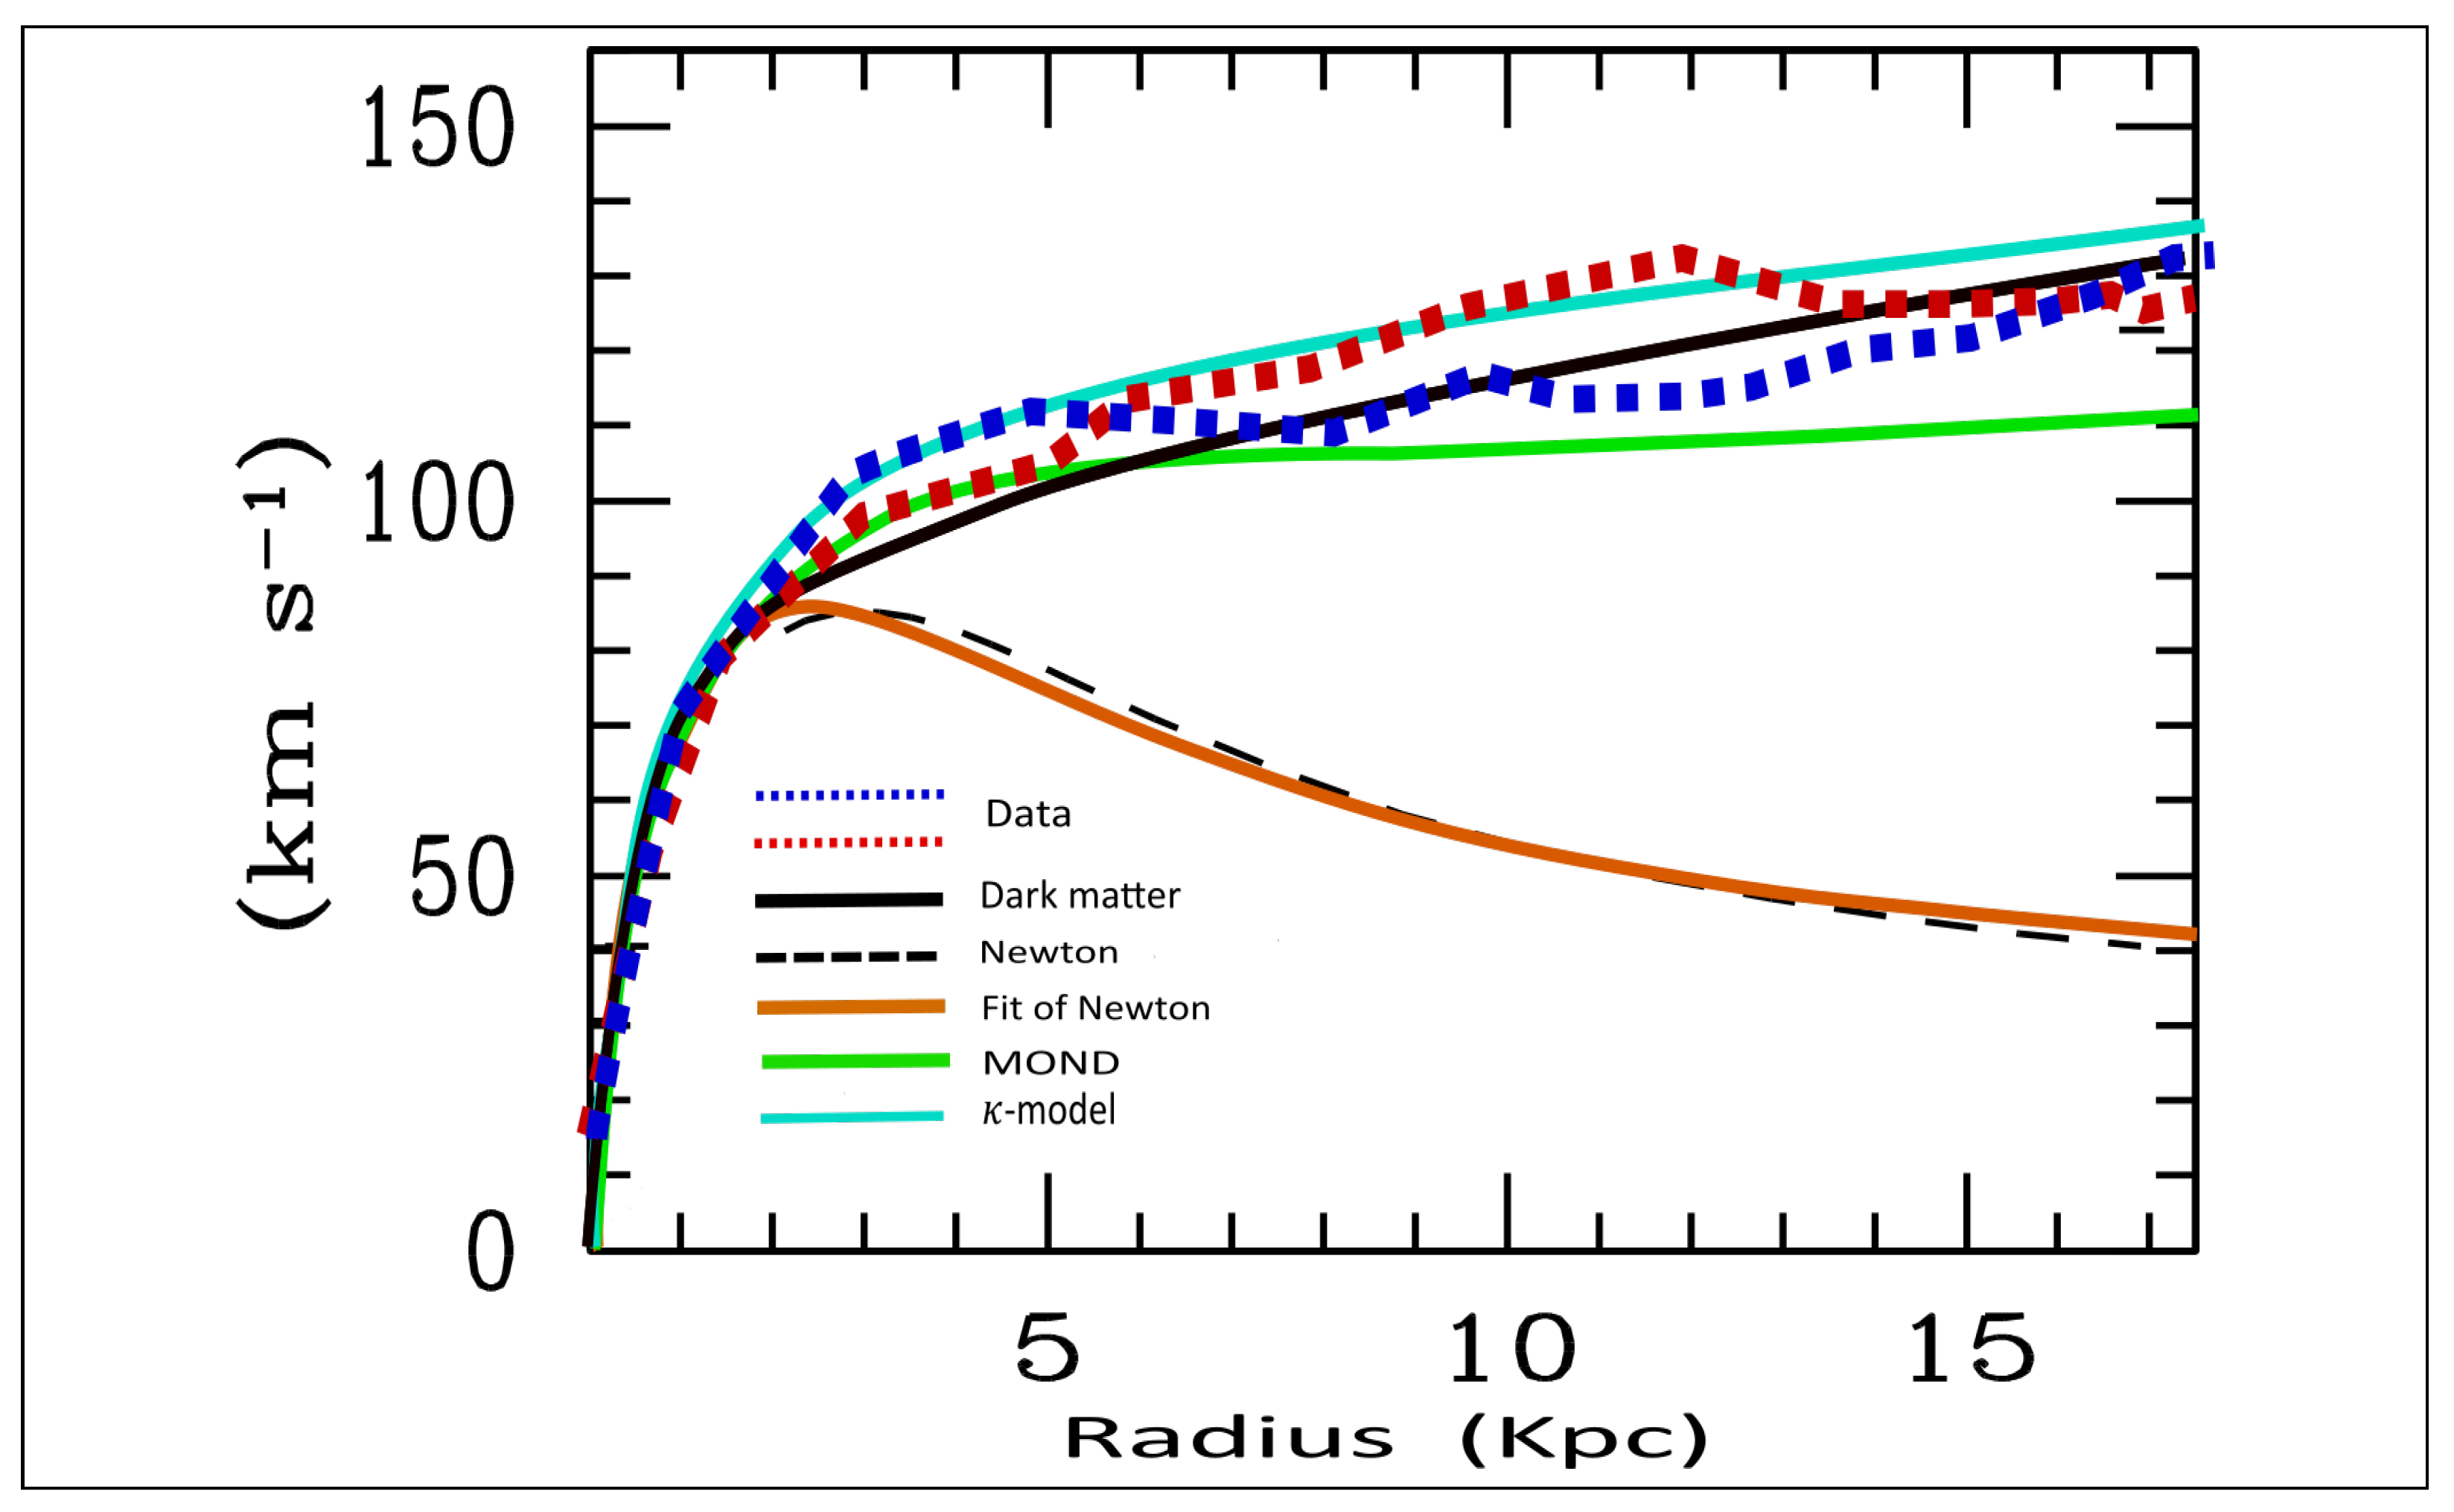
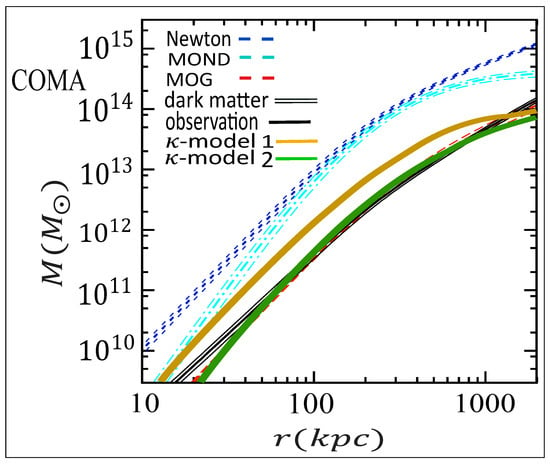
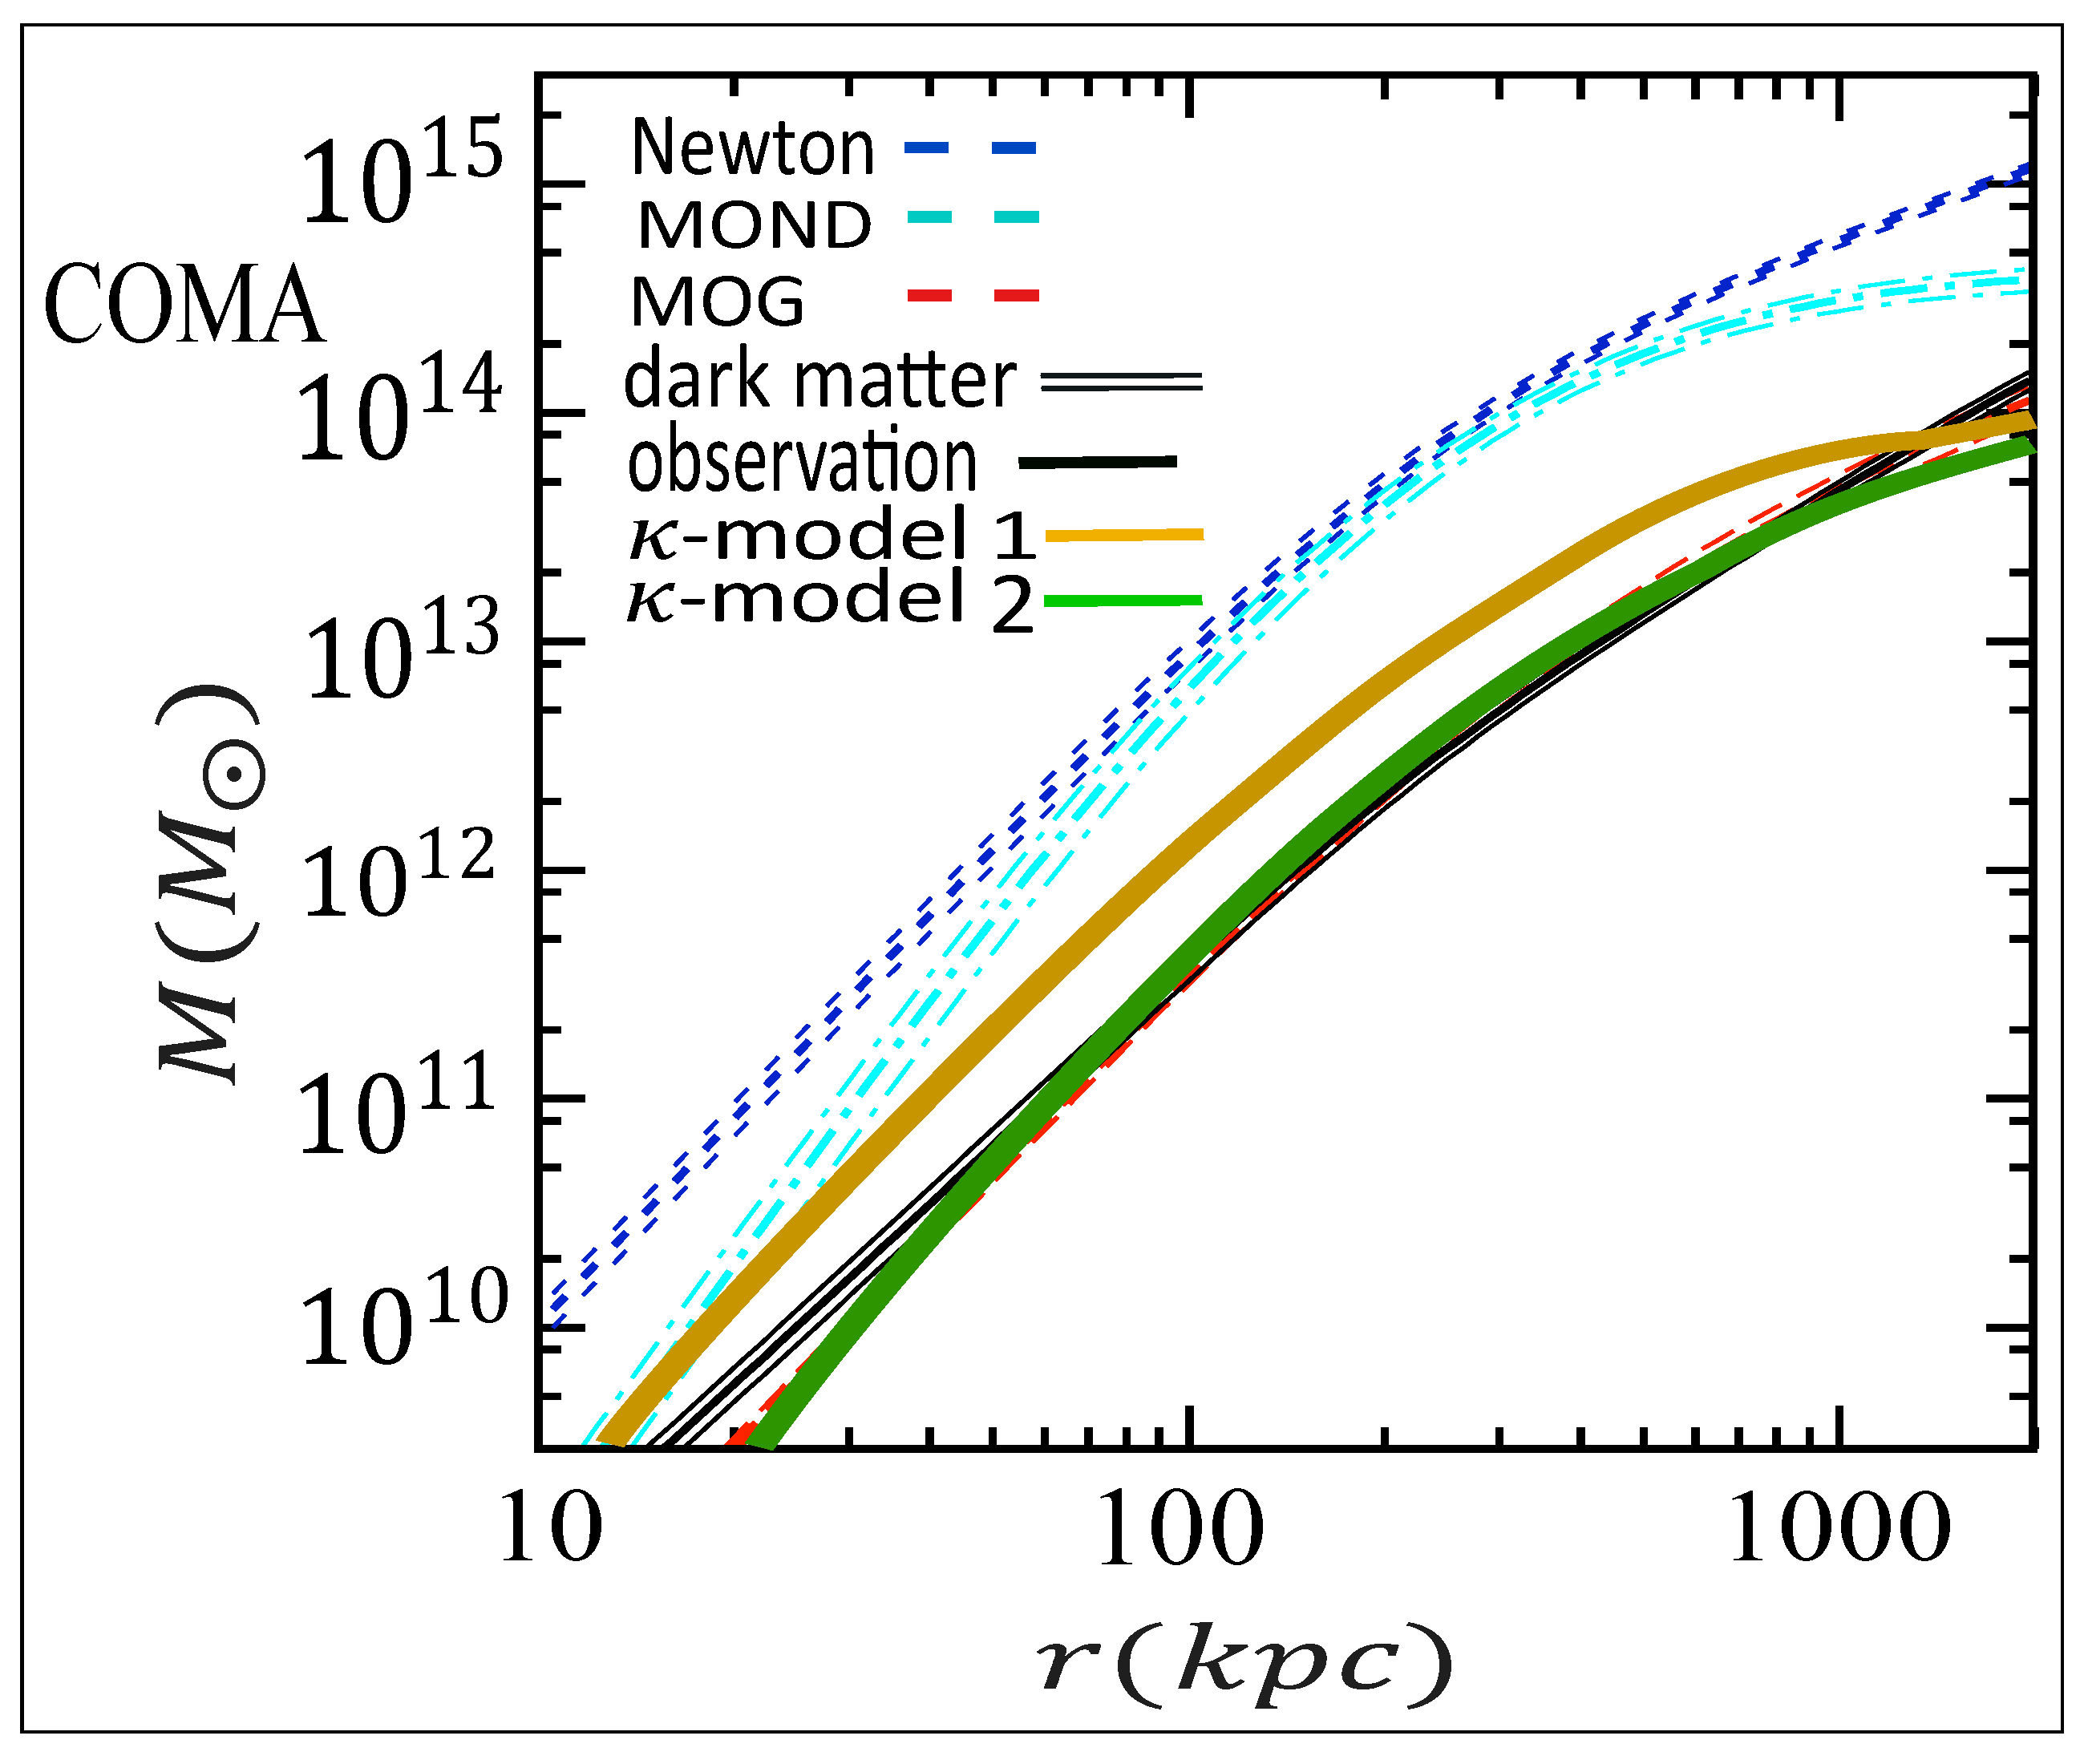
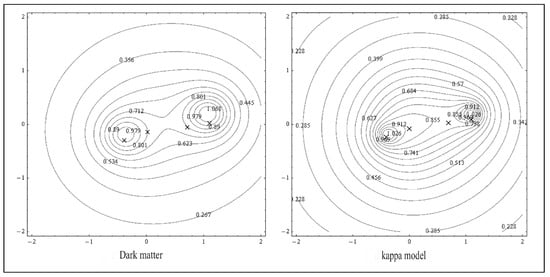
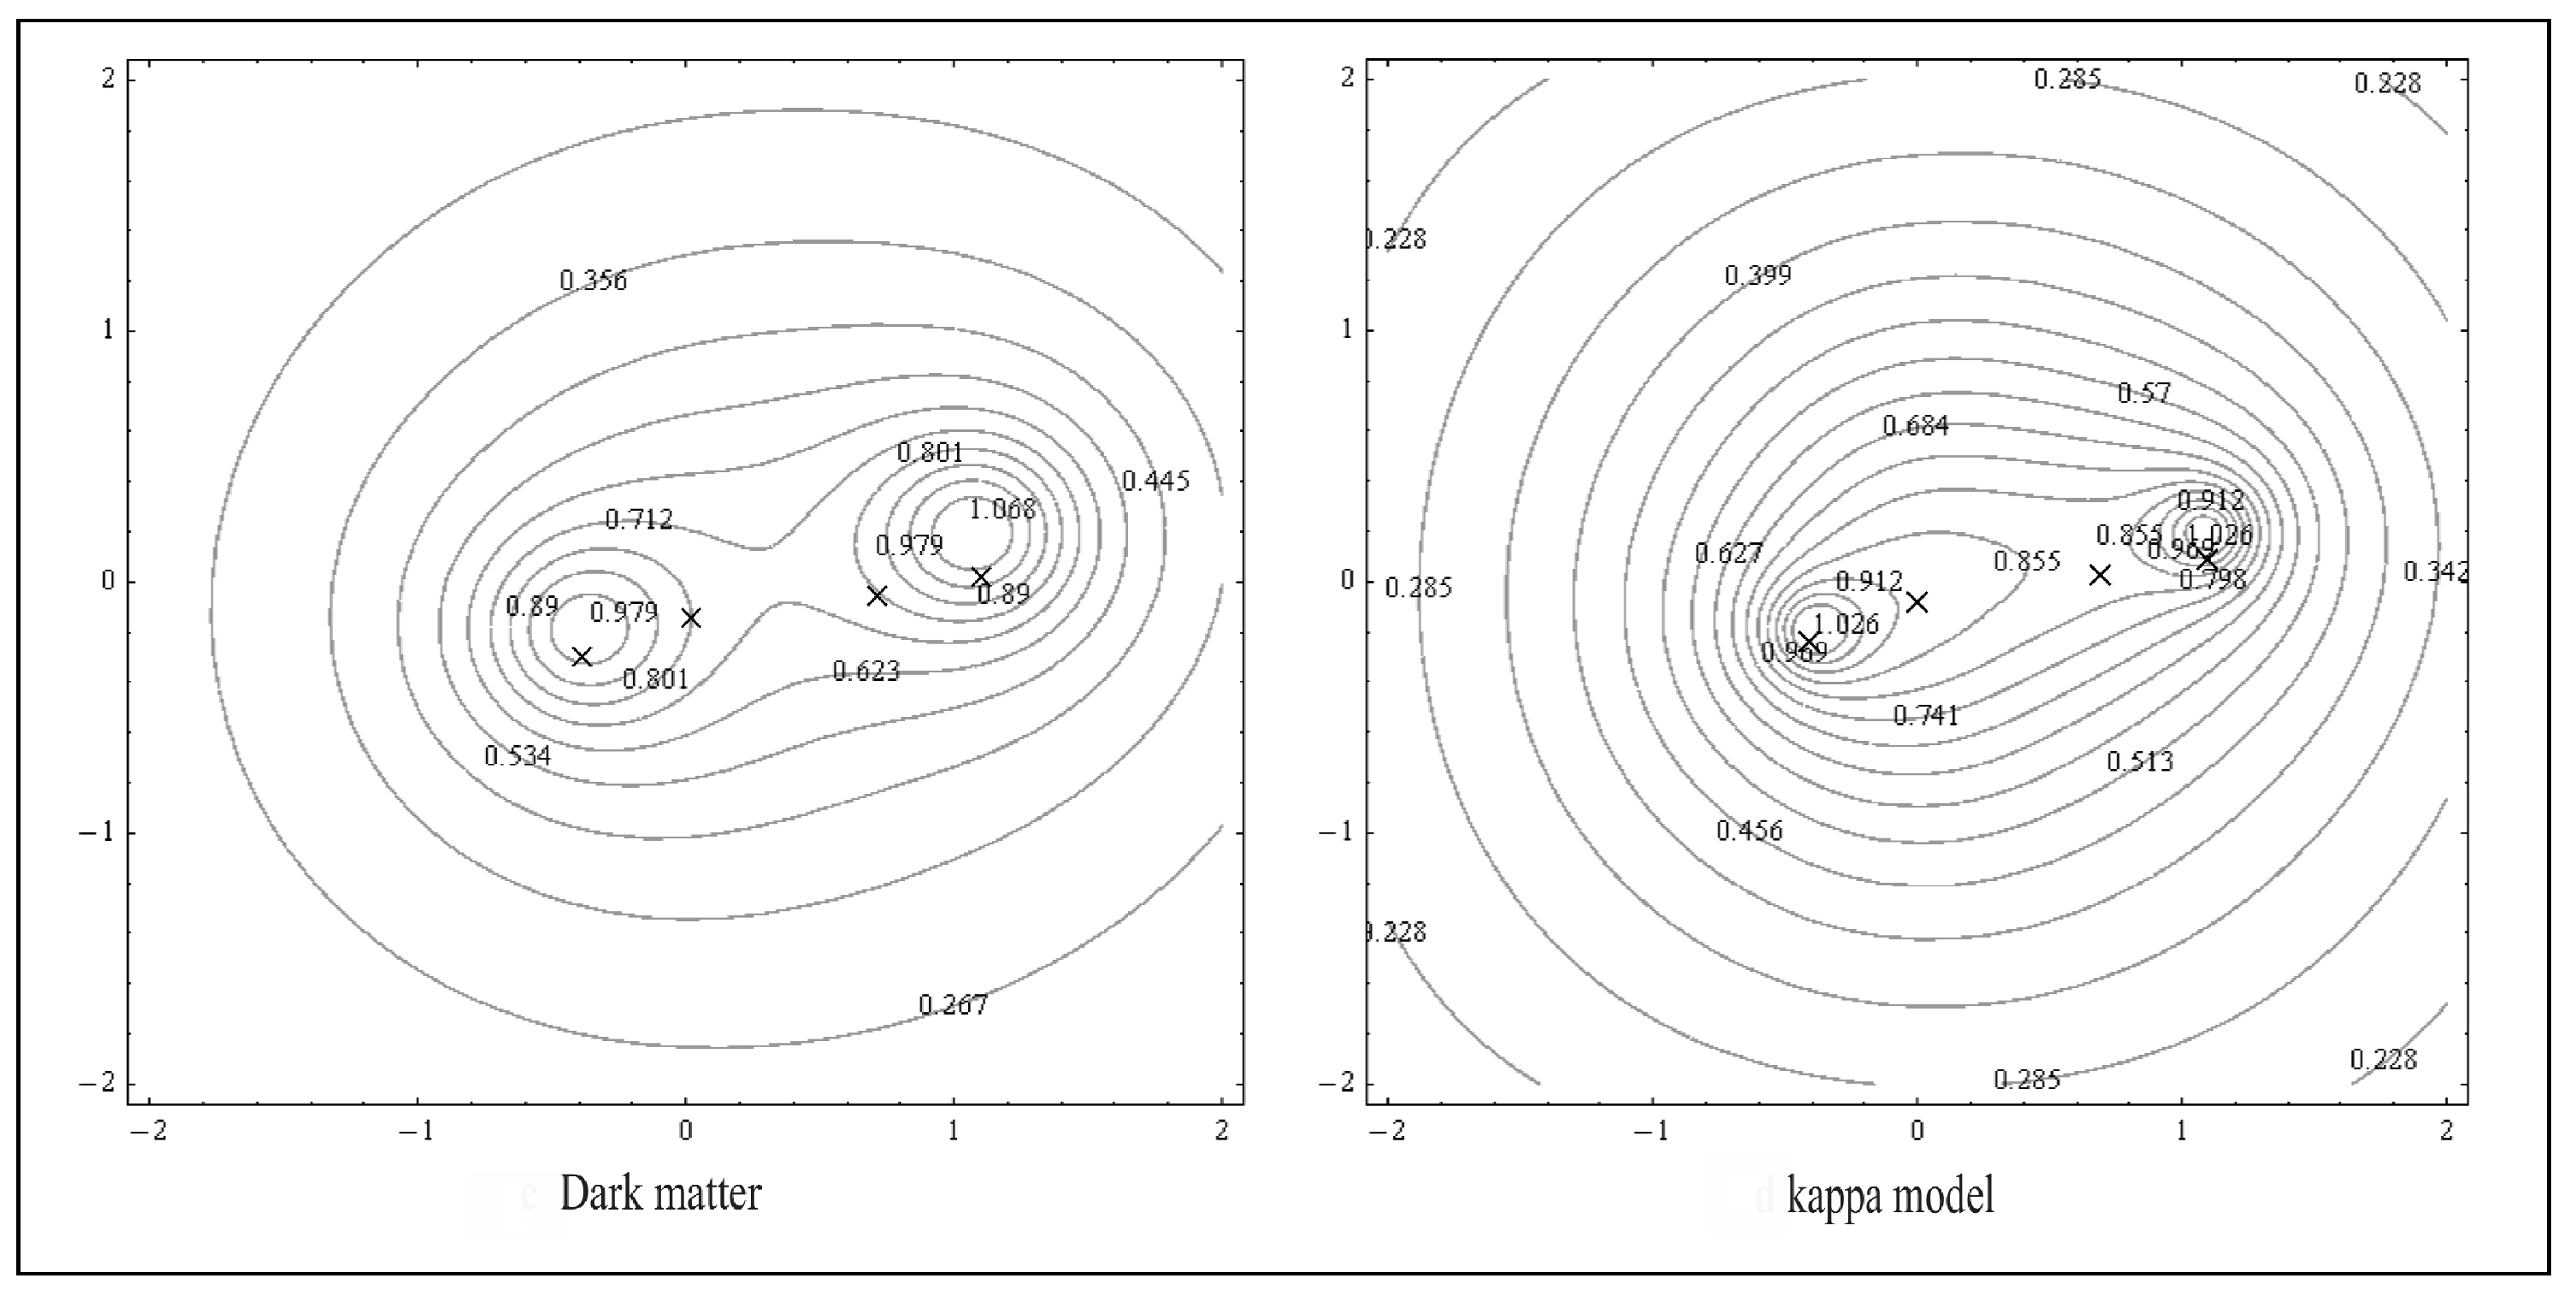
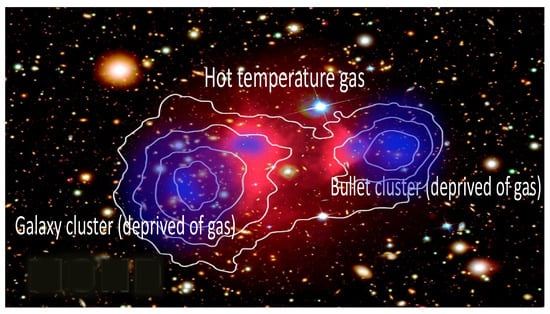
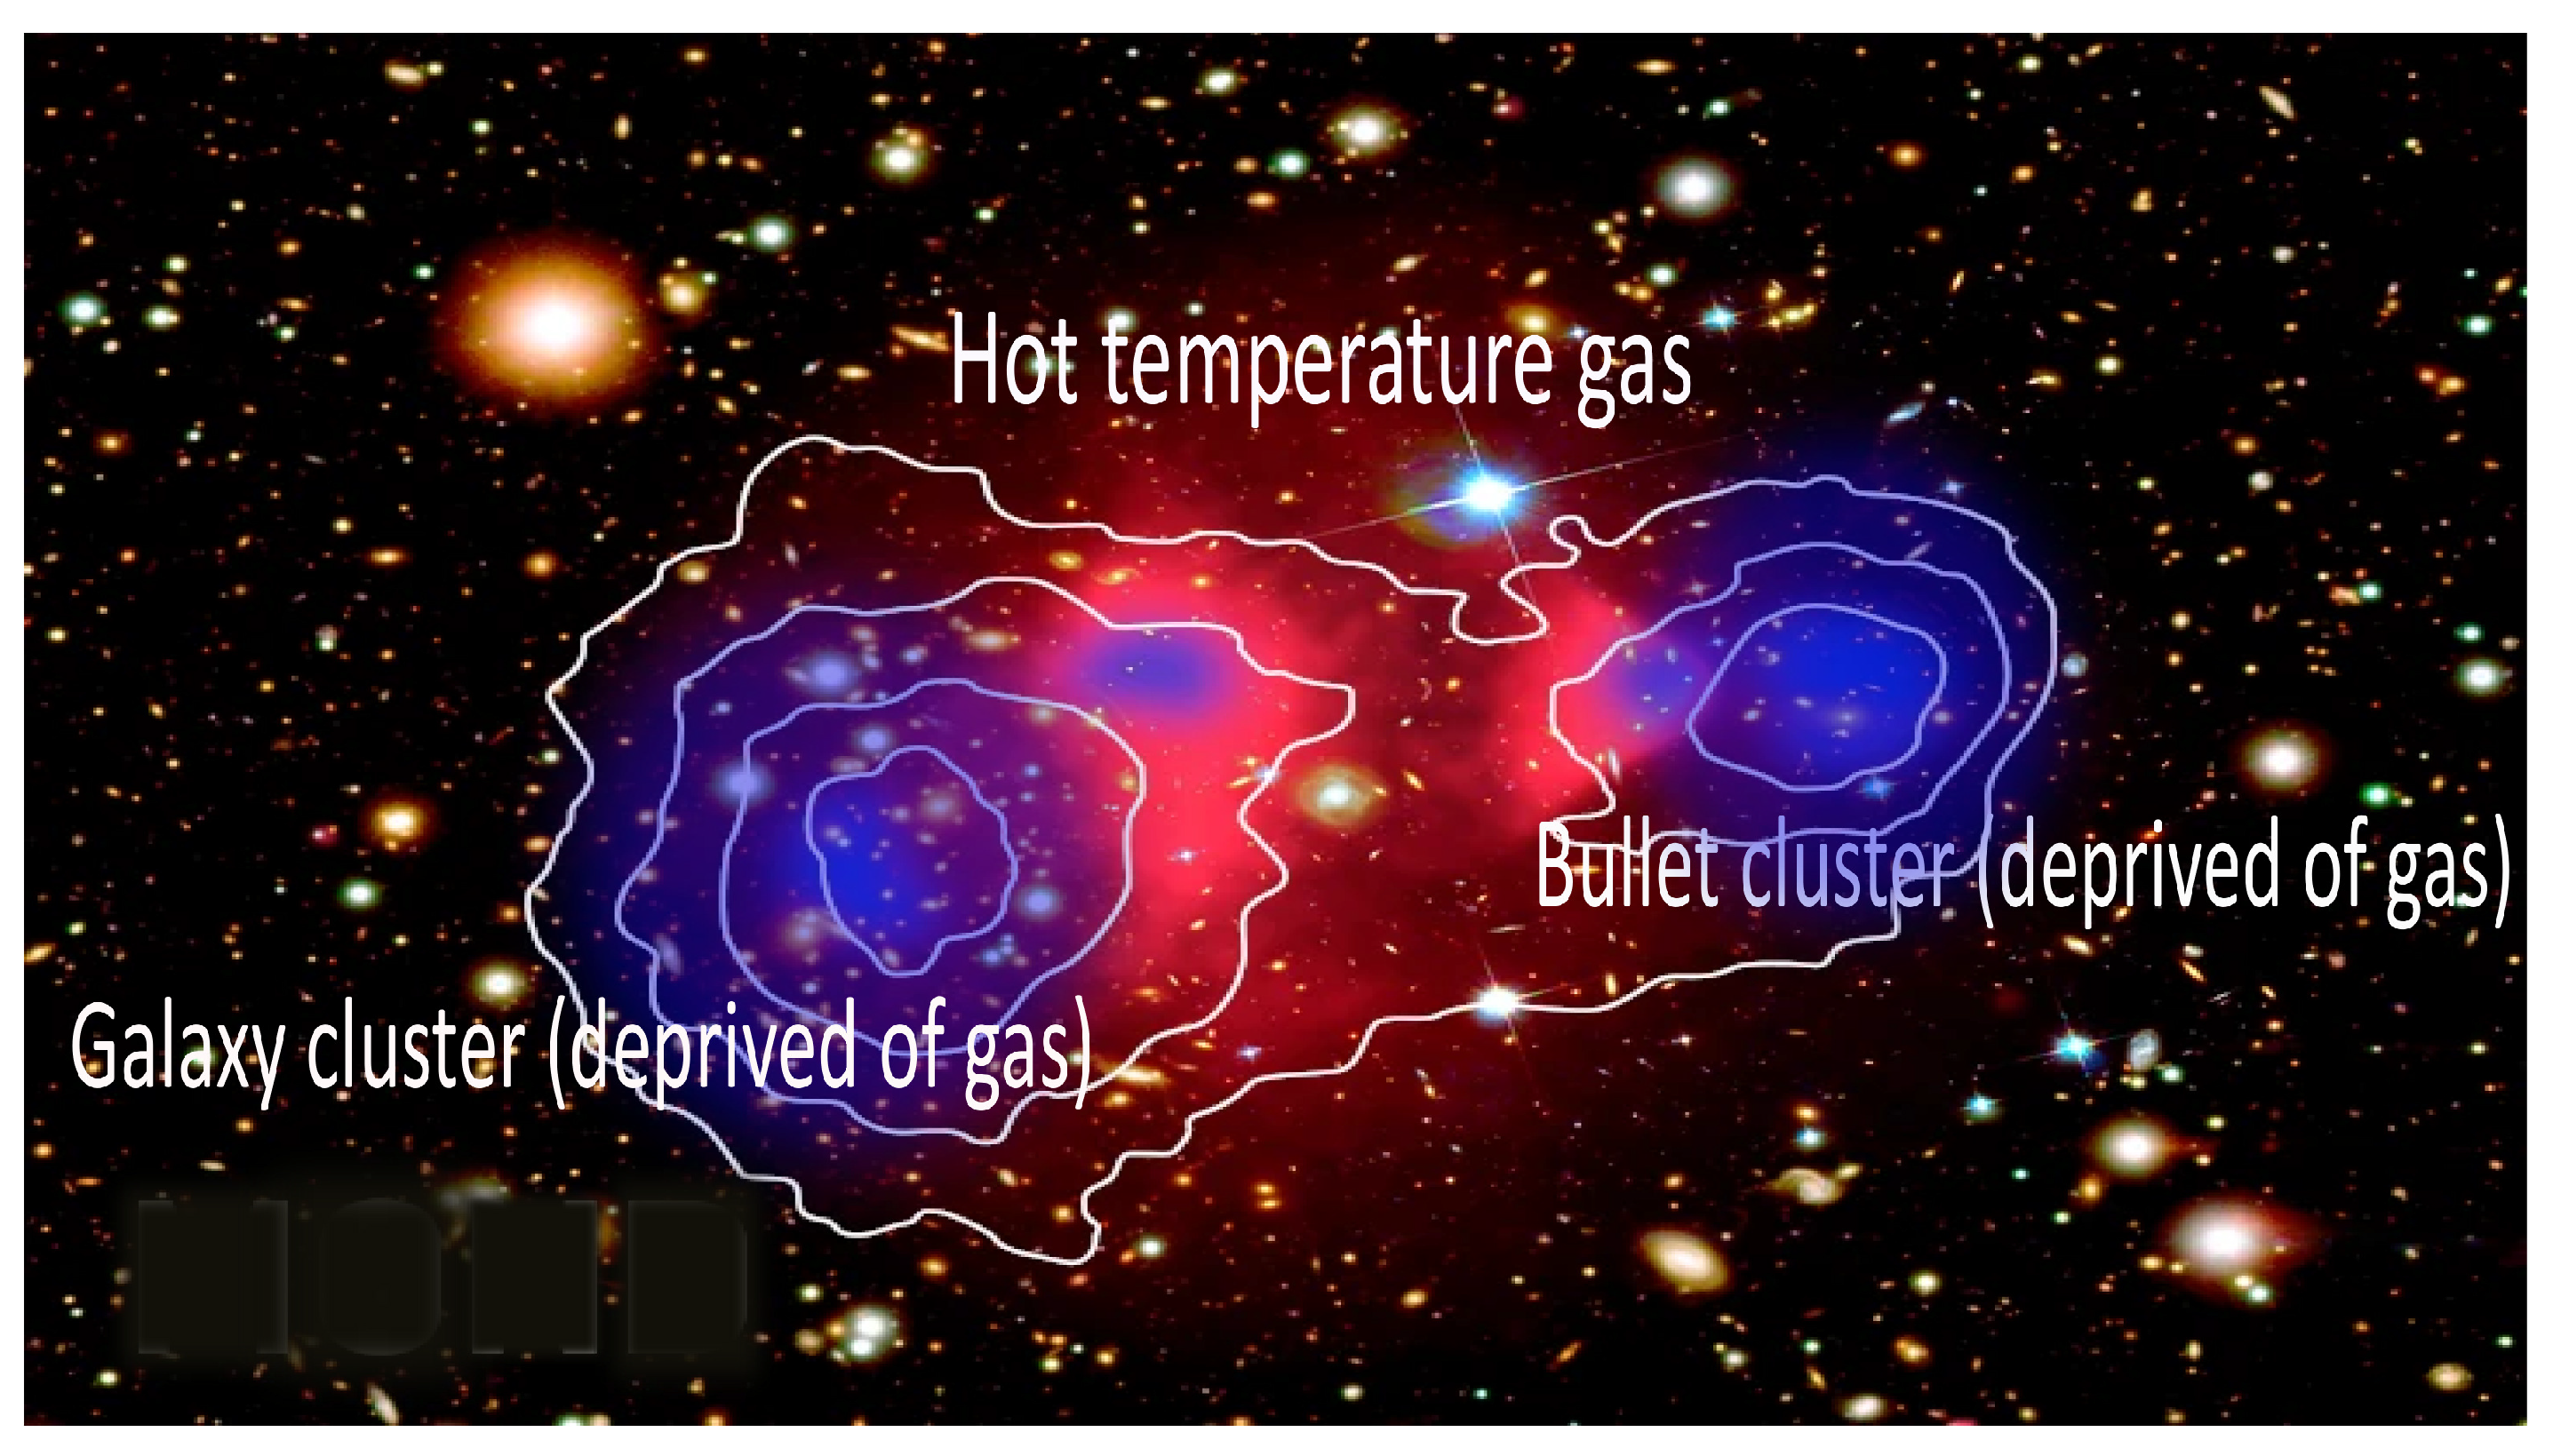
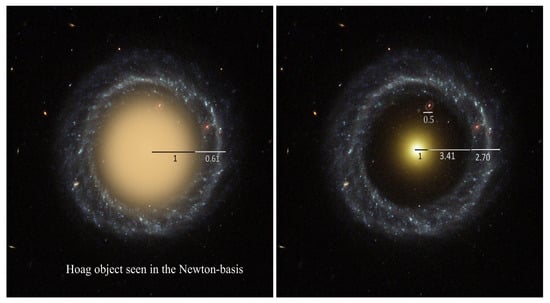
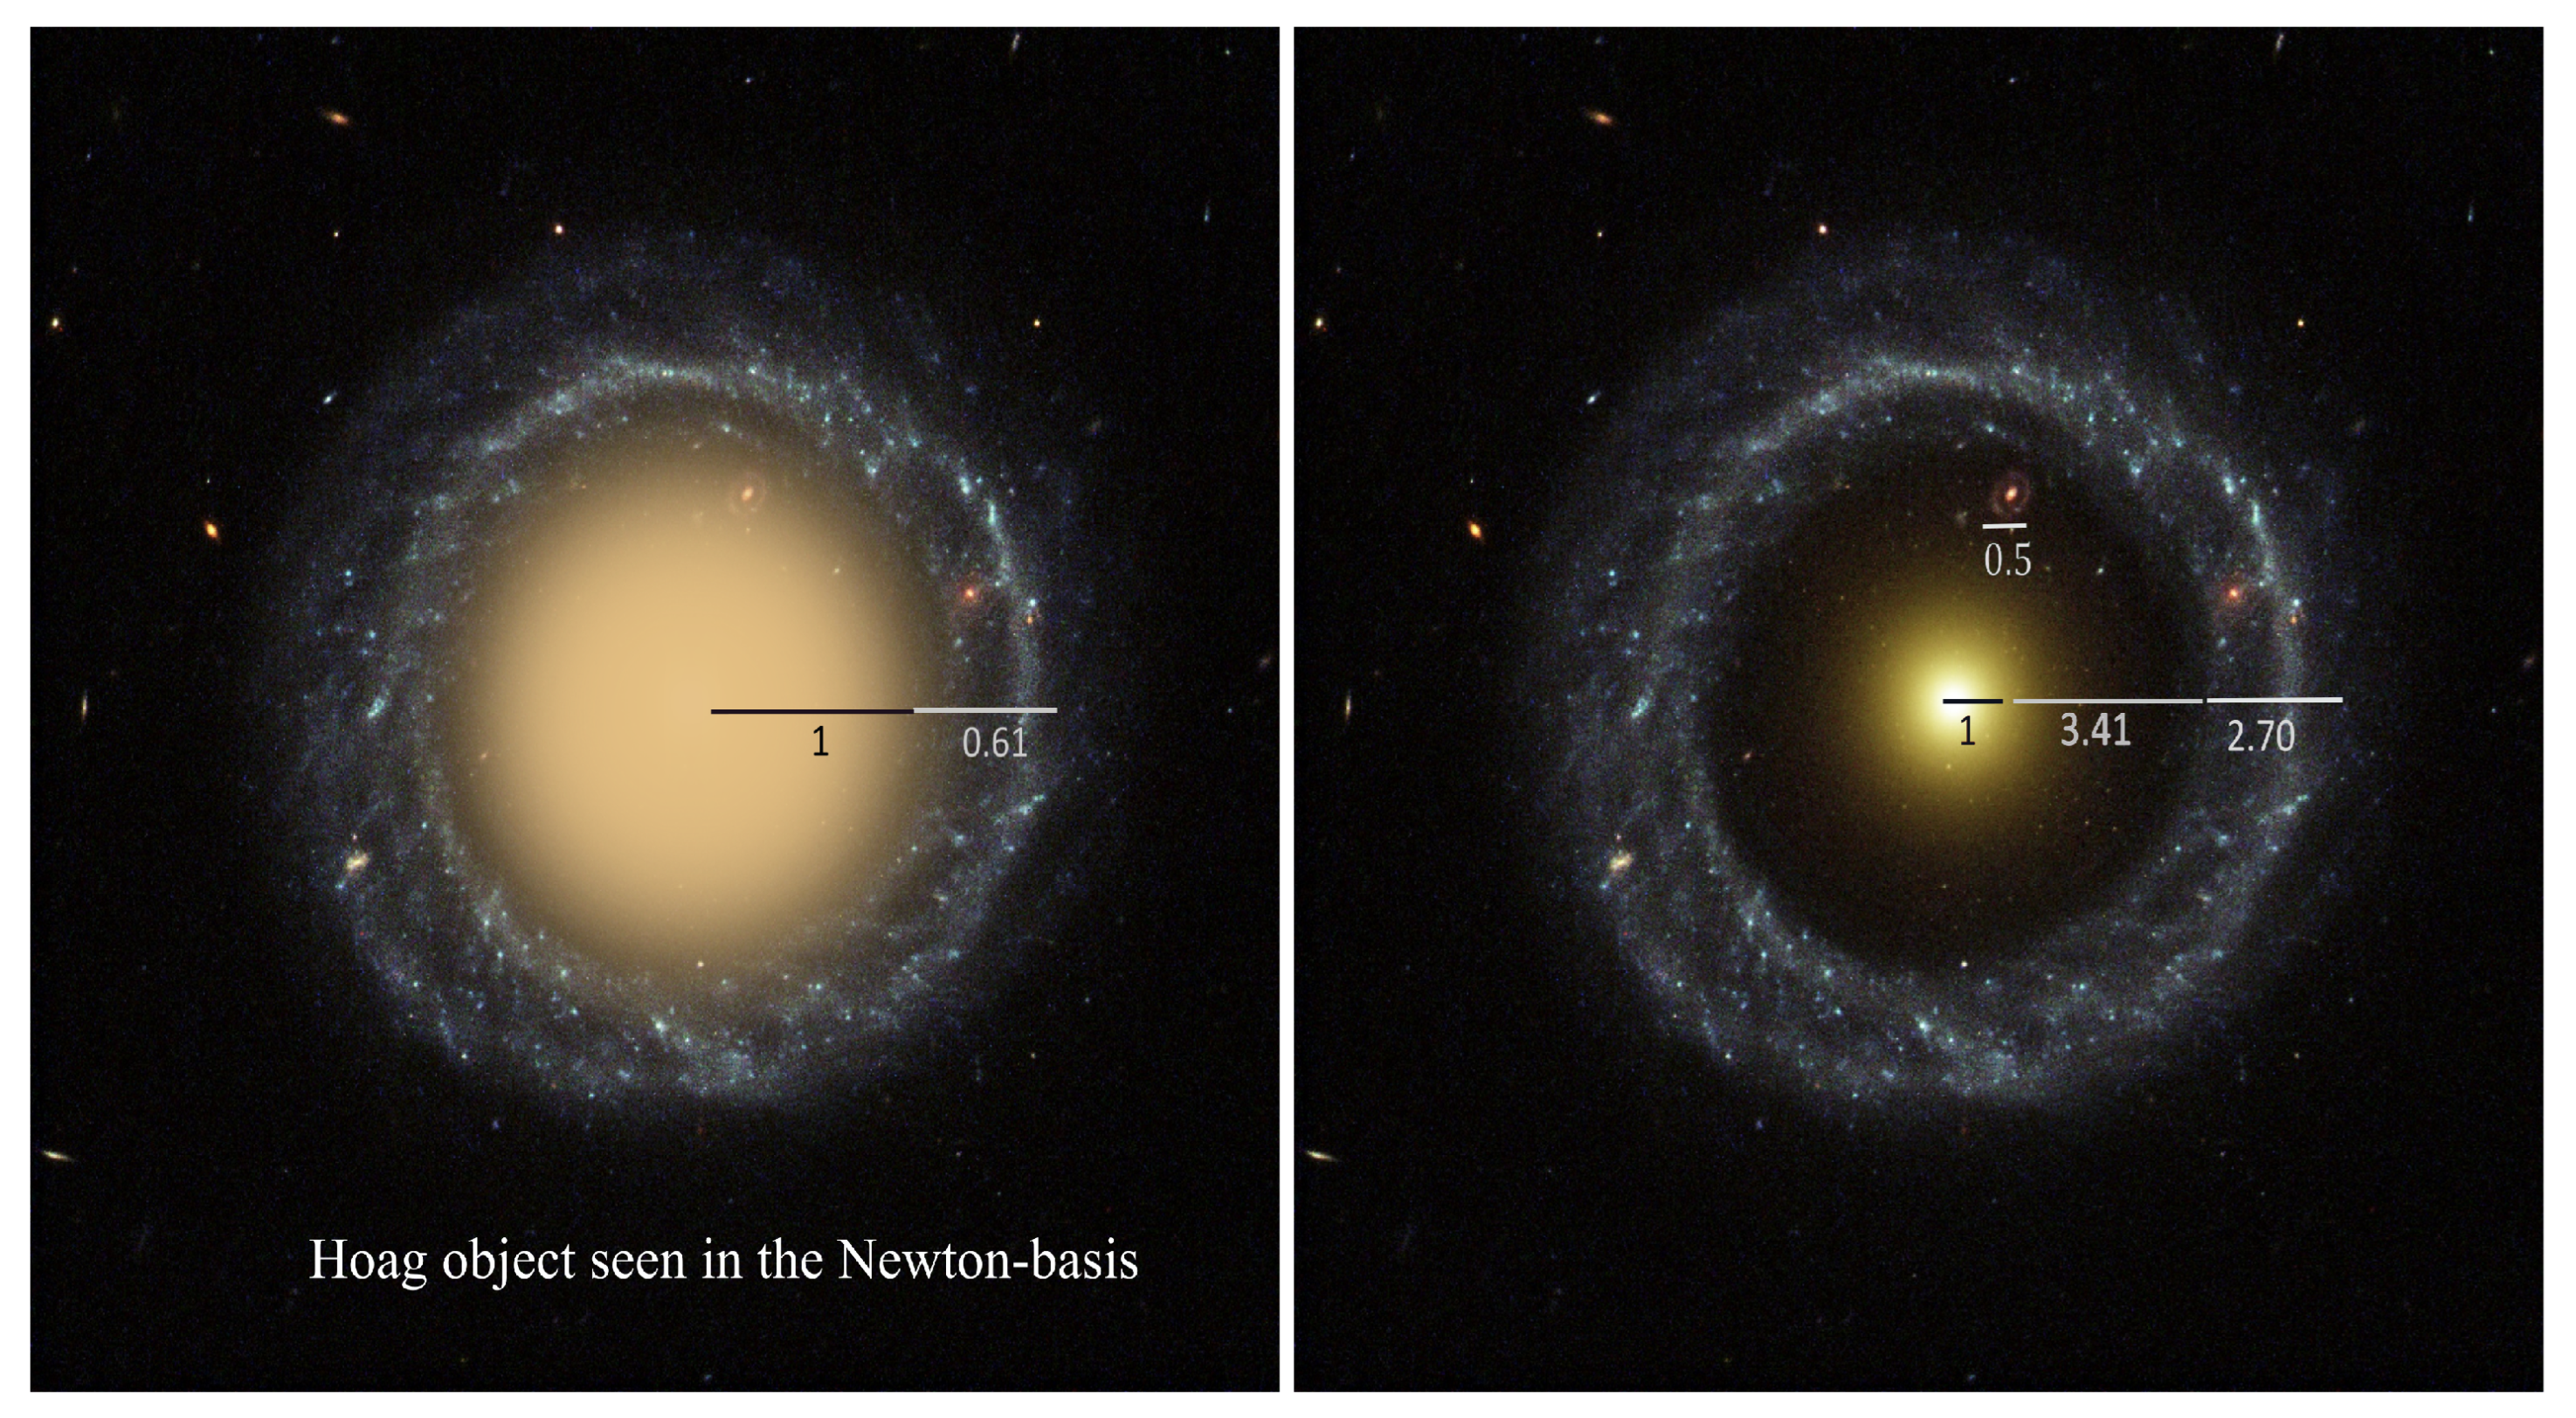
Disclaimer/Publisher’s Note: The statements, opinions and data contained in all publications are solely those of the individual author(s) and contributor(s) and not of MDPI and/or the editor(s). MDPI and/or the editor(s) disclaim responsibility for any injury to people or property resulting from any ideas, methods, instructions or products referred to in the content. |
© 2026 by the authors. Licensee MDPI, Basel, Switzerland. This article is an open access article distributed under the terms and conditions of the Creative Commons Attribution (CC BY) license.