


Abstract
Accurate identification of harmonic components is a prerequisite for addressing resonance risks in new energy power stations. Traditional Variational Modal decomposition (VMD) is susceptible to the influence of the modal decomposition order K and the penalty factor α when decomposing harmonic signals. This paper proposes an adaptive parameter selection method for VMD based on an improved Triangular Topology Aggregation Optimization (TTAO) algorithm. Firstly, the pre-set parameters of variational modal decomposition—modal order K and penalty factor α—exhibit strong coupling. Conventional optimization algorithms cannot effectively coordinate adjustments to both parameters. This paper employs an enhanced TTAO algorithm, whose triangular topology unit structure and dual aggregation mechanism enable simultaneous adjustment of modal order K and penalty factor α, effectively resolving their coupled optimization challenge. Using minimum envelope entropy as the fitness function, the algorithm obtains an optimized parameter combination for VMD to decompose the signal. Subsequently, dominant modal components are selected based on Pearson’s correlation coefficients for reconstruction, with harmonic parameters precisely identified using the Prony algorithm. Simulation results demonstrate that under a 20 dB noise environment, the proposed method achieves a signal-to-noise ratio (SNR) of 25.6952 for steady-state harmonics, with a root mean square error (RMSE) of 0.4889. The mean errors for frequency and amplitude identification are 0.055% and 3.085%, respectively, significantly outperforming methods such as PSO-VMD and EMD. Moreover, the runtime of our model is markedly shorter than that of the PSO-VMD algorithm, effectively resolving the symmetric trade-off between recognition accuracy and runtime inherent in variational modal decomposition.
1. Introduction
Against the macro backdrop of China’s dual carbon strategy, the energy sector is undergoing a profound and systemic transformation. The development of new power systems represents a crucial pathway towards decarbonizing and cleaning the energy structure. Its defining characteristic lies in the large-scale, high-proportion integration of renewable generation sources such as wind and photovoltaic power. This transformative adjustment significantly alters the structure of power systems and the symmetry of energy flow. Whilst power electronics technology has greatly enhanced the flexibility of power conversion and control, it has also exacerbated harmonic issues and the resulting harmonic resonance phenomena [1].
Compared with the traditional power system, the new power system presents more variations in the system equivalent impedance curve due to its high proportion of power electronic interfaces, which directly leads to a significant increase in the risk of harmonic resonance [2]. In addition, the intermittent and random nature of the new energy output also may cause the harmonic components of the power system to change abruptly in a very short period of time, which may lead to power quality deterioration, protection misoperation, or even widespread power outages [3]. Statistics indicate that in grid systems with high proportions of renewable energy sources, harmonic voltage distortion rates can increase by approximately 30–50% compared to conventional systems. Harmonic distortion at wind and photovoltaic grid connection points frequently exceeds the limits specified in the IEEE 519-2022 standard [4,5], which stipulates that voltage distortion at public connection points should generally not exceed 5%. Harmonic pollution not only increases electrical energy losses but may also trigger cascading issues such as electrical equipment overheating, false tripping of protective devices, and communication interference. Specifically, in sites featuring multiple parallel inverters, harmonic resonance frequencies are distributed more densely, readily inducing sustained resonance within the 500 Hz–2 kHz band. In severe cases, this may even cause grid-connected inverters to disconnect, compromising system stability. Therefore, it is difficult to analyze the frequency domain characteristics of harmonics to fully reflect the harmonic risk situation of the system; there is an urgent need to analyze and detect harmonics dynamically and at multiple scales from an integrated time–frequency domain perspective.
In recent years, researchers both domestically and internationally have proposed a variety of classical methods for harmonic detection in power systems. Notable techniques include the fast Fourier transform (FFT) [6], the wavelet transform [7], instantaneous reactive power theory [8], and the S transform [9]. These methods are able to identify the harmonic components in a steady state or a near-steady state to some extent. However, in a high percentage of new energy access scenarios, the harmonic characteristics tend to be more non-stationary, abrupt, and multi-scale, and the above methods often face limitations such as limited time–frequency resolution and insufficient noise immunity.
Signal-adaptive decomposition methods, such as empirical modal decomposition (EMD) [10] and its improved versions (integrated empirical modal decomposition (EEMD) [11], complementary ensemble EEMD (CEEMD) [12], the CEEMDAN algorithm [13], etc.), enhance the ability of analyzing non-smooth signals by extracting the intrinsic modal components in a recursive manner. However, they are susceptible to modal aliasing, endpoint effects, and parameter sensitivity and are still essentially limited by the idea of recursive decomposition.
Variational Mode Decomposition (VMD) [14] introduces a variational optimization framework to decompose the signal into eigenmodes with minimum bandwidth, exhibiting excellent time–frequency localization properties and high mode orthogonality (>93%), and the time–frequency confusion error is significantly reduced. However, its decomposition performance is sensitive to the choice of the number of modes (K) and the penalty factor α [15,16]. K determines the number of decomposed modes and the center frequency distribution; α controls the degree of bandwidth contraction of the modes. If the parameters are not properly selected, it may lead to the loss of key harmonic information or the increase in pseudo-modes, especially during sudden harmonic detection in new energy scenarios.
Adaptive parameter optimization methods based on intelligent optimization algorithms can well overcome the problem of VMD parameter dependence [17]. Typical intelligent optimization algorithms include the particle swarm algorithm (PSO) [18], which has a fast convergence speed but easily falls into the local optimum, and the simulated annealing algorithm [19] (SA), which has a strong capacity to escape from the local optimum but has a slow convergence speed and exhibits difficulty in parameter adjustment.
These optimization methods perform well under smooth or quasi-smooth signals, but they still face the challenge of balancing optimization accuracy, convergence speed, and global search capability in sudden harmonics and harmonic resonance detection in new energy scenarios.
Therefore, to overcome the shortcomings of existing harmonic detection methods in convergence speed, global search capability, and noise robustness under high-percentage renewable energy integration, this paper proposes a time–frequency domain-cooperative harmonic detection framework. This framework integrates an improved TTAO algorithm with VMD and the Prony algorithm to achieve precise identification of harmonic parameters. The core contribution lies in establishing a parameter-adaptive optimization process within this detection framework: the enhanced TTAO algorithm intelligently optimizes the critical VMD parameters (K and α) through improved population initialization and adaptive parameter adjustment, effectively resolving their coupled optimization challenge and enhancing their robustness against noise and dynamic signal variations. This study aims to construct a TTAO-VMD parameter optimization model by employing minimum envelope entropy as the fitness function; propose an IMF component selection and reconstruction mechanism based on Pearson’s correlation coefficients; and combine it with the Prony algorithm for high-precision extraction of harmonic parameters. Through steady-state and transient harmonic simulation experiments, the proposed method’s detection accuracy, noise immunity, and tracking capability for abrupt harmonic changes are validated.
2. Harmonic Resonance in High-Percentage New Energy Power Systems
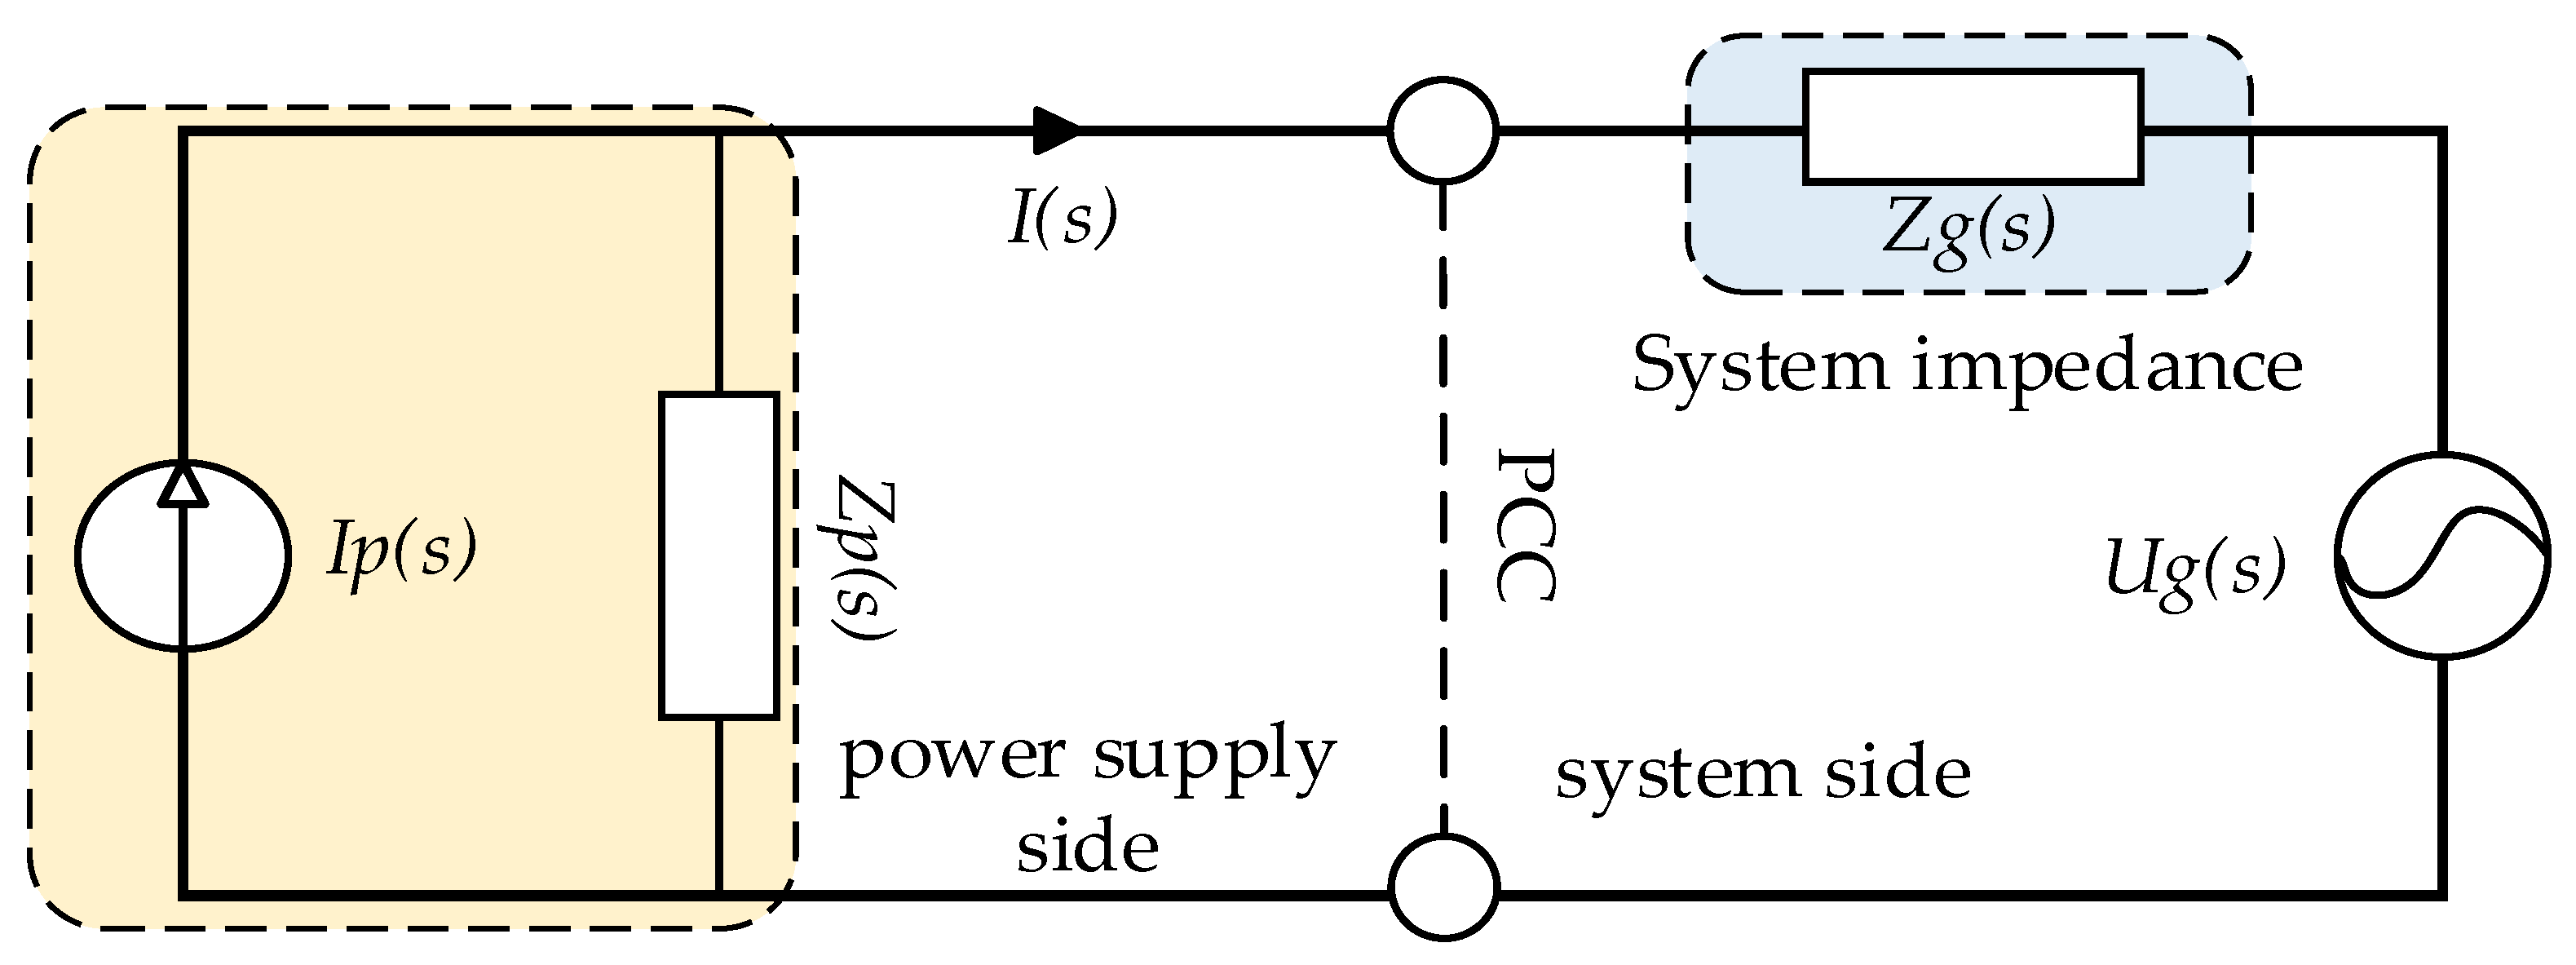
In the high-ratio new energy power system shown in Figure 1, the distributed power supply side is equated to a parallel circuit with a controlled current source Ip(s) and output impedance Zp(s), and the system side is equated to a series circuit with a constant voltage source Ug(s) and system impedance Zg(s).
Figure 1.
Distributed power grid-connected equivalent circuit.
The output current of the grid-connected inverter can be expressed as
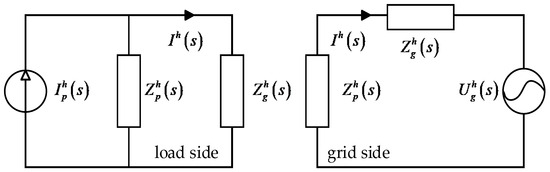
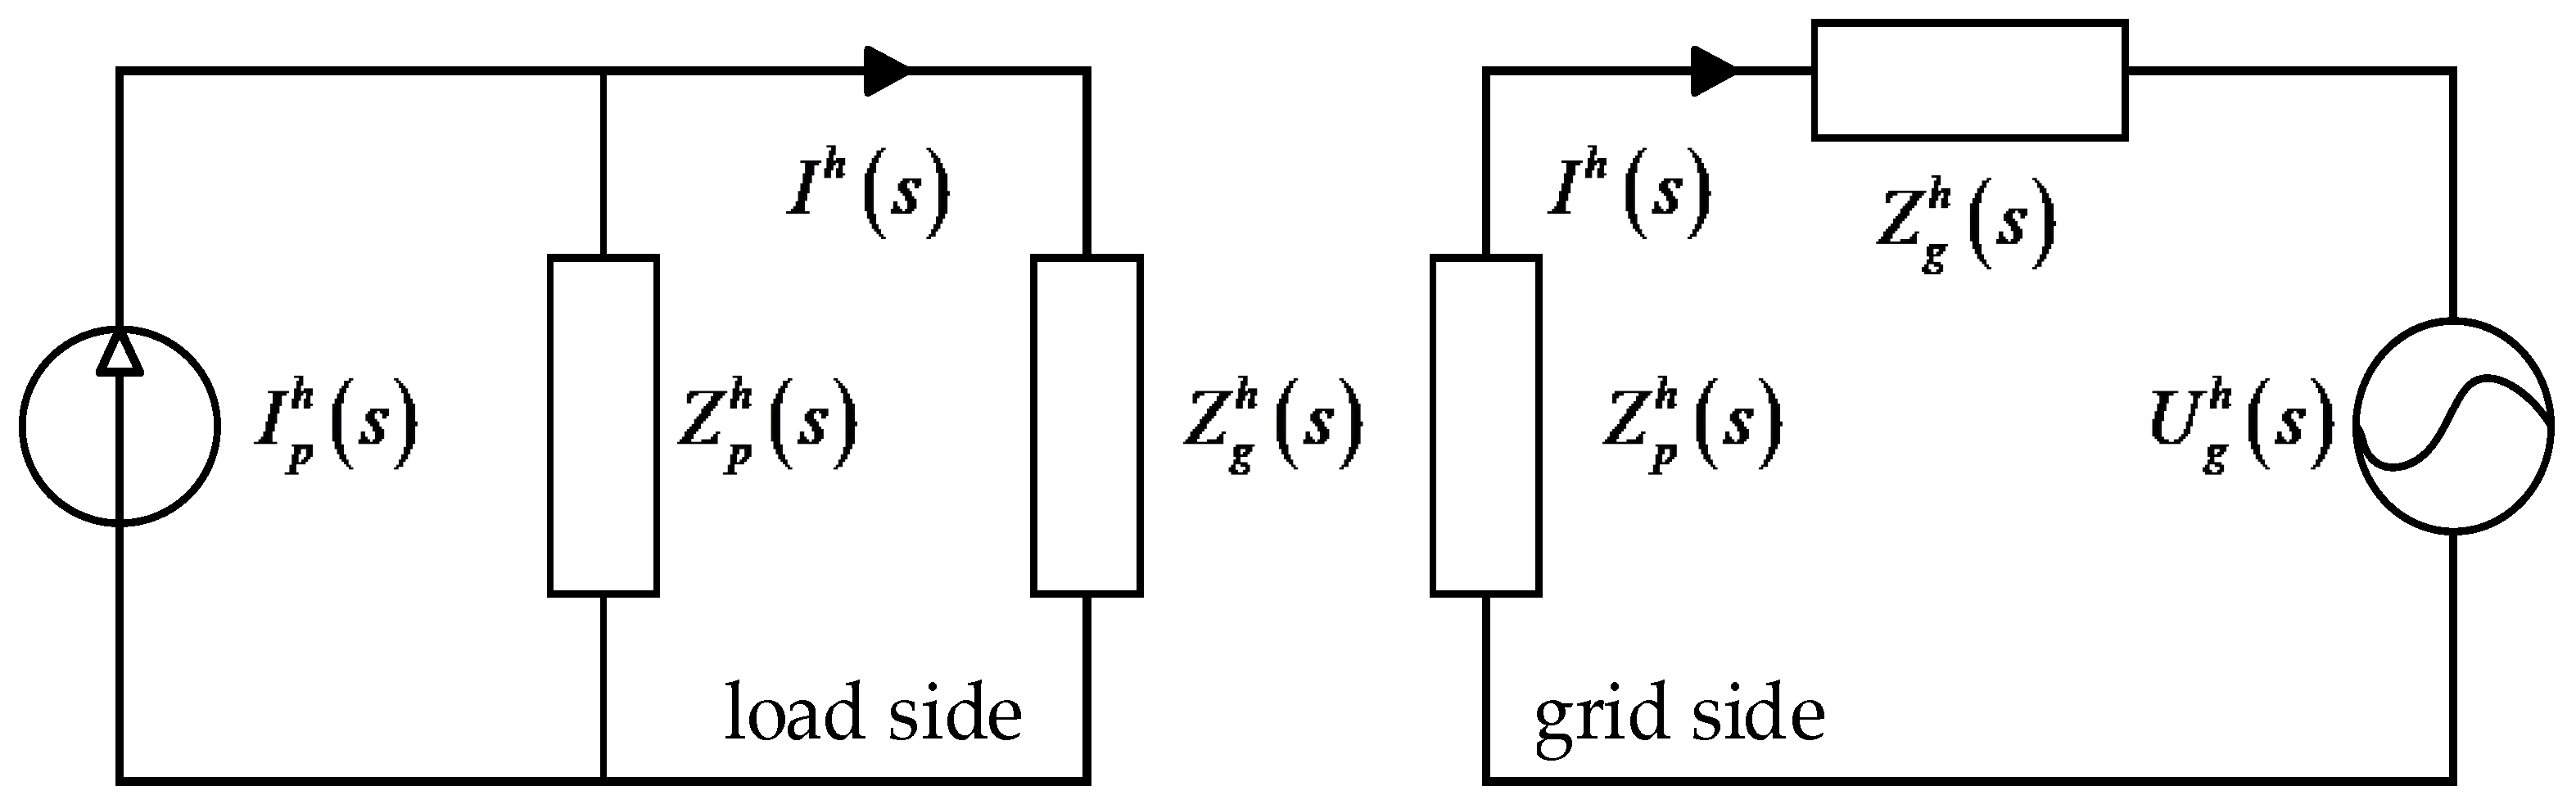
As shown in Figure 2, if a harmonic source exists at the intrinsic frequency of the system, then the system will resonate. When the harmonic frequency of is close to the intrinsic frequency of the impedance network, it will cause parallel resonance in the system, and when the harmonic frequency of is close to the intrinsic frequency of the impedance network, it will cause series resonance in the system. Resonance will amplify the harmonic pollution in the system and even destabilize the system. Therefore, it is necessary to not only analyze the frequency domain characteristics of harmonics but also consider the time domain characteristics of harmonics in a comprehensive and balanced way to accurately detect the various steady-state harmonics and short-time harmonics of the power system and take measures in time to suppress the harmonic interference so as to not trigger harmonic resonance and cause a greater impact on the system.
Figure 2.
Resonant equivalent circuit.
3. VMD and Parameter Optimization Algorithm
The previous section introduced the principle of harmonic-triggered resonance in high-percentage new energy power systems and the need to propose accurate harmonic detection algorithms. In this section, the principles of the harmonic detection algorithm are presented.
3.1. Principle of Variational Modal Decomposition
The VMD algorithm operates by formulating a variational framework that decomposes the original non-smooth signal into K distinct intrinsic mode functions (IMFs), each characterized by specific sparsity properties. This decomposition algorithm aims to extract the central frequency and bandwidth associated with every IMF component. The method seeks to minimize the total estimated bandwidth across all IMF components as its optimization objective [20]. The mathematical formulation of the VMD approach can be described by the following equation:
where K denotes the number of modes, denotes the modal components obtained by decomposition, represents the center frequency of the decomposed signal, is the Dirac function, denotes the presence of bias, denotes the convolution operator, and is the original signal.
In order to address the optimal solution problem presented by the equation, the algorithm incorporates the Lagrange multiplier and the penalty factor , transforming the original constrained equation-solving problem into an unconstrained equation-solving problem. The expression is as follows:
In VMD, the decomposition results are relatively heavily influenced by the decomposition quantity K and the penalty factor ; too large a value of K leads to over-decomposition, while too small a value of K tends to cause modal aliasing and inadequate decomposition; too large a value of leads to modal aliasing, while too small a value may introduce noise.
Based on the aforementioned issues, this paper introduces a TTAO algorithm aimed at optimizing the selection of VMD parameters through initial position optimization and enhancement of convergence speed.
3.2. Triangular Topology Aggregation
This section employs the Logistic–Tent chaotic map to optimize the initial position of the TTAO algorithm. Optimizing the initial position enhances the global convergence capability of the optimization algorithm. Furthermore, we also optimize the iteration speed of the TTAO algorithm, significantly accelerating convergence when confronted with complex computational scenarios.
The core of the TTAO (Triangle Topology Aggregation Optimization) algorithm is based on similar-triangle topology, and the triangle topology unit containing three vertices (search agent), and one internal random vertex is used as the basic evolutionary unit, and the exploration and development ability is balanced by two strategies of generalized aggregation (interacting with excellent individuals across the unit to achieve global exploration) and local aggregation (using local information within the unit for local development). However, there are still some problems:
- (1)
- The initial position is not adjusted, and optimizing the initial position can improve the global search ability and reduce the number of iterations;
- (2)
- Computational complexity is high when dealing with large-scale data.
For Problem 1, the initial position is optimized by Logistics–Tent chaotic mapping; for Problem 2, we optimize the traditional method by adaptive parameter tuning. Logistics–Tent [21] mapping combines two classical mappings of Logistics and Tent with chaotic mapping using random initialization of dimensions in its search space, and its mathematical expression is as follows [22]:
where x is a system variable, with ; is the control variable, a continuous real parameter used to adjust the degree of chaos in the system, whose value may vary continuously within the interval , is the initial position; and denote the lower and upper bounds of the search range, respectively; and mod 1 denotes modulo 1 arithmetic (i.e., taking the fractional part of a number), serving to constrain the computational result within the interval [0, 1) and thereby ensure effective iteration of the chaotic map.
For the problem of high algorithmic complexity in large-scale computation, during the iterative process, the parameters are dynamically adjusted according to the current search state, and the size of the triangle topology unit is gradually reduced to accelerate convergence, which is mathematically represented as
where l represents the size of the triangular topological unit, is the current number of iterations, is the maximum allowed number of iterations, and is the initial size. The specific steps of the improved TTAO algorithm are detailed in Appendix A.
3.3. TTAO-VMD Parameter Optimization
Considering that VMD needs to artificially set the number of IMF components (K) as well as the penalty factor and that the setting of the initial value has a large impact on the effect of decomposition, the TTAO algorithm is introduced to optimize the parameter selection of VMD in order to maximize the denoising effect. In order to better determine the parameters of VMD, this paper takes the minimum envelope entropy as the fitness function of the TTAO algorithm, and the formula for envelope entropy is as follows [23]:
where is the envelope signal sequence obtained by the Hilbert demodulation of the resolved signal, is the ith IMF obtained by VMD of the signal, is the resolved signal obtained by the Hilbert transform, is the probability distribution of the envelope signal sequence , and N is the total number of signal sampling points. The entropy value of the probability distribution is calculated as the envelope entropy.
4. Principles of the Prony Algorithm
The Prony algorithm fits the sampled data at equal time intervals using p exponential terms and their linear combinations with arbitrary magnitudes, phases, frequencies, and attenuation factors [24]. The general expression is as follows:
where is an approximate fit to the measured data , n = 0, 1, …, N (N is the number of sampling points). , , , and represent the amplitude, frequency, phase, and attenuation factor, respectively. represents the time interval, and p represents the model order.
To find , , , and , construct the objective function (Equation (12)) as follows:
Assuming that the signal is generated by a linear difference model, the process of solving the difference in Equation (12) can be obtained. The characteristic polynomial is obtained as follows:
The error between the fitted data and the true data is , and combining this with Equation (11) then yields
will be derived as an output that solves the equation, which is then taken into the characteristic polynomial and solved for ; then is substituted into (9) and (14).
The final equation for each parameter is given below.
5. Harmonic Detection Procedure
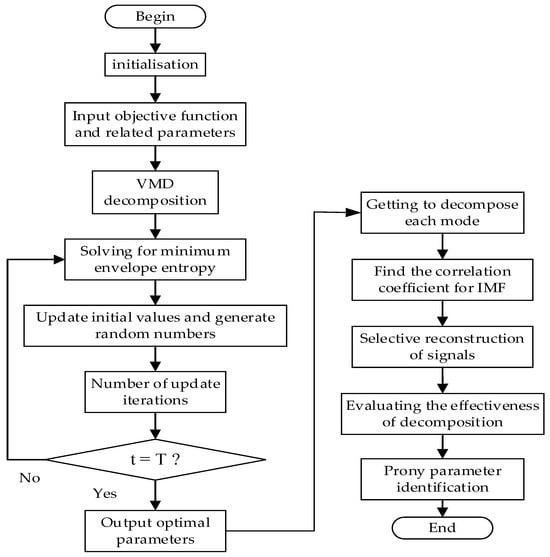
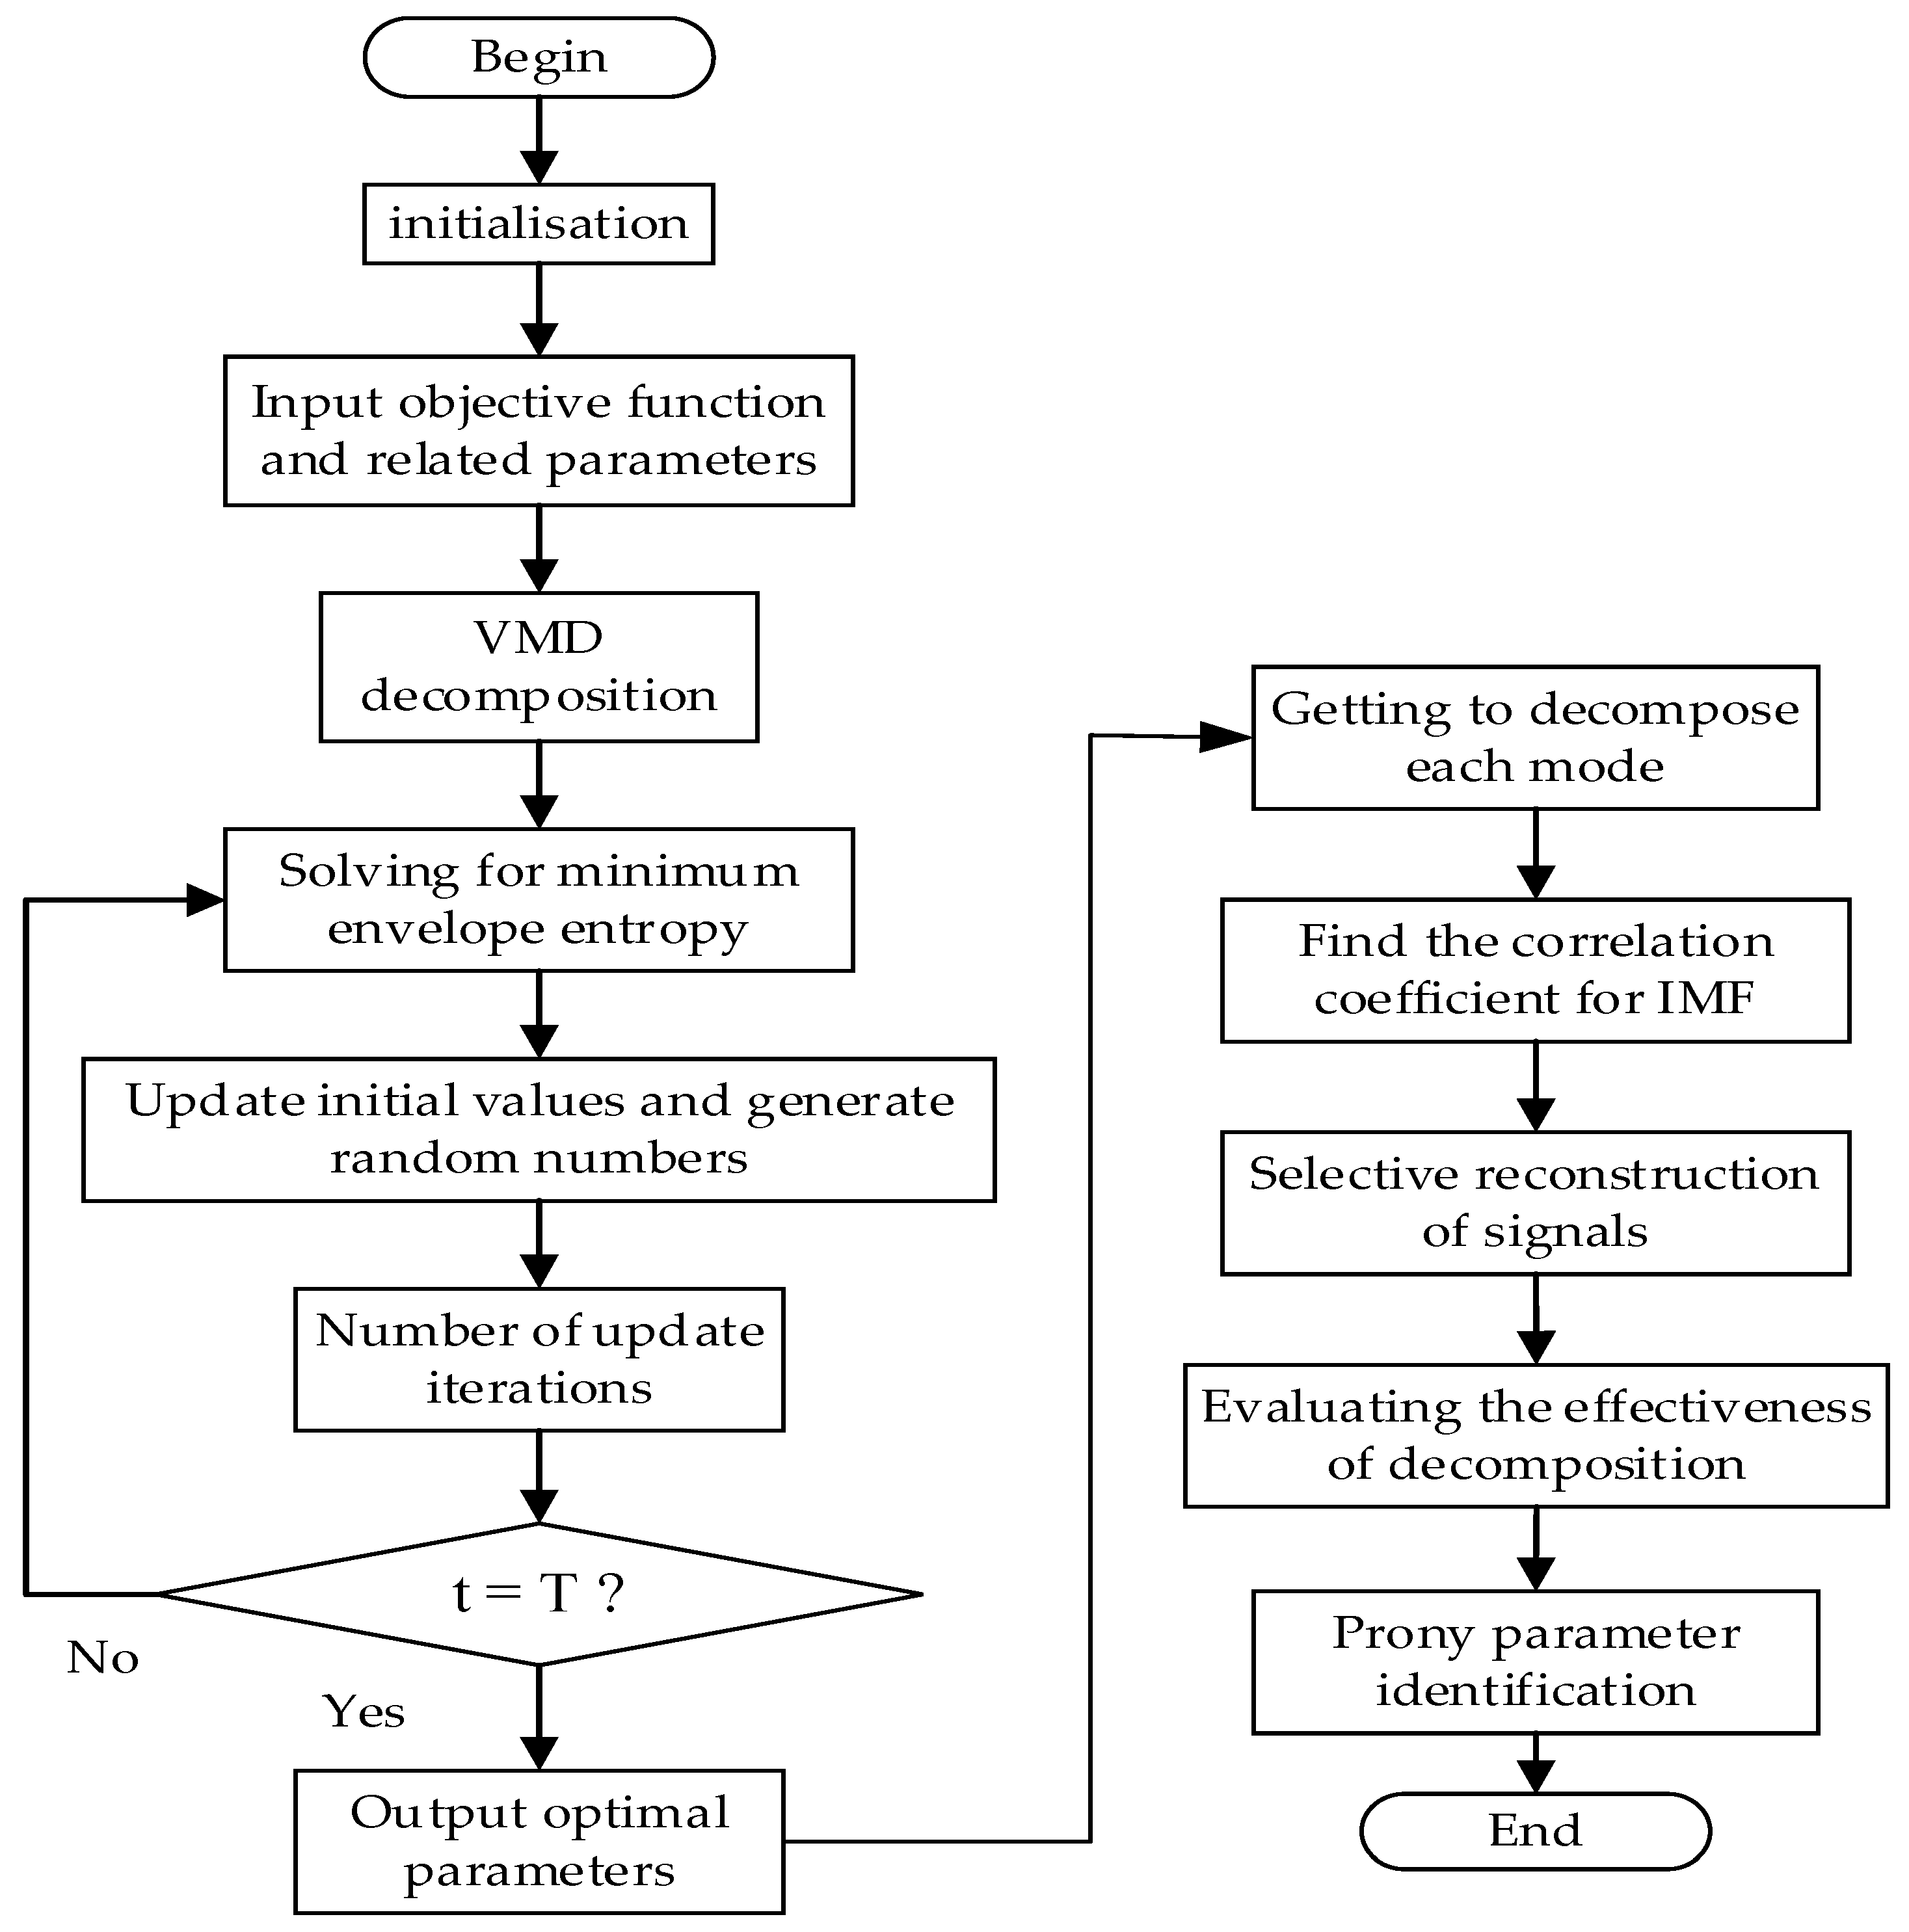
The specific steps for harmonic detection are outlined as follows:
- (1)
- Input signal data and determine the sampling frequency Fs and sampling point N;
- (2)
- Using the minimum envelope entropy as the objective function for fitness evaluation, determine the optimal number of decomposed modes (K) and the penalty factor for VMD through the application of the TTAO algorithm;
- (3)
- VMD decomposes the signal into K internal modal components, finds the correlation coefficient with the original signal for each IMF component, and selects the IMFs that satisfy the conditions for signal reconstruction;
- (4)
- Evaluate the effectiveness of VMD based on the root mean square error (RMSE), the signal-to-noise ratio (SNR), and the correlation coefficient (R) [25];
- (5)
- Prony parameter identification is conducted on the decomposed signal to extract information such as the frequency and amplitude of the signal, facilitating comparisons with alternative methods. The process is illustrated in Figure 3.Figure 3. Flow chart of harmonic detection.
6. Simulation Analysis
In this paper, the version of MATLAB used is 2022a. The specific specifications of the computer employed are as follows: the processor is an 11th Gen Intel® Core™ i5-1135G7@2.40GHz; the RAM is 16 GB; the graphics card has 128 MB of memory, and the operating system is Windows 11 Professional.
In power systems, signals often contain noise as well as harmonics, and based on these assumptions, the harmonic model can be expressed as [26]
where represents Gaussian white noise.
6.1. De-Noising Effect Verification
To compare the denoising effects of the TTAO-VMD, PSO-VMD and EMD methods in different noise environments, the signal-to-noise ratio (SNR) and root mean square error (RMSE) are used as the main evaluation indexes of the denoising effects, and decomposition is performed on the steady-state signals and transient signals in different noise environments. Gaussian white noise of 20 dB and 10 dB was added to the steady-state signal and the transient signal, respectively. The results are shown in Table 1 and Table 2:
Table 1.
Comparison of the signal-to-noise ratio under different noise intensities.
Table 2.
Comparison of root mean square error under different noise intensities.
As demonstrated in Table 1 and Table 2, the proposed method achieves superior noise reduction performance compared to both the EMD and PSO-VMD approaches under various noise conditions, whether applied to steady-state or transient signals. This stems from TTAO’s capacity to seek more globally optimal solutions for the K and α parameters, thereby yielding purer decomposition results that mitigate noise and modal aliasing effects. This manifests as higher signal-to-noise ratio (SNR) and lower root mean square error (RMSE). Ultimately, this lays the foundation for the Prony algorithm to extract harmonic signal parameters. Moreover, the proposed method demonstrates particularly pronounced noise reduction capabilities in transient signals and high-noise environments, indicating its significant advantages and broad applicability.
6.2. Steady-State Signal Analysis
The load harmonic model introduced in this paper contains fundamental harmonics, third harmonics, fifth harmonics, seventh harmonics, and interharmonics. The model is expressed as follows:
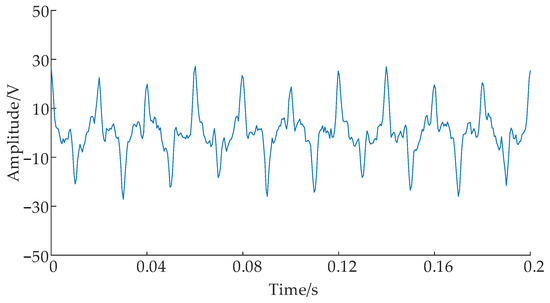
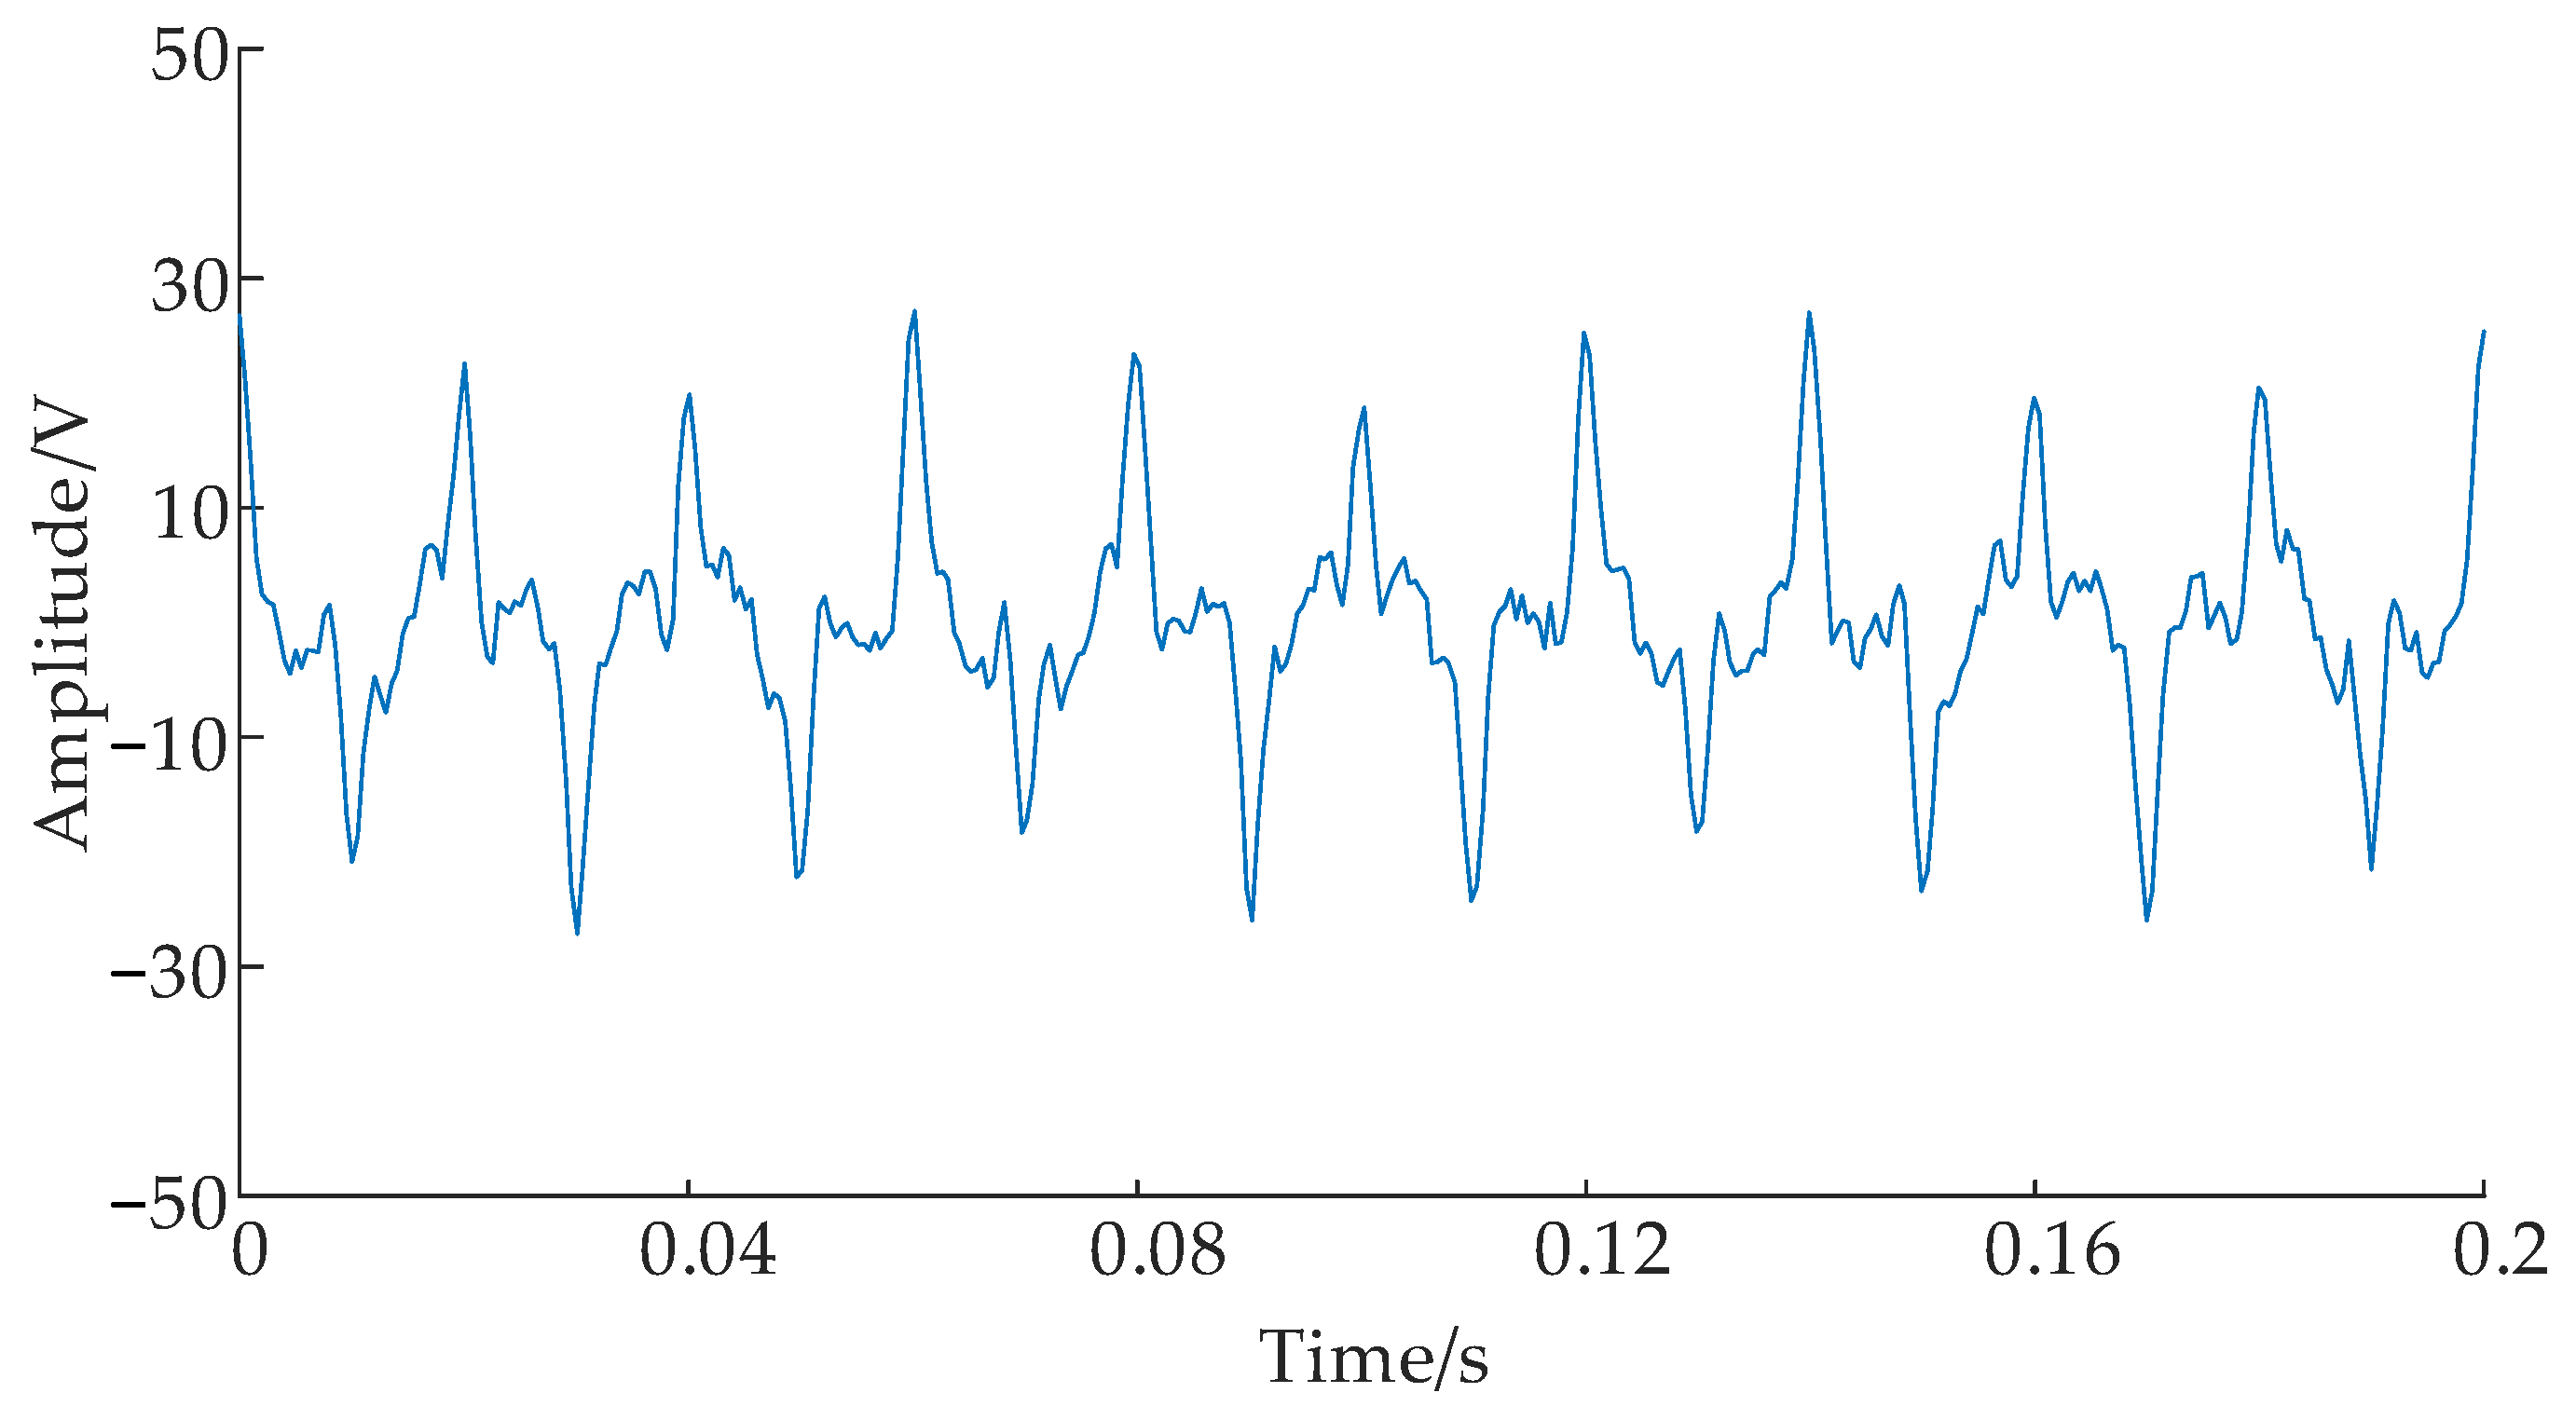
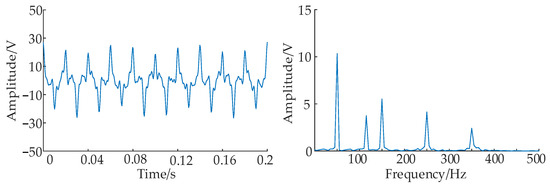
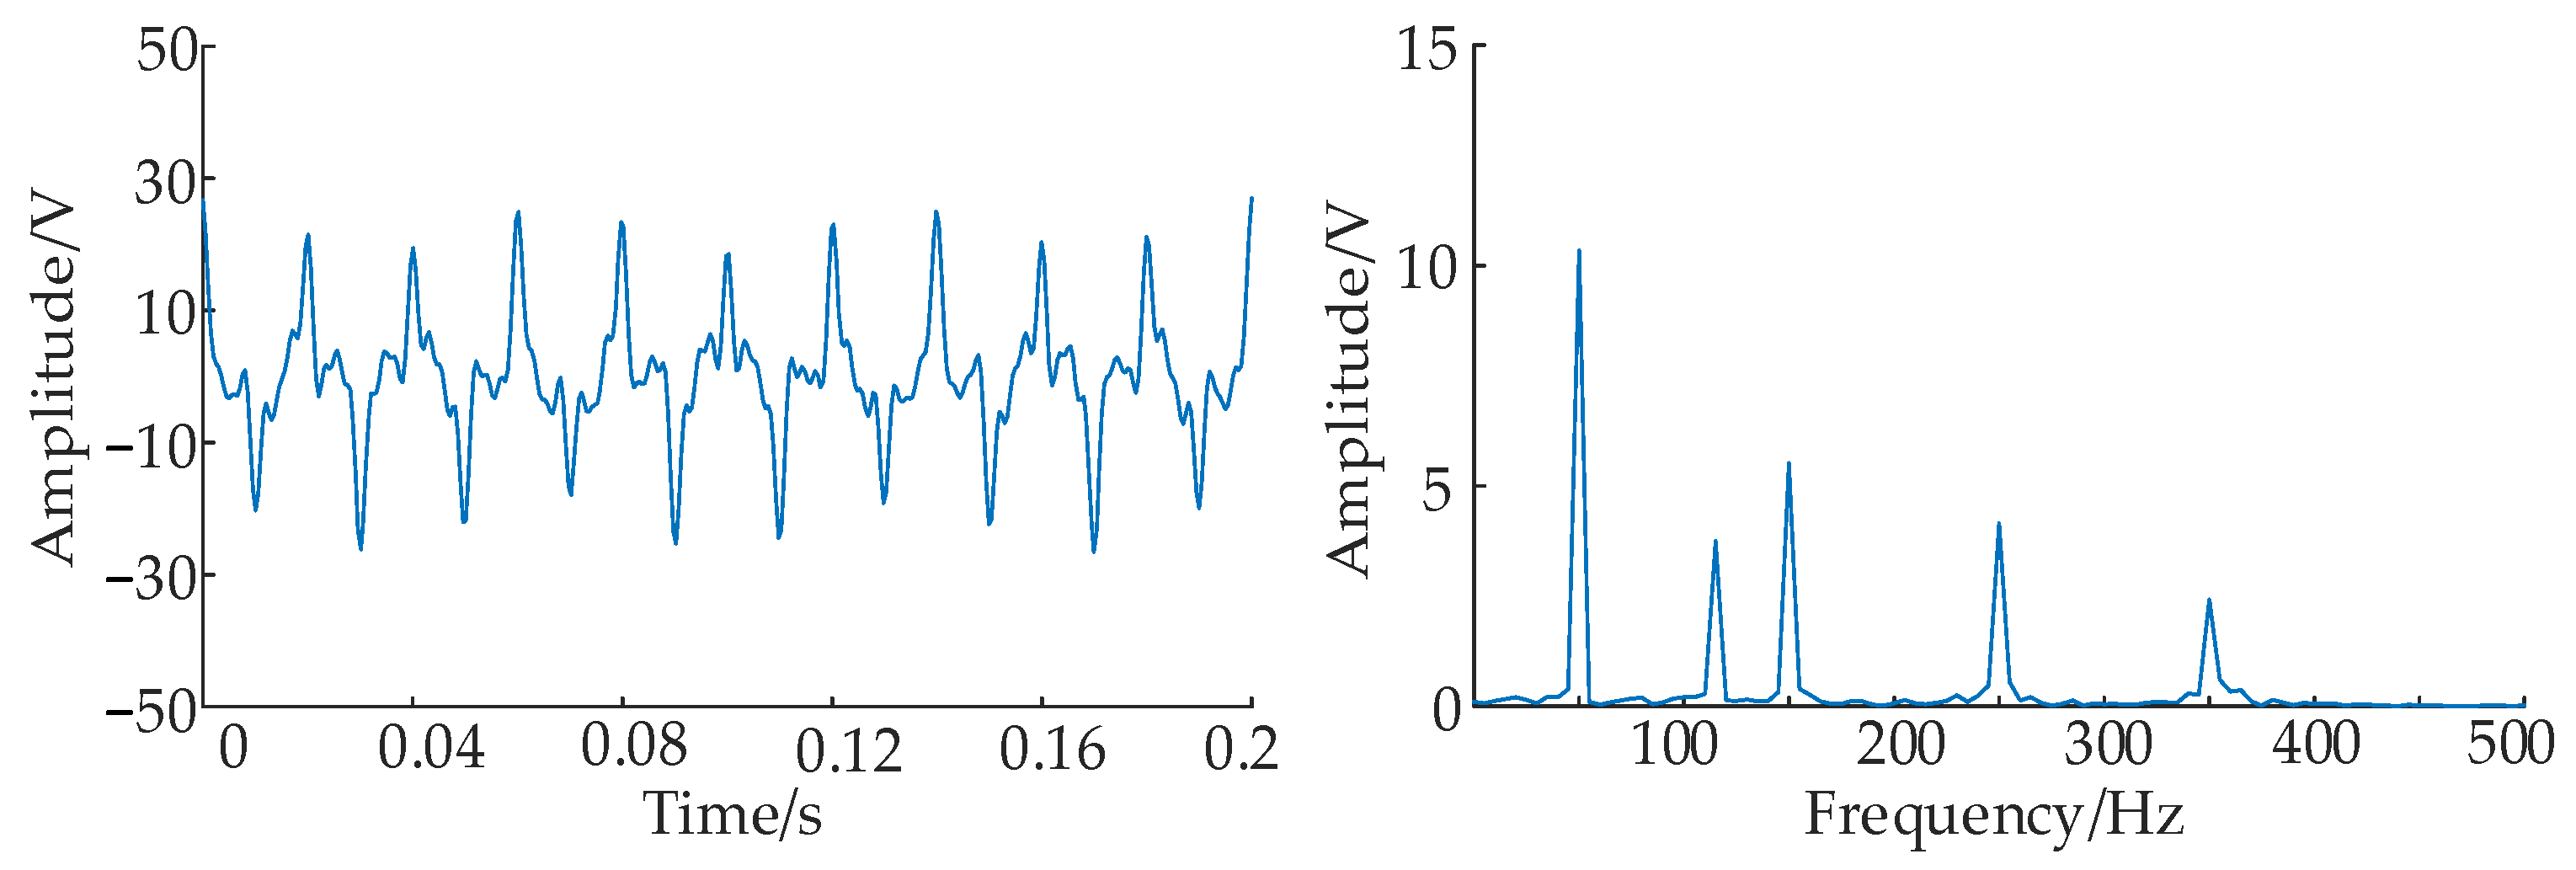
The sampling frequency is 2000 Hz. The number of samples (N) is 400, and 20 dB of Gaussian white noise is added to the original signal. The waveform is shown in Figure 4.
Figure 4.
Waveform diagram containing the 20 dB Gaussian white noise signal.
The selection of TTAO parameters is based on empirical rules. Generally, the population size can be set to between five and twenty times the problem’s dimension. In this paper, the problem’s dimension is two, namely the number of decompositions and the penalty factor. Furthermore, as the triangular topology structure of the TTAO algorithm aids in maintaining diversity while also considering computational resource conservation, the population size need not be excessively large; setting it to ten is sufficient. Secondly, as the authors have enhanced the convergence speed of the TTAO algorithm in this paper, the iteration count need not be excessively high; Twenty iterations suffice. For the lower bound of the number of VMDs, the selection criterion is based on fundamental factors plus their harmonics. In this paper, considering power system signals, the lower bound is set to two. Similarly, for the upper bound of the number of decompositions, based on empirical evidence, the upper bound for typical power system signals is set between 8 and 12. Finally, concerning the penalty factor: A low penalty factor yields a wider bandwidth, enabling the mode to encompass more frequency components and offering greater noise immunity. Conversely, a high penalty factor results in a narrower bandwidth, producing a purer mode but rendering it more susceptible to noise [27]. An excessively high penalty factor may over-smooth the signal, leading to a loss of detail. After comprehensive consideration, this paper adopts lower and upper bounds of 100 and 10,000, respectively, for the penalty factor. The improved TTAO parameter settings and their running results are shown in Table 3:
Table 3.
TTAO and PSO parameter settings.
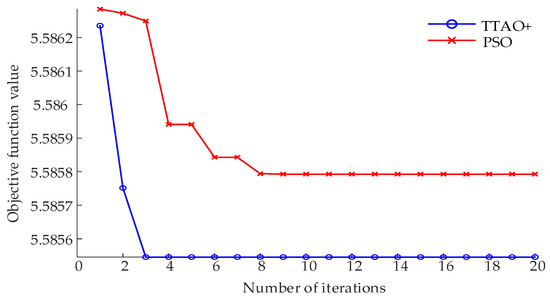
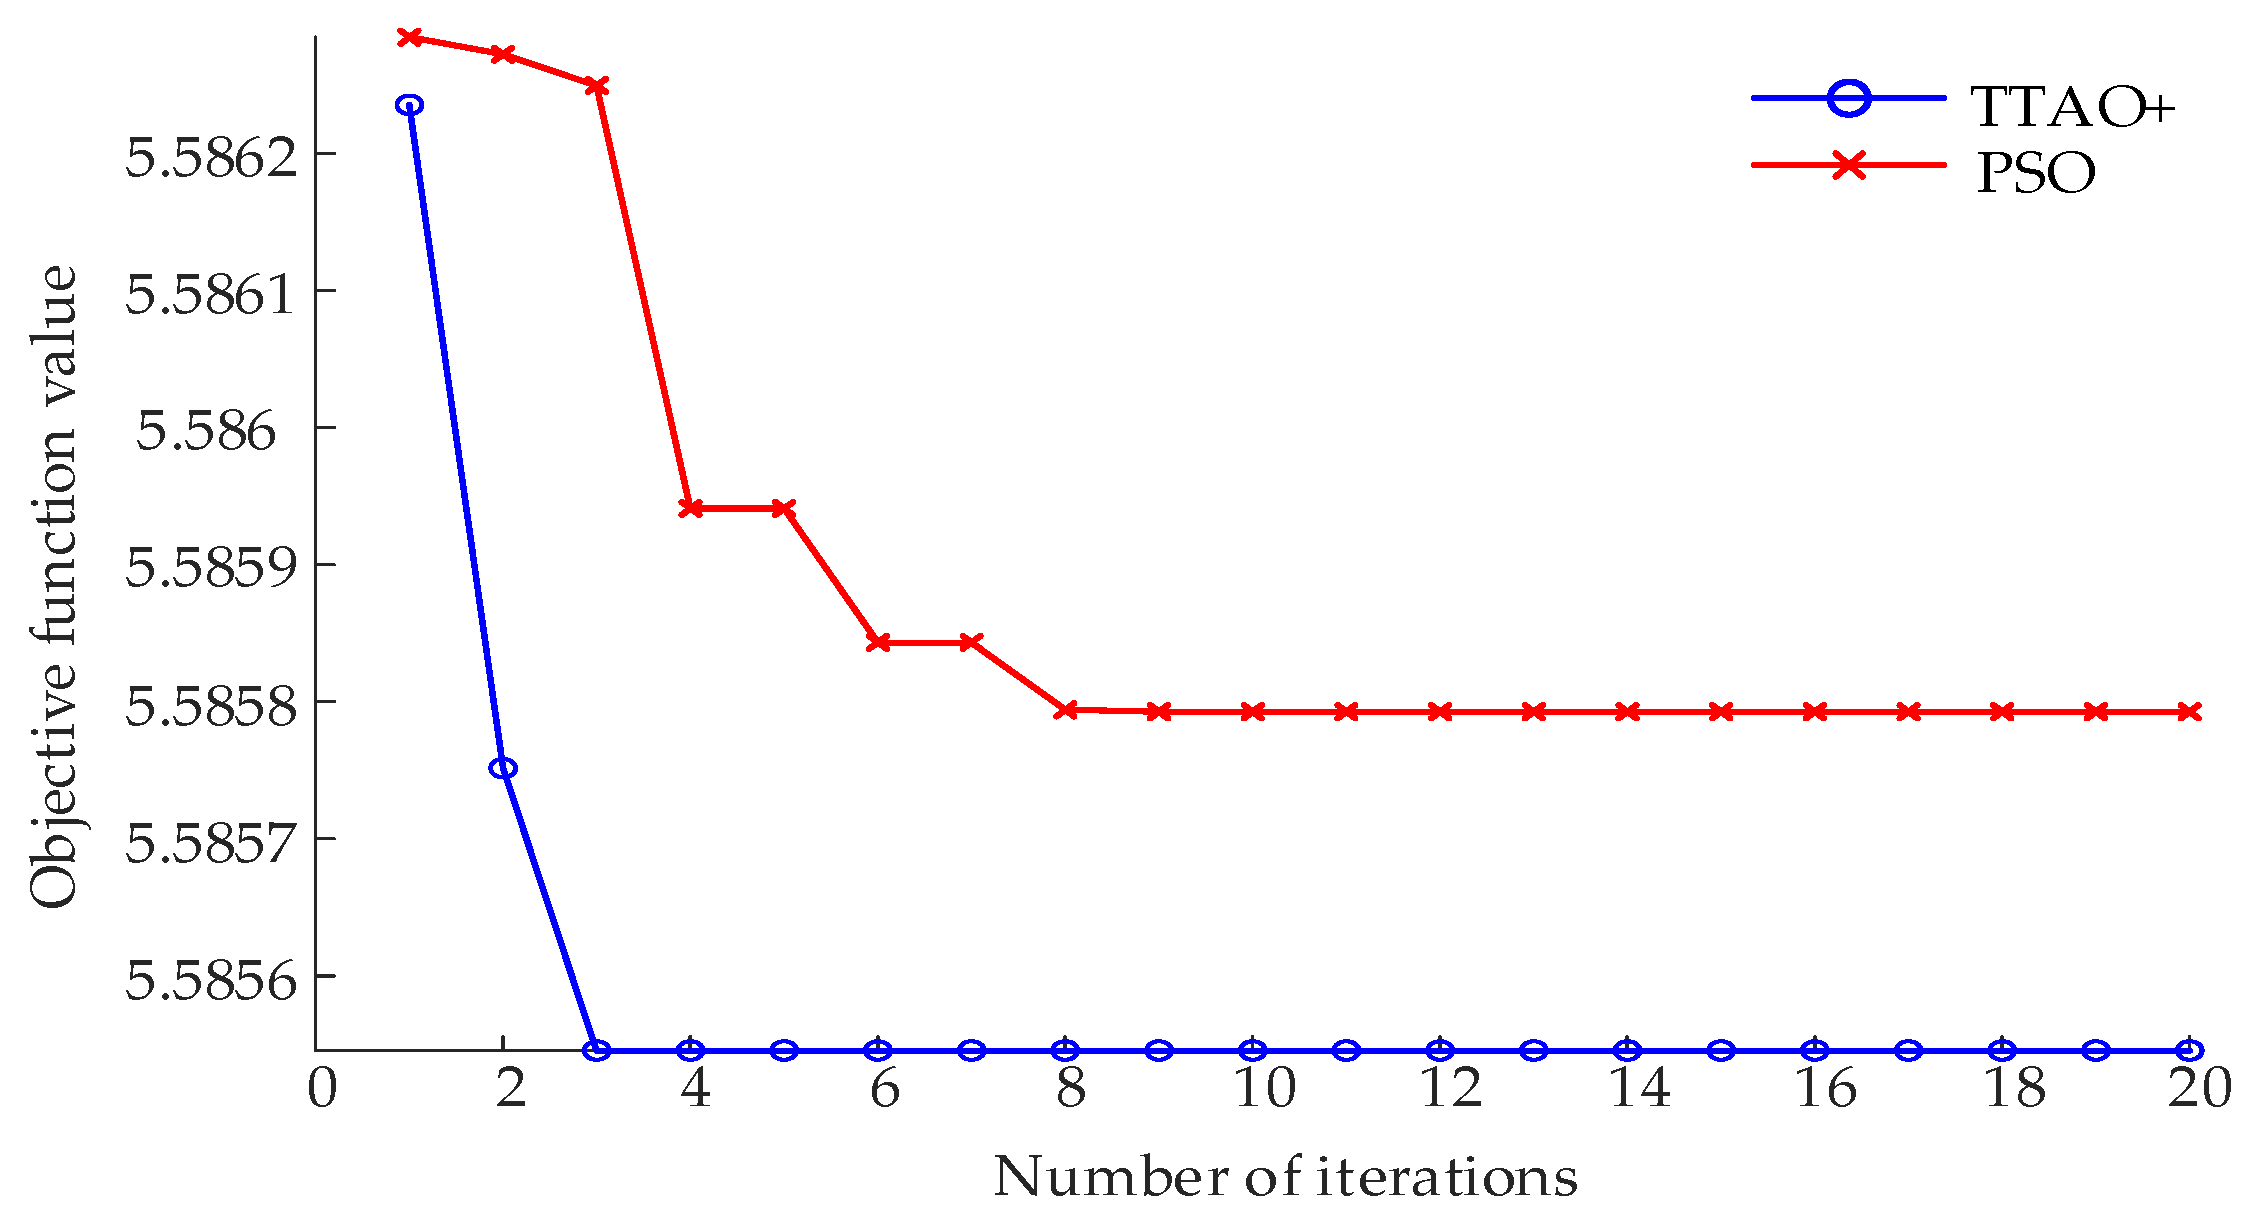
To optimize the determination of VMD parameters, the TTAO algorithm employs the minimum value of envelope entropy as the fitness function. A higher envelope entropy value indicates weaker signal periodicity and higher noise levels, whereas a lower value signifies stronger periodicity and smoother signals. While maintaining the aforementioned fundamental parameter settings unchanged, the improved TTAO and PSO optimization algorithms were employed to compute the minimum envelope entropy value. The corresponding iterative curve evolution is depicted in Figure 5. The notation TTAO+ denotes the improved TTAO algorithm. As evident from Figure 5, within a finite iteration count, the enhanced TTAO algorithm exhibits the fastest convergence rate and optimal convergence performance compared to the PSO algorithm. This demonstrates the enhanced TTAO algorithm’s advantages in initial position selection and iterative convergence speed. At this point, the global optimal function value is 5.585, corresponding to a VMD penalty factor of 4878.5 and a decomposition layer count of 5.1.
Figure 5.
Convergence comparison of the TTAO+ and PSO algorithms.
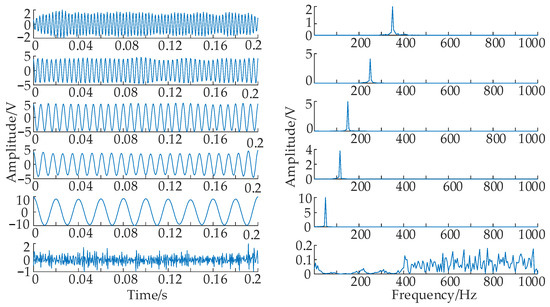
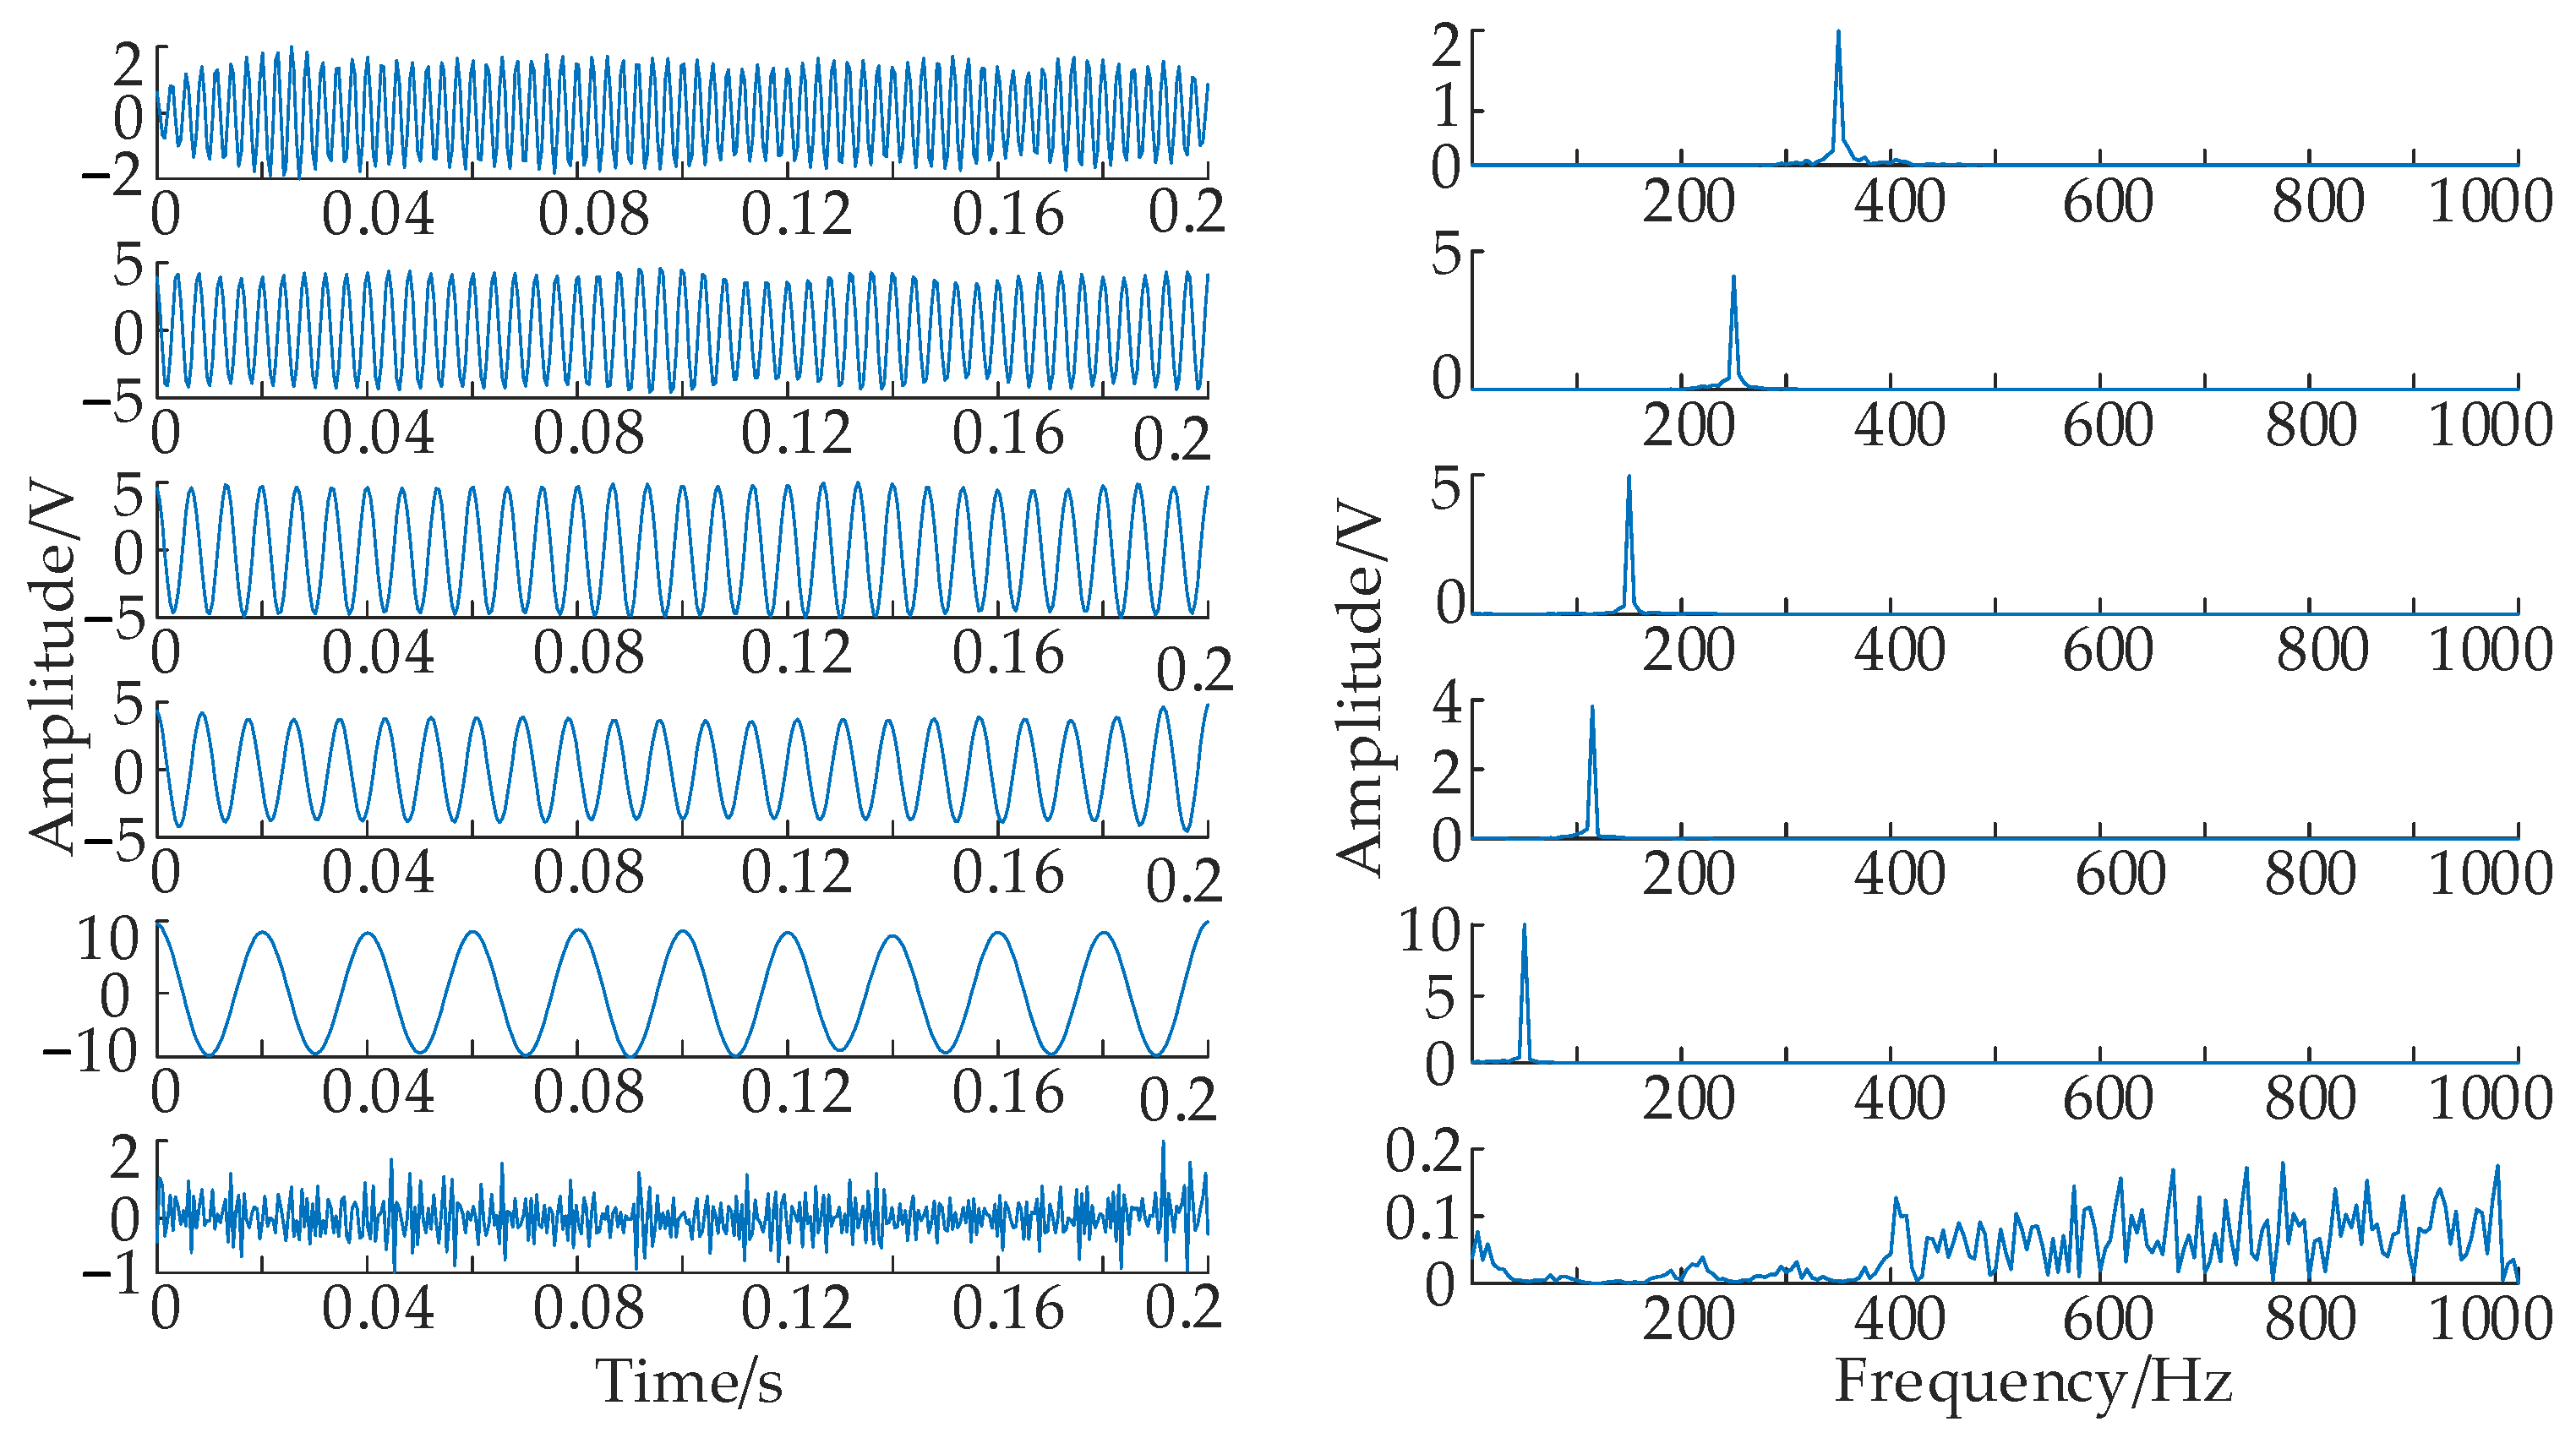
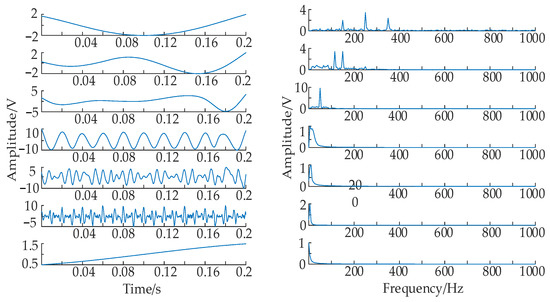
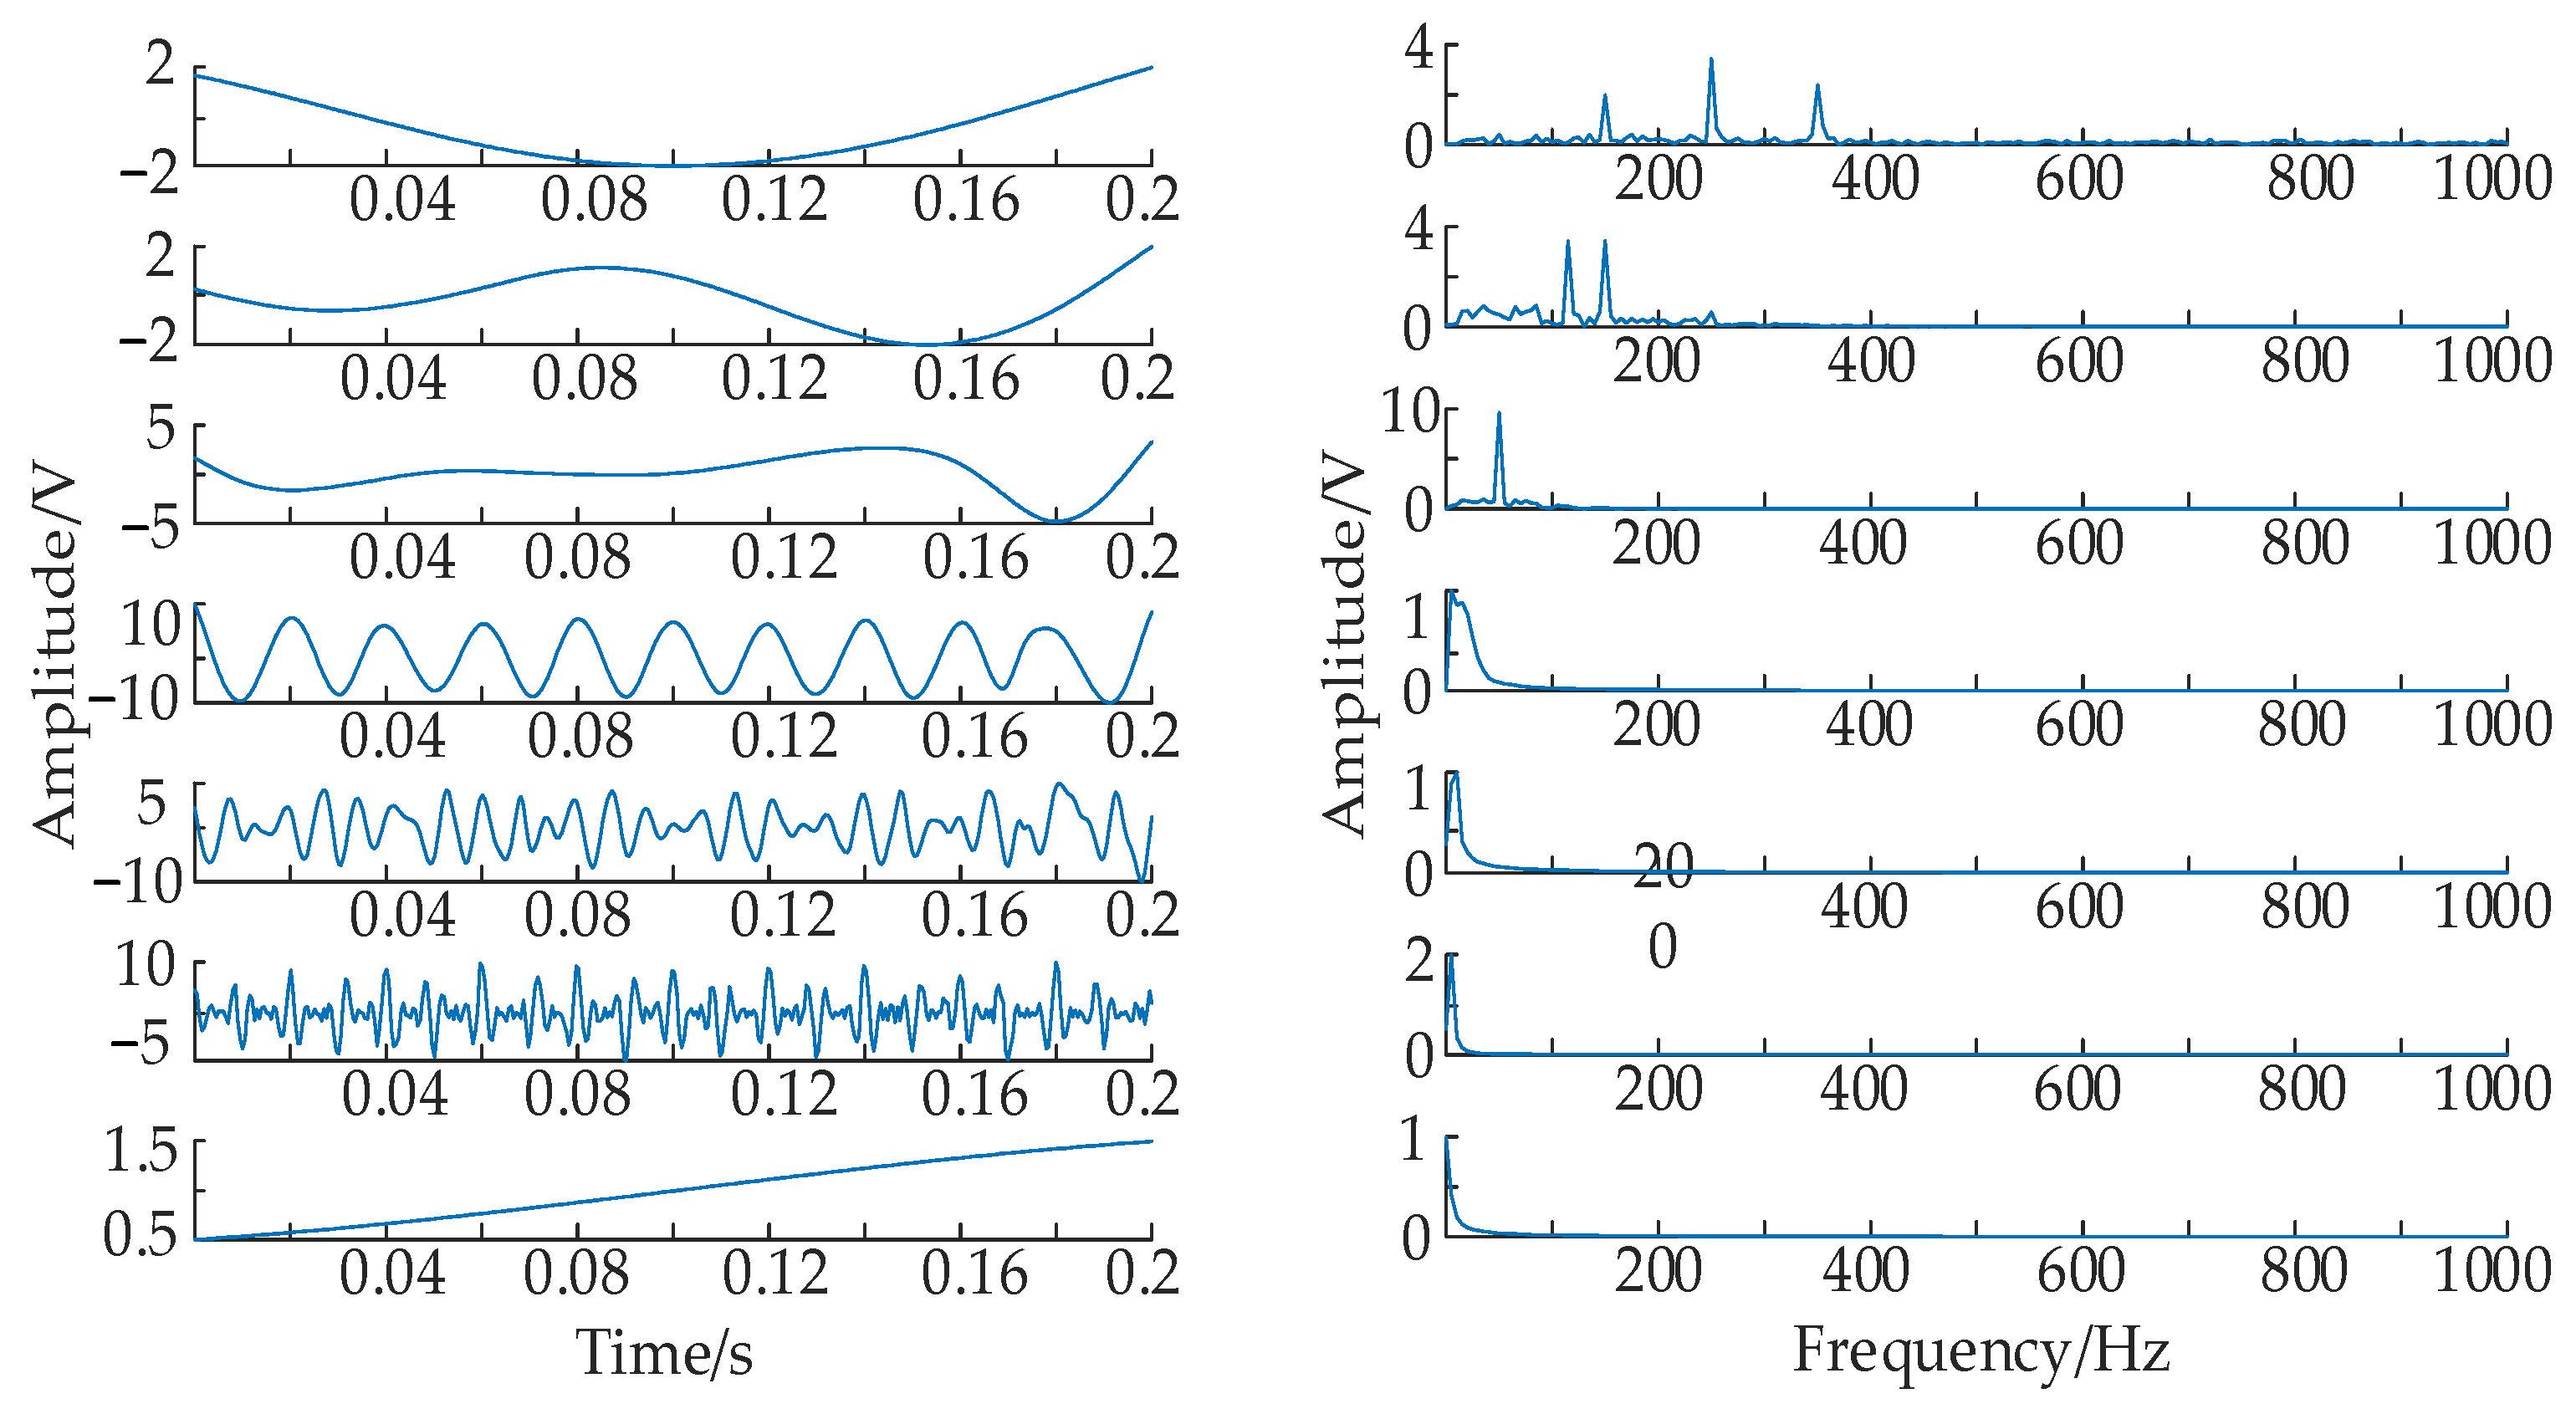
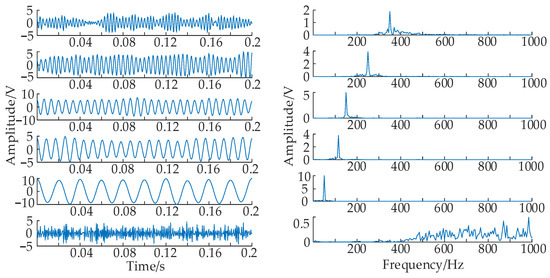
The TTAO algorithm outputs a modal decomposition count of 5.1. To prevent over-decomposition, the fractional part is rounded down. The penalty factor employs rounding to handle decimal places. Taking the number of decomposition layers as five and that of the penalty factor as 4878, decomposition is performed by VMD, and its decomposition results are compared with the PSO-VMD and EMD results, and the comparison is shown in Figure 6, Figure 7 and Figure 8.
Figure 6.
TTAO-VMD waveforms and spectrograms.
Figure 7.
EMD waveforms and spectrograms.
Figure 8.
PSO-VMD waveforms and spectrograms.
To select IMF components for signal reconstruction, the Pearson correlation coefficient between each IMF component extracted from the TTAO-VMD model and the original signal is calculated. Based on industry practice and experimental validation, the benchmark threshold is set at 0.3. However, in low signal-to-noise ratio scenarios (10–20 dB), noise reduces the correlation of harmonic IMF components. Therefore, the threshold should be appropriately lowered to prevent the erroneous deletion of weak-amplitude harmonics. Typically, the threshold is reduced to approximately 0.2. As can be seen from Table 4, the minimum correlation coefficient recorded was 0.19. Evidently, to prevent erroneous deletion of weak harmonics, this component should be regarded as a valid component.
Table 4.
The TTAO-VMD model decomposes the correlation coefficients of each mode.
From the correlation coefficients in the table, it can be seen that all the signals obtained from the decomposition are effective components, which shows the efficiency of the method in this paper. The effective components are selected for reconstruction. The waveform and spectrum of the reconstructed signal are shown in Figure 9.
Figure 9.
Reconstruction of signal waveforms and spectrograms.
As can be seen from Figure 9, the signal is processed by the denoising algorithm to obtain better results, although there are certain burrs, but the dominant frequency is successfully extracted, and the overall signal, compared to the dyed-noise signal, is smoother, proving the effectiveness of the method in this paper.
A low-order Prony algorithm model may result in underfitting, whilst an excessively high-order model may induce overfitting. In this paper, following TTAO-VMD processing, the noise content within the harmonic signal is rendered negligible, exerting minimal influence on the Prony algorithm’s parameter identification ability. Consequently, a second-order Prony model is sufficient to achieve high identification accuracy whilst effectively preventing the introduction of spurious components. Prony parameter identification is performed on the signal, and the results of the identification of this paper’s method are compared with those of the PSO-VMD method and the EMD method.
Upon reviewing the identification results, it is observed that the average frequency identification error outperforms the average amplitude identification error. Specifically, the average frequency identification error for the EMD method is 0.081%, while its average amplitude identification error stands at 3.168%. In comparison, the PSO-VMD method exhibits an average frequency identification error of 0.089% and an average amplitude identification error of 5.876%. The method proposed in this paper achieves a frequency identification error of 0.055% and an average amplitude identification error of 3.085%. Although the frequency and amplitude identification results in Table 5 and Table 6 are numerically close, their subtle differences hold significant practical importance in engineering applications. Frequency accuracy directly impacts resonance point identification and filter design, particularly at sharp points in the impedance curve of new energy systems, where even a 0.02 Hz deviation may alter resonance risk assessment conclusions. Amplitude accuracy directly relates to total harmonic distortion (THD) calculations and compliance assessments for individual harmonic limits. According to the IEEE 519-2022 standards, measurement errors of 2–5% can lead to misjudgements when harmonic amplitudes are at their limit thresholds. The methodology presented herein maintains an average frequency error of 0.055% and an average amplitude error of 3.085% even under 20 dB noise conditions, outperforming comparative approaches. This provides a more reliable data foundation for harmonic mitigation and standard compliance assessments.
Table 5.
Frequency identification results of different methods.
Table 6.
Amplitude identification results of different methods.
6.3. Transient Signal Analysis
To further validate the detection capability of the proposed method for short-time harmonic signals, the following transient harmonic signals are constructed:
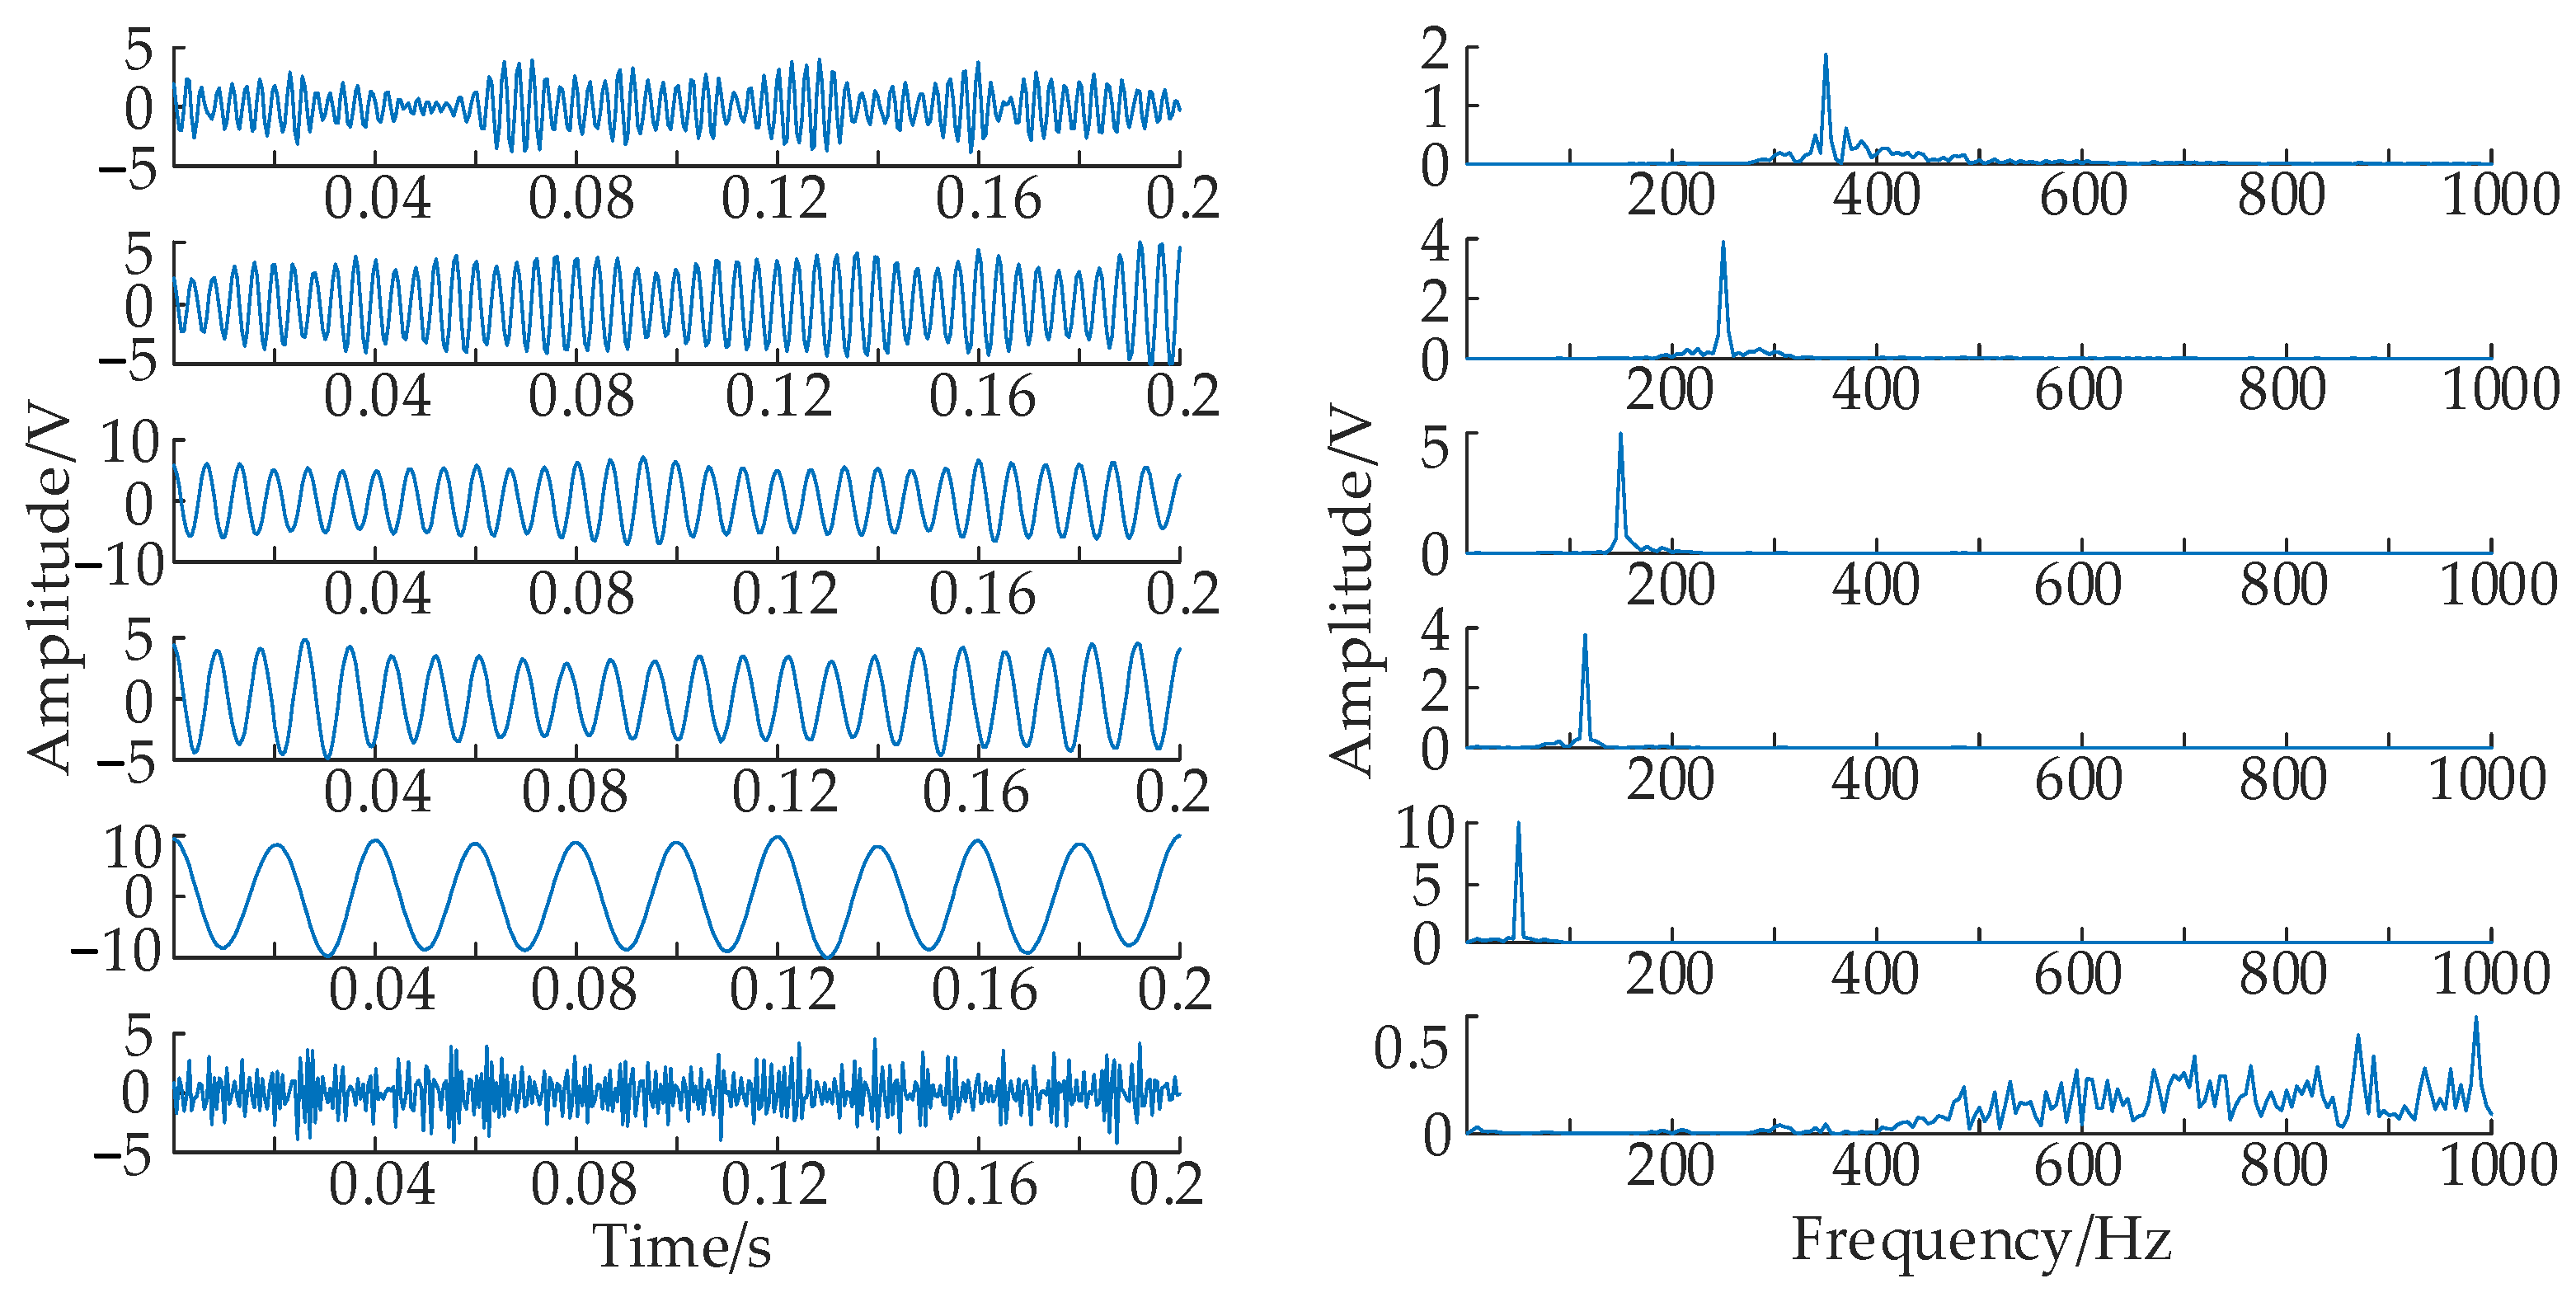
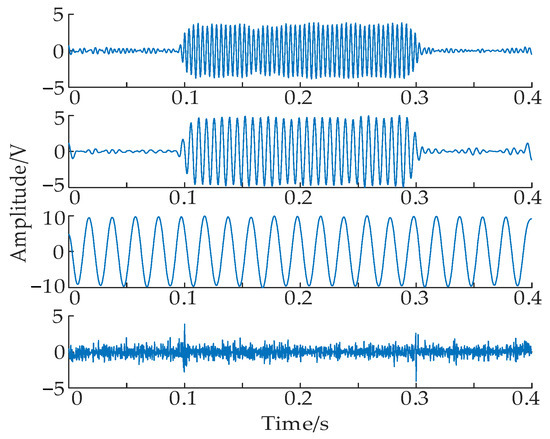
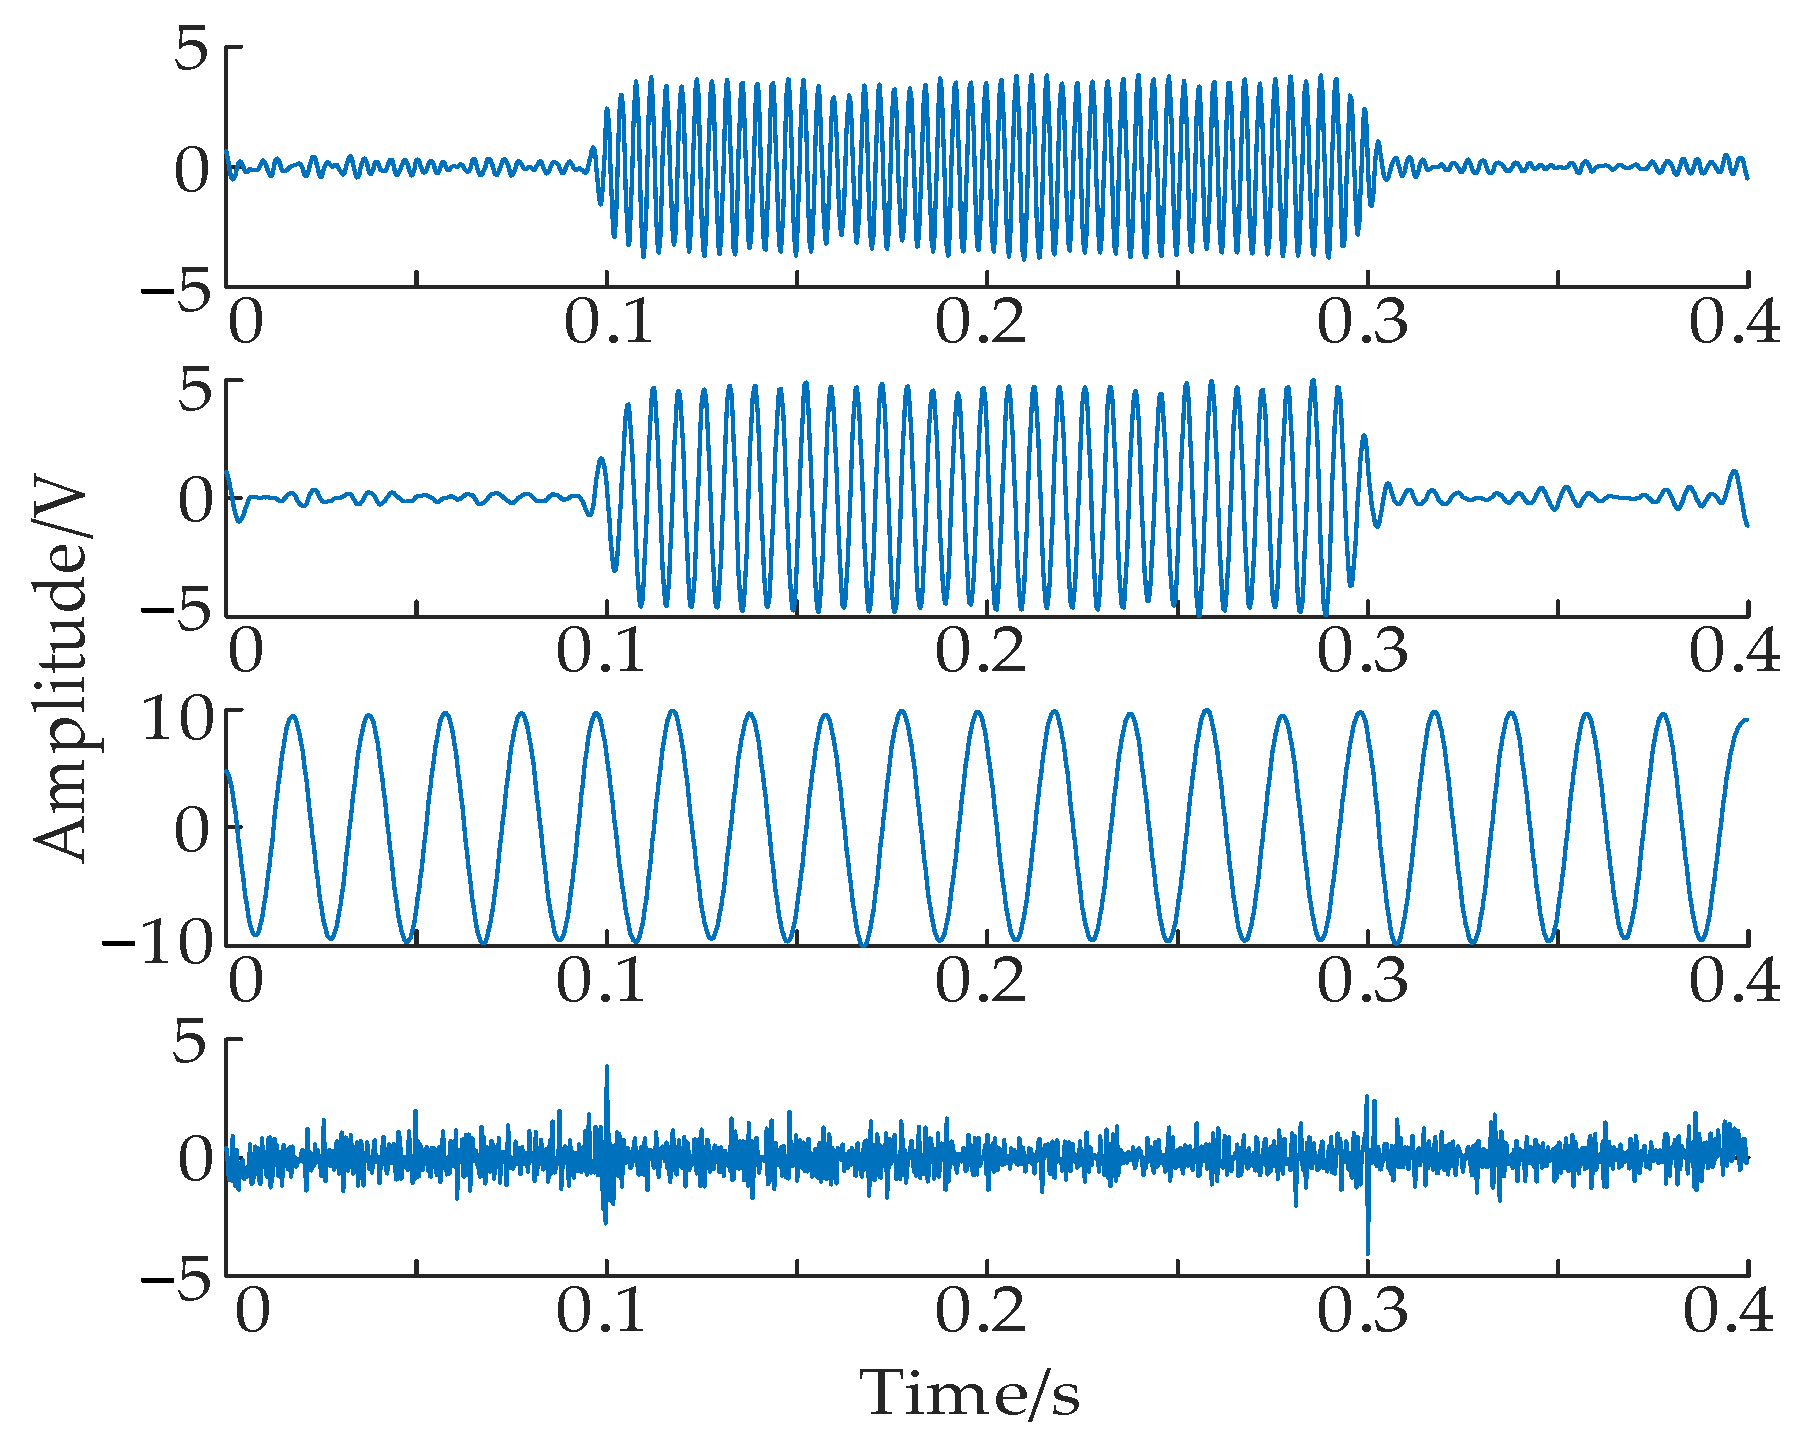
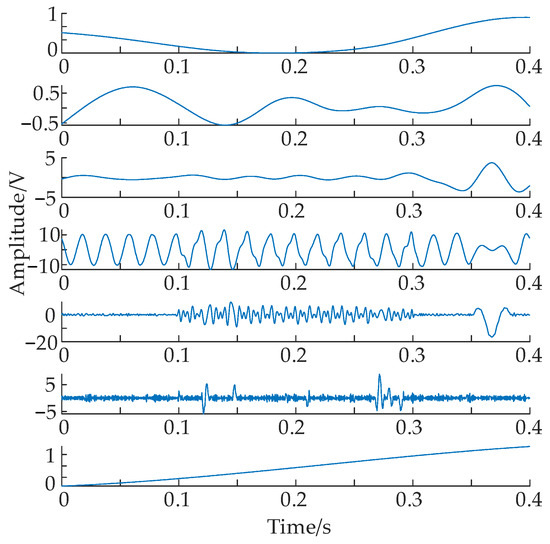
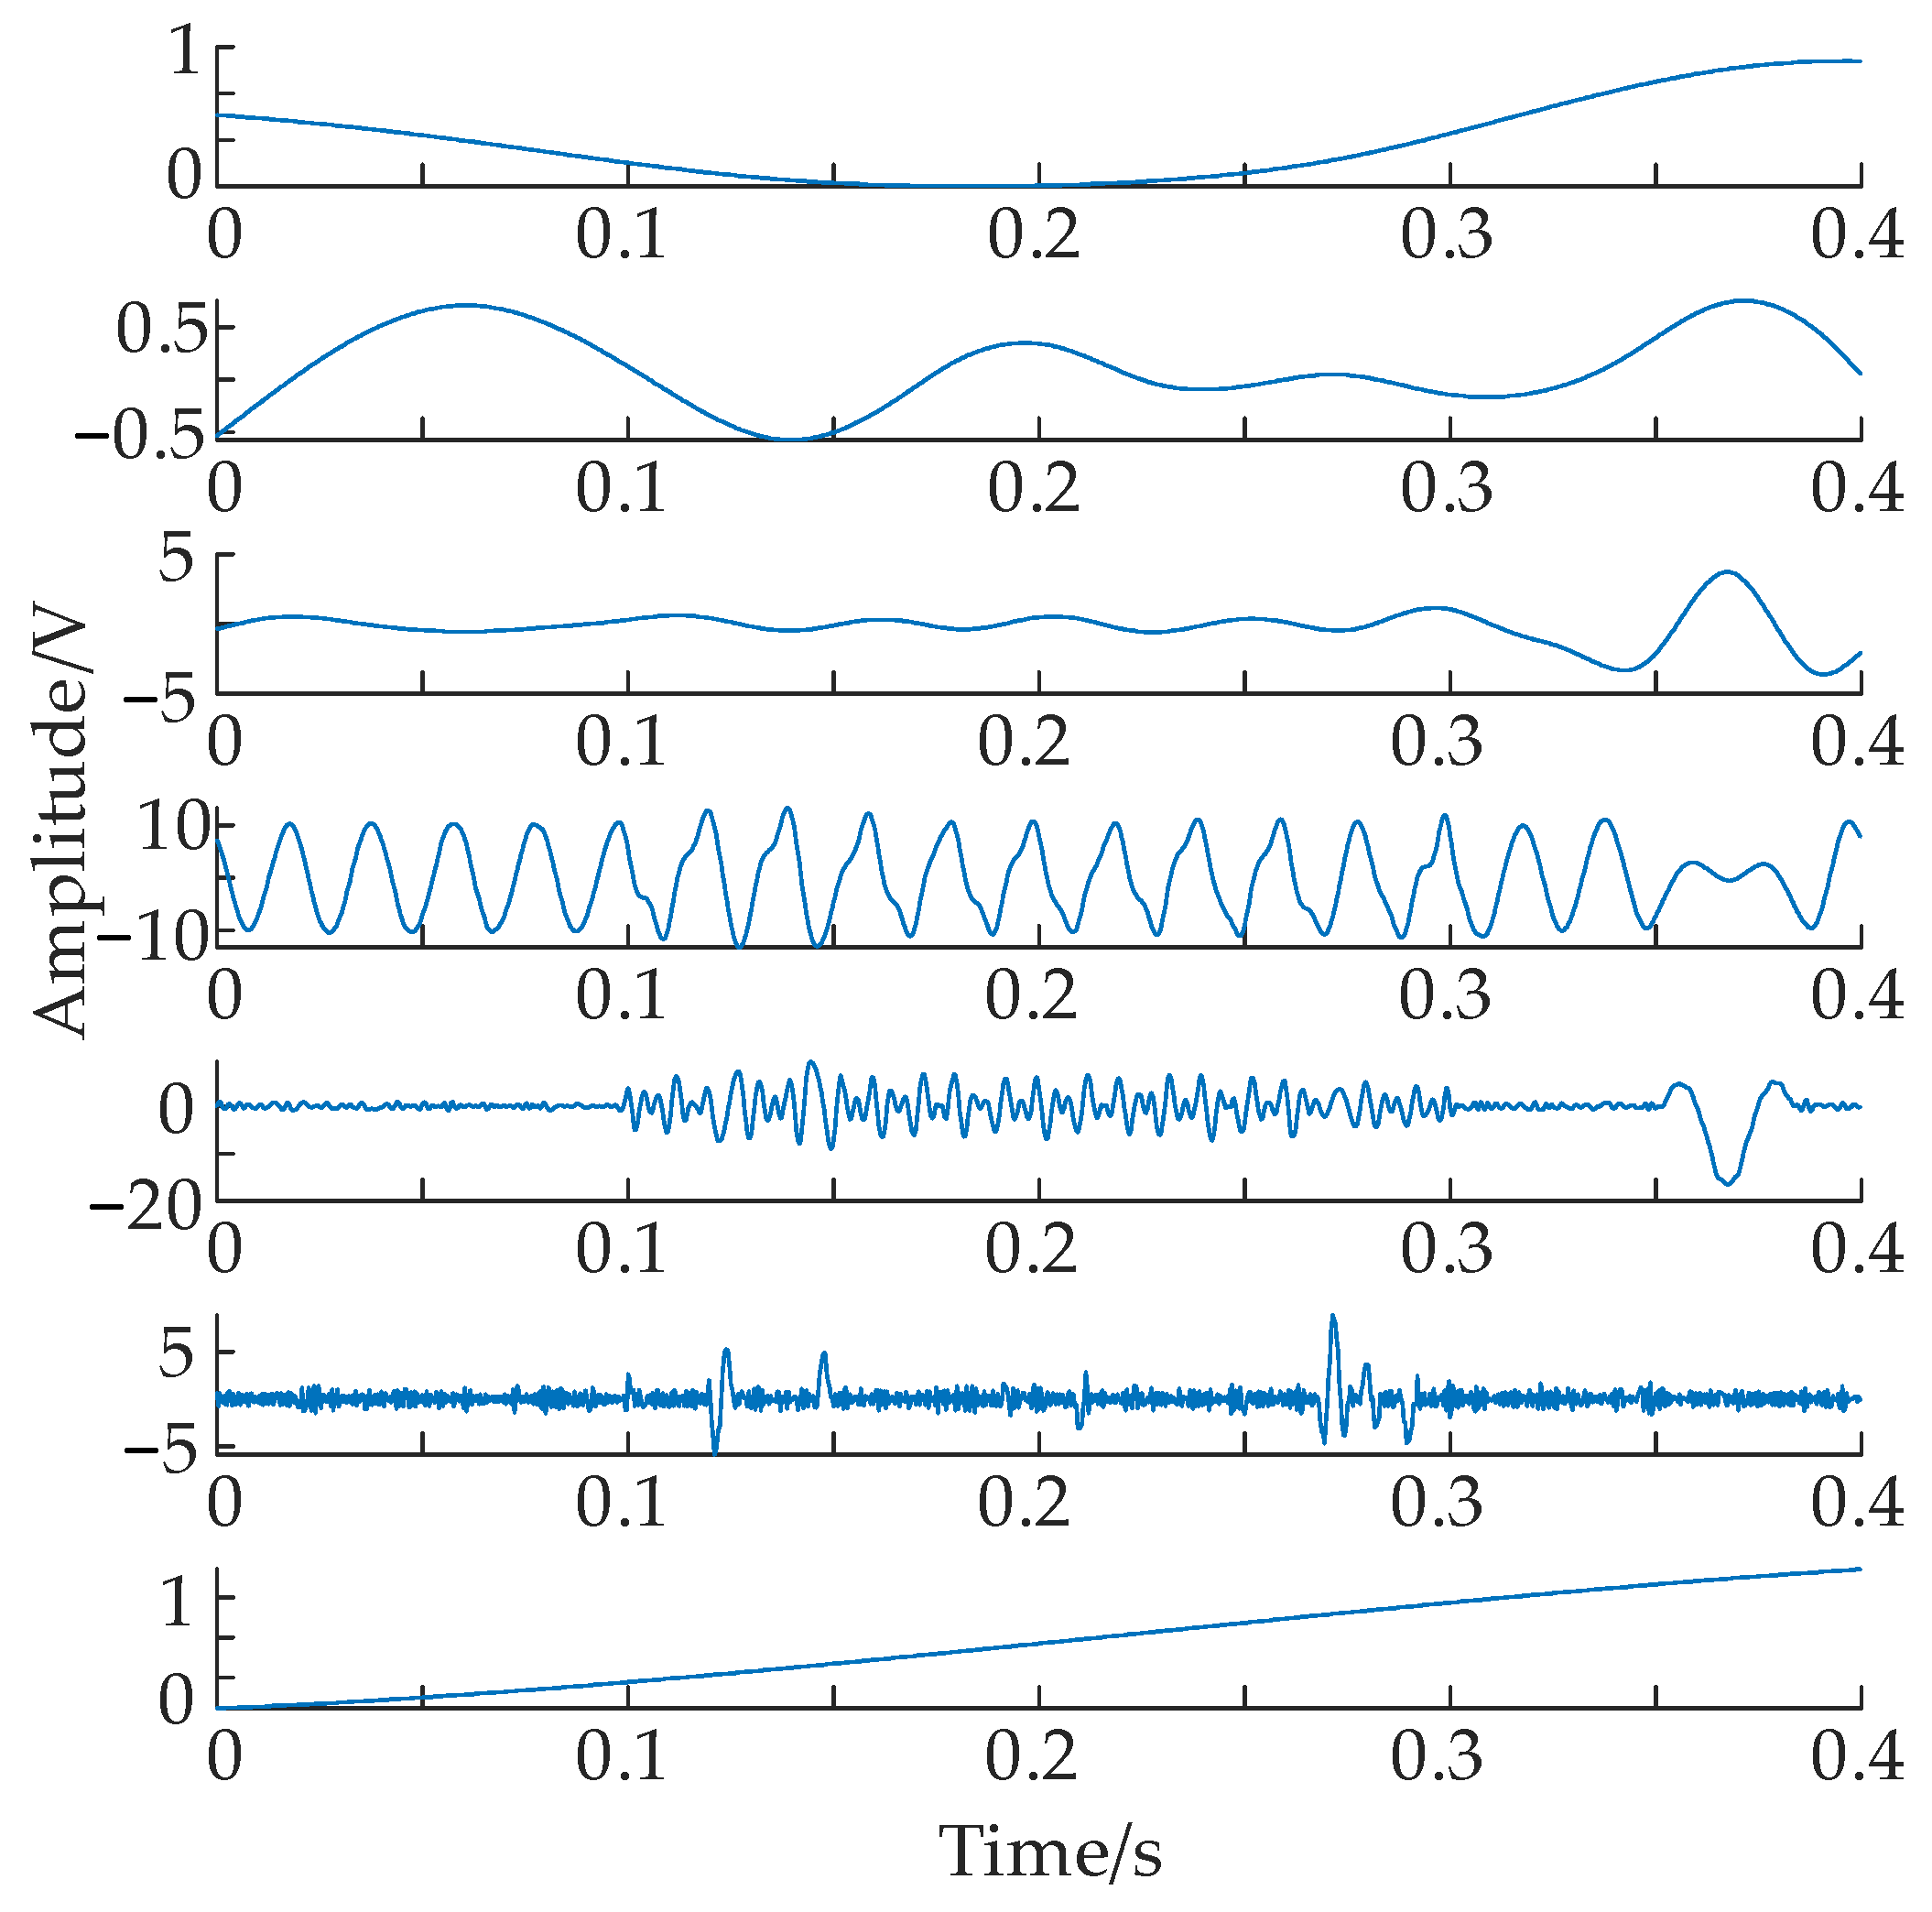
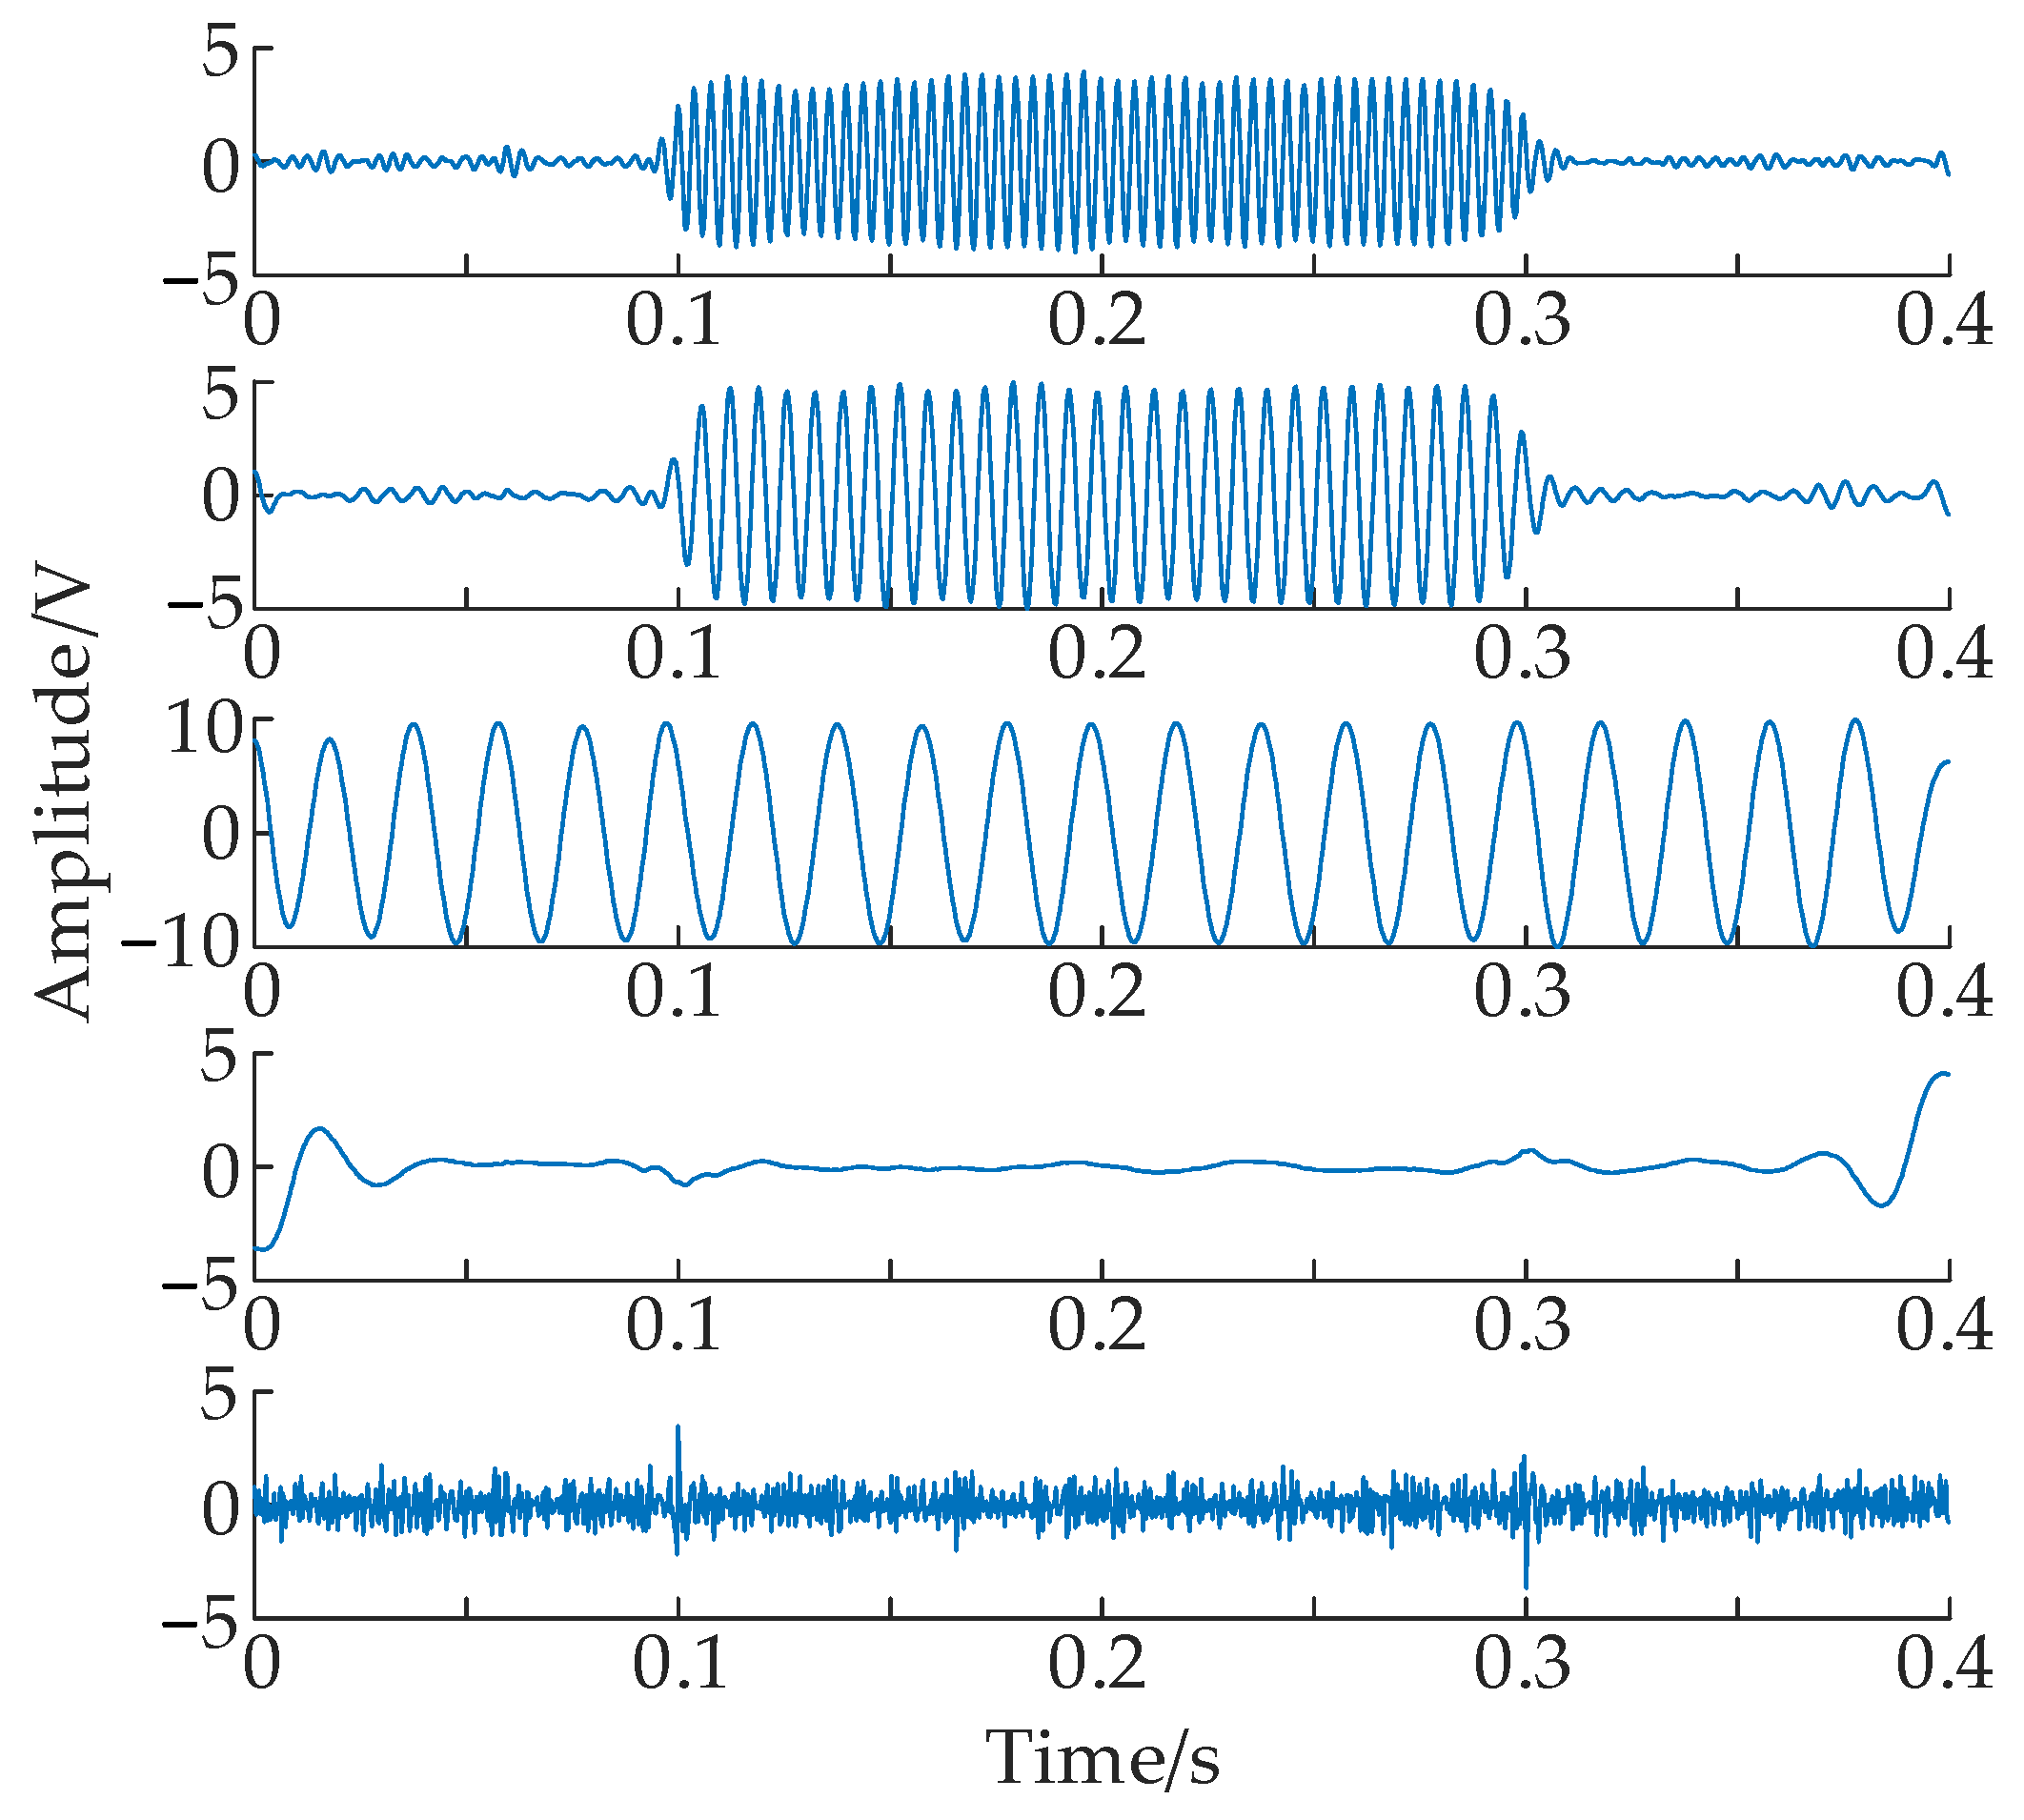
The sampling frequency is 3000 Hz. The number of samples (N) is 1200, and the original signal is added with 15 dB of Gaussian white noise. Decomposition of the original signal using TTAO-VMD, EMD, and PSO-VMD is performed, and the results are shown below.
As can be seen from Figure 10, Figure 11 and Figure 12, the decomposition effect of this paper’s method and the PSO-VMD method is obviously due to the EMD method, and both of them can clearly extract the effective signal components. Comparing this paper’s method and the PSO-VMD method, it can be seen that the PSO-VMD method has an obvious spectral leakage phenomenon, and the Prony identification results further support this fact. In contrast, the method proposed in this paper performs better in this aspect and can effectively separate the transient components, and the specific identification results are shown in the following table and are consistent with the characteristics of the decomposition results shown above. As shown in Table 7 and Table 8, the parameter identification performance of the proposed method significantly outperforms that of the EMD and PSO-VMD approaches. Overall, the frequency parameter identification error is markedly smaller than the amplitude parameter identification error, a result dictated by the practical conditions of power systems and the inherent characteristics of the identification algorithms themselves. Specifically, regarding the frequency identification error, the average error for the proposed method is 0.270%. This represents reductions of 82% and 47% compared to the EMD (1.526%) and PSO-VMD (0.516%) methods, respectively. Regarding magnitude identification error results, the average identification error of the proposed method is 1.130%. Compared with the EMD method (7.885%) and the PSO-VMD method (4.920%), the identification error is reduced by 85% and 77%, respectively, demonstrating significant effectiveness.
Figure 10.
TTAO-VMD.
Figure 11.
EMD diagram.
Figure 12.
PSO-VMD.
Table 7.
Results of transient signal frequency parameter identification.
Table 8.
Results of transient signal amplitude parameter identification.
To evaluate the real-time processing performance of different algorithms, the average runtime for processing the same set of signals on identical hardware platforms (MATLAB 2022a) was compared. The specific operational data is shown in Table 9.
Table 9.
Average runtimes using different models.
Although the computational time of TTAO-VMD exceeds that of fixed-parameter VMD, it achieves approximately 44% time savings compared to PSO-VMD owing to its faster convergence rate. Its computational cost is primarily expended on implementing parameter adaptation, a necessary trade-off for novel renewable energy harmonic scenarios where characteristics remain unknown. For applications demanding stringent real-time performance, we recommend adopting an “offline optimization, online deployment” strategy. This entails determining the optimal parameter set offline using this method and directly applying it during online monitoring.
7. Conclusions
This paper presents a harmonic detection framework for high-penetration renewable energy power systems by integrating an improved Triangulation Topology Aggregation Optimizer (TTAO) with Variational Mode Decomposition (VMD) and the Prony algorithm. Its core contribution is establishing a parameter-adaptive and automated process, where TTAO intelligently optimizes the critical VMD parameters (K and α), thereby significantly enhancing the method’s robustness against noise and dynamic signal variations compared to traditional trial-and-error approaches.
Simulation results on both steady-state and transient harmonics confirm the framework’s superior accuracy and noise immunity. This demonstrates its practical potential for dynamic, noisy grid environments typical of modern renewable integration. While the optimization step increases the computational load, this can be mitigated in practice through pre-computed parameter sets or hardware acceleration, facilitating its path toward online monitoring applications.
8. Limitations and Future Work
While the proposed TTAO–VMD–Prony method demonstrates promising results in simulations, this study has several limitations. First, validation relies entirely on synthetic signals with additive Gaussian white noise, which may not fully capture the complexity of real-world noise, measurement distortions, and non-stationary transients encountered in actual renewable energy plants. Second, the method’s performance under highly dynamic conditions—such as during faults with rapidly evolving harmonics or with closely spaced interharmonics—requires further investigation. Third, the computational cost of the iterative optimization process may limit its current suitability for real-time, high-speed applications.
Future research will focus on the following directions to address these limitations and enhance the method’s practicality: Firstly, apply the method to field measurements from microgrids or PV/wind farms to assess its robustness and accuracy under realistic conditions. Secondly, develop strategies to improve tracking capability for fast-changing harmonics and the separation of spectrally dense components. Then, investigate methods to reduce the algorithm’s computational burden, such as using pre-computed parameter lookup tables or simplified models, to explore its potential for real-time implementation. Finally, expand the framework to three-phase system analysis, voltage harmonic assessments, and other power quality disturbances.
Author Contributions
Conceptualization, C.G. and Q.J.; Methodology, Y.Z. and C.G.; Validation, D.C.; Resources, G.Y.; Writing – review & editing, C.G.; Visualization, J.Q. All authors have read and agreed to the published version of the manuscript.
Funding
This research received no external funding.
Data Availability Statement
The original contributions presented in this study are included in the article. Further inquiries can be directed to the corresponding author.
Conflicts of Interest
Authors Yao Zhong, Guangrun Yang, Jiaqi Qi, Dongyan Chen and Qihao Jin were employed by Metering Centre of Yunnan Power Grid Co. The remaining author declares that the research was conducted in the absence of any commercial or financial relationships that could be construed as a potential conflict of interest.
Appendix A
Table A1.
Step-by-step algorithm for the improved TTAO algorithm.
References
- Li, F.; Zhang, Y.; Feng, Q.; Liu, Y.; Zhang, X.; Ma, M. Comprehensive Design of Active Damper for Suppression of Harmonic Resonance in Renewable Energy System. Electr. Power Syst. Res. 2025, 245, 111564. [Google Scholar] [CrossRef] [Scilit]
- Zhong, F.; Xie, S.; Peng, Y.; Wang, H. Harmonic Resonance Evaluation and Suppression of Railway Power Conditioner-Network-Train Coupling System. Int. J. Electr. Power Energy Syst. 2024, 161, 110182. [Google Scholar] [CrossRef] [Scilit]
- Nabian Dehaghani, M.; Korõtko, T.; Rosin, A. Power Quality Improvement in DG Based Distribution Systems: A Review. Renew. Sustain. Energy Rev. 2026, 225, 116184. [Google Scholar] [CrossRef] [Scilit]
- Teixeira, M.O.N.; Melo, I.D.; Filho, J.A.P. An Optimisation Model Based Approach for Power Systems Voltage Stability and Harmonic Analysis. Electr. Power Syst. Res. 2021, 199, 107462. [Google Scholar] [CrossRef] [Scilit]
- IEEE 519-2022; IEEE Standard for Harmonic Control in Electric Power Systems. IEEE Standards Association: Piscataway, NJ, USA, 2022.
- Deng, Y.; Zhao, G.; Zhu, K.; Zhou, T.; Xu, Z. NCAFI: Nuttall Convolution Window All-Phase FFT Interpolation-Based Harmonic Detection Algorithm for Infrared Imaging Detection. Infrared Phys. Technol. 2022, 125, 104310. [Google Scholar] [CrossRef] [Scilit]
- Maurya, I.; Gupta, S.K.; Maurya, P. An Efficient Harmonic Detection Approach for Shunt Active Filter Based on Wavelet Transform. Ain Shams Eng. J. 2018, 9, 2833–2839. [Google Scholar] [CrossRef] [Scilit]
- Ren, Y.; Liang, J.; Zhang, S.; Guo, X.; Cheng, Y. Harmonic Direction Identification of New Energy Stations Based on Instantaneous Reactive Power Theory and Harmonic Power. In Proceedings of the 2022 International Conference on Wireless Communications, Electrical Engineering and Automation (WCEEA), Indianapolis, IN, USA, 15–16 October 2022; IEEE: Indianapolis, IN, USA, 2022; pp. 58–62. [Google Scholar]
- Lima, É.M.; Brito, N.S.D.; Souza, B.A.D. High Impedance Fault Detection Based on Stockwell Transform and Third Harmonic Current Phase Angle. Electr. Power Syst. Res. 2019, 175, 105931. [Google Scholar] [CrossRef] [Scilit]
- Shukla, S.; Mishra, S.; Singh, B. Power Quality Event Classification Under Noisy Conditions Using EMD-Based De-Noising Techniques. IEEE Trans. Ind. Inf. 2014, 10, 1044–1054. [Google Scholar] [CrossRef] [Scilit]
- Shi, J.; Liu, Z. Harmonic Detection Technology for Power Grids Based on Adaptive Ensemble Empirical Mode Decomposition. IEEE Access 2021, 9, 21218–21226. [Google Scholar] [CrossRef] [Scilit]
- Liu, Z.; Li, M. An Early Fault Characteristics Analysis Method of Reactor Canned Motor Pump Based on Signal Enhancement Hilbert Transform and Complete Ensemble Empirical Mode Decomposition with Optimized Adaptive Noise. Measurement 2025, 255, 118035. [Google Scholar] [CrossRef] [Scilit]
- Zhou, J.; Luo, R.; Huang, J. White Noise Suppression Method of Partial Discharge Ultrasonic Signal of Transformer Based on Improved Wavelet Threshold-CEEMDAN. High Volt. Appar. 2024, 60, 163–171. [Google Scholar] [CrossRef]
- Li, S.; Zhu, X.; Zhou, D. Power Quality Disturbance Signal Denoising and Detection Based on Improved DBO-VMD Combined with Wavelet Thresholding. Electr. Power Syst. Res. 2025, 238, 111193. [Google Scholar] [CrossRef] [Scilit]
- Li, C.; Gao, Y.; Xiang, N.; Zhang, Y.; Chen, Z. A Two-Stage Decomposition Method for Harmonic Detection Using UWPT and Spectral Envelope Prior-Assisted VMD. IEEE Trans. Instrum. Meas. 2025, 74, 1–14. [Google Scholar] [CrossRef] [Scilit]
- Wang, X.; Wang, S.; Ren, J.; Jing, W.; Shi, M.; Zheng, X. A Novel Harmonic Detection Method for Microgrids Based on Variational Mode Decomposition and Improved Harris Hawks Optimization Algorithm. IEEE Access 2024, 12, 60797–60807. [Google Scholar] [CrossRef] [Scilit]
- Wen, C.; Ding, J.; Xiao, M. A Modified ROHO-VMD and AKF-Based Framework for Accurate Harmonic Detection. Electr. Power Syst. Res. 2025, 248, 111948. [Google Scholar] [CrossRef] [Scilit]
- Steczek, M.; Chudzik, P.; Lewandowski, M.; Szelag, A. PSO-Based Optimization of DC-Link Current Harmonics in Traction VSI for an Electric Vehicle. IEEE Trans. Ind. Electron. 2020, 67, 8197–8208. [Google Scholar] [CrossRef] [Scilit]
- Ghadami, S.; Moghiman, M. Control of Total Harmonic Distortion of Voltage with New Chaotic Simulated Annealing. In Proceedings of the 2007 International Conference on Electrical Engineering, Lahore, Pakistan, 11–12 April 2007; IEEE: Lahore, Pakistan, 2007; pp. 1–6. [Google Scholar]
- Arrieta Paternina, M.R.; Tripathy, R.K.; Zamora-Mendez, A.; Dotta, D. Identification of Electromechanical Oscillatory Modes Based on Variational Mode Decomposition. Electr. Power Syst. Res. 2019, 167, 71–85. [Google Scholar] [CrossRef] [Scilit]
- Li, H.; Wang, H.; Li, M. Verifiable Image Encryption via Undirected Graph Conduction and Sine-Logistic-Tent Fusion Chaotic System. Digit. Signal Process. 2026, 168, 105495. [Google Scholar] [CrossRef] [Scilit]
- Qin, Q.; Liang, Z.; Xu, Y. Image Encryption Algorithm Based on Logistic—Tent Chaotic Mapping and Bit Plane. J. Dalian Minzu Univ. 2022, 24, 245–252. [Google Scholar] [CrossRef]
- Shen, J.; Wang, Z.; Wang, Y.; Zhu, H.; Zhang, L.; Tang, Y. AGWO-PSO-VMD-TEFCG-AlexNet Bearing Fault Diagnosis Method under Strong Noise. Measurement 2025, 242, 116259. [Google Scholar] [CrossRef] [Scilit]
- Gong, J.; Liu, S. Harmonic Detection Method for Power System Based on Enhanced SVD and Prony. Electr. Eng. 2023, 5, 34–39. [Google Scholar] [CrossRef]
- Abed, J.N.; Abdoos, A.A.; Ebadi, A. A New Hybrid Intelligent Method for Short-Term Photovoltaic Power Forecasting Based on Combination of ELM, VMD and PCA. Electr. Power Syst. Res. 2026, 250, 112104. [Google Scholar] [CrossRef] [Scilit]
- Tang, Q.; Huang, J.; Zhu, B.; Yu, J.; Liang, C.; Li, J. Time-Varying Harmonic Analysis Method Based on Adaptive Frequency-Shift Filtering for Power Systems. Electr. Power Syst. Res. 2025, 238, 111177. [Google Scholar] [CrossRef] [Scilit]
- Liu, Y.; Long, Y.; Xue, C.; Liu, M.; Zhou, Y. Adaptive RPSO-VMD-CatBoost Framework for Traction Motor Fault Diagnosis. Electr. Power Syst. Res. 2026, 250, 112172. [Google Scholar] [CrossRef] [Scilit]


Disclaimer/Publisher’s Note: The statements, opinions and data contained in all publications are solely those of the individual author(s) and contributor(s) and not of MDPI and/or the editor(s). MDPI and/or the editor(s) disclaim responsibility for any injury to people or property resulting from any ideas, methods, instructions or products referred to in the content. |
© 2025 by the authors. Licensee MDPI, Basel, Switzerland. This article is an open access article distributed under the terms and conditions of the Creative Commons Attribution (CC BY) license.