


Abstract
High-altitude Andean páramo ecosystems are critical socio-ecological assets that provide key regulating and supporting services, yet they remain highly vulnerable to climate change and anthropogenic pressures. Understanding these services requires frameworks that integrate biophysical capacity with social valuation and demographic accessibility. In this study, we mapped and assessed belowground and aboveground carbon storage and species habitat provision across the altitudinal gradient (3160–4400 m.a.s.l.) of Cajas National Park (PNC), Ecuador, using a spatially explicit socio-ecological approach. Carbon stocks were modeled following The Intergovernmental Panel on Climate Change (IPCC) 2019 Refined Guidelines, combining reference soil organic carbon (SOC) stocks with aboveground biomass coefficients. Habitat provision was modeled through a multi-factor suitability index integrating Normalized Difference Vegetation Index (NDVI), elevation, water bodies, and interpolated climate surfaces. Biophysical supplies were weighted via a Delphi-based expert consultation and integrated with demographic census data (173,672 inhabitants in four adjacent parishes) to estimate actual service capture and effective benefits. Total carbon stocks in PNC were estimated at 1.49 million Mg C, with volcanic Andisols acting as the primary reservoir (97.5% of the total stock). Habitat suitability was highly heterogeneous, with critical refuge patches clustered around the park’s lacustric network and stable microclimatic zones. Socio-ecological mapping revealed that the eastern boundary of the park represents the highest hotspot of effective benefit capture, directly supplying vital water regulation and cultural services to the peri-urban populations of Sayausí and Baños. These results demonstrate the utility of integrating standard IPCC guidelines with the ECOSER protocol, offering a repeatable and transparent framework to guide spatial conservation planning and sustainable land-use zoning in vulnerable high-altitude protected areas.
1. Introduction
High-altitude mountain ecosystems occupy a critical position in global sustainability, acting as sentinels of climate change and key suppliers of vital ecosystem services (ESs) for billions of people downstream [1,2,3,4]. Among these, the Andean páramo, a neotropical high-altitude alpine grassland ecosystem stretching across the Northern Andes, is exceptionally unique due to its biophysical properties [5,6,7]. Dominated by extreme organic matter accumulation and low temperatures that slow down decomposition, the páramo represents one of the most carbon-dense terrestrial ecosystems globally, storing massive amounts of organic carbon within its volcanic ash soils (primarily Andisols) [8,9,10,11]. Furthermore, its soils exhibit an extraordinary water retention capacity, often exceeding 80% water content at saturation, paired with low bulk density, making the páramo a natural hydrological sponge that regulates the freshwater supply for major Andean cities [12,13,14,15].
In addition to its regulating capacities, the páramo is a primary supporting ecosystem, recognized as a global hotspot of biodiversity and high-altitude endemism. In Ecuador alone, the páramo harbors approximately 1500 to 1524 species of vascular plants, of which more than 600–628 species are strictly endemic [4,9,16]. Covering only 5% of the national territory, this ecosystem accounts for nearly 30% of the country’s vascular plant diversity, providing critical habitats and refuge zones for specialized fauna, such as the spectacled bear (Tremarctos ornatus), the Andean condor (Vultur gryphus), and numerous endemic high-altitude amphibians [17,18,19]. In the Cajas National Park specifically, Ansaloni et al. [20] documented 666 vascular plant species across 264 genera and 89 botanical families, including the first records of Dichondra macrocalyx and Piptochaetium tovarii for Ecuador, underscoring the park’s exceptional phytodiversity.
Despite their ecological and hydrological materiality, páramo landscapes face escalating vulnerabilities. Climate-driven shifts, characterized by rising temperatures, altered precipitation regimes, and increased evapotranspiration, threaten to dry out organic-rich soils, potentially transforming these global carbon sinks into net emitters of carbon dioxide () [8,21,22,23,24]. In parallel, intense anthropogenic pressures, specifically agricultural encroachment, cattle grazing, paramo burning (quema de pajonales), and trout farming, degrade soil structure, compact porous volcanic matrices, and fragment natural wildlife corridors [25,26]. In Ecuador’s southern páramo, García et al. [27] found that approximately 50% of the native herbaceous páramo had been transformed into anthropogenic páramo over recent decades, driven by cycles of exploitation, abandonment, and inadequate regeneration. Similarly, Ross et al. [28] documented significant land-cover transitions in the páramo of south-central Ecuador between 1979 and 2014, with agricultural and pastoral encroachments advancing into the 3500–5000 m.a.s.l. elevation band. Guarders et al. [29] corroborated these patterns for northern Ecuador, showing that páramo stability was relatively high (0.75–0.90) but montane forests experienced a 40% reduction in the same period, with topographic factors as the primary driver of change. Villarreal-Veloz et al. [30] further demonstrated that NDVI-derived greenness of Ecuadorian tussock grasses is highly responsive to precipitation and soil temperature, suggesting that ongoing climate change will interact with land-use pressures to further depress primary productivity in páramo ecosystems.
Cajas National Park (PNC), located in the southern Austro region of Ecuador, is a premier representative of this high-altitude wetland and páramo matrix. Spanning more than 28,500 hectares, PNC has been recognized internationally as a Ramsar site since 2002 and as a UNESCO Biosphere Reserve since 2013 [31]. The park contains a complex lacustric network of more than 6000 water bodies, which act as the headwaters of the Tomebamba, Mazán, Yanuncay, and Migüir rivers. These basins are the main municipal water source for the metropolitan area of Cuenca (with over 600,000 inhabitants) and feed the Paute hydroelectric complex, which is vital for Ecuador’s national power grid.
To ensure the long-term conservation of PNC under the threats of climate change and human encroachment, robust spatial land-management and zoning strategies are needed. However, a significant research gap remains in mountain ecosystem management. Traditional ecosystem service assessments often focus solely on the biophysical supply of services (e.g., mapping total tons of carbon or species richness indices) without addressing how these services flow across space and are captured or valued by human societies [32]. The lack of integrated, spatially explicit models that connect biophysical supply, stakeholder perceptions, and demographic accessibility often leaves land managers with incomplete indicators, leading to subjective or ineffective conservation zoning.
To fill this gap, this study applies a comprehensive socio-ecological mapping approach to Cajas National Park. We integrate standard biophysical modeling with the collaborative ECOSER protocol [1,2] and a Delphi-based expert consultation framework. The specific objectives of this research are threefold: (1) to model and map the spatial distribution of carbon storage capacity (Soil Organic Carbon and vegetative biomass) across PNC using the IPCC 2019 Refined Guidelines; (2) to develop a multi-factor suitability index to map species habitat provision across the park’s altitudinal gradient; and (3) to weight and integrate these biophysical assets with stakeholder perceptions and demographic data from surrounding parishes (Baños, Sayausí, Chaucha, and Molleturo) to quantify and map the spatial hotspots of actual ecosystem service flows and effective human benefits. By bridging standardized biophysical accounting with socio-ecological valuation, this study provides a repeatable, transparent, and policy-aligned framework for sustainable land management in high-altitude protected areas.
2. Materials and Methods
2.1. Study Area
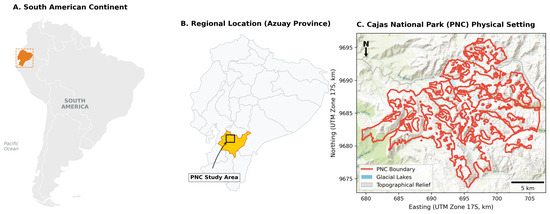
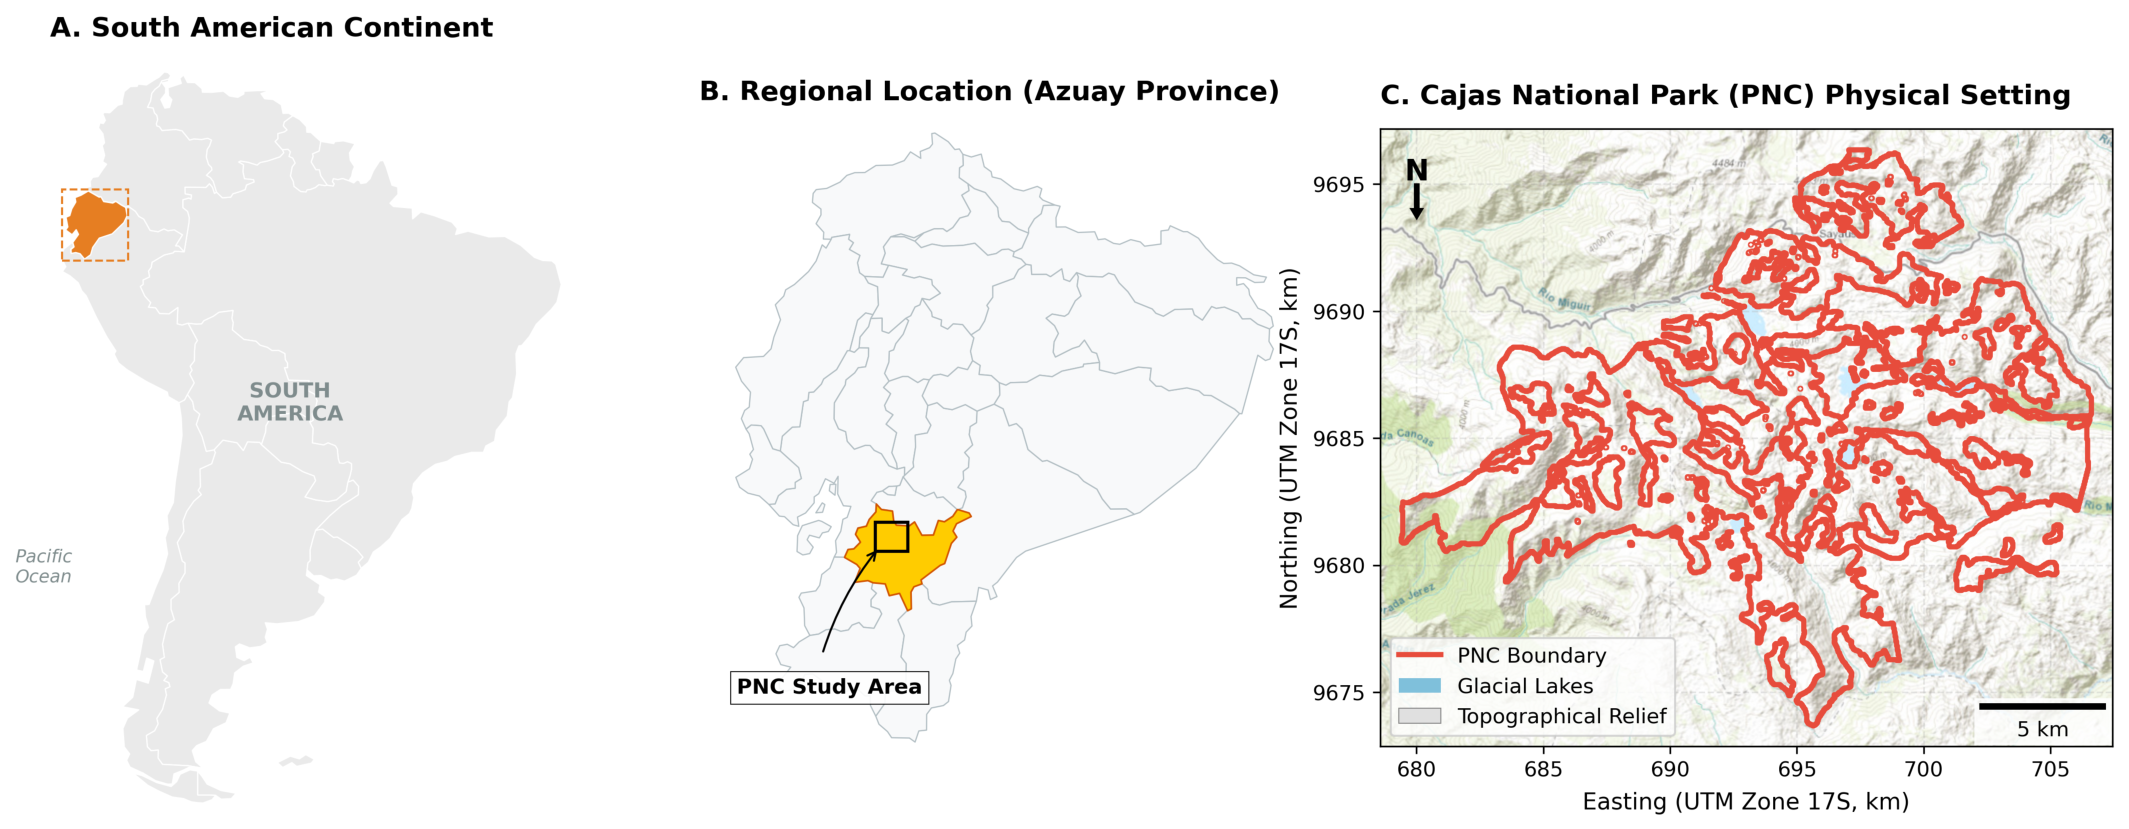
This research was conducted in Cajas National Park (PNC), located in the Western Cordillera of the southern Ecuadorian Andes, within the Azuay Province, Canton Cuenca (Figure 1). The park encompasses a total area of approximately 28,585.66 hectares, centered at coordinates 694,103.66 m E and 9,684,982.17 S (UTM WGS 84 Zone 17S). The elevation ranges along a steep gradient from 3160 m.a.s.l. at the lower valleys to a peak of 4400 m.a.s.l. at the high ridges, with a mean elevation of 3911.84 m.a.s.l.
Figure 1.
Geographic location and spatial extent of Cajas National Park.
The climate is classified as Equatorial High Mountain Climate (Clima Ecuatorial de Alta Montaña), characterized by low annual thermal amplitude and high daily temperature fluctuations. The mean annual temperature is 8 °C, and annual precipitation ranges between 1000 and 2000 mm. PNC’s geology is characterized by volcanic deposits of the Tarqui and Quimsacocha formations, which have developed thick organic soils belonging predominantly to the Andisol order (specifically Andosols, characterized by high alofane content, low bulk density, and extreme water retention). The primary vegetation cover is the shrubby and herbaceous páramo (pajonal), characterized by tussock grasses such as Calamagrostis spp. and Festuca spp., intermixed with cushion plants, high-altitude shrubs, and fragmented patches of native Polylepis forests.
Socio-Demographic Profile of Adjacent Communities
The four parishes directly bordering the park represent markedly contrasting demographic profiles, according to the VIII National Population and Housing Census of Ecuador (INEC, 2022) [33]. Baños (Canton Cuenca), located along the park’s eastern flank, is the most densely populated parish, with approximately 30,000 inhabitants, of whom roughly 51% are women and 49% are men, with a predominance of working-age adults (25–59 years). Agriculture, smallholder dairy farming, and floriculture are the primary livelihood activities in Baños. Sayausí parish, also on the eastern border, has approximately 15,000 inhabitants, with a significant proportion (around 28%) engaged in agricultural and livestock activities. In contrast, the western parishes of Chaucha and Molleturo are predominantly rural and sparsely populated, with approximately 1500 and 9000 inhabitants, respectively. Both parishes have high rates of agricultural dependence (over 60% of the economically active population) and are characterized by mestizo and indigenous communities with traditional land-use practices that include subsistence farming, extensive cattle grazing, and small-scale timber extraction. These socio-demographic contrasts directly shape the spatial heterogeneity of ecosystem service demand and benefit capture modeled in this study.
2.2. Data Sources and Spatial Pre-Processing
To implement the socio-ecological assessment, we compiled and harmonized a multi-source spatial database in QGIS (v3.44) [34], projected to the Universal Transverse Mercator (UTM) Zone 17S coordinate reference system. The primary datasets and pre-processing workflows were integrated across four key dimensions. First, for remote sensing and topographic assets, a cloud-free satellite image was acquired from the United States Geological Survey (USGS) EarthExplorer portal, specifically selecting the Landsat 8 Level-2, Collection 2, Tier 1 Surface Reflectance (SR) product (atmospherically corrected via the Land Surface Reflectance Code, LaSRC) [35]. This scene covers Path 11, Row 62, and was acquired on 24 July 2024, corresponding to the local dry season with less than 5% cloud cover, providing a standardized 30-m spatial resolution. In addition, a Digital Elevation Model (DEM) was obtained from the Advanced Land Observing Satellite (ALOS) Phased Array L-band Synthetic Aperture Radar (PALSAR) mission at an initial spatial resolution of 12.5 m [36]. This DEM was resampled to a standardized 30-m grid using bilinear interpolation in QGIS [34] to ensure strict spatial alignment with the Landsat imagery, and was subsequently utilized to extract topographic variables including absolute elevation, slope gradients, and aspect.
Second, government-vetted thematic layers were incorporated to characterize edaphic and vegetative patterns. Soil taxonomic order maps and Land-Use/Land-Cover (LULC) layers (2023 edition) were obtained at a 1:50,000 cartographic scale from the Ministry of the Environment, Water and Ecological Transition of Ecuador (MAATE) [37]. These spatial databases were utilized to identify soil taxonomic orders (predominantly Andisols, alongside Inceptisols, Alfisols, Entisols, and Mollisols) and map the spatial boundaries of native forests, high-altitude shrubby/herbaceous páramo (pajonal), agricultural zones, and water bodies.
Third, climatic surfaces were modeled to capture microclimatic gradients across the park. Long-term monthly precipitation and temperature records covering the 2023–2024 period were compiled from four regional meteorological stations managed by the National Institute of Meteorology and Hydrology (INAMHI) [38]: Sayausí, Labrado, Chanlud, and El Cajas. Continuous annual precipitation and temperature raster surfaces were generated across the PNC boundary using the Inverse Distance Weighting (IDW) spatial interpolation algorithm in QGIS with a power parameter () on a standardized 30-m grid [34,39].
Fourth, demographic census databases were integrated to represent beneficiary human systems. Parish-level population data were extracted from the National Institute of Statistics and Censuses (INEC) VIII National Population Census (2022/2023) [33]. Our socio-ecological capture models focused specifically on the four parishes directly adjacent to the park’s administrative boundaries: Chaucha, Molleturo, Sayausí, and Baños, which represent a total potential beneficiary population of 173,672 inhabitants.
2.3. Modeling Regulating Services: Carbon Storage
Following the IPCC 2019 Refined Guidelines for National Greenhouse Gas Inventories [40] (specifically Chapter 12 on Wetlands and Organic Soils), total carbon storage (, ) in each pixel was modeled as the sum of belowground Soil Organic Carbon () and Aboveground/Belowground Biomass Carbon ():
2.3.1. Soil Organic Carbon ()
The spatial modeling of SOC was performed by assigning reference soil organic carbon stocks () associated with the respective soil taxonomic orders, adjusted by land-use (), management (), and input () factors:
For PNC, the climatic region was designated as Tropical Montane. Reference carbon stocks () for a depth of 0–30 cm were assigned to each soil order based on the IPCC default reference table for tropical montane soils (Table 1):
Table 1.
Reference soil organic carbon stocks () for the 0–30 cm depth in Tropical Montane climates by soil order.
Since PNC is a highly protected national park under minimal human intervention, the correction factors , , and were set to 1.0 (representing native, undisturbed vegetation and natural nutrient input regimes). Concretely, the variables in Equation (2) correspond directly to the columns of Table 1: is the value in the third column (IPCC ) for the soil order identified in GIS; reflects the land-use type derived from the LULC layer (set to 1.0 for native páramo and forest); reflects the management practice (1.0 for conservation areas); and reflects organic input regime (1.0 for natural litter inputs). This one-to-one mapping ensures full spatial traceability from soil polygon to carbon density raster.
2.3.2. Biomass Carbon ()
The vegetative carbon stock (, ) was modeled by intersecting the LULC map with Tier 1 carbon stock coefficients for biomass in tropical montane ecosystems:
The vegetative biomass coefficients () applied across the distinct Land-Use/Land-Cover (LULC) classes within Cajas National Park were assigned based on standard Tier 1 carbon stock values for tropical montane ecosystems [8,14,40] (Table 2).
Table 2.
Vegetative biomass carbon stock coefficients () by LULC class in Cajas National Park.
The variables in Table 2 map directly to Equation (3) as follows: each LULC class polygon is assigned its corresponding value (third column), which is then multiplied by the pixel area (, in hectares) to yield in Mg C. The four LULC classes therefore produce four discrete biomass carbon density surfaces, which are spatially merged into the final raster used throughout the analysis.
2.4. Modeling Supporting Services: Species Habitat Provision
Ecosystem capacity to provide shelter, nutrient pathways, and breeding conditions for endemic high-altitude flora and fauna was modeled using a spatially explicit multi-factor suitability index (, dimensionless) based on key biophysical constraints [1,4,39]:
where each biophysical input raster is normalized to a continuous, dimensionless range of using a min-max scaling function to represent a linear gradient from zero suitability to maximum environmental capacity:
The individual suitability factors were selected to represent critical ecological niches within the high-altitude wetland matrix. First, vegetative greenness and primary productivity were captured using the Normalized Difference Vegetation Index (), which serves as a proxy for primary food supply and shelter. The index was calculated from the Landsat 8 OLI/TIRS bands according to the standard mathematical ratio:
The resulting raster was normalized (), where values closer to 1.0 represent high vegetative vigor (e.g., Polylepis forest canopy) and values closer to 0.0 represent bare soil or rock. Second, the altitudinal gradient () was modeled using the ALOS PALSAR DEM; higher elevations in Cajas National Park represent relatively undisturbed alpine zones that act as spatial refuges for cold-adapted endemic wildlife. Third, thermal stability () was extracted from the normalized interpolated annual temperature layer, where moderate, stable thermal zones represent optimal habitats, avoiding the physiological stress associated with extreme alpine freezing events. Fourth, the annual precipitation layer () was incorporated as a proxy for water input, as high precipitation maintains the hyper-humid conditions required by specialized páramo flora and amphibians. Fifth, freshwater proximity () was modeled by calculating the Euclidean distance from each pixel to the park’s extensive lacustric network and high-altitude wetlands, where pixels adjacent to lakes represent maximum suitability () due to immediate access to hydrological resources, and suitability decreases linearly with distance.
2.5. Socio-Ecological Integration: Flows and Benefits (The ECOSER Protocol)
To translate biophysical supply into socio-ecological metrics, we applied the ECOSER protocol combined with a Delphi-based expert consultation. This workflow was operationalized in three consecutive phases. In the first phase, we conducted an online Delphi consultation with a panel of environmental science and engineering stakeholders to establish the social valuation weights () for the modeled services [41]. The panel comprised 12 experts drawn from the fields of environmental engineering (), ecology and biology (), hydrology (), and geography/GIS (), all with demonstrable research or professional experience in Andean ecosystems. The consultation also incorporated structured survey responses from sixth-semester Environmental Engineering students at the Universidad Agraria del Ecuador (Students, ), providing an additional layer of applied academic perspective on the relative importance of the assessed services. On a scale of , where 0 indicates negligible importance and 1 indicates maximum importance, the experts assigned relative importance weights of for Soil Organic Carbon () storage (), for vegetative Biomass Carbon () storage (), and for Species Habitat Provision () ().
In the second phase, we modeled the relative flow () of ecosystem services across the park. The individual biophysical supply layers for each service j were first normalized to a common scale of using a min-max rescaling. The relative flow for each pixel i was then calculated as the weighted sum of these normalized biophysical supplies () and their corresponding social valuation weights () derived from the Delphi panel [5]:
Because the three Delphi weights (, , ) sum to 2.03 and the individual inputs are bounded on , the raw weighted sum can theoretically exceed 100. To obtain a final index that is interpretable on a standard scale, the raw weighted sum was subsequently rescaled using a second min-max normalization across all pixels within the park boundary. The reported values therefore represent the rescaled, bounded output of this two-step process.
In the third phase, we modeled the effective benefit capture (), representing the portion of the spatial flow that is actually captured or utilized by adjacent human communities. This was achieved by multiplying the relative flow () by a demographic capture coefficient () [2]:
The capture coefficient () represents a spatial proxy of human demand and accessibility, modeled as a function of the spatial proximity and demographic weight () of the four adjacent parishes:
where is the census population of parish p (Baños = 30,000, Sayausí = 15,000, Chaucha = 1500, and Molleturo = 9000), and represents the Euclidean distance from the center of pixel i to the administrative centroid of parish p, thereby penalizing service delivery with increasing distance.
2.6. Statistical Validation and Spatial Zonal Analysis
To analyze the spatial variability and homogeneity of carbon stocks and habitat provision, we conducted a spatial zonal analysis in QGIS using the LULC and soil order layers as zone boundaries. Standard descriptive statistics, including mean, sum, standard deviation (), and coefficient of variation (), were extracted for each zone to validate the model’s sensitivity to topographic and edaphic changes [39,42]. Sensitivity analysis was performed by perturbing input parameters () to calculate the propagation of uncertainty through the carbon and habitat models.
3. Results
3.1. Edaphic and Vegetative Characterization of Cajas National Park
Cajas National Park (PNC) covers a total of 28,585.66 hectares. The spatial and thematic analysis reveals that the park is dominated by volcanic ash-derived soils of the Andisol order. These soils cover approximately 96.8% of the terrestrial surface of the park, while other orders such as Inceptisols, Alfisols, Entisols, and Mollisols cover the remaining 3.2% in small localized pockets along the lower river valleys and steep peripheral cliffs [11,13,37].
The vegetation cover of PNC is heavily dominated by high-altitude pajonal (herbaceous and shrubby páramo), which accounts for 84.5% of the total land cover. This vegetation type forms a dense, continuous carpet of tussock grasses (mostly Calamagrostis spp. and Festuca spp.) interspersed with cushion plants and low woody shrubs [7,17]. Fragmented patches of native montane forest, predominantly composed of the genus Polylepis (known locally as “Árbol de Papel”), are scattered in sheltered valleys and rocky ravines, occupying approximately 2.1% of the park. The remaining area consists of the extensive lacustric network, which includes over 6000 lakes and high-altitude wetlands (covering 6.2% of the park), and bare soil/rock surfaces or anthropic areas (covering 7.2%) [16,43].
3.2. Quantification and Spatial Distribution of Carbon Stocks
By applying the IPCC 2019 Refined Guidelines for Tropical Montane climates, we estimated the spatial distribution of Soil Organic Carbon (SOC) and vegetative biomass carbon () across PNC. The total carbon stock within the park is estimated at approximately 1.49 million Mg C (1,490,000 metric tons of Carbon).
The spatial modeling reveals a massive asymmetry between belowground and aboveground carbon pools. The primary carbon reservoir is the soil, with a total belowground organic stock of 1.45 million Mg C (1,453,000 Mg C), representing 97.5% of the park’s total carbon capacity. In contrast, vegetative biomass carbon () represents only 2.5% of the total stock, amounting to approximately 37,000 Mg C (Table 3).
Table 3.
Zonal statistics of carbon storage capacity in Cajas National Park (PNC) based on the IPCC 2019 Refinement.
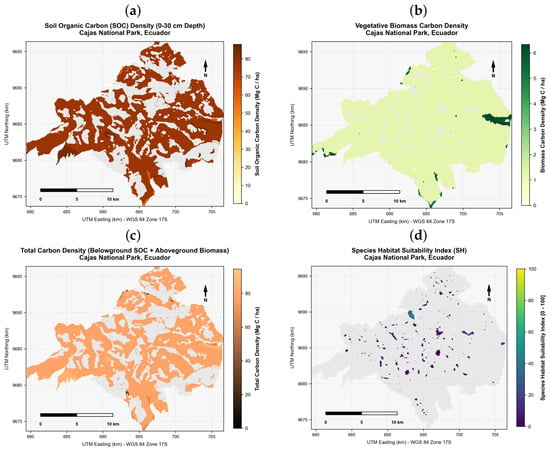
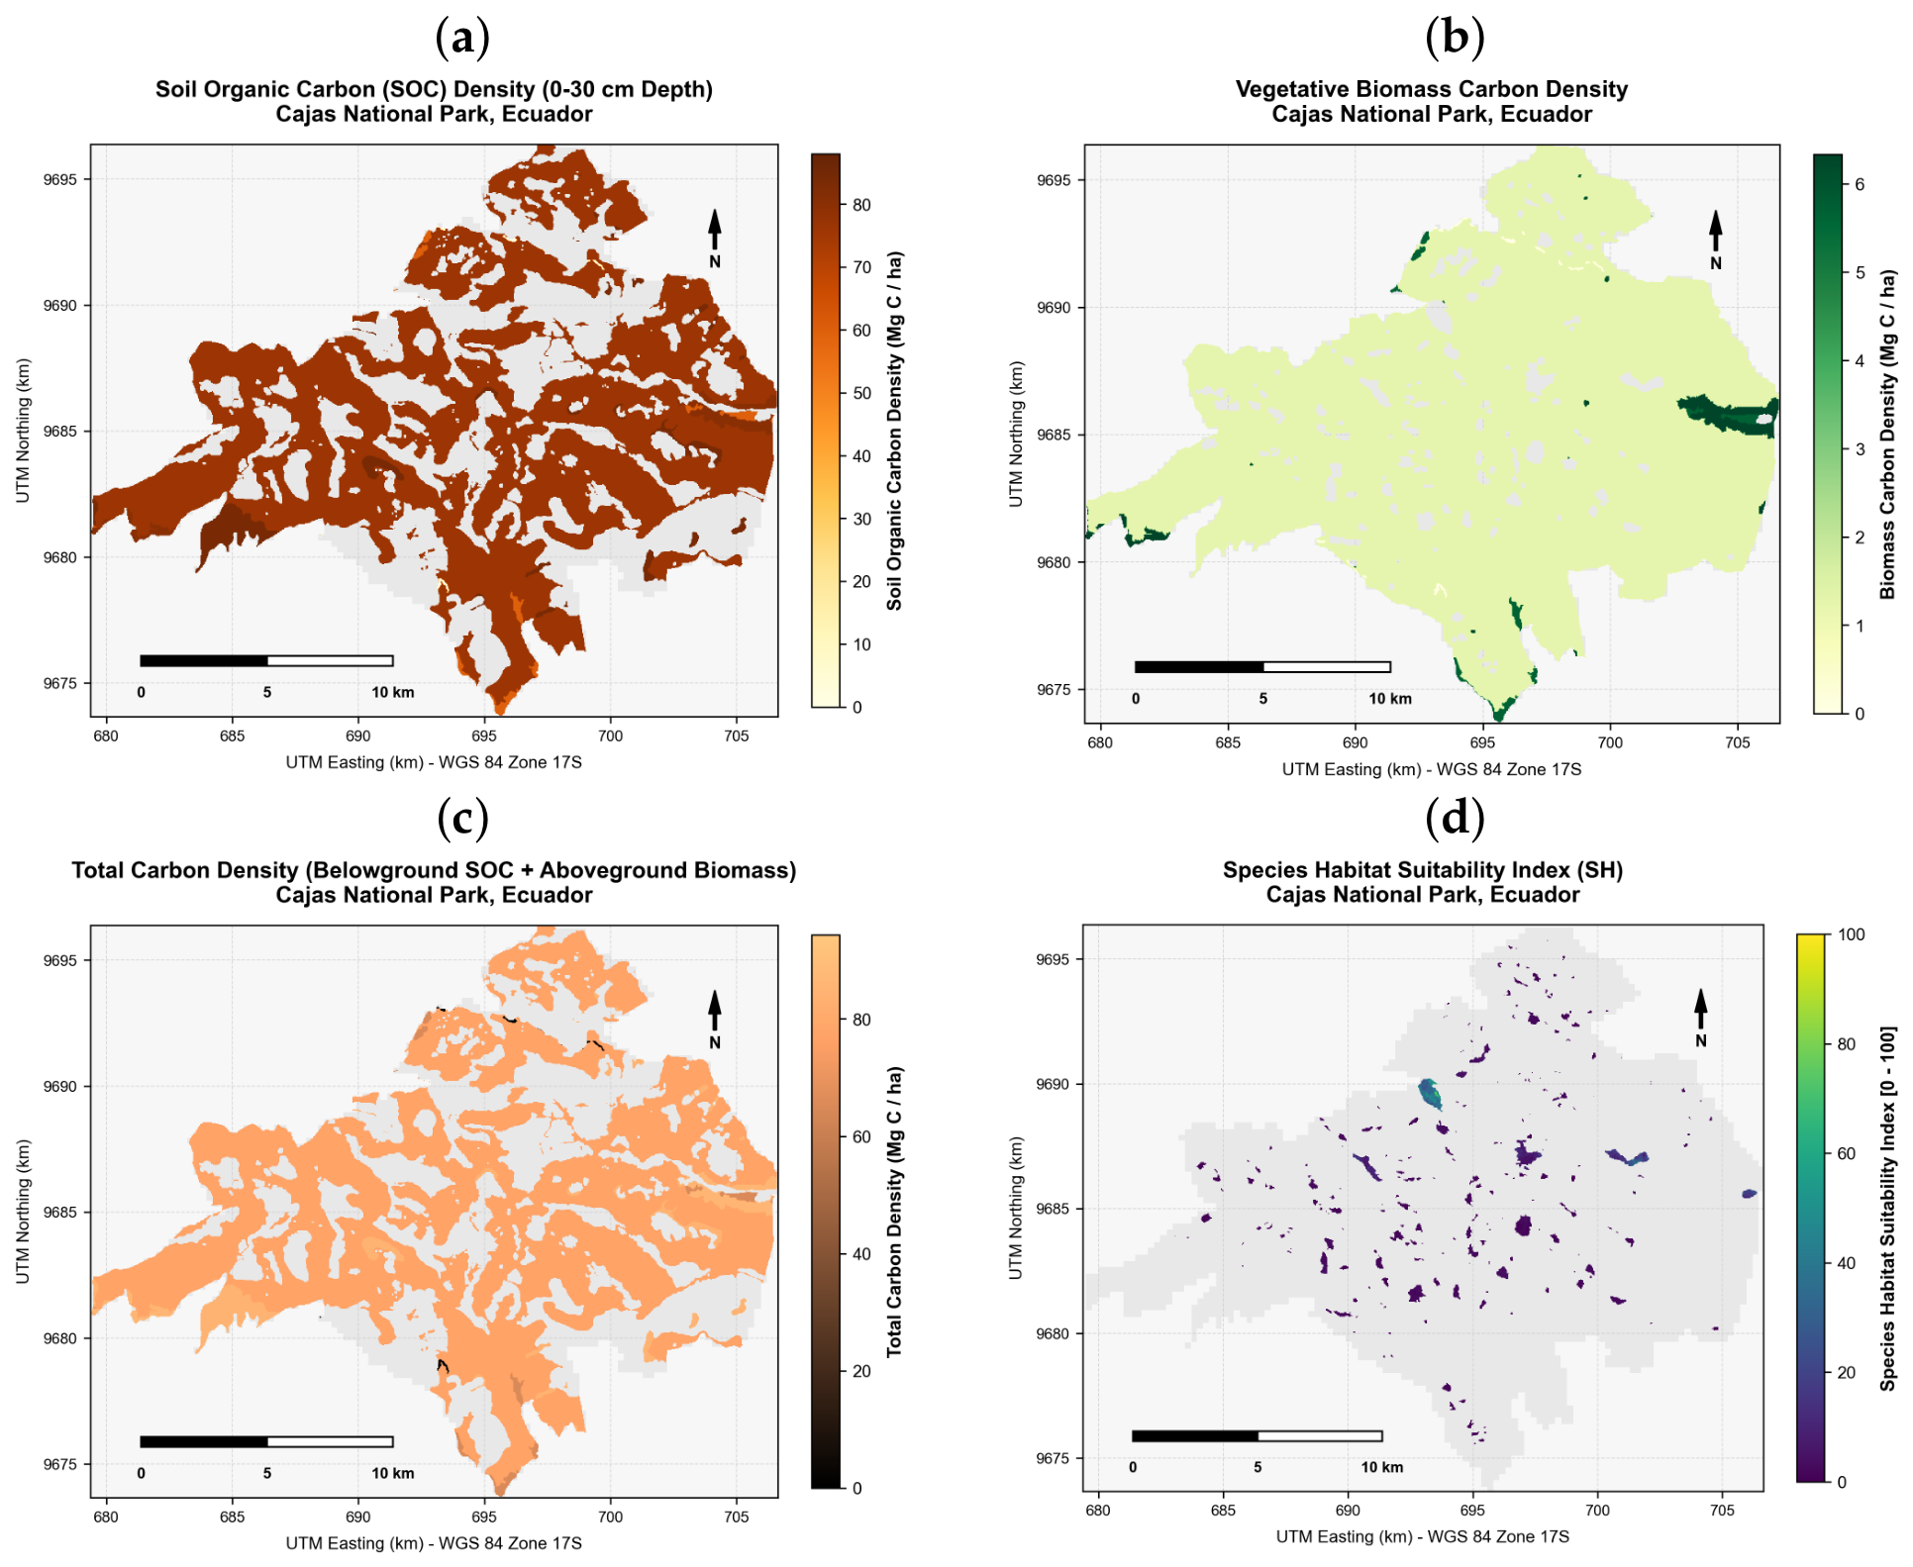
The average Soil Organic Carbon density across the park’s terrestrial surface is , exhibiting low spatial variability (SD = ) due to the continuous presence of Andisols under natural conservation states (). The spatial distribution map of SOC (Figure 2a) shows a highly homogeneous pattern across the core páramo plateau, where Andisols maintain their maximum reference carbon storage of [11,40]. Lower soil carbon values ( to ) are restricted to peripheral zones with steeper slopes and lower-altitude river beds where Entisols and Inceptisols are present [9,13].
Figure 2.
Spatial distribution of ecosystem service assets in Cajas National Park. (a) Soil Organic Carbon (SOC) storage () at 0–30 cm depth. The highly homogeneous pattern across the páramo plateau (mean ) reflects the widespread dominance of Andisols under undisturbed conservation states; lower values in peripheral river valleys correspond to Entisols and Inceptisols. (b) Vegetative Biomass Carbon (, ). Isolated hotspots of mark sheltered valleys with native Polylepis forest fragments, while the vast pajonal matrix stores a near-constant . (c) Total Carbon (, ), combining SOC and . The composite map shows the dominance of belowground carbon (97.5% of total stock), with maximum values () in Andisol-forested valleys and minimum values () along bare peripheral escarpments. (d) Multi-factor Species Habitat Suitability Index (, dimensionless). The extreme spatial heterogeneity (range –; mean ) reflects the complex landscape ecology of Cajas: high-suitability refuges () are tightly concentrated around lake margins (e.g., Laguna Toreadora, Laguna Llaviuco) and sheltered microclimatic valleys with Polylepis canopy, while the exposed high-ridge summits represent natural low-productivity niches.
For the aboveground biomass carbon pool, the average density is , with a standard deviation of . The spatial distribution map of (Figure 2b) shows distinct hotspots of higher carbon storage () in the sheltered valleys that harbor native Polylepis forest fragments. In contrast, the vast pajonal plains store a constant, lower density of , while water bodies and bare ground hold no vegetative carbon stock.
The combined Total Carbon () map (Figure 2c) highlights the overall biophysical carbon asset of PNC. The average total carbon density is (ranging from in bare sandy peripheral zones to in forested volcanic ash soils), emphasizing that belowground organic carbon conservation in volcanic soils must be the focal point of local climate regulation and land management strategies.
3.3. Spatial Modeling of Species Habitat Suitability
The species habitat suitability index () was modeled by integrating primary productivity (NDVI), elevation refuge, thermal stability, precipitation, and proximity to freshwater lakes. The spatial modeling of these biophysical inputs revealed distinct environmental gradients across Cajas National Park. First, regarding primary productivity, the NDVI was calculated from Landsat 8 OLI/TIRS bands on its standard dimensionless scale of following Equation (6). Following the ECOSER protocol specification (Barral, 2017) [44], which requires the primary productivity input layer to be expressed in relative units of , the raw NDVI raster was subsequently rescaled using a linear min-max transformation: . The reported values therefore correspond to this rescaled ECOSER input layer. The rescaled NDVI increased from a mean of in 2023 (with a maximum of ) to a mean of in 2024 (with a maximum of ), reflecting a general recovery of vegetation density and photosynthetic activity within a moderate-to-high range typical of high-altitude pajonal and shrubby páramo ecosystems under active conservation [30]. Second, lake area analysis indicated that the park’s extensive lacustric network contains water bodies ranging in size from to , with a mean lake surface area of (SD = ), representing a dense, high-capacity freshwater network [45].
Third, climatic interpolation surfaces showed extremely stable long-term gradients. Interpolated annual temperature across the park was highly constant, with a mean of 17.90 °C (SD = 0.27 °C, ranging from 17.30 °C to 18.00 °C), which reflects the low seasonal thermal amplitude characteristic of regional equatorial high-mountain environments. Annual precipitation was high and well-distributed, with a mean of (SD = , ranging from to ). Fourth, the topographic elevation refuge gradient ranged from 3160 to , exhibiting a mean elevation of (SD = ), which represents a major structural barrier and biological refuge.
By multiplying these five normalized factors, the resulting habitat suitability index () exhibited a highly heterogeneous spatial pattern (Figure 2d). The index ranged from a minimum of to a maximum of , with a mean score of and a high standard deviation of .
The high standard deviation and skewness of the habitat index indicate a strong spatial asymmetry in habitat provision. The vast majority of the park displays lower suitability scores, representing the harsh alpine environments of the highest ridges where extreme wind, thin soils, and low vegetative biomass limit species presence. In contrast, high-suitability hotspots () are clustered in lower-lying, sheltered valleys, specifically around the lake margins (e.g., Lake Toreadora, Lake Llaviuco) and stable microclimatic zones. These pockets act as primary biological refuges, offering concurrent access to freshwater, primary food sources (NDVI), and physical shelter (native forest fragments).
3.4. Socio-Ecological Flows and Effective Benefit Capture
To understand how these biophysical capacities translate into human benefits, we applied the ECOSER protocol. The Delphi expert consultation, conducted with regional stakeholders in environmental engineering and mountain ecology, yielded highly consistent social importance weights (). Specifically, Soil Organic Carbon storage () was assigned a weight of , vegetative Biomass Carbon storage () was weighted at , and Species Habitat Provision () received a weight of . The panel of experts placed a high and balanced valuation on all three ecosystem services, demonstrating a clear consensus on the concurrent importance of belowground climate regulation and high-altitude biodiversity refuge preservation in protected wetland systems.
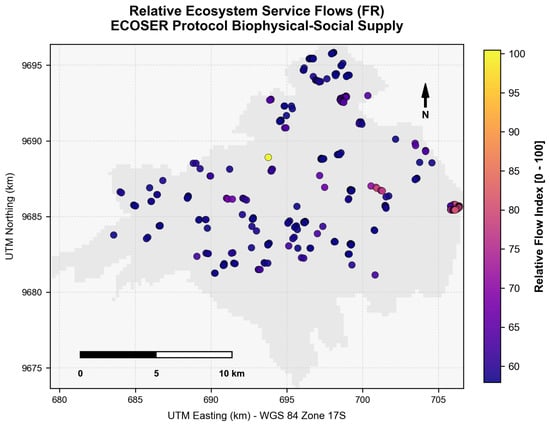
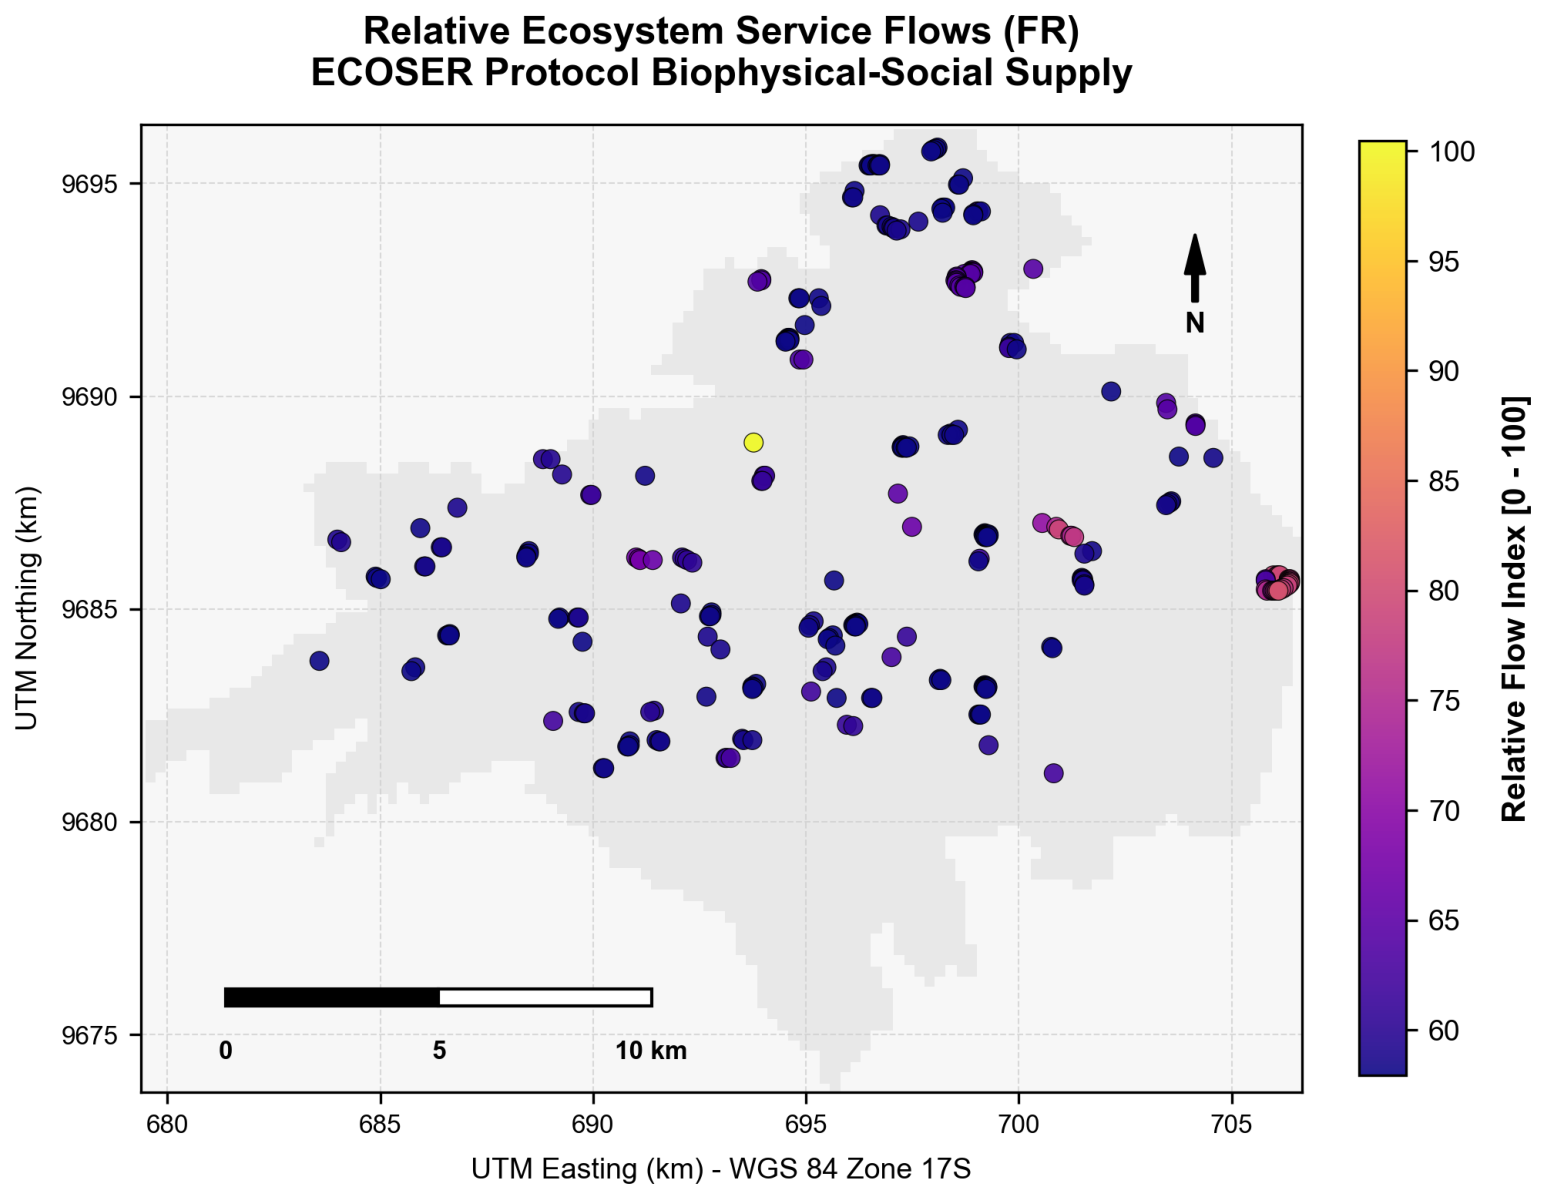
By integrating the normalized biophysical supplies with these social weights, the calculated Relative Flow () map (Figure 3) yielded a mean flow index of (on a scale of 0 to 100) with a very low spatial variation (SD = , ranging from to across 90% of the cells). This low spatial variation indicates that Cajas National Park has a highly homogeneous biophysical capacity to generate environmental flows, primarily sustained by the widespread coverage of high-carbon Andisols and stable pajonal.
Figure 3.
Spatial distribution of relative ecosystem service flows () across Cajas National Park.
However, when these biophysical flows were integrated with spatial demographic demand, a stark spatial divergence emerged between service supply and actual human capture. The total surrounding beneficiary population across the four adjacent parishes was calculated at 173,672 inhabitants, consisting of 30,000 inhabitants in Baños, 15,000 inhabitants in Sayausí, 9000 inhabitants in Molleturo, and 1500 inhabitants in Chaucha, with the remaining 118,172 inhabitants representing the adjacent peri-urban fringe of Canton Cuenca.
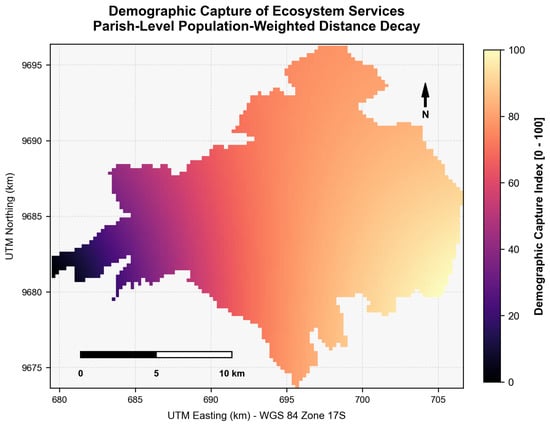
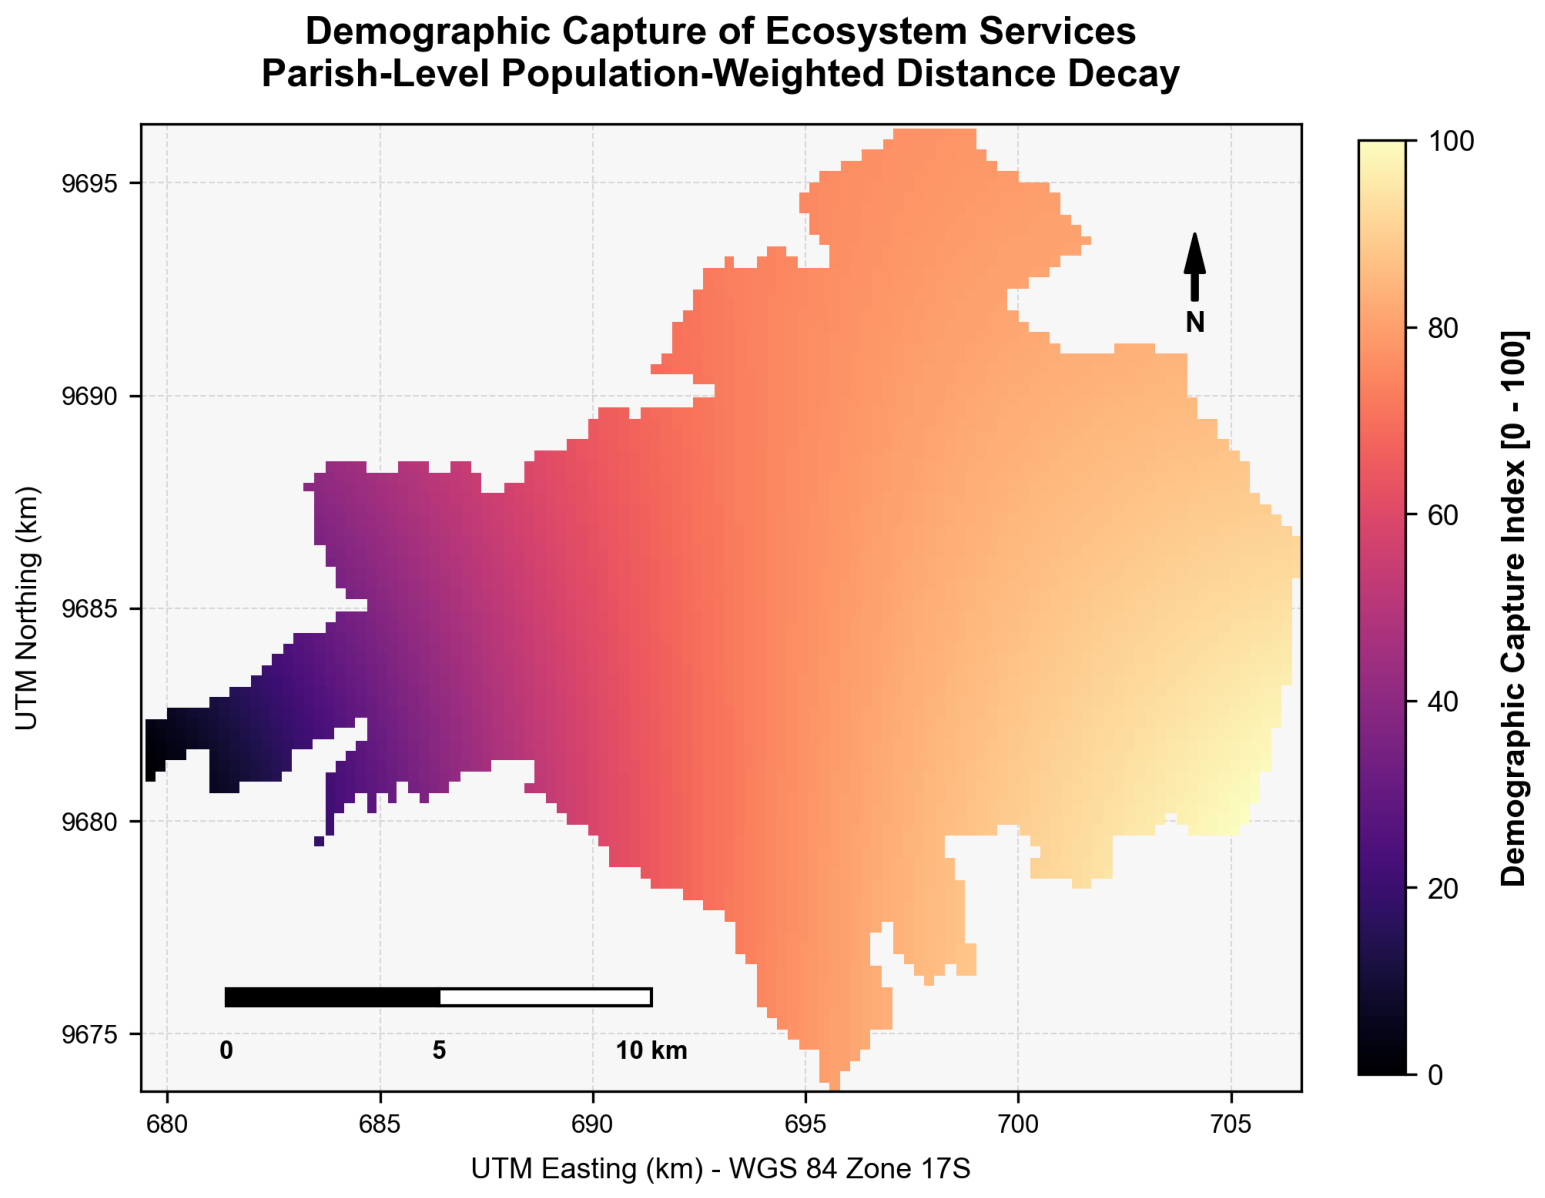
The Demographic Capture index () ranged from to , with a mean of (SD = ). The spatial capture map (Figure 4) shows a pronounced gradient, with maximum capture values clustered along the eastern boundary of the park. This eastern fringe is directly adjacent to the highly populated peri-urban parishes of Baños and Sayausí, which act as direct demographic sinks. In contrast, the western and central core of the park exhibits minimal capture due to extreme geographic isolation and low population density in Molleturo and Chaucha.
Figure 4.
Spatial distribution of demographic capture () of ecosystem services in Cajas National Park.
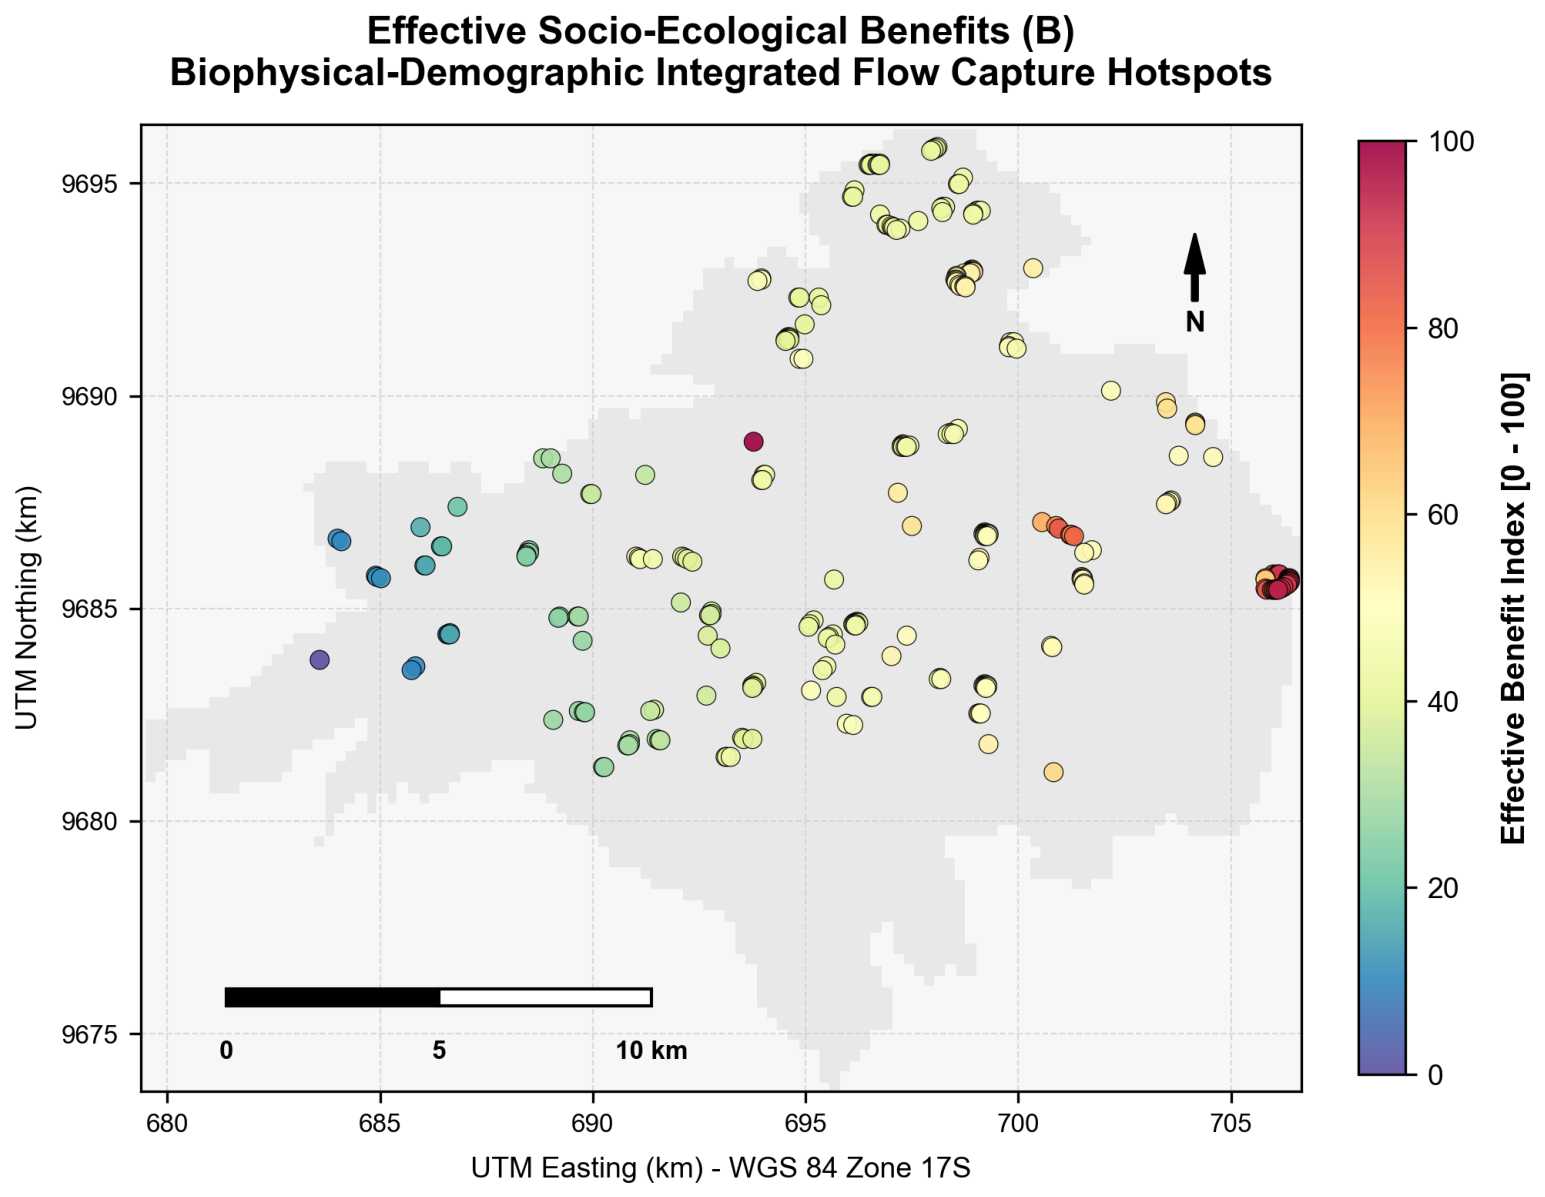
The final Effective Benefit () index (on a scale of 0 to 100) shows a mean score of , with a moderate-to-high standard deviation of (ranging from to ). The spatial distribution of effective benefits (Figure 5) highlights that while the entire park has a high biophysical supply of services, the actual socio-ecological benefit is strongly concentrated along the eastern boundaries. This zone acts as a critical interface where high biophysical supply meets intense human demand, providing vital water regulation, flood mitigation, and recreational opportunities directly to the urban and peri-urban populations of Cuenca.
Figure 5.
Spatial distribution of effective socio-ecological benefits () in Cajas National Park.
4. Discussion
4.1. The Dominant Role of Andisols in High-Altitude Climate Regulation
Our biophysical modeling highlights Cajas National Park as a major regional carbon sink, storing 1.49 million Mg C. The finding that 97.5% of this carbon is stored belowground in volcanic Andisols ( million Mg C) is consistent with established literature on Andean páramo soils. For instance, studies in the Yanacocha Reserve reported that Andisols store approximately in the top 36 cm of the soil profile, representing over 82% of the total ecosystem stock [9,10]. Similarly, research in the Chimborazo páramo recorded SOC values ranging from 150 to , reinforcing the fact that high-altitude volcanic ash soils act as the primary terrestrial carbon sink in the Northern Andes [11,12,13].
The average soil carbon density calculated in our study ( for the 0–30 cm depth) is slightly lower than values reported in Yanacocha or Chimborazo. This minor discrepancy is due to the conservative IPCC Tier 1 reference values applied ( for Andisols under tropical montane climates) and the steep topographic slopes in PNC, which can accelerate erosion and reduce soil depth compared to flatter, low-relief high-altitude plateaus [21,39]. Nevertheless, our high-resolution spatial mapping confirms that the pajonal acts as a “carbon transfer pump”: aboveground vegetative biomass (storing only on average) continuously transfers carbon to the belowground pool via rapid root turnover and slow organic matter decomposition rates driven by low temperatures and high soil moisture [14,18].
The high spatial homogeneity of the SOC stock (SD = ) reflects the intact, protected status of PNC. In agricultural and grazing lands, management factors ( and ) drop significantly, leading to a rapid depletion of SOC through soil compaction, aeration, and erosion [11,22]. The preservation of Andisols in Cajas is therefore a critical climate regulation service that prevents massive carbon emissions into the atmosphere [10,25].
4.2. Habitat Heterogeneity: Microclimatic Stability and Lacustric Refuges
The extreme spatial variability of the species habitat suitability index (), ranging from to , highlights the complex landscape ecology of Cajas. High-suitability patches are heavily concentrated around the park’s lacustric network and stable microclimatic zones [7,43]. The dense network of more than 6000 lakes provides essential freshwater resources and buffers high-altitude temperature extremes, creating stable humid microclimates that support unique micro-habitats [16,19].
This structural heterogeneity and its influence on biodiversity are well-documented in other global mountain systems. In the alpine regions of the Qilian Mountains, China, research showed that the spatial differentiation of ecosystem services is highly sensitive to altitudinal gradients, precipitation regimes, and localized vegetation cover, with low-lying river valleys acting as key biological refuges [46,47,48]. Similar dynamics are observed in highland wetland ecosystems, where the spatial distribution and size of water bodies play a primary role in maintaining biodiversity by buffering macroclimatic fluctuations [19,43]. Furthermore, global mountain grassland analyses revealed that climate change and human activities are jointly reshaping the vegetation dynamics of high-altitude systems worldwide, highlighting the necessity of preserving intact altitudinal corridors in protected areas [24,49,50].
In Cajas, the low-suitability values () occupying the highest ridges and bare rock zones reflect natural biophysical constraints rather than degradation. These high-altitude summits are characterized by extreme wind speeds, low temperatures, and high solar radiation, representing highly specialized, low-productivity niches. The high-suitability zones in the valleys, particularly where native Polylepis forests overlap with lacustric margins, represent crucial conservation hotspots [17,18]. These micro-refuges are critical for the survival of endemic fauna, such as the high-altitude hummingbirds (Metallura baroni) and unique amphibian assemblages, which depend on the microclimatic buffering provided by the forest canopy and water bodies [4,25].
4.3. Socio-Ecological Flows: Addressing the Biophysical–Demographic Mismatch
The integration of biophysical supply and demographic demand through the ECOSER protocol reveals a profound spatial asymmetry in ecosystem service delivery. While the biophysical capacity of PNC is highly homogeneous and evenly distributed across the high-altitude plateau, the actual socio-ecological benefit () is strongly skewed towards the eastern boundary. This asymmetry is driven by the close proximity of the park’s eastern edge to the highly populated parishes of Sayausí and Baños, which act as direct demographic sinks.
This spatial mismatch highlights the limitations of traditional biophysical-only mapping in conservation planning. If land managers focus solely on biophysical supply, they would prioritize the entire park plateau equally. However, by incorporating the demographic capture coefficient (), our model highlights the eastern fringe as a critical “socio-ecological interface”. In this zone, the high capacity of the park to regulate water and store carbon directly benefits the dense peri-urban populations of Cuenca, making it a primary hotspot for active land-use zoning and conservation buffering.
This socio-ecological gradient is consistent with previous applications of the ECOSER protocol. In rural cacao-dominated landscapes in Los Ríos, Ecuador, researchers identified a similar spatial mismatch where biophysical supply was concentrated in remote forest fragments, while effective benefits were captured along river corridors and agricultural fringes where human settlements were located [1,6,51]. Similarly, in the Abras de Mantequilla wetland, the spatial valuation of regulating and cultural services was highly sensitive to demographic proximity and local community perceptions, proving that the flow of ecosystem services is dictated by the geographic relationship between supply zones and beneficiary populations [2,52,53]. In the Ecuadorian highlands more broadly, the political economy of conservation funding and Payment for Ecosystem Services arrangements has demonstrated that service flows are inherently territorial constructs, shaped by governance structures and the spatial boundaries of human demand [54,55].
4.4. Implications for Conservation Planning and Land-Use Zoning
The results of this study have direct policy implications for the management of Cajas National Park and other high-altitude protected areas in the Andes. First, regarding the prioritization of belowground carbon conservation, since volcanic Andisols store 97.5% of the park’s total carbon, local conservation strategies must focus heavily on preventing soil compaction and edaphic disturbance [11,18]. Anthropogenic activities such as illegal cattle grazing, pajonal burning (quema de pajonales), and intensive tourism development along lacustric margins compact the highly porous soil matrix. This compaction reduces the soil’s extraordinary water retention capacity and exposes deep organic carbon horizons to aerobic decomposition, potentially transforming these massive sinks into net emitters of greenhouse gases [21,25].
Second, maintaining altitudinal wildlife corridors is critical to address the extreme spatial fragmentation of high-suitability habitats (). Environmental planning should prioritize establishing and protecting continuous ecological corridors that connect lower montane valleys to the high-altitude plateau [17,24]. Specifically, protecting native Polylepis forest fragments and enforcing strict buffers around lake margins will help preserve vital microclimatic refuges and support high-altitude wildlife dispersion under changing climatic regimes [4,19].
Third, the pronounced concentration of effective benefits () along the park’s eastern boundary provides a strong, spatially explicit foundation for implementing targeted Payment for Ecosystem Services (PES) programs. The municipal water utility of Cuenca (ETAPA) already manages water conservation funds; our spatial model suggests that these financial resources should be disproportionately directed towards supporting sustainable agricultural transitions and conservation easements in the Sayausí and Baños parishes, which act as the primary geomorphic guardians and direct beneficiaries of the eastern watershed interface [54,55,56].
Finally, regarding methodological limitations and future research avenues, while the IPCC Tier 1 guidelines utilized here provide a highly transparent and standardized baseline for regional accounting [40], localized high-resolution soil core sampling (Tier 2 or Tier 3) is necessary to capture the extreme depth and edaphic density variations of these páramo soils [13], which can store up to in deep organic layers. Furthermore, integrating seasonal dynamic hydrological models would refine the spatial accuracy of the water-related suitability factors [7,26,50], while crop and reservoir models can be adapted to evaluate agricultural and hydrological dynamics under climate change [42,57,58].
5. Conclusions and Recommendations
5.1. Conclusions
This study successfully mapped and evaluated the regulating (carbon storage) and supporting (species habitat) ecosystem services of Cajas National Park using a spatially explicit socio-ecological approach. The core conclusions of this research are threefold. First, Cajas National Park acts as a massive regional carbon reservoir, storing an estimated 1.49 million Mg C. Belowground volcanic Andisols are the primary carbon sink, accounting for 97.5% of the total stock ( million Mg C), while aboveground vegetative biomass plays a secondary, complementary role (2.5%, 37,000 Mg C). Second, the capacity of the park to provide species habitats is highly heterogeneous and asymmetric, with a mean suitability index of (ranging from to ). High-suitability refuge zones are tightly clustered around the lacustric network and stable microclimatic valleys, while the highest wind-swept ridges represent natural low-productivity niches. Third, the ECOSER protocol successfully bridged the biophysical–demographic gap by showing that while the biophysical supply of services is relatively homogeneous across the high-altitude plateau, the effective benefits () are strongly concentrated along the eastern boundary. This eastern fringe represents the primary socio-ecological hotspot, where environmental flows directly supply climate mitigation and hydrological regulation services to the adjacent peri-urban populations of Sayausí and Baños. The integration of IPCC Tier 1 guidelines with the ECOSER protocol revealed that the two frameworks are methodologically complementary: while IPCC guidelines provide standardized, globally consistent biophysical reference values that ensure transparency and reproducibility of carbon accounting, the ECOSER protocol adds the critical socio-ecological dimension by spatially linking biophysical supply to human demand. The key aspects for successful integration are: (i) ensuring that biophysical supply layers are spatially explicit and at sufficiently high resolution to resolve ecosystem heterogeneity; (ii) involving local stakeholders through participatory valuation (e.g., Delphi panels) to ensure that social weights reflect real-world priorities; and (iii) using demographic capture coefficients to translate homogeneous biophysical maps into spatially differentiated benefit maps that directly inform conservation zoning and PES program design.
5.2. Recommendations
To guide local and regional environmental policy, several key recommendations are proposed based on our socio-ecological findings. First, municipal authorities should incorporate belowground soil organic carbon preservation into municipal conservation bylaws, establishing strict penalties for activities such as agricultural expansion or illegal cattle grazing that compact or disturb Andisols. Second, environmental managers should enforce strict preservation buffers of at least 100 m around all water bodies and native Polylepis forest fragments to protect critical species refuges and freshwater quality. Third, Canton Cuenca should strengthen and expand its regional Payment for Ecosystem Services (PES) programs, utilizing our spatial effective benefit () hotspots to direct financial resources toward community-led conservation on the eastern peri-urban border. Finally, a high-resolution, long-term edaphic monitoring network should be established within Cajas National Park to transition from regional IPCC Tier 1 reference values to localized Tier 3 soil organic carbon models, thereby tracking carbon accumulation and soil moisture dynamics under changing climate regimes. Beyond the biophysical and hydrological dimensions, conservation success in Cajas ultimately depends on the social, economic, and cultural engagement of adjacent communities. Livelihood diversification programs, such as community-based ecotourism, agroecological certification for dairy and agricultural producers, and cultural heritage recognition of indigenous and mestizo land-use knowledge, are essential complements to regulatory conservation instruments. Conservation efforts should explicitly incorporate the traditional ecological knowledge and customary land-use ethics of the Kichwa and mestizo communities in Chaucha and Molleturo, which have governed resource use in these landscapes for generations. Economically, sustainable funding mechanisms beyond water funds, including voluntary carbon credit markets and biodiversity offset schemes linked to urban development approvals in Cuenca, represent viable pathways to finance long-term conservation at the scale required to secure these socio-ecological assets.
Author Contributions
Conceptualization, D.P. and F.R.-J.; methodology, D.P., K.A.C.-V., F.R.-J. and J.D.-C.M.; software, D.P. and Y.G.; validation, D.P. and Y.G.; formal analysis, K.A.C.-V., Y.G. and D.P.; investigation: D.P., F.R.-J., C.O. and Y.G.; resources, D.P. and Y.G.; data curation, D.P. and Y.G.; writing—original draft preparation, D.P. and Y.G.; writing—review and editing, D.P., Y.G., C.O. and F.R.-J.; visualization, D.P. and Y.G.; supervision, D.P.; project administration, D.P. and Y.G. All authors have read and agreed to the published version of the manuscript.
Funding
This research was funded by the Agrarian University of Ecuador (UAE), within the framework of the project “Ecosystem Service Valuation and Integration of Multispectral Remote Sensing and GIS: A Collaborative Protocol Model for El Cajas National Park, Ecuador”, approved by Resolution No. 325-2024 of the Honorable University Council, and “Estimation of carbon sinks across different land cover and land use types using multispectral remote sensing and unmanned aerial vehicles (UAVs) in the Coastal region of Ecuador,” approved via RESOLUTION No. R-CIFI-UAE-SE-No.017-2025.
Data Availability Statement
The raw data supporting the conclusions of this article will be made available by the authors on request.
Acknowledgments
The authors gratefully acknowledge the sixth-semester students of the Environmental Engineering program of the Universidad Agraria del Ecuador (UAE) () for their participation in the structured expert survey that informed the social valuation weights used in this study. The authors also thank ETAPA-EP and the Ministry of the Environment, Water and Ecological Transition of Ecuador (MAATE) for facilitating access to spatial datasets and park administrative information. During the preparation of this manuscript, the authors used ChatGPT (OpenAI; model GPT-5.6) strictly to assist with English-language grammar and style editing. The authors also used Consensus (Consensus.app) as an AI-assisted literature discovery tool to support reference searching and cross-checking. These AI tools were not involved in any data processing, geospatial modeling, or statistical analysis. All spatial processing and calculations were performed manually by the authors using QGIS and standard mathematical models. All AI-assisted textual outputs were reviewed and edited by the authors; all references were rigorously verified against the original sources. The authors take full responsibility for the content of this publication.
Conflicts of Interest
The authors declare no conflicts of interest.
Abbreviations
The following abbreviations are used in this manuscript:
| CNP | El Cajas National Park |
| RUSLE | Revised Universal Soil Loss Equation |
| NDVI | Normalized Difference Vegetation Index |
| EC | Erosion-Control index |
| DEM | Digital Elevation Model |
| LS | Slope Length–Steepness factor |
| MFI | Modified Fournier Index |
| NASA | National Aeronautics and Space Administration |
| POWER | Prediction of Worldwide Energy Resources (NASA) |
| INAMHI | Instituto Nacional de Meteorología e Hidrología (Ecuador) |
| GEE | Google Earth Engine |
| LULC | Land Use/Land Cover |
| RMSE | Root Mean Square Error |
| NSE | Nash–Sutcliffe Efficiency |
| CV | Coefficient of Variation |
| ESA | European Space Agency |
References
- Portalanza, D.; Barral, M.P.; Villa-Cox, G.; Ferreira-Estafanous, S.; Herrera, P.; Durigon, A.; Ferraz, S. Mapping ecosystem services in a rural landscape dominated by cacao crop: A case study for Los Rios province, Ecuador. Ecol. Indic. 2019, 107, 105593. [Google Scholar] [CrossRef] [Scilit]
- Portalanza, D.; Torres-Ulloa, M.; Arias-Hidalgo, M.; Piza, C.; Villa-Cox, G.; Garcés-Fiallos, F.R.; Álava, E.; Durigon, A.; Espinel, R. Ecosystem services valuation in the Abras de Mantequilla wetland system: A comprehensive analysis. Ecol. Indic. 2024, 158, 111405. [Google Scholar] [CrossRef] [Scilit]
- Abegaz, A.; Ali, A.; Tamene, L.; Abera, W.; Smith, J.U. Modeling long-term attainable soil organic carbon sequestration across the highlands of Ethiopia. Environ. Dev. Sustain. 2022, 24, 5131–5162. [Google Scholar] [CrossRef] [Scilit]
- Admasu, S.; Yeshitela, K.; Argaw, M. Impact of land use land cover changes on ecosystem service values in the Dire and Legedadi watersheds, central highlands of Ethiopia: Implication for landscape management decision making. Heliyon 2023, 9, e15352. [Google Scholar] [CrossRef] [Scilit] [PubMed]
- Laterra, P.; Barral, M.P.; Carmona, F.; Nahuelhual, L. ECOSER: Protocolo Colaborativo de Evaluación y Mapeo de Servicios Ecosistémicos y Vulnerabilidad Socioecológica para el Ordenamiento Territorial; Technical Report; Instituto Nacional de Tecnología Agropecuaria (INTA): Buenos Aires, Argentina, 2015. Available online: https://ecosistemas.senacyt.gob.pa/handle/123456789/740 (accessed on 16 July 2026).
- Arega, E.; Deribew, K.T.; Moisa, M.B.; Gemeda, D.O. Assessment of soil erosion and prioritization of conservation and restoration measures using RUSLE and Geospatial techniques: The case of upper Bilate watershed. Geomat. Nat. Hazards Risk 2024, 15. [Google Scholar] [CrossRef] [Scilit]
- Mosquera, G.M.; Hofstede, R.; Bremer, L.L.; Asbjornsen, H.; Carabajo-Hidalgo, A.; Cárdenas, I.; Crespo, P.; Deckers, J.; Donoso, D.A.; Fleischbein, K.; et al. Frontiers in páramo water resources research: A multidisciplinary assessment. Sci. Total Environ. 2023, 892, 164373. [Google Scholar] [CrossRef] [Scilit] [PubMed]
- Portalanza, D.; Valle, E.; Cepeda, M.; Garzón, L.; Guevara, J.C.; Arcos, D.; Ortega, C.; Macías-Barberán, J.R. Remote-Sensing Carbon Stock Dynamics and Carbon-Market Valuation in Ecuador’s Churute Mangrove Ecological Reserve (2015–2021). Ecologies 2026, 7, 23. [Google Scholar] [CrossRef] [Scilit]
- Shaju, T.; Shaji, P. Riparian Vegetation in Kerala’s River Basins: Diversity, Ecological Functions and Restoration Prospects; Elsevier: Amsterdam, The Netherlands, 2024; pp. 65–75. [Google Scholar] [CrossRef] [Scilit]
- Steinhäuser, C. Mountain farmers’ intangible values foster agroecological landscapes: Case studies from Sierra Santa Victoria in northwest Argentina and the Ladin Dolomites, northern Italy. Agroecol. Sustain. Food Syst. 2020, 44, 352–377. [Google Scholar] [CrossRef] [Scilit]
- Alavi-Murillo, G.; Diels, J.; Gilles, J.; Willems, P. Soil organic carbon in Andean high-mountain ecosystems: Importance, challenges, and opportunities for carbon sequestration. Reg. Environ. Change 2022, 22, 128. [Google Scholar] [CrossRef] [Scilit]
- Paing, J.N.; van Bussel, L.G.; Gomez, R.A.; Hein, L.G. Ecosystem services through the lens of indigenous people in the highlands of Cordillera Region, Northern Philippines. J. Environ. Manag. 2022, 308, 114597. [Google Scholar] [CrossRef] [Scilit] [PubMed]
- Navarro, M.; Aragón, G.; Oyague, E.; Ignacio, J.; Franco, P. The ecological effects of conventional infrastructure and its impact on the highandean societies of southern peru by the year 2023: Myth or scientific reality? [Los efectos ecológicos de la infraestructura convencional y su impacto sobre las sociedades altoandinas del departamento de tacna al extremo sur peruano en el año 2023 ¿mito o realidad científica?]. Dialogo Andin. 2024, 110–127. [Google Scholar] [CrossRef] [Scilit]
- Chengere, S.A.; Steger, C.; Gebrehiwot, K.; Nemomissa, S.; Dullo, B.W. Modeling Cultural Keystone Species for the Conservation of Biocultural Diversity in the Afroalpine. Environments 2022, 9, 156. [Google Scholar] [CrossRef] [Scilit]
- Areche, F.O.; Araujo-Reyes, L.D.; Estrada-Ayre, P.C.; Basualdo-Garcia, P.E.; Huanca, F. Hydrosocial Connectivity and Water Footprint Governance from Andean Headwaters to Coastal Landscapes. J. Sustain. Dev. Energy Water Environ. Syst. 2026, 14, 1–18. [Google Scholar] [CrossRef] [Scilit]
- Ramsar Convention Secretariat. Cajas Lacustrine System Information Sheet on Ramsar Wetlands (RIS); Ramsar Secretariat: Gland, Switzerland, 2022. [Google Scholar]
- Pizarro, S.E.; Pricope, N.G.; Vargas-Machuca, D.; Huanca, O.; Ñaupari, J. Mapping Land Cover Types for Highland Andean Ecosystems in Peru Using Google Earth Engine. Remote Sens. 2022, 14, 1562. [Google Scholar] [CrossRef] [Scilit]
- Guarderas, P.; Trávez, K.; Boeraeve, F.; Cornelis, J.T.; Dufrêne, M. Native forest conversion alters soil macroinvertebrate diversity and soil quality in tropical mountain landscapes of northern Ecuador. Front. For. Glob. Change 2022, 5, 959799. [Google Scholar] [CrossRef] [Scilit]
- Chiappero, M.F.; Vaieretti, M.V.; Martínez, P.A.; Izquierdo, A.E. The role of local environmental heterogeneity in shaping soil mesofauna communities of Argentine high Andean wetlands. Soil Ecol. Lett. 2025, 7, 240312. [Google Scholar] [CrossRef] [Scilit]
- Ansaloni, R.; Izco, J.; Amigo, J.; Minga, D. Analysis of the páramo vascular flora in the Cajas National Park (Central Andes, Ecuador). Mediterr. Bot. 2022, 43, e76491. [Google Scholar] [CrossRef] [Scilit]
- Vali, A.; Comai, S.; Matteucci, M. Deep learning for land use and land cover classification based on hyperspectral and multispectral earth observation data: A review. Remote Sens. 2020, 12, 2495. [Google Scholar] [CrossRef] [Scilit]
- He, J.; Wang, Y. Construction of Humanistic Landscape Ecological Corridor in Highland Canyon Area in Sichuan, China: Based on the Evaluation of the Importance of Ecosystem Service Functions. In High-Quality, Resilient and Safe Cities; Lecture Notes in Civil Engineering; Springer: Singapore, 2025; Volume 729, pp. 246–269. [Google Scholar] [CrossRef] [Scilit]
- Abate, D.; Borges, J.G.; Marques, S.; Bushenkov, V. An Ecological-Economic Approach to Assess Impacts of the Expansion of Eucalyptus Plantations in Agroforest Landscapes of Northern Ethiopia. Forests 2022, 13, 686. [Google Scholar] [CrossRef] [Scilit]
- Na, M.; Zuecco, G.; Tarolli, P. Impacts of Climate Change and Human Activities on Global Mountain Grasslands: Insights into the Last Two Decades and Future Climate Scenarios. Earth’s Future 2026, 14, e2025EF006419. [Google Scholar] [CrossRef] [Scilit]
- Lis-Gutiérrez, M.; Lis-Gutiérrez, J.P.; Jiménez-Parra, J.; Henao-Rodríguez, C. Environmental impact of the páramo in Colombia: An approach from the FPEIR model. Salud Cienc. Tecnol.—Ser. Conf. 2023, 2, 378. [Google Scholar] [CrossRef] [Scilit]
- Drenkhan, F.; Castro-Salvador, S. An Approach Towards Water Security in the Tropical Andes: Challenges and Perspectives. Rev. Kawsaypacha Soc. Medio Ambiente 2023, A-006. [Google Scholar] [CrossRef] [Scilit]
- García, V.J.; Márquez, C.O.; Rodríguez, M.V.; Orozco, J.J.; Aguilar, C.D.; Ríos, A.C. Páramo ecosystems in Ecuador’s southern region: Conservation state and restoration. Agronomy 2020, 10, 1922. [Google Scholar] [CrossRef] [Scilit]
- Ross, C.; Fildes, S.; Millington, A.C. Land-use and land-cover change in the páramo of South-Central Ecuador, 1979–2014. Land 2017, 6, 46. [Google Scholar] [CrossRef] [Scilit]
- Guarderas, P.; Smith, F.; Dufrene, M. Land use and land cover change in a tropical mountain landscape of northern Ecuador: Altitudinal patterns and driving forces. PLoS ONE 2022, 17, e0260191. [Google Scholar] [CrossRef] [Scilit] [PubMed]
- Villarreal-Veloz, J.; Zapata-Ríos, X.; Uvidia-Zambrano, K.; Borja-Escobar, C. Spatio-Temporal Description of the NDVI (MODIS) of the Ecuadorian Tussock Grasses and Its Link with the Hydrometeorological Variables and Global Climatic Indices. Sustainability 2023, 15, 11562. [Google Scholar] [CrossRef] [Scilit]
- Rumayomi, N.A.A.; Murdjoko, A.; Ungirwalu, A.; Mulyadi; Benu, N.M.H.; Djitmau, D.A. Forest Conservation by Conserving Socio-cultural Aspects: A Lesson from the Sougb Tribe in Teluk Bintuni, West Papua Province. J. Manaj. Hutan Trop. 2025, 31, 288–299. [Google Scholar] [CrossRef] [Scilit]
- Sircely, J.; Abdisemet, B.O.; Kamango, J.; Kuseyo, A.; Markos, M.W.; Nganga, I.N.; Russell, S.; Somare, J.M.; Tolessa, T.; Workneh, A.; et al. Deriving scalable measures for restoration of communal grazing lands. Ecol. Soc. 2022, 27, 10. [Google Scholar] [CrossRef] [Scilit]
- INEC. VIII Censo Nacional de Población y VII de Vivienda; Instituto Nacional de Estadística y Censos: Quito, Ecuador, 2023.
- QGIS Development Team. QGIS Geographic Information System; Open Source Geospatial Foundation: Beaverton, OR, USA, 2024. [Google Scholar]
- USGS. Landsat 8 Collection 2 Level-2 Surface Reflectance Product Guide; U.S. Geological Survey: Reston, VA, USA, 2024.
- JAXA. ALOS PALSAR 12.5m Digital Elevation Model Dataset; Japan Aerospace Exploration Agency: Tokyo, Japan, 2021. [Google Scholar]
- MAATE. Mapa de Cobertura y Uso de la Tierra del Ecuador Continental, Escala 1:50,000; Ministerio del Ambiente, Agua y Transición Ecológica: Quito, Ecuador, 2023.
- INAMHI. Anuario Meteorológico Nacional 2023–2024; Instituto Nacional de Meteorología e Hidrología: Quito, Ecuador, 2024.
- Portalanza, D.; Morstadt, J.D.C.; Polhmann, V.; Gallardo, G.; Aguilera, K.; Garcia, Y.; Rodriguez-Jarama, F. Mapping Soil Erosion and Ecosystem Service Loss: Integrating RUSLE and NDVI Metrics to Support Conservation in El Cajas National Park, Ecuador. Hydrology 2025, 12, 279. [Google Scholar] [CrossRef] [Scilit]
- IPCC. 2019 Refinement to the 2006 IPCC Guidelines for National Greenhouse Gas Inventories; Intergovernmental Panel on Climate Change: Geneva, Switzerland, 2019. [Google Scholar]
- Tamire, C.; Elias, E.; Argaw, M. Spatiotemporal dynamics of soil loss and sediment export in Upper Bilate River Catchment (UBRC), Central Rift Valley of Ethiopia. Heliyon 2022, 8, e11220. [Google Scholar] [CrossRef] [Scilit] [PubMed]
- Portalanza, D.; Pohlmann, V.; Horgan, F.G.; Torres-Ulloa, M.; Durigon, A.; Ferraz, S.; Cuadra, S.V. Can extreme climatic and bioclimatic indices reproduce soy and maize yields in Latin America? Part 1: An observational and modeling perspective. Environ. Earth Sci. 2024, 83, 175. [Google Scholar] [CrossRef] [Scilit]
- Pan, J.; Ma, Y.; Cai, S.; Chen, Y.; Chen, Y. Distribution patterns of lake-wetland cultural ecosystem services in highland. Environ. Dev. 2022, 44, 100754. [Google Scholar] [CrossRef] [Scilit]
- Barral, M.P. Tutorial Para el Mapeo de Funciones Ecosistémicas y Servicios Ecosistémicos; Technical Report; Universidad Nacional de Mar del Plata: La Plata, Argentina, 2016. [Google Scholar] [CrossRef]
- Benito, X.; Luethje, M.; Schneider, T.; Fritz, S.C.; Baker, P.A. Ecological resilience in tropical Andean lakes: A paleolimnological perspective. Limnol. Oceanogr. 2022, 67, S23–S37. [Google Scholar] [CrossRef] [Scilit]
- Silva Neto, E.C.; Coelho-Junior, M.G.; Horák-Terra, I.; Gonçalves, T.S.; Anjos, L.H.C.; Pereira, M.G. Organic Soils: Formation, Classification and Environmental Changes Records in the Highlands of Southeastern Brazil. Sustainability 2023, 15, 3416. [Google Scholar] [CrossRef] [Scilit]
- Héritier, S.; Lebreton, C. From ‘revolutionary’ to contested park. Mobilization and conflicts in the recategorization process of the nevado de toluca national park (Mexico). Artic.—J. Urban Res. 2017, 16, 3279. [Google Scholar] [CrossRef] [Scilit]
- Velasco, N.; Diaz, P.J. Potential model of Scalesia pedunculata carbon sequestration through restoration efforts in agricultural fields of Galapagos. PLoS ONE 2024, 19, e0302680. [Google Scholar] [CrossRef] [Scilit] [PubMed]
- Reyes-Quintana, M.; Lizarazo, I. Convolutional neural network-based semantic segmentation model for land cover classification in páramo ecosystems [Modelo de segmentación semántica de imágenes satelitales basado en redes neuronales convolucionales para la clasificación de cobertura de la tierra en páramos]. Rev. Teledetec. 2025, 65, 21858. [Google Scholar] [CrossRef] [Scilit]
- Montesinos, C.; Saavedra, D.; Bourrel, L.; Rau, P.; Diaz, R.D.; Lavado-Casimiro, W. Understanding the Impacts of Climate Change and Landcover/Land Use Transformations on Highlands Hydrological Ecosystem Services in the Piuray–Ccorimarca Watershed (Andean Cordillera of Peru). Climate 2026, 14, 49. [Google Scholar] [CrossRef] [Scilit]
- Hartz, S.M.; de Freitas, T.R.O.; Gonçalves, G.L.; Bicca-Marques, J.C.; Quintela, F.M.; Tirelli, F.P.; da Costa, C.F.; Pereira, M.J.R.; Luza, A.L. Mammals of the Campos Sulinos: Diversity and Conservation; Springer International Publishing: Cham, Switzerland, 2023; pp. 289–318. [Google Scholar] [CrossRef] [Scilit] [PubMed]
- Sharma, N.; Priyatharshini, S.; Kaliappan, N.; Dhevagi, P.; Poornima, R.; Ramya, A. Waste Management Challenges and Potential Solutions in the Indian Himalayan Region; Springer Science + Business Media: Cham, Switzerland, 2025; pp. 177–213. [Google Scholar] [CrossRef] [Scilit]
- Jing, X.; Ding, L.; Zhou, J.; Huang, X.; Degen, A.; Long, R. The adaptive strategies of yaks to live in the Asian highlands. Anim. Nutr. 2022, 9, 249–258. [Google Scholar] [CrossRef] [Scilit] [PubMed]
- McBurney, M.; Tuaza, L.A.; Johnson, C. Paying for ecological services in Ecuador: The political economy of structural inequality. J. Agrar. Change 2023, 23, 385–403. [Google Scholar] [CrossRef] [Scilit]
- Joslin, A. Dividing “Above” and “Below”: Constructing Territory for Ecosystem Service Conservation in the Ecuadorian Highlands. Ann. Am. Assoc. Geogr. 2020, 110, 1874–1890. [Google Scholar] [CrossRef] [Scilit]
- ETAPA, E.P. Monitoreo Hidrológico e Hidrometeorológico del Parque Nacional Cajas; Empresa Pública Municipal de Telecomunicaciones, Agua Potable, Alcantarillado y Saneamiento de Cuenca: Cuenca, Ecuador, 2023. [Google Scholar]
- Portalanza, D.; Horgan, F.G.; Pohlmann, V.; Cuadra, S.V.; Torres-Ulloa, M.; Alava, E.; Ferraz, S.; Durigon, A. Potential Impact of Future Climates on Rice Production in Ecuador Determined Using Kobayashi’s ’Very Simple Model’. Agriculture 2022, 12, 1828. [Google Scholar] [CrossRef] [Scilit]
- Ibrahim, T.; Geremew, B.; Tesfay, F. Spatio-temporal dynamic of land use and land cover in andit tid watershed, wet frost/afro-alpine highland of ethiopia. Edelweiss Appl. Sci. Technol. 2021, 5, 33–38. [Google Scholar] [CrossRef] [Scilit]

Disclaimer/Publisher’s Note: The statements, opinions and data contained in all publications are solely those of the individual author(s) and contributor(s) and not of MDPI and/or the editor(s). MDPI and/or the editor(s) disclaim responsibility for any injury to people or property resulting from any ideas, methods, instructions or products referred to in the content. |
© 2026 by the authors. Licensee MDPI, Basel, Switzerland. This article is an open access article distributed under the terms and conditions of the Creative Commons Attribution (CC BY) license.