


Abstract
As a globally climate-sensitive region and ecological security barrier, the spatiotemporal dynamics of net ecosystem productivity (NEP) on the Qinghai–Tibetan Plateau are of great significance for understanding carbon cycling in alpine ecosystems. However, due to insufficient representation of parameter heterogeneity in models and unclear nonlinear attribution of complex environmental factors, substantial uncertainties remain in the spatiotemporal patterns and driving mechanisms of NEP in this region. Therefore, this study first employed an improved Carnegie–Ames–Stanford Approach (CASA) model to assess NEP on the Qinghai–Tibetan Plateau from 2000 to 2022 and characterize its spatiotemporal evolution, and subsequently applied the optimal multivariate-stratification geographical detector (OMGD) to quantify the independent and synergistic driving effects of hydrothermal conditions, extreme climate events, and human activities on NEP variations. The results indicate that: (1) from 2000 to 2022, vegetation NEP on the Qinghai–Tibetan Plateau exhibited a southeast-to-northwest decreasing spatial heterogeneity pattern, with a multi-year mean value of 219.61 g C·m−2; (2) during the study period, NEP showed an overall increasing trend (at a rate of 1.596 g C·m−2·yr−1), with 52.5% of the region experiencing significant increases, primarily concentrated in the central–eastern humid regions and alpine meadow areas; and (3) among individual factors, the growing season length was the primary driver of NEP, in addition to temperature and precipitation, while human activities exerted negligible influence; under interaction effects, the hydrothermal synergistic enhancement (0.79 < q < 0.89) exhibited the highest explanatory power. These results show that carbon sequestration in alpine ecosystems is governed by nonlinear hydrothermal interactions and provide a scientific basis for assessing carbon sink resilience in the “Asian Water Tower” under global warming.
1. Introductions
Against the backdrop of intensifying global climate change and the ongoing transition towards carbon neutrality, harmonizing the carbon budget structure and enhancing the carbon sequestration capacity of ecosystems have become critical issues that urgently need to be resolved in global ecology and environmental science. Terrestrial ecosystems play a pivotal role in the global carbon cycle, and the magnitude of their carbon sink function directly influences the trajectory of atmospheric CO2 concentrations [1]. Vegetation is the dominant component of terrestrial ecosystems and constitutes the primary contributor to the global terrestrial carbon sink [2]. Therefore, enhancing vegetation protection and ecological restoration to bolster ecosystems’ carbon sequestration capacity is of paramount importance for establishing a global carbon balance and achieving green and low-carbon development. Net ecosystem productivity (NEP), a key parameter for quantifying the carbon source–sink capacity of terrestrial ecosystems, reflects the net balance between carbon fixed by vegetation through photosynthesis and carbon released via soil respiration [3,4]. In recent years, as carbon balance has become a central issue in contemporary development—from the Paris Agreement to China’s “dual carbon” goals—the monitoring of carbon sinks in key ecological conservation areas and the estimation and analysis of NEP have emerged as major research hotspots in the construction of global ecological security.
With the rapid advancement of remote sensing technologies and the increasing availability of multi-source observational datasets, regional-scale vegetation productivity estimation has progressively evolved from conventional field plot surveys to an integrated framework that combines remote sensing observations with ecological process models. At present, the estimation of vegetation productivity and ecosystem carbon balance has developed into a well-established research framework, primarily encompassing ecosystem process models, light-use efficiency (LUE) models, and empirical statistical models. Among these, the Carnegie–Ames–Stanford Approach (CASA) model has been extensively employed for estimating net primary productivity (NPP) and NEP at both regional and global scales because of its relatively simple structure, modest parameter requirements, and strong adaptability across diverse environmental conditions [5]. Using the CASA model, numerous studies have systematically characterized the spatiotemporal dynamics of ecosystem carbon balance across diverse regions, providing critical scientific support for regional carbon sink assessments and ecological conservation efforts. In recent years, research has progressively expanded beyond vegetation productivity estimation to encompass the spatiotemporal dynamics of ecosystem carbon sinks, the elucidation of their driving mechanisms, and projections of future changes [6,7], while placing increasing emphasis on integrated analyses of the coupled interactions among climate change, human activities, and ecological processes. Meanwhile, advances in multi-source remote sensing data fusion, model parameter optimization, and machine learning techniques have further enhanced the accuracy and regional applicability of vegetation productivity estimation, thereby providing more robust support for carbon cycle assessment and ecosystem monitoring [8,9].
Although substantial progress has been made in recent years in the study of carbon sources and sinks in terrestrial ecosystems at national and ecosystem-type scales, several critical issues remain to be addressed. A major limitation is the reliance on simplified model inputs and static parameters; for instance, the maximum light use efficiency (LUEmax) is frequently assigned as a fixed constant or through empirical zonation [10,11], which fails to capture climatic and ecological heterogeneity, thereby introducing systematic biases. Furthermore, many studies predominantly focus on NPP, which quantifies only photosynthetic carbon fixation and neglects carbon losses from soil heterotrophic respiration. This omission limits the interpretability of results in the context of the integrity and dynamic feedback mechanisms of the carbon cycle [12]. Parallel to this, although previous studies have assessed the potential of optimized anthropogenic management practices (AMPs) to enhance vegetation carbon sequestration [13], the cumulative impacts of the human footprint on the broader ecosystem carbon cycle have yet to be systematically quantified [14]. This leads to substantial uncertainty in carbon sink estimations for key ecological regions. While the geographical detector has been widely applied for attribution analysis, conventional discretization of continuous variables often leads to a loss of spatial information. Although the optimal parameter-based geographical detector (OPGD) improved this, it still requires manual selection of optimal combinations [15]. In contrast, the optimal multivariate-stratification geographical detector (OMGD) offers a more efficient framework for automatically identifying spatial stratified heterogeneity (SSH) and complex factor interactions [16].
The Qinghai–Tibetan Plateau (TP), the “Third Pole” of the Earth, represents a critical frontier for research on the terrestrial carbon cycle. This region is characterized by ecological fragility, complex topography, and frequent extreme climate events, forming a typical alpine grassland ecosystem. Extreme climate events often alter photosynthetic rates, respiration intensity, and ecosystem resilience, leading to abrupt shifts and long-term lag effects in carbon-sink functions [17]. Over the past four decades, intensified precipitation has increased soil erosion on the Qinghai–Tibetan Plateau by 42%, resulting in organic carbon losses equivalent to 11% ± 3% of the regional terrestrial ecosystem carbon sink, thereby exacerbating the climate–erosion–carbon feedback loop [18]. In recent years, climate warming on the Qinghai–Tibetan Plateau has further increased the intensity and frequency of extreme precipitation events. Although significant vegetation greening has been observed, intense debate persists regarding whether the TP acts as a significant carbon source or a weak sink [19,20,21,22]. Therefore, conducting NEP estimation and analysis for the Qinghai–Tibetan Plateau and investigating the driving mechanisms of extreme climate and anthropogenic factors is of significant practical importance, providing quantitative evidence for understanding how human activities and natural processes jointly shape carbon cycle dynamics [23].
To address these knowledge gaps, this study focuses on the Qinghai–Tibetan Plateau and establishes an integrated framework for NEP estimation and attribution that incorporates both ecological process mechanisms and regional characteristics, with three primary objectives: (1) To estimate NEP across the Qinghai–Tibetan Plateau from 2000 to 2022 by integrating an improved CASA model, a soil respiration model, and multi-source remote sensing and meteorological datasets. (2) To characterize the spatiotemporal dynamics and transition patterns of NEP across the Qinghai–Tibetan Plateau, thereby identifying the spatial heterogeneity and temporal evolution of regional carbon sink dynamics. (3) To quantitatively identify the dominant drivers and their interactive effects governing the spatial heterogeneity of NEP by jointly considering climatic conditions, hydrothermal regimes, extreme climate events, and human activities, thereby elucidating the mechanisms underlying regional vegetation carbon sink dynamics. This study provides a robust scientific basis for improving the understanding of carbon cycle dynamics on the Qinghai–Tibetan Plateau and their responses to climate change and anthropogenic activities.
2. Materials and Methods
2.1. Study Area
The Qinghai–Tibetan Plateau is located in southwestern China, extending from 26°00′12″ N to 39°46′50″ N and 73°18′52″ E to 104°46′59″ E, with a total area of approximately 2.615 million km2, accounting for about one-quarter of the China’s terrestrial area. The plateau exhibits pronounced topographic variability, with elevations ranging from 60 to 8792 m (Figure 1b) and an average elevation exceeding 4000 m, and an overall terrain that gradually declines from northwest to southeast; it is the largest and highest plateau in China and the world, often referred to as the “Roof of the World.” Owing to its extremely high elevation, the Qinghai–Tibetan Plateau is characterized by thin and dry air, and most regions experience a distinct alpine mountain climate. Spatially, climatic heterogeneity is pronounced, with climate types transitioning from humid to alpine humid, alpine sub-humid, alpine semi-arid, and alpine arid conditions from southeast to northwest. The mean annual temperature in the plateau interior is below 0 °C and decreases progressively with increasing elevation. According to the 1981–2020 climatological mean, the Qinghai–Tibet Plateau receives a mean annual precipitation of approximately 596 mm, exhibiting pronounced spatiotemporal variability and an overall decreasing gradient from southeast to northwest [24]. Vegetation types in the region are highly diverse, and under the combined influence of environmental factors and human activities, they exhibit a systematic succession pattern from forest to shrubland, meadow, grassland, and desert from southeast to northwest [25]. In addition, the Qinghai–Tibetan Plateau constitutes a core area of the national ecological security barrier, where source regions such as the Three-River Source Region, the Zoige Wetland, and the Qilian Mountains serve as key carbon sink conservation zones, fulfilling the functions of enhancing carbon sequestration and protecting the carbon pool.
Figure 1.
Geographical location, topography, and land-use distribution of the Qinghai–Tibetan Plateau. (a) Geographic location of the Qinghai–Tibetan Plateau relative to China; (b) elevation distribution of the Qinghai–Tibetan Plateau; (c) land-use distribution of the Qinghai–Tibetan Plateau.
2.2. Data Sources and Preprocessing
The main datasets used for NEP estimation, driver attribution, and validation, including their temporal coverage, spatial resolution, and sources, are summarized in Table 1.
2.2.1. Meteorological Data
The meteorological variables employed in this study include air temperature, precipitation, solar radiation, and extreme climate indices. Monthly mean air temperature, monthly precipitation, and extreme climate index data were obtained from the National Tibetan Plateau Data Center (https://data.tpdc.ac.cn, accessed on 9 August 2025). This dataset was generated by downscaling the global 0.5° climate dataset released by the Climatic Research Unit (CRU) and the WorldClim global high-resolution climate dataset over China using the Delta spatial downscaling approach. The temporal coverage of the monthly mean temperature and precipitation data used in this study spans from 2000 to 2022, with a spatial resolution of 1000 m. The extreme climate indices were derived from the High-resolution Climate Indices Projection for China (HiCIPC) dataset. This dataset was generated based on daily precipitation and air temperature data provided by the High-resolution China CMIP6 downscaled climate projection dataset (HiCPC) and includes gridded products of multiple extreme climate indices. In this study, the annual products of consecutive wet days (CWD) and growing season length (GSL) were selected, both with a spatial resolution of 0.1°. In addition, solar radiation data were acquired via the Google Earth Engine platform using the TerraClimate dataset. This dataset integrates high-resolution climatological data with global reanalysis datasets and is derived based on a water balance model, with a spatial resolution of 4000 m.
2.2.2. Remote Sensing Data
The remote sensing data utilized in this study were primarily obtained from the National Aeronautics and Space Administration (NASA). These datasets include the following: (1) The MOD15A2H product, which provides 8-day fraction of photosynthetically active radiation (FPAR) data at a spatial resolution of 500 m. This product is generated using a radiative transfer model coupled with a look-up table (LUT) inversion algorithm and represents a standardized global dataset of the fraction of photosynthetically active radiation absorbed by vegetation canopies. (2) The MOD09A1 8-day surface reflectance product, which has undergone atmospheric correction, aerosol correction, and bidirectional reflectance distribution function (BRDF) adjustment. It provides stable spectral information in the near-infrared (NIR), shortwave infrared (SWIR), and green (GREEN) bands with a spatial resolution of 500 m. To address anomalous and missing pixels in MOD09A1 caused by cloud contamination or sensor limitations, a cloud-removal algorithm was applied for data filtering. (3) The MOD10A1 product provides daily snow cover data at a spatial resolution of 500 m. This dataset identifies snow cover distribution based on the normalized difference snow index (NDSI) algorithm and effectively captures the spatiotemporal dynamics of snow cover in alpine regions.
To quantitatively assess the intensity of human activities, this study incorporated the global annual terrestrial human footprint dataset for 2000–2022 developed by Mu et al. [26]. This dataset was generated within a unified framework by integrating eight variables representing anthropogenic pressures, including population density, nighttime lights, and agricultural and pastoral land use. Furthermore, this dataset achieves spatiotemporally consistent representation over long time series at a 1 km spatial resolution and, through validation against existing human footprint products and visual interpretation samples, demonstrates high accuracy and reliability, thereby providing robust support for multi-scale assessments of human activity impacts.
2.2.3. Land Use Data
Land use data were derived from the GLC-FCS30D global 30 m fine-resolution land cover product released by the Aerospace Information Research Institute, Chinese Academy of Sciences. This dataset adopts a hierarchical classification scheme comprising 35 land cover categories, with a temporal coverage spanning from 1985 to 2022. The overall accuracy of the basic classification system (10 classes) reaches 80.88% (±0.27%), while the Level-1 validation system of the Land Cover Classification System (LCCS) (17 classes) achieves an accuracy of 73.04% (±0.30%) [27].
2.2.4. NPP Validation Data and Other Datasets
In this study, MODIS products and in situ observations were employed for NPP validation: (1) The MODIS-based validation utilized the MOD17A3HGF dataset, which provides annual vegetation NPP data from 2001 to 2022 at a spatial resolution of 1000 m for consistency comparison. This product is derived using a light-use efficiency (LUE) model, which integrates MODIS-derived FPAR with meteorological driving variables to estimate daily photosynthesis and subsequently aggregates it to annual NPP. (2) The in situ observational data were obtained from the global terrestrial ecosystem net primary productivity (NPP) observation database published by Rodal et al. [28] and used as an independent dataset for model validation. This database compiles field-measured NPP observations from diverse terrestrial ecosystems worldwide spanning 1959–2023 and has undergone standardized data processing and rigorous quality control procedures. According to the spatial extent of this study (the Qinghai–Tibetan Plateau) and the study period (2000–2022), the database was screened using both spatial and temporal constraints. Following the combined spatial and temporal filtering, a total of 14 valid NPP observations were retained for model validation.
The administrative boundary and elevation data of the study area were obtained from the National Geomatics Center of China (https://www.ngcc.cn/, accessed on 11 June 2025). To eliminate spatial inconsistencies among different data sources, all raster datasets were subjected to batch projection transformation, standardized to a common grid structure, and resampled to a spatial resolution of 1 km. Specifically, the land use dataset was resampled using the nearest-neighbor method to preserve categorical land cover information, whereas all other continuous variables were resampled using bilinear interpolation. Finally, all datasets were masked and clipped according to the boundary of the Qinghai–Tibetan Plateau to generate a spatially consistent dataset with a unified geographic reference framework. In terms of temporal scale integration, FPAR data from the MOD09A1 and MOD15A2H products were composited using the monthly median method to generate monthly time series; monthly temperature data were aggregated to annual variables using the annual mean approach, whereas monthly precipitation data and MOD17A3HGF data were accumulated annually to derive yearly totals.
Table 1.
Descriptions of datasets utilized in this research.
The main procedures of this study consist of three components: NEP estimation, spatiotemporal dynamics analysis, and driving mechanism analysis. The overall technical framework is illustrated in Figure 2.
Figure 2.
Schematic workflow of NEP estimation based on the improved CASA model and its response mechanisms to environmental factors.
2.3. Methods
2.3.1. Estimation of Vegetation NPP and NEP
Net ecosystem productivity (NEP) is quantified by subtracting heterotrophic respiration from the total carbon fixed by net primary productivity (NPP), representing the net carbon exchange between terrestrial ecosystems and the atmosphere. The calculation formula is as follows:
where , , and denote the net ecosystem productivity, net primary productivity, and carbon emissions from soil microbial (heterotrophic) respiration at pixel x in year t, respectively (expressed as g C·m−2·a −1). The sign of directly determines the carbon source–sink status of the ecosystem: when vegetation carbon sequestration offsets and exceeds heterotrophic respiration ( > 0), the system functions as a carbon sink. Conversely, when heterotrophic respiration exceeds vegetation carbon fixation ( < 0), the ecosystem is functionally characterized as a carbon source to the atmosphere.
The spatial distribution of Rh was estimated using an empirical regression model developed by Pei et al. [29]. This model was constructed based on long-term in situ observations from typical alpine grasslands on the Tibetan Plateau and demonstrates a strong capability for characterizing carbon flux dynamics under high-altitude extreme environmental conditions. The specific calculation formula is as follows:
where and represent the mean annual air temperature (°C) and annual precipitation (mm) at pixel x in year t, respectively; denotes heterotrophic soil respiration.
This study employed the improved CASA model proposed by Zhu et al. [30] to quantitatively estimate NPP on the Tibetan Plateau from 2000 to 2022. The model determines the maximum light-use efficiency (LUEmax) for different vegetation types based on a detailed land cover classification scheme, thereby overcoming the limitations of traditional models that use globally uniform static values. Additionally, a land-surface water index (LSWI)-based simplified model was introduced in this study, leveraging the sensitivity of shortwave infrared reflectance to leaf water content to directly characterize water stress through remote sensing observations. Furthermore, the LSWI time series were subjected to gap-filling and filtering processes to reduce the influence of anomalous values. The NPP is calculated as follows:
where denotes the absorbed photosynthetically active radiation (MJ m−2) at pixel x in month t, while represents the actual light-use efficiency (g C MJ−1) of vegetation at pixel x in month t.
The specific formulations for and are as follows:
where represents the total solar radiation (MJ m−2) at pixel x in month t; 0.5 denotes the proportion of total solar radiation that is photosynthetically active radiation available for vegetation use; and ( refers to the fraction of incoming photosynthetically active radiation absorbed by vegetation at pixel x in month t. Following the improvement strategies of Li et al. [31] and Zhao et al. [32], this study employs FPAR derived from the MOD15A2 remote sensing product to replace the FPAR estimated using the empirical relationship with normalized difference vegetation index (NDVI) in the original model. The formula is shown below:
where and represent the low-temperature and high-temperature stress coefficients, respectively. denotes the water stress coefficient. represents the maximum light use efficiency under ideal conditions, which is assigned a uniform value of 0.389 g C MJ−1 in the original model. In this study, following the simulation results of Zhu et al. [11], different values of are assigned to different vegetation types.
The temperature stress scalar was constructed based on air temperature within the CASA model framework [4,33], with normalization procedures and threshold constraints incorporated in practical applications, consistent with the regionalized modifications proposed by Zhu et al. [11] constructed based on air temperature variables. The water stress coefficient was derived according to the improved methods of Xiao et al. [34] and Bao et al. [8], using the remotely sensed LSWI to dynamically characterize the constraints of water availability on vegetation photosynthesis:
where denotes the land surface water index, derived from the normalized difference between near-infrared and shortwave infrared reflectance. represents the maximum value for a given pixel during the growing season, estimated using the maximum value composite (MVC) method. Subsequently, a combination of historical time series interpolation and spatial neighborhood interpolation was applied to achieve full coverage of missing data. Finally, the Savitzky–Golay (SG) filtering method was employed for smoothing and noise reduction.
2.3.2. Spatiotemporal Dynamics Analysis of NEP
The Theil–Sen trend analysis is a robust nonparametric estimator based on rank statistics, which effectively mitigates the influence of outliers and noise and demonstrates strong robustness for non-normally distributed data [35]. In this study, this method was applied to quantify the temporal trend of NEP on the Tibetan Plateau from 2000 to 2022, and the calculation formula is as follows:
where denotes the Sen’s slope, while and represent the values of the time series at time points and , respectively, where 2000 ≤ < ≤ 2022 in this study.
The Mann–Kendall test was employed to assess the significance of the Sen’s slope trend analysis results; it does not require assumptions of normality and is therefore well-suited to handling outliers and missing values in environmental time series [36].
Hot spot and cold spot analysis (Getis-Ord Gi*) was employed to identify the spatial clustering characteristics of NEP on the Tibetan Plateau, and the Gi* statistic was calculated for each pixel. With the criterion of Z > |1.96| (p < 0.05) for 95% confidence, statistically significant hotspots (high-value clusters) and cold spots (low-value clusters) of NEP were precisely extracted within the study area. The calculation formula is as follows:
where denotes the mean NEP, represents the standard deviation of NEP; is the standardized spatial weight matrix, and is the total number of pixels; a larger value indicates a higher degree of hotspot clustering for NEP, whereas a smaller value corresponds to a stronger cold spot clustering pattern.
In addition, this study constructed a transition matrix of NEP classes for the period 2000–2022. By quantitatively analyzing the transformation pathways and distribution characteristics among different classes, the dynamic evolution and stability of vegetation carbon sequestration levels during the study period were explicitly revealed.
2.3.3. Optimal Multivariate-Stratification Geographical Detector (OMGD) Model
The geographical detector is a statistical framework designed to detect spatial heterogeneity and reveal its driving forces [37], enabling the quantitative assessment of the contribution of independent variables to the dependent variable. However, conventional geographical detector (GD) and optimal parameter-based geographical detector (OPGD) methods primarily focus on single-factor discretization and often fail to accurately capture complex nonlinear interactions among multiple factors due to subjective discretization schemes. In this study, the optimal multivariate-stratification geographical detector (OMGD) model proposed by Guo et al. [16] was employed. By introducing two additional modules—factor discretization optimization and scale detector—the OMGD model overcomes the limitations of traditional one-dimensional stratification. It achieves the automatic identification of factor combinations and optimal discretization levels through multivariate joint stratification and parameter space optimization, thereby reducing subjective bias and more objectively revealing synergistic enhancement mechanisms and complex nonlinear responses among multiple drivers.
The OMGD framework consists of six components, among which the factor detector, interaction detector, and risk detector were utilized in this study to identify the driving factors and response mechanisms of NEP variation. The factor detector employs the q-statistic to quantify the explanatory power of a single variable on the spatial differentiation of NEP, with values approaching 1 indicating stronger explanatory power. The interaction detector reveals whether multiple variables jointly exert interactive effects on the response variable, as well as the type and magnitude of such interactions (Table 2).
where denotes the number of strata of the driving factor; represents the sample size within the h-th stratum, and denotes the variance of NEP within that stratum; and correspond to the total sample size and the overall variance of NEP within the study area, respectively.
Table 2.
Types of independent variable interactions.
The risk detector aims to identify environmental conditions most conducive to vegetation carbon sequestration, thereby quantitatively determining the sensitive intervals of NEP responses to driving factors. It first calculates and compares the mean NEP under different environmental gradients, with the formula expressed as follows:
where represent the mean NEP values for the i-th and j-th strata of the driving factor, respectively; and denote the variances of NEP for the i-th and j-th strata, respectively; and represent the sample sizes corresponding to the i-th and j-th strata of the driving factor.
Subsequently, a t-test (p < 0.05) was applied to identify statistically significant differences within each factor, and the degrees of freedom were calculated as follows:
3. Results
3.1. Validation of Vegetation Net Primary Productivity (NPP) Estimation Accuracy
To evaluate the reliability of the vegetation NPP estimated by the improved CASA model over the Qinghai–Tibetan Plateau and to ensure the credibility of the NEP results, this study primarily employed two strategies: validation using in situ observations and comparison with remote sensing data products. In this study, the global terrestrial ecosystem NPP observation database published by Rodal et al. [28] on the Scientific Data platform was employed as an independent validation dataset to evaluate the NPP estimates derived from the CASA model. The results demonstrated strong agreement between the model-derived estimates and field-measured observations at the spatial scale, with a significant positive correlation coefficient of R = 0.690 (p < 0.0063) (Figure 3a).
Figure 3.
Validation of the improved CASA model: scatter plots showing the consistency of the simulated NPP with (a) station-based measurements and (b) MODIS satellite products.
The MOD17A3HGF dataset provides vegetation NPP data from 2001 to 2022. By randomly and uniformly sampling 2000 points annually within the study area, the correlation between the CASA-estimated NPP and MODIS-derived NPP at these sample locations was evaluated. The results demonstrate a high level of statistical consistency between the two datasets, with a correlation coefficient of R = 0.86 (p < 0.001), indicating that the estimated vegetation productivity in this study is highly accurate (Figure 3b). This finding complements the validation based on in situ observations and jointly confirms the robustness of the NEP estimation results in this study.
3.2. Spatial Distribution of NPP and NEP
From 2000 to 2022, NPP and NEP in the study area exhibited pronounced and highly consistent spatial heterogeneity (Figure 4), both showing a distribution pattern characterized by higher values in the southeast and lower values in the northwest. To facilitate the characterization of spatial variations in vegetation productivity across the study area, NEP on the Qinghai–Tibetan Plateau was classified into five levels at 250 g C m−2 yr−1 intervals based on its value range: extremely low (<250 g C·m−2·a−1), low (250–500 g C·m−2·a−1), moderate (500–750 g C·m−2·a−1), high (750–1000 g C·m−2·a−1), and extremely high (>1000 g C·m−2·a−1). High carbon sink regions (NEP > 750 g C·m−2·a−1) are primarily distributed in the southeastern evergreen coniferous and broadleaf forest zones, covering an area of approximately 52,180 km2. In contrast, carbon source regions (NEP < 0 g C·m−2·a−1) and extremely low-value areas are mainly located in the sparsely vegetated central and northwestern desert–steppe regions, with a carbon source area of about 22,790 km2. This spatial pattern reflects the pronounced regional heterogeneity of vegetation carbon sequestration capacity across the Tibetan Plateau, which is primarily regulated by the gradient of regional hydrothermal conditions. The southeastern plateau is strongly influenced by the Asian monsoon, receiving abundant precipitation and supporting relatively high vegetation cover, whereas the northwestern plateau is located deep within the continental interior, where moist air masses are effectively blocked by surrounding mountain ranges, limiting atmospheric moisture transport [12]. Coupled with the constraints imposed by extensive deep permafrost, these environmental conditions jointly restrict vegetation productivity and the carbon sequestration capacity of the ecosystem [38].
Figure 4.
Spatiotemporal patterns and statistical distribution of (a) NPP and (b) NEP within the study area.
Statistical analysis indicates that the multi-year mean values of NPP and NEP in the study area are 237.53 g C·m−2·a−1 and 219.61 g C·m−2·a−1, respectively, with peak values exceeding 2000 g C·m−2·a−1 and 1500 g C·m−2·a−1, respectively. In terms of distribution characteristics, the kurtosis values of NPP and NEP (1.46 and 1.71, respectively) both exhibit a leptokurtic pattern, indicating a high frequency concentration in low-value regions and demonstrating that only a limited proportion of the study area maintained relatively high productivity. Meanwhile, the positive skewness values of 1.11 and 1.17 suggest that the distribution centers of both variables are significantly shifted toward low-value regions (<200 g C·m−2·a−1). These statistical features reveal a markedly asymmetric spatial pattern of ecosystem carbon sequestration capacity across the Qinghai–Tibetan Plateau, where regions with high carbon sink potential are primarily confined to localized areas with favorable ecological and environmental conditions.
3.3. Spatiotemporal Evolution of NEP
3.3.1. Spatiotemporal Variations of NEP
In terms of temporal dynamics (Figure 5b), the mean NEP over the Qinghai–Tibetan Plateau exhibited a significant increasing trend from 2000 to 2022 (p < 0.01), with an average annual increment of 1.596 g C·m−2·a−1 and a multi-year mean of 253.744 g C·m−2·a−1. The peak NEP occurred in 2014, reaching 271.860 g C·m−2·a−1. This increase is primarily attributed to the prolongation of the growing season driven by a warming and humidifying climate, as well as a series of ecological conservation programs implemented by the Chinese government since the beginning of the 21st century [19,39,40] Despite the overall upward trend, NEP exhibited pronounced interannual variability, characterized by distinct “pulse-like” declines. Notably, significant negative anomalies in NEP were observed in 2011 and during 2019–2020. The marked decline in 2011 was mainly constrained by seasonal drought induced by climate warming [41]; The reduction in NEP during 2019–2020 may be associated with significant positive anomalies in winter snowfall under the background of an extreme El Niño event, which, coupled with a phase of regional warming–drying climate variability, disrupted the hydrothermal conditions during the growing season and consequently weakened the net carbon uptake capacity of the ecosystem [42].
Figure 5.
Spatiotemporal evolution of vegetation NEP on the Tibetan Plateau from 2000 to 2022: (a) Spatial distribution of change significance; (b) Interannual trend and anomaly analysis.
From the perspective of spatial trends and their areal statistics (Figure 5a), the vegetation carbon sequestration capacity on the Qinghai–Tibetan Plateau showed an overall increasing trend while exhibiting pronounced spatial heterogeneity. Based on the results of the Theil–Sen trend analysis and the Mann–Kendall significance test, NEP trends were classified into five categories: significant decrease, non-significant decrease, no significant change, non-significant increase, and significant increase, with the significance level set at p < 0.05. Approximately 71.2% of the region demonstrated an increasing trend in vegetation NEP, with 52.5% exhibiting a statistically significant increase, indicating that the carbon sink capacity of Tibetan Plateau vegetation has generally strengthened over the past two decades. The significantly increasing areas are mainly concentrated in the central and eastern humid regions, as well as alpine meadow zones, indicating that ecosystem productivity has improved more markedly in areas with relatively favorable climatic conditions. In contrast, about 12.7% of the areas in the central–western transitional zone exhibited non-significant changes, suggesting that these areas may have remained in a relatively stable state under the combined influence of multiple ecological processes. Meanwhile, approximately 16.1% of the study area exhibited a declining trend in NEP, including 8.3% with a significant decrease and 7.8% with a non-significant decrease. These areas were defined as carbon sink degradation risk zones in this study and were primarily distributed across the ecologically fragile regions of the central and southern Qinghai–Tibet Plateau.
3.3.2. Spatial Clustering Characteristics of NEP
According to the hot spot–cold spot analysis (Getis–Ord Gi*) conducted at five-year intervals from 2000 to 2022, NEP across the Qinghai–Tibetan Plateau exhibited significant spatial heterogeneity and structured clustering patterns (Figure 6). Hot spot areas were primarily concentrated in the southeastern region, characterized by high-biomass forest distribution and persistence over time, predominantly at the 99% confidence level, exhibiting a dynamic process of initial contraction followed by expansion and ultimately forming a stable carbon sink core area. In contrast, cold spot regions with low NEP values were mainly distributed in the northwestern alpine desert zone, showing a trend of “rapid decline followed by recovery with an overall westward shift. In 2000, cold spot areas were extensive and mainly identified at the 95% confidence level; subsequently, the degree of cold spot clustering decreased to its lowest level in 2005, reflecting a weakening in the spatial continuity of low-carbon sequestration areas and a partial recovery of regional carbon sink capacity during the early stage of the study. After 2010, cold spot areas at the 99% confidence level gradually expanded westward and became stabilized, suggesting that areas with low carbon sink capacity became progressively concentrated in the alpine and arid interior characterized by more severe natural conditions, with their spatial distribution being jointly regulated by regional climatic gradients, vegetation types, and ecological environmental gradients [43].
Figure 6.
Spatial clustering dynamics of NEP based on Getis-Ord Gi* analysis at five-year intervals (2000–2020) and for 2022: (a–f) represent the hotspot and cold spot distributions for 2000, 2005, 2010, 2015, 2020, and 2022.
3.3.3. Transition of NEP Classification Levels
According to the proportional area statistics of each category from 2000 to 2022 (Figure 7b), low-level NEP accounted for the largest share, forming the dominant structure of the plateau carbon sink, whereas the extremely high-level category occupied the smallest proportion. Both categories exhibited strong spatial stability over the long-term period, with minimal interannual variation. In contrast, the proportion of the extremely low-level NEP area showed significant variation from 2000 to 2022, displaying an overall trend of “rapid decline followed by low-level fluctuations.”
Figure 7.
Dynamic evolution and structural transitions of NEP levels on the Tibetan Plateau (2000–2022): (a) Transfer matrix visualization via Sankey diagram; (b) Interannual variations in the area proportions of five NEP categories.
Drawing on the transition matrix and net change analysis (Figure 7a, Table 3), the NEP grade structure on the Tibetan Plateau exhibited distinct phased adjustments from 2000 to 2022, characterized by an overall upward trend—a structural optimization where grades shifted from lower to medium-high levels. The period from 2000 to 2005 exhibited the most pronounced transitions among NEP classes, with the area classified as the very low category decreasing by 490,895 km2 (88.96%), indicating a large-scale release of carbon sequestration potential in low-productivity regions during the early study period. Although the extent of the very low NEP class subsequently fluctuated and partially rebounded, its rate of increase slowed considerably; between 2020 and 2022, the area further declined slightly to 113,847 km2 (−22.80%), suggesting that following the rapid improvement observed in the early years, low carbon sink regions continued to contract while gradually approaching a relatively stable state. Driven by large-scale transitions from the extremely low category, the low-level NEP area increased sharply by 53.60% to a peak of 1,210,353 km2 in 2005, after which it continuously transitioned toward the moderate and high NEP classes, ultimately declining to 1,058,930 km2 by 2022. This pattern of initial expansion followed by contraction reflects a progressive upgrading pathway within the system from lower to higher productivity levels. The moderate and high-level NEP categories exhibited a steadily strengthening supporting role. Except for a slight decline during 2010–2015 (−1.77%), the moderate-level area maintained an overall upward trend, becoming the dominant component of the regional carbon sink; the high-level area increased progressively from 2000 and reached a stage peak of 121,496 km2 in 2015; although the net rate of change exhibited a slight decline between 2015 and 2022, the overall trend remained one of steady expansion. Throughout the study period, the area of the extremely high-level category remained consistently around 43,000 km2, with fluctuations not exceeding 1%. This high degree of stability indicates that core carbon sink areas, represented by regions with extremely high NEP (>1000 g C m−2 yr−1), possess strong resistance to disturbances and serve as a fundamental cornerstone for maintaining regional carbon cycle equilibrium. Notably, NEP class transitions during 2000–2022 occurred predominantly between adjacent classes, whereas cross-class shifts were relatively uncommon, indicating that the enhancement of vegetation carbon sequestration capacity across the Tibetan Plateau was characterized by gradual recovery rather than abrupt improvement, thereby reflecting the continuous and cumulative responses of regional ecosystems.
Table 3.
Net area change and change rate of NEP classes on the Tibetan Plateau (2000–2022).
3.4. Driving Forces of NEP
This research, leveraging the optimal multivariate-stratification geographical detector model, selected five natural meteorological factors—precipitation (PRE), temperature (TEM), growing season length (GSL), consecutive wet days (CWD), and snow cover days (SnowDays)—and one social factor, the human footprint (HFP). It further evaluated and quantified the independent influence, coupling effect, and conditional response of these six driving factors on the spatial heterogeneity of NEP for the years 2000, 2005, 2010, 2015, 2000, and 2022.
The q-statistic derived from the factor detector directly reflects the explanatory power and differentiation capacity of each individual factor on the spatial variability of NEP. The results (Figure 8) indicate that the ranking of q-values in 2000 differs from other years, whereas from 2005 to 2022 the q values remained highly stable with only minor fluctuations, suggesting that the dominant drivers governing the spatial heterogeneity of NEP across the Tibetan Plateau exhibited strong temporal consistency. In 2000, precipitation exhibited the strongest explanatory power for NEP spatial distribution (q = 0.796), followed by air temperature (q = 0.775). After 2005, air temperature became the dominant factor, followed closely by precipitation, with only a marginal difference between the two, highlighting the primary controlling role of hydrothermal conditions in shaping the spatial heterogeneity of NEP on the Qinghai–Tibetan Plateau. Meanwhile, the explanatory power of the growing season length consistently remained at a relatively high level (0.65 < q < 0.75) and ranked third throughout the study period, indicating that, in addition to hydrothermal conditions, the duration of the growing season is also a critical eco-climatic factor governing the spatial heterogeneity of regional carbon sink capacity. An extended growing season enhances the duration of photosynthetic carbon assimilation, thereby increasing ecosystem net carbon uptake capacity [44]. In contrast, consecutive wet days and snow cover days exhibited relatively weak explanatory power (q < 0.4), while the human footprint showed the weakest influence on NEP spatial heterogeneity (q < 0.1). These findings suggest that, at the scale of the Qinghai–Tibetan Plateau, the spatial differentiation of NEP is predominantly controlled by large-scale hydrothermal resource availability, whereas extreme or episodic climatic events mainly affect interannual variability rather than long-term spatial patterns [45]. Consequently, their direct influence on the regional carbon sink structure is relatively limited. Moreover, owing to the low population density and the generally limited intensity of anthropogenic activities across the Tibetan Plateau, human activities have not emerged as the dominant driver of the spatial heterogeneity of NEP, indicating that the functioning of the plateau ecosystem remains primarily regulated by natural processes [39]. Changes in NEP require not only an analysis of the explanatory power of individual factors but also an examination of the interactions among factors. The interaction detector results (Figure 8) indicate that the spatial differentiation of NEP on the Qinghai–Tibetan Plateau is not governed by a single factor, but rather jointly determined by the coupling of multiple environmental variables, exhibiting an overall nonlinear relationship. Among these, precipitation (PRE) in combination with other factors showed strong explanatory power for NEP spatial heterogeneity, and its interaction with air temperature (TEM) consistently yielded the highest q-values, characterized by bivariate enhancement. The corresponding q value increased continuously from 0.795 in 2000 to 0.886 in 2022, indicating a progressively strengthening synergistic effect over the study period. These findings suggest that a pronounced synergistic amplification mechanism exists between water availability and thermal conditions on the Tibetan Plateau, whereby favorable moisture and temperature conditions jointly promote vegetation photosynthesis and soil carbon sequestration, thereby enhancing ecosystem carbon uptake simultaneously, with this coupling effect becoming increasingly pronounced during the later stages of the study period. These results further confirm that carbon sink formation in alpine ecosystems is primarily regulated by coupled hydrothermal processes, which is consistent with the findings of Piao et al. [46] and Nemani et al. [47], who demonstrated that global vegetation productivity is predominantly controlled by the synergistic effects of water and thermal conditions. In addition, the interaction between precipitation and snow cover days exhibited relatively high q-values, substantially exceeding that of the snow cover days factor alone, and manifested as bivariate enhancement in 2010, 2020 and 2022. This finding indicates that the direct influence of snow cover days on NEP is relatively limited and is expressed primarily through its interaction with precipitation, whereby snow indirectly enhances ecosystem productivity by regulating snowmelt recharge, soil moisture availability, and spring water supply, thereby producing a synergistic amplification effect on the spatial heterogeneity of NEP. Overall, from 2000 to 2022, the interaction types among most driving factors were dominated by the nonlinear weakening of single factors, followed by bivariate enhancement or nonlinear weakening, with no independent relationships observed among factors. Moreover, the explanatory power of multi-factor interactions was consistently greater than that of any individual factor, further demonstrating that the spatial heterogeneity of NEP across the Tibetan Plateau is primarily governed by the coupled effects of environmental drivers, particularly hydrothermal resources and growing season dynamics, rather than by any single environmental variable. Furthermore, this dominant driving pattern remained highly stable throughout the period from 2005 to 2022, indicating strong temporal consistency in the mechanisms controlling the spatial differentiation of regional carbon sink capacity.
Figure 8.
Independent and interactive effects of driving factors on the spatial heterogeneity of NEP from 2000 to 2022: (a–f) present the annual results of factor detectors (right) and interaction detectors (left). Note: For each year (a–f), the right panel displays the q-statistics from the factor detector for individual drivers, while the left panel shows the q-statistics from the interaction detector for pairwise factors. PRE: Precipitation; TEM: Temperature; GSL: Growing season length; CWD: Consecutive wet days; SnowDays: Snow cover days; HFP: Human footprint.
This study further employed a risk detector to identify the differences in NEP means across different levels for each factor and selected the top five combinations with the strongest interactions. The results indicate that, during the study period from 2000 to 2022, NEP responses to two-factor interactions exhibited pronounced nonlinearity and phase-dependent characteristics, with distinct optimal response levels across different years (Figure 9). Specifically, the synergistic effect of PRE × TEM generally resulted in the highest NEP at the high-level (d) category in most years; however, in 2010, the mean NEP at this level dropped to the lowest value. This indicates that the response of NEP to hydrothermal conditions exhibits a pronounced nonlinear threshold effect, such that higher levels of water and thermal availability do not necessarily correspond to greater vegetation carbon sequestration capacity. Once the coupling of water and thermal conditions on the Tibetan Plateau exceeds the ecological tolerance range of the ecosystem, excessively strong hydrothermal interactions may instead induce a decline in ecosystem productivity. Therefore, the optimal hydrothermal stratification does not necessarily represent the optimum state for ecosystem productivity, as its effects remain constrained by water limitation and regulated by extreme climatic events. In contrast, the PRE × GSL combination exhibited a marked increase in inter-level differences after 2015, with the optimal stratum shifting from Class d to Class b in 2020, before reverting to Class d in 2022. This indicates that the positive effect of an extended growing season on NEP is strongly stage-dependent and relies on a concurrent match between the growing season duration and water availability. As the regional climatic background evolved, the optimum response interval of NEP underwent dynamic shifts and exhibited a certain degree of resilience following improvements in hydrothermal conditions [46,48]. Similar inconsistencies were observed in other combinations; for instance, the high-level responses of PRE × SD and PRE × CWD fluctuated markedly across different years, suggesting that snow processes and persistent precipitation regulate NEP primarily through stage-dependent effects by altering snowmelt recharge, the temporal distribution of water availability, and resource allocation during the growing season, rather than exerting a persistent and stable positive influence. In contrast, within the PRE × HFP combination, NEP was more stable at mid-to-high levels (b–c), although certain years exhibited missing stratifications. This pattern is primarily attributable to the limited spatial overlap between areas of high human activity intensity and regions receiving abundant precipitation across the Tibetan Plateau, resulting in insufficient valid samples for specific strata rather than statistical artifacts. These findings indicate that anthropogenic activities are strongly constrained by the natural environmental setting, and their influence on the spatial heterogeneity of NEP is manifested mainly through localized regulatory effects rather than serving as a dominant driver at the regional scale. Significance tests indicated that NEP differences between most strata were statistically meaningful, except for the a and b levels in the 2000 PRE × HFP combination. This suggests that in regions of low human activity intensity, NEP responds more gradually to this combination, with differences progressively increasing as the levels rise. Overall, the risk detector analysis demonstrates that the response of NEP across the Tibetan Plateau to multi-factor interactions is not governed by a single pattern of high-level synergistic effects but is jointly regulated by the dynamic migration of environmental thresholds and the reconfiguration of coupling relationships among multiple interacting factors. Carbon sink formation in alpine ecosystems is characterized by pronounced nonlinearity, dynamic behavior, and strong spatiotemporal dependence; therefore, under ongoing climate change, variations in regional NEP cannot be adequately explained by any single environmental factor alone but instead require comprehensive consideration of multi-factor coupling processes and their associated threshold effects.
Figure 9.
Nonlinear responses of NEP to optimal environmental strata during 2000–2022: (a–f) identify the suitable intervals for the top five interactive factor pairs based on the OMGD risk detector in 2000, 2005, 2010, 2015, 2020, and 2022. Note: Strata a, b, c, and d indicate different hierarchical levels of the coupled factor layers. The height of the bars reflects the mean NEP value within each stratum.
4. Discussion
4.1. Spatial Differences Between NEP and NPP
This study estimated the NPP and NEP on the Qinghai–Tibet Plateau using an improved CASA model and soil respiration equation. The spatial patterns of the two variables are generally consistent, both exhibiting a distribution characterized by higher values in the southeast and lower values in the northwest. According to the calculation formula of NEP (NEP = NPP − Rh), soil respiration (Rh) was also estimated, and its spatial distribution exhibited a similar regional gradient (Figure 10). This consistency suggests a certain degree of spatial covariation between soil respiration (Rh) and NPP, which may primarily be associated with the following ecological mechanisms: (1) in terrestrial ecosystems, higher vegetation productivity is typically associated with greater carbon inputs, including increased litter accumulation and root exudation, which provide energy sources for microbial decomposition. Consequently, soil respiration tends to increase in tandem with vegetation productivity across space, forming a coupled relationship between productivity and soil respiration [49]. Moreover, root respiration and rhizosphere microbial activity constitute important components of Rh, and increases in vegetation biomass often simultaneously enhance these processes [50,51]. (2) Hydrothermal conditions are key climatic factors regulating the spatial variability of both NPP and Rh on the Qinghai–Tibetan Plateau [52,53]. The southeastern region, influenced by the Asian monsoon, is characterized by abundant precipitation and relatively high temperatures, which not only promote photosynthesis and biomass accumulation but also enhance microbial metabolism and organic matter decomposition, thereby jointly increasing NPP and Rh [54]. Conversely, the cold and arid environment of the northwestern region constrains both vegetation growth and microbial activity, leading to synchronous reductions in NPP and Rh.
Figure 10.
Mean soil heterotrophic respiration (Rh) on the Tibetan Plateau during 2000–2022: (a) spatial pattern; (b) statistical frequency distribution.
4.2. Mechanisms of NEP Spatial Differentiation and Optimal Threshold Effects Driven by Hydrothermal Synergy
This study employed the optimal multivariate stratification geographical detector (OMGD) to analyze the primary driving mechanisms of NEP on the Qinghai–Tibetan Plateau. The factor detector results indicate that air temperature and precipitation consistently dominate the explanatory power for NEP spatial distribution (q > 0.77), confirming the high sensitivity of plateau ecosystems to hydrothermal variability. This finding is consistent with the conclusions of Piao et al., who demonstrated that suitable temperature conditions enhance plateau productivity by prolonging the growing season, while sufficient precipitation alleviates physiological drought in high-altitude regions. It also highlights the synergistic regulation of vegetation carbon fixation processes by hydrothermal factors [19,55].
Notably, the risk detector further identified that NEP mean values reached higher levels under specific combinations of temperature and precipitation classes, indicating the existence of a distinct “optimal hydrothermal threshold window” for carbon uptake on the plateau. This is consistent with global-scale studies showing that terrestrial ecosystem productivity is not indefinitely enhanced by a single factor but depends on the coordinated balance between temperature and water availability [47].
Moreover, the interaction between precipitation and temperature exhibited substantially stronger explanatory power than individual factors. This nonlinear enhancement effect implies that the positive impact of a single hydrothermal factor on NEP is constrained by the availability of the other factor. In the alpine arid and semi-arid regions of the Qinghai–Tibetan Plateau, carbon sink enhancement driven by thermal conditions is often limited by water deficits [56]. Only when hydrothermal resources are highly coupled in space can a stable and strong carbon sink pattern be established [47]. This multi-factor coupling relationship demonstrates that the OMGD model can effectively identify complex ecological drivers and provides a spatial basis for understanding carbon balance responses of alpine ecosystems under climate change.
4.3. Limitations and Future
This study estimated the vegetation NEP on the Qinghai–Tibetan Plateau from 2000 to 2022 using the improved CASA model proposed by Zhu et al. [30]. Influenced by high altitude, complex terrain, and climate sensitivity, ecological processes and carbon cycle mechanisms in this region exhibit pronounced spatial heterogeneity, leading to unavoidable uncertainties in estimation. These uncertainties primarily arise from two sources: first, the simulation of vegetation NPP, which is affected by remote sensing parameter retrievals and model parameter settings; and second, the estimation of soil microbial respiration (Rh), which is a key component of ecosystem carbon exchange and a major source of uncertainty in NEP estimation. Rh is highly sensitive to variations in soil temperature, moisture conditions, substrate availability, and freeze–thaw processes, and these complex environmental controls may further increase the uncertainty of regional carbon budget assessments on the Qinghai–Tibetan Plateau [53,57]. Comparison indicates that the NPP estimates in this study are highly consistent with NPP derived from MODIS products and in-situ observations, suggesting that the uncertainty in NEP estimates is more likely attributable to the parameterization and spatial variability of soil respiration, particularly Rh estimation. Meanwhile, long-term and spatially representative Rh observations across the Qinghai–Tibetan Plateau remain limited, making independent validation of Rh estimates at the regional scale challenging. Therefore, future studies should further implement long-term ecosystem respiration observations, develop improved Rh parameterization schemes, and conduct multi-model, multi-algorithm, and multi-scale cross-validation based on multi-source data integration to improve the reliability of carbon budget assessments on the Qinghai–Tibetan Plateau.
Permafrost on the Qinghai–Tibetan Plateau plays a crucial role in the regional carbon cycle. Permafrost stores large amounts of organic carbon, and its thawing under climate warming may promote microbial decomposition and release CO2 and CH4, thereby affecting the regional carbon balance [58]. However, significant uncertainties remain in permafrost studies on the Qinghai–Tibetan Plateau, mainly due to the highly heterogeneous spatial distribution, insufficient long-term observational data, and limitations in modeling capability [59,60,61]. Consequently, permafrost degradation processes were not explicitly incorporated into the driving factor framework in this study. Future research could further explore its influence on NEP dynamics by integrating indicators such as active-layer thickness and soil temperature. Although land use change is an important driver of regional carbon cycling, it has already been incorporated into the NEP estimation through the parameterization of LUEmax in the CASA model. Including it as an additional driving factor in the geographical detector analysis could introduce endogeneity bias. Moreover, because land use change across the Qinghai–Tibetan Plateau was relatively limited during the study period, it was not considered an independent driving factor in this study [62].
5. Conclusions
(1) From 2000 to 2022, vegetation NPP and NEP on the Qinghai–Tibetan Plateau exhibited significant spatial heterogeneity, characterized by an overall pattern of higher values in the southeast and lower values in the northwest. High-value regions were mainly concentrated in southeastern forest ecosystems, whereas the northwestern alpine desert regions were dominated by low values or acted as carbon source areas. The multi-year mean values of NPP and NEP in the study area were 237.53 g C·m−2·a−1 and 219.61 g C·m−2·a−1, respectively, both showing positively skewed distributions.
(2) During the study period, NEP on the Qinghai–Tibetan Plateau showed a significant increasing trend, with a growth rate of 1.596 g C·m−2·a−1 and a mean value of 253.744 g C·m−2, accompanied by pronounced interannual variability. Notable negative anomalies occurred in 2011 and during 2019–2020. Spatially, approximately 71.2% of the region exhibited an increasing trend in NEP, of which 52.5% was statistically significant, with growth areas mainly located in the central–eastern humid regions and alpine meadow zones. The NEP classification structure overall shifted overall from lower to medium–high levels, with a marked contraction of extremely low-level areas in the early study period, indicating a sustained enhancement of regional carbon sink capacity over the long term.
(3) The spatial differentiation of NEP on the Qinghai–Tibetan Plateau is primarily controlled by hydrothermal conditions, with air temperature and precipitation identified as the most critical driving factors (q > 0.77), followed by the growing season length (0.65 < q < 0.73). Extreme or episodic climatic events (q < 0.4) mainly influenced interannual variability rather than long-term spatial patterns, whereas the independent effect of human activities was the weakest. Moreover, most driving factors exhibited significant coupling effects, particularly the combination of temperature and precipitation, which showed the strongest explanatory power (0.79 < q < 0.89). Synthetically, the regional carbon sink capacity is predominantly governed by the synergistic matching of water and heat and the optimal eco-climatic conditions they jointly establish.
Author Contributions
Conceptualization, Y.L.; methodology, Y.L. and H.W.; software, H.W.; validation, Y.L.; formal analysis, H.L.; investigation, Y.L.; data curation, Y.L.; writing—original draft preparation, Y.L. and F.L.; writing—review and editing, H.L.; visualization, Y.L., H.W., F.L. and X.W.; supervision, H.L.; project administration, H.L.; funding acquisition, H.L. All authors have read and agreed to the published version of the manuscript.
Funding
This research was supported by the National Key R&D Program of China (2024YFD1700200).
Data Availability Statement
The data that support the findings of this study are openly available in “figshare” at https://doi.org/10.6084/m9.figshare.32204697 (accessed on 13 April 2026).
Conflicts of Interest
The authors declare no conflict of interest.
References
- Piao, S.; He, Y.; Wang, X.; Chen, F. Estimation of China’s Terrestrial Ecosystem Carbon Sink: Methods, Progress and Prospects. Sci. China Earth Sci. 2022, 65, 641–651. [Google Scholar] [CrossRef] [Scilit]
- Sha, Z.; Bai, Y.; Li, R.; Lan, H.; Zhang, X.; Li, J.; Liu, X.; Chang, S.; Xie, Y. The Global Carbon Sink Potential of Terrestrial Vegetation Can Be Increased Substantially by Optimal Land Management. Commun. Earth Environ. 2022, 3, 8. [Google Scholar] [CrossRef] [Scilit]
- Field, C.B.; Behrenfeld, M.J.; Randerson, J.T.; Falkowski, P. Primary Production of the Biosphere: Integrating Terrestrial and Oceanic Components. Science 1998, 281, 237–240. [Google Scholar] [CrossRef] [Scilit] [PubMed]
- Potter, C.S.; Randerson, J.T.; Field, C.B.; Matson, P.A.; Vitousek, P.M.; Mooney, H.A.; Klooster, S.A. Terrestrial Ecosystem Production: A Process Model Based on Global Satellite and Surface Data. Glob. Biogeochem. Cycles 1993, 7, 811–841. [Google Scholar] [CrossRef] [Scilit]
- Wang, R.-Y.; Mo, X.; Ji, H.; Zhu, Z.; Wang, Y.-S.; Bao, Z.; Li, T. Comparison of the CASA and InVEST Models’ Effects for Estimating Spatiotemporal Differences in Carbon Storage of Green Spaces in Megacities. Sci. Rep. 2024, 14, 5456. [Google Scholar] [CrossRef] [Scilit] [PubMed]
- Chen, Y.; Xu, Y.; Chen, T.; Zhang, F.; Zhu, S. Exploring the Spatiotemporal Dynamics and Driving Factors of Net Ecosystem Productivity in China from 1982 to 2020. Remote Sens. 2023, 16, 60. [Google Scholar] [CrossRef] [Scilit]
- Huang, C.; Sun, C.; Nguyen, M.; Wu, Q.; He, C.; Yang, H.; Tu, P.; Hong, S. Spatio-Temporal Dynamics of Terrestrial Net Ecosystem Productivity in the ASEAN from 2001 to 2020 Based on Remote Sensing and Improved CASA Model. Ecol. Indic. 2023, 154, 110920. [Google Scholar] [CrossRef] [Scilit]
- Bao, G.; Bao, Y.; Qin, Z.; Xin, X.; Bao, Y.; Bayarsaikan, S.; Zhou, Y.; Chuntai, B. Modeling Net Primary Productivity of Terrestrial Ecosystems in the Semi-Arid Climate of the Mongolian Plateau Using LSWI-Based CASA Ecosystem Model. Int. J. Appl. Earth Obs. Geoinf. 2016, 46, 84–93. [Google Scholar] [CrossRef] [Scilit]
- Li, J.; Xu, D.; Xu, Z.; Wang, Y.; Yang, J. Multi-Source Remote Sensing and Machine Learning Reveal Spatiotemporal Variations and Drivers of NPP in the Tianshan Mountains, China. J. Arid. Land 2026, 18, 56–83. [Google Scholar] [CrossRef] [Scilit]
- Running, S.W.; Thornton, P.E.; Nemani, R.; Glassy, J.M. Global Terrestrial Gross and Net Primary Productivity from the Earth Observing System. In Methods in Ecosystem Science; Sala, O.E., Jackson, R.B., Mooney, H.A., Howarth, R.W., Eds.; Springer: New York, NY, USA, 2000; pp. 44–57. ISBN 978-0-387-98743-9. [Google Scholar]
- Zhu, W.; Pan, Y.; He, H.; Yu, D.; Hu, H. Simulation of Maximum Light Use Efficiency for Some Typical Vegetation Types in China. Chin. Sci. Bull. 2006, 51, 457–463. [Google Scholar] [CrossRef] [Scilit]
- Chapin, F.S.; Woodwell, G.M.; Randerson, J.T.; Rastetter, E.B.; Lovett, G.M.; Baldocchi, D.D.; Clark, D.A.; Harmon, M.E.; Schimel, D.S.; Valentini, R.; et al. Reconciling Carbon-Cycle Concepts, Terminology, and Methods. Ecosystems 2006, 9, 1041–1050. [Google Scholar] [CrossRef] [Scilit]
- Qin, Z.; Sha, Z. Optimizing Anthropogenic Management Practices Can Effectively Enhance the Vegetation Carbon Sequestration in China. J. Environ. Manag. 2026, 411, 130196. [Google Scholar] [CrossRef] [Scilit] [PubMed]
- Reichstein, M.; Bahn, M.; Ciais, P.; Frank, D.; Mahecha, M.D.; Seneviratne, S.I.; Zscheischler, J.; Beer, C.; Buchmann, N.; Frank, D.C.; et al. Climate Extremes and the Carbon Cycle. Nature 2013, 500, 287–295. [Google Scholar] [CrossRef] [Scilit] [PubMed]
- Song, Y.; Wang, J.; Ge, Y.; Xu, C. An Optimal Parameters-Based Geographical Detector Model Enhances Geographic Characteristics of Explanatory Variables for Spatial Heterogeneity Analysis: Cases with Different Types of Spatial Data. GISci. Remote Sens. 2020, 57, 593–610. [Google Scholar] [CrossRef] [Scilit]
- Guo, Y.; Wu, Z.; Zheng, Z.; Li, X. An Optimal Multivariate-Stratification Geographical Detector Model for Revealing the Impact of Multi-Factor Combinations on the Dependent Variable. GISci. Remote Sens. 2024, 61, 2422941. [Google Scholar] [CrossRef] [Scilit]
- Venter, O.; Sanderson, E.W.; Magrach, A.; Allan, J.R.; Beher, J.; Jones, K.R.; Possingham, H.P.; Laurance, W.F.; Wood, P.; Fekete, B.M.; et al. Sixteen Years of Change in the Global Terrestrial Human Footprint and Implications for Biodiversity Conservation. Nat. Commun. 2016, 7, 12558. [Google Scholar] [CrossRef] [Scilit] [PubMed]
- Deng, R.; Li, D.; Zhao, Y.; Walling, D.E.; Panagos, P.; Borrelli, P.; Ciais, P.; Huang, Y.; Bai, Y.; Chalov, S.; et al. Intensified Rainfall Overrides Vegetation Greening in Driving Erosion and Carbon Loss on the Tibetan Plateau. Sci. Bull. 2025, 70, 3698–3702. [Google Scholar] [CrossRef] [Scilit] [PubMed]
- Piao, S.; Fang, J.; Ciais, P.; Peylin, P.; Huang, Y.; Sitch, S.; Wang, T. The Carbon Balance of Terrestrial Ecosystems in China. Nature 2009, 458, 1009–1013. [Google Scholar] [CrossRef] [Scilit] [PubMed]
- Ji, J.; Huang, M.; Li, K. Prediction of Carbon Exchanges between China Terrestrial Ecosystem and Atmosphere in 21st Century. Sci. China Ser. D-Earth Sci. 2008, 51, 885–898. [Google Scholar] [CrossRef] [Scilit]
- He, H.; Wang, S.; Zhang, L.; Wang, J.; Ren, X.; Zhou, L.; Piao, S.; Yan, H.; Ju, W.; Gu, F.; et al. Altered Trends in Carbon Uptake in China’s Terrestrial Ecosystems under the Enhanced Summer Monsoon and Warming Hiatus. Natl. Sci. Rev. 2019, 6, 505–514. [Google Scholar] [CrossRef] [Scilit] [PubMed]
- Zheng, J.; Zhang, Y.; Wang, X.; Zhu, J.; Zhao, G.; Zheng, Z.; Tao, J.; Zhang, Y.; Li, J. Estimation of Net Ecosystem Productivity on the Tibetan Plateau Grassland from 1982 to 2018 Based on Random Forest Model. Remote Sens. 2023, 15, 2375. [Google Scholar] [CrossRef] [Scilit]
- Chen, H.; Ju, P.; Zhu, Q.; Xu, X.; Wu, N.; Gao, Y.; Feng, X.; Tian, J.; Niu, S.; Zhang, Y.; et al. Carbon and Nitrogen Cycling on the Qinghai–Tibetan Plateau. Nat. Rev. Earth Environ. 2022, 3, 701–716. [Google Scholar] [CrossRef] [Scilit]
- Li, D.; Jiang, Y.; Yang, K.; Guo, D. Assessing the Fidelity of Gridded Datasets for Characterizing Precipitation over the Tibetan Plateau Using Multi-Source Observations and Water Balance. J. Meteorol. Soc. Jpn. 2026, 104, 11. [Google Scholar] [CrossRef] [Scilit]
- Zhou, G.; Ren, H.; Liu, T.; Zhou, L.; Ji, Y.; Song, X.; Lv, X. A New Regional Vegetation Mapping Method Based on Terrain-Climate-Remote Sensing and Its Application on the Qinghai-Xizang Plateau. Sci. China Earth Sci. 2023, 66, 237–246. [Google Scholar] [CrossRef] [Scilit]
- Mu, H.; Li, X.; Wen, Y.; Huang, J.; Du, P.; Su, W.; Miao, S.; Geng, M. A Global Record of Annual Terrestrial Human Footprint Dataset from 2000 to 2018. Sci. Data 2022, 9, 176. [Google Scholar] [CrossRef] [Scilit] [PubMed]
- Zhang, X.; Zhao, T.; Xu, H.; Liu, W.; Wang, J.; Chen, X.; Liu, L. GLC_FCS30D: The First Global 30 m Land-Cover Dynamics Monitoring Product with a Fine Classification System for the Period from 1985 to 2022 Generated Using Dense-Time-Series Landsat Imagery and the Continuous Change-Detection Method. Earth Syst. Sci. Data 2024, 16, 1353–1381. [Google Scholar] [CrossRef] [Scilit]
- Rodal, M.; Luyssaert, S.; Balzarolo, M.; Campioli, M. A Global Database of Net Primary Production of Terrestrial Ecosystems. Sci. Data 2025, 12, 1534. [Google Scholar] [CrossRef] [Scilit] [PubMed]
- Pei, Z.-Y.; Ouyang, H.; Zhou, C.-P.; Xu, X.-L. Carbon Balance in an Alpine Steppe in the Qinghai-Tibet Plateau. J. Integr. Plant Biol. 2009, 51, 521–526. [Google Scholar] [CrossRef] [Scilit] [PubMed]
- Zhu, W.; Pan, Y. Estimation of terrestrial net primary productivity of China using remote sensing. Chin. J. Plant Ecol. 2007, 31, 413–424. [Google Scholar] [CrossRef] [Scilit]
- Li, C.; Cao, H.; Fan, Y.; Han, H.; Sun, H.; Wang, Y. Remote Sensing Estimation and Analysis of Net Primary Productivity (NPP) Based on a Corrected CASA Model: A Case Study of the Hexi Corridor. Acta Ecol. Sin. 2019, 39, 1616–1626. [Google Scholar] [CrossRef] [Scilit]
- Zhao, F. Remote Sensing Estimation and Validation of Grassland Net Primary Productivity in Xilingol League Based on the CASA Model. Master’s Thesis, Chinese Academy of Agricultural Sciences, Beijing, China, 2016. [Google Scholar]
- Field, C.B.; Randerson, J.T.; Malmström, C.M. Global Net Primary Production: Combining Ecology and Remote Sensing. Remote Sens. Environ. 1995, 51, 74–88. [Google Scholar] [CrossRef] [Scilit]
- Xiao, X.; Hollinger, D.; Aber, J.; Goltz, M.; Davidson, E.A.; Zhang, Q.; Moore, B. Satellite-Based Modeling of Gross Primary Production in an Evergreen Needleleaf Forest. Remote Sens. Environ. 2004, 89, 519–534. [Google Scholar] [CrossRef] [Scilit]
- Sen, P.K. Estimates of the Regression Coefficient Based on Kendall’s Tau. J. Am. Stat. Assoc. 1968, 63, 1379–1389. [Google Scholar] [CrossRef]
- Mann, H.B. Nonparametric Tests Against Trend. Econometrica 1945, 13, 245. [Google Scholar] [CrossRef] [Scilit]
- Yu, H.; Liu, D.; Zhang, C.; Yu, L.; Yang, B.; Qiao, S.; Wang, X. Research on Spatial–Temporal Characteristics and Driving Factors of Urban Development Intensity for Pearl River Delta Region Based on Geodetector. Land 2023, 12, 1673. [Google Scholar] [CrossRef] [Scilit]
- Wang, T.; Yang, D.; Yang, Y.; Piao, S.; Li, X.; Cheng, G.; Fu, B. Permafrost Thawing Puts the Frozen Carbon at Risk over the Tibetan Plateau. Sci. Adv. 2020, 6, eaaz3513. [Google Scholar] [CrossRef] [Scilit] [PubMed]
- Chen, C.; Park, T.; Wang, X.; Piao, S.; Xu, B.; Chaturvedi, R.K.; Fuchs, R.; Brovkin, V.; Ciais, P.; Fensholt, R.; et al. China and India Lead in Greening of the World through Land-Use Management. Nat. Sustain. 2019, 2, 122–129. [Google Scholar] [CrossRef] [Scilit] [PubMed]
- Wei, D.; Qi, Y.; Ma, Y.; Wang, X.; Ma, W.; Gao, T.; Huang, L.; Zhao, H.; Zhang, J.; Wang, X. Plant Uptake of CO2 Outpaces Losses from Permafrost and Plant Respiration on the Tibetan Plateau. Proc. Natl. Acad. Sci. USA 2021, 118, e2015283118. [Google Scholar] [CrossRef] [Scilit] [PubMed]
- Chen, B.; Zhang, X.; Tao, J.; Wu, J.; Wang, J.; Shi, P.; Zhang, Y.; Yu, C. The Impact of Climate Change and Anthropogenic Activities on Alpine Grassland over the Qinghai-Tibet Plateau. Agric. For. Meteorol. 2014, 189–190, 11–18. [Google Scholar] [CrossRef] [Scilit]
- Wei, L.; You, Q.; Zuo, Z.; Zhang, R.; Kang, S. Impacts of Different El Niño Events on Winter Snowfall over the Tibetan Plateau. Atmos. Res. 2025, 322, 108156. [Google Scholar] [CrossRef] [Scilit]
- Piao, S.; Tan, K.; Nan, H.; Ciais, P.; Fang, J.; Wang, T.; Vuichard, N.; Zhu, B. Impacts of Climate and CO2 Changes on the Vegetation Growth and Carbon Balance of Qinghai–Tibetan Grasslands over the Past Five Decades. Glob. Planet. Change 2012, 98–99, 73–80. [Google Scholar] [CrossRef] [Scilit]
- Li, M.-W.; Zhang, J.; Wu, Z.-F.; Fu, Y.-S. Effect of Growing Season Length on Gross Primary Productivity Increased in the Jinsha River Watershed. J. Plant Ecol. 2025, 18, rtae108. [Google Scholar] [CrossRef] [Scilit]
- Zeng, F.; Yang, R.; Liu, H.; Du, Q.; Liu, Y.; Cun, H. Spring Factors Controlling Interannual CO2 Flux Variations in a Subtropical Humid Alpine Meadow on the Southeastern Tibetan Plateau. Agric. For. Meteorol. 2025, 370, 110603. [Google Scholar] [CrossRef] [Scilit]
- Piao, S.; Wang, X.; Park, T.; Chen, C.; Lian, X.; He, Y.; Bjerke, J.W.; Chen, A.; Ciais, P.; Tømmervik, H.; et al. Characteristics, Drivers and Feedbacks of Global Greening. Nat. Rev. Earth Environ. 2019, 1, 14–27. [Google Scholar] [CrossRef] [Scilit]
- Nemani, R.R.; Keeling, C.D.; Hashimoto, H.; Jolly, W.M.; Piper, S.C.; Tucker, C.J.; Myneni, R.B.; Running, S.W. Climate-Driven Increases in Global Terrestrial Net Primary Production from 1982 to 1999. Science 2003, 300, 1560–1563. [Google Scholar] [CrossRef] [Scilit] [PubMed]
- Humphrey, V.; Berg, A.; Ciais, P.; Gentine, P.; Jung, M.; Reichstein, M.; Seneviratne, S.I.; Frankenberg, C. Soil Moisture–Atmosphere Feedback Dominates Land Carbon Uptake Variability. Nature 2021, 592, 65–69. [Google Scholar] [CrossRef] [Scilit] [PubMed]
- Angst, Š.; Angst, G.; Mueller, K.E.; Lange, M.; Eisenhauer, N. Un(Der)Explored Links between Plant Diversity and Particulate and Mineral-Associated Organic Matter in Soil. Nat. Commun. 2025, 16, 5548. [Google Scholar] [CrossRef] [Scilit] [PubMed]
- Jian, J.; Frissell, M.; Hao, D.; Tang, X.; Berryman, E.; Bond-Lamberty, B. The Global Contribution of Roots to Total Soil Respiration. Glob. Ecol. Biogeogr. 2022, 31, 685–699. [Google Scholar] [CrossRef] [Scilit]
- Trumbore, S. Carbon Respired by Terrestrial Ecosystems—Recent Progress and Challenges. Glob. Change Biol. 2006, 12, 141–153. [Google Scholar] [CrossRef] [Scilit]
- Dong, L.; Wang, X. Inconsistent Influence of Temperature, Precipitation, and CO2 Variations on the Plateau Alpine Vegetation Carbon Flux. npj Clim. Atmos. Sci. 2025, 8, 91. [Google Scholar] [CrossRef] [Scilit]
- Zhang, Z.; Li, Y.; Williams, R.A.; Chen, Y.; Peng, R.; Liu, X.; Qi, Y.; Wang, Z. Responses of Soil Respiration and Its Sensitivities to Temperature and Precipitation: A Meta-Analysis. Ecol. Inform. 2023, 75, 102057. [Google Scholar] [CrossRef] [Scilit]
- Zhang, C.; Zhang, X.; Tang, Q.; Chen, D.; Huang, J.; Wu, S.; Liu, Y. Quantifying Precipitation Moisture Contributed by Different Atmospheric Circulations across the Tibetan Plateau. J. Hydrol. 2024, 628, 130517. [Google Scholar] [CrossRef] [Scilit]
- He, W.; Sun, J.; Di, B.; Peñuelas, J. Rapid Loss of Terrestrial Ecosystem Multifunctionality in China on a Century Scale. Earth’s Future 2026, 14, e2025EF007008. [Google Scholar] [CrossRef] [Scilit]
- Zuo, C.; Wang, J.; Zhang, X.; Ye, H.; Wang, S.; Watson, A.E.; Li, Y.; Zhao, X. Drought Will Constrain Ongoing Increase in Net Ecosystem Productivity under Future Climate Warming over Alpine Grasslands on the Qinghai-Tibetan Plateau, China. Ecol. Indic. 2023, 154, 110823. [Google Scholar] [CrossRef] [Scilit]
- Hursh, A.; Ballantyne, A.; Cooper, L.; Maneta, M.; Kimball, J.; Watts, J. The Sensitivity of Soil Respiration to Soil Temperature, Moisture, and Carbon Supply at the Global Scale. Glob. Change Biol. 2017, 23, 2090–2103. [Google Scholar] [CrossRef] [Scilit] [PubMed]
- Schuur, E.A.G.; McGuire, A.D.; Schädel, C.; Grosse, G.; Harden, J.W.; Hayes, D.J.; Hugelius, G.; Koven, C.D.; Kuhry, P.; Lawrence, D.M.; et al. Climate Change and the Permafrost Carbon Feedback. Nature 2015, 520, 171–179. [Google Scholar] [CrossRef] [Scilit] [PubMed]
- Sun, W.; Cao, B. Ensemble Numerical Simulation of Permafrost over the Tibetan Plateau from Flexible Permafrost Model: 1950–2023. EGUsphere 2025, 2025, 1–32. [Google Scholar] [CrossRef] [Scilit]
- Wu, Q.; Zhang, T. Recent Permafrost Warming on the Qinghai-Tibetan Plateau. J. Geophys. Res. 2008, 113, 2007JD009539. [Google Scholar] [CrossRef] [Scilit]
- Feng, Q.; Wu, T.; Wu, X.; Wang, D.; Yang, S.; Lou, P.; Yan, X.; Ma, X. Carbon Storage and Dynamics in Cryosphere: Progress and Challenges. Carbonsphere 2026, 1, 9510005. [Google Scholar] [CrossRef] [Scilit]
- Li, Y.; Hu, Z.; Liu, C.; Yang, X.; Zhang, Z.; Sun, W.; Niu, F.; Zhang, E.; Yang, Q. Exploring Impacts of Land Use and Cover Changes on Ecosystem Services on the Qinghai-Xizang Plateau. Remote Sens. 2025, 17, 2840. [Google Scholar] [CrossRef] [Scilit]
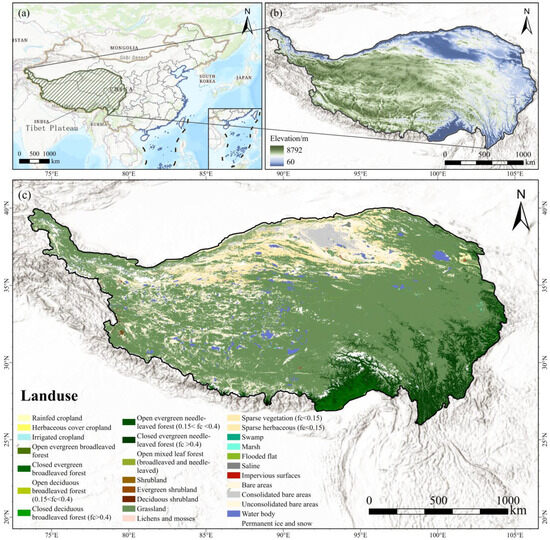
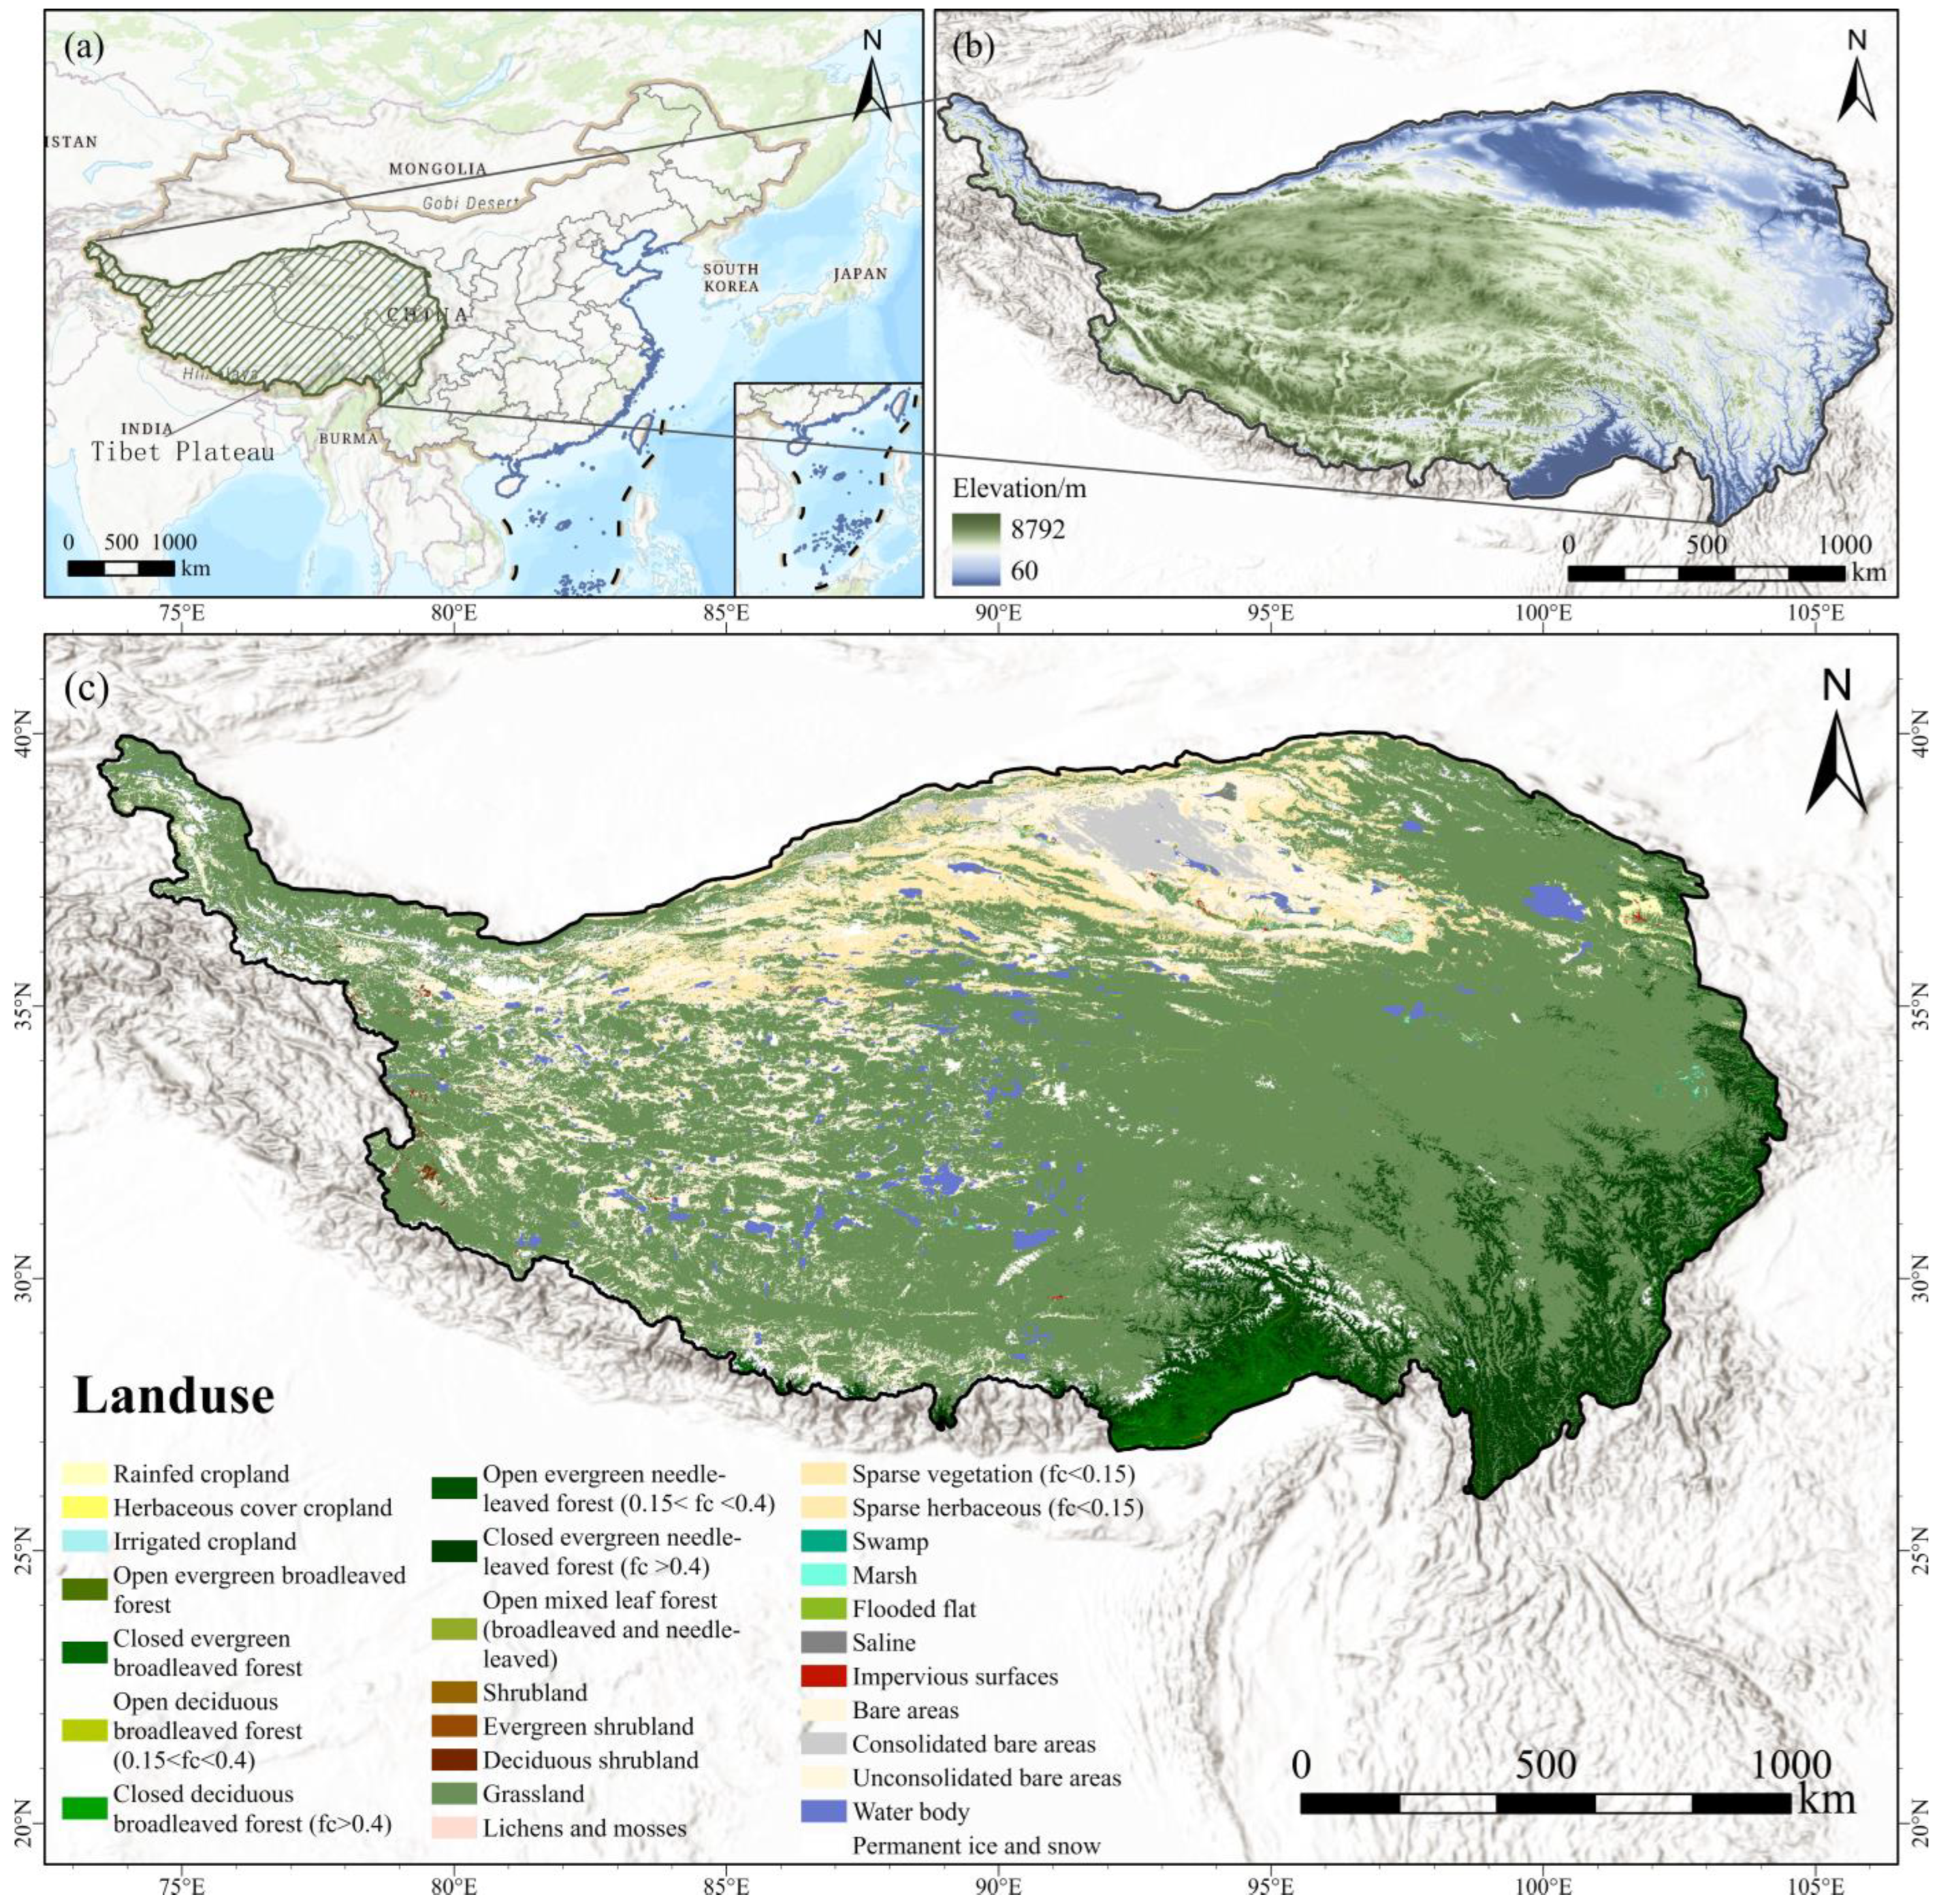
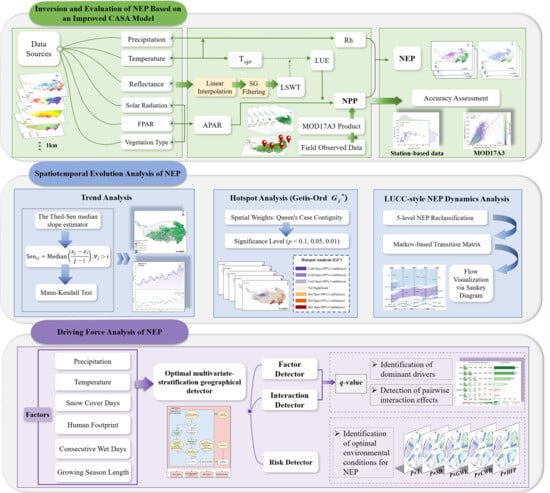
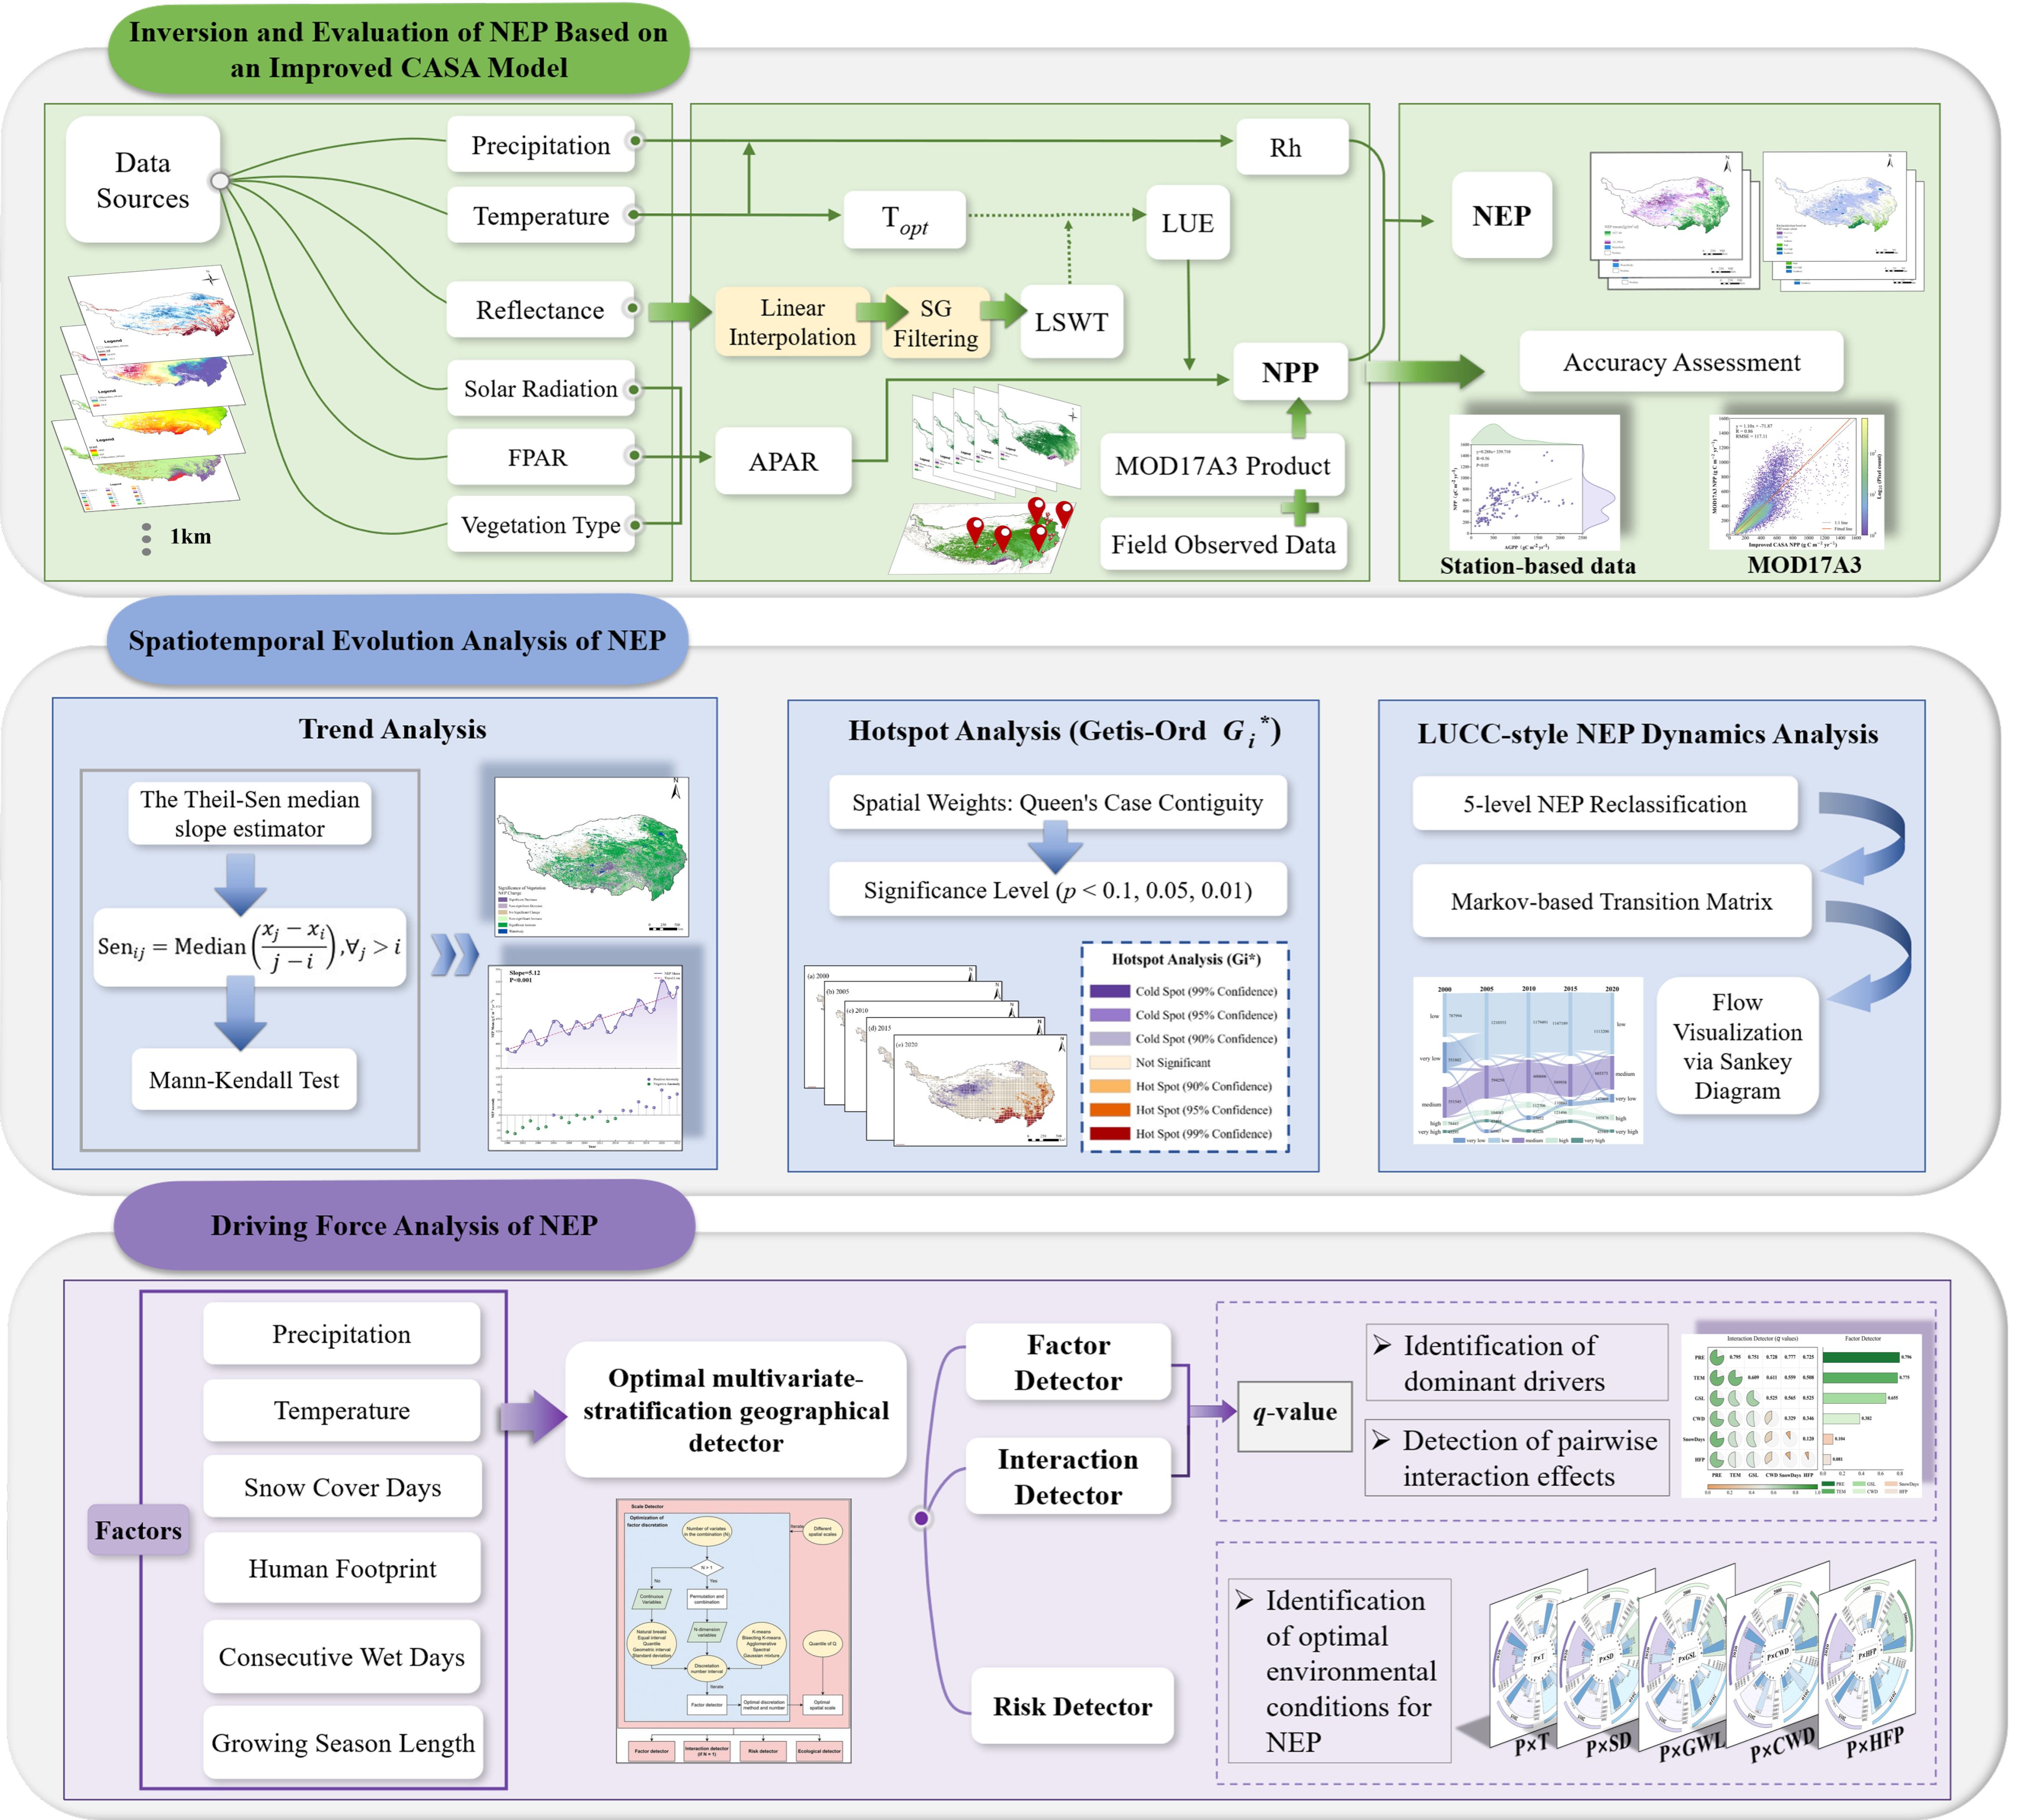
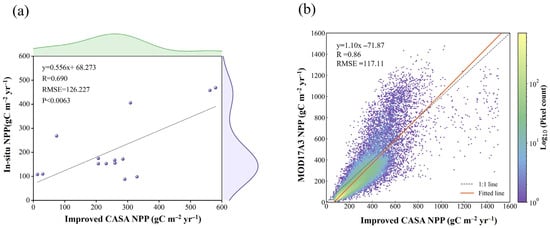
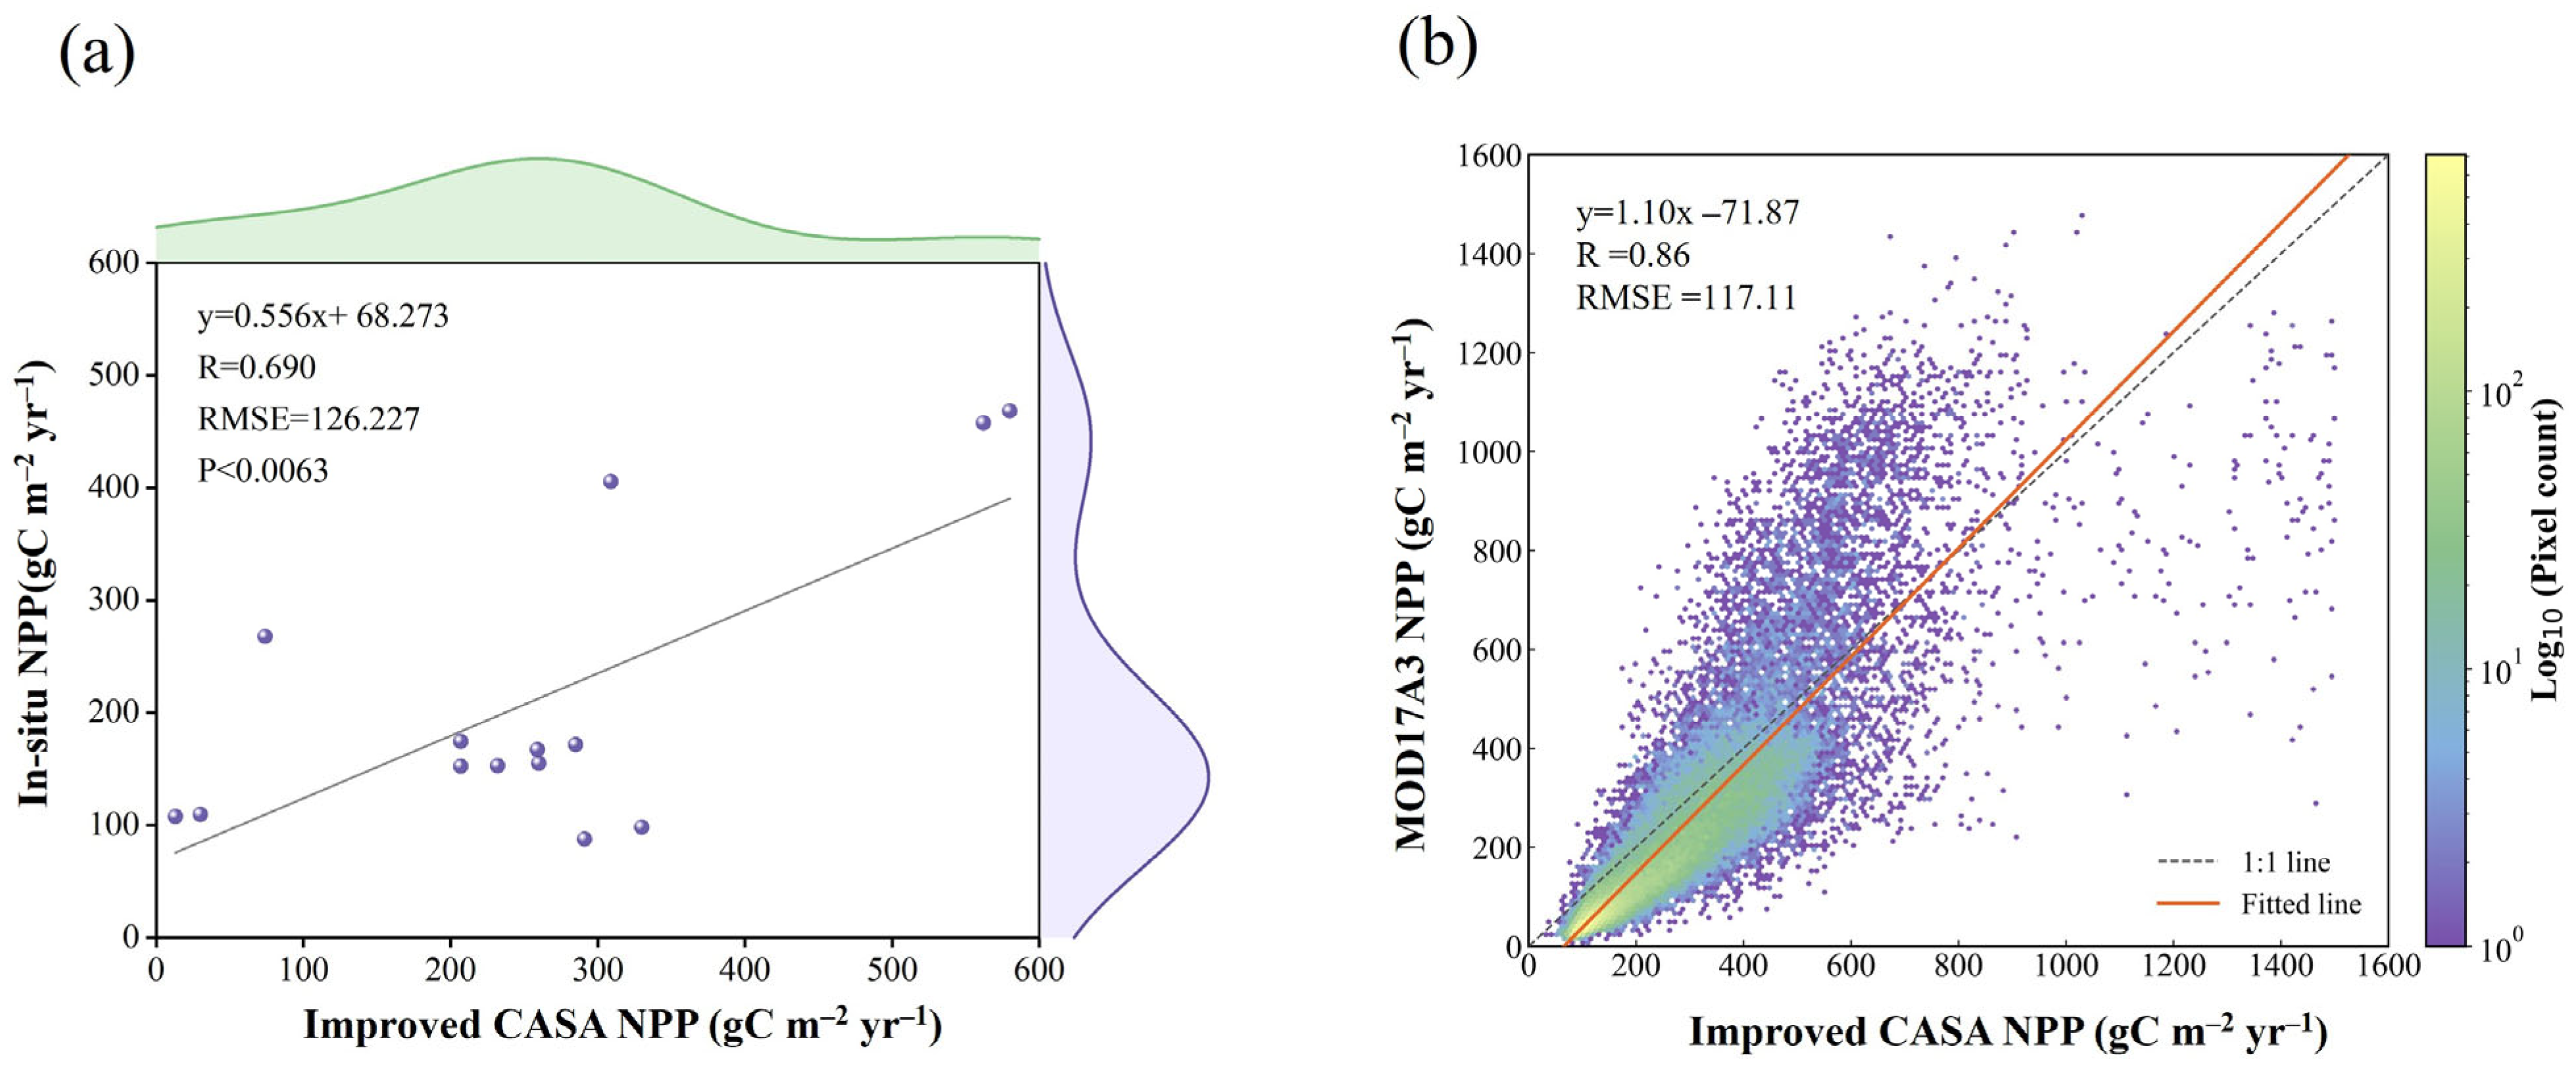
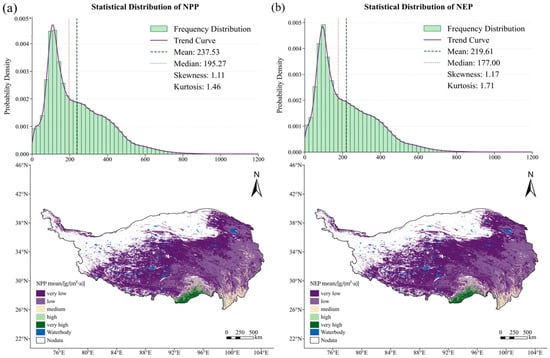
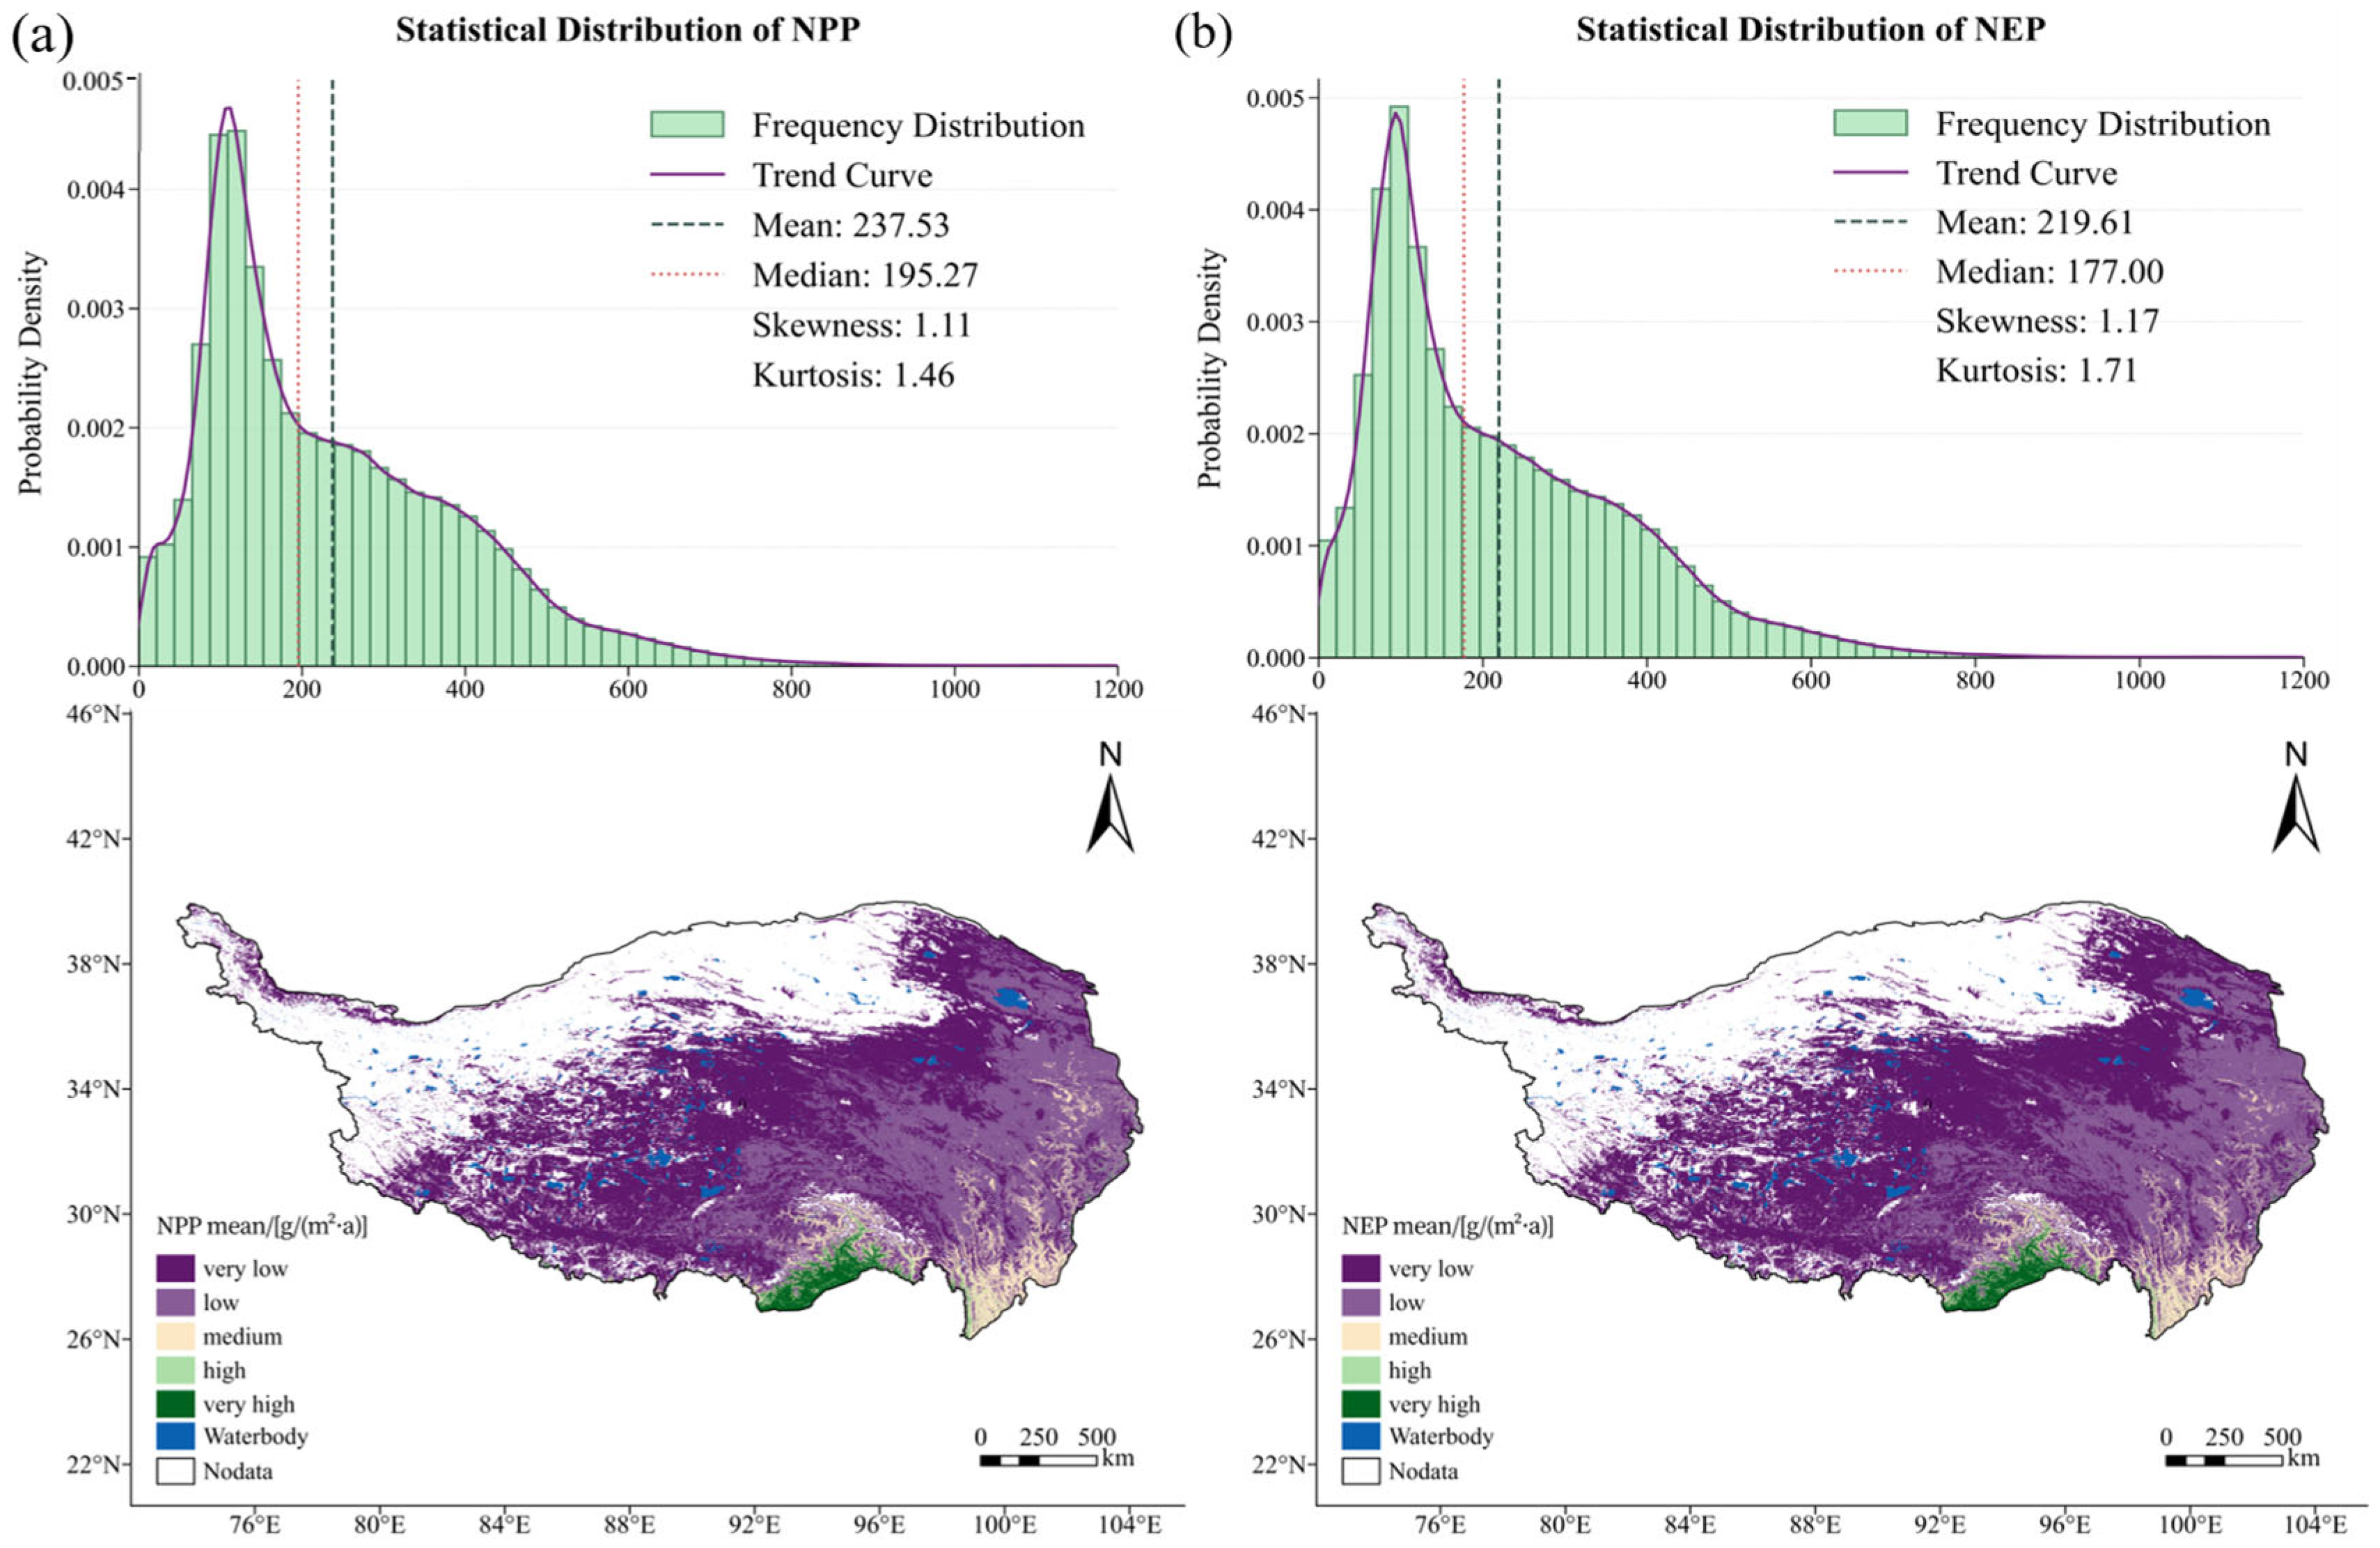
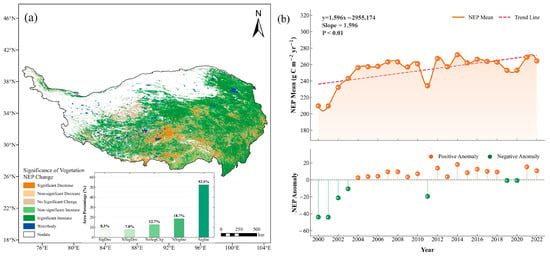
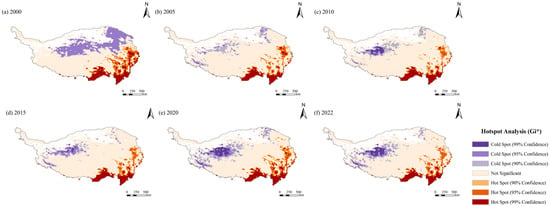
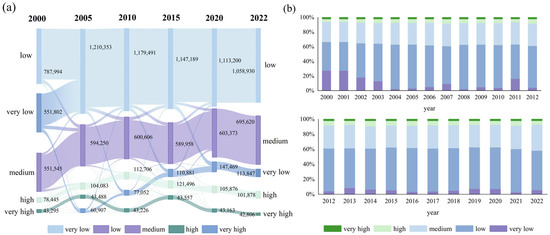
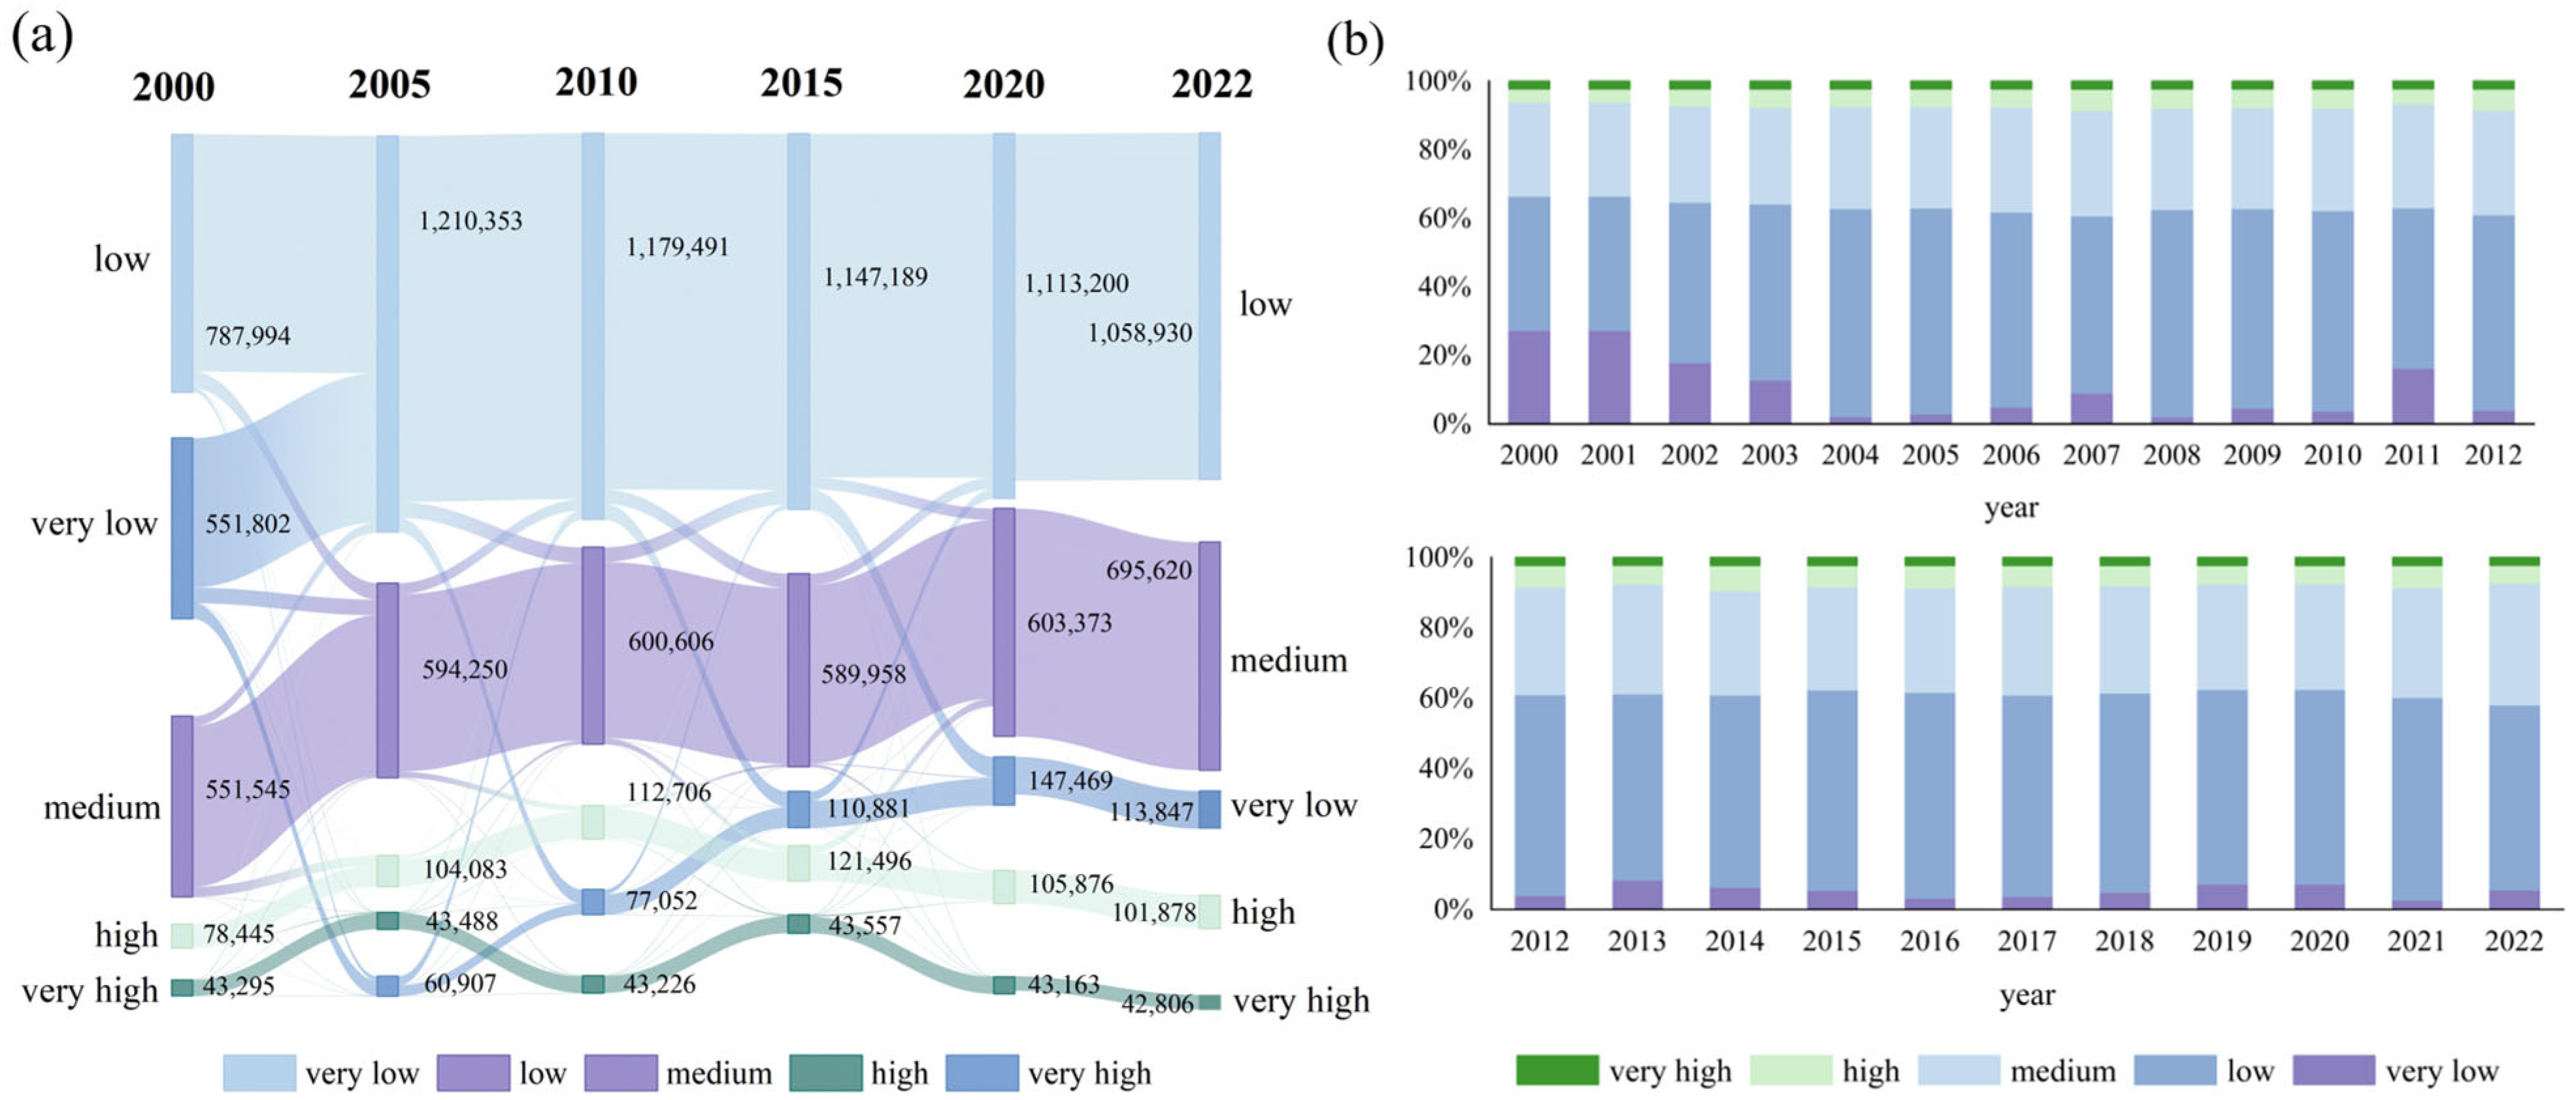
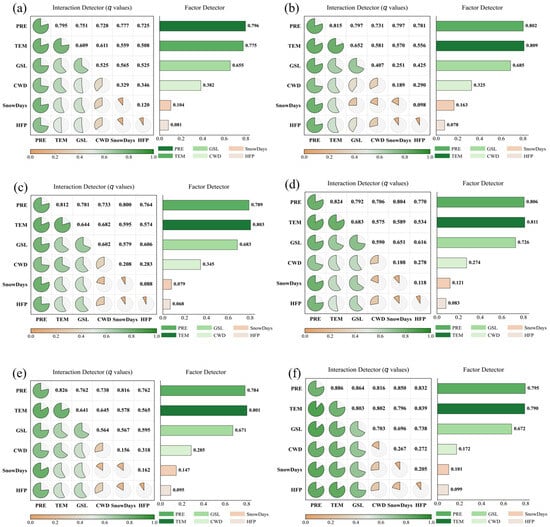
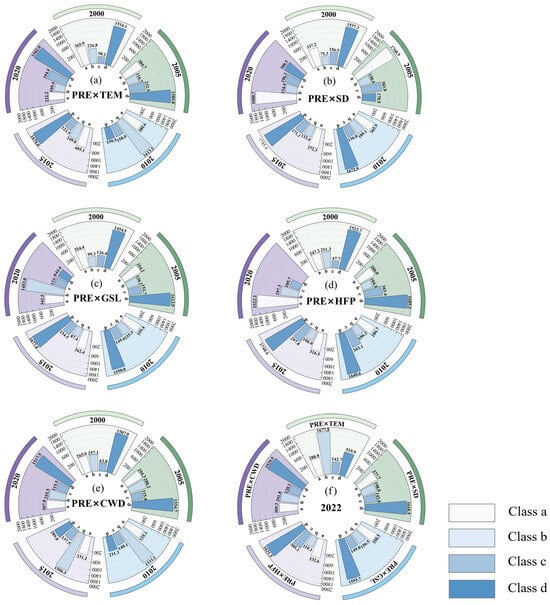
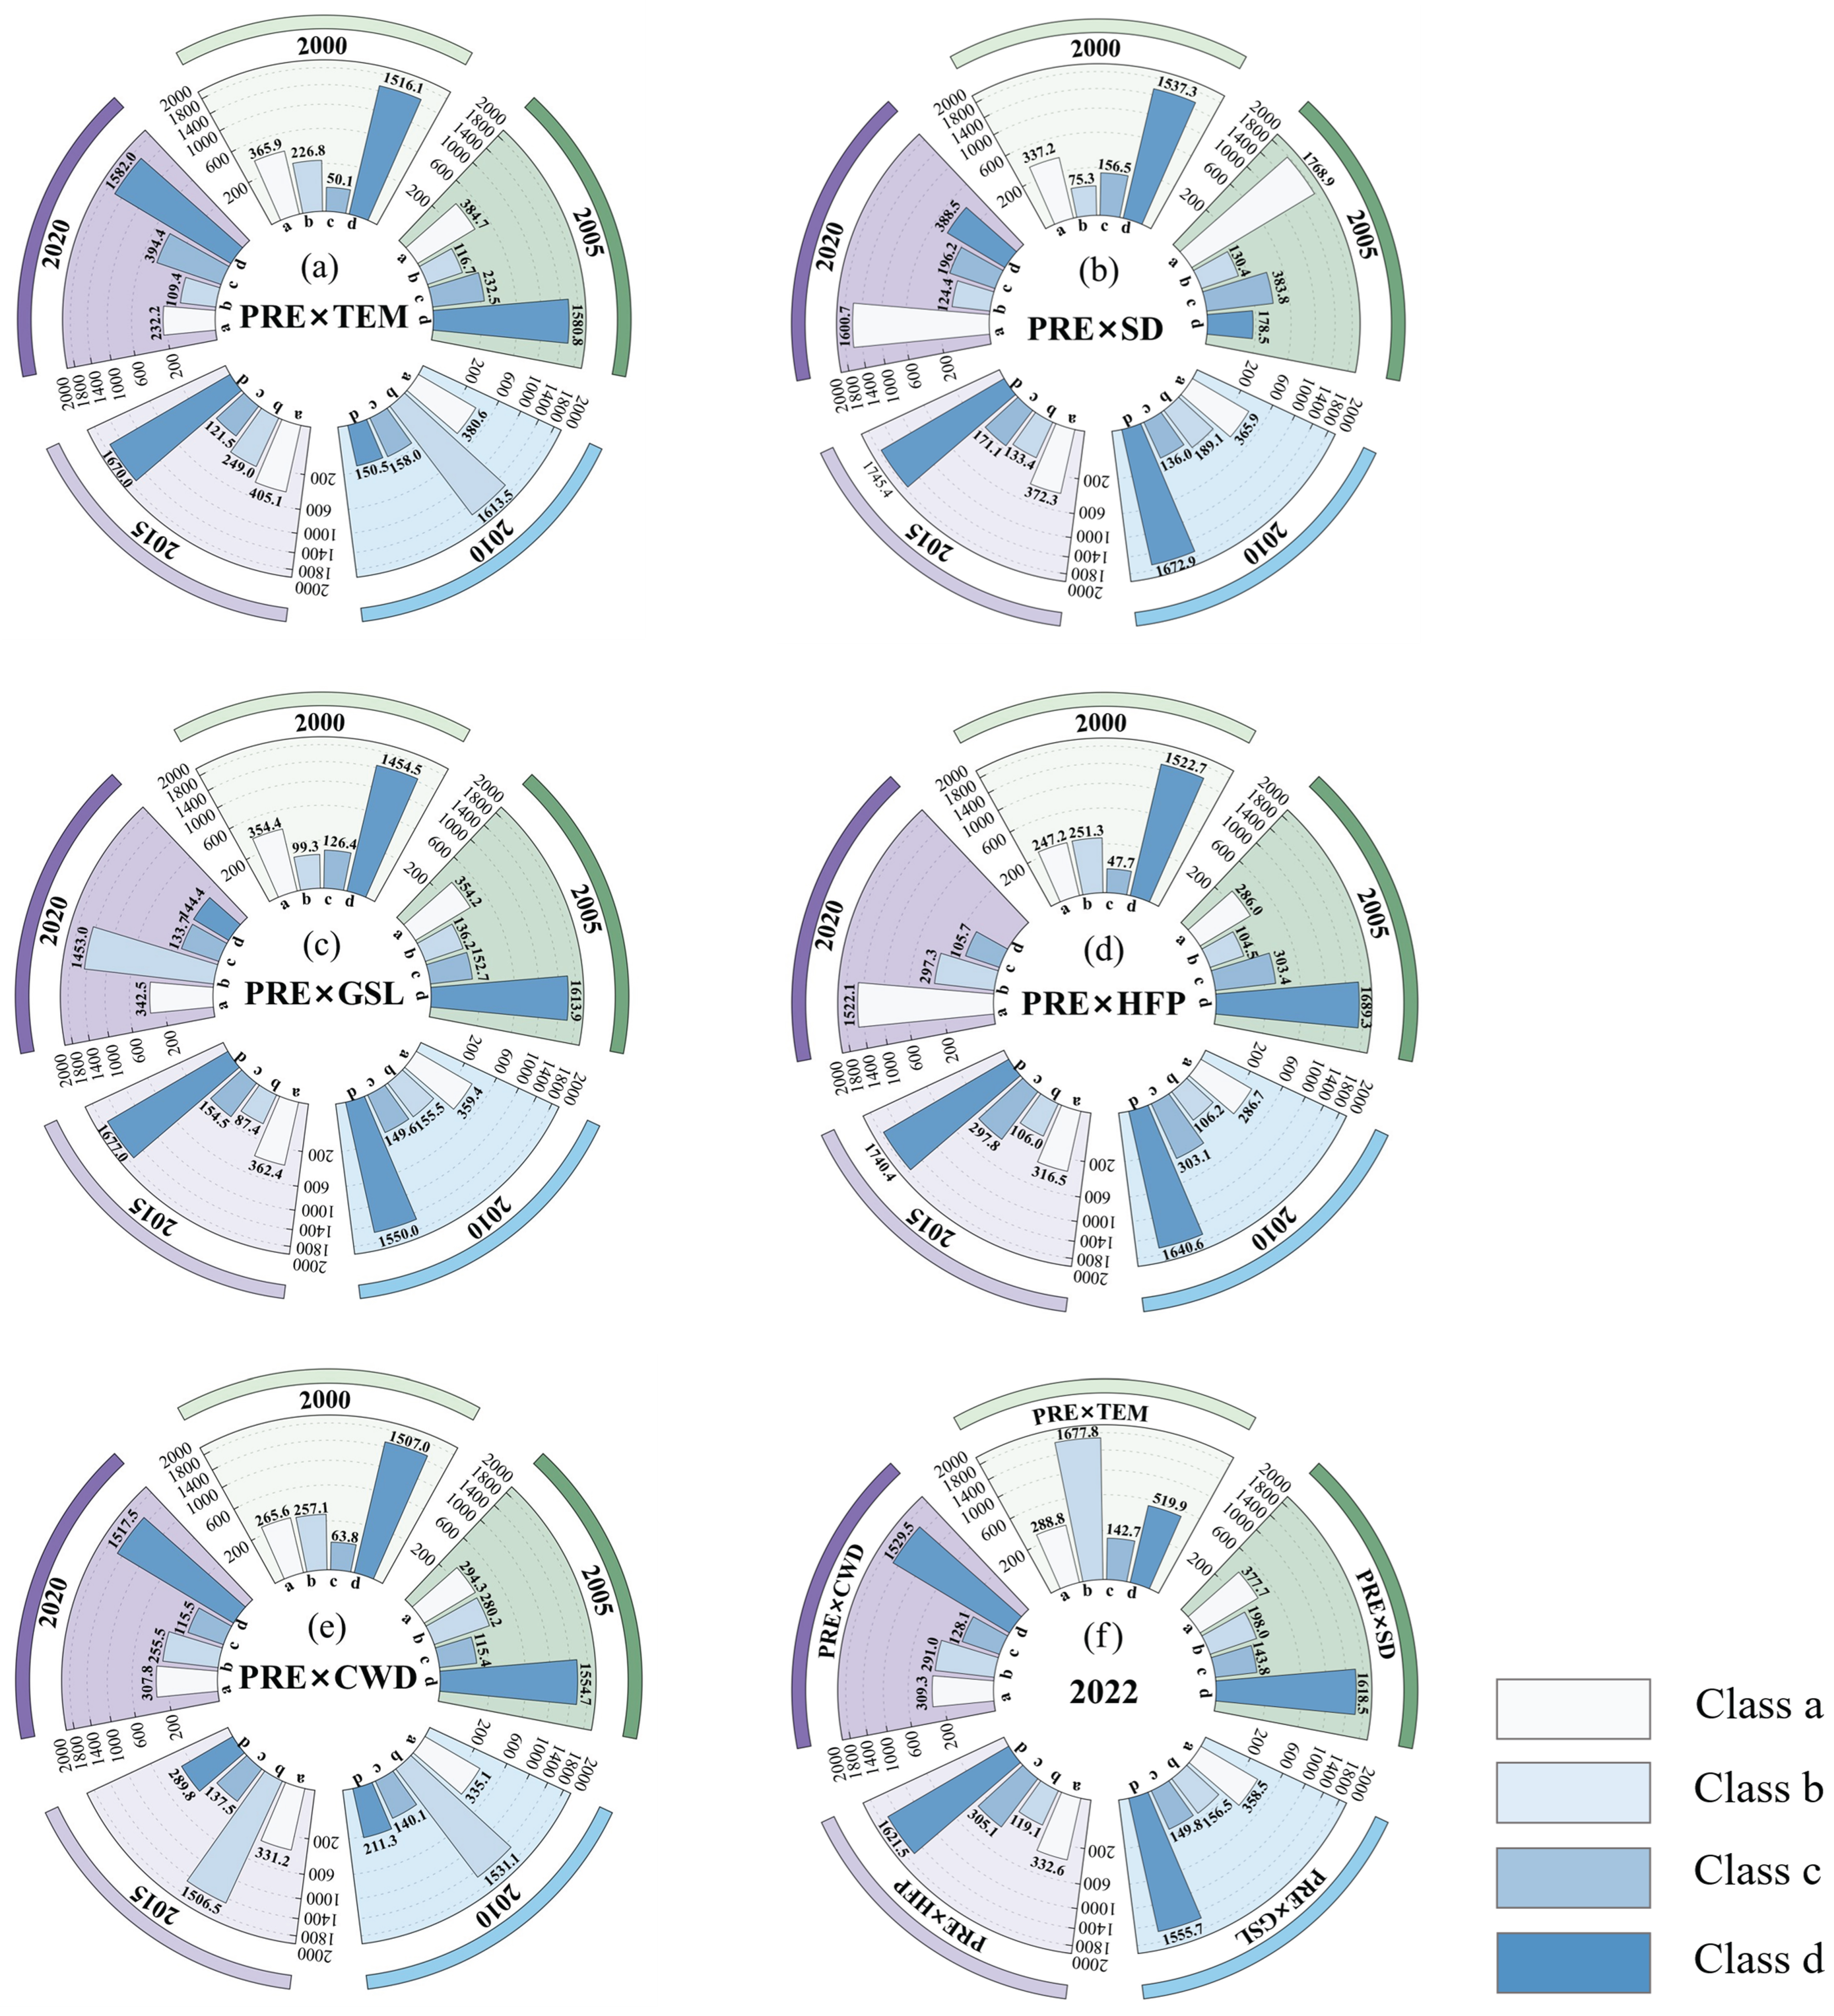
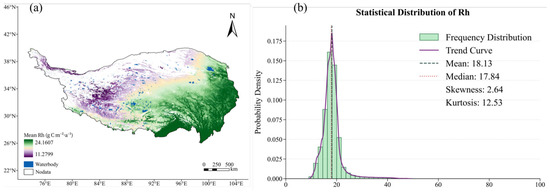
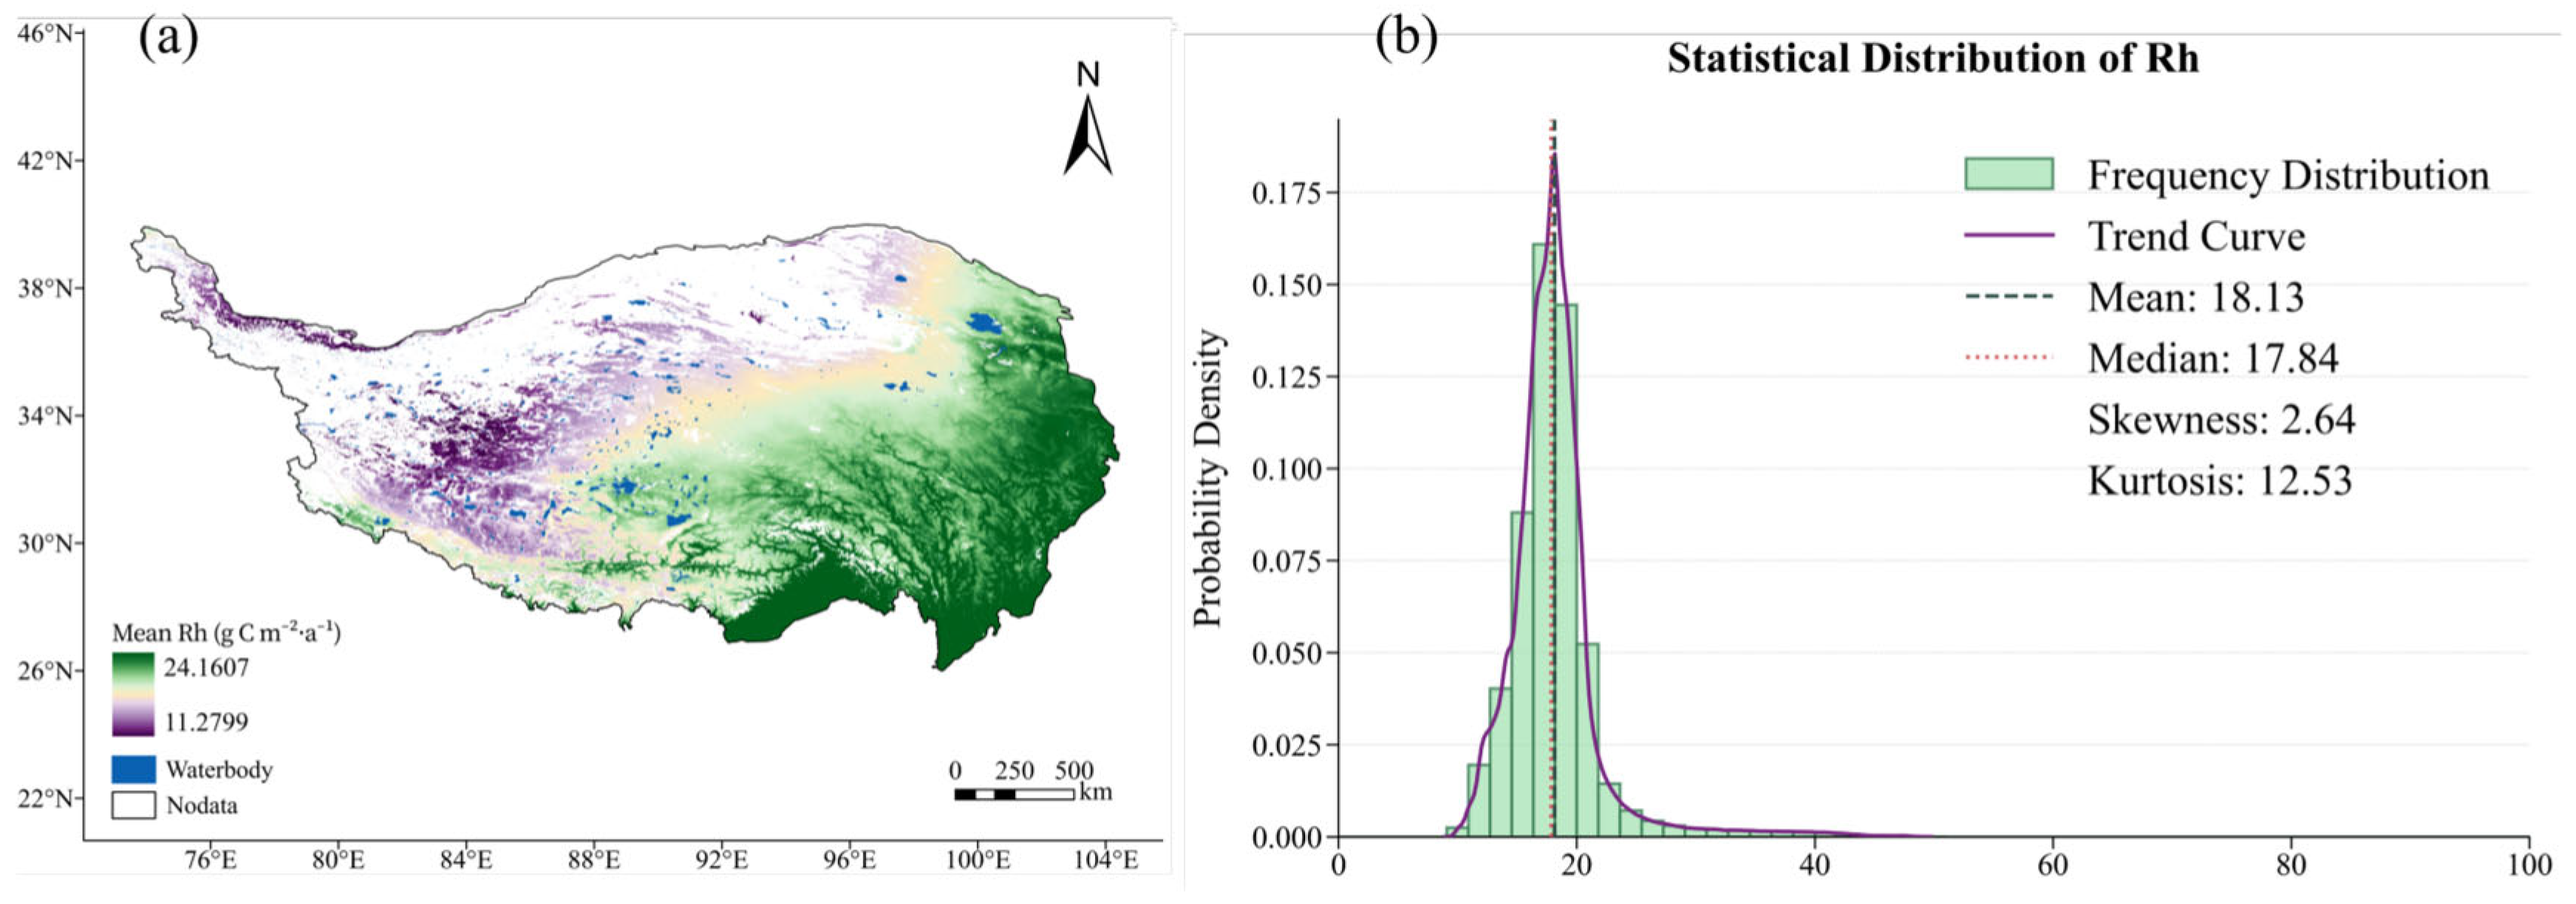

Disclaimer/Publisher’s Note: The statements, opinions and data contained in all publications are solely those of the individual author(s) and contributor(s) and not of MDPI and/or the editor(s). MDPI and/or the editor(s) disclaim responsibility for any injury to people or property resulting from any ideas, methods, instructions or products referred to in the content. |
© 2026 by the authors. Licensee MDPI, Basel, Switzerland. This article is an open access article distributed under the terms and conditions of the Creative Commons Attribution (CC BY) license.