1. Introduction
Rapid urbanization and population growth have become defining characteristics of major metropolitan cities worldwide, placing increasing pressure on housing availability, land utilization, infrastructure provision, and environmental sustainability. As cities continue to expand, sustainable urban development increasingly depends on the efficient use of existing urban land resources rather than continued outward expansion. Identifying and activating underutilized urban land has therefore become an important component of strategic urban planning, supporting compact city development, infrastructure optimization, improved housing accessibility, and more sustainable growth patterns. Recent work has further emphasized that strategic planning for urban sustainability requires data-driven approaches that enable planners to identify underutilized urban land, optimize land-use decisions, and support sustainable urban growth through integrated spatial planning [
1]. In this context, intelligent remote sensing frameworks can provide timely and scalable information to support evidence-based urban planning.
In Saudi Arabia, the city of Riyadh has experienced substantial demographic and spatial expansion in recent years [
2], creating new challenges related to urban sprawl, land-use efficiency, and housing affordability. Among the most significant challenges affecting sustainable urban development is the widespread presence of underutilized urban parcels commonly referred to in Saudi Arabia as “White Lands.” According to Saudi regulations, White Lands are defined as “all undeveloped land capable of development and growth, located within urban boundaries” [
3]. Internationally, these lands are more commonly described as vacant lands or urban vacant lands [
4,
5,
6,
7]. Regardless of terminology, such lands represent a strategic urban resource whose identification and management can directly influence urban sustainability, housing supply, infrastructure efficiency, and long-term city resilience.
The existence of large quantities of vacant urban land can negatively affect both the spatial and economic development of cities. These undeveloped parcels create discontinuities within the urban fabric, contribute to inefficient infrastructure expansion, increase service delivery costs, and may encourage speculative land holding practices that restrict land availability and inflate property prices [
4]. Conversely, effective identification and redevelopment of vacant land can support a wide range of sustainability objectives, including residential development, green infrastructure expansion, public service provision, urban regeneration, and improved land-use efficiency [
4,
5,
6,
7]. Consequently, the monitoring and management of vacant urban land has become an important component of strategic planning frameworks aimed at promoting sustainable and resilient urban growth.
Recognizing these challenges, Saudi Arabia introduced the White Land Fees Law as part of its broader urban development and housing reform initiatives. The law seeks to increase land availability, improve market efficiency, discourage land speculation, and accelerate urban development by imposing annual fees on undeveloped urban land [
8]. Recent amendments further strengthened the legislation by expanding its scope, increasing enforcement mechanisms, and introducing a tiered fee structure reaching up to 10% of land value [
3,
9,
10]. These reforms align closely with the objectives of Saudi Vision 2030, which emphasizes sustainable urban development, efficient resource utilization, improved housing accessibility, and data-driven decision making in city planning.
Despite the strategic importance of White Land monitoring, conventional approaches based on field surveys and manual geographic information system (GIS) analysis remain labor-intensive, requiring site visits, manual digitization of parcel boundaries, and periodic re-surveying to track land-use change, which makes them costly and difficult to scale across rapidly growing metropolitan regions. This limitation reduces the ability of planning authorities to maintain up-to-date inventories of vacant land and evaluate development opportunities in a timely manner. Advances in remote sensing, artificial intelligence, and computer vision offer an opportunity to address this challenge by enabling automated and large-scale urban land monitoring using high-resolution satellite imagery. In particular, semantic segmentation techniques have demonstrated strong performance in urban scene understanding tasks, including land-cover classification, building extraction, infrastructure mapping, and land-use analysis. Their ability to perform pixel-level classification makes them particularly suitable for identifying vacant urban parcels at city scale.
Motivated by these developments, this study presents TerraVision, an intelligent White Land monitoring framework that leverages deep learning-based semantic segmentation for large-scale vacant land detection in Riyadh. High-resolution satellite imagery acquired through the Esri ArcGIS platform [
11] was utilized to construct a manually annotated dataset covering approximately 180 km
2 of the city. The proposed framework evaluates ten segmentation architectures spanning encoder–decoder networks, transformer-based models, YOLO segmentation models, and the zero-shot Segment Anything Model 3 (SAM3). Beyond model evaluation, the framework incorporates a geospatial post-processing pipeline that reconstructs city-scale prediction maps, estimates neighborhood-level White Land distributions, and supports urban analysis through an interactive GIS-enabled dashboard.
The significance of this work extends beyond automated image segmentation. By enabling systematic identification and monitoring of underutilized urban land, the proposed framework contributes to data-driven strategic planning for urban sustainability. The generated outputs can support municipalities, planners, policymakers, and developers in identifying development opportunities, prioritizing infrastructure investments, monitoring land-use policies, and promoting more efficient urban growth. In this way, TerraVision serves as both a technical remote sensing framework and a practical decision-support tool for sustainable urban management.
The contributions of this paper can be summarized as follows:
Development of a high-resolution annotated satellite imagery dataset for White Land detection in Riyadh.
Comparative evaluation of ten deep learning segmentation models across multiple architectural families for vacant land detection.
Design of a city-scale geospatial processing pipeline for White Land area estimation, spatial analysis, and urban sustainability assessment.
Integration of the generated outputs into an interactive GIS-enabled dashboard to support urban planning, land monitoring, and strategic decision making.
The remainder of this paper is organized as follows.
Section 2 reviews the related work concerning vacant land analysis, urban sustainability applications, and semantic segmentation techniques in remote sensing.
Section 3 presents the proposed methodology, including dataset preparation, model architectures, training procedures, and post-processing workflows.
Section 4 discusses the experimental results and comparative analysis of the evaluated models. Finally,
Section 5 concludes the paper and outlines future research directions.
3. Methodology
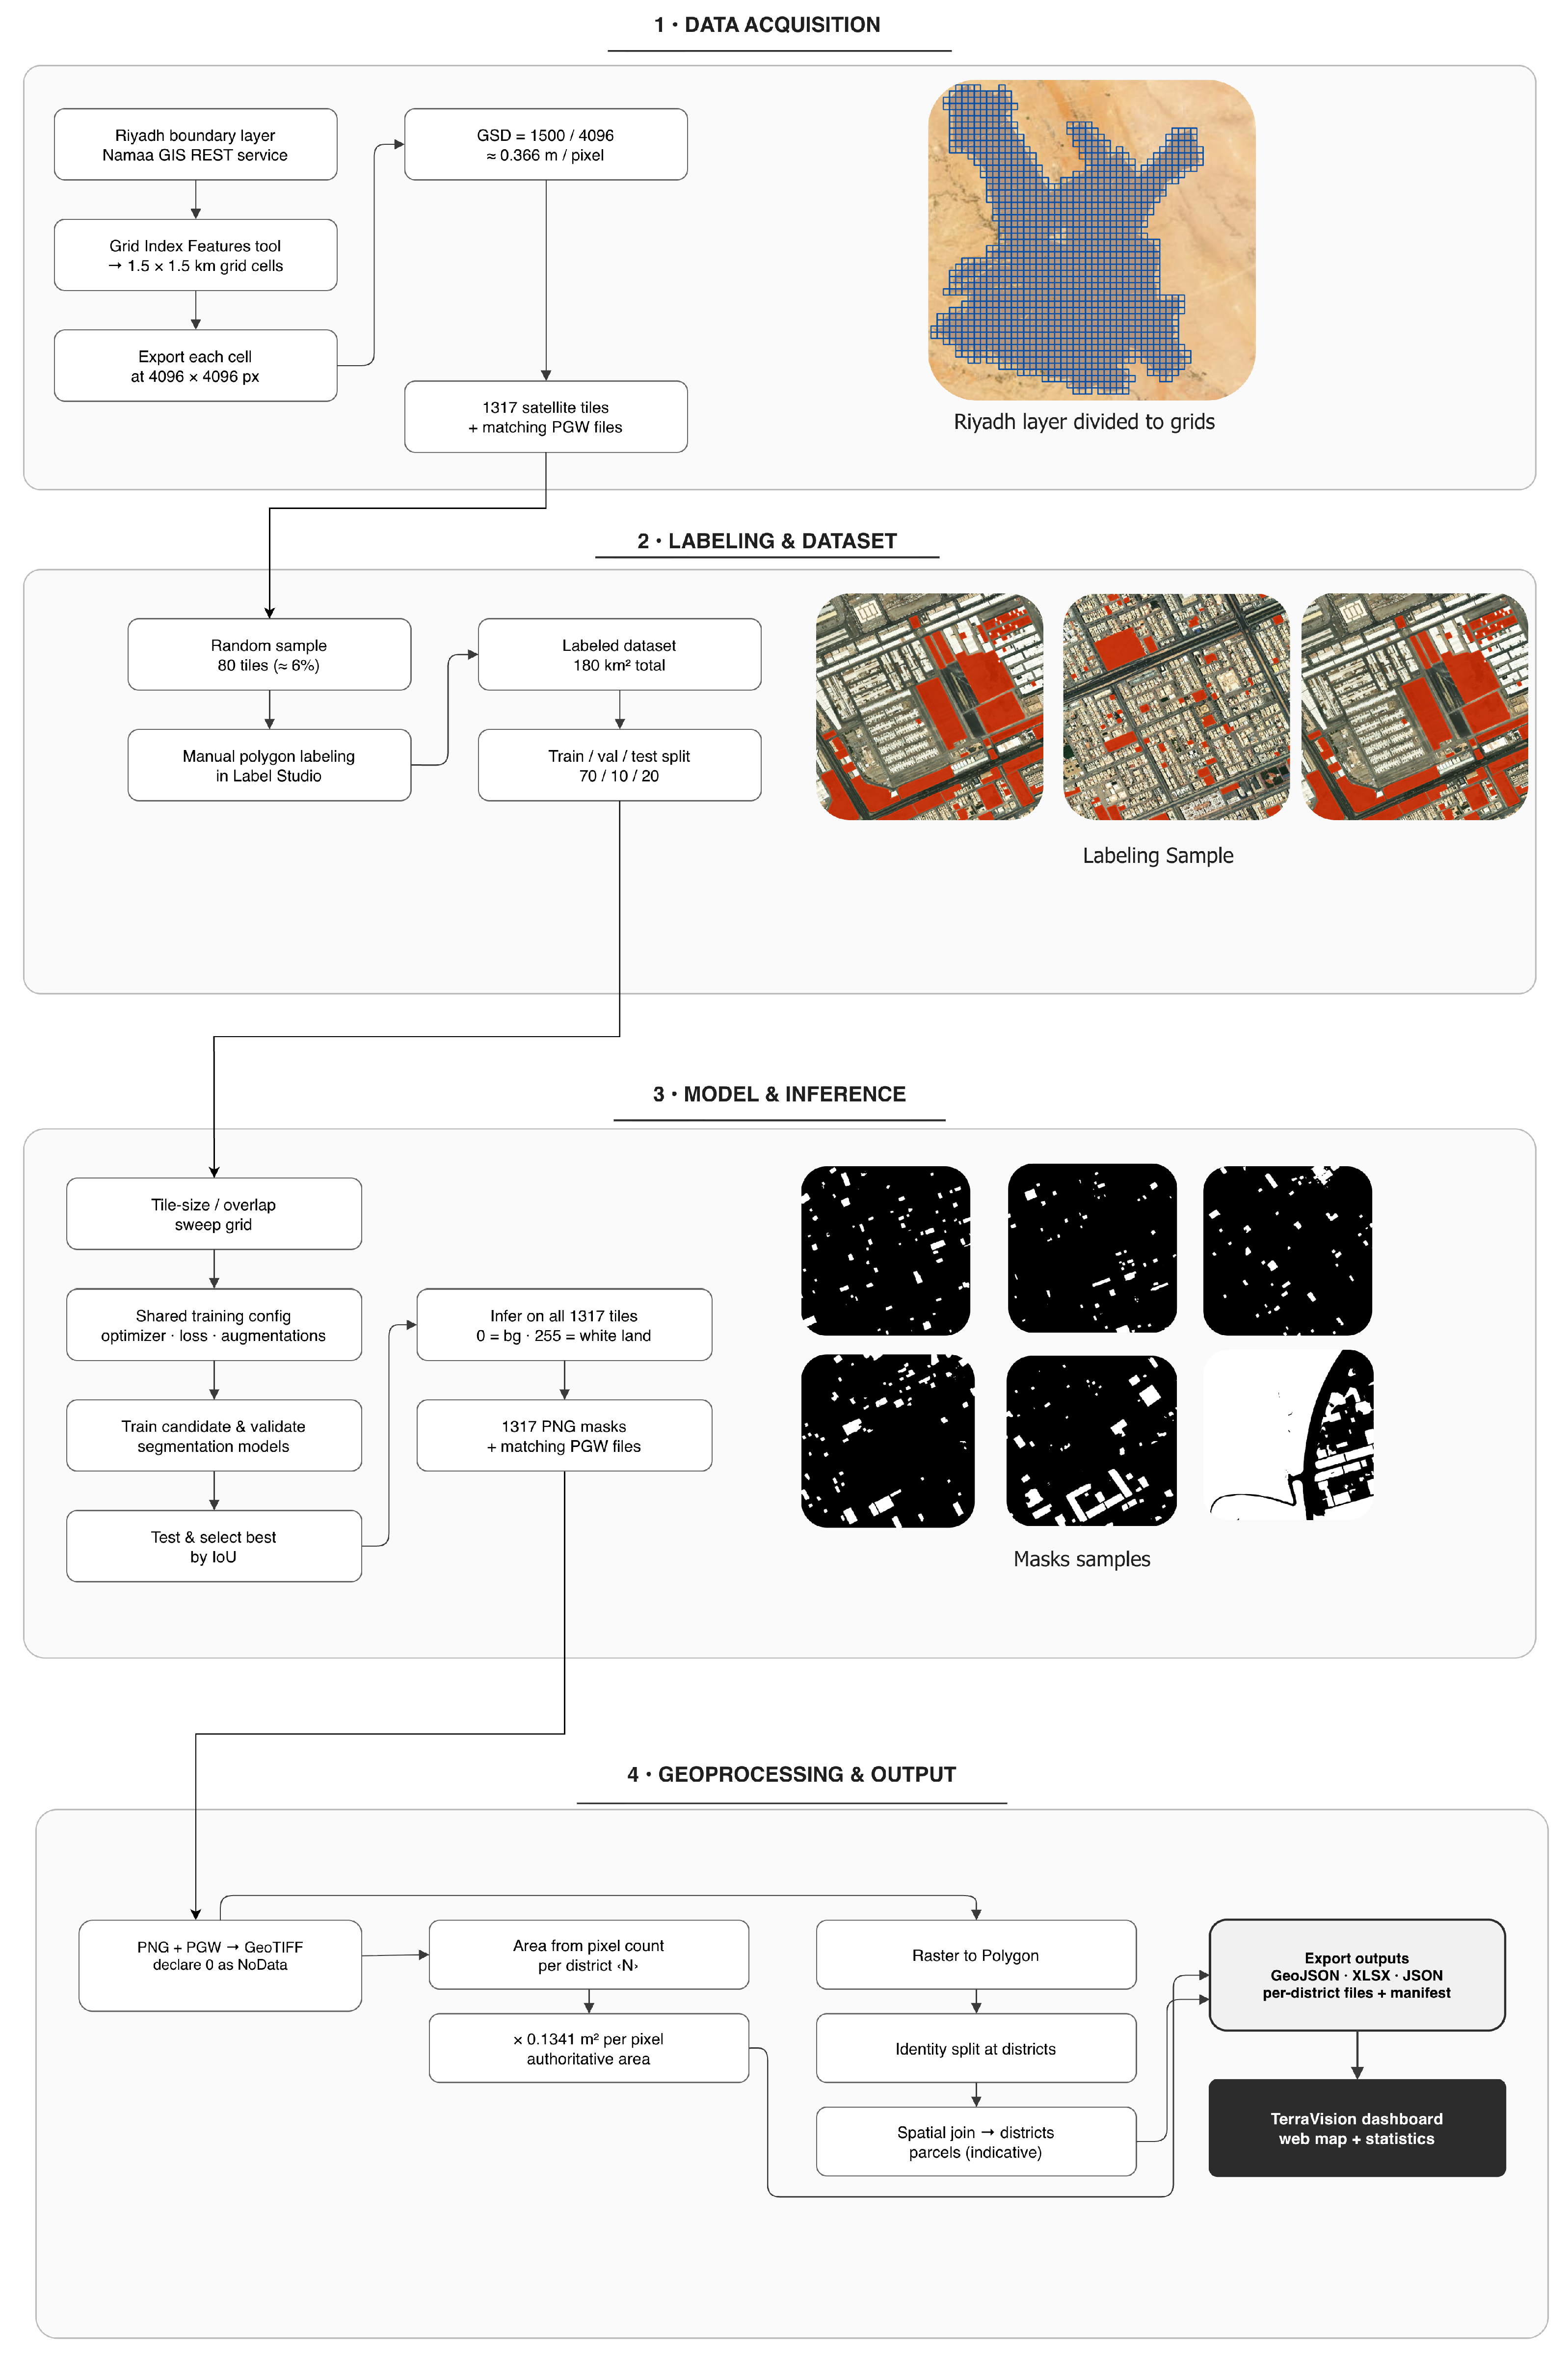
This work follows a structured machine learning pipeline for large-scale White Land detection using high-resolution satellite imagery. The proposed framework consists of four main stages: data acquisition, preprocessing, model training and classification, and visualization through a dashboard.
Figure 1 illustrates the overall workflow of the proposed TerraVision framework.
The first stage involves collecting and organizing satellite imagery covering the entirety of Riyadh. The study area is divided into geographic tiles, where each tile contains multiple land parcels to improve spatial analysis efficiency. Alongside the imagery, metadata such as neighborhood names, geographic coordinates, and segment identifiers are preserved to support later reconstruction and statistical analysis. After data collection, the dataset is labeled and manually reviewed, as described in
Section 3.1, before a formal preprocessing stage consisting of augmentation and formatting, described in
Section 3.2. Augmentation techniques, which expand the training set by applying transformations such as flipping and rotation to existing images, are applied to improve model generalization and reduce overfitting. The processed images are then subdivided into smaller patches suitable for training semantic segmentation models, which assign a class label to every pixel in an image. The third stage focuses on model training and classification. Multiple semantic segmentation architectures are trained and evaluated using the labeled dataset. Hyperparameters are iteratively tuned, meaning training settings are repeatedly adjusted based on validation performance until the model generalizes well, to maximize generalization performance while minimizing overfitting. Once the best-performing model is identified, inference is performed on the remaining unlabeled tiles to generate city-scale White Land predictions. Finally, the segmentation outputs are integrated into an interactive bilingual (Arabic and English) dashboard for visualization and spatial analysis. The dashboard presents prediction maps, neighborhood-level statistics, and geospatial analytics that support urban monitoring and decision-making.
The rationale behind this pipeline is based on building upon recent advancements in semantic segmentation and remote sensing discussed in the related work. The framework combines deep learning, geospatial processing, and GIS visualization into a scalable solution for urban White Land monitoring.
3.1. Data Acquisition
Data acquisition is a critical stage in the proposed framework because the quality and organization of the satellite imagery directly affect segmentation performance. Several factors were considered during this stage, including spatial resolution, metadata preservation, scalability, and computational efficiency. High-resolution satellite imagery was acquired through the ArcGIS platform [
11]. The platform provides commercial satellite imagery with a spatial resolution between 0.31 and 0.34 m per pixel, which is among the highest commercially available resolutions for urban analysis [
31]. The acquired imagery spans dates from 11 February 2025, to 11 April 2025, while the imagery catalog is updated annually by the provider [
32]. The high spatial resolution was necessary for accurately distinguishing White Land boundaries from surrounding urban structures.
To cover the entirety of Riyadh, the study area was divided into a geographic grid using the Grid Index Features tool applied to a spatial boundary layer [
33]. Each tile covers an area of
km and was exported at a resolution of
pixels, corresponding to approximately 0.366 m per pixel. This configuration was selected to give a clean, consistent working resolution across every tile while maximizing the export resolution limit and maintaining manageable file sizes. This resolution is coarser than the native source imagery (0.31 to 0.34 m per pixel); the export therefore resamples the imagery accordingly, and the resulting 0.366-m-per-pixel resolution is the one used for annotation, training, evaluation, and city-scale inference throughout the pipeline. Squaring this value gives the per-pixel ground area, approximately 0.1341 square meters per pixel, used to convert segmented pixel counts into authoritative area estimates during geoprocessing. In total, 1317 image tiles were generated.
To construct the training and testing dataset, 80 tiles were randomly selected, representing approximately 6% of the total extracted imagery. These tiles were manually annotated to delineate White Land boundaries. Each tile represents approximately 2.25 km
2, resulting in a labeled dataset covering nearly 180 km
2. The labeling process focused specifically on binary classification between White Land and non-White Land regions. Buildings, roads, vegetation, and other urban structures were treated as background classes. Five annotators labeled the 80 tiles, each responsible for 16 tiles. Manual review was conducted to minimize annotation inconsistencies, particularly for challenging cases such as partially developed or asphalted plots; disagreement about such ambiguous cases was resolved through shared labeling conventions the team agreed on for each case rather than a formal inter-annotator agreement statistic. The absence of a computed Kappa is noted here as a limitation of the current annotation protocol and a target for future data collection.
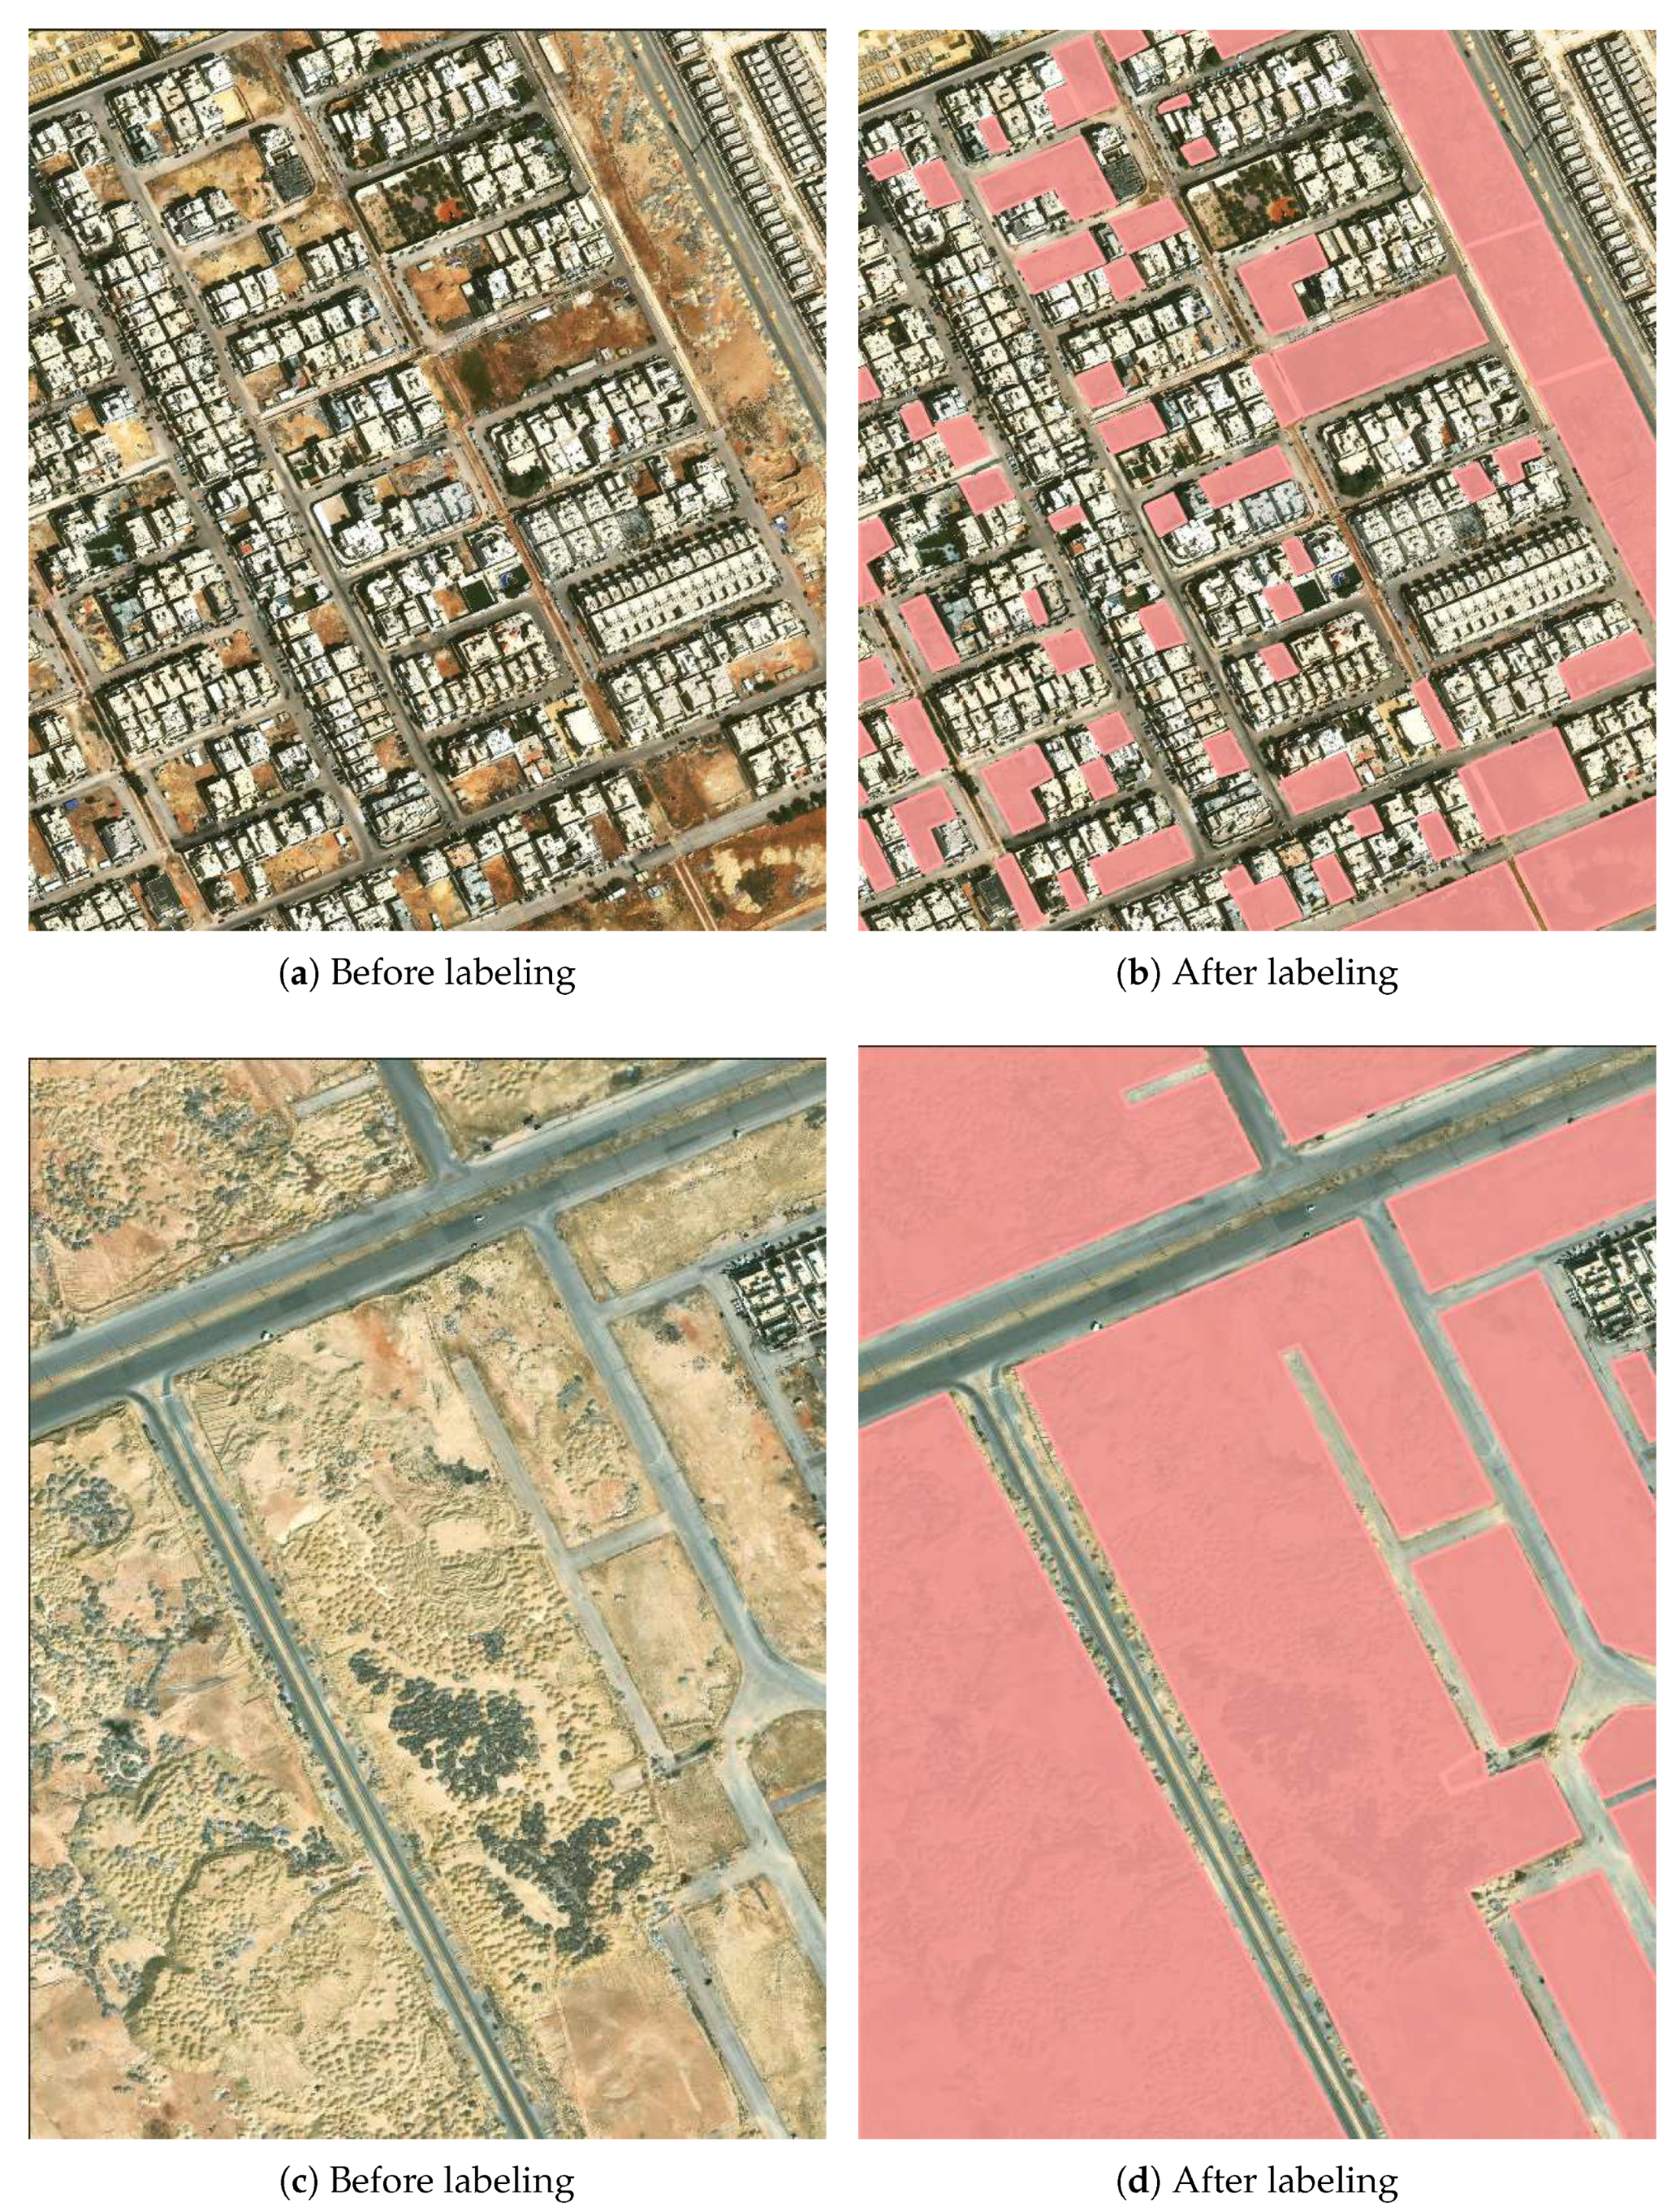
Figure 2 presents representative samples from the training dataset, illustrating the satellite imagery before and after the manual annotation process.
Metadata associated with each tile, including neighborhood identifiers, tile coordinates, and segmentation indices, was preserved throughout the pipeline. This information enables reconstruction of city-scale prediction maps and neighborhood-level statistical analysis. The acquisition strategy was also designed for scalability and efficient processing. Optimized tile sizes and structured storage formats were used to reduce memory requirements and accelerate training and inference. The framework can therefore support future expansion toward nationwide White Land monitoring and temporal urban analysis.
3.2. Data Preprocessing
After data gathering, preprocessing converts raw satellite imagery into a structured dataset suitable for semantic segmentation. The preprocessing pipeline consists of two primary stages: augmentation, and formatting.
First, data augmentation was applied to improve model generalization and artificially increase dataset diversity. Augmentation helps reduce overfitting by exposing the models to different spatial orientations and imaging conditions. The augmentation pipeline included geometric transformations such as horizontal flipping, vertical flipping, and rotations of , , and . Additional transformations involving brightness and contrast adjustments were also applied to simulate varying satellite capture conditions. These operations increased the effective training dataset size while preserving the semantic meaning of the segmented regions.
Following data augmentation, the dataset was reformatted into a structured representation suitable for model training. Images and segmentation masks were stored in paired formats to ensure synchronized loading during training and inference. Large satellite tiles were further subdivided into smaller image patches to reduce memory consumption and satisfy the input size requirements of different segmentation architectures. Metadata associated with each tile was preserved throughout this process to enable later reconstruction of city-scale segmentation outputs and neighborhood-level statistical analysis.
3.3. Model Selection
Ten segmentation models spanning four architectural families were evaluated in this study. Nine models were fine-tuned using the proposed White Land dataset, while one model was evaluated in a zero-shot setting, without dataset-specific fine-tuning. The selection criteria focused on architectural diversity, suitability for remote sensing segmentation tasks, and compatibility with available computational resources.
The first family consists of encoder–decoder architectures. U-Net [
34] with a ResNet34 [
35] backbone and UNet++ [
36] with an EfficientNet-B0 [
37] backbone were selected due to their strong ability to preserve spatial detail through skip connections, which is particularly useful for irregular vacant land boundaries.
Also, DeepLabV3+ [
38] with a ResNet50 backbone was included because of its Atrous Spatial Pyramid Pooling (ASPP) module, which captures multi-scale contextual information while maintaining feature resolution. The model is also widely adopted in satellite image segmentation literature, making it suitable for comparative evaluation.
In addition, Feature Pyramid Network (FPN) [
39] and Path Aggregation Network (PAN) [
40], both using ResNet34 backbones, were selected to evaluate alternative multi-scale feature aggregation strategies. These architectures are effective for detecting White Land parcels of varying sizes across urban environments.
For transformer-based segmentation, SegFormer [
41] with the MIT-B0 backbone was selected due to its computational efficiency and strong performance in previous vacant land studies, particularly the work of Hu and Zhuang [
17]. Transformer architectures are advantageous for capturing long-range contextual dependencies within high-resolution satellite imagery.
Moreover, three YOLO-based segmentation models were also evaluated: YOLOv8-seg [
42], YOLO11-seg [
43], and YOLO26-seg [
44]. These architectures combine object detection mechanisms with segmentation heads, enabling efficient real-time segmentation while maintaining competitive accuracy.
Finally, Meta’s Segment Anything Model 3 (SAM3) [
45] was included as a zero-shot baseline. Due to hardware limitations, SAM3 was not fine-tuned on the dataset. Instead, it was run as a concept-prompted baseline: each tile was passed to the model with a single fixed text prompt, “vacant land,” rather than point or box prompts; detections below a confidence score of 0.5 were discarded, and at most 50 instances per tile were kept before merging into a binary mask, to assess how a general-purpose foundation segmentation model performs without domain-specific adaptation.
3.4. Evaluation Metrics
Model performance was evaluated using five primary segmentation metrics: Intersection over Union (IoU), Dice coefficient, Precision, Recall, and Matthews Correlation Coefficient (MCC). These metrics were selected because they provide a balanced evaluation of binary segmentation performance in imbalanced datasets.
First, intersection over Union (
) was used as the primary evaluation metric. IoU measures the overlap between predicted and ground-truth White Land regions relative to their union:
Second, Dice coefficient measures segmentation similarity while emphasizing overlap between prediction and ground truth:
Third, precision measures the proportion of predicted White Land pixels that are correctly classified:
Fourth, recall evaluates the proportion of actual White Land pixels successfully identified by the model:
Fifth, Matthews Correlation Coefficient (MCC) provides a balanced metric derived from all values of the confusion matrix and remains robust under class imbalance:
Pixel accuracy was not considered a primary metric because the dataset is dominated by non-White Land pixels, which can artificially inflate accuracy values. IoU, Dice, Precision, Recall, and MCC provide a more reliable assessment of White Land segmentation performance.
Additional metrics such as F1-score, specificity, balanced accuracy, pixel AP, pixel AUROC, mean IoU, and frequency-weighted IoU were monitored during training but omitted from the final evaluation since they provided limited additional insight for the binary segmentation task.
4. Results and Discussion
This section presents the experimental results obtained from the proposed White Land detection framework and analyzes the performance of the evaluated segmentation models. First, the selected hyperparameter configurations and training settings are discussed. Next, the segmentation accuracy of all models is compared using multiple evaluation metrics on the held-out test set, followed by a computational analysis of training and inference efficiency. The section then demonstrates the practical deployment of the proposed framework through the TerraVision application and concludes with a discussion of the observed limitations and challenges.
4.1. Hyperparameter Settings
All nine finetuned models were trained using a unified training pipeline to ensure fair comparison across architectures. Hyperparameters, the configuration settings that control how a model is trained, such as learning rate, batch size, and training duration, are discussed below. The main hyperparameters varied during experimentation were tile size and tile overlap, while all other settings remained fixed. Five tile sizes were evaluated: 256, 384, 512, 768, and 1024 pixels, each a multiple of 32 to match the stride of the encoder downsampling path used by the evaluated architectures. Because the effect of tile size and overlap on segmentation performance is not established for this task and imagery type, both were swept across a range of values rather than fixed to a single setting drawn from prior work. The range spans from small patches, which increase spatial detail and the number of training samples, to near full-tile inputs, which preserve broader spatial context but increase GPU memory consumption per training step; 1024 pixels represents a practical upper bound given the GPU memory available for this study (
Section 4.3). Three overlap ratios were tested: 0.125, 0.25, and 0.375, spanning a similar range from minimal to substantial redundant coverage at tile borders. Each model was therefore trained on 15 different tile size and overlap combinations. Edge-aware tiling was applied to ensure complete image coverage without dropping border pixels.
The SMP-based models (U-Net, UNet++, DeepLabV3+, FPN, and PAN) and SegFormer were trained using the AdamW optimizer with a learning rate of and weight decay of . A cosine annealing learning-rate scheduler and a combined Binary Cross-Entropy and Dice loss function were used; Cross-Entropy loss measures how far the model’s predicted class probabilities are from the correct label at each pixel, penalizing confident incorrect predictions more heavily. Training was performed for a maximum of 100 epochs with early stopping patience set to 15 epochs. The YOLO-based segmentation models were trained using the Ultralytics framework with default optimizer and scheduler settings. Training was limited to 300 epochs, a higher ceiling than the 100 used for the SMP and SegFormer models, reflecting the YOLO framework’s different training dynamics and lower per-epoch cost, with the same early stopping strategy; in practice, training ended earlier once validation IoU stopped improving, so 300 is an upper bound rather than a fixed target.
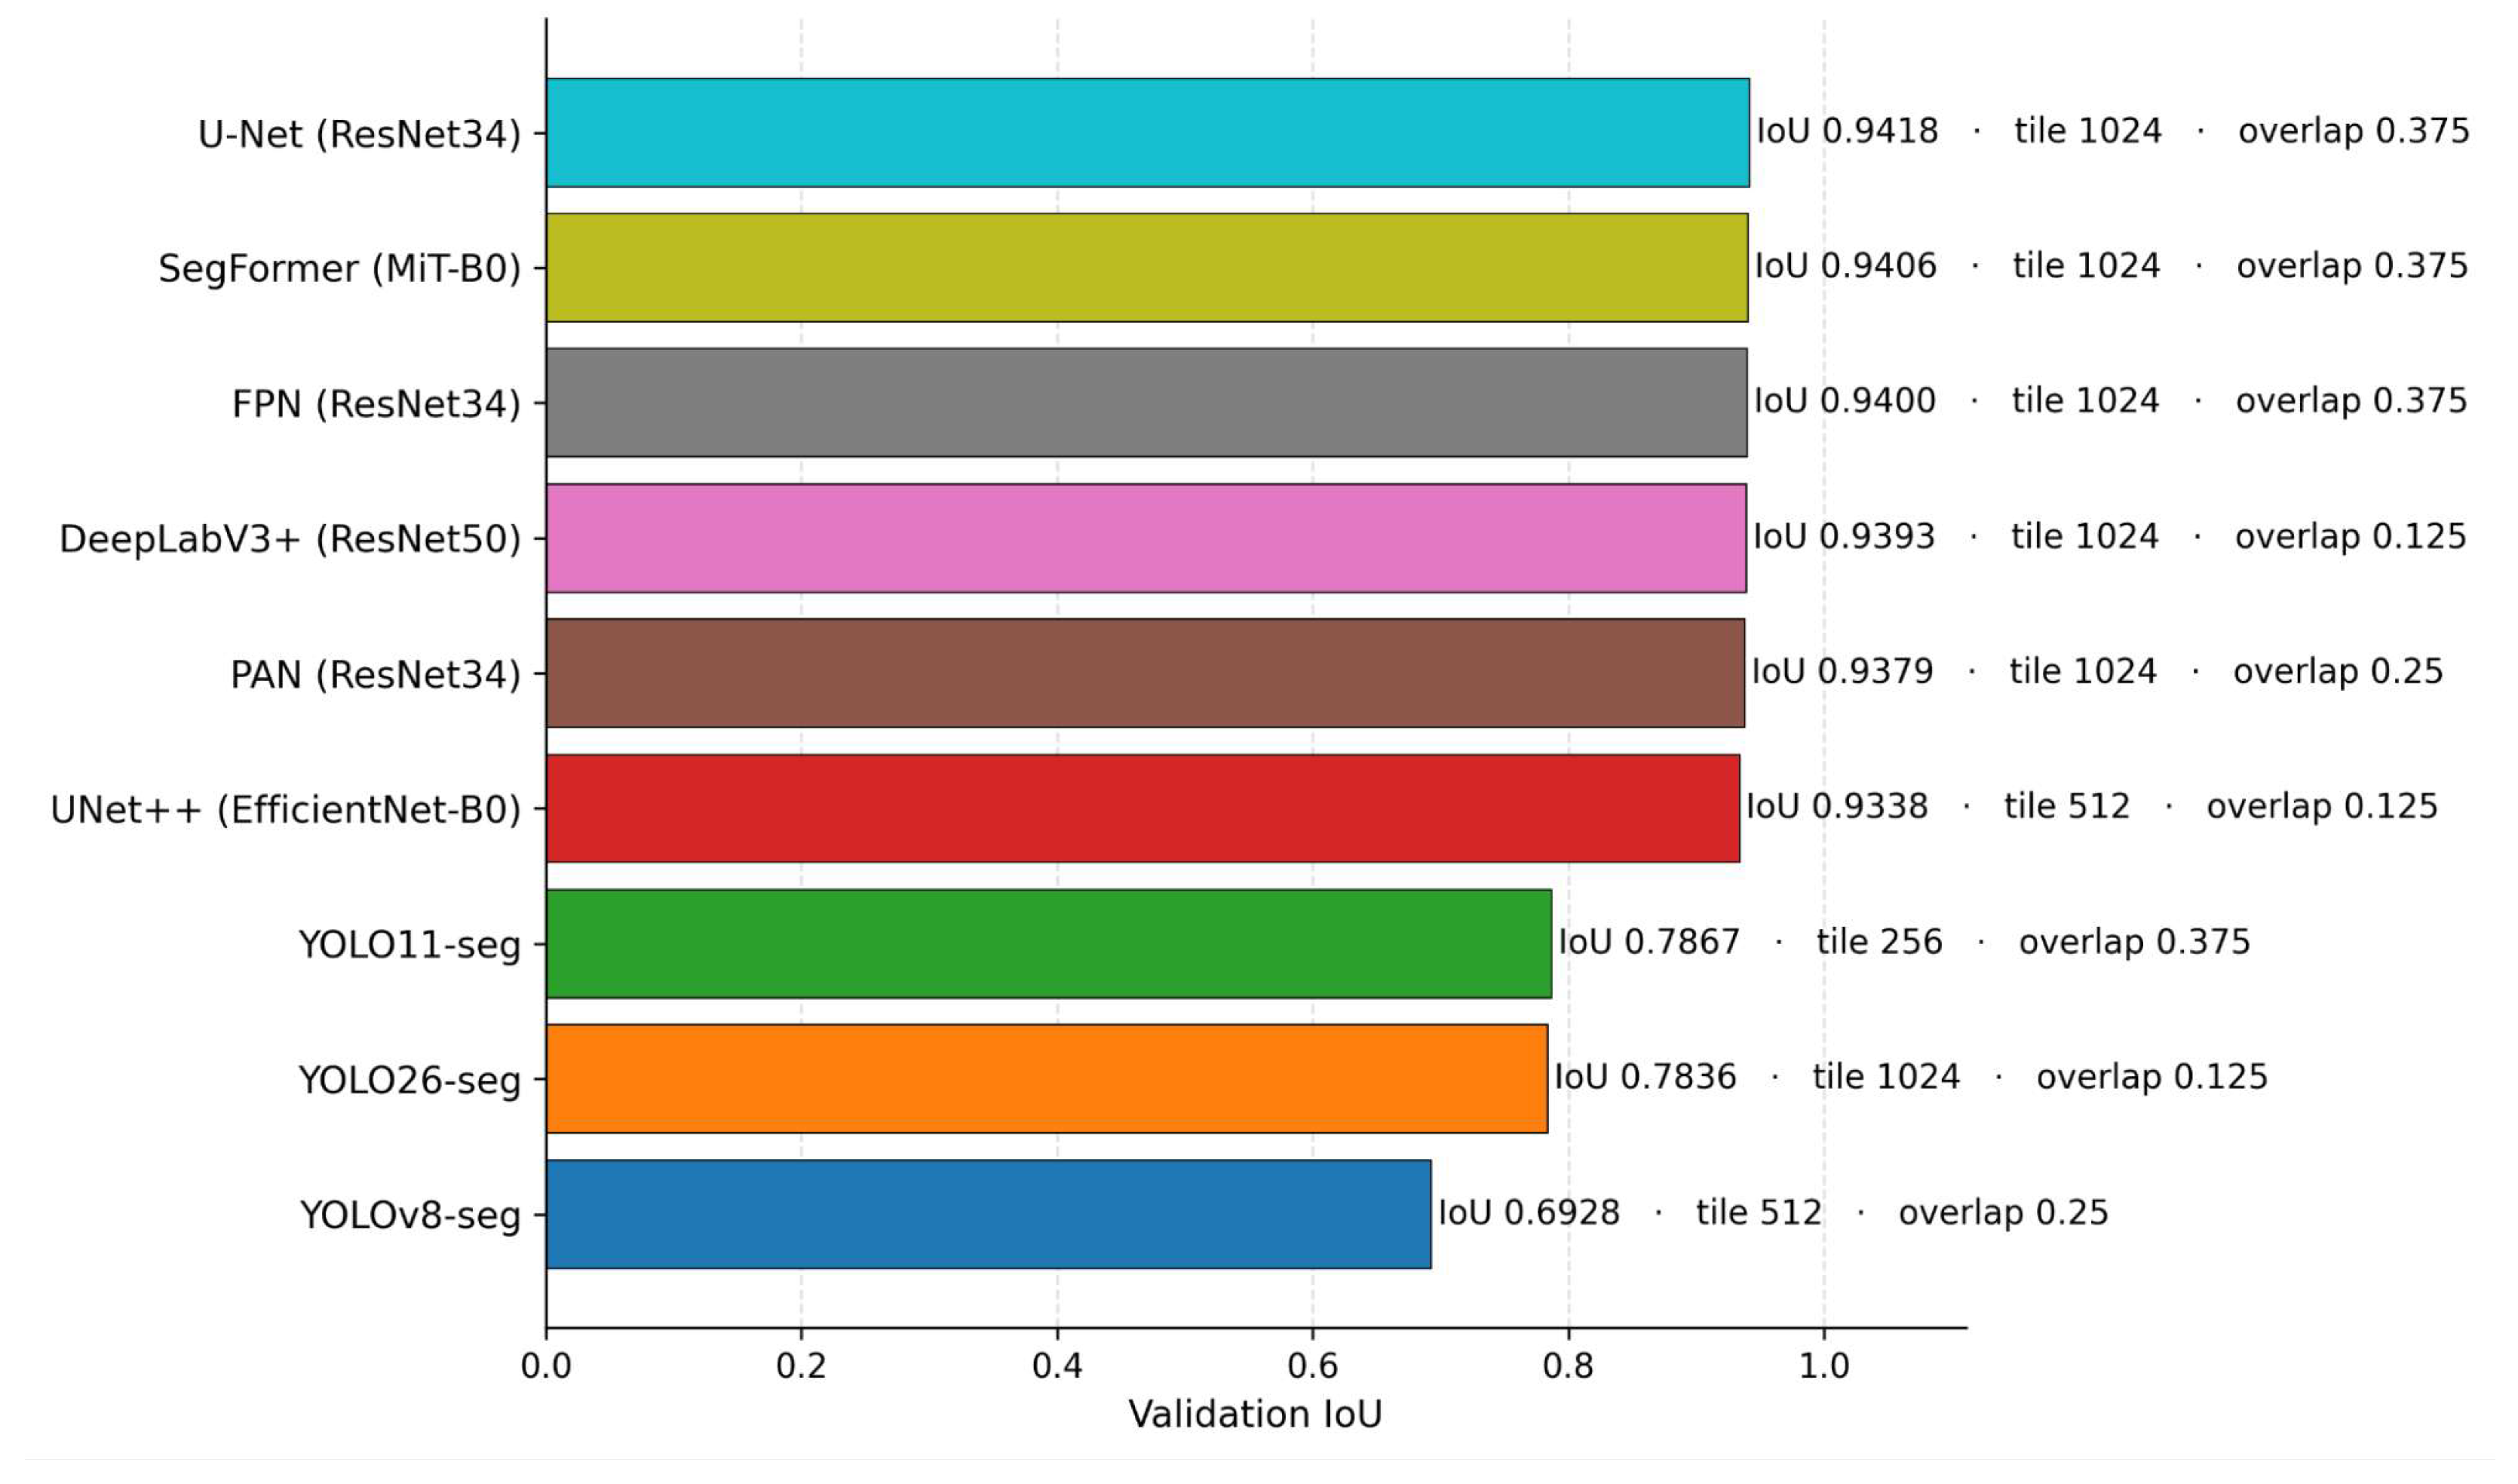
For each model, the configuration achieving the highest validation IoU was selected as the final model.
Figure 3 shows the best configuration and validation IoU for each of the nine finetuned models; these are validation-set results used for model and configuration selection, whereas
Table 2 reports the corresponding test-set results. All experiments used a fixed dataset split of 70%, 10%, and 20% for training, validation, and testing, respectively, with a fixed random seed applied throughout the pipeline to ensure experimental reproducibility and fair model comparison. The split is performed at the level of the 80 annotated source tiles, prior to subdivision into training patches, and the pipeline includes an explicit check confirming that the training, validation, and test tile sets are pairwise disjoint; patches are then generated independently within each split, so no patch in the test set originates from a tile used in training or validation.
4.2. Performance Analysis
This subsection evaluates the performance of the ten segmentation models on the held-out 20% test set. Each model was evaluated using its best-performing configuration selected during the validation sweep. During inference, all models used non-overlapping tiles.
The semantic segmentation models (U-Net, UNet++, DeepLabV3+, FPN, PAN, and SegFormer) and SAM3 generate pixel-level probability maps, which were thresholded at 0.5 to produce binary segmentation masks. The YOLO-based models generate instance masks that were merged into a single binary mask per tile before evaluation. All models were assessed using the same five metrics mentioned before. As
Table 2 shows, the six finetuned semantic segmentation models achieved consistently high performance, with IoU scores ranging between 0.94 and 0.96. SegFormer achieved the best overall performance with an IoU of 0.9563 and an MCC of 0.9027, though by a small margin over FPN and PAN across most evaluation metrics. FPN and PAN also demonstrated the effectiveness of multi-scale feature aggregation for White Land segmentation. Furthermore, SAM3 achieved an IoU of 0.9281 despite operating in a zero-shot setting without finetuning on the proposed dataset. Although its performance was lower than the finetuned semantic models, the results demonstrate the strong generalization capabilities of large foundation segmentation models. The reference masks used for training and evaluation represent a visual and manual interpretation of White Land based on satellite imagery; they do not necessarily correspond to a parcel’s official legal classification under zoning, ownership, and registered development status, a distinction discussed further in
Section 4.5.
On the other hand, the YOLO-based segmentation models produced lower overall performance compared to the semantic segmentation architectures. YOLOv8-seg achieved the highest IoU among the YOLO family at 0.8545, while YOLO26-seg obtained the lowest overall performance with an IoU of 0.7211. The reduced performance suggests that detection-first segmentation architectures are less suitable for precise pixel-level White Land delineation compared with segmentation-first architectures.
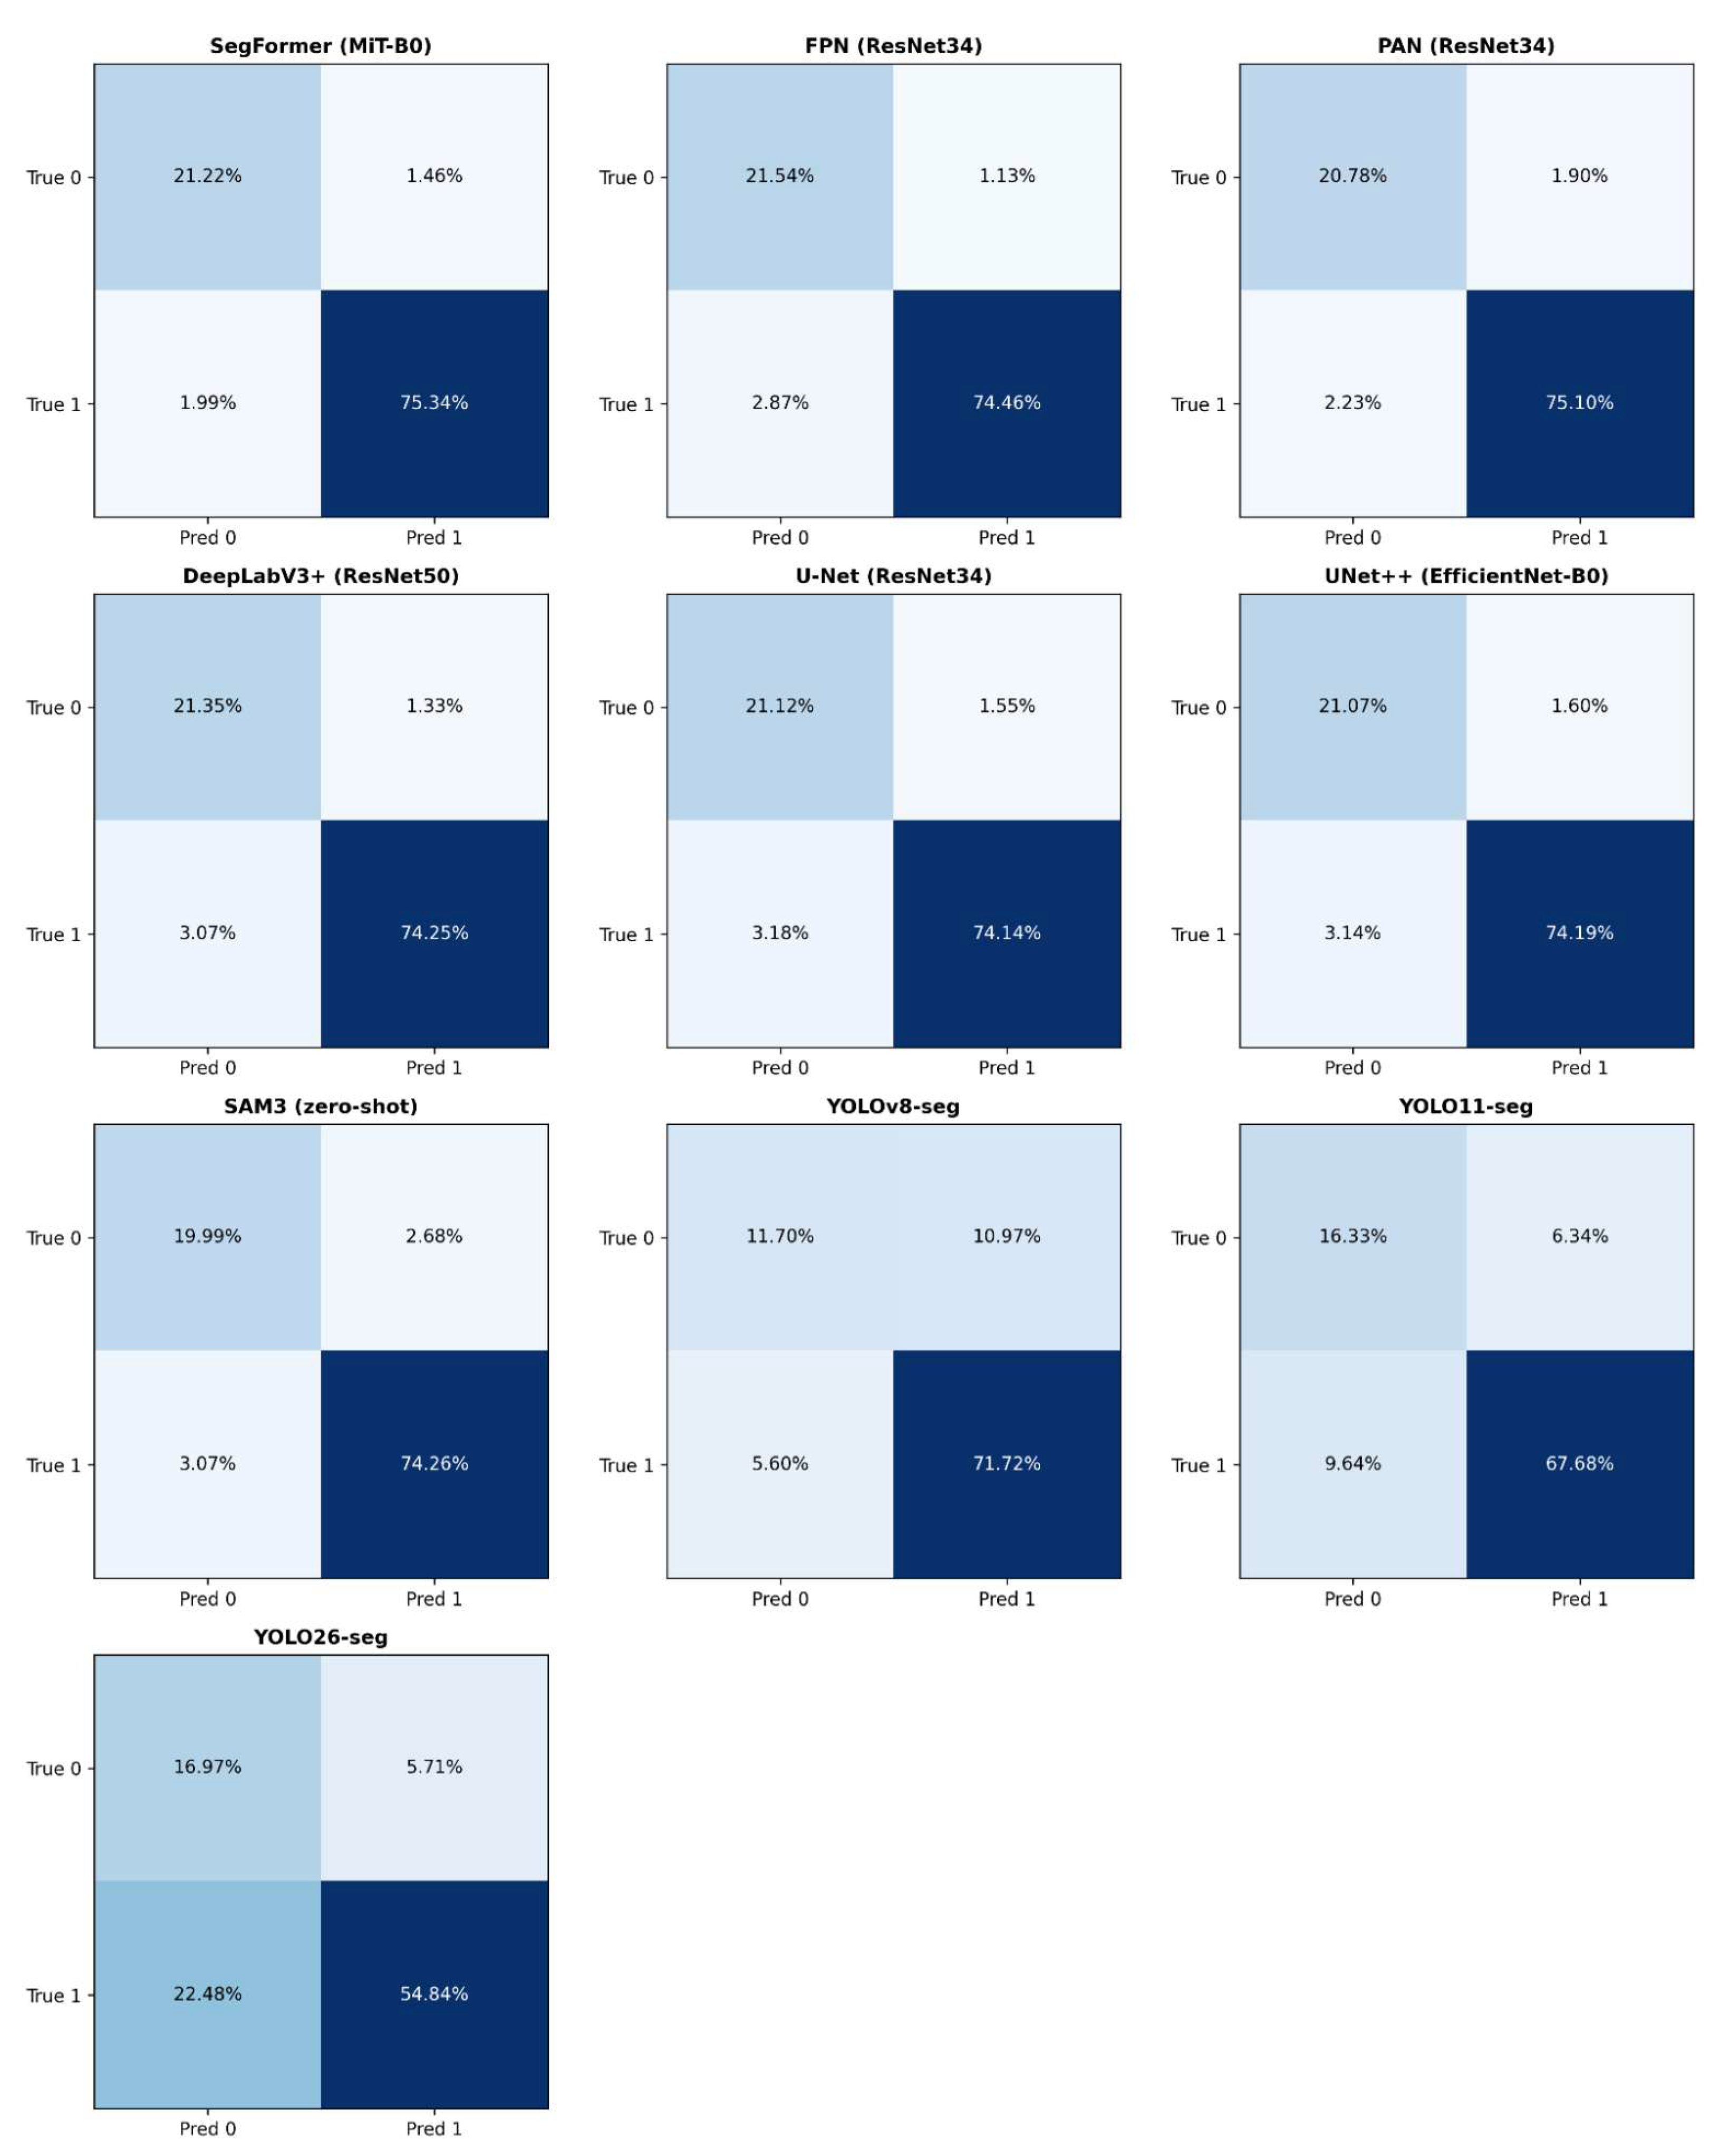
To further analyze pixel-level prediction behavior,
Figure 4 presents the normalized confusion matrices for all models. The semantic segmentation models exhibited consistently low false-positive and false-negative rates, while the YOLO-based models showed noticeably larger error regions. Among the YOLO models, YOLOv8-seg produced the largest false-positive area, whereas YOLO26-seg produced the largest false-negative area, missing a substantial portion of actual White Land pixels.
Overall, the results demonstrate that transformer-based and encoder–decoder semantic segmentation models are highly effective for large-scale White Land detection in high-resolution satellite imagery. In particular, SegFormer provided the best balance between precision, recall, and spatial segmentation quality across the benchmark.
4.3. Computational Analysis
This subsection evaluates the computational efficiency of the evaluated models in terms of training and inference time. Training and inference were measured separately because they were conducted on different hardware configurations. The SMP-based models (U-Net, UNet++, DeepLabV3+, FPN, and PAN) and SegFormer were trained on a workstation equipped with two NVIDIA RTX 4090 GPUs (24 GB VRAM each) using PyTorch 2.1.0 data parallelism. The YOLO-based models were trained on a separate workstation with a single NVIDIA RTX 4080 SUPER (16 GB VRAM). Inference for all models was performed on a third machine using a single NVIDIA RTX 3080 GPU (10 GB VRAM). Due to these hardware differences, training times between the SMP/SegFormer models and the YOLO models should not be compared directly.
Among the semantic segmentation models, FPN and PAN achieved the shortest training times, requiring approximately two hours each as
Table 3 shows. UNet++ and SegFormer required longer training durations due to their more computationally intensive architectures. SegFormer recorded the highest training cost among the semantic models at approximately 5.3 h. The YOLO-based models showed large variation in training time. YOLOv8-seg trained the fastest at 1.8 h, while YOLO26-seg required 8.6 h. Although YOLOv8-seg had the shortest training time overall, the YOLO family generally exhibited higher inference costs compared with the semantic segmentation models.
Inference results showed a clear efficiency advantage for the semantic segmentation architectures. FPN, PAN, and DeepLabV3+ completed inference on the full test set in under 10 s, while all semantic models completed evaluation in less than 18 s. In contrast, the YOLO models required between 69 and 84 s due to additional operations such as object detection, non-maximum suppression, which removes duplicate overlapping detections and keeps only the most confident one, and instance-mask processing. SAM3 produced the slowest inference time at 92.4 s despite operating in a zero-shot setting. The large size of the foundation model significantly increased computational cost during inference.
Overall, the semantic segmentation models provided the best balance between segmentation accuracy and computational efficiency. The YOLO models demonstrated higher computational overhead during both training and inference, while SAM3, although competitive in accuracy, was computationally expensive for large-scale deployment scenarios.
4.4. TerraVision Application
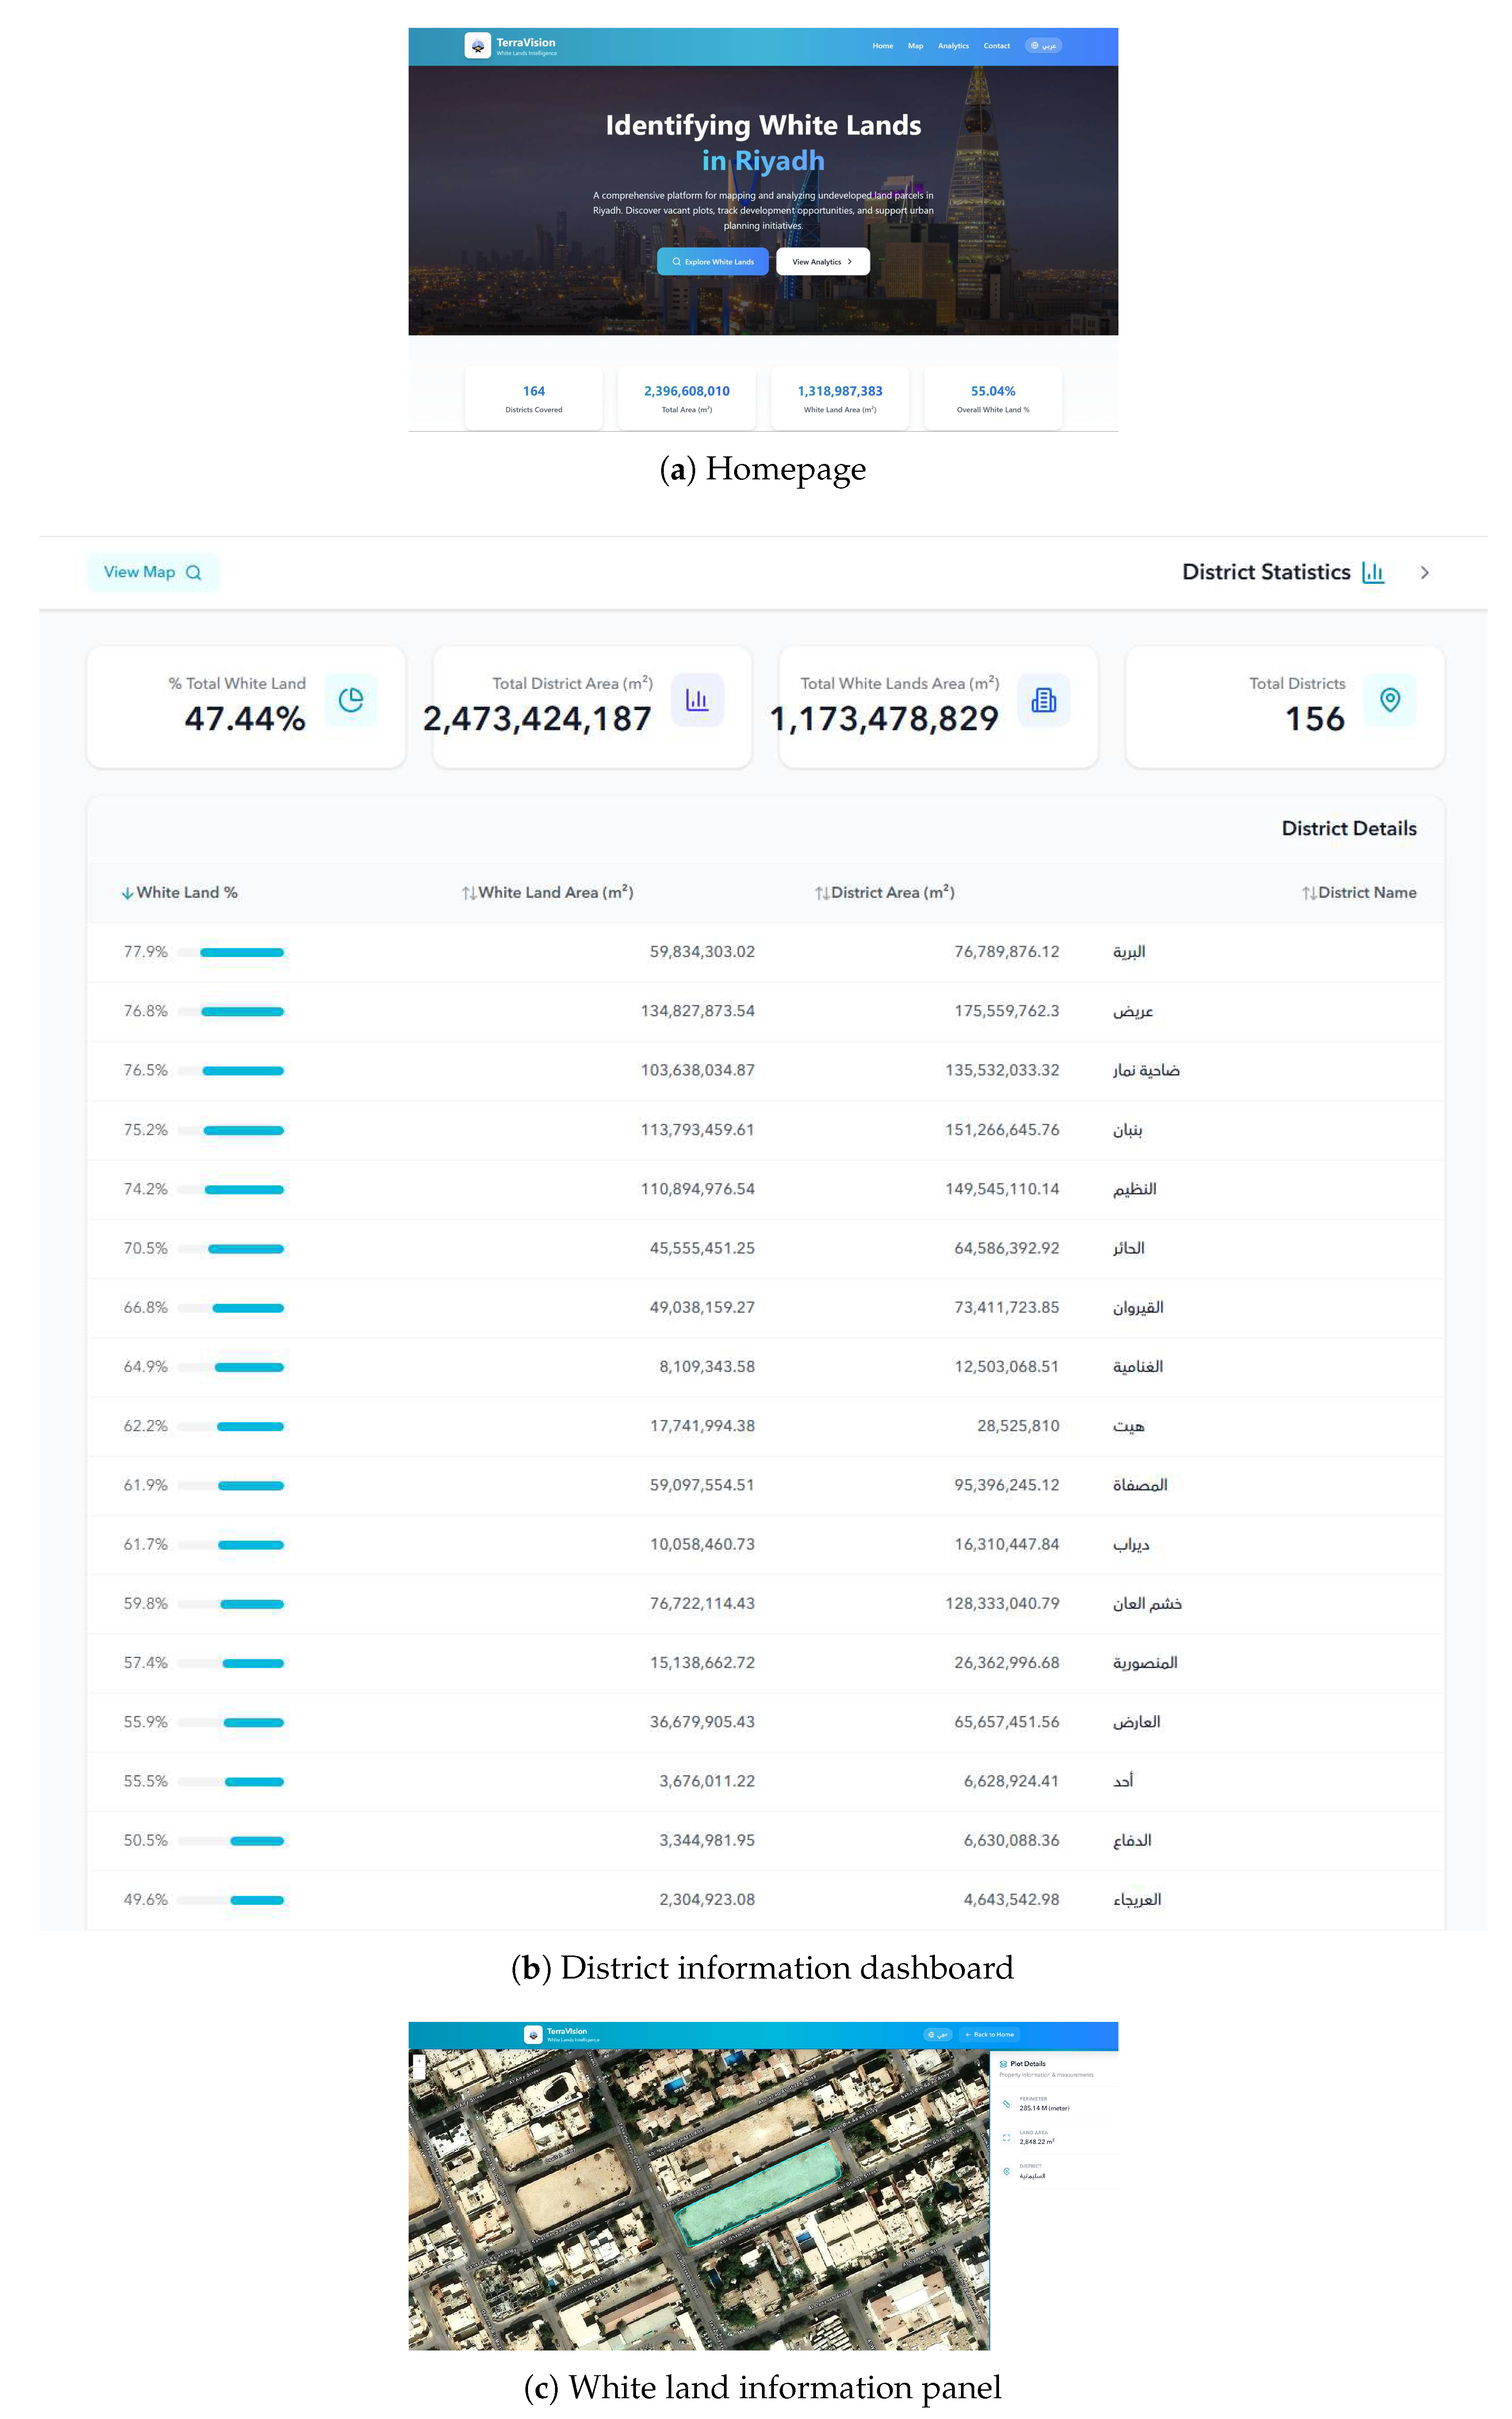
To demonstrate the practical applicability of the proposed framework, the segmentation pipeline was integrated into a real-world web application named TerraVision. The application serves as a visualization and decision-support platform that allows municipalities, urban planners, developers, investors, and researchers to explore and analyze White Land distribution across Riyadh.
The front-end and presentation layer were designed to make the system intuitive, interactive, and accessible to both technical and non-technical users. The application was developed using the ArcGIS platform to provide responsive GIS-based visualization with bilingual support in both Arabic and English. The platform combines satellite imagery, segmentation outputs, and spatial statistics into a unified interface for large-scale urban analysis. The home page provides an overview of the system and presents dynamically generated statistics related to mapped regions and White Land percentages. These statistics are computed directly from the processed segmentation outputs, allowing users to quickly understand the spatial distribution of vacant land without manually inspecting raw datasets.
The core functionality of TerraVision is provided through an interactive GIS map interface. Predicted White Land regions are displayed as polygon layers over high-resolution satellite imagery, enabling users to visually inspect undeveloped urban areas. Selecting a polygon opens an information panel containing additional attributes such as land area, perimeter, and associated neighborhood. This improves usability and allows the platform to function as more than a static visualization tool.
By integrating the proposed segmentation framework into a deployable GIS application, TerraVision demonstrates how machine learning-based White Land detection can support real-world urban planning and land-monitoring workflows.
Figure 5 shows sample screenshots from the TerraVision front–end interface.
4.5. Discussion
The benchmark results support the hypothesis that machine learning models trained on high-resolution satellite imagery are an effective approach for White Land detection. The six finetuned semantic segmentation models achieved IoU scores between 0.94 and 0.96 on the held-out test set, demonstrating strong agreement between predicted and ground-truth masks. Among all evaluated models, SegFormer achieved the best performance with an IoU of 0.9563, indicating that transformer-based architectures are highly effective for large-scale urban segmentation tasks. Because the IoU differences among the top three models, SegFormer, FPN, and PAN, are small, formal significance testing between them, such as bootstrap confidence intervals, is left to future work.
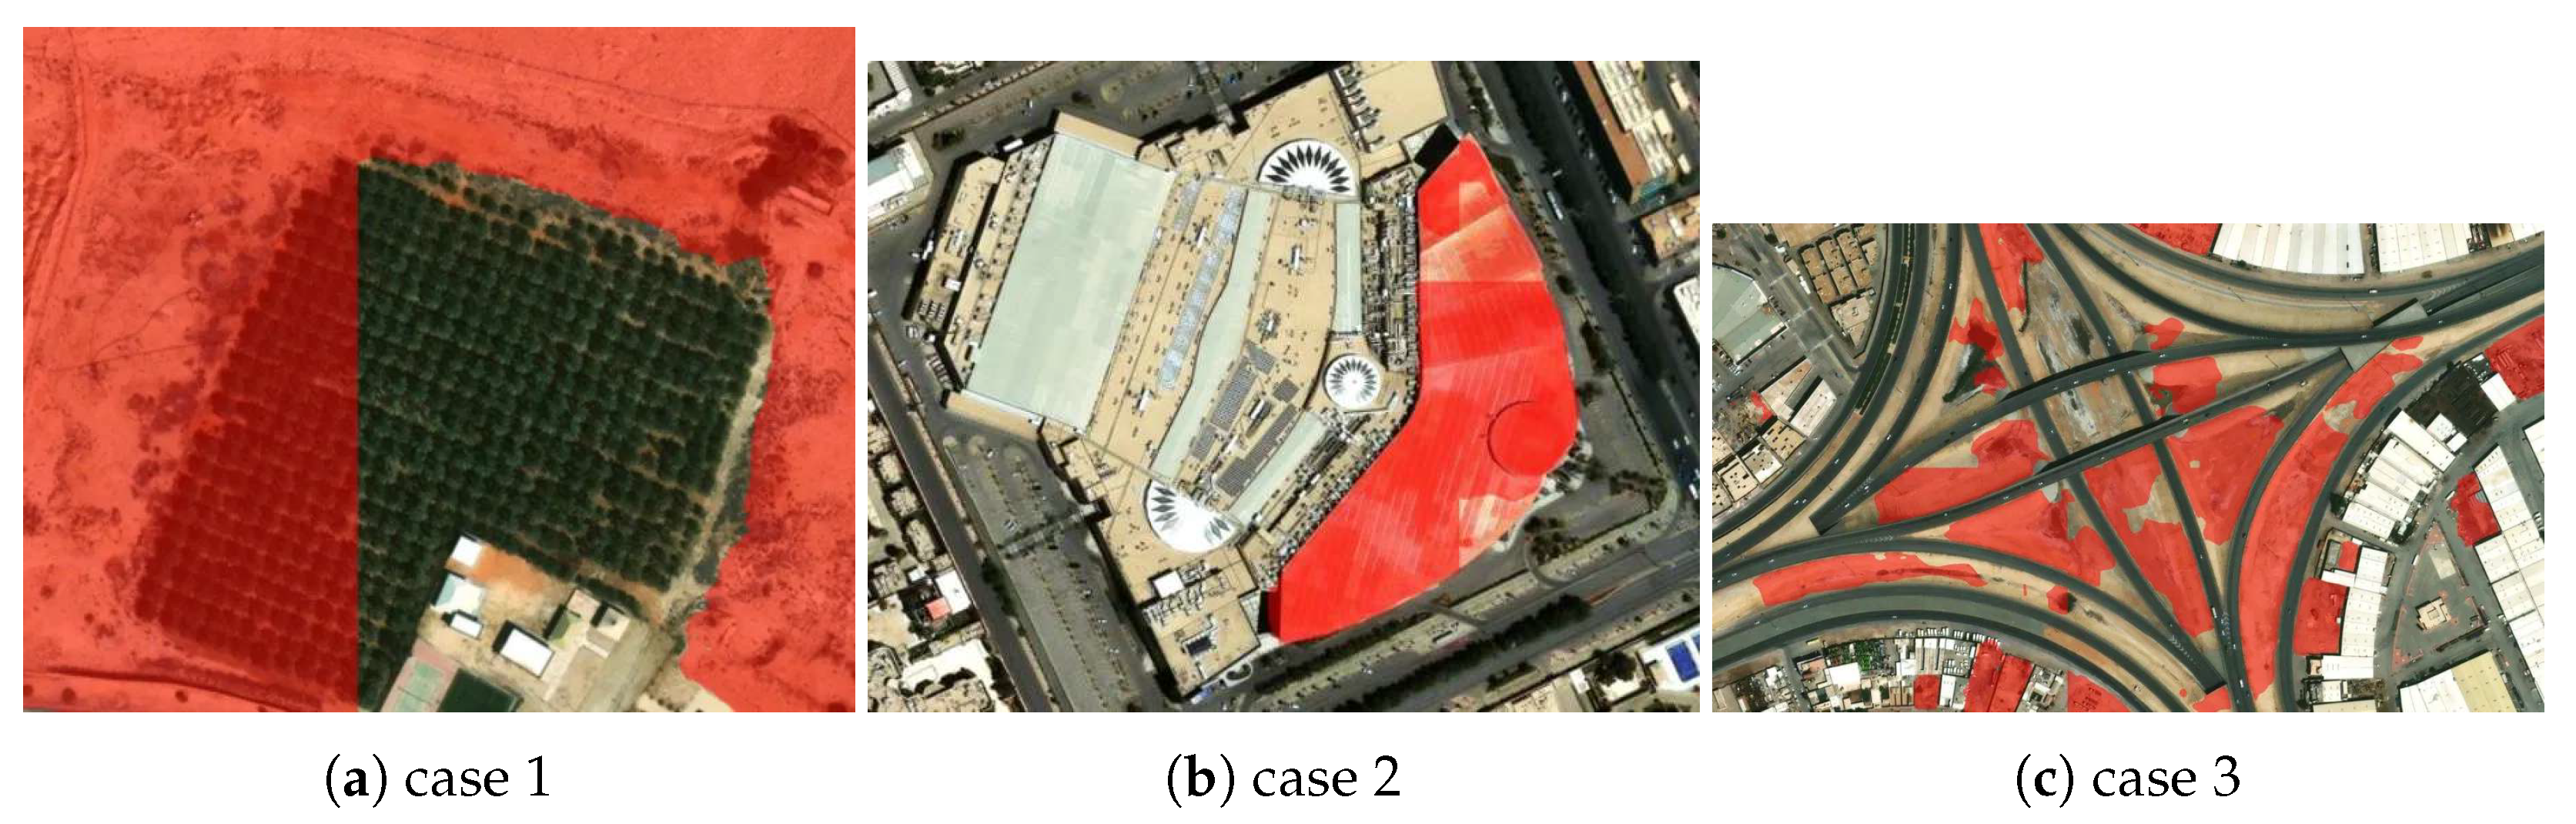
Despite the strong quantitative results, qualitative inspection revealed several recurring failure modes. The models occasionally misclassified cultivated areas, particularly palm tree farms, as White Land due to similarities in texture and sparse vegetation patterns. Large building rooftops were also sometimes classified as vacant land because of their visual resemblance to compacted soil surfaces. In addition, undevelopable areas such as highway interchange gaps were identified as White Land since the models relied purely on visual appearance without contextual land-use information.
Figure 6 illustrates several representative examples of the misclassification cases observed in the model predictions.
These observations highlight an important limitation of purely image-based segmentation. The models identify visually vacant regions but cannot determine whether a parcel is legally or practically developable. Integrating cadastral information, zoning regulations, and parcel boundaries would therefore be essential for real-world deployment. Parcel-level postprocessing could also reduce several observed false positives by filtering predictions using official land ownership and land-use records. Validation of the visual reference masks against the official cadastral registry maintained by the Ministry of Municipalities and Housing (MOMAH) was outside the scope of the present dataset construction and is identified as a priority for future work. The 80 annotated tiles were also selected through simple random sampling, without stratification by urban typology, density, or central-versus-peripheral location; future work should evaluate stratified sampling across these dimensions to strengthen generalization claims across Riyadh’s urban fabric.
Overall, the results demonstrate that semantic segmentation provides a practical and scalable solution for automated White Land monitoring. However, additional integration with municipal spatial data and broader geographic evaluation would be necessary before deploying the system as a fully automated urban planning tool.
5. Conclusions
This study evaluated the use of machine learning and semantic segmentation models for automated White Land detection in Riyadh using high-resolution satellite imagery. The results demonstrate that semantic segmentation is an effective and scalable approach for detecting vacant urban land at the city scale.
Six finetuned semantic segmentation models achieved strong performance, with IoU scores ranging between 0.94 and 0.96 on the held-out test set. SegFormer achieved the highest performance with an IoU of 0.9563, while the zero-shot SAM3 model also produced competitive results without dataset-specific fine-tuning. In contrast, the YOLO-based models achieved lower accuracy and higher computational cost, making them less suitable for dense pixel-level segmentation in this application.
The proposed framework supports preliminary remote-sensing screening for White Land monitoring, consistent with the goals of Saudi Arabia’s amended White Land Fees Law. Direct implementation of the law would additionally require cadastral information, zoning regulations, parcel boundaries, and ownership records not yet part of the system. Future work should focus on integrating cadastral and land-use data, improving robustness against challenging visual cases, and evaluating the framework on additional cities and time periods.




 ,
,