1. Introduction
Urbanisation has accelerated dramatically over the last century. According to the most recent United Nations estimates, global population growth will be increasingly concentrated in urban settlements. The 2025 revision of the World Urbanization Prospects projects that cities will absorb around two-thirds of the world’s population increase by 2050, while most of the remaining growth will occur in towns; by contrast, the global rural population is expected to peak in the 2040s and then gradually decline [
1].
In this context, cities lie at the centre of global sustainability challenges: they depend on substantial flows of materials and energy [
2] and exert significant pressure on surrounding and distant ecosystems through land conversion, resource appropriation and pollutant emissions [
3]. At the same time, urban ecosystems can provide essential ecosystem services (ESs) that support environmental quality, human health, biodiversity conservation and cultural identity [
4,
5,
6]. These dynamics align with a growing view of cities as complex socio-ecological systems, where ecological processes and human activities co-evolve across scales [
7,
8].
Within this perspective, urban squares deserve particular attention: they operate as multifunctional public spaces that can contribute to ecosystem service provision, social cohesion, microclimate regulation, ecological connectivity and urban resilience [
5,
9,
10,
11]. At the same time, they can also be understood as socio-ecological nodes where ecological processes, everyday social practices, and management choices intersect within the broader urban fabric [
6,
12,
13].
For the purposes of this review, “urban square” is treated as an operational category rather than as a fixed universal typology. It refers to publicly accessible open urban spaces, commonly described in the literature as squares, plazas, or similar civic spaces, that function as focal nodes of social interaction and urban circulation. This choice reflects the heterogeneous terminology used across disciplines while maintaining a focus on square-like public settings rather than on urban green spaces more broadly (see Limitations).
Despite this potential, squares are less frequently addressed in conservation-oriented literature compared with the extensive body of work on parks, street trees and green infrastructure [
13,
14,
15,
16]. Accordingly, existing research on urban squares remains fragmented and offers limited guidance on how environmental pressures, ecological components and management responses are jointly addressed in these spaces. This limitation is particularly problematic because urban squares are exposed to concentrated environmental and anthropogenic pressures, including chronic air pollution [
17], urban heat stress [
18] and the effects of rapid urban expansion [
19]. In the broader context of climate change adaptation and resilience [
20] and of policy instruments that emphasise ecosystem restoration and multifunctional urban nature [
21], a consolidated, conservation-oriented knowledge base on urban squares is especially timely.
A scoping review is particularly suited to this task because it enables the systematic mapping of heterogeneous evidence, the identification of conceptual patterns and the clarification of fragmented or inconsistent terminology [
22,
23,
24,
25]. Rather than critically appraising study quality or estimating pooled effect sizes, scoping reviews focus on “what has been studied, how and with which concepts”, making them appropriate for emerging and interdisciplinary fields such as ecosystem services in urban squares. Accordingly, the present review aims to map patterns of representation within the literature rather than to assess evidentiary strength or comparative methodological robustness across studies. In such fields, a scoping-review design benefits from being combined with a conceptual framework capable of clarifying causal relationships and reducing terminological ambiguity.
Despite the broad application of the Conservation Standards (CS; also known as the Open Standards for the Practice of Conservation) in conservation planning and adaptive management, no systematic review has yet used CS-derived categories to synthesise how conservation-relevant dynamics are addressed in relation to urban squares. The CS framework is a widely used framework for planning, managing and evaluating conservation projects, and organises problems and responses into explicit relationships between conservation targets, direct threats, contributing factors and conservation actions [
26,
27]. Clearly distinguishing these components can help structure socio-ecological interpretation and support more transparent discussion of how pressures, conditions and responses are represented. In this study, CS-derived categories are used as an analytical structure to synthesise the literature on urban squares, rather than to guide a specific conservation project cycle.
Alternative frameworks such as DPSIR may also be suitable in urban contexts; however, CS was selected here because its distinction between conservation targets, direct threats, contributing factors and conservation actions offered a particularly suitable vocabulary for tracing how conservation-relevant dynamics are represented across a heterogeneous body of literature [
28].
This analytical structure is well-suited for this purpose because it offers a consistent vocabulary for linking ecological objectives, proximate pressures, contextual drivers and response options across a heterogeneous body of literature.
This compatibility is particularly relevant given the increasing importance of nature-based solutions (NbSs) as methodological tools for addressing societal challenges across ecosystems in policy and practice. NbSs are commonly defined as actions to protect, sustainably manage and restore natural or modified ecosystems while addressing societal challenges and providing benefits for both human well-being and biodiversity [
29]. From this perspective, NbSs are especially relevant to the present review because they can be interpreted within the CS analytical structure as conservation-oriented actions that respond to specific direct threats, act on underlying contributing factors, and potentially improve conservation targets in multifunctional urban spaces. Their growing prominence is reflected in recent global policy frameworks, including the Kunming–Montreal Global Biodiversity Framework, which explicitly calls for the upscaling of ecosystem-based approaches to halt biodiversity loss while delivering societal benefits (CBD, 2022) [
30]. Recent guidance has also highlighted the compatibility between CS-informed planning and NbS-oriented approaches in socio-ecological contexts [
31], while broader syntheses point to the rapid expansion and mainstreaming of urban NbSs across heterogeneous settings [
32].
Existing reviews provide valuable syntheses of ecosystem services, green infrastructure and urban biodiversity [
13,
14,
16]. In parallel, recent bibliometric assessments have mapped emerging research trends in urban ecosystem services using co-occurrence network analysis [
33]. However, these efforts do not explicitly structure the literature around CS categories or focus on urban squares as distinct socio-ecological settings. As a consequence, existing syntheses provide little guidance on how to structure knowledge about urban squares within an operational, conservation-oriented analytical structure that connects ecological patterns, human pressures and management responses.
Building on this logic, we provide a CS-informed scoping synthesis of research on urban squares with the CS framework as an analytical lens to: (i) map how conservation-relevant dynamics in urban squares are represented in the peer-reviewed literature; (ii) organise the reviewed evidence according to four analytical components: conservation targets, direct threats, contributing factors and actions; and (iii) identify knowledge gaps and underrepresented dimensions that may inform future research and urban planning. Specifically, the review focuses on air quality, soil, water resources, biodiversity and cultural values, dimensions that are central to urban environmental conservation and human well-being [
4,
6,
34].
Accordingly, the review addresses four research questions:
Which conservation targets are addressed by the scientific literature on urban squares in relation to air quality, soil, water resources, biodiversity and cultural values?
Which direct threats (environmental and anthropogenic) are most frequently reported?
Which contributing factors influence these threats, and how consistently are they described?
Which conservation actions or solutions are proposed, and how often do they appear?
These four questions reflect the core analytical structure of the CS framework: conservation targets, direct threats, contributing factors and conservation actions, used to diagnose conservation problems and guide strategic planning [
26].
2. Materials and Methods
2.1. Review Design
This scoping review followed the methodological guidance proposed by Arksey and O’Malley, Levac et al. and Peters et al., and reporting was informed by the PRISMA-ScR checklist [
22,
23,
24,
25], which is designed to enhance transparency, completeness and reproducibility in scoping review reporting.
2.2. Identification of Literature
The literature search was conducted in two major scientific databases, Scopus and Web of Science (WoS), and was completed in October 2024. The search was restricted to the abstract field and combined three main blocks of terms: (i) threats and pressures (e.g., “threat”, “danger”, “pressure”), (ii) urban squares (e.g., “urban square”, “city plaza”, “civic square”) and (iii) key environmental and socio-cultural dimensions (air quality, soil, water, biodiversity and cultural–historical values). This choice was intended to keep retrieval focused and manageable within a highly heterogeneous interdisciplinary literature, while privileging records in which the review topics were sufficiently visible at the search stage.
The full search strings, including Boolean structure, keywords and applied filters, are reported in
Supplementary Material S1.
The chosen topics aimed to focus the bibliographic research on aspects of urban squares that are particularly relevant to both social and environmental well-being, namely:
Air quality, which directly affects the recreational and social functions of public spaces [
17];
Soil quality, as healthy soils favour rainwater infiltration, reduce the risk of flooding, and contribute to regulating the urban hydrological cycle [
35];
Biodiversity, which increases aesthetic quality, educational value and psychological well-being, and can transform squares into micro-habitats that contribute to urban ecological connectivity [
36];
Historical, cultural and identity values, since squares can contain tangible and intangible heritage that contributes to urban collective memory [
37].
The time span was set to 2014–2024 to capture contemporary developments in the literature and align with recent policy debates on urban adaptation and nature-based solutions [
13,
14]. Only English-language publications were considered, in order to ensure contemporary and internationally accessible literature. All records retrieved from Scopus and WoS were exported in CSV format and managed in separate spreadsheets during the screening phases. Because screening was conducted in parallel for each database, duplicates were removed only after the final screening stage (see
Section 3.3).
2.3. Eligibility Criteria and Screening
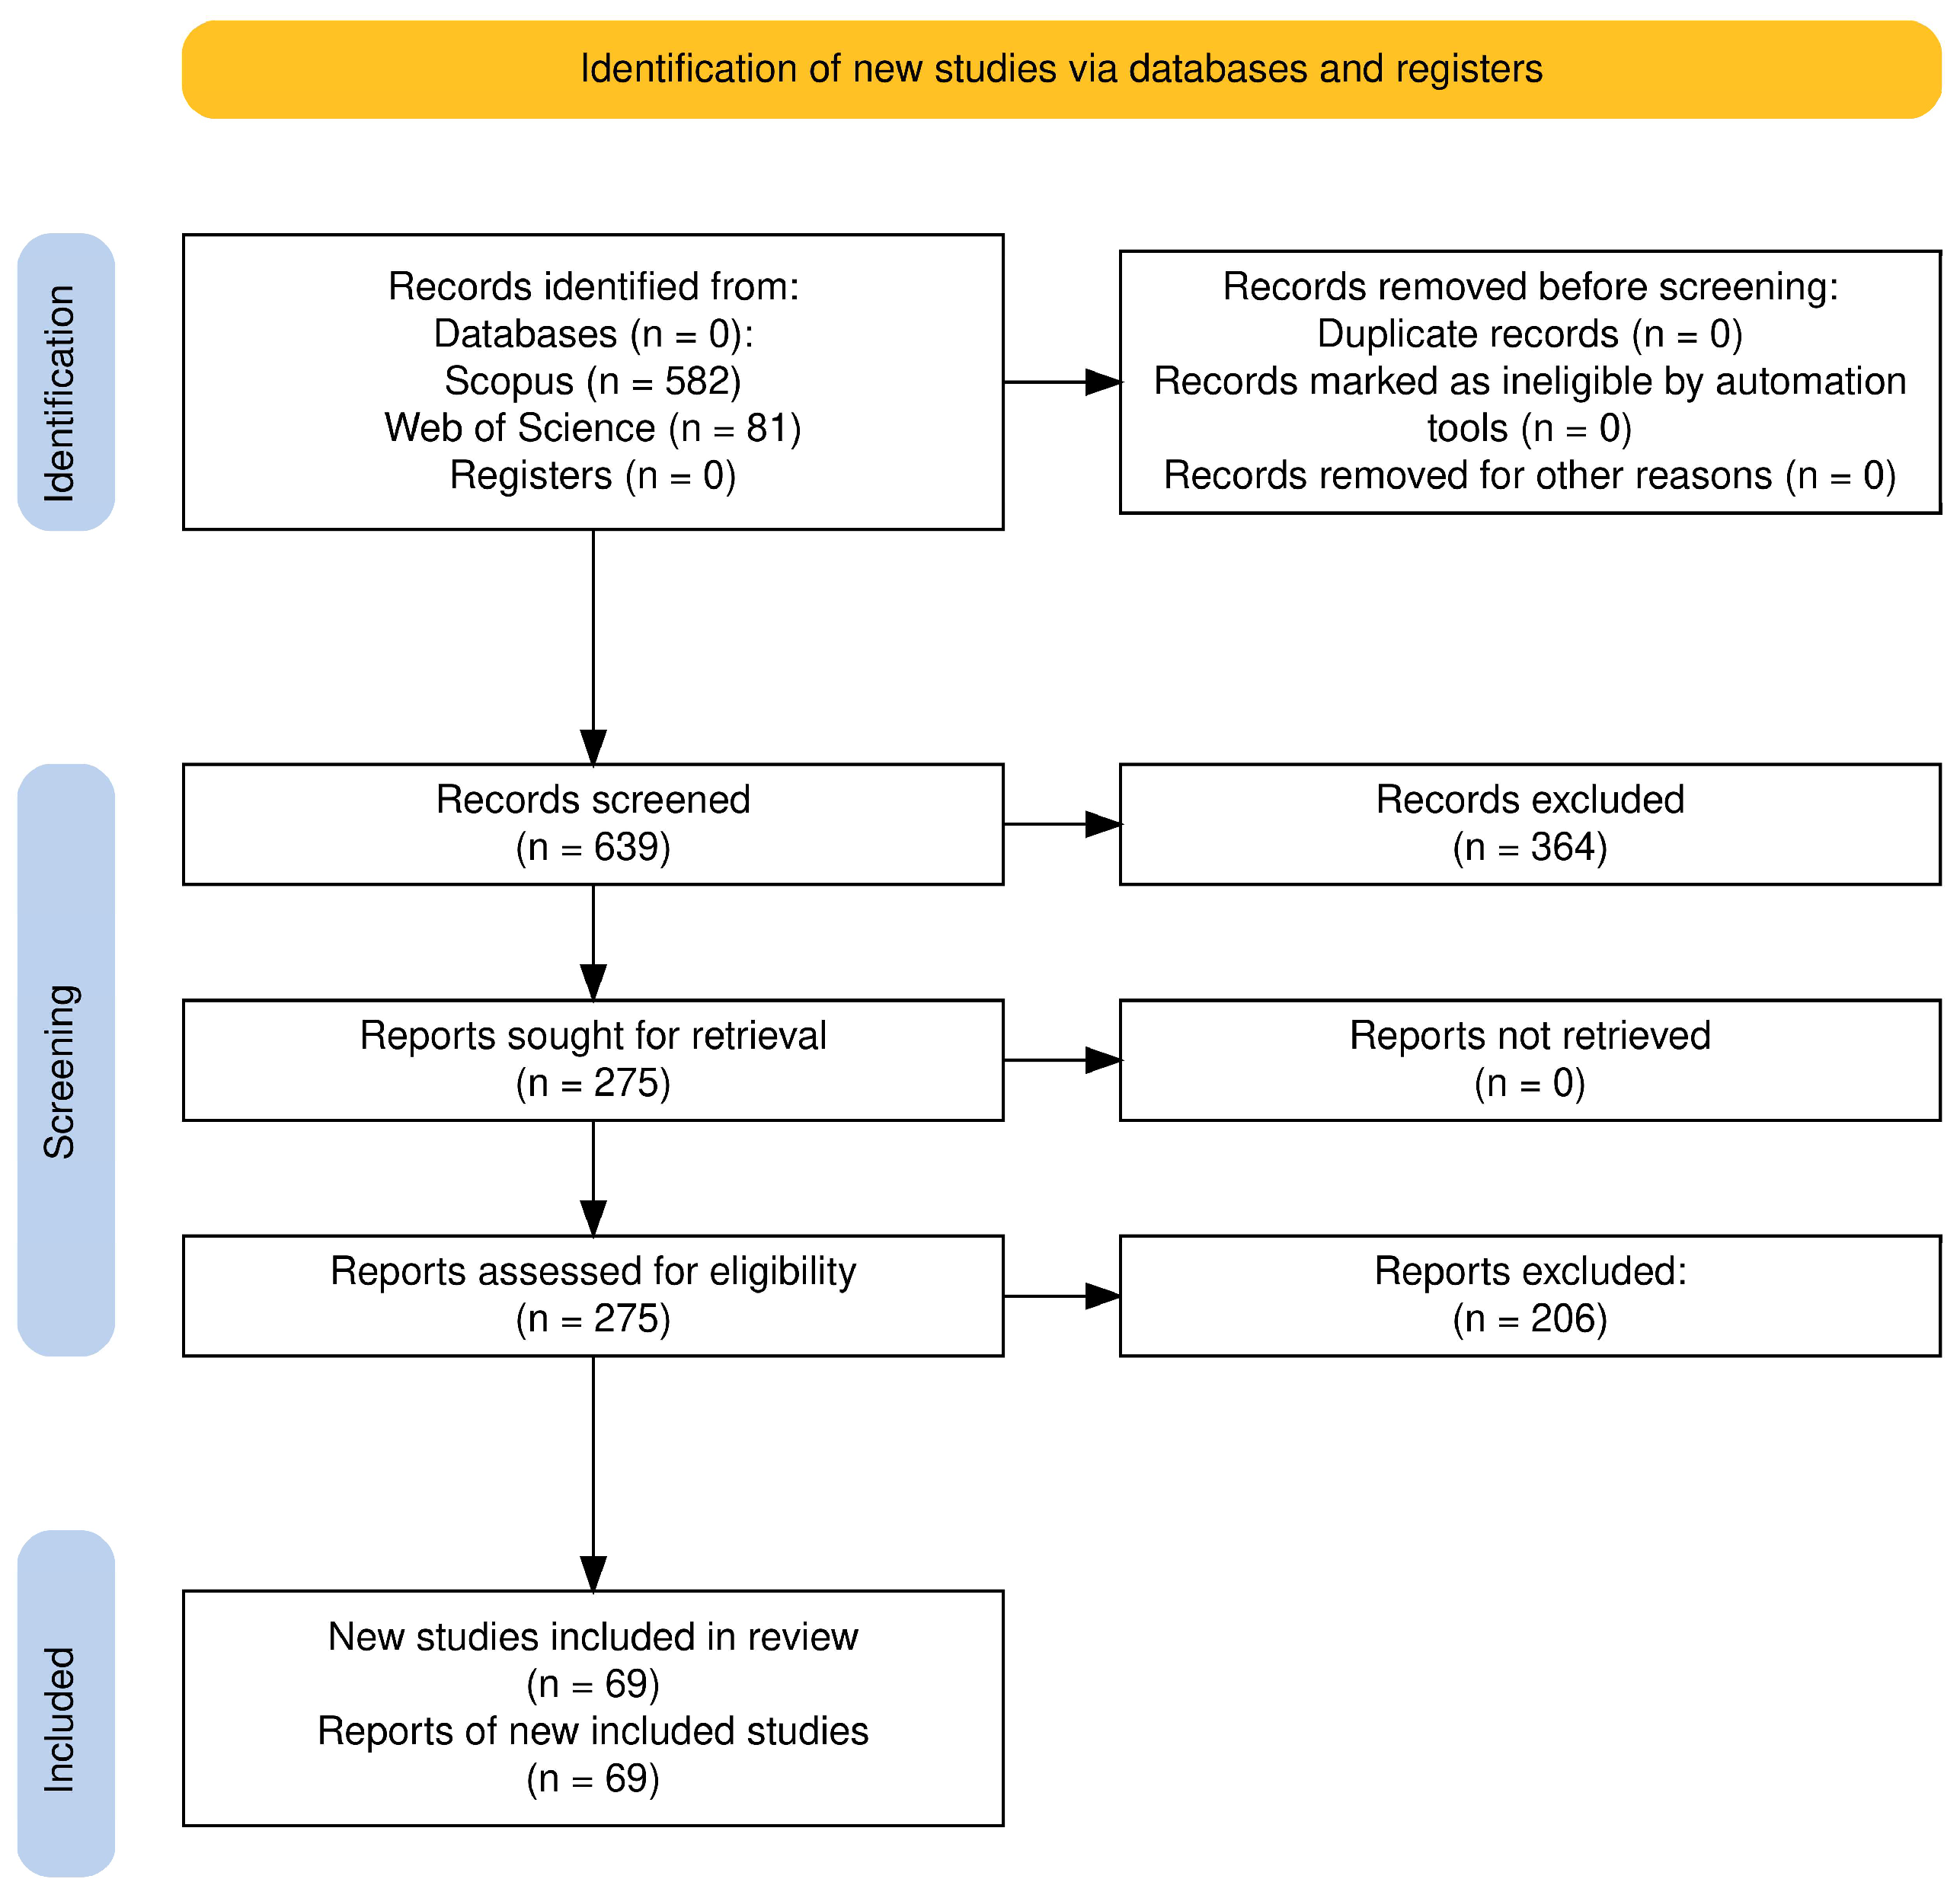
The identification step returned 582 records from Scopus and 81 from Web of Science (WoS). Because the two databases differ in structure and indexing, screening was conducted in parallel for each database following the same sequential criteria.
The first screening level applied two basic filters: (i) English-language publications and (ii) publication year between 2014 and 2024. This step ensured a focus on contemporary and internationally accessible research. After this filter, the Scopus sample was reduced to 363 records and the WoS sample to 68 records.
The second screening level retained only peer-reviewed scientific articles, excluding reviews, books, conference papers and grey literature. This step yielded 275 eligible records in Scopus and 66 in WoS.
The third screening level assessed whether the abstract or conclusion of each article addressed at least one of the four research questions of the review (conservation targets, direct threats, contributing factors, or conservation actions). This eligibility assessment was carried out by the first reviewer. Ninety-three records met this criterion: 69 from Scopus and 24 from Web of Science.
After the final screening stage, the two datasets were compared to assess overlap between databases. All 24 articles retained from Web of Science were also present in the Scopus dataset. Therefore, no additional unique records were contributed by Web of Science after screening.
To facilitate the analyses and ensure consistency in metadata structure, the Scopus dataset was used as the reference dataset for subsequent analyses. The final sample thus consisted of 69 unique articles retrieved from Scopus.
An additional post hoc sensitivity check based on expanded search fields in Scopus and Web of Science yielded a larger number of retrieved records, but had only limited consequences at the eligibility stage and did not lead to additional included studies. A summary of this complementary check is provided in
Supplementary Material S4. The final analytical corpus, therefore, remained unchanged.
To ensure compliance with PRISMA-ScR reporting standards, the identification, screening and inclusion process across databases was summarised using a PRISMA 2020 flow diagram shown in
Figure 1, generated using the PRISMA2020 Shiny application [
38]. A more detailed schematic representation illustrating the parallel screening process applied to Scopus and Web of Science is provided in
Supplementary Material S1.
2.4. Descriptive Bibliometric Analysis and Data Extraction
A descriptive bibliometric analysis was conducted to characterise the broader literature context from which the final sample was drawn and to assess how the screening process reshaped the evidence base. Bibliometric indicators were computed for both the initial Scopus dataset (n = 275) and the final screened sample (n = 69), allowing a comparative assessment of temporal, geographical and thematic patterns.
Bibliographic metadata (titles, abstracts, authors, sources, publication years and keywords) were exported from Scopus in CSV format and analysed using a combination of tools. All descriptive and comparative analyses were conducted using RStudio (v2025.09.2), an integrated development environment for the R statistical language (v4.4.3) [
39].
RStudio was used to perform all other descriptive and comparative analyses and to produce publication-quality graphical outputs. Specifically, RStudio was used to examine the following:
Annual scientific production patterns;
Co-authorship and scientific collaboration networks;
Distribution of the most relevant sources and journals;
Comparative keyword- and abstract-based analyses, including keyness analysis;
Additional descriptive visualisations supporting the interpretation of the screened corpus.
For the co-authorship and scientific collaboration networks, links were derived from author affiliation countries in the initial Scopus dataset and visualised as a chord diagram generated in R. The network represents co-authorship ties between countries based on shared country affiliations across publications. For readability in the main text, only the 15 countries with the highest total collaboration strength were displayed, while country labels were abbreviated where necessary. This type of visualisation was adopted in line with recent bibliometric applications emphasising international co-authorship links over purely count-based geographical representations [
40].
Bibliometric analyses were performed using the Bibliometrix R package (v5.2.1) through its Biblioshiny interface [
41]. In detail, Biblioshiny was used to generate keyword co-occurrence networks exploring the conceptual structure of the initial (
n = 275) and screened (
n = 69). In these networks, nodes represent terms, edges represent the strength of co-occurrence between terms within documents, and community colours indicate clusters of terms detected through a modularity-based clustering algorithm (Louvain). Co-occurrence networks were generated using Jaccard normalisation to account for differences in term occurrence across documents. The resulting maps were interpreted descriptively to characterise broad thematic convergence and to compare how screening reshaped the conceptual profile of the evidence base; they were not used as inclusion/exclusion criteria.
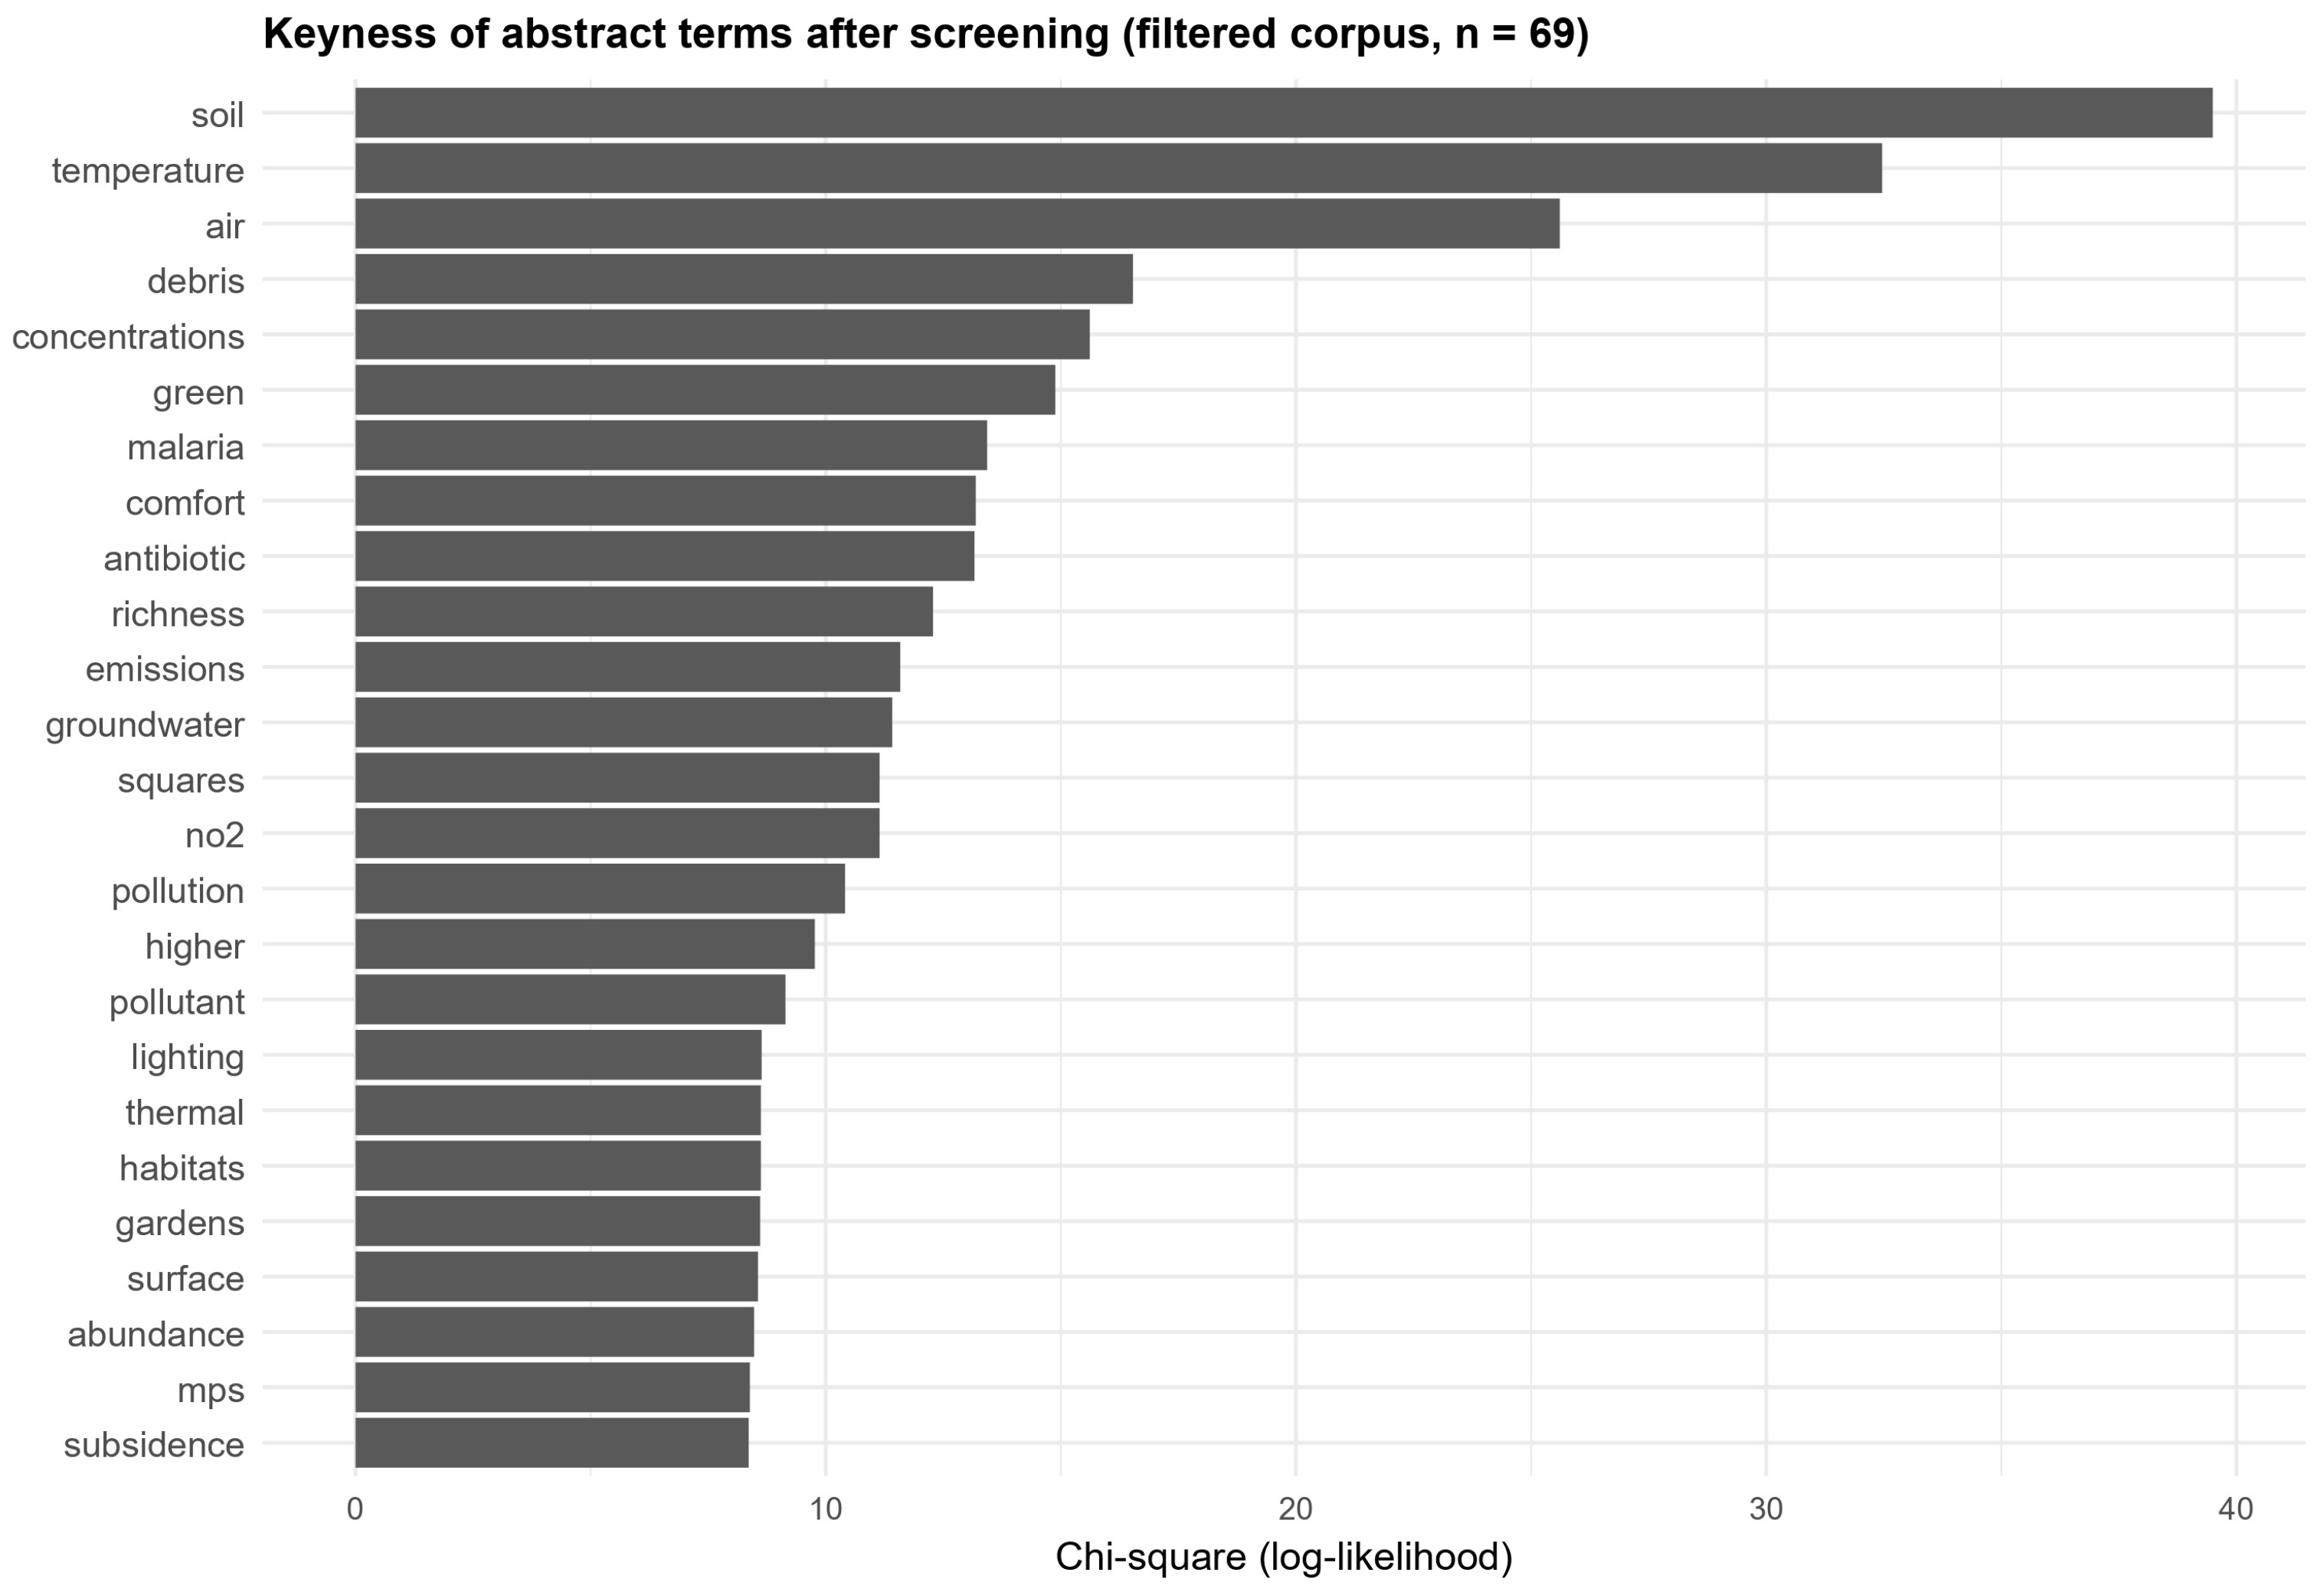
Keyness analysis was applied to compare the abstracts of the initial and filtered corpora, identifying terms that are statistically distinctive of the screened dataset relative to the original corpus using a log-likelihood (chi-square) metric. Rather than describing term frequencies within a single corpus, this approach allows the assessment of conceptual shifts induced by the screening process, highlighting changes in thematic emphasis across the evidence base.
The use of custom R scripts allowed improved graphical quality, reproducibility and consistency across figures compared to default Biblioshiny outputs. In parallel, the full texts of the 69 selected articles were analysed using the CS-derived analytical structure.
2.5. Categorisation for Frequency Analysis
The analysis of the selected literature was structured according to the CS framework, which delivers a widely adopted and standardised structure for analysing conservation-relevant dynamics in complex socio-ecological systems [
26].
Four analytical components were used:
Conservation targets, defined as specific components of biodiversity or socio-ecological systems that represent the ultimate objectives of conservation efforts and whose condition is of primary concern [
26];
Direct threats, defined as human activities or processes that directly and immediately degrade one or more conservation targets, as well as natural phenomena whose frequency or intensity has been altered by human activities. The classification of direct threats followed the CMP–IUCN threat classification system, as described by Salafsky [
26];
Contributing factors, used here as an operational subset of the broader CS concept of “factors”, encompassing indirect drivers, enabling conditions and contextual processes that influence the emergence, intensity, or persistence of direct threats [
27];
Conservation actions, defined as actions proposed or implemented to reduce direct threats, improve the condition of conservation targets, or exploit favourable opportunities [
26].
Because the terminology used across the reviewed studies did not consistently align with the CS framework, an iterative reduction and harmonisation process was applied to conservation targets, contributing factors and conservation actions, in order to enable systematic comparison across heterogeneous sources. Terms referring to similar ecological processes, pressures, or management responses were grouped into macro-categories based on their shared ecological function or management relevance within urban socio-ecological systems. For example, different indicators of surface sealing were grouped under impervious surface coverage, while descriptions of fuel types and energy systems were grouped under energy production and fuels. This process continued until no further conceptually justified aggregations could be identified. To ensure transparency, the full list of original terms, their assignment to macro-categories and illustrative examples are reported in the
Supplementary Material S2.
For direct threats, the CMP–IUCN classification was applied up to Level 2. Minor adaptations were introduced to reflect recurrent patterns in the reviewed literature and to preserve conceptual clarity. These included the aggregation of closely related Level-2 subcategories and the explicit separation of urban heat island from the broader climate change category. All adaptations are fully documented in the
Supplementary Material S2. The consequential categorisation was used to generate frequency distributions for conservation targets, direct threats, contributing factors and conservation actions, which are presented in
Section 3.
2.6. Construction of the Cross-Case Conceptual Synthesis
Within the CS framework, a situation model is defined as a structured representation of the key relationships among conservation targets, direct threats, contributing factors and stakeholders within a specific project context, based on local knowledge, stakeholder input and empirical data [
26]. Because this study is based on a scoping review of heterogeneous literature rather than on a single place-based conservation initiative, the development of a full CS situation model was not methodologically feasible.
Nevertheless, the relationships among contributing factors, direct threats and conservation targets identified in the reviewed studies proved too complex to be captured solely through frequency histograms. To obtain a more systemic and integrative view of these interconnections, a cross-case conceptual synthesis was therefore developed. This diagram does not represent a site-specific CS situation model, but rather a cross-case conceptual synthesis of the most recurrent causal linkages reported in the literature.
For this purpose, direct threats were reclassified according to Level 1 of the IUCN–CMP threat hierarchy, retaining broad macro-categories while incorporating within them the Level-2 subcategories used in the frequency analysis. The only exception was urban heat island (UHI), which was preserved as a separate class given its relatively high frequency (10 occurrences) and its conceptual relevance in urban socio-ecological systems. Contributing factors were aggregated into broader macro-categories to reduce redundancy and enhance readability. To ensure transparency, the full list of original terms and their assignment to these macro-categories is reported in the
Supplementary Material S2.
During this phase, partial overlap developed between the terminology used to describe direct and indirect pressures. Categories such as pollution or climate change were found to function either as immediate pressures or as amplifying systemic drivers, depending on the analytical framing adopted by individual studies. To harmonise the classification and avoid double-counting, a frequency-based operational criterion was applied: categories predominantly described as background or systemic drivers in the literature were represented as contributing factors clusters, whereas those recurrently framed as immediate pressures on conservation targets were retained as direct threats. Accordingly, residential, commercial and recreation areas, human intrusions and disturbances and climate change were treated as contributing factor clusters, while pollution and natural system management and modifications were retained exclusively as direct threats.
The refined classification was used to construct a cross-case conceptual synthesis using Miradi online platform (Foundations of Success, Inc., Bethesda, MD, USA), a tool aligned with the CS framework and designed to support the structured representation of causal relationships in conservation planning. It was used here as a structuring and visualisation tool aligned with CS terminology, in order to display recurrent literature-reported relationships in a consistent format. The resulting diagram should not be interpreted as a site-specific CS situation model, but as a cross-case conceptual synthesis of recurrent relationships reported in the reviewed literature. Its purpose is to translate frequency-based histograms into a systemic representation of how drivers, threats and Conservation Targets interact in urban socio-ecological systems that include, but are not limited to, urban squares.
2.7. Triad-Based Clustering of Recurrent Causal Configurations
To complement the frequency-based synthesis and support a more explicit examination of recurrent causal configurations, an additional triad-based clustering procedure was conducted on complete Contributing Factor-Direct Threat-Conservation Target (CF-DT-CT) linkages extracted from the screened studies. For this purpose, a dedicated
Supplementary Material S3 was compiled, in which each row represented one complete triad reported in the reviewed literature. Only complete triads were retained, as the aim was not to cluster articles based on isolated pairwise associations, but to explore how full causal configurations recur across the evidence base. The full triad table, together with the retained clustering outputs, is provided in
Supplementary Material S3.
After harmonisation of terms according to the coding framework described above, identical triads were collapsed and counted by the number of distinct articles in which they occurred. To reduce noise and avoid overinterpreting very infrequent configurations, only recurrent triads reported in at least two distinct articles were retained for clustering. Each retained triad was then represented as a binary vector based on its three components (CF, DT and CT), and pairwise dissimilarity among triads was calculated using Jaccard distance on binary data, as this measure is well-suited to comparing presence/absence configurations based on shared components. Hierarchical clustering was performed using the average-linkage method, which was retained because, in this exploratory setting, it provided an interpretable compromise between excessively compact and excessively fragmented groupings. The resulting dendrogram was interpreted as an exploratory visual support for identifying recurrent groupings of complete CF-DT-CT configurations, in line with the general logic of dendrogram-based pattern grouping adopted in previous ecological studies such as Canedoli et al. [
42]. The clustering analysis and dendrogram visualisation were conducted in R within the RStudio environment.
Because the aim of this step was exploratory rather than classificatory, the dendrogram was not used to derive an objectively optimal number of clusters. Instead, three plausible partitions (k = 4, 5, and 6) were compared in terms of thematic interpretability, preservation of meaningful separation, and avoidance of excessive fragmentation. The five-cluster solution was retained because it preserved a small Biodiversity-related grouping that was absorbed in the four-cluster solution, while avoiding the additional single-triad cluster produced by the six-cluster solution. The detailed composition of the retained k = 5 solution is also reported in
Supplementary Material S3. The resulting dendrogram was therefore used as an exploratory aid to interpret broader recurrent causal groupings within the reviewed literature, rather than as a definitive typology or as evidence of causal strength.
3. Results
The results are based on the final sample of 69 peer-reviewed articles. As described in
Section 2.3, screening was conducted in parallel for Scopus and Web of Science (WoS). Duplicate records were removed when datasets were consolidated for PRISMA reporting, prior to calculating the final screening counts. After the eligibility assessment, all WoS records retained at the full-text stage overlapped with those identified in Scopus. Therefore, Scopus was used as the reference dataset for subsequent bibliometric outputs and for full-text coding under the CS analytical lens.
This section is organised into two parts. First, a bibliometric overview contextualises the final sample within the broader body of records retrieved during identification. Second, the coded literature is synthesised according to the four CS components (conservation targets, direct threats, contributing factors and conservation actions).
3.1. Bibliometric Overview
This section presents a bibliometric overview of the literature identified through the scoping review, with the aim of contextualising the final sample of 69 articles within the broader evidence base. The comparison between the initial pool of records and the screened sample highlights how the selection process shaped the temporal, geographical, and thematic profile of the reviewed literature. These descriptive findings provide contextual background for the subsequent analysis using the CS framework, without constituting a comprehensive bibliometric mapping of the field.
3.1.1. Scientific Production by Annual Pattern
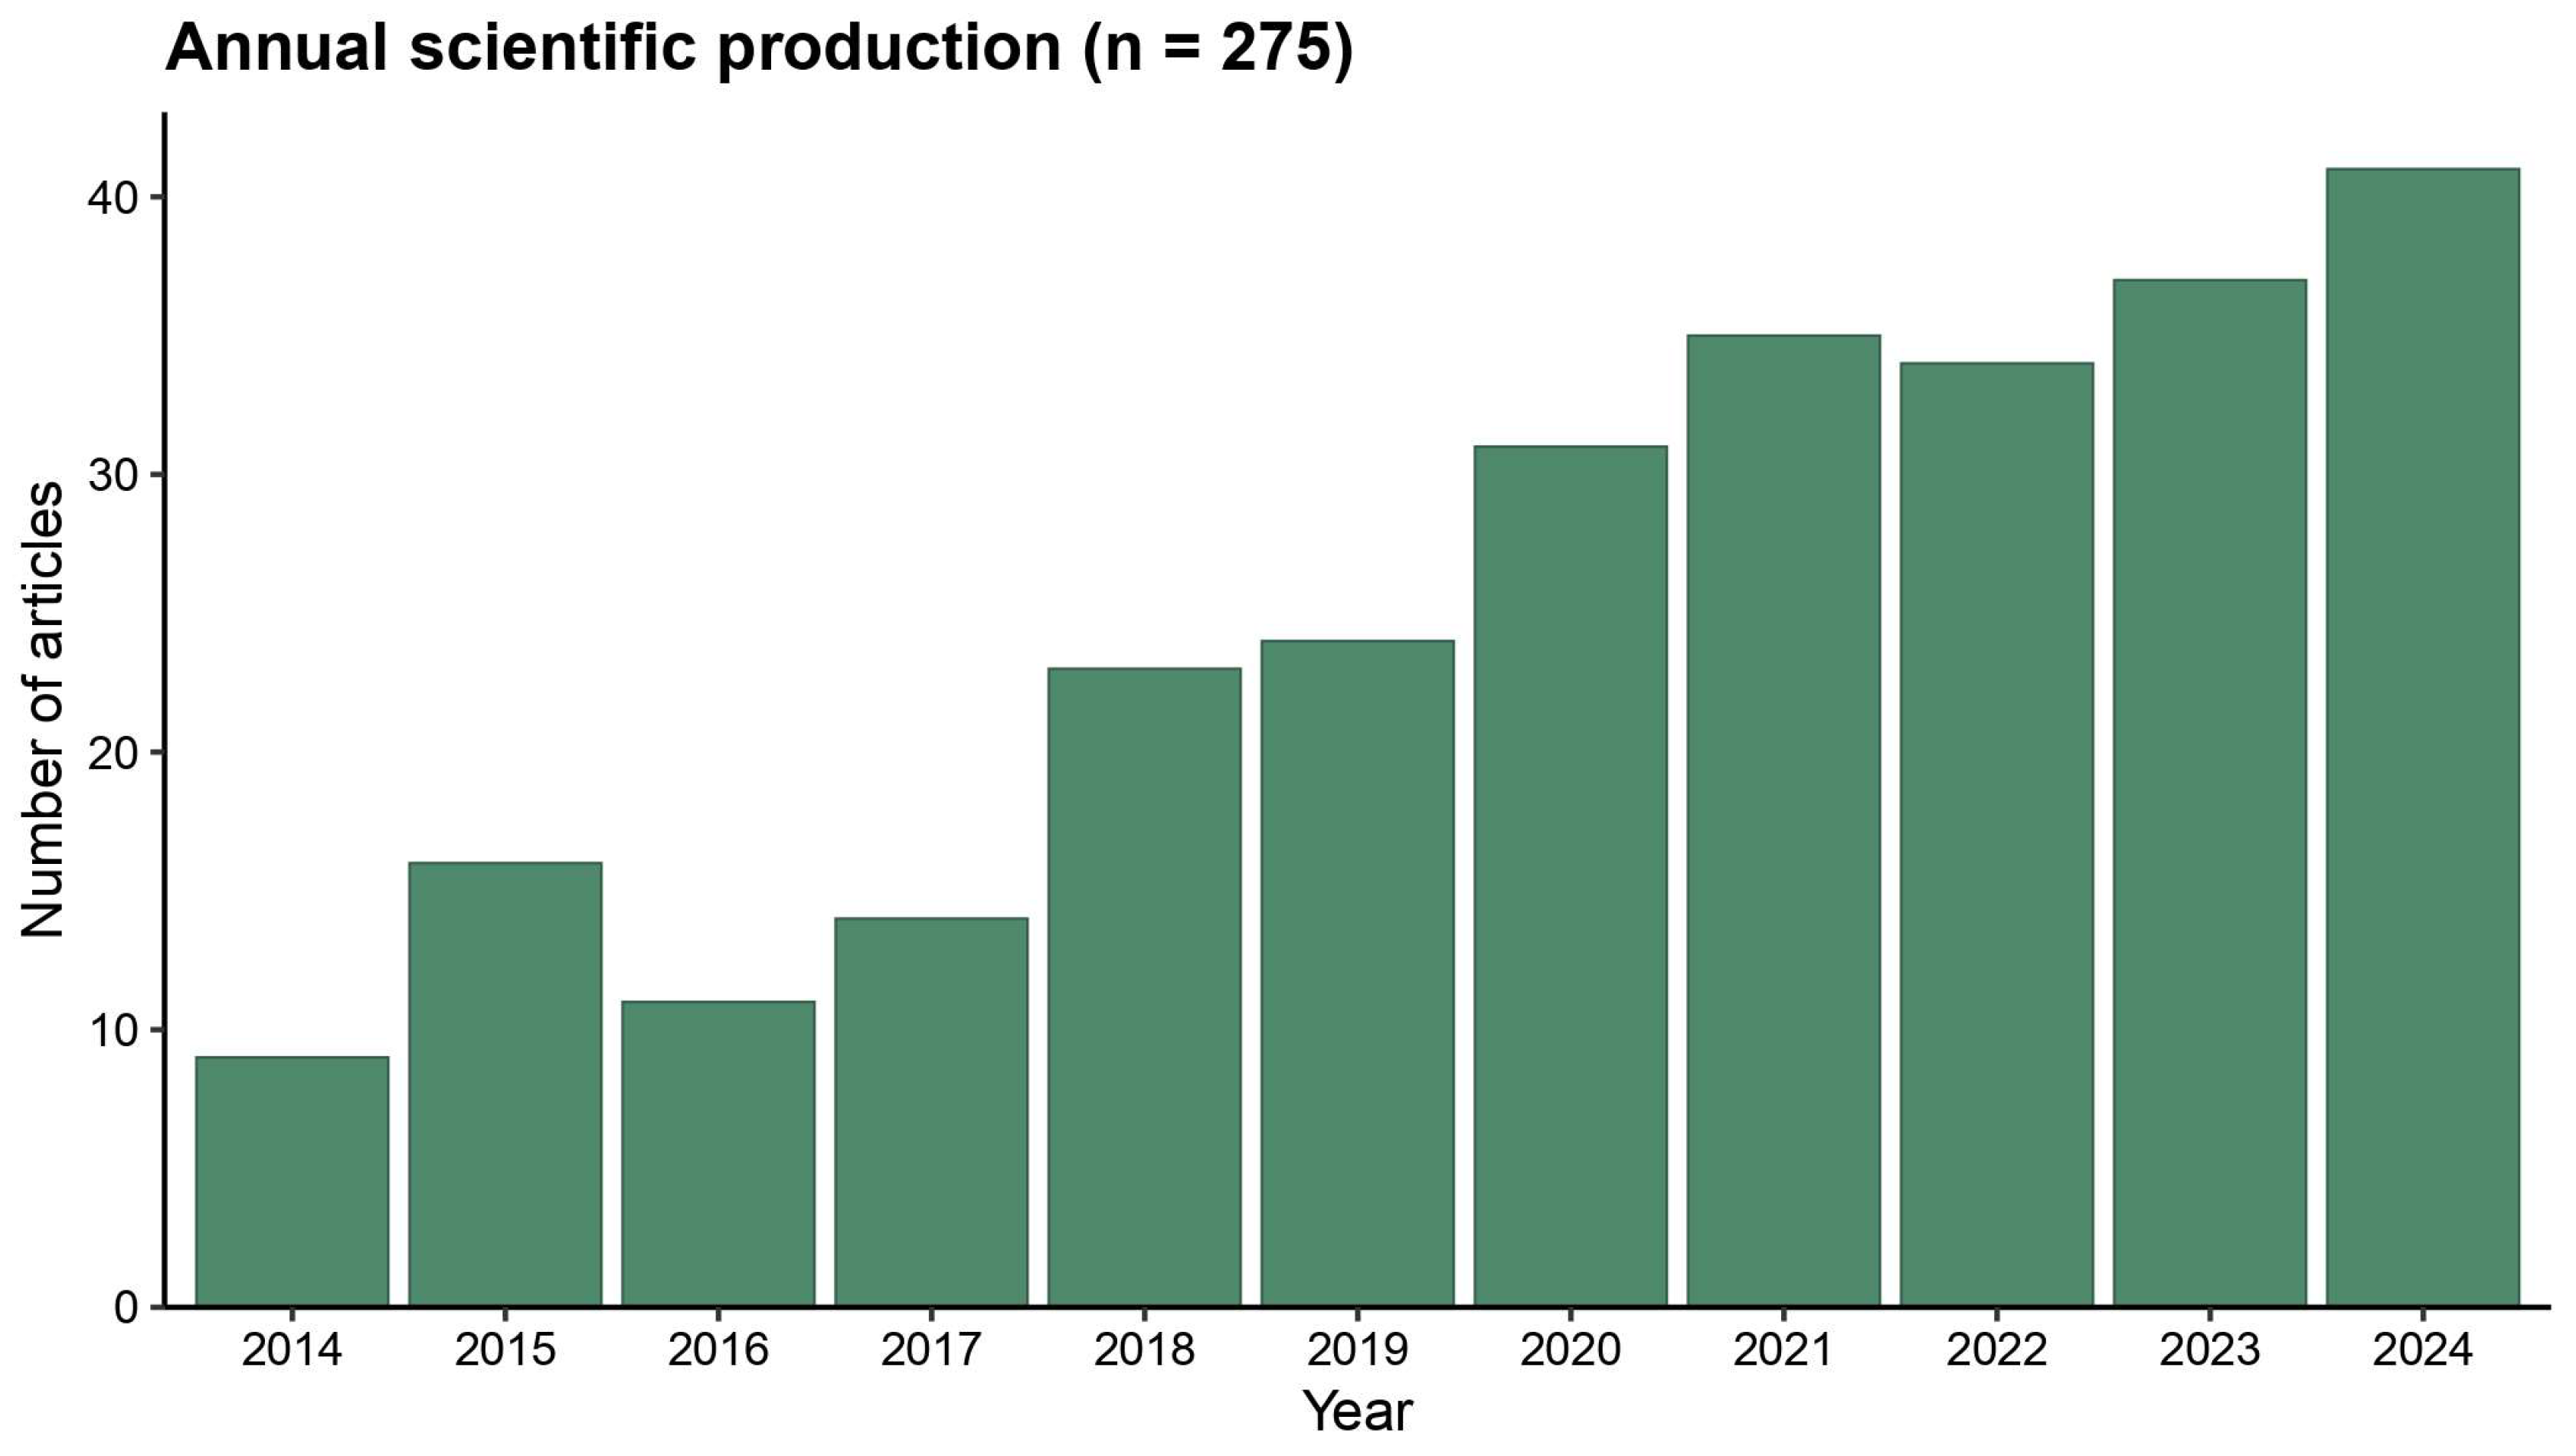
The annual distribution of publications suggests a progressive strengthening of scholarly attention to environmental pressures and related outcomes in urban contexts over the study period. In the initial dataset (
n = 275), the temporal pattern can be interpreted as comprising an early phase (2014–2017) of comparatively limited and fluctuating output, followed by a phase of consolidation (2018–2020), and a more recent phase (2021–2024) of marked expansion (
Figure 2).
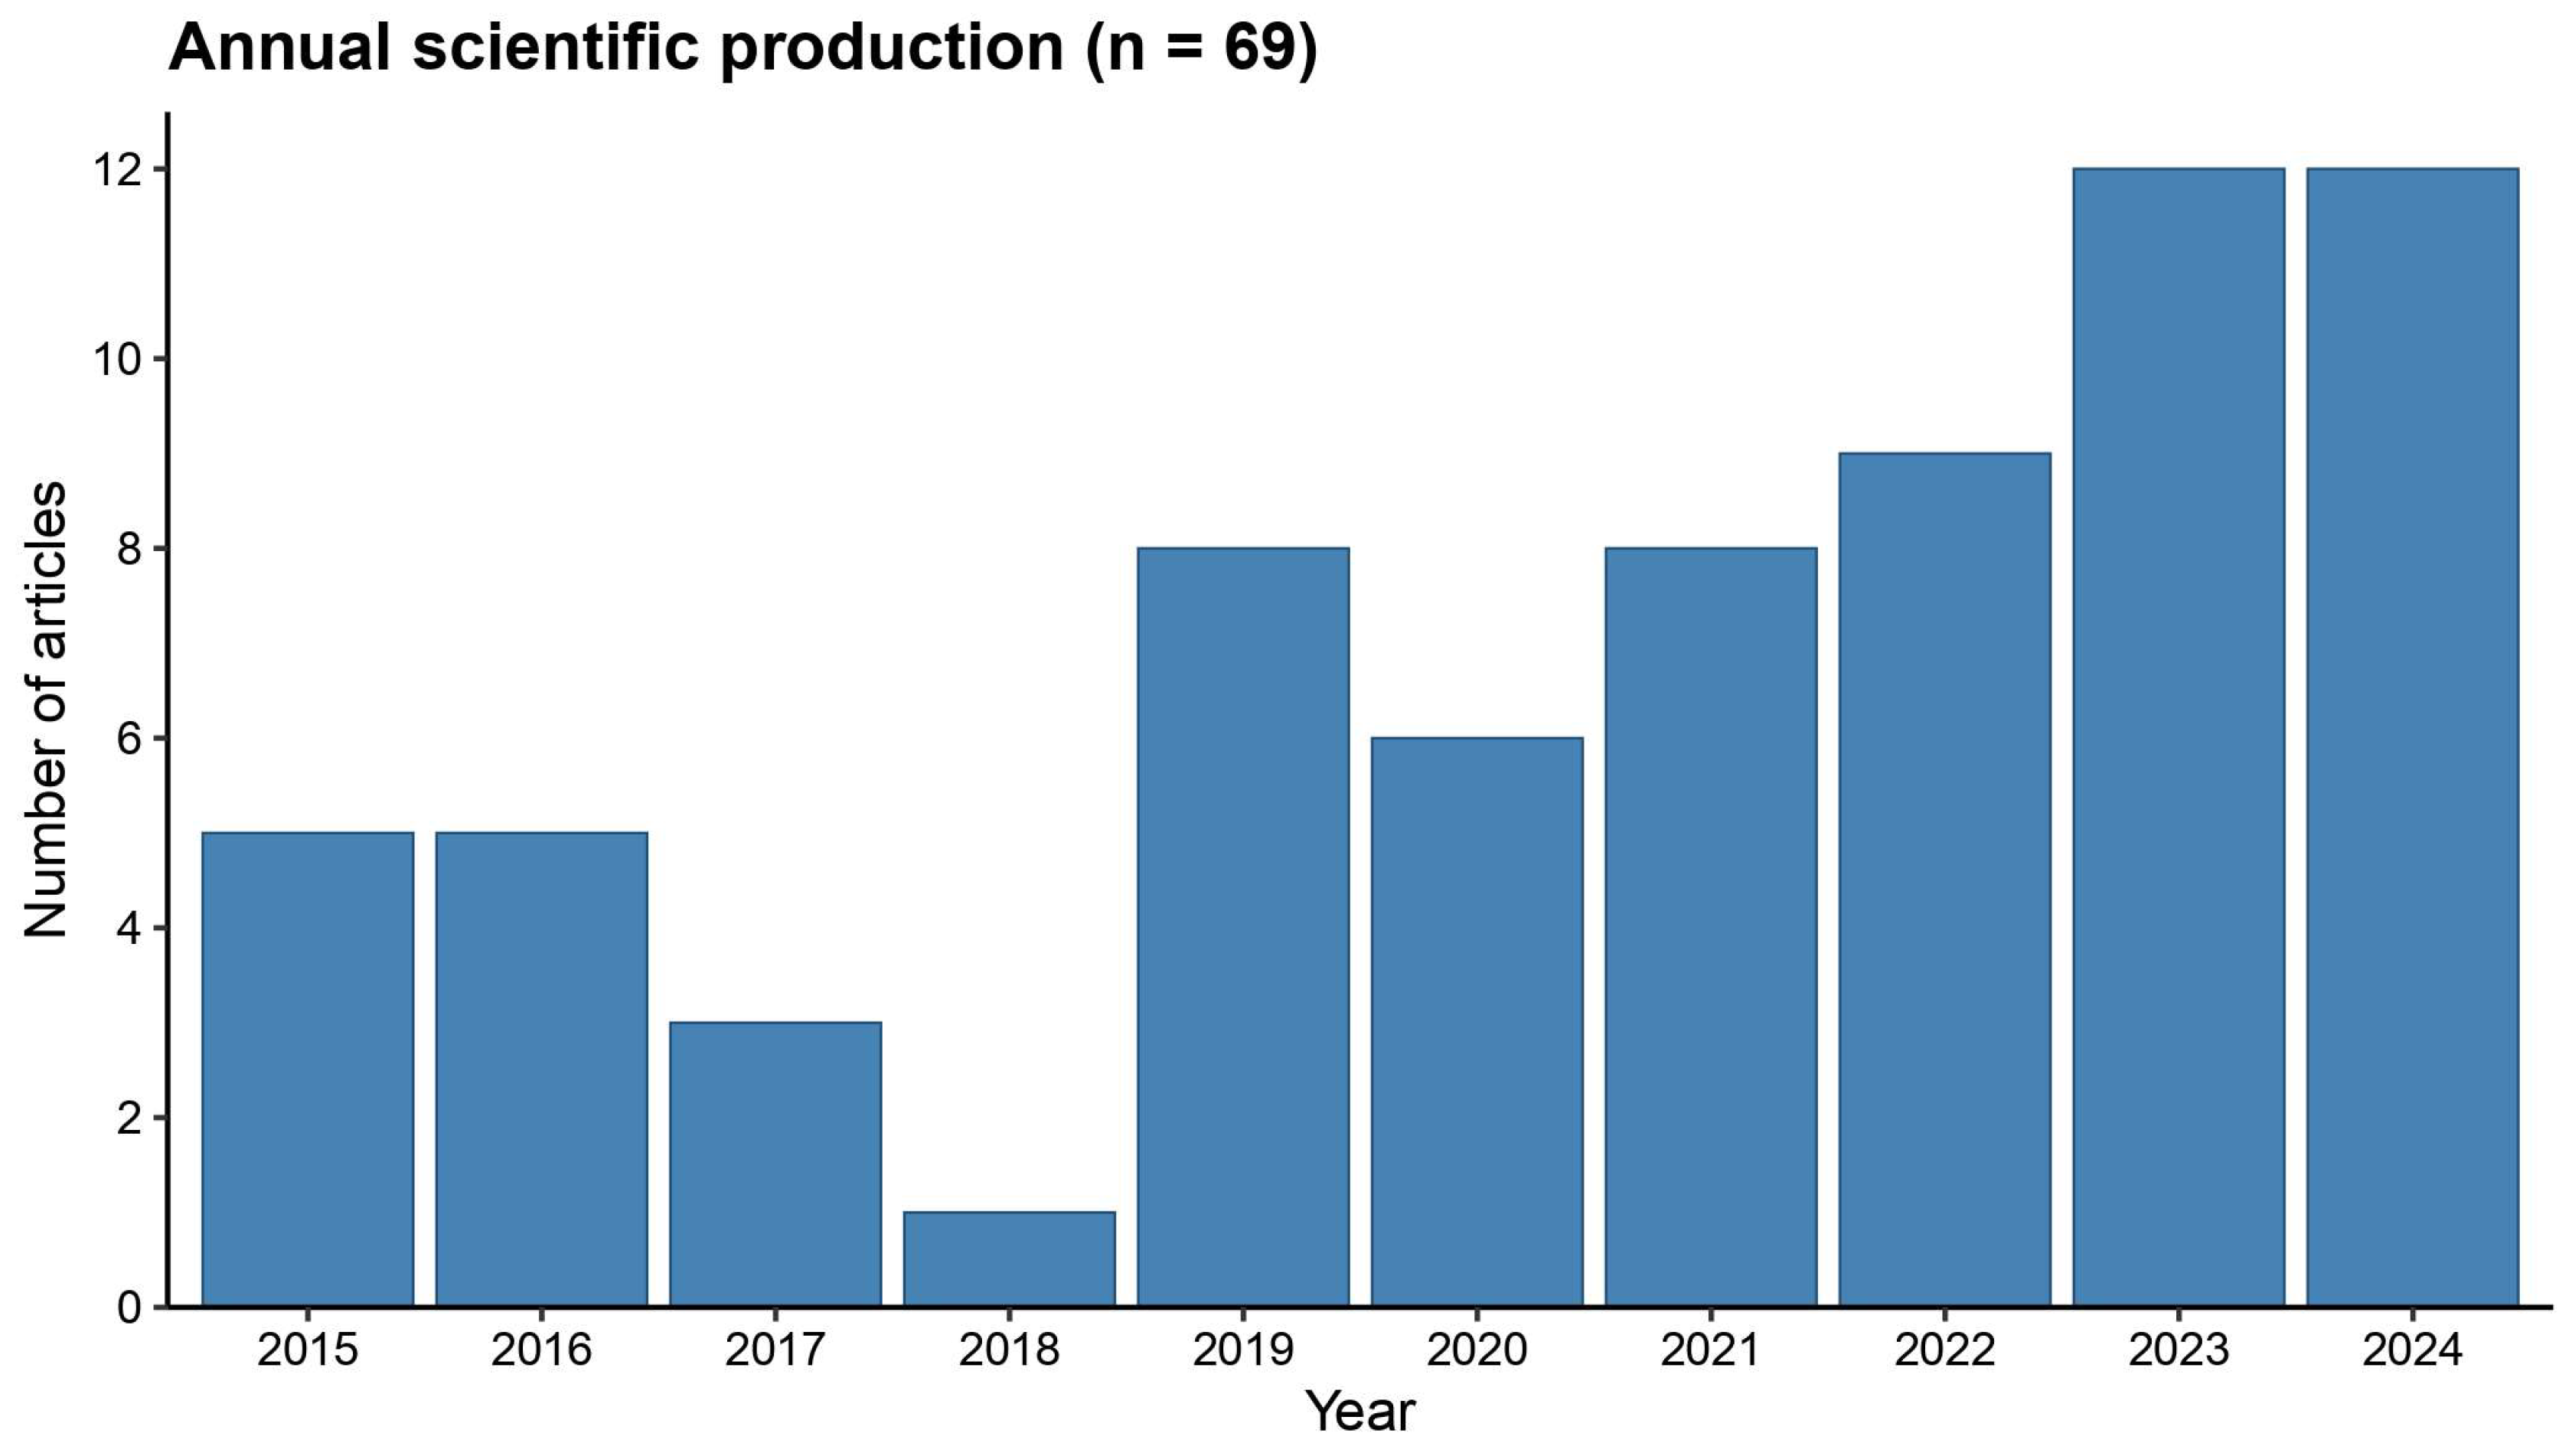
By contrast, the screened sample (
n = 69) shows a less regular temporal profile (
Figure 3). Here, an early phase (2015–2018) of limited and uneven output is followed by a phase of recovery and gradual increase (2019–2021), and then by a more recent phase (2022–2024) in which the number of relevant studies becomes more consistently elevated. Taken together, these patterns suggest that the screening process did not simply reduce the number of records, but also reshaped the temporal structure of the evidence base in relation to the specific focus of the review.
3.1.2. International Collaboration Pattern
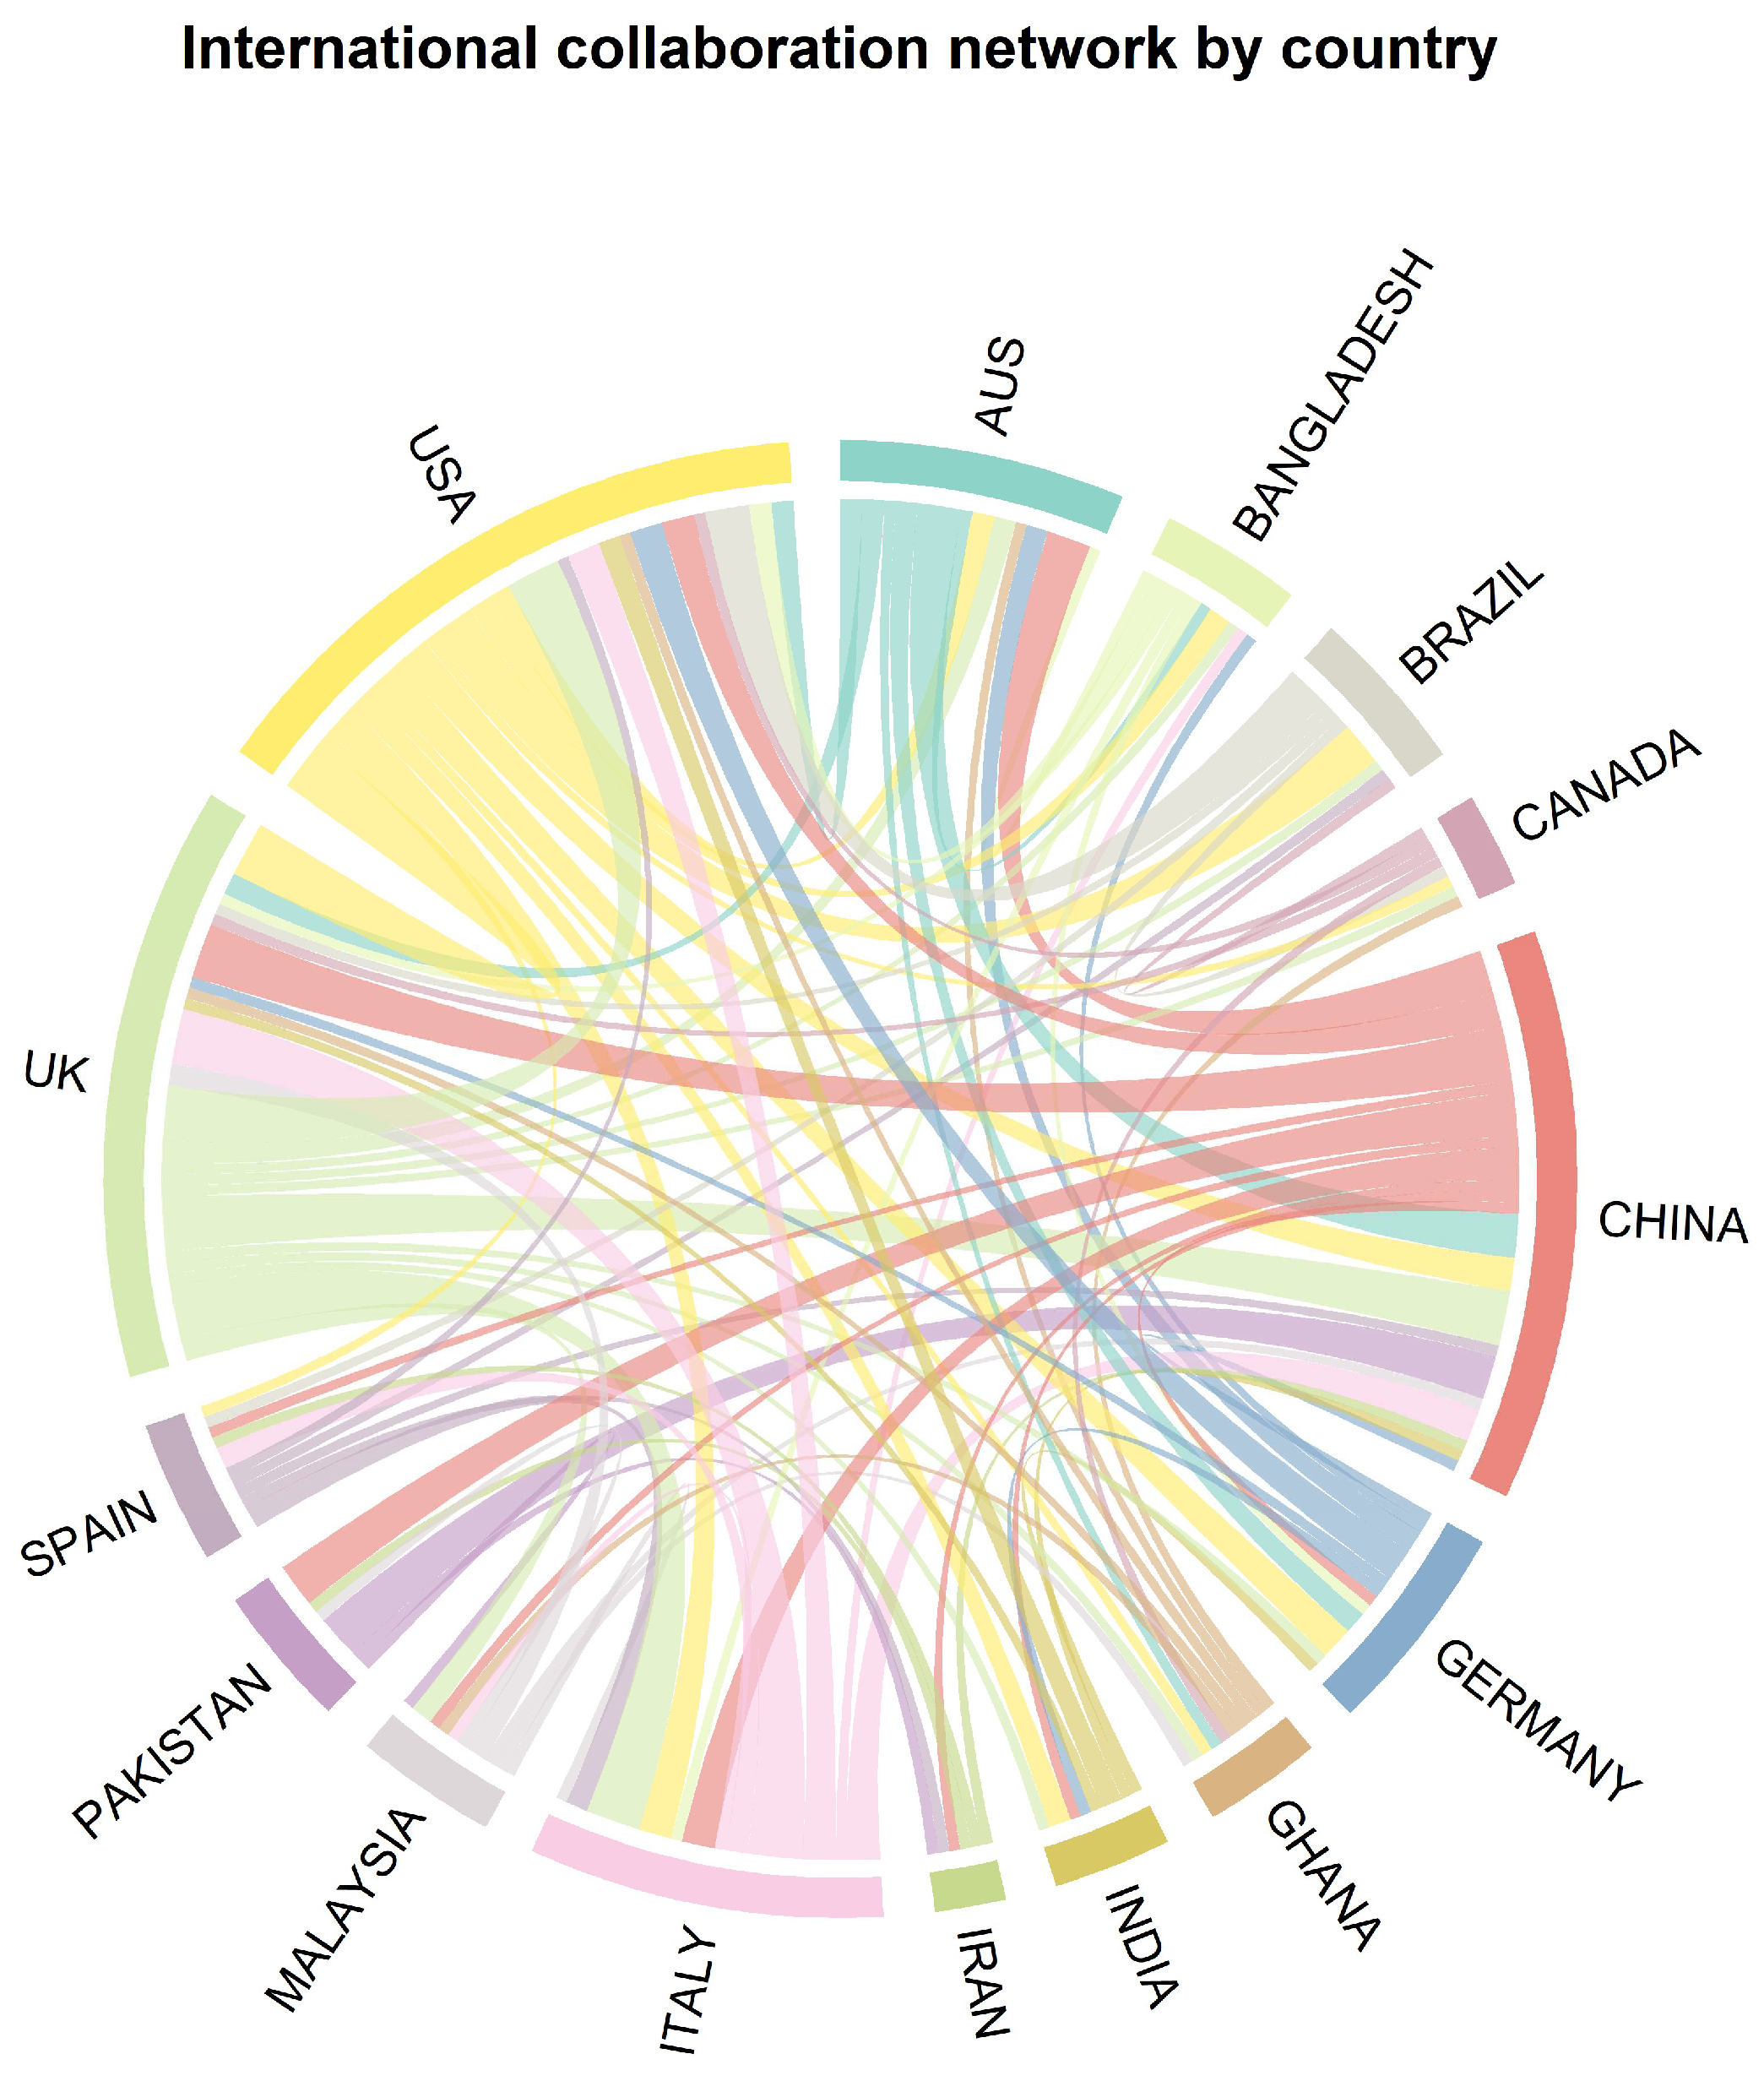
The international collaboration network highlights a geographically uneven but clearly interconnected literature structure in the initial Scopus dataset (
n = 275) (
Figure 4). China, the United States and the United Kingdom emerge as the most prominent nodes, indicating a central role in cross-country co-authorship. Other countries, including Germany, Italy, Australia, Bangladesh, Brazil and Canada, also contribute to the network, although with lower overall collaboration strength. Rather than simply reflecting publication volume, this representation helps to show how the literature is relationally organised across countries, with a limited number of hubs accounting for a large share of the visible international linkages. For readability,
Figure 4 displays only the 15 countries with the highest total collaboration strength.
3.1.3. Source Distribution
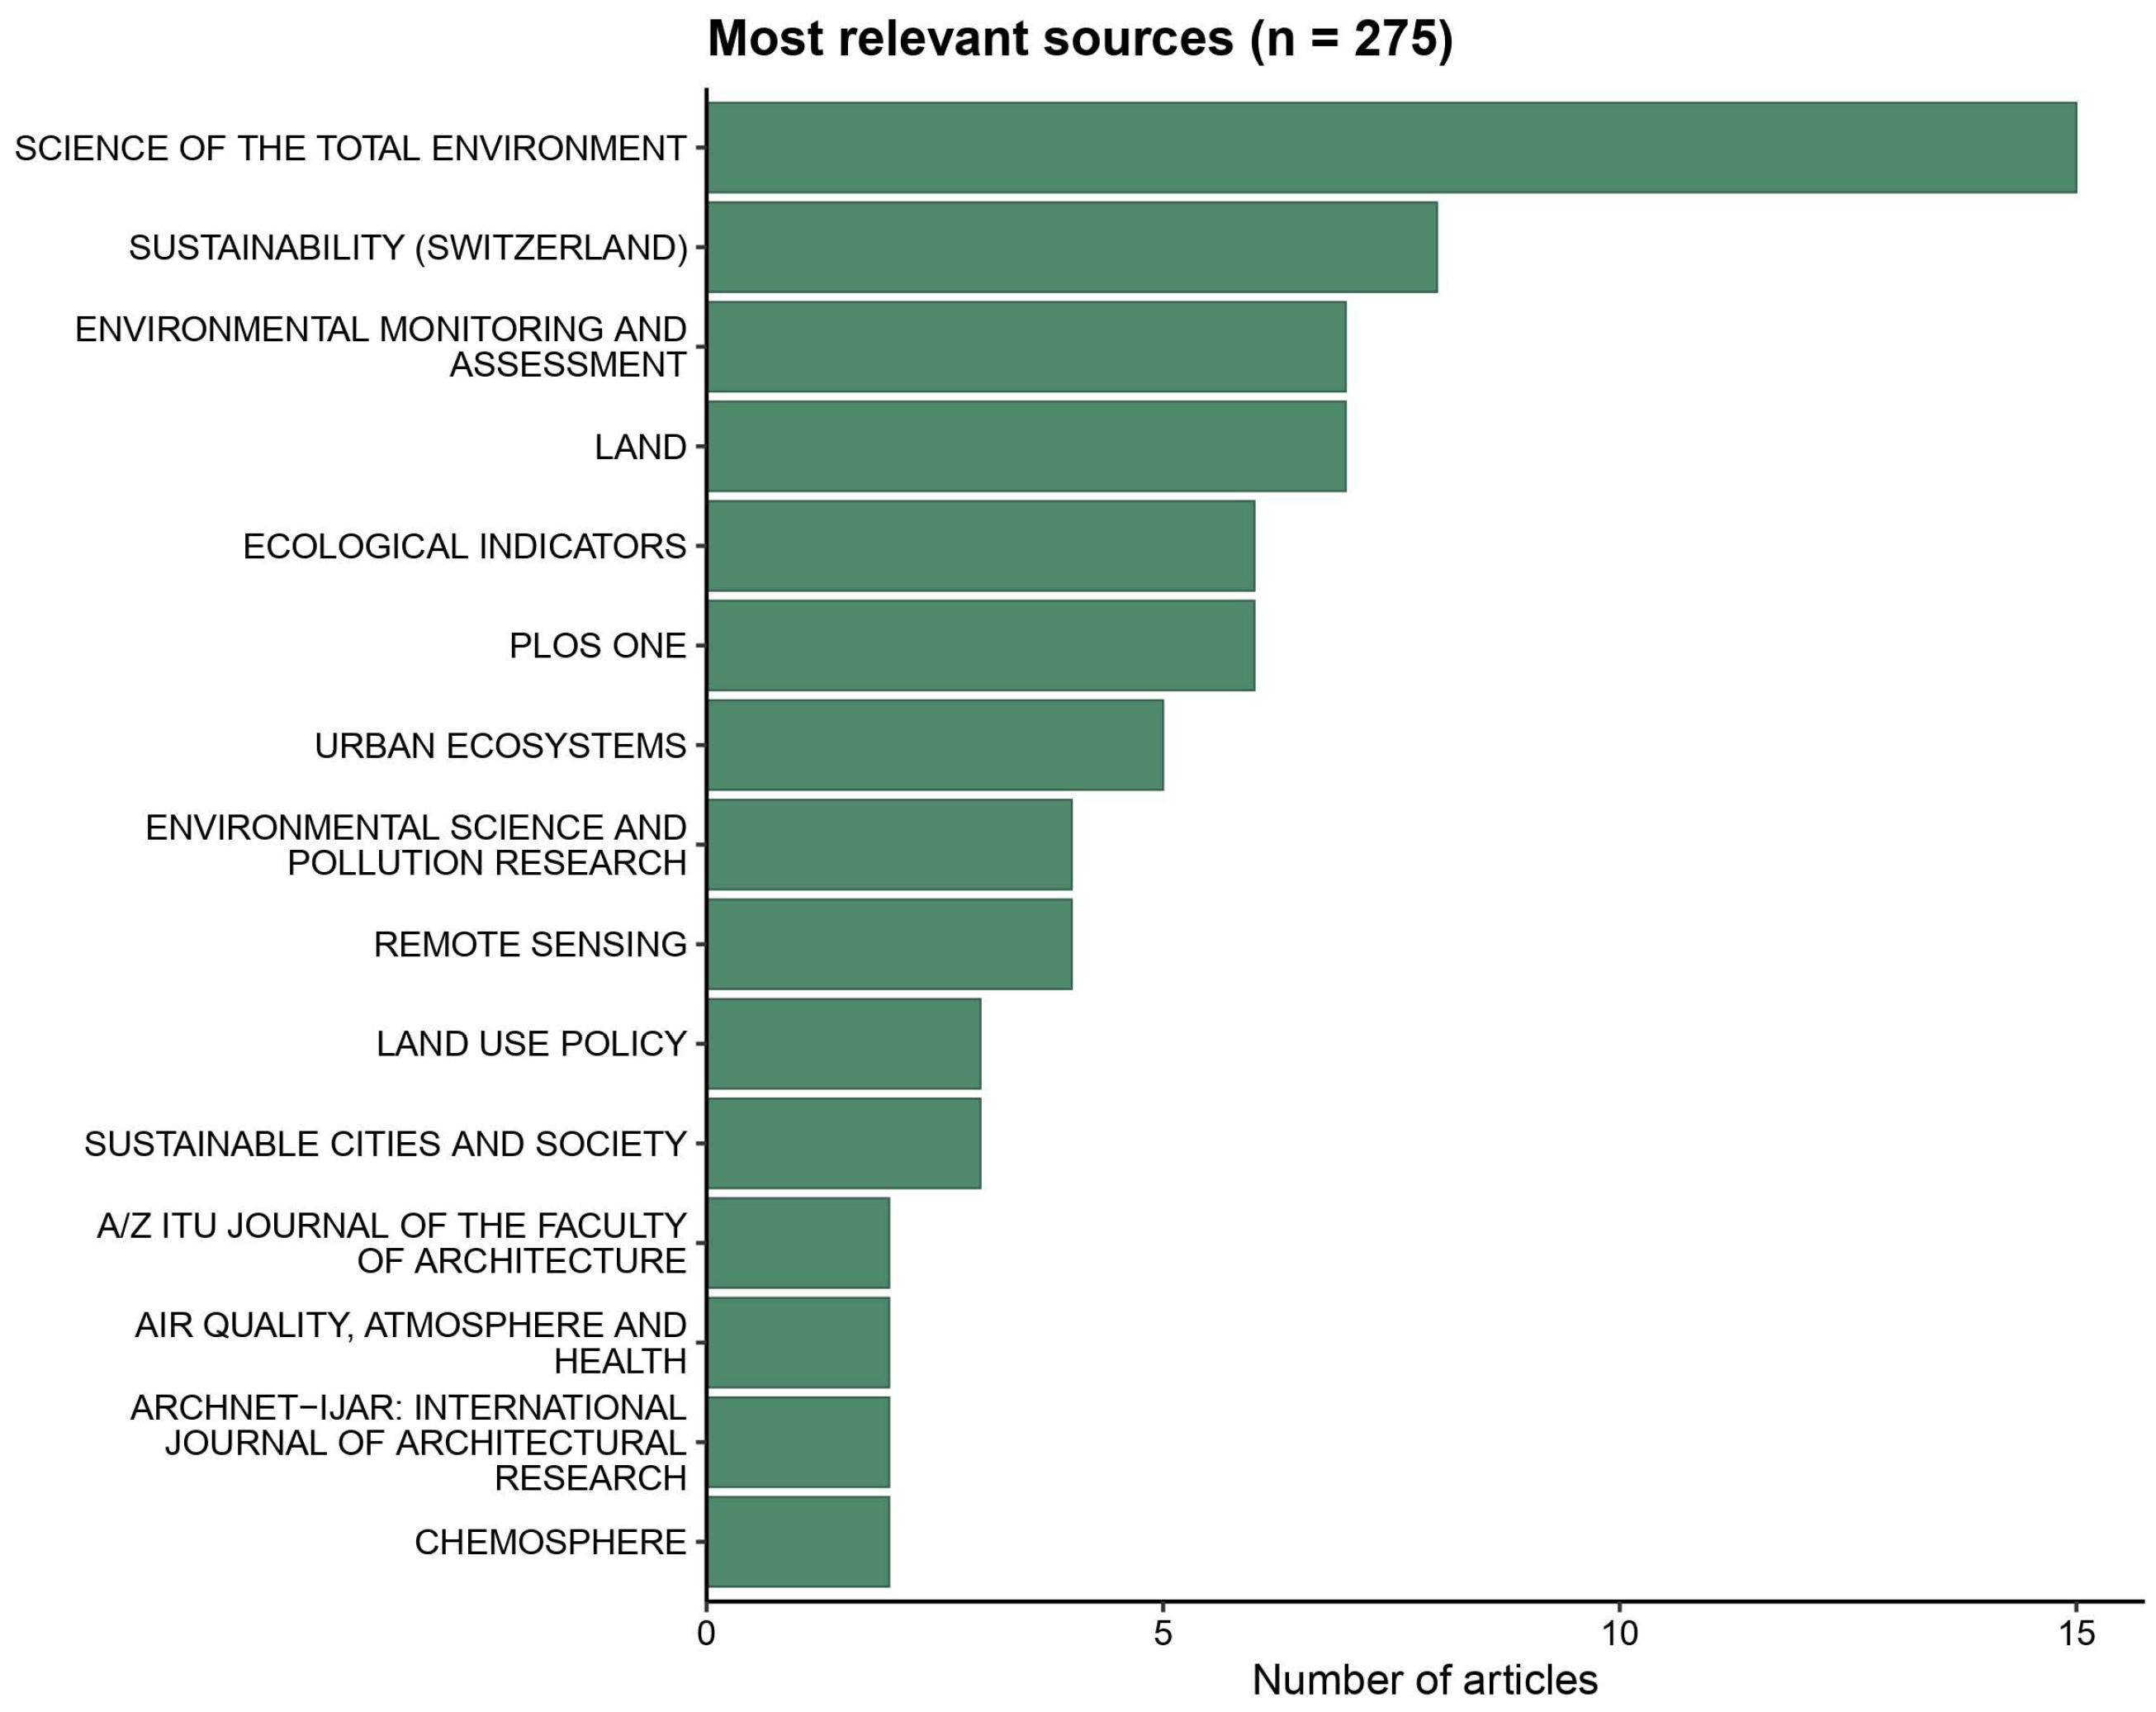
The analysis of publication venues within the general dataset of 275 articles (
Figure 5) shows that research on urban threats is distributed across a broad range of journals. The most represented journals were Science of the Total Environment (15 articles), Sustainability (8 papers), Environmental Monitoring and Assessment, and Land (7 articles). Other journals contributed fewer articles, including Land Use Policy with three articles. This distribution indicates that, although a small group of journals dominates the literature, research on urban threats draws from a relatively broad spectrum of sources focused on the environment and sustainability, reflecting the interdisciplinary nature of the field.
In the screened sample (
n = 69), the journal distribution shifts (
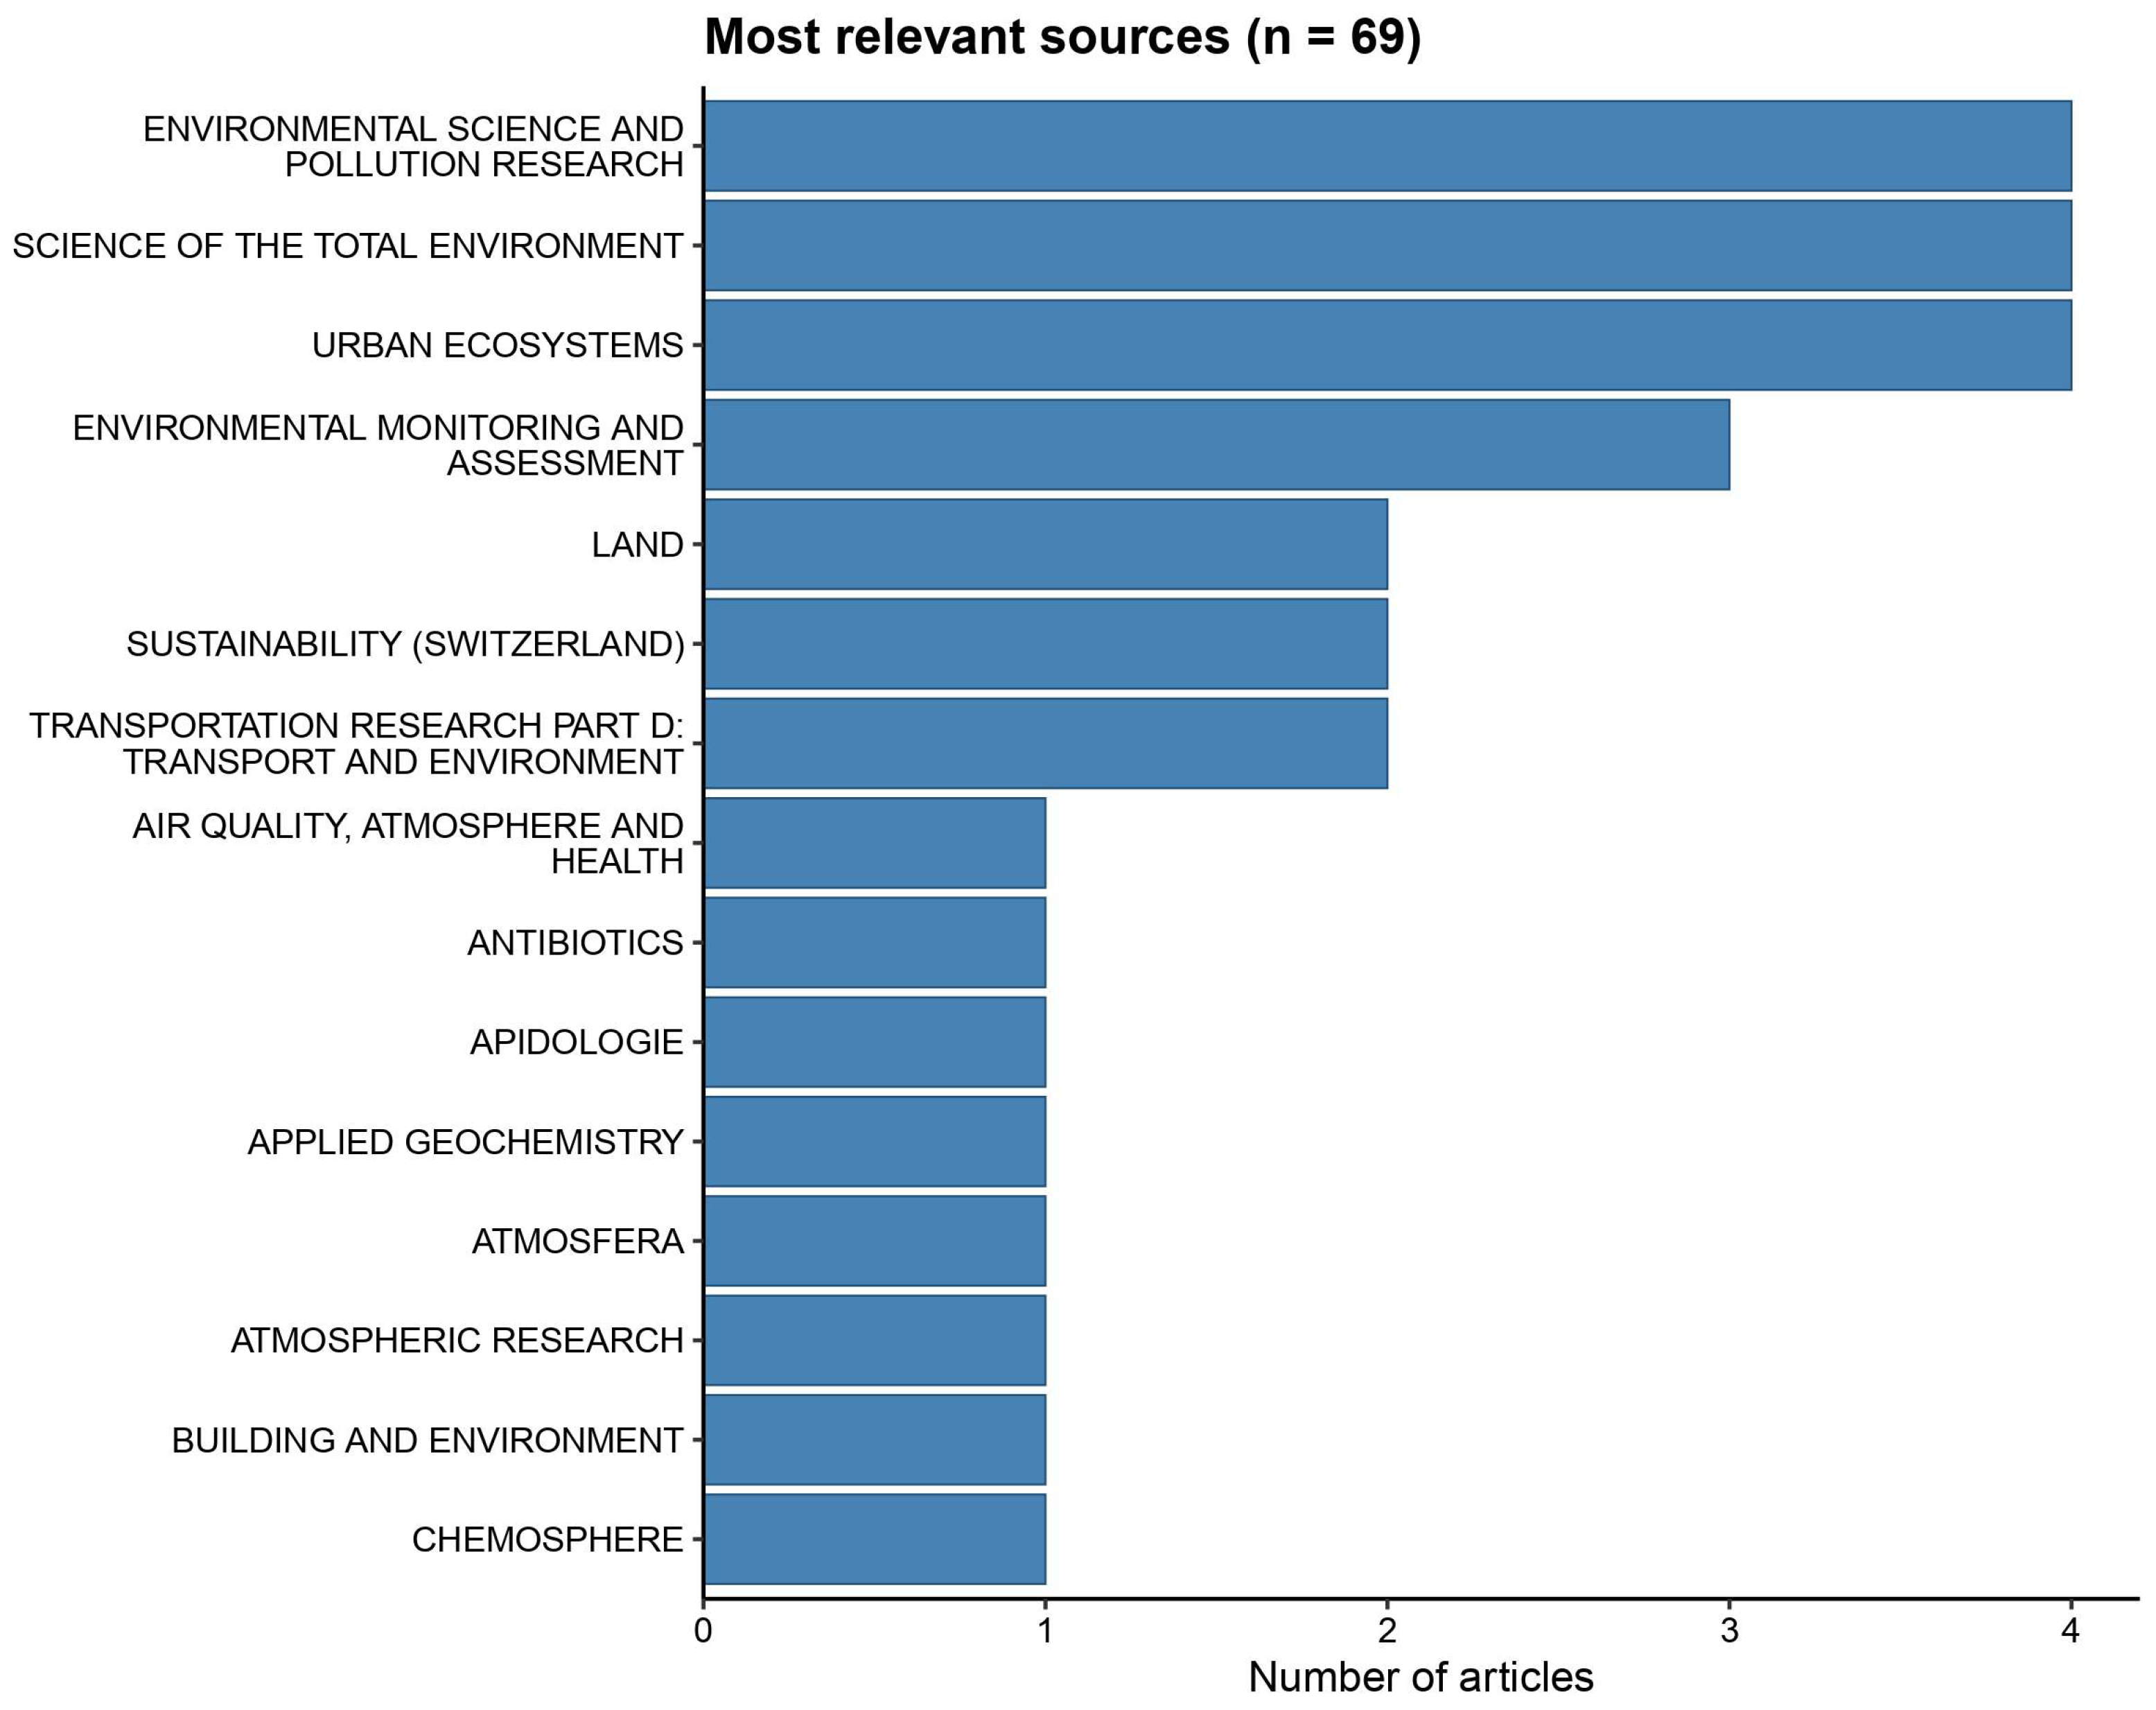
Figure 6).
Environmental Science and Pollution Research,
Science of the Total Environment and
Urban Ecosystems are the most represented sources (4 articles each), followed by
Environmental Monitoring and Assessment (three articles) and
Land,
Sustainability and
Transportation Research (two articles each). The remaining journals contribute single articles. In aggregate, screening concentrates the evidence base in outlets more directly aligned with the review focus, while still reflecting an interdisciplinary publication landscape.
3.1.4. Conceptual Shift Induced by Screening
To further assess how the screening process reshaped the conceptual focus of the literature, a keyness analysis was applied to the abstracts of the initial (
n = 275) and final (
n = 69) datasets (
Figure 7). Using a log-likelihood (chi-square) approach, this analysis identifies terms that are statistically distinctive in the filtered corpus when directly compared to the initial dataset.
Patterns indicate that the screening process increased the relative prominence of studies focused on measurable environmental pressures and exposure-related outcomes, including air pollution (e.g., air, pollution, NO2, emissions), soil and groundwater contamination, and thermal conditions (e.g., temperature, thermal). In addition, terms related to human comfort, green elements, and urban habitats occurred as characteristic of the filtered corpus.
Health-related terms, including vector-borne disease indicators such as malaria, also appeared as statistically distinctive. These terms reflect the inclusion of a limited number of studies addressing environmental health risks in specific urban contexts, rather than their general prominence across the literature.
Overall, the keyness analysis indicates that screening increased the relative prominence of studies centred on measurable environmental pressures, exposure pathways and related impacts. This conceptual shift establishes a robust foundation for the subsequent synthesis, which applies the CS framework as an analytical lens.
3.1.5. Co-Occurrence Analysis
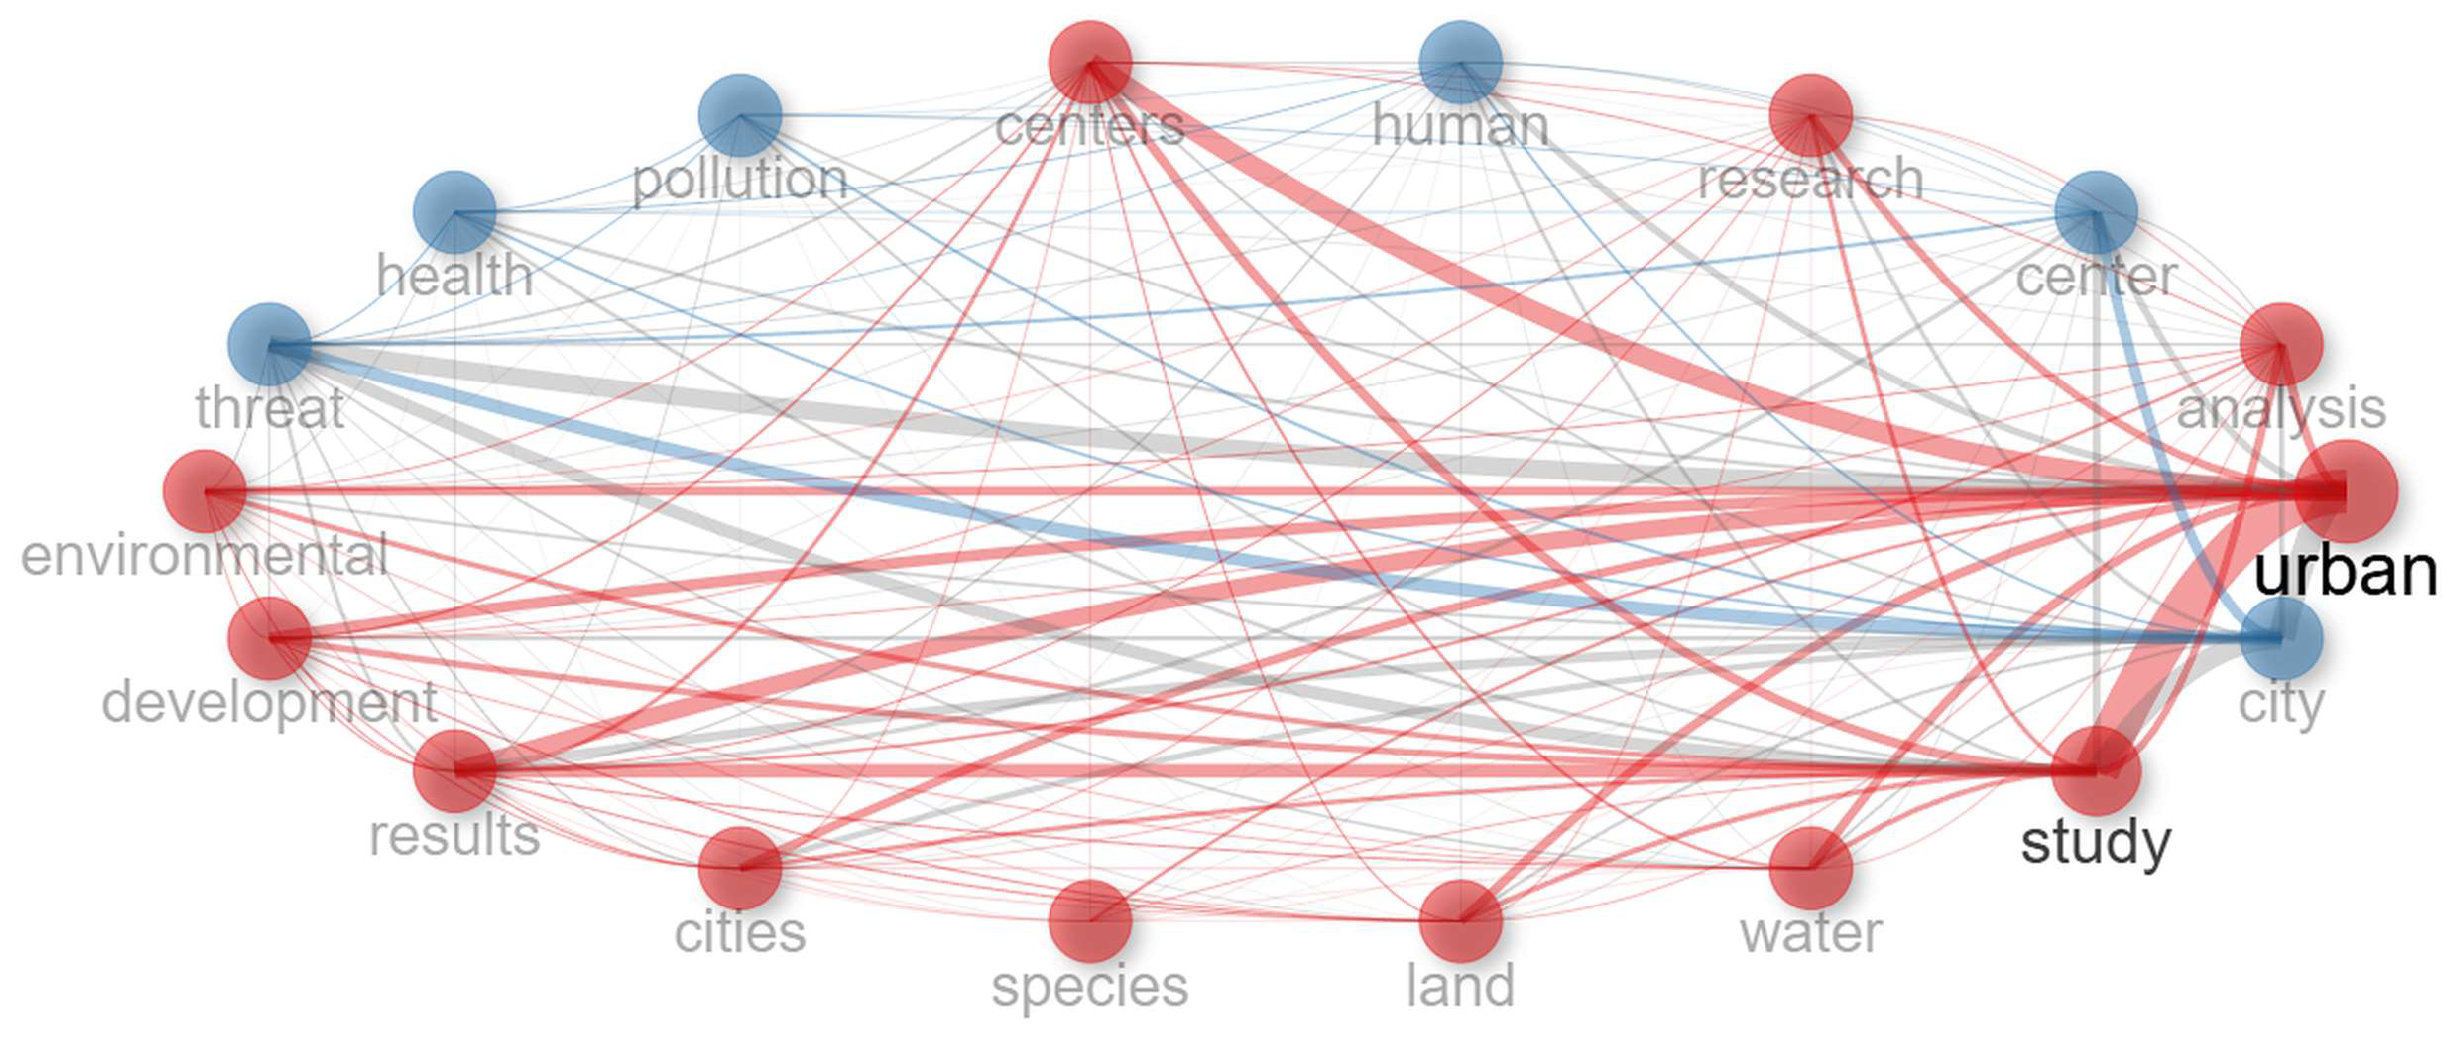
To complement the keyness analysis, a term co-occurrence analysis was used to visualise how screening reshaped the conceptual structure of the literature. In the initial dataset (
n = 275), the network is dominated by broad, generic terms (e.g., “urban”, “environmental”, “species”, “health”), consistent with a heterogeneous evidence base in which multiple topics remain only partially differentiated (
Figure 8).
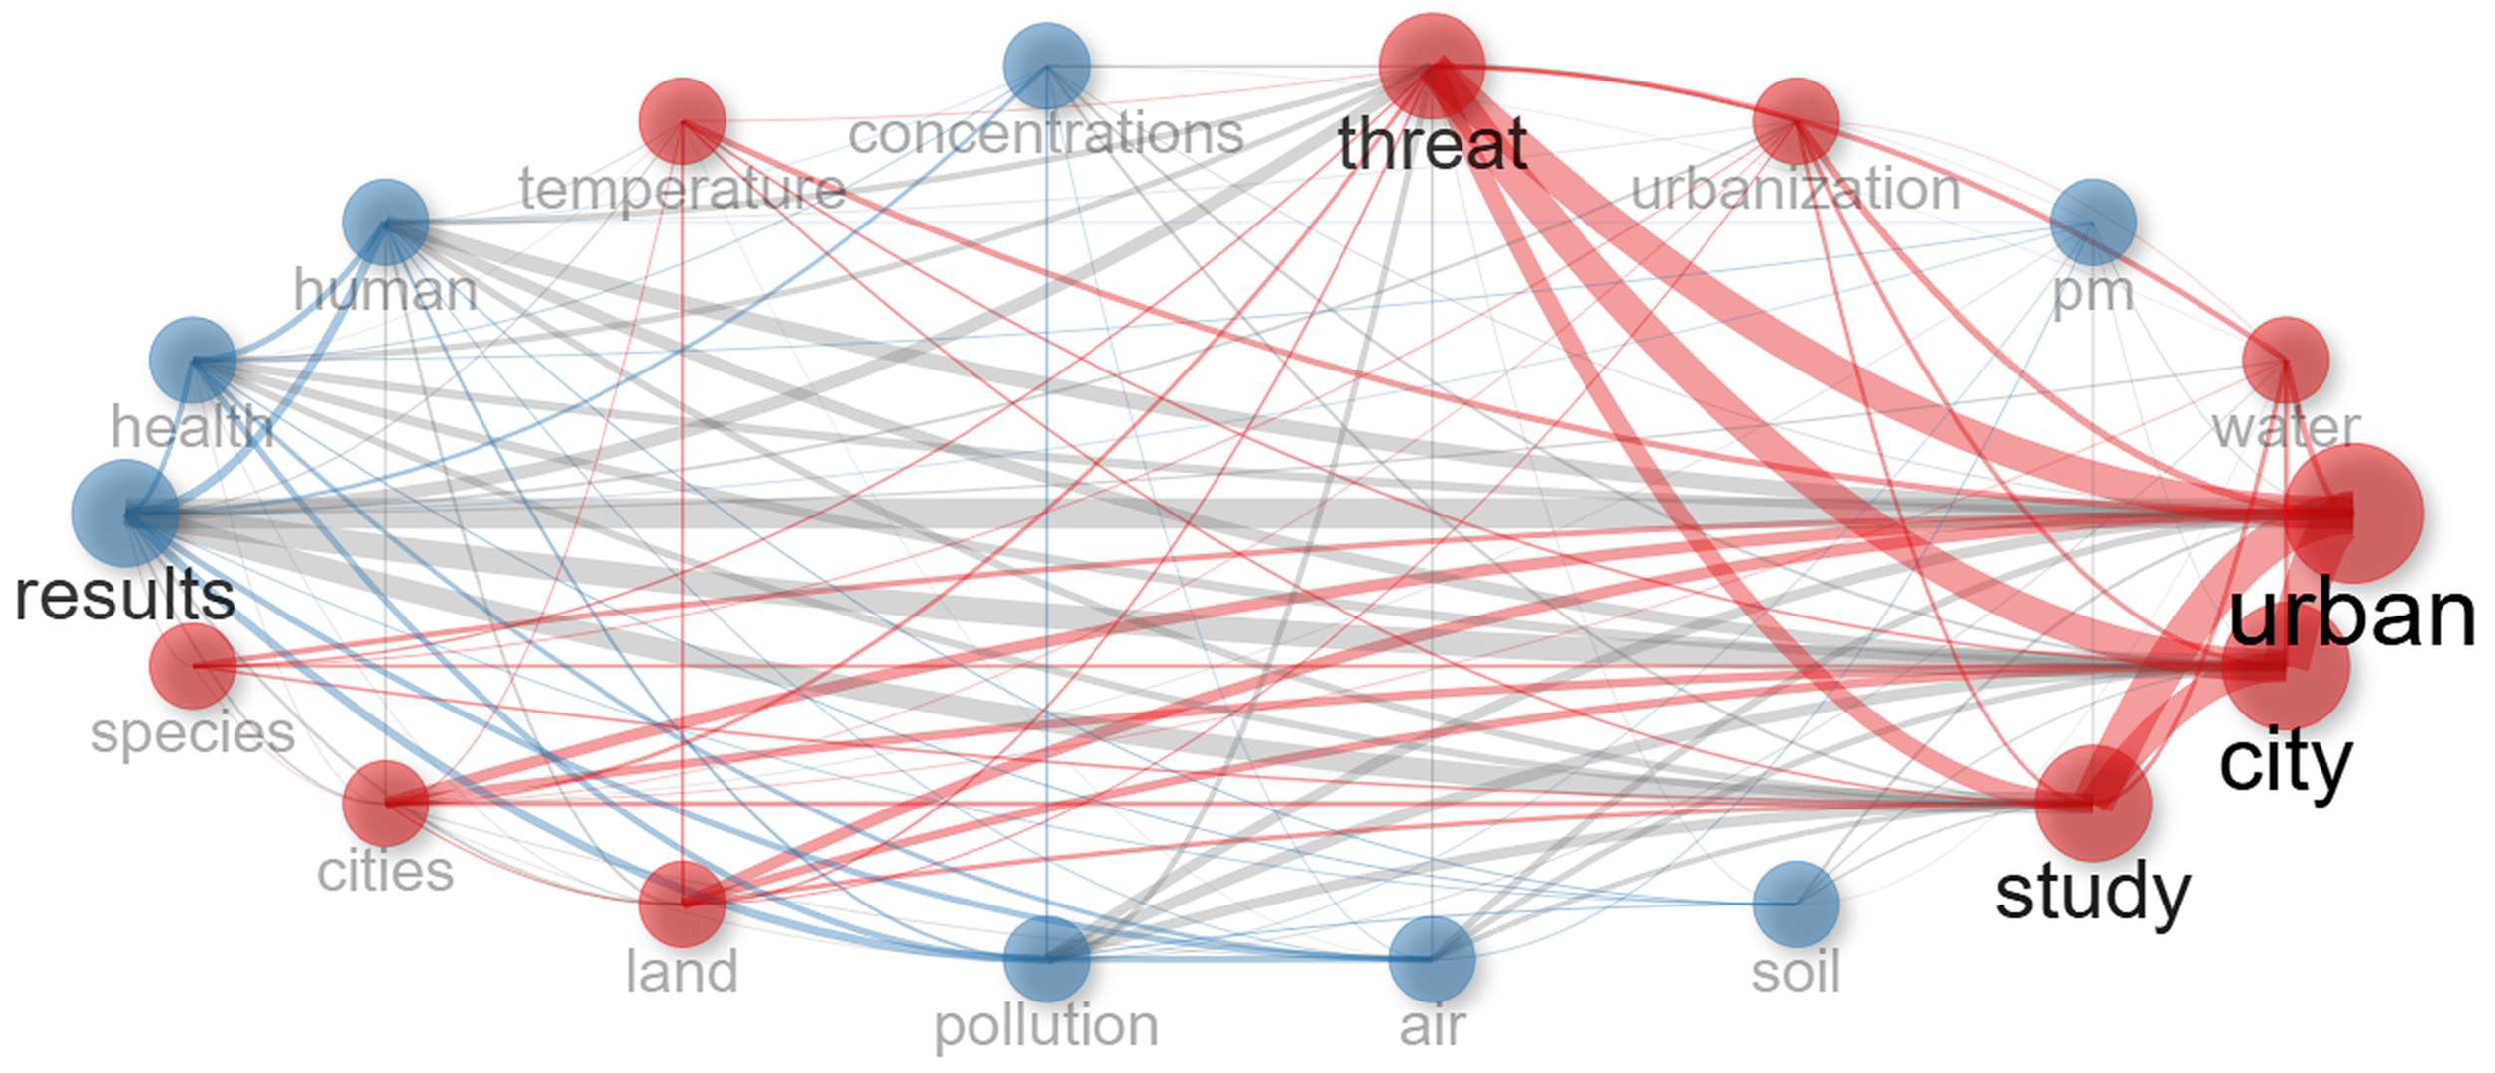
In the screened sample (
n = 69), the network remains centred on a limited number of high-frequency generic terms, but pressure- and exposure-related terms (e.g., “pollution”, “air”, “soil”, “water”, “temperature”, “PM”) become more visible and more strongly integrated within the network, indicating a narrower conceptual focus in relation to the review objectives (
Figure 9). The comparison suggests that screening did more than narrow the dataset; it also sharpened the conceptual scope by emphasising environmental pressure–impact relationships particularly pertinent to urban squares.
Rather than yielding sharply separated thematic clusters, the comparison between
Figure 8 and
Figure 9 indicates that screening reduced conceptual dispersion and increased the relative prominence of environmental pressure–impact terms in relation to the review focus.
Building on this overview,
Section 3.2 synthesises the screened studies according to the four CS components to address the research questions.
3.2. CS Synthesis: Frequency Patterns Across Conservation Targets, Direct Threats, Contributing Factors and Conservation Actions
To answer the research questions, the screened studies were coded and summarised according to four CS components: (i) conservation targets, (ii) direct threats, (iii) contributing factors and (iv) conservation actions. For each component, frequency histograms were produced to show how often each category was reported across the final sample. This visual approach highlights the most recurrent elements discussed in relation to urban squares, as well as categories that are less frequently reported across the screened evidence base.
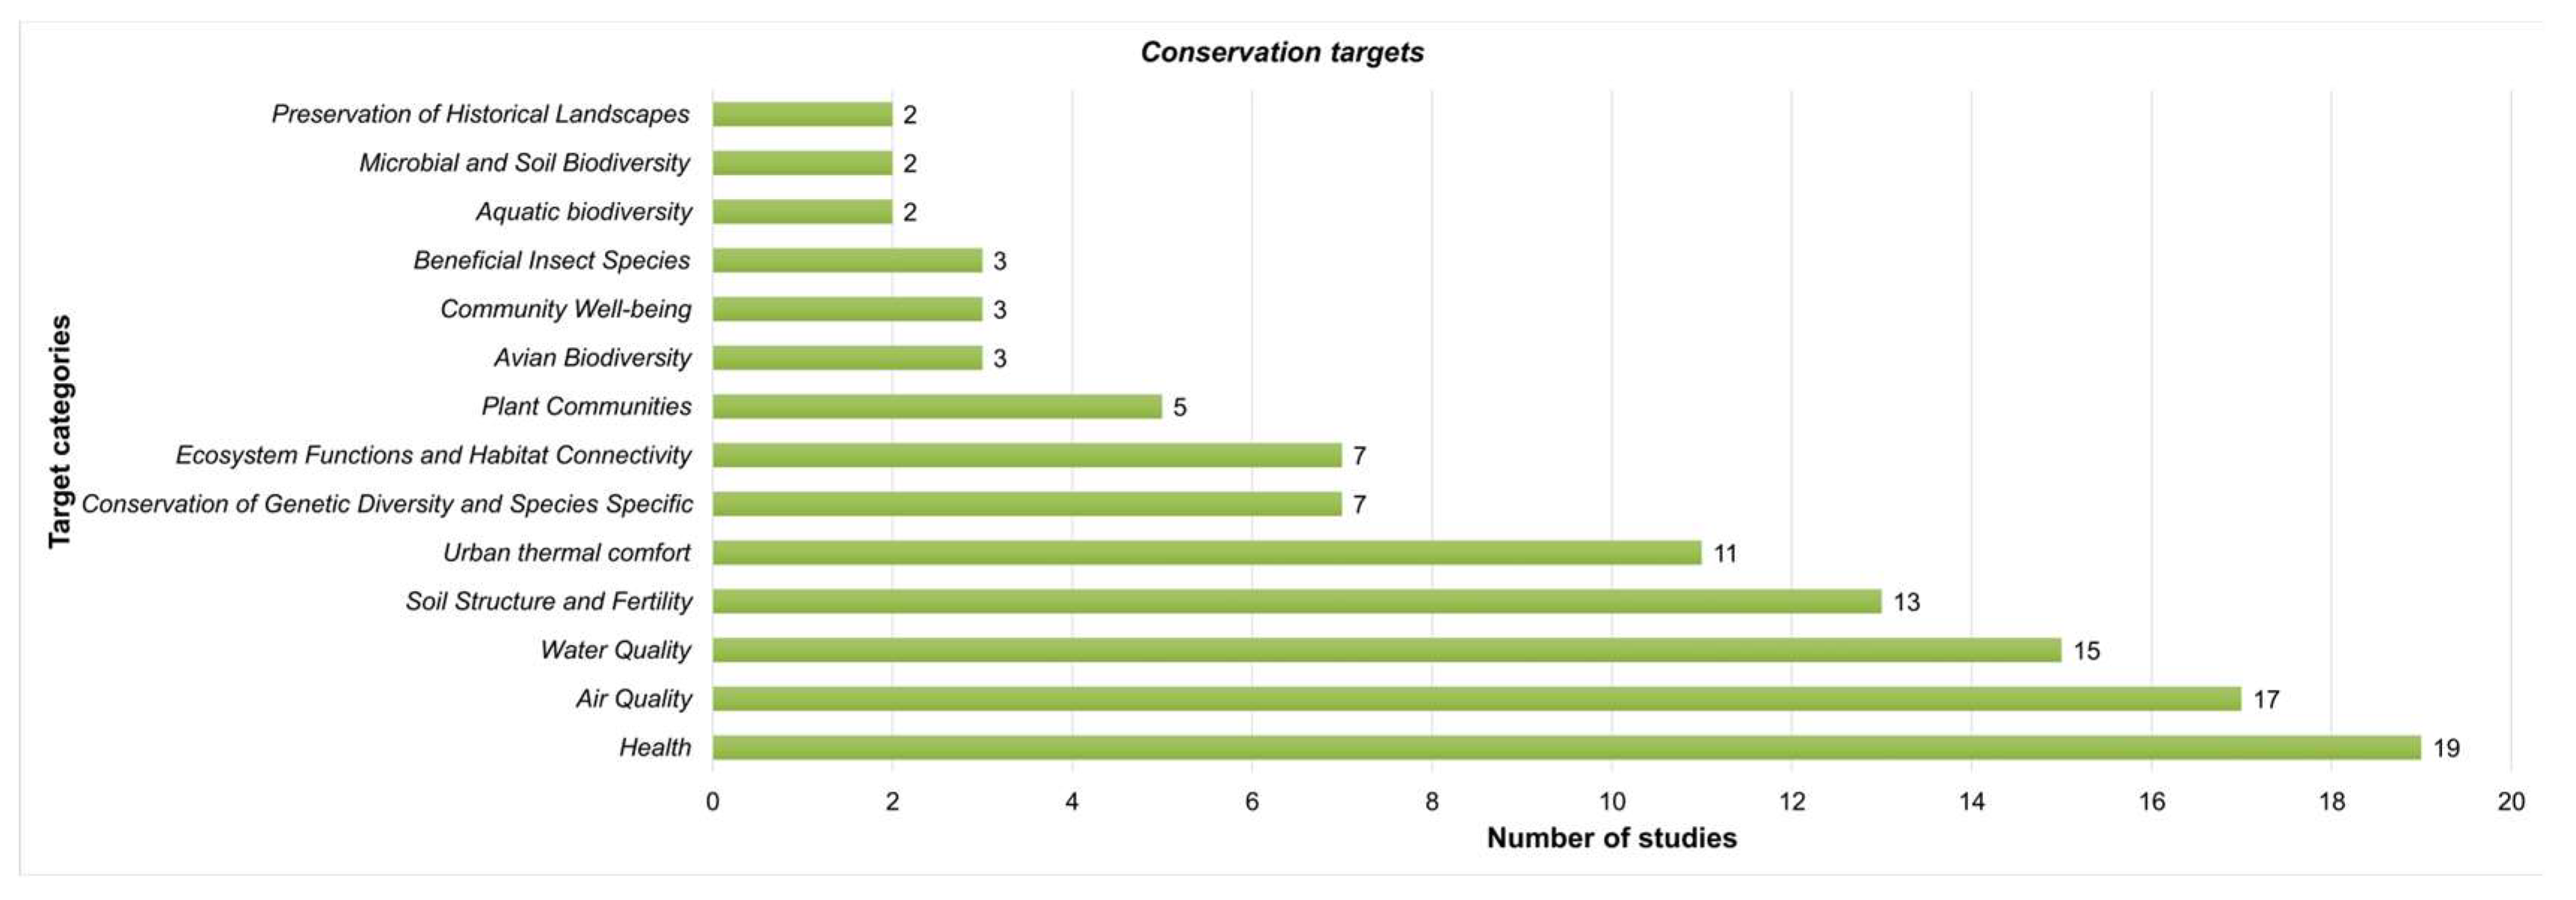
Figure 10 summarises the distribution of conservation targets identified across the final sample. Health appears as the most frequently cited target, appearing in 19 studies. This reflects the recurring focus on human well-being as a central outcome of urban green interventions. Air quality (17 occurrences) and water quality (15 occurrences) follow closely, confirming the relevance of regulating services in densely urbanised contexts. By contrast, microbial and soil biodiversity, preservation of historical landscapes, and aquatic biodiversity were each mentioned only twice. In total, 14 distinct categories of conservation targets were identified, reflecting a heterogeneous yet uneven representation of ecological, cultural, and social dimensions.
Beyond conservation targets, the reviewed literature systematically addresses the pressures that threaten their achievement.
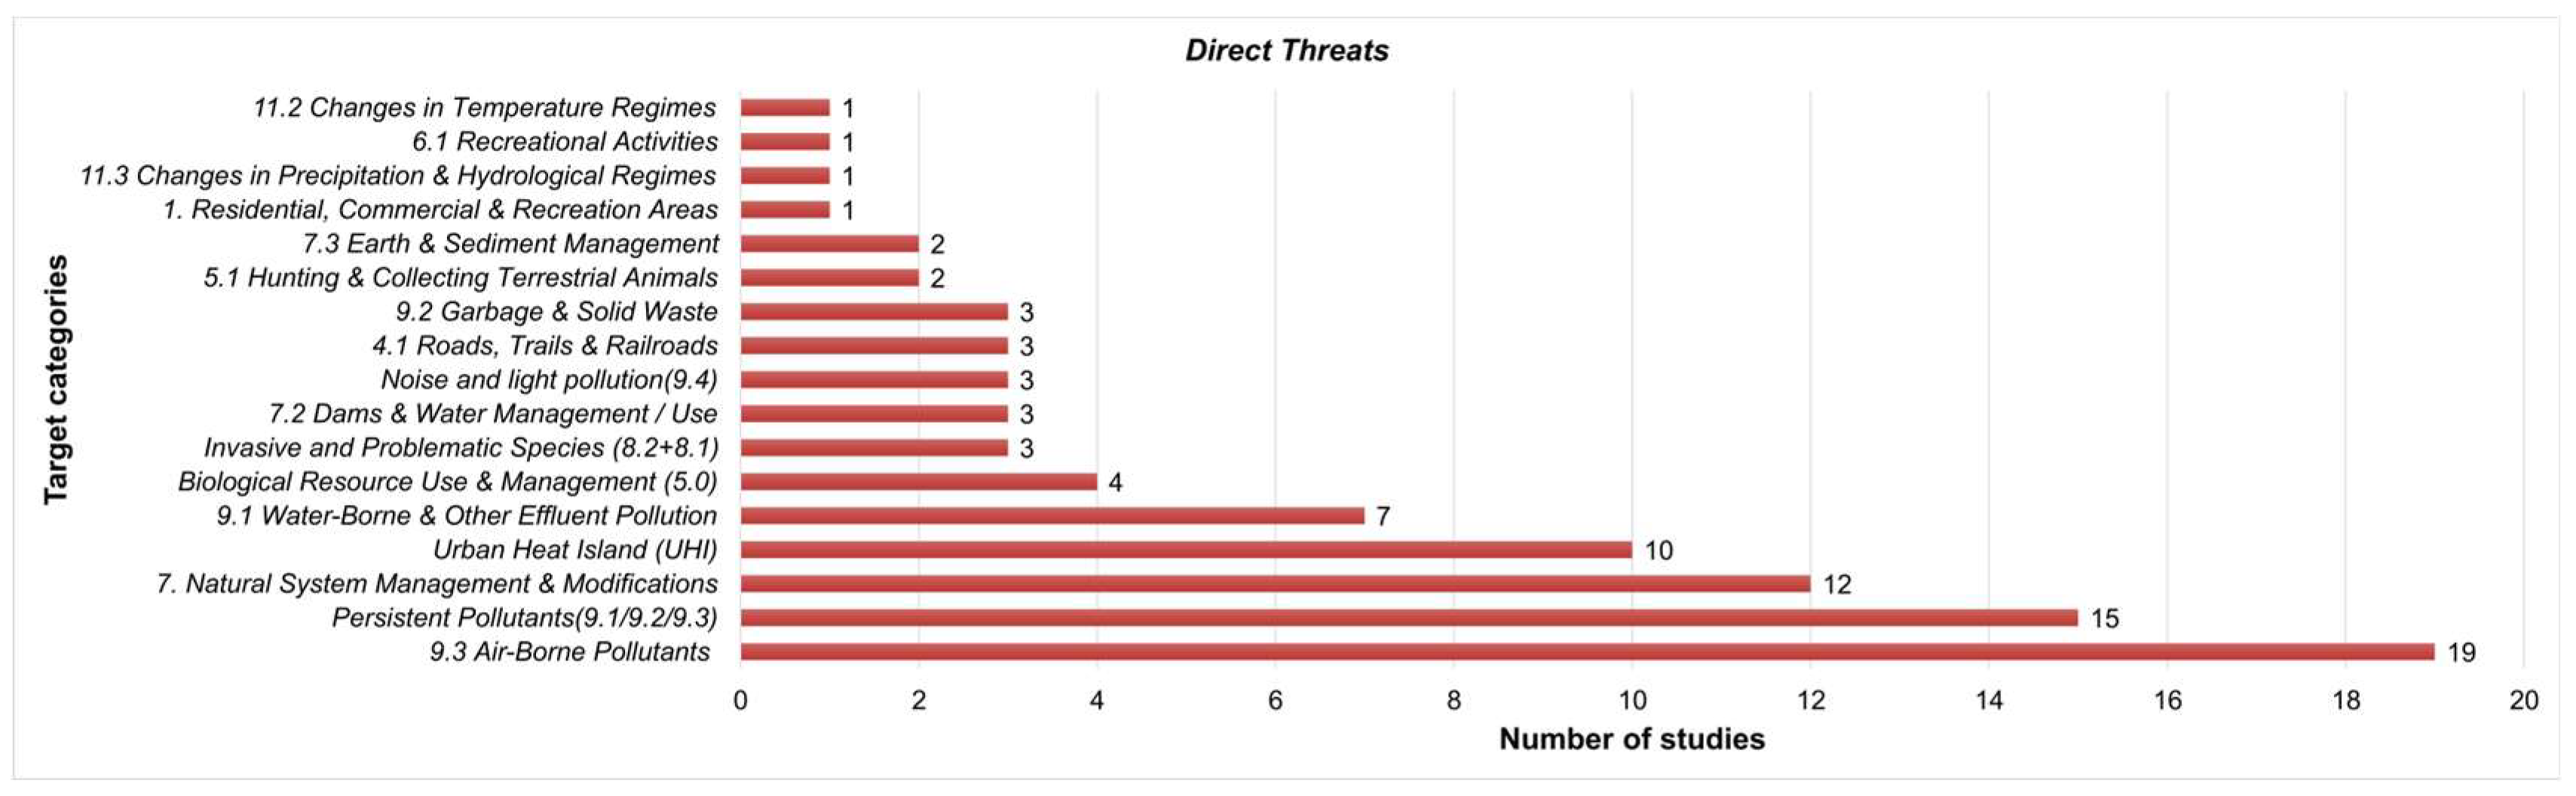
Figure 11, therefore, reports the distribution of direct threats, as classified according to IUCN categories (with the addition of some custom categories). The most frequently cited threat is airborne pollutants, reported 19 times. Persistent pollutants, considered here as a separate category, were the second most cited (15 occurrences), while natural system management and modification ranked third with 12 mentions. Several other categories, such as changes in precipitation and hydrological regimes, changes in temperature regimes, and recreational activities, appeared only once. In total, 17 distinct threat categories were recorded, indicating a broad but highly variable recognition of pressures affecting urban squares.
However, threats are shaped by multiple underlying factors, which
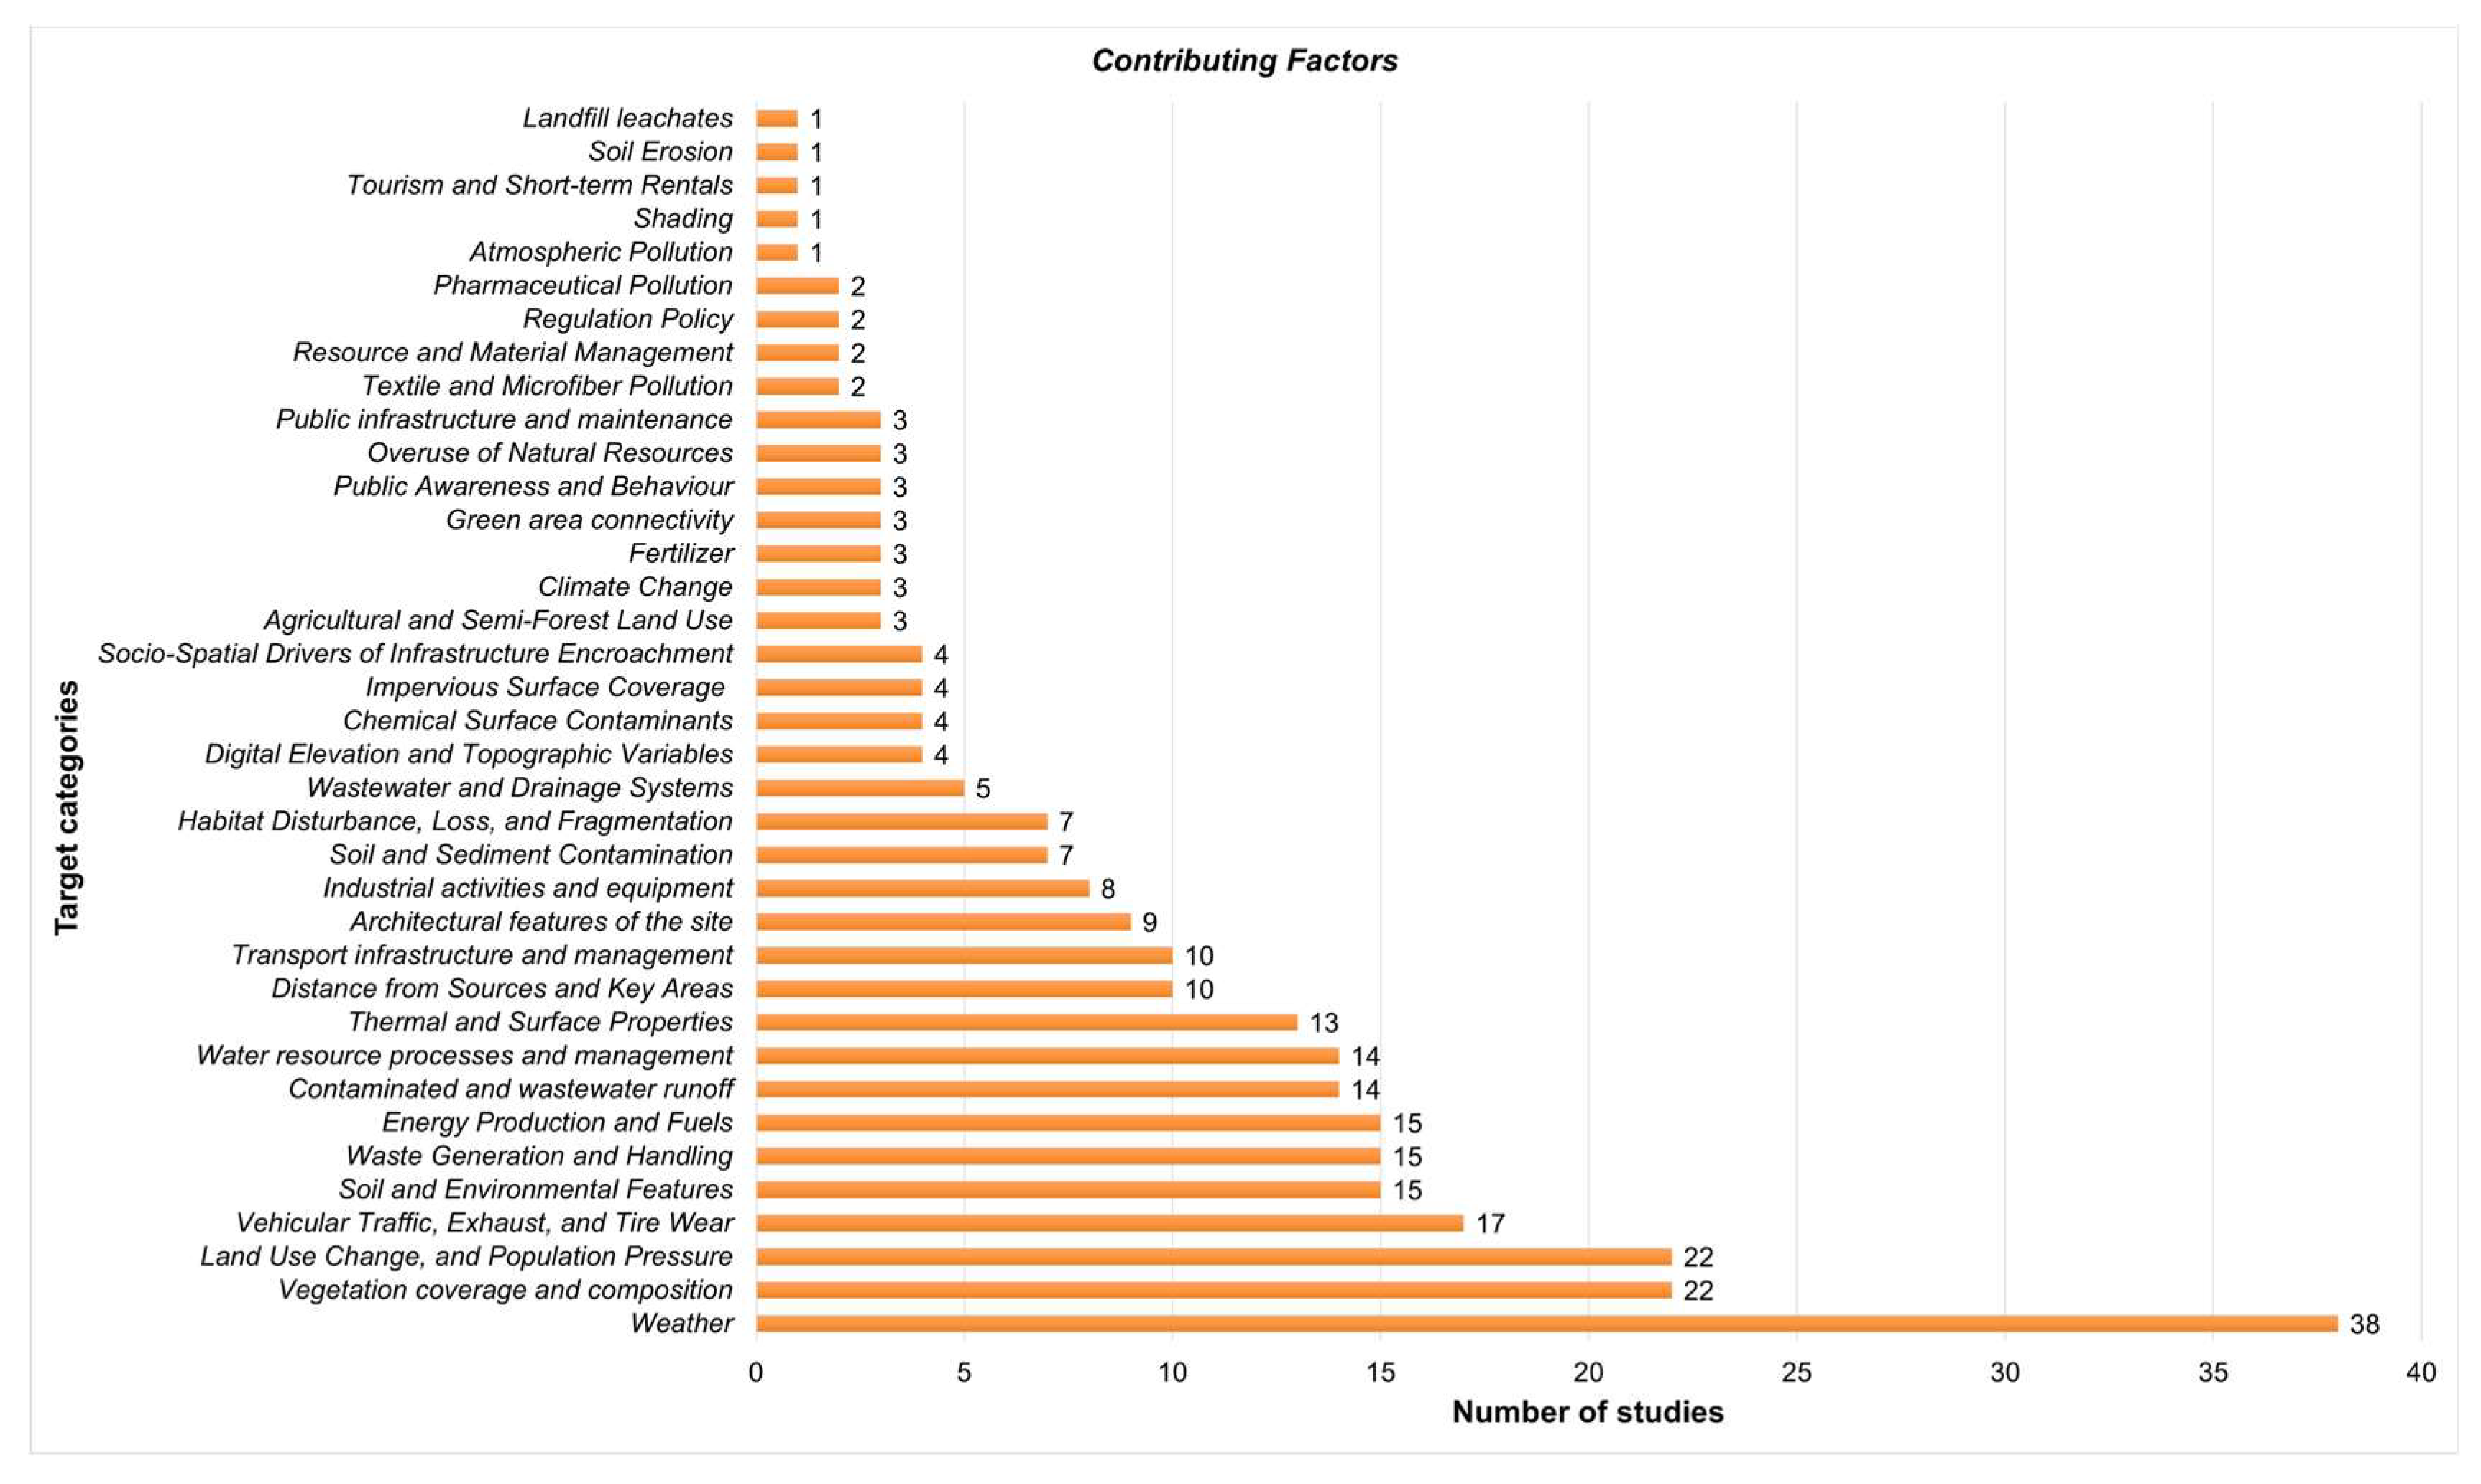
Figure 12 captures. Weather conditions emerge as the most cited contributing factors (38 studies), indicating that climatic variation is seen as a central driver in many studies. Vegetation coverage and composition, together with land use change, follow with 22 occurrences each. Vehicular traffic, exhaust, and tyre wear rank next, with 17 mentions. At the lower end, factors such as landfill leachates, shading, and soil erosion are barely represented (one occurrence each). Altogether, 37 macro-factors were identified, showing that the literature attributes a very broad spectrum of drivers to conservation outcomes, yet with strong skewness toward a few high-frequency ones.
Finally, the reviewed studies also proposed a set of actions intended to address these pressures.
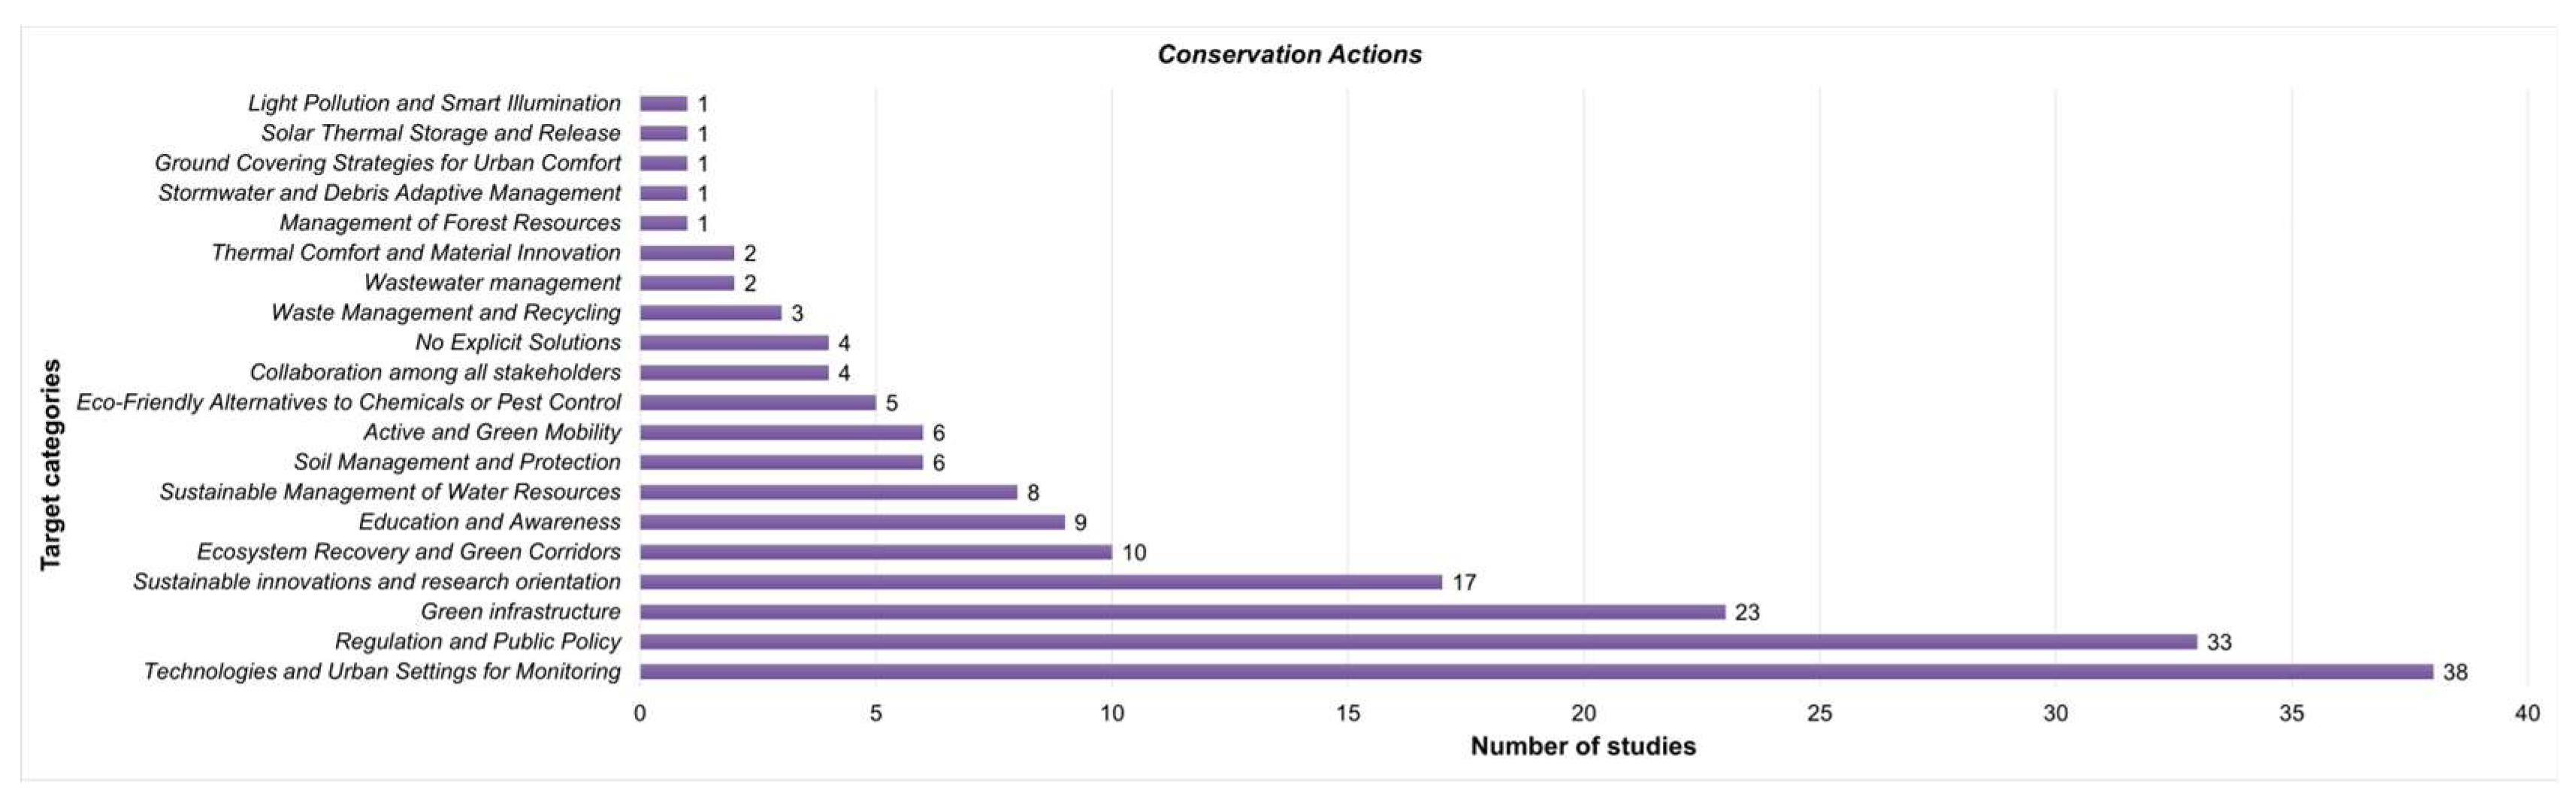
Figure 13 displays the range of suggested conservation actions. The most frequently reported interventions relate to technologies and urban monitoring settings (38 occurrences), followed by regulation and public policy measures (33) and the promotion of green infrastructure (23). Less common interventions included light pollution control and smart illumination, stormwater and debris adaptive management, ground covering strategies, and solar thermal storage and release, each reported only once. In total, 19 categories of conservation actions were identified, indicating that while technological and policy-oriented measures dominate the discussion, other potentially relevant conservation actions appear only marginally in the reviewed literature.
3.3. Cross-Case Conceptual Synthesis of Relationships Among Conservation Targets, Direct Threats and Contributing Factors
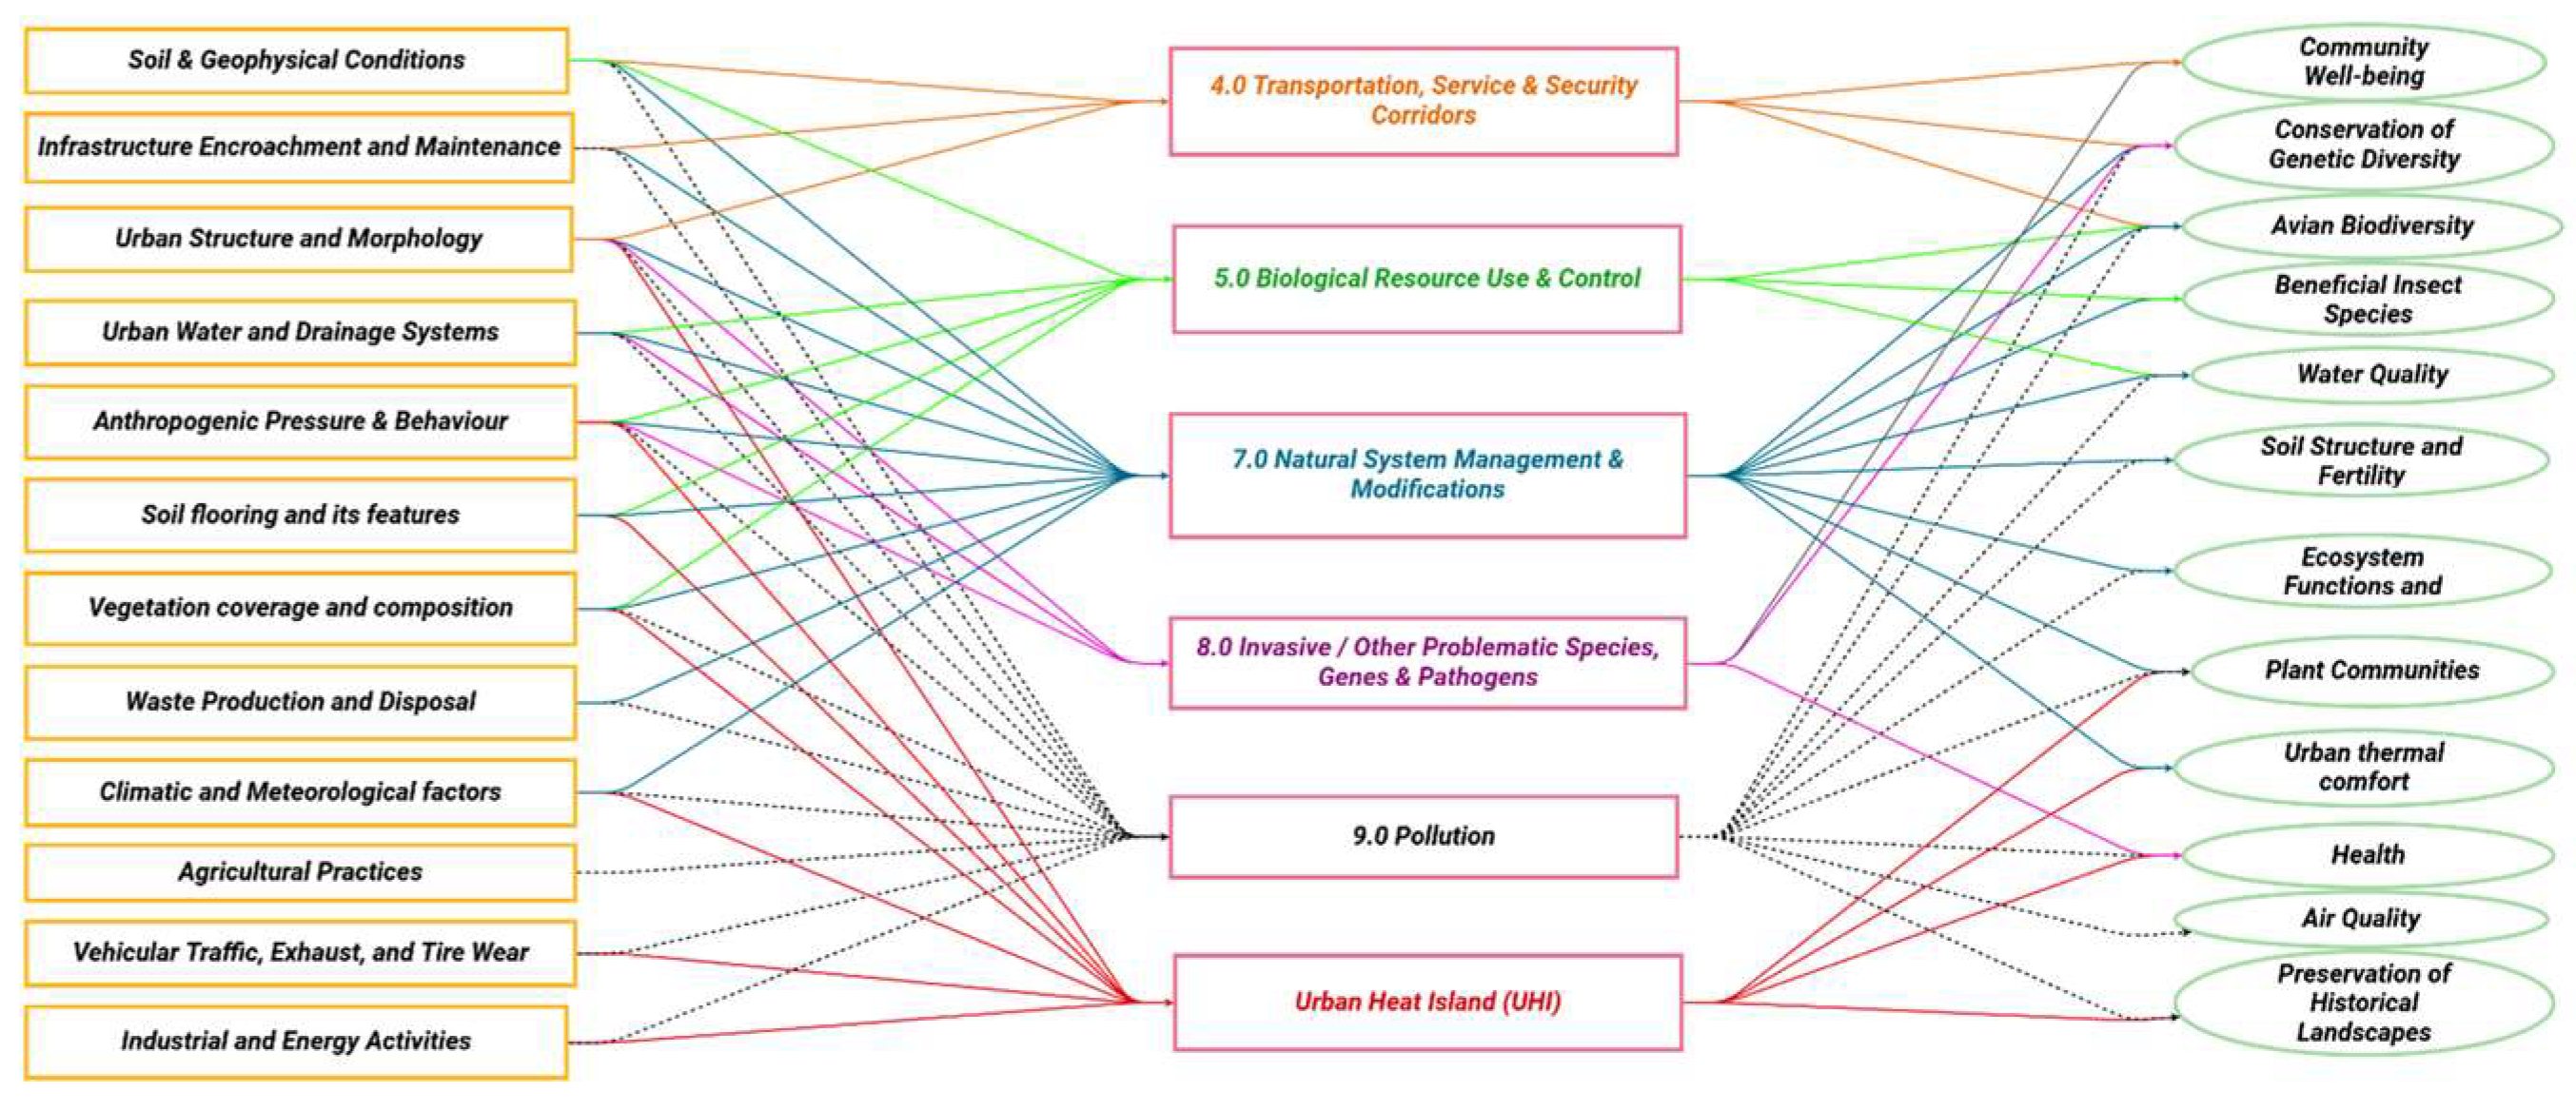
Drawing on the frequency analysis, this section presents a cross-case conceptual synthesis of the key relationships between contributing factors, direct threats, and conservation targets reported across the reviewed studies. The diagram shown in
Figure 14 was developed using Miradi as a structuring and visualisation tool aligned with CS terminology and should be interpreted as a cross-case conceptual synthesis rather than as a site-specific CS situation model.
The diagram provides a cross-case conceptual synthesis based on frequency-derived results from 69 studies and visualised using Miradi software. Numbers preceding direct threats indicate the corresponding Level-1 IUCN–CMP threat categories. Urban heat island (UHI) is shown without a numeric code because it is not included in the IUCN–CMP threat hierarchy but was retained as a distinct pressure due to its recurrent and conceptually relevant treatment in urban studies. Arrows represent relationships described in the literature rather than empirically demonstrated causal links.
Within the network, pollution (n = 47) and natural system management and modifications (n = 17) emerge as the most frequently reported direct threat categories and display linkages to multiple conservation targets. This indicates that these pressures are repeatedly discussed in the literature across heterogeneous urban contexts, including studies explicitly addressing urban squares. In contrast, lower-frequency threat categories such as transportation, service and security corridors (n = 3) and invasive and other problematic species, genes and pathogens (n = 3) show fewer reported linkages within the screened evidence base.
Among contributing factors, broad clusters such as climatic and meteorological factors, urban structure and morphology, and anthropogenic pressure and behaviour connect to the widest range of direct threats. This pattern suggests that a limited number of recurring systemic drivers are consistently described in the reviewed studies as shaping multiple pressure pathways affecting urban socio-ecological systems.
In aggregate, the cross-case conceptual synthesis integrates frequency-based outcomes with a structured representation of relationships reported in the literature, providing a synthetic view of how drivers, pressures and conservation targets are discussed in relation to urban squares across the reviewed studies.
3.4. Recurrent Causal Configurations: Triad-Based Clustering
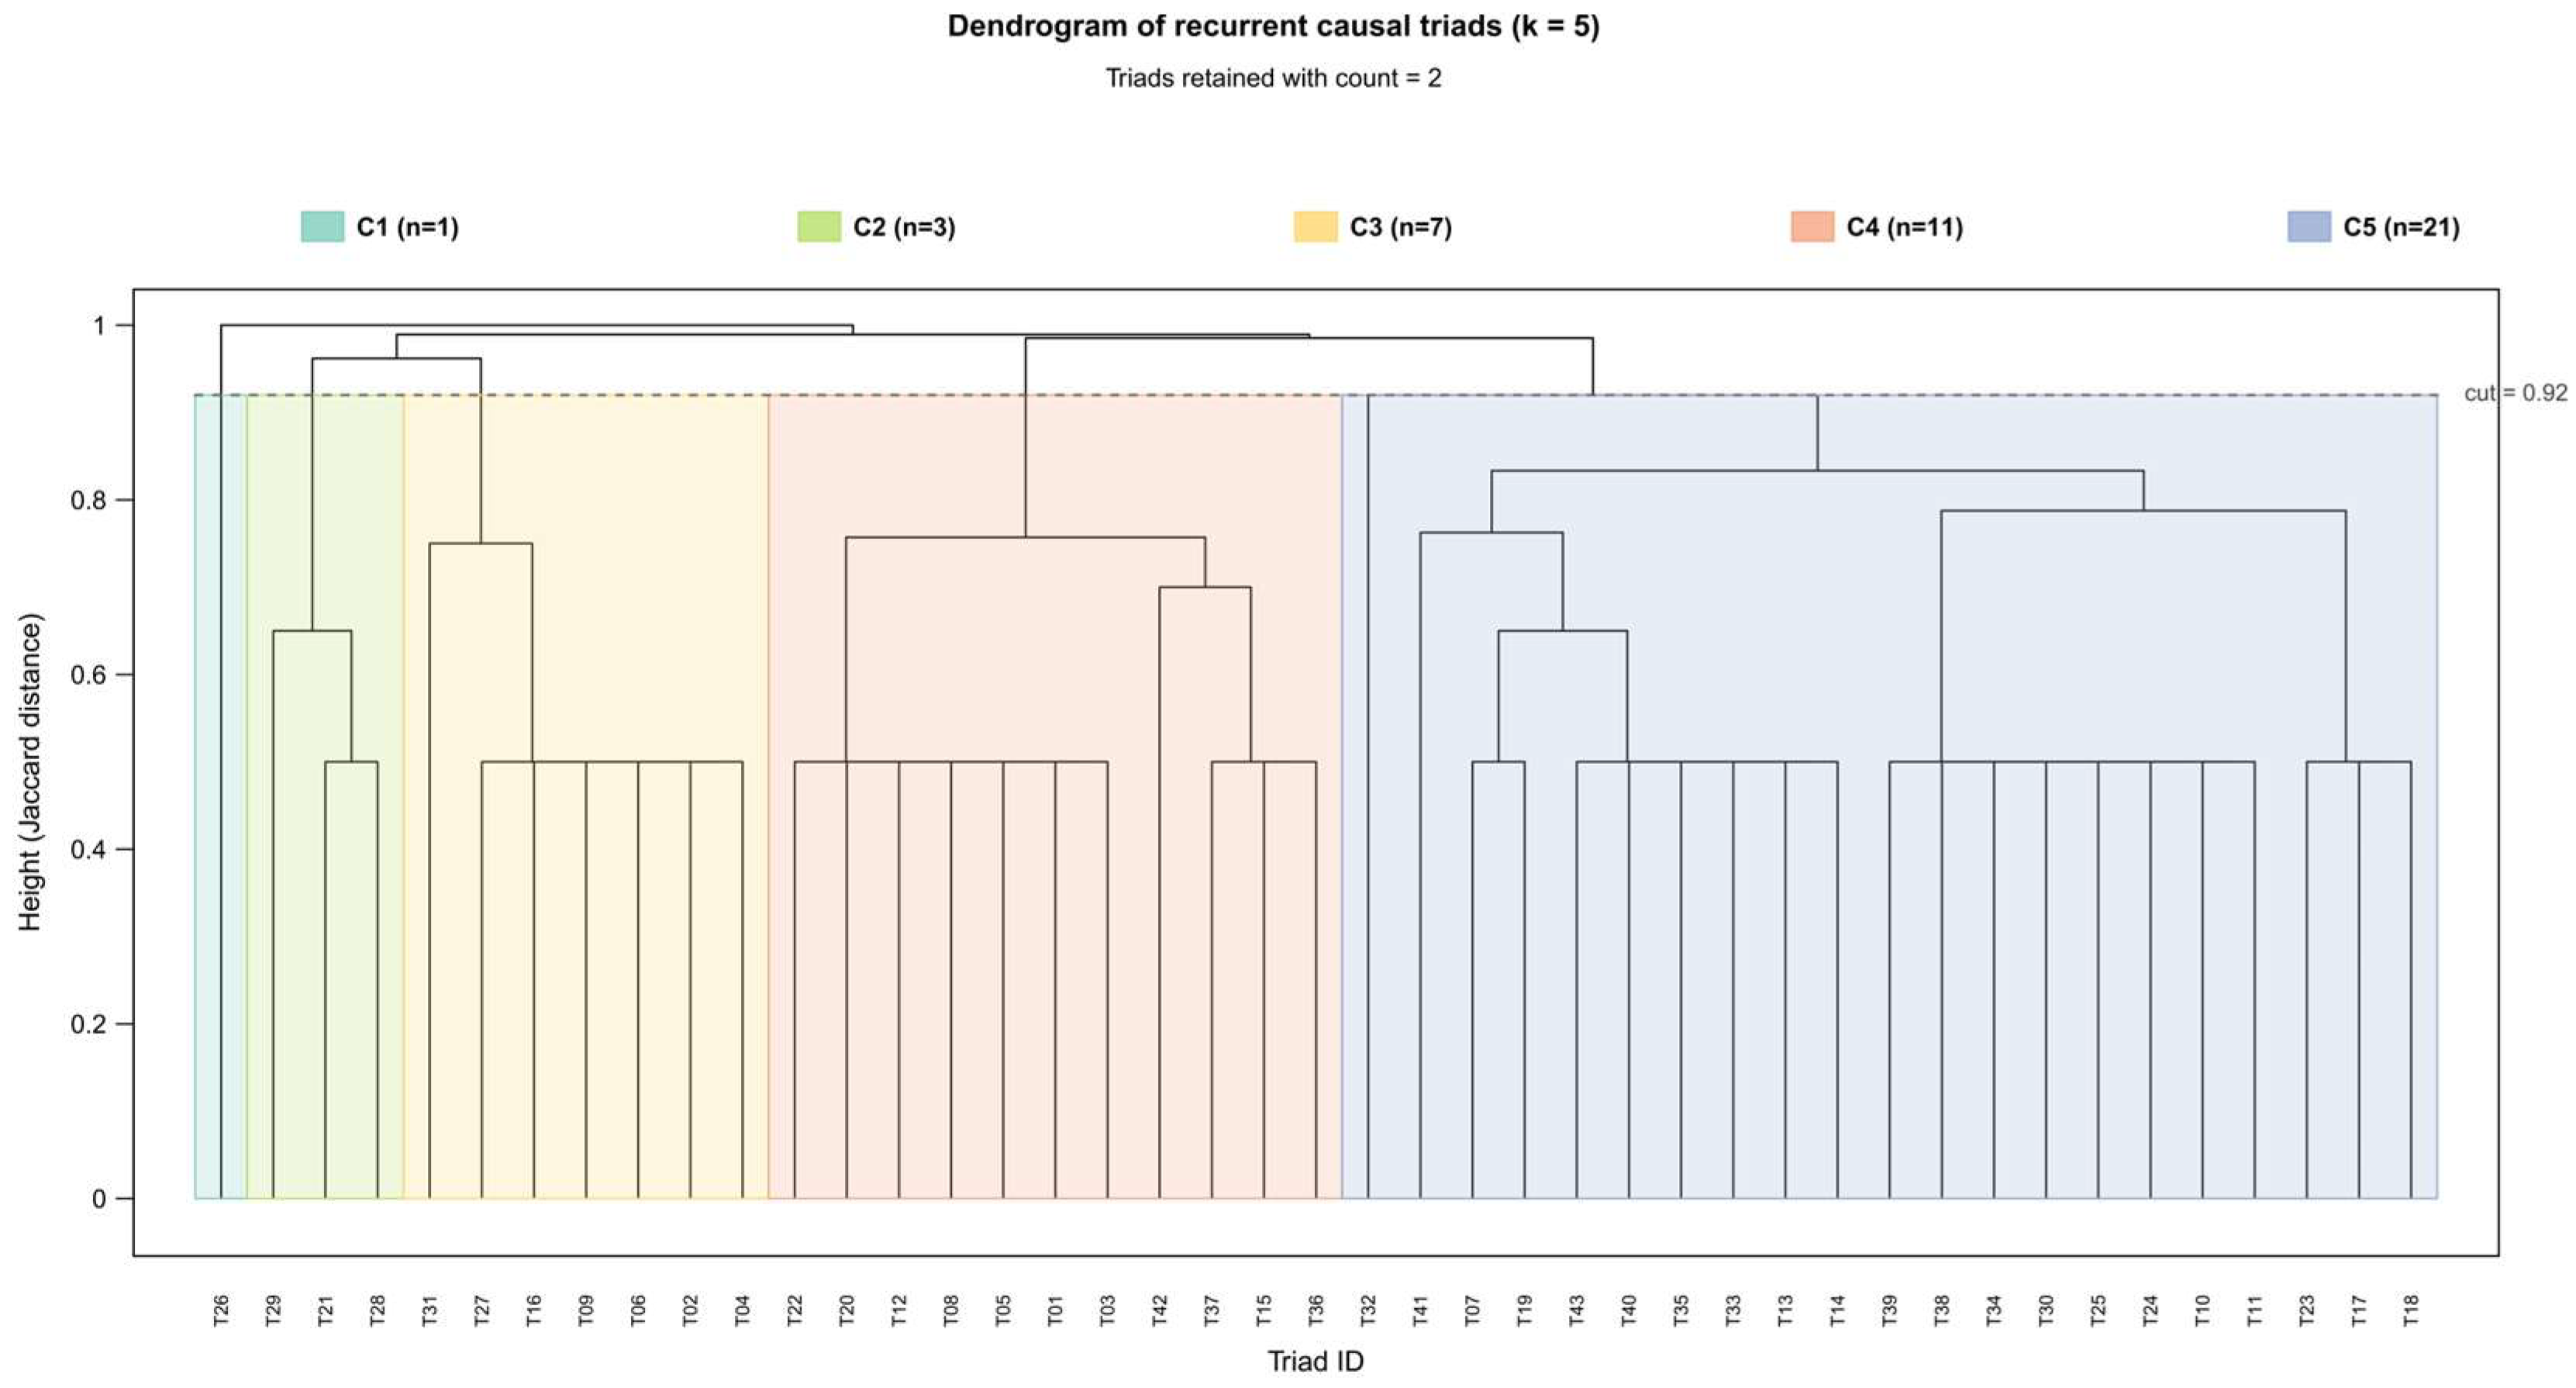
This section examines the recurrent CF-DT-CT triads identified in the reviewed literature in order to highlight broader causal groupings beyond the frequency-based distributions. These recurrent configurations are illustrated in
Figure 15.
The five-cluster solution identified five recurrent groups of CF-DT-CT triads that differed in both size and thematic coherence. One small isolated cluster included a single recurrent pathway linking habitat disturbance with biological resource use and management and beneficial insect species. A second, relatively small cluster grouped biodiversity-related disturbance configurations, connecting land-use pressure and distance from sources, and management- or disturbance-related factors to conservation of genetic diversity and conservation targets.
Three larger clusters accounted for most of the retained triads. The first of these was centred on urban heat island (UHI) as the dominant direct threat and was mainly associated with urban thermal comfort as the affected conservation target. This cluster included recurrent triads linking thermal and surface properties, architectural features, vegetation cover and composition, land-use pressure, weather, and impervious surface coverage to heat-related impacts. A second large cluster was structured around airborne pollutants, with air quality as the dominant target. Within this group, the most recurrent contributing factors included weather, traffic-related emissions, transport infrastructure, energy production, and vegetation-related conditions, with some extensions to health outcomes. The largest cluster was more heterogeneous and mainly grouped triads related to persistent pollutants and other contamination-related threats, linking runoff, waste, soil, wastewater, water management, and related factors to impacts on soil structure and fertility and water quality, with some additional links to health.
As visible in the dendrogram structure (
Figure 15), recurrent triads were not distributed evenly across the literature but were concentrated around a limited number of broader causal groupings. In particular, heat-related and air-pollution-related configurations were more compact and internally coherent, whereas contamination-related pathways formed a broader and more heterogeneous cluster. Biodiversity-related pathways were retained as a smaller separate grouping, while one pathway remained isolated from the broader structure.
4. Discussion
The quantitative patterns emerging from this review highlight how conservation-relevant elements are addressed in the literature on urban squares, allowing the identification of recurring emphases and underrepresented dimensions within the screened evidence base and their potential relevance for conservation-oriented urban planning and nature-based solutions.
Following the analytical structure of the Open Standards framework, the discussion examines conservation objectives, direct threats, contributing factors, and conservation actions, focusing on what these distributions reveal about how urban squares are currently framed as socio-ecological systems and which dimensions remain under-represented. The interpretive value and limitations of the cross-case conceptual synthesis, together with the exploratory contribution of the triad-based clustering, are also discussed.
4.1. Conservation Targets: Patterns and Gaps
In the literature reviewed (
Figure 10), conservation targets are primarily focused on health, air quality, and water quality, which together represent the most frequently reported objectives across the screened studies. These targets largely correspond to regulating services and human-centred outcomes, suggesting that urban squares are predominantly framed in the literature as spaces where environmental quality is assessed through its direct implications for human well-being [
4,
13,
34].
In contrast, targets such as microbial and soil biodiversity, aquatic biodiversity, and preservation of historical landscapes appear only sporadically in the reviewed literature, despite growing evidence on the relevance of soil-related functions and carbon storage in urban ecosystems more broadly [
43]. Other biologically specific targets, including beneficial insect species and avian biodiversity, are also reported infrequently. This uneven distribution indicates that, within square-focused research, several ecological and cultural dimensions are rarely articulated as explicit conservation objectives, despite their recognised relevance in urban socio-ecological systems [
36,
44]. One contributing explanation is that below-ground and microbial components of urban ecosystems are less frequently operationalised due to methodological constraints and the absence of standardised indicators, which limits their inclusion as explicit targets in applied urban studies [
45]. These limitations may partly explain the low frequency of such targets in the screened literature, although they may also reflect broader research priorities that favour more readily measurable and policy-visible outcomes.
Taken together, the distribution of conservation targets shown in
Figure 10 indicates that current square-focused research places much greater emphasis on targets related to health, air quality and water quality, while offering more limited and fragmented coverage of biodiversity-related target categories (e.g., avian, insect, aquatic biodiversity) and of historical landscape preservation. This asymmetry provides an essential backdrop for interpreting the direct threats highlighted in the following section and points to an underrepresented area within the screened literature on biodiversity-related and cultural Conservation Targets.
4.2. Assessment of Direct Threats
Direct threats identified in the reviewed literature are summarised in
Figure 11. Overall, the distribution of reported threats is highly uneven, with a small number of categories accounting for a large share of the occurrences across the final sample.
Pollution-related pressures constitute the most frequently identified direct threats within urban squares. Among these, airborne and persistent pollutants predominate, reflecting their extensively documented ecological and health impacts as well as their systematic monitoring through established protocols [
46,
47]. Empirical evidence further underscores the persistence and cumulative effects of long-lived contaminants within urban environments, reinforcing their salience in the reviewed literature [
48,
49]. Beyond pollution, natural system management and modifications and urban heat island (UHI) also emerge as highly recurrent direct threats. These categories highlight the role of urban form, surface sealing and land-cover composition in shaping environmental conditions within urban squares. In particular, UHI is increasingly recognised as a direct and measurable pressure affecting human comfort and ecosystem functioning in urban open spaces [
18,
20,
50].
All remaining threat categories, including waterborne and other effluent pollution, noise and light pollution, invasive and problematic species, and climate-related pressures such as changes in temperature regimes and changes in precipitation and hydrological regimes, as well as pressures related to recreational activities, appear with markedly lower frequencies. Their limited representation likely reflects context-specific dynamics and methodological challenges in capturing diffuse or long-term impacts, rather than indicating a lower relevance of these threats in urban environments [
51,
52]. This pattern is particularly evident for water-related dynamics, where water quality is frequently reported as a conservation target, while waterborne and other effluent pollution is less often identified as a direct threat.
Taken together, the distribution presented in
Figure 11 reveals a strong concentration of research on a limited subset of direct threats, primarily those that are readily quantifiable and aligned with regulatory monitoring frameworks. This focus leaves other pressures comparatively underexplored and reinforces the need to examine the contributing factors that condition the emergence and persistence of these threats, as discussed in the following section.
4.3. Contributing Factors and Their Role in Shaping Threats
Figure 12 shows that climatic and meteorological conditions constitute the most frequently reported contributing factors cluster in the screened literature. This reflects the recurrent framing of weather-related variability as an upstream condition influencing multiple pressure pathways in urban environments, particularly those associated with air quality dynamics and thermal comfort [
20,
53].
Vegetation coverage and composition emerge as a second key contributing factor, consistently discussed in relation to microclimate regulation, pollutant dispersion and habitat provision within highly sealed urban contexts [
6,
18]. Land-use change and population-related pressures play a similar role, often described as conditioning surface sealing, altered thermal regimes and habitat fragmentation across different urban settings [
19,
36].
By contrast, a long tail of contributing factors is reported only sporadically, typically because these drivers are highly context-dependent or embedded within broader causal chains rather than treated as standalone processes. Overall, the distribution suggests that the literature repeatedly relies on a limited set of systemic contributing factors to explain the occurrence and persistence of multiple direct threats (
Figure 12 and
Supplementary Material S2), while more specific or indirect drivers receive comparatively limited attention.
From a conservation-oriented planning perspective, this pattern has direct implications for the types of interventions discussed in the literature. If a small number of recurring contributing factors are repeatedly framed as upstream drivers of multiple direct threats, conservation actions are likely to concentrate on measures that are compatible with these dominant framings. The following section, therefore, examines whether the distribution of reported conservation actions reflects a corresponding focus on policy-oriented and monitoring-based responses, or whether actions targeting upstream drivers and indirect pathways are equally represented.
4.4. Conservation Actions: Patterns and Emphases in the Literature
Figure 13 summarises the conservation actions reported in the reviewed literature to address the direct threats affecting urban squares. Most studies do not frame these actions as single solutions, but rather as sets of measures that can be grouped into a limited number of recurring categories.
Actions related to technologies and urban monitoring settings are reported most frequently, followed by regulatory policies and green infrastructure. These categories reflect approaches that are already embedded in planning practice and governance processes, and that can be readily linked to existing regulatory frameworks and monitoring requirements. Their prominence is consistent with the alignment of these measures with standardised assessment procedures and policy-driven research agendas.
Other categories, including light pollution control and smart illumination, stormwater and debris adaptive management, ground covering strategies, forest management and solar thermal storage and release, appear far less often. These actions are typically discussed in a small number of studies, often with a strong focus on specific contexts or experimental settings. Differences in technical complexity, implementation costs and institutional uptake likely contribute to their limited representation.
Studies addressing light pollution control and smart illumination, for instance, tend to prioritise the analysis of ecological impacts, while concrete mitigation strategies are addressed less consistently [
54]. Similarly, ground covering strategies and solar thermal storage and release are mainly explored through modelling exercises or individual case studies aimed at understanding urban thermal dynamics, particularly in more recent contributions [
50,
55]. Although these approaches show promising results, they remain unevenly integrated into the broader body of literature.
Taken together, the distribution of conservation actions depicted in
Figure 13 points to a strong reliance on established, policy-compatible measures. This pattern also helps clarify the role of NbSs within the reviewed literature. Rather than emerging as a separate analytical domain, NbS-related interventions are mainly reflected in action categories such as green infrastructure and, more indirectly, in design- and management-oriented measures that seek to regulate heat, improve air and water-related conditions, and enhance ecological functioning in urban squares. In this sense, the literature suggests that NbSs are most often operationalised through measures intended to mitigate recurrent direct threats by acting on underlying ecological and spatial processes, rather than through an explicitly conservation-labelled vocabulary. At the same time, actions addressing upstream drivers or indirect pathways remain less frequently discussed, which narrows the range of evidence available for addressing interacting threats and contributing factors in urban squares.
These patterns also underline the policy relevance of the reviewed literature, as the most recurrent action categories align closely with urban planning tools and municipal governance instruments commonly mobilised for climate adaptation, urban biodiversity enhancement and broader sustainability agendas, including the SDGs.
4.5. Cross-Case Conceptual Synthesis and Recurrent Causal Configurations
Figure 14 is intended to complement the frequency histograms by showing how high-frequency elements are typically linked within the screened literature. Read in this way, the diagram highlights a small set of recurrent pathways through which contributing factors are framed as shaping major threat categories, which in turn connect to predominantly human-centred targets.
Two patterns stand out. First, broad contributing factor clusters (e.g., climatic/meteorological conditions, urban structure and morphology, and human behaviour) are repeatedly described as upstream drivers that feed into multiple threat pathways, suggesting that the literature often frames pressures on urban squares as multi-causal rather than attributable to single isolated stressors. Second, dominant direct threat categories, particularly pollution and natural system management and modification, appear as central hubs connecting to several target domains, indicating that these pressures act as common explanatory anchors across otherwise heterogeneous case studies.
Importantly, the diagram should be read as a synthesis of relationships reported by the reviewed studies, not as evidence of causal strength. Its main value lies in making these recurrent narrative linkages explicit, thereby helping identify where the literature is comparatively thin (e.g., peripheral threats and less frequently connected targets) and where place-based validation would be most informative for conservation-oriented planning and nature-based solutions.
Accordingly, conservation actions are not incorporated into the cross-case conceptual synthesis, as the reviewed literature rarely reports explicit and transferable linkages between specific direct threats and actions at a level suitable for robust cross-case synthesis, and their inclusion would have required ex-post inference.
To complement the cross-case conceptual synthesis shown in
Figure 14, the recurrent CF-DT-CT triads were further examined as complete causal configurations. As illustrated in the dendrogram (
Figure 15), the five-cluster solution was retained as the most interpretable partition because it preserved meaningful thematic separation without introducing the additional fragmentation observed in the six-cluster solution, while the four-cluster solution collapsed a smaller biodiversity-related grouping into a broader degradation cluster. Read in combination with
Figure 14, this exploratory grouping suggests that the literature on urban squares is not structured around a random combination of isolated factors, but around a limited number of recurrent causal patterns.
Consistent with the cluster structure shown in
Figure 15, the most coherent and recurrent groupings were those related to UHI-mediated thermal discomfort and air pollution exposure, in which different contributing factors repeatedly converged on the same dominant direct threats and on largely human-centred conservation targets. By contrast, biodiversity-related pathways remained less recurrent and more weakly consolidated, while contamination-related pathways formed a broader but more internally heterogeneous grouping. This uneven structure is itself informative, as it suggests that the literature has so far developed a more consistent representation of heat- and air-quality-related pressures than of biodiversity-sensitive dynamics. In this sense, the triad-based grouping does not provide evidence of causal strength but offers an additional exploratory layer for interpreting how recurrent pathways are structured across the reviewed literature.
Beyond their value as cross-case interpretive tools, these results also help clarify the applicability of the CS analytical lens in urban contexts. In the present review, its main strength lies in providing a transparent and consistent structure for distinguishing conservation targets, direct threats, contributing factors and conservation actions across a fragmented and heterogeneous body of literature. This makes it particularly useful for identifying recurrent pressures, dominant response patterns and underrepresented dimensions in research on urban squares. At the same time, the review also highlights some limits of this analytical structure when applied to highly managed, multifunctional and socially contested urban spaces. In such contexts, ecological functions, social uses, symbolic meanings and governance choices often overlap, making the distinction between targets, drivers and responses less stable than in more conventional conservation settings. For this reason, CS is interpreted here primarily as an analytical framework used to structure the review, rather than as a sufficient standalone representation of urban socio-ecological complexity.
4.6. Limitations
This scoping review is subject to several limitations that should be considered when interpreting its findings.
First, the literature on urban squares does not consistently adopt the terminology or conceptual structure of the CS framework. As a result, the assignment of concepts to conservation targets, direct threats and contributing factors required interpretative judgement, which may have introduced some degree of classification uncertainty despite transparent documentation in the
Supplementary Material S2. Moreover, the use of CS-derived categories in urban contexts also has limits. In highly managed, multifunctional and socially contested spaces such as urban squares, the distinction between ecological targets, social values, drivers and governance responses may be less clear-cut than in more conventional conservation settings.
Second, the aggregation of heterogeneous terms into macro-categories, while necessary to enable comparison across studies, may have influenced the relative prominence of specific elements in the frequency-based results and visual syntheses.
Third, screening and full-text coding were conducted by a single reviewer. Although this approach is common in exploratory scoping reviews, it may introduce subjectivity; future studies would benefit from multi-reviewer coding and formal inter-coder reliability procedures.
Fourth, the original search strategy prioritised specificity by restricting retrieval to the abstract field, which may have reduced sensitivity for studies in urban design, planning or architecture that discuss square-related dynamics without foregrounding them in the abstract. An additional post hoc sensitivity check using expanded search fields in Scopus and Web of Science increased the number of retrieved records but yielded only a very limited number of borderline candidates at the eligibility stage, none of which was retained under the pre-specified inclusion criterion. This suggests that the original strategy may have narrowed retrieval, while having a limited impact on the final interpretive patterns of the review.
Fifth, the review protocol was not prospectively registered, and no formal appraisal of study quality was undertaken, in line with the aims of a scoping review.
Consequently, the findings should be interpreted as a synthesis of how conservation-relevant issues are represented in the literature, rather than as a graded assessment of evidentiary strength or methodological robustness across studies.
In addition, the review relied on an operational search-based definition of “urban square” rather than on a universally accepted typology. While this choice allowed the inclusion of heterogeneous but relevant square-like public spaces, it may also have introduced some boundary ambiguity at the interface with adjacent categories such as plazas, civic open spaces and other intensively used public urban spaces.
Finally, the conceptual diagram presented here reflects relationships reported across the reviewed literature rather than a place-based CS situation model. It should therefore be interpreted as a heuristic tool to support interpretation and hypothesis generation, rather than as evidence of causal strength.
5. Conclusions
This scoping review applied the Open Standards for the Practice of Conservation as an analytical lens to synthesise how the peer-reviewed literature frames urban squares in terms of conservation targets, direct threats, contributing factors and conservation actions. Using CS-derived categories as an analytical structure for synthesis, the review provides a structured account of how conservation-relevant dynamics are represented in the literature on urban squares and illustrates their interpretive value in a scoping-review context. Across the 69 included studies, the evidence base is strongly skewed towards human-centred and policy-visible dimensions, particularly health, air quality and water quality, while biodiversity-related targets and cultural–heritage dimensions remain comparatively underrepresented.
A similar imbalance emerges for direct threats and contributing factors. Pollution-related pressures and natural system management and modification dominate the literature, whereas other threats and underlying drivers are discussed less consistently. At the same time, a limited set of systemic contributing factors, especially climatic conditions, vegetation characteristics and land-use dynamics, are repeatedly invoked to explain multiple pressure pathways affecting urban squares.
With regard to conservation actions, the reviewed literature largely emphasises monitoring technologies, regulatory instruments and green infrastructure. Actions addressing upstream drivers or indirect pathways are comparatively less explored, suggesting a narrowing of the evidentiary basis available to support integrative and context-sensitive planning interventions.
Beyond the frequency-based distributions, the cross-case conceptual synthesis and the exploratory triad-based clustering help make explicit how recurrent pathways are framed in the literature on urban squares. While these outputs do not represent causal evidence, they provide complementary interpretive tools for synthesising recurrent literature-reported relationships and may support future place-based analysis and the design of nature-based solutions.
Future research should prioritise (i) the operationalisation of underrepresented conservation targets through comparable indicators, (ii) the empirical testing and refinement of the pathways identified here through place-based applications developed with local stakeholders, and (iii) increased methodological transparency through multi-reviewer coding and clearer operational definitions of urban squares. Together, these steps may help strengthen the evidence base for more context-sensitive conservation-oriented planning in urban public spaces.




 ,
,