Article

Landscape Ecological Risk Assessment and Driving Factors During 1995–2024 in the Dianzhong Five Lakes Region of Yunnan Province, China Using the XGBoost-SHAP and Random Forest Models


School of Architecture and Urban Planning, Yunnan University, Kunming 650500, China
*
Author to whom correspondence should be addressed.
Land 2026, 15(3), 508; https://doi.org/10.3390/land15030508
Submission received: 10 January 2026 / Revised: 11 March 2026 / Accepted: 19 March 2026 / Published: 21 March 2026
(This article belongs to the Section Land Use, Impact Assessment and Sustainability)

Abstract

The assessment of landscape ecological risk and the exploration of its driving factors is a critical approach to alleviating the conflict between the growing demand of human activities and ecological environment conservation, and the Five Lakes Area in Central Yunnan serves as a typical representative of landscape ecological risk issues in plateau lake regions. Therefore, this study, based on the land use transfer change characteristics of the Five Lakes Area in Central Yunnan across four periods (1995–2024), employed the landscape pattern index method to calculate the spatiotemporal variation characteristics of the landscape ecological risk index; additionally, 10 driving factors (including natural and socio-economic factors) were selected, and the XGBoost-SHAP model and Random Forest model were applied to explore the driving factors, with the results showing that: (1) In terms of land use transfer, farmland, forest, and Grass land were transferred among each other, the inflow of Construction land increased, and Grass land had the largest outflow area; (2) regarding landscape ecological risk, the landscape pattern was unstable, the loss degree increased, and the moderate and moderately high-risk areas expanded; and (3) for driving factors, the dominance shifted from natural factors to socio-economic factors; among these, Precipitation, NDVI (Normalized Difference Vegetation Index), Land use intensity, and Night-time light index were significant influencing factors. Based on the above results, a zoning management and control strategy for landscape ecological risk was proposed, aiming to provide a scientific reference for policy formulation to reduce risks and alleviate human–land conflicts.

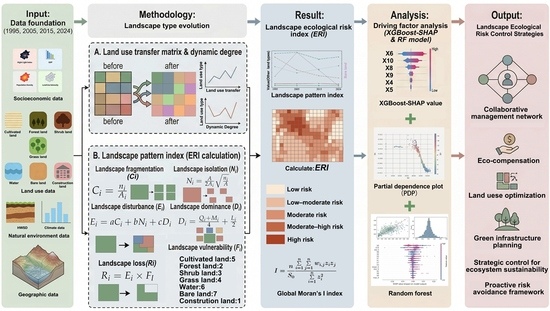
Graphical Abstract

1. Introduction

With the acceleration of global urbanization and the intensification of land use change, issues such as landscape fragmentation and the degradation of ecosystem services have become increasingly prominent, and landscape ecological risk has emerged as a research hotspot in fields including ecology, geography, and territorial spatial planning [1]. Plateau freshwater lakes are vital natural resources that provide a protective barrier for ecological security and biodiversity [2]. Given the high sensitivity and vulnerability of lake ecosystems, which pose great challenges to governance, the rapid growth of economic scale and population in the basin has posed severe threats to lake ecosystems, and how to alleviate the conflict between the growing demand of human activities and the protection of the ecological environment has become a practical issue that needs to be addressed [3]. Data released by the Yunnan Provincial Department of Water Resources and the Department of Ecology and Environment shows that three of the five lakes in the Central Yunnan Five Lakes Area have long remained at Class IV or below water quality, with only Fuxian Lake and Lugu Lake meeting the environmental requirements; over the past 30 years, the area occupied by urban development within the 3 km landward buffer zone of Dianchi Lake’s shoreline has accounted for 53.63%; a total of 42 development plots (covering 164.2 hectares, equivalent to 2463 mu) have been constructed in the Caohai area of Dianchi Lake, and the 25 km lakeside zone around Caohai has been encroached upon by real estate and other projects. By 2024, the Five Lakes Area in Central Yunnan has become an engine for Yunnan Province’s economic development, with a permanent population urbanization rate of approximately 78%. Rapid economic growth and urbanization have led to high development intensity in the region, resulting in intensified ecological environment pressure that threatens biodiversity and constrains regional green development [4]. As a typical plateau lake region in southwest China, the Five Lakes Area of central Yunnan is not only a core economic growth pole of Yunnan Province, but also an important ecological barrier in the upper reaches of the Pearl River (Pearl River Basin Comprehensive Plan 2012–2030). Its ecological security is closely related to regional biodiversity conservation, water resource regulation and urban sustainable development, making it a key area for studying landscape ecological risks in plateau lake ecosystems.
Landscape ecological risk assessment aims to identify the adverse ecological effects that may arise from potential stressors, with a focus on the relationship between landscape pattern and ecological processes [5,6,7]. In terms of research ideas, the mainstream framework follows the logic of “Landscape type evolution–Landscape ecological risk assessment–Driving factor analysis [8,9,10]”. Among them, landscape type evolution is mostly based on changes in land use types [11], and is characterized by calculating the land use transfer matrix and land use dynamic degree. For landscape ecological risk assessment, the landscape pattern index method is the most widely applied [12,13]; this method can not only quantitatively describe the landscape structure, but can also elucidate the evolutionary mechanism of landscape ecological risk from the perspective of spatial pattern changes [14,15], serving as an important tool to explore the variation characteristics of landscape ecological risk [16,17]. Driving factor analysis is conducted to identify the causes of changes in landscape ecological risk, which provides important theoretical support for the formulation of risk management and control strategies [18], and also represents a cutting-edge topic for methodological innovation in recent years.
In the research on driving factors, traditional models including Partial Least Squares–Structural Equation Modeling (PLS-SEM), Ordinary Least Squares (OLSs) and Geographically Weighted Regression (GWR) have been widely applied [19,20,21,22,23,24,25], yet there is room for further development: It is difficult to accurately reveal the complex high-dimensional and non-linear action mechanisms among driving factors by virtue of traditional statistical and spatial analysis methods [26]. As a plateau lake agglomeration and the core of the Central Yunnan Urban Agglomeration, the study area has significant spatiotemporal heterogeneity in the driving factors of landscape ecological risk, with the limitations of traditional methods reflected in three aspects. First, the landscape pattern is a complex system formed by the interaction of natural and human activities, and the correlations among various factors show strong non-linearity and interdependence, but traditional methods based on linear assumptions cannot depict such complex dynamic relationships [27]. Second, the analysis of driving factors over a long time series requires massive, high-dimensional and multi-scale data, and traditional methods have bottlenecks in computational efficiency and feature extraction during data processing, failing to fully explore the inherent laws of data [28]. Third, insufficient exploration of the interactive and threshold effects of driving factors restricts the targeting and scientificity risk management and control strategies [29]. However, machine learning methods provide a new approach to solve the above problems due to their advantages in strong non-linear fitting, high-dimensional data processing and anti-overfitting [27]. In existing studies on driving factors, the XGBoost-SHAP model outperforms traditional models [30,31,32,33], while the Random Forest model has strong robustness and interpretability, which can effectively identify the interactive effects of driving factors [34].
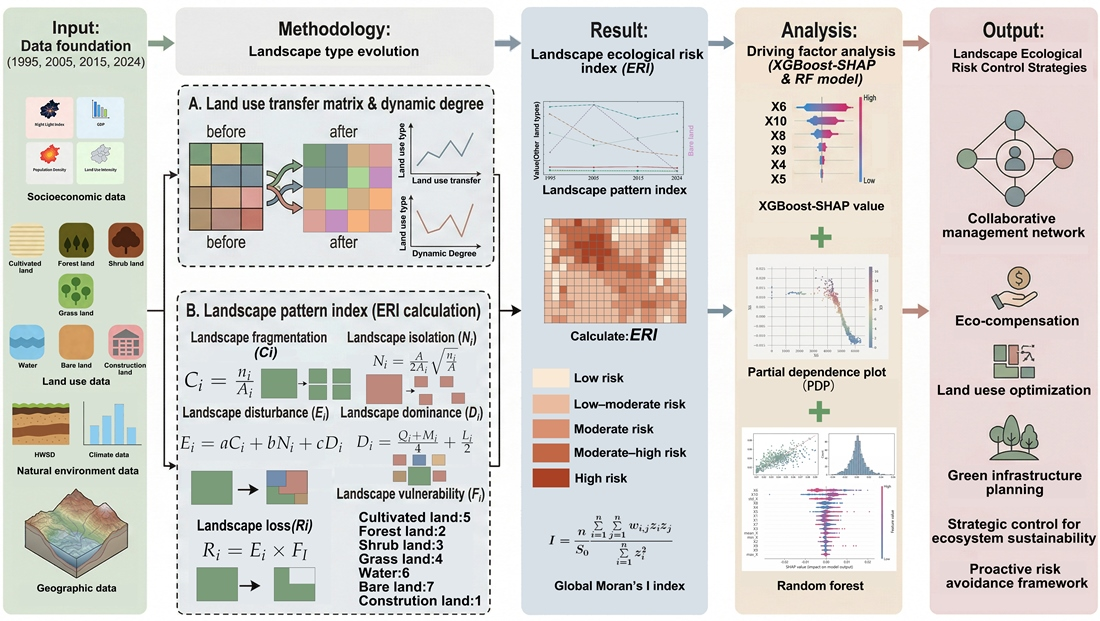
Through a comprehensive literature review, we find that existing studies have neither developed targeted applications of interpretable machine learning methods in this study area nor accurately revealed the dynamic non-linear interaction mechanisms of landscape ecological risk driving factors and the transformation laws of dominant factors in the specific Dianzhong Five Lakes Region [35,36,37]. Accordingly, based on the research framework of “landscape type evolution–landscape ecological risk assessment–variation characteristics of risk index–driving factor analysis–formulation of risk management and control strategies”, this study carries out research at the grid scale with the time series of 1995, 2005, 2015 and 2024. It adopts a combination of methods including land use transfer matrix, dynamic degree analysis, Fragstats software, landscape pattern index method, XGBoost-SHAP and Random Forest model for calculation and analysis. On this basis, it proposes problem-oriented and goal-constrained risk management and control strategies, aiming to provide decision support for the territorial spatial ecological governance of the region.

2. Materials and Methods

2.1. Study Area

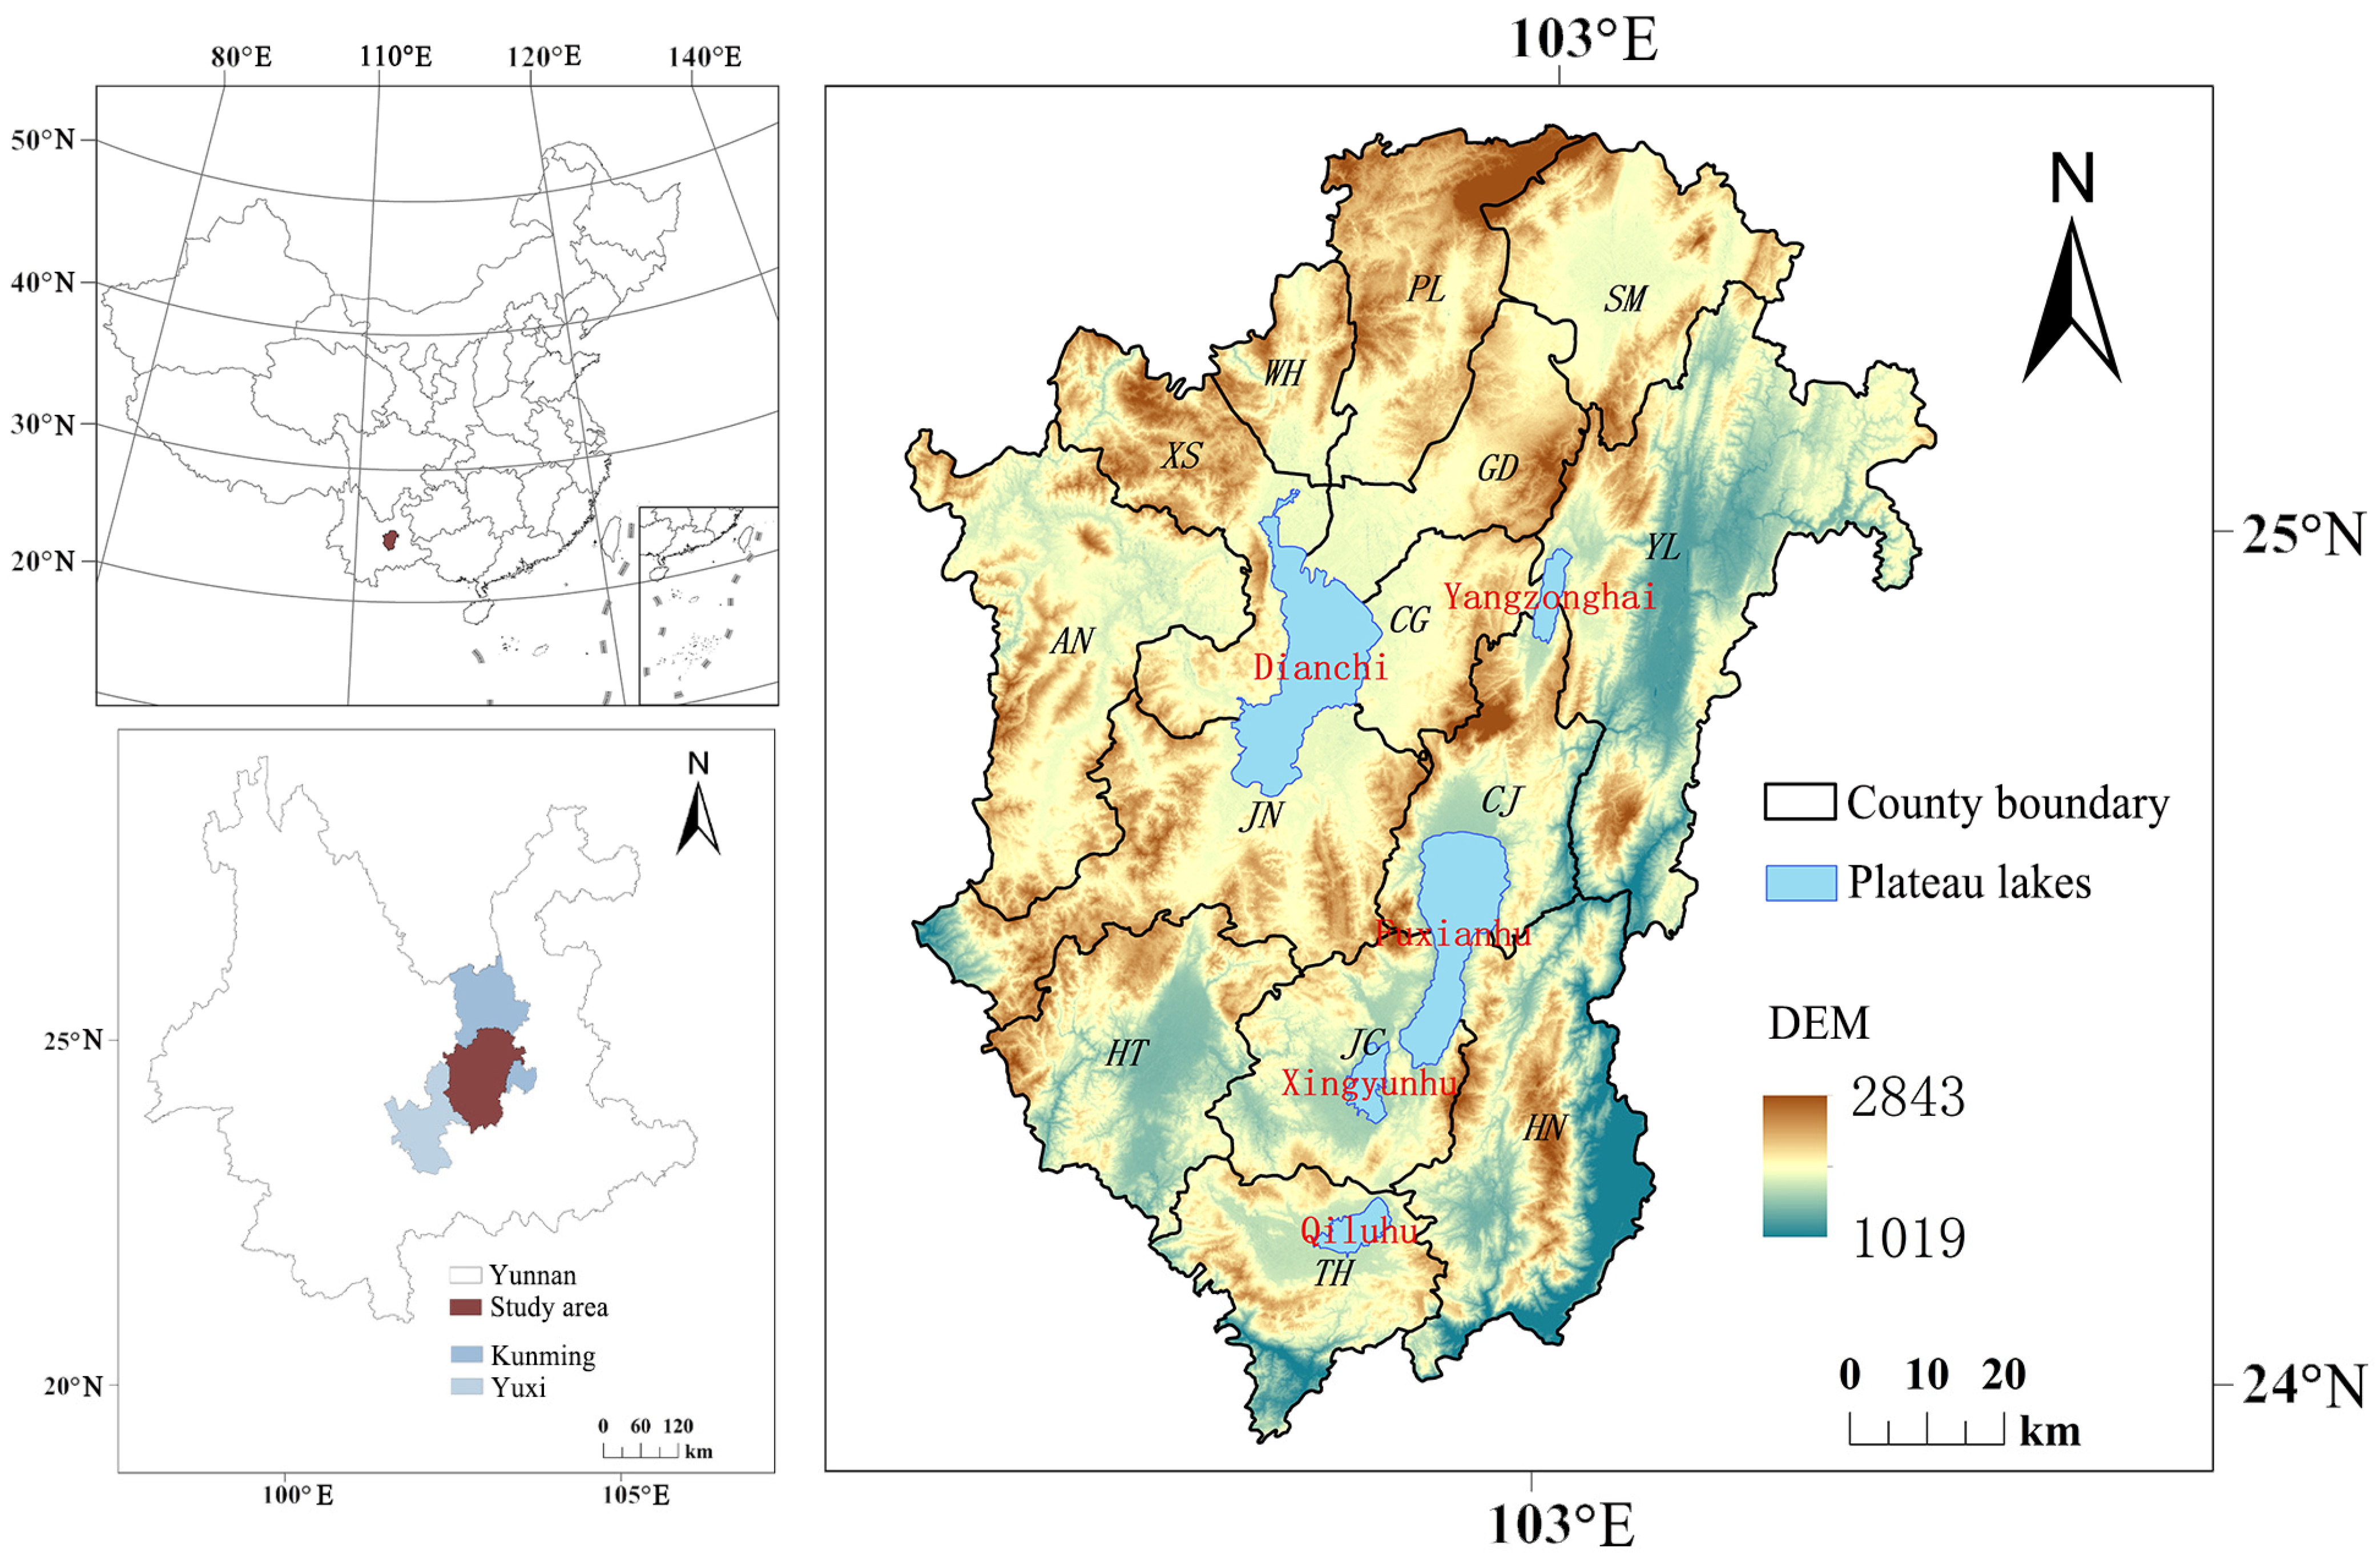
This study includes 14 districts (counties) around the Five Lakes Area in central Yunnan, covering parts of Kunming City and Yuxi City (Figure 1). Among them, Hongta District (HT), Jiangchuan District (JC), Tonghai County (TH), Chengjiang City (CJ), and Huaning County (HN) belong to Yuxi City; Wuhua District (WH), Panlong District (PL), Chenggong District (CG), Xishan District (XS), Yiliang County (YL), Guandu District (GD), Anning City (AN), Jinning District (JN), and Songming County (SM) belong to Kunming City. The five lakes refer to Dianchi Lake, Yangzong Lake, Qilu Lake, Fuxian Lake, and Xingyun Lake, with a total area of approximately 13,083 km2, accounting for about 3.41% of Yunnan Province’s total area. According to the Statistical Bulletin on National Economy of Kunming City and Yuxi City, and the Statistical Yearbook of Yunnan Province, by 2024, the total population of this region was approximately 10.15 million, accounting for about 20.97% of Yunnan Province’s total population, and the total regional GDP was approximately 1.06 trillion yuan, accounting for about 30.29% of Yunnan Province’s GDP. The study area boasts superior climate, high-quality environment, abundant mineral resources, high economic value, and a wide variety of biological resources, making it a region with relatively superior comprehensive physical geographical conditions and resource endowments in the province. Therefore, selecting the plateau lake area in central Yunnan as the research site can reflect the problem orientation and systematic concept of the study.

2.2. Data Sources

This study incorporates land use data, basic geographic information data, natural environment data, and socio-economic data (Table 1). In addition, relevant planning documents and statistical data are included: Yunnan Statistical Yearbook 2024, Statistical Communiqués on the National Economy of Kunming City and Yuxi City, 14th Five-Year Plan for Ecological Environmental Protection of Yunnan Province (2022), Territorial Spatial Plan of Yunnan Province (2021–2035), and Development Plan for the Central Yunnan Urban Agglomeration (2020–2035). The above research dataset was completed in October 2025.
For data processing, land use data were subjected to reprojection, reclassification, and extraction to obtain land use change data; Elevation data were merged, reprojected, clipped, and calculated to generate Elevation and Slope raster data for the study area; NDVI data were normalized and clipped to derive NDVI data for the study area; road network vector data were merged, reprojected, intersected, converted to raster format, and extracted to obtain vector and raster data of highways and railways in the study area; meteorological data were linked, clipped, and reprojected to acquire meteorological data for the study area; and HWSD2.0 data were linked and clipped to obtain soil data for the study area. To address the spatial scale mismatch of data sources and ensure the consistency of data quality and spatial references, all datasets were unified to the Krasovsky_1940_Albers projection coordinate system and resampled to a resolution of 30 m × 30 m.

2.3. Methods

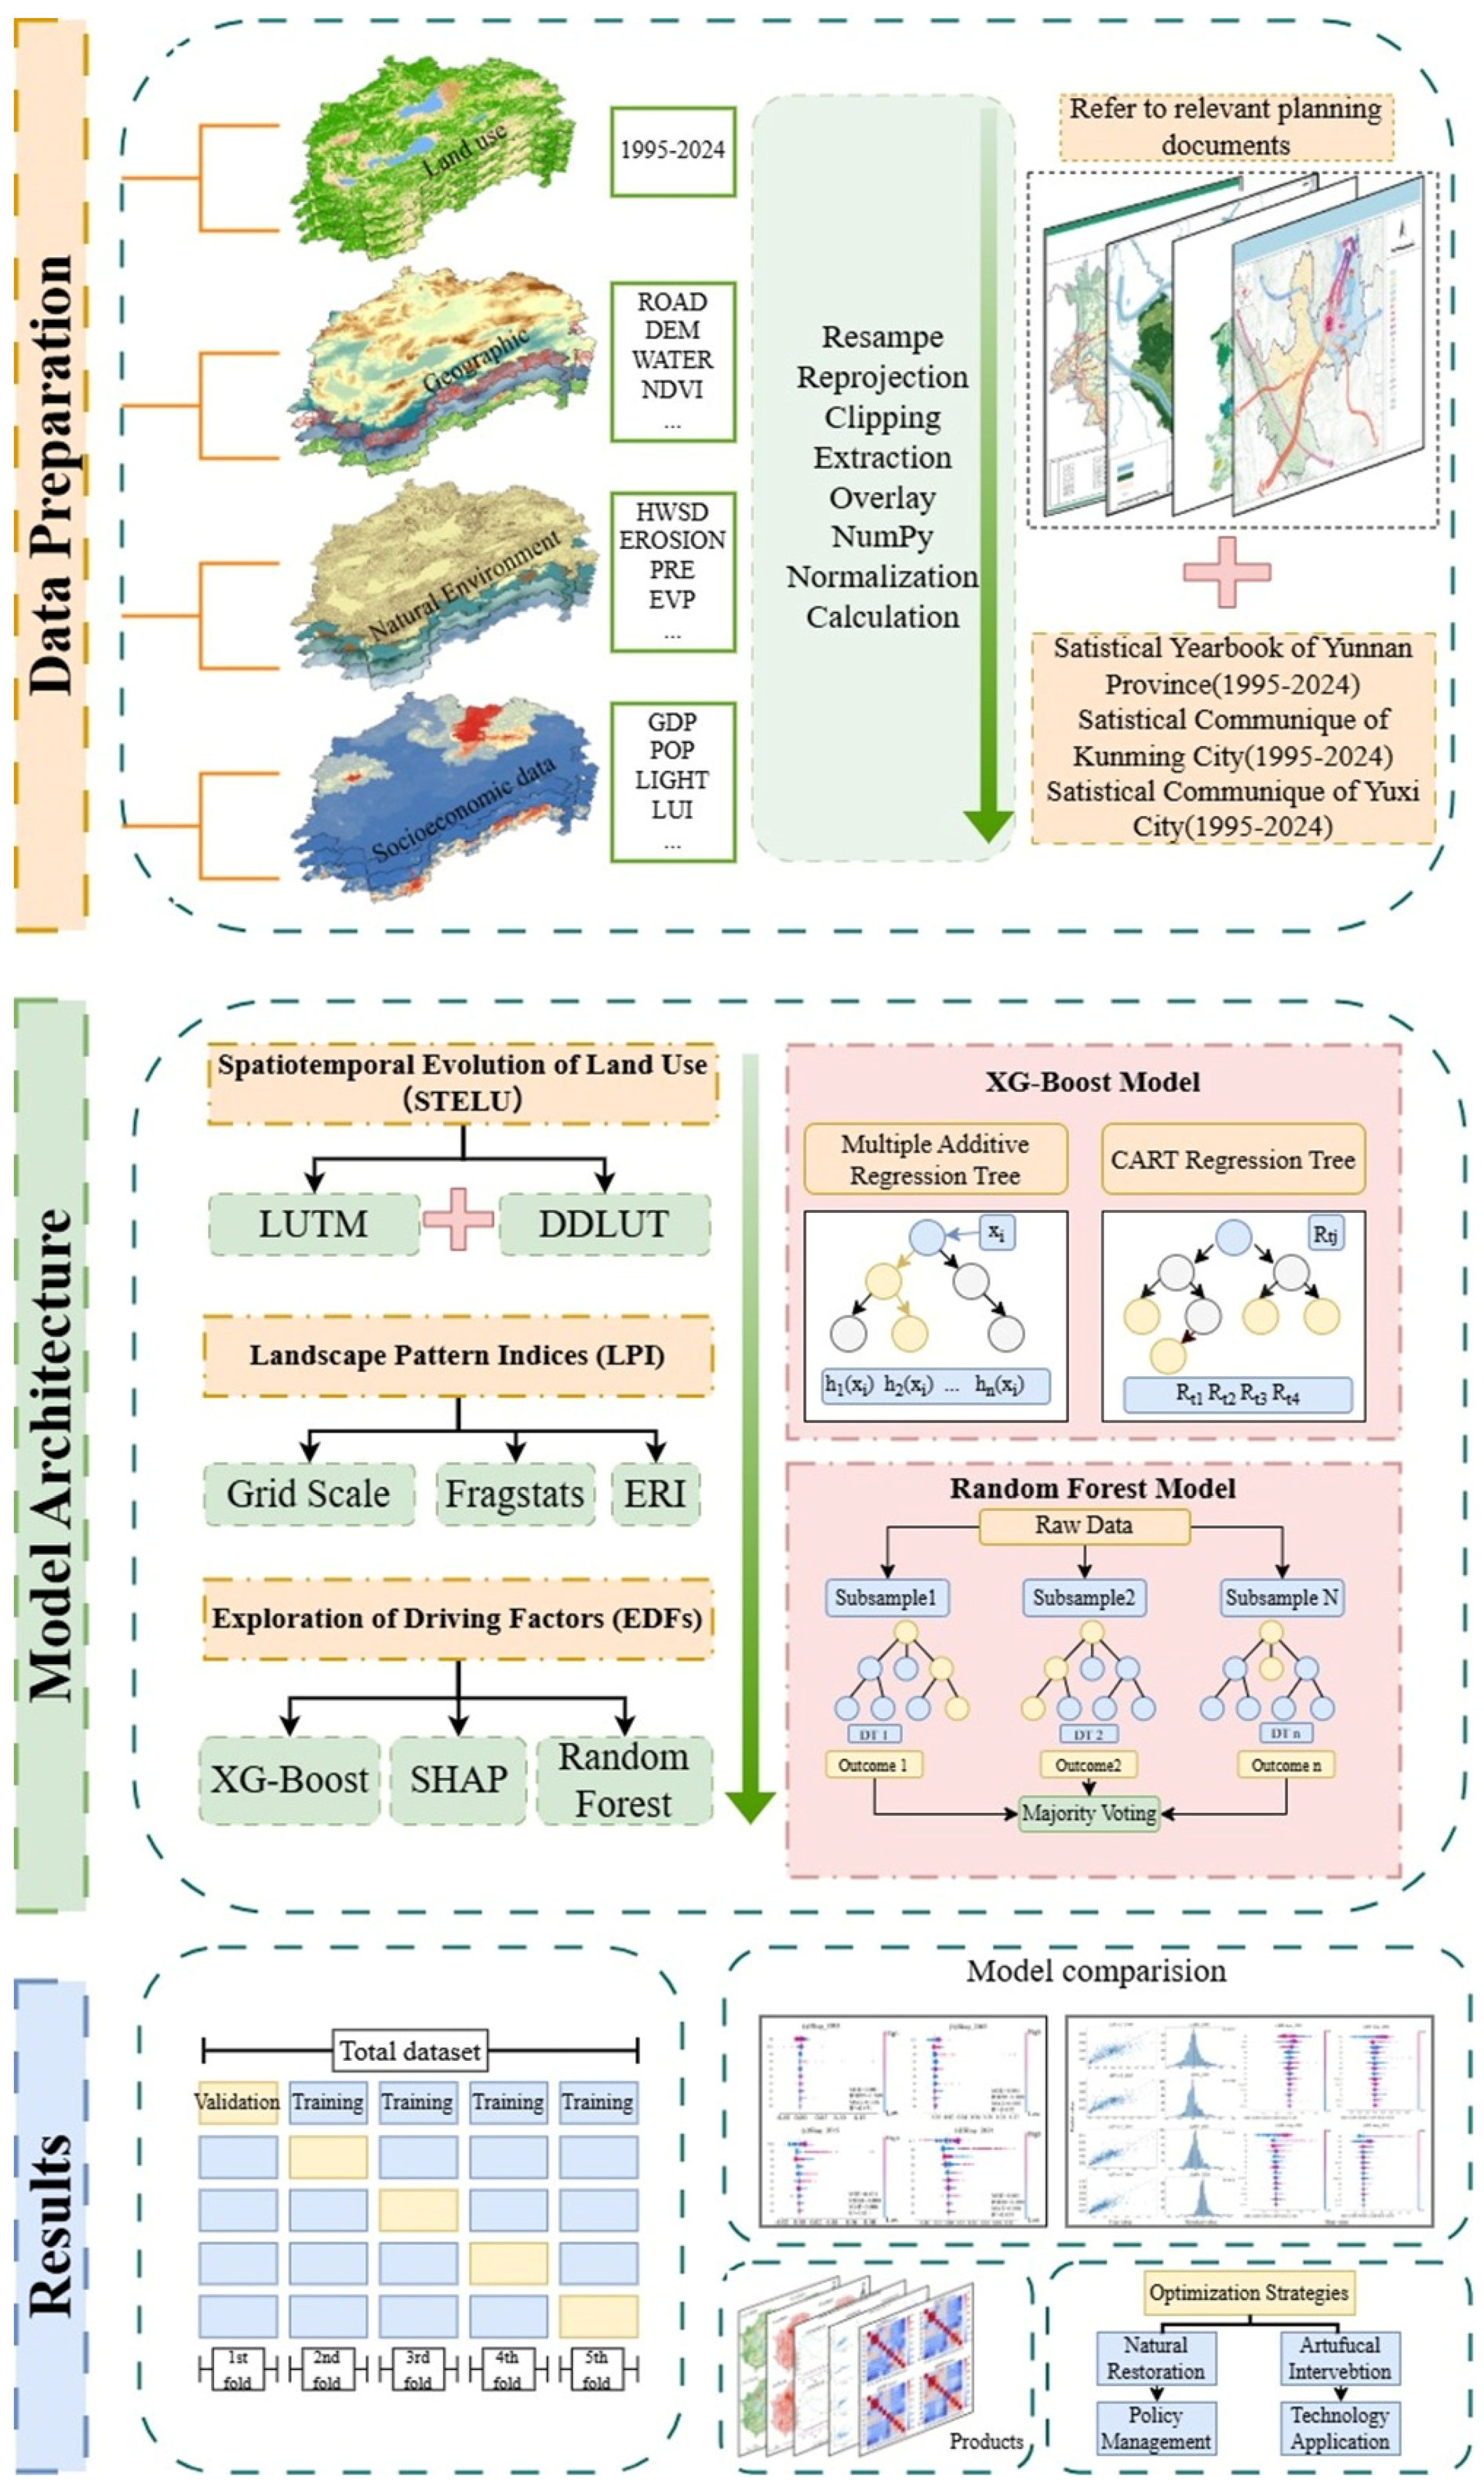
First, the spatiotemporal variation characteristics of land use in the study area from 1995 to 2024 were calculated, and the transfer area and variation rules of land use types in the study area were measured using the land use transfer matrix and land use dynamic degree. Second, the Fragstats 4.2 software was employed to calculate landscape pattern indices, including landscape fragmentation, landscape isolation, landscape dominance, landscape disturbance degree, landscape vulnerability degree, landscape loss degree, and landscape risk index. Then, the interpretable machine learning XGBoost-SHAP model and Random Forest prediction model were applied to analyze the driving factors affecting the landscape ecological risk index and their correlations. Finally, targeted strategies for the management and control of landscape ecological risk were put forward based on the analysis results, and Figure 2 illustrates the technical framework of this study (Figure 2).

2.3.1. Land Use Transfer Matrix

To reveal the characteristics and patterns of land use conversion in the Five Lakes Area in Central Yunnan, the land use transfer matrix method was used to calculate the direction and quantity of mutual conversion between the areas of different land use types [38,39]. The formula is as follows:
S i j = [ S 11 S 1 n S 21 S 2 n S n 1 S n n ]
where S denotes the area of land use type; i denotes the land use type before conversion; j denotes the land use type after conversion; S i j denotes the area converted from type i to type j ; n denotes the number of land use types, and for the convenience of calculation, n = 6 ; when i = j , it indicates that no area conversion has occurred for a certain land use type.

2.3.2. Land Use Dynamic Degree

The single land use dynamic degree (DD) can describe the quantitative change in a certain land use type within a specific time period [40]. The calculation formula is as follows:
K = U b U a U a × 1 T × 100 %
where T denotes the dynamic degree of a certain land use type during the study period; when K > 0 , it indicates an increase in the area of this land use type, and when K < 0 , it indicates a decrease in the area of this land use type. The larger the value of K , the greater the degree of change in this land use type; U a denotes the area of a certain land use type in the initial period, and U b denotes the area of the same land use type in the final period (km2); T denotes the study period.
The comprehensive land use dynamic degree (CDD) can characterize the comprehensive rate of regional land use changes. It refers to the ratio of the total change amount of all land use types in the region to the sum of twice the area of all land use types in the region, reflecting the intensity of changes in land use types. The calculation formula is as follows:
S = [ i = 1 n U i j 2 i = 1 n U i ] × 1 T × 100 %
where S denotes the comprehensive land use dynamic degree; U i denotes the area of the i t h land use type in the initial period; Δ U i j denotes the absolute value of the area of the i t h land use type converted to n o n i land use types during the study period; T denotes the study period.

2.3.3. Landscape Pattern Index Method

The landscape ecological risk index (ERI) is a quantitative result derived from the combination of various landscape pattern indices. It can quantitatively characterize the spatial distribution pattern of landscapes and reveal the relationship between landscape types and landscape ecological risks [41]. The calculation formula is shown in Table 2.
To represent the natural ability of the ecosystem where the landscape type is located to resist external disturbances and its sensitivity to changes, values were assigned based on the relevant literature and normalized [45,46], resulting in: Cultivated land: 0.17857, Forest land: 0.07143, Shrub land: 0.10714, Grass land: 0.14286, Water: 0.21429, Bare land: 0.25000, Construction land: 0.03571. Based on the landscape loss degree, the landscape ecological risk index (ERI) was calculated, and the formula is as follows:
E R I i = i = 1 N A k i A k R i
where A denotes area; k denotes the evaluation unit; i denotes the landscape type; A k denotes the area of the k t h evaluation unit; A k i denotes the area of landscape type i in the k t h evaluation unit. To ensure the accuracy and precision of the calculation results, the study area (the Five Lakes Area in Central Yunnan) was divided into 2 km × 2 km grids (a total of 3493 grids), and the landscape ecological risk index was calculated for four periods from 1995 to 2024.

2.3.4. Driving Factor Selection

The selection of driving factors comprehensively considers two dimensions—physical geography and socio-economy—and ten driving factors are chosen with reference to existing studies [47,48] (Table 3). Six core physical geography factors include Elevation, Slope, Topographic relief, Soil erosion degree, Precipitation and NDVI. Elevation, Slope and Topographic relief match the study area’s topographic features (high altitude, extensive mountains, scarce flat basins) and accurately characterize its topographic spatial differences. Soil erosion degree and Precipitation are chosen based on the area’s prominent rocky desertification and soil erosion, directly reflecting its ecological vulnerability [49]. NDVI, a core quantitative indicator for ecological environment quality, directly reflects vegetation coverage. The four socio-economic core indicators are Population density, Per capita GDP, Night-time light and Land use intensity. These four factors fully and accurately reflect the spatiotemporal heterogeneity of the area’s population distribution, economic development and urbanization, meet the socio-economic driving characterization needs, and effectively capture the interference intensity of human activities on regional landscape ecosystems [50].
The aforementioned ten driving factors can directly or indirectly affect the pollution index, biodiversity index and climate variability index. The simultaneous incorporation of the pollution index, biodiversity index and climate variability index into the model may give rise to multicollinearity, which in turn induces model overfitting and impairs the accuracy of the analysis results. In addition, the application of the biodiversity index is constrained by the lack of complete long-term series monitoring data, which makes it difficult to meet the requirements of this study for long-term series analysis. This has therefore been identified as a key direction for subsequent research.
To avoid deviations in calculation results caused by inconsistencies in data types and precision, the raster data of the 10 driving factors were standardized to the same precision and coordinate system using ArcGIS 10.8 software. Afterwards, the landscape ecological risk shp files for each time period were converted into point features, and the “Extract Multi Values to Points” tool was utilized to extract raster data into vector data. Additionally, robustness processing was incorporated into the Python-based Random Forest model to handle missing values.

2.3.5. Interpretable Machine Learning for Exploring Driving Factors

The XGBoost (Extreme Gradient Boosting) regression model is an efficient gradient boosting decision tree algorithm that integrates multiple weak learners into a strong learner through sequential iteration. It optimizes the objective function using first-order and second-order derivatives, effectively handling missing values and high-dimensional collinear data, and exhibits strong predictive ability for non-linear relationships between driving factors and landscape ecological risk [51]. This model was implemented using Python 3.13 software, and its expression is as follows:
Y = k = 1 K f k ( x i ) , f k F
where Y denotes the predicted value; K denotes the total number of decision trees; x i denotes the feature vector corresponding to the sample (i.e., the explanatory variable); f k denotes the k t h regression tree; F denotes the set of all trees. First, the dataset was divided into a training set and a test set at a ratio of 7:3 to construct a basic regression model. The model parameters were optimized through 5-fold cross-validation combined with grid search to find the optimal parameter combination, which improved the model performance and prevented overfitting. Common evaluation metrics for regression tasks, including Mean Squared Error (MSE), Root Mean Squared Error (RMSE), Mean Absolute Error (MAE), and R2 score, were calculated and output to verify the fitting effect and generalization ability of the model.
However, XGBoost models have been shown to lack explanatory power for the effects of spatiotemporal heterogeneity in practical applications. Therefore, the SHAP black-box interpretation algorithm was introduced on the basis of this model in this study. Based on the cooperative game theory method, this algorithm quantifies the contribution degree of driving factors to measure the importance of each factor, namely, feature importance [47]. The positive or negative value of the SHAP value indicates a promoting or inhibiting effect on the prediction result, and the larger the absolute value, the deeper the influence of this factor on the model prediction result [52,53]. Its expression is as follows:
i = S N \ { i } | S | ! ( | N | | S | 1 ) ! | N | ! [ μ ( S { i } ) μ ( s ) ]
where i denotes the SHAP value of factor i ; N denotes the set of all features; S denotes the subset that does not contain feature i ; μ ( S ) denotes the contribution of the model prediction using the feature set S ; μ ( S { i } ) denotes the contribution of the prediction after adding feature i .
The Random Forest model is an ensemble learning model constructed by integrating multiple independent CART regression trees through the bootstrap resampling method and majority voting principle [54,55]. It has the advantages of strong anti-overfitting ability, high efficiency in processing high-dimensional data, and insensitivity to outliers, and can effectively identify the interaction effects between driving factors. This model was implemented using Python’s scikit-learn library, with the number of decision trees ranging from 500 to 1000 according to the dataset configurations of different periods; to enhance the interpretability of model decisions, SHAP was also applied to analyze the feature importance of the Random Forest model, and its prediction performance (e.g., R2, RMSE) was compared with the XGBoost-SHAP model to verify the reliability of the driving factor analysis results.

3. Results

3.1. Spatiotemporal Variation Characteristics of Land Use

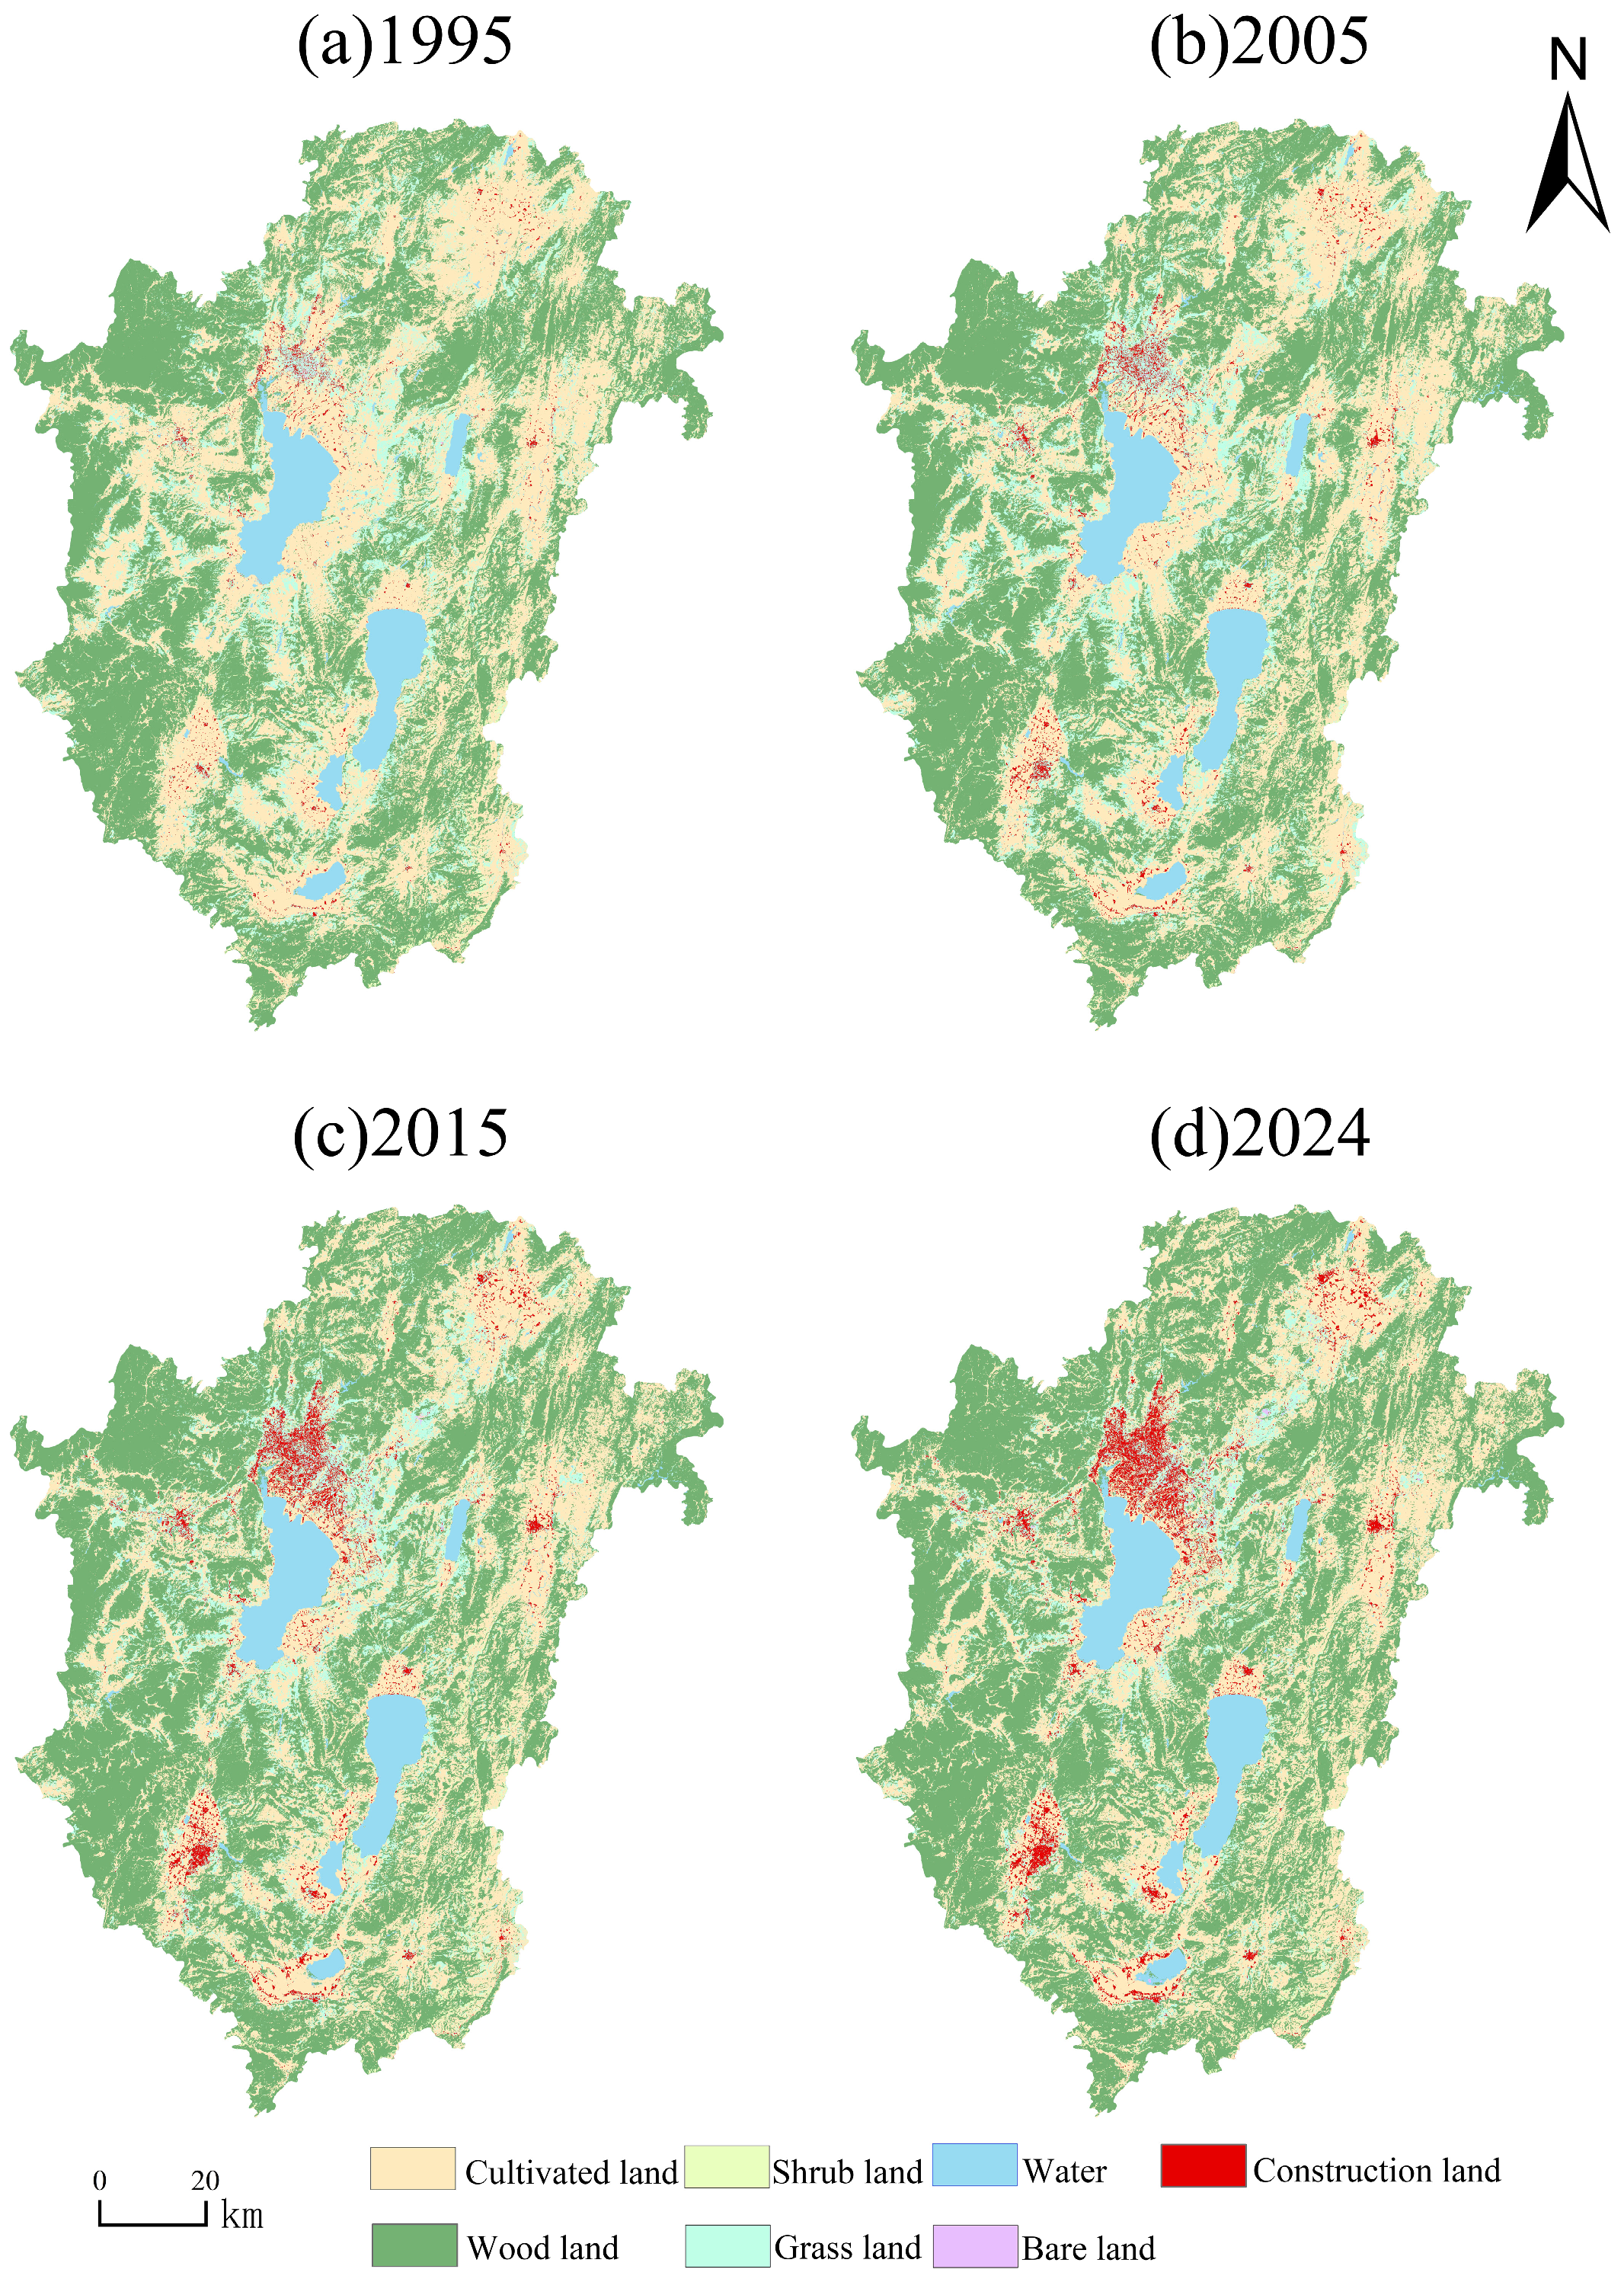
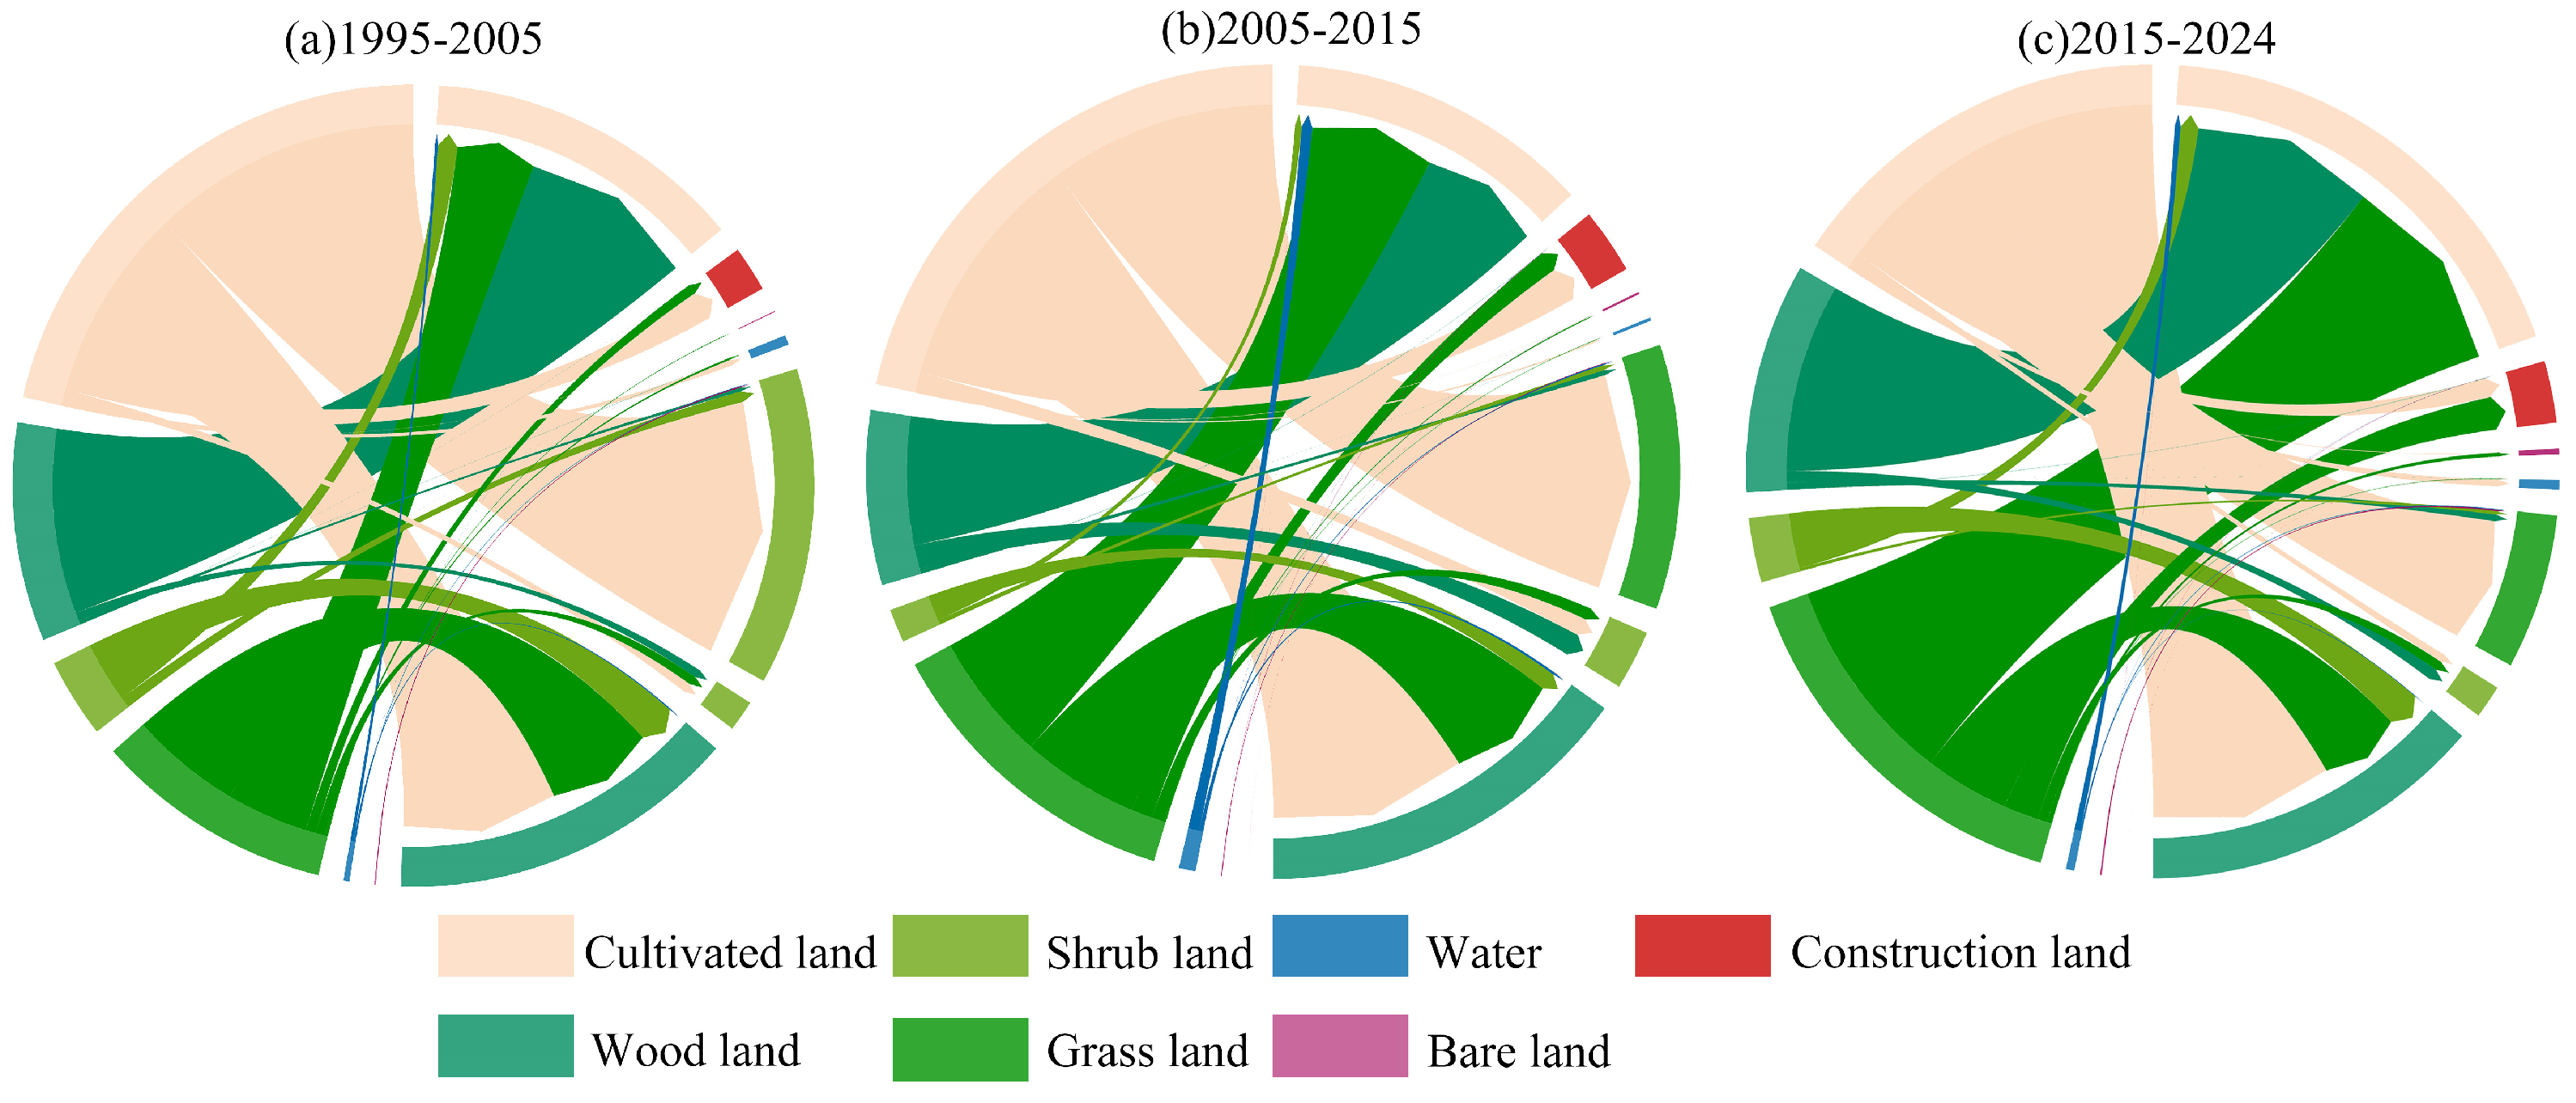
The area of Construction land exhibited the most significant increase, particularly in regions such as the northern part of Dianchi Lake, around Qilu Lake, the southern part of Xingyun Lake, the northern part of Fuxian Lake, and the flat damarea of Hongta District. This was followed by a significant decrease in the area of Cultivated land in 2024 compared with 1995 (Figure 3). The land use transfer situation was calculated using Formula (1), and the transfer degree of each land use type varied across different periods (Figure 4).
From 1995 to 2005, Cultivated land was mainly converted to Grass land and Forest land, with a small portion transferred to Construction land; Forest land was primarily converted to Cultivated land (forming a mutual conversion pattern between the two), while Shrub land and Grass land were mainly transferred to Forest land (which received conversions from multiple land use types, and Grass land was also converted to Cultivated land), and Construction land received the largest area of conversion from Cultivated land. From 2005 to 2015, the area of Cultivated land converted to Forest land increased, Grass land and Construction land received the largest areas of conversion from Cultivated land, Cultivated land mainly accepted conversions from Forest land and Grass land, a small portion of Water was converted to Cultivated land (with a larger area than in the previous period), and a small amount of Cultivated land, Grass land, and Forest land were transferred to Shrub land. By 2015–2024, the proportion of Grass land had exceeded that of Cultivated land, and Cultivated land, Grass land, and Forest land exhibited mutual conversion; Construction land area continued to increase, and Water was converted to Cultivated land but with a reduced conversion area. Meanwhile, the area of Bare land increased, the area of Shrub land converted to Forest land expanded, and the change in Bare land was not significant.

3.2. Calculation Results of Land Use Dynamic Degree

From the perspective of single land use dynamic degree, Cultivated land decreased by 751.5 km2 from 1995 to 2015 but increased by 109 km2 from 2015 to 2024; Forest land and Construction land have continued to expand over the past 30 years (with Construction land seeing a greater degree of change), Bare land changed most drastically between 2015 and 2024, and Water showed a “rise–fall–rise” trend—yet it decreased by 23.75 km2 from 2005 to 2015, and the increases in the adjacent periods failed to offset this reduction; Grass land saw a relatively drastic and large-scale decrease, accumulating a 413.64 km2 reduction from 2005 to 2024. From the perspective of comprehensive dynamic degree, land use change was roughly consistent in the 1995–2005 and 2015–2024 periods, while the most intense change occurred in 2005–2015 (Table 4).

3.3. Spatiotemporal Variation Characteristics of Landscape Ecological Risk

3.3.1. Characteristics of Landscape Pattern Indices

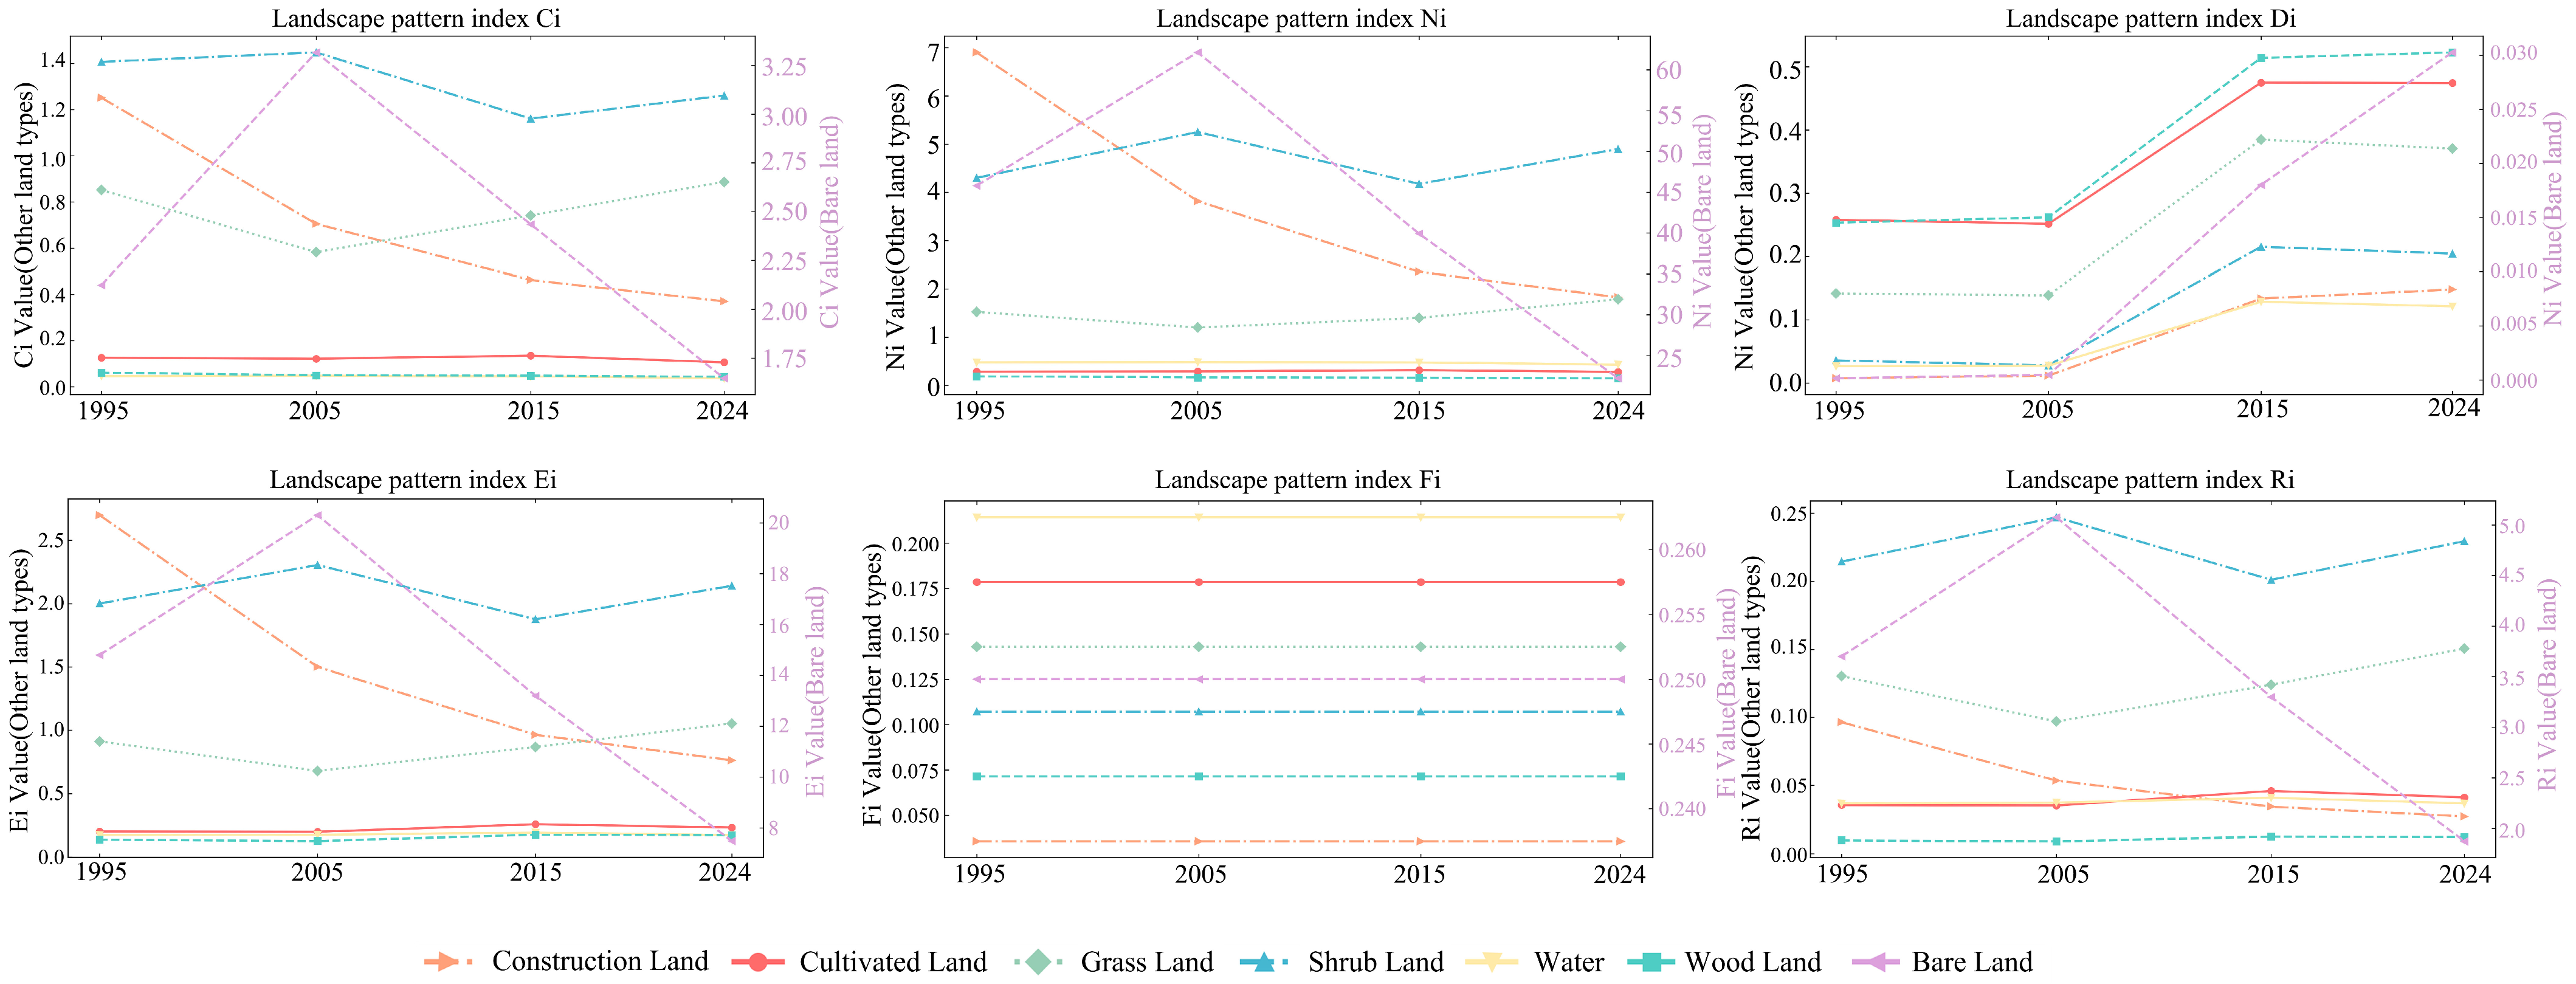
As shown in Figure 5, for Landscape Fragmentation, except for a slight increase in Grass land, the other land use types exhibited a fluctuating downward or continuous downward trend; for Landscape Isolation, Shrub land, Grass land and Water showed an upward trend while the remaining types declined—with Construction land having the most significant downward trend; for Landscape Dominance, all land use types demonstrated an upward trend, among which Cultivated land and Forest land had the largest values and the most notable increases, while Water and Construction land had the lowest dominance; for Landscape Disturbance Degree, Construction land gradually decreased, Water remained basically stable, and Grass land and Shrub land showed an upward trend; for Landscape Loss Degree, Construction land had a significant downward trend, Water rose to a peak in 2015 then declined to the 1995 level, and Shrub land and Grass land exhibited a fluctuating upward trend.

3.3.2. Characteristics of the Landscape Ecological Risk Index (ERI)

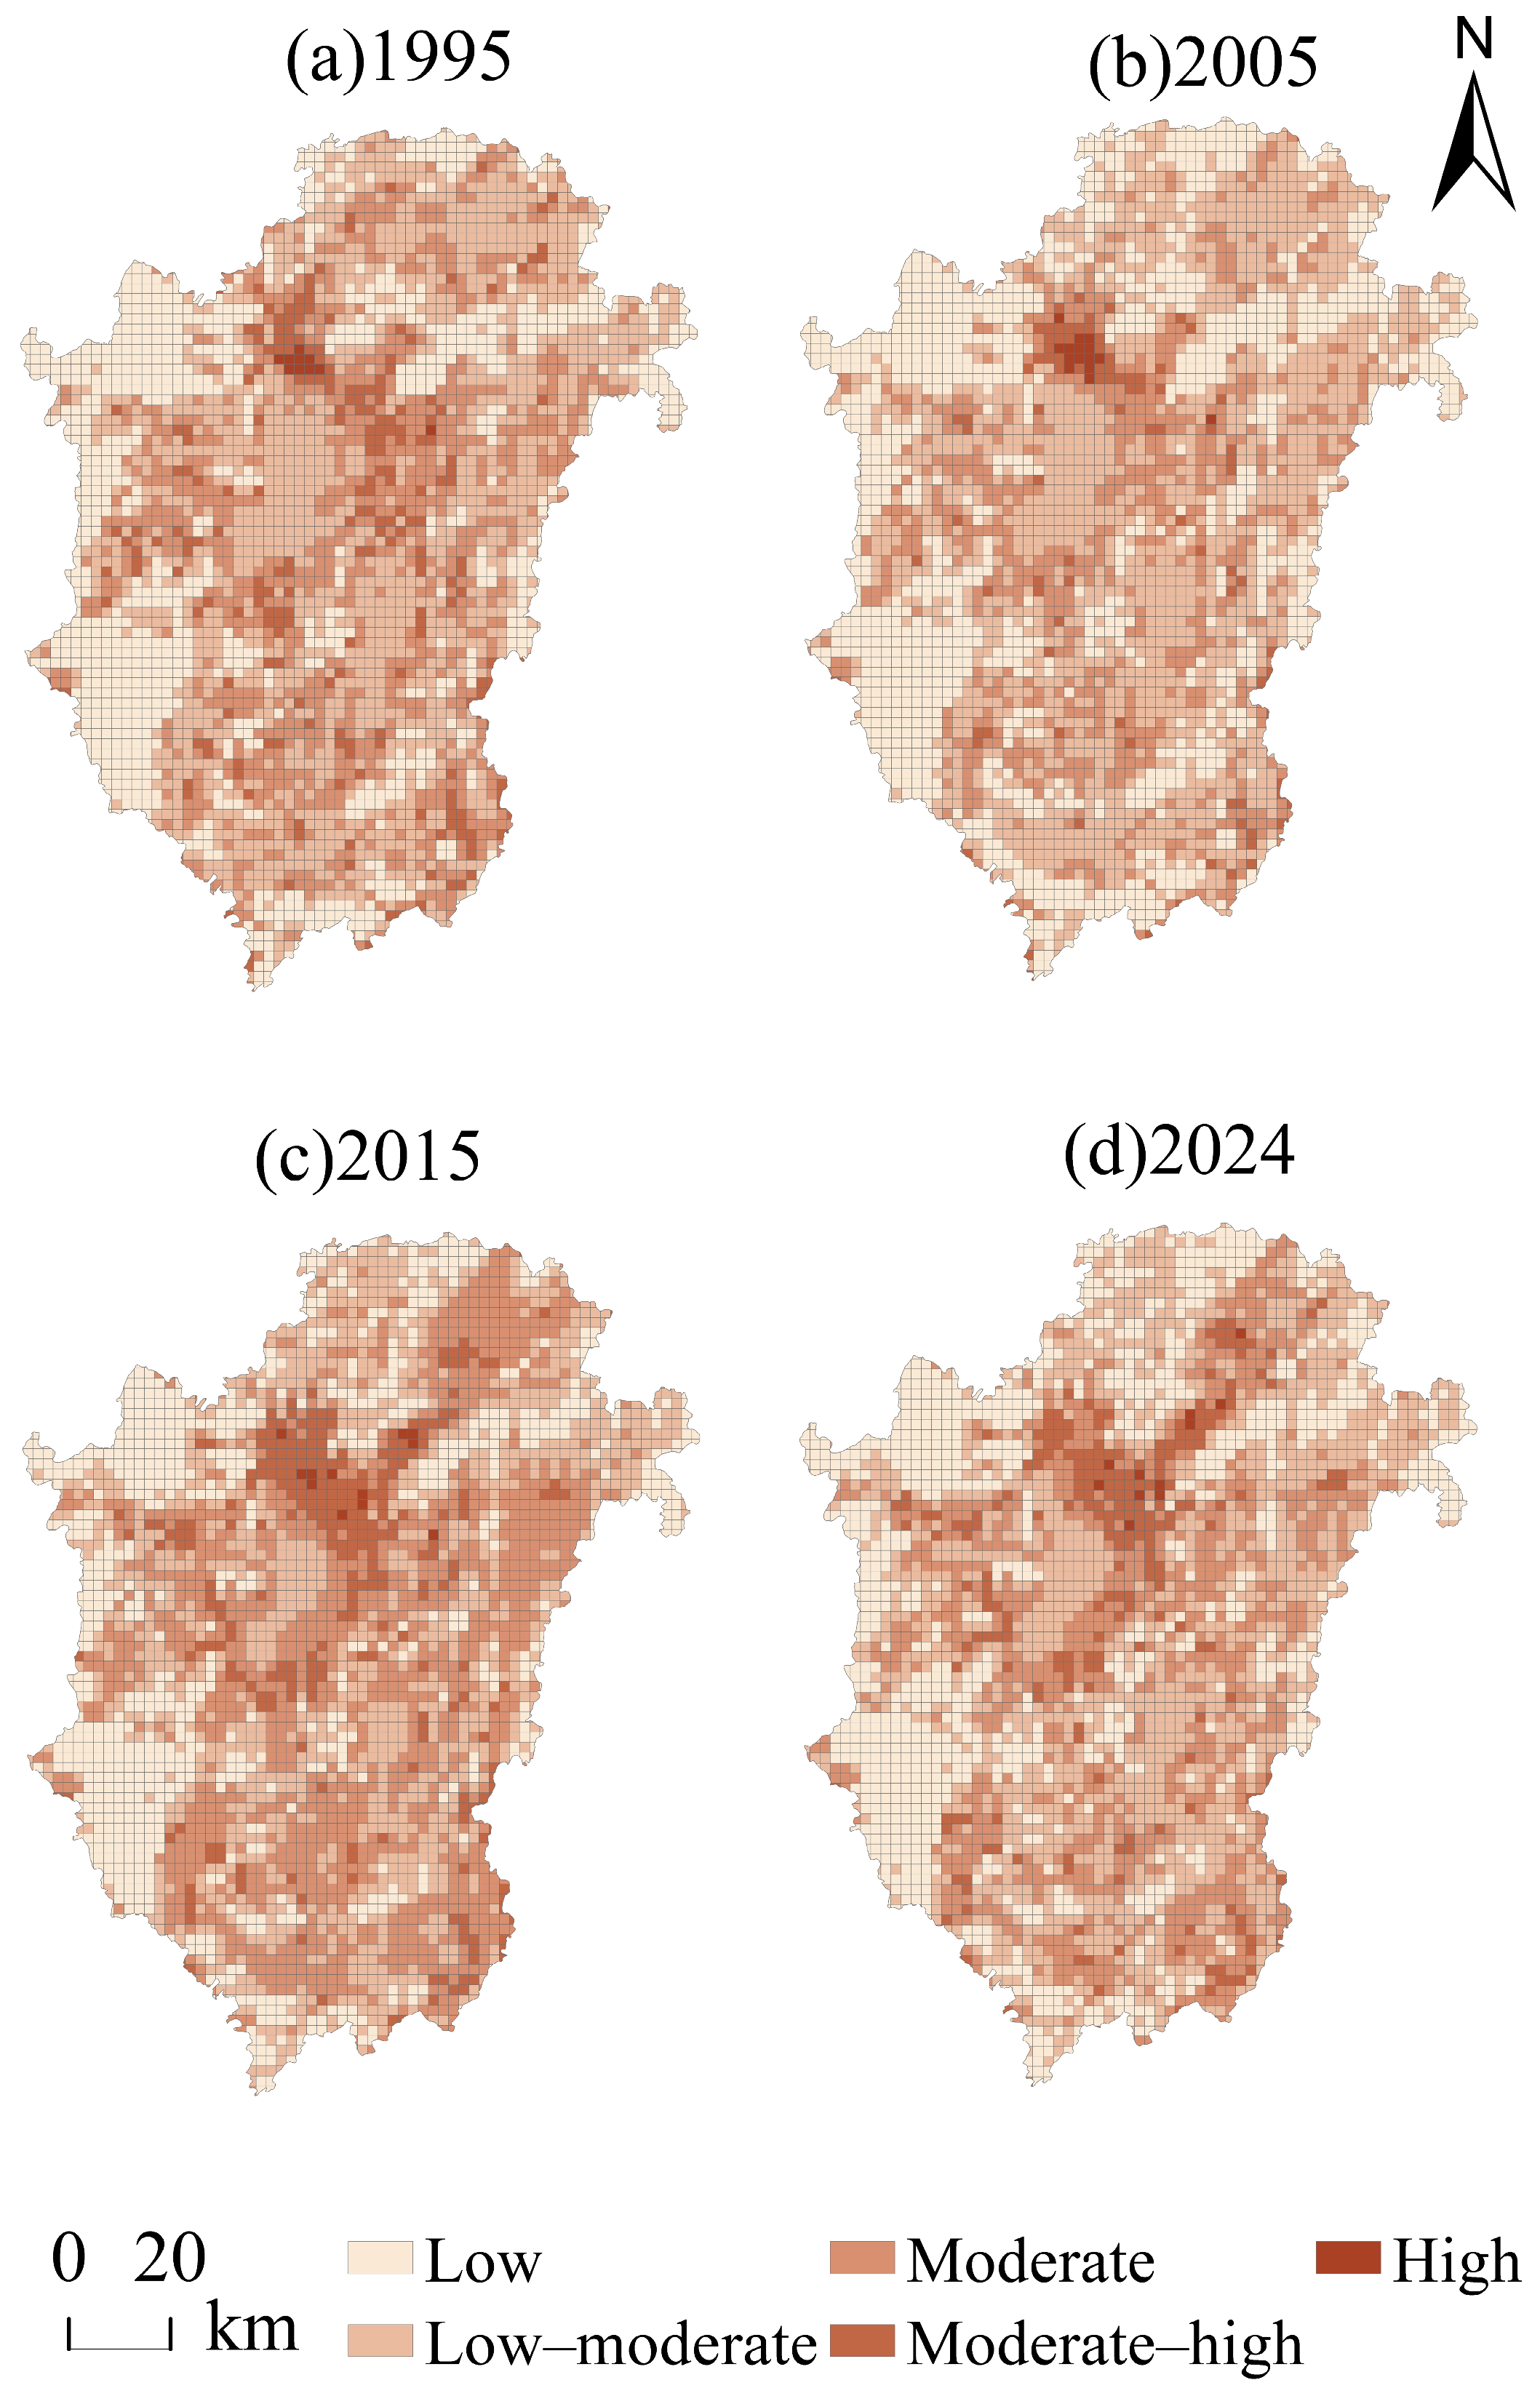
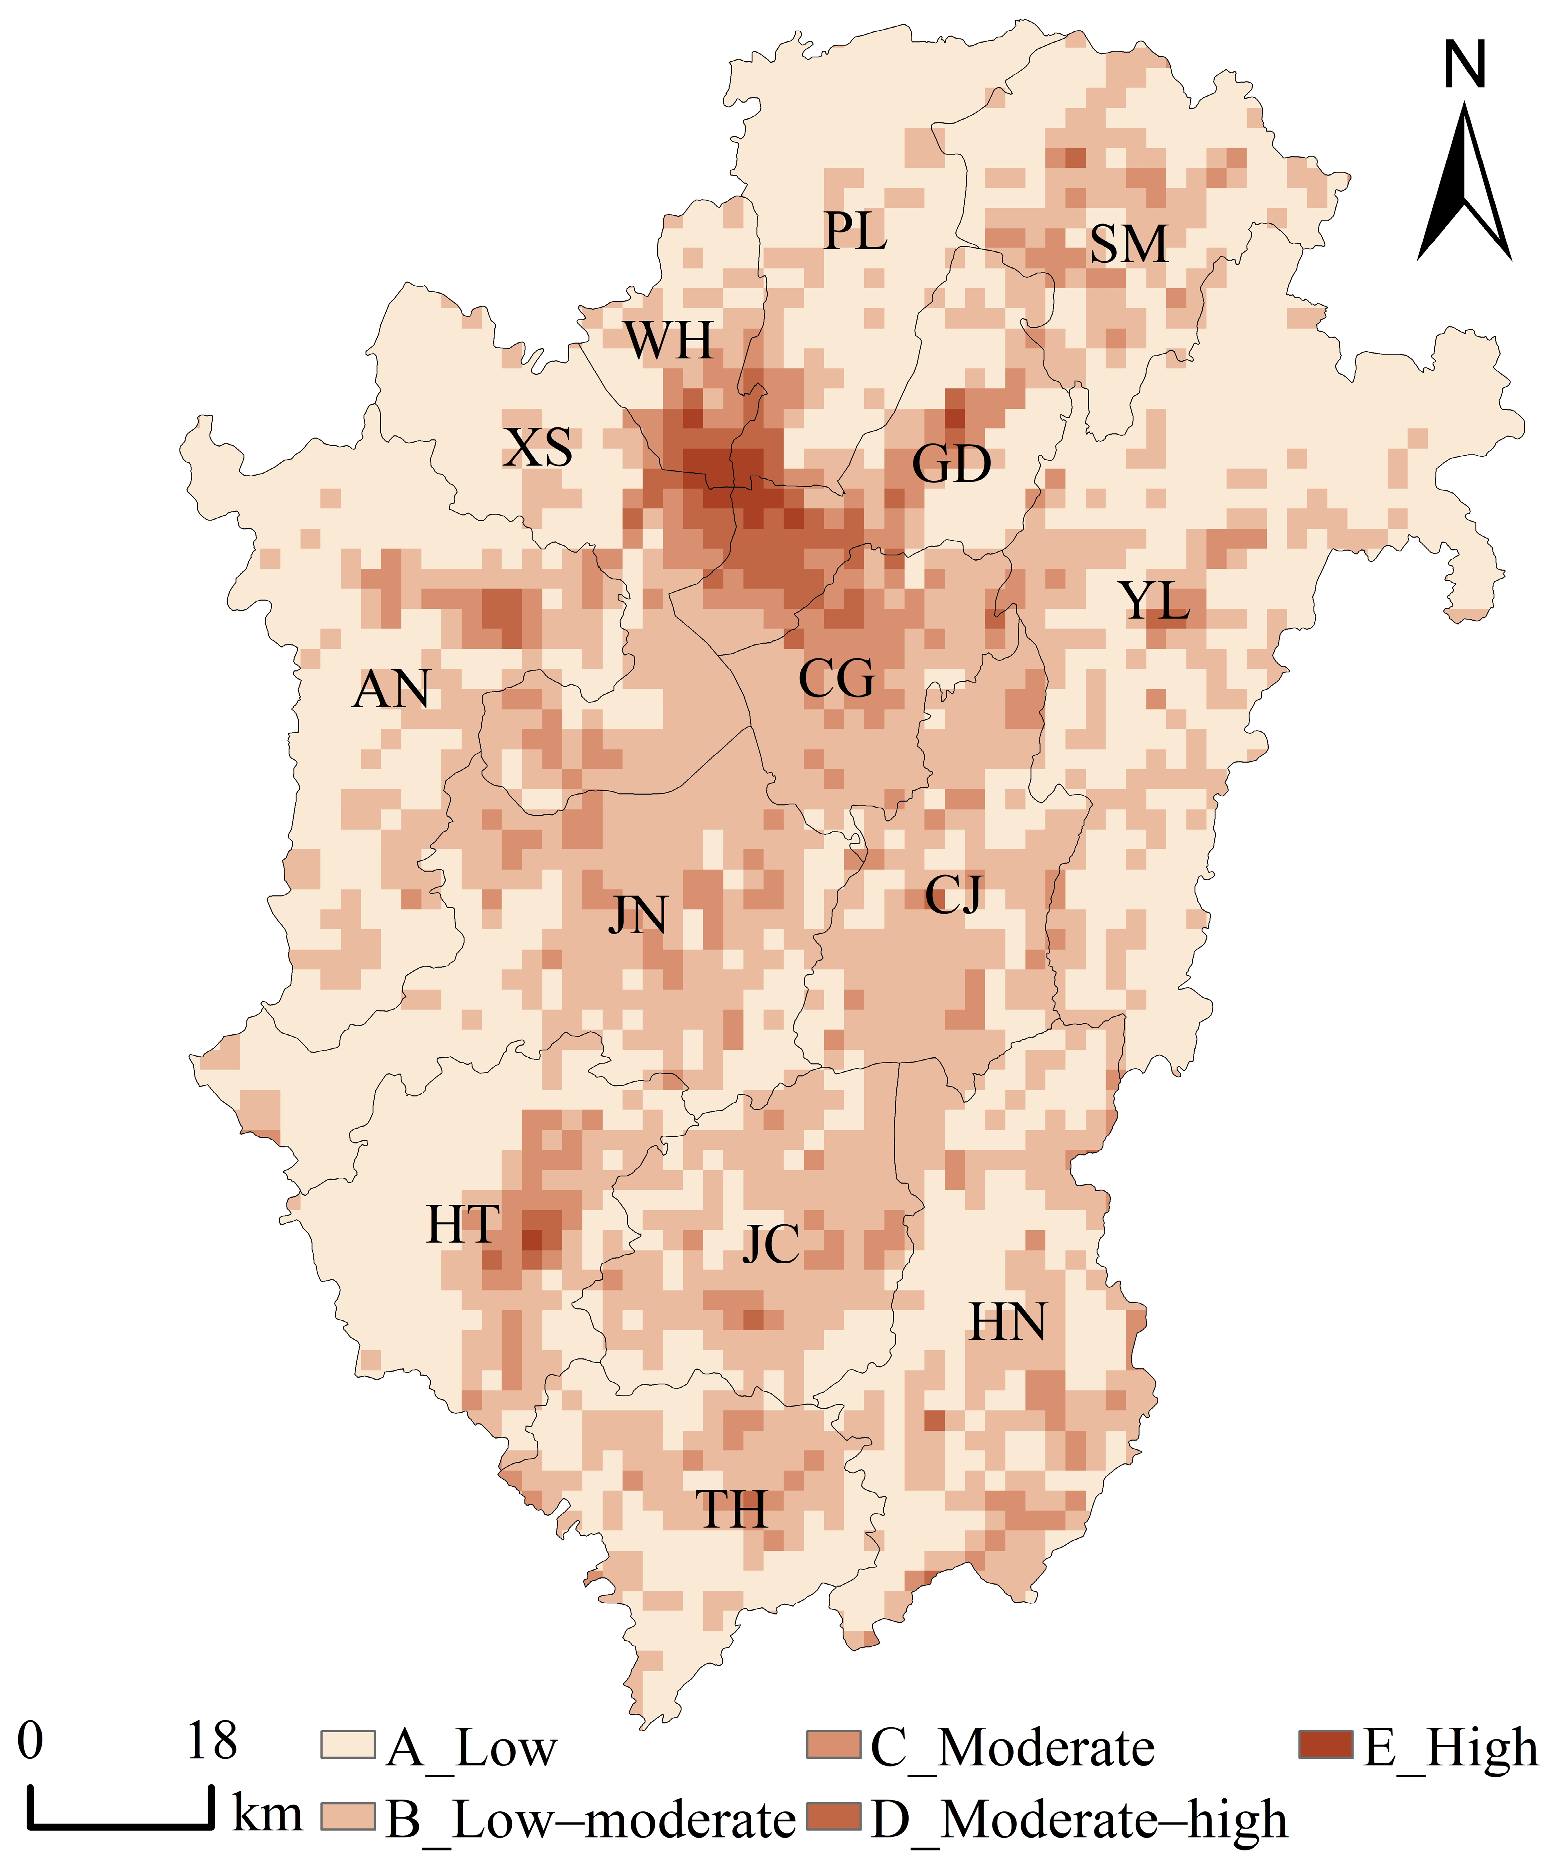
According to Formula (4), the landscape ecological risk index was visualized using ArcGIS10.8, and risk levels were classified using the Natural Breaks Classification Method based on the calculation results. To uniformly compare the landscape ecological risk across different periods, the arithmetic mean of the critical values of risk levels in each period was adopted as the classification standard, dividing the ERI into five grades [56]: Low risk (ERI ≤ 0.025879), Low–medium risk (0.025879 < ERI ≤ 0.041481), Medium risk (0.041481 < ERI ≤ 0.062885), Medium–high risk (0.062885 < ERI ≤ 0.154108), and High risk (ERI ≥ 0.154108). The overall landscape ecological risk in the study area exhibited an upward trend, with significant expansion of High-risk regions, prominent gradient classification, and Low risk and Low–medium risk grades accounting for a relatively large proportion (Figure 6). The Five Lakes remained in the Low–medium risk grade across the four periods—their area expanded from 1995 to 2005, sharply decreased by 2015, and expanded again in 2024; as illustrated in Figure 6a, the study area was dominated by Low risk and Low–medium risk in 1995, with local occurrences of Medium risk and Medium–high risk, while High-risk regions accounted for the smallest proportion and were scattered. In 2005 (Figure 6b), the overall risk grade slightly declined, Medium–high-risk regions slightly reduced in proportion and concentration, and the coverage of Low risk and High risk expanded; by 2015 (Figure 6c), Medium–high-risk regions began to expand, with Medium risk and Medium–high risk becoming the dominant grades in the area, and the Low-risk regions in the north shrank significantly. In 2024 (Figure 6d), Medium–high-risk areas further expanded and formed a continuous agglomeration belt in the central urban agglomeration of Kunming–Yuxi and the five lakes shore zone, while High-risk areas contracted and were limited to the core built-up areas of Kunming’s main urban area (Wuhua, Panlong and Guandu Districts). This stage presented a spatial evolution characteristic of “High-risk convergence, Medium–high-risk diffusion”, and the regional ecological risk did not achieve substantive improvement, but only showed a transfer of High risk grade to Medium–high risk grade in spatial distribution.
To further verify the validity of the environmental risk index as an indicator of substantive ecological risk, this study conducted a correlation analysis between the environmental risk index and independent ecological outcomes that align with the characteristics of the study area: (1) At the lake scale, areas with Moderate high/High risk index values (e.g., around the inflow rivers of Dianchi Lake) overlap with regions where water quality has been persistently rated at Grade IV or worse (data from the Yunnan Provincial Department of Ecology and Environment), indicating a positive correlation between High risk index values and poor water quality. (2) Low risk index areas correspond to nature reserves with high NDVI values and intact forest ecosystems (e.g., Yuxi Hongta Mountain Municipal Nature Reserve, Tonghai Xiushan County-level Nature Reserve), whereas High risk index areas are mostly distributed in urban built-up zones, as well as regions with severe landscape fragmentation and Cultivated land degradation. Such consistency between the spatial distribution pattern of the landscape risk index and independent ecological conditions verifies that this index can effectively reflect the substantive landscape ecological risks in the study area to a certain extent.

3.3.3. Analysis of the Spatial Distribution Pattern of ERI

To further explore the variation characteristics of landscape ecological risk in the Central Yunnan Five Lakes Region from a spatial distribution perspective, the landscape ecological risk index was analyzed at the grid scale, and the global Moran’s I was adopted to determine the spatial distribution patterns of all driving factors. The analysis results are presented in Table 5. The p-values of the results were all less than 0.01, and the global Moran’s I values across the time series were all greater than 0, indicating a positive spatial correlation and a tendency toward agglomerated distribution of the results. Changes in the global Moran’s I values showed that the spatial agglomeration degree of X1 increased from 1995 to 2024; that of X2, X3, X4 and X5 rose first and then declined; and that of X6, X7, X8, X9 and X10 fluctuated and decreased but rebounded in 2024.

3.4. Calculation Results of Driving Factors

3.4.1. Correlation Analysis of the XGBoost-SHAP Model

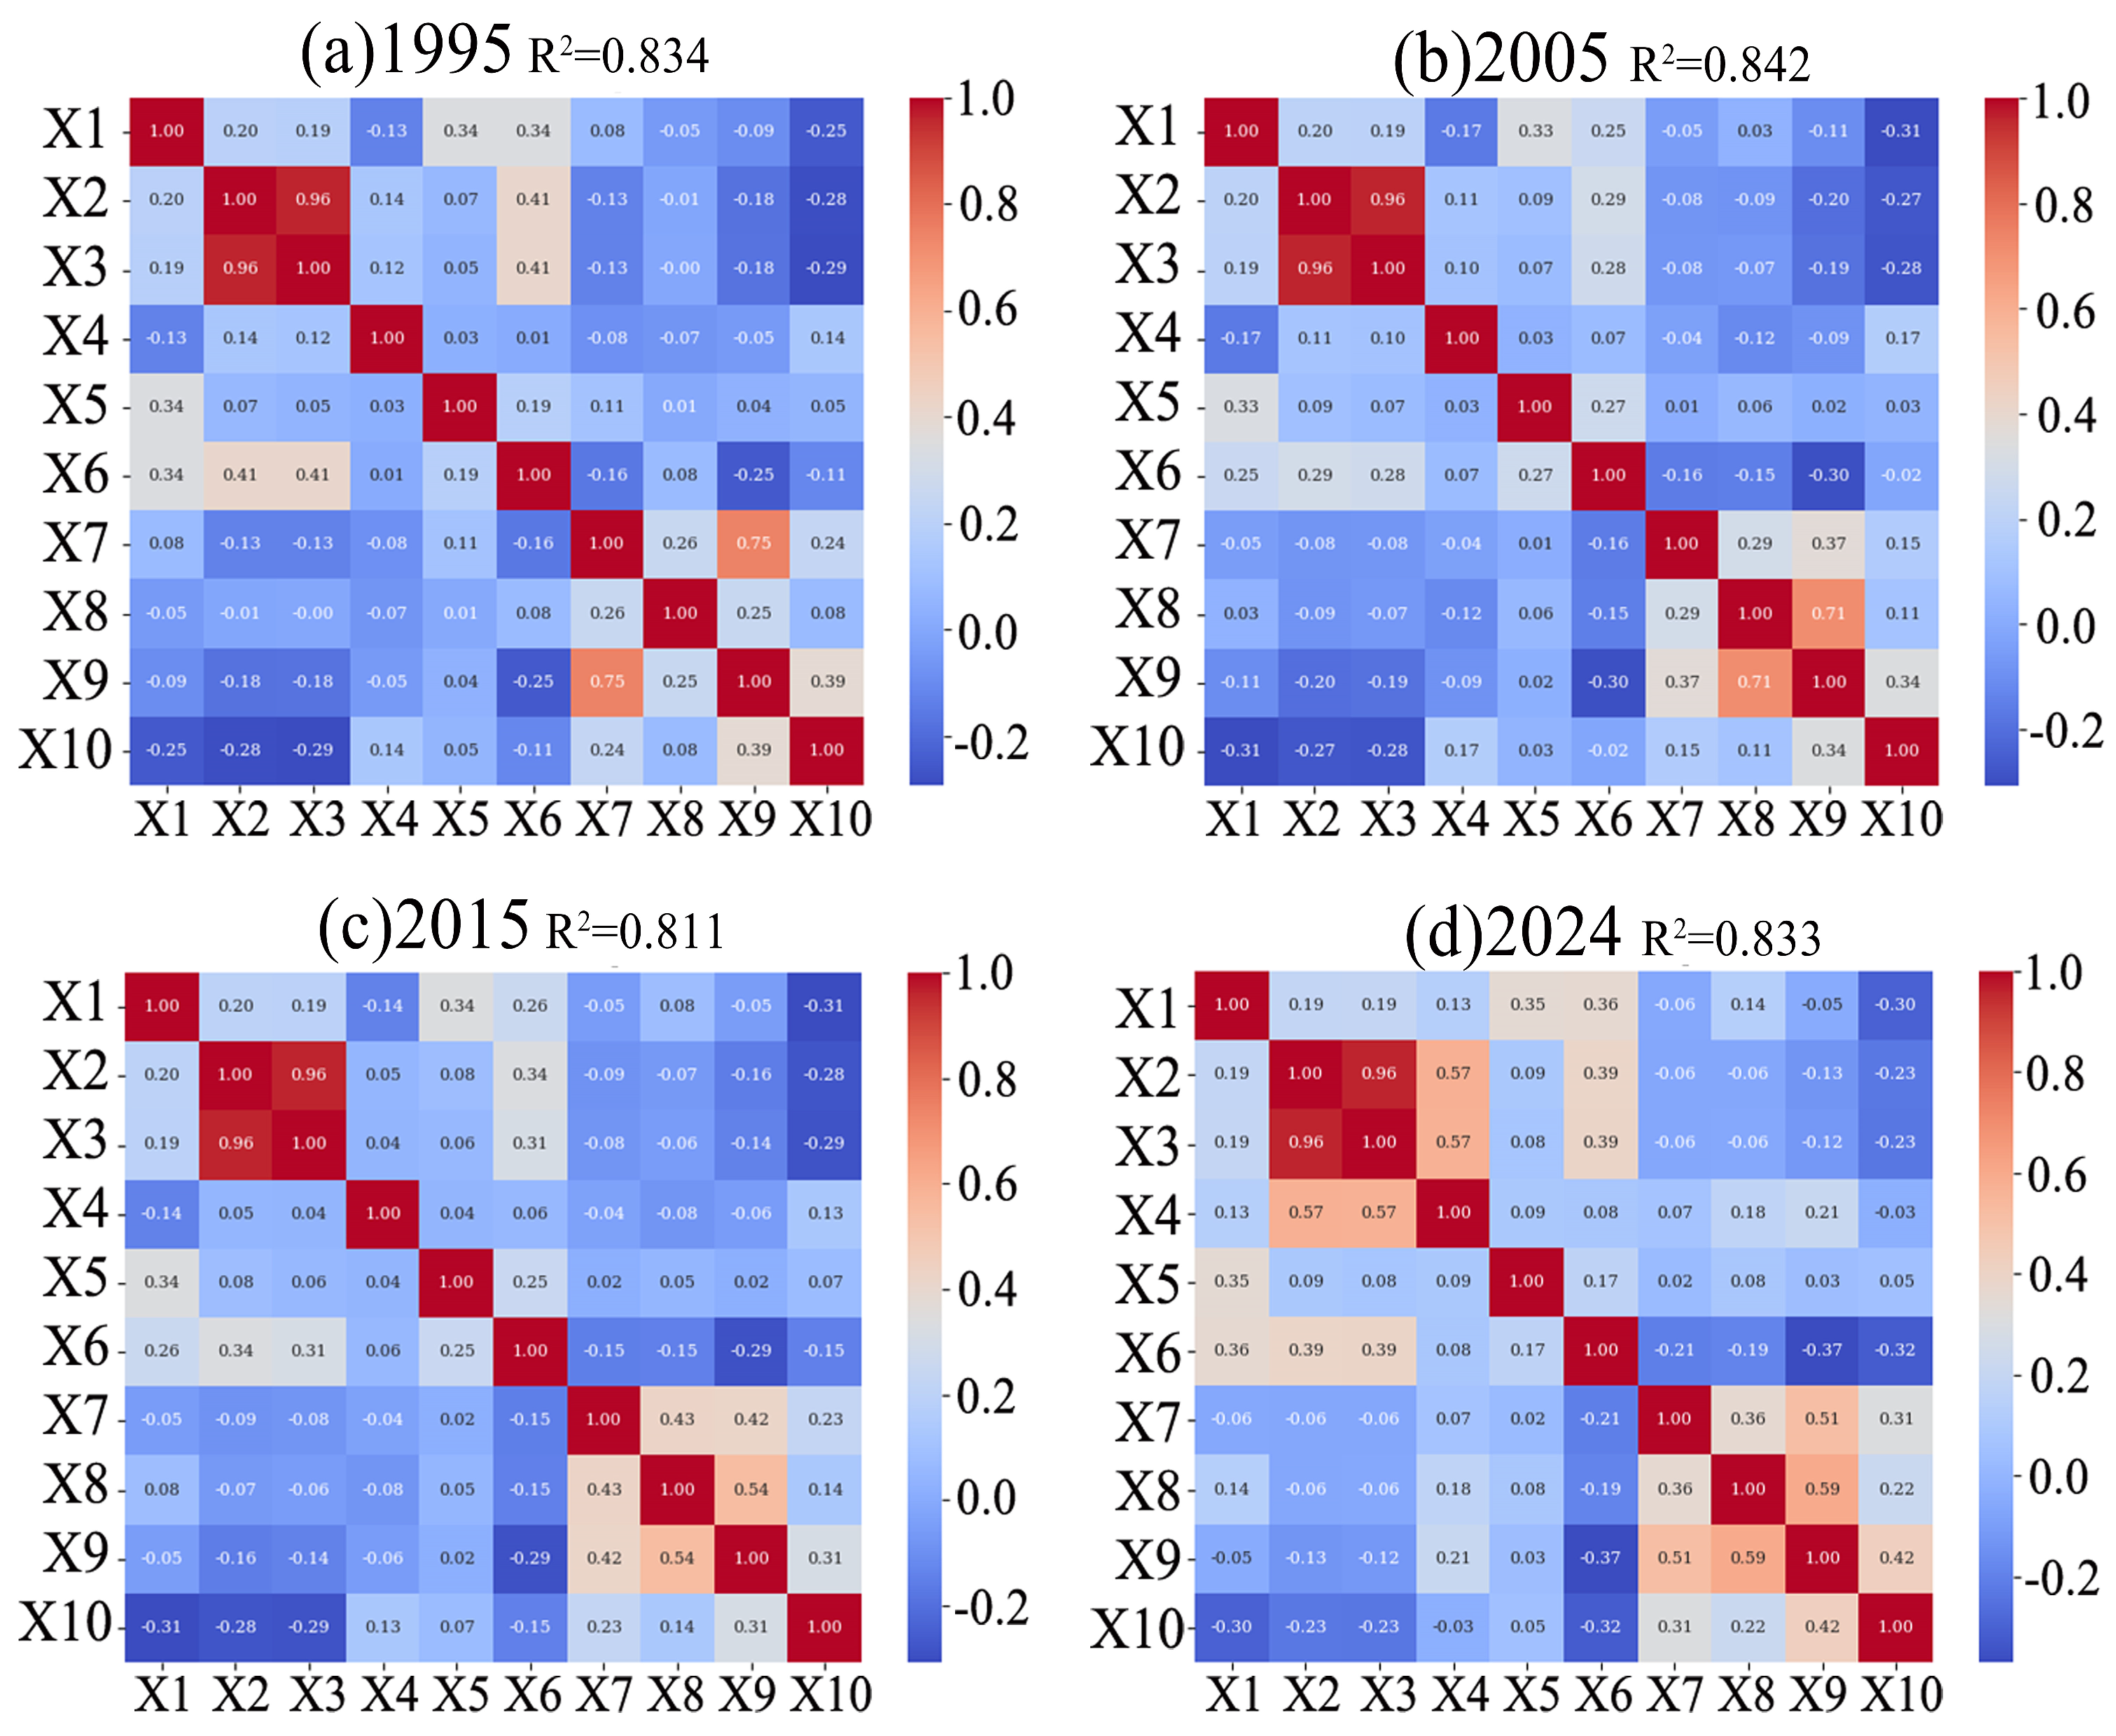
The variable correlations exhibited significant changes across the four periods: The positive correlations tended to be stable while the negative correlations were significant from 1995 to 2005, and the significance of positive correlations increased while negative correlations weakened from 2015 to 2024 (Figure 7). The positive correlation coefficient between X2 and X3 remained consistently at 0.96, indicating a strong positive correlation; from 1995 to 2015, the correlation coefficients between X4 and X2/X3 were around 0.14 (weak correlation), which increased to 0.57 by 2024, making X4 a moderately strong positive correlation factor. In 1995, X7 had a strong positive correlation with X9, while the correlations between X7 and X8, and between X8 and X9, were weak; from 2005 to 2024, the correlation coefficients between X7 and X8, and between X8 and X9, increased, forming correlation clusters (Figure 7b–d). The absolute values of the correlation coefficients between factors such as X1 and X5 with other factors remained within the weak correlation range (<0.5); X6 had small numerical fluctuations with X7 and X9 in different years, maintaining an overall weak negative correlation state.

3.4.2. Shap Value Feature Importance Analysis

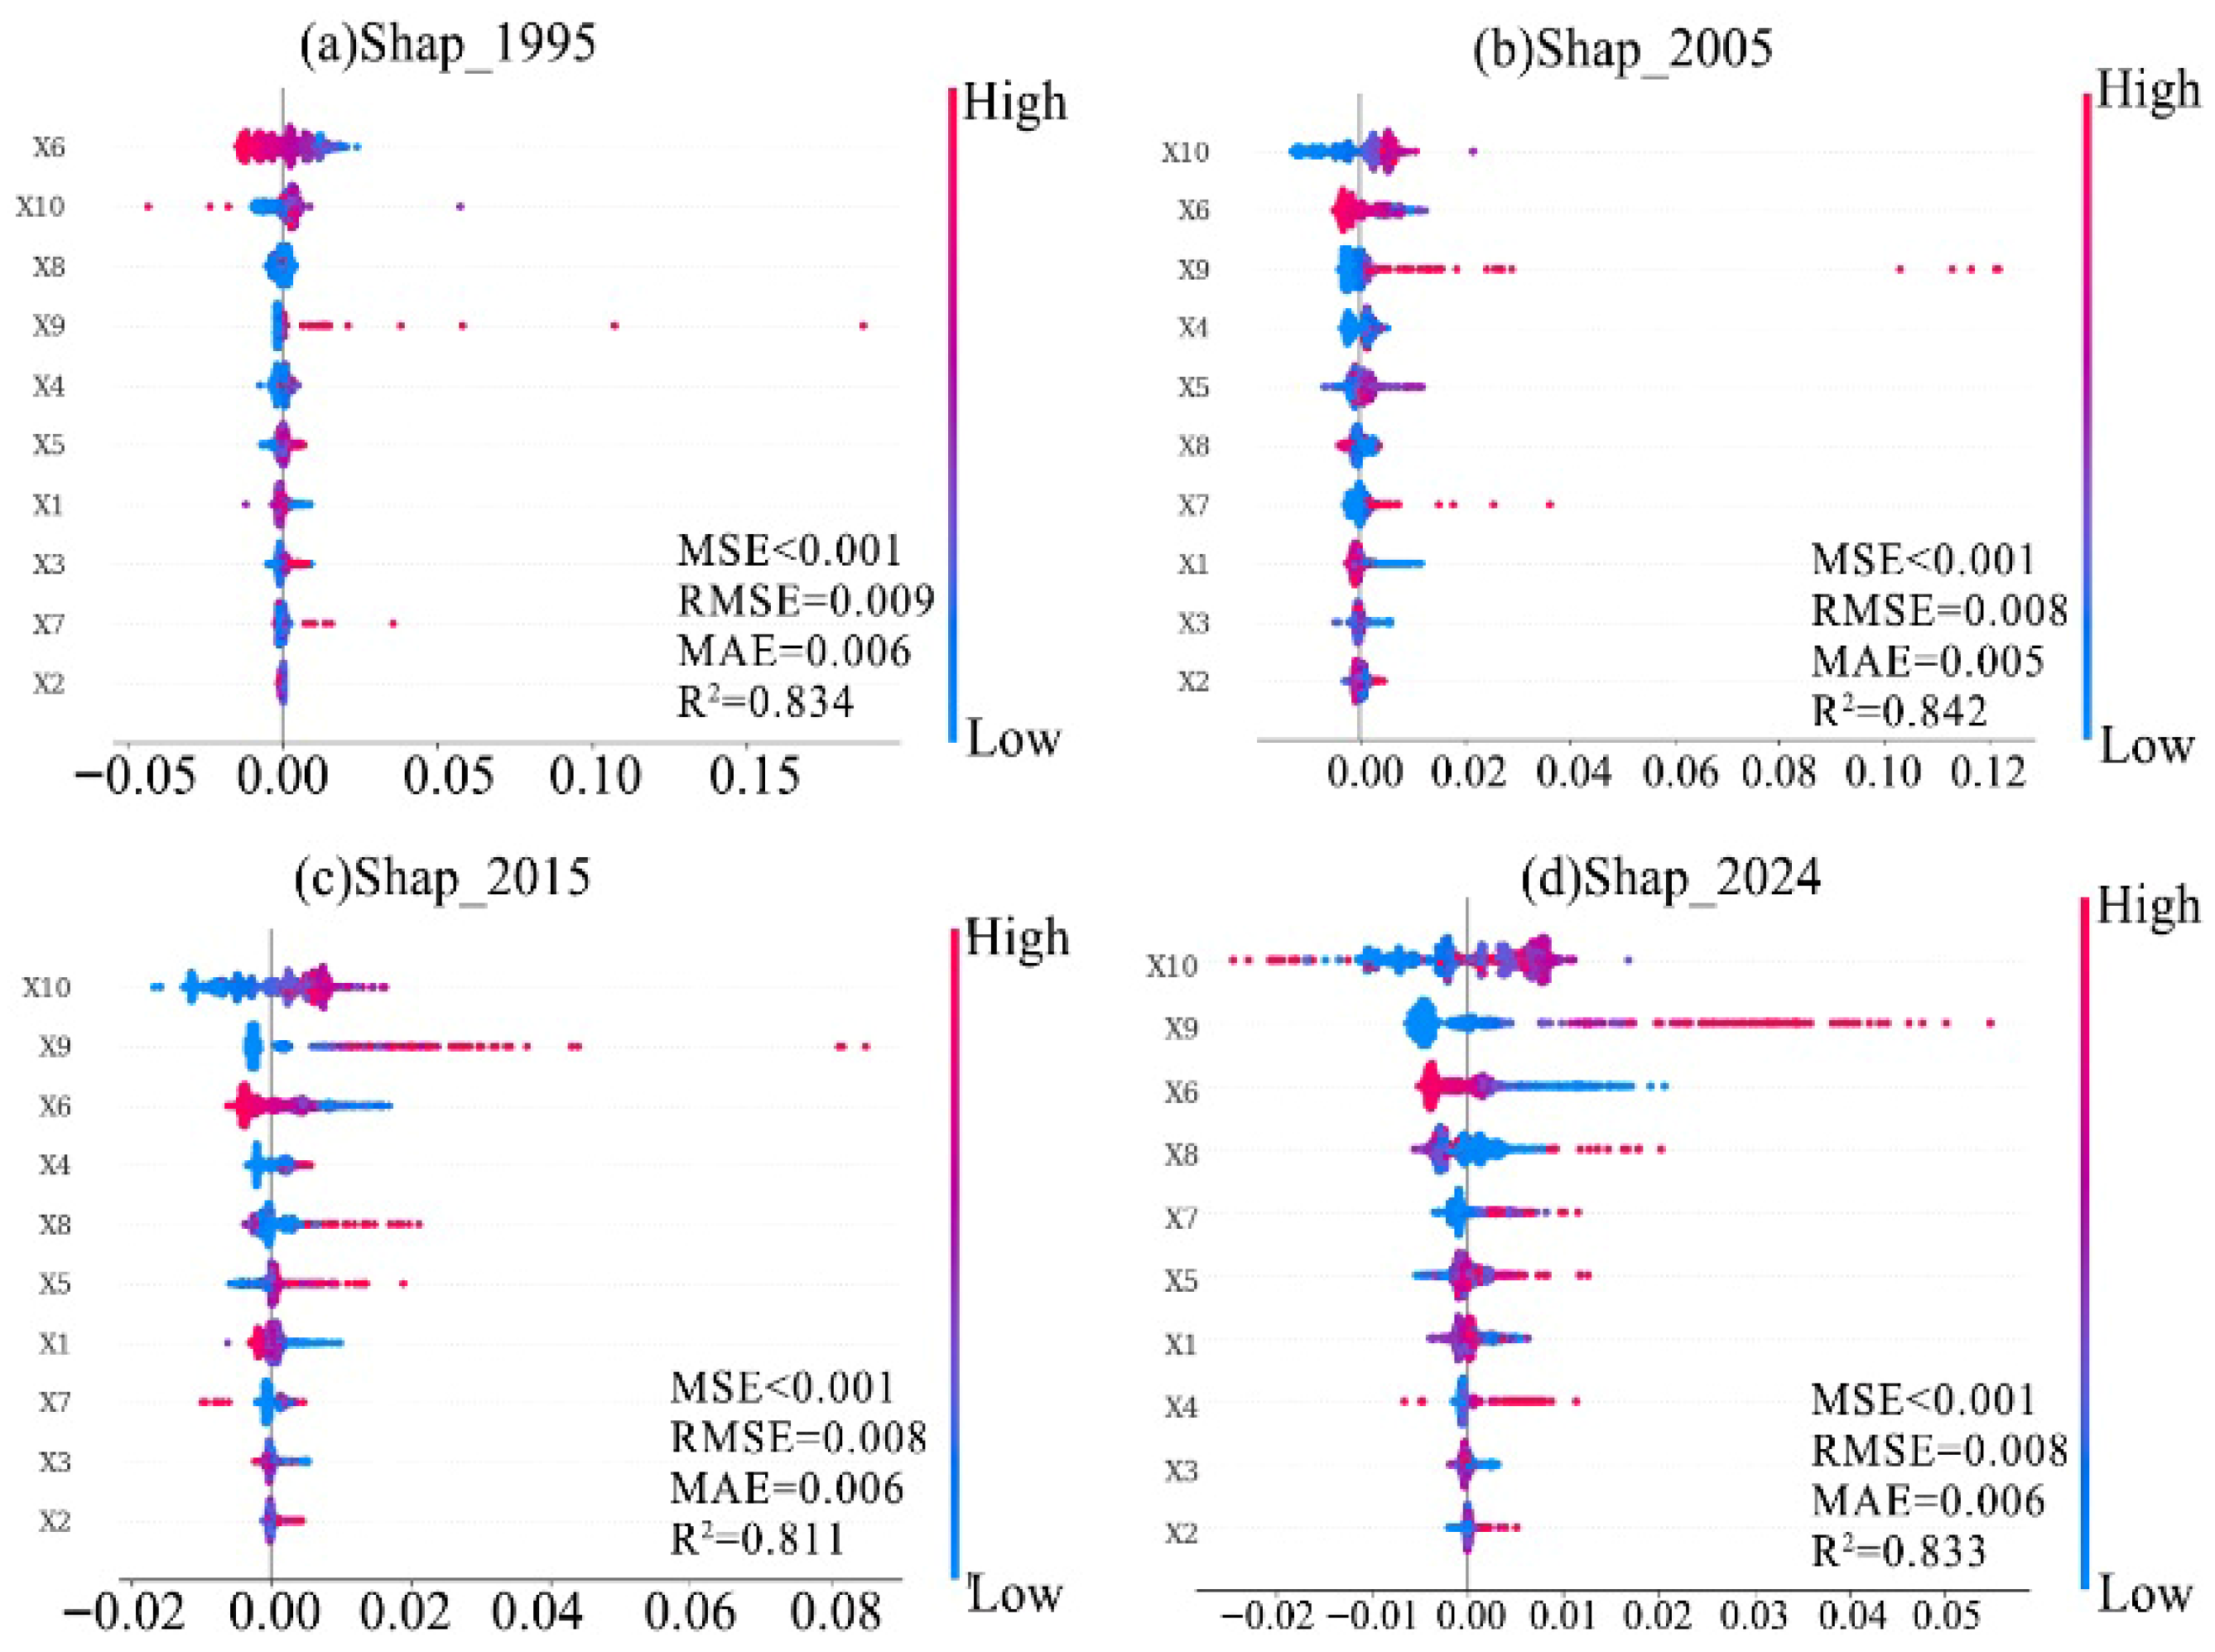
From 1995 to 2024, the positive and negative driving relationships of each factor gradually became significant, with X6, X10, and X9 remaining important influencing factors over the long term. In 1995, X6 was the core influencing factor (Figure 8a), while X10 replaced X6 in 2005 and its influence continued to strengthen between 2015 and 2024; in 1995, X9 had a small impact range and ranked low, but its ranking continued to rise and concentrated on the right side from 2005 to 2024 (Figure 8b–d), indicating that X9 had become the main driving factor for increasing landscape ecological risk. Although X2 and X3 had significant correlations, their contributions to landscape ecological risk remained consistently weak; X4 and X5 belonged to the medium importance category—among them, the importance of X4 decreased and its driving force weakened between 2015 and 2024, while X5 and X8 maintained medium importance and the most stable driving force; the driving force of X7 gradually weakened with a continuous decline in its importance.
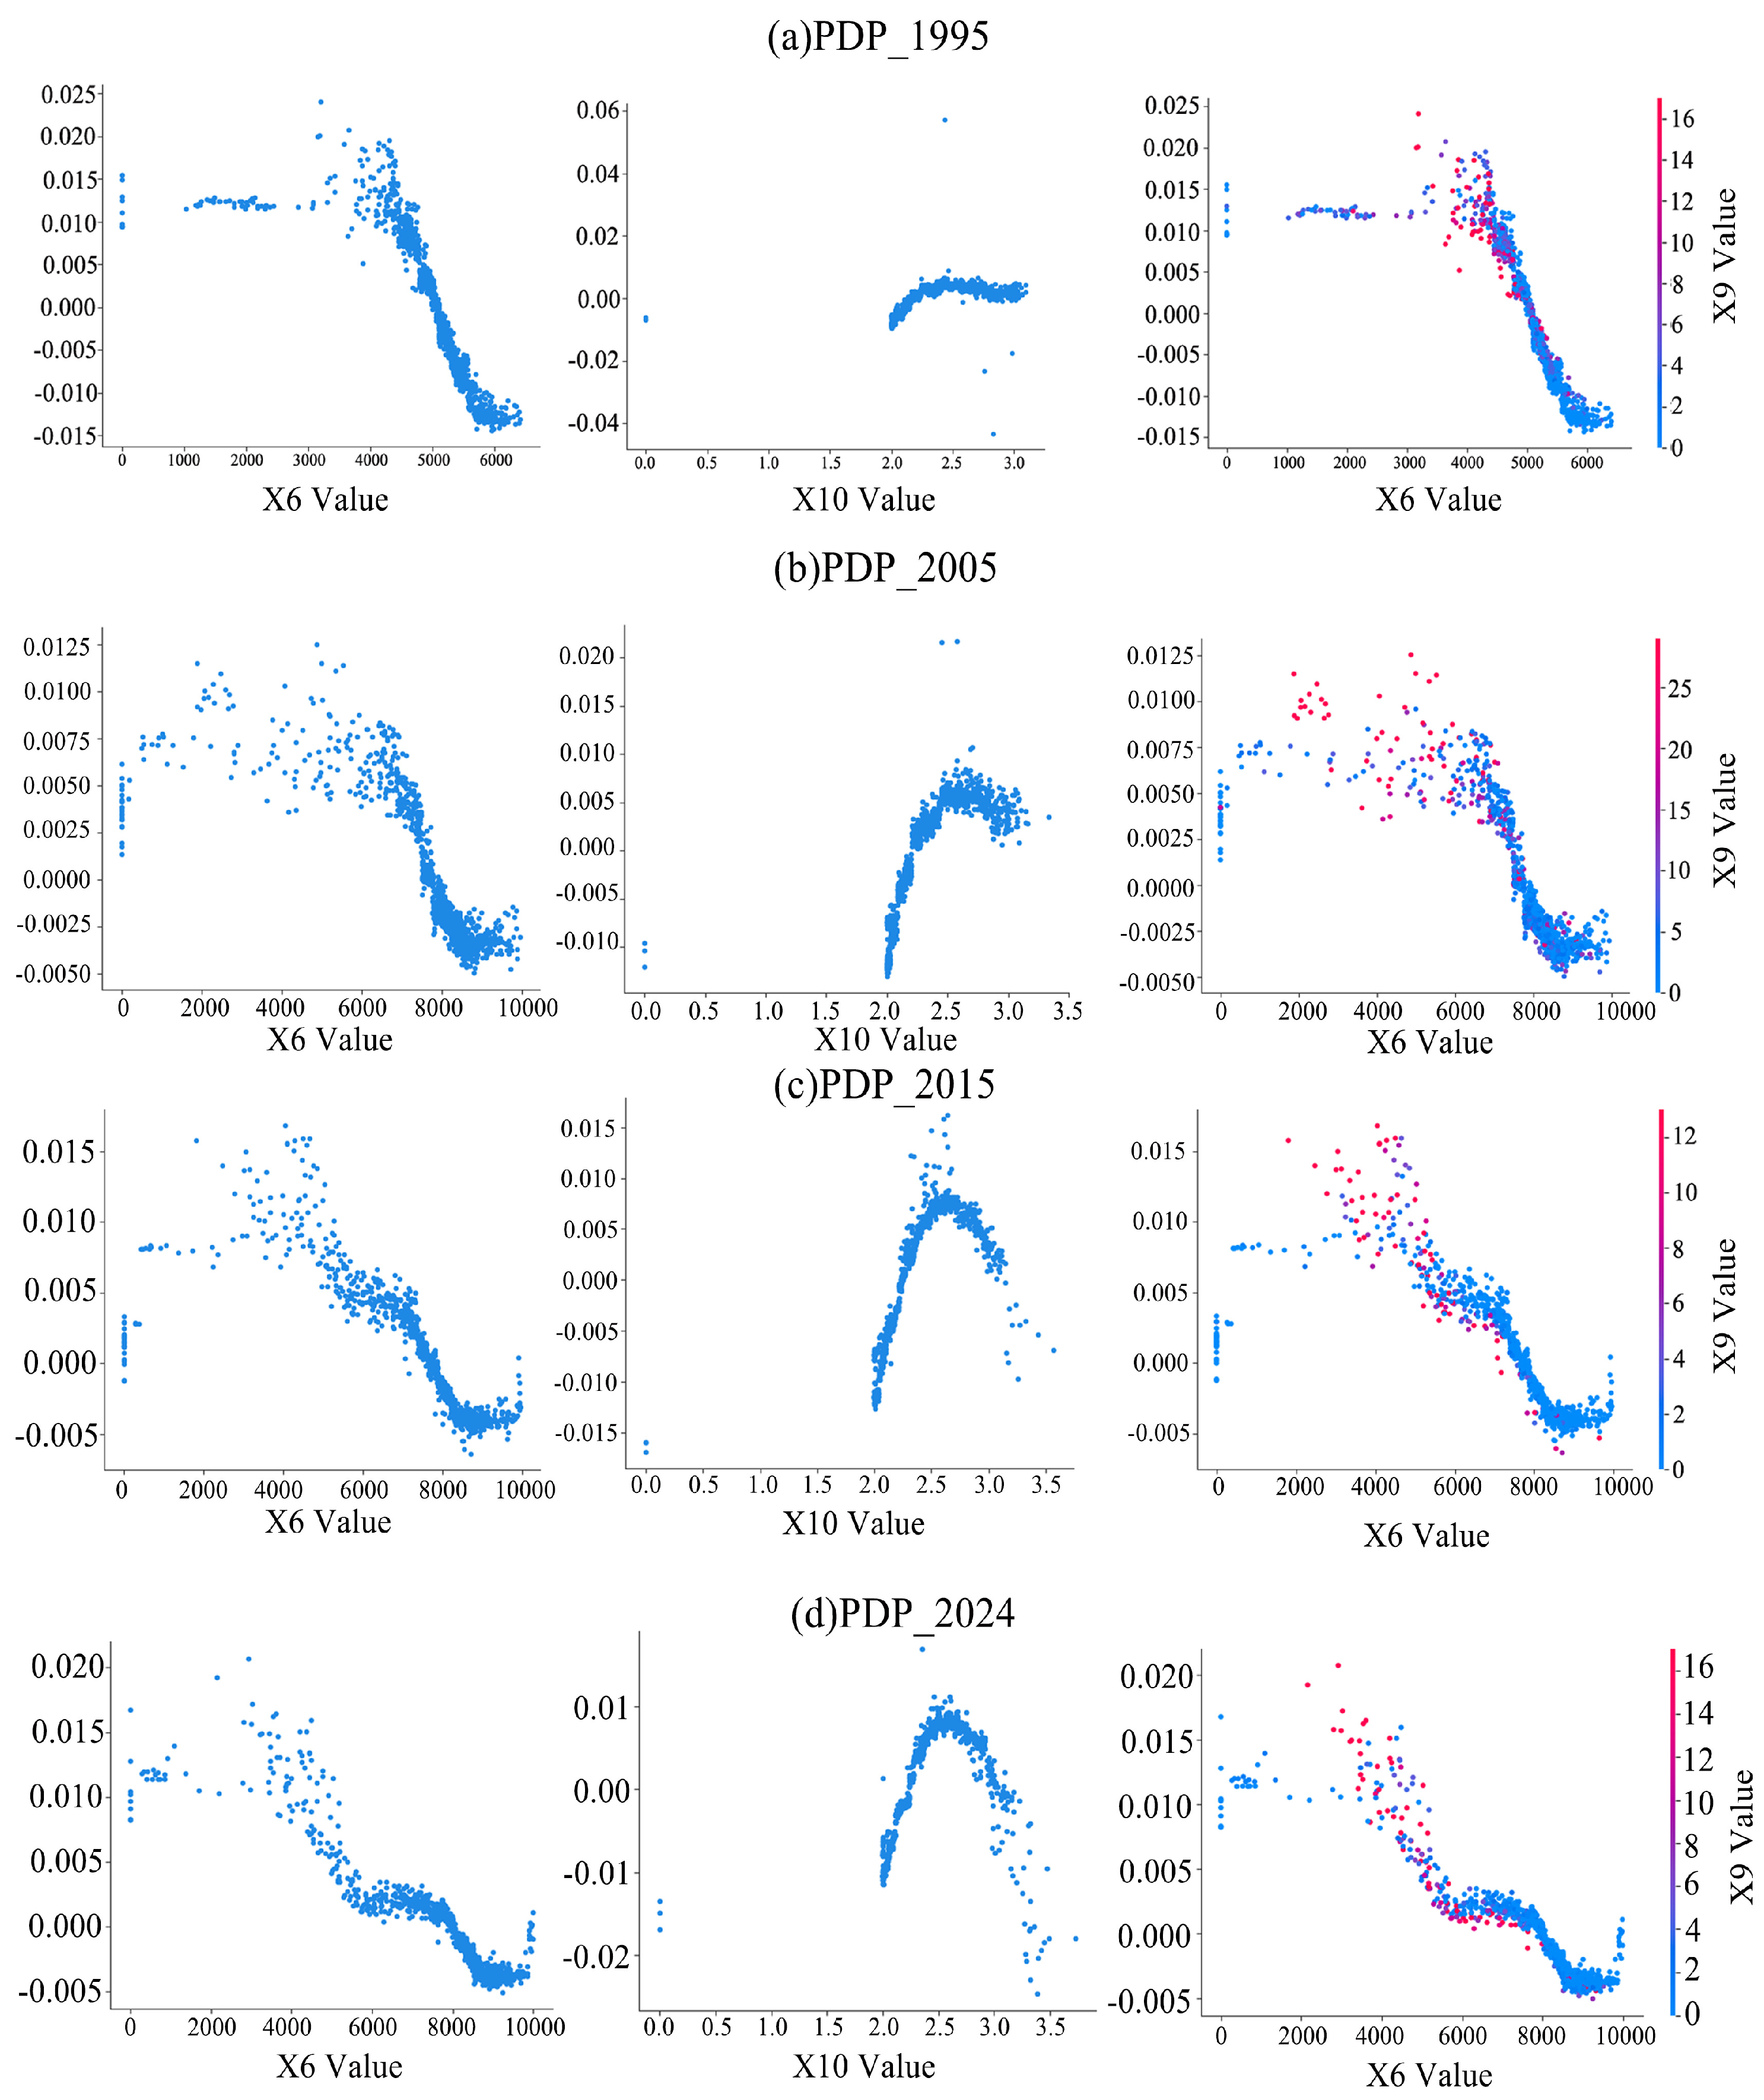
To demonstrate the marginal effects of single or multiple features on the model prediction results, the partial dependence plots (PDPs) of X6, X10, and the combination of X6 and X9 were plotted for the period from 1995 to 2024 (Figure 9 shows the partial dependence plot for predicted values, and comparisons are only made within this figure. The ERI classification scheme in Figure 6 is not shared with Figure 9).
In 1995, when X6 (Normalized Difference Vegetation Index, NDVI) was assumed to range from 0 to 3000, the landscape ecological risk index (ERI) showed no significant fluctuations (Figure 9a). When X6 was assumed to range from 3000 to 4500, it exerted a positive impact on ERI; beyond this threshold, it had a negative impact on ERI. For X10 (Land use intensity), when its value ranged from 0 to 0.2, the ERI showed no obvious fluctuations; when X10 was assumed to exceed 2.0, it exerted a positive impact on ERI. In the bivariate dependence plot of X6 and X9 (Night-time light index), X9 had a positive impact when its value ranged from 0 to 8, and this impact increased sharply beyond 8. The influence directions on ERI were opposite between X6 ranging from 3500 to 5000 and X9 ranging from 8 to 14—an increase in the Night-time light index within this interval may reduce the mitigating effect of NDVI on landscape ecological risk.
As shown in Figure 9b, in 2005, the negative impact of X6 on the landscape ecological risk index (ERI) was triggered later with weakened intensity; the positive effect of X10 on ERI increased significantly after its value exceeded 2.0; and X9 exerted a more significant positive impact on ERI within the range of 15–25, further weakening the regulation of the negative influence of X6 on ERI.
As shown in Figure 9c, in 2015, the influence direction of X6 on ERI was roughly consistent with that in 2005. The positive impact of X10 on ERI within the range of 2.0–2.7 was more significant than in the previous two periods. X9 had an obvious positive impact on ERI in the range of 15–25 and a distinct negative impact in the range of 0–10.
As shown in Figure 9d, in 2024, the negative impact of X6 on ERI became more significant within the range of 0–6000. Within the same value interval as in previous periods, X10 still had a positive impact on ERI, but the effect weakened. That is to say, although the increase in Land use intensity would raise ERI, the magnitude of the increase became smaller. It is worth noting that, although X10 appeared to exert a negative impact on ERI when its value exceeded 2.5, this effect was actually negligible. The trend of ERI was roughly consistent when X6 ranged from 2000 to 7000 and X9 ranged from 4 to 16. This indicates that, by 2024, if the Night-time light index falls within the range of 4–16, the NDVI index should be maintained within the corresponding range to keep ERI relatively stable.

3.4.3. Comparison of Random Forest Prediction Models

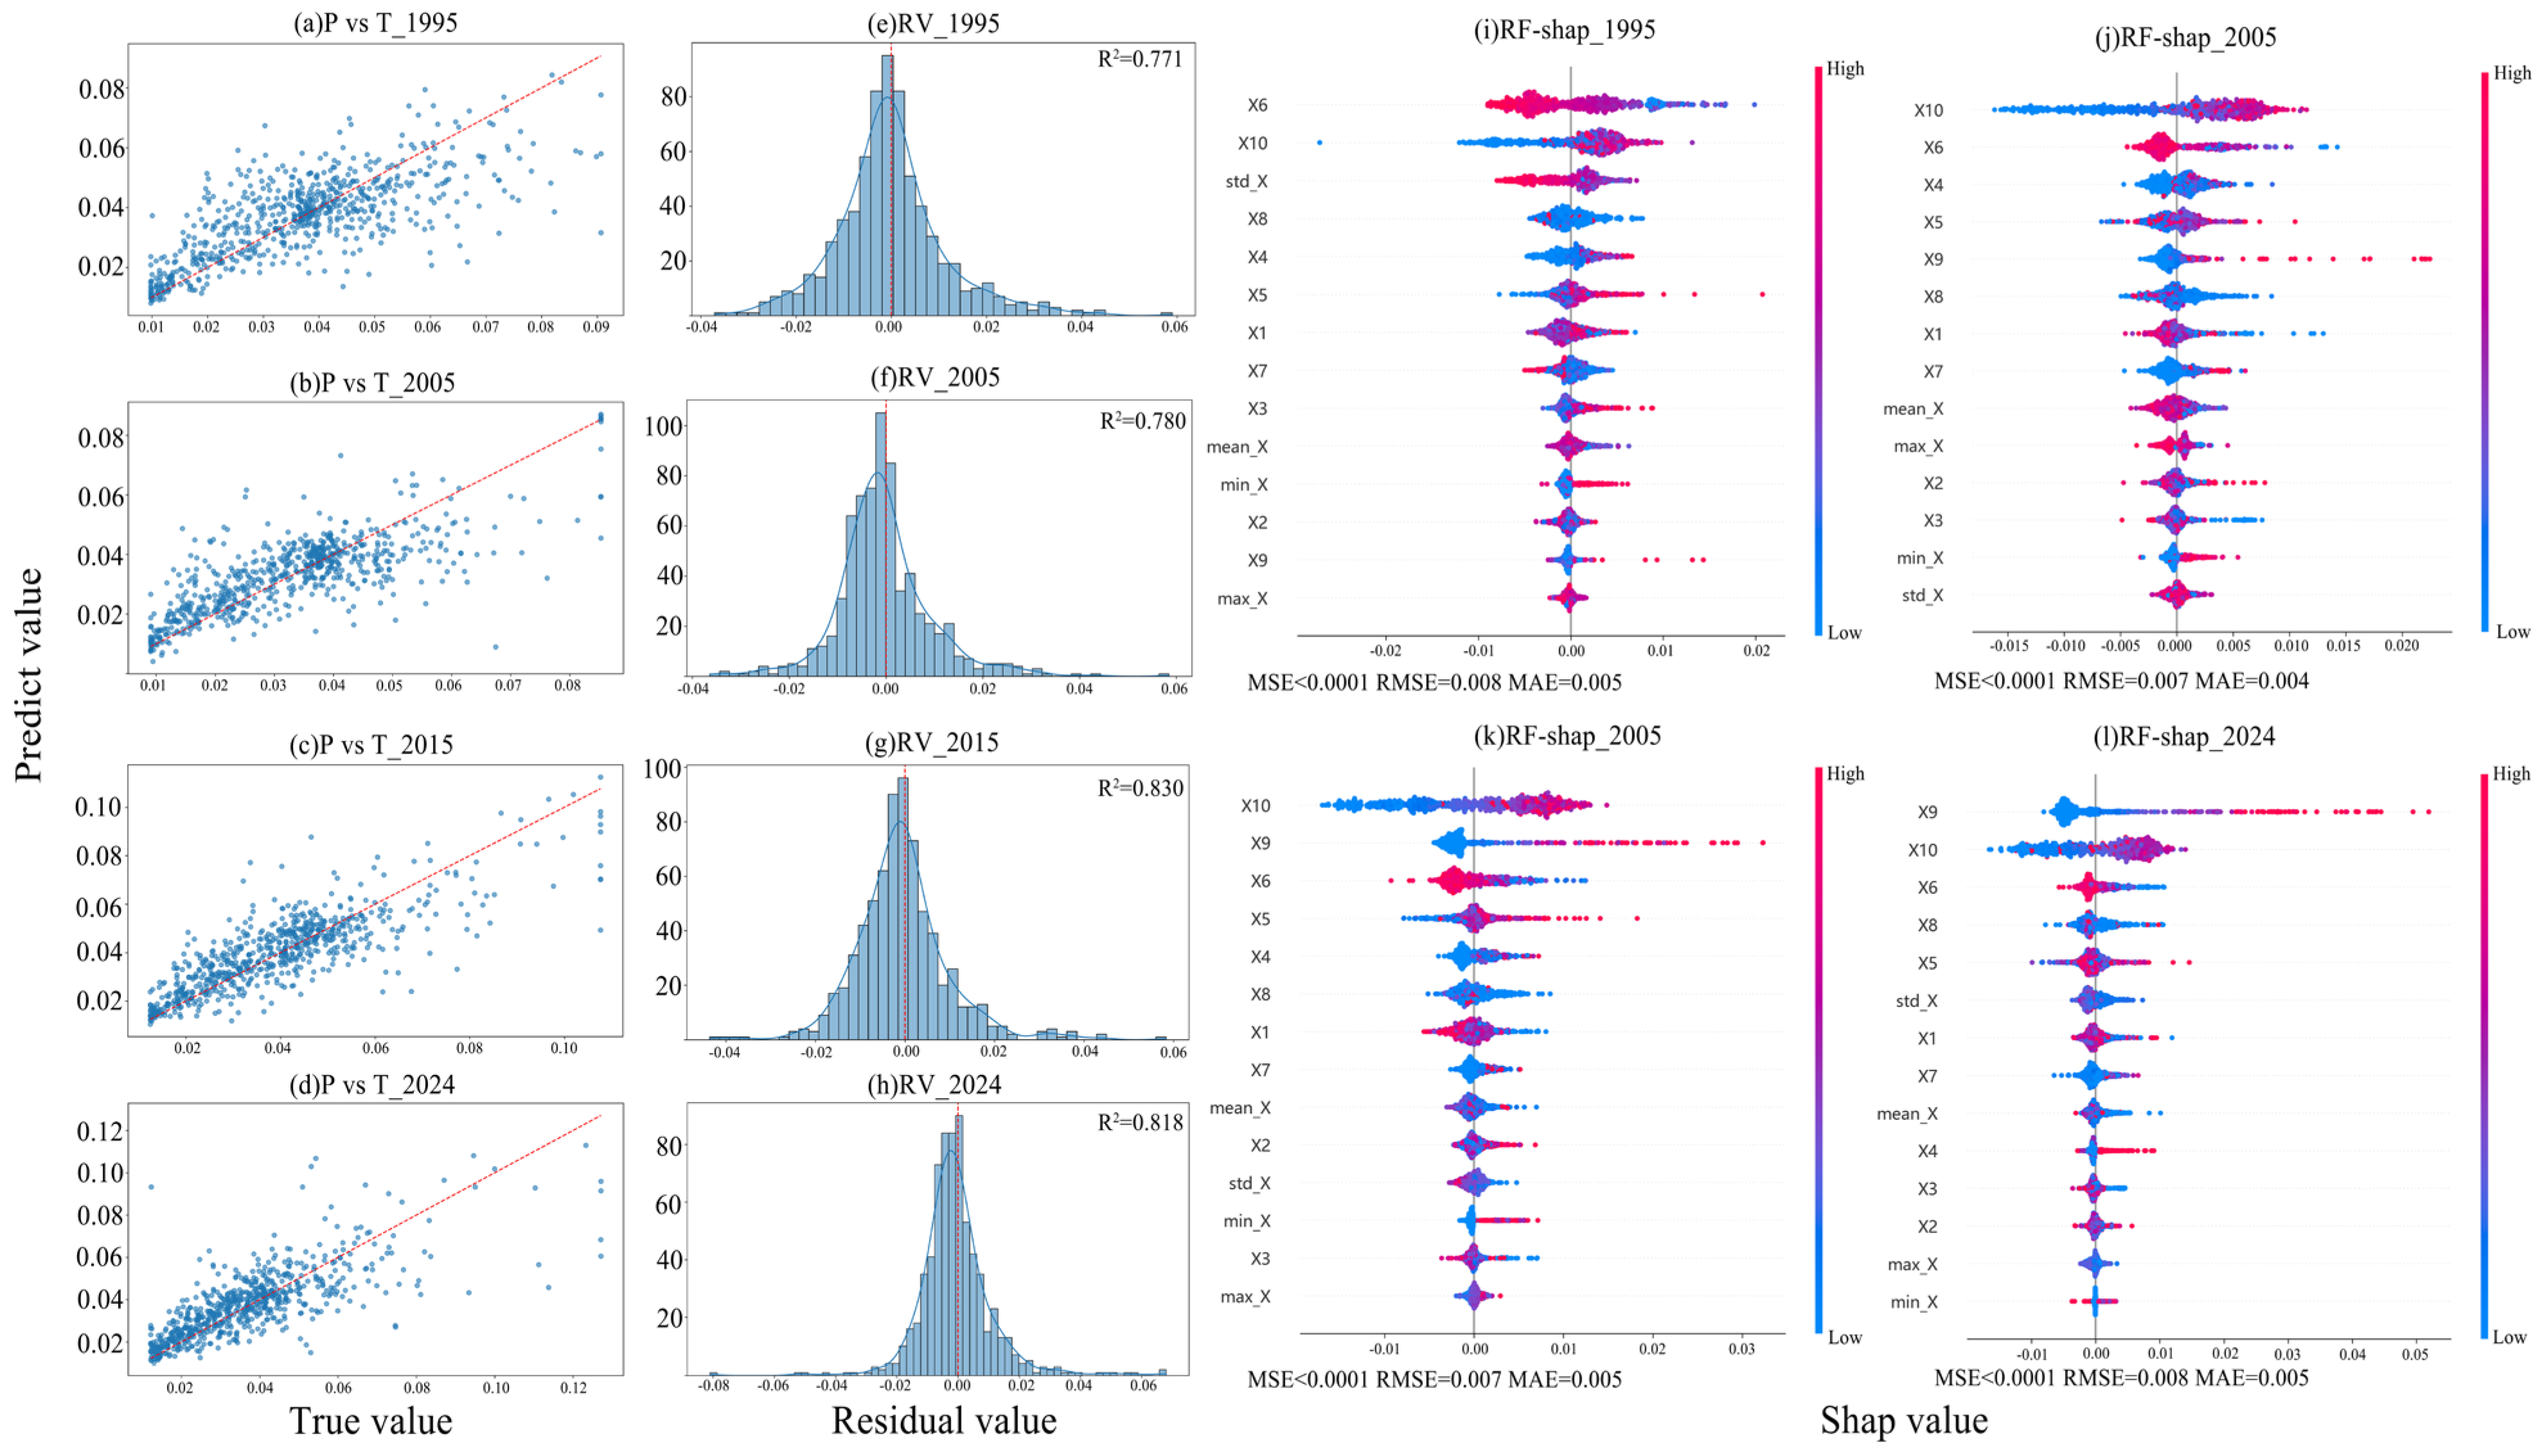
After the triple robustness tests of data, model, and evaluation—covering resistance to extreme values and missing data, model regularization, and multi-dimensional evaluation (anti-bias)—we finally verified the stability of the model under different data distributions and subsets through cross-validation, multi-model comparison, and visual validation. The results are as follows: The predicted vs. true (P vs. T) values (In the scatter plot, the red dashed line represents the ideal fitting curve of y = x, indicating a perfect prediction state where the predicted value equals the true value.), Residual Value (RV) distribution, and SHAP values generated by the Random Forest model reveal the variation patterns between driving factors and ERI from three dimensions (Figure 10).
(1) From the perspective of model fitting effect (Figure 10a–d), the predicted and true values showed a significant positive correlation from 1995 to 2024. The model could capture the basic correlation between driving factors and ERI but generally exhibited weak predictive ability for extreme values; however, the model accuracy meets the research requirements. (2) From the perspective of error structure (Figure 10e–h), the residual peaks were concentrated around 0 and approached a normal distribution during 1995–2024, indicating that the prediction errors of most samples were small, with a small number of extreme residuals and a reasonable error structure. (3) From the perspective of feature importance (see Figure 10i–l), the results were basically consistent with the XGBoost model from 1995 to 2024. X6 (NDVI), X9 (Night-time light index), and X10 (Land use intensity) were the most influential features on the model output, with the dominant features shifting from X6 to X10 and then to X9. This indicates that the influence of NDVI gradually weakened, while the influence of the Night-time light index and Land use intensity increased—consistent with the partial dependence plots (PDPs) of the XGBoost model.

3.5. Landscape Ecological Risk Control Strategies

After analyzing the variation characteristics of landscape ecological risk and exploring its driving factors, goal-constrained strategies for landscape ecological risk management and control are proposed (see Figure 11).
Zone A has the widest distribution and remained a Low-risk area across all four periods. This zone contains a large number of mountains, forests, and rivers, such as the Woyun Mountain Tourist Area, Muyang River, Nanpan River, Xishan Scenic Area, Tanglangchuan River, and Yuxi River. Strict water source protection policies should be implemented, prohibiting any water-polluting activities within water source protection areas [57]. The legal and regulatory system for forest reserves and nature reserves should be improved: Based on vegetation types (e.g., broad-leaved forests) and potential habitat distribution of internal organisms, the scope of protected areas should be refined and clearly defined (Table 6); any form of illegal logging, hunting, mining, or other activities should be prohibited, and long-term monitoring of vegetation coverage (NDVI) and key species should be carried out to ensure the integrity of forest resources and biodiversity [58].
Zone B ranks second in terms of distribution, and all of the five lakes are included in this zone (Figure 11). Among them, Yangzonghai Lake, the southern part of Fuxian Lake, and the southern part of Qilu Lake face the risk of upgrading to Zone C, while most areas of Jiangchuan District and Chengjiang City are located in Zone B. This type of zone needs to combine prevention of risk escalation with ecological restoration: improve ecological revetments of inflow rivers, upgrade agricultural basic irrigation facilities to reduce agricultural non-point source pollution [59]; strictly prohibit the construction of buildings and structures along river and lake banks; integrate local nature reserve planning, promote the conversion of Cultivated land to Grass land and lakes within the scope of the “Three Zones and Three Lines”; improve domestic sewage discharge pipeline facilities and water purification facilities, install water quality monitoring equipment around lakes and along rivers, and synchronize monitoring of vegetation types (Table 6) and associated organisms to advance the prevention of risk escalation [60].
Zone C has further reduced in area, mainly distributed in the urban built-up area in the northern part of Dianchi Lake, Anning City, and Hongta District, with scattered distribution around the five lakes (Figure 11). These zones are generally socio-economically developed, characterized by low vegetation coverage and dense buildings. Priority should be given to the implementation of soil and water conservation projects in these areas to improve vegetation coverage [61]: increase public green spaces in urban areas, restore green spaces in wasteland, add green barriers along roads, and lay permeable underlying surfaces. Meanwhile, urban development should be controlled within the scope of the protected area (Yuxi Hongta Mountain Municipal Nature Reserve in HT), and stock renewal should be carried out to avoid encroaching on ecological corridors connecting protected areas [62].
Zone D is mainly distributed in the central urban area of Kunming City (Figure 11). According to the change trend of landscape ecological risk, the risk in this zone is expanding year by year, and urgent risk control measures are required. This zone should prioritize ecological restoration measures and severely crack down on illegal discharge of pollutants and activities that damage the ecological environment [63]. According to the Regulations on the Implementation of the Forest Law of the People’s Republic of China, it is necessary to change the urban construction and development model, optimize the land use structure, implement the Grain for Green project for sloping Cultivated land with a Slope of more than 25 degrees, and alleviate road-induced landscape fragmentation.
Zone E is decreasing year by year, but its risk should not be underestimated (Figure 11). It is necessary to continuously improve urban planning, promote highly intensive land use, and enhance landscape connectivity. Meanwhile, the urban ecological environment monitoring system should be improved to identify damaged landscapes and implement targeted ecological restoration measures—synchronously monitoring vegetation types (such as broad-leaved forests in study area fringe protected areas) and associated organisms to ensure the effectiveness of ecological risk reduction [64].

4. Discussion

4.1. Evolution Mechanism of Landscape Ecological Risk

From 1995 to 2005, land use transfer was dominated by the conversion between Cultivated land, Grass land, and Forest land, with Construction land accounting for a low proportion. This low-intensity land use change, reflected by the comprehensive land use dynamic degree (CDD) of only 0.66% (the lowest among the three periods, Table 4), resulted in minimal disturbance on the landscape pattern, and the Low–medium risk area even shrank in 2005 compared with 1995 [65]. To promote the urbanization rate, the Yunnan Provincial Government issued a series of migration and household registration policies as well as land reform policies. A large number of rural residents flocked to cities, especially in Wuhua District, Panlong District, Guandu District, and Xishan District. Urban construction and development encroached on Cultivated land and ecological land, fragmenting continuous landscapes, increasing landscape fragmentation and loss degree, and leading to the expansion of High-risk areas [66]. From 2005 to 2015, the frequency of land use transfer increased, with more frequent conversions between Grass land, Forest land, and Cultivated land, while the area of converted-in Construction land expanded. Such frequent land use conversions undermined the stability of the landscape pattern [67]. On the one hand, the construction of Chenggong New District in Kunming and urban peripheral development in areas such as Hongta District of Yuxi occupied a large amount of Cultivated land. On the other hand, the Grain for Green policy was implemented in mountainous areas and around Dianchi Lake and Fuxian Lake to adjust the agricultural structure by cultivating economic forests; meanwhile, the “Four Retirements and Three Restorations” policy was introduced in lakeside areas to guide the withdrawal of population and industries. From 2015 to 2024, ecological environment governance policies continued to be intensified, and the High-risk areas further shrank; however, the Medium–high-risk and Medium-risk areas had spread from the central to the northern part of the study area. On the one hand, Yunnan Province implemented large-scale national land greening and river-lake pollution prevention and control. On the other hand, agricultural non-point source pollution remained severe: The water quality of the five lakes had long been classified as Grade V inferior or failed to meet the standards, and the problem of direct discharge of domestic sewage was prominent, leading to the expansion of Medium–high-risk areas [36,68].

4.2. Influence Mechanism of Driving Factors

In 1995, the higher the NDVI, the lower the ERI; the higher the Land use intensity, the higher the ERI. By 2024, NDVI had dropped to the third place in terms of feature importance, indicating that the intensity of human activity disturbance had exceeded the ecological buffering capacity of vegetation, and simply increasing vegetation coverage could not effectively reduce ecological risk. Topographic factors, including X1, X2, and X3, had a weak direct impact on ERI. From 1995 to 2024, the impact of Precipitation has been consistently bidirectional: According to Reference [69], rainfall duration and rainfall amount are significantly positively correlated with Slope runoff and erosion. Moderate Precipitation promotes vegetation growth and increases the NDVI value, thereby mitigating landscape disturbance and reducing erosion intensity. In contrast, excessive Precipitation may intensify surface runoff, which in turn exacerbates soil erosion in plateau lake basins and further increases the degree of landscape disturbance and erosion intensity. Precipitation is therefore an unstable influencing factor, and enhancing soil and water conservation capacity is crucial for alleviating the potential negative impacts of excessive Precipitation. The Night-time light index reflects urban expansion, and ERI has increased with the advancement of urbanization. The impacts of Population density and Per capita GDP have been bidirectional: In the early stage of development, extensive growth led to an increase in ERI; in the later stage, the improvement of urban planning and the guidance of ecological governance policies have slightly reduced ERI.

4.3. Rationality of Policy Strategies

The Comprehensive Governance Zone for Water Conservation and Human Settlement Improvement of Plateau Lakes in Central Yunnan, as defined in the Yunnan Provincial Territorial Spatial Ecological Restoration Plan (2021–2035), is consistent with the previously proposed landscape ecological risk management and control strategies in the ecological restoration and comprehensive territorial improvement planning. Meanwhile, the research area falls within the key project zone of the Southeast Yunnan Rocky Desertification Ecological Restoration Belt, aligning with the plan’s key restoration task of shifting from single-lake governance to regional integrated governance. In the optimization of Yunnan Province’s ecological function zone pattern, the research area is situated within the Northeast Yunnan–Central Yunnan Soil and Water Conservation Corridor, further verifying the rationality of the soil and water conservation measures proposed in this study.

4.4. Limitations and Future Research

This study still has certain limitations. In terms of factor selection, the consideration of natural driving factors in the Dianzhong Five Lakes region is insufficient. In the future, factors such as biodiversity will be added. Regarding socio-economic factors, indicators like social net primary productivity (SNPP) will be incorporated for further analysis. In terms of model validation, there are limitations due to the machine learning model remaining to be further developed. Additionally, there are limitations in the consideration of future landscape ecological risk (ERI). Future research will conduct in-depth multi-scenario simulations of ERI and explore the risk evolution mechanism of the Dianzhong Five Lakes region from the perspective of proactive risk avoidance.

5. Conclusions

This study, by employing land use transfer and dynamic degree, landscape pattern indices and risk indices, the XGBoost-SHAP model, and the Random Forest model, conducted calculation and visualization of the spatiotemporal evolution of landscape ecological risk, and an exploration of driving factors for the four periods of 1995, 2005, 2015, and 2024. It also discussed the evolution mechanism of ecological risk and the influence mechanism of driving factors in the study area. Finally, based on the above analysis, targeted landscape ecological risk control strategies were proposed. The conclusions are as follows:
(1) From 1995 to 2024, land use transfer in the study area was mainly characterized by the mutual conversion between Cultivated land, Forest land, and Grass land. The area of converted-in Construction land was greater than converted-out, showing a trend of frequent overall conversions during the research period.
(2) The landscape pattern was unstable, and the landscape loss degree of various land use types showed an overall upward trend. The landscape risk level fluctuated upward in the study period, with Medium- and Medium–high-risk areas expanding significantly from 2005 to 2015 and slightly contracting in 2015–2024, while High-risk areas presented a continuous shrinking trend.
(3) The driving factors shifted from being dominated by natural factors to socio-economic factors. By 2024, a shift from natural to socio-economic driving factor dominance was fully manifested in the study area.
(4) Combined with the risk levels and their fluctuation characteristics, preliminary zoning-based landscape ecological risk control strategies were proposed. Led by policy control, the strategies primarily focus on improving the planning of urban infrastructure, optimizing the land use structure, and strengthening soil and water conservation capacity, which can provide a preliminary scientific reference for local ecological risk management.

Author Contributions

Conceptualization, Z.L. and Y.L.; methodology, Z.L. and X.D.; software, Z.L. and X.D.; formal analysis, X.D. and Y.L.; investigation, Y.L. and S.W.; data curation, H.W. and Y.Y.; writing (original draft preparation), Z.L. and X.D.; writing (review and editing), Y.L. and Z.L. and X.D.; visualization, T.Z. and S.W.; project administration, Y.L. and Z.L.; supervision, Y.Y. and X.D. All authors have read and agreed to the published version of the manuscript.

Funding

This work was supported by the National Natural Science Foundation of China (Grant No. 52368008), the project of Yunnan Provincial Department of Education (Grant No. 2025Y0023), and the Graduate Student Research Innovation Program (Grant No. KC-24249203).

Data Availability Statement

The raw data supporting the conclusions of this article will be made available by the authors on request.

Conflicts of Interest

The authors declare no conflicts of interest.

References

  1. Peng, J.; Xu, D.M.; Tang, H.; Jiang, H.; Dong, J.Q.; Wu, J.G. A landscape ecological approach to spatial conservation planning–ecological security pattern. Trends Ecol. Evol. 2025, 40, 1010–1022. [Google Scholar] [CrossRef] [Scilit]
  2. Wen, Z.Q.; Li, X.; Liu, B.; Li, T.H. A comprehensive evaluation method for plateau freshwater lakes: A case in the Erhai Lake. Ecosyst. Health Sustain. 2021, 7, 1993753. [Google Scholar] [CrossRef] [Scilit]
  3. Adili, A.; Wu, B.; Chen, J.Y.; Wu, N.; Ge, Y.X.; Abuduwaili, J. Assessment of landscape ecological risk and its driving factors for the Ebinur Lake Basin from 1985 to 2022. Land 2023, 13, 1572. [Google Scholar] [CrossRef] [Scilit]
  4. Yang, J.L.; Wen, W.W.; Hu, X.R.; Huang, L.P.; Chen, L.; Lu, H.B.; Chen, G.J. Spatiotemporal Variations and Driving Mechanisms of Water Quality in Nine Plateau Lakes of Yunnan from 2013 to 2022. Res. Environ. Sci. 2025, 38, 1300–1311. [Google Scholar] [CrossRef]
  5. Guo, J.P.; Shen, B.B.; Li, H.X.; Wang, Y.D.; Tuvshintogtokh, I.; Niu, J.M.; Potter, M.A.; Yonghong, F. Past dynamics and future prediction of the impacts of land use cover change and climate change on landscape ecological risk across the Mongolian plateau. J. Environ. Manag. 2024, 355, 120365. [Google Scholar] [CrossRef] [Scilit]
  6. Kang, L.X.; Yang, X.; Gao, X.; Zhang, J.X.; Zhou, J.; Hu, Y.P.; Chi, H.X. Landscape ecological risk evaluation and prediction under a wetland conservation scenario in the Sanjiang Plain based on land use/cover change. Ecol. Indic. 2024, 162, 112053. [Google Scholar] [CrossRef] [Scilit]
  7. Zeng, J.; Wu, J.H.; Chen, W.X. Coupling analysis of land use change with landscape ecological risk in China: A multi-scenario simulation perspective. J. Clean. Prod. 2024, 435, 140518. [Google Scholar] [CrossRef] [Scilit]
  8. Dadashpoor, H.; Azizi, P.; Moghadasi, M. Land use change, urbanization, and change in landscape pattern in a metropolitan area. Sci. Total Environ. 2019, 655, 707–719. [Google Scholar] [CrossRef] [Scilit] [PubMed]
  9. Du, L.D.; Dong, C.; Kang, X.C.; Qian, X.L.; Gu, L.X. Spatiotemporal evolution of land cover changes and landscape ecological risk assessment in the Yellow River Basin, 2015–2020. J. Environ. Manag. 2023, 332, 117149. [Google Scholar] [CrossRef] [Scilit] [PubMed]
  10. Chang, S.; Wei, Y.Q.; Dai, Z.Z.; Xu, W.; Wang, X.; Duan, J.J.; Zou, L.; Zhao, G.R.; Ren, X.Y.; Feng, Y.Z. Landscape ecological risk assessment and its driving factors in the Weihe River basin, China. J. Arid. Land 2024, 16, 603–614. [Google Scholar] [CrossRef] [Scilit]
  11. Jia, L.; Yu, K.X.; Li, Z.B.; Li, P.; Cong, P.J.; Li, B.B. Spatiotemporal pattern of landscape ecological risk in the Yangtze River Basin and its influence on NPP. Front. For. Glob. Change 2024, 6, 1335116. [Google Scholar] [CrossRef] [Scilit]
  12. Xu, M.L.; Matsushima, H. Multi-dimensional landscape ecological risk assessment and its drivers in coastal areas. Sci. Total Environ. 2024, 908, 168183. [Google Scholar] [CrossRef] [Scilit] [PubMed]
  13. Fu, G.; Xiao, N.; Qi, Y.; Wang, W.; Li, J.; Zhao, C.; Cao, M.; Xia, J. Fusing multidimensional hierarchical information into finer spatial landscape metrics. Ecol. Evol. 2021, 11, 15225–15236. [Google Scholar] [CrossRef] [Scilit] [PubMed]
  14. Li, M.; Zhang, L.L.; Chen, Y.Y.; Liu, S.L.; Cai, M.Y.; Sun, Q.Q. Construction of Landscape Ecological Risk Collaborative Management Network in Mountainous Cities-A Case Study of Zhangjiakou. Land 2024, 13, 1586. [Google Scholar] [CrossRef] [Scilit]
  15. Huang, L.Y.; Yuan, L.C.; Xia, Y.Y.; Yang, Z.Y.; Luo, Z.L.; Yan, Z.; Li, M.Y.; Yuan, J.A. Landscape ecological risk analysis of subtropical vulnerable mountainous areas from a spatiotemporal perspective: Insights from the Nanling Mountains of China. Ecol. Indic. 2023, 154, 110883. [Google Scholar] [CrossRef] [Scilit]
  16. Ai, J.W.; Yu, K.Y.; Zeng, Z.; Yang, L.Q.; Liu, Y.F.; Liu, J. Assessing the dynamic landscape ecological risk and its driving forces in an island city based on optimal spatial scales: Haitan Island, China. Ecol. Indic. 2022, 137, 108771. [Google Scholar] [CrossRef] [Scilit]
  17. Wang, G.Y.; Ran, G.Y.; Chen, Y.N.; Zhang, Z.Y. Landscape Ecological Risk Assessment for the Tarim River Basin on the Basis of Land-Use Change. Remote Sens. 2023, 15, 4173. [Google Scholar] [CrossRef] [Scilit]
  18. Sun, L.R.; Zhou, D.M.; Cen, G.Z.; Ma, J.; Dang, R.; Ni, F.; Zhnag, J. Landscape ecological risk assessment and driving factors of the Shule River Basin based on the geographic detector model. Arid. Land Geogr. 2021, 44, 1384–1395. [Google Scholar]
  19. Xiao, W.J.; Fan, Y.; Li, X.; Wang, X. Multi-scenario Simulation of Land Use Change and Carbon Storage Assessment in Jinan Metropolitan Area. Environ. Sci. 2025, 46, 7083–7093. [Google Scholar] [CrossRef] [Scilit]
  20. Cao, S.; Jin, X.B.; Yang, X.H.; Sun, R.; Liu, J.; Han, B.; Xu, W.Y.; Zhou, Y.K. Coupled MOP and GeoSOS-FLUS models research on optimization of land use structure and layout in Jintan district. J. Nat. Resour. 2019, 34, 1171–1185. [Google Scholar] [CrossRef] [Scilit]
  21. Zhan, W.T.; Wu, Y.F.; Zheng, W.W.; Zhang, H.; Zhang, B.L. Impacts of Changes of Multi-temporal Land Use/Landscape Patterns on Water Quality in the Yellow River Basin: An Empirical Study Based on Geographically Weighted Regression Modeling. Environ. Sci. 2025, 46, 6233–6243. [Google Scholar] [CrossRef] [Scilit]
  22. Qiao, Y.J.; Xu, W.G.; Liu, K.; Pei, W.M.; Wang, Z.; Han, X.Y.; Zhang, H. Spatio-temporal evolution of vegetation NPP in Heilongjiang Province based on the multi-scale geographically weighted regression model. Acta Ecol. Sin. 2025, 45, 4878–4888. [Google Scholar] [CrossRef]
  23. Bai, L.; Yu, Y.X.; Jiang, L.; Liao, T.H. Spatial Pattern of Digital Industry in the Yangtze River Economic Belt and Driving Factors: Evidence from Firm-level Data. Resour. Environ. Yangtze Basin 2025, 34, 2145–2153. [Google Scholar] [CrossRef]
  24. Shamuxi, A.; Han, B.; Wusimanjiang, P.; Abudukerimu, A.; Chen, Q.L.; Zhou, H.T.; Gong, M. Spatial pattern and driving mechanisms of dryland landscape ecological risk: Insights from an integrated geographic detector and machine learning model. Ecol. Indic. 2025, 172, 113305. [Google Scholar] [CrossRef] [Scilit]
  25. Wang, J.F.; Liu, Y.T.; Liu, Y.Q. Impact of built environment on urban vitality and its spatial heterogeneity based on OPGD and MGWR: A case study of Guangzhou. Geogr. Res. 2025, 44, 3304–3321. [Google Scholar] [CrossRef]
  26. Chen, Y.; Tan, B.Y.; Guo, Y.Z. Analysis of the Spatiotemporal Evolution and Driving Factors of Green and Low-Carbon Development in the Yangtze River Delta Region. Res. Environ. Sci. 2025, 38, 2136–2144. [Google Scholar] [CrossRef]
  27. Yao, X.; Chen, X.; Wang, X.W. Analysis of Spatiotemporal Evolution and Driving Factors of Ecological Environment Quality in the Min Delta Urban Agglomeration Based on XGBoost-SHAP Model. Environ. Sci. 2025. [Google Scholar] [CrossRef] [Scilit]
  28. Liu, D.Y.; Dong, W.Z.; Gou, R.; Su, W.C. Spatial and temporal evolution of ecosystem service supply and demand and analysis of driving factors in Chongqing based on InVEST model and XGBoost-SHAP [J/OL]. Environ. Sci. 2025. [Google Scholar] [CrossRef] [Scilit]
  29. Gan, Z.Q.; Dong, H.Y.; Shi, S.; Qu, C. Spatio temporal Evolution and Driving Forces of Landscape Ecological Risk in Harbin City Based on Interpretable Machine Learning. Environ. Sci. 2025. [Google Scholar] [CrossRef]
  30. Bao, S.W.; Yu, C.Z.; Wan, Z.Y. Spatial mismatch and attribution analysis of flood risk and resilience in megacities: Insights from a “Risk-Resilience-Effect” framework and an interpretable XGBoost-SHAP model. Sustain. Cities Soc. 2025, 131, 106758. [Google Scholar] [CrossRef] [Scilit]
  31. He, J.J.; Shi, Y.J.; Xu, L.H.; Lu, Z.W.; Feng, M.; Tang, J.Q.; Guo, X.D. Exploring the scale effect of urban thermal environment through XGBoost model. Sustain. Cities Soc. 2024, 114, 105763. [Google Scholar] [CrossRef] [Scilit]
  32. Pei, B.; Chen, S.L. Quantifying and revealing cultivated land ecological compensation performance: A machine learning-based approach. Environ. Impact Assess. Rev. 2025, 115, 108016. [Google Scholar] [CrossRef] [Scilit]
  33. Li, L.N.; Xia, R.; Dou, M.; Zhang, K.; Chen, Y.; Jia, R.; Li, X.; Dou, J.; Li, X.; Hu, Q.; et al. Integrated machine learning reveals aquatic biological integrity patterns in semi-arid watersheds. J. Environ. Manag. 2024, 359, 121054. [Google Scholar] [CrossRef] [Scilit] [PubMed]
  34. Zhong, Y.; Dong, X.J. Spatio-temporal evolution and influencing factors of coupling coordination between new urbanization and comprehensive rural revitalization in Central China. Acta Geogr. Sin. 2025, 80, 1–32. [Google Scholar] [CrossRef]
  35. Chen, X.B.; Ding, W.R. Identification of key areas for ecological restoration of territorial space based on ecological security pattern: A case of five plateau lake basins in central Yunnan [J/OL]. J. Environ. Eng. Technol. 2023, 13, 2248–2260. [Google Scholar] [CrossRef]
  36. Lu, X.M.; Peng, S.Y.; Cai, F.C.; Peng, S.X.; Xiang, W.G. Impacts of Human Activities and Climate Change on Wetland Landscape Pattern of the Nine Major Plateau Lake Basins in Yunnan Province. Wetl. Sci. 2024, 22, 191–206. [Google Scholar] [CrossRef]
  37. Qian, T.T.; Liu, F.L.; Qi, Y.; Yao, W. Landscape pattern changes and response to ecosystem service value in plateau lake basin of central Yunnan. Res. Soil Water Conserv. 2026, 33, 1–12. [Google Scholar] [CrossRef]
  38. Zhen, Y.; Wu, Z.P.; Yin, Z.H.; Yang, X.Q.; Zhao, X.H. Study on spatio-temporal change of land use in Zoige County, Sichuan Province. Ecol. Sci. 2022, 41, 41–49. [Google Scholar] [CrossRef]
  39. Jia, Q. Evolution of Land Use and its Response of Ecosystem Service Value in Gongyi City of He’nan Province. Bull. Soil Water Conserv. 2020, 40, 249–258. [Google Scholar] [CrossRef]
  40. Zhao, M.S.; Wu, T.; Sheng, L.; Chen, X.J.; Zhang, D.Y.; Lu, Y.Y. Spatial Optimization Simulation of Land Use in Anhui Province Under the “Dual Carbon Goals”. Environ. Sci. 2025. [Google Scholar] [CrossRef] [Scilit]
  41. Gong, X.W.; Zhou, D.M.; Zhang, J.; Luo, S.Y.; Chen, J.K.; Gao, Y.J. Landscape ecological risk evaluation and degree of coupling coordination in Qingyang City from the perspective of production-living-ecological space. Arid. Zone Res. 2025, 42, 556–567. [Google Scholar] [CrossRef]
  42. He, M.C.; Dong, H.; Chen, L.M.; Zhou, Z.F. Driving factors and prediction of landscape ecological risk in typical karst basin—A case study in Dabang River basin. Bull. Soil Water Conserv. 2025, 45, 218–229. [Google Scholar] [CrossRef]
  43. Luo, Q.Q.; Liu, F.L.; Qian, T.T.; Qi, Y.; Yao, W. Spatiotemporal evolution and driving forces of landscape ecological risk in Yunnan border area. Res. Soil Water Conserv. 2026, 33, 396–404. [Google Scholar] [CrossRef]
  44. Chen, Z.Y.; Shi, H.S.; Li, W. Construction of ecological security pattern in Heilongjiang Province based on ecological risk assessment. J. Soil Water Conserv. 2026, 40, 414–425. [Google Scholar] [CrossRef]
  45. Pan, X.; Chen, P.; Fu, S.F.; Wu, J.; Chen, Q.H. Landscape ecological risk assessment in Xiamen by landscape pattern analysis. J. Appl. Oceanogr. 2024, 43, 771–780. [Google Scholar]
  46. Wang, C.W.; Yao, L.J.; Wang, Z.F.; Zhang, Q.; Xie, L. Landscape ecological risk assessment and driving factors analysis in the Three River Source Region from 2000 to 2020. Arid. Zone Res. 2024, 41, 1908–1920. [Google Scholar] [CrossRef]
  47. Chen, B.H.; Li, Z.; Su, F.; Zhang, M.S.; Liu, R.; Bai, J.H.; Zhang, Y.H.; Luo, H. Based on XGBoost+SHAP: Revealing the driving factors of ecological vulnerability in Sichuan Province and its ecological protection assessment. Geol. Bull. China 2026, 45, 105–120. [Google Scholar]
  48. Qiu, D.E.; Zhang, J.Y.; Qi, K.L.; Yang, X.X. Spatiotemporal evolution characteristics and critical driving factor threshold analysis of habitat quality in Sichuan province based on SHAP-interpretable machine learning. Acta Ecol. Sin. 2025, 45. [Google Scholar] [CrossRef]
  49. Yunnan Provincial Department of Water Resources. Soil and Water Conservation Bulletin of Yunnan Province (2024) [R/OL]. Available online: https://wcb.yn.gov.cn/html/2025/shuitubaochigongbao_0714/3061457.html (accessed on 14 July 2025).
  50. Wang, S.; Liu, F.L.; Chen, W.T.; Liu, Y.; Cai, W. Landscape ecological risk evaluation and driving factors in the lake basin of Central Yunnan Plateau. Chin. J. Eco-Agric. 2024, 32, 391–404. [Google Scholar] [CrossRef]
  51. Xie, Z.Y.; Yang, P.; Wang, Z.X.; Hu, X.S.; Zhang, L.Y. Identification of Urban Road Traffic Carbon Emission Driving Mechanisms Based on Interpretable Machine Learning. Environ. Sci. 2025. [Google Scholar] [CrossRef] [Scilit]
  52. Li, T.Y.; Xu, X.C.; Yang, X.; Cui, B.; Chen, H.A.; Zhao, X.Y.; Yuan, N.; Meng, F.Q. Prediction of nitrogen leaching from winter-wheat production in North China based on random forest and XGBoost. China Environ. Sci. 2025, 45, 343–354. [Google Scholar] [CrossRef]
  53. Liu, R.X.; Li, J.X.; Li, Y. Prediction model and environmental interpretation for the spatial pattern of plant diversity in the water-level fluctuation zone of reservoir based on XGBoost and SHAP. Acta Ecol. Sin. 2024, 44, 9652–9669. [Google Scholar] [CrossRef]
  54. Lei, K.X.; Zhang, H.Q.; Qiu, H.Q.; Wang, J.S.; Yu, H.Y.; Wang, X.Y.; Zhao, B.W. The spatiotemporal variation characteristics and influencing factors of ecosystem services in national parks. Acta Ecol. Sin. 2025, 45, 11442–11462. [Google Scholar] [CrossRef]
  55. Zhao, L.; Zhang, C.T.; Guo, F.Y.; Wu, D.T. Coordinated evolution and driving factors of green development and common prosperity in China. J. Nat. Resour. 2025, 40, 2177–2194. [Google Scholar] [CrossRef] [Scilit]
  56. Yang, F.; Jin, X.B.; Liu, J.; Zhang, X.; Song, J.; Li, Q.; Zhou, Y. Assessing landscape ecological risk in rapidly urbanized areas from the perspective of spatiotemporal dynamics. Trans. Chin. Soc. Agric. Eng. (Trans. CSAE) 2023, 39, 253–261. [Google Scholar] [CrossRef]
  57. Li, Q.; Wang, Y.; Li, L.; Zhang, H.; Wang, B. Ecological restoration scheme of lake basins on the karst plateau based on natural solution: Take nine lakes on the Yunnan Plateau as example. Cars Ologica Sin. 2023, 42, 391–401. [Google Scholar] [CrossRef]
  58. Li, Y.X.; Li, S.H.; Peng, S.Y. Temporal and Spatial Evolution of NDVI and Its Response Relation with the Climate in the Nine Plateau Lake Basins of Yunnan Province. Res. Soil Water Conserv. 2020, 27, 192–200. [Google Scholar] [CrossRef]
  59. Gan, J.; Wang, Z. Ecological restoration zoning identification and optimization strategies for Shanghai coastal zone based on landscape ecological risk and ecosystem service value. J. Appl. Oceanogr. 2025, 44, 131–145. [Google Scholar] [CrossRef]
  60. Shen, Y.; Wang, H.; Nie, X. Research on ecological restoration zoning in coastal zone based on landscape ecological risk and ecosystem service value: A case study of Fangchenggang City. J. Environ. Eng. Technol. 2024, 14, 1066–1076. [Google Scholar] [CrossRef]
  61. Xiang, A.M.; Zhao, X.Q.; Huang, P.; Yi, Q.; Pu, J.W.; Shi, X.Y.; Chu, B.C. Diagnosis and restoration of priority area of territorial ecological restoration in Plateau Lake Watershed. Acta Ecol. Sin. 2023, 43, 6143–6153. [Google Scholar] [CrossRef]
  62. Qiao, B.; Cao, X.Y.; Sun, W.J.; Gao, Y.Y.; Chen, Q.; Yu, H.Y.; Wang, Z.; Wang, N.A.; Cheng, H.Y.; Wang, Y.P.; et al. Ecological zoning identification and optimization strategies based on ecosystem service value and landscape ecological risk: Taking Qinghai area of Qilian Mountain National Park as an example. Acta Ecol. Sin. 2023, 43, 986–1004. [Google Scholar] [CrossRef] [Scilit]
  63. Zhong, Q.K.; Wang, Z.Y.; Wang, N.; Xi, F.R. Spatial differentiation characteristics and driving factors of landscape ecological risk in arid area of northern Shaanxi. Bull. Surv. Mapp. 2022, 7, 100–106. [Google Scholar] [CrossRef]
  64. Xiao, H.B.; An, Q.; Sheng, S.; Kuang, Y.L. Research on Urban Mountain Ecological Restoration and Classified Protection Strategies Based on Spatial Identification of Ecological Risk: Taking the West New District of Jinan City as an Example. J. Chin. Landsc. Archit. 2020, 36, 43–47. [Google Scholar] [CrossRef]
  65. Lin, W.; Li, S.H.; Wei, X.; Su, Y.; Zeng, J.Y. Ecological Risk Assessment of an Artificial Mangrove Wetland in Luoyang River Estuary Based on Landscape Pattern. J. Hydrogeol. 2025, 46, 50–62. [Google Scholar] [CrossRef]
  66. Zhang, G.; Ye, C.S. Effects of different habitat fragmentation processes on ecosystem services in Poyang Lake urban agglomeration. Res. Soil Water Conserv. 2025, 32, 329–340. [Google Scholar] [CrossRef]
  67. Li, C.X.; Wu, X.; Hu, Y. Land use and landscape pattern change analysis in a typical gully area of the Loess Plateau: A case study of Qingyang City, Gansu Province. J. Desert Res. 2025, 45, 172–180. [Google Scholar] [CrossRef]
  68. Zhang, H.S.; Jiao, Y.M.; Chen, F.; Zhang, Z.N.; Xu, Q.E.; Tao, Y. Multi-scale impacts of human activity intensity on water quality in nine plateau lake basins in Yunnan Province. J. Lake Sci. 2024, 36, 430–442. [Google Scholar] [CrossRef] [Scilit]
  69. Li, G.F.; Wang, J.H.; Xie, F.Q.; Liang, Z.X.; Qiu, F. Effects of rainfall and cropping patterns on the soil erosion characteristics of lateritic red soil slope. Sci. Soil Water Conserv. 2022, 20, 65–73. [Google Scholar] [CrossRef]
Figure 1. Research area.
Land 15 00508 g001
Figure 2. Research technical route.
Land 15 00508 g002
Figure 3. Land use/cover change data (LUCC) for 1995–2024.
Land 15 00508 g003
Figure 4. Land use transfer chord map, 1995–2024.
Land 15 00508 g004
Figure 5. Landscape pattern index.
Land 15 00508 g005
Figure 6. Landscape risk index (ERI).
Land 15 00508 g006
Figure 7. Correlation heatmap.
Land 15 00508 g007
Figure 8. Shap value, 1995–2024.
Land 15 00508 g008
Figure 9. Partial dependence plot (PDP), 1995–2024.
Land 15 00508 g009
Figure 10. Random Forest results.
Land 15 00508 g010
Figure 11. Zonal control of landscape ecological risk.
Land 15 00508 g011
Table 1. Data description and source.
CategoryDataResolution/ScaleData Source
Land Use DataYunnan Province Land Use Data30 mZenodo Platform
https://zenodo.org/
Geographic Information DataDEM30 mGeospatial Data Cloud
https://www.gscloud.cn/
Road Network Data1:250,000National Catalog Service For Geographic Information
https://www.webmap.cn/
Water System Vector Data1:250,000National Catalogue Service For Geographic Information
https://www.webmap.cn/
NDVI30 mResource and Environmental Science Data Platform
https://www.resdc.cn/Default.aspx
Natural Environment DataHWSD2.01 kmFood and Agriculture Organization of the United Nations
https://www.fao.org/home/en
Soil Erosion Degree Data30 mScience Data Bank
https://www.scidb.cn/
Annual Spatial Interpolation Dataset of Chinese Meteorological Elements1 kmResource and Environmental Science Data Platform
https://www.resdc.cn/Default.aspx
Socio-economic DataGDP1 kmResource and Environmental Science Data Platform
https://www.resdc.cn/Default.aspx
Population Density Data1 km
Night-Time Light Dataset1 km
Land Use Intensity30 mAuthor’s calculations
Table 2. Formulas of Landscape Pattern Indices.
Index NameCalculation MethodIntroduction
Landscape Fragmentation (Ci) C i = n i A i The ratio of the number of patches of a landscape type to its total area; the smaller the ratio, the lower the fragmentation.
Landscape Isolation (Ni) N i = A 2 A i n i A A is the total landscape area; n i is the number of patches of landscape type i .
Landscape Dominance (Di) D i = Q i + M i 4 + L i 2 Where Q i = number of grids where patch i occurs; M i   = (grids of patch i )/total grids of all patches; L i   = (area of patch i )/total grid area.
Landscape Disturbance (Ei) E i = a C i + b N i + c D i a + b + c = 1 , where a , b , c are the weight values of C i ,   N i ,   D i respectively. a = 0.5, b = 0.3, c = 0.2 [42,43,44].
Landscape Vulnerability (Fi)Obtained by referring to the characteristics of similar regions, adopting the expert scoring method, and normalizing the resultsCultivated land: 5; Forest land: 2; Shrub land: 3; Grass land: 4; Water: 6; Bare land: 7; Construction land: 1.
Landscape Loss (Ri) R i = E i × F I The product of landscape vulnerability degree and landscape disturbance degree.
Table 3. Landscape ecological risk driving factor table.
CategoryFactorSerial No.UnitERI
Natural environmentElevationX1MY
SlopeX2°
Topographic reliefX3
Soil erosion degreeX4
PrecipitationX5mm
NDVIX6
Socio-economicPopulation densityX7persons/km2
Per capita GDPX810,000 yuan/km2
Night-time lightX9
Land use intensityX10
Table 4. Land use dynamic degree of the Five Lakes Area in central Yunnan (1995–2024). DD (%); change volume (km2).
TimeCultivatedForestShrubGrassWaterBareConstructionCDD (%)
DDCvDDCvDDCvDDCvDDCvDDCvDDCv
1995–2005−0.65−334.30.36209.3−3.1−771.03123.80.106.56−1.51−1.518.4272.370.66
2005–2015−0.87−417.20.61362.42.746.1−0.6−84.26−0.3−237.782.197.24114.70.73
2015–20240.281090.30168.7−2.3−45−2.9−3290.11.313.135.903.6890.400.67
Table 5. Results of global Moran’s I index analysis for ERI in the Central Yunnan Five Lakes Region (1995–2024).
p < 0.011995200520152024
FactorsMoran’s IMoran’s IMoran’s IMoran’s I
X10.556630.57060.57060.57576
X20.210990.230330.230330.17323
X30.22370.229390.229390.18851
X40.113650.175890.13340.1173
X50.205890.234030.234570.2012
X60.624240.468130.44360.49114
X70.883070.494830.594580.6553
X80.892970.900220.837790.84283
X90.890490.899870.583870.66673
X100.616760.578410.581180.59668
Table 6. Nature reserve data (source: Directory of Nature Reserves in Yunnan Province, Yunnan Forestry and Grass land Bureau).
Nature Reserve GradeNameAdministrative RegionProtection TypeMain Protection
Objects
Area (ha)Year of
Establishment
Yunnan Provincial Nature ReserveProvincial Geology Nature Reserve of the Precambrian (Sinian)–Cambrian Boundary Stratotype Section, ChinaJNGeological HeritageInternational Stratotype Section of the Sinian–Cambrian Boundary581989
Provincial Nature Reserve of the Chengjiang BiotaCJPaleontological HeritagePaleontological Fossil Site18001997
Prefectural (Municipal) Nature Reserve in YunnanYuxi Hongta Mountain Municipal Nature ReserveHTForest EcosystemForest ecosystem, natural landscape and water source forest5578.552001
County-level Nature Reserve in YunnanChengjiang Liangshan County-level Nature ReserveCJForest EcosystemForest ecosystem, natural landscape and water source forest2285.581995
Tonghai Xiushan County-level Nature ReserveTHForest EcosystemForest ecosystem, natural landscape and water source forest9319.82001
Yiliang Zhushan Zongshenshan County-level Nature ReserveYLForest EcosystemNatural semi-humid evergreen broad-leaved forest9582002
Yangzonghai Laoye Mountain County-level Nature ReserveYLForest EcosystemNatural evergreen broad-leaved forest13332002
Yiliang Jiuxang Maitian River County-level Nature ReserveYLForest EcosystemNatural evergreen broad-leaved forest19562002
Huaning Denglou Mountain County-level Nature ReserveHNForest EcosystemForest ecosystem, natural landscape and water source forest61442004
Jiangchuan Dalongtan County-level Nature ReserveJCForest EcosystemForest ecosystem, natural landscape and water source forest66622004
Disclaimer/Publisher’s Note: The statements, opinions and data contained in all publications are solely those of the individual author(s) and contributor(s) and not of MDPI and/or the editor(s). MDPI and/or the editor(s) disclaim responsibility for any injury to people or property resulting from any ideas, methods, instructions or products referred to in the content.