


Abstract
To address the disconnect between macro-quantity planning and micro-spatial allocation at the township level during rapid urbanization, this study developed a coupled model framework based on Multi-Objective Planning (MOP) and the Future Land-Use Simulation (FLUS) model, using Longhu Town as a case study. First, economic and ecological benefit coefficients were calibrated via the Grey Prediction Model and equivalent factor method to define three scenarios: Economic Priority (EPS), Ecological Protection (EcPS), and Balanced Development (BDS). Second, an Artificial Neural Network (ANN) was employed to quantify driving factors, coupled with self-adaptive Cellular Automata (CA) for spatial allocation in 2030. The results indicate that: (1) The model exhibits high reliability for small-scale simulation, with a Kappa coefficient of 0.95 and a Figure of Merit (FoM) of 0.29. (2) Strategic orientations lead to distinct spatial differentiation: under the EPS, urban–industrial land expands significantly northwestward (+16.60%), causing fragmented erosion of cropland; the EcPS achieves a 5.27% increase in forest land and ecological restoration through strict quantitative constraints; the BDS realizes the synergy of urban clustering and ecological enhancement with a marginal urban increase (0.72%). (3) The eastern urban sectors and northeastern cropland belts are identified as future land-use conflict hotspots. The “quantity-space” collaborative optimization path proposed in this study provides a scientific basis and dynamic simulation tool for refined territorial spatial management at the township scale.
1. Introduction
Changes in land tenure, quantity, and spatial distribution not only affect human survival and the evolution of natural ecological environments globally but are also closely linked to the health and sustainability of global ecosystems. As China’s economy enters a stage of high-quality development, the growing demands of production and daily life have placed immense pressure on land resource utilization [1]. This intensified human activity has exacerbated ecological degradation, triggering a cascade of environmental issues. Consequently, the contradiction between human social development, territorial space, and natural ecosystems has become increasingly difficult to reconcile. The question of how to promote the healthy and rational utilization of land has thus emerged as a critical issue needing urgent resolution and remains a research hotspot in land-use-related fields.
Conducting multi-scenario simulation analysis for Longhu Town is a practical necessity for the construction of Zhengzhou as a National Central City. As the core of the Zhengzhou Metropolitan Area, Zhengzhou relies on Longhu Town—located in the south of the urban district—as a strategic gateway and pivotal hub. Against the backdrop of national strategies, it is imperative to conduct an in-depth study on the intrinsic mechanisms of its current land-use characteristics and spatiotemporal dynamic changes. Building upon the evaluation of previous land-use planning implementation, simulating future land-use structures and spatial distribution patterns under different scenarios is essential. These efforts will provide theoretical support for the future development of Longhu Town, facilitate the optimization of its land-use spatial structure, and advance the effective transmission of territorial spatial planning. Ultimately, this will better enable Zhengzhou to exert its radiating effect as a National Central City and the core of the metropolitan area.
At present, land use and management in China are confronted with multifaceted challenges. Research has indicated that systemic issues, such as irrational land-use structures and the persistent illegal occupation of cropland [2], remain prevalent, suggesting that the overall efficiency of land utilization requires further enhancement [3]. These problems are particularly acute at the township level, manifesting specifically as ambiguous property rights and fragmented agricultural operations. As the fundamental administrative unit for land use and management, the township government occupies a central position in the allocation of land resources [4]. By leveraging critical information and coordination capabilities, these local authorities play an indispensable intermediary role [5]. Consequently, the accurate prediction of future land-use development trends is regarded as a vital proactive strategy to circumvent or mitigate the aforementioned issues.
Regarding prediction methods, a diverse range of technical pathways has been developed within academia. Supported by robust data foundations, methods such as regression analysis, Markov chains, and multivariate statistics are frequently employed for precise forecasting [6]. To address land-use intensity, quantity, and long-term spatiotemporal dynamics, researchers have extensively applied a variety of models and methodologies. these include CLUE-S, CLUMondo [7], integrated data-driven and Monte Carlo models [6], and mixed-integer programming or discrete choice models integrated with Cellular Automata (CA) [8]. Furthermore, more advanced frameworks have emerged, such as the Patch-generating Land-Use Simulation (PLUS) model [9], the Artificial Neural Network-Cellular Automata (ANN-CA) model [10], hybrid Markov-CLUE-S models [11,12], and coupled System Dynamics (SD)-PLUS models [13]. More recently, comprehensive evaluation frameworks integrating SD, PLUS, and InVEST models have also been utilized to provide more holistic assessments [14].
Future scenario simulation transcends singular predictions, serving as a pivotal tool for actively exploring land-use patterns under divergent development trajectories. Researchers have designed multifaceted scenarios from various perspectives. For instance, S et al. established integrated SSP-RCP scenarios to predict land cover changes in South Korean administrative districts [15], while Y et al. adopted combined Shared Socioeconomic Pathways (SSPs) and Representative Concentration Pathways (RCPs) [13]. Additionally, Zhang et al. constructed natural growth and two types of ecological protection scenarios for Wuhan [16]; Jiang et al. simulated the evolution of “Production–Living–Ecological Space” (PLES) in Zhengzhou under various SSP scenarios [17]; and Lai et al. defined scenarios of natural development, rapid development, and ecological protection for Hainan Island [18]. Finally, Chen et al. focused on the impact of policy interventions by comparing strong and weak policy environments.
Among numerous simulation models, the Future Land-Use Simulation (FLUS) model has emerged as a prominent tool due to its capacity to integrate natural and socio-economic drivers for simulating Land-Use/Cover Change (LUCC). By coupling System Dynamics (SD) with Cellular Automata (CA), the FLUS model significantly enhances simulation precision, leading to its widespread adoption in both global and regional studies [19]. In China, the robustness of the FLUS model has been demonstrated across various geographical contexts, including metropolitan areas like Wuhan [20], Xuzhou [21], and Guangzhou [22], as well as critical ecological regions such as the Yangtze River Economic Belt [23], the coastal zones of Yancheng [24], the Huaihe River Basin [25], the Shule River Basin [26], and the Loess Plateau [27].
However, current applications of the FLUS model are predominantly concentrated at macro- and meso-scales, such as provincial, municipal, or watershed levels. Research specifically optimized for the micro-scale of townships remains relatively sparse, even though land-use conflicts at this level are often more concentrated and complex. Addressing this gap, the present study focuses on the township scale, employing the FLUS model to conduct land-use change simulations and multi-scenario analyses. Selecting this finer resolution is expected to minimize the risk of spatial detail distortion often caused by coarse data [28], thereby providing a more scientific and precise decision-making reference for refined land management and spatial planning at the grassroots level.
2. Materials and Methodology
2.1. Study Area
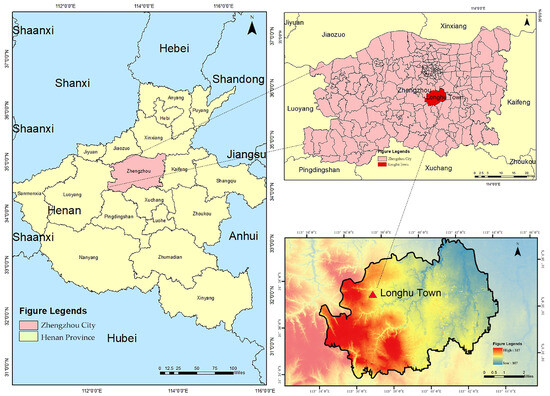
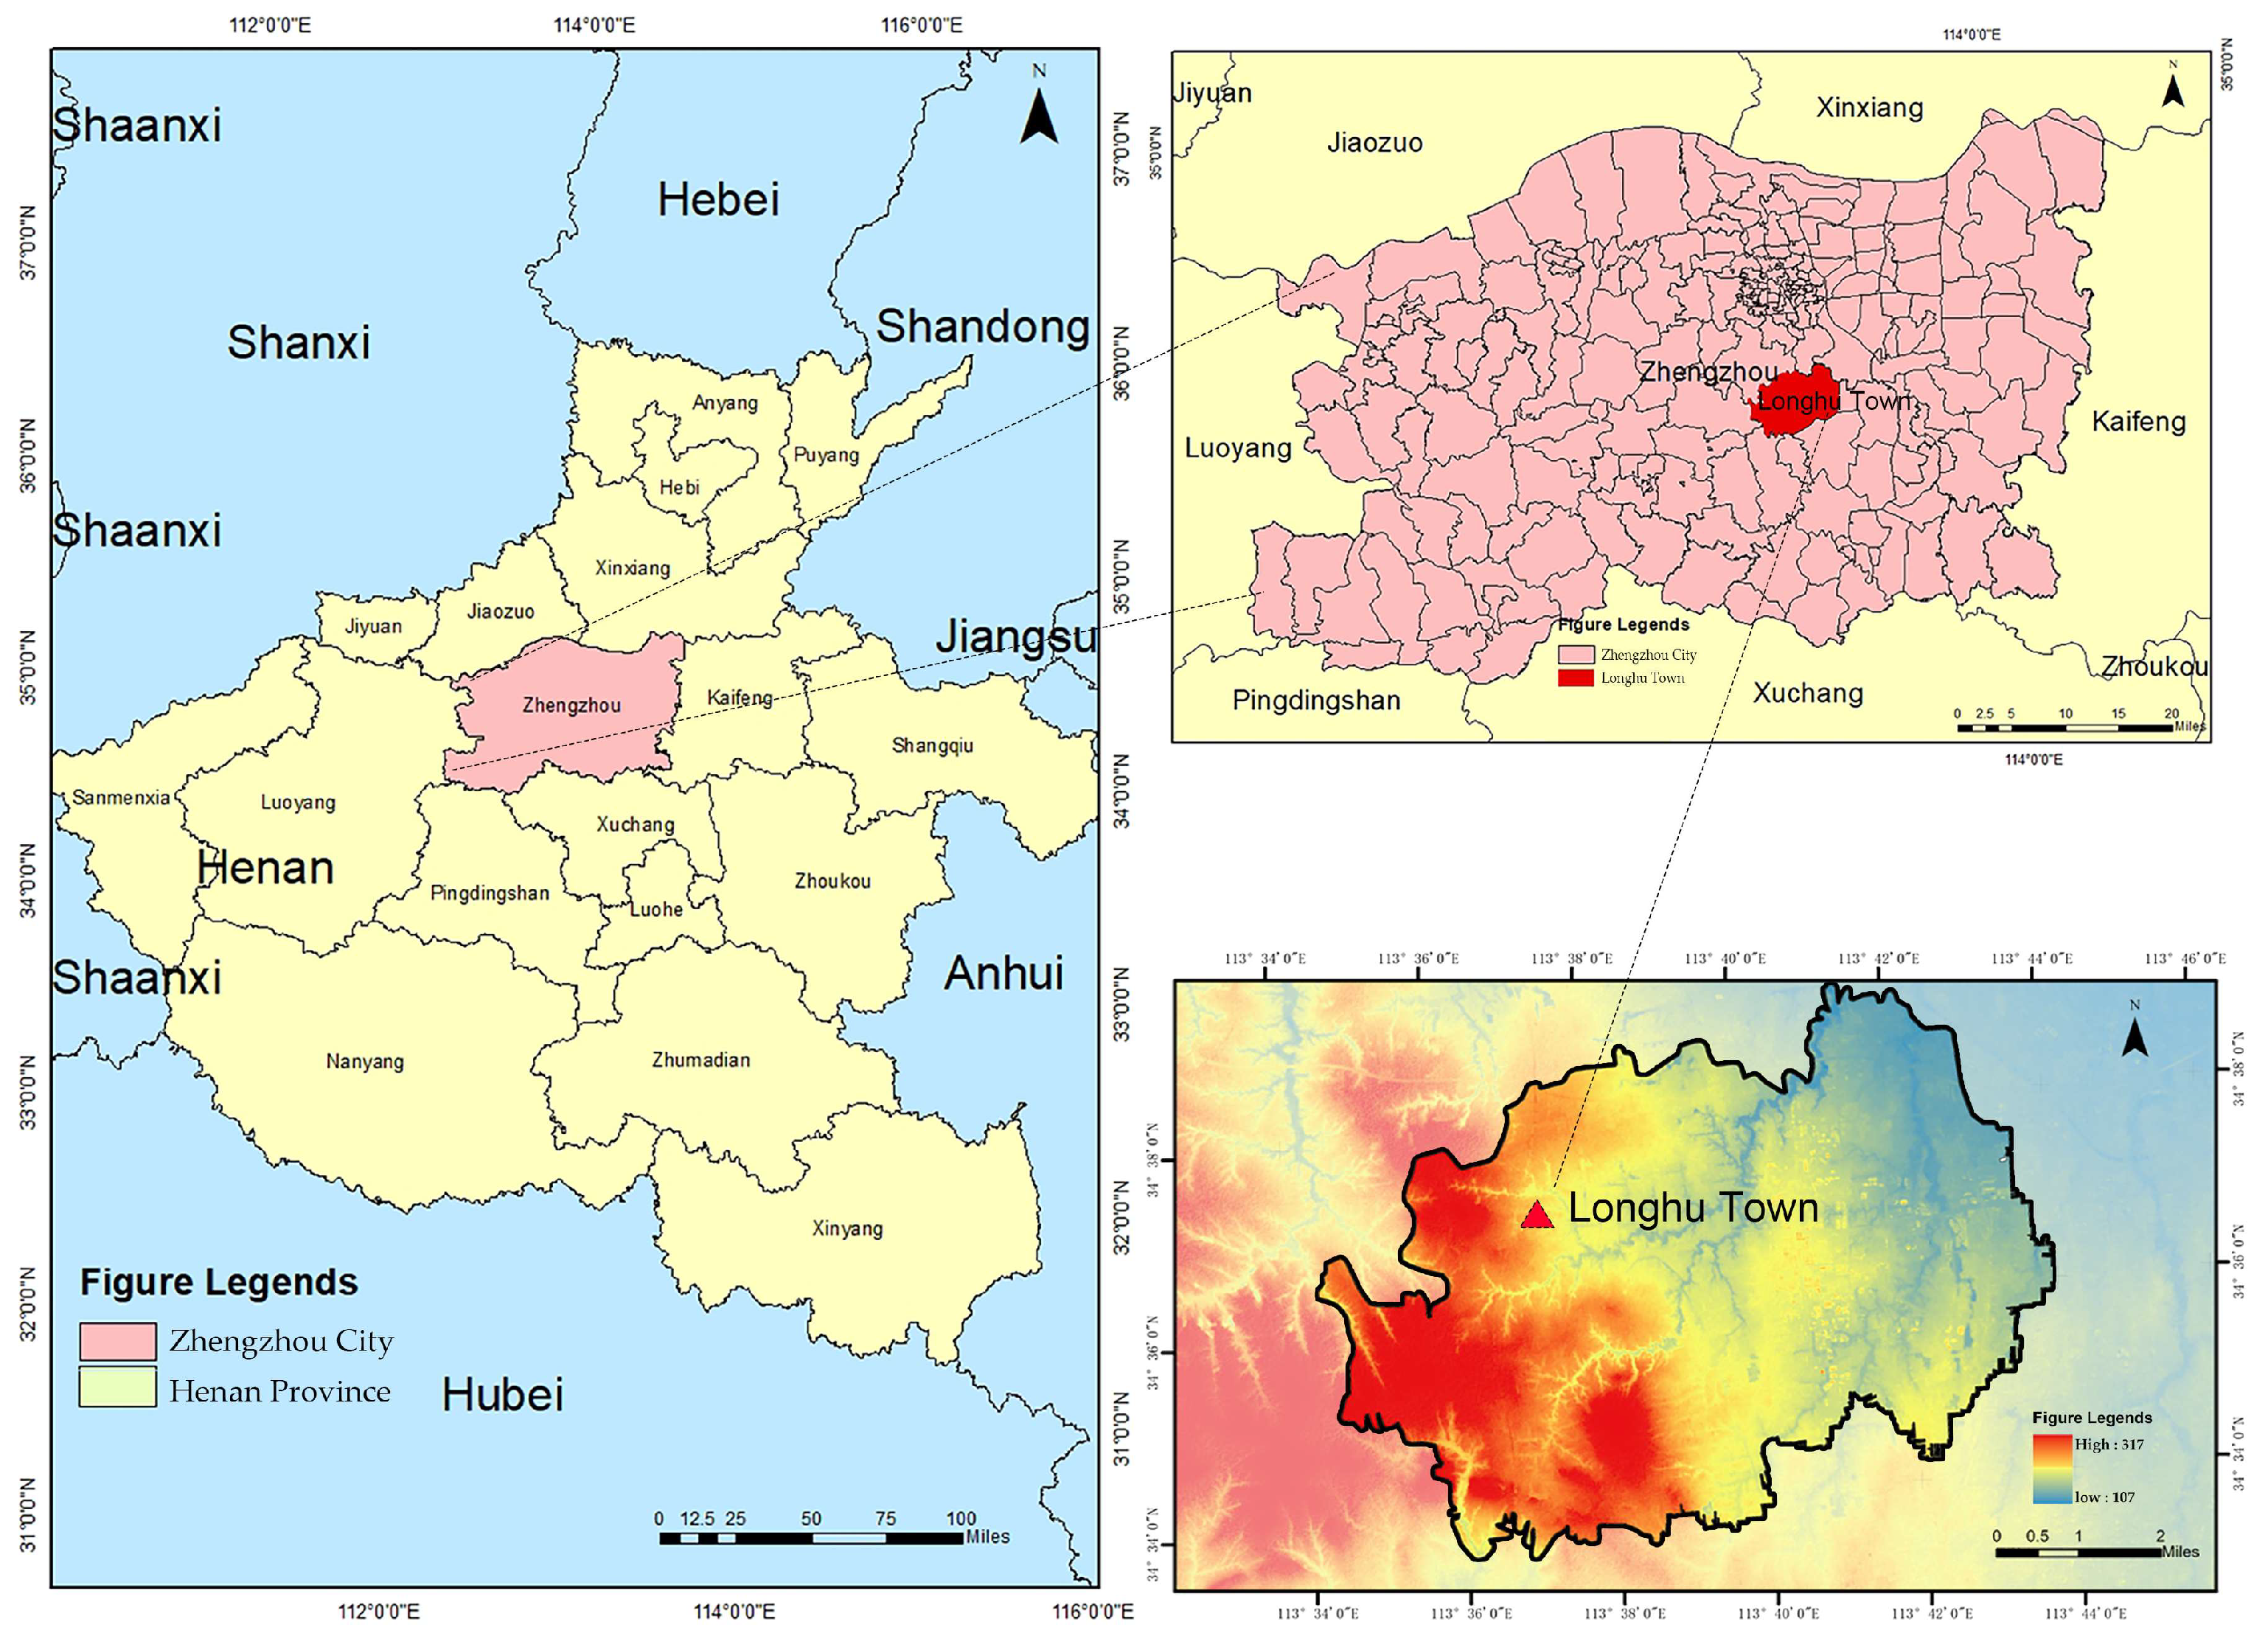
Longhu Town is situated in Henan Province, Central China, bordering Zhengzhou—the provincial capital—to the north. Spanning a total area of 98 km2 and administering 28 administrative villages, it is the largest township in Xinzheng City by land area. The town is geographically positioned between 113°35′–113°44′ E and 34°33′–34°39′ N (Figure 1). Characterized by its strategic location and high transport accessibility, Longhu Town serves as a vital gateway for Zhengzhou’s southward expansion and is widely recognized as the “Southern Gate” of the city, with multiple national and provincial highways traversing its territory from north to south.
Figure 1.
Location of the study area.
According to the Zhengzhou Metropolitan Area Master Plan, Longhu Town is designated as a regional trade and logistics hub, as well as a key base for education and scientific research. In recent years, by leveraging the development of the “China South City” (Huanancheng) comprehensive trade and logistics center and various large-scale cultural tourism projects, the town has experienced rapid growth in its economic and cultural industries. Consequently, it has been ranked among the “Top 100 Towns with Comprehensive Strength in China” for four consecutive years. The rapid urbanization and complex land-use structure make Longhu Town a representative case for studying land-use simulations at the township scale.
2.2. Data Sources and Preprocessing
2.2.1. Land-Use Classification and Data Integration
The study utilizes land-use data of the study area from 2015 to 2020 (Table 1). Due to the implementation of the Third National Land Survey in China in 2017, significant discrepancies existed in land-use classification standards between different years. To ensure temporal consistency, this study engaged in institutional consultations with the Municipal Natural Resources Bureau and the Township Land Management Office. Based on these consultations and specific research requirements, the land-use categories were reclassified and unified while strictly adhering to national standards and definitions. Consequently, the land use in the study area was categorized into nine distinct types: cropland, garden land, forest land, urban–industrial–mining land, scenic and special-use land, transportation and water conservancy land, village land, grassland, and water and tidal flats, as detailed in Appendix A Table A1.
Table 1.
Data types and sources.
2.2.2. Spatial Preprocessing and Standardization
To facilitate spatial modeling, all vector datasets were converted into raster format using ArcGIS 10.8 and resampled to a uniform spatial resolution of 30 m × 30 m. To ensure spatial consistency across all layers, the CGCS2000_3_Degree_GK_Zone_38 coordinate system was adopted. All raster data underwent rigorous clipping and mosaicking processes to ensure identical spatial extents, row–column dimensions, and precise spatial alignment.
2.3. Research Design and Technical Framework
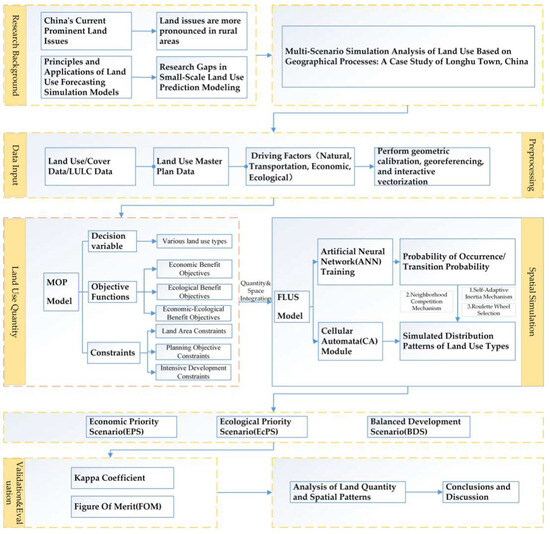
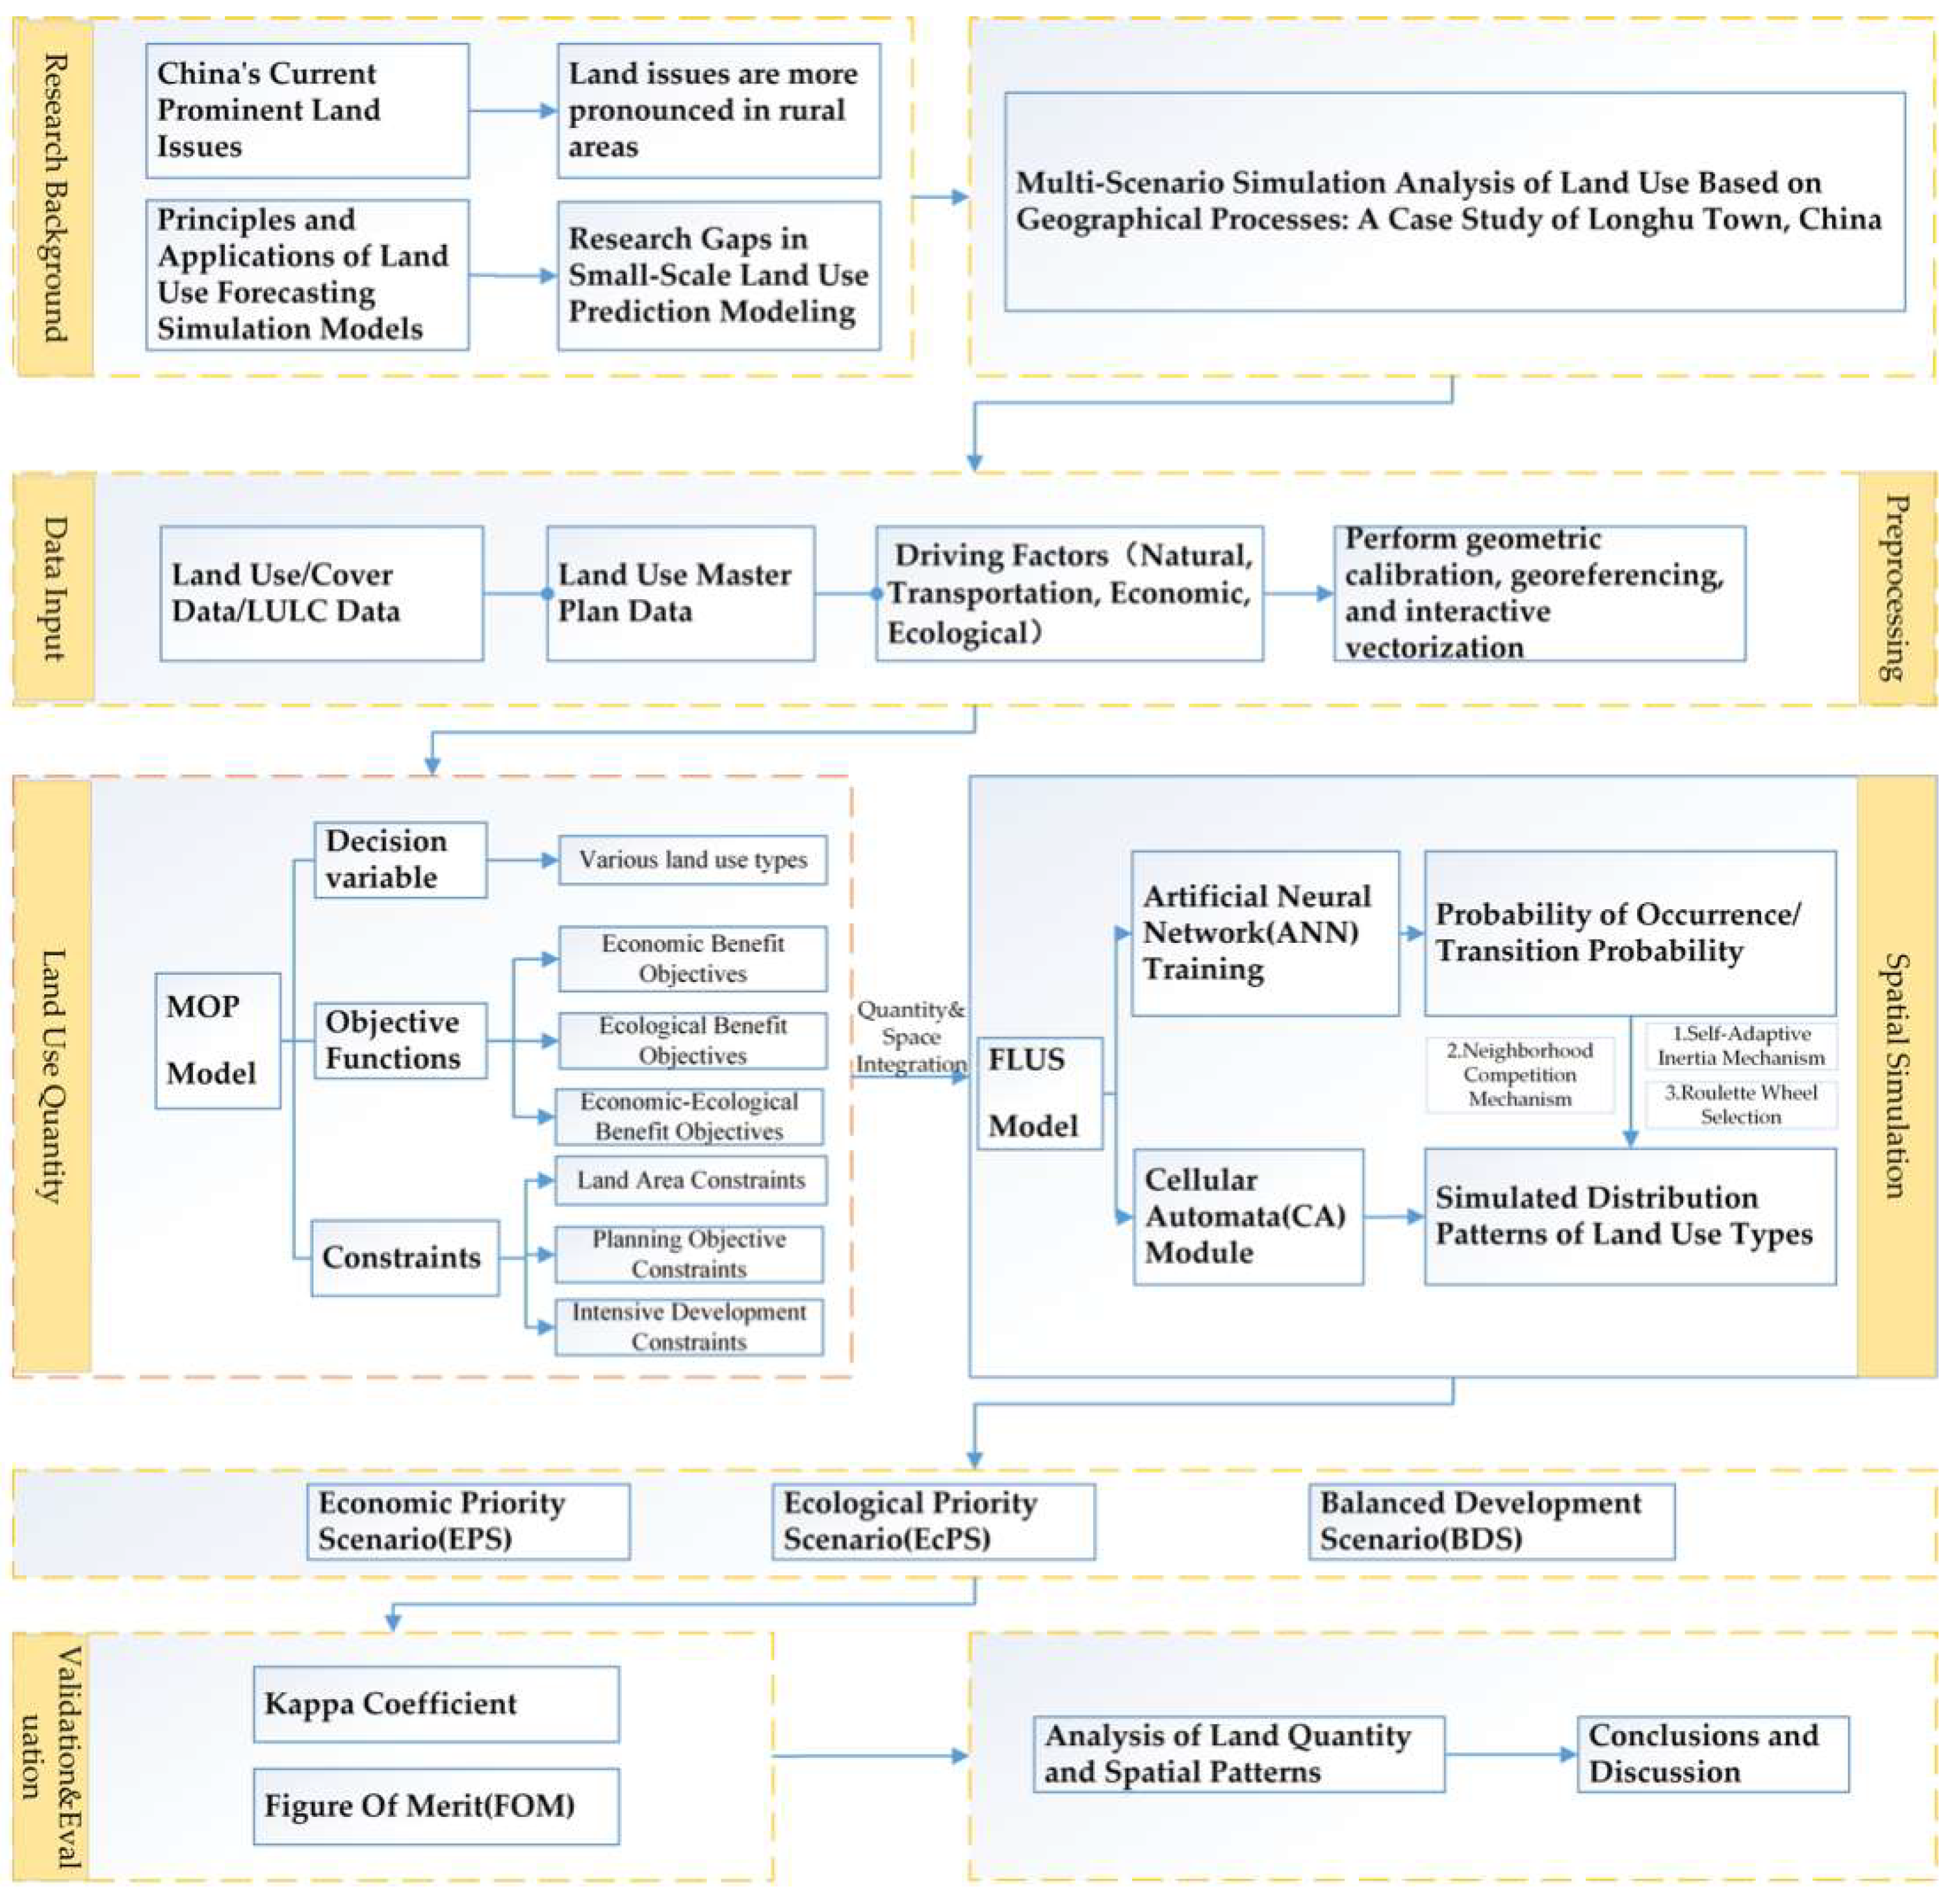
Taking the prominent issues of land use in China as a starting point, this study systematically reviews the principles and application progress of land-use prediction models. Following the logic of “Macro-problem identification—Scale-gap positioning—Research-theme establishment,” we define the specificity and urgency of land-use issues at the township level. Addressing the research gap in small-scale (township) land-use prediction, this study establishes the theme: “Geographical Process-based Multi-scenario Simulation Analysis of Land Use: A Case Study of Longhu Town.” The overall workflow adheres to a core technical route of “Data support—Model coupling—Scenario simulation—Accuracy verification—Optimization suggestions,” detailed as follows (Figure 2):
Figure 2.
The research framework and technical roadmap of this study.
Firstly, multi-source baseline data—including current land-use status, master planning, physical geography, socio-economics, transportation accessibility, and ecological constraints—were systematically collected. Through standardization and data cleaning, coordinate systems and spatial resolutions were unified to construct a standardized research database.
Subsequently, a coupled framework integrating the Multi-Objective Planning (MOP) and Future Land-Use Simulation (FLUS) models was adopted. Specifically, the MOP model focuses on the dual objectives of economic and ecological benefits. By setting three differentiated development scenarios and incorporating constraints such as macro-policy control and sustainable land use, the optimal area structure for various land-use types in the target year was calculated. Simultaneously, the FLUS model identifies key driving factors (topography, transport accessibility, ecological, and economic factors). Through Artificial Neural Network (ANN) training, the influence weights of these factors were quantified to calculate the spatial probability of occurrence for each land-use type. Parameter calibration was completed by integrating the MOP output, land-type transition rules, and expansion factors.
Based on the coupled model framework, the spatial distribution patterns of land use in Longhu Town for the target year under the three scenarios were generated. Simulation validity was then verified using the Kappa coefficient and Figure of Merit (FoM).
Finally, a multi-dimensional visualization and scenario comparison were conducted on the validated simulation results. From the perspectives of land-use structure optimization, spatial layout adjustment, and scenario path selection, targeted and actionable recommendations for the future development of the township are proposed. This study aims to provide robust decision support for the refined management and sustainable development of land use at small scales.
2.4. Land-Use Demand Prediction: Multi-Objective Planning (MOP)
To determine the optimal land-use structure under various future development pathways, this study first constructed a Multi-Objective Planning (MOP) model. The core of this model lies in translating macro-strategic scenarios into quantifiable mathematical constraints to collaboratively optimize two often-conflicting objectives: economic benefits and ecological benefits.
2.4.1. Parameter Prediction Based on the Grey Prediction Model (GM(1,1))
The objective functions in the MOP model (economic and ecological benefits) depend on the value coefficients per unit area of each land-use type. To obtain these coefficients for the target year (2030), the Grey Prediction Model GM(1,1) was employed. This model is particularly suitable for small data sequences with exponential trends, fitting the practical situation of limited historical data at the township scale.
The specific steps were as follows: First, based on historical data from Longhu Town (2015–2020), the equivalent factor tables for economic and ecological benefit coefficients per unit area were calculated. Subsequently, these historical time series were used as inputs for the GM(1,1) model implemented on the MATLAB R2024b to predict the two types of benefit coefficients for 2030.
Prior to modeling, a rigorous step-by-step ratio test was conducted on the time-series data from 2015 to 2020. The results indicate that the ratios for all indicators fall strictly within the admissible coverage interval, confirming that the data exhibits the quasi-exponential behavior required for GM(1,1) modeling. Furthermore, the Posterior Variance Ratio (C) and Small Error Probability (P) for all land-use types meet high-precision standards (detailed accuracy metrics are provided in Appendix A Table A2). The resulting predicted coefficients serve as the core parameters for constructing the objective functions in the MOP model.
It is important to note that the 2015–2020 period was deliberately selected as the calibration window based on specific temporal considerations. This timeframe aligns with China’s “13th Five-Year Plan,” representing a critical transitional phase characterized by the intersection of rapid urbanization and ecological civilization policies [29]. Moreover, recent studies have demonstrated that new-type urbanization exerted a significantly stronger economic radiative effect on surrounding areas specifically during the 2015–2020 period [30]. For peri-urban areas like Longhu Town, capturing these recent “high-frequency fluctuations”—which reflect the latest trends in urbanization and economic transformation—thereby offers higher predictive validity for the near future than using long-term historical averages, which may dilute these emerging structural signals. This methodological choice is further supported by recent findings from Li, T et al. [31] and Li, D et al. [32].
2.4.2. Model Construction and Scenario Settings
- Decision Variables: In this study, nine land-use types are defined as decision variables: S1 (cropland), S2 (garden land), S3 (forest land), S4 (urban–industrial–mining land), S5 (scenic and special-use land), S6 (transportation and water conservancy land), S7 (village land), S8 (grassland), and S9 (water and tidal flats).
- Objective Functions: The economic benefit objective aims to maximize the sum of the area of each land-use type multiplied by its respective economic coefficient. The ecological benefit objective follows the same logic.
Based on the availability of township-scale statistics and following consultation with local authorities, economic coefficients were defined as follows: cropland is proxied by the total output value of agriculture minus tea and fruit; garden land uses tea and fruit output; forest land corresponds to forestry output; urban–industrial–mining and transportation and water conservancy land are proxied by the output value of secondary and tertiary industries; and scenic and special-use land is linked to tourism income. For types with low economic returns (e.g., unused land), coefficients were excluded from the economic objective. Ecological coefficients were assigned based on the Ecosystem Service Value (ESV) equivalent factor table published by Xie et al. [33].
- Constraints: The constraint system integrates multiple policy and natural rigid limitations, categorized into three types: total land area constraints, planning target constraints, and intensive development constraints (Table 2). The setting of constraint intervals for decision variables follows a “Status Quo–Inertia Dual Benchmark” principle. Specifically, the upper and lower bounds for each variable are defined by two key benchmarks: (1) the actual area in 2020, representing the policy baseline of ‘status quo’ (i.e., zero growth or zero loss); and (2) the inertial projected value for 2030, calculated based on the average historical change rate from 2015 to 2020, representing the boundary of natural evolution driven by market forces. The MOP model seeks the optimal solution within the feasible region bounded by these two values. Furthermore, the values in Table 2 are presented with two decimal places as they are directly derived from the precise statistics of the GIS vector database. This precision is maintained to ensure strict mass balance with the total study area, preventing cumulative errors caused by rounding.
Table 2.
Constraints for the Multi-Objective Planning (MOP) model.
Scenario Weights: Three representative scenarios were established: Economic Priority Scenario (EPS), Ecological Protection Scenario (EcPS), and Balanced Development Scenario (BDS). By adjusting the weights of the two objectives (Table 3) and reflecting policy intensity in the constraints, the model calculates the optimal land-use allocation for 2030. It should be noted that the weight combinations (0.8/0.2, 0.2/0.8, 0.5/0.5) are not intended to be precise empirical measurements of current policies. Instead, they serve as archetypal scenarios selected from the Pareto optimal set. The high weight of 0.8 is deliberately set to simulate the boundary effects of strong policy interventions, thereby amplifying the spatial differentiation under conflicting development goals. The 0.5/0.5 ratio serves as a theoretical neutral baseline. This distinct gradient setting allows for a clearer identification of spatially sensitive areas in the simulation.
Table 3.
Objective weights and core constraints across three scenarios.
2.4.3. Solving and Output
The MOP model was solved using the LINGO 19.0 optimization solver. LINGO 19.0 was selected for its high-efficiency global optimization capabilities in linear, non-linear, and integer programming, making it ideal for the multi-variable and complex constraint system in this study.
By inputting the corresponding target weights and constraint sets for each scenario, the global solver sought exact solutions for the integrated objective function. The core outputs represent the optimal planned areas for each land-use type in Longhu Town for 2030. These structured results were then imported into the FLUS model as the quantitative control framework to drive the spatial allocation process.
2.5. Spatial Land-Use Simulation: The FLUS Model
To translate the quantitative land-use structures optimized via Multi-Objective Planning (MOP) into high-resolution spatial distribution patterns, this study employed the Future Land-Use Simulation (FLUS) model for spatial allocation. By integrating Artificial Neural Networks (ANN) with Self-adaptive Cellular Automata (CA), the FLUS model effectively characterizes the spatial competition of land use under various driving forces. The ANN training process essentially quantifies the non-linear coupling between driving factors and land-use transitions within complex geographical evolutionary processes, thereby providing the dynamical support necessary for high-precision spatial simulation.
2.5.1. Driving Factors and Probability of Occurrence
Based on a systematic review of existing literature [34,35,36,37,38], land-use change is driven by multi-dimensional factors: physical geography, socio-economics, and proximity. Given the micro-scale of this township study, we prioritized data availability and consistency at the local level.
Eight driving factors were selected: elevation, slope, aspect, distance to major roads, distance to the township government, distance to water bodies, GDP per unit area, and population density. The ANN was trained on historical data to quantify the influence weights of these factors, generating initial suitability probabilities for each land-use type across the study area.
2.5.2. Coupling Mechanism and Spatial Iteration
A key design of this study is the bidirectional closed-loop coupling of the MOP and FLUS models, creating a feedback framework where “macro-objectives guide micro-evolution”:
- Top-level Quantity Input: The optimal area structures for each scenario (from Section 2.4 serve as the total spatial allocation targets for the FLUS-CA module.
- Scenario Implementation: The transition cost matrix and neighborhood factor parameters are the primary tools for implementing scenario-specific logic.
- Cost Matrix: A binary matrix (0 or 1) defining permitted (1) or prohibited (0) transitions between land types.
- Neighborhood Factors: Ranging from 0 to 1, these quantify the relative expansion intensity of each land type. Higher values indicate a stronger competitive advantage in the spatial neighborhood.
The specific settings for the transition rules and neighborhood weights across the EPS, EcPS, and BDS scenarios are summarized in Appendix A Table A3 and Table A4.
- Bottom-up Spatial Competition: The self-adaptive CA module integrates suitability probabilities, neighborhood effects, and scenario-based transition costs. Under the constraint of the total area targets, the model performs multiple iterations to reach a spatial equilibrium.
This framework ensures that the “top-down” policy optimizations from the MOP are spatially manifested through “bottom-up” dynamics, resulting in patterns that satisfy both macro-strategy and local spatial logic.
2.6. Model Calibration and Validation
To ensure the reliability of the 2030 projections, the FLUS model underwent rigorous historical back-testing. We used 2015 as the base year to simulate the land-use pattern of 2020 based on contemporary driving factors. The simulated results were then compared with actual 2020 land-use observations.
The calibration process involved fine-tuning inertia coefficients and transition costs to ensure the simulated spatial patterns and statistical features closely matched reality. Accuracy was quantitatively assessed using the Kappa coefficient and the Figure of Merit (FoM) index.
Once these indicators reached the accepted validity thresholds, the parameters were deemed reliable for reflecting the land-use change mechanisms of Longhu Town. These verified high-precision parameters were then applied to all future scenario simulations for 2030, ensuring that the coupled framework rests on a scientifically robust foundation.
3. Results
3.1. Model Calibration, Mechanism, and Accuracy Validation
3.1.1. Historical Backtracking Calibration and Accuracy Verification
To ensure the reliability of the future land-use simulation, this study first performed historical back-testing and accuracy validation on the FLUS model. The Kappa coefficient and Figure of Merit (FoM) were adopted as the core evaluation metrics. The Kappa coefficient measures the categorical consistency between the simulation and actual observations, while the FoM index focuses on the spatial accuracy of cells that undergo transitions. Based on existing literature, thresholds of Kappa > 0.75 and FoM > 0.15 (or 0.25 depending on scale) are generally considered acceptable.
Validation Metrics for Model Accuracy:
- Kappa Coefficient: This metric was calculated based on a global pixel-by-pixel comparison between the simulated 2020 land-use map and the actual observation, reflecting the overall consistency of the macroscopic spatial pattern. The formula is expressed as follows:
Kappa = (P0 − Pc)/(1 − Pc)
- Figure of Merit (FoM) Index: Recognizing that the Kappa coefficient is often biased upward by the large proportion of unchanged “persistent” pixels in short-term (e.g., 5–10 years) township-scale simulations, this study introduced the FoM index to specifically evaluate the model’s accuracy in simulating the dynamic “changed areas.” The formula is given by:
FoM = B/(A + B + C + D)
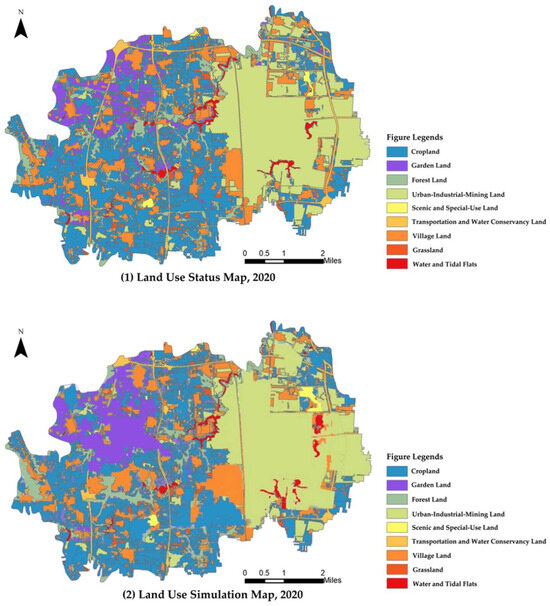
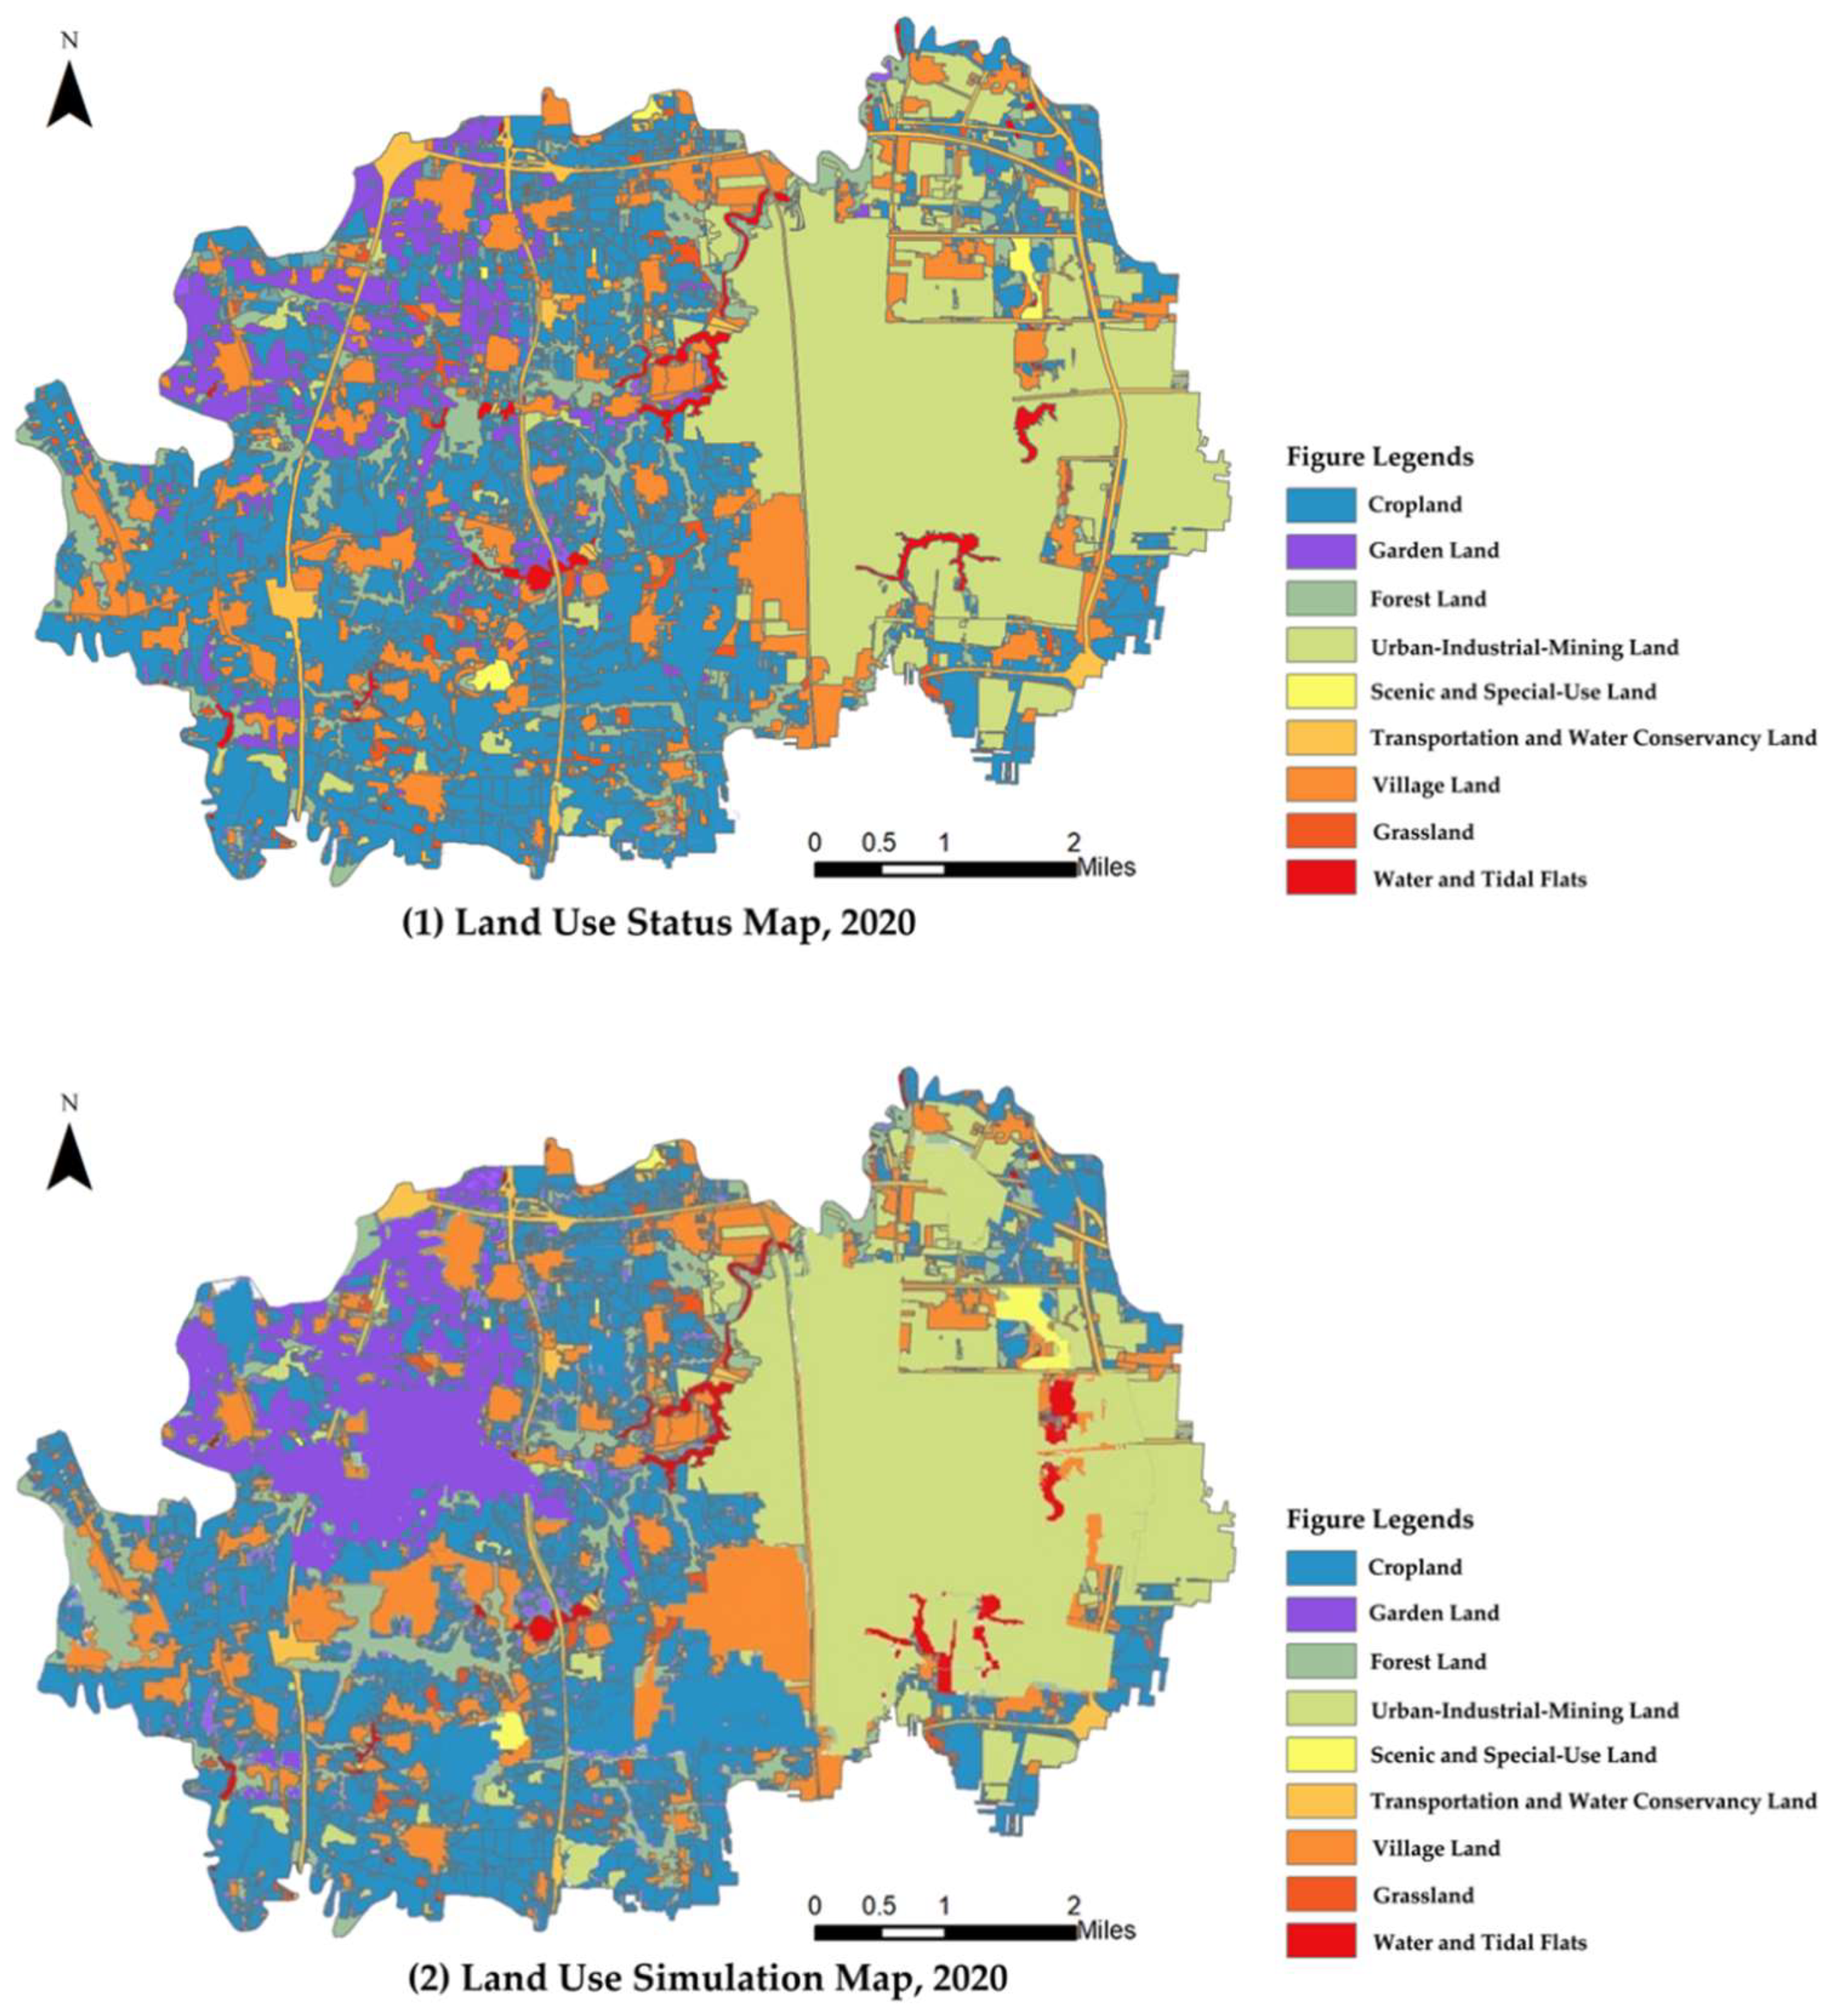
The specific procedure involved utilizing the Artificial Neural Network (ANN) and Cellular Automata (CA) modules within the GeoSOS-FLUS V2.4 software. Taking the 2010 land-use baseline and its corresponding driving factors as inputs, the ANN module calculated the transition probabilities for each land category, and parameters were calibrated to simulate the land-use pattern for 2020. By employing the model’s built-in validation function, the simulated 2020 results were compared against the actual 2020 land-use data (Figure 3). The validation yielded a Kappa coefficient of 0.95 and a Figure of Merit (FoM) of 0.29. Both metrics significantly exceeded established thresholds, demonstrating the model’s high-precision capability in reproducing historical land-use dynamics. This result confirms the robustness of the parameter system and provides a solid methodological foundation for projecting 2030 land-use scenarios using 2020 as the base year.
Figure 3.
Land-Use Simulation and Status Maps in 2020.
3.1.2. Driving Forces and Transition Mechanisms for Future Projections
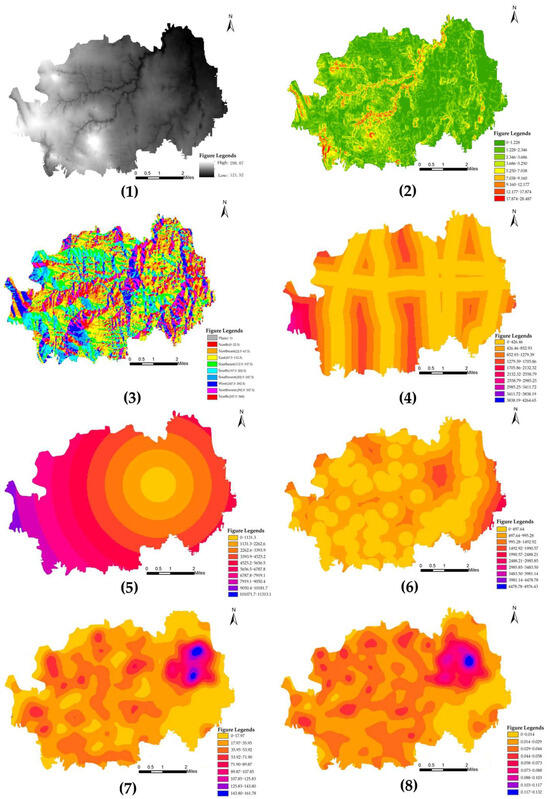
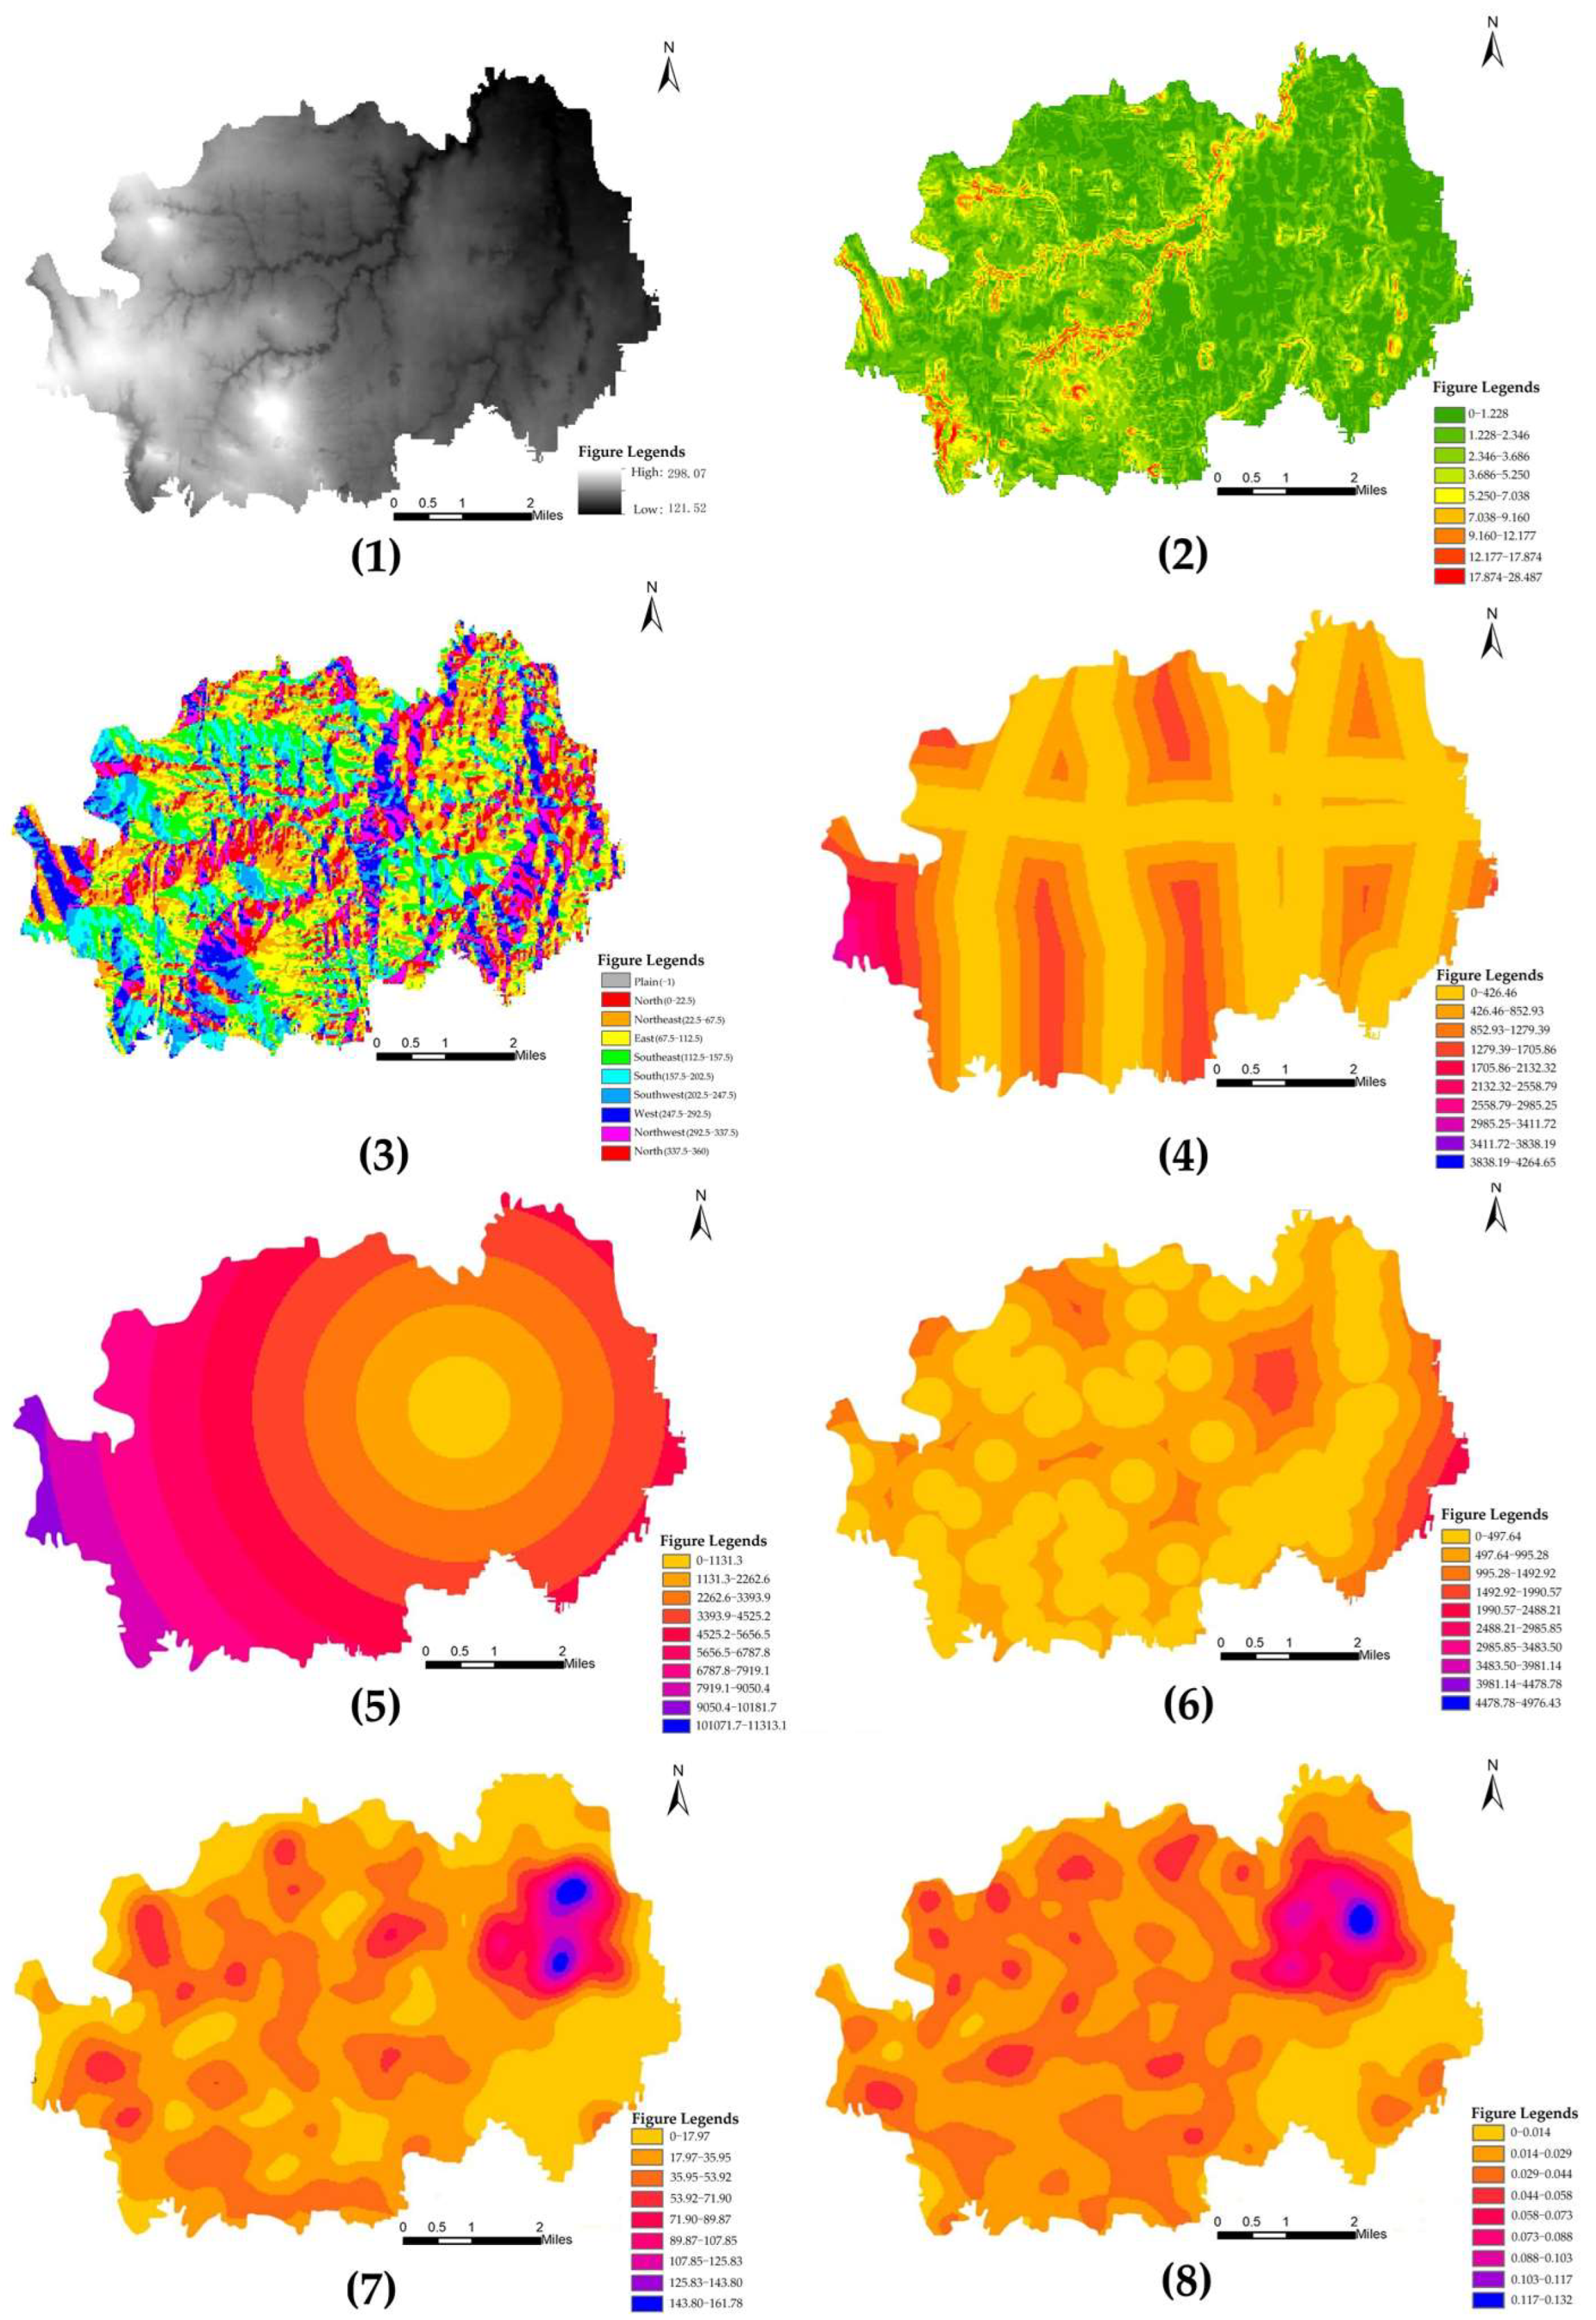
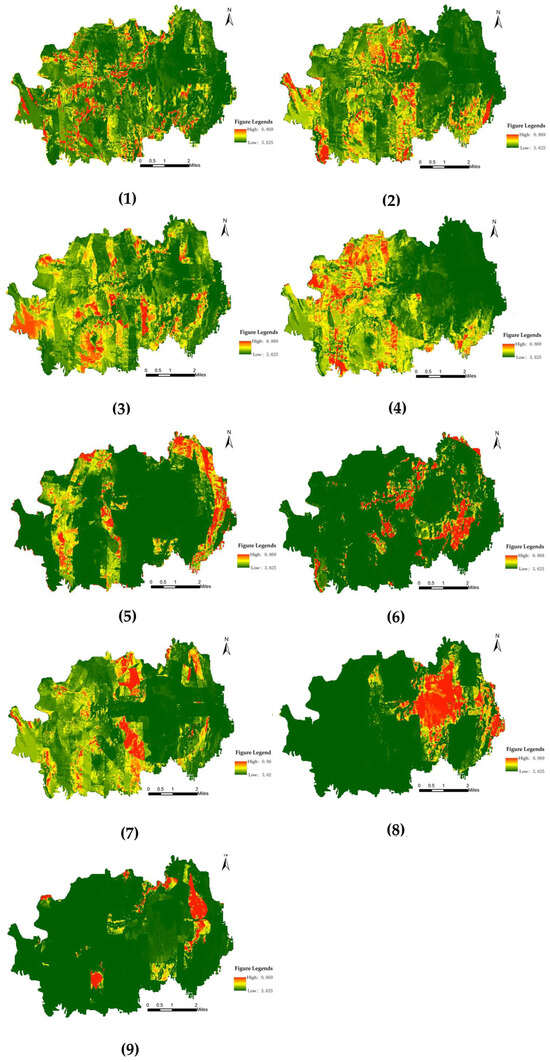
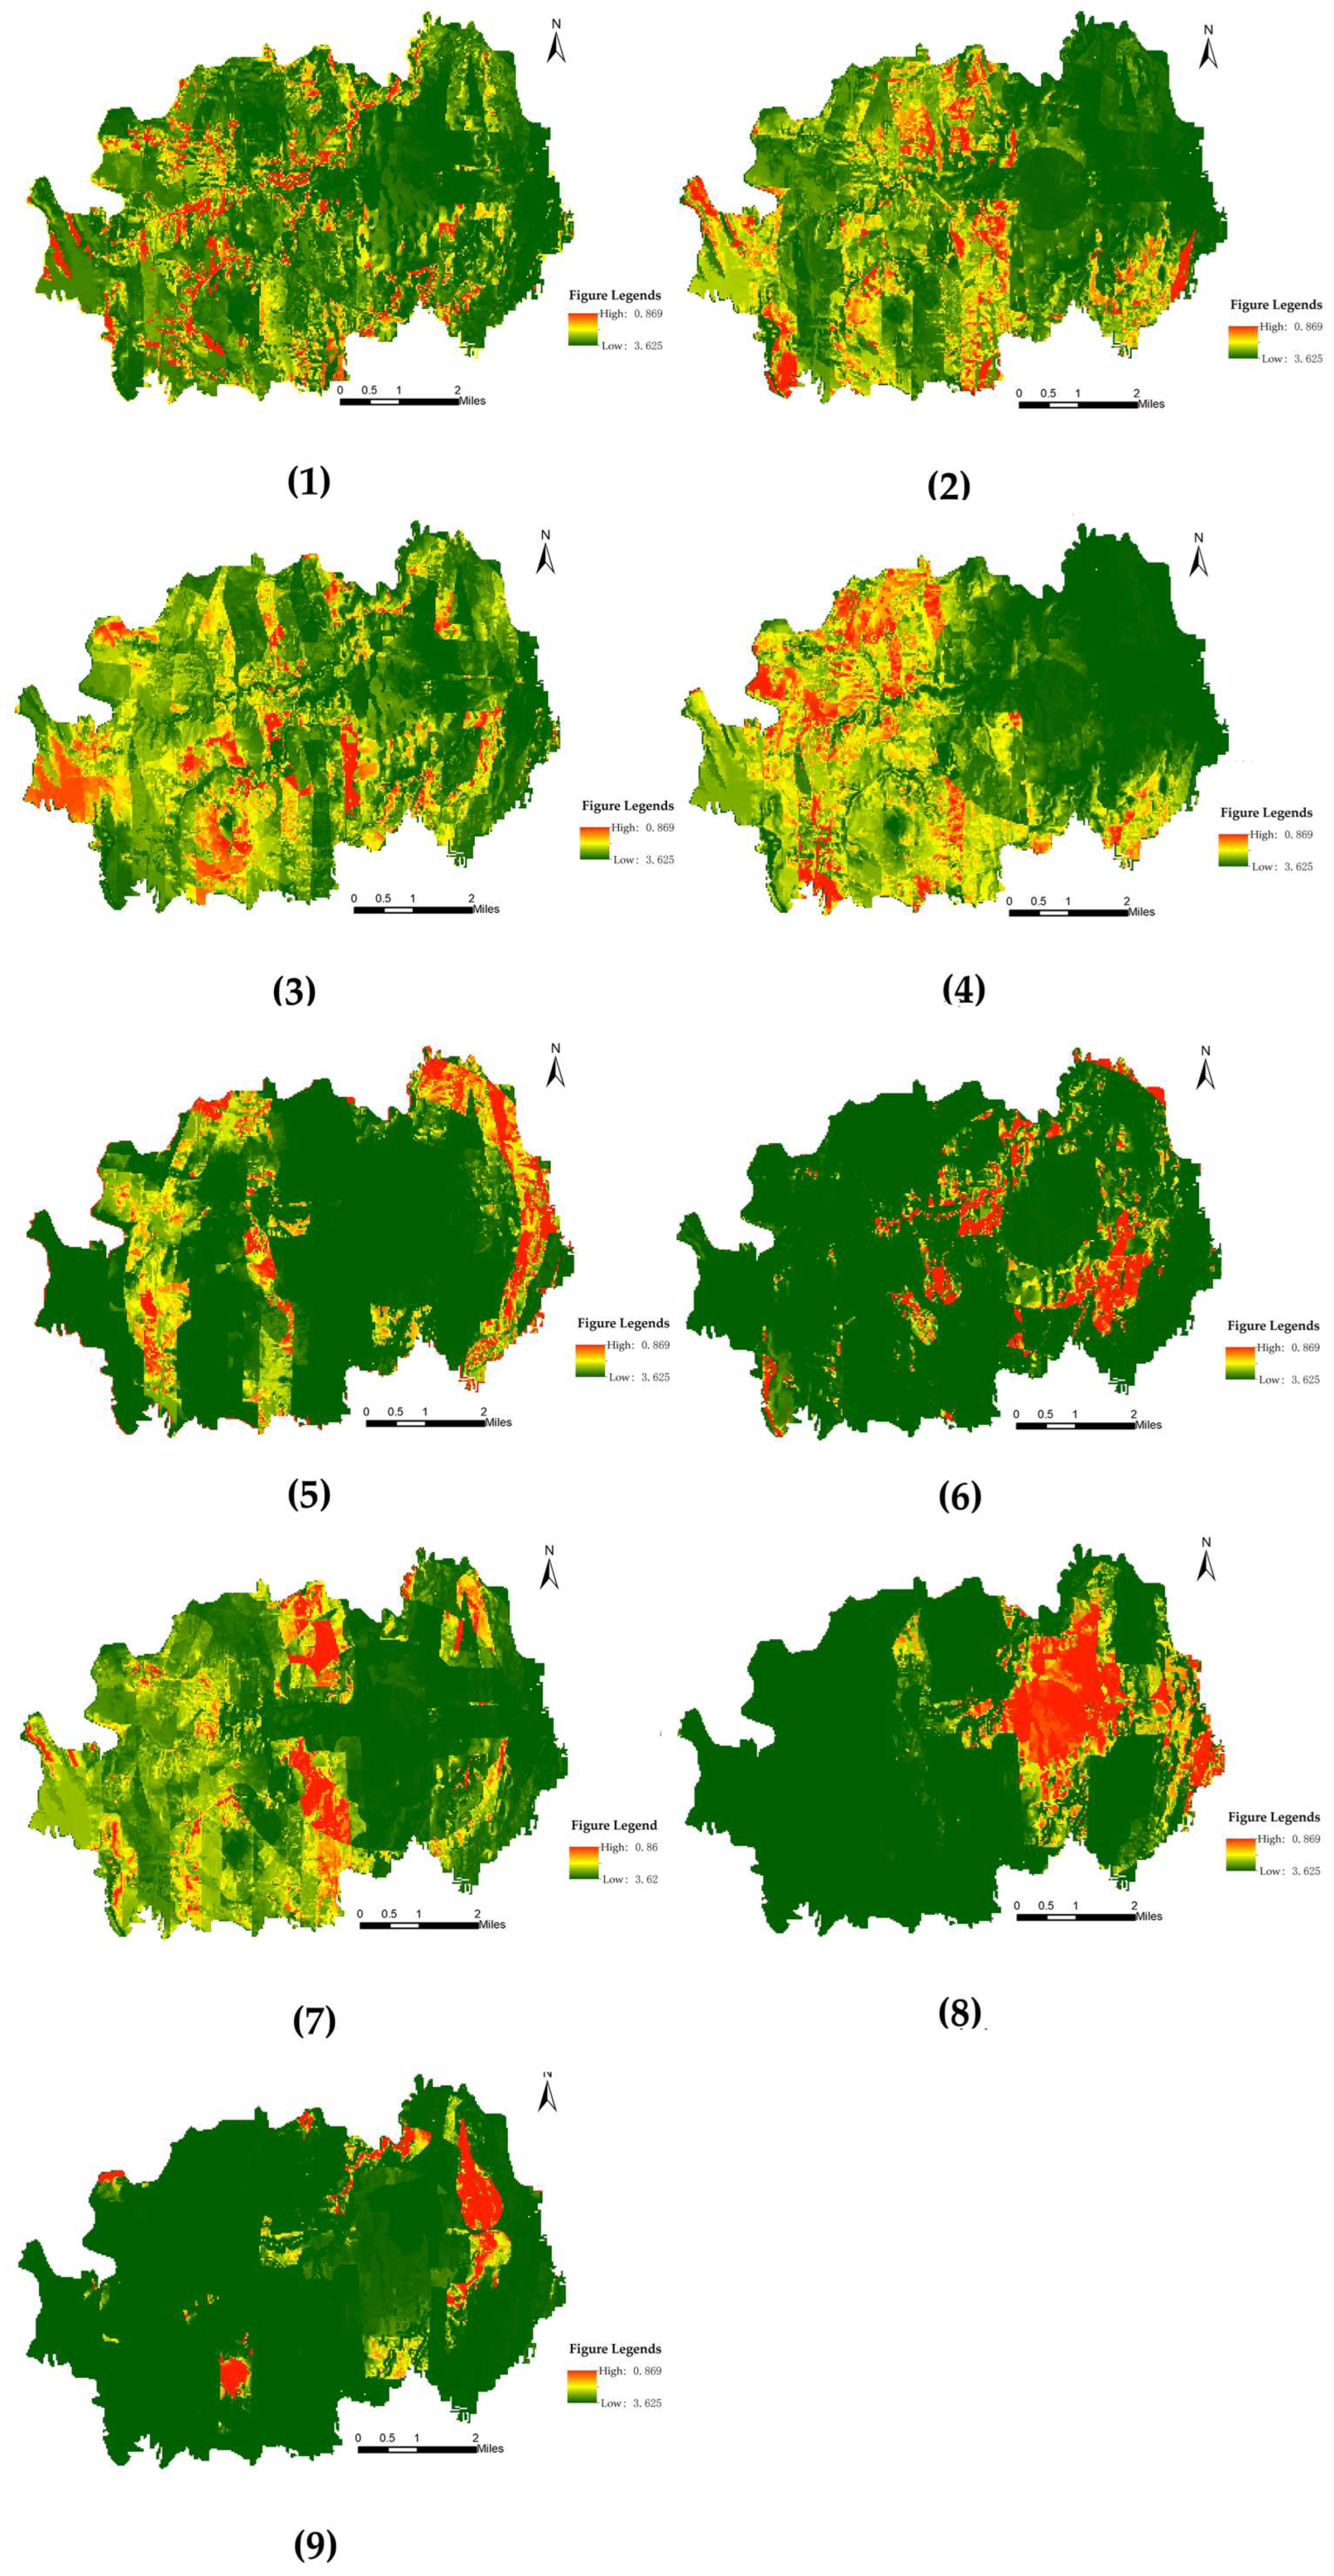
To elucidate the internal logic of the multi-scenario projections and avoid a “black-box” simulation, this section presents the intermediate results generated using 2020 as the base year. First, the driving factors—including topography (elevation, slope), demographic (population), and economic (GDP) metrics—were spatialized and standardized (Figure 4). Subsequently, the ANN module of the FLUS model utilized these factors to generate the spatial probability of occurrence for each land-use type for the 2030 simulation (Figure 5).Taking the Urban-Industrial-Mining land (S4) probability map as an example, it intuitively reflects the potential suitability of various grid cells for conversion into construction land under current socio-economic and natural constraints. High-probability areas (warm tones) are significantly clustered along major transportation axes, around the urban core, and in regions with high GDP density. This spatial distribution aligns closely with classic land-use change theories, indicating that the model successfully learned and quantified the influence of core drivers on urban expansion. Such transparent intermediate outputs enhance the interpretability of the simulation process and provide a mechanistic basis for the subsequent multi-scenario spatial patterns.
Figure 4.
Standardized map of driving factors (in order (1–8): elevation, slope, aspect, distance from pixel to main road, distance from pixel to town government, distance from pixel to water body, GDP per unit area, population density per unit area).
Figure 5.
Probability of occurrence of various land types (in order (1–9): cropland, garden land, forest land, urban-industrial-mining land, scenic and special-use land, transportation and water conservancy land, village land, grassland, and water and tidal flats).
3.2. Evolution of Land-Use Structure Under Multiple Scenarios
Based on the Multi-Objective Planning (MOP) model solved via MATLAB R2024b and LINGO 19.0, this study obtained the optimized quantitative land-use structures for the study area in 2030 under three development scenarios (Table 4). Overall, driven by established constraints and scenario objectives, each pathway exhibits distinct structural differentiation: land-use types with lower economic or ecological outputs were reduced, while high-benefit types expanded, thereby achieving the optimal comprehensive benefits predefined for each scenario.
Table 4.
Simulation results and changes in land-use quantity structure under multiple scenarios in 2030.
Under the Economic Priority Scenario (EPS), the land-use structure is significantly biased toward economic benefit objectives. Compared with the 2020 baseline data, urban–industrial–mining land (S4) and transportation and water conservancy land (S6) increased by 16.60% (+489.48 hm2) and 1.71% (+11.25 hm2), respectively, serving as the primary spatial carriers for regional economic growth. Conversely, cropland (S1) experienced the most substantial shrinkage, decreasing by 17.32% (−139.76 hm2), while grassland (S8) and water and tidal flats (S9) also saw sharp declines exceeding 27%. Although this structure maximizes economic output in the short term, it risks the loss of cropland resources and damage to the ecological foundation, posing challenges to long-term regional sustainability.
Under the Ecological Protection Scenario (EcPS), ecological benefit objectives dominate, leading to a profound restructuring of land use. Forest land (S3) and scenic and special-use land (S5) emerged as the primary gainers, with areas increasing by 5.27% (+90.69 hm2) and 62.48% (+33.93 hm2), respectively, significantly strengthening the scale and function of ecological spaces. To accommodate this expansion, grassland and water and tidal flats were both heavily compressed (each decreasing by approximately 27.33%). The expansion of various construction lands was strictly restricted, largely maintaining their current status. This structure clearly reflects the spatial trade-offs under the “ecology first” strategy, prioritizing ecological conservation while securing basic economic needs.
Under the Balanced Development Scenario (BDS), the BDS seeks a middle ground between development and conservation, exhibiting the most moderate and inclusive land-use changes. Among construction lands, only urban–industrial–mining land showed a slight growth of 0.72% (+21.15 hm2). Regarding ecological land, forest and scenic and special-use land increased by 2.44% and 18.41%, respectively—growth rates that lie between the two aforementioned radical scenarios. Cropland and garden land were almost entirely preserved, with negligible rates of change. Area reductions were primarily concentrated in water and tidal flats (−27.33%). This structure achieves the collaborative optimization of both economic and ecological benefits at the quantitative level, reflecting the trade-offs and equilibrium central to the philosophy of sustainable development.
3.3. Spatial Pattern Simulation and Comparison Under Multiple Scenarios
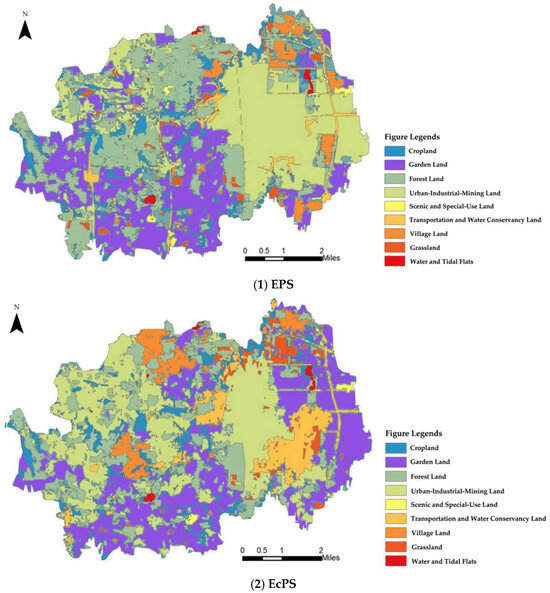
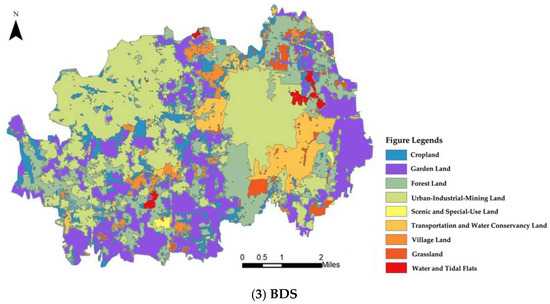
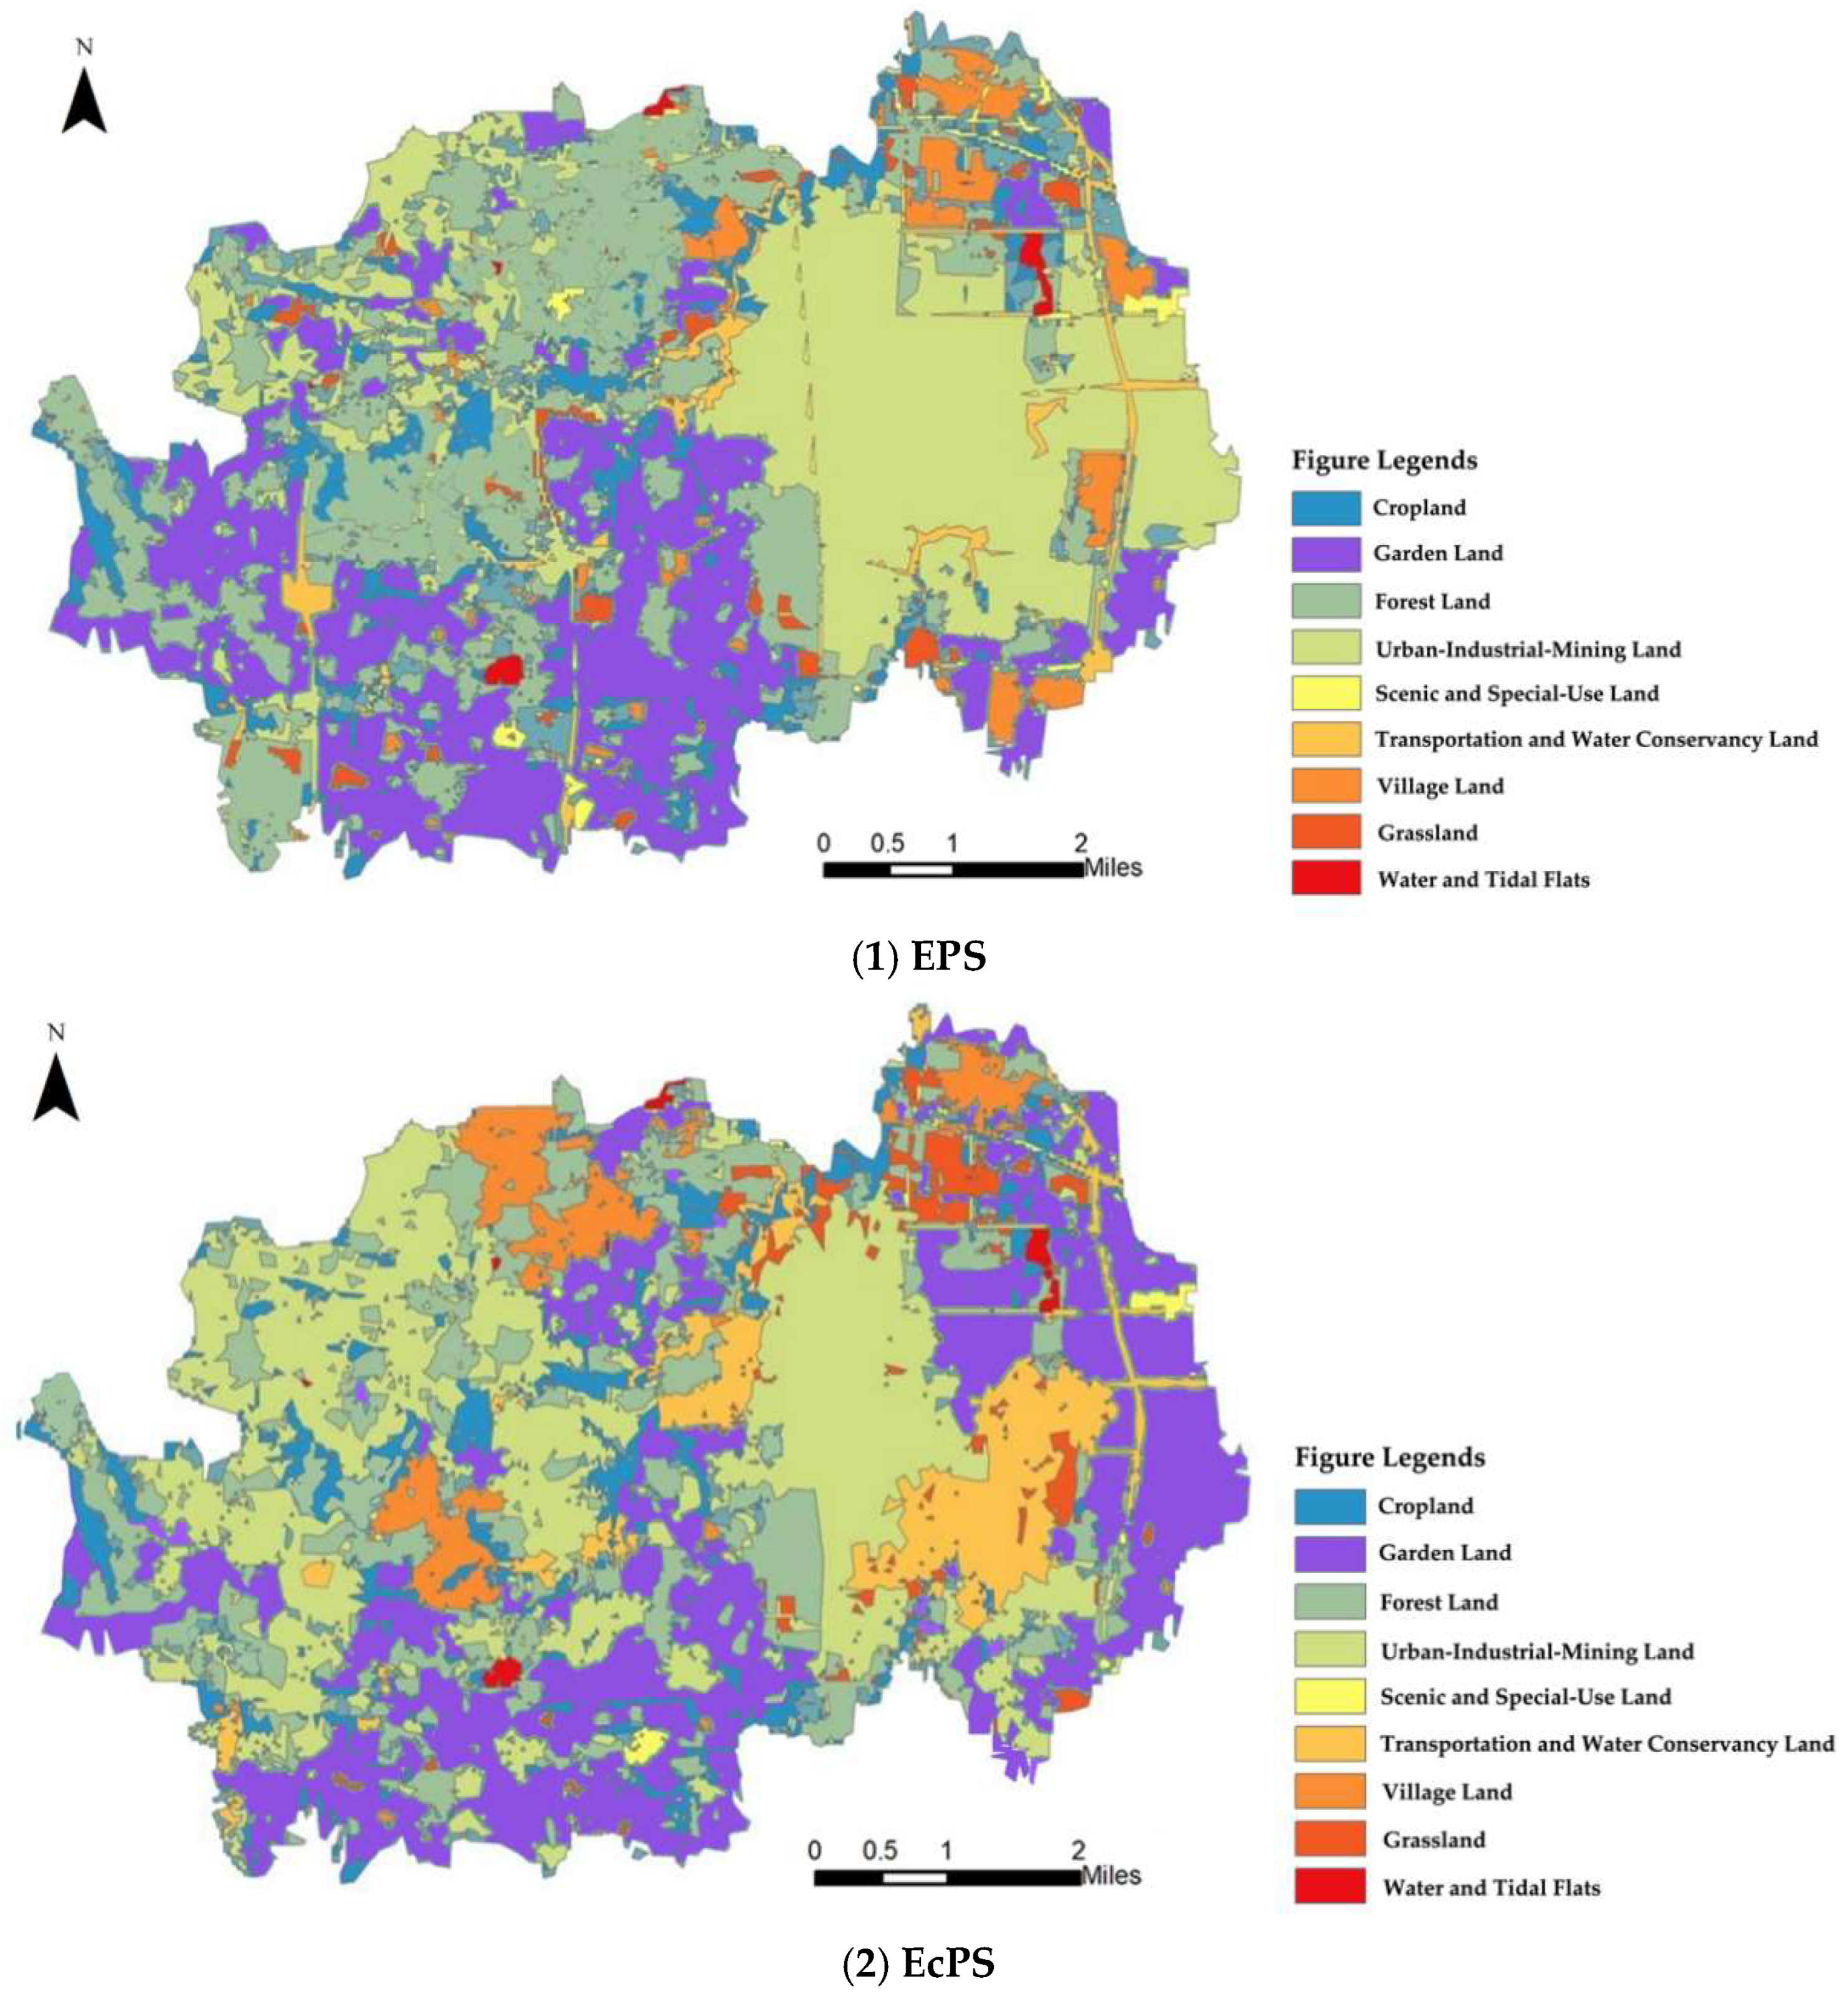
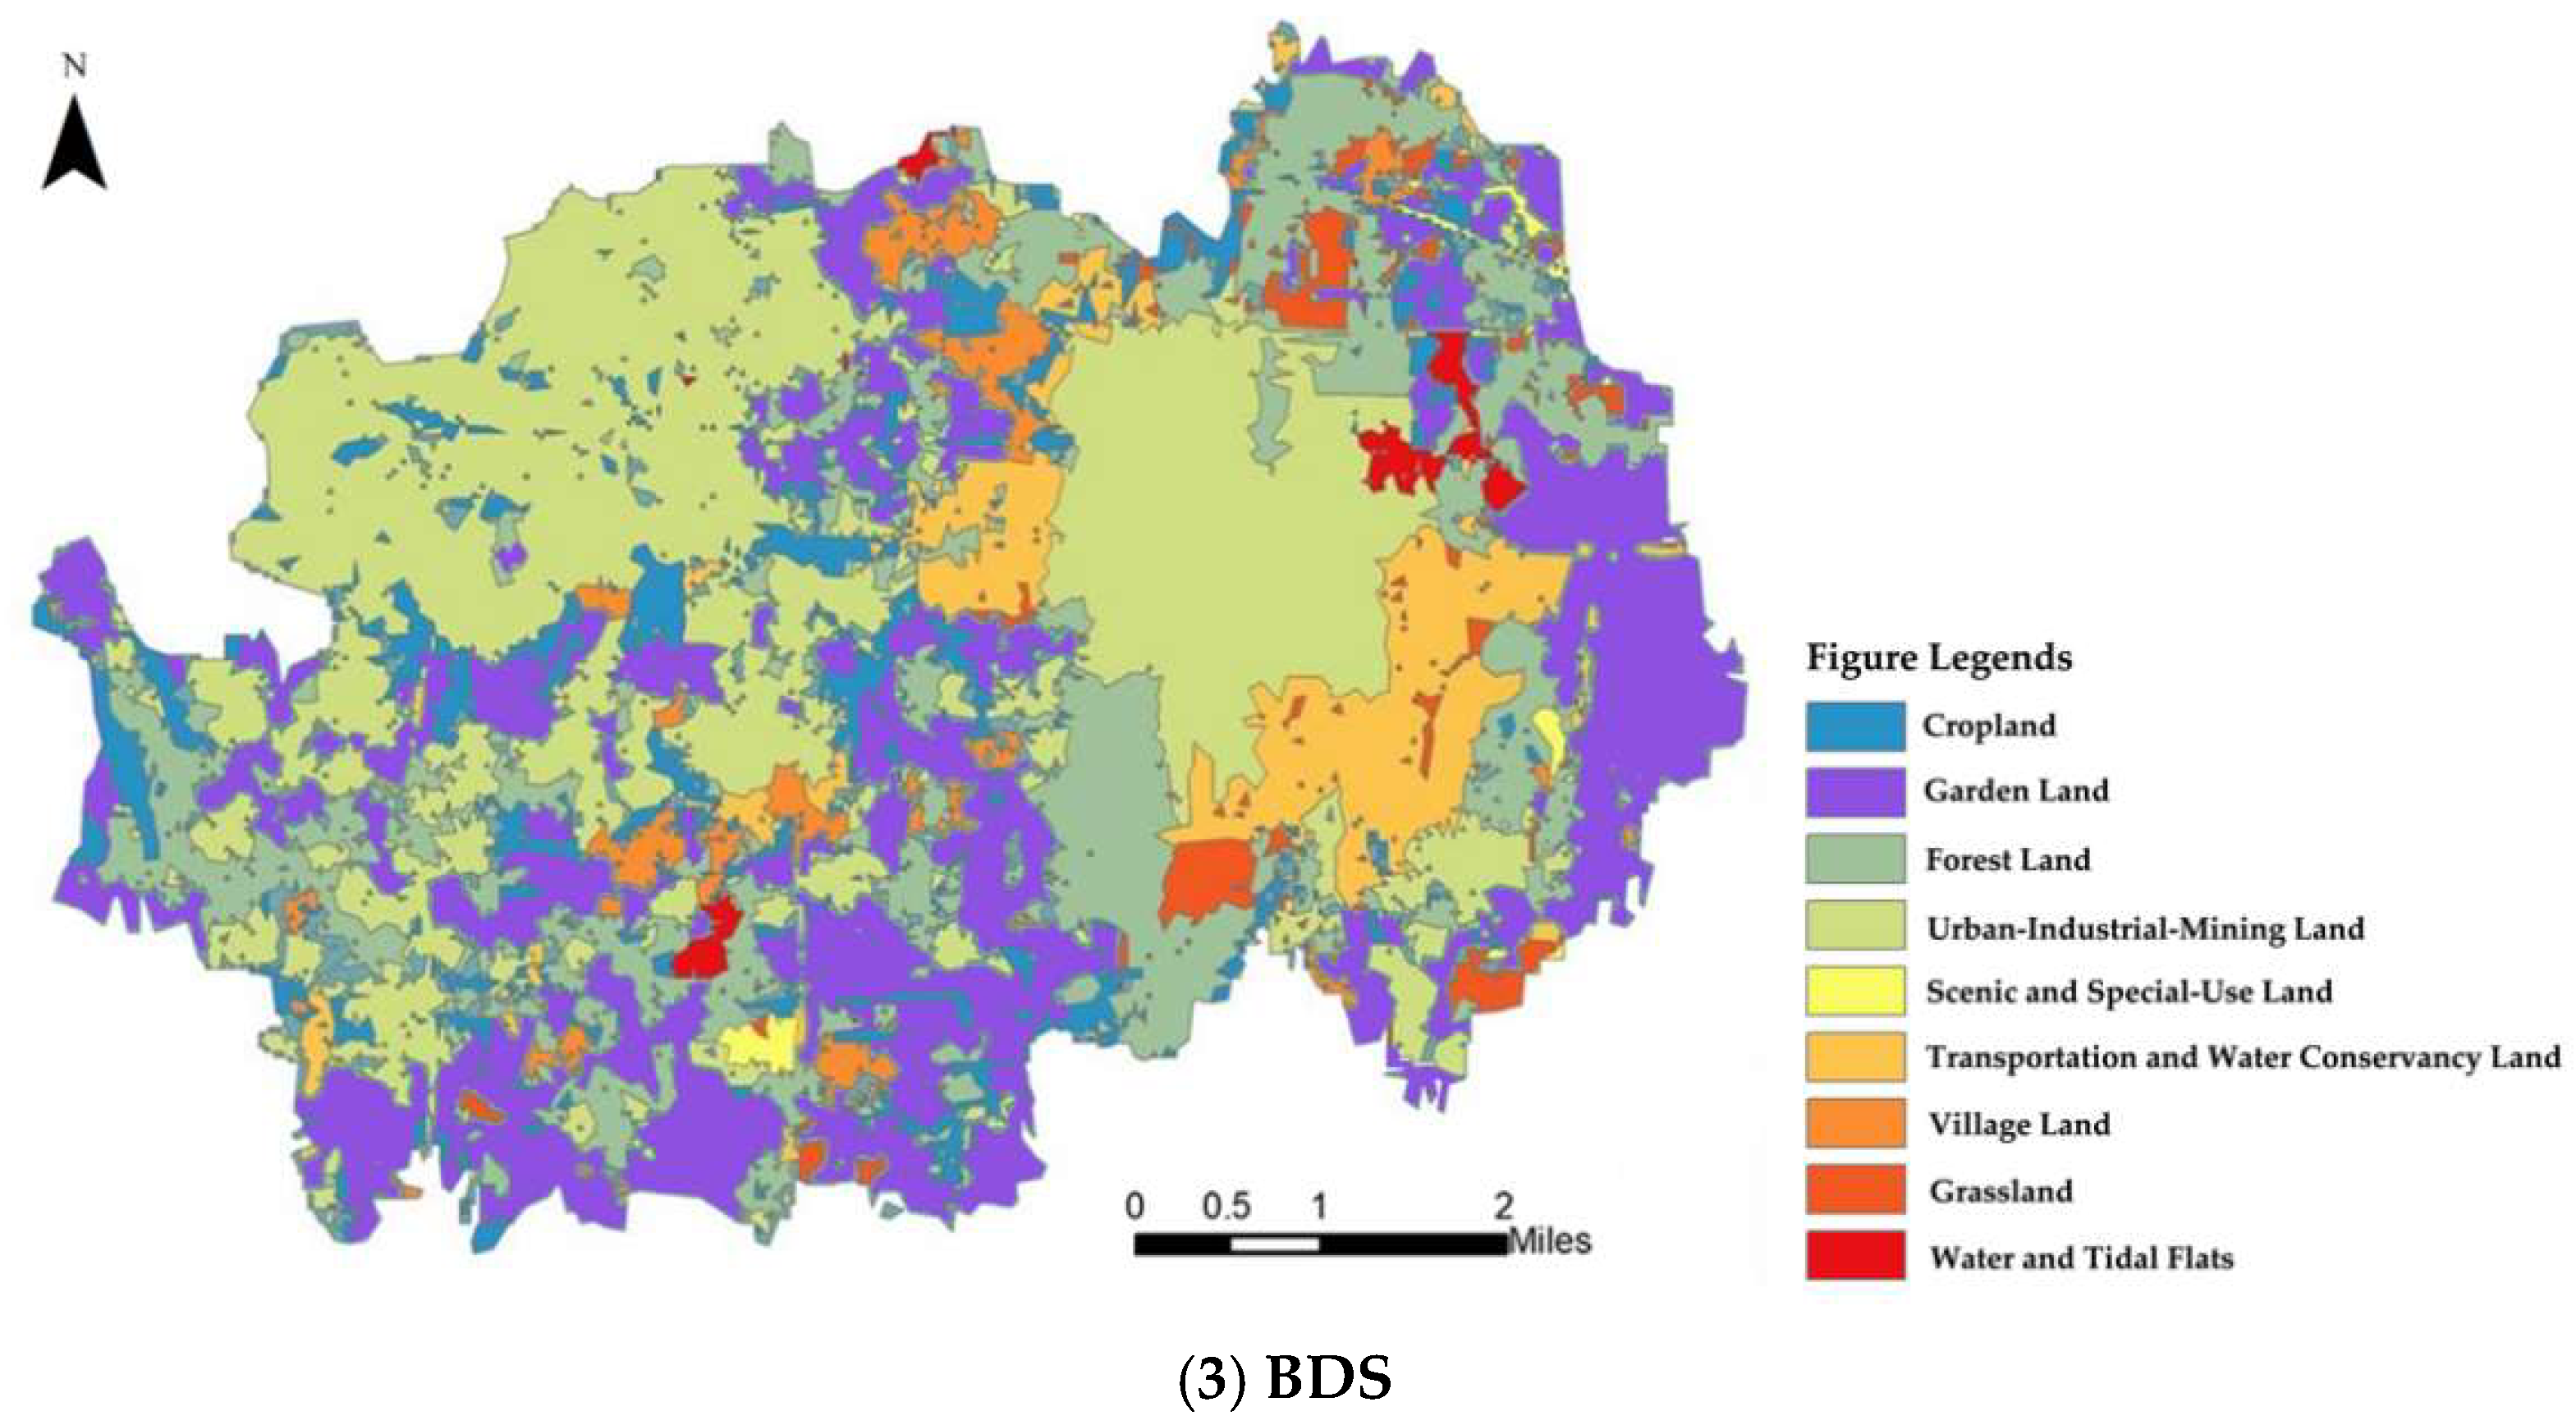
Leveraging the spatial simulation capabilities of the GeoSOS-FLUS V2.4 software, this study generated the land-use distribution patterns for the study area in 2030 under three development scenarios (Figure 6). The simulation results exhibit pronounced spatial differentiation across scenarios. The spatial reorganization of various land categories clearly reflects the divergent spatial logics driven by the strategic orientations of “Economic Priority,” “Ecological Protection,” and “Balanced Development.” The spatial reorganization across scenarios reflects the spatial responses of geographical evolutionary processes, governed by socio-economic drivers under specific policy constraints.
Figure 6.
Multi-scenario land-use simulation map for 2030.
3.3.1. Spatial Expansion and Encroachment Under the Economic Priority Scenario (EPS)
Under the EPS, urban-industrial-mining land (S4) demonstrates a prominent trend of agglomeration and expansion toward the northwest. A substantial portion of the original construction land in the east is phased out, with the spatial center of gravity shifting northwestward to form more intensive, contiguous growth zones integrated with newly added transportation and water conservancy land (S6). This process is accompanied by extensive encroachment on peripheral lands: cropland in the southeast and northeast exhibits marked fragmented recession, partially converting into construction or garden land. Garden land (S2) itself undergoes spatial reorganization, shifting from a dispersed to a concentrated pattern. Simultaneously, forest and scenic and special-use lands in the central region are squeezed, with some areas transitioning into garden or construction land. This pattern clearly illustrates the outcome of space competition oriented toward economic growth, where high-output land types expand and aggregate while ecological and agricultural spaces are segmented and eroded.
3.3.2. Spatial Protection and Restoration Under the Ecological Protection Scenario (EcPS)
Under the EcPS, the preservation and expansion of ecological space become dominant. Forest land (S3) coverage expands significantly, forming a more connected ecological matrix. Meanwhile, scenic and special-use land (S5) exhibits concentrated development in the eastern sector. To achieve these ecological goals, development is strictly constrained: urban-industrial-mining land in the east recedes noticeably, with its spatial demand redirected to the west. Village land (S7) is reconfigured through agglomeration in the northern and central regions, and the reclaimed space is partially converted into ecological land. While cropland remains generally stable, sporadic eco-conversions (e.g., returning farmland to forest) occur in the north. This pattern reflects the spatial implementation of the “Ecology First” strategy, enhancing regional ecological functions through construction land contraction, layout optimization, and systematic restoration of ecological spaces.
3.3.3. Spatial Trade-Offs and Optimization Under the Balanced Development Scenario (BDS)
The spatial pattern under the BDS is characterized by compromise and optimization. Development and protection reach a spatial equilibrium: while urban–industrial–mining land moderately shifts and concentrates in the northwest, no large-scale recession occurs in the east. The spatial morphology of cropland (S1) and garden land remains largely stable, with only minor conversions occurring at the peripheries. Ecological construction focuses on quality enhancement, with forest land showing steady “infill” growth and scenic-use land undergoing minor adjustments. Rural spaces are optimized via agglomeration in the north and center; specifically, some central villages are converted to forest, while eastern villages are integrated into urban-industrial clusters. This pattern achieves a precise spatial alignment and synergy between development and protection, providing a feasible spatial blueprint for long-term regional sustainability.
4. Discussion
4.1. Dialogue with Existing Research
The spatial patterns revealed in this study—characterized by “northwestern agglomeration” of construction land and “southeastern fragmentation” of cropland—contrast with the homogenized expansion observed by Men and Pan (2023) [35] at the watershed scale. This disparity validates their hypothesis regarding the scale-dependency of driving factor effects. By utilizing the MOP-FLUS coupling framework, we quantified the non-linear trade-offs between urban expansion and ecological loss. This deepens the observations of Zhang et al. (2022) [37]; while they noted conflicts between multiple objectives, our research further clarifies how these conflicts manifest spatially through specific geographical processes of marginal encroachment and contiguous protection.
Furthermore, our simulation identifies “Economic–Ecological Equilibrium” as the optimal sustainable path for Longhu Town. This echoes the conclusions of Yu et al. (2024) [38] in coastal wetland research: extreme scenarios of either protection or development trigger significant system vulnerabilities, whereas moderate, managed co-evolution is key to regional resilience. Finally, the identification of the eastern industrial conflict zone and the northeastern cropland sensitivity zone provides precise targets for spatial governance, operationalizing the framework of Wu et al. (2022) [34] regarding the spatial heterogeneity of climate and development impacts.
4.2. Interpretations of Deep Mechanisms
4.2.1. Spatial Maneuvering Between Market and Policy Forces
Under the Economic Priority Scenario (EPS), the pattern of northwestern urban clustering and marginal cropland encroachment is a direct spatial mapping of capital’s profit-seeking nature. In the absence of strong constraints, land development naturally gravitates toward areas with optimal locational conditions (e.g., proximity to the urban core and transport axes), revealing the “inertial expansion” mechanism of market-driven land use. Conversely, the Ecological Protection Scenario (EcPS) demonstrates how intensive policy intervention reshapes spatial logic. By polarizing the transition cost matrix and neighborhood weights, we simulated the “transmission-response” process of rigid constraints like Ecological Red Lines. Here, ecological value logic overrides economic utility, reconstructing the spatial pattern toward functional integrity.
4.2.2. The “Core–Periphery” Effect in Land Competition
The spatial evolution revealed by FLUS simulations is not a homogeneous phenomenon but exhibits a pronounced “core–periphery” geographical process, reflecting the spatial expansion logic driven by metropolitan radiation [39]. As a highly competitive land category, urban-industrial land demonstrates significant path dependency and agglomeration effects; it prioritizes “infilling” around existing built-up areas via neighborhood effects and extends axially along transportation corridors. In contrast, the recession of cropland and ecological land predominantly occurs at these expansionist “peripheral frontiers,” revealing their systemic vulnerability in spatial competition. The significance of this study lies in quantifying these competitive dynamics through multi-scenario comparisons: policy interventions (e.g., increasing the transition costs of ecological land) can substantially recalibrate competitive weights, shifting these land types from “passive retreat” to “stabilization or proactive expansion,” thereby optimizing the overall spatial structure.
4.2.3. Feedback Mechanisms of Regional Strategy at the Township Scale
As a constituent of the Zhengzhou Metropolitan Area, Longhu’s simulation results reflect the localization of regional strategies. The shift of the construction land’s center of gravity toward the Zhengzhou main city in all scenarios confirms that regional polarization is the fundamental driver of township evolution. Township land-use change is a product of regional exogenous forces and local endogenous governance, suggesting that its future is not a simple linear extrapolation but can be regulated through local institutional tools.
4.2.4. Systematic Trade-Offs from “Quantity Balance” to “Spatial Efficiency”
The optimal quantity structure from the MOP model is not mechanically implemented in FLUS; instead, it undergoes complex spatial competition. This reveals a tension between macro-quantity balance and micro-spatial efficiency. For instance, the drastic urban growth in the EPS necessitates the encroachment on high-quality cropland, leading to a “spatial mismatch” of food production and ecological services. The Balanced Development Scenario (BDS) essentially mitigates this mismatch through refined spatial rules (e.g., guiding industrial transfer and village agglomeration), maximizing overall territorial efficiency.
4.3. Methodological Contributions
The MOP-FLUS framework bridges the long-standing disconnect between “scale” and “layout” in land-use planning.
Synergy Disclosure: Unlike standalone MOP (lacking spatial logic) or FLUS (lacking strategic guidance), this coupling reveals non-linear trade-offs. In the BDS, for example, a mere 0.72% quantity increase achieves high spatial efficiency via “infill growth” strategies.
Precision Governance: It allows planners to “pre-test” the spatial consequences of quantitative targets, providing a robust methodology for precise territorial management.
4.4. Validation of Temporal Representativeness and Long-Term Evolutionary Trajectories
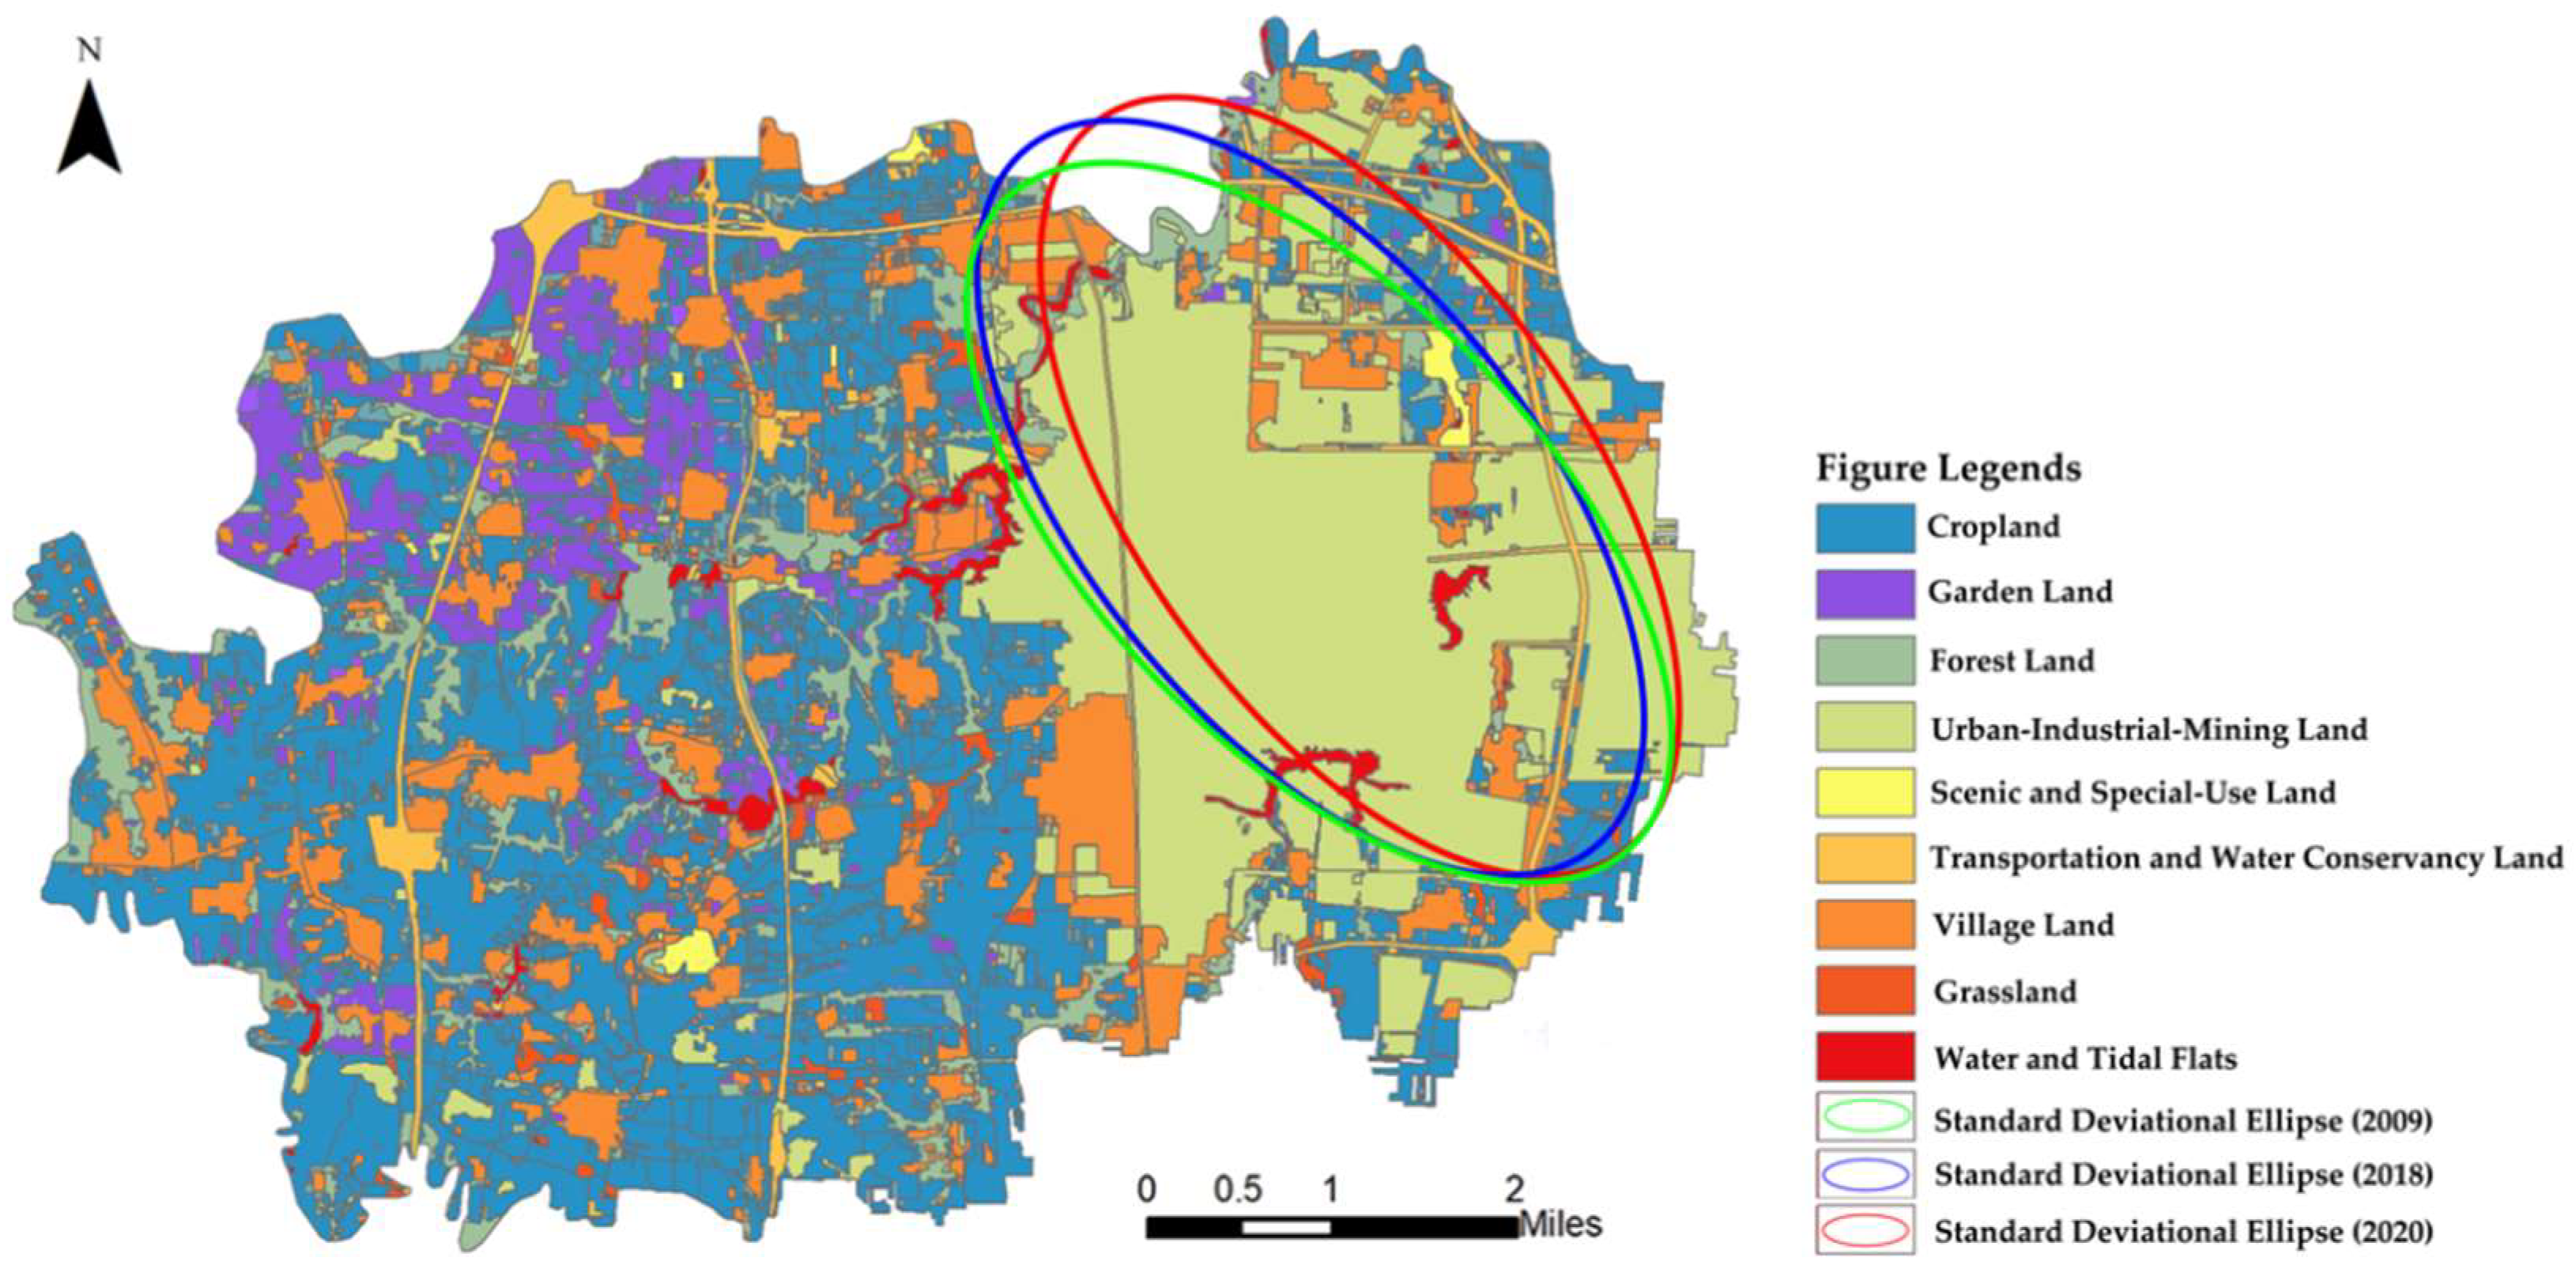
This study primarily calibrated the model parameters based on land-use change data from 2015 to 2020. We acknowledge that this five-year span is relatively short and may carry the risk of failing to fully capture long-term evolutionary patterns of land use, potentially leading to a misjudgment of trends for 2030. To validate the robustness of the simulation results, we incorporated additional historical time-series data (2009, 2018, and 2020) and conducted a retrospective verification of the region’s long-term spatial logic by calculating the Standard Deviational Ellipse (SDE). It should be noted that, while the land-use datasets for 2009 and 2018 explicitly included the “Construction Land” category, the 2020 dataset did not directly employ this terminology. To ensure data consistency for the longitudinal analysis, the “Urban–Industrial and Mining Land; Scenic and Special-Use Land; Transportation and Water Conservancy Land” category in the 2020 dataset is treated as equivalent to “Construction Land” in this discussion.
The calculation results (see Appendix A Table A5 and Figure A1) indicate that, based on the data from 2009, 2018, and 2020, the gravity center of construction land in Longhu Town exhibited a pronounced and continuous migration trend from “southeast to northwest.” This trajectory profoundly reflects the sustained radiative influence and gravitational pull of Zhengzhou’s main urban area on Longhu Town. Notably, the simulated gravity center of urban-industrial and mining land for 2030 continues this northwestward migration path, showing no significant directional deviation. This high consistency across the “History–Status Quo–Future” spatial trajectory demonstrates that, despite the relatively short modeling window, the model has successfully captured the core driving mechanisms dominating regional development (the urban sprawl pressure extending from the north). Consequently, the projected spatial pattern for 2030, derived from the 2015–2020 data, aligns with the long-term geographical evolutionary process and possesses high credibility.
4.5. Limitations and Future Directions
Although the “Optimization–Simulation” coupling framework constructed in this study has demonstrated high simulation accuracy at the township scale and provided valuable spatial decision support, several limitations remain, pointing directions for future research.
Potential Bias in Long-term Predictions Driven by Short-term Data Baselines: While the Standard Deviational Ellipse (SDE) analysis successfully validated the consistency of the spatial evolution trend (specifically, the northwest expansion), limitations regarding the quantitative prediction of land use must be acknowledged. Constrained by data availability, the future quantitative demands in this study were extrapolated using the GM(1,1) model based on the short-term time series from 2015 to 2020. This methodological approach inherently assumes that the urbanization rate and land conversion logic established during the “13th Five-Year Plan” period will continue in a linear or quasi-exponential manner. However, long-term projections derived from short baselines carry inherent risks, as they may not fully capture potential structural breakpoints triggered by future macroeconomic shifts or disruptive policy interventions. Consequently, the projected area values and spatial configurations for 2030 should be interpreted as reference scenarios indicating relative trends rather than absolute, precise predictions. Future research should aim to acquire multi-period historical data spanning longer decades to recalibrate the demand prediction module, thereby minimizing this extrapolation uncertainty.
Static Assumptions of Driving Factors: The use of annual static data for GDP and population ignores the dynamic nature of development, such as real-time traffic or emerging industrial zones. Future research should incorporate spatiotemporal sequence data (e.g., nighttime lights, mobile signaling) to enhance the model’s foresight.
Depth of Ecological Process Simulation: The current model treats ecological benefits as linear functions of area. Future studies should couple this framework with ecological models like InVEST or SWAT to transition from “area constraints” to “ecological function constraints,” maximizing ecosystem services.
Abstraction of Micro-Agent Behaviors: The model overlooks the differentiated decisions of households and enterprises. Incorporating Agent-Based Modeling (ABM) would link macro land-use change with micro-adaptive behaviors, enhancing the model’s power to explain complex human–environment interactions [40].
5. Conclusions
This study employed a coupled MOP-FLUS model framework to simulate and optimize land-use patterns in Longhu Town for the year 2030 under three distinct development pathways. The primary conclusions are as follows:
5.1. Core Findings and Optimal Pathway Identification
The research demonstrates that land-use evolution in rapidly urbanizing townships is a profound trade-off between economic drivers and ecological constraints. Among the simulated pathways, the Balanced Development Scenario (BDS) is identified as the optimal strategic choice for Longhu Town. Unlike the EPS, which secures industrial growth at the cost of a 17.32% loss in high-quality cropland, or the EcPS, which might stifle economic vitality, the BDS achieves a synergistic equilibrium. It accommodates a moderate 0.72% urban expansion while facilitating a 2.44% increase in forest land. This confirms that sustainable development in peri-urban areas is attainable through “infill” optimization rather than blind extensive sprawl.
5.2. Methodological and Theoretical Contributions
The primary contribution of this study is the construction of an operational “Evaluation–Simulation–Optimization” framework specifically tailored for the township scale.
Methodological Value: By coupling the quantitative optimization of MOP with the spatial dynamics of FLUS, this study successfully decodes the non-linear interactions between macro-targets and micro-allocations, effectively addressing the long-standing “quantity–space disconnect” in single-model applications.
Theoretical Significance: The study deepens the understanding of the “asymmetric spillover” mechanism in satellite towns. It confirms that small-scale land-use changes are jointly governed by metropolitan core radiation and policy-driven transition costs, providing a theoretical benchmark for research on similar peri-urban townships globally.
5.3. Planning Implications and Policy Recommendations
Based on the findings, we propose the following strategic recommendations for Longhu Town and similar administrative units:
- Adopt the Balanced Development Model: Planning authorities should transition from “single-growth” targets to a BDS-aligned framework, prioritizing the protection of the northeastern cropland belts while guiding industrial clustering toward the northwest.
- Implement Differentiated Zonal Governance: Targeted policies are required to resolve core spatial conflicts. In eastern conflict zones, we recommend “functional optimization and stock renewal” strategies to integrate ecological functions through urban renewal. In cropland-sensitive areas, a refined management approach focusing on “total volume stability, quality improvement, and layout adjustment” should be enforced to strictly protect contiguous high-quality agricultural land.
- Establish a “Diagnosis–Simulation–Evaluation” Dynamic Support System: The MOP-FLUS framework should be integrated as a routine tool for territorial spatial planning. By institutionalizing regular scenario simulations, planners can pre-evaluate the spatial impacts of various strategies, facilitating a shift from static “indicator control” to dynamic “scenario guidance and adaptive management.”
Author Contributions
Conceptualization, Y.M. and G.S.; methodology, Y.M.; software, Y.M.; validation, Y.M. and Y.G.; formal analysis, Y.M.; investigation, Y.M., G.S. and Y.G.; resources, Y.M.; data curation, Y.G.; writing—original draft preparation, Y.M.; writing—review and editing, Y.M. and Y.G.; visualization, Y.M.; supervision, G.S.; project administration, G.S. All authors have read and agreed to the published version of the manuscript.
Funding
This research was funded by the Fundamental Research Funds for the Central Universities of Hohai University grant number B200207039 and the Key Research Project of the National Social Science Fund of China grant number 21&ZD183. The APC was funded by the authors.
Data Availability Statement
The original contributions presented in the study are included in the article; further inquiries can be directed to the corresponding author.
Conflicts of Interest
The authors declare no conflicts of interest.
Appendix A
Table A1.
Land-Use Reclassification System and Description.
Table A2.
Data Validity Check, Fitting Accuracy of the GM(1,1) Model, and Predicted Benefit Coefficients for 2030.
Table A3.
Land-use transition cost matrices under three scenarios.
Table A4.
Neighborhood factor parameters under three scenarios.
Table A5.
Gravity Center Coordinates and SDE Rotation Angles of Construction Land (2009, 2018, and 2020).
Figure A1.
Standard Deviational Ellipses of Construction Land (2009, 2018, and 2020).
References
- Ma, T.; Cao, X.; Zhao, H. Development Zone Policy and High-Quality Economic Growth: Quasi-Natural Experimental Evidence from China. Reg. Stud. 2023, 57, 590–605. [Google Scholar] [CrossRef] [Scilit]
- Chen, W.; Zeng, J.; Li, N. Change in Land-Use Structure Due to Urbanisation in China. J. Cleaner Prod. 2021, 321, 128986. [Google Scholar] [CrossRef] [Scilit]
- Zhou, Y.; Li, X.; Liu, Y. Rural Land System Reforms in China: History, Issues, Measures and Prospects. Land Use Policy 2020, 91, 104330. [Google Scholar] [CrossRef] [Scilit]
- Zhou, Y.; Wu, T.; Wang, Y. Urban Expansion Simulation and Development-Oriented Zoning of Rapidly Urbanising Areas: A Case Study of Hangzhou. Sci. Total Environ. 2022, 807, 150813. [Google Scholar] [CrossRef] [Scilit]
- Zhou, L.; Zhang, W.; Fang, C.; Sun, H.; Lin, J. Actors and Network in the Marketization of Rural Collectively-Owned Commercial Construction Land (RCOCCL) in China: A Pilot Case of Langfa, Beijing. Land Use Policy 2020, 99, 104990. [Google Scholar] [CrossRef] [Scilit]
- Hou, Y.; Li, Y.; Li, J.; Huang, Q.; Duan, X.; Feng, X.; Zhu, G. Simulating the Dynamics of Urban Land Quantity in China from 2020 to 2070 under the Shared Socioeconomic Pathways. Appl. Geogr. 2023, 159, 103094. [Google Scholar] [CrossRef] [Scilit]
- Wang, Y.; Song, C.; Gao, Y.; Ye, S.; Gao, P. Integrating National Integrated Assessment Model and Land-Use Intensity for Estimating China’s Terrestrial Ecosystem Carbon Storage. Appl. Geogr. 2024, 162, 103173. [Google Scholar] [CrossRef] [Scilit]
- Zhang, R.; Lee, C.Y.; Malahayati, M.; Xu, Y.; Onodera, S.; Saito, M.; Ridwansyah, I.; Wang, R. Optimizing Land Use for Carbon Neutrality: A Scenario Analysis in the Jakarta Metropolitan Area. Sustain. Futures 2025, 9, 100702. [Google Scholar] [CrossRef] [Scilit]
- Aghaloo, K.; Sharifi, A. Balancing Priorities for a Sustainable Future in Cities: Land Use Change and Urban Ecosystem Service Dynamics. J. Environ. Manag. 2025, 382, 125460. [Google Scholar] [CrossRef] [Scilit]
- Gong, Q.; Hui, X.; Tian, Z. Risk Section Classification of Tunnel Settlement Based on Land-Use Development Simulation and Uncertainty Analysis. Int. J. Transp. Sci. Technol. 2023, 12, 716–728. [Google Scholar] [CrossRef] [Scilit]
- Duan, Z.; Lu, C.; Wang, X.; Tang, X.; Sheng, S. Spatiotemporal Evolution and Multi-Scenario Simulation of Rural Settlements in Liangzhou District: Evidence from an Oasis Region in the Arid Northwest. Land 2025, 14, 2397. [Google Scholar] [CrossRef] [Scilit]
- Zhang, Z.; Pan, H.; Gan, J.; Sheng, S.; Lu, G. Spatiotemporal Evolution and Scenario Simulation of Landscape Ecological Risk in Hilly–Gully Regions: A Case Study of Zichang City. Land 2025, 14, 2358. [Google Scholar] [CrossRef] [Scilit]
- Liang, Y.; Zhang, L.; Li, Q.; Yang, L.; Sun, J.; Tian, G.; Wang, T.; Zhao, H.; Wang, D. Spatiotemporal Dynamics and Forecasting of Ecosystem Service Value in Zhengzhou Using Land-Use Scenario Simulation. Land 2025, 14, 2255. [Google Scholar] [CrossRef] [Scilit]
- Xing, X.; Wang, Q.; Meng, F.; Liu, P.; Huang, L.; Zhuo, W. Assessing the Land Use-Carbon Storage Nexus along G318: A Coupled SD-PLUS-InVEST Model Approach for Spatiotemporal Coordination Optimization. Land 2025, 14, 2067. [Google Scholar] [CrossRef] [Scilit]
- Han, S.; Kang, Y.; Jo, H.; Ahn, M.; Kim, T.; Son, S. Future Land Use and Cover Modeling in South Korea: Linking SSP-RCP with FLUS Model. Land 2025, 14, 2380. [Google Scholar] [CrossRef] [Scilit]
- Zhang, Y.; Zheng, M.; Qin, B. Optimization of Spatial Layout Based on ESV-FLUS Model from the Perspective of “Production-Living-Ecological”: A Case Study of Wuhan City. Ecol. Modell. 2023, 481, 110356. [Google Scholar] [CrossRef] [Scilit]
- Jiang, X.; Zhai, S.; Liu, H.; Chen, J.; Zhu, Y.; Wang, Z. Multi-Scenario Simulation of Production-Living-Ecological Space and Ecological Effects Based on Shared Socioeconomic Pathways in Zhengzhou, China. Ecol. Indic. 2022, 137, 108750. [Google Scholar] [CrossRef] [Scilit]
- Lai, J.; Qi, S.; Chen, J.; Guo, J.; Wu, H.; Chen, Y. Exploring the Spatiotemporal Variation of Carbon Storage on Hainan Island and Its Driving Factors: Insights from InVEST, FLUS Models, and Machine Learning. Ecol. Indic. 2025, 172, 113236. [Google Scholar] [CrossRef] [Scilit]
- Wang, N.; Chen, X.; Zhang, Z.; Pang, J. Spatiotemporal Dynamics and Driving Factors of County-Level Carbon Storage in the Loess Plateau: A Case Study in Qingcheng County, China. Ecol. Indic. 2022, 144, 109460. [Google Scholar] [CrossRef] [Scilit]
- Zhang, Y.; Yu, P.; Tian, Y.; Chen, H.; Chen, Y. Exploring the Impact of Integrated Spatial Function Zones on Land Use Dynamics and Ecosystem Services Tradeoffs Based on a Future Land Use Simulation (FLUS) Model. Ecol. Indic. 2023, 150, 110246. [Google Scholar] [CrossRef] [Scilit]
- Yang, Y.; Chen, X.; Zhang, Y.; Cao, Y.; Jin, D. Multi-Scenario Simulation of Land Use Transition in a Post-Mining City Based on the GeoSOS-FLUS Model: A Case Study of Xuzhou, China. Land 2025, 14, 2442. [Google Scholar] [CrossRef] [Scilit]
- Lin, W.; Sun, Y.; Nijhuis, S.; Wang, Z. Scenario-Based Flood Risk Assessment for Urbanizing Deltas Using Future Land-Use Simulation (FLUS): Guangzhou Metropolitan Area as a Case Study. Sci. Total Environ. 2020, 739, 139899. [Google Scholar] [CrossRef] [Scilit]
- Zhang, L.; Feng, F.; Huang, H.; Cao, Y.; Jiang, S.; Shi, W.; Lv, H.; Xu, C.; Sanesi, G.; Lafortezza, R. Scenario-Based Simulation of Ecosystem Service Supply and Demand in China’s Yangtze River Economic Belt. Environ. Res. 2025, 285, 122264. [Google Scholar] [CrossRef] [Scilit]
- Xu, Y.; Xiao, C.; Bai, J.; Wang, D.; Wen, L.; Long, L.; Qiu, J.; Zhang, Y. Spatio-Temporal Evolution of Coastal Wetlands and Carbon Storage Driven by Natural and Anthropogenic Processes in Yancheng City, China. Estuarine Coastal Shelf Sci. 2025, 325, 109466. [Google Scholar] [CrossRef] [Scilit]
- Yu, T.; Jia, S.; Zhang, Y.; Cui, X. How Can Urban Expansion and Ecological Preservation Be Balanced? A Simulation of the Spatial Dynamics of Production-Living-Ecological Spaces in the Huaihe River Eco-Economic Belt. Ecol. Indic. 2025, 171, 113192. [Google Scholar] [CrossRef] [Scilit]
- Shi, P.; Zhou, D.; Jiang, J.; Huang, X.; Zhang, J.; Dong, Q.; Jia, Y. Spatiotemporal Evolution Pattern of Water Yield Service of Ecosystems in the Shule River Basin, Northwest China, Integrating Future Climate and Land Use Changes. Ecol. Indic. 2025, 181, 114452. [Google Scholar] [CrossRef] [Scilit]
- Hu, Y.; Gao, M.; Batunacun. Evaluations of Water Yield and Soil Erosion in the Shaanxi-Gansu Loess Plateau under Different Land Use and Climate Change Scenarios. Environ. Dev. 2020, 34, 100488. [Google Scholar] [CrossRef] [Scilit]
- Liang, Z.; Liang, X.; Jiang, X.; Li, T.; Guan, Q. Balancing Simulation Performance and Computational Intensity of CA Models for Large-Scale Land-Use Change Simulations. Environ. Modell. Softw. 2025, 185, 106293. [Google Scholar] [CrossRef] [Scilit]
- Ma, L.; Wang, Q.; Zhu, Y.; Liu, Z. The Impact and Mechanism of New-Type Urbanization on High-Quality Forestry Development: A Case Study of the Yellow River Basin in China. Diversity 2025, 17, 7. [Google Scholar] [CrossRef] [Scilit]
- Yu, Y.; Zhao, K.; Du, Y. Nexus between New-Type Urbanization, Economic Development, and Haze Pollution in China: A Spatial Analysis. J. Urban Plann. Dev. 2024, 150, 04024043. [Google Scholar] [CrossRef] [Scilit]
- Li, T.; Nie, J.; Qiu, G.; Li, Z.; Ji, C.; Li, X. Time Series Forecasting via an Elastic Optimal Adaptive GM(1,1) Model. Electronics 2025, 14, 2071. [Google Scholar] [CrossRef] [Scilit]
- Li, D.; Qiu, M.; Yang, S.; Wang, C.; Luo, Z. An Optimal Fractional-Order Accumulative Grey Markov Model with Variable Parameters and Its Application in Total Energy Consumption. AIMS Math. 2023, 8, 26425–26443. [Google Scholar] [CrossRef] [Scilit]
- Xie, G.; Zhang, C.; Zhang, C.; Xiao, Y.; Lu, C. The Value of Ecosystem Services in China. Resour. Sci. 2015, 37, 1740–1746. (In Chinese) [Google Scholar]
- Wu, J.; Luo, J.; Zhang, H.; Qin, S.; Yu, M. Projections of Land Use Change and Habitat Quality Assessment by Coupling Climate Change and Development Patterns. Sci. Total Environ. 2022, 847, 157491. [Google Scholar] [CrossRef] [Scilit]
- Men, D.; Pan, J. Ecological Network Identification and Connectivity Robustness Evaluation in the Yellow River Basin under a Multi-Scenario Simulation. Ecol. Modell. 2023, 482, 110384. [Google Scholar] [CrossRef] [Scilit]
- Luan, C.; Liu, R. Integrated Ecological and Environmental Spatial Soft Constraint Mechanism: Urban Multi-Objective Land Use Optimization under Multiple Scenarios. J. Environ. Manag. 2025, 385, 125661. [Google Scholar] [CrossRef] [Scilit]
- Zhang, X.; Ren, W.; Peng, H. Urban Land Use Change Simulation and Spatial Responses of Ecosystem Service Value under Multiple Scenarios: A Case Study of Wuhan, China. Ecol. Indic. 2022, 144, 109526. [Google Scholar] [CrossRef] [Scilit]
- Yu, B.; Zang, Y.; Wu, C.; Zhao, Z. Spatiotemporal Dynamics of Wetlands and Their Future Multi-Scenario Simulation in the Yellow River Delta, China. J. Environ. Manag. 2024, 353, 120193. [Google Scholar] [CrossRef] [Scilit]
- Cartier, C.; Oakes, T. Introduction: Vast Land of Borders: Empire, State, and Territory in China. Eurasian Geogr. Econ. 2024, 65, 709–729. [Google Scholar] [CrossRef] [Scilit]
- Grillitsch, M.; Sotarauta, M. Trinity of Change Agency, Regional Development Paths and Opportunity Spaces. Prog. Hum. Geogr. 2020, 44, 704–723. [Google Scholar] [CrossRef] [Scilit]
- GB/T 21010-2017; Current Land Use Classification. Standards Press of China: Beijing, China, 2017.

Disclaimer/Publisher’s Note: The statements, opinions and data contained in all publications are solely those of the individual author(s) and contributor(s) and not of MDPI and/or the editor(s). MDPI and/or the editor(s) disclaim responsibility for any injury to people or property resulting from any ideas, methods, instructions or products referred to in the content. |
© 2026 by the authors. Licensee MDPI, Basel, Switzerland. This article is an open access article distributed under the terms and conditions of the Creative Commons Attribution (CC BY) license.