


Abstract
Vegetation cover characteristics underpin the understanding of regional ecosystem status and guide sustainable development. While extensive research has documented long-term vegetation dynamics in Qinghai Province, critical gaps remain in identifying driving factors, quantifying their thresholds, and uncovering nonlinear relationships governing vegetation cover. In view of this, based on the MOD13Q1V6 dataset from the Google Earth Engine (GEE) platform, this study constructed a kernel normalized difference vegetation index (kNDVI) dataset for Qinghai Province spanning the period 2001–2023. Furthermore, the spatiotemporal characteristics and future evolution trends of vegetation cover were revealed by employing methods including the Theil–Sen–Mann–Kendall (Theil–Sen–MK) trend test, Hurst exponent, and centroid migration model. At a grid scale of 5 km × 5 km, based on the combined model of Extreme Gradient Boosting and SHapley Additive exPlanations (XGBoost-SHAP), this study integrated 10 multi-source remote sensing variables related to natural conditions, socioeconomic factors, and geographical accessibility to reveal the nonlinear effects between driving factors and kNDVI and identify the key threshold inflection points. The results showed the following: (1) From 2001 to 2023, the kNDVI of Qinghai Province exhibited a fluctuating growth trend with an annual growth rate of 0.0016 per year, presenting a spatial pattern of being higher in the southeast and lower in the northwest. Specifically, the kNDVI of unused land achieved the highest growth rate (65.96%), which was significantly higher than that of other land use types. (2) The kNDVI in Qinghai Province was dominated by stable areas, accounting for 52.75%. Future trend analysis indicated that the region was primarily characterized by sustainable improvement zones (39.91%), while areas with uncertain future trends accounted for 39.70%. (3) The XGBoost-SHAP model revealed that the annual mean precipitation (AMP) (47.26%) and Digital Elevation Model (DEM) (20.40%) exerted substantial impacts on the kNDVI. Marginal effect curves identified distinct threshold inflection points for the major characteristic factors: AMP = 363.2 mm (95%CI: 361.2–365.2 mm), DEM = 4463.9 m (95%CI: 4446.0–4481.1 m), grazing intensity = 1.8 SU (Stocking Unit)·ha−1 (95%CI: 1.8–1.9 SU·ha−1), and slope = 2.8° (95%CI: 2.7–3.0°) and 19.0° (95%CI: 18.8–19.3°). The interaction combinations of AMP × DEM and DEM × distance to construction land exerted a strong positive effect on the kNDVI in the study area, which was conducive to enhancing vegetation cover. These findings verified the effectiveness of ecological projects implemented in Qinghai Province to a certain extent and provided data support for subsequent differentiated restoration and management.
1. Introduction
The combined and superimposed effects of climate change and human activities have gradually emerged as a key factor restricting ecosystem stability, which has been verified in numerous studies [1,2]. Specifically, it is characterized by frequent extreme climate events, accelerated biodiversity loss, intensified habitat fragmentation, and grassland degradation coupled with desertification expansion in arid regions [2,3]. Land use/cover change (LUCC) acts as a key driver of the aforementioned phenomena; the land ecological issues arising from its impacts—including farmland degradation, grassland desertification, and alpine gravelization (it is a geo-ecological process occurring in the high-elevation areas of the Qinghai–Tibet Plateau, characterized by the accumulation of surface gravel and soil degradation driven by exogenic geomorphic processes)—will exert negative impacts on the sustainable utilization and management of regional land [4,5]. As a core barrier zone on the Qinghai–Tibet Plateau, Qinghai Province exhibits fragility and sensitivity in its land distribution pattern due to its geographical location, and land use patterns may exert an impact on the regional ecosystem service functions [6]. Ecological restoration is recognized as a crucial approach to effectively enhance ecosystem stability [7]. Currently, Qinghai Province is steadily advancing major ecological projects, including grain-to-green programs, desertification prevention and control, and national park construction [8,9]. Therefore, clarifying the spatiotemporal distribution pattern of vegetation cover and its driving mechanisms is conducive to the coordinated implementation of ecological projects, and it is of great practical significance for the scientific planning and zonal management of regional land.
As primary producers in ecosystems, vegetation serves as a pivotal link in material cycling and energy flow among Earth’s spheres. It also plays an irreplaceable role, particularly in facilitating carbon sink function conversion [10]; any reduction or increase in vegetation cover will trigger cascading effects within ecosystems [11]. High vegetation cover not only characterizes the rationality of land use structure but also verifies the effectiveness of regional ecological governance and restoration [6,8,9]. From a land management perspective, rational and orderly land use can facilitate the positive succession of vegetation and enhance land productivity and carrying capacity [12]; conversely, it will lead to vegetation degradation and trigger ecological problems such as desertification and sandy desertification [13]. Internationally, long-term dynamic assessment based on vegetation cover has become one of the core approaches for land management [14,15]. Relevant studies on cold and arid regions in China have indicated that the dynamic characteristics of vegetation cover are closely associated with climate change and land planning [16,17]. A wealth of practical evidence has confirmed that ecological projects such as afforestation and the Grain for Green Program can increase regional vegetation cover and maintain the health and stability of ecosystems [18]. Owing to the differences in land conditions, hydrothermal conditions, and government policy support across various regions, their impacts on regional vegetation cover exhibit significant spatial heterogeneity [19]. Existing research still has shortcomings in the in-depth coupling of vegetation dynamic changes and regional land policies, which is insufficient to support refined zonal management and control of regions [20]. Thus, investigating the spatiotemporal patterns and driving factor responses of long-term vegetation growth can facilitate the in-depth integration of remote sensing monitoring and land planning, providing a scientific basis for supporting the sustainable and coordinated development of regional land resources.
Vegetation indices are core remote sensing indicators for quantifying vegetation growth and vitality, which are commonly used to characterize the spatial distribution of vegetation [21]. They provide technical means for the dynamic monitoring of ecological conditions and serve as tools for evaluating the effectiveness of land use changes and ecological restoration projects [14,18,20]. With the in-depth research on vegetation cover conducted by international scholars, a diversified evaluation index system has gradually been established. Among these indices, the commonly used ones include the normalized difference vegetation index (NDVI), enhanced vegetation index (EVI), and soil-adjusted vegetation index (SAVI). These indices have been widely applied in farmland quality assessment, land use change monitoring, and ecological red line delimitation across different spatiotemporal scales, yielding a series of research findings [22,23] and enriching the theoretical and practical research on regional vegetation cover.
Despite the substantial advances in research on traditional vegetation indices derived from linear operational relationships, notable limitations persist: (1) The “saturation” issue in high-vegetation-cover areas: Indices such as the NDVI exhibit sluggish responses in regions with excessively high vegetation cover [24], making it difficult to distinguish differences in vegetation vitality among high–vegetation cover areas [25], which is not conducive to the zonal protection of vegetation. (2) The background interference issue in low–vegetation cover areas: Since the NDVI relies heavily on reflectance differences, exposed rocks and soils are highly likely to mask partial vegetation information [26,27], leading to overestimated or underestimated assessment results and thus affecting subsequent ecological evaluation outcomes. (3) The unstable spatiotemporal comparability issue: Affected by differences in sensor performance and vegetation phenological delays, uncertainties may arise in the results of long-term remote sensing monitoring and assessment [28]. To address the limitations of linear vegetation indices, Camps-Valls et al. [29] proposed a nonlinear vegetation index based on machine learning principles and kernel functions—the kernel normalized difference vegetation index (kNDVI)—in 2021. Studies have shown that this index exhibits excellent discrimination capability in high–vegetation cover areas and strong resistance to background interference in low–vegetation cover areas. It has been validated and applied across diverse spatial units at the national scale [30] and other regional scales, including the Qinghai–Tibet Plateau, the Loess Plateau, nature reserves, ecological project implementation zones, and mining areas [31,32,33,34,35], thereby complementing and improving the assessment performance of other vegetation indices. Meanwhile, the advancement of remote sensing technology has made it possible to conduct long-term retrospective studies. The GEE platform, which deeply integrates massive volumes of remote sensing images and data products, provides robust support for the long-term calculation and processing of the kNDVI.
Currently, a large number of scholars have conducted thorough studies on the vegetation cover characteristics and driving factors in Qinghai Province. At the regional scale, systematic assessments have mainly been carried out using linear indices such as the NDVI and EVI [16,36,37]. By adopting methods including Pearson correlation coefficients, partial correlation analysis, and geographical detectors, these studies have revealed that vegetation growth is jointly affected by climatic factors and human activities [38,39,40]. However, located in the northeastern Qinghai–Tibet Plateau, the “Roof of the World” [41], Qinghai Province features a large elevation difference and complex topography. Restricted by the limitations of traditional vegetation indices, relevant research still has the following shortcomings and controversies: (1) Current research assumes a linear relationship between driving factors and vegetation cover, ignoring potential nonlinear relationships and threshold effects between them; thus, research on nonlinear characteristics needs further exploration. (2) No studies to date have investigated the spatiotemporal dynamics of the kNDVI at the provincial scale, and the characterization of vegetation cover across diverse land use types also warrants in-depth investigation. (3) Qinghai Province has a vast territory and strong spatial heterogeneity of driving factors, leading to no consensus on the relative contribution of these factors to vegetation cover. To address the existing limitations in the study area, particularly the lack of quantitative analysis of the nonlinear characteristics of driving factors, we introduce the XGBoost-SHAP hybrid model. The XGBoost model exhibits exceptional performance in analyzing high-dimensional, large-scale datasets and modeling complex nonlinear relationships, thus having been widely applied across numerous research fields. However, it remains an inherently “black–box” model that cannot directly quantify the specific contribution of individual factors [42]. The SHAP (SHapley Additive exPlanations) framework precisely compensates for this deficiency: it not only quantifies the magnitude of the contributions from each driving factor but also identifies the direction of their impacts [43]. In summary, this study integrates the kNDVI with the XGBoost-SHAP model to investigate the complex nonlinear relationships between vegetation cover and its driving factors while quantitatively assessing the extent of their respective impacts. This research focuses on addressing three core research questions as follows: (1) What are the spatiotemporal dynamics of the kNDVI in Qinghai Province across different land use types? In particular, do significant changes occur in vegetation cover within unused land areas? (2) What is the future variation trend of vegetation in Qinghai Province? (3) What are the core factors affecting the kNDVI in Qinghai Province? Do the main factors exhibit nonlinear relationships or threshold effects with the kNDVI?
In view of this, the kNDVI of Qinghai Province, China, from 2001 to 2023 was computed in this study based on the MOD13Q1V6 dataset from the GEE platform. Subsequently, trend test analysis, the Hurst exponent, and the gravity center migration model were integrated to perform a comprehensive analysis of the spatiotemporal dynamics and future variation trends of the kNDVI in the study area. Furthermore, multi-source remote sensing data pertaining to natural environmental data, socioeconomic data, and geographic accessibility data, combined with the XGBoost-SHAP model, were employed to quantify the driving factors restricting kNDVI changes and reveal their nonlinear characteristics. The findings of this study are expected to provide empirical data support for land use structure planning, ecological project effectiveness evaluation, and sustainable development in Qinghai Province.
2. Materials and Methods
2.1. Study Area
Qinghai Province is located in the northeastern part of the Qinghai–Tibet Plateau, with geographical coordinates range from 89°35′ to 103°04′ E and from 31°09′ to 39°19′ N [44]. The terrain is generally characterized as high in the west and low in the east, with highlands in the north and south and lowlands in the central region (Figure 1). Dominated by plateau and mountainous landforms, the elevation ranges from 1637 to 6730 m, with an average elevation exceeding 3000 m [39] (Figure 1c,d). It features a typical plateau continental climate, characterized by scarce and concentrated precipitation, long sunshine duration, intense solar radiation, and significant temperature differences between day and night [39]. The Annual Mean Temperature (AMT) ranges from −5.1 to 9.0 °C [44], and precipitation is highly unevenly distributed throughout the year, with the rainy season typically occurring from May to October. Regional precipitation varies significantly, generally decreasing gradiently from the southeast to the northwest. Boasting numerous river systems, Qinghai Province is the source of the Yangtze River, Yellow River, and Lancang River, earning it the reputation of “China’s Water Tower” [36]. According to data from the 2023 Qinghai Provincial Water Resources Bulletin (http://www.qinghai.gov.cn/), the average annual precipitation in Qinghai Province in 2023 was 370.5 mm, 17.1% higher than the multi-year average, indicating a water-abundant year; the total water resources reached 85.538 billion m3. In addition, it is endowed with abundant animal, plant, and mineral resources.
Figure 1.
Overview of the study area. (a) Geographic location map of Qinghai Province. The administrative boundary vector data were sourced from the National Geographic Information Resource Catalog Service System of the Ministry of Natural Resources, with the map verification number: GS (2022) 1873 [45]. No modifications were made to the base map boundaries, and the unified coordinate system is WGS_1984_UTM_Zone_47N. (b) Land use types in 2023 (land use types were merged based on the China Land Cover Dataset (CLCD) from Wuhan University, including six major categories: cropland, forest, grassland, water, construction, and unused land). Main administrative region names and their abbreviations: Xining City; Haidong City; Haibei Tibetan Autonomous Prefecture, Haibei Prefecture; Hainan Tibetan Autonomous Prefecture, Hainan Prefecture; Yushu Tibetan Autonomous Prefecture, Yushu Prefecture; Golog Tibetan Autonomous Prefecture, Golog Prefecture; Haixi Mongolian and Tibetan Autonomous Prefecture, Haixi Prefecture; Huangnan Tibetan Autonomous Prefecture, Huangnan Prefecture. (c) DEM. (d) Slope.
We adopted the land use classification system of the Chinese Academy of Sciences (https://www.resdc.cn/) and divided the land use types of Qinghai Province into the following categories based on the first-level classification: cropland, forest, grassland, water, construction, and unused land. Among these, grassland and unused land account for 65.29% and 29.40% of the total area, respectively (Figure 1b). The main vegetation types include alpine meadow, alpine steppe, shrubland, forest, and desert as well as semi-desert vegetation [39]. According to data from the Qinghai Provincial Bureau of Statistics (http://www.qinghai.gov.cn/), the province had a permanent resident population of 5.94 million by the end of 2023, an increase of 709,000 compared with 2001, with its GDP reaching $54.836 billion. Qinghai Province comprises 2 prefecture-level cities (Xining City and Haidong City) and 6 autonomous prefectures [8], namely Haibei Tibetan Autonomous Prefecture, Huangnan Tibetan Autonomous Prefecture, Hainan Tibetan Autonomous Prefecture, Golog Tibetan Autonomous Prefecture, Yushu Tibetan Autonomous Prefecture, and Haixi Mongolian and Tibetan Autonomous Prefecture, covering a total area of approximately 720,000 square kilometers [39] (Figure 1a). Due to its unique physical geographical characteristics, vegetation growth is highly susceptible to the impacts of human activities and climate change [46].
With the continuous and in-depth advancement of multiple ecological initiatives—including the Three-River Headwaters National Park, Qinghai Lake National Nature Reserve, and the Qinghai section of Qilian Mountains National Park—these efforts effectively underpin Qinghai Province’s fulfillment of its strategic positioning as the “most critical ecological security barrier, most ecologically sensitive region, and area with the heaviest ecological protection responsibilities” while safeguarding national ecological security.
2.2. Data Sources and Preprocessing
The vegetation cover data were acquired from the GEE platform (https://earthengine.google.com/). By accessing the MOD13Q1V6 dataset, the kNDVI data of the area from 2001 to 2023 were calculated using the Maximum Value Composite (MVC) method [47]. This dataset has a spatial resolution of 250 m and a temporal resolution of 16 days. The driving factors can be primarily classified into three categories based on data type—natural environment, socioeconomics, and geographic accessibility (Table 1)—which are specified as follows: (1) Land use type: The China Land Cover Dataset (CLCD) is a long-term annual land cover dataset for China developed by Professors Yang Jie and Huang Xin from Wuhan University. It is based on Landsat images from the GEE platform and available at https://zenodo.org/records/12779975, accessed on 15 December 2025. With a spatial resolution of 30 m, the dataset comprises 9 land use types including cropland, forest, shrub, grassland, water, snow/ice, barren, impervious, and wetland [48]. In light of the actual conditions of the study area, these types were reclassified into 6 categories: cropland, forest, grassland, water, construction, and unused land. To ensure the consistency of research scales, all datasets were resampled to a uniform spatial resolution of 250 m × 250 m using the Nearest Neighbor method via the Resample tool in ArcGIS 10.7, with the projected coordinate system uniformly standardized to WGS 1984 UTM Zone 47N. (2) Natural environmental data: The main selected data include DEM, slope, AMT, AMP, and soil data. Among these, the DEM was a numerical representation of terrain elevation used to extract slope and elevation factors. It was obtained from ASTER GDEM V3 on the Geospatial Data Cloud platform (http://www.gscloud.cn/) with a spatial resolution of 30 m; slope was calculated using GIS tools. The AMT and AMP data were relatively important meteorological factors for a region. They were sourced from the National Tibetan Plateau Scientific Data Center (https://data.tpdc.ac.cn/) with a spatial resolution of 1000 m. Soil data were derived from the Harmonized World Soil Database (HWSD) Version 1.2, with a spatial resolution of 1000 m. To ensure the consistency of research scales, all datasets were resampled to a uniform spatial resolution of 250 m × 250 m via bilinear interpolation using the resampling tool in ArcGIS 10.7, with the projected coordinate system uniformly standardized to WGS_1984_UTM_47N. (3) Socioeconomic factors: Two core datasets were selected: population density data from the global LandScan Population Dataset (https://landscan.ornl.gov/) with a spatial resolution of 1000 m and grazing intensity data from the National Ecosystem Science Data Center (https://www.nesdc.org.cn/) with a spatial resolution of 300 m. The spatial resolution was unified to 250 m × 250 m via bilinear interpolation, and the projected coordinate system was standardized to WGS_1984_UTM_47N. (4) Geographic accessibility data: Distances to construction land, rivers, and lakes were extracted from land use type data and calculated using the Euclidean distance tool in GIS. Distances to major roads and railways were computed after extraction from the OpenStreetMap (OSM) road dataset (https://www.openstreetmap.org/). The spatial resolution of the datasets was processed using the identical method described above to ensure their spatial alignment.
Table 1.
Data sources.
2.3. Research Methods
The methods adopted in this study closely focus on the core of the research: clarifying the spatiotemporal patterns of vegetation cover and identifying key driving factors in Qinghai Province. Meanwhile, the following research methods are selected based on the principles of comprehensiveness, rationality, and accessibility. The basic research framework is current vegetation cover diagnosis → future trend interpretation → spatial pattern evolution → nonlinear driving mechanism analysis (Figure 2).
Figure 2.
Technical roadmap of the study. Step 1 mainly integrates multi–source datasets to construct a database. Step 2 focuses on spatio-temporal evolution analysis, including Theil–Sen–MK trend analysis, Hurst exponent, and centroid migration model. From left to right, the subplots are: Spatial distribution of different grades of kNDVI in Qinghai Province, Future trend characteristics of the kNDVI, and kNDVI centroid migration trajectory. Step 3 mainly conducts model accuracy validation and identification of driving thresholds. The left panel shows marginal effect plots: (a–f) represent the marginal effect plots for AMP (X3), DEM (X1), grazing intensity (X4), distance to construction land (X6), soil organic carbon content (X9), and slope (X2), respectively. The right panel shows interaction plots: (a) SHAP interaction scatter plot of AMP vs. DEM, showing the distribution of their interaction effect on model output; (b) SHAP interaction scatter plot of AMP vs. grazing intensity, reflecting the spatial distribution of their interaction effect; (c) SHAP interaction scatter plot of AMP vs. distance to construction land, presenting the contribution pattern of their interaction to prediction results; (d) SHAP interaction scatter plot of DEM vs. grazing intensity, revealing the strength and direction of their interaction effect; (e) SHAP interaction scatter plot of DEM vs. distance to construction land, demonstrating the non-linear impact of their interaction on model output; (f) SHAP interaction scatter plot of grazing intensity vs. distance to construction land, showing the distribution characteristics of their interaction effect.
2.3.1. Calculation of kNDVI
Previous studies on vegetation cover in Qinghai Province have mostly focused on traditional linear vegetation indices (e.g., NDVI) to characterize the ecological evolution processes of the region [16,37]. However, since the NDVI is calculated primarily through linear difference normalization of near-infrared and red spectral bands, it tends to suffer from saturation in high-cover areas and susceptibility to interference in low-cover areas [24]. These limitations can mask subtle vegetation changes, thereby compromising the reliability of assessment results [25]. The kNDVI is theoretically based on the nonlinear transformation of kernel methods [29]; by modifying the spatial mapping of original spectral features via kernel functions, it can effectively capture the nonlinear relationships between spectral reflectance and vegetation cover. Relevant studies have confirmed that the kNDVI outperforms the NDVI in terms of saturation resistance and anti-interference capability [30,31]. It ranges from 0 to 1. Therefore, based on the MOD13Q1V6 dataset on the GEE, this study calculated the kNDVI of Qinghai Province for the period 2001–2023. Its calculation principle is described as follows [28]:
wherein kNDVI denotes the kernel normalized difference vegetation index; tanh(·) represents the hyperbolic tangent function in the nonlinear operation; NIR refers to the near-infrared band; Red denotes the red band; and σ is the length-scale parameter, whose value can be adjusted to characterize the nonlinear response of the index to vegetation cover under different scenarios. Generally, it is assigned an average value of σ = 0.5 × (NIR + Red) [49], and thus, the above formula can be simplified as follows:
In this study, the coefficient of variation (CV) was employed to quantify the kNDVI variability in low- and high-vegetation zones, aiming to evaluate the anti-saturation performance of the kNDVI in high-cover zones and its anti-interference capability in low-cover areas [50]. Specifically, based on the kNDVI dataset of Qinghai Province spanning 2001 to 2023, the study area was classified into low–vegetation zones (kNDVI ≤ 0.05) and high-vegetation zones (kNDVI > 0.38) using the natural breaks classification method. Long-term trend plots and boxplots for both regions were generated using Python 3.13. Comparative analysis of these plots was then conducted to further validate the effectiveness of the kNDVI in high-vegetation zones.
2.3.2. Theil–Sen–MK Trend Analysis
Theil–Sen slope analysis is a robust nonparametric trend quantification method with strong resistance to outliers, measurement errors, and other disturbances. It is highly efficient and widely applied in analyzing long-term time-series trend variations and is employed herein to examine the pixel-wise change trends of vegetation cover in Qinghai Province from 2001 to 2023. The M-K trend test is often used in conjunction with Theil–Sen slope analysis. This test method has the advantages of being independent of data distribution and free from the interference of outliers [51] and is mainly used to evaluate whether the long-term change trends of time-series data are significant, authentic, and substantial [33]. The unit of the slope value defined as kNDVI year−1 (dimensionless per year). Herein, the superscript −1 denotes the reciprocal, meaning per year.
2.3.3. Hurst Exponent
The Hurst exponent (H) is a key indicator based on rescaled range analysis (R/S analysis) for quantifying the long-term memory and trend persistence of long time-series data [52]. Essentially, it identifies the tendency of future evolution trends to be consistent with or reverse historical trends by exploring the self-similarity of historical time series [53], rather than providing deterministic predictions of future trends. It ranges from 0 to 1. Drawing on previous research [54], the specific classification criteria are as follows:
- (1)
- When 0 ≤ H < 0.5, the future kNDVI evolution trend in Qinghai Province will reverse the historical trend, showing anti-persistence; the closer the value is to 0, the stronger the anti-persistence.
- (2)
- When 0.5 < H ≤ 1, the future kNDVI evolution trend in Qinghai Province will be consistent with the historical trend, showing persistence; the closer the value is to 1, the stronger the persistence.
- (3)
- When H ≈ 0.5, the kNDVI evolution in Qinghai Province tends to be random, meaning future trends cannot be inferred from historical data, and thus, the results have no reference significance.
To characterize the spatial heterogeneity of future kNDVI trends more precisely, the Hurst exponent is further divided into six levels with reference to relevant studies [49], as detailed in Table 2. This classification method fully accounts for the impacts of Qinghai Province’s unique geographical location on vegetation cover, enabling finer capture of subtle regional variations and facilitating subsequent ecological management and governance. However, it should be noted that the Hurst exponent infers trend persistence based on the assumption of no severe disturbances in the short term. If drastic changes (e.g., climate shifts) occur, such trend inferences will be significantly affected, and the Hurst exponent may not fully reflect the duration of persistence [54].
Table 2.
Classification of Hurst exponent for kNDVI in Qinghai Province.
2.3.4. Centroid Migration Model
The gravity center migration of the kNDVI is calculated based on the annual kNDVI gravity center coordinates, with kNDVI values serving as spatial weights: regions with higher kNDVI values exert a greater influence on the gravity center distribution. By analyzing the migration distance and direction of the gravity center between adjacent years, the spatial succession patterns of vegetation cover can be revealed [55]. This method is implemented using the functions of ArcGIS 10.7, and its core principle is described as follows:
wherein Xt and Yt represent the longitude and latitude coordinates of the kNDVI centroid in the study area during period t; n is the total number of pixels; Cti denotes the kNDVI value of the i-th pixel during period t; and Xti and Yti are the geometric centroids of the i-th pixel during period t.
2.3.5. XGBoost-SHAP Model
XGBoost is a decision tree-based distributed gradient boosting framework that outperforms traditional gradient boosting algorithms with distinctive advantages: it enables weighted processing of data distributions, incorporates regularization to mitigate overfitting, supports parallel computing for accelerated model training, and allows for automatic handling of missing values. As an enhanced variant of the gradient boosting tree ensemble, it has been widely applied to classification and regression tasks involving large-scale, high-dimensional datasets [42]. The core principle of XGBoost lies in iterative training to continuously rectify prediction errors, with the final model output generated by aggregating the predictions of all base learners [56]. However, XGBoost remains an inherently “black-box” model, lacking the ability to provide direct interpretability for its prediction results. To address this limitation, the SHAP explainable framework, which is grounded in the Shapley value from game theory, is introduced to quantify the contribution of each feature. Beyond quantifying the magnitude of driving factor contributions, the SHAP framework can further identify the direction of factor impacts and their interactive effects, thus achieving a balanced integration of high predictive accuracy and robust model interpretability for the hybrid model [43]. Its calculation principle is detailed in references [42,43]. Relevant code for this section was run using Python 3.13, and the technical roadmap is presented in Figure 2.
To eliminate the impacts of dimensional differences among variables and multicollinearity on model evaluation results, this study first implemented variable standardization. We then tested for multicollinearity based on the variance inflation factor (VIF) [57] and excluded highly collinear variables with a VIF value greater than 10 (e.g., AMT). Ultimately, ten core variables were retained for XGBoost model construction. Model accuracy was ensured by integrating basic regression metrics, standard 5-fold cross-validation, and spatial 5-fold cross-validation, thereby enhancing the model’s generalization capability and robustness [58].
For fitting the SHAP marginal effect relationships, we considered that polynomial regression or generalized additive models (GAMs) might be susceptible to the spatial heterogeneity of the kNDVI, entailing uncertain risks of subjectivity and overfitting in parameter setting and curve fitting [59]. In contrast, the locally weighted scatterplot smoothing (LOWESS) method offers the advantages of being model agnostic, robust to outliers, and highly interpretable. Therefore, LOWESS was adopted to fit the trend of marginal effect relationships so as to guarantee the rationality and interpretability of the fitting curves.
3. Results
3.1. Spatiotemporal Evolution Characteristics of Vegetation Cover in Qinghai Province
3.1.1. Temporal Variation and Spatial Distribution Characteristics of Vegetation Cover
The spatial distribution and interannual variation trend of the average annual kNDVI in Qinghai Province from 2001 to 2023 are illustrated in Figure 3. Overall, the annual mean kNDVI of the study area increased from 0.2154 to 0.2494 over the 23-year period, with an annual growth rate of 0.0016 year−1, and the multi-year annual mean kNDVI stood at 0.2301 (Figure 3a). Vegetation growth in the study area exhibited a distinct fluctuating pattern, with the lowest value recorded in 2008 and the highest value in 2018. From the perspective of different administrative divisions, Huangnan Prefecture had the highest annual mean kNDVI of 0.4136, while Haixi Prefecture had the lowest of only 0.1161. In terms of the annual mean kNDVI change rate, the administrative units were ranked in the following descending order: Hainan Prefecture (0.002 year−1) > Yushu Prefecture (0.001 year−1) > Haidong City (0.0019 year−1) > Haixi Prefecture (0.0018 year−1) > Golog Prefecture (0.0013 year−1) > Haibei Prefecture (0.0012 year−1) > Huangnan Prefecture (0.0011 year−1) > Xining City (0.0007 year−1).
Figure 3.
Spatiotemporal variation and spatial distribution of the average kNDVI in Qinghai Province (2001–2023); (a) variation trends of the kNDVI in different administrative regions; (b) spatial distribution of the average kNDVI from 2001 to 2023. In the legend, darker colors indicate higher vegetation cover.
The kNDVI was categorized into five classes using the natural breaks method (Figure 3b). low–vegetation-cover areas (kNDVI ≤ 0.05) accounted for 41.20% of the total area, primarily distributed in the northwestern and western parts of Qinghai Province, with the Qaidam Basin as the core concentration zone. Relatively low–vegetation-cover areas (0.05 < kNDVI ≤ 0.15) made up 17.23% of the area, mainly located in most parts of Tanggula Town, the northwestern part of Yushu Prefecture, the northwestern corner of Golog Prefecture, and the central part of Hainan Prefecture. Moderate-vegetation-cover areas (0.15 < kNDVI ≤ 0.27) occupied approximately 12.59% of the total area, concentrated mainly around the periphery of low–vegetation-cover areas, particularly in the eastern part of Haixi Prefecture, the mid-western parts of Yushu Prefecture and Golog Prefecture, the outer areas of the Gonghe Basin, and the Hehuang Valley. Relatively high-vegetation-cover areas were defined as 0.27 < kNDVI ≤ 0.38 and high-vegetation-cover areas as kNDVI > 0.38. These two classes accounted for 13.48% and 15.50% of the total area, respectively, and were predominantly distributed in the southwestern and eastern regions of Qinghai Province.
3.1.2. Vegetation Cover Characteristics Across Different Land Use Types
As mentioned in the introduction, vegetation cover can directly reflect the rationality of regional land use and the effectiveness of ecological projects [6,7,9,17]. Combined with the key implementation nodes of ecological projects in Qinghai Province (https://sthjt.qinghai.gov.cn/), in this study, the years 2001, 2005, 2015, and 2023 were selected. Annual land use types were spatially overlaid with the annual mean kNDVI values using ArcGIS 10.7, and the annual mean kNDVI values under different land use structures were obtained through statistical analysis (Figure 4).
Figure 4.
Vegetation cover characteristics under different land use types; (a–f) represent the annual mean kNDVI values of the six land use types in the study area for 2001, 2005, 2015, and 2023, respectively; different colors of the columns correspond to different years, and the height of the columns indicates the magnitude of the annual mean kNDVI values. Figure (g) is a Sankey diagram of land use transitions in Qinghai Province from 2001 to 2023, illustrating the area transfer processes among 6 land use types (cropland, forest, grassland, water, construction, and unused land) across four time nodes (2001, 2005, 2015, and 2023). Rectangular nodes represent land use types in the corresponding year, with node width positively correlated to the area of the type; colored flows correspond to the transfer paths of the initial land use types, with flow width proportional to the transfer area. The color coding is as follows: cropland (light yellow), forest (dark green), grassland (light green), water body (blue-red), construction land (pink), and unused land (light gray).
By comparing Figure 4a–d, the following findings were obtained: From 2001 to 2023, forest maintained the highest average vegetation cover (above 0.42) with an increasing trend, followed by cropland and grassland, whose average vegetation cover reached 0.3402 and 0.2355 respectively, remaining at relatively high levels. Meanwhile, vegetation cover in water also increased, while that in construction decreased slightly by 3.74% (Figure 4d), a change possibly related to the expansion of construction, rapid population growth, and inadequate supporting greening [60]. More importantly, unused land showed a continuous increase in vegetation cover, rising from 0.0379 in 2001 to 0.0629 in 2023 with a significant growth rate of 65.96% (Figure 4f). Analysis of the Sankey diagram of land use transition from 2001 to 2023 (Figure 4g) shows frequent and substantial transitions between grassland and unused land. During 2001–2023, the area converted from grassland to unused land (24,844.31 km2) was noticeably larger than that from unused land to grassland (22,931.00 km2). This pattern may partly contribute to the increase in the kNDVI over unused land and could provide additional evidence that ecological protection and restoration programs in Qinghai Province have played a role in promoting vegetation growth [8,9].
3.1.3. Characteristics of Vegetation Cover Centroid Migration
The spatial distribution and migration distance of the annual average kNDVI gravity center in Qinghai Province are illustrated in Figure 5. From 2001 to 2023, the kNDVI gravity center in Qinghai Province changed relatively frequently (Figure 5a,b). Specifically, during 2001–2005, it migrated westward by 31.71 km; between 2005 and 2010, it moved southeastward by the longest distance (34.93 km); from 2010 to 2015, it shifted southwestward by 13.55 km; and subsequently, the gravity center mainly migrated northeastward, with distances of 9.99 km and 4.05 km, respectively. Overall, the kNDVI gravity center showed a predominant southeastward movement trend from 2001 to 2023, remaining concentrated within Golmud City.
Figure 5.
Migration direction and distance of kNDVI centroid in Qinghai Province from 2001 to 2023; both (a,b) indicate that the main distribution range of the kNDVI centroid is concentrated in Golmud City, Haixi Prefecture; black arrows represent the directions; Among them, the dots in Figure b represent the kNDVI centroid positions. Blue, red, yellow, pink, purple, and green denote the kNDVI centroids in 2001, 2005, 2010, 2015, 2020, and 2023, respectively. (c) Migration direction of kNDVI centroid in different years: dots of different colors denote the spatial distribution positions of the centroid in different years, black lines represent the migration direction of the centroid, and framed numbers indicate the migration distance of the centroid in different periods.
3.1.4. Spatial Variation Characteristics of kNDVI in Qinghai Province
The spatial variation trend of the kNDVI in Qinghai Province is illustrated in Figure 6a. To further clarify this spatial trend, the kNDVI slope (SkNDVI) was spatially overlaid with the results of the MK significance test. The specific classification and statistical results of area proportions are presented in Table 3.
Figure 6.
Spatial variation of kNDVI in Qinghai Province. (a) Sen’s slope of kNDVI in Qinghai Province over 23 years. The slope values were calculated based on the annual kNDVI time series using the least squares linear regression method, with a unit of kNDVI year−1. The color gradient in the legend, ranging from red to dark green, indicates a shift in vegetation cover trend from decreasing to increasing. (b) Spatial distribution of different grades of kNDVI in Qinghai Province. This map shows the spatial distribution of the significance of kNDVI slope trends, which was determined based on statistical significance tests (p < 0.05) combined with the direction of slope trends. The results are classified into five categories: significant degradation (red), slight degradation (light pink), basic stability (gray), slight improvement (light green), and significant improvement (dark green).
Table 3.
Classification basis and result statistics of kNDVI spatial variation trends.
Combining Figure 3b and Figure 6b, it is found that 20.28% and 20.21% of Qinghai Province fall into the significant improvement and slight improvement categories, respectively. These areas are mainly distributed in western Yushu Prefecture, the Yellow River source region of Golog Prefecture, the periphery of the Gonghe Basin, the western Qilian Mountains, and the oasis areas of the Qaidam Basin. As key regions for ecological protection and restoration in Qinghai Province, their vegetation cover has been improved to a certain extent, indicating remarkable effectiveness of ecological restoration projects over the 23-year period.
Regions with no significant change account for 52.75%, primarily concentrated in the Qaidam Basin, Gonghe Basin, and high-elevation areas in western Qinghai Province. The kNDVI slopes in these regions are generally stable, with values close to 0. Slightly degraded areas make up 5.13%, while significantly degraded areas account for 1.63%, mainly distributed in the southeastern part of Zhidoi County and southern part of Qumarlêb County in Yushu Prefecture, Gande County and Jigzhi County in Golog Prefecture, Xining City, and other major populated areas.
An analysis by administrative division reveals that Haidong City, Xining City, and Golog Prefecture exhibit notably higher proportions of areas with significant vegetation improvement than other prefectures and cities, accounting for 43.57%, 35.06%, and 29.99%, respectively (Figure 7), indicating relatively favorable improvements in vegetation cover conditions. Huangnan Prefecture is dominated by areas with slight vegetation improvement, with a corresponding area proportion of 33.61%. In addition, Haixi Prefecture has the lowest proportion of slightly improved areas at merely 9.08%.
Figure 7.
Area proportion of kNDVI change trends in various administrative units of Qinghai Province. In the bar chart, different colors represent distinct kNDVI change trend types, with the classification criteria consistent with those specified in Table 4.
Regions with basically unchanged vegetation cover are concentrated primarily in Haixi Prefecture, where this category accounts for an overwhelming 75.19% of the total area, followed by Yushu Prefecture at 42.08%. Xining City and Haidong City have lower proportions of unchanged areas compared to other administrative divisions. The top four administrative divisions with kNDVI degradation are Xining City (17.94%), Yushu Prefecture (11.38%), Golog Prefecture (11.13%), and Haidong City (10.76%).
3.1.5. Future Sustainability Characteristics of kNDVI in Qinghai Province
The spatial distribution of the Hurst exponent for the kNDVI in Qinghai Province is illustrated in Figure 8a. The mean Hurst exponent of the study area is 0.434 (H < 0.5), indicating that the vegetation cover in Qinghai Province will exhibit a certain degree of weak anti-persistence in the future. Among the classified regions, the anti-persistent areas are concentrated in the Qaidam Basin, accounting for 39.70% of the total area, which reflects the high sensitivity of the arid inland regions in the northwest to factors such as climatic conditions and human activities. The moderately persistent areas follow, with an area proportion of 21.84%. The strongly persistent and very strongly persistent areas are mainly distributed in the eastern agricultural regions of Qinghai Province, the western Qilian Mountains, the oasis areas of the Qaidam Basin, the Yellow River source region, and the northwestern part of Yushu Prefecture, showing zonal or patchy distributions. These two categories account for 9.83% and 10.72% of the total area, respectively, and these regions possess a sound ecological background.
Figure 8.
Spatial distribution of the Hurst exponent and future variation trend of the kNDVI in Qinghai Province. (a) Spatial pattern of the Hurst exponent, based on the mean Hurst exponent; vegetation persistence was classified into six categories: anti-persistence (gray), weak persistence (orange), relatively weak persistence (yellow), moderate persistence (green), relatively strong persistence (teal), and strong persistence (dark blue); (b) Future trend characteristics of the kNDVI. This map overlays the results of Hurst exponent and kNDVI slope analysis, dividing the outcomes into six categories: sustained significant degradation (red), sustained slight degradation (light pink), sustained stability (yellow), sustained slight improvement (green), sustained significant improvement (dark blue), and uncertain future trend (gray).
To further analyze the future spatial variation trends of the kNDVI in Qinghai Province, the spatial variation trends of the kNDVI were spatially overlaid with the Hurst exponent values. The classification criteria and statistical results are presented in Table 4. From a spatial perspective (Figure 8b), the sustainable improvement areas account for 39.91% of the total area, which are mainly concentrated in regions with a sound ecological background, including the northeastern and southwestern parts of Haixi Prefecture, the south-central part of Hainan Prefecture, the western and northwestern parts of Golog Prefecture, and the northwestern part of Yushu Prefecture. The continuous degradation areas make up 6.60% of the total area; parts of these areas are clustered in major human-populated regions such as Xining City and Haidong City, while the remaining parts are scattered to varying degrees across the mid-eastern part of Gangcha County in Haibei Prefecture, the border area between Hainan Prefecture and Huangnan Prefecture, most areas of Gande County and Jigzhi County in Golog Prefecture, and the eastern part of Zhidoi County and southern part of Qumarlêb County in Yushu Prefecture.
Table 4.
Classification basis and statistical results of kNDVI future trends.
In comparison, areas with unclear future variation trends account for as much as 39.70% of the total area. According to their spatial distribution, these areas are mainly located in the desert steppe zone around the Gonghe Basin, the desert oasis zone dominated by the Qaidam Basin, and the alpine steppe zone in the northwestern part of Golog Prefecture. Therefore, this study concludes that the uncertainties mainly stem from two aspects. First, the spatial heterogeneity of hydrothermal conditions caused by geographical differences leads to poor inherent vegetation cover conditions; meanwhile, the superposition of multiple factors such as varying intensities of grazing and human activities in some regions introduces additional uncertainties. Second, discrepancies in the accuracy of multi-source remote sensing data used in this study may induce uncertainties in regional area identification, which requires further verification.
3.2. Analysis of Influencing Factors on kNDVI
3.2.1. Accuracy Verification of the XGBoost Model
This study employed the XGBoost model to quantify the relative contribution of different factors to the kNDVI. Prior to model training, the VIF was used to test for multicollinearity among the factors, and optimal hyperparameters were incorporated to enhance the generalization performance of the model. The results of the VIF test are presented in Table 5. Factors with strong multicollinearity (VIF > 10) were excluded, and 10 core factors were ultimately retained, which could effectively reduce the bias of the model caused by multicollinearity issues.
Table 5.
VIF values of different influencing factors on kNDVI.
A total of 27,848 valid sample points were extracted at a grid scale of 5 km × 5 km and partitioned into a training set and a validation set at a ratio of 7:3. The hyperparameters of the XGBoost model were optimized via grid search, with the optimal parameter configuration set as follows: number of iterations = 300, max_depth = 7, learning_rate = 0.1, colsample_bytree = 0.9, and subsample = 0.9. This configuration was designed to ensure high model accuracy while mitigating the risk of overfitting. For the training set, the model achieved a coefficient of determination (R2) of 0.9750, a mean absolute error (MAE) of 0.0167, a mean squared error (MSE) of 0.0006, and a root mean squared error (RMSE) of 0.0251; for the validation set, the corresponding metrics were R2 = 0.9010, MAE = 0.0326, MSE = 0.0025, and RMSE = 0.0504. To comprehensively evaluate the fitting performance and spatial generalization capability of the XGBoost model, a dual accuracy validation approach combining standard 5-fold cross-validation and spatial 5-fold cross-validation was adopted. These two methods complemented each other and collectively verified the excellent generalization and robustness of the model [58]. The standard 5-fold cross-validation yielded the following metrics for the model: R2 = 0.9042, MAE = 0.0319, MSE = 0.0024, and RMSE = 0.0493. Spatial 5-fold cross-validation involved balanced grouping of sample points based on their longitude and latitude coordinates, which eliminated the uncertainties arising from potential spatial overlap between training and validation samples [58]. The results of geographically stratified cross-validation were R2 = 0.6933 (±0.1442), MAE = 0.0475 (±0.0100), MSE = 0.0048 (±0.0017), and RMSE = 0.0682 (±0.0135).
Cross-validation with the two aforementioned methods demonstrated that the model with the optimized parameter configuration possessed high accuracy and reliability, and the selected driving factors exhibited considerable representativeness in explaining the spatial heterogeneity of the kNDVI. Nevertheless, attention should be paid to the uncertainties in model accuracy induced by hyperparameter settings. Although the superior generalization performance and robustness of the model were confirmed by standard and spatial 5-fold cross-validation, such parameterization may introduce biases to the quantification of feature importance and contribution via the SHAP framework, which constitutes a notable caveat of this study.
3.2.2. Importance of Influencing Factors Based on SHAP Values
The SHAP values were used to quantify the importance of different factors in driving kNDVI variations, as illustrated in Figure 9a. The results show that AMP and DEM ranked the top two in terms of contribution to the kNDVI, accounting for 47.26% and 20.40% of the total contribution, respectively. They were followed by grazing intensity and distance to construction land, with contribution rates of 9.95% and 5.47%, respectively. In addition, the contribution of soil organic carbon content to the kNDVI reached 4.98%. By contrast, the impact of pH on vegetation cover in Qinghai Province was significantly weaker than that of other factors, accounting for only 0.99% of the total contribution.
Figure 9.
SHAP feature importance plot and SHAP beeswarm plot. In panel (a), the horizontal green bars represent the magnitude of SHAP importance values, where longer bars correspond to higher importance values; in panel (b), the plot shows the distribution of SHAP values for each feature (DEM–pH): the horizontal axis represents SHAP values (indicating the direction and intensity of a feature’s impact on the model output; the farther the value deviates from 0, the stronger the impact). The vertical axis represents features. The color gradient (red → high; blue → low) corresponds to the actual value of each feature itself.
Figure 9b also reveals that AMP has an upper position and a wider distribution range, indicating that it exerts the most significant influence on kNDVI fluctuations and acts as the core factor. Higher AMP values are more conducive to increasing the kNDVI. DEM also has a relatively notable impact, while pH has the weakest effect on the kNDVI. Overall, natural factors have a significantly stronger impact on the kNDVI than anthropogenic factors.
3.2.3. Dependence Characteristics Between kNDVI and Influencing Factors
To further analyze the spatial dependence characteristics between influencing factors and the kNDVI, the SHAP marginal effects of major characteristic factors were selected for characterization (Figure 10).
Figure 10.
SHAP marginal effect plots of single factors. Panels (a–f) represent the marginal effect plots for AMP (X3), DEM (X1), grazing intensity (X4), distance to construction land (X6), soil organic carbon content (X9), and slope (X2), respectively. Taking DEM as an example, the SHAP dependence plot illustrates the marginal impact of feature DEM on model predictions. Each dot represents a sample, colored according to its corresponding SHAP value (red indicates a positive impact, blue indicates a negative impact). The black curve is the LOWESS fit of the SHAP values, with the gray shaded area representing the 95% confidence interval (CI). The red dashed line denotes the SHAP = 0 boundary, where the feature has no impact on predictions. The vertical orange dashed line (Threshold 1) indicates the critical value of DEM (4463.9, 95%CI: 4446.0–4481.1), at which the direction of the feature’s impact transitions from positive to negative. The lower panel shows the density distribution of feature DEM across the dataset, highlighting the concentration of samples in different value ranges. The threshold inflection points are determined primarily based on the positive–negative transitions of the factor marginal effect curves, and the 95% confidence intervals of the thresholds are obtained through 500 iterations of non-parametric Bootstrap sampling.
Figure 10a shows a significant strong correlation between AMP and the kNDVI. With increasing precipitation, the SHAP value rises markedly, with a critical inflection point of 363.2 mm (95%CI: 361.2–365.2 mm) where the marginal effect shifts from negative to positive. When AMP < 361.2 mm, the SHAP value is negative; when AMP > 365.2 mm, the SHAP value increases rapidly and continuously, indicating a significant positive promotion effect on the kNDVI. Figure 10b reveals an inverted U-shaped relationship between DEM and the kNDVI, i.e., promotion followed by inhibition. DEM has a threshold inflection point of 4463.9 m (95%CI: 4446.0–4481.1 m). When DEM < 4446.0 m, the curve stabilizes first, then rises and finally declines, reflecting a positive effect of DEM on the kNDVI. When the elevation exceeds 4481.1 m, the SHAP value drops sharply below zero, showing a strong inhibitory effect of DEM on the kNDVI. Moreover, the higher the elevation, the stronger the inhibition, which may be directly related to the modulation of hydrothermal distribution and population density by elevation. Grazing intensity exhibits a persistent inhibitory relationship with kNDVI overall, with a distinct characteristic value of 1.8 SU·ha−1 (95%CI: 1.8–1.9 SU·ha−1). When grazing intensity < 1.8 SU·ha−1, the SHAP value is positive with minor fluctuations, indicating certain recoverability of vegetation growth. When grazing intensity increases continuously and grazing intensity > 1.9 SU·ha−1, the SHAP value turns negative, signifying severe inhibition of vegetation by high grazing intensity (Figure 10c). The impact of distance to construction land on the kNDVI is characterized by a gradually increasing negative effect with distance: the farther away from construction land, the more pronounced the inhibitory effect on vegetation (Figure 10d). Slope exerts a nonlinear effect on the kNDVI (promotion followed by inhibition), with two distinct characteristic inflection points: 2.8° (95%CI: 2.7–3.0°) and 19.0° (95%CI: 18.8–19.3°). When slope < 2.7°, it shows a weak promotion effect; when 3.0° < slope < 18.8°, it facilitates a kNDVI increase; when slope > 19.3°, it exerts a strong inhibitory effect on the kNDVI, significantly impacting vegetation growth (Figure 10e). Soil organic carbon content generally demonstrates a nonlinear positive promotion effect on SHAP values. When soil organic carbon content is excessively low, soil fertility is insufficient, which is unfavorable for vegetation growth (Figure 10f). It should be clarified that the threshold inflection points identified in this study are only applicable within the scope of the employed dataset. The threshold values are susceptible to the combined effects of multiple factors, including the number of sampling points, model parameter settings, and the accuracy of source data.
3.2.4. Analysis of the Impact of Interactive Effects on kNDVI
The effects of factor interactions on the kNDVI were illustrated using SHAP interaction plots (Figure 11). Figure 11a–c present the interaction results between AMP and DEM, grazing intensity, and distance to construction land, respectively. When both AMP and DEM were at high levels, a significant positive promoting effect on the kNDVI was observed. The synergistic effect of high precipitation and high elevation proved more favorable for vegetation growth. This could be attributed to the relatively weak evaporation and reduced water loss in high-elevation regions, which are conducive to vegetation development. In contrast, when AMP was high but DEM was low, the SHAP interaction values turned negative, indicating an inhibitory effect on the kNDVI. This implies that in low-elevation areas with heavy rainfall, intense precipitation may induce surface soil erosion, which degrades soil quality and thereby impairs vegetation growth. A weak and relatively independent interaction was identified between AMP and grazing intensity, primarily characterized by a mild positive synergy when both factors increased. This finding suggests that the positive facilitation of sufficient precipitation on vegetation growth can, to a certain extent, mitigate the inhibitory effect of high-intensity grazing on grasslands. A significant positive synergistic effect was observed between AMP and distance to construction land, where the combined increase in both factors contributed positively to SHAP values. This indicates that the promoting effect of high precipitation on vegetation is more pronounced in areas far from construction land, with high precipitation and low anthropogenic disturbance jointly driving the increase in the kNDVI.
Figure 11.
SHAP interaction plots of feature pairs. (a) SHAP interaction scatter plot of AMP vs. DEM, showing the distribution of their interaction effect on model output; (b) SHAP interaction scatter plot of AMP vs. grazing intensity, reflecting the spatial distribution of their interaction effect; (c) SHAP interaction scatter plot of AMP vs. distance to construction land, presenting the contribution pattern of their interaction to prediction results; (d) SHAP interaction scatter plot of DEM vs. grazing intensity, revealing the strength and direction of their interaction effect; (e) SHAP interaction scatter plot of DEM vs. distance to construction land, demonstrating the non-linear impact of their interaction on model output; (f) SHAP interaction scatter plot of grazing intensity vs. distance to construction land, showing the distribution characteristics of their interaction effect. The color gradient from blue to red indicates an increase in SHAP interaction values, and the horizontal red dashed line represents the baseline where the interaction value is zero. Each point reflects the interaction effect between two feature values, which is used to reveal the joint impact of feature pairs on the kNDVI.
Figure 11d,e illustrate the interaction effects between DEM and grazing intensity and between DEM and distance to construction land, respectively. The overall SHAP interaction values of DEM and grazing intensity are close to 0, indicating that their combined impacts on the kNDVI are relatively independent and limited, which may be attributed to the differences in their mechanisms of action on vegetation. When both DEM and distance to construction land are at high levels, a strong positive promoting effect on the kNDVI is observed. This suggests that high-elevation areas with low-intensity human activities are more conducive to vegetation growth. In contrast, as DEM increases while distance to construction land decreases, the SHAP values shift to negative, indicating that distance to construction land can significantly weaken the positive effect of DEM on the kNDVI. This implies that low-elevation areas adjacent to construction land are subject to high frequency and intensity of human disturbance, thus making vegetation growth conditions vulnerable to external interference. Figure 11f presents the interaction relationship between grazing intensity and distance to construction land, which is relatively independent with no significant interaction effect. A weak negative interactive impact on the kNDVI is only observed when both factors fall within the low-value ranges.
Overall, the interaction combinations of AMP × DEM and DEM × distance to construction land exert a significant positive promoting effect on the kNDVI in the study area, which is conducive to improving vegetation cover. In contrast, the interaction effects of AMP × grazing intensity, DEM × grazing intensity, and grazing intensity × distance to construction land are weak, basically exhibiting the characteristics of independent influence. In addition, there exists a synergistic dependence between AMP and DEM as well as distance to construction land, which is constrained by the value ranges of the two paired factors; the positive effect of AMP can be exerted more effectively within the high-value ranges of DEM and distance to construction land.
4. Discussion
4.1. Analysis of kNDVI’s Anti-Oversaturation Performance in High-Vegetation-Cover Areas
The applicability of the kNDVI in regions with varying vegetation cover has been validated by numerous scholars [61,62]. Wang et al. [54] utilized the kNDVI to analyze the vegetation cover characteristics of the cold-temperate coniferous forest region in the Greater Khingan Mountains, revealing the fluctuating growth patterns in high-cover areas and the directional nature of spatial vegetation changes, thus verifying the effective application of the kNDVI in high-vegetation zones. Li et al. [25] analyzed vegetation change trends in the Three-River Headwaters Region based on the NDVI and kNDVI and found that the assessment results derived from the kNDVI were significantly superior to those from the NDVI: the proportion of improved areas increased by 6.09%, which strongly supported the applicability of this index in alpine ecologically sensitive regions.
By comparing the slope changes and coefficients of variation (Figure 12), we found that the slope of the high-vegetation zones was 0.000262 year−1 (p = 0.0323 < 0.05), indicating a significant yet slow upward trend in vegetation growth from 2001 to 2023. High-vegetation-cover areas (e.g., alpine meadows and coniferous forests) typically exhibit relatively stable vegetation growth, low interannual fluctuations, and strong synergistic resilience within ecosystems [63]. In contrast, the low–vegetation zones showed an extremely significant upward trend with a slope of 0.000158 year−1 (p < 0.001), although the growth magnitude was slightly lower than that of the high-vegetation zones. This discrepancy may be attributed to artificially implemented ecological restoration projects, drought events, or the lagged effects of warming and humidification on vegetation growth (Figure 12a) [64,65], high-lighting the substantial differences in vegetation cover between the two zones.
Figure 12.
Characteristics of slope changes (a) and coefficients of variation (b) in low– and high–vegetation areas. Regions with kNDVI > 0.38 are classified as high–vegetation areas, while those with kNDVI ≤ 0.05 are defined as low–vegetation cover areas. These two categories are a consolidation of the vegetation cover types elaborated in Section 3.1.1. In figure (a), The colored dots in the figure represent the annual mean kNDVI observations for different vegetation areas: red dots correspond to low–vegetation areas (≤0.05), and blue dots correspond to high–vegetation areas (>0.38). The red and blue solid lines are the linear trend lines fitted to the annual mean kNDVI of the two regions, respectively. The slope of annual mean kNDVI for low–vegetation areas is 0.000158 (p < 0.001), and for high–vegetation areas is 0.000262 (p = 0.0323, p < 0.05), indicating a significant increasing trend in vegetation greenness for both regions. In figure (b), Boxplot elements: The black vertical lines represent the range of values (Whisker: Min–Max), the red boxes represent the interquartile range (Box: Q1–Q3), the white diamonds inside the boxes represent the median, the black diamonds represent the mean, and the open circles represent outliers. Colored dots: Red scatter points represent CV% observations in low–vegetation areas, while blue scatter points represent CV% observations in high–vegetation areas, visually showing the distribution density and dispersion of the two datasets. Low–vegetation areas: Q1 = 4.3, Median = 4.6, Q3 = 4.8, with CV values significantly higher overall than those in high–vegetation areas. High–vegetation areas: Q1 = 0.9, Median = 0.9, Q3 = 1.0, with CV values concentrated at a much lower level. Statistical test: The mean difference between the two groups is −3.69%, with p < 0.001 (***), indicating that the CV% in low–vegetation areas is significantly higher than that in high–vegetation areas. p **: This typically indicates p < 0.01, meaning the statistical result is significant at the 1% significance level, i.e., it is highly statistically significant. p ***: This typically indicates p < 0.001, meaning the statistical result is significant at the 0.1% significance level, i.e., it is extremely statistically significant.
As shown in Figure 12b, the CV in the low–vegetation zones (4.61%) was notably higher than that in the high-vegetation zones (0.92%), representing a difference of 3.69%. This result indicates that vegetation growth in high-vegetation-cover areas experienced minimal interannual fluctuations and maintained a relatively stable state, whereas low–vegetation zones were more vulnerable to external disturbances. Collectively, the positive slope in high-vegetation-cover areas confirms vegetation growth from 2001 to 2023, and the kNDVI successfully captured this subtle trend without suffering from saturation-related loss of sensitivity [66]. Furthermore, the kNDVI demonstrated strong discriminative power even in low–vegetation zones, particularly in the Qaidam Basin [67]. A smaller CV value also implies a more stable ecological structure and stronger resistance to disturbances, which aligns with the stable community dynamics and regular growth cycles of high-vegetation-cover areas [68,69]. These findings collectively validate the effectiveness and suitability of the kNDVI for analyzing vegetation cover patterns across Qinghai Province.
4.2. Spatiotemporal Heterogeneity of kNDVI in Qinghai Province
In previous studies on vegetation cover in Qinghai Province, the NDVI has been the primary dataset, with commonly used products including GIMMS NDVI, SPOT NDVI, MODIS NDVI, and Landsat NDVI. Findings on the spatial pattern of vegetation cover in Qinghai derived from these NDVI products are highly consistent with the results of this study [28,36,39,40,70]. Vegetation cover in Qinghai Province exhibited an increasing trend at a rate of 0.0016 year−1 during 2001–2023 (Figure 3a), yet this growth was spatially heterogeneous rather than uniform. Regions with positive growth rates were concentrated in the Yellow River Source Area, southern Gonghe Basin, southwestern Qilian Mountains, and oasis areas of the Qaidam Basin (Figure 5), which may be associated with the regional ecological background, climatic conditions, and the implementation of ecological projects [6,7,8].
The Yellow River Source Area and Qilian Mountains are vital ecological function zones in Northwest China, playing a crucial role in maintaining biodiversity and ecosystem balance [70,71]. The establishment of the Three-River Headwaters National Park and implementation of zonal management measures have effectively reduced disturbances to the core protected areas of the Yellow River Source Area, leading to improved regional ecological conditions [25,71]. The ecological projects integrated with photovoltaic industries centered in the Gonghe Basin have optimized land use structures, improved vegetation distribution patterns, and significantly enhanced species diversity [72]. In contrast, vegetation in the southwestern Qilian Mountains and Qaidam Basin oases relies on alpine snowmelt and artificial irrigation [72]; ongoing climatic warming and wetting have accelerated snowmelt, which is favorable for vegetation survival in these arid regions [73,74]. Additionally, artificial Haloxylon ammodendron forestation and mining area ecological restoration have facilitated vegetation recovery. Zhang et al. [75] demonstrated that H. ammodendron forests play a key role in combating aeolian desertification and restoring degraded arid ecosystems while delivering dual ecological stability and economic benefits in desert oasis ecotones. Combined with the evidence from Figure 4, which shows active vegetation cover restoration in unused land, these results collectively verify the effectiveness of ecological projects implemented in Qinghai Province. Of course, such changes have also been confirmed in previous studies [76]. Grassland and unused land are the dominant land use types in Qinghai Province. Combined with Figure 4g, we found that the mutual transitions between grassland and unused land in different periods exhibited a trend of high proportional area but decreasing total transfer volume. Nevertheless, the area converted from grassland to unused land remained larger than that from unused land to grassland. This transition preserved the vegetation foundation for unused land, and the continuous implementation of ecological projects may have further promoted vegetation restoration, thereby contributing to the significant increase in the kNDVI over unused land [77]. The area with a degraded vegetation cover trend accounts for 6.60%, distributed in important human agglomeration areas in eastern Qinghai Province, as well as Zhiduo County, Qumalai County, Gande County, and Jiuzhi County. On the one hand, this is closely related to human intervention [51]; on the other hand, it may be closely related to the degradation of “black soil beach” grasslands caused by regional grazing, rodent infestations, and other factors [48,52,53].
Future trend analysis of the kNDVI based on the Hurst exponent revealed that 39.70% of Qinghai Province exhibits an uncertain future trend (Table 4, Figure 7). In terms of distribution, these areas are concentrated primarily in the Qaidam Basin, including the east-central part of the Gonghe Basin and the northwestern part of Yushu Prefecture. We consider that this spatial pattern may be related to the particularity of the geographical location, the fragility of the ecological background, and the spatial heterogeneity of driving factors. Wei et al. [49] reported that 70.96% of Inner Mongolia shows uncertain future kNDVI trends, primarily distributed in regions such as Alxa. This proportion is significantly higher than that of other trend types, and the corresponding land use types are consistent with the findings of this study. Specifically, the Qaidam Basin and its surroundings, typical inland arid basins constrained by geography, have a fragile, limited ecological background. Previous studies showed fluctuating vegetation growth [78], with higher cover at lower elevations. Vegetation here relies on alpine snowmelt and artificial irrigation, and climate warming–wetting may destabilize this water supply [73,74,79]. The mid-eastern Gonghe Basin, dominated by desert steppe, is affected by grazing, interannual precipitation variability and human activities, which may enhance vegetation fluctuations and obscure future trends [80]. Northwestern Yushu Prefecture has permafrost; vegetation growth is limited by freeze–thaw cycles, rodent infestations, and spatial precipitation heterogeneity. Freeze–thaw cycles cause disasters [81,82], damaging soil structure and vegetation attachment. Rodents (e.g., pikas) gnaw roots, even forming “bare patches” [83], exacerbating uncertainty.
Areas with improved vegetation cover accounted for 39.91% of the total area and were highly coincident with the ongoing ecological projects, nature reserves, and national parks implemented in Qinghai Province. This reflects the positive impacts of policy interventions on vegetation cover [40,84]. By analyzing the vegetation cover characteristics of the Ebinur Lake Wetland National Nature Reserve before and after its establishment, studies have found that vegetation improvement was most significant after the reserve’s foundation, further confirming the positive environmental effects brought by the implementation of ecological projects [85]. Areas with degraded vegetation cover accounted for 6.60%, distributed in the important human settlements in eastern Qinghai Province as well as Zhidoi County, Qumarlêb County, Gande County, and Jigzhi County. This degradation is closely related to human interference on the one hand [86]; on the other hand, it may be strongly associated with the “black soil beach” grassland degradation caused by regional grazing, rodent infestations, and other factors [87,88]. Furthermore, the study found that the centroid of the kNDVI in Qinghai Province exhibited a northwestward migration trend from 2001 to 2023, indicating that the core zone of vegetation cover change in the province is concentrated in the arid northwest region (Figure 5). This may be directly linked to the recharge of desert oases by meltwater from the northern foot of the Kunlun Mountains [73,74] and, on the other hand, demonstrates the positive contribution of ecological restoration projects implemented in Qinghai Province to enhancing regional vegetation cover. We note that the centroid showed a relatively complex migration trajectory, which is closely associated with the disturbances of external factors such as climatic anomalies and human activities [55]. The centroid migration model adopted in this study reveals the characteristics of regional kNDVI changes, serving as an effective supplement to the spatiotemporal pattern analysis of the kNDVI.
4.3. Nonlinear Responses and Threshold Characteristics of Driving Factors to Vegetation Cover
Studies have shown that over half of the vegetation-covered areas on the Qinghai–Tibet Plateau are jointly driven by hydrothermal factors such as temperature and precipitation [89]. Although temperature, a critical factor, was excluded from detailed analysis in this study due to multicollinearity, its role in vegetation growth cannot be overlooked [7,38,39]. SHAP feature plots revealed that AMP contributed up to 47.26% to kNDVI variability (Figure 9a), exerting a significant promoting effect on regional vegetation cover. This finding is consistent with results reported in previous studies [37,90,91]. However, the positive effect of precipitation on the kNDVI does not follow a simple linear relationship; instead, it exhibits a distinct diminishing marginal effect (Figure 10a). Within the low-precipitation range, increased precipitation substantially boosts vegetation cover. Once precipitation exceeds its threshold inflection point, the positive promotion weakens in the absence of synergistic effects from DEM and distance to construction land (Figure 10a,c) and may even turn into inhibition in low-elevation areas (Figure 10a). This phenomenon can be attributed to excess moisture damaging surface soil texture and nutrients or even triggering soil erosion, which, in turn, hinders vegetation growth when water requirements are already satisfied [92]. Elevation is another key factor influencing regional vegetation growth (Figure 9), also having a prominent threshold inflection point (Figure 10b). Qinghai Province features a topographic gradient of high elevation in the southeast and low elevation in the northwest. Elevation differences drive spatial variations in hydrothermal distribution and soil types [44], indirectly shaping vegetation cover patterns. Within the low-elevation range, the kNDVI first increases and then decreases with rising elevation, indicating an optimal elevation interval for the kNDVI [93], where the hydrothermal combination is most favorable for vegetation growth (Figure 10b). Beyond this threshold inflection point (Figure 11d,e), the positive effect of elevation on the kNDVI is disrupted by other factors (e.g., climate change and human activities), leading to a sharp decline in the kNDVI.
Grazing intensity is a core indicator for grassland management, and high grazing intensity is clearly detrimental to the sustainable utilization of grasslands. An analysis of vegetation cover in the Qilian Mountains showed that grazing intensity exhibits a significant threshold response to ecological risks [94], which aligns with the finding of generally low kNDVI values in high-grazing-intensity areas in this study.
Although slope contributes only 3.48% to kNDVI variability (Figure 9), its impact on the kNDVI cannot be neglected. Figure 10f reveals that slope has a dual-threshold inflection point effect on the kNDVI. At extremely low slopes, the kNDVI increase may be impeded by human activities and waterlogging. Within the optimal slope range, vegetation growth is significantly promoted. However, once the maximum threshold inflection point is exceeded (Figure 10f), the kNDVI declines sharply, possibly due to altered soil structure induced by excessively steep slopes. Li et al. [95] studied the effects of topographic differentiation on vegetation cover in the Qilian Mountains National Park and found that vegetation cover decreases significantly when the slope exceeds 25°. Although the identified maximum threshold inflection point differs from that in this study, the kNDVI variation trend is consistent, reflecting the spatial heterogeneity of topographic factors. In addition, other factors closely related to human activities also exert certain influences on vegetation cover in the study area. For vegetation restoration and management at the regional scale, priority should be given to the spatial heterogeneity of driving factors. Implementing context-specific strategies that comprehensively consider hydrothermal conditions, topographic factors, and human disturbances can significantly improve the efficiency of regional vegetation governance and management [34,40,85].
We found a distinct nonlinear relationship between the driving factors and the kNDVI (Figure 10), a finding that has not been addressed in previous studies of the research area, which have mostly focused on the impacts of meteorological factors on vegetation cover [7,38,89,90]. This study thus represents a continuation and innovation of research on the characteristics of vegetation cover in Qinghai Province. From the perspective of land science, however, further research is warranted to explore how to integrate natural factors, grazing intensity, and other variables with the ecological restoration and management philosophy of zonal protection and to construct a unified management framework for land science [94].
Based on the findings of this study, two key issues require in-depth consideration. First is the trade-off between conservation and development. Once the threshold inflection point is exceeded, it is critical to balance ecological conservation and economic development. This is particularly pertinent for regions with vital ecosystem service functions, such as the Three-River Headwaters Region and the Qilian Mountains, where grazing intensity and grassland ecological balance represent key constraints on both ecological sustainability and economic growth [95]. Second is the optimization of zoned management and governance. Given Qinghai Province’s vast territory and diverse, complex landforms, a one-size-fits-all ecological planning and governance strategy is impractical [96]. Instead, kNDVI values can be used to delineate differentiated land use management units (Figure 4), such as the oasis areas in the Qaidam Basin and the Three-River Headwaters National Park. These units may exhibit distinct responses to thresholds, and such variability can effectively guide zoned land management. Meanwhile, it will also serve to validate the threshold inflection points identified in this study, thereby supporting evidence-based land science management and verifying the local applicability of these thresholds.
4.4. Limitations and Prospects
Based on long-term remote sensing datasets spanning 2001–2023, this study analyzed the spatiotemporal dynamics of the kNDVI in Qinghai Province. Vegetation growth dynamics and their driving factors were further examined using trend tests, centroid migration analysis, the Hurst exponent, and the XGBoost-SHAP model. However, several limitations remain and require refinement in future research:
- (1)
- The systematic understanding of uncertainty analysis needs to be further advanced. Although this study has briefly analyzed the uncertainties arising from the accuracy of remote sensing data products, remote sensing data interpolation and model parameter settings in the Section 4, it has not conducted a sensitivity analysis of core methods such as the XGBoost-SHAP model. In terms of the selection of model driving factors, there remain uncertainties caused by incomplete considerations and the absence of comparative analysis of multiple factor combinations. Primarily, we argue that the uncertainty induced by the parameter settings of the XGBoost-SHAP model should be prioritized, as inappropriate parameterization may lead to biases in the calculation of SHAP feature importance and contribution values. Notably, quantitative fitting trends for the marginal effect relationships of driving factors may also exhibit certain discrepancies. Even though this study adopted complementary standard 5-fold cross-validation and spatial 5-fold cross-validation to verify that the model achieved satisfactory accuracy, a notable discrepancy was observed in the R2 values derived from the two validation methods. This finding indicates a significant level of spatial heterogeneity across the study area, which is consistent with the geographical context of Qinghai Province. Standard 5-fold cross-validation may overestimate the model accuracy due to potential spatial overlap of partial sample points between the training and validation sets, whereas spatial 5-fold cross-validation accounts for the spatial locations of sample points and thus better reflects the actual conditions of the study area. In subsequent research, attention should be paid to the spatial heterogeneity of the study area, and zonal research integrated with climatic, vegetation type, and other characteristic factors should be conducted to further enhance the generalization capability of the model.
- (2)
- Insufficient generalization and validation of identified threshold inflection points: Threshold inflection points in this study were determined based on the sign switching of factor marginal effect curves, with 95% confidence intervals derived from 500 iterations of nonparametric Bootstrap sampling. Despite improved reliability, sensitivity analyses within the ±5% and ±10% ranges were not performed. Moreover, the identified thresholds lacked effective field validation and in situ data support, which limits their generalization and raises the risk of overfitting.
- (3)
- Driving mechanism analysis is insufficiently in-depth and lacks guidance for practical applications. Meanwhile, confined to a 5 km × 5 km grid scale, this study failed to explore kNDVI patterns at the watershed and county scales, necessitating further refinement of the results. In addition, this study only briefly calculated kNDVI values across different land use types but did not quantify the contribution of land use transitions to kNDVI variations.
To address these limitations, targeted and in-depth studies should be conducted in the future. We should also attach importance to the quantitative analysis of non-climatic factors, such as the impacts of policy dividends and land use transitions on vegetation cover [97,98], so as to provide robust scientific support for zonal vegetation restoration, management, and sustainable development.
5. Conclusions
Based on the kNDVI dataset constructed using the GEE platform, this study conducted a long-term analysis and assessment of vegetation cover characteristics in Qinghai Province from 2001 to 2023. The spatiotemporal patterns and future evolution trends of the kNDVI were analyzed via methods including the Theil–Sen–MK trend test, Hurst exponent, and centroid migration model. Combined with multi-source remote sensing products and the XGBoost-SHAP model, the key driving factors affecting vegetation cover were quantified and the main threshold inflection points were identified. The main conclusions are as follows:
The kNDVI of Qinghai Province exhibited a fluctuating growth trend from 2001 to 2023, with an average annual growth rate of 0.0016 year−1 and a multi-year mean value of 0.2301. It showed a distribution pattern of being higher in the southeast and lower in the northwest, with low-value areas concentrated mainly in the Qaidam Basin of Haixi Prefecture. The annual mean kNDVI values across different land use types followed the order: forest > cropland > grassland > construction > water > unused land. Notably, unused land registered the highest kNDVI growth rate (+65.96%). The core area of the kNDVI was located in Haixi Prefecture, Qinghai Province, shifting generally southeastward by 7.46 km during the study period. From 2001 to 2023, the dominant kNDVI change type in Qinghai Province was stability, accounting for 52.75% of the total area. The area proportion of regions with significant improvement was 18.65% higher than that of regions with significant degradation. The Hurst exponent indicated that the future kNDVI trend would be dominated by sustained improvement (39.91%), while the area with uncertain future trends accounted for 39.70%.
Driving factors and key threshold inflection points were identified using the XGBoost-SHAP model. The model exhibited good accuracy with 5-fold cross-validation. SHAP values revealed that AMP (47.26%) and DEM (20.40%) ranked as the top two contributors to the kNDVI. Marginal effect curves indicated that all major characteristic factors had significant threshold inflection points: AMP = 363.2 mm (95%CI: 361.2–365.2 mm), DEM = 4463.9 m (95%CI: 4446.0–4481.1 m), grazing intensity = 1.8 SU·ha−1 (95%CI: 1.8–1.9 SU·ha−1), and slope = 2.8° (95%CI: 2.7–3.0°)/19.0° (95%CI: 18.8–19.3°). Interactive combinations of AMP × DEM and DEM × distance to construction land exerted a significant positive promoting effect on the kNDVI in the study area.
Although the research framework of this study provides a relatively comprehensive analysis and exploration of the vegetation cover characteristics and driving thresholds in Qinghai Province, limitations in remote sensing data accuracy and analytical methods have introduced uncertainties and constraints to the study. Future research should consider the incorporation of full-factor variables and the integration of high-precision datasets, thereby improving data interpretability and the generalizability of identified thresholds.
Author Contributions
Conceptualization, H.Y. and L.Z.; methodology, H.Y. and Y.L.; software, H.Y. and L.Z.; formal analysis, H.Y. and X.M.; investigation, H.Y., Y.L., X.L., M.Y. and R.Y.; resources, L.Z. and X.M.; data curation, H.Y., Y.L., M.Y. and J.D.; writing—original draft preparation, H.Y.; writing—review and editing, L.Z.; visualization, H.Y., Y.L., X.L. and Z.C.; supervision, L.Z.; project administration, L.Z. All authors have read and agreed to the published version of the manuscript.
Funding
This work was supported by the Natural Science Foundation of Qinghai Province (2022-ZJ-711), the National Natural Science Foundation of China (42171467), and the Geological Survey Project of the Natural Resources Comprehensive Survey Command Center, China Geological Survey (KC20220018).
Institutional Review Board Statement
Not applicable.
Data Availability Statement
Data are contained within the article.
Acknowledgments
We appreciate anonymous reviewers and their valuable comments. Also, we thank the editors for the editing and comments.
Conflicts of Interest
The authors declare no conflicts of interest.
References
- Fang, Y.X.; Meng, F.H.; Luo, M.; Sa, C.L.; Bao, Y.H.; Lei, J. Coupling coordination framework for assessing balanced development between potential ecosystem services and human activities. Earth’s Future 2025, 13, e2025EF006243. [Google Scholar] [CrossRef] [Scilit]
- Zhou, T.C.; Sun, J.; Ye, C.C.; Jing, X.; Liang, E.Y.; Lu, X.Y.; Akira, S.M.; Michael, E.M.; Josep, P. Climate change is predicted to reduce global belowground ecosystem multifunctionality. Nat. Commun. 2025, 16, 9337. [Google Scholar] [CrossRef] [Scilit] [PubMed]
- Van Den Bosch, M.; Costanza, J.K.; Peek, R.A.; Steel, Z.L. Projected increases in climate extremes across global vertebrate diversity hotspots. Glob. Change Biol. 2025, 31, e70272. [Google Scholar] [CrossRef] [Scilit] [PubMed]
- Li, S.; Su, H.Y.; Ma, L.; Zhang, Z.H.; Zhang, Q.; Wu, F.L.; Ade, H.; Hu, X.; Chang, T.; Wang, Z.; et al. Alpine gravelization compromises ecosystem multifunctionality through vegetation loss and soil nutrient depletion. Catena 2025, 261, 109519. [Google Scholar] [CrossRef] [Scilit]
- Chalchissa, F.B.; Kuris, B.K. Modelling soil organic carbon dynamics under extreme climate and land use and land cover changes in western oromia regional state, Ethiopia. J. Environ. Manag. 2023, 350, 119598. [Google Scholar] [CrossRef] [Scilit]
- Ma, S.H.; Wen, Z.Z. Optimization of land use structure to balance economic benefits and ecosystem services under uncertainties: A case study in Wuhan, China. J. Clean. Prod. 2021, 311, 127537. [Google Scholar] [CrossRef] [Scilit]
- Bi, Y.; Liu, T.; Pei, Y.; Wang, X.; Du, X. Landscape analysis and assessment of ecosystem stability based on land use and multitemporal remote sensing: A case study of the Zhungeer Open-Pit Coal Mining Area. Remote Sens. 2025, 17, 1162. [Google Scholar] [CrossRef] [Scilit]
- Hu, Y.; Zhang, S.D.; Shi, Y.; Guo, L. Quantifying the impact of the Grain-for-Green Program on ecosystem service scarcity value in Qinghai, China. Sci. Rep. 2023, 13, 2927. [Google Scholar] [CrossRef] [Scilit]
- Ke, Y.; Zhao, B.T.; Li, Y.H.; Wang, X.F.; Jin, J.X.; Jiang, J.; Dong, W.T.; Wang, R.N.; Yang, H.Q.; Wang, T.L.; et al. Effects of the implementation intensity of ecological engineering on ecosystem service tradeoffs in Qinghai Province, China. Land 2024, 13, 848. [Google Scholar] [CrossRef] [Scilit]
- Feng, Z.Y.; Chen, D.; Su, T.Q.; Xie, L.F.; Wang, Z.C.; Wang, C.; Zhang, J.B.; Bai, X.Y.; Hu, B.Q. Vegetation restoration promotes soil carbon stability by enhancing mineral-associated organic carbon and microbial necromass accumulation in Karst ecosystems. J. Soils Sediments 2025, 25, 3397–3409. [Google Scholar] [CrossRef] [Scilit]
- Zarandian, A.; Ramezani Mehrian, M.; Mohammadyari, F. Impact assessment of vegetation loss on the ecosystem functions in a semiarid watershed in Iran. Acta Geophys. 2022, 70, 677–696. [Google Scholar] [CrossRef] [Scilit]
- Sun, Z.X.; Li, W.Y.; Liu, J.M.; Cao, S.H.; Zhang, W.J.; Wang, H. Evaluation of comprehensive benefit for ecological restoration in Shaanxi Province. Acta Ecol. Sin. 2022, 42, 2718–2729, (In Chinese with English Abstract). [Google Scholar] [CrossRef] [Scilit]
- Zhao, G.H.; Dan, Z.T.Q.; Wei, X.H. A review grassland desertification characteristics of Qinghai-Tibet Plateau. Grassl. Turf 2012, 32, 83–89, (In Chinese with English Abstract). [Google Scholar]
- Baioni, E.; Fiantanese, G.; Porta, G.M. Data-driven assessment of climate change and vegetative cover dynamics in traditional oases. J. Hydrol. Reg. Stud. 2025, 59, 102266. [Google Scholar] [CrossRef] [Scilit]
- Dahan, K.S.; Moluh, N.H.; Eshetu, S.B.; Hounkpati, K.; Ratsimba, H.R.; Sieber, S.; Löhr, K. Assessment of land use and land cover (LULC) and vegetation degradation state from wildfire within the scope of forest landscape restoration (FLR) in Cameroon. Eur. J. Remote Sens. 2025, 58, 2498955. [Google Scholar] [CrossRef] [Scilit]
- Song, Y.; Ma, M.G. Variation of AVHIRR NDVI and its relationship with climate in Chinese arid and cold regions. J. Remote Sens. 2008, 12, 499–505, (In Chinese with English Abstract). [Google Scholar] [CrossRef] [Scilit]
- Lin, J.; Bo, W.H.; Dong, X.P.; Zhang, R.W.; Yan, J.P.; Chen, T. Evolution of vegetation cover and impacts of climate change and human activities in arid regions of Northwest China: A Mu Us Sandy Land case. Environ. Dev. Sustain. 2025, 27, 18977–18996. [Google Scholar] [CrossRef] [Scilit]
- Wang, X.J.; Zhang, B.Q.; He, C.S. Impacts of vegetation restoration in the Agro-pastoral Ecotone of Northern China on regional land-atmosphere interactions and hydrological cycle. Adv. Earth Sci. 2025, 40, 737–752, (In Chinese with English Abstract). [Google Scholar]
- Liu, D.Y.; Zhang, X.M.; Yue, Y.M.; Wang, K.L.; Zou, D.S. Vegetation cover change and its influencing factors in karst regions ofGuangxi based on Geodetector. Res. Agric. Modern 2019, 40, 1038–1047, (In Chinese with English Abstract). [Google Scholar]
- Chai, L.F.; Tian, L.; Ao, Y.; Wang, X.Q. Influence of human disturbance on the change of vegetation cover in the Tibetan Plateau. Res. Soil Water Conserv. 2021, 28, 382–388, (In Chinese with English Abstract). [Google Scholar]
- Tang, Y.J.; Wang, Q.M. Spatial reconstruction-aided spatio-temporal fusion of NDVI images. Natl. Remote Sens. Bull. 2025, 29, 2602–2615, (In Chinese with English Abstract). [Google Scholar]
- Lee, S.; Kim, S.; Yoon, H. Analysis of differences in vegetation phenology cycle of abandoned farmland, using harmonic analysis of time-series vegetation indices data: The case of Gwangyang City, South Korea. GISci. Remote Sens. 2020, 57, 338–351. [Google Scholar] [CrossRef] [Scilit]
- Balbinot, L.; Pereira, L.C.; Matus, G.N.; Da Cunha e Silva, D.C.; Nnadi, E.O.; Tonello, K.C. Linking vegetation indices and land tenure to assess passive restoration dynamics in the Brazilian Cerrado. Land Use Policy 2025, 158, 107760. [Google Scholar] [CrossRef] [Scilit]
- Wang, Q.; Moreno-Martínez, Á.; Muñoz-Marí, J.; Campos-Taberner, M.; Camps-Valls, G. Estimation of vegetation traits with kernel NDVI. ISPRS J. Photogramm. Remote Sens. 2023, 195, 408–417. [Google Scholar] [CrossRef] [Scilit]
- Li, K.N.; Lin, Y.Y.; Zhao, J.S.; Wang, J.; Ge, F. Driving Mechanisms of Vegetation Change and Ecological Vulnerability in the Three-River Headwater Region. Arid Land Geogr. 2025, 48, 283–295, (In Chinese with English Abstract). [Google Scholar]
- Lan, C.Y.; Guo, L.B.; Tan, W.X.; Huang, P.P.; Li, S.H.; Ma, M.Z. Grassland canopy height retrieval using remote sensing vegetation indices (NDHD, NDVI, and EVI) in Xilin Gol. Chin. J. Grassl. 2025, 47, 31–44, (In Chinese with English Abstract). [Google Scholar]
- Li, J.; Xu, H.Q.; Li, X.; Guo, Y.B. Vegetation information extraction of Pinus massoniana forest in soil erosion areas using soil-adjusted vegetation index. J. Geo-Inf. Sci. 2015, 17, 1128–1134, (In Chinese with English Abstract). [Google Scholar]
- Hu, R.J.; Chen, X.L.; Chen, J.; Zhang, S.R.; Kuang, Y.L.; Yu, H.Y.; Ji, H.Z.; Zhao, X.J.; Yi, S.H.; Meng, B.P.; et al. MODIS NDVI saturation assessment of alpinemeadow grassland biomass estimation using remote sensing: A case study in the eastern edge of the Qinghai-Tibet Plateau. Acta Ecol. Sin. 2024, 44, 6357–6372, (In Chinese with English Abstract). [Google Scholar]
- Camps-Valls, G.; Campos-Taberner, M.; Moreno-Martínez, Á.; Walther, S.; Duveiller, G.; Cescatti, A.; Mahecha, M.D.; Muñoz-Marí, J.; García-Haro, F.J.; Guanter, L.; et al. A unified vegetation index for quantifying the terrestrial biosphere. Sci. Adv. 2021, 7, eabc7447. [Google Scholar] [CrossRef] [Scilit]
- Tiwari, A.; Kira, O.; Bamah, J.; Boneh, H.; Karnieli, A. Multi-Sensor classification framework of urban vegetation for improvingecological services management. Remote Sens. 2024, 16, 1110. [Google Scholar] [CrossRef] [Scilit]
- Ren, X.Q.; Hou, P.; Ma, Y.T.; Wang, J.H.; Xie, L. Analysis of vegetation changes and driving factors on the Qinghai-Tibet Plateau from 2000 to 2022. Forests 2024, 15, 2188. [Google Scholar] [CrossRef] [Scilit]
- Ma, Y.T.; Gong, J.; Jin, T.T.; Xu, T.Y.; Kan, G.B. Comparison of different vegetation indices for estimating vegetation changes and analyzing driving factors in a semi-arid area, China. J. Arid Land 2025, 17, 1785–1805. [Google Scholar] [CrossRef] [Scilit]
- Zhong, C.H.; Chen, J.H.; Yang, H.; Jin, T.Y.; Zhang, Z.J.; Hu, Z.M.; Wu, K. Assessment of conservation effectiveness in nature reserves of four provinces in western China based on kernel normalized difference vegetation index data. Acta Ecol. Sin. 2025, 45, 1199–1209, (In Chinese with English Abstract). [Google Scholar]
- Wu, T.J.; Liu, Y.X.; Wang, Z.Z.; Yao, Y.; Wang, C.X.; Fu, F.Y.; Wang, C.G.; Liu, T. Trends and influencing factors of ecosystem resilience in major ecological project areas in China. Acta Ecol. Sin. 2025, 45, 9000–9010, (In Chinese with English Abstract). [Google Scholar]
- He, S.X.; Yang, J.H.; Zhang, G.Y.; Zhu, D.M.; Wang, C.; Hu, G.B. Analysis of vegetation changes and influencing factorson mine-damaged land in a typical county in central Yunnan based on XGBoost-SHAP model. Bull. Surv. Mapp. 2025, 58–65, (In Chinese with English Abstract). [Google Scholar] [CrossRef]
- Dai, Z.J.; Zhao, X.; Li, G.W.; Wang, X.C.; Pang, L.H. Spatialtemporal variations in NDVI in vegetation-growing season in Qinghai based on GIMMS NDVI 3g. vl in past 34 years. Pratacultural. Sci. 2018, 35, 713–725, (In Chinese with English Abstract). [Google Scholar]
- Shi, Y.; Liu, S.L.; Kang, W.P.; Zhi, Y.; Lu, R.J.; Zhang, S.H. Vegetation restoration potential and its changes in Qinghai, China in 2001–2022. J. Desert Res. 2025, 45, 34–44, (In Chinese with English Abstract). [Google Scholar]
- Wu, K.; Hu, Z.M.; Wang, X.H.; Chen, J.H.; Yang, H.; Yuan, W.P. Widespread increase in sensitivity of vegetation growth to climate variability on the Tibetan Plateau. Agric. For. Meteorol. 2024, 358, 110260. [Google Scholar] [CrossRef] [Scilit]
- Zhao, J.Y.; Ding, Y.Y.; Du, M.; Yang, J.; Song, Q. Analysis of spatial-temporal variations of alpine vegetation cover based on multi-source remote sensing data. Yellow River 2022, 44, 86–92, (In Chinese with English Abstract). [Google Scholar]
- Chen, L.; Yin, S.Q.; Ju, L.X.; Liu, J.S.; Jiao, S.; Zhang, Y.X. Remote sensing monitoring of vegetation restoration effect based on NDVI time series data in Muli Coalfield of Qinghai Province. Coal Sci. Technol. 2025, 53, 269–281, (In Chinese with English Abstract). [Google Scholar]
- Bai, Y.X.; Peng, Y.F.; Zhang, D.Y.; Yang, G.B.; Chen, L.Y.; Kang, L.Y.; Zhou, W.; Wei, B.; Xie, Y.H.; Yang, Y.H. Heating up the roof of the world: Tracing the impacts of in-situ warming on carbon cycle in alpine grasslands on the Tibetan Plateau. Natl. Sci. Rev. 2025, 12, nwae371. [Google Scholar] [CrossRef] [Scilit] [PubMed]
- Zhou, B.; Chen, G.P.; Yu, H.R.; Zhao, J.S.; Yin, Y. Revealing the nonlinear impact of human activities and climate change on ecosystem services in the Karst Region of southeastern Yunnan using the XGBoost-SHAP model. Forests 2024, 15, e1420. [Google Scholar] [CrossRef] [Scilit]
- Nguyen, H.H.D.; Nguyen, T.N.; Phan, T.A.T.; Huynh, N.T.; Huynh, Q.D.; Trieu, T.T. Explainable artificial intelligence model for evaluating shear strength parameters of municipal solid waste across diverse compositional profiles. Theor. Appl. Mech. Lett. 2025, 15, e100578. [Google Scholar] [CrossRef] [Scilit]
- Ye, X.J.; Wang, Y.H.; Pan, H.Z.; Bai, Y.; Dong, D.F.; Yao, H.M. Spatial-temporal variation and driving factors of vegetation productivity in Qinghai Provincenet ecosystem. Arid Zone Res. 2022, 39, 1673–1683, (In Chinese with English Abstract). [Google Scholar]
- GS (2022) 1873; Standard map of the People’s Republic of China (2022 Edition). Ministry of Natural Resources: Beijing, China, 2022.
- Zhang, B.; Zhou, W.; Zhang, F.C. Remote sensing monitoring and driving force analysis of land degradation in Qinghai Province from 1999 to 2018. Bull. Soil Water Conserv. 2020, 40, 120–128+325, (In Chinese with English Abstract). [Google Scholar]
- Nagol, R.J.; Vermote, F.E.; Prince, D.S. Effects of atmospheric variation on AVHRR NDVI data. Remote Sens. Environ. 2008, 113, 392–397. [Google Scholar] [CrossRef] [Scilit]
- Yang, J.; Huang, X. The 30 m annual land cover dataset and its dynamics in China from 1990 to 2024. Earth Syst. Sci. Data 2025, 13, 3907–3925. [Google Scholar] [CrossRef] [Scilit]
- Wei, G.P.; Zhang, W.J.; Zhu, Z.H.; Gao, Y.X.; Yu, X.Y. Spatio-temporal variation and climate driving factors of vegetation coverage in Nei Mongol from 2004 to 2023 based on kNDVI. Sci. Silvae Sin. 2025, 61, 80–91, (In Chinese with English Abstract). [Google Scholar]
- Alharbi, S.; Raun, W.R.; Arnall, D.B.; Zhang, H. Prediction of maize (Zea mays L.) population using normalized-difference vegetative Index (NDVI) and coefficient of variation (CV). J. Plant Nutr. 2019, 42, 673–679. [Google Scholar] [CrossRef] [Scilit]
- Zhang, H.T.; Wang, S.D.; Ding, J.J. Driving mechanism nonlinear threshold identification of vegetation in China: Based on causal and inference and machine learning. J. Arid Land 2025, 17, 1341–1360. [Google Scholar] [CrossRef] [Scilit]
- Adeel, A.; Zhang, J.H.; Barjeece, B.; Kashif, M.; Faisal, M. Exploring vegetation trends and restoration possibilities in Pakistan by using hurst exponent. Env. Sci. Pollut. Res. 2023, 30, 91915–91928. [Google Scholar]
- Ma, N.; Bai, T.; Cai, Z.Z. Vegetation cover change and its response to climate and surface factors in Xinjiang based on different vegetation types. Res. Soil Water Conserv. 2024, 31, 385–394, (In Chinese with English Abstract). [Google Scholar]
- Wang, Z.H.; Wang, B.; Zhang, Q.L.; Sa, R.L. Spatial and temporal characteristics and driving force analysis of vegetation cover change in Greater Khingan Mountains ecological functional area based on kNDVI. Environ. Sci. 2025, 46, 3021–3032, (In Chinese with English Abstract). [Google Scholar]
- Li, X.W.; Zulkar, H.; Wang, D.Y.; Zhao, T.N.; Xu, W.T. Changes in vegetation coverage and migration characteristics of center of gravity in the arid desert region of Northwest China in 30 recent years. Land 2022, 11, 1688. [Google Scholar] [CrossRef] [Scilit]
- Bentéjac, C.; Csörgő, A.; Martínez-Muñoz, G. A comparative analysis of gradient boosting algorithms. Artif. Intell. Rev. 2021, 54, 1937–1967. [Google Scholar] [CrossRef] [Scilit]
- Li, K.; Li, X.P.; Hu, W.; Xu, J. Spatiotemporal patterns and driving forces of ecological quality in the Yangtze River economic belt using GWRR. Sustainability 2026, 18, 256. [Google Scholar] [CrossRef] [Scilit]
- Abriha, D.; Srivastava, P.K.; Szabó, S. Smaller is better? Unduly nice accuracy assessments in roof detection using remote sensing data with machine learning and k-fold cross-validation. Heliyon 2023, 9, e14045. [Google Scholar] [CrossRef] [Scilit]
- Bera, D.; Das Chatterjee, N.; Bera, S. Comparative performance of linear regression, polynomial regression and generalized additive model for canopy cover estimation in the dry deciduous forest of West Bengal. Remote Sens. Appl. Soc. Environ. 2021, 22, 100502. [Google Scholar] [CrossRef] [Scilit]
- Gao, Y.; Xie, M.M.; Fu, M.C.; Cao, Y.K. Pattern dynamics of vegetation coverage of Plateau Valley-City in the Western China: A case study in Xining. Acta Ecol. Sin. 2014, 34, 1094–1104, (In Chinese with English Abstract). [Google Scholar] [CrossRef] [Scilit]
- Wang, C.X.; Liu, L.; Zhou, Y.K.; Liu, X.J.; Wu, J.P.; Tan, W.; Xu, C.; Xiong, X.Q. Comparison between satellite derived solar-induced chlorophyll fluorescence, NDVI and kNDVI in detecting water stress for dense vegetation across Southern China. Remote Sens. 2024, 16, 1735. [Google Scholar] [CrossRef] [Scilit]
- Chen, Z.C.; Cheng, Y.Q.; Zhang, X.F.; Zhu, Z.Y.; Wang, S.D.; Zhang, H.B.; Zou, Y.F.; Hao, C.Y. Spatiotemporal changes of vegetation growth and its influencing factors in the Huojitu mining area from 1999 to 2023 based on kNDVI. Remote Sens. 2025, 17, 536. [Google Scholar] [CrossRef] [Scilit]
- Wei, C.W.; Su, K.; Jiang, X.B.; You, Y.F.; Zhou, X.B.; Yu, Z.; Chen, Z.C.; Liao, Z.H.; Zhang, Y.M.; Wang, L.Y. Increase in precipitation and fractional vegetation cover promote synergy of ecosystem services in China’s arid regions—Northern Sand-Stabilization Belt. Front. Ecol. Evol. 2023, 11, 1116484. [Google Scholar] [CrossRef] [Scilit]
- Li, W.X.; Xu, J.; Yao, Y.Q.; Zhang, Z.C. Temporal and spatial change characteristics of vegetation cover(NDVI) in the Three-River Headwater region on Tibetan Plateau under global warming. Mt. Res. 2021, 39, 473–482, (In Chinese with English Abstract). [Google Scholar]
- Liu, X.F.; Zhang, J.Y.; Zhu, X.F.; Pan, Y.Z.; Liu, Y.X.; Zhang, D.H.; Lin, Z.H. Spatiotemporal changes in vegetation coverage and its driving factors in the Three-River Headwaters region During 2000–2011. J. Geogr. Sci. 2014, 24, 288–302. [Google Scholar] [CrossRef] [Scilit]
- Liu, Y.; Tan, M.L.; Yaseen, Z.M.; Zhang, F. Spatiotemporal analysis of long-term vegetation dynamics using kNDVI and machine learning-based multifactor analysis. Ecol. Inform. 2026, 93, 103559. [Google Scholar] [CrossRef] [Scilit]
- Dong, F.F.; Qin, F.C.; Zhang, T.G.; Dong, X.Y.; Wu, Y.H.; Guo, Z.W. kNDVI reveals vegetation dynamics and hydro–edaphic controls in inner Mongolia (2000–2024). Sci. Rep. 2026, 16, 5244. [Google Scholar] [CrossRef] [Scilit]
- Geng, S.B.; Shi, P.L.; Song, M.H.; Zong, N.; Zu, J.X.; Zhu, W.R. Diversity of vegetation composition enhances ecosystem stability along elevational gradients in the Taihang Mountains, China. Ecol. Indic. 2019, 104, 594–603. [Google Scholar] [CrossRef] [Scilit]
- Wang, T.; Xin, L.Y.; Ma, T.S.; Zhu, Z.H.; Du, Y.G. Effect of phylogenetic diversity on the stability of alpine meadows on the Tibetan Plateau. Chin. J. Ecol. 2022, 41, 2368–2373, (In Chinese with English Abstract). [Google Scholar]
- Zheng, D.F.; Wang, Y.H.; Hao, S.; Xu, W.J.; Lv, L.T.; Yu, S. Spatial-temporal variation and tradeoffs/synergies analysis on multiple ecosystem services: A case study in the Three-River Headwaters region of China. Ecol. Indic. 2020, 116, 106494. [Google Scholar] [CrossRef] [Scilit]
- Zhu, L.; Liu, D.H.; Tan, Y.R.; Zhang, Y.D.; Chen, W.Y. Dynamic assessment of ecological and environmental quality in the source regionof the Yellow River (Maqu) in recent 20 years. J. Northwest For. Univ. 2025, 40, 209–217, (In Chinese with English Abstract). [Google Scholar]
- Qu, Z.; Yang, S.C.; Zhao, P.; Han, Q.J.; Niu, Q.H.; Yin, D.Y.; Zhang, J.C. Effects of large—Scale photovoltaic power stations on vegetation and soil inalpine sandy land in the northeastern margin of Qinghai—Tibet Plateau: A case study of Gonghe Basin in Qinghai Province. J. Arid Land Resour. Environ. 2024, 38, 92–106, (In Chinese with English Abstract). [Google Scholar]
- Li, Y.L.; Yang, T.B.; Zeng, B. Land cover change of southern fringe oasis in the Qaidam Basin from 2000 to 2009 based on MODIS data. J. Desert Res. 2011, 31, 34–42, (In Chinese with English Abstract). [Google Scholar]
- Zhu, M.Y.; Ni, F.Q.; Deng, Y.; Ren, H.Z.; Wang, Y.X.; Wu, M.Y.; Yue, Z.Y.; Jiang, N.; Wen, W. Responses of blue and green water to climate warming-wetting andvegetation greening in the Yangtze River source region. J. Water Resour. Water Eng. 2025, 36, 40–48, (In Chinese with English Abstract). [Google Scholar]
- Zhang, Q.; Wang, R. Allometric growth and biomass allocation in Haloxylon ammodendron forests: Implications for desertification control and ecosystem rehabilitation in the Jilantai Salt Lake region. Forests 2025, 16, 392. [Google Scholar] [CrossRef] [Scilit]
- Liu, H.; Na, Y.; Wu, Y.T.; Li, Z.G.; Qu, Z.Q.; Lv, S.J.; Jiang, R.; Sun, N.; Hao, D.K. Spatiotemporal patterns of vegetation coverage and its response to land-use change in the agro-pastoral ecotone of Inner Mongolia, China. Land 2025, 14, 1202. [Google Scholar] [CrossRef] [Scilit]
- Lan, L.H.; Wang, Z.B.; He, F. Land cover change as a critical driver of vegetation restoration in water-scarce Northern China. Remote Sens. 2025, 17, 3010. [Google Scholar] [CrossRef] [Scilit]
- Lou, J.P.; Xu, G.Y.; Wang, Z.J.; Yang, Z.G.; Ni, S.C. Multi-year NDVI values as indicator of the relationship between spatiotemporal vegetation dynamics and environmental factors in the Qaidam Basin, China. Remote Sens. 2021, 13, 1240. [Google Scholar] [CrossRef] [Scilit]
- Li, Z.H.; Wang, H.; Yang, F.W.; Li, D.L.; Shi, Y.L.; Jiang, Y.C. Interdecadal variation of normalized differential vegetation index response to climate warming and humidification in the Qinghai Plateau during the growing season. Chin. J. Atmos. Sci. 2024, 48, 2045–2058, (In Chinese with English Abstract). [Google Scholar]
- Jia, H.; Liu, L.Y.; Liu, J.F. Desertification sensitivity assessment in the Gonghe Basin. J. Desert Res. 2025, 45, 1–9, (In Chinese with English Abstract). [Google Scholar]
- Li, N.C.; Lin, Z.J.; Gu, Q.; Fan, X.W.; Li, W.J.; Wang, X.H.; Wang, Y.H. Dynamic variation characteristics of near-surface freeze-thaw erosion intensity in permafrost regionsof source area of Yangtze River. J. Glaciol. Geocryol. 2025, 47, 1290–1304, (In Chinese with English Abstract). [Google Scholar]
- Cui, J.J.; Xin, Z.B.; Huang, Y.Z. The spatiotemporal variations in freeze-thaw erosion in 2003–2020 on the Qinghai-Tibet Plateau. Acta Ecol. Sin. 2023, 43, 4515–4526, (In Chinese with English Abstract). [Google Scholar]
- Zhang, J.G.; Liu, D.W.; Meng, B.P.; Chen, J.J.; Wang, X.Y.; Jiang, H.; Yu, Y.; Yi, S.H. Using UAVs to assess the relationship between alpine meadow bare patches and disturbance by pikas in the source region of Yellow River on the Qinghai-Tibetan Plateau. Glob. Ecol. Conserv. 2021, 26, e01517. [Google Scholar] [CrossRef] [Scilit]
- He, X.H.; Yu, Y.P.; Cui, Z.P.; He, T. Climate change and ecological projects jointly promote vegetation restoration in Three-River source region of China. Chin. Geogr. Sci. 2021, 31, 1108–1122. [Google Scholar] [CrossRef] [Scilit]
- Tang, Y.Q.; Ma, Y.F.; Tang, M.Y.; Xu, Z.J.; Xiao, Y.X.; Xia, N.; Ma, Y.G. Evaluation of the effectiveness of natural vegetation protection and restoration in Ebinur Lake Wetland National Nature Reserve based on normalized vegetation indices. Arid Land Geogr. 2025, 48, 1828–1840, (In Chinese with English Abstract). [Google Scholar]
- Lv, W.B.; Liu, F.M.; Cai, K.; Cao, Y.; Deng, M.L.; Liang, W.; Yan, J.W.; Wang, G.Y. Distinguishing the impacts and gradient effects of climate change and human activities on vegetation cover in the Weihe River Basin, China. J. Geophys. Res. Biogeosci. 2024, 129, e2024JG008297. [Google Scholar] [CrossRef] [Scilit]
- Dong, Q.M.; Zhao, X.Q.; Wu, G.L.; Shi, J.J.; Ren, G.H. A Review of Formation Mechanism and Restoration Measures of “Black-Soil-Type” Degraded Grassland in the Qinghai-Tibetan Plateau. Environ. Earth Sci. 2013, 70, 2359–2370. [Google Scholar] [CrossRef] [Scilit]
- Dong, L.; Li, J.J.; Sun, J.; Yang, C. Soil Degradation Influences Soil Bacterial and Fungal Community Diversity in Overgrazed Alpine Meadows of the Qinghai-Tibet Plateau. Sci. Rep. 2021, 11, 11538. [Google Scholar] [CrossRef] [Scilit]
- Li, H.Y.; Zhang, C.G.; Wang, S.Z.; Ma, W.D.; Liu, F.G.; Chen, Q.; Zhou, Q.; Xia, X.S.; Niu, B.C. Response of vegetation dynamics to hydrothermal conditions onthe Qinghai-Tibet Plateau in the last 40 years. Acta Ecol. Sin. 2022, 42, 4770–4783, (In Chinese with English Abstract). [Google Scholar]
- Zhang, S.Q.; Chen, H.; Song, M.H.; Fu, Y.; Niu, H.H.; Yang, Y.; Zhang, B.X. Spatial and temporal variation of fractional vegetation coverand its relationship with environmental factors in the Qaidam Basin during 2000–2015. Arid Land Geogr. 2019, 42, 1124–1132, (In Chinese with English Abstract). [Google Scholar]
- Yan, Y.C.; Sun, S.J.; Yu, D.; Gao, G.S. Impact and trend estimation of climate change on vegetation greennessin the Qaidam Basin. Arid Zone Res. 2025, 42, 1257–1268, (In Chinese with English Abstract). [Google Scholar]
- Lins, C.M.T.; Souza, E.R.; Souza, T.E.M.S.; Paulino, M.K.S.S.; Monteiro, D.R.; Souza Júnior, V.S.; Dourado, P.R.M.; Rego Junior, F.E.A.; Silva, Y.J.A.; Schaffer, B. Influence of vegetation cover and rainfall intensity on soil attributes in an area undergoing desertification in Brazil. Catena 2023, 221, 106751. [Google Scholar] [CrossRef] [Scilit]
- Duan, J.; Marzuki, A.; Bagheri, M. Spatial-temporal analysis of vegetation coverage change in the Emei Mountain area based on Landsat imagery. J. Circuits Syst. Comput. 2025, 35, 2550425. [Google Scholar] [CrossRef] [Scilit]
- Qiao, B.; Yang, H.; Cao, X.Y.; Zhou, B.R.; Wang, N.A. Driving mechanisms and threshold identification of landscape ecological risk: A nonlinear perspective from the Qilian Mountains, China. Ecol. Indic. 2025, 173, 113342. [Google Scholar] [CrossRef] [Scilit]
- Li, J.; Gong, C.W. Effects of terrain factors on vegetation cover change in national park of Qilian Mountains. Bull. Soil Water Conserv. 2021, 41, 228–237, (In Chinese with English Abstract). [Google Scholar]
- He, J.; Li, Y.; Shi, X.Y.; Hou, H.Y. Integrating the impacts of vegetation coverage on ecosystem services to determine ecological restoration targets for adaptive management on the Loess Plateau, China. Land Degrad. Dev. 2023, 34, 5697–5712. [Google Scholar] [CrossRef] [Scilit]
- Wang, W.D.; Chen, Y.; Du, Z.; Bi, S.T.; Zhang, Q.; Ye, T. Ecological restoration zoning and its driving factors in Beijing-Tianjin-Hebei based on landscape ecological risk and ecosystem services. Ecol. Indic. 2025, 178, 114086. [Google Scholar] [CrossRef] [Scilit]
- Zhu, R.; He, Z.; Huang, S.H.; Shi, H.D.; Liu, X.L.; Wang, J.K.; Liu, J.B.; Liu, A.F.; Li, L. Spatial and temporal changes in vegetation coverage in Huayuan County and the influence of Chinese policies on vegetation coverage. Ecol. Indic. 2025, 171, 113171. [Google Scholar] [CrossRef] [Scilit]
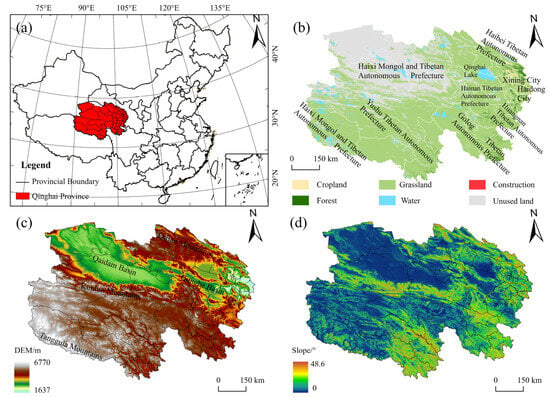
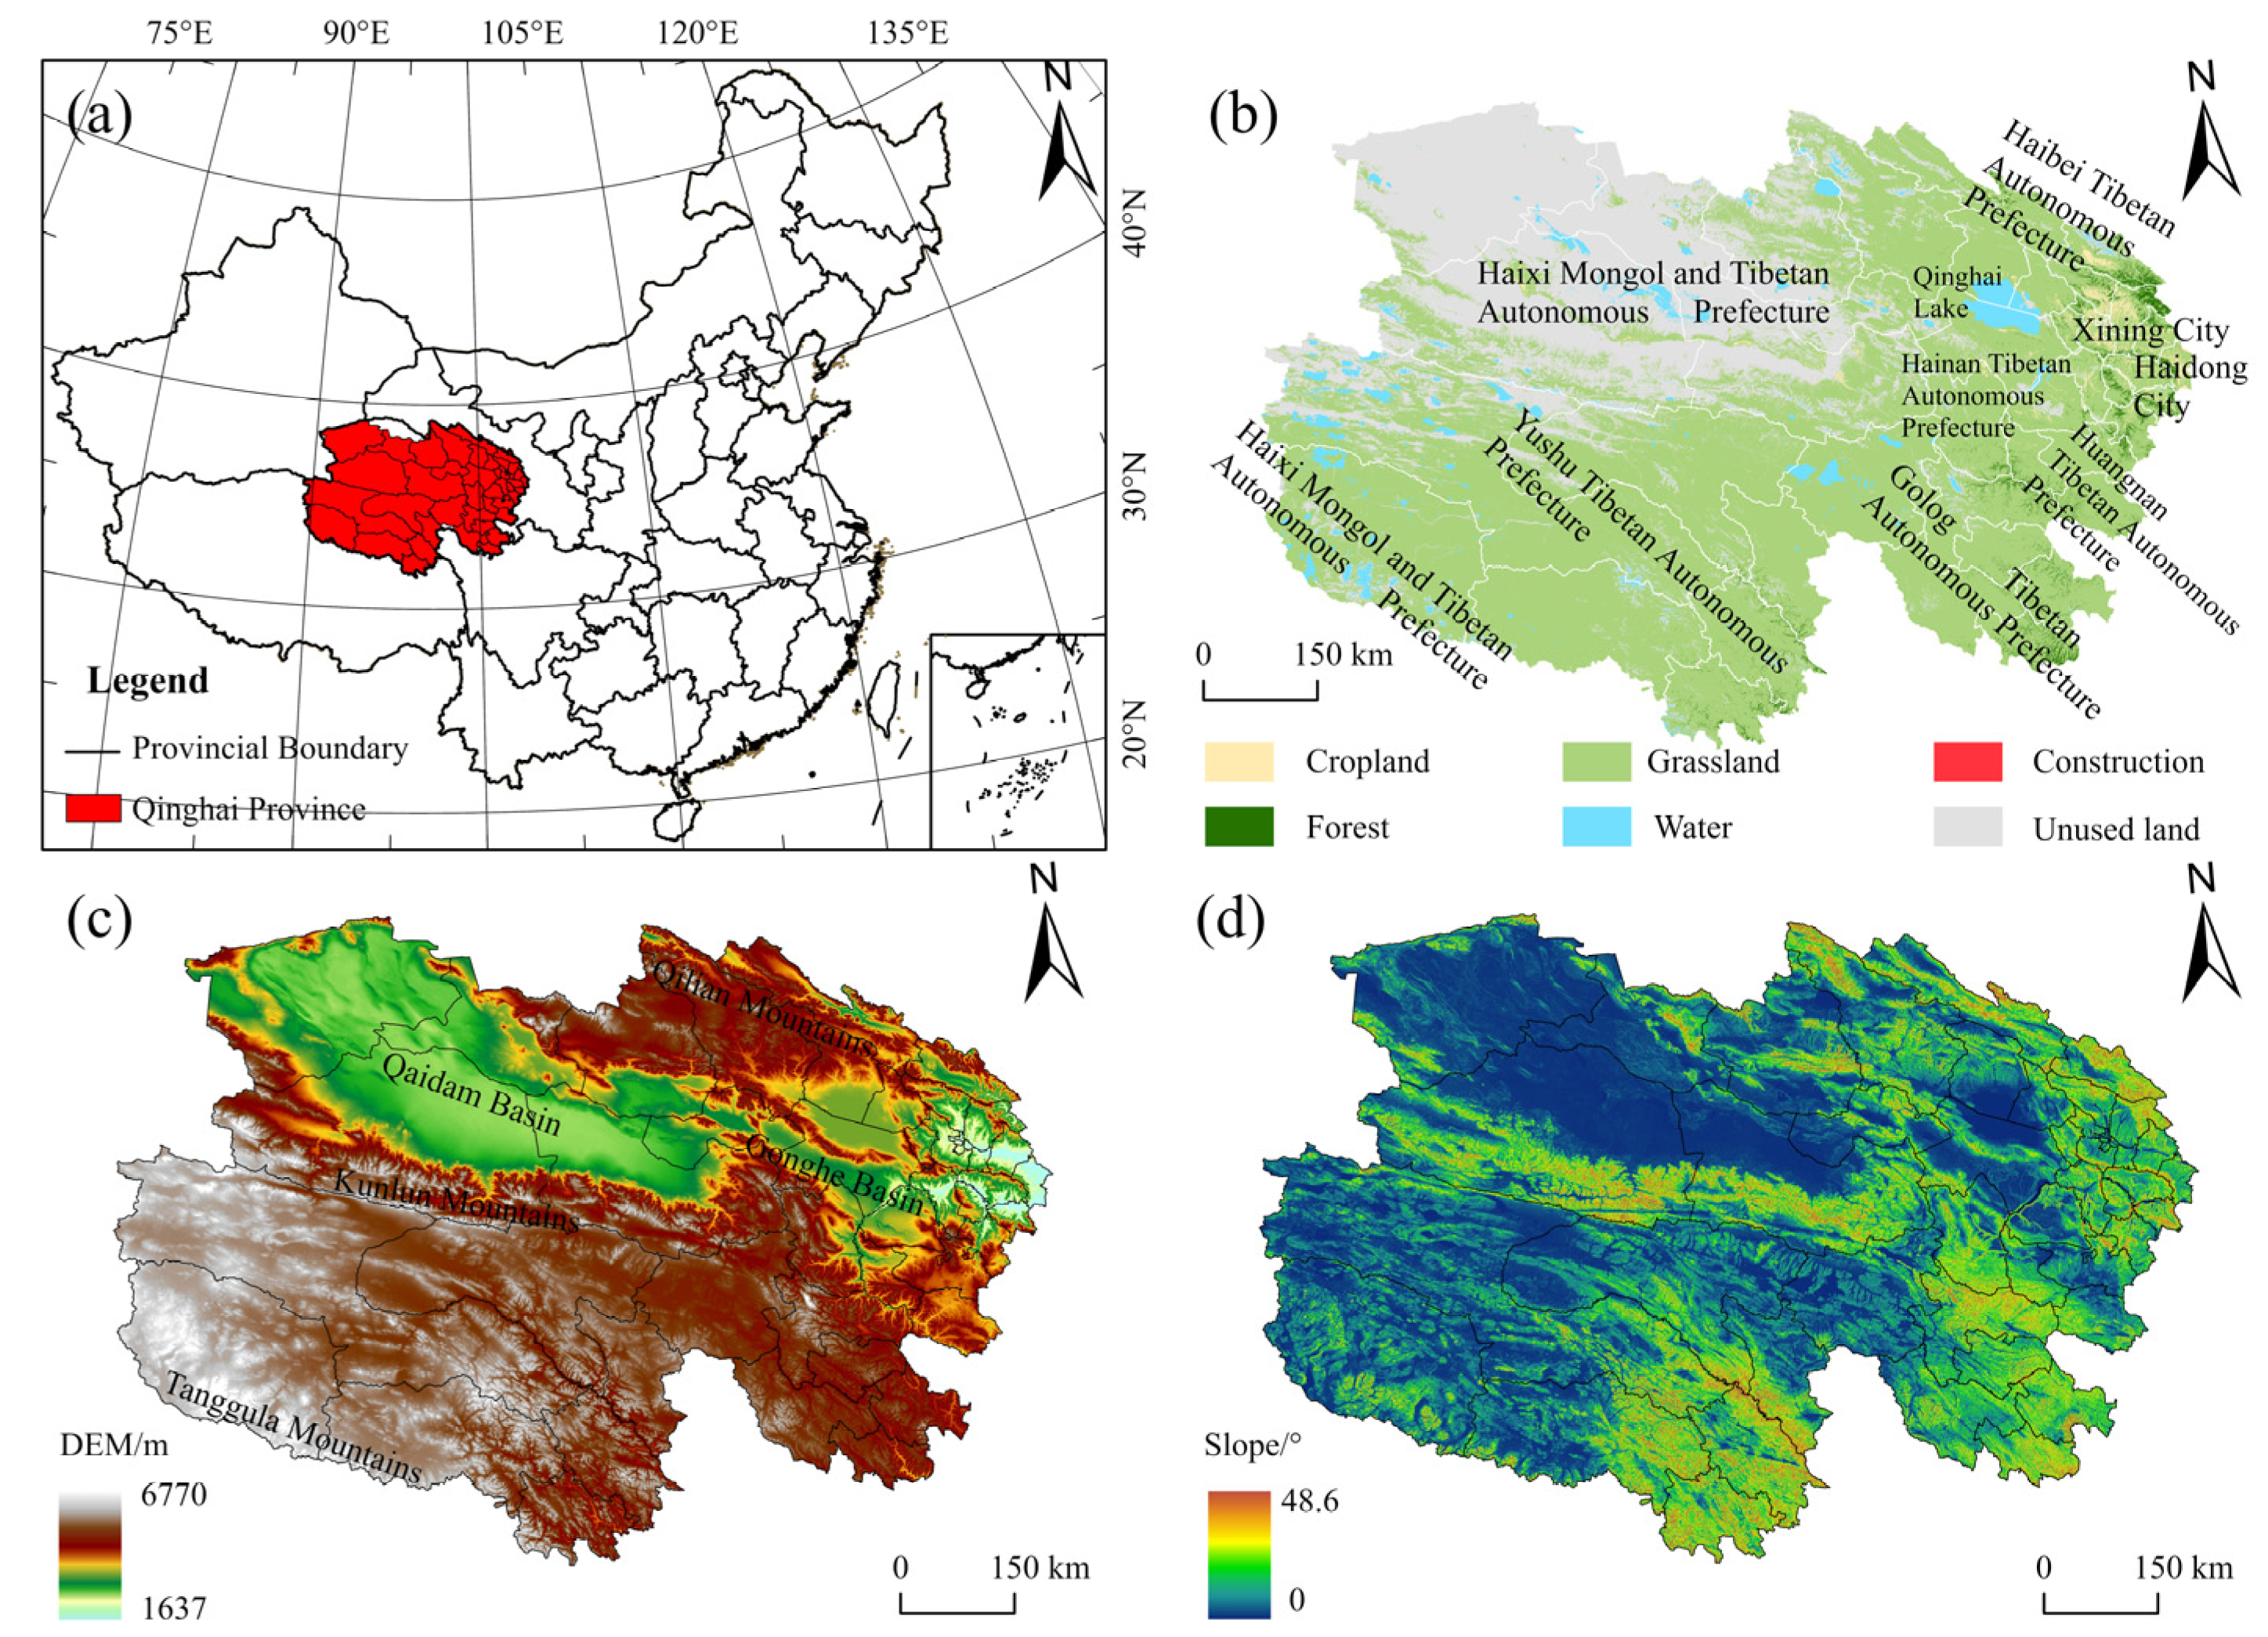
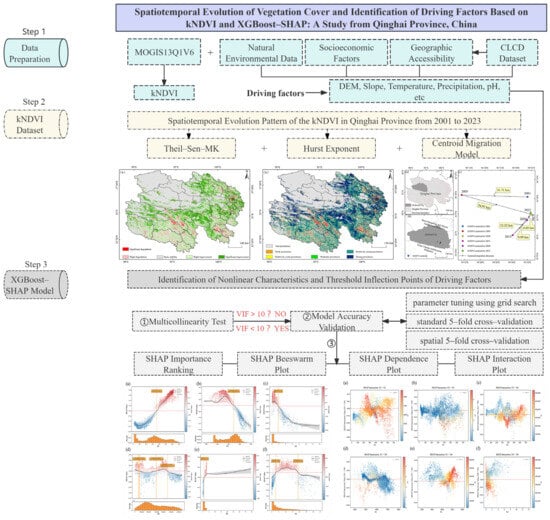
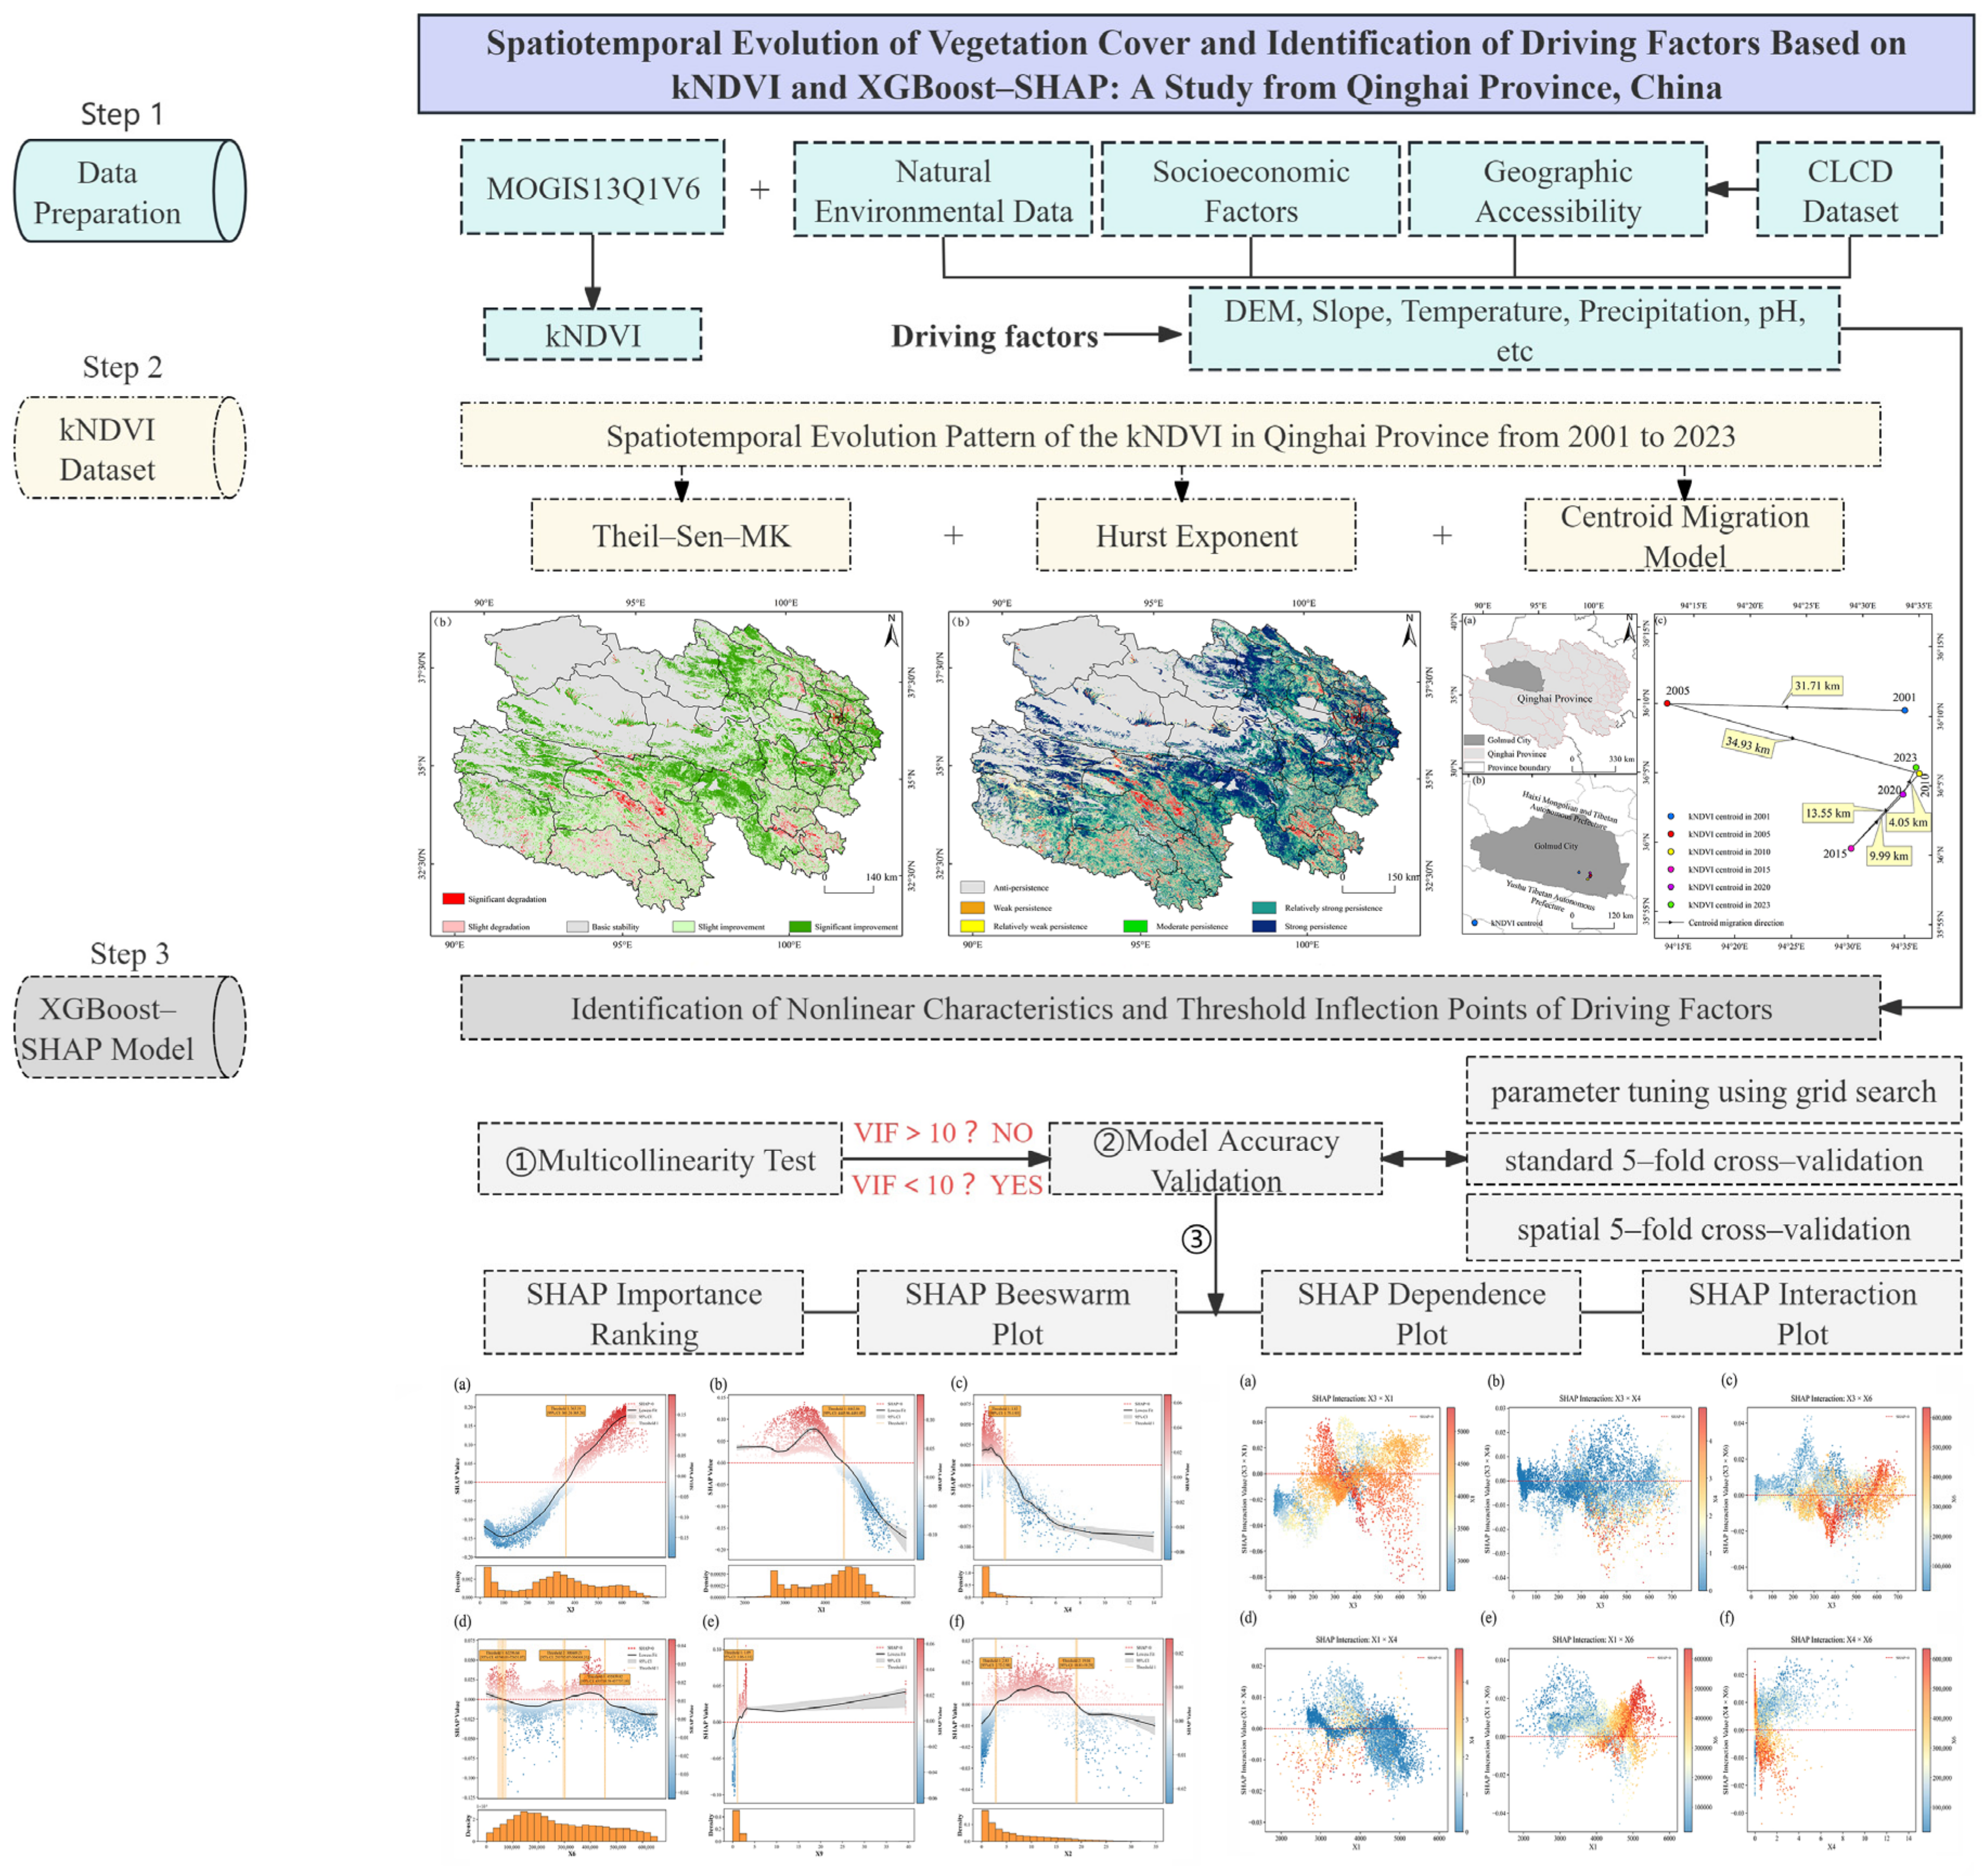
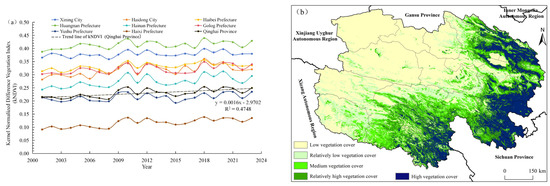
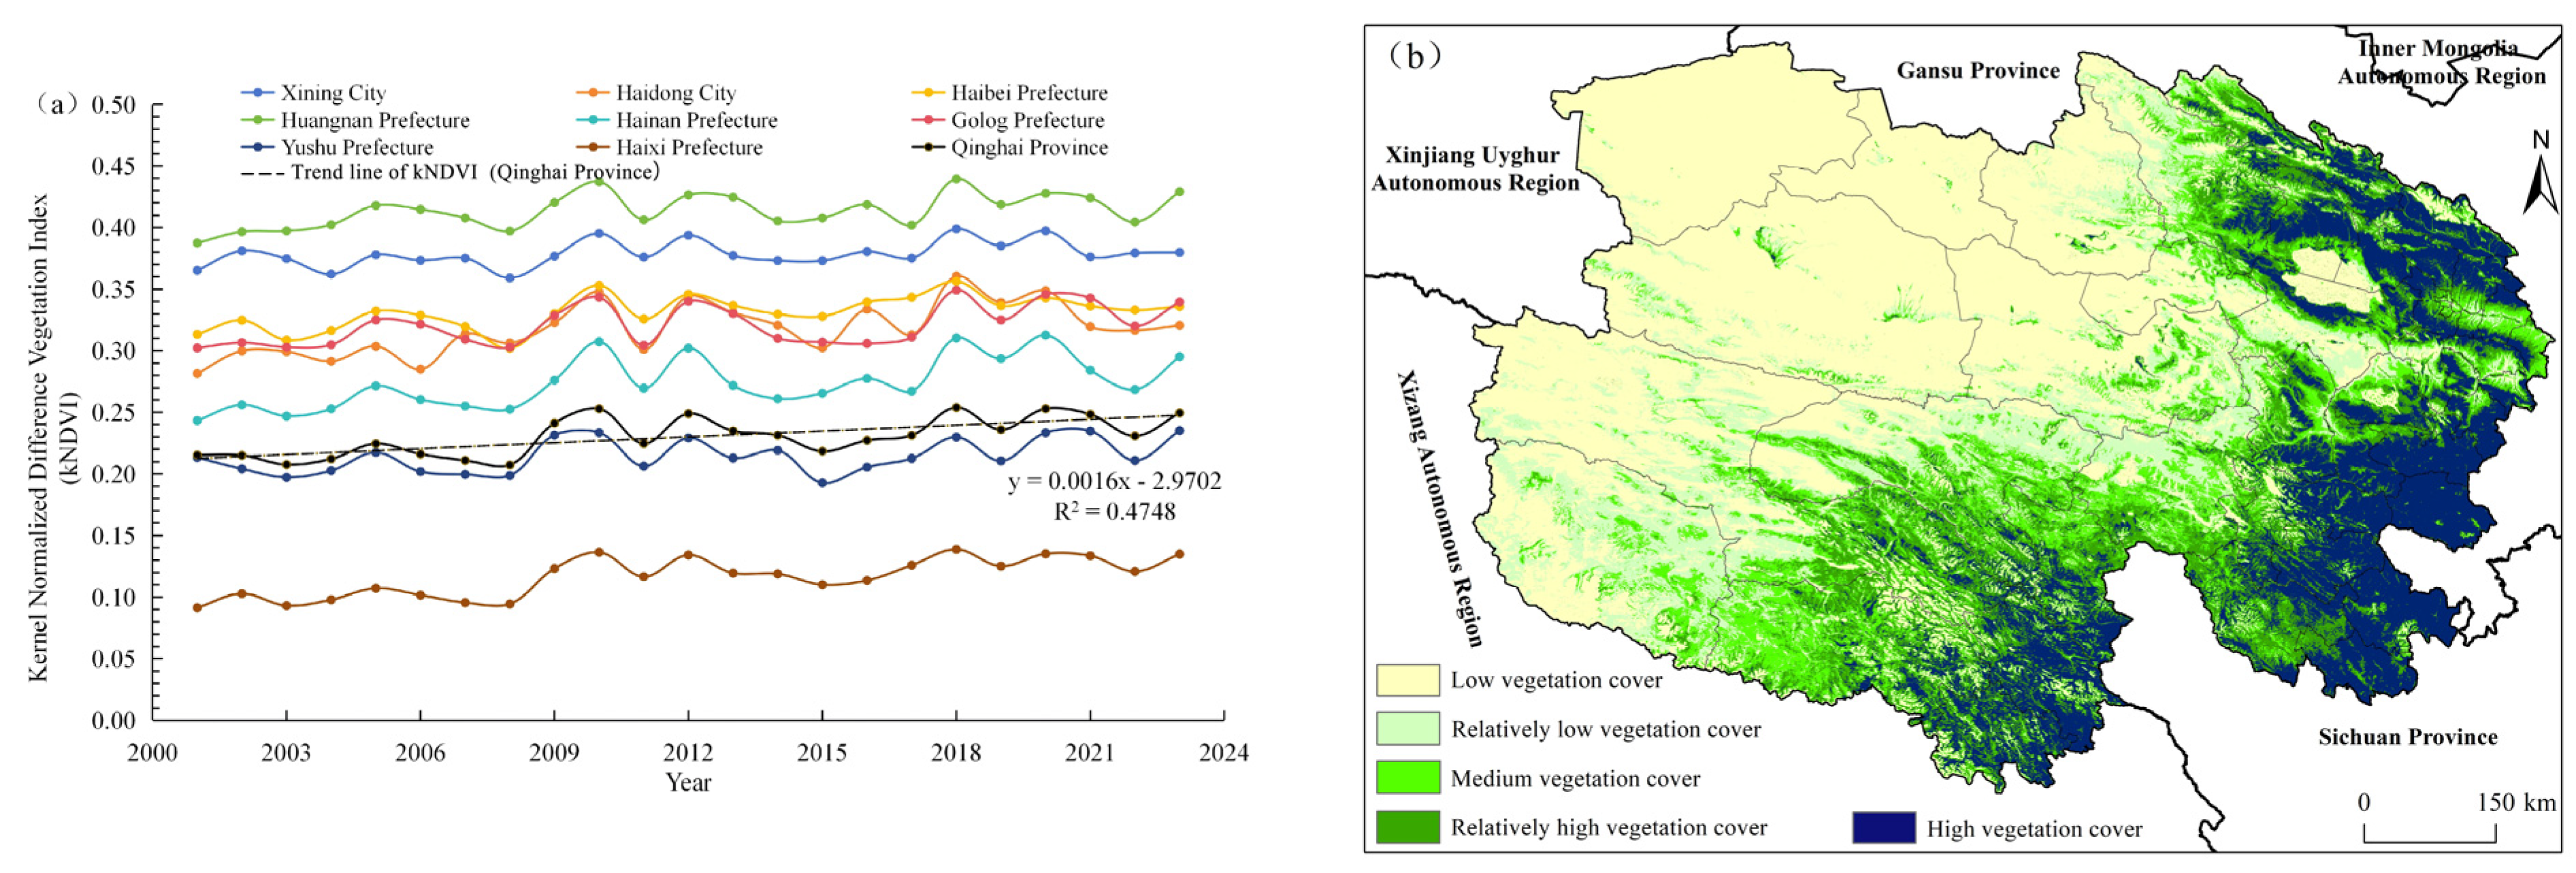
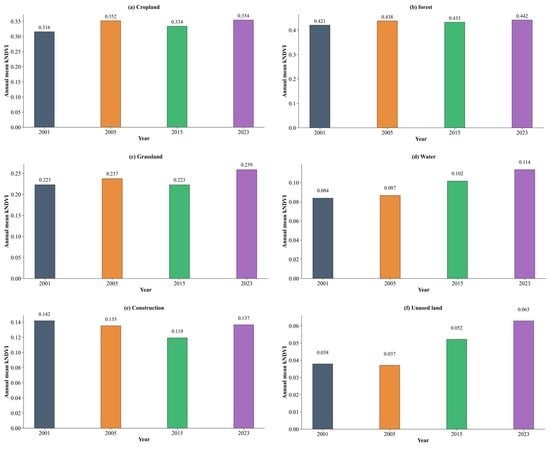
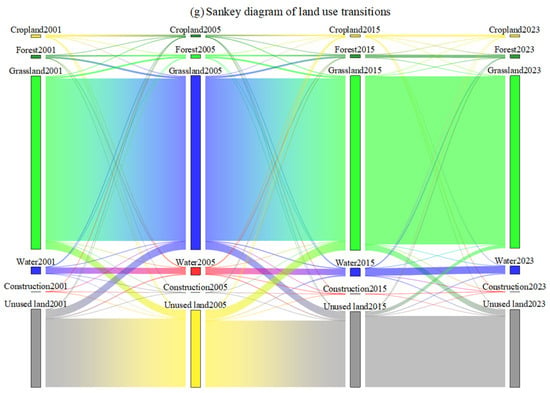
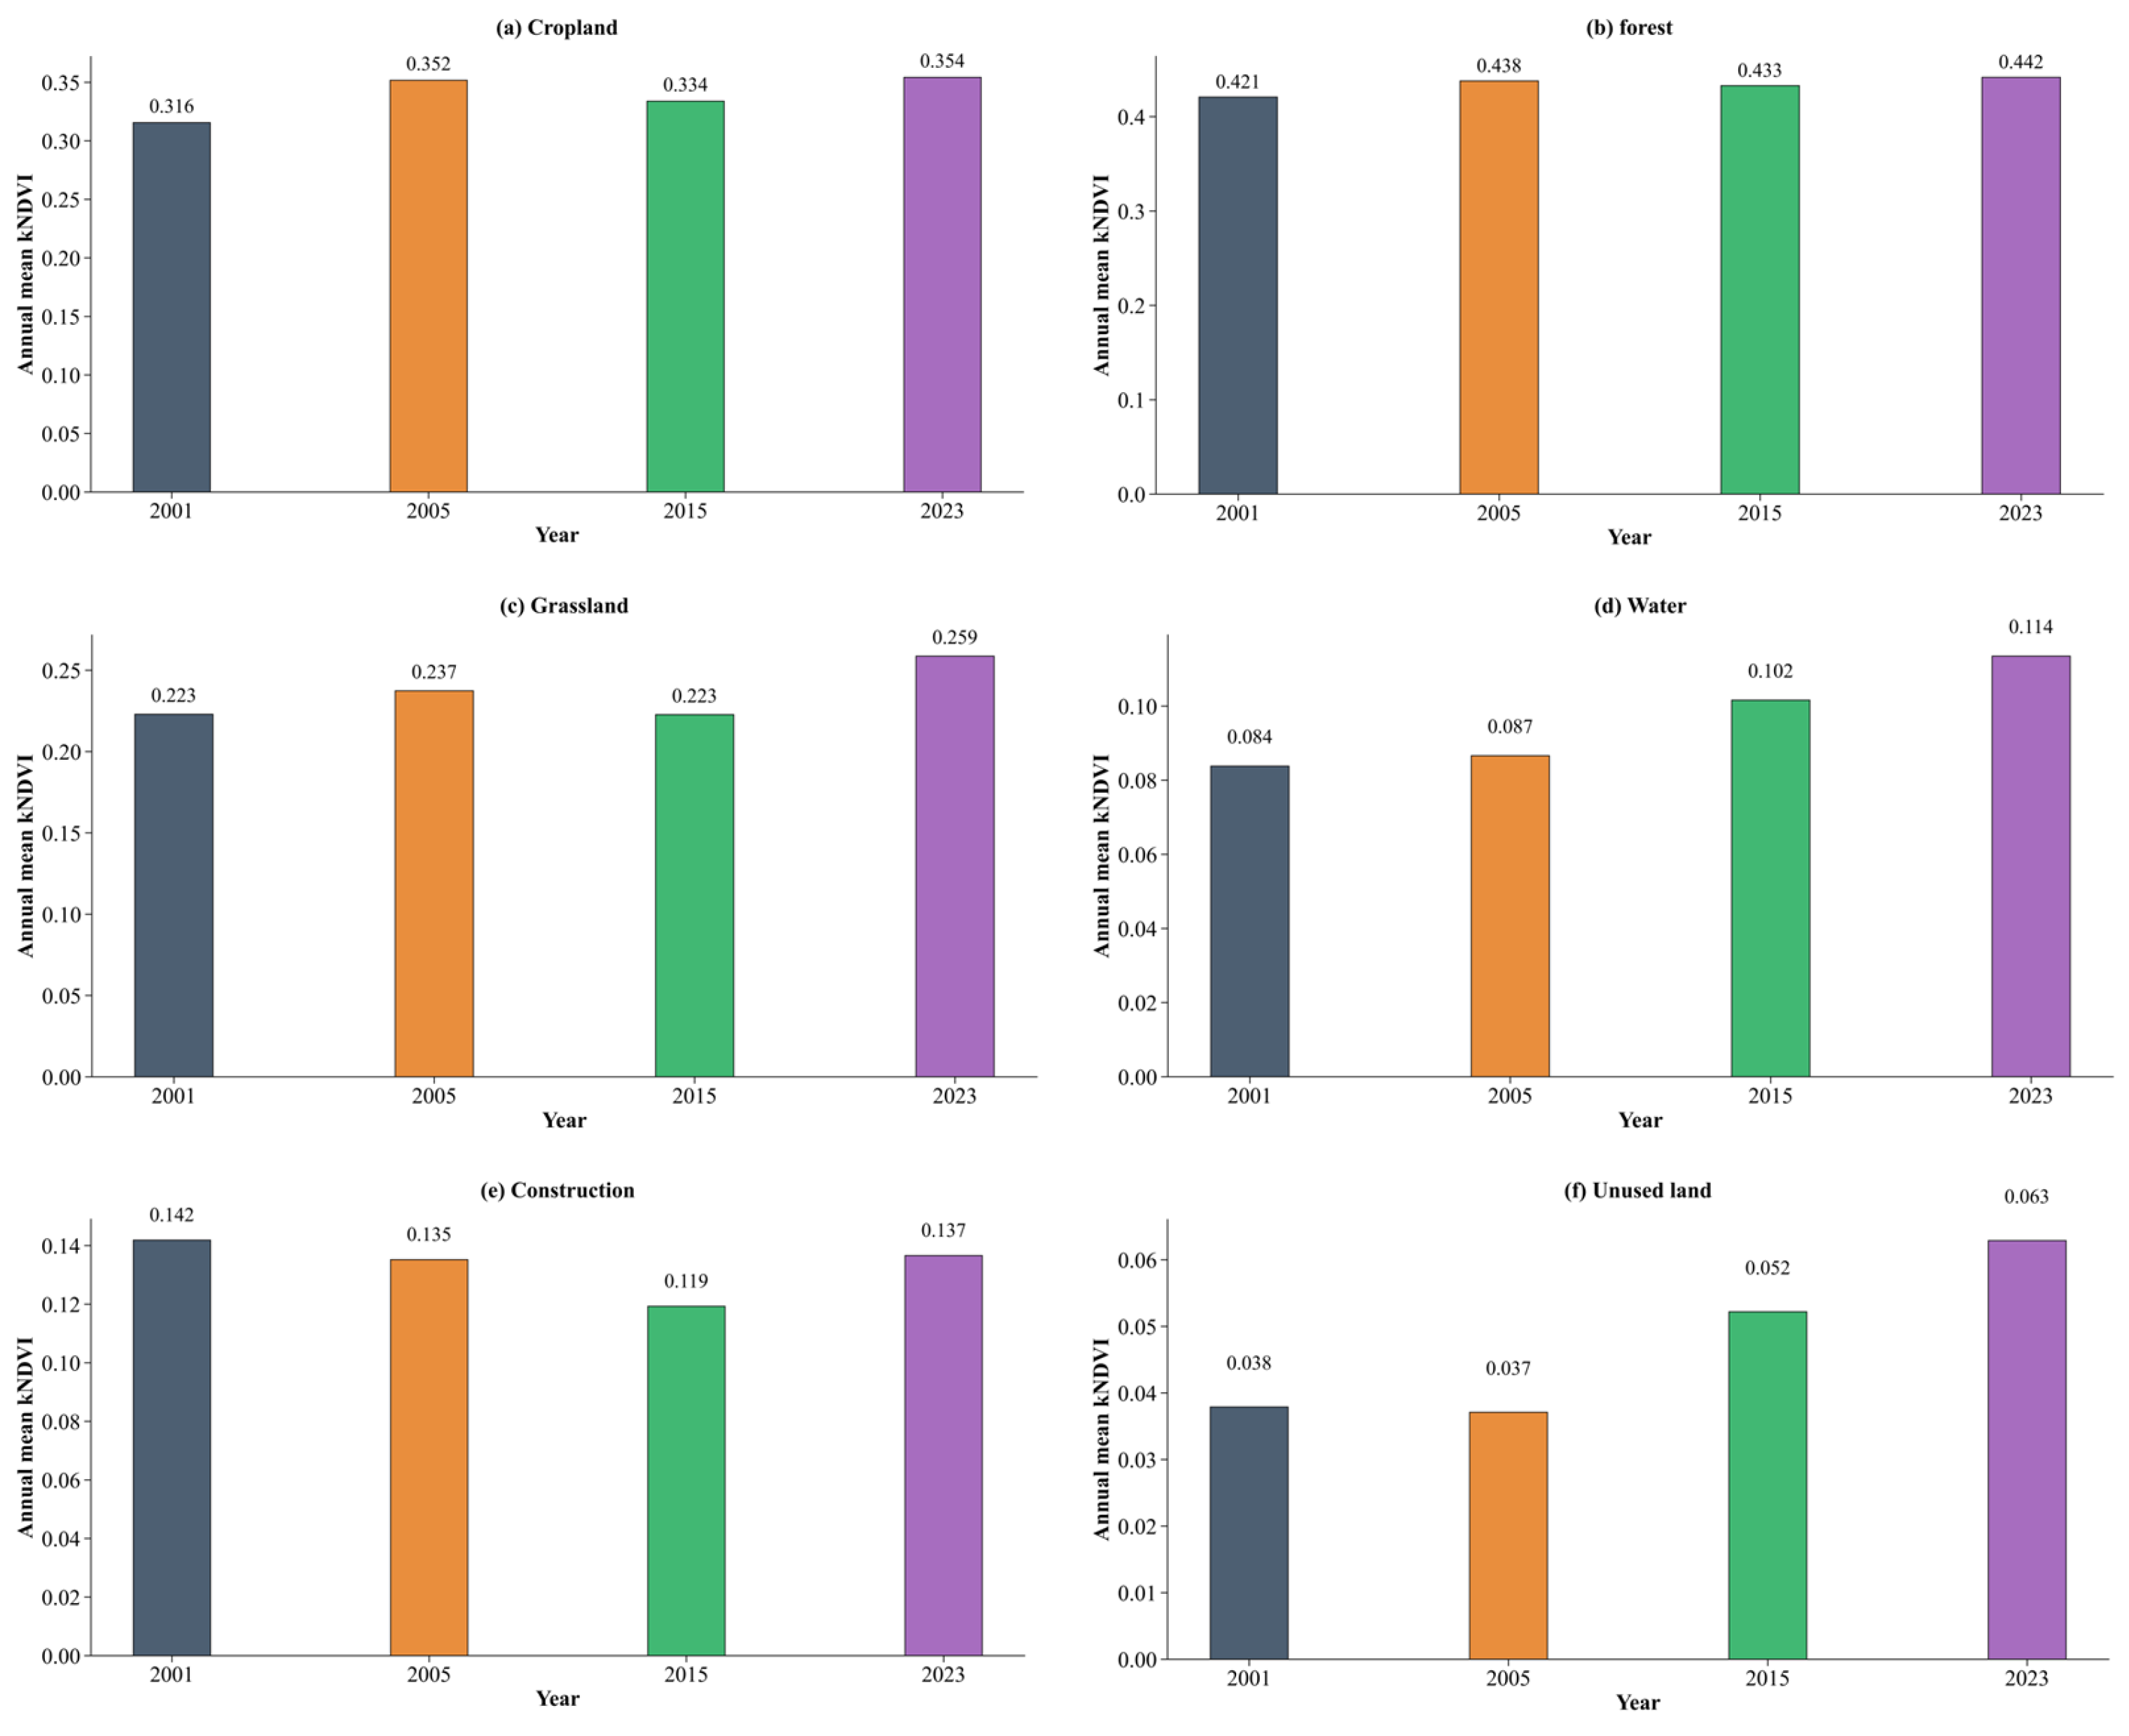
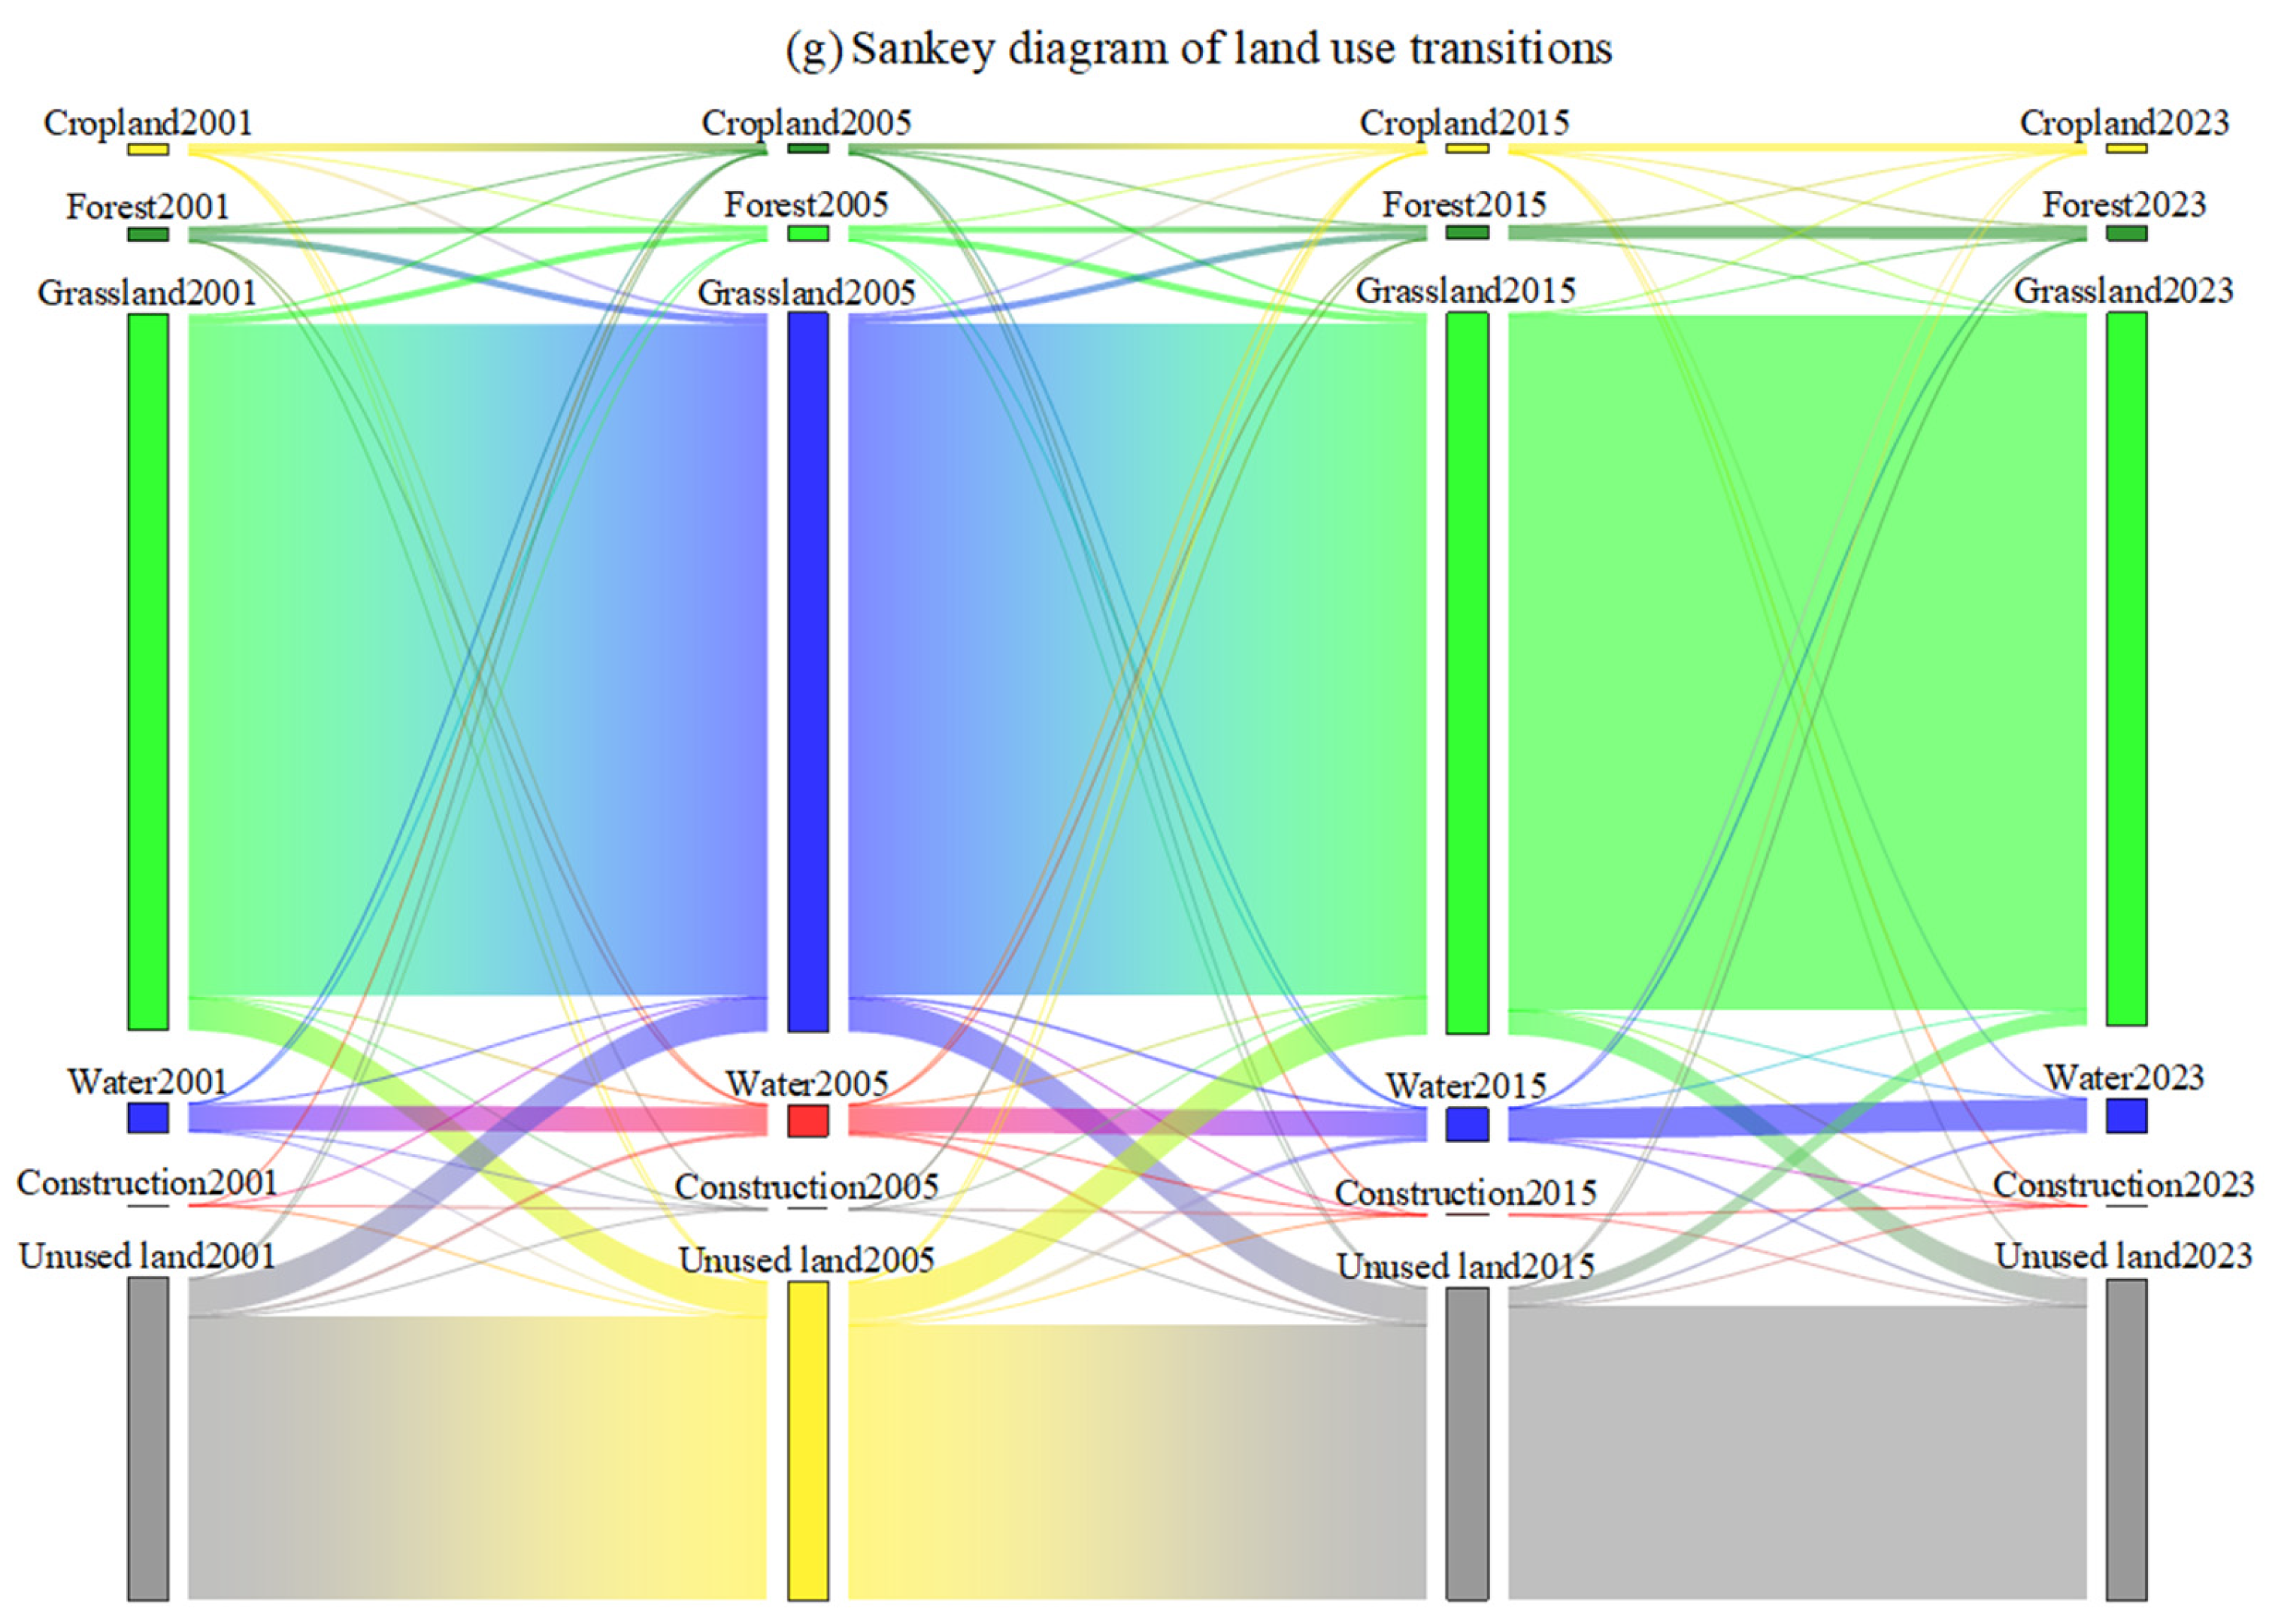
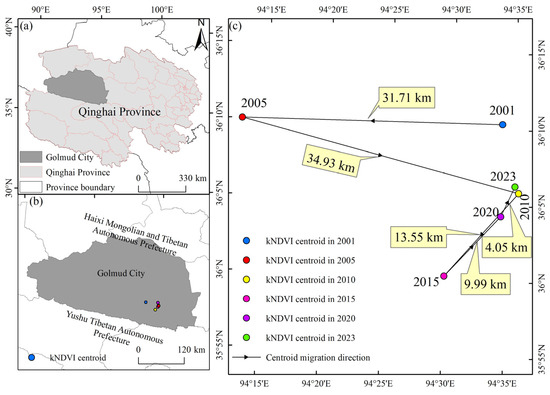
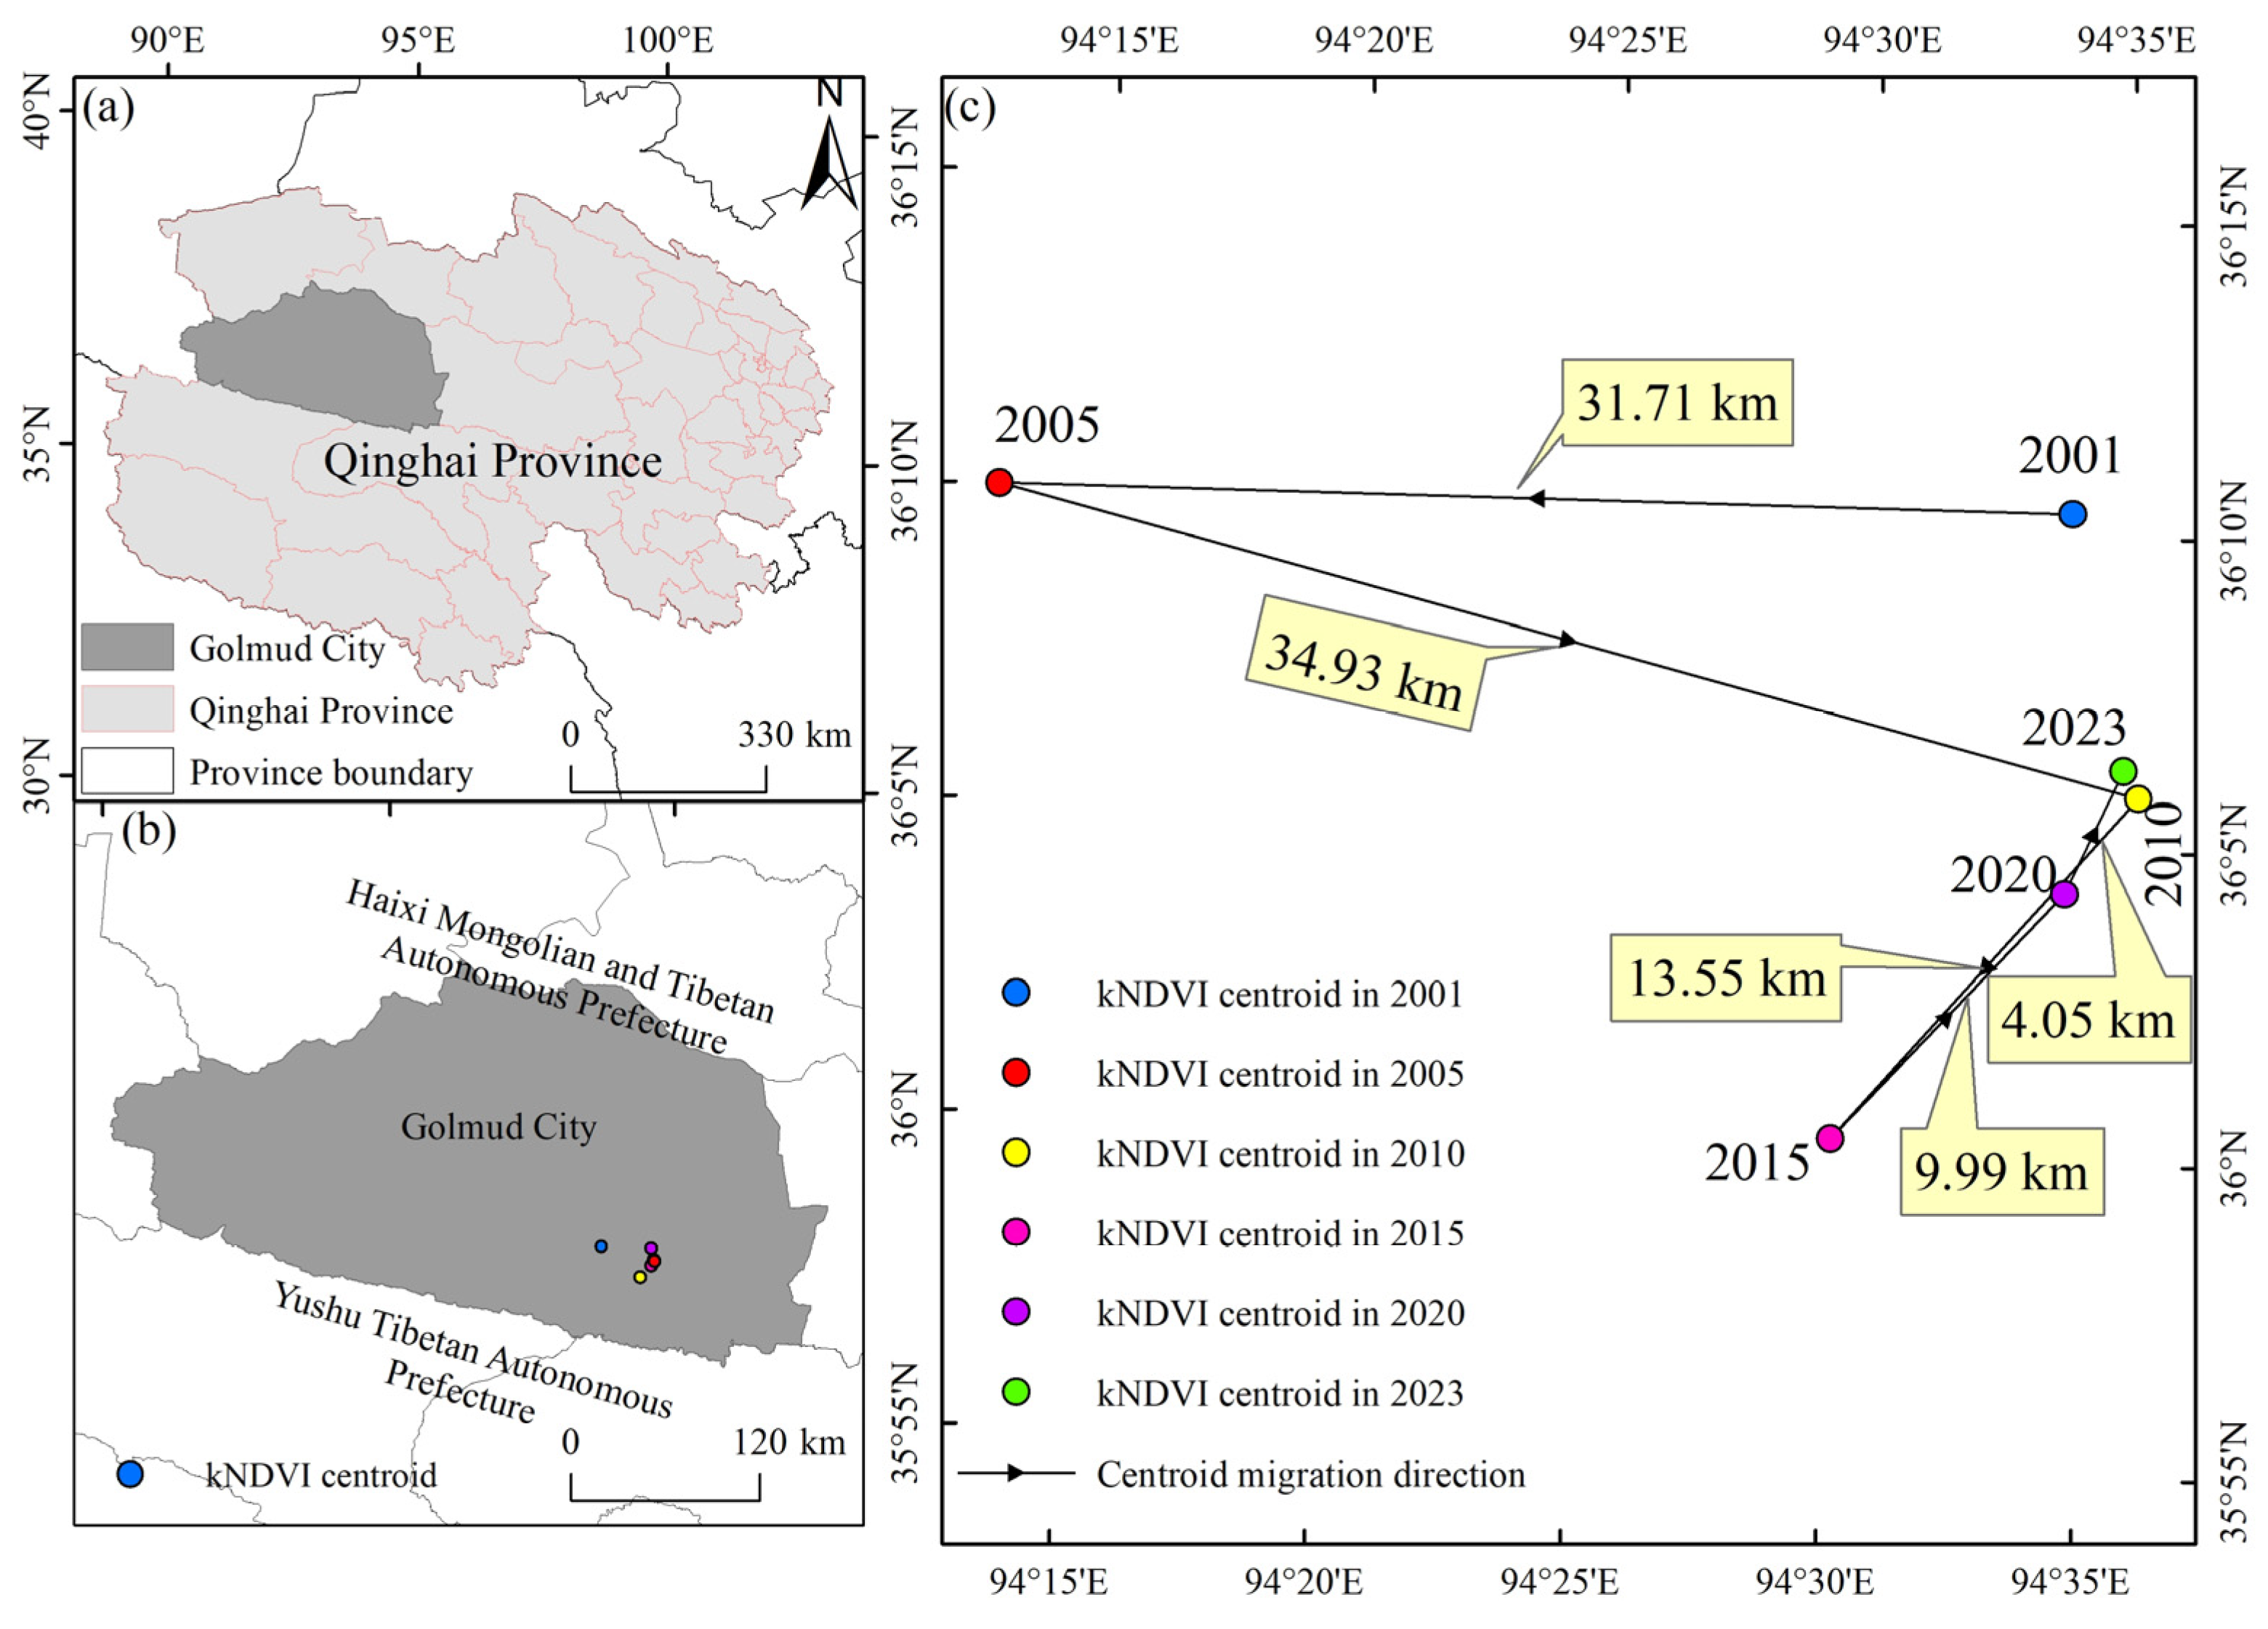
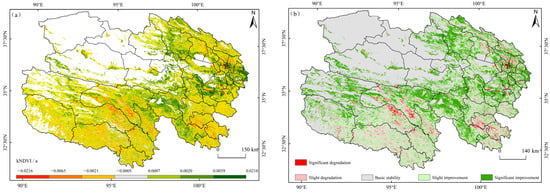
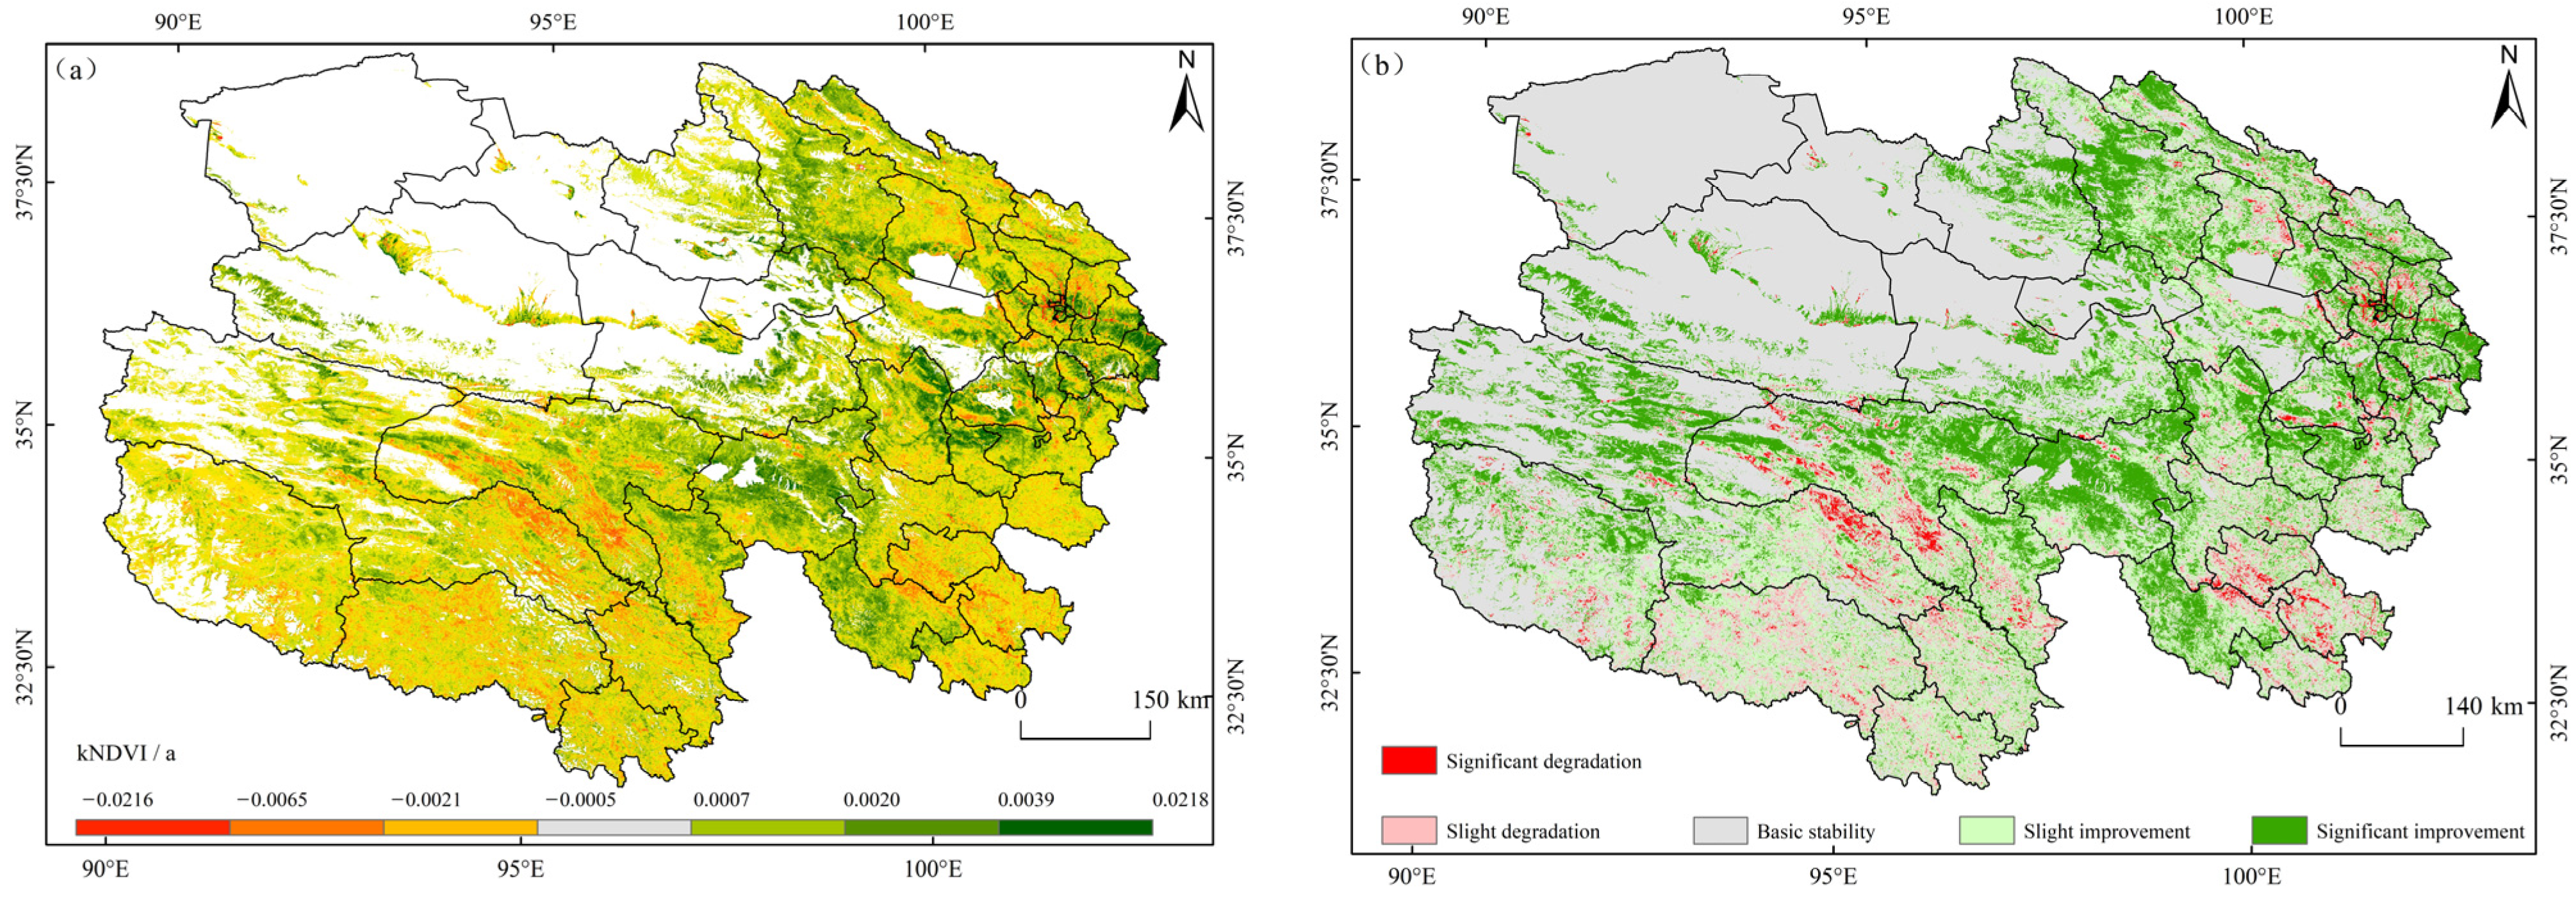
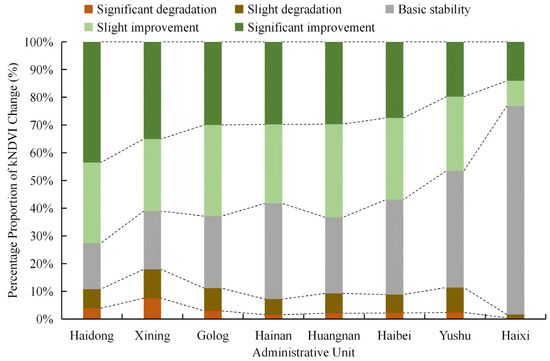
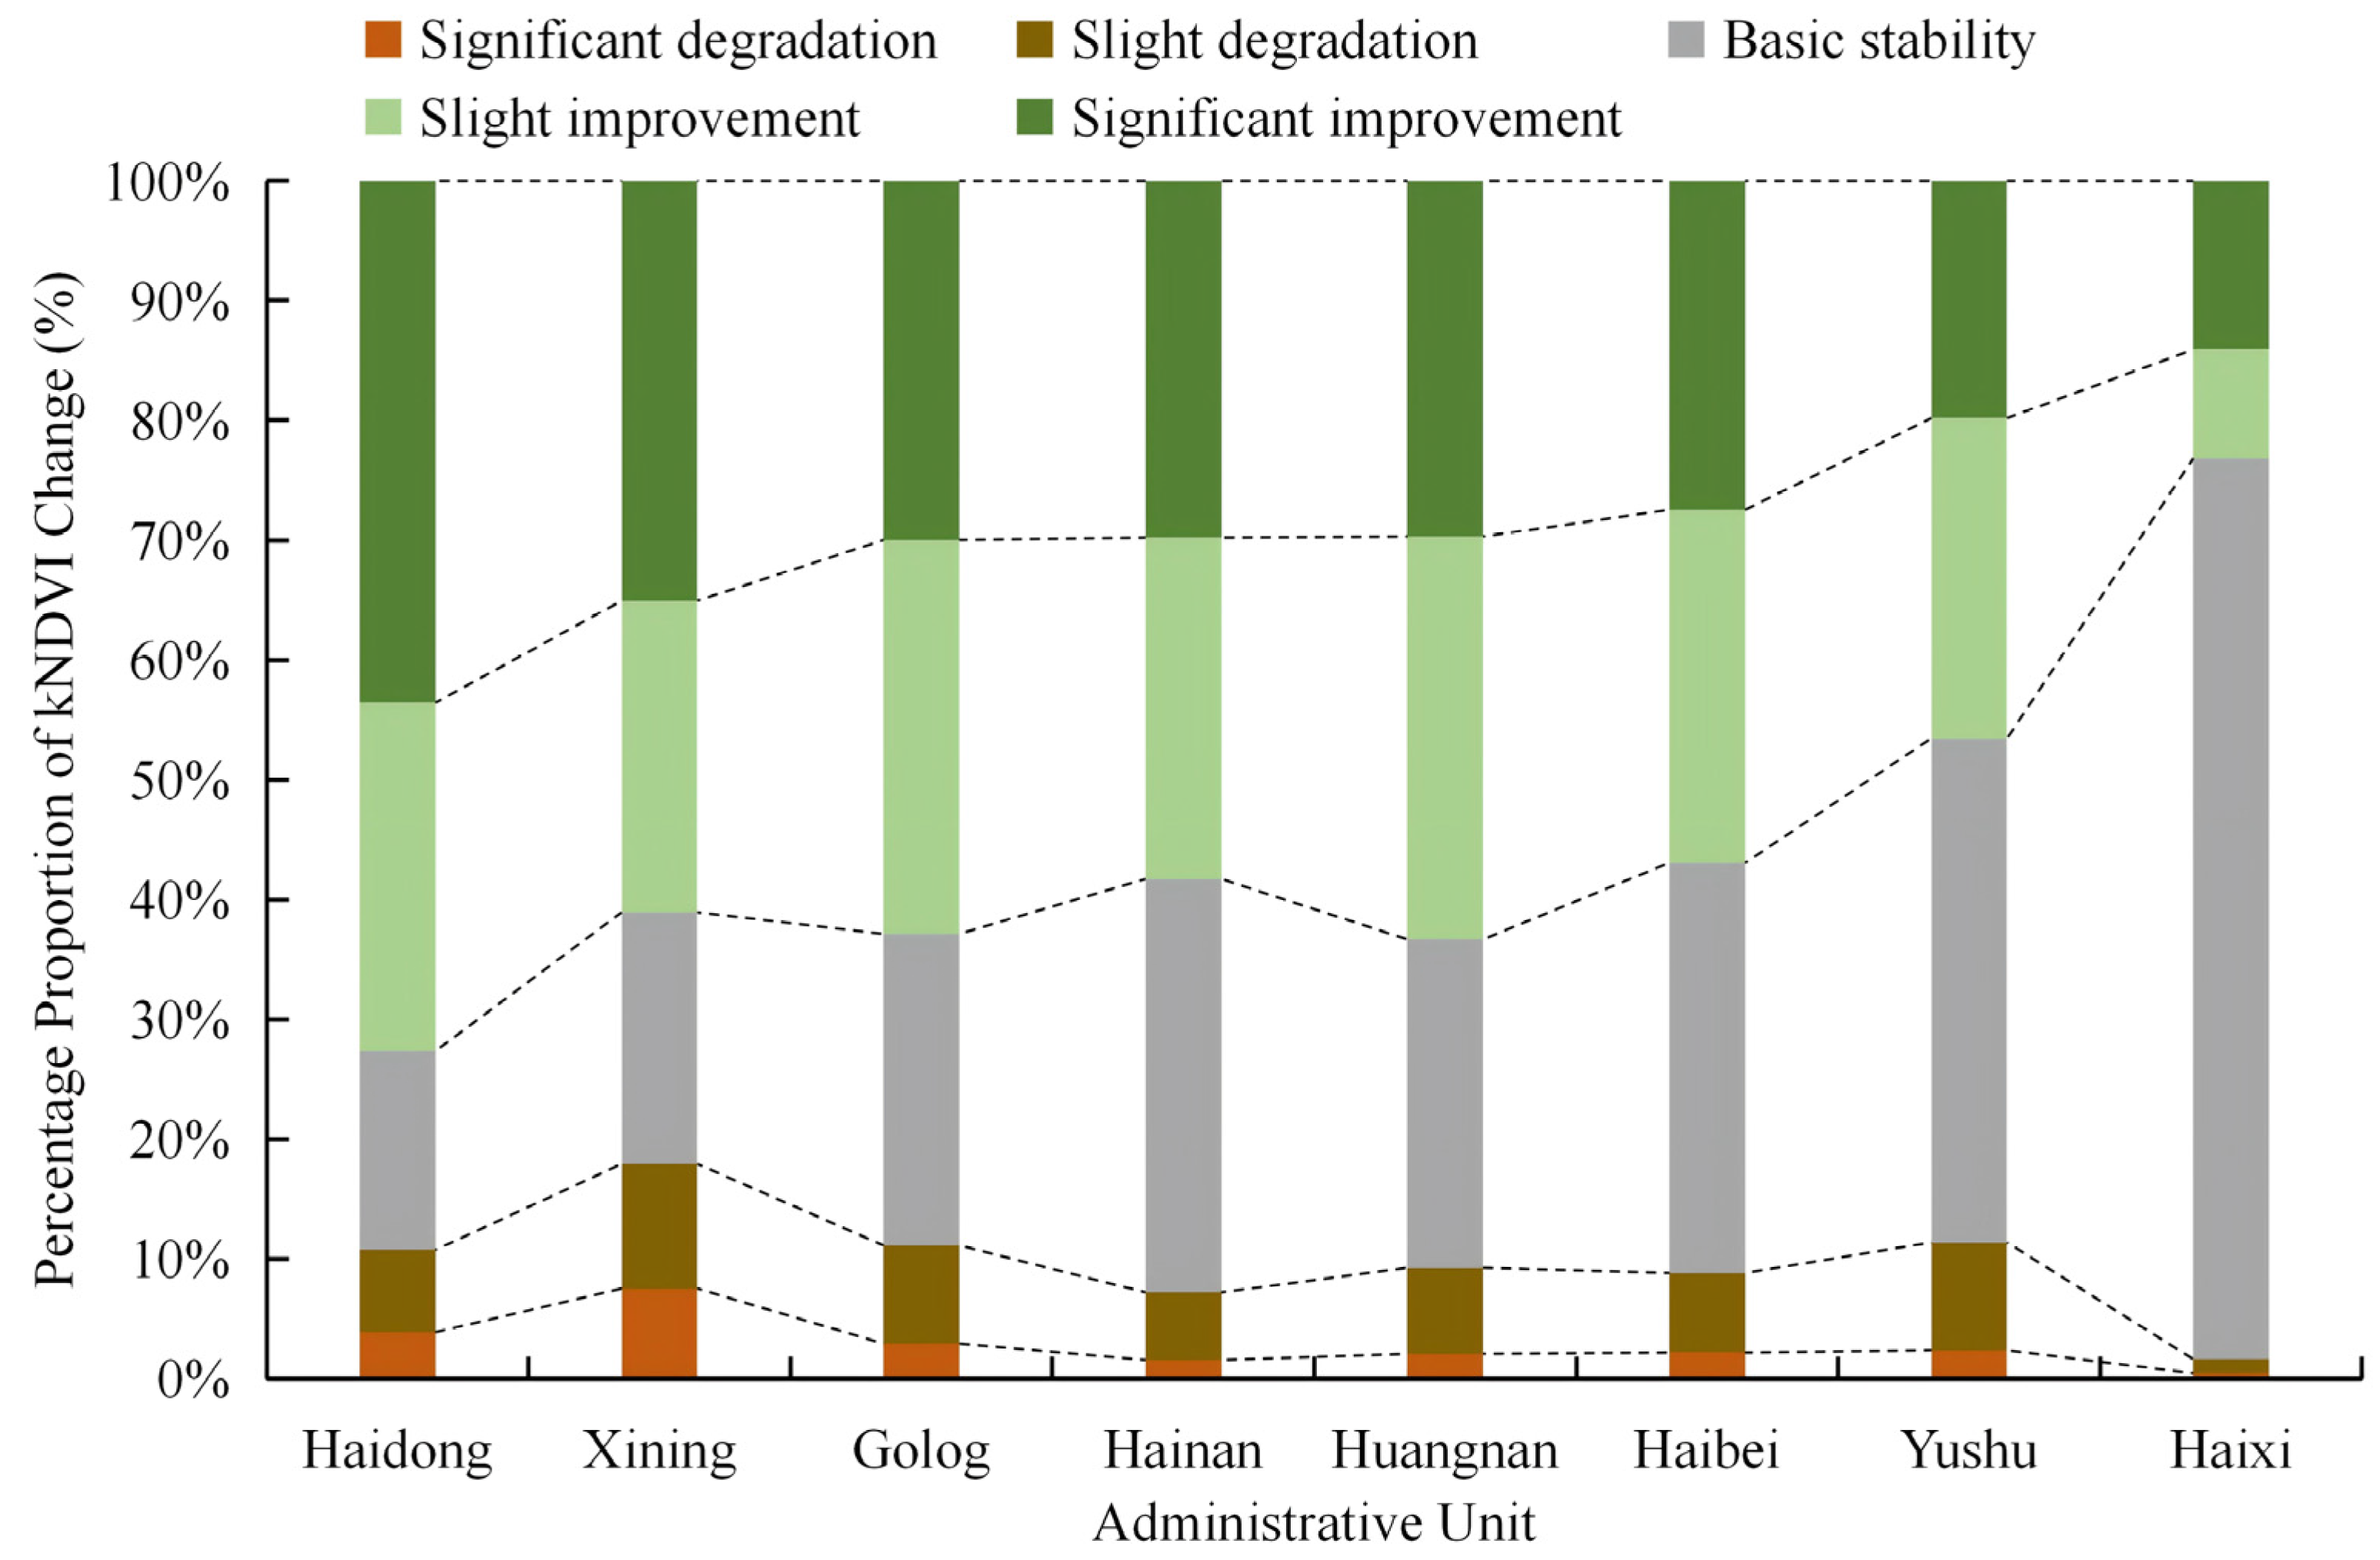
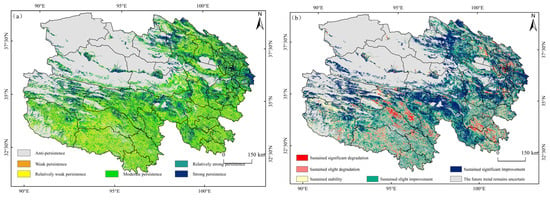
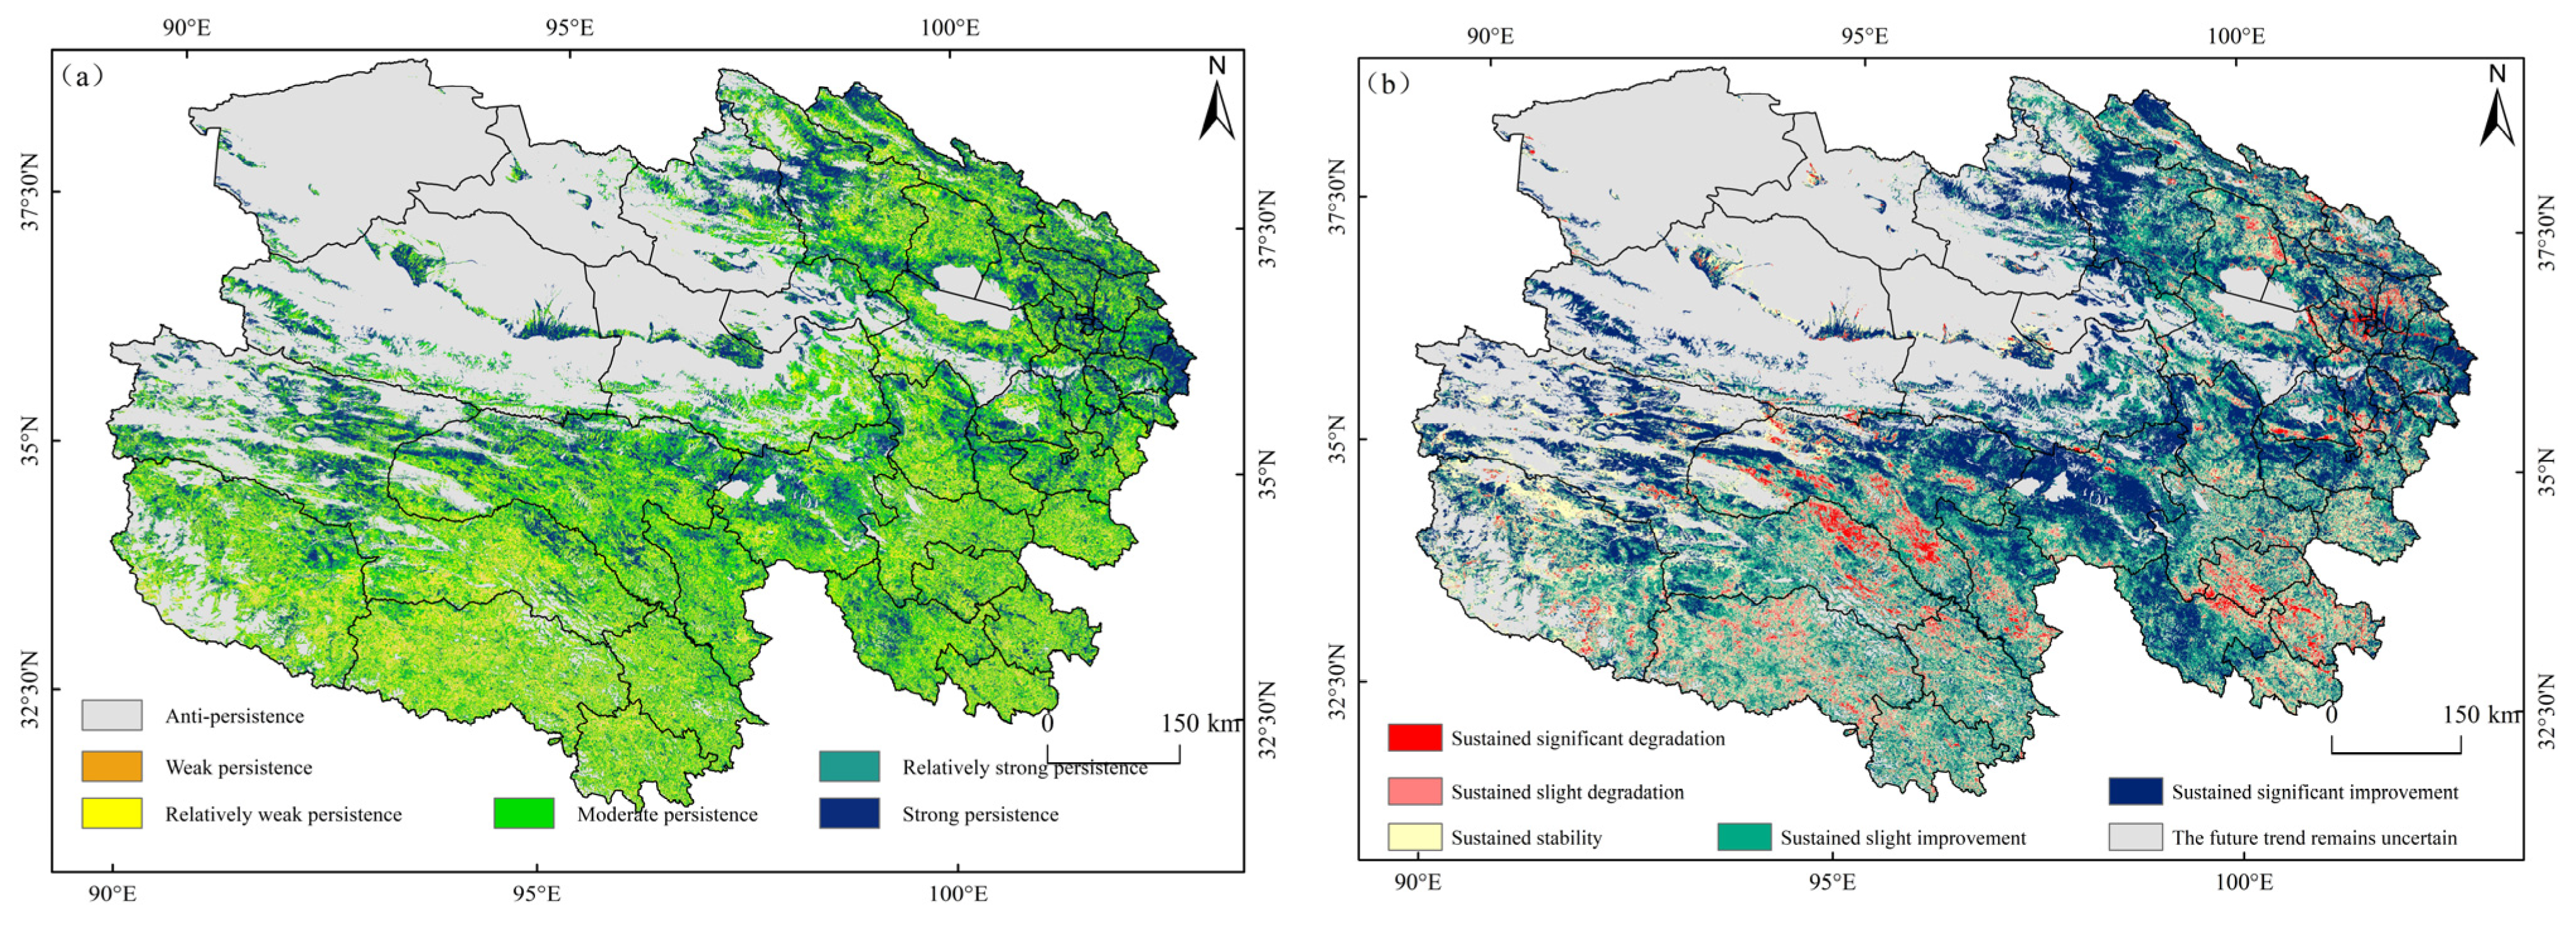
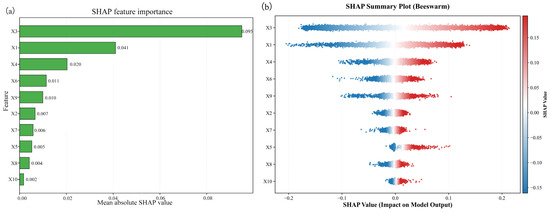
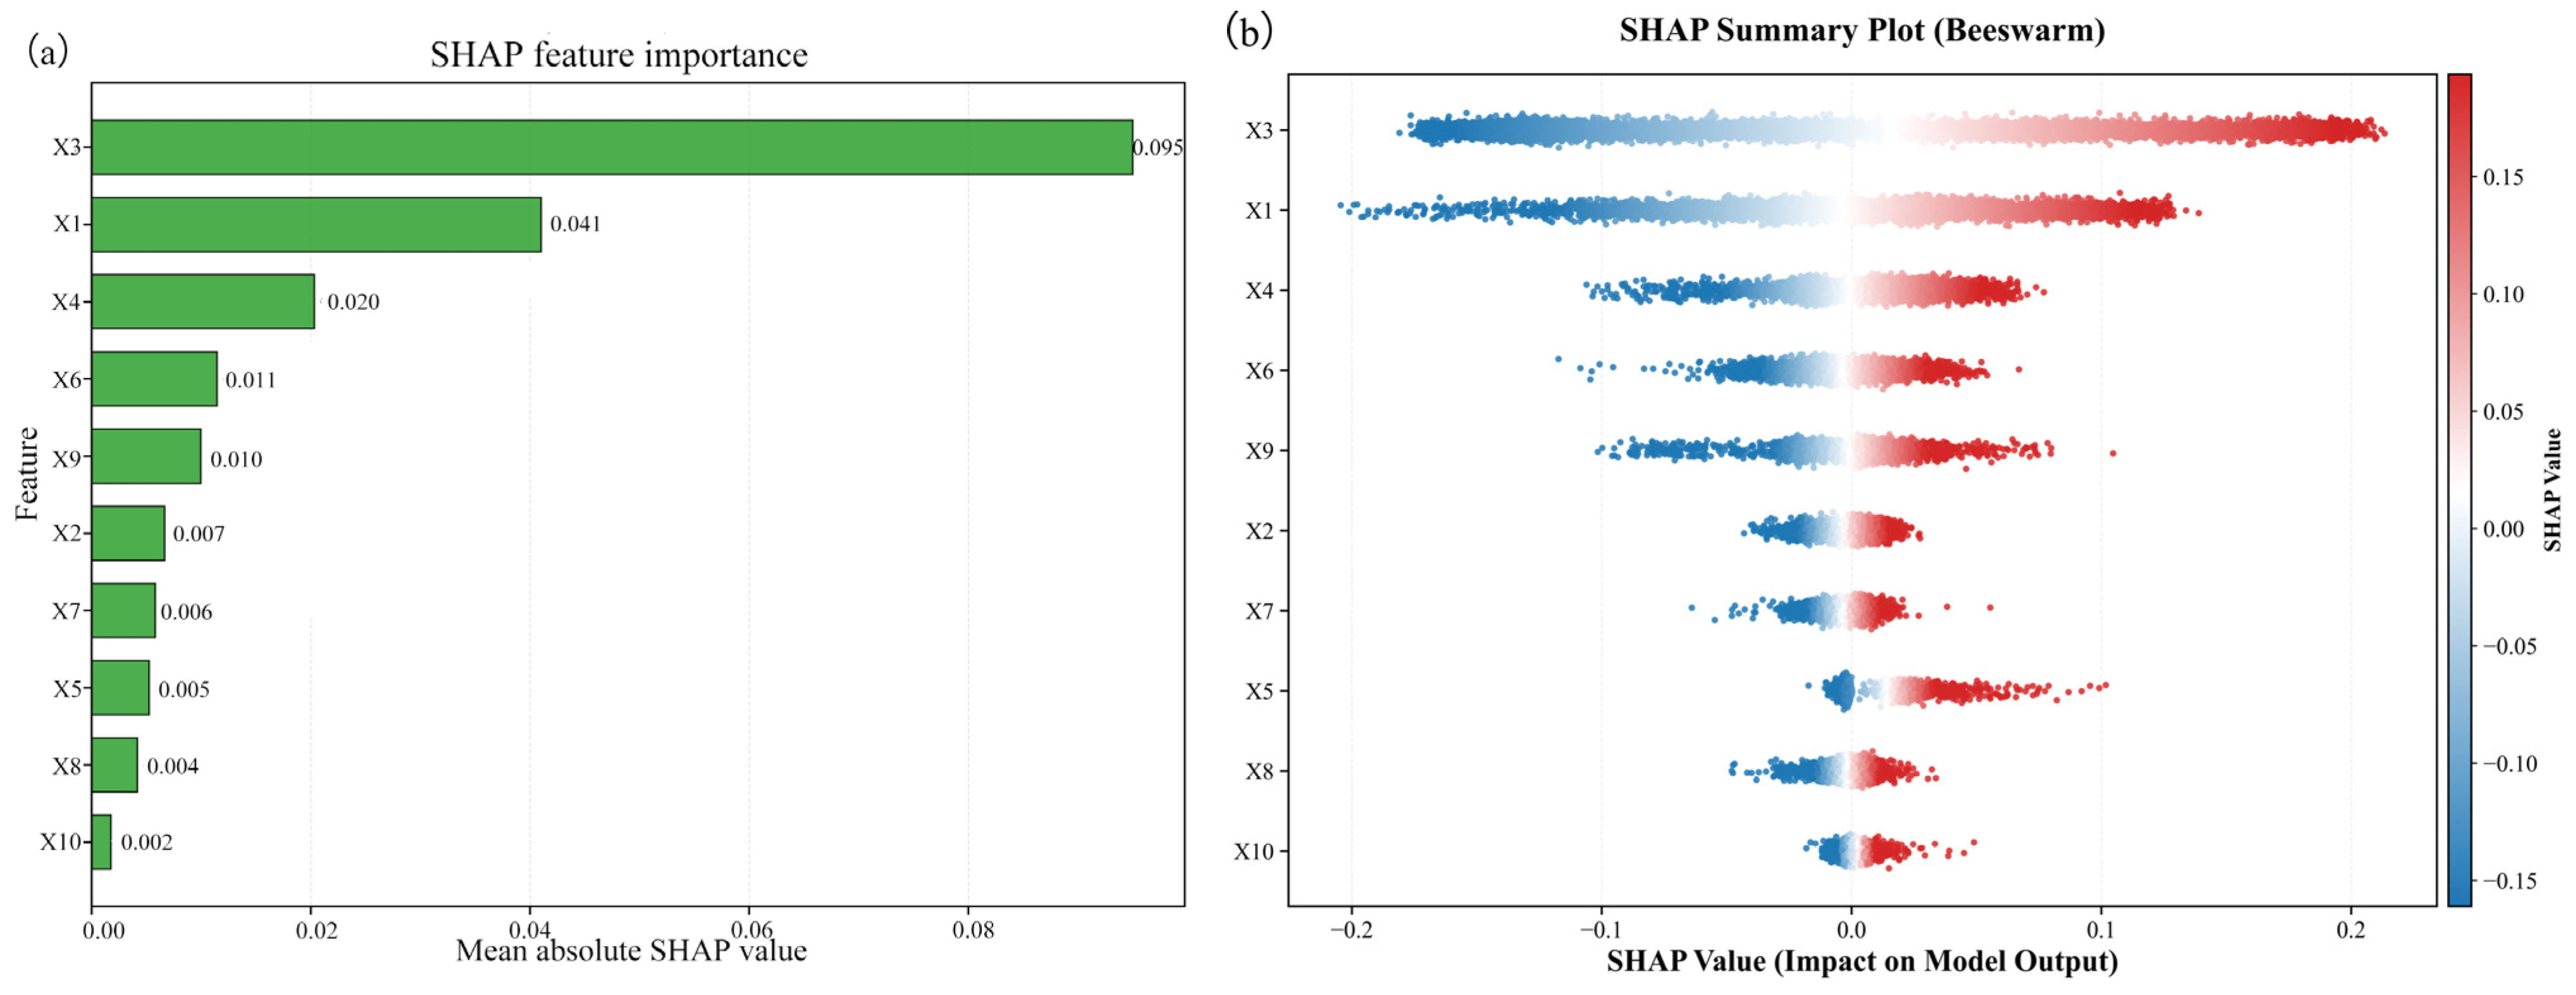
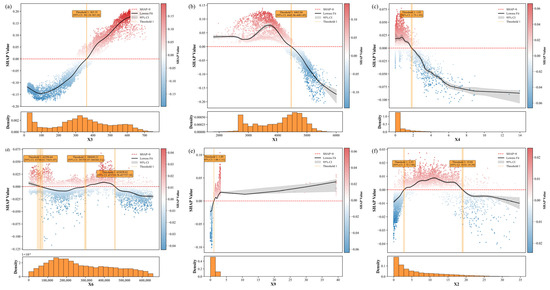
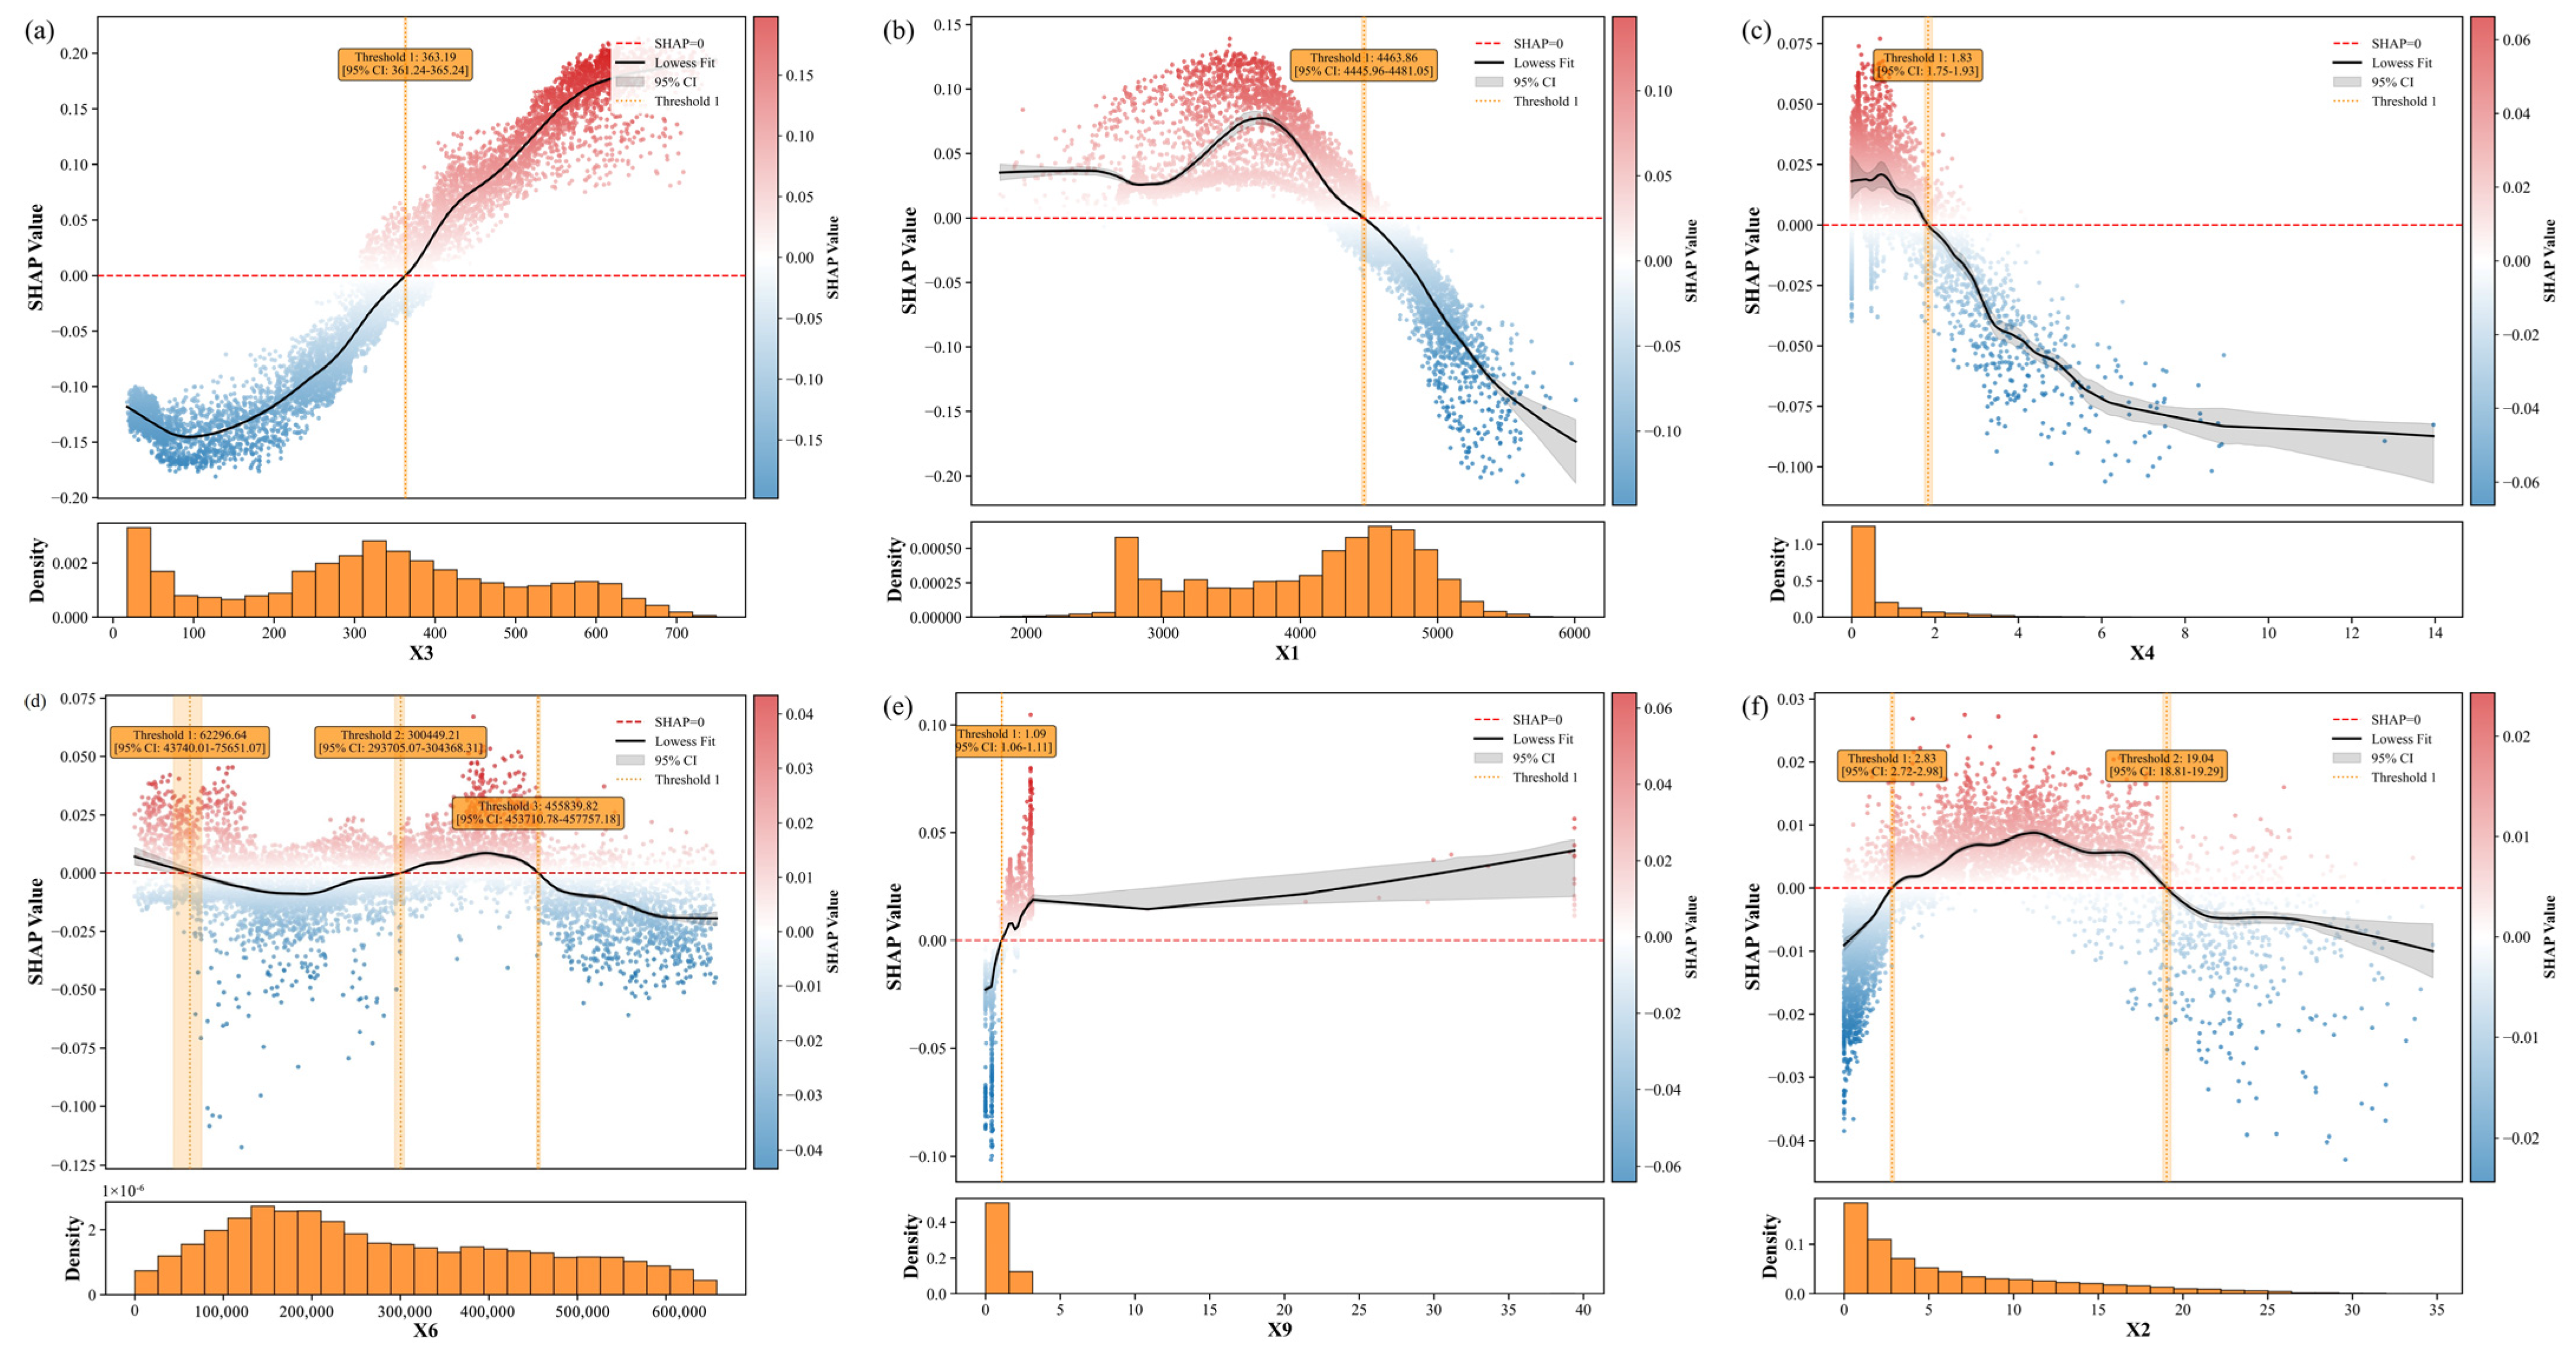
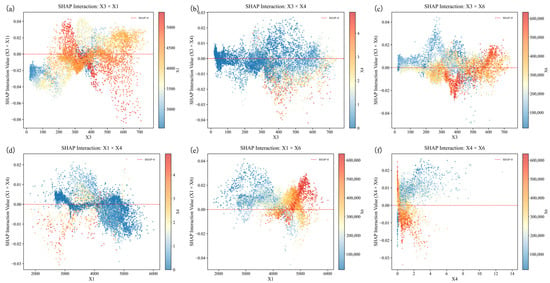
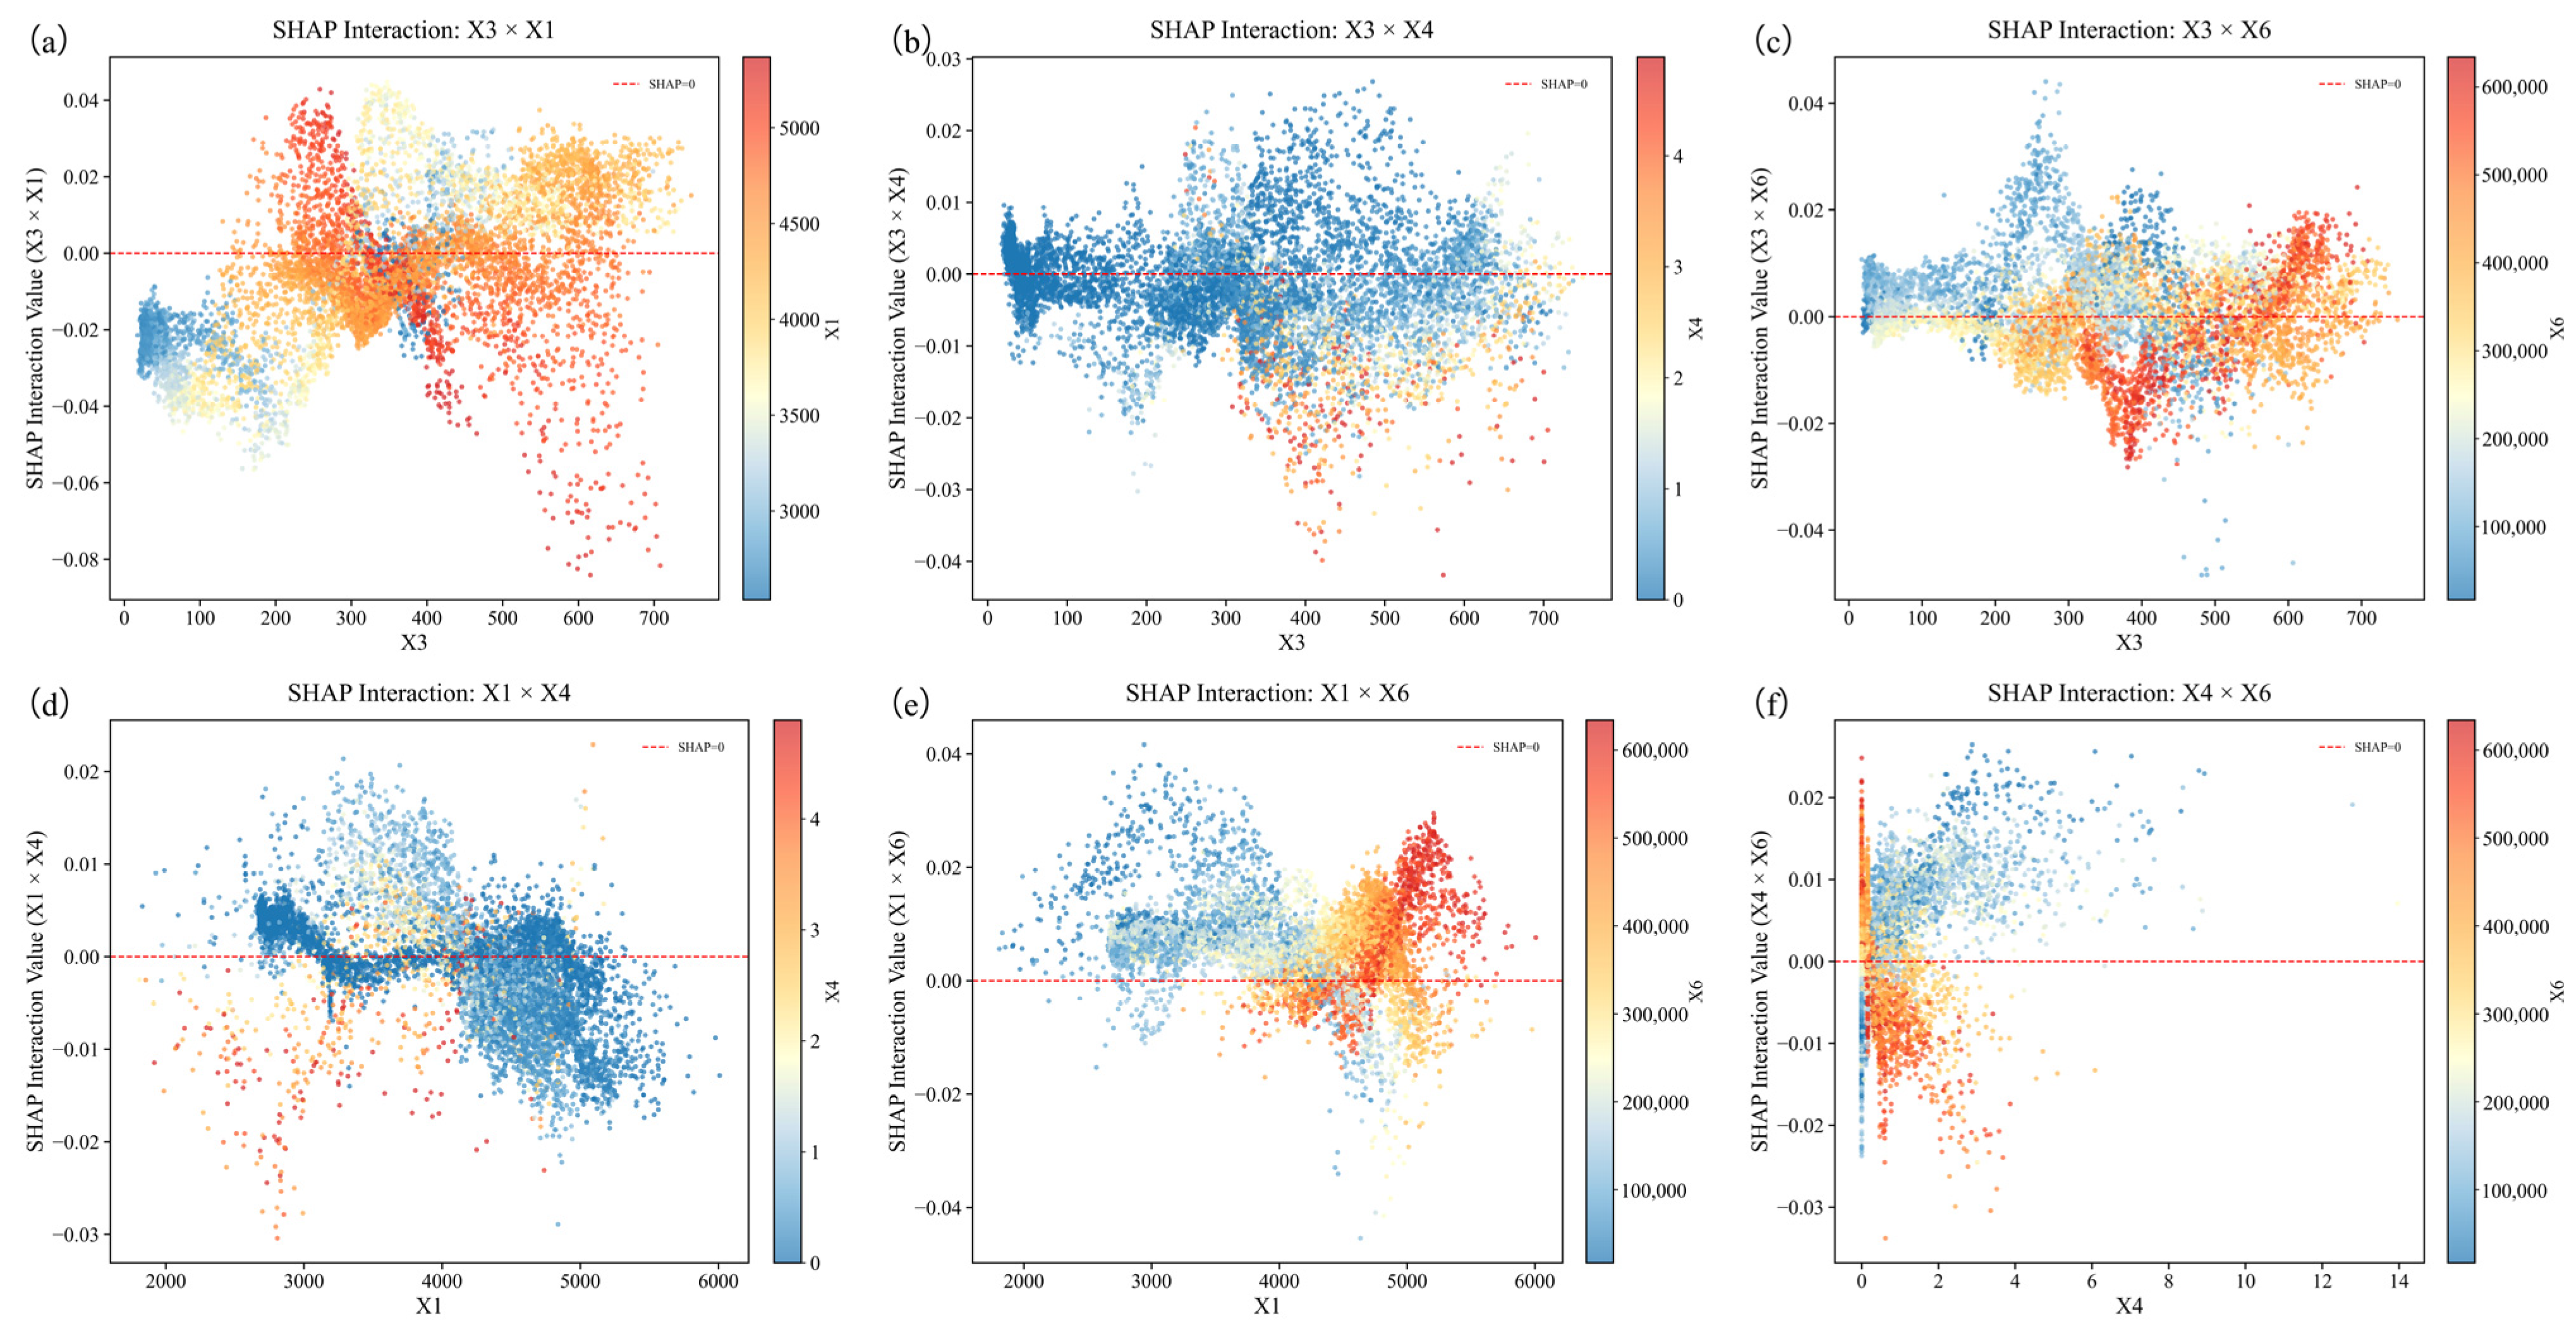
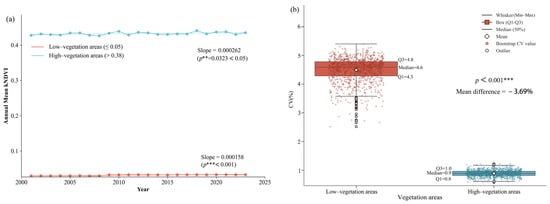
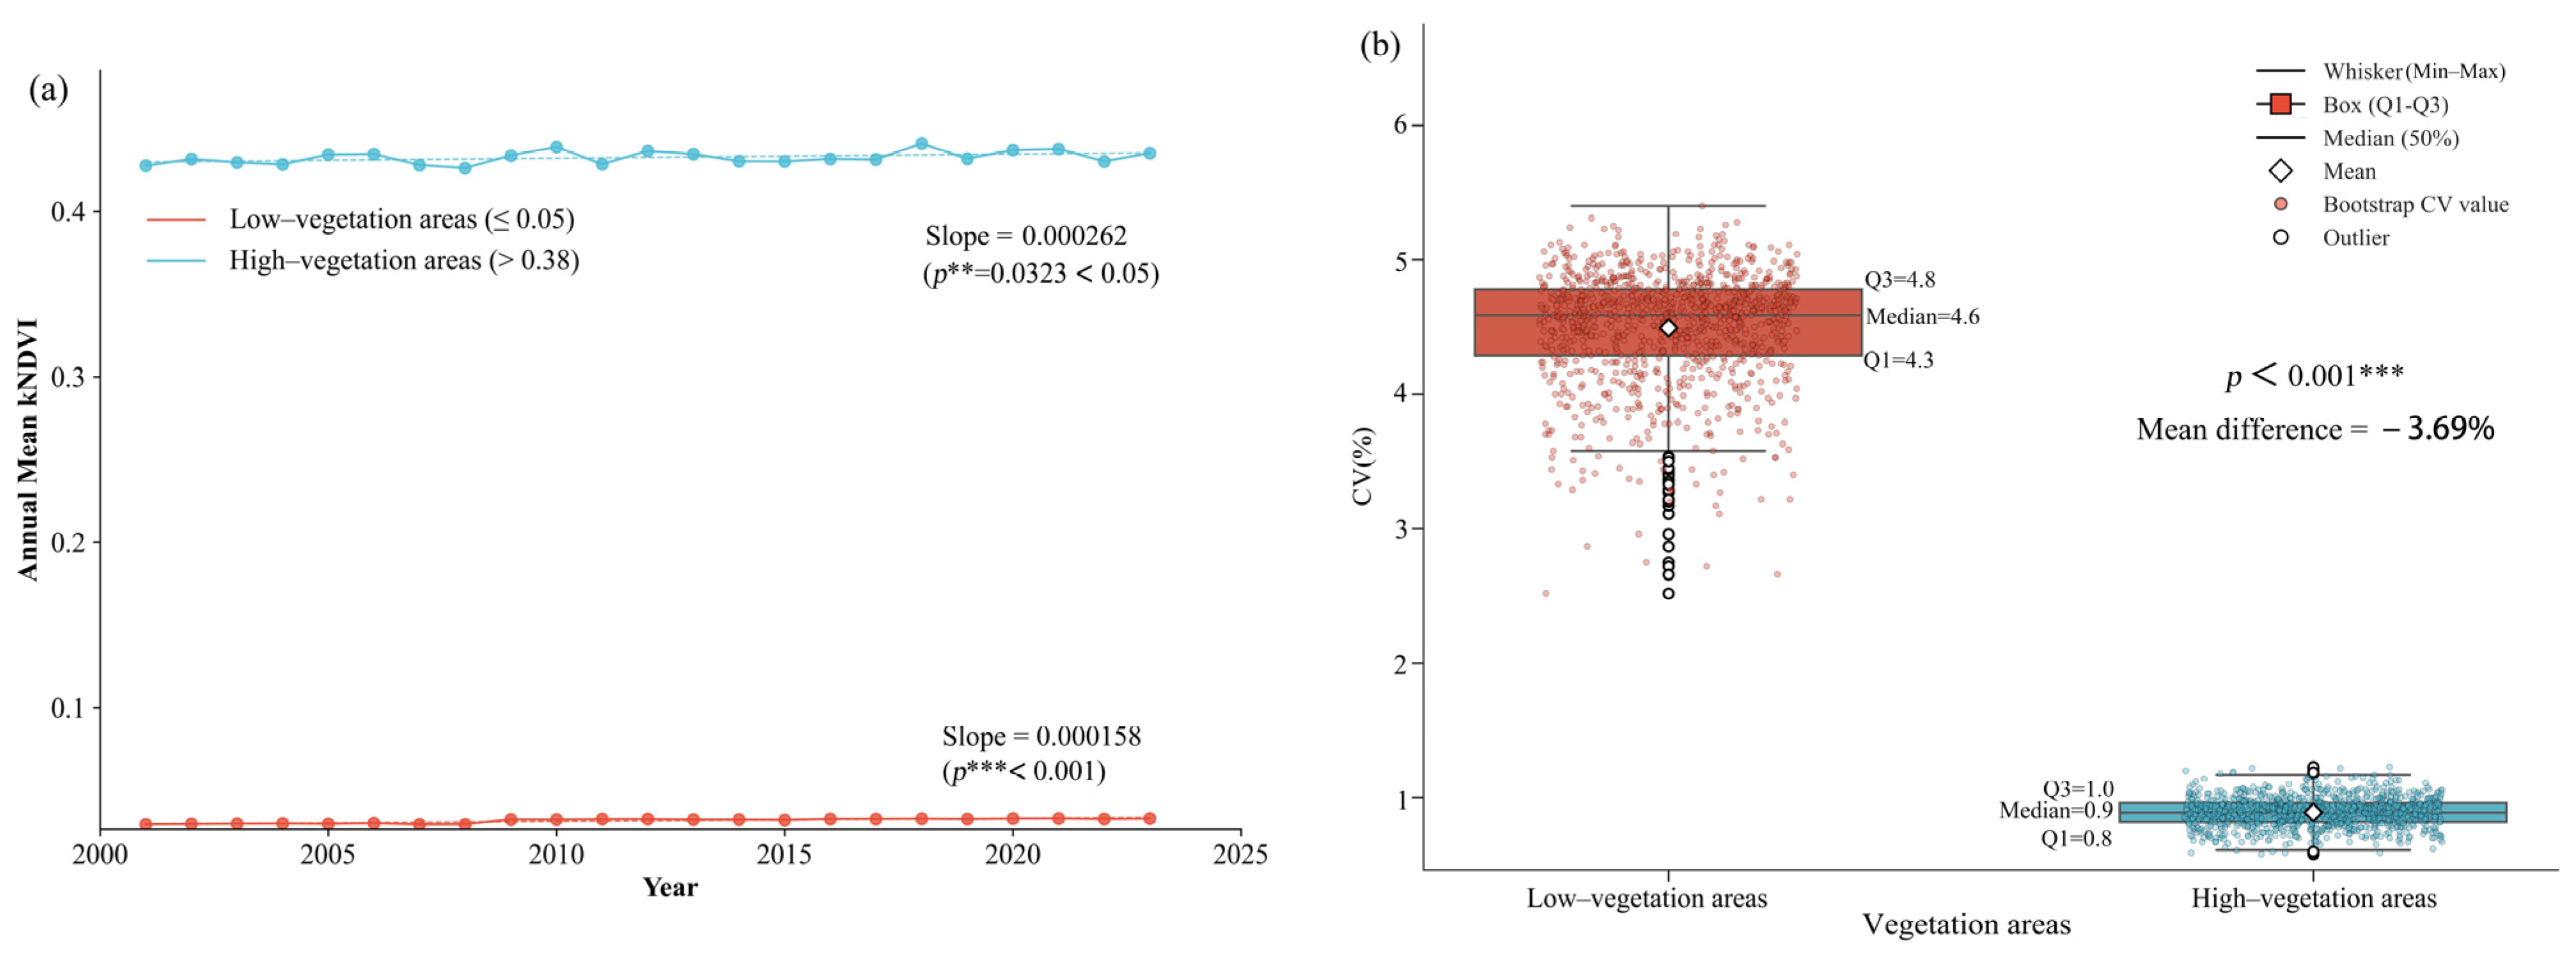

Disclaimer/Publisher’s Note: The statements, opinions and data contained in all publications are solely those of the individual author(s) and contributor(s) and not of MDPI and/or the editor(s). MDPI and/or the editor(s) disclaim responsibility for any injury to people or property resulting from any ideas, methods, instructions or products referred to in the content. |
© 2026 by the authors. Licensee MDPI, Basel, Switzerland. This article is an open access article distributed under the terms and conditions of the Creative Commons Attribution (CC BY) license.