Article

Construction and Empirical Study of Evaluation System of IST Development Potential in Heilongjiang Province Based on Multi-Source Heterogeneous Data


1
School of Architecture and Design, Harbin Institute of Technology, Harbin 150006, China
2
Key Laboratory of Cold Region Urban and Rural Human Settlement Environment Science and Technology, Ministry of Industry and Information Technology, Harbin 150006, China
*
Author to whom correspondence should be addressed.
Land 2026, 15(2), 337; https://doi.org/10.3390/land15020337
Submission received: 30 December 2025 / Revised: 7 February 2026 / Accepted: 9 February 2026 / Published: 16 February 2026
(This article belongs to the Section Land Planning and Landscape Architecture)

Abstract

Against the backdrop of rapid development in the IST industry, addressing issues such as regional homogeneity and uneven spatiotemporal development requires scientific identification and analysis of related resources to support sustainable regional IST development and promote high-quality regional economic growth. This study proposes a framework based on “policy orientation–theoretical support–regional adaptation,” utilizing machine learning to construct a multi-dimensional evaluation index system for IST development potential. By combining subjective and objective criteria to determine indicator weights, a scientific evaluation system is established, with visual analysis conducted through Geographic Information System (GIS). The research selects 22 indicator factors across four dimensions: natural environmental suitability, socio-economic support capacity, regional transportation accessibility, and tourism appeal. Through weighted superposition analysis, it achieves visual representation of spatial differentiation characteristics in the development potential levels of IST in Heilongjiang Province. Results demonstrate a distinct “V”-shaped distribution of high development potential, primarily concentrated in the Greater Khingan Range region, Harbin–Mudanjiang border zone, and Jiamusi, with gradual decline from the core “V”-shaped area to both sides. The proposed evaluation index system provides scientific quantitative decision-making support for regional IST planning, and this methodology also holds reference value for evaluating other tourism industry developments.

1. Introduction

Ice and Snow Tourism (IST) [1], a form of ecotourism, combines cultural immersion in ice and snow traditions with winter sports and leisure activities. Centered on unique ice and snow resources, it offers immersive experiences that are highly participatory, engaging, and thrilling [2,3,4].
As a distinctive type of tourism, IST started relatively late in China but developed rapidly. In 1992, the former National Tourism Administration and the Civil Aviation Administration of China jointly held the “China Friendship Tour Year,” which for the first time listed “ice and snow scenery tours” as one of the fourteen specialized tourism categories. In 1995, the first National Skiing Symposium was held in Jilin Province, sparking nationwide enthusiasm for IST [5]. Early IST was mainly concentrated in the three northeastern provinces and Xinjiang, regions rich in natural ice and snow resources, focusing on skiing and ice sculpture sightseeing, with clientele primarily consisting of professional enthusiasts or local tourists, resulting in a relatively small market scale. The preparation and hosting of the 2022 Beijing Winter Olympics became a pivotal turning point, marking a new phase in China’s IST development from event-driven to market-driven. Throughout this process, the northeastern region, leveraging its unique natural endowments and regional structural advantages, has formed an ice and snow cultural symbol and economic development model, embodying the concept that “ice and snow are also golden mountains and silver mountains”. As one of China’s key winter tourism destinations, Heilongjiang Province has consistently attracted visitors nationwide through signature attractions like Harbin Ice and Snow World, the International Snow Sculpture Festival, Ice Sculpture Festival, and Snow Expo [6]. According to statistics from the Heilongjiang Provincial Department of Culture and Tourism, the province received 120 million tourist visits from November 2023 to February 2024, generating 171.197 billion yuan in tourism revenue. Harbin City alone welcomed 87.438 million visitors and generated 124.89 billion yuan in tourism revenue. While summer tourism revenue reached 58.32 billion yuan in 2023, winter tourism revenue was 2.93 times higher, highlighting significant imbalances in seasonal tourism development. This study focuses on Heilongjiang not only for its unique natural resources but also due to the critical and widespread challenges in its IST sector. Evaluating the province’s tourism potential provides scientific insights and solutions to regional challenges, driving sustainable development in this industry.
The evaluation of IST resources has been explored since the 1950s within interdisciplinary fields, including geography, tourism studies, and sociology. Early research primarily utilized psychological preferences and visual quality assessments to evaluate natural landscapes. Subsequently, a computer-based visual quality evaluation system for landscapes emerged, evolving toward quantitative approaches. Mature analytical frameworks were established through methodologies such as fuzzy mathematics and the Analytic Hierarchy Process (AHP). With the advancement of science and technology and the deepening of research, studies on IST have expanded from focusing on ecological carrying capacity [7] to examining detailed aspects, such as plant and soil [8], animal communities, and site water resources [9]. These studies have further evolved to explore the impacts of climate change on resources [10,11,12] and ski tourism [13], as well as factors influencing tourist experiences [10,12,14], the suitability of IST resources [15], climate suitability [16], tourism development suitability [17], and the application of digital technologies in IST development [18,19,20]. The research approach has gradually shifted from questionnaire surveys [21] to a combination of remote sensing data analysis [22,23], processing UGC data from online platforms [24,25,26], and machine learning-assisted research [27,28,29]. The research subjects include IST bases [30], scenic areas [31], ice and snow sports resources [32], IST products [33], and popular IST regions [34,35,36,37,38,39,40]. The evaluation of existing ice and snow resources has laid a foundation for the development of IST, but the research on Heilongjiang Province mainly focuses on the evaluation of resource endowment and regional differentiation and lacks the systematic evaluation of integrating multi-source data and spatial intuitive expression.
Therefore, this study focuses on Heilongjiang Province as the primary research area, proposing a framework for constructing an evaluation index system based on “policy orientation–theoretical support–regional adaptation”. Utilizing machine deep learning, we identify four dimensions—natural environment, socio-economic conditions, location and transportation, and tourist appeal—as the criterion layer. Building upon existing research and regional development characteristics, we integrate Large Language Models (LLMs) to establish the indicator layer and element layer of the evaluation system. This results in a comprehensive evaluation framework comprising 4 criterion layers, 6 indicator layers, and 22 element layers for assessing the development potential of IST. By employing GIS spatial analysis technology, we integrate multi-source heterogeneous data, including meteorological data, topographic information, transportation infrastructure distribution, and socio-economic indicators. Through spatial analysis and comprehensive evaluation models, we conduct in-depth exploration of the province’s ice and snow resources. Spatial visualization techniques are applied to analyze regional disparities in tourism development potential, identifying key and secondary development zones for IST in Heilongjiang. This study provides theoretical foundations for scientific planning of IST, promotes coordinated regional development, and drives high-quality growth of the ice and snow economy. The research consists of two main components: (1) reviewing existing studies, integrating foundational data on natural environment, socio-economic conditions, location and transportation, and tourist appeal, and constructing an evaluation system based on regional realities; (2) conducting a systematic assessment of IST development potential using Heilongjiang Province as a case study, proposing practical strategies based on evaluation results to provide scientific guidance for regional development, thereby advancing the high-quality development of IST in Heilongjiang.

2. Materials and Methods

2.1. Empirical Region

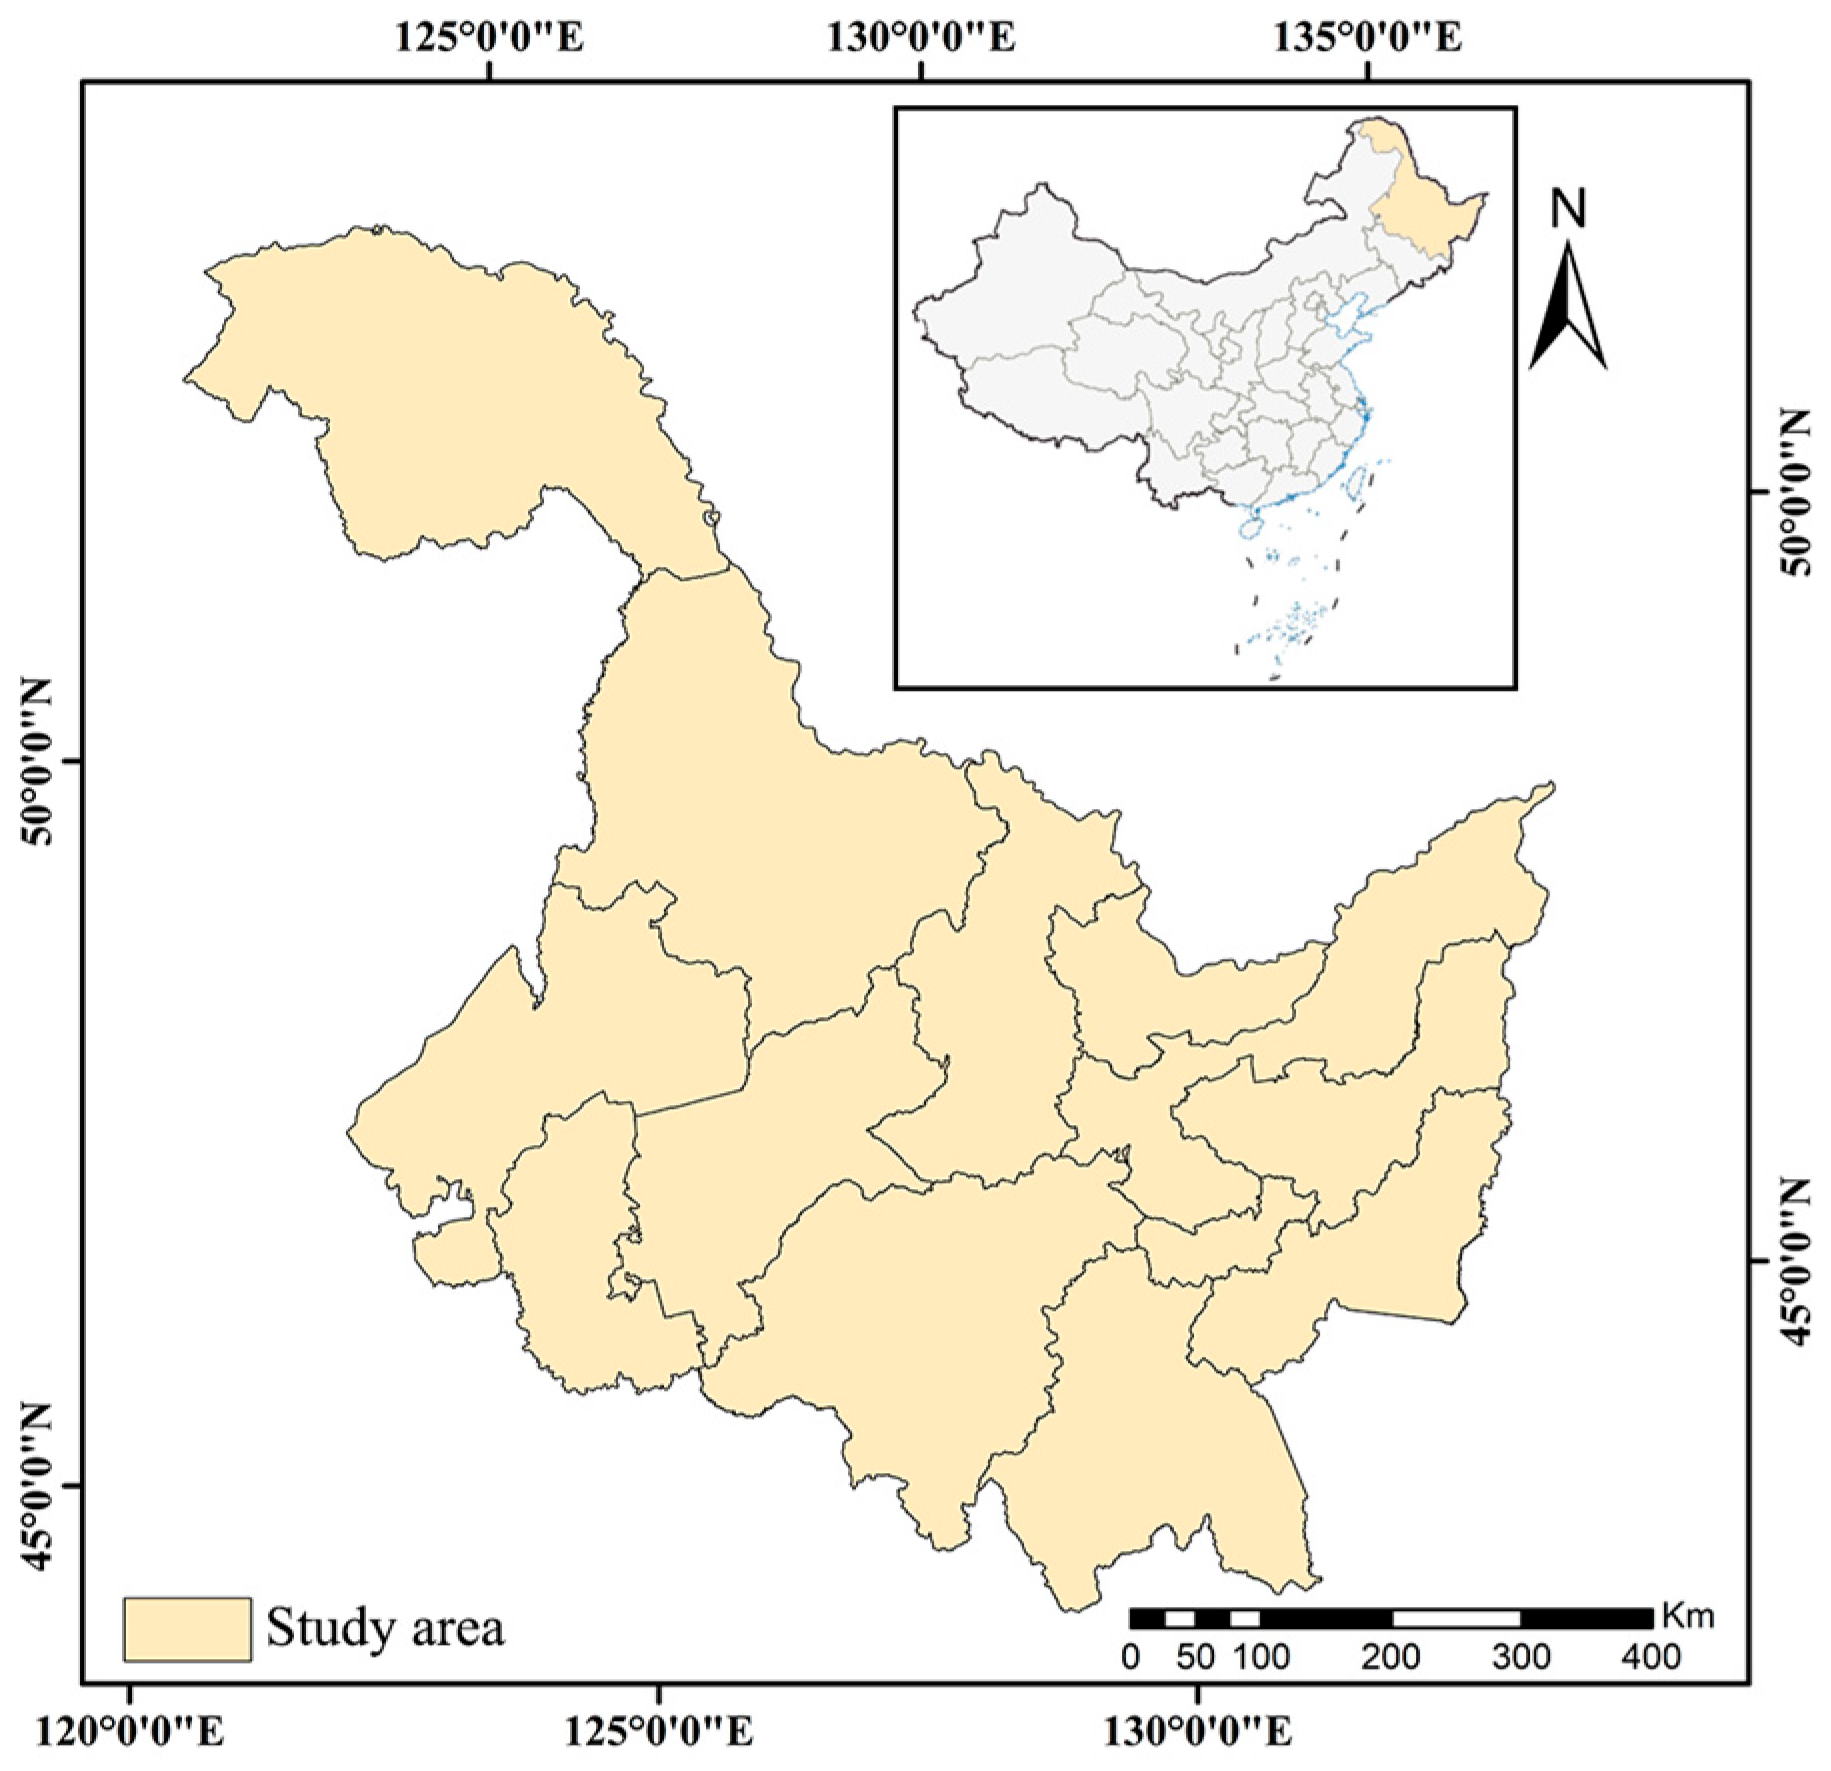
This study takes Heilongjiang Province in northeastern China (43°25′~53°33′ north latitude, 121°11′~135°05′ east longitude) as the research object (Figure 1). With a total area of approximately 473,000 square kilometers, Heilongjiang Province is the provincial-level administrative region with the highest latitude and easternmost longitude in China. Renowned for its high-quality winter tourism resources, the province has actively responded to the national development concept of “ice and snow are also gold and silver mountains,” establishing winter tourism as an important component of its regional development strategy and continuously advancing the construction of an ice and snow economy industrial system. Significant differences in socioeconomic and infrastructure conditions exist among cities and counties within the province, facilitating the use of multi-source heterogeneous data to assess spatial heterogeneity characteristics. In summary, Heilongjiang’s unique geographical location and natural resources can provide crucial basic information for this study and serve as a reference for evaluating the development potential of IST in similar regions.

2.2. Data Sources and Preprocessing

This study primarily examines natural elements and urban infrastructure factors. The data include snow cover, temperature, topography, regional population, local economic development level, infrastructure construction, accessibility, and tourism infrastructure. The data cover the year 2023, with some averages from the past decade. The administrative boundary map was sourced from the China Standard Map Service (CSMS); the digital elevation data was obtained from the GEBCO website hosted by the UK Oceanographic Data Centre (BODC) [41]; the slope and aspect information were derived from DEM data analysis. Existing climate research has conducted a point-by-point comparative analysis of nearly 30 years of climate data from 31 meteorological stations within the province. The results indicate that Heilongjiang has recently experienced occasional, low-probability abrupt climate changes, although the overall trend remains relatively stable [42]. By extracting and averaging the climate data from the past decade, it is possible to more accurately reflect the current potential for climate resource development in Heilongjiang Province. Snow depth, snow cover, temperature, and other data were sourced from the ERA5-Land dataset [43]. The period from December to February of the following year was selected as the main timeframe, with the dataset downloaded monthly. The Xarray tool was used to calculate the average values of the data according to the snow season, completing the merging of time series. For socioeconomic aspects, regional population size, regional economic development level, tertiary industry proportion, and infrastructure construction conditions, including toilets, roads, and green spaces, were all sourced from the Heilongjiang Provincial Bureau of Statistics. The acquired data region codes were matched with attributes in the geospatial data, linking the data information with the geospatial data (WGS_1984_UTM_zone_50N). The information on Grade A scenic spots in the tourism industry mainly comes from statistical data provided by the Heilongjiang Provincial Department of Culture and Tourism. This includes both scenic viewing sites and representative ice and snow cultural attractions, as well as cultural heritage-related sites, indirectly reflecting cultural and other intangible indicators through quantitative data (Table 1).

2.3. Research Methods

2.3.1. Overall Method Framework

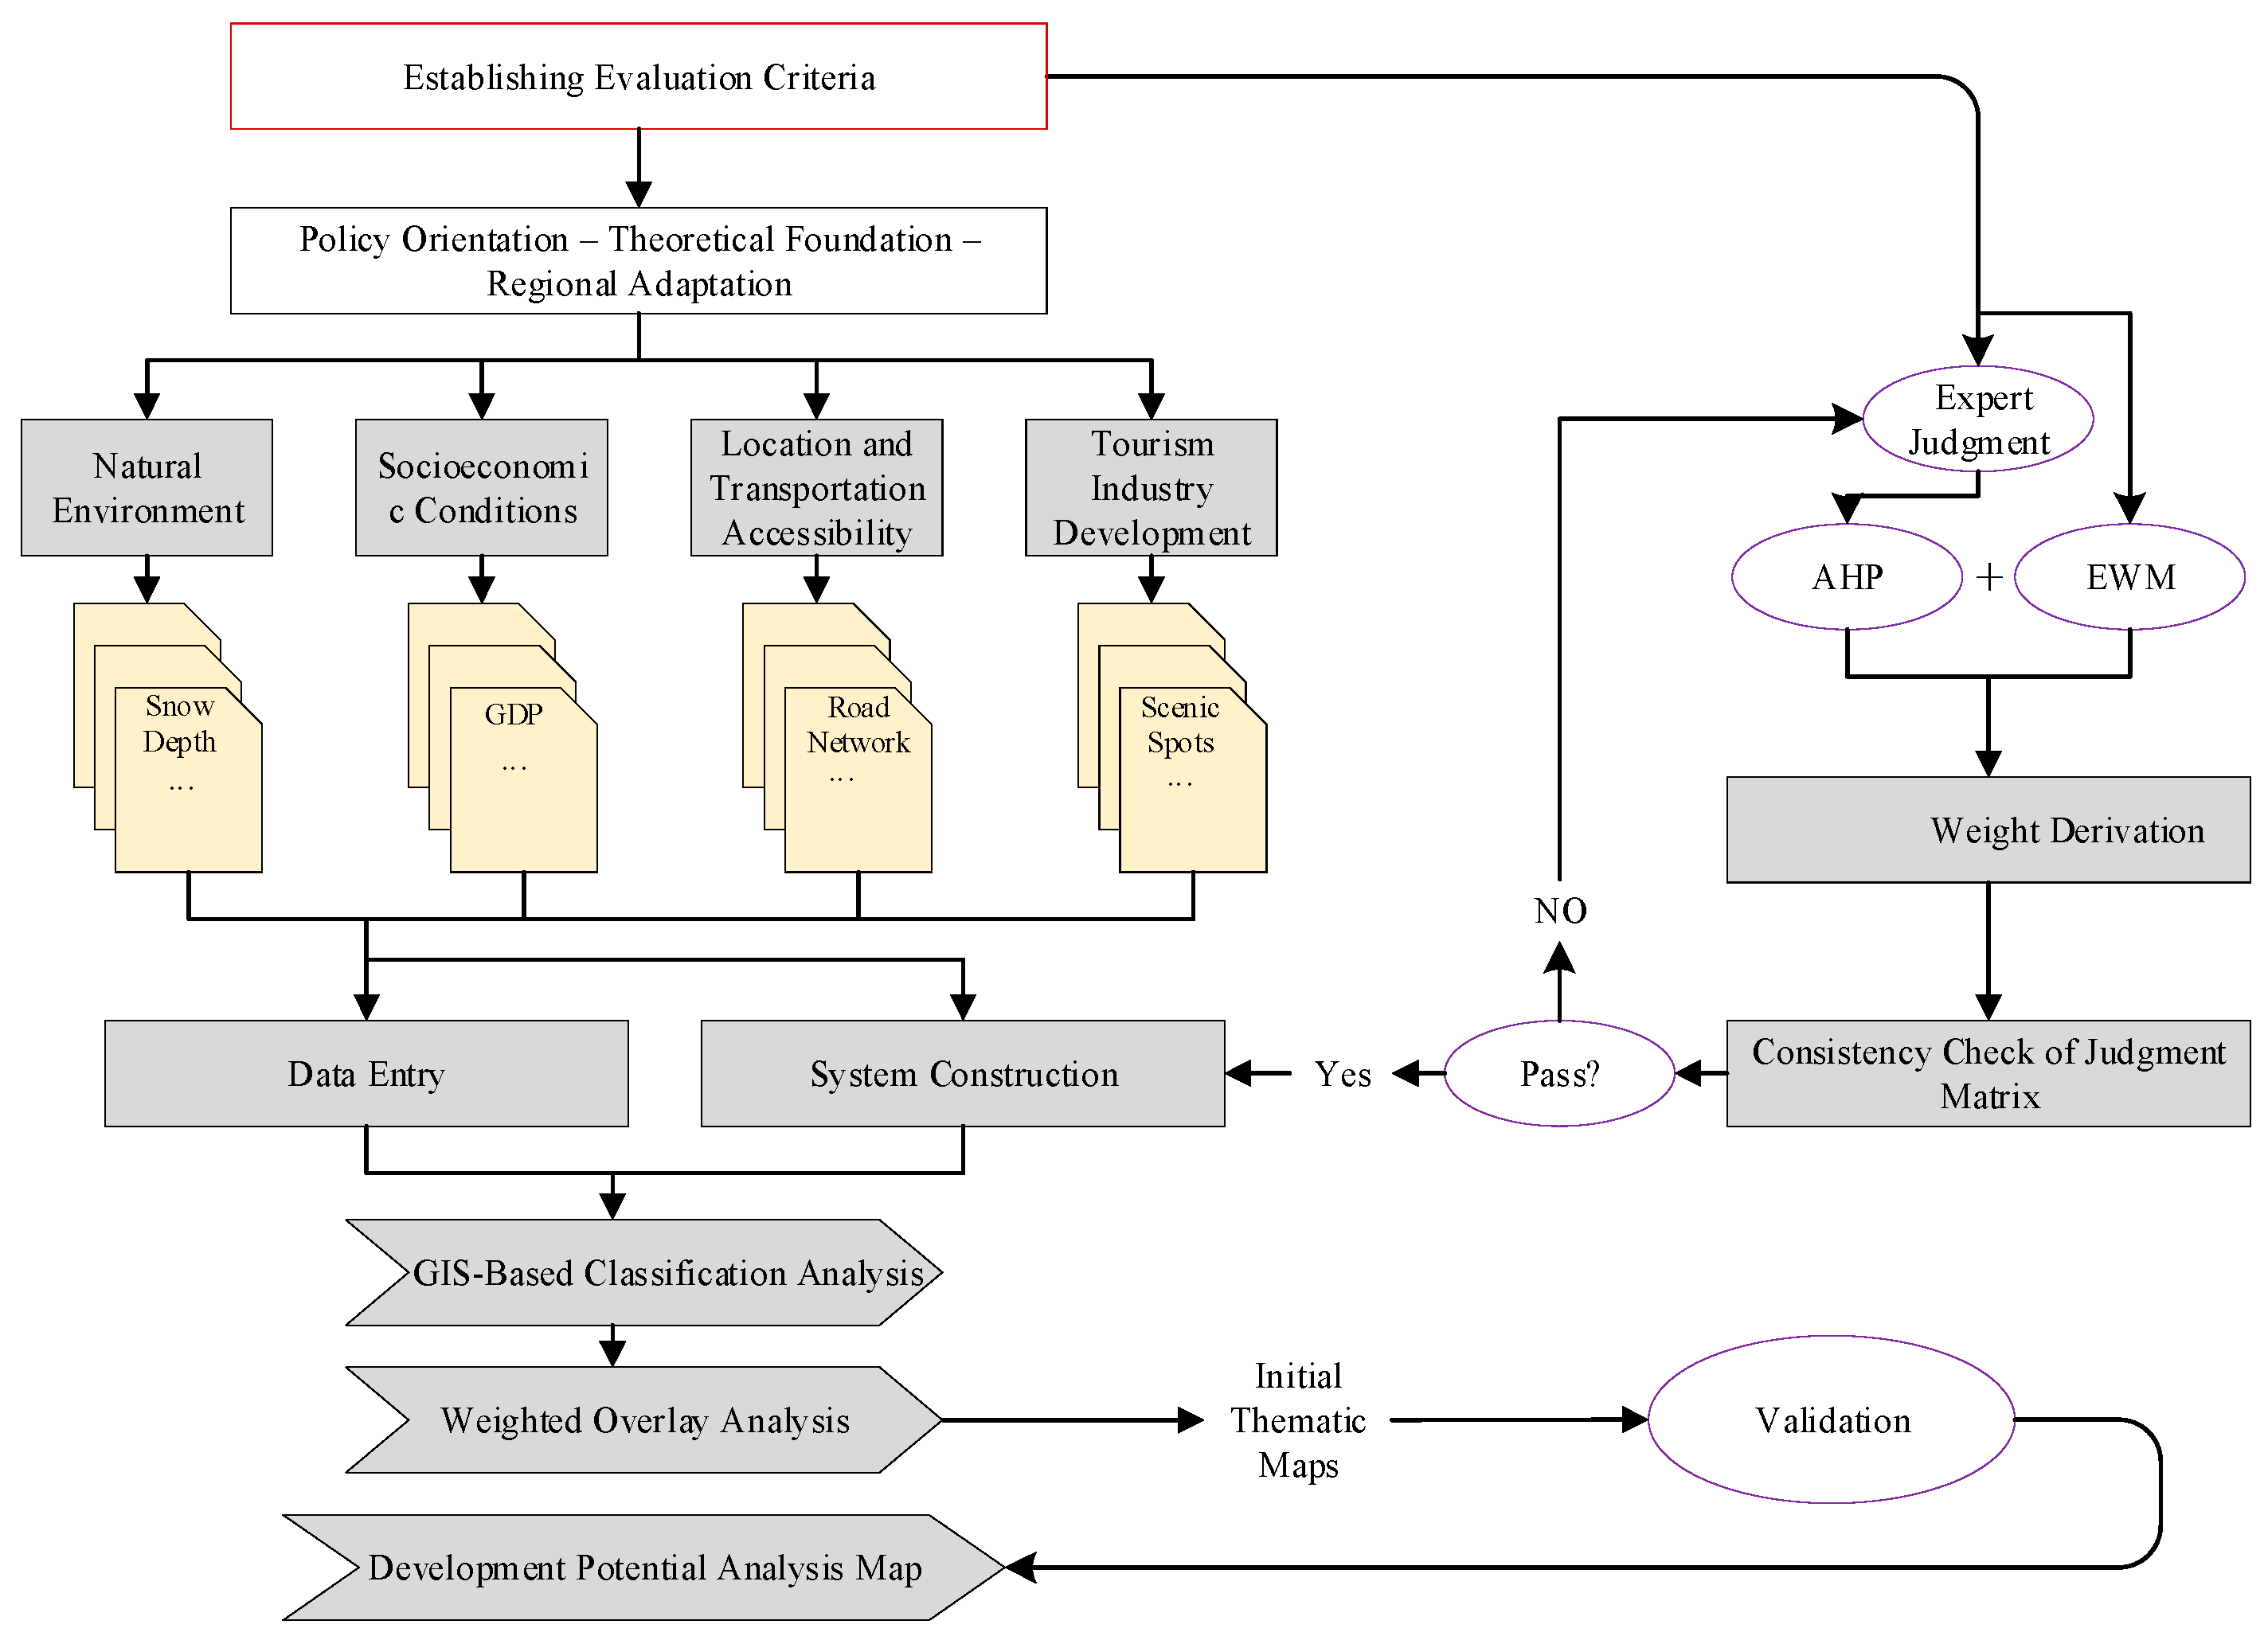
This study employed a Multi-Criteria Evaluation (MCE) model to systematically assess the development potential of IST resources in Heilongjiang Province. The research followed a technical framework of “system construction–data registration–result analysis”, with the specific workflow as follows: Step 1: Based on the “policy guidance–theoretical support–regional adaptation” framework, key factors influencing IST development potential were identified to establish an evaluation index system. Subsequently, the Analytic Hierarchy Process (AHP) and Entropy Weight Method (EWM) were combined to determine comprehensive weights for each factor, constructing an evaluation system for IST development potential. Step 2: Multi-source heterogeneous data underwent registration processing, with GIS technology applied to rasterize data, converting each factor’s data into raster layers and performing preliminary classification. Step 3: Through weighted overlay analysis, comprehensive evaluation results of IST resource development potential were obtained (Figure 2). Based on these results, the spatial distribution of development potential is classified, clearly delineating potential levels across different regions within Heilongjiang Province.

2.3.2. Construction of Evaluation Index System

  • Construction of Evaluation Criteria: Based on the Topic Cluster Analysis of Policy Texts
To ensure the scientific rigor and policy coherence of the evaluation system for IST resource development potential, this study utilized Python 3.12 web scraping to collect policies related to IST, resources, economy, and sports from national, provincial, and municipal levels. Combined with manual screening, we established a policy corpus and constructed a criterion layer based on it. Considering the variability of policies, this study, when selecting policy texts, takes into account both the diversity of their levels and the extent of their temporal coverage. At the same time, the promulgation of national-level policies can guide provincial and municipal policies for a certain period, thereby ensuring that the overall orientation of the policy texts we select aligns with future development trends. Subsequently, unsupervised clustering was performed using the Latent Dirichlet Allocation (LDA) topic model to identify latent topic distributions in policy documents. Semantic interpretation and manual classification were conducted by integrating topic weightings. Through thematic analysis and integration, four primary dimensions were distilled: natural environment, socio-economic development, regional transportation, and tourist appeal. These four dimensions serve as critical components of the criterion layer, reflecting key development priorities emphasized in policy documents while providing logical foundations for constructing subsequent indicator and element layers.
2.
Evaluation Elements Screening: Classification of Elements in Theoretical Research and Large Language Models
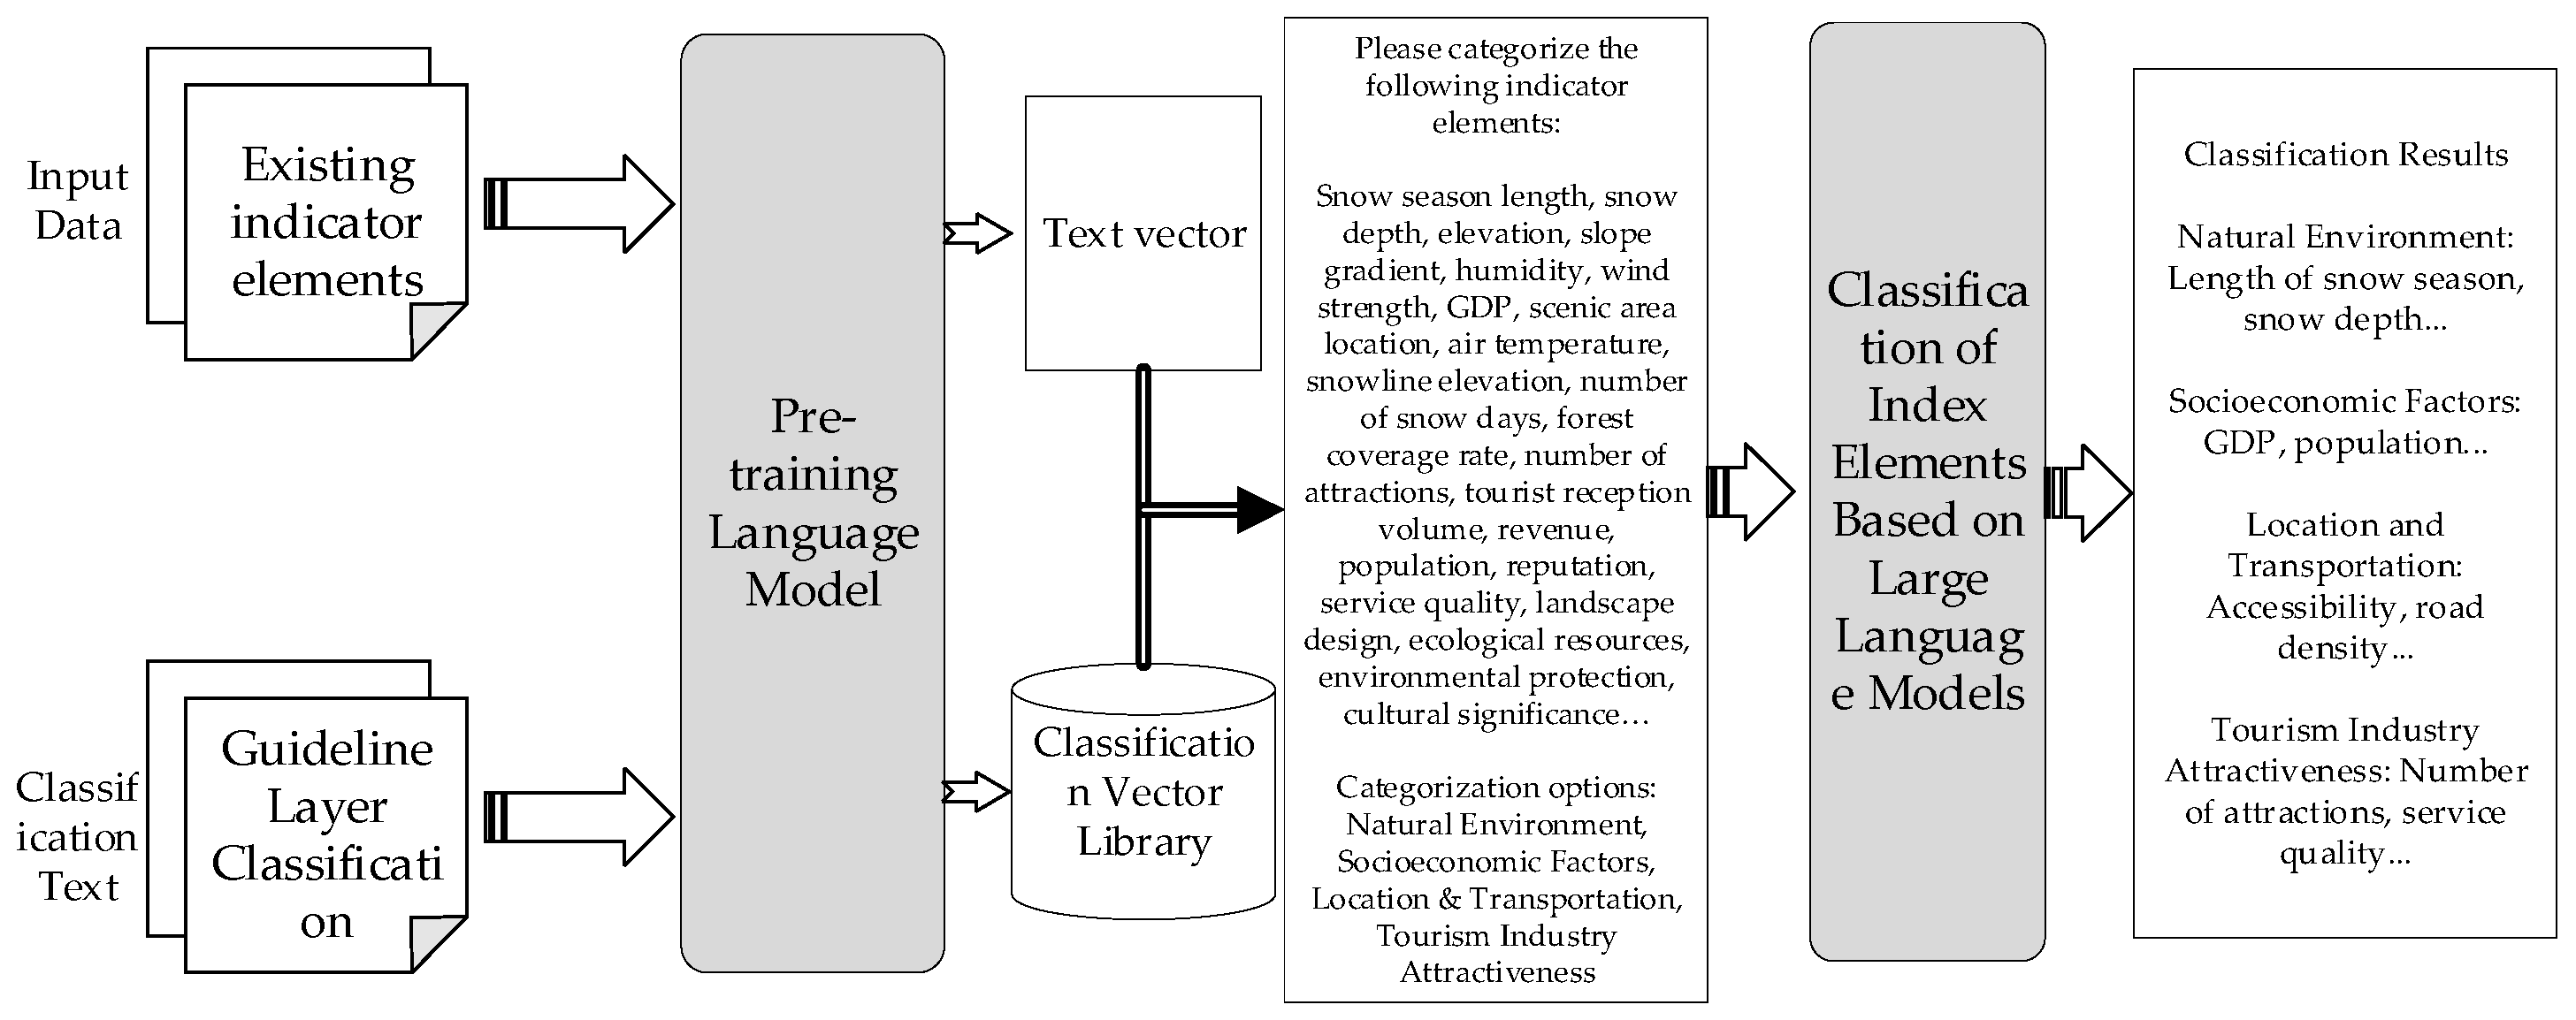
Building upon the established criterion framework, this study systematically reviews widely adopted evaluation elements in the existing literature to clarify specific assessment dimensions for IST development. A preliminary element database was constructed, encompassing multiple dimensions including resource conditions, location factors, socio-economic conditions, and industrial development. To enhance the scientific rigor and classification efficiency of element categorization while ensuring objectivity of the evaluation system, the research introduced Large Language Models (LLMs) as auxiliary tools (Figure 3). By integrating the aforementioned criterion framework, the model performed classification training and semantic matching analysis on the element database. Through automated annotation and categorization of semantic relationships between input elements and the criterion framework, multiple evaluation elements were systematically consolidated to ultimately refine and construct the indicator layer content system. Although the study initially considered certain “soft indicators”, such as folk activities and brand recognition, these were excluded due to their subjective measurement methods and substitutability with tourist appeal-related elements. During indicator selection, the feasibility and compatibility of these components were thoroughly evaluated, leading to their omission in the final framework.
3.
Establishment of the index system: Optimization of Expert Selection Based on Delphi Method
After completing the initial construction of the indicator layer, this study introduced the Delphi method to refine and validate the categorized indicators, aiming to enhance the practical applicability of the evaluation system. By designing expert questionnaires, we invited specialists from fields such as tourism geography, regional planning, and resource environment to assess the representativeness, operability, and importance of each indicator. Through multiple rounds of anonymous surveys and synthesizing expert feedback, we gradually reached a consensus. A total of 25 questionnaires were distributed, with 23 returned. Participants included professors and doctoral candidates specializing in all-for-one tourism and winter sports tourism, master’s students in ecology-related fields, tourism professionals, and in-house graduate students in Heilongjiang Province. After synthesizing opinions from multiple experts, we ultimately selected core indicators that were representative in both theoretical foundations and practical applications, forming the final indicator system adopted in this study.

2.3.3. Grading of Factor Scores

The research data are mostly unevenly distributed, so a combination of the natural breaks method and equal interval classification was used to grade each factor (except some direct assignment of indicators according to the research). The grading of development potential was carried out by referring to the current regulations and literature research (see Table 2).

2.3.4. Establishment of Indicator Weights Combining Qualitative and Quantitative Approaches

In this study, the establishment of indicator weights combines the Analytic Hierarchy Process (AHP) and the Entropy Weight Method (EWM). Initially, the AHP was used to determine subjective weights, but since it primarily relies on expert scoring, it remains somewhat subjective even after accounting for various influencing factors. To mitigate this, the EWM, which uses objective computational data, was integrated with the AHP to reduce errors in the final weight determination, thereby yielding the final indicator weights.
The consistency test formula primarily involves the calculation of CI values and the comparison between CI and RI values, with the specific formulas as follows:
C I = λ max n n 1
C R = C I R I
When CR < 0.1, the consistency test is passed.
The comprehensive weight was calculated using the weighted average method, with the specific formula as follows:
W f i n a l = α W A H P + β W E W M
In the formula W A H P α W E W M β , the Analytic Hierarchy Process (AHP) is used to calculate the weight, with its weight determination factor; the entropy method is used to calculate the weight, with its weight determination factor. To minimize errors, this paper assigned both values as 0.5.
The formula for calculating the objective weight of each indicator using the entropy method is:
E j = k i = 1 n p i j l n ( p i j )
In the formula, pij represents the proportion k = 1/ln(n)of the i-th item under the j-th indicator.
The specific formula for information entropy weight is as follows:
W j = 1 E j

2.3.5. Spatial Rasterization of GIS-Based Indicator System Data

By implementing spatial grid-based processing for geographic information indicator systems, we obtained comprehensive regional spatial data to effectively simulate and analyze the spatial distribution of various development-related indicators across provincial boundaries. This study integrated multi-source heterogeneous data related to natural environment, socio-economic conditions, location–transportation factors, and tourist appeal. Based on data accuracy, we defined 90 m × 90 m as the minimum grid cell, constructing geospatial visualization layers for each indicator. Using GIS rasterization methods, we uniformly converted all 22 indicator datasets into raster format and applied standardized projection (WGS_1984 UTM Zone 50N) for subsequent analysis and visualization. Given the large number of evaluation factors, this study demonstrates spatial processing methods for only a few representative indicators.
  • Accessibility Analysis
Accessibility analysis primarily involved two core steps. First, the existing road traffic network was utilized to construct a topologically structured dataset. Second, based on this dataset, network analysis methods were employed in ArcGIS 10.7 to calculate the shortest path time for each region or raster unit from predefined starting points or service centers, thereby quantifying inter-regional traffic accessibility. This analysis utilized the Shortest Path Accessibility (SPA) model, with the specific formula as follows:
A i = min j ϵ S T i j
The accessibility A i A i i of i a region T i j T i j or i unit j i is the j shortest S time S from the region to the center, which is the set of all centers.
2.
Distribution of Grade A Scenic Areas
The distribution data of A-level scenic spots primarily derives from the “List of A-level Scenic Spots in Heilongjiang Province” published by the Heilongjiang Provincial Department of Culture and Tourism. Scenic spots were classified into different tiers based on their specific attributes in the list. Using Python 3.12, we scraped the latitude and longitude coordinates of each Grade A scenic spot and refined the data with Google Earth. After importing the data into the ArcGIS 10.7 platform, the Kernel Density tool was employed to generate raster maps. The specific formula is as follows:
f x , y = 1 h 2 i = 1 n ω i K d i h
where f x , y denotes the kernel density at location x , y , h represents the search radius of the kernel function, d i is the distance to the i th scenic spot, ω i is the weight of the i th scenic spot, and K is the Gaussian kernel function:
K u = 1 2 π exp 1 2 u 2
3.
Data Overlay Analysis
Data overlay analysis primarily utilized the evaluation framework established in the article, employing the ArcGIS 10.7 platform to aggregate and overlay various data elements with different weights. First, the pre-processed data elements underwent standardized analysis with unified dimensions according to the evaluation grading system, yielding fixed scores such as 1, 3, 5, 7, and 9. Subsequently, the weighted overlay tool was applied to combine each component based on its assigned weight, yielding the final analytical results as shown in the formula below.
S = W i × F i
where Wi is the weight of the i-th evaluation factor, and Fi is the standardized value of the i-th evaluation factor.

3. Results

3.1. Evaluation System Construction

3.1.1. Establishment of the Policy Layer

First, the collected national, provincial, and municipal policy documents (tables) underwent preprocessing, including Chinese word segmentation, stop word removal, synonym normalization, and part-of-speech filtering, followed by the construction of a document-word matrix based on TF-IDF or word frequency.
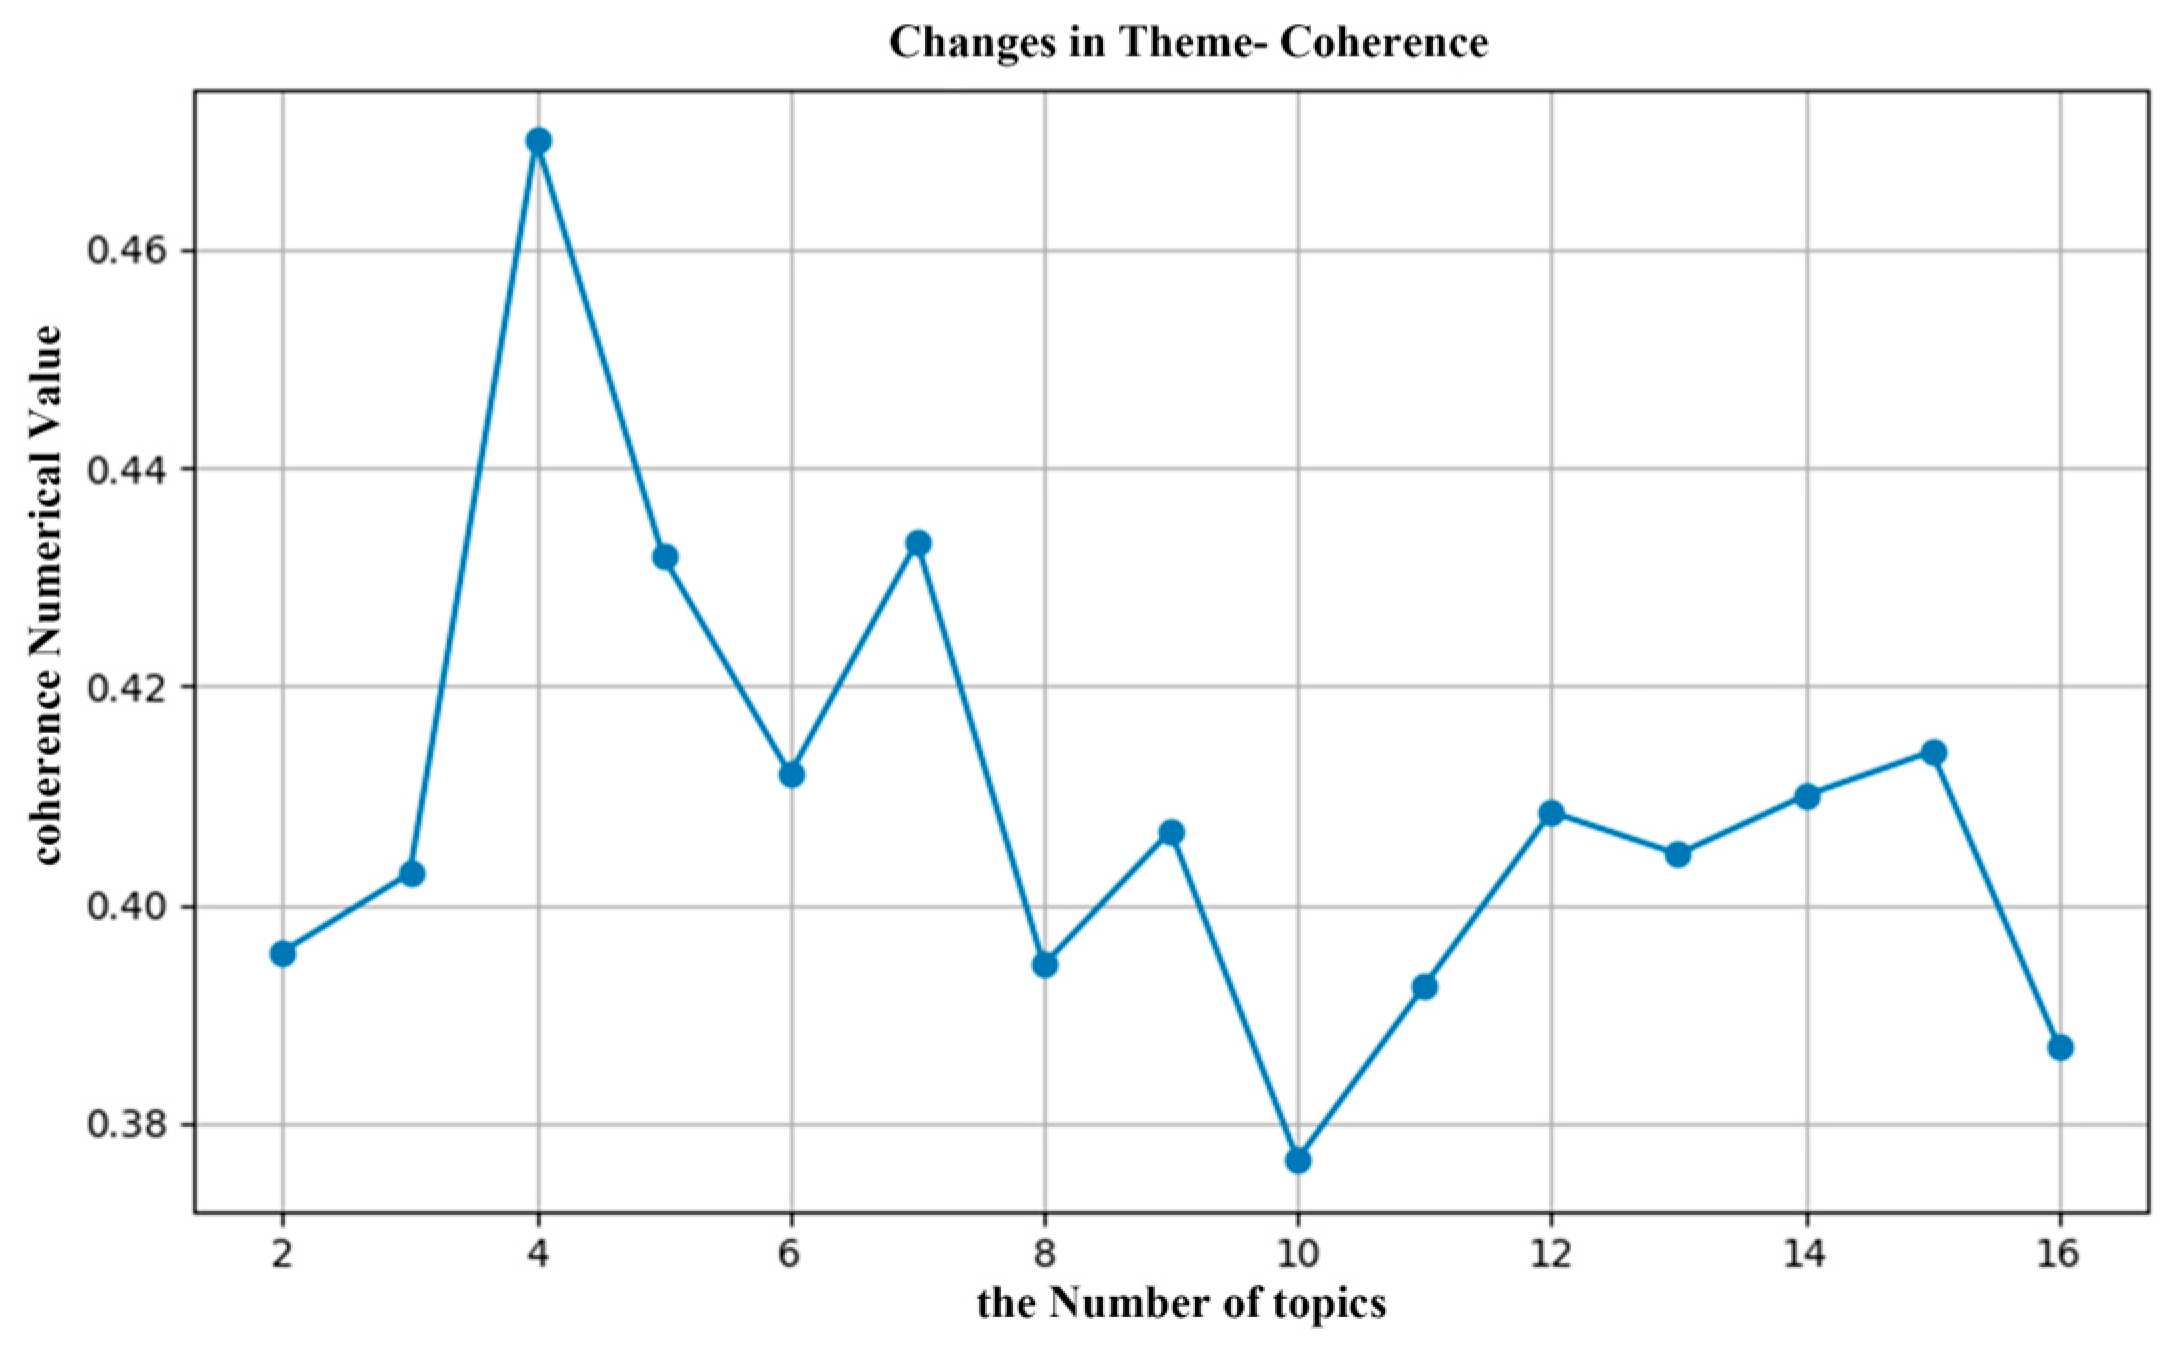
Secondly, multiple thematic value ranges were established (in this study, the ranges were set to 2–16 based on pre-computational results). Using Python 3.12, the LDA model was sequentially run from two topics across these predefined ranges, with Coherence Scores calculated for each thematic group [44]. For consistency metrics, common evaluation indices, such as C-v, C-uci, C-npmi, or UMass, have been widely adopted in existing research. Given that the policy content in this study was in Chinese, the C-v metric, which demonstrates superior stability and adaptability in Chinese texts, was selected. Thirdly, curve plots were generated to visualize how thematic consistency scores varied with thematic counts across different K values, identifying key trends, including score peaks and diminishing marginal improvement thresholds. Finally, combining consistency scores with semantic interpretation effectiveness, the final model parameters were determined by selecting thematic counts that achieved high consistency scores while maintaining thematic differentiation and broad coverage. This validation process effectively eliminated subjectivity in thematic selection, enhancing the LDA model’s applicability and persuasiveness in subsequent text analysis and laying a solid foundation for identifying implicit thematic structures and analyzing policy orientations in policy texts. Specific validation results are presented below (Figure 4):
After conducting consistency checks on the LDA model and analyzing the trend of topic consistency scores across different topic counts, we determined the optimal number of topics to be 4. Setting the LDA model’s topic count (num-topics) to four ensured accurate summarization of core concepts in policy texts while maintaining semantic aggregation and differentiation. Subsequently, we performed keyword recognition and topic content analysis to further explore the semantic depth of policy text themes.
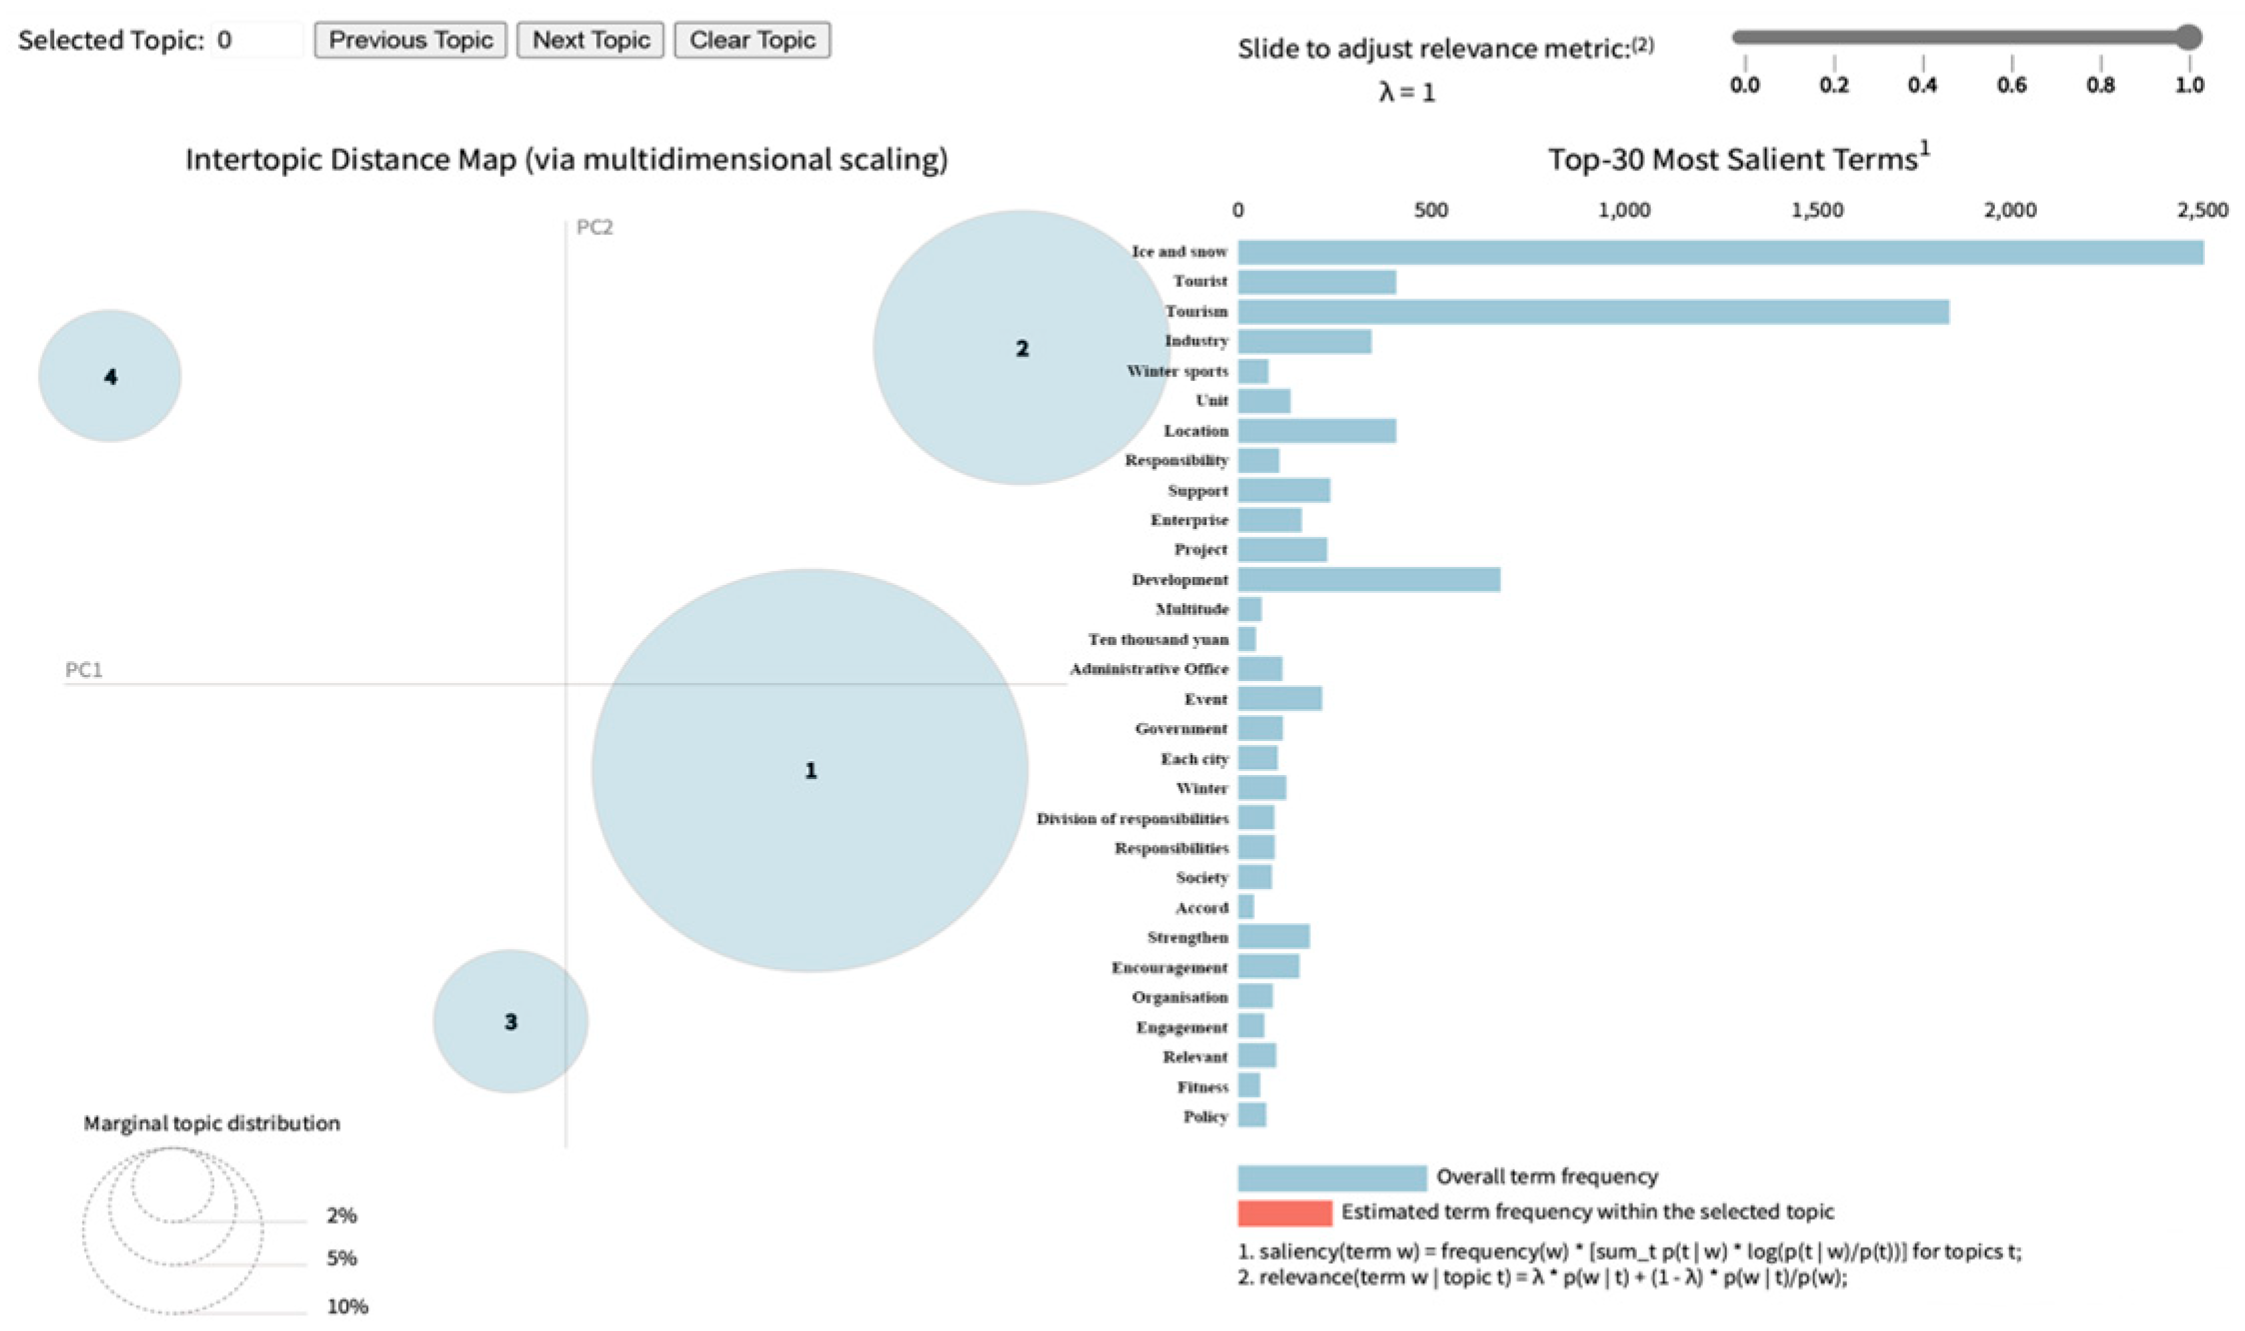
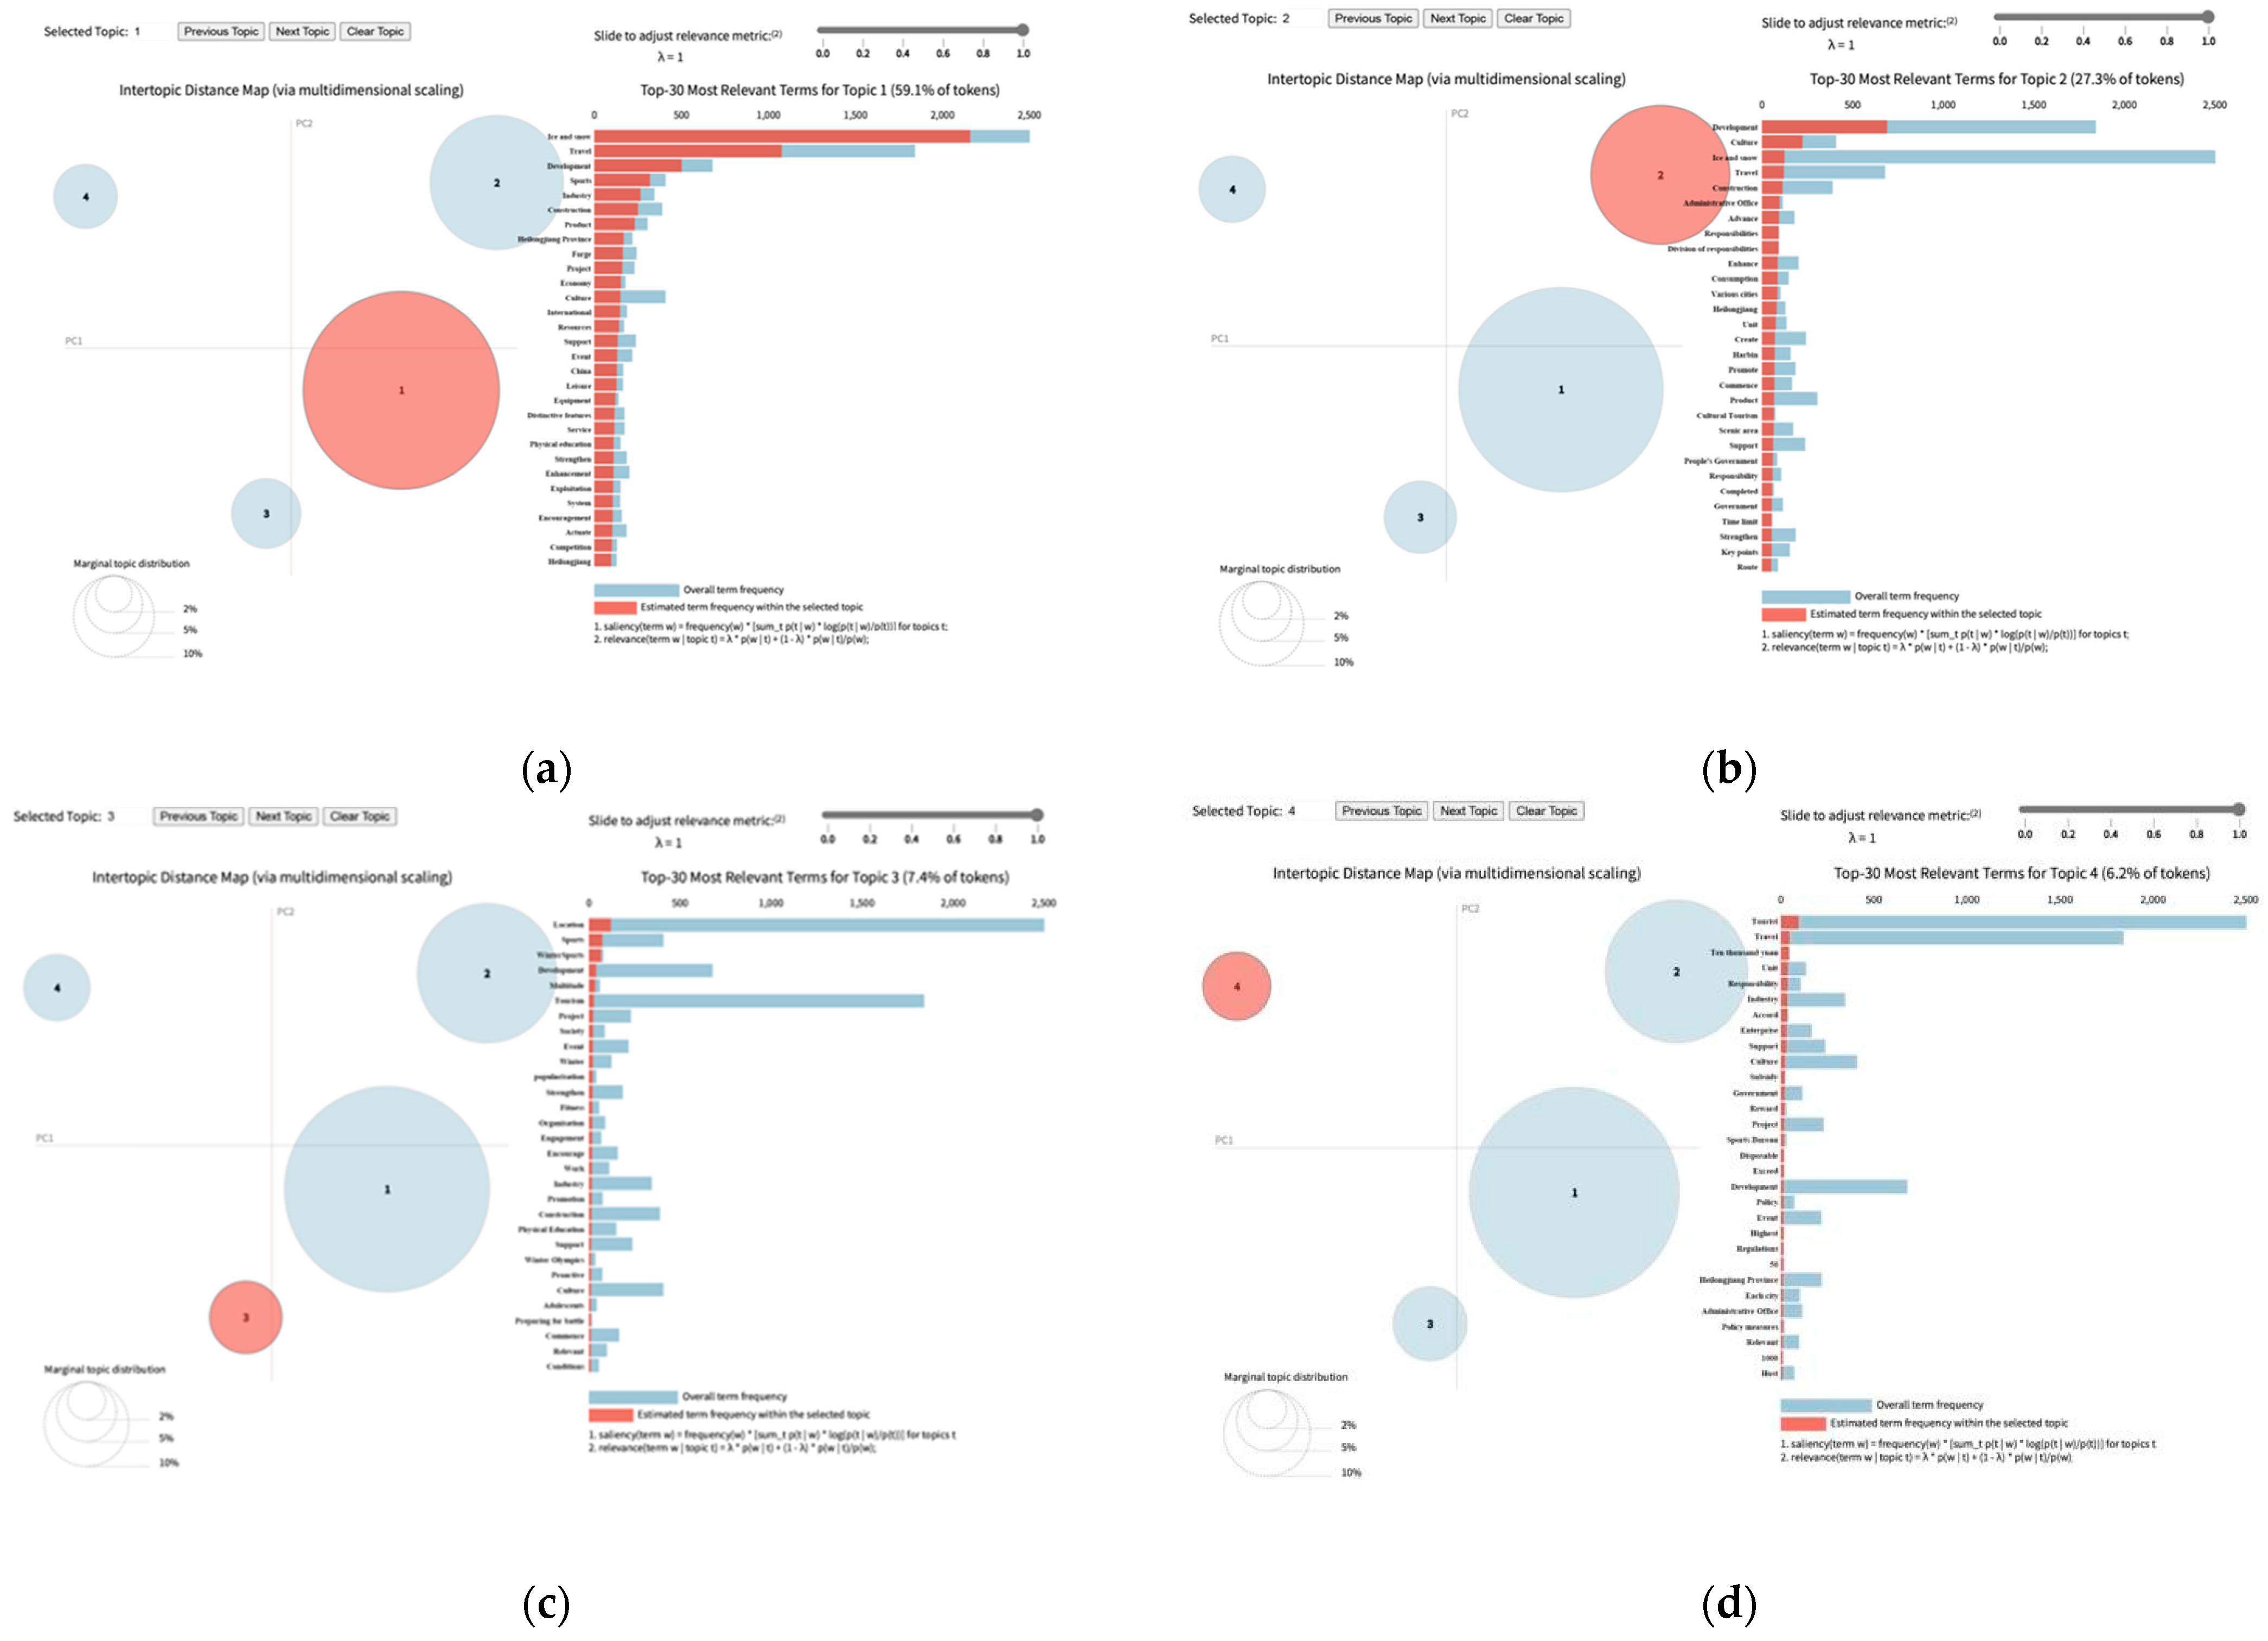
The LDA modeling results were visualized using tools like the pyLDAvis library to present the thematic modeling outcomes. The specific results are shown in Figure 5 and Figure 6, including distribution maps of thematic keywords, distance relationships between themes (represented by the position and size of circles in a two-dimensional space to indicate relative relationships), and document-theme probability distribution maps. This visualization process not only highlights the differences and connections between themes but also provides an intuitive basis for subsequent policy text clustering, trend analysis, and spatial attribution studies.
The results demonstrate that the primary keywords in Theme 1 encompass “ice and snow, resources, leisure, and uniqueness,” while Theme 2 predominantly features “development, construction, enhancement, and support.” Theme 3 highlights “location, accessibility, and participation,” and Theme 4 emphasizes “tourists, industry, incentives, and policies.” Subsequent analysis categorizes these themes into four key dimensions: “natural resources,” “social economy,” “location and transportation,” and “tourist appeal,” providing a comprehensive framework for policy-driven IST development. This structure serves as a scientific basis for selecting specific indicators. The natural resources dimension evaluates development suitability from an ecological perspective, while the social economy dimension assesses regional socio-economic investments’ impact on tourism growth. Location and transportation analysis focuses on accessibility, evaluating regional connectivity to inform practical development strategies. The tourist appeal dimension examines visitor preferences, identifying areas with high visitor potential and future priority destinations.

3.1.2. Selection of Indicator and Element Layers

In the subsequent indicator selection process, we thoroughly evaluated the compatibility between selected elements and the criterion layer. The theoretical framework-based evaluation elements identified in this section were categorized into a preliminary indicator system using large-scale models according to the criterion layer. The final evaluation indicator system (Table 3) was then finalized through multiple rounds of Delphi method screening.

3.1.3. Determination of Evaluation Factor Weights

Through a literature review, government document analysis, and expert consultations, we established classification criteria for each influencing factor. Subsequently, AHP analysis and entropy method analysis [45,46] were conducted using expert scoring to determine the weight distribution of each component. Consistency testing of expert questionnaire results yielded a CR score of 0.093, below 0.1, indicating good consistency. At the criterion level, four components showed significant differences: natural environment potential accounted for 52.1%, followed by socio-economic potential (23.9%), regional transportation potential (17.2%), and tourist appeal (6.8%). At the indicator level, climate indicators dominated with 38.2% weight, while infrastructure development and tourist appeal elements had the lowest impact at 6.8%. Within indicators, snow depth (14.1%) and snow coverage rate (11.1%) were key influencing factors, whereas shopping location distribution and leisure facility distribution (0.7%) had minimal impact. The detailed evaluation system is presented in Table 4 below:

3.2. Grading Criteria for Evaluation Factors

In climatic factors, snow depth is measured in centimeters, snow cover percentage in percentages, snow-covered days in days, and sunshine duration in hours. Based on actual IST development and existing research, areas with snow depth exceeding 40 cm, snow cover over 80%, and snow-covered days above 100 days are classified as high-development-potential zones. Lower values in these metrics indicate progressively reduced development potential. Temperature classification follows the local standard “Meteorological Suitability Grades for IST” issued by the Liaoning Provincial Market Supervision Administration. The optimal temperature range for tourism development is between −12 °C and −14 °C, with development potential grades decreasing progressively toward extremes. For geographical factors, elevation and slope are graded at equal intervals according to existing research. Current studies generally consider 3000 m as the ideal altitude for IST, with development potential grades decreasing progressively toward extremes. A slope gradient of 0–10° indicates high development potential, while lower elevations and steeper slopes result in reduced potential. Social-economic indicators such as regional population, GDP, tertiary industry proportion, and toilet availability per 10,000 people use natural breakpoints, where higher values correlate with higher development potential grades. tourist appeal factors primarily include Grade A scenic spots, star-rated hotels, dining, shopping, and leisure facilities. This study analyzes regional tourist appeal intensity, applying normalization processing where higher values correspond to higher scoring grades (Table 5).
This evaluation grading table systematically presents the specific scoring criteria for the elements used in the study, serving as the foundation for potential development assessment. The construction of the evaluation grading table provides fundamental support for subsequent score calculations.

3.3. Empirical Study of Evaluation System

3.3.1. Development Potential Assessment Scores for Each Guideline Level

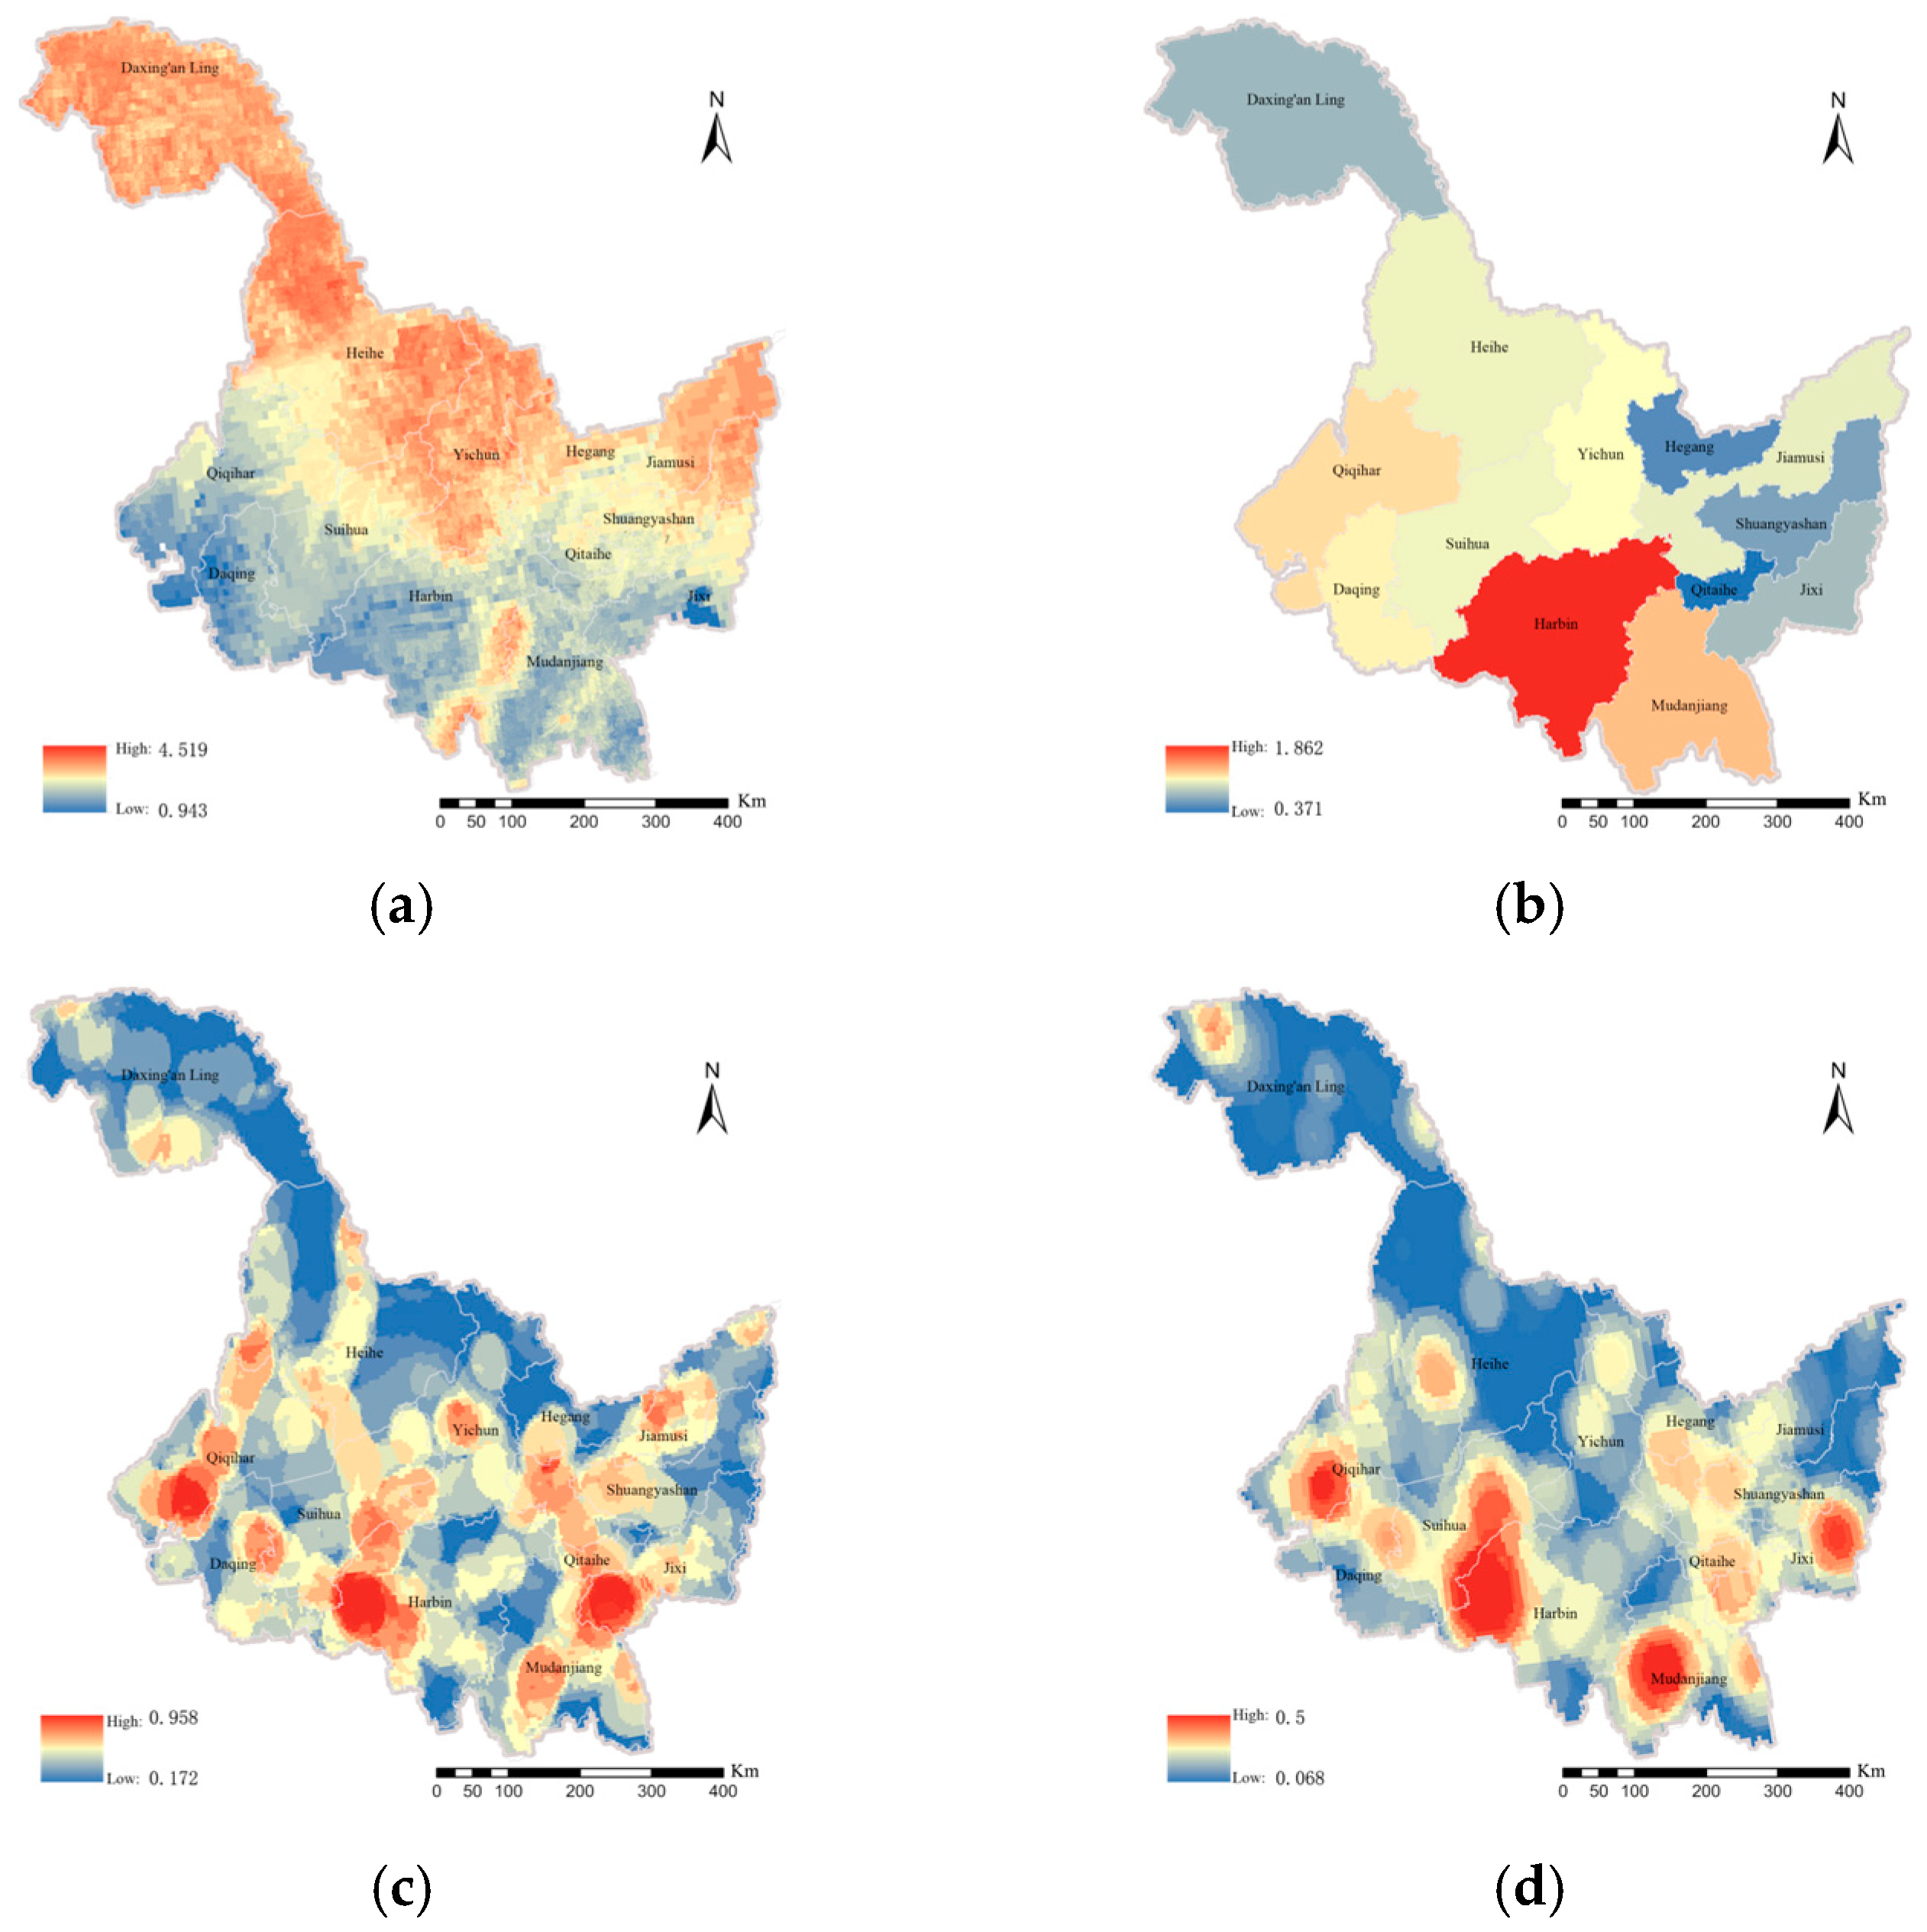
Based on the evaluation framework established in the preceding section, empirical analysis was conducted across Heilongjiang Province. The results indicate that the overall index range for natural resource development potential evaluation spans 0.943–4.519. This assessment primarily comprises two components: climatic factors (development potential grade index range: 0.562–3.438) and geographical factors (development potential grade index range: 0.139–1.251), with climatic factors demonstrating relatively higher weighting. In terms of development potential, the northern region and the southern border area between Mudanjiang and Harbin cities exhibit higher potential grades. Some regions feature extended winter snow seasons, with effective snow cover periods reaching approximately 130 days, providing high-quality snow resources conducive to developing outdoor IST projects. The terrain, characterized by alternating mountainous, hilly, and flat areas, offers favorable conditions for diverse tourism activities, including winter sports, ice and snow sightseeing, and cultural experiences.
The overall socioeconomic development potential index ranges from 0.371 to 1.862, primarily comprising two components: regional development level and infrastructure construction. Specifically, the regional development level index ranges from 0.269 to 1.539, while the infrastructure construction index ranges from 0.085 to 0.527, with the former holding a relatively higher weight. Overall, Harbin, as the provincial capital, demonstrates robust socioeconomic development, showcasing a “dominant position” in the region. Mudanjiang City follows closely, while cities in the western and northern areas exhibit relatively lower development levels.
The location–transportation development potential index ranges from 0.172 to 0.985 (Figure 7c). Analysis reveals that most regions, particularly the central and southern areas, have relatively favorable transportation conditions, which significantly boost the development of IST. In contrast, the northern and eastern regions exhibit notable deficiencies in transportation infrastructure, making them priority areas for future development. The tourist appeal index ranges from 0.068 to 0.5 (Figure 7d), indicating uneven distribution of resource appeal. High development potential is concentrated in cities like Harbin, Mudanjiang, Qiqihar, and Jixi, while other regions demonstrate relatively lower potential.
The various elements logged into the GIS platform were scored and evaluated, yielding the following results (Table 6).
Overall, the natural resources category achieved the highest score, serving as the primary factor influencing the development potential of IST in Heilongjiang Province. Although socioeconomic conditions, geographical location, transportation, and tourist appeal scored relatively lower, they remain indispensable components that provide crucial support for the development of IST.

3.3.2. Analysis of Overall Development Potential Levels

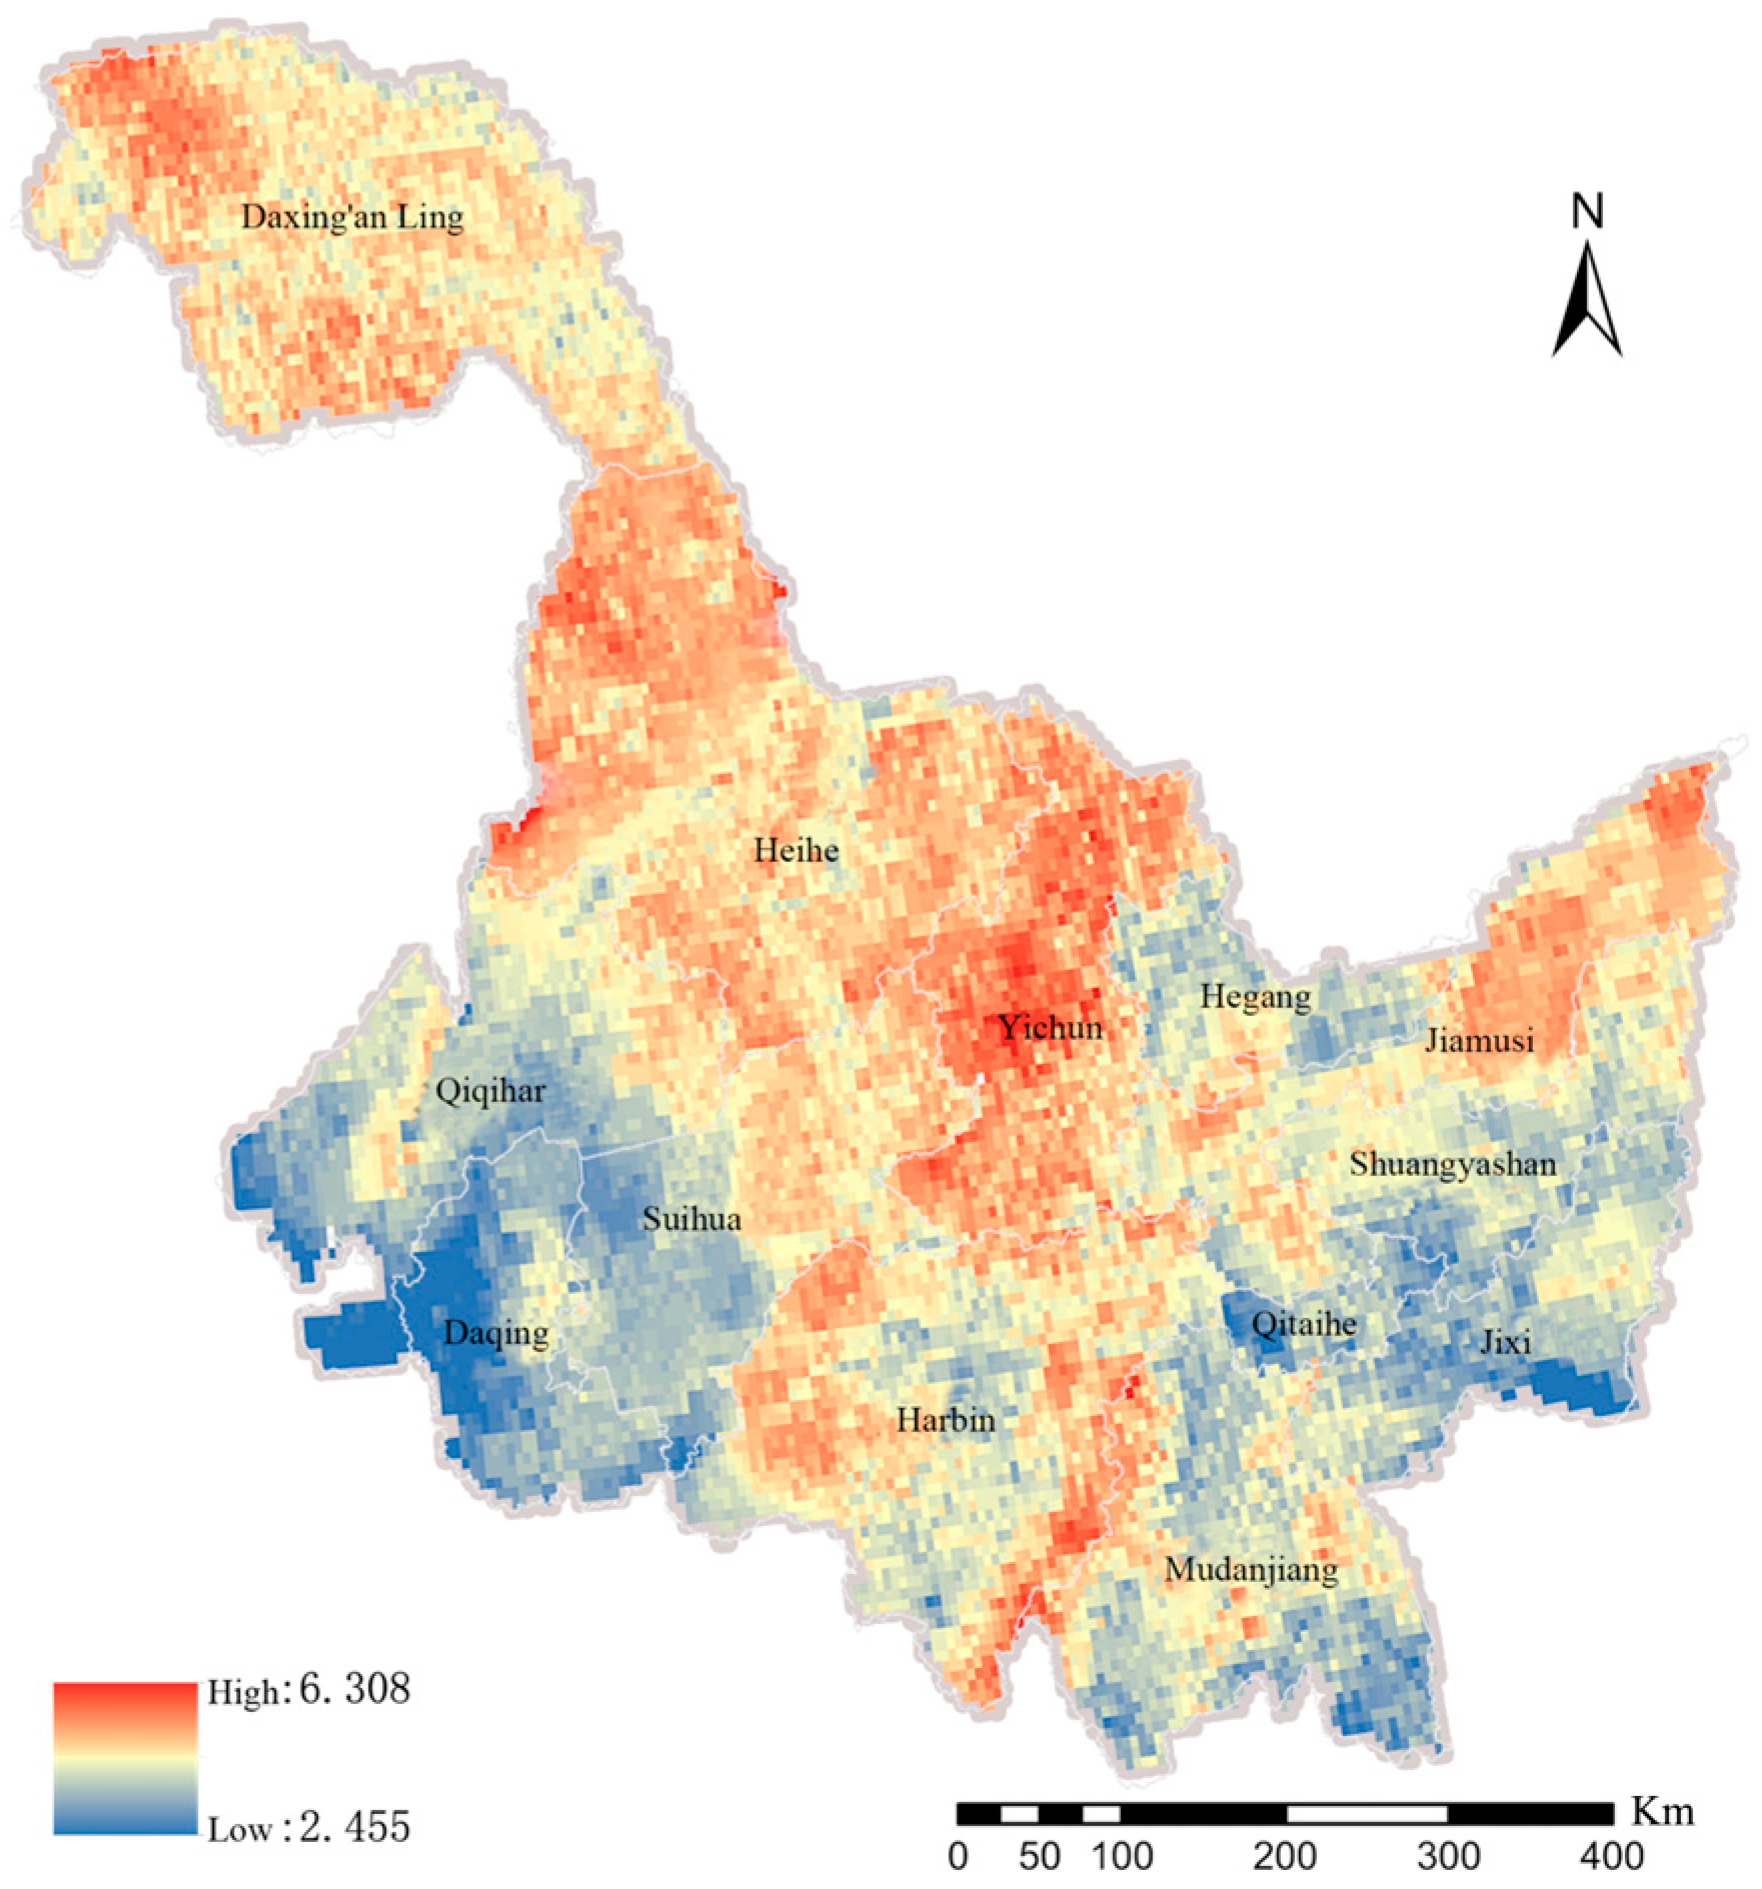
The comprehensive evaluation of the four-tier classification potential yielded a holistic raster map of Heilongjiang Province’s IST development potential, with scores ranging from 2.455 to 6.308. Using the natural breakpoint method, the existing raster data was processed into five development potential tiers: low, relatively low, moderate, relatively high, and high (Table 7), resulting in the final IST development potential map (Figure 8).
The results indicate that high-development-level areas form a V-shaped distribution pattern. This primarily encompasses the Greater Khingan Range in the north, extending southward along the Harbin–Suifenhe–Heilongjiang development axis to the junction of Harbin and Mudanjiang, then northeastward to Jiamusi. Beyond this core area, development levels gradually decrease in both directions. The Greater Khingan Range, one of China’s northernmost major mountain ranges, boasts abundant snow and forest resources. Mohe, the northernmost city within this region, features renowned attractions like the “Arctic Village,” drawing visitors through its snow resources and border culture. Key cities in Heilongjiang Province—Heihe, Yichun, Harbin, Mudanjiang, and Jiamusi—also possess unique advantages for snow tourism. Heihe is distinguished by its Sino–Russian border charm and the snowy landscapes of Wudalianchi; Yichun draws visitors with the snow-covered forests and skiing resources of the Lesser Khingan Mountains; Harbin is globally renowned for its Ice and Snow World and International Ice and Snow Festival; Mudanjiang captivates with the winter fishing at Jingpo Lake and the fairy-tale snow scenes of Snow Village; Jiamusi showcases its winter vitality through the Songhua River Ice and Snow World and winter swimming events. The existing resource conditions in these cities provide a solid foundation for the subsequent development of winter tourism.

4. Discussion

4.1. Methods for Establishing an Evaluation System

The evaluation system for IST resource development potential developed in this study demonstrates strong scientific rigor and innovative features. At the criterion level, LDA-based topic modeling technology was employed to extract key themes from policy texts, significantly enhancing the system’s responsiveness to real-world policy directives. During the indicator layer classification process, Large Language Models (LLMs) were utilized to semantically categorize element databases, enabling structured and standardized representation of multi-source heterogeneous information. This approach overcomes the limitations of traditional manual classification methods, which are often subjectively biased and inefficient.
Based on the aforementioned content, the Delphi method was employed to validate and optimize the expert questionnaire. Through multiple rounds of refinement, the final elements of the evaluation system were determined, ensuring its applicability and authority. The final weights of each element were then established using a combined AHP and EWM approach. Overall, the methodology for constructing the evaluation system is scientifically rigorous, effectively minimizing the influence of subjective factors.

4.2. Analysis of the Elements of the Evaluation System

Architecturally, this evaluation system demonstrates clear hierarchy and logical coherence, comprehensively addressing key dimensions of IST development, including natural, geographical, social, and industrial aspects, with strong adaptability and promotion potential. The study reveals that natural environmental potential (0.521) ranks highest among the four dimensions, reflecting experts’ emphasis on natural elements—a characteristic deeply rooted in the inherent nature of IST. Social and economic potential (0.239) follows, focusing on regional infrastructure support beyond natural factors. Location and transportation (0.172) and tourist appeal (0.068) indicate that future tourism development should prioritize existing resources as the foundation for further expansion.
The natural environment potential is primarily composed of climatic and geographical indicators, including snow depth (0.141), snow cover duration (0.085), and elevation (0.061). IST heavily relies on these resources, as evidenced by the study’s findings. Factors such as snow depth and snow cover are widely recognized as key elements in the evaluation system, while slope and aspect hold relatively lower importance. All these evaluation criteria can be analyzed and converted using meteorological monitoring data to derive the metrics employed in our system.
The second dimension focuses on socioeconomic potential, primarily measured by regional development indicators, such as Gross Regional Product (GRP, 0.062) and population size (0.060), along with infrastructure development metrics. Beyond natural environment, tourism resource development requires robust local economic foundations, which is why these indicators carry greater weight. All relevant variables in this study are supported by official data from local statistical yearbooks, ensuring both credibility and scientific rigor.
Regarding location and transportation potential, the evaluation primarily focuses on accessibility (0.061) and road network density (0.056)—key factors that significantly impact tourism activities and destination accessibility. These elements demonstrate strong data availability in the study, with comprehensive road network data available on relevant platforms to support their scoring analysis. In contrast, more detailed yet less accessible factors, like self-driving conditions and cycling/foot traffic friendliness, are generally considered unsuitable for large-scale assessment.
Regarding tourist appeal, the distribution of Grade A scenic spots (0.025) carries the highest evaluation weight. This outcome reflects industry considerations in the expert assessment process, with some tourism scholars identifying scenic spot distribution and accommodation facilities as the two most critical factors, while supporting amenities, like shopping, dining, and leisure activities, are considered less important. These evaluation criteria can be converted into specific metrics using official statistical data, ensuring high data accessibility and accuracy.

4.3. Comparison of Evaluation Systems

By comparing the findings of this study with previous research and building upon established indicators, we developed an evaluation framework for assessing the development potential of IST resources across regions. Existing scholars have focused on factors such as natural environment, transportation accessibility, tourism infrastructure, regional competitiveness, and intrinsic value. However, current research primarily relies on model-based and estimated indicators with limited correlation to official statistics, restricting the applicability and comparability of evaluation systems. In contrast, this study integrated the AHP and EWM [44,45] to establish a standardized indicator hierarchy aligned with partial official data, thereby enhancing the scientific rigor, reproducibility, and policy relevance of the evaluation system. The existing framework also selectively retains key elements emphasized by prior scholars, ensuring the credibility and scientific validity of the overall assessment. Consistent with previous research, the high importance of natural resources in this study reflects inherent attributes of tourism resources. Furthermore, by constructing a standardized, statistically validated indicator system based on official data, this study transcends spatial or model-based analyses, providing a policy-relevant framework for resource management.

4.4. Empirical Results of the Evaluation System

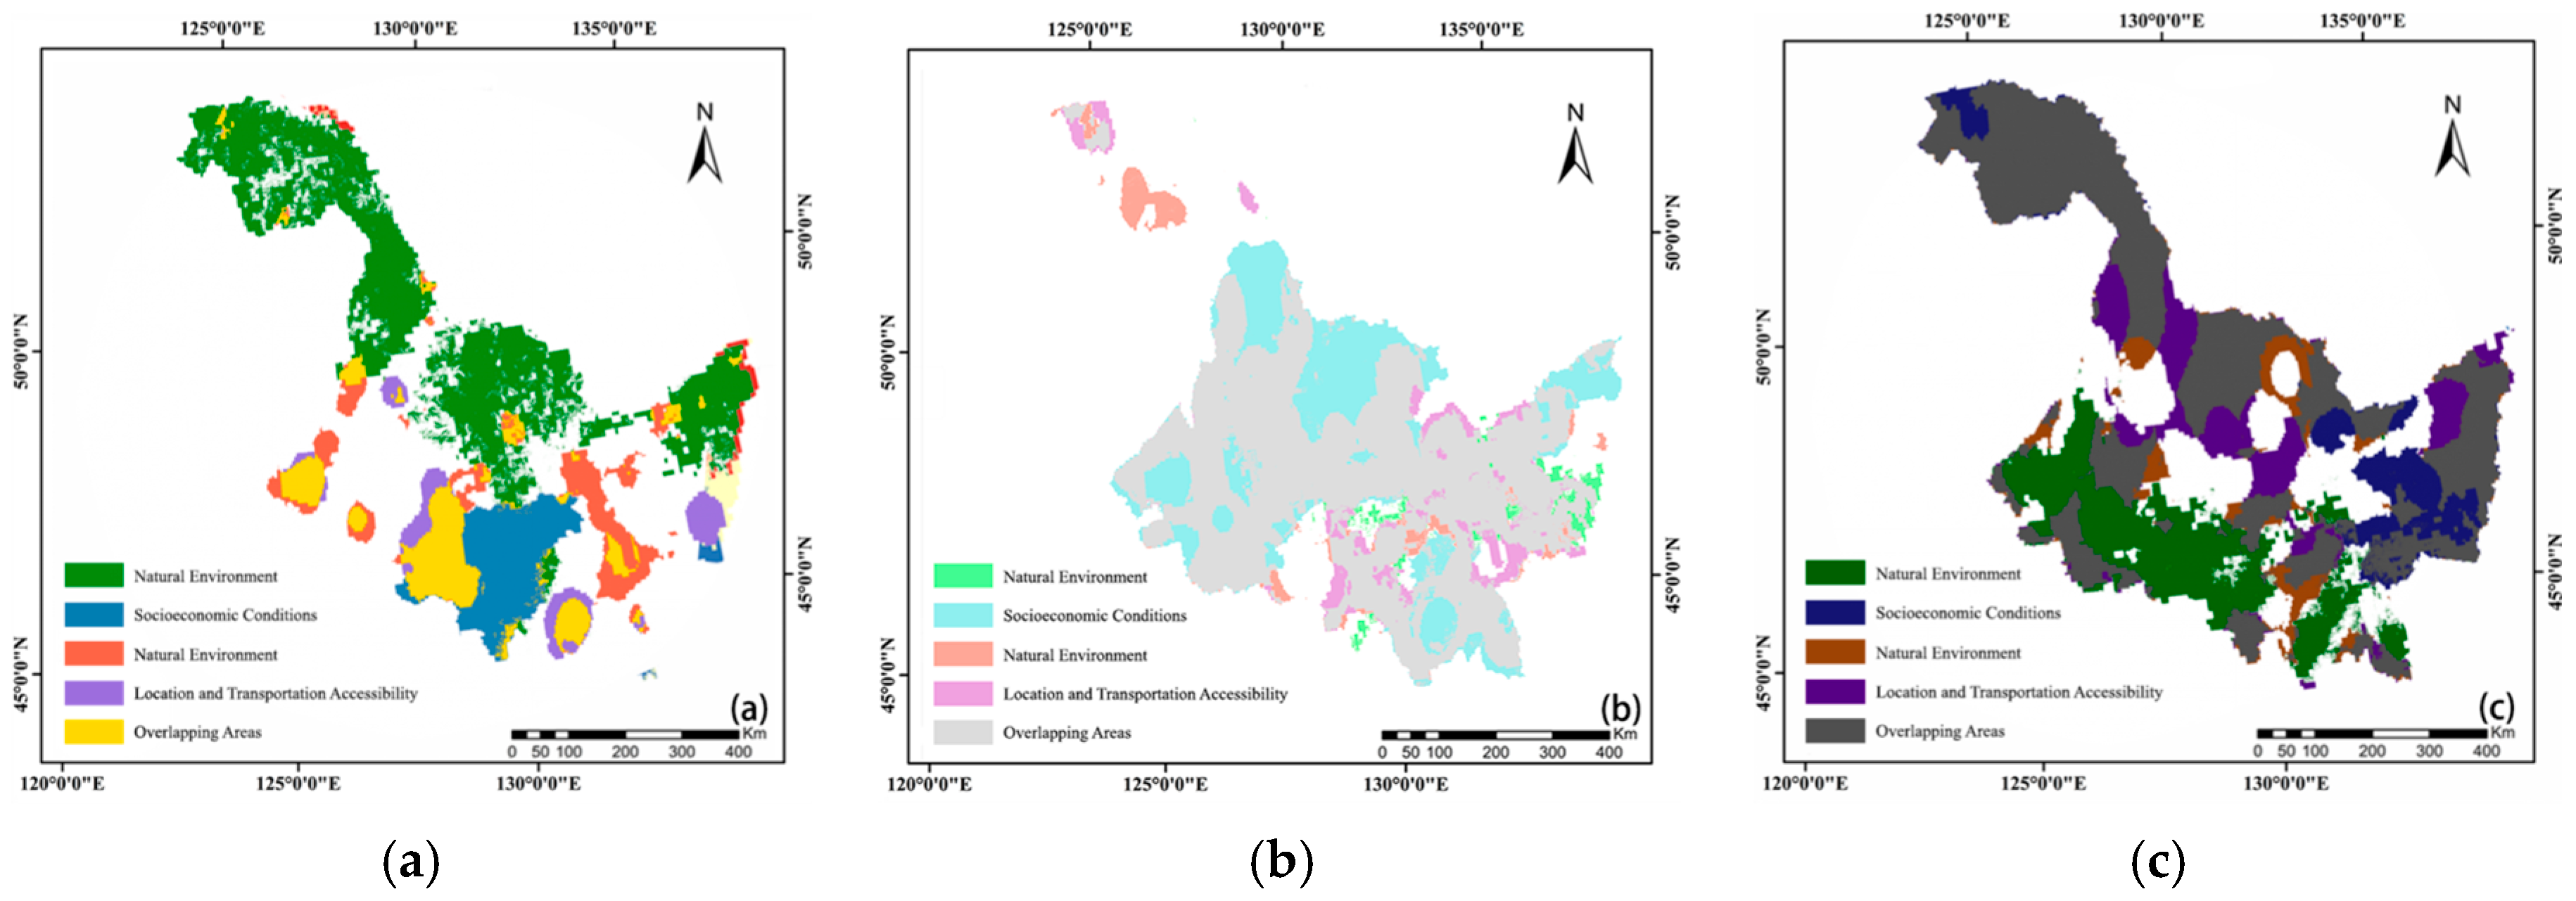
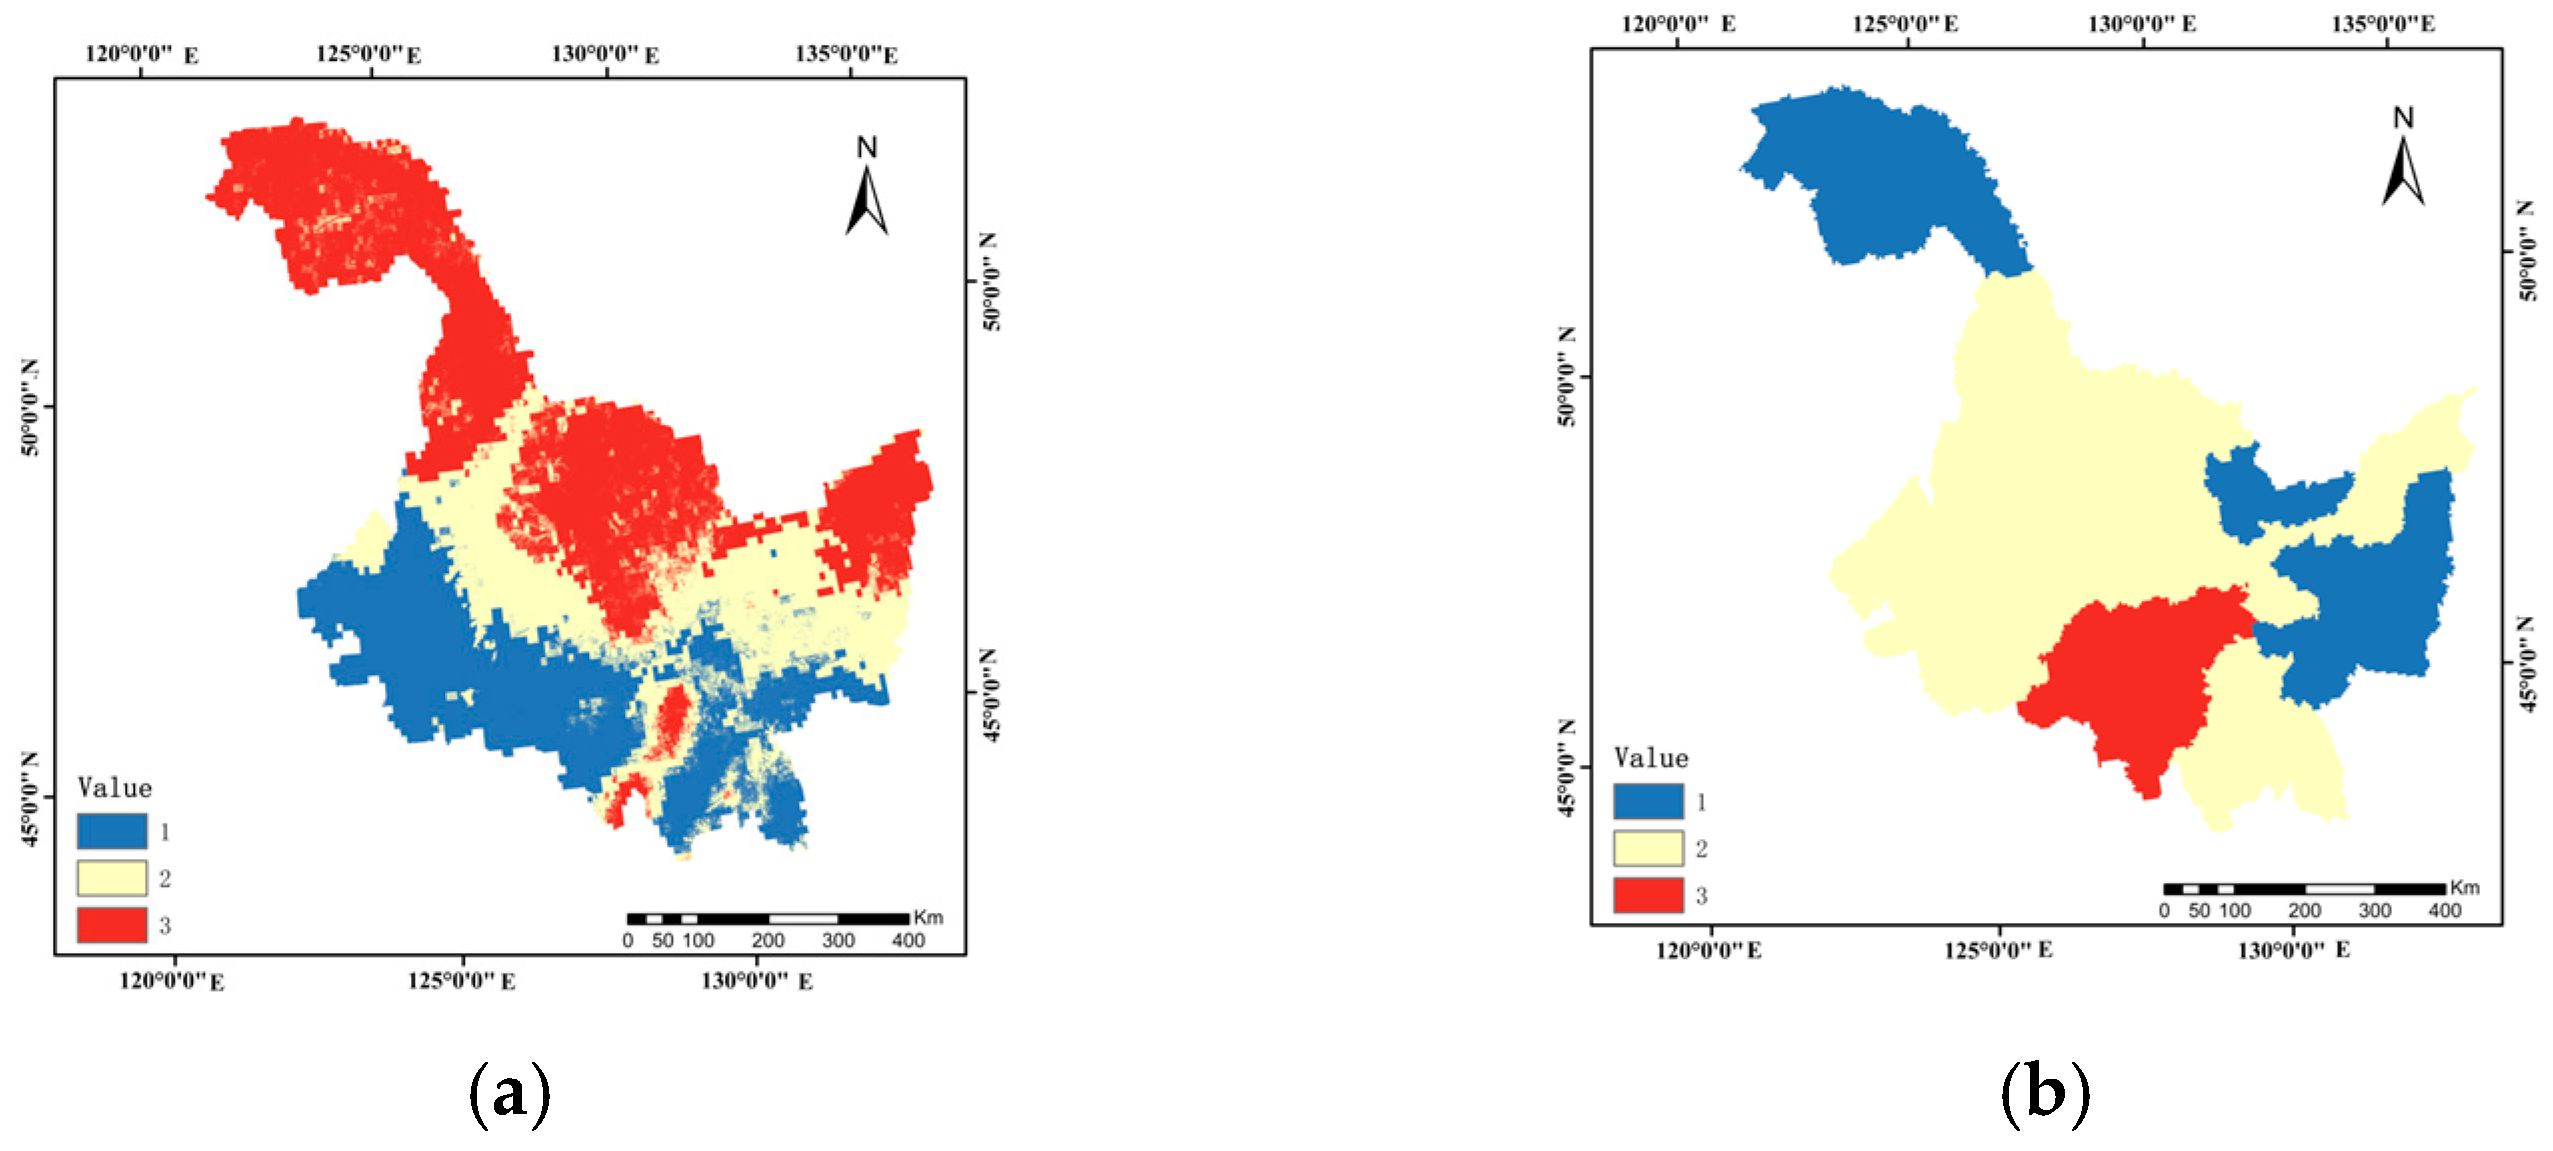
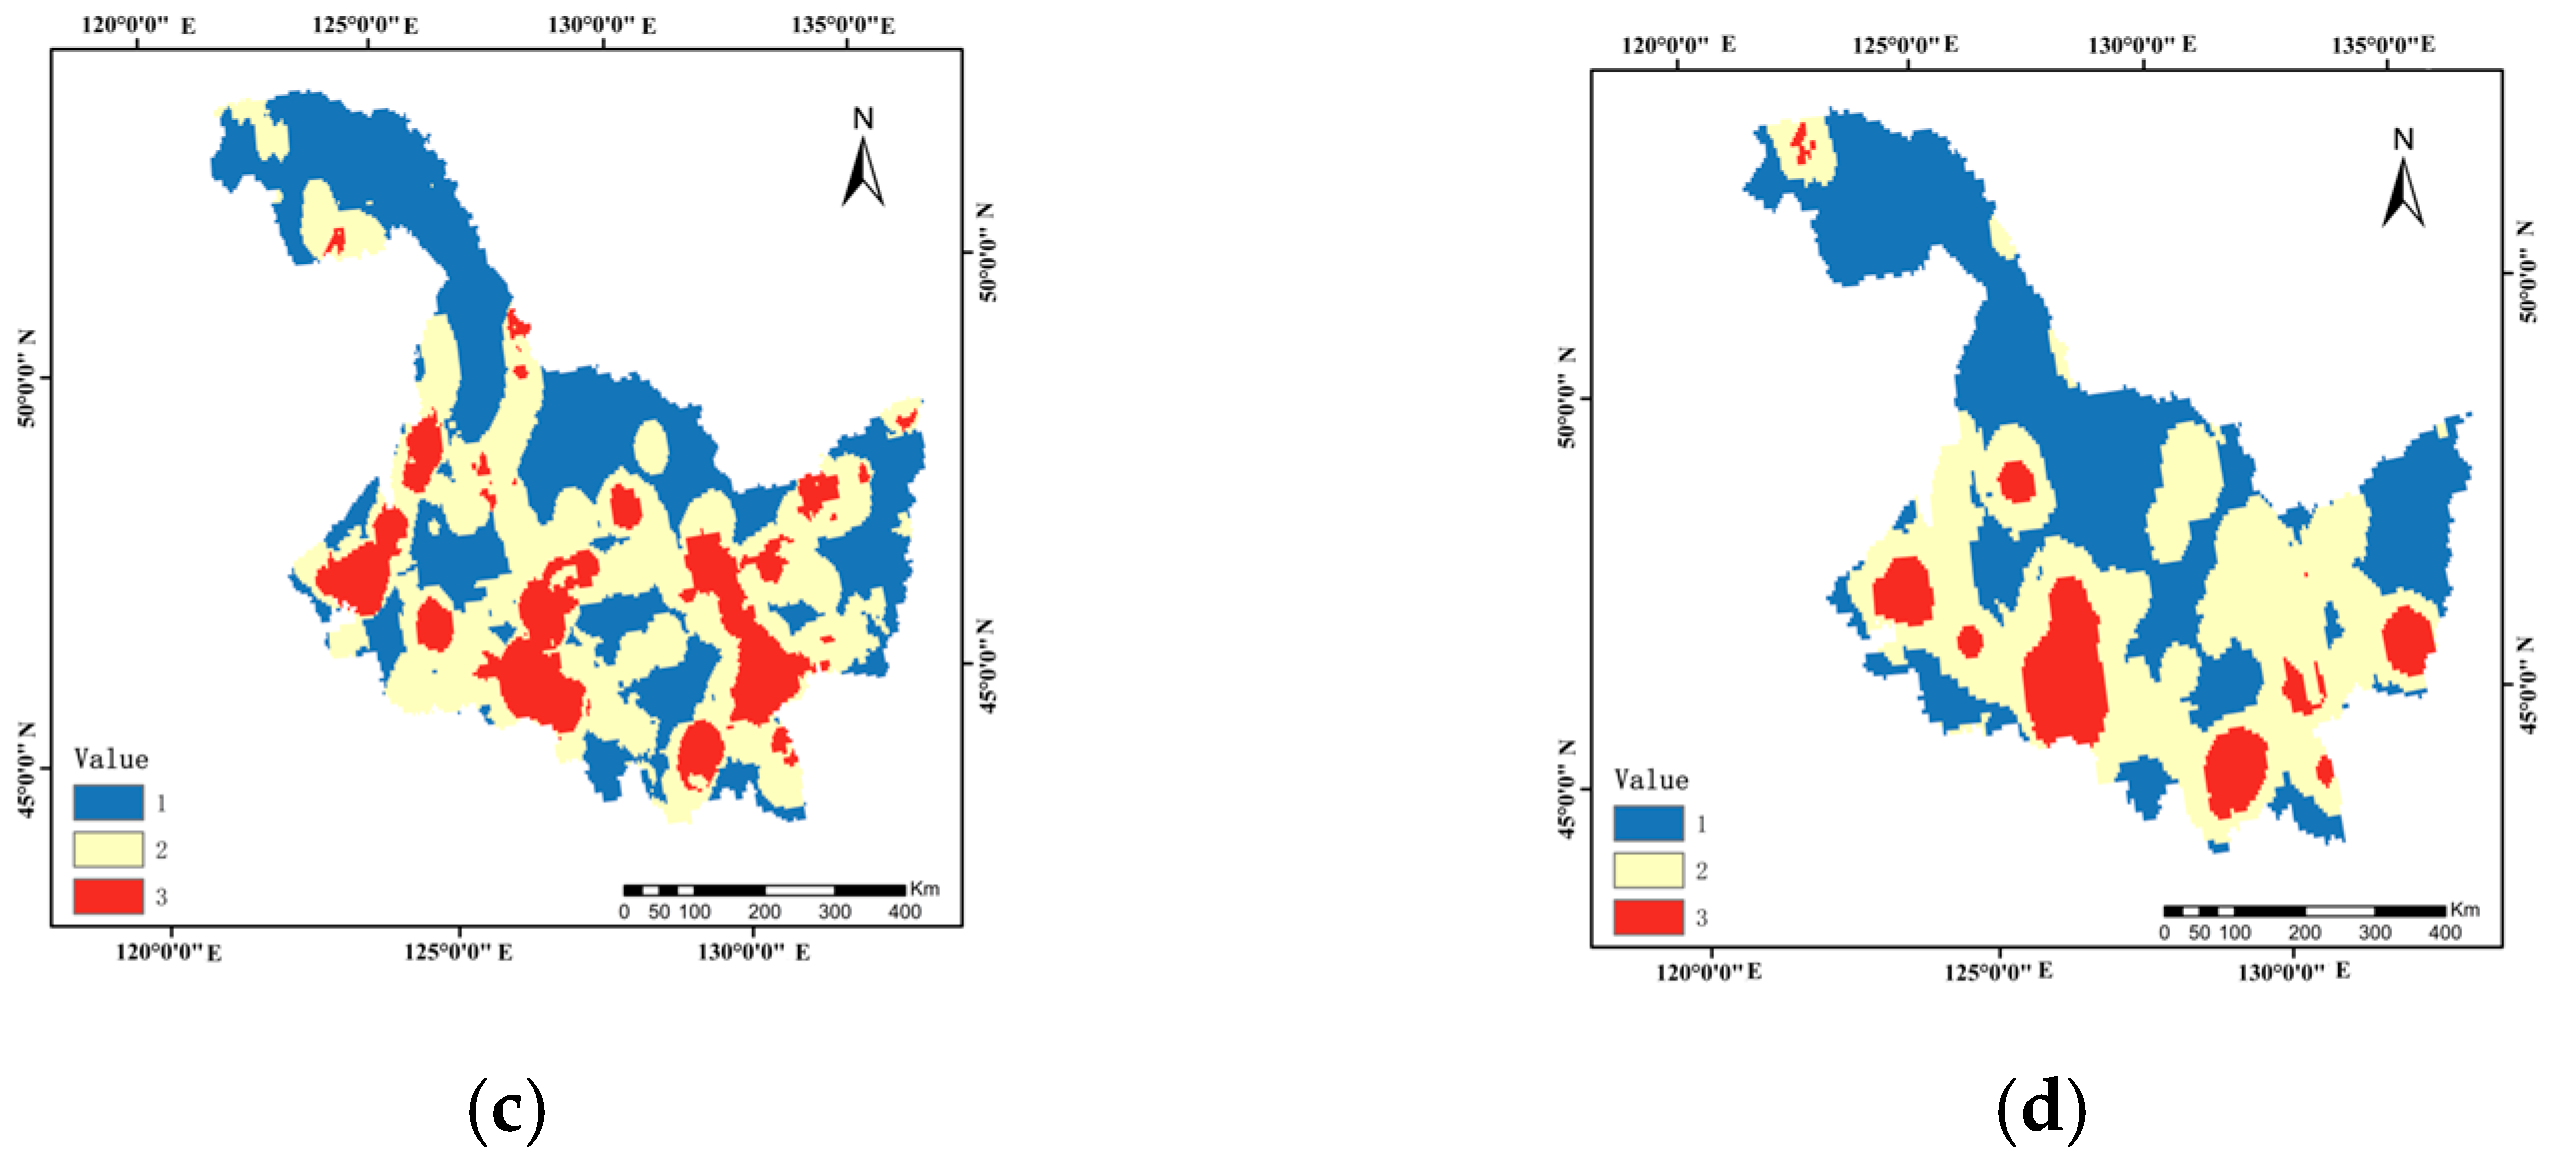
Based on the evaluation results from the preceding analysis, the assessment outcomes across four criterion layers were standardized into numerical values representing development potential, categorized into three tiers (high, medium, and low) with corresponding values of 3, 2, and 1 (Figure 9). Using machine learning models, RGB recognition was applied to four reference maps to extract distinct development potential levels for each criterion layer. These levels were then synthesized into three development potential maps covering different criteria, which were cross-referenced with the original criterion layers (Figure 10). The analysis reveals that regions with two or more criteria at medium or low potential levels are relatively common. However, areas with significant disparities in natural environmental factors can partially compensate for deficiencies in other elements. For regions with favorable natural conditions, targeted policies could be implemented across other criteria to stimulate regional tourism development.
The previous analysis results indicate that the development potential level extends southward along the “Harbin–Suiyuan–Heihe” development axis to the border between Harbin and Mudanjiang, and gradually decreases northeastward to Jiamusi, forming a “V-shaped” high-potential belt. As an important mountain range in northern China, the Greater Khingan Range boasts abundant ice and snow resources as well as forestry resources. Attractions such as Mohe’s “Polar Village” attract a large number of tourists, making it a highland of ecological resources for IST in the province. Core cities such as Harbin, Heihe, Yichun, Mudanjiang, and Jiamusi, leveraging their unique ice and snow resources and cultural advantages, have established a diversified IST product system, laying a solid foundation for regional tourism development.
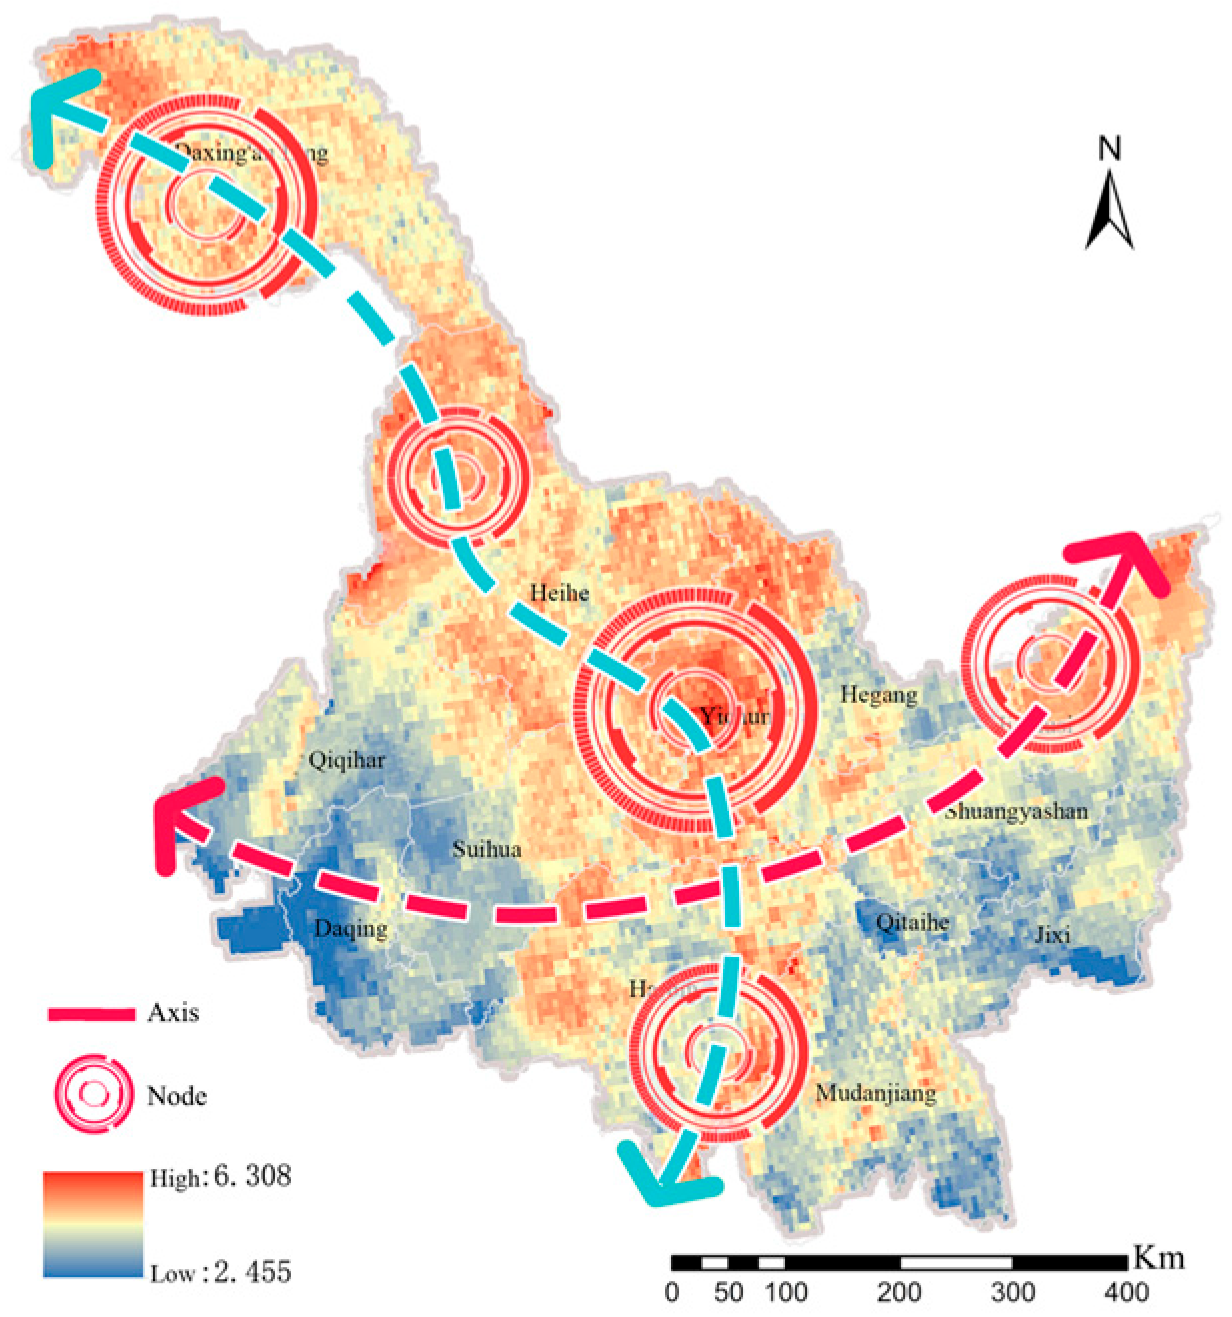
Through comprehensive analysis of four key dimensions—natural environment, socio-economic conditions, regional transportation infrastructure, and tourist appeal—Heilongjiang Province should adopt a spatial development strategy for IST that emphasizes “resource-based support, transportation-driven growth, industrial clustering, and tiered advancement.” Regarding the natural environment, the province should prioritize ecological conservation and sustainable resource utilization, developing “authentic + immersive” tourism products in high-potential areas like the Greater Khingan Range and Yichun. Economically, developed regions such as Harbin should serve as core hubs by optimizing business environments and talent supply to enhance competitiveness in the IST sector. Transportation-wise, a multi-modal, multi-node transportation network should be established to improve connectivity in remote and inland areas, ensuring easier access for tourists. For tourist appeal, Harbin should continue building a world-class IST brand, while regions like Mudanjiang, Yichun, and Heihe can develop diverse ice and snow products leveraging their cultural and resource advantages. Areas with moderate potential should focus on short-distance leisure tourism and festival-based economies, promoting balanced development of tourism resources (Figure 11).

5. Conclusions

This study establishes a scientifically rigorous framework for evaluating development potential, providing a methodological approach to quantitatively analyze data on natural environment, socio-economic conditions, regional transportation, and tourism industries, thereby determining the development potential levels within a region. Building upon this foundation, spatial network analysis methods can be employed to assess development potential from multiple perspectives, proposing coordinated development strategies across four dimensions: natural, social, location, and industrial. These findings provide a scientific basis for the sustainable development of winter tourism. The key conclusions are as follows:
(1) The development potential evaluation system established in this study demonstrates scientific rigor. Following the framework of “policy orientation–theoretical support–regional adaptation” for evaluation indicators, the study utilized machine deep learning to identify four core dimensions—“natural environment, socio-economic conditions, location and transportation, and tourist appeal”—as the criterion layer. Building upon existing research and regional development characteristics, Large Language Models (LLMs) were incorporated to define the element layer and factor layer of the evaluation system. This resulted in a comprehensive evaluation framework for IST development potential, comprising 4 criterion layers, 6 target layers, and 22 specific assessment elements. At the criterion layer level, the four components show distinct proportions: natural environment accounts for 52.1%, socio-economic conditions for 23.9%, followed by location and transportation (17.2%) and tourist appeal (6.8%). Further breakdown reveals that climate indicators (38.2%) constitute the most significant influencing factor, while infrastructure development and tourist appeal elements (6.8%) have the least impact. At the indicator layer level, snow depth (14.1%) and snow coverage rate (11.1%) emerge as key influencing factors, whereas shopping location distribution and leisure facility distribution (0.7%) exhibit minimal influence.
(2) Specifically, the evaluation of natural resource potential incorporates four climatic indicators: snow depth, snow cover rate, snow-covered days, and temperature, along with three geographical indicators: elevation, slope, and aspect. For socioeconomic potential, the assessment primarily includes three regional development metrics: population size, regional GDP, and tertiary industry proportion, as well as four infrastructure indicators: toilets per 10,000 residents, per capita park green space area, public transport vehicles per 10,000 residents, and urban road area per capita. The evaluation of transportation accessibility focuses on four key factors: local road network density, bus stop distribution, and regional connectivity. Regarding tourist appeal, the analysis covers five elements: distribution of Grade A scenic spots, number of star-rated hotels, distribution of dining venues, shopping locations, and recreational facilities.
(3) The evaluation system incorporates key indicators directly linked to official statistics, addressing the limitations of previous surveys that relied heavily on subjective assessments. This framework can serve as a model for similar tourism resource evaluations. Based on our findings, we propose actionable strategies for sustainable winter tourism development. First, climate factors should be prioritized in resource planning, ensuring respect for existing climatic conditions while minimizing environmental impacts. Second, strengthening interdisciplinary collaboration between tourism studies, environmental science, and sociology will provide more accurate, scientific, and dynamic data for future resource development, enhancing adaptability. Overall, this research not only establishes a robust data foundation for spatial potential assessments but also offers a replicable methodology for evaluating cold-region or resource-based tourism areas.
This study has made significant progress in establishing an evaluation framework for assessing the development potential of IST, though certain limitations remain. Firstly, the current data analysis primarily relies on municipal or county-level units, which may not fully capture subtle regional variations due to their relatively broad spatial scale. Future research could adopt higher spatial resolution data and refine evaluation units to enhance precision and relevance. Secondly, due to factors such as data availability, there are certain limitations in data selection. Subsequent research could explore incorporating longer-term real-time dynamic data, such as extending climate time series to 30 years. Concurrently, systematic validation of analytical data against site observation data could be conducted to reasonably quantify uncertainties and ensure greater accuracy in analytical outcomes. Regarding indicator selection, future efforts could involve collaborating with local stakeholders (tourism operators, ski resort managers, local governments) to develop climate indicators for assessing winter tourism potential [47], thereby enhancing the scientific rigor and objectivity of the indicator system. Soft indicators such as socio-cultural factors, including ice-snow folk festivals and cultural heritage, should also be integrated into the indicator framework to enrich the factor composition. Furthermore, this study primarily relies on existing data and has not yet fully reflected the potential impacts of dynamic factors, such as climate change, policy adjustments, and unforeseen events. Concurrently, deepening the development of carrying capacity models to account for potential competing destinations could establish an early warning system capable of alerting to risks associated with tourism growth. Soft indicators, such as socio-cultural factors and visitor preferences, remain underrepresented in this study, presenting new avenues for subsequent research. Despite these limitations, this work provides a robust foundation and valuable reference for systematically evaluating Heilongjiang Province’s ice and snow tourism resource development potential through multi-source data integration and multi-method approaches. It is anticipated that future research will build upon this foundation to further refine and deepen these methodologies.

Author Contributions

Conceptualization, Y.T. and X.Z.; methodology, Y.T., X.Z. and Z.Z.; software, Y.T. and X.Z.; validation, Y.T., X.Z., Z.Z., S.C. and X.W.; formal analysis, Y.T., and X.Z.; investigation, X.Z.; resources, Y.T., X.Z. and Z.Z.; data curation, Y.T., X.Z., S.C. and X.W.; writing—original draft preparation, Y.T., X.Z., Z.Z., S.C. and X.W.; writing—review and editing, Y.T., X.Z., Z.Z., S.C. and X.W.; visualization, X.Z., S.C. and X.W.; supervision, Y.T., Z.Z., and X.W.; project administration, Y.T. and Z.Z.; funding acquisition, Z.Z. All authors have read and agreed to the published version of the manuscript.

Funding

This research was funded by the Heilongjiang Province Philosophy and Social Science Research Planning Project “Research on the Path to High-Quality Development of Heilongjiang’s Ice and Snow Tourism Industry Driven by Digital Twins”, grant number 23GLA044, the National Natural Science Foundation of China, General Program “Research on High-Quality Development Models of Urban Space along Middle Eastern Railways under the Concept of Green Contraction.”, grant number 52278055.

Data Availability Statement

No new data were created or analyzed in this study. Data sharing is not applicable to this article.

Conflicts of Interest

The authors declare no conflicts of interest.

References

  1. Qiwei, S. China Tourism Dictionary; Shanghai Lexicographical Publishing House: Shanghai, China, 2013. [Google Scholar]
  2. Zhu, X.K.; Yang, X.L.; Xue, Y.S.; Wang, Y.Q. Study on tourist satisfaction perception and improvement strategies in IST: A case study of Harbin’s IST. Resour. Environ. Arid. Reg. 2018, 32, 189–195. [Google Scholar] [CrossRef]
  3. Liu, W.; Jiang, M. The Value of IST Resources and Its System Construction. Ice Snow Sports 2016, 38, 90–92+96. [Google Scholar] [CrossRef]
  4. Liu, C. Exploration of the Integration and Innovation Strategy for the Development of IST Culture and Sustainable Economic Development in Jilin Province. J. Jilin Radio Telev. Univ. 2014, 120–121. [Google Scholar]
  5. Tang, C.; Xiao, X.; Qin, S. Research on China’s Snow and Ice Tourism: Conceptual Analysis, Historical Development, and System Construction. Geogr. Res. 2023, 42, 332–351. [Google Scholar] [CrossRef]
  6. Chen, Y.; Yue, Y. The Value, Practical Challenges and Optimization Path of IST in Northeast China from the Perspective of Experience Economy. J. Shenyang Sport Univ. 2025, 44, 122–128+136. [Google Scholar]
  7. Wall, G. Cycles and capacity: A contradiction in terms? Ann. Tour. Res. 1983, 10, 268–272. [Google Scholar] [CrossRef]
  8. Watson, A. Soil erosion and vegetation damage near ski lifts at Cairn Gorm, Scotland. Biol. Conserv. 1985, 33, 363–381. [Google Scholar] [CrossRef]
  9. Morin, S.; François, H.; Réveillet, M.; Sauquet, E.; Crochemore, L.; Branger, F.; Leblois, É.; Dumont, M. Simulated hydrological effects of grooming and snowmaking in a ski resort on the local water balance. Hydrol. Earth Syst. Sci. 2023, 27, 4257–4277. [Google Scholar] [CrossRef]
  10. Welling, J.T.; Arnason, T.; Olafsdottir, R. Research Frontiers Glacier tourism: A scoping review. Tour. Geogr. 2015, 17, 635–662. [Google Scholar] [CrossRef]
  11. Deng, J.; Che, T.; Jiang, T.; Dai, L.Y. Suitability projection for Chinese ski areas under future natural and socioeconomic scenarios. Adv. Clim. Change Res. 2021, 12, 224–239. [Google Scholar] [CrossRef]
  12. Gilbert, D.; Hudson, S. Tourism demand constraints—A skiing participation. Ann. Tour. Res. 2000, 27, 906–925. [Google Scholar] [CrossRef]
  13. Morin, S.; Samacoïts, R.; François, H.; Carmagnola, C.M.; Abegg, B.; Demiroglu, O.C.; Pons, M.; Soubeyroux, J.-M.; Lafaysse, M.; Franklin, S.; et al. Pan-European meteorological and snow indicators of climate change impact on ski tourism. Clim. Serv. 2021, 22, 100215. [Google Scholar] [CrossRef]
  14. Bonnefoy-Claudet, L.; Ghantous, N. Emotions’ Impact On Tourists’ Satisfaction with Ski Resorts: The Mediating Role of Perceived Value. J. Travel Tour. Mark. 2013, 30, 624–637. [Google Scholar] [CrossRef]
  15. Zhang, X.; Zhang, Z.; Liu, L. A study on suitability evaluation of Xinjiang’s IST resources. J. Earth Inf. Sci. 2018, 20, 1604–1612. [Google Scholar] [CrossRef]
  16. Yu, X.; Hu, Y.; Zhang, T.; Hu, Y. Analysis of climate suitability for IST in the western Changbai Mountain scenic area. Meteorol. Disaster Prev. 2019, 26, 44–48. [Google Scholar] [CrossRef]
  17. Shi, Z. Evaluation of Ice and Snow Resources and Suitability Research for Tourism Development in Jilin Province. Ph.D. Thesis, Northeast Normal University, Changchun, China, 2023. [Google Scholar]
  18. Zhao, L.; Wang, F. Value orientation and implementation path of digital transformation in ice and snow sports tourism during the 14th Five-Year Plan period. Sports Cult. Guide 2021, 9, 1–6+47. [Google Scholar] [CrossRef]
  19. Liu, G.; Zhang, C. “Internet Plus IST” Industrial Development Path Selection: A Case Study of Heilongjiang Province. Learn. Explor. 2018, 1, 130–134+176. [Google Scholar] [CrossRef]
  20. Niu, Z.; Yang, Z.; Yu, Z. The mechanism, application scenarios and implementation pathways of digital technology in empowering high-quality development of the IST industry. J. Shenyang Sport Univ. 2025, 44, 124–130. [Google Scholar] [CrossRef]
  21. Davras, G.M. Classification of Winter Tourism Destination Attributes According to Three Factor Theory of Customer Satisfaction. J. Qual. Assur. Hosp. Tour. 2021, 22, 496–516. [Google Scholar] [CrossRef]
  22. Terzago, S.; Bongiovanni, G.; Von Hardenberg, J. Seasonal forecasting of snow resources at Alpine sites. Hydrol. Earth Syst. Sci. 2023, 27, 519–542. [Google Scholar] [CrossRef]
  23. Cao, J. The Ecological Safety Assessment and Brand Communication of Ice-Snow Tourism Under the Internet of Things and Deep Learning. IEEE Access 2023, 11, 128235–128244. [Google Scholar] [CrossRef]
  24. Peng, Y.; Yin, P.; Matzler, K. Analysis of Destination Images in the Emerging Ski Market: The Case Study in the Host City of the 2022 Beijing Winter Olympic Games. Sustainability 2022, 14, 555. [Google Scholar] [CrossRef]
  25. Wu, P.; Zhu, X.; Yang, S.; Huang, J. The influence of the Beijing Winter Olympic games on the demand for winter sports: An empirical analysis based on the Baidu Index. Heliyon 2023, 9, e20426. [Google Scholar] [CrossRef]
  26. Liu, S.; Guo, Q. Image perception of IST in China and the impact of the Winter Olympics. PLoS ONE 2023, 18, e0287530. [Google Scholar] [CrossRef]
  27. Shao, D.; Li, H.; Wang, J.; Hao, X.; Niu, L. Adaptability analysis of snow in the Zhangjiakou competition zone of the Beijing Olympic Winter Games for the next 30 years. J. Hydrol.-Reg. Stud. 2023, 46, 101358. [Google Scholar] [CrossRef]
  28. Mitterwallner, V.; Steinbauer, M.; Mathes, G.; Walentowitz, A. Global reduction of snow cover in ski areas under climate change. PLoS ONE 2024, 19, e0299735. [Google Scholar] [CrossRef] [PubMed]
  29. Zhang, B. The analysis of ecological security and tourist satisfaction of ice-and-snow tourism under deep learning and the Internet of Things. Sci. Rep. 2024, 14, 10705. [Google Scholar] [CrossRef]
  30. Cheng, Z.; Liu, K.; Sun, J.; Xi, J.; Yang, J. Comprehensive evaluation of suitability for China’s IST bases. Resour. Sci. 2016, 38, 2233–2243. [Google Scholar]
  31. Lou, T. Evaluation and Development Strategies of Ecological Tourism Resources in Sun Island Scenic Area. Ph.D. Thesis, Jilin Agricultural University, Changchun, China, 2017. [Google Scholar]
  32. Wu, W.; Liu, Y.; Chen, Y.; Zhang, C. Research on the Value Evaluation of Ice and Snow Sports Resources in Heilongjiang Province. Ice Snow Sports 2017, 39, 56–60. [Google Scholar] [CrossRef]
  33. Xie, L. Research on the Redevelopment of IST Products in Chongli. Ph.D. Thesis, Yunnan University, Kunming, China, 2018. [Google Scholar]
  34. Yu, F.; You, L.; Di, R. Evaluation of Climate Resources for Ski Tourism in Inner Mongolia. Inn. Mong. Meteorol. 2018, 6, 7–9. [Google Scholar] [CrossRef]
  35. Liu, Y.; Zhang, H.; Huang, X.; Chang, Y.; Zhang, J. Evaluation of climate suitability for winter sports in Shanxi Province. Drought Meteorol. 2019, 37, 173–179. [Google Scholar]
  36. Zhang, C. Current Status and Development Strategies of Winter Sports Tourism Resources Development and Utilization in Shenyang City. Ph.D. Thesis, Northeastern University, Shenyang, China, 2018. [Google Scholar]
  37. Zhou, X.; Gong, Q.; Zhao, C.; Cui, Y.; Liu, M. Suitability assessment of ice and snow climate resources in Liaoning Province. J. Meteorol. Environ. Sci. 2020, 36, 76–85. [Google Scholar] [CrossRef]
  38. Wang, X.R.; Zhao, R.; Yu, H.; Wang, L.S.; Wang, Q. Evaluation of theoretical snow cover period and skiing climate suitability: A case study of Changbai Mountain Ski Resort. Acta Ecol. Appl. 2020, 31, 1259–1266. [Google Scholar]
  39. Li, S.; Mao, W.; Chen, J.; Yao, J.Q.; Li, J.G.; Tuoliewubieke, D. Climate suitability and its changing characteristics of winter sports in northern Xinjiang. Adv. Clim. Change Res. 2021, 17, 537–547. [Google Scholar] [CrossRef]
  40. Wang, R. Evaluation of Winter Tourism Climate Suitability in Hotspots of China’s IST. Ph.D. Thesis, Harbin Normal University, Harbin, China, 2023. [Google Scholar]
  41. Wang, Y.X.; Yang, J.P.; Tang, F.; Ge, Q.; He, Q.; Dai, X. Analysis of the Reciprocal Feedback between Glacier Tourism Development and Regional Economic Growth in Hailuogou. Land 2023, 12, 24. [Google Scholar] [CrossRef]
  42. Zhang, Z.M. Spatiotemporal Distribution of Snow Cover and Its Response to Climate Change in Heilongjiang Province. Ph.D. Thesis, Heilongjiang University, Harbin, China, 2024. [Google Scholar]
  43. Cao, Y.Q.; Jiang, L.M. Power Spectra’s Perspective on Meteorological Drivers of Snow Depth Multiscale Behavior over the Tibetan Plateau. Land 2025, 14, 790. [Google Scholar] [CrossRef]
  44. Li, L.R.; Bai, Y.; Yuan, X.F.; Li, F. Assessing the Supply-Demand Matching and Spatial Flow of Urban Cultural Ecosystem Services: Based on Geospatial Data and User Interaction Data. Land 2025, 14, 773. [Google Scholar] [CrossRef]
  45. Du, H.; Wang, Z.; Li, H.; Zang, C. Analysis of Spatial and Temporal Pattern Evolution and Decoupling Relationships of Land Use Functions Based on Ecological Protection and High-Quality Development: A Case Study of the Yellow River Basin, China. Land 2024, 13, 862. [Google Scholar] [CrossRef]
  46. Kim, H.N.; Kim, J. Developing Indicators for the Valuation of River Ecosystem Services. Land 2025, 14, 2091. [Google Scholar] [CrossRef]
  47. Barnet, A.F.; Ciurana, A.B.; Pozo, J.X.O.; Russo, A.; Coscarelli, R.; Antronico, L.; De Pascale, F.; Saladié, Ò.; Anton-Clavé, S.; Aguilar, E. Climate services for tourism: An applied methodology for user engagement and co-creation in European destinations. Clim. Serv. 2021, 23, 100249. [Google Scholar] [CrossRef]
Figure 1. Main study area.
Land 15 00337 g001
Figure 2. Flowchart of the methodological framework for evaluating the potential level of IST development in Heilongjiang Province.
Land 15 00337 g002
Figure 3. Schematic diagram of LLM-assisted design.
Land 15 00337 g003
Figure 4. LDA topic consistency test change curve.
Land 15 00337 g004
Figure 5. Overall LDA analysis results.
Land 15 00337 g005
Figure 6. LDA analysis results for each topic. (a) Theme 1; (b) Theme 2; (c) Theme 3; (d) Theme 4.
Land 15 00337 g006
Figure 7. (a) Evaluation of natural resource development potential; (b) evaluation of socioeconomic development potential; (c) evaluation of regional transportation development potential; (d) evaluation of tourist appeal development potential.
Land 15 00337 g007
Figure 8. Evaluation of IST development potential in Heilongjiang Province.
Land 15 00337 g008
Figure 9. (a) Reclassification of natural environmental elements; (b) reclassification of socio-economic factors; (c) reclassification of location and transportation factors; (d) reclassification of tourist appeal factors.
Land 15 00337 g009aLand 15 00337 g009b
Figure 10. (a) High development potential distribution and overlapping areas; (b) middle development potential distribution and overlapping areas; (c) low development potential distribution and overlapping areas.
Land 15 00337 g010
Figure 11. Development pattern optimization recommendation diagram.
Land 15 00337 g011
Table 1. Data sources.
Data TypeData NameYear of DataResolution RatioData Source
DatabaseAdministrative boundary map2023\China Standard Map Service (CSMS) (http://bzdt.ch.mnr.gov.cn/ (10 June 2025)) and ArcGIS 10.7 Online (https://www.arcgis.com/ (10 June 2025))
Natural environment dataSnow depth2013–20230.05°ERA5-Land dataset (https://cds.climate.copernicus.eu/ (10 June 2025))
Snow cover2013–20230.05°ERA5-Land dataset (https://cds.climate.copernicus.eu/ (10 June 2025))
Number of days with snow2013–20230.05°ERA5-Land dataset (https://cds.climate.copernicus.eu/ (10 June 2025))
Air temperature2013–20230.05°ERA5-Land dataset (https://cds.climate.copernicus.eu/ (10 June 2025))
DEM 30 mhttps://www.gebco.net/ (10 June 2025)
Location traffic dataRoad \Open Street Map (OSM) (https://www.openstreetmap.org/ (10 June 2025))
Transportation stop \Open Street Map (OSM) (https://www.openstreetmap.org/ (10 June 2025))
Socioeconomic dataPopulation size2023Statistical dataWebsite of Heilongjiang Provincial Bureau of Statistics (https://tjj.hlj.gov.cn/ (10 June 2025))
Total output value2023Statistical dataWebsite of Heilongjiang Provincial Bureau of Statistics (https://tjj.hlj.gov.cn/ (10 June 2025))
Proportion of tertiary industry2023Statistical dataWebsite of Heilongjiang Provincial Bureau of Statistics (https://tjj.hlj.gov.cn/ (10 June 2025))
Infrastructure construction2023Statistical dataWebsite of Heilongjiang Provincial Bureau of Statistics (https://tjj.hlj.gov.cn/ (10 June 2025))
Tourism industry informationPOI2023\Online map platforms (Gaode, Baidu)
Table 2. National and Heilongjiang Provincial government policy documents related to IST.
Order NumberRelease TimeSubordinate to or Under the Command OfPrimary Publishing OrganizationName
12013National levelGeneral Office of the State CouncilNotice on Issuing the Outline of National Tourism and Leisure (2013–2020)
22016National levelNational Tourism AdministrationDevelopment Plan for Ice and Snow Sports (2016–2025)
32016National levelState Physical Culture AdministrationPublic Winter Sports Promotion and Popularization Program
42018National levelNational Tourism AdministrationNotice on Implementing the Main Responsibility of Tourism Market Supervision and Strengthening the Comprehensive Management of Hot Tourism Routes in Winter
52019National levelGeneral Office of the Central Committee of the Communist Party of China, General Office of the State CouncilOpinions on Developing Ice and Snow Sports in Beijing Winter Olympics in 2022
62021National levelMinistry of Culture and TourismAction Plan for the Development of IST (2021–2023)
72024National levelGeneral Office of the State CouncilSome Opinions on Stimulating the Vitality of Ice and Snow Economy by High-Quality Development of Ice and Snow Sports
82024National levelCentral Regional Coordination and Development Leading GroupImplementation Plan for Promoting High-quality Development of Ice and Snow Economy in Northeast China to Facilitate New Breakthroughs in Comprehensive Revitalization
92017Provincial levelHeilongjiang Province Tourism Development CommissionSpecial Plan for IST in Heilongjiang Province (2017–2025)
102020Provincial levelHeilongjiang Provincial People’s GovernmentDevelopment Plan of IST Industry in Heilongjiang Province (2020–2030)
112022Provincial levelHeilongjiang Provincial People’s GovernmentPlanning of the Economic Development of Ice and Snow in Heilongjiang Province
(2022–2030)
122022Provincial levelGeneral Office of the Heilongjiang Provincial People’s GovernmentSome Policy Measures to Support the Development of Ice and Snow Economy in Heilongjiang Province
132023Provincial levelGeneral Office of the Heilongjiang Provincial People’s Government50 Measures to Release Tourism Consumption Potential and Promote High-Quality Development of Tourism in Heilongjiang Province
142023Provincial levelGeneral Office of the Heilongjiang Provincial People’s GovernmentImplementation Plan of Developing Characteristic Cultural Tourism in Heilongjiang Province 2023–2025
152024Provincial levelGeneral Office of the Heilongjiang Provincial People’s GovernmentImplementation Plan of 2024–2025 Winter IST Hundred Days Action in Heilongjiang Province
162024Provincial levelGeneral Office of the Heilongjiang Provincial People’s GovernmentImplementation Plan of Heilongjiang Province on Stimulating the Vitality of Ice and Snow Economy by High-quality Development of Ice and Snow Sports
172022City levelHarbin Municipal People’s GovernmentHarbin City’s Several Policy Measures to Support the Development of Ice and Snow Economy
Table 3. Evaluation system of IST development potential.
Target LayerCriterion LayerIndex LevelElement Layer
Evaluation of the Potential of IST Resource DevelopmentNatural environment potentialClimate indicatorSnow depth, snow cover percentage, snow days, temperature
Geographic indicatorElevation, slope, aspect
Socio-economic potentialLevel of regional developmentRegional population, regional GDP, and proportion of the tertiary industry
Infrastructure constructionToilets per 10,000 population, per capita park green space area, public transport vehicles per 10,000 population, urban road area per capita
Location traffic potentialLocal traffic conditionsRoad network density, distribution of bus stops, regional accessibility
Tourist appealTourist appeal factorDistribution of Grade A scenic spots, number of star-rated hotels, distribution of dining venues, distribution of shopping venues, and distribution of leisure facilities
Table 4. Weighting Table for the Evaluation System of IST Development Potential.
Target LayerCriterion LayerIndex LevelElement Layer
Evaluation of the Potential of IST Resource DevelopmentNatural environment potential
(0.521)
Climate indicator
(0.382)
Deep snow (0.141)
Snow cover (0.111)
Snow days (0.085)
Temperature (0.045)
Geographic indicator
(0.139)
Elevation (0.061)
Slope (0.044)
Slope direction (0.034)
Socio-economic potential
(0.239)
Regional development level (0.171)Regional population (0.060)
Regional GDP (0.062)
Tertiary industry proportion (0.049)
Infrastructure construction
(0.068)
Toilets per 10,000 people (0.017)
Per capita park green space area (0.017)
Public transport vehicles per 10,000 population (0.016)
Per capita urban road area (0.018)
Location traffic potential
(0.172)
Local traffic conditions
(0.172)
Network density (0.056)
Bus stop distribution (0.055)
Regional accessibility (0.061)
Tourist appeal (0.068)Tourist appeal factor
(0.068)
Distribution of Grade A scenic spots (0.025)
Number of star-rated hotels (0.021)
Distribution of dining locations (0.008)
Shopping location distribution (0.007)
Distribution of recreational facilities (0.007)
Table 5. Classification of development potential evaluation of IST.
Target LayerCriterion LayerIndex LevelElement LayerFactor Grade Classification
Low Development Potential (1)Low Development Potential (3)Medium Development Potential (5)High Development Potential (7)High Development Potential (9)
Evaluation of the Potential of IST Resource DevelopmentNatural environment potentialClimate indicatorSnow depth
(unit: cm)
0~1010~2020~3030~4040 or more
Snow cover
(unit: %)
0~4040~6060~7070~8080~100
Snow days
(unit: day)
0~3030~6565~8585~100100~135
Air temperature
(unit: ℃)
−16~−18−14~−16−8~-10−10~−12−12~−14
Geographic indicatorAltitude
(unit: m)
0~195195~347347~527527~763763~1694
Falling gradient
(unit: °)
16.6 and above10.5~16.65.9~10.52.3~5.90~2.3
Aspect
(unit: none)
West slopeSouthwest and northwest slopesDongpoSoutheast and northeast slopesSouth slope, north slope
Socio-economic potentialLevel of regional developmentPopulation of a region
(unit: person)
16,359~145,876145,877~292,755292,756~500,327500,328~811,178811,179~1,390,679
Gross regional product
(unit: 100 million yuan)
168~409.2409.2~664.7664.7~13181318~29882988.6~5490.1
Proportion of tertiary industry
(unit: %)
31.8~34.634.6~38.738.7~40.640.6~47.247.2~64.4
Infrastructure constructionToilets per 10,000 people
(unit: seat)
1.2~1.61.6~2.82.8~4.34.3~5.95.9~6.7
Per capita park green space area
(unit: square meter)
10.4~11.511.5~15.615.6~16.916.9~18.618.6~40.8
Public transport vehicles per 10,000 population
(unit: standard unit)
6.3~7.47.4~10.910.9~1313~15.615.6~31
Per capita urban road area
(unit: square meter)
11.5~12.412.4~13.413.4~1515~17.217.2~27.1
Location traffic potentialLocal traffic conditionsRoad network density
(unit: km2)
0~0.20.2~0.430.43~0.890.89~1.731.73~3
Bus stop distribution0~162.36162.36~669.73669.73~1451.091451.09~2039.642039.64~2587.61
Regional accessibility
(unit: none)
593~987385~593238~385118~2383~118
Tourist appealTourist appeal indexGrade A scenic areas
(unit: individual)
0~0.80.8~1.91.9~2.62.6~4.34.3~7.4
Star-rated hotels
ditto
0~0.20.2~0.60.6~1.11.1~1.61.6~2.3
Catering locations
ditto
0~11.211.2~43.243.2~131.2131.2~265.6265.6~408.1
Shopping locations
ditto
0~19.519.5~81.381.3~256.9256.9~536.6536.6~829.9
Recreation facilities
ditto
0~11.711.7~42.342.3~122.5122.5~243.6243.6~371.9
Table 6. Score ranges for development potential of various elements.
ElementScore Value
Natural Environment4.233–4.777
Socioeconomic Conditions0.371–1.862
Location and Transportation Accessibility0.958–0.172
Tourism Industry Development0.068–0.500
Table 7. Grading standard of IST development potential in Heilongjiang Province.
Development Potential Level ZoningDevelopment Potential Score RangeArea Ratio
High development potential≥5.06819.56
High development potential4.676~5.06831.16
Moderate development potential4.268~4.67625.38
Low development potential3.709~4.26819.41
Low development potential2.454~3.7094.49
Disclaimer/Publisher’s Note: The statements, opinions and data contained in all publications are solely those of the individual author(s) and contributor(s) and not of MDPI and/or the editor(s). MDPI and/or the editor(s) disclaim responsibility for any injury to people or property resulting from any ideas, methods, instructions or products referred to in the content.