


Abstract
The Qaidam Basin is situated in the arid region of northwestern China, characterized by extensive areas of saline–alkali land and significant soil salinization, which severely impedes the sustainable development of local agriculture. This study focuses on the saline soils of the Qaidam Basin Artificial grassland, where 109 surface soil samples (0–20 cm depth) were collected to analyze the salinity characteristics and soil fertility across varying degrees of salinization. The relationship between soil salinity ions and soil fertility indicators is investigated. The results indicate: (1) All samples were categorized into five salinization levels based on total salt content: non-salinized, lightly salinized, moderately salinized, heavily salinized, and saline soil, with average total salt contents of 0.75, 2.30, 3.45, 8.90, and 14.95 g/kg, respectively. Among the soil salt ions, the anion SO42− constituted the highest proportion. The primary anionic components in the study area were SO42− and Cl−, while the predominant cations were Na+ and Ca2+. As salinity increased, the proportion of Na+ and Cl− within the total ions gradually increased, whereas the proportions of Ca2+, Mg2+, and HCO3− ions progressively decreased. (2) As salinity increased, soil total nitrogen, total phosphorus, total potassium, alkali-hydrolysable nitrogen, and available potassium content all showed an upward trend, while soil pH exhibited a downward trend. Soil organic matter content fluctuated across different salinity levels, but no significant differences were observed in organic matter content between soils of varying salinity degrees. (3) The correlation analysis revealed that the contents of total nitrogen, total phosphorus, total potassium, alkali-hydrolysable nitrogen, and readily available potassium were highly positively correlated with total salinity. Among these, the strongest correlation was observed between total salinity and readily available potassium, with a correlation coefficient of 0.828, followed by total nitrogen at 0.767. The pH level exhibited a highly significant negative correlation with total salinity, while demonstrating a highly significant positive correlation with HCO3−. Soil organic matter demonstrated highly significant positive correlations with K+ and SO42−, along with a significant positive correlation with Ca2+. (4) Redundancy analysis indicated a negative correlation between soil organic matter and HCO3−, while total nitrogen, total potassium, alkali-hydrolysable nitrogen, available phosphorus, and available potassium were positively correlated with K+. In both non-salinized and saline soils, the pH level showed a positive correlation with HCO3−. K+ and Na+ exerted substantial influence on soil fertility, and as salinization increased, the impact of total salinity on soil fertility progressively intensified. This study aims to analyze the relationship between soil salinity and soil fertility, facilitating subsequent in-depth investigations into the spatial variation characteristics of soil fertility and salinity. It endeavors to provide a theoretical basis for the remediation of saline–alkali soils in the Qaidam Basin.
1. Introduction
Soil is regarded as a vital foundation for agricultural production, playing an essential role in agricultural development and ecological conservation. Soil salinization is now recognized as a significant challenge in constraining the sustainable development of global agriculture. The rational development and utilization of saline–alkali soils is prioritized as it holds considerable importance for achieving sustainable agricultural development [1]. Saline soils are collectively referred to as various soil types characterized by elevated soluble salt content, adversely affecting overall soil properties and plant growth [2]. In 2023, China elevated the strategic priorities of arable land conservation and the comprehensive remediation of saline–alkali land. The management strategy for saline–alkali land in the nation involves combining ‘adapting crops to land’ and ‘adapting land to crops’, with an emphasis on categorized approaches and phased development. The transformation of existing saline–alkali farmland is coordinated with the measured development of reserve resources, which is of significant strategic importance for safeguarding food security, consolidating its foundations, expanding agricultural production space, and ensuring sustainable agricultural development. According to UNESCO and FAO estimates, the global area of saline–alkali land is about 955 million hectares, of which approximately 99.14 million hectares are located in China. Moreover, the area of saline–alkalized soil is still expanding at a rate of 1–2 million hectares per year [3,4]. The widespread presence of saline–alkali soils can adversely affect crop growth, soil nutrient retention, and the ecological environment, and may also reduce crop quality and yield [5]. The saline–alkali lands in China’s northwestern region are characterized by diverse types and complex origins, with extensive areas of saline–alkali soils widely distributed. The Qaidam Basin is recognized as an inland saline–alkali zone in the northwest, located in northwestern Qinghai Province. Due to its climatic and topographical features, elevated soil salinity levels are observed, resulting in pronounced soil salinization and extensive saline–alkali land. Qinghai Province is reported to have approximately 3.2 million hectares of saline–alkali land, with 20 to 30 million mu of saline–alkali wasteland deemed suitable for conversion into arable land [6]. Over 90% of Qinghai’s total saline–alkali land area is accounted for by the Qaidam Basin, presenting considerable potential for development and utilization. The basin’s agricultural soils are predominantly characterized by sulphate-chloride and chloride-sulphate salt composition types [7]. Soil fertility is defined as the comprehensive capacity of soil to sustainably and harmoniously supply air, temperature, nutrients, and non-toxic substances required for plant growth [8,9]. Higher concentrations of soluble salts in saline–alkali soils are associated with not only impacts on plant growth and development through impaired water absorption, osmotic stress, ionic toxicity, and nutrient imbalance [10], but also negative influences on multiple aspects including soil physicochemical properties and productivity. As living standards rise, the demand for livestock products grows, leading to an increasingly apparent shortage of forage resources. The Qaidam Basin is dominated by desert vegetation. Unsustainable use of natural grasslands over the long term, coupled with human disturbances such as indiscriminate land reclamation and overgrazing, are associated with grassland degradation, reduced productivity, and deteriorating ecological conditions. Livestock production and sustainable ecological development are both adversely affected by this situation. In this context, forage crops cultivation on saline–alkali wasteland is proposed as a viable solution to address forage shortages and alleviate livestock pressure. Significant importance for both food security and livestock production is associated with this approach. In recent years, planting salt-tolerant plants has been identified as an effective biological measure for managing saline–alkali land among various remediation methods, representing a dual-benefit model promoting both ecological restoration and productive output [11]. Artificial grasslands are defined as those cultivated through human planting and management, employing measures such as reseeding, fertilization, and irrigation [12]. The establishment of artificial grassland is associated with high-quality fodder provision to alleviate the grass-livestock conflict and possesses robust ecological restoration functions, including preventing soil erosion and curbing the progression of secondary soil salinization and desertification [13].
Numerous studies have been conducted on the impact of soil salinization on soil fertility [14,15], with analytical methods such as correlation analysis, principal component analysis, and redundancy analysis employed to characterize variations in salinity and nutrient content. Soil properties are known to exhibit spatial variability across different regions, with contributing factors to salinized soil formation being complex and diverse. Some progress has been achieved in research on soil salinization in the Qaidam Basin. Prior work has detailed the types and causes of saline–alkali soils in the basin [16,17,18]. The formation of saline–alkali soils is attributed to the combined effects of human activities and natural factors, and is categorized into desert saline soils, meadow saline soils, marsh saline soils, and lakeshore salt flats. Zhang Defang et al. [19] analyzed salinity characteristics by collecting soil samples from different land-use types within the Qaidam Basin, identifying dominant ion types and delineating suitable cultivation zones for the soil samples. In a study by Li Songyang et al. [20], the salinity and nutrient characteristics of Waya Farm in Wulan County, Haixi Prefecture, Qinghai Province, were analyzed. It was indicated that the study area was primarily characterized by chloride-type salinization, with a pronounced surface aggregation of salts in the topsoil. Sampling and remote sensing methods were employed by Zhou Lei et al. [21] to assess the spatiotemporal dynamics of soil salinization in the Qaidam Basin from 2000 to 2015. An overall decreasing trend in both the extent and severity of soil salinization across the basin was revealed in the findings. Specifically, areas of severe salinization were reduced in size and intensity, whereas regions with low and moderate salt accumulation increased in area. Currently, research on artificial grasslands in the saline–alkali soils of the Qaidam Basin is predominantly focused on the introduction and screening of salt-tolerant forage grasses, the evaluation of yield traits, and adaptation assessments. However, the relationship between soil salinity and key nutrient indicators in these saline–alkali soils, along with their spatial variation characteristics, has rarely been studied. Therefore, the investigation of salinization characteristics and spatial variation in saline–alkali soils in artificial grassland areas within the Qaidam Basin is considered to hold significant theoretical and practical value. This study focuses on soils of varying salinity levels, classified according to their distribution within artificial grassland planting zones. The relationship between soil salinity and soil fertility is analyzed using correlation analysis and redundancy analysis. This work provides a basis for further investigation into the spatial variation in soil fertility and salinity in the study area, aiming to supply a theoretical foundation for the scientific planning of artificial grasslands and for the remediation and utilization of saline–alkali soils in the Qaidam Basin.
2. Materials and Methods
2.1. Overview of the Study Area
The Qaidam Basin is situated within an arid, inland desert region, which is known for a highland continental climate. Severe aridity and cold conditions are experienced in the basin, where the average annual temperature is approximately 3 °C. Evaporation is intense, while precipitation is scarce and unevenly distributed, decreasing from the southeast to the northwest. Significant salt accumulation can be observed in the topsoil, and extensive areas of saline–alkali land are evident. Delingha City, which is located in the northeastern part of the Qaidam Basin, features complex topography at an average elevation of approximately 3000 m. Its geographic coordinates range from 36°55′ N to 38°22′ N and 96°15′ E to 98°15′ E. The landforms are diverse, exhibiting a south-low and north-high topographic gradient. According to the Köppen climate classification system, Delingha City falls under the cold desert (BWk) climate type [22]. It exhibits typical highland inland desert characteristics: year-round aridity, cold winters, long sunshine duration, and significant diurnal temperature variation.
2.2. Soil Sample Collection and Analytical Methods
The sampling sites were located in forage cultivation bases within Gaha Town and Xuji Township, Delingha City. Both bases consisted of approximately rectangular areas, collectively covering 35.4 square kilometers, and were planted with annual forage oats. Soil sampling was collected post-harvest of the 2023 forage oats, spanning the dates of 17–20 October 2023. Sampling was performed at a depth of 0–20 cm using an S-shaped five-point sampling pattern, where soil from five points was composited into one sample. Sampling points had a spacing of approximately 500 m, resulting in a total of 109 soil samples. The latitude and longitude of each sampling point were accurately recorded using GPS. Soil samples were purged of stones, plant roots, and other debris, thoroughly mixed, and divided into four equal portions. Approximately 1 kg from each portion was gathered and transported to the laboratory for air-drying under well-ventilated, cool, and dry conditions. After drying, the samples were subject to grinding and sieving for the separate determination of soil fertility and salinity indices. Soil fertility indicators were ascertained using methods outlined in “Soil and Agricultural Chemistry Analysis” [23]. The main instrument used was the PinAAcle 900T atomic absorption spectrometer (PerkinElmer, MA, USA).Soil organic matter (OM) was determined via the potassium dichromate external heating method; total nitrogen (TN) employed the semi-micro Kjeldahl method; total phosphorus (TP) was analyzed using the HCIO4-H2SO4 method; total potassium (TK) was measured through the NaOH fusion and flame photometric method;available nitrogen (AN) was determined with the alkaline diffusion method; available phosphorus (AP) was analyzed via NaHCO3 extraction followed by molybdenum-antimony colourimetric analysis; available potassium (AK) utilized flame photometry; and pH was assessed by PHS-2F model pH meter(Leici, Shanghai, China). Total salt content was analyzed gravimetrically; CO32− and HCO3− were quantified via double-indicator neutralization titration; Cl− was assessed with silver nitrate titration; SO42− was measured through indirect titration with EDTA; Ca2+ and Mg2+ were quantified using EDTA complexation; K+ and Na+ were determined by flame photometry. Owing to the negligibly low concentration of CO32− ions, which fell below the detection limit, these ions were excluded from the analysis.
2.3. Data Processing and Soil Salinization Classification Standards
The classification criteria for soil salinization in this study were derived from the Qinghai Province Haixi Prefecture Agricultural Soil Salinization Grading Standards which were established during the Second National Soil Survey [24]. All samples were categorized into five salinization levels based on total salt content: non-salinized (salinity < 2 g/kg), lightly salinized (salinity ≥ 2, <3 g/kg), moderately salinized (salinity ≥ 3, <5 g/kg), heavily salinized (salinity ≥ 5, <10 g/kg), and saline soil (salinity ≥ 10 g/kg). Soil fertility grading standards were established according to the nutrient classification criteria from the Second National Soil Survey [25] (Table 1). The evaluation results for nutrient sufficiency/deficiency across various salinization levels are detailed in Table 2. Data collation and analysis were performed with Microsoft Office Excel 2021 and IBM SPSS Statistics 27 software. SPSS 27 facilitated normality testing, non-parametric tests, and correlation analysis. Since the Kolmogorov–Smirnov test for normality indicated only total phosphorus met the normality assumption, non-parametric Kruskal–Wallis tests were utilized for significant analysis of soil fertility indicators. Graphical representations were created utilizing OriginPro 2024b software.
Table 1.
Nutrient Classification Standards of the second national soil survey.
Table 2.
Evaluation of the abundance and scarcity of soil fertility indicators for different degrees of salinization.
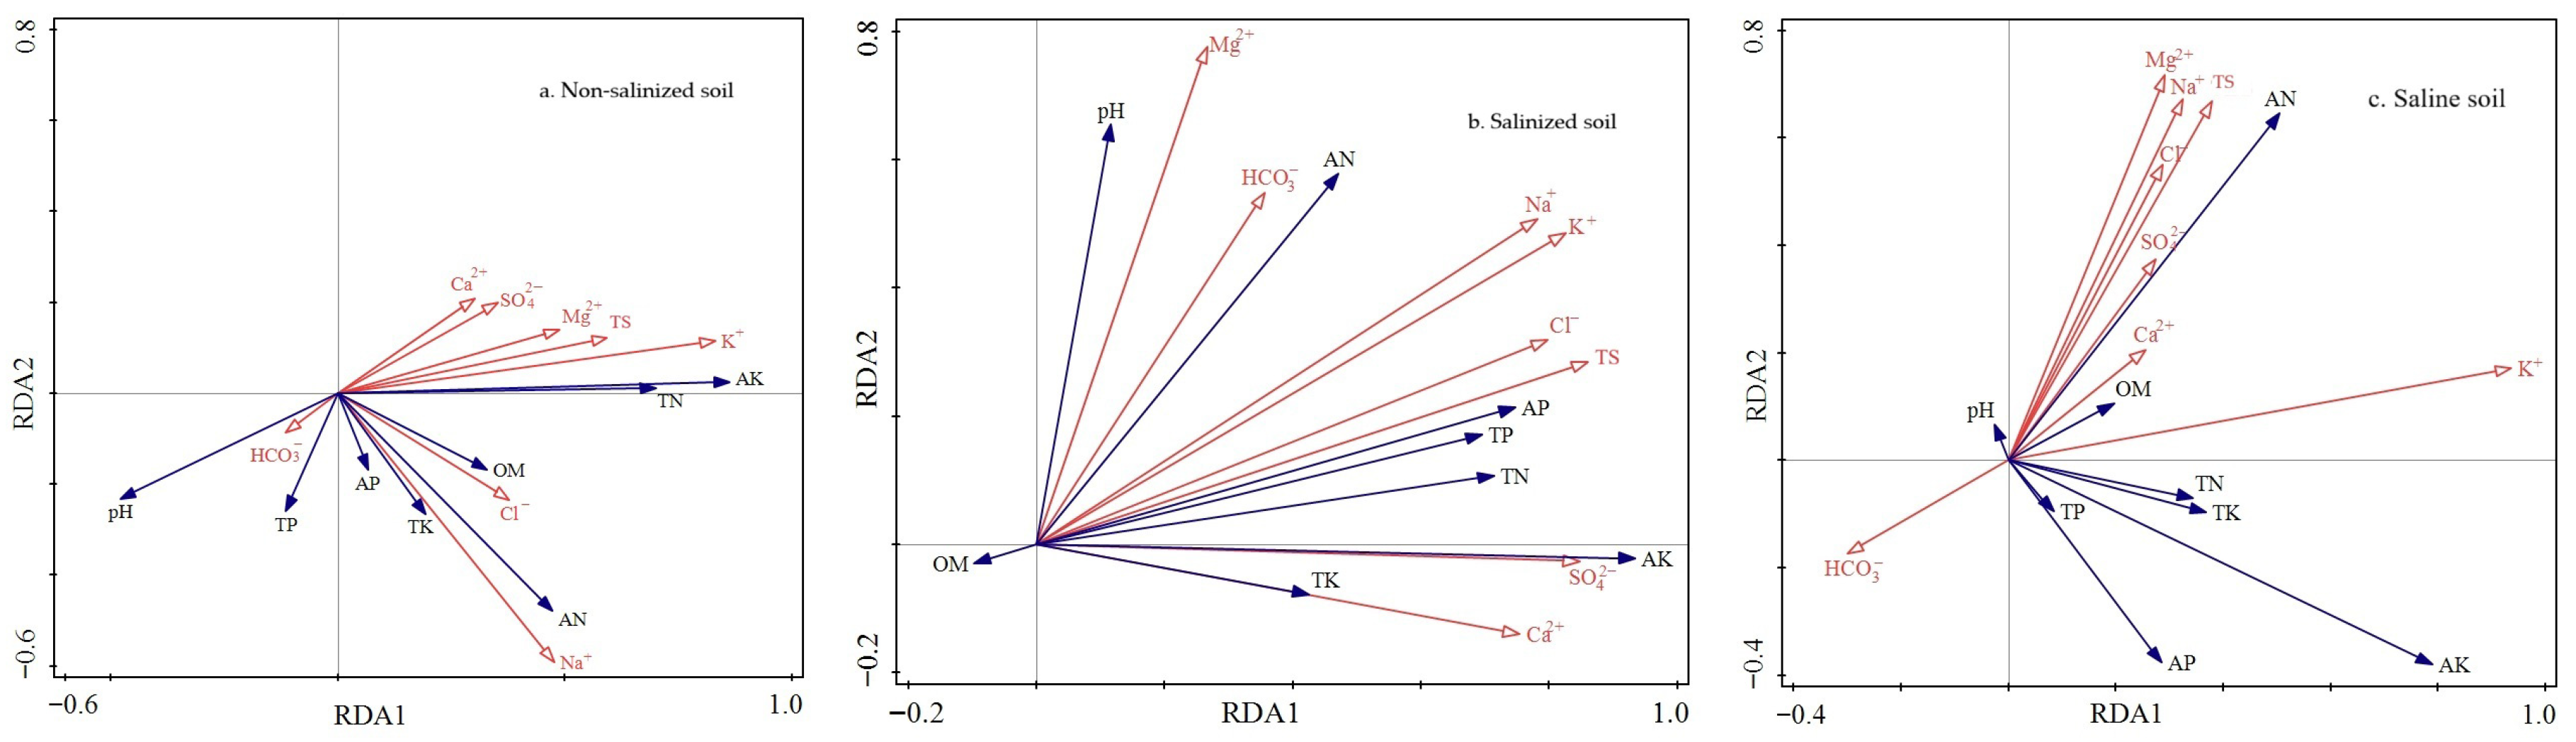
Redundancy analysis (RDA) was executed with Canoco 5.0 software to examine soil fertility and salinity across varying degrees of salinization. For the purpose of highlighting salinization characteristics, soils classified as lightly, moderately, and heavily salinized were consolidated into a single salinized soil category. All samples were subsequently divided into three groups based on soil salinity content: saline soil (salinity ≥ 10 g/kg), salinized soil (salinity 2–10 g/kg), and non-salinized soil (salinity < 2 g/kg). Linear ranking plots were constructed for each respective category. With salinity indicators acting as explanatory variables (red arrows), the following salt ions were selected: Mg2+, Ca2+, Na+, K+, SO42−, Cl−, HCO3−, and total salt content (TS). Soil fertility indicators, including TN (total nitrogen), TP (total phosphorus), TK (total potassium), AN (available nitrogen), AP (available phosphorus), AK (available potassium), OM (organic matter), and pH, served as response variables (blue arrows). In the examination of the three soil types (non-salinized, salinized, and saline soils), the first two RDA axes displayed eigenvalues of 0.6972/0.0199, 0.8254/0.0232, and 0.4180/0.2666 respectively, with subsequent axes showing a steep decline in eigenvalues. The cumulative variation explained by the initial two axes ranged between 68.46% and 84.86%, with cumulative variation fitting rates from 97.50% to 98.87%. Since the third axis contributed less than 1.23% of the variation, only the first two axes were preserved for subsequent analysis. The first two axes were chosen for constructing a two-dimensional ordination plot of response variables versus explanatory variables. The rays with arrows in the plot depicted fertility and various salinity indicators, with arrow length indicating the strength of the relationship between soil salinity and fertility indicators. The angle between the rays illustrated the correlation between different indicator variables. An acute angle signified a positive correlation, with a smaller acute angle denoting a stronger association between indicators. Conversely, an obtuse angle indicated a negative correlation [26].
3. Results
3.1. Differences in Ion Composition Among Various Salinized Soils
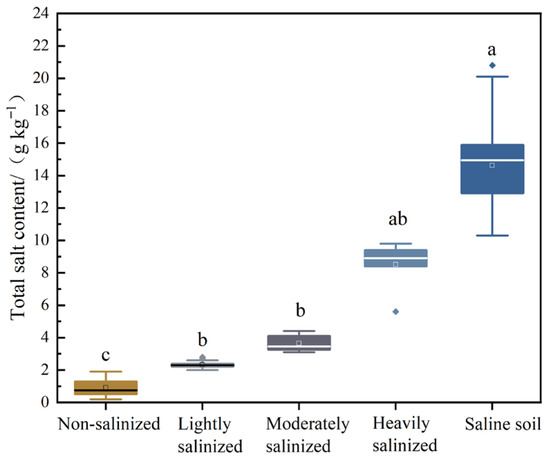
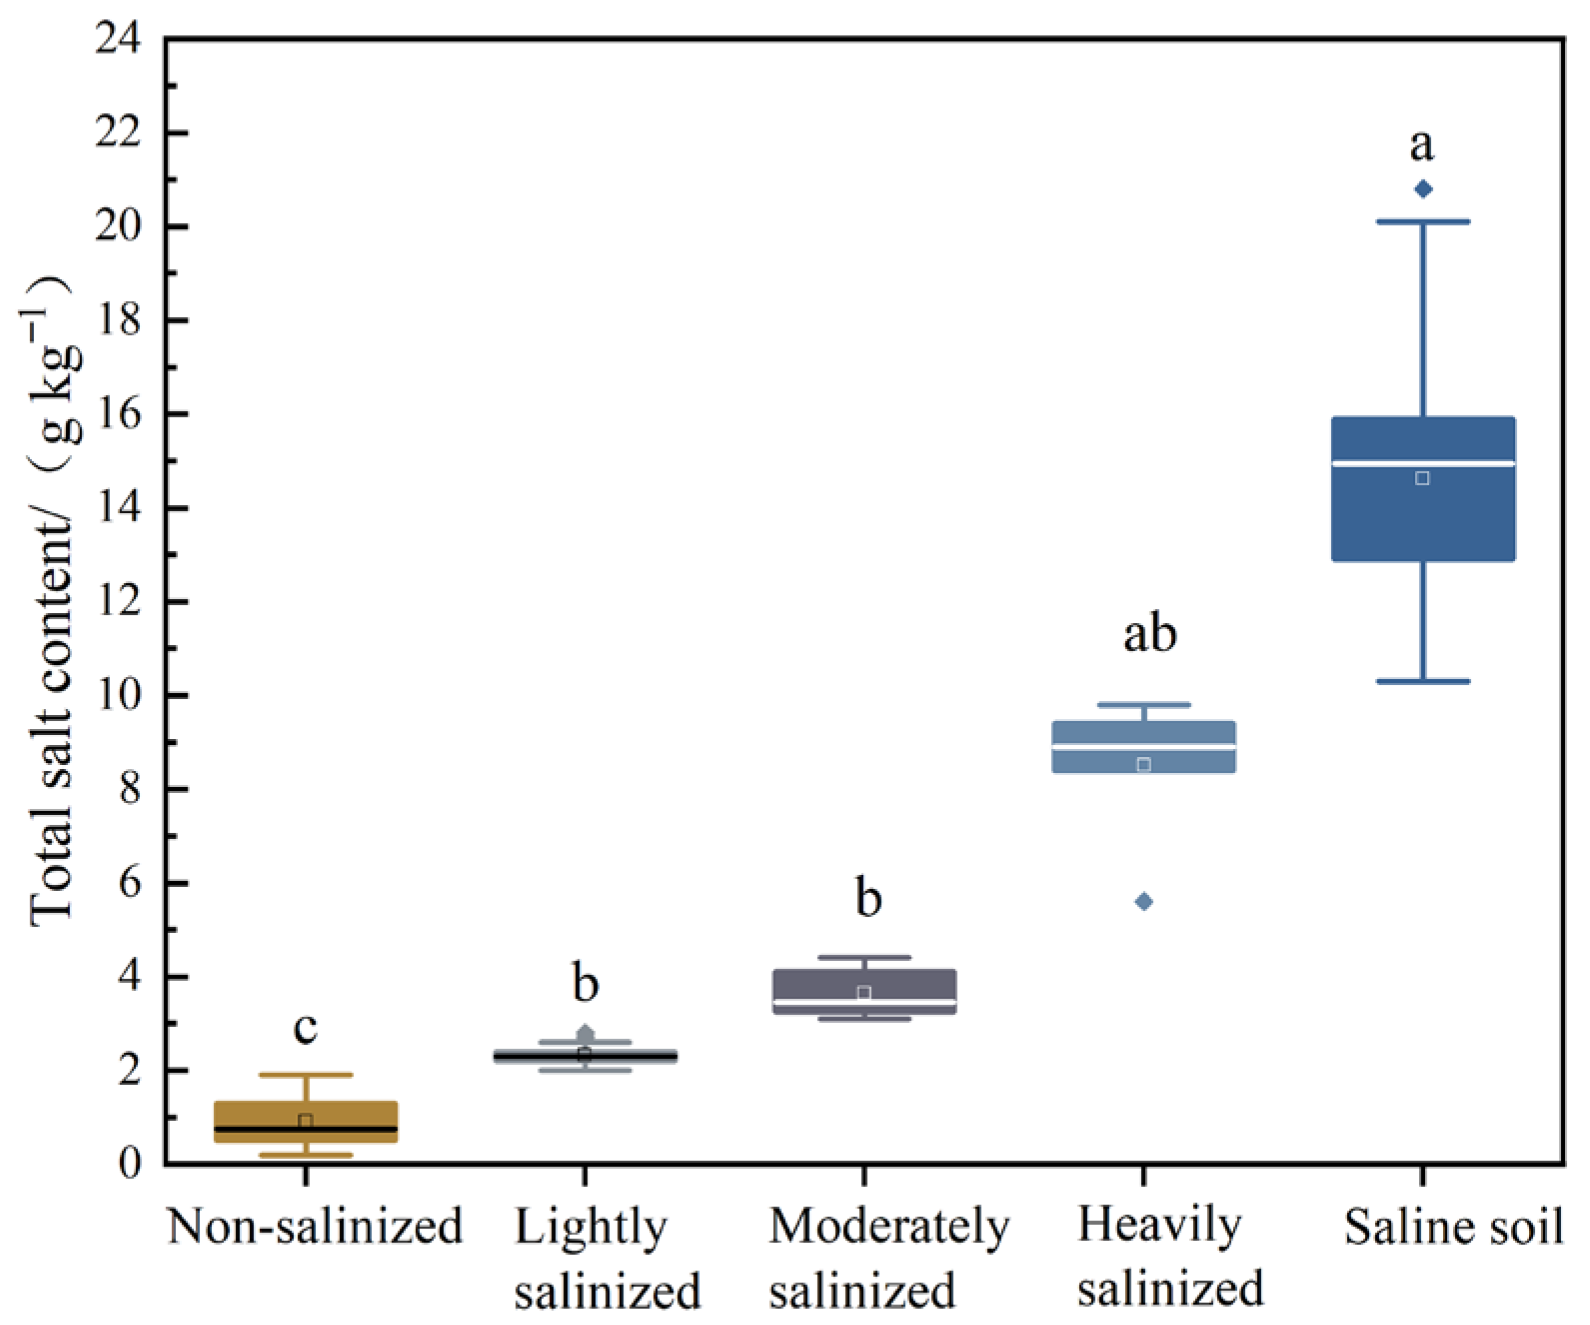
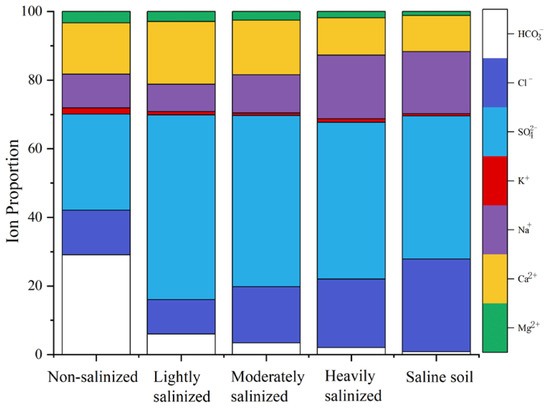
As shown in Figure 1, statistical results for total salt content across different levels of soil salinization indicate values of 0.75, 2.30, 3.45, 8.90, and 14.95 g/kg for non-salinized, lightly salinized, moderately salinized, heavily salinized, and saline soil, respectively. The specific ranges for total salt content are 0.2–1.9, 2.0–2.8, 3.1–4.4, 5.6–9.8, and 10.3–20.8 g/kg, respectively. Total salt content demonstrated an increasing trend with escalating salinization levels. Figure 2 presents a cumulative distribution plot of soil salt ion percentages across five salinization grades. Among these five salinization levels, SO42− accounted for the highest proportion. Conversely, non-salinized soils feature the highest concentration of HCO3− ions. Notably, SO42− constituted up to 53.8% in lightly salinized soils. Compared to lightly saline soils, the ion proportions of Na+ and Cl− significantly increased in saline soils. Conversely, HCO3−, Mg2+, and Ca2+ exhibited decreasing trends. K+ consistently accounted for the lowest proportion across all salinity levels. The ionic composition predominantly featured anions, primarily SO42− and Cl−, while cations were mainly Na+ and Ca2+.
Figure 1.
Total salt content in soil at different levels of salinization. Note: Significant differences between salinity classes are labeled with different letters; solid lines within the box represent the median, the upper and lower margins of the box are the 25th and 75th percentiles, respectively, and solid dots represent anomalous data.
Figure 2.
Percentage stacking statistics of each salt ion content in different salinized soils.
3.2. Organic Matter and pH Values in Soils with Varying Degrees of Salinization
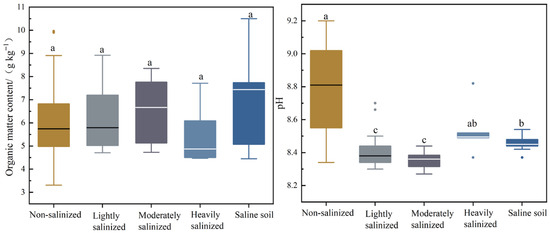
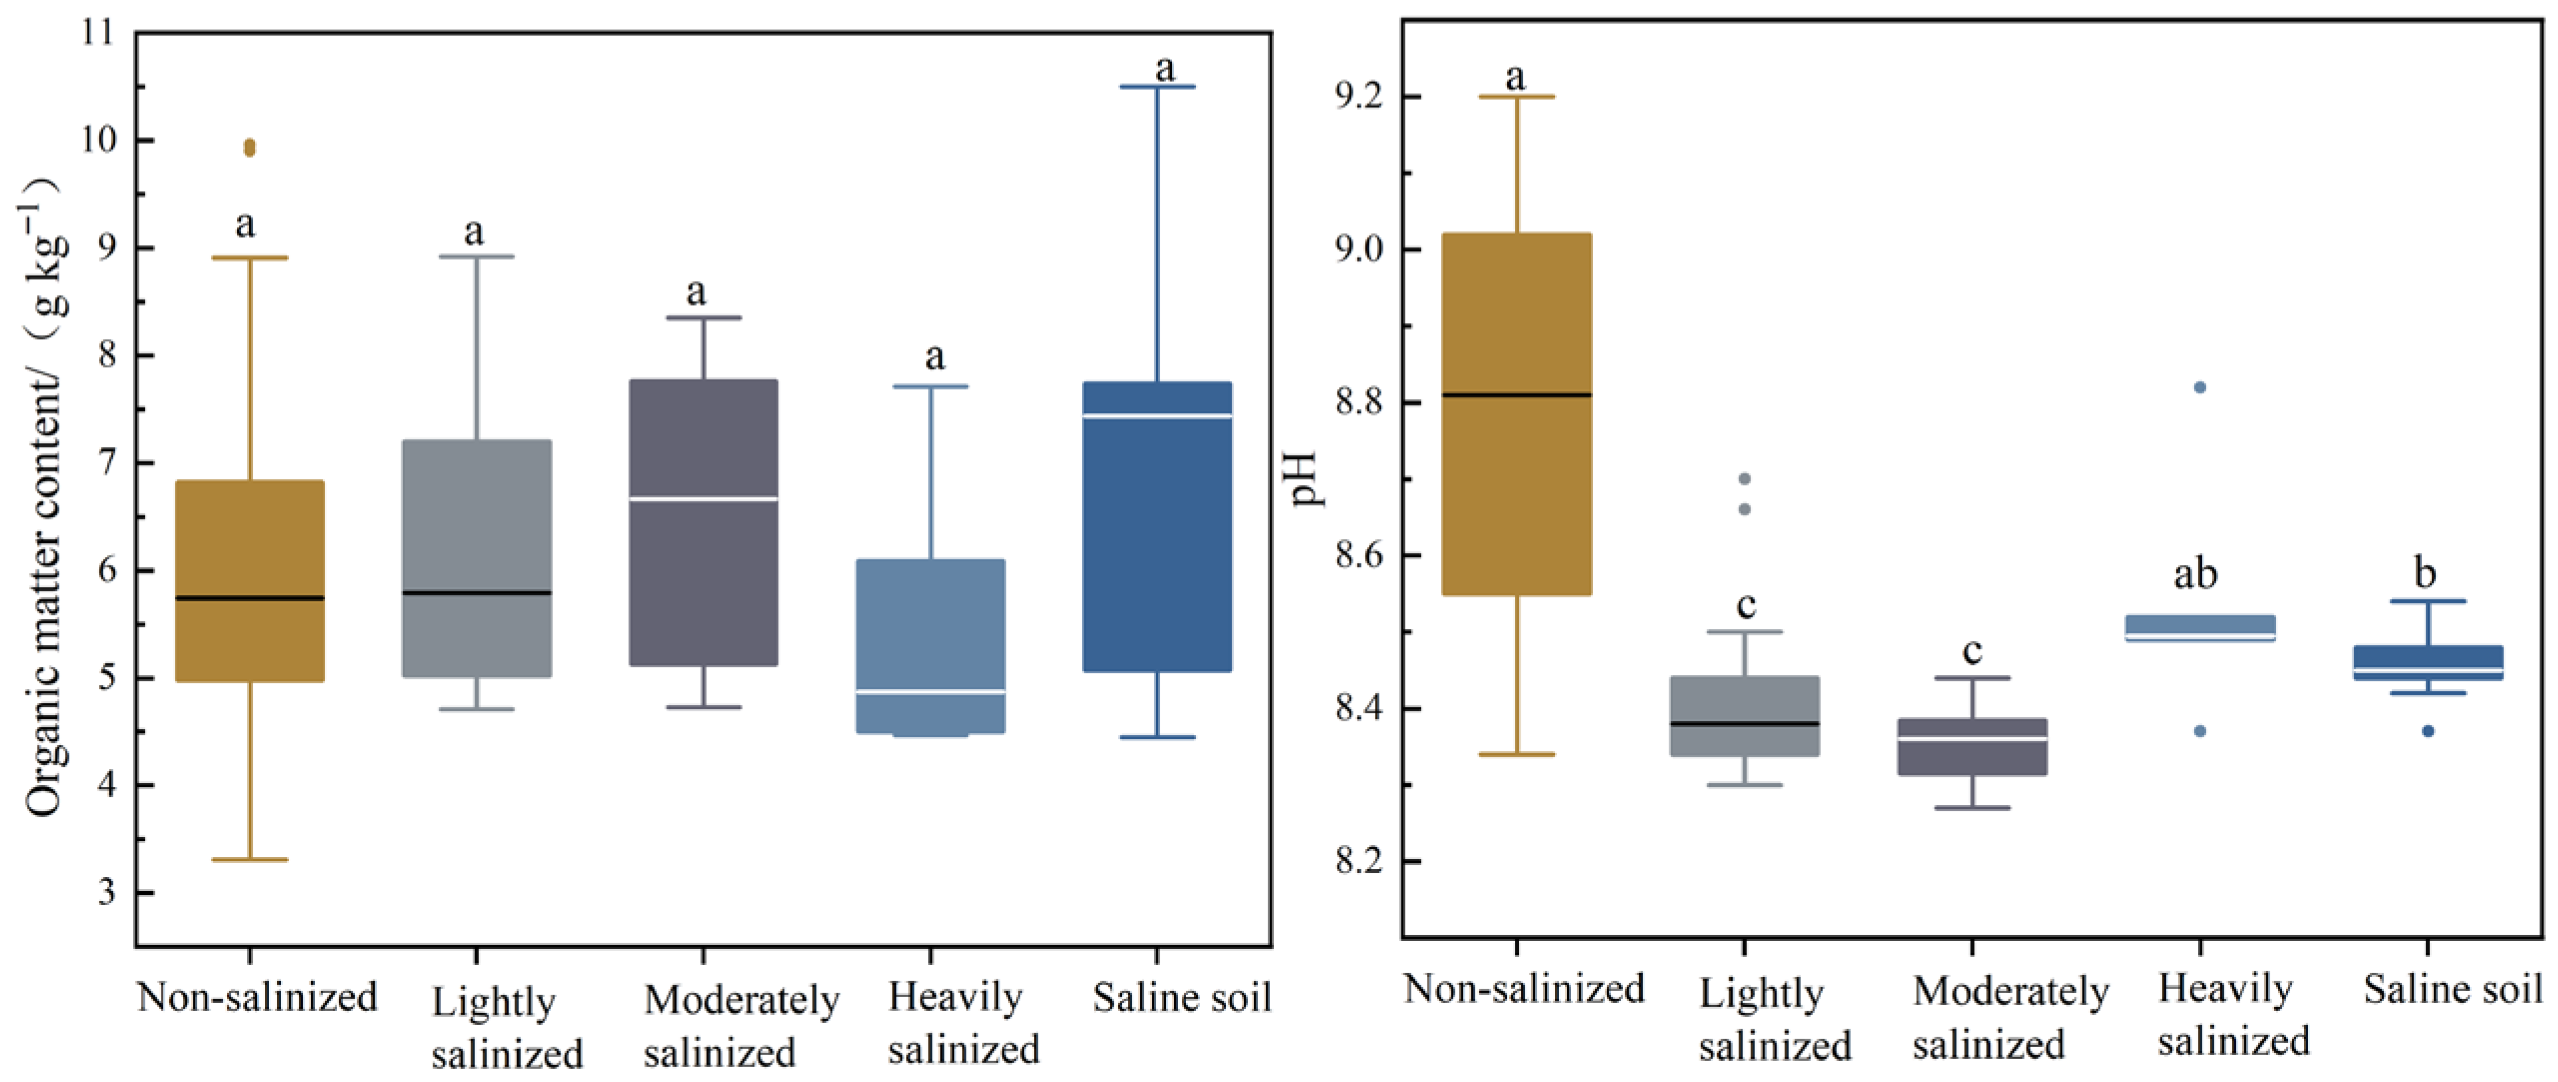
As shown in Table 2 and Figure 3, the soil organic matter content for non-salinized, lightly salinized, moderately salinized, heavily salinized, and saline soil grades was 5.75, 5.79, 6.67, 4.88, and 7.44 g/kg respectively. While organic matter content fluctuated across salinization grades, no significant differences were observed between soils of varying salinization levels. The pH values for non-salinized, lightly salinized, moderately salinized, heavily salinized, and saline soil grades were 8.81, 8.38, 8.36, 8.50, and 8.45 respectively. Across salinization categories, pH values exhibited an overall decreasing trend. Compared to non-salinized soils, the pH of lightly salinized, moderately salinized, and saline soils was significantly lower by 4.9%, 5.1%, and 4.1% respectively. (p < 0.05), representing an average reduction of 4.7%.
Figure 3.
Contents of soil organic matter (OM) and Soil pH (pH) under different salinization grades. Note: Significant differences between salinity classes are labeled with different letters; solid lines within the box represent the median, the upper and lower margins of the box are the 25th and 75th percentiles, respectively, and solid dots represent anomalous data.
3.3. Total Nutrient Content in Different Salinized Soils
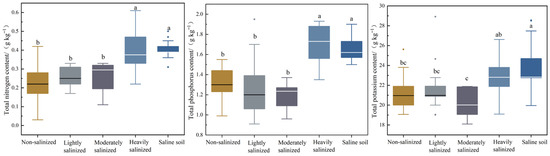
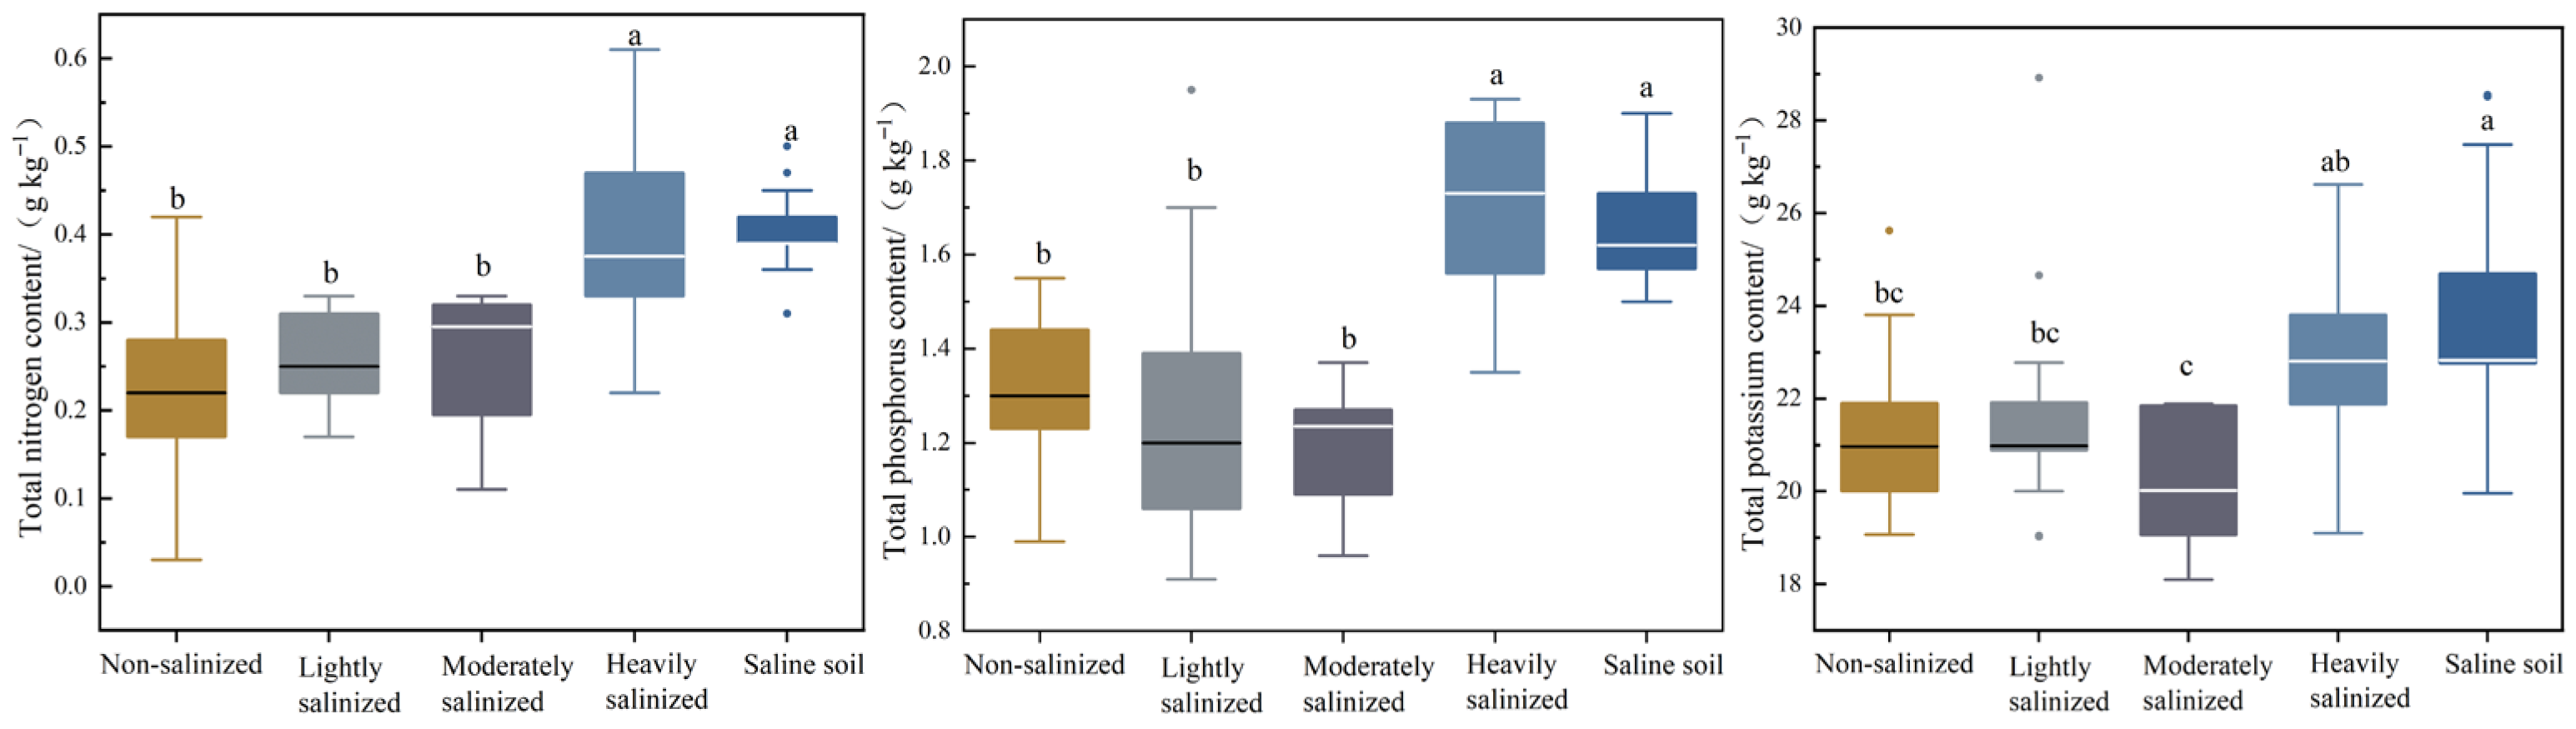
As shown in Figure 4. The total nitrogen content in soils classified as non-salinized, lightly salinized, moderately salinized, heavily salinized, and saline soils was 0.22, 0.25, 0.30, 0.38, and 0.39 g/kg respectively. Saline soils exhibited the highest total nitrogen content, showing significant increases of 77.3%, 56.0%, and 30.0% (p < 0.05) compared to non-salinized, lightly salinized, and moderately salinized soils respectively, with an average increase of 54.4%. Soil fertility grading criteria were established based on the nutrient classification standards from the Second National Soil Survey to evaluate fertility deficiency levels across different salinization grades (Table 2). It was observed that the total nitrogen content across various salinization grades falls within the extremely poor range. Total phosphorus content in non-salinized, lightly salinized, moderately salinized, heavily salinized, and saline soils was 1.30, 1.20, 1.24, 1.73, and 1.62 g/kg respectively. Total phosphorus in saline and heavily salinized soils was significantly higher than in non-salinized soil by 24.6% and 33.1% respectively (p < 0.05), with an average increase of 28.9%. Total phosphorus content across all salinization grades was extremely rich (see Table 2). Total potassium content in non-salinized, lightly salinized, moderately salinized, heavily salinized, and saline soils was 20.97, 20.98, 20.02, 22.81, and 22.83 g/kg respectively, with saline soils exhibiting significantly higher total potassium levels than non-salinized, lightly salinized, and moderately salinized soils by 8.9%, 8.8%, and 14.0% respectively (p < 0.05). Total potassium content generally increased with higher salinization levels, with all salinization grades exhibiting rich potassium levels.
Figure 4.
Total nitrogen (TN), total phosphorus (TP), and total potassium (TK) under different salinization grades. Note: Significant differences between salinity classes are labeled with different letters; solid lines within the box represent the median, the upper and lower margins of the box are the 25th and 75th percentiles, respectively, and solid dots represent anomalous data.
3.4. Available Nutrient Content in Different Salinized Soils
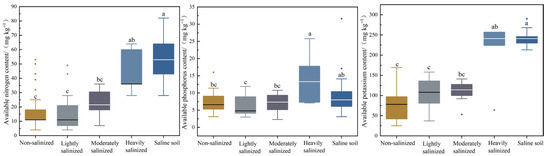
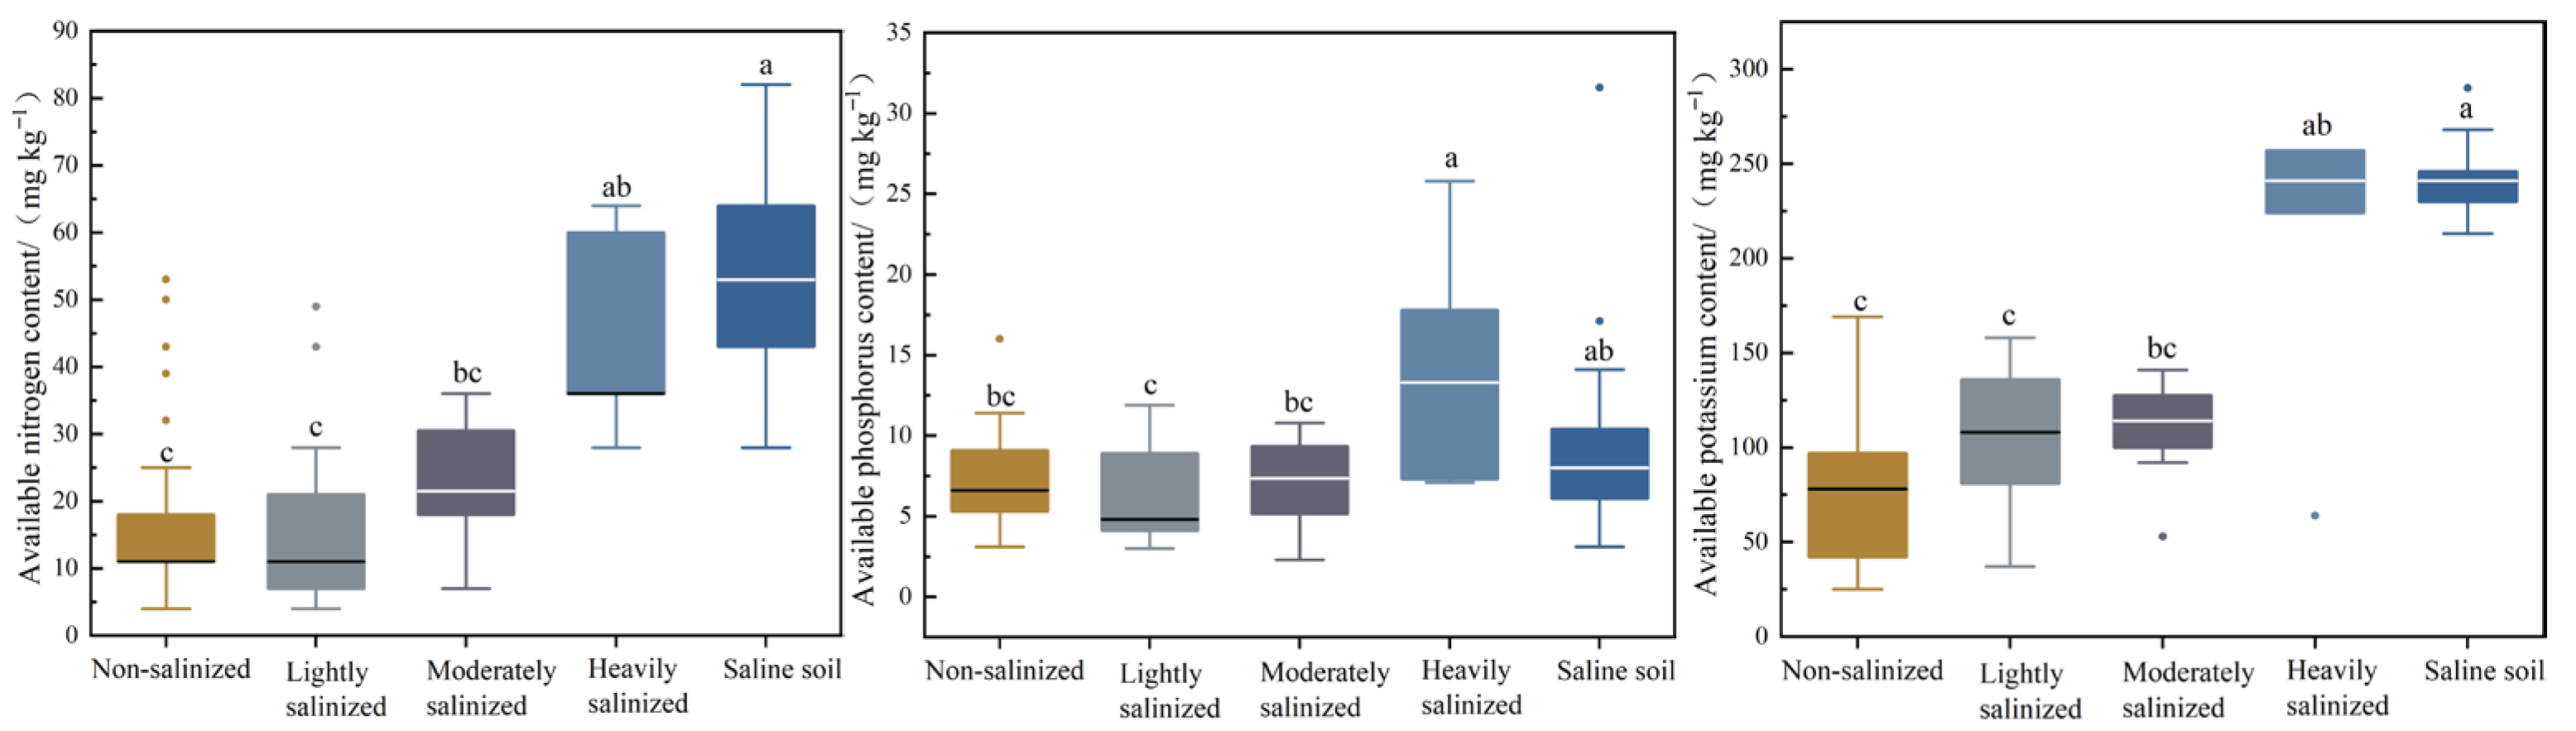
As shown in Figure 5, the soil available nitrogen content for non-salinized, lightly salinized, moderately salinized, heavily salinized, and saline soils was 11.0, 11.0, 21.5, 36.0, and 53.0 mg/kg respectively, with saline soils exhibiting the highest available nitrogen content. This value was significantly higher than that of non-saline and lightly saline soils by 381.8% and markedly increased by 146.5% compared to moderately saline soils (p < 0.05). Available nitrogen levels in saline and heavily saline soils were classified as poor, while those in non-saline, lightly saline, and moderately saline soils were categorized as extremely poor (see Table 2). The available phosphorus content in non-salinized, lightly salinized, moderately salinized, heavily salinized, and saline soils was 6.60, 4.80, 7.35, 13.30, and 8.00 mg/kg respectively. The available phosphorus in heavily salinized soils differed significantly from that in non-salinized, lightly salinized, and moderately salinized soils (p < 0.05). Among these, heavily saline soils exhibit relatively rich phosphorus content. Saline soils, non-saline soils, and moderately saline soils all possess readily available phosphorus levels within a moderate range, whereas lightly saline soils are poor in this nutrient. The available potassium content in non-saline, lightly saline, moderately saline, heavily saline-affected, and saline soils was 78.0, 108.0, 114.0, 241.0, and 241.0 mg/kg respectively, with salt soils exhibiting significantly higher potassium levels than non-saline, lightly saline, and moderately saline soils by 209.0%, 123.1%, and 111.4% respectively (p < 0.05). With increasing salinization levels, both available nitrogen and available potassium content exhibited an upward trend. Saline and heavily saline soils displayed exceptionally high potassium levels, while lightly and moderately saline soils were found to have relatively rich potassium content. Non-saline soils were observed to have moderate potassium levels.
Figure 5.
Available nitrogen (AN,), available phosphorus (AP), and available potassium (AK) under different salinization grades. Note: Significant differences between salinity classes are labeled with different letters; solid lines within the box represent the median, the upper and lower margins of the box are the 25th and 75th percentiles, respectively, and solid dots represent anomalous data.
3.5. The Effect of Soil Salt Ions on Soil Fertility Indicators
3.5.1. Correlation Analysis Between Soil Fertility and Soil Salinity Indicators
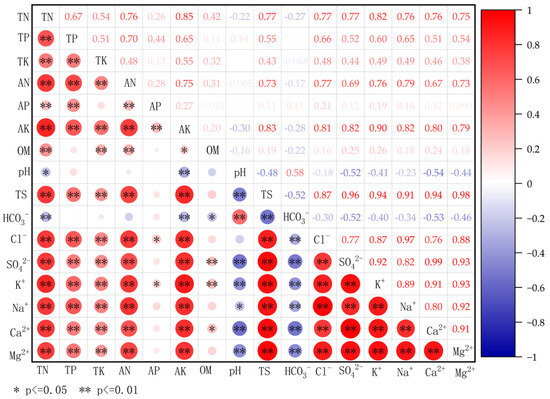
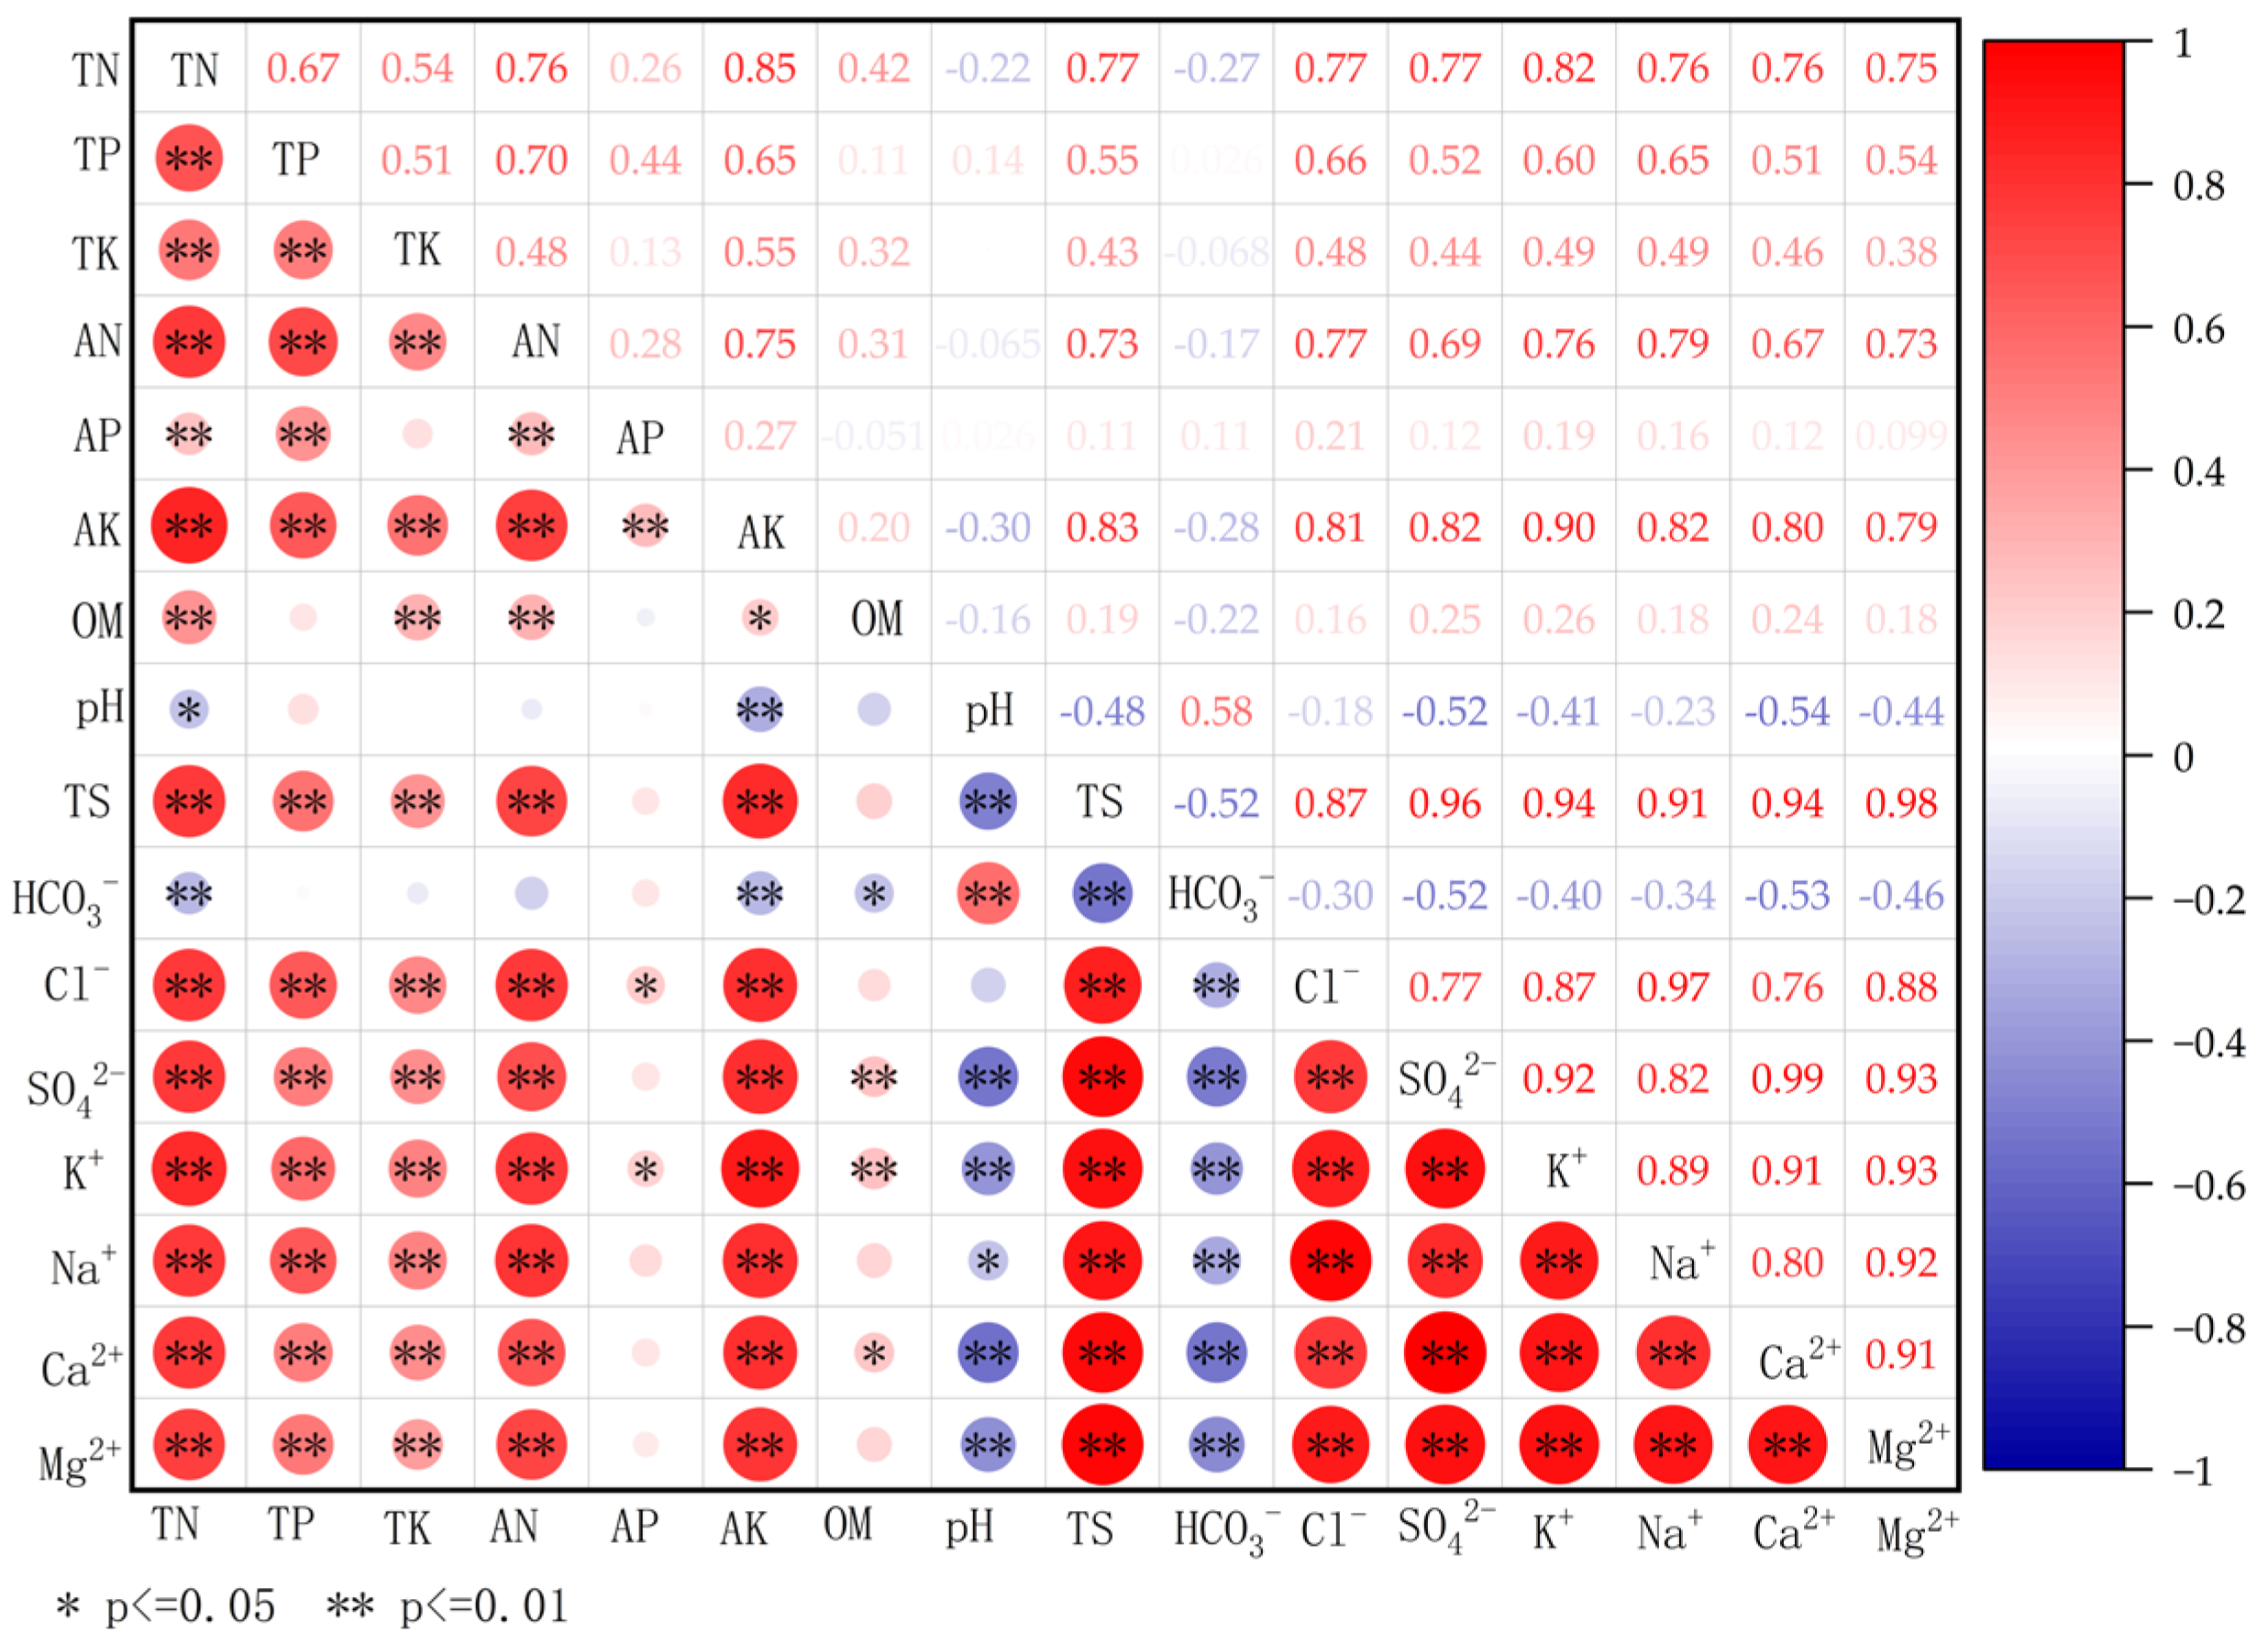
The correlation analysis between soil salinity and fertility indicators, presented in Figure 6, revealed significant relationships among the parameters. Total salt content was found to have a highly significant positive correlation with Mg2+, Ca2+, Na+, K+, SO42−, and Cl−, but a highly significant negative correlation with HCO3−. The strongest correlation for total salinity was observed with Mg2+ (r = 0.978), followed by SO42− (r = 0.955). HCO3− showed extremely significant negative correlations with total nitrogen, available potassium, and total salinity, and a significant negative correlation with organic matter. Soil pH was characterized by an extremely significant positive correlation with HCO3− and extremely significant negative correlations with Mg2+, Ca2+, K+, SO42−, and total salinity, while a significant negative correlation was observed with Na+. A significant positive correlation was identified between soil organic matter and K+, SO42−, and Ca2+. Total nitrogen, total phosphorus, total potassium, available nitrogen, and available potassium each exhibited extremely significant positive correlations with Mg2+, Ca2+, Na+, K+, SO42−, Cl−, and total salinity. Among these, total salinity correlated most strongly with available potassium (r = 0.828), followed by total nitrogen (r = 0.767). Available phosphorus was significantly positively correlated with Cl− and K+. Overall, total and available nutrients were closely associated with K+.
Figure 6.
Correlation analysis between soil fertility indexes and salt ions under different salinity classes.
3.5.2. Redundancy Analysis of Soil Salinity and Soil Fertility Indicators
As shown in Figure 7, the correlation between pH and TS alongside other salt ions varies across different salinization grades. Specifically, HCO3- exhibits a positive correlation in both non-salinized and saline soils, whilst Ca2+ shows a certain positive correlation in saline soils. K+ demonstrates a positive correlation with TN, TK, AN, AP, and AK across all salinization classifications. Total salt content consistently maintains a positive correlation with TN, TK, AN, and AK concentrations. Across all salinization levels, the arrows representing K+ consistently exhibit greater magnitude, indicating its broader influence on soil fertility. The length of the Na+ arrow shows little variation across salinization levels, suggesting its contribution to soil fertility indicators remains relatively stable. Conversely, the lengths of the TS and Mg2+ arrows increase progressively with salinization severity, from non-saline to saline soils, demonstrating that their impact on soil fertility indicators deepens as salinity rises.
Figure 7.
Results of redundancy analysis of fertility indicators and salt ions in different salinized soils. Note: The salinity index is indicated by red arrows and includes salt ions such as Mg2+, Ca2+, Na+, K+, SO42−, Cl−, HCO3−, and total salt content (TS). Soil fertility indicators, marked by blue arrows, include TN (total nitrogen), TP (total phosphorus), TK (total potassium), AN (available nitrogen), AP (available phosphorus), AK (available potassium), OM (organic matter), and pH.
4. Discussion
The soil salinity in the study area is dominated by SO42− and Cl−, with Na+ as the secondary cation, constituting a sulphate-type saline soil. Due to geological sedimentation processes coupled with the weathering of sulphate minerals, the soil surface layer readily accumulates substantial quantities of sulphates characterized by low solubility and poor mobility [27]. SO42− exhibits low mobility in soil, is not easily leached, and often forms insoluble precipitates with other ions [28]. Conversely, chloride ions possess higher solubility than sulphate ions and demonstrate greater mobility within the soil matrix. Both Cl− and Na+ are major harmful ions in saline soils. Elevated Cl− concentrations can be toxic to plant roots, inhibit enzyme activity, and interfere with phosphorus uptake [29]. Furthermore, an antagonistic relationship between Cl− and NO3− can restrict nitrate absorption, impairing plant growth [30,31]. Similarly, excessive Na+ is toxic to plants and can inhibit potassium (K+) uptake, leading to its accumulation in the soil [15,32]. The Qaidam Basin is a high-altitude, inland, closed basin characterized by an arid climate and strong evaporation. Consequently, salt ions tend to accumulate in the surface soil as water evaporates, resulting in a distinct salt surface accumulation phenomenon [20]. It was found that with increasing salinization grade, the proportions of Na+ and Cl− in the total ion content showed an increasing trend, while those of HCO3−, Mg2+, and Ca2+ decreased. This may be because higher salinity, through increased salt ion concentrations, affects cation exchange and thereby exerts a certain inhibitory effect on soil alkalization [33].
This study demonstrates a highly significant positive correlation between HCO3− ion content and pH. The pH of non-salinized soils is markedly higher than that of saline soils, a phenomenon likely attributable to the greater presence of alkaline salts in non-salinized soils where HCO3− ions constitute a substantial proportion. Within saline–alkali soil environments, these alkaline salts readily combine with soil components to form complexes, reacting with free ions such as HCO3− and OH− [34], thereby elevating soil pH. Concurrently, the exchange of base cations in saline soils affects the concentration of HCO3− ions, thereby altering the soil’s pH value [35,36]. This study found that both individual ions (K+, Mg2+, Na+, HCO3−) and total salt content exerted varying degrees of influence on soil fertility indicators, with distinct effects observed for different salt ions. Across varying degrees of salinization, total nitrogen, total potassium, available nitrogen, and available potassium all showed positive correlations with Ca2+, Na+, K+, SO42−, and Cl− ions. Zhao Qianyu et al. [14] investigated soil nutrient and salinization characteristics in lakeshore zones of semi-arid regions. They observed negative correlations between organic matter, available nitrogen, and available potassium with Mg2+, Ca2+, Na+, SO42−, and Cl− in grasslands, whereas positive correlations were found in saline–alkali soils and shoals. This contrasts with the present findings, potentially attributable to differing land types, vegetation cover, and anthropogenic influences. The study indicates a consistent positive correlation between total salinity and both available nitrogen and readily available potassium across varying salinization levels. This may stem from the study area’s transformation from saline–alkali wasteland to cultivated pastureland, where fertilizer application occurred. Zhou Jinqian et al. [37] observed through pot experiments that sludge application enhanced soil fertility while increasing total salinity by 27%. This suggests that adding external materials during land improvement can moderately boost soil fertility but also leads to salt accumulation. Research by Wu Yu et al. [38] indicates that with increasing years of greenhouse cultivation, although exogenous fertilization management led to rising trends in soil organic matter, available nitrogen, and available phosphorus, salt ion content accumulated in protected vegetable field. However, prior studies yielded differing results. Chen Yuqi et al. [39] observed in the Yellow River Delta that as salinization intensified, a significant decrease in soil organic matter content occurred. This was attributed to the toxic effects of soil salinization ions, which inhibit crop growth and normal development. Concurrently, high-salinity environments suppress soil microbial activity. Furthermore, increased sodium ions in salinized soils, accompanied by heightened alkalinity and sodium adsorption ratios, disrupt soil aggregates, thereby affecting organic matter content [40,41]. These factors subsequently impair soil nutrient cycling and reduce soil fertility.
Variations in soil salinity and fertility are influenced by numerous factors, including soil texture, cultivation duration, and human activities. Generally, the intensification of soil salinization is associated with a decline in fertility. However, studies have indicated [42,43,44] that when salt concentrations remain below specific critical levels, elevated salinity may be correlated with increased organic matter content. The results of this study show that with higher salinization grades, the contents of total nitrogen, total phosphorus, total potassium, available nitrogen, and available potassium in the soil all increased. This pattern may be explained by three main reasons. First, the experimental area is located in the Qaidam Basin, where soils are affected by salt lakes and an extremely arid climate. Strong evaporation leads to high salt content in the surface soil, forming a high-salinity environment dominated by ions such as SO42−, Cl−, and Na+ [27]. Second, the influence of soil texture is significant. Heavier soils are less prone to salt leaching but tend to have higher levels of fertility-related nutrients [45], whereas sandy soils leach salts more easily but are lower in nutrients [46]. Research by Wang Qianbing et al. has shown that with increasing salinization, the silt and clay content of soils in the Qaidam Basin rises [47], resulting in a finer soil texture [48]. Increased clay content helps to retain soil nutrients but also contributes to salt accumulation [49]. Third, human activities may play a role. Fertilization practices in the experimental area, combined with the fact that salt stress inhibits plant growth and reduces nutrient uptake, may lead to the retention and accumulation of nutrients in the soil. The forage oat planted in the study area exhibits strong salt tolerance, and its growth is less inhibited by salinity, which helps to promote nutrient accumulation in the soil [50]. Oats, an annual grass of the Poaceae family, show notable stress tolerance, performing well under drought, low temperature, poor nutrient, and saline–alkali conditions [51,52]. They are considered valuable in arid western regions and are widely cultivated for saline–alkali land remediation. Therefore, through scientific management of water and fertilizer to regulate soil salinity, salt damage can be alleviated while a balance in nutrient supply and demand is maintained, thereby supporting the improvement and utilization of salinized soils.
For agricultural practices, the rational utilization of saline–alkali soils requires the selection of appropriate salt-tolerant forage varieties based on different salinization levels. Priority should be given to crops that exhibit both salt tolerance and high nutrient use efficiency [53]. For example, oats have been demonstrated to possess a certain degree of saline–alkali resistance in the Qaidam Basin region [11]. Furthermore, scientifically sound land management should be implemented in artificial grassland cultivation. Irrigation management should prioritize the control of SO42− and Cl−, while soil amendments and organic fertilizers can be applied to improve soil quality and promote oat growth and yield [54,55]. Finally, a scientific nutrient management program should be established based on dynamic monitoring of soil salinity and nutrients. Tailored nutrient management strategies enable precision management, and appropriate fertilization can meet the nutritional demands of salt-tolerant crops while minimizing nutrient fixation and loss [56]. The arid northwestern regions of China are characterized by low rainfall, with saline–alkali land accounting for approximately 70% of the country’s total saline–alkali area, a significant abundance of saline–alkali soil resources. Therefore, the findings of this study may provide a theoretical basis for regions with similar arid climatic conditions. This study has analyzed only the surface soil fertility and salinity characteristics of the study area. Future work will involve analyzing the spatial heterogeneity of salinity and nutrients in saline–alkali soils to provide a theoretical foundation for the sustainable establishment of artificial grasslands and the remediation of saline–alkali soils in arid regions.
5. Conclusions
- The study area primarily exhibits SO42− and Cl− as anions, with Na+ and Ca2+ predominating among cations. As salinization intensifies, the proportion of Na+ and Cl− within the total ionic load gradually increases, with these ions progressively dominating during the salinization process.
- As salinization intensifies, soil total nitrogen, total phosphorus, total potassium, available nitrogen, and available potassium all exhibit an upward trend, reaching their highest levels in heavily salinized soils. Soil pH shows a decreasing trend with increasing salinization classification, while soil organic matter content exhibits no significant variation.
- Soil organic matter exhibits a significant positive correlation with K+, SO42−, and Ca2+, but a significant negative correlation with HCO3−. Total nitrogen, total phosphorus, total potassium, available nitrogen, and readily available potassium content exhibited extremely significant positive correlations with total salinity. Among these, the strongest correlation was observed between total salinity and readily available potassium, with a correlation coefficient of 0.828, followed by total nitrogen at 0.767. pH showed an extremely significant positive correlation with HCO3−, yet an extremely significant negative correlation with total salinity.
- Redundancy analysis results indicate that as salinization levels increase, the impact of total salinity on soil fertility progressively intensifies, with K+ exerting the most significant influence on soil fertility indicators. Across soils of varying salinization degrees, organic matter consistently exhibited a negative correlation with HCO3−, while total nitrogen, total potassium, available nitrogen, available phosphorus, and available potassium consistently showed positive correlations with K+.
Author Contributions
M.S. and Y.L.: Research investigation, Conceptual design, Methodology, Writing—review and editing. Y.C. and L.T.: Conceptual design, Research investigation, Data organization. X.W.: Research investigation, Methodology, Research implementation, Drafting—initial manuscript, Validation. All authors have read and agreed to the published version of the manuscript.
Funding
This research project is funded by the Qinghai Provincial Major Science and Technology Special Project (2023-NK-A3).
Data Availability Statement
The data used to support the findings of this study is available from the corresponding author upon request.
Conflicts of Interest
The authors declare no conflicts of interest.
References
- Jia, X.; Ren, H.; Sun, P.; Ma, B. Analysis of the International Research Situation of Integrated Management of Saline-alkali Land. World Sci. Technol. Res. Dev. 2025, 47, 9–23, (In Chinese with English abstract). [Google Scholar]
- Yang, J.; Yao, R.; Wang, X.; Xie, W.; Zhang, X.; Zhu, W.; Zhang, L.; Sun, R. Research on Salt-affected Soils in China: History, Status Quo and Prospect. Acta Pedol. Sin. 2022, 59, 10–27, (In Chinese with English abstract). [Google Scholar]
- Zhang, Q.; Zhao, W.; Chen, W.; Qin, T.; Xue, S. Research Progress on Remediation and Conservation of Saline Alkali Soil. Tianjin Agric. Sci. 2018, 24, 65–70, (In Chinese with English abstract). [Google Scholar]
- Li, D.; Shen, H.; Tian, J.; Guo, Y.; Liu, J. Review of Saline-alkali Land Improvement. Mod. Agric. Sci. Technol. 2023, 24, 153–159, (In Chinese with English abstract). [Google Scholar]
- Lyu, N.; Shi, L.; Dai, Y.; Li, Y.; Yin, F. Reclamation of saline-alkali soils in Xinjiang: A review. J. Irrig. Drain. 2024, 43, 1–10, (In Chinese with English abstract). [Google Scholar]
- Feng, Q.; Yin, X.; Zhu, M.; Zhang, J.; Liu, W.; Xi, H.; Yu, T.; Yang, L.; Liu, W.; Lu, Z. Overall promotion of integrated management and utilization of saline-alkali land in Northwest China: Conditions, challenges, and recommendations. Bull. Chin. Acad. Sci. 2024, 39, 2060–2073, (In Chinese with English abstract). [Google Scholar]
- Wang, X.; Hu, S. Characteristics and amelioration of farmland salinized soils in the Qaidam Basin. J. Arid. Land Resour. Environ. 1998, 4, 75–85, (In Chinese with English abstract). [Google Scholar]
- Deng, X.; Lyu, D.; Wu, X.; Feng, T.; Zhang, M.; Zhu, J. Evaluation of farmland soil fertility in Jiuquan City based on principal component analysis. Hubei Agric. Sci. 2023, 62, 21–24+46, (In Chinese with English abstract). [Google Scholar]
- Zhang, W.; Wang, S.; Liu, Z.; Tang, X.; Xiong, L.; Xia, W.; Wang, P.; Yuan, F.; Sun, G.; Li, Z.; et al. Evaluating soil fertility improvement effects of chemical fertilizer combined with organic fertilizers in a red paddy soil using the soil fertility index. J. Plant Nutr. Fertil. 2021, 27, 777–790, (In Chinese with English abstract). [Google Scholar]
- Zhou, H.; Shi, H.; Yang, Y.; Feng, X.; Chen, X.; Xiao, F.; Lin, H.; Guo, Y. Insights into plant salt stress signaling and tolerance. J. Genet. Genom. 2024, 51, 16–34. [Google Scholar] [CrossRef] [Scilit]
- Wang, Y.; Shi, J.; Sheng, L.; Li, S.; Yang, X.; Wang, X.; Ma, Y. Adaptive evaluation on oat varieties on severe saline—Alkali land in Qaidam basin. Qinghai Anim. Husb. Vet. J. 2019, 49, 36–41+51, (In Chinese with English abstract). [Google Scholar]
- Shen, H.; Zhu, Y.; Zhao, X.; Geng, X.; Gao, S.; Fang, J. Analysis of current grassland resources in China. Chin. Sci. Bull. 2016, 61, 139–154, (In Chinese with English abstract). [Google Scholar]
- Zheng, J.; Zhang, J.; Wu, R.; Lyu, J. Classification of Artifical Grassland Resources in Qaidam Basin. J. Grassl. Forage Sci. 2021, 5, 34–41+45. (In Chinese) [Google Scholar]
- Zhao, Q.; Yu, H.; Yang, F.; Wang, X.; Feng, D.; Zhang, Y.; Wang, M.; Liao, H. Study on the characteristics of soil nutrients and salinization of lake wetlands in semi-arid region: Taking Daihai Lake as an example. J. Environ. Eng. Technol. 2023, 13, 188–196, (In Chinese with English abstract). [Google Scholar]
- Wei, Y.; Li, J.; Sun, X.; Liu, J.; Xiao, H.; Li, H.; Fu, C.; Song, X.; Zhang, Q.; Qin, L. Analysis of Soil Physical and Chemical Properties and Ion Variation Rule of Saline-alkali Degraded Grassland in Songnen. Acta Agrestia Sin. 2024, 32, 1702–1709, (In Chinese with English abstract). [Google Scholar]
- Yan, X.; Zhang, J.; Yang, Z.; Zhu, X. Current Status and Improvement Measures of Saline-Alkaline Soils in the Qaidam Basin. Agric. Technol. 2020, 40, 18–20. (In Chinese) [Google Scholar]
- Yu, Y.; Wang, M. A Brief Discussion on the Formation of Saline-Alkali Soils in the Qaidam Basin and the Application of Subsurface Drainage Technology. J. Qinghai Environ. 1997, 1, 19–21. (In Chinese) [Google Scholar]
- Wang, T.; Xu, C.; Pu, X.; Zhao, Y.; Wei, X.; Wang, W. Current Status and Practice of Grass Planting and Soil Improvement Technology in the Saline-Alkali Land of Qaidam Basin, Qinghai Province. Qinghai Sci. Technol. 2025, 32, 20–25+31, (In Chinese with English abstract). [Google Scholar]
- Zhang, D.; Fan, G.; Ma, Y. Study on the Type of Saline-alkaline Land and Saltion Correlation of Qaidam Basin. Sci. Technol. Qinghai Agric. For. 2016, 3, 1–6, (In Chinese with English abstract). [Google Scholar]
- Li, S.; Wang, X.; Wang, Y.; Ma, Y.; Li, S. Analysis of soil nutrients and ions characteristic of Qaidam Basin saline—Alkali land. Chin. Qinghai J. Anim. Vet. Sci. 2017, 47, 36–40, (In Chinese with English abstract). [Google Scholar]
- Zhou, L.; He, C.; Lyu, A.; Wang, S.; Luo, T.; Wang, Y. Research on quick dynamic monitoring of soil salinization in Qaidam Basin. Sci. Surv. Mapp. 2021, 46, 99–106+114, (In Chinese with English abstract). [Google Scholar]
- Feng, Y.; Du, S.; Fraedrich, K.; Zhang, X. Fine-grained climate classification for the Qaidam Basin. Atmosphere 2022, 13, 913. [Google Scholar] [CrossRef] [Scilit]
- Bao, S. Soil and Agricultural Chemistry Analysis, 3rd ed.; China Agriculture Press: Beijing, China, 2000. (In Chinese) [Google Scholar]
- Li, Y. Saline Characteristics of Soil Salt and its Components in Qaidam Basin. China Rural. Water Hydropower 2019, 11, 72–75+80, (In Chinese with English abstract). [Google Scholar]
- Zhang, Z.; Jiao, J.; Chen, T.; Chen, Y.; Lin, H.; Xu, Q.; Cheng, Y.; Zhao, W. Soil nutrient evaluation of alluvial fan in the middle and lower reaches of Lhasa River Basin. J. Plant Nutr. Fertil. 2022, 28, 2082–2096, (In Chinese with English abstract). [Google Scholar]
- Yang, Y.; Yang, T.; Yang, Y.; Ren, M.; Zhang, J.; Gong, S.; Yang, S.; Wu, Y.; Wang, J. Study on the relationship between shrinkage rate and conventional physical indexes of tobacco based on redundancy analysis. Hubei Agric. Sci. 2023, 62, 144–148, (In Chinese with English abstract). [Google Scholar]
- Li, L.; Wang, Z. Salt-affected soils type and Saline-geochemical features in Qaidam Basin. Acta Pedol. Sin. 1990, 1, 43–53, (In Chinese with English abstract). [Google Scholar]
- Li, W.; Wang, Z.; Zheng, X.; Zhang, J. Soil salinity variation characteristics of cotton field under long-term mulched drip irrigation. Trans. Chin. Soc. Agric. Eng. 2016, 32, 67–74, (In Chinese with English abstract). [Google Scholar]
- Guo, J.; Wang, M.; Geng, R.; Li, X.; Yin, X.; Wei, G. Salinity Characteristics Analysis of Saline Alkali Soil in Yinbei Irrigation District of Ningxia. Chin. Agric. Sci. Bull. 2021, 37, 38–42, (In Chinese with English abstract). [Google Scholar]
- Zhao, Z. The Effects of Soil Salinisation on Plants and Remedial Measures. Northwest Hortic. 2020, 12, 40–42. (In Chinese) [Google Scholar]
- Pan, J.; Wang, L.; Huang, C.; You, Q.; Guo, P.; Guo, Q.; Xue, X. Review on effects of salt stress on plant energy metabolism processes in arid regions. J. Desert Res. 2024, 44, 111–118, (In Chinese with English abstract). [Google Scholar]
- Gupta, B.; Huang, B. Mechanism of Salinity Tolerance in Plants: Physiological, Biochemical, and Molecular Characterization. Int. J. Genom. 2014, 2014, 701596. [Google Scholar] [CrossRef] [Scilit] [PubMed]
- Niu, D.; Peng, H.; Wang, Q.; Ga, Q.; Li, X.; Yang, H.; Cang, S.; Qi, Y. The principal component analysis of salinized situation in desert land of Chaidamu basin. Acta Prataculturae Sin. 2001, 2, 39–46, (In Chinese with English abstract). [Google Scholar]
- Li, G. Preliminary Research on Saline-Alkali Soil Conditioners. Xinjiang Farm Res. Sci. Technol. 2020, 43, 29–32. (In Chinese) [Google Scholar]
- Guo, Q. The Response Mechanism of Soil Salt Ion Transfer and Diversity Rule to Environment Factors and Risk Analysis. Ph.D. Thesis, Northwest A & F University, Xianyang, China, 2010. (In Chinese with English abstract). [Google Scholar]
- Pan, G. Soil Chemical Analysis on the Process of Soil Acidification. J. Ecol. 1990, 9, 50–54, (In Chinese with English abstract). [Google Scholar]
- Zhou, J.; Ma, J.; Zhang, L.; Shang, X.; Li, X. Effect of dry sludge application on saline-alkali soil property and the growth of plants. J. Environ. Eng. Technol. 2018, 8, 443–448, (In Chinese with English abstract). [Google Scholar]
- Wu, J.; Wang, W.; Zhu, F. Analysis on Soil Physical and Chemical Characteristics of Protected Vegetable Fields in Fengxian District of Shanghai City. J. Chang. Veg. 2011, 20, 53–55, (In Chinese with English abstract). [Google Scholar]
- Chen, Y.; Xu, L.; Wang, Z.; Wang, X.; Yao, R.; Zhao, X. Stoichiometric Characteristics of Nutrient Microbial Biomass-Extracellular Enzyme Activity in Different Salt-affected Soils. Acta Pedol. Sin. 2025, 62, 811–824, (In Chinese with English abstract). [Google Scholar]
- Yang, L.; Zhang, Y.; Huang, X.; Zhang, Y.; Zhao, Y.; Shi, X. Effects of Long-Term Application of Chloride Containing Fertilizers on the Biological Fertility of Purple Soil Under a Rice-Wheat Rotation System. Sci. Agric. Sin. 2016, 49, 686–694, (In Chinese with English abstract). [Google Scholar]
- Daliakopoulos, I.; Tsanis, I.; Koutroulis, A.; Kourgialas, N.; Varouchakis, A.; Karatzas, G.; Ritsema, C. The threat of soil salinity: A European scale review. Sci. Total Environ. 2016, 573, 727–739. [Google Scholar] [CrossRef] [Scilit]
- Liu, W.; Lu, F.; Xu, X.; Fu, Y.; Fu, T.; Chen, G. Spatial variability of soil salinity and organic matter in reclaimed area of abandoned salt pan in coas. Trans. Chin. Soc. Agric. Eng. 2019, 35, 183–190, (In Chinese with English abstract). [Google Scholar]
- Jiang, J.; Huang, X.; Li, X.; Yan, Z.; Li, X.; Ding, W. Soil organic carbon storage in tidal wetland and its relationships with soil physico-chemical factors: A case study of Dongtan of Chongming, Shanghai. J. Ecol. Rural. Environ. 2015, 31, 540–547, (In Chinese with English abstract). [Google Scholar]
- Li, X.; Xiao, G.; Guo, Z.; Wang, J. Spatial distribution characteristics of farmland soil organic carbon and its effect on salinization in the eastern foot of Helan Mountain. J. Agro-Environ. Sci. 2023, 42, 612–623, (In Chinese with English abstract). [Google Scholar]
- Yao, J.; Zhang, Y. Correlation between Soil Texture Types and Their Basic Fertility. Beijing Agric. Sci. 1998, 4, 34–35. (In Chinese) [Google Scholar]
- Liang, Z.; Ni, J. Fertility Analysis of Different Texture Soil in Youyang Tobacco-growing Areas. Southwest China J. Agric. Sci. 2014, 27, 1621–1625, (In Chinese with English abstract). [Google Scholar]
- Wang, Q.; Li, Y.; Song, M.; Talin, G.; Wang, H.; Liu, C. Study on particle size composition and erodibility of different salinized soils in Delingha City. Fujian Agric. Sci. Technol. 2025, 56, 35–41, (In Chinese with English abstract). [Google Scholar]
- Wang, H.; Cao, Y.; Song, M.; Talin, G.; Wang, Q.; Liu, C.; Li, Y. Particle size distribution and erodibility of soils under different salinization levels in the Qaidam Basin. Chin. J. Appl. Environ. Biol. 2024, 30, 1101–1107, (In Chinese with English abstract). [Google Scholar]
- Zhao, L.; Qin, F.; Dong, X.; Zhao, K.; Dong, F.; Ma, H.; Mi, H.; Wang, Z. Assessing soil particle size and nutrients of two Nitraria tangutorum nebkha habitats in Tengger Desert. Bull. Soil Water Conserv. 2025, 45, 213–223, (In Chinese with English abstract). [Google Scholar]
- Duan, C.; Yang, X.; Sun, H.; Zhang, X.; Wang, L.; Li, T. Comprehensive evaluation and screening of saline-alkali tolerance of cereal crop species in saline-alkali soil of Qaidam Basin. Agric. Res. Arid. Areas 2025, 43, 23–38, (In Chinese with English abstract). [Google Scholar]
- Wang, Y.; Li, S.; Sheng, L.; Wang, X. Introduction test of oat varieties on moderate and mild saline—Alkali land in Qaidam basin. Chin. Qinghai J. Anim. Vet. Sci. 2018, 48, 12–17, (In Chinese with English abstract). [Google Scholar]
- Ma, Y.; Liu, Z.; Bai, Y.; Wang, W.; Wang, H. Study on Diversity of Oats Varieties in Xinjiang. Xinjiang Agric. Sci. 2006, 43, 510–513, (In Chinese with English abstract). [Google Scholar]
- Wan, L.; Zheng, J. Discussion on Techniques and Models of Grassland Ecological Construction in Extremely Arid Area of Qaidam—Taking the Artificial Grassland in the Village of Nalenggele as An Example. J. Qinghai Environ. 2018, 28, 181–183+202. (In Chinese) [Google Scholar]
- Wang, J.; Liu, X.; Jin, X.; Fu, Y.; Bao, K.; Quan, Z.; Dang, Y.; Xu, C.; Wang, W.; Zhang, H.; et al. Effects of Potassium Fulvate Application on Oat Growth and Soil Quality in the Saline-Alkali Soils of the Qaidam Basin. Acta Agrestia Sin. 2025, 33, 3118–3128, (In Chinese with English abstract). [Google Scholar]
- Sun, H.; Zhao, Y.; Xu, C.; Pu, X.; Dou, H.; Pu, Y.; Wang, W. Research on the effects of soil improvement methods in saline-alkali land on the growth performance of feed oats. J. Grassl. Forage Sci. 2025, 6, 9–21, (In Chinese with English abstract). [Google Scholar]
- Duan, L.; Ma, X.; Ju, Z.; Jia, Z. Impact of Reduced and Split Nitrogen Fertilization on Oat Biomass and Nitrogen Use Efficiency in Alpine Regions. Acta Agrestia Sin. 2024, 32, 3185–3193, (In Chinese with English abstract). [Google Scholar]

Disclaimer/Publisher’s Note: The statements, opinions and data contained in all publications are solely those of the individual author(s) and contributor(s) and not of MDPI and/or the editor(s). MDPI and/or the editor(s) disclaim responsibility for any injury to people or property resulting from any ideas, methods, instructions or products referred to in the content. |
© 2026 by the authors. Licensee MDPI, Basel, Switzerland. This article is an open access article distributed under the terms and conditions of the Creative Commons Attribution (CC BY) license.