


Abstract
(1) Background: Under the dual pressures of global climate change and rapid urbanization, blue–green infrastructure as a nature-based solution is crucial for enhancing urban sustainability. However, there is still a significant cognitive gap regarding the synergy mechanism between its blue and green components and its nonlinear combined impact on sustainability. (2) Method: To fill this gap, this study takes Zhenjiang, a national sponge pilot city in China, as a case and constructs a comprehensive assessment framework. The framework combines multi-source spatio-temporal big data (remote sensing images, point of interest data, mobile phone signaling data) with spatial analysis techniques (geodetectors, Getis-Ord Gi*) to quantify the synergistic effects of blue–green infrastructure on environmental, economic, and social sustainability. (3) Results: The main findings include the following: (1) urban sustainability presents a spatial differentiation pattern of “high in the center, low in the periphery, and multi-core”, and there is a significant positive spatial correlation with the distribution of blue–green infrastructure. (2) The economic dimension, especially daytime population vitality, contributes the most to overall sustainability. (3) Crucially, the co-configuration of sponge facility density and park facility density was identified as the most influential driving mechanism (q = 0.698). In addition, the interaction between the blue infrastructure and the green sponge facilities showed obvious nonlinear enhancement characteristics. Based on spatial matching analysis, the study area was divided into three priority intervention zones: high, medium, and low. (4) Conclusions: This study confirms that it is crucial to view blue–green infrastructure as an interrelated collaborative system. The findings deepen the theoretical understanding of the synergistic empowerment mechanism of blue–green infrastructure and provide scientifically based and actionable policy support for the precise planning of ecological spaces in high-density urbanized areas.
1. Introduction
1.1. Background
Under the dual challenges of global climate change and rapid urbanization, urban systems are increasingly facing multiple pressures such as extreme climate events, declining ecosystem service functions, and insufficient impetus for sustainable development. In this context, “nature-based solutions” have gained widespread attention due to their cost-effectiveness and multiple synergistic advantages. Among them, the blue–green infrastructure theory provides a new theoretical perspective and planning framework for building climate-resilient cities and enhancing urban sustainable development capabilities [1]. The theory emphasizes the systematic integration of blue infrastructure (water bodies, such as rivers, lakes, wetlands) and green infrastructure (green spaces, vegetation, etc.) to build urban ecological networks and promote the transformation from the traditional “gray engineering-led” single disaster prevention model to a development path that focuses on system adaptation, recovery, and co-evolution [2,3,4,5].
Research and practice on blue–green infrastructure have extended from a single ecological dimension to a comprehensive systematic assessment. Research on the ecological dimension mainly emphasizes the regulatory services and restoration potential of BGI in areas such as stormwater management [6,7], cooling and humidification [8], and biodiversity conservation [9]. Socio-economic studies have begun to focus on the recreational value brought by BGI [10], its real estate appreciation effect [11], and its positive role in promoting public health [12,13]. In recent years, some studies have also attempted to integrate different dimensions into a systematic assessment framework starting from the “structure–function–benefit” chain.
The evolution of the concept of urban sustainability has gone through a process from a single dimension to comprehensive integration. Early research focused on the resilience of infrastructure to natural disasters, emphasizing the stability and reliability of engineering. With the introduction of the theory of socio-ecological sustainability, the academic community began to focus on soft factors such as social learning, self-organization, and adaptability. In recent years, the rise in complex systems theory has further driven urban sustainability research towards holistic, dynamic, and evolutionary directions [14,15].
In terms of evaluation methods, existing research is mainly divided into two categories: the index system method and the model simulation method. The former achieves quantitative assessment of urban sustainability by constructing multi-dimensional indicators (such as form, environment, economy, society, etc.) [16,17,18]. The latter uses tools such as system dynamics and surrogate models to simulate the dynamic responses of urban systems to disturbances. For example, studies have used MCR models to integrate fragmented wetland resources and construct blue ecological networks to mitigate the urban heat island effect [19].
At the technical application level, big data means such as spatial analysis and machine learning have significantly enhanced the depth of mechanism analysis. On the one hand, by interpreting multi-source remote sensing data through methods such as random forests (like Landsat, Sentinel series), efficient identification of the spatial distribution and dynamic changes in blue–green infrastructure has been achieved [20]. On the other hand, using new types of data, such as mobile phone signaling and social media location, the sustainability characteristics of urban social systems can be precisely depicted. In addition, the research also used models such as the Moran Index, CASA, PLUS, and InVEST to quantify the spatio-temporal evolution and driving mechanisms of the blue–green infrastructure landscape pattern [21,22,23].
Although significant progress has been made in existing research, there are still several important gaps in the field. In terms of research perspective, most evaluations still view blue and green elements as independent or homogeneous systems, lacking a detailed analysis of their synergistic mechanisms and type differentiations (such as the matching relationship between blue spaces like floodplains, river corridors, ponds, and sponge facilities at different levels), making it difficult to reveal the structural paths that enable sustainable development. Methodologically, existing evaluations mostly rely on static indicators and linear models (such as the entropy method, AHP), which can achieve structured analysis, but often rely on subjective judgment or standardization algorithms in determining weights, lacking the ability to effectively detect and model the nonlinear interactions and driving mechanisms between blue–green infrastructure elements.
Zhenjiang, a typical Jiangnan water network city in eastern China and a national sponge city pilot, has blue spaces such as the Yangtze River floodplain, ancient canal corridors, and scattered reservoirs interwoven with green sponge facilities such as rain gardens and infiltration ponds, providing ideal evidence for studying the synergy of blue–green infrastructure and a scalable solution for building climate-resilient cities [24]. An ecological process approach based on the morphological structure of blue–green infrastructure is more conducive to identifying the sustainability of this ecological pattern [25].
1.2. Core Issues and Innovative Points
Based on this, this study aims to break through the above limitations and take Zhenjiang, a typical Jiangnan water network city and a national sponge pilot, as its research object, focusing on exploring the following core issues:
- (1)
- How should the spatial coupling relationship between blue–green infrastructure and urban sustainability be quantified?
- (2)
- What are the differences in the contributions and synergy paths of different types of blue–green infrastructure elements in urban sustainability?
- (3)
- How can precise collaborative optimization strategies be proposed based on the results of this analysis?
By answering these questions, this study aims to provide a scientific basis for deepening the theory of blue–green infrastructure and driving the sustainable transformation of high-density cities.
Compared to existing research, the innovation of this article mainly lies in three aspects. (1) Perspective innovation: Viewing BGI as a collaborative system with nonlinear interactions within it, rather than a collection of independent elements. (2) Method innovation: Coupling geographic detectors with machine learning interpretability methods (SHAP) to jointly quantify the nonlinear interaction mechanisms between BGI elements and their contribution to sustainability. (3) Applied innovation: A complete closed-loop framework has been established from “spatial pattern assessment-driving mechanism for diagnosis, zoning, and precise policy implementation”, providing directly operable decision support tools for sponge cities and similar ecologically oriented plans.
2. Framework
2.1. Theoretical Implications of Blue–Green Infrastructure and Urban Sustainability
The core concepts that need to be clarified first in this study are: what is blue–green infrastructure and what is urban sustainability. By analyzing the multi-dimensional impact of blue–green infrastructure on environmental, economic and social systems, an assessment system for identifying its potential to enhance urban sustainability is proposed.
2.1.1. Theoretical Linkages Between Blue–Green Infrastructure and Urban Sustainability
Blue–Green infrastructure, derived from the theory and practice of eco-city planning, refers to an interconnected network of natural, semi-natural areas and artificial facilities designed to provide a variety of ecosystem services [26]. Compared with traditional gray infrastructure, BGI emphasizes managing environmental issues by simulating natural processes through NBS and has adaptability and resilience to climate change [27]. Urban sustainability refers to the long-term capacity of an urban system to achieve economic prosperity, social equity, and ecological integrity within its environmental carrying capacity, with a clear positive connotation.
This article defines Blue Infrastructure (BI) as a natural or semi natural network of water bodies, such as rivers, lakes, wetlands, ponds, etc. Green Infrastructure (GI) is defined as an ecological network that includes natural vegetation, green spaces, and artificially constructed sponge facilities such as rain gardens, infiltration ponds, and ecological ditches.Grey infrastructure refers to traditional engineered drainage networks and flood control facilities. In the text, ‘blue-green infrastructure’ (BGI) is a collaborative integration system between BI and GI, and ‘sponge infrastructure’, as a key component of GI, is an important technical means to connect natural ecosystems with artificially built environments.
Overall, the blue–green infrastructure theory provides a path and operational vehicle for identifying and enhancing the sustainability potential of cities, which compensates for the sustainability deficiencies of only gray infrastructure through cost-effectiveness and synergistic gains. Urban sustainability provides a clear development goal and value orientation for the planning and construction of blue–green infrastructure, and a strategic basis for systematically optimizing the allocation model of blue–green infrastructure.
2.1.2. Multi-Dimensional Pathways for Blue–Green Infrastructure to Empower Urban Sustainability
The empowerment of urban sustainability by blue–green infrastructure is mainly achieved through three core dimensions: environmental sustainability, economic sustainability, and social sustainability.
Environmental sustainability is the ecological foundation on which BGI underpins urban development. Cities with high sustainability potential should have healthy blue–green systems to maintain ecological balance and deal with environmental disturbances. This is manifested in the hydrological regulation and water purification capabilities of blue spaces such as rivers, lakes, and wetlands, as well as the microclimate regulation and biodiversity support functions of green infrastructure such as sponge facilities and green spaces.
Economic sustainability is reflected in the activation and stabilization of urban economic systems by BGI. The maintenance of environmental sustainability provides high-quality ecological assets and spatial carriers for economic development, and lays the foundation for green industries and innovative economic paths. BGI contributes directly or indirectly to economic growth by enhancing the commercial vitality of waterfront areas, attracting talent aggregation, and reducing the cost of urban environmental governance.
Social sustainability is closely linked to BGI’s public service function. Blue and green spaces, as important public goods, are directly related to the well-being of residents and social cohesion in terms of the fairness of their distribution, accessibility, and the recreational, cultural, and aesthetic services they provide. A city with high social sustainability must have a blue–green infrastructure network that is both inclusive and efficient.
2.1.3. Variables, Systems, and Mechanisms of Conceptual Frameworks
The core of this article is to explore how blue-green infrastructure systems (intervention systems) affect urban sustainability through their complex internal and external mechanisms (outcome variables). Specifically:
(1) Outcome Variable: Represented by the Comprehensive Urban Sustainability Index (USI), covering three dimensions of environment, economy, and society, it is the ultimate measure for evaluating the effectiveness of interventions.
(2) Intervention System: a blue-green infrastructure (BGI) composite system.
(i) Blue infrastructure (BI): natural or semi natural water body networks (such as rivers, lakes, wetlands). (ii) Green Infrastructure (GI) is defined as an ecological network that includes natural vegetation, green spaces, and artificially constructed sponge facilities such as rain gardens, infiltration ponds, and ecological ditches. This article mainly focuses on its synergistic or substitutive relationship with blue-green systems.
(3) Explanatory Mechanism: mainly includes (i) spatial coupling mechanism (the statistical correlation between the spatial distribution of BGI and the spatial pattern of USI, revealed through spatial autocorrelation analysis); (ii) Nonlinear interaction mechanisms (synergistic or antagonistic effects beyond simple summation between different types and attributes of BGI elements, as well as between BGI and urban socio-economic elements, revealed through geographic detector interaction detection and SHAP analysis).
2.2. Limitations of Existing Blue–Green Infrastructure Assessment Frameworks
At present, some studies have attempted to construct an assessment framework for BGI, but there are still obvious limitations. First, most frameworks focus on the ecological performance or single economic value assessment of BGI, lacking systematic consideration of the social dimension, which is crucial for the long-term sustainability of cities. Secondly, existing evaluations often present static snapshots, making it difficult to capture the dynamic response process and resilience of the BGI under disturbances such as extreme climate events. Finally, linear weighted models are commonly used in the methodology, which can achieve basic multi-index integration but fail to effectively reveal the complex nonlinear interactions and synergistic driving mechanisms among the elements within the BGI, making it difficult to achieve “precise policy implementation” in planning practice.
2.3. Urban Sustainability Assessment from the Perspective of Blue–Green Infrastructure Correlation
Given the limitations of the existing framework, this paper aims to assess the sustainable development potential of cities, integrating the United Nations Sustainable Development Goals (SDGs) related to blue and green infrastructure and screening factors. For example, based on SDG14 (Life underwater), SDG15 (Life on land), SDG6 (Clean drinking water), SDG11 (Sustainable cities), SDG13 (Climate action), and SDG3 (Health and well-being) [28], a new three-dimensional assessment framework is proposed. By integrating the three dimensions of environmental sustainability, economic sustainability, and social sustainability, this framework provides a more comprehensive and dynamic assessment system for urban sustainability (Figure 1).
Figure 1.
Conceptual framework of the relationship between BGI and USI.
The dimension of environmental sustainability mainly measures the ecological background and regulatory function of BGI. The natural capital stock of BGI is quantified by the total area and type distribution of blue spaces (such as rivers, lakes, ponds, ditches). The ability of artificial regulation is characterized by the density of sponge facilities. The health of the ecosystem is reflected by the vegetation coverage index (NDVI). These metrics together form the environmental support base for urban sustainability.
The economic sustainability dimension focuses on the stimulating effect of BGI on urban economic vitality. Using daytime and nighttime population vitality (mobile phone signaling data) to dynamically perceive the spatiotemporal distribution and intensity of economic activity, the economic empowerment effect of BGI is evaluated by quantifying the attractiveness of BGI to commercial capital through the POI density of commercial facilities such as hotels and retail facilities.
The social sustainability dimension assesses the public service and social equity value of BGI. The supply of public green services through the distribution density of park facilities is measured, indirectly reflecting the region’s appeal to active people and social vitality through the distribution of the youth population. The role of BGI in cultural heritage is considered through the distribution of cultural heritage, and the spatial equity of public services is evaluated through the accessibility of blue and green spaces. Scholars have found that blue–green infrastructure (BGI) enhances urban sustainability in terms of entertainment and leisure, sports and socialization, and cultural education by providing various CES and attracting younger generations to gather [29,30].
Among these, the first-level feature indicators include the environmental dimension, the economic dimension, and the social dimension. In descending order of weight, the secondary indicators are sponge facilities, water quality, nocturnal vitality, etc. (Table 1).
Table 1.
Variable composition analysis.
Based on the determination of spatial sustainability as the evaluation objective, the control layer and network layer are determined, the main influence directions among the indicators are sorted out, the relationships among the indicators are determined, and an evaluation index system for urban sustainability based on AHP is established.
The assessment of urban sustainability mainly involves a comprehensive assessment of its environmental, economic, and social dimensions. After calculating the relevant index, it is divided into five levels (1, 3, 5, 7, 9) by the natural discontinuity point method, and then the overall level, spatial distribution pattern, and correlation of the relevant indicators in the city are analyzed. By revealing the relevant characteristics and patterns, the related problems and problem areas are identified, and a scientific basis for further targeted optimization is provided.
2.4. Determination of Evaluation Indicator System
2.4.1. A Comprehensive Evaluation Method Connecting AHP Weights and Driving Detection
The construction of the indicator system and the analysis of driving factors in this study follow a two-stage logic of “comprehensive evaluation and mechanism diagnosis”, using different methods.
AHP (prior weights): Used to construct a comprehensive USI. Its weight is based on the judgment of domain experts on the general importance of various dimensions/indicators to urban sustainability, with the aim of generating a comprehensive and balanced outcome measure that reflects theoretical assumptions.
Geographic detector and SHAP (posterior driven detection): Used to diagnose which BGI elements or their interactions have practical and statistically significant explanatory power for the spatial differentiation of USI in the specific spatiotemporal context of a particular case (Zhenjiang). The results may deviate from the prior weights of AHP, as this reveals local, data-driven causal or correlative relationships rather than universal value judgments.
These two methods are not conflicting, but complementary: AHP ensures the theoretical integrity and multidimensionality of the evaluation framework; geographic detectors and SHAP extract specific and actionable driving mechanisms from the data. The comparison of the two results (for example, the economic dimension has a high weight in AHP, and the geographic detector also identifies economic vitality as a key driver) can mutually confirm. If there is a difference (for example, if an indicator with a lower AHP weight is detected as a key interaction factor), it precisely reveals the specifics of the case and provides deeper insights for precise planning.
2.4.2. Determination of Weight for Evaluation Indicator System
This study uses the Analytic Hierarchy Process (AHP) to determine the weights of each dimension and specific indicators. Firstly, based on the theory of blue–green infrastructure and the connotation of urban sustainable development, a hierarchical structure model was constructed, including the target layer (Urban Sustainable Development Index USI), the standard layer (environmental, economic, social dimensions), and the indicator layer (16 indicators shown in Table 1). Subsequently, 10 experts from the fields of urban planning, ecology, and sustainable development science were invited to compare the importance of each level element in pairs and construct a judgment matrix. Use the eigenvector method to calculate weights and perform consistency checks (all judgment matrices have CR values of less than 0.1) to ensure logical consistency. The final determined weights for each dimension are as follows: environmental system (0.35), economic system (0.40), and social system (0.25). On this basis, calculate the normalized weight of each specific indicator according to its level (Table 1).
2.5. Research Content and Paper Structure
To sum up, the overall structure of this paper is as shown in Figure 2:
Figure 2.
Technology roadmap.
The core framework of this study follows a logical closed loop of “urban sustainability assessment—spatial correlation analysis—driver factor detection—zonal policy” (Figure 2). First, quantify the urban sustainability index (USI) based on multi-source data to construct an urban sustainability index that integrates the features of blue elements (BI) and green facilities (GI). Secondly, focus on analyzing the spatial correlations and synergies between the system statuses of different types of blue infrastructure and green sponge facilities and the sustainability levels of their surrounding areas. Finally, form a precise planning strategy based on the synergistic characteristics of “blue–green infrastructure” by identifying key driving mechanisms and dividing priority intervention areas [31].
3. Materials and Methods
3.1. Scope of Study
The study area of this paper is defined as the typical Jiangnan water network city on the eastern coast of China—Zhenjiang City, Jiangsu Province (31°37′ to 32°19′ north latitude, 118°58′ to 119°58′ east longitude). According to the overall territorial spatial planning of Zhenjiang City (2021–2035), this study focuses on its central urban area, including the core built-up areas of Jingkou District, Runzhou District, Dantu District, and High-tech Zone, and the surrounding key ecological areas, with a total area of approximately 350 square kilometers. This area is a pilot for sponge city construction established at the national level and has a solid policy and practical foundation (Figure 3).
Figure 3.
Study area.
In terms of the regional ecological background, Zhenjiang City presents a unique landform pattern of “one water running across the river and three connected hills”. This complex topography, which combines major rivers (the Yangtze River), hills (the Ningzhen Mountains), alluvial plains, and dense water networks, provides the study with a natural gradient and diverse samples for identifying and comparing the relationship between different types of blue–green infrastructure (such as floodplains, river corridors, hilly reservoirs and ponds, etc.) and urban sustainability.
From the perspective of urban development, Zhenjiang, as an important component of the Yangtze River Delta urban agglomeration, faces both ecological pressure and spatial resource constraints brought by high-density urbanization and benefits from the policy advantages and investment intensity brought by the national-level pilot. This highly enriched natural ecological diversity within a limited space, combined with the complex process of rapid urbanization and systematic ecological restoration, makes it an ideal empirical case for exploring the synergy mechanism of blue–green infrastructure, which is both typical and forward-looking.
3.2. Data Sources and Processing
To systematically assess urban sustainability from the perspective of blue–green infrastructure, this study selected indicators from the three dimensions of environment, economy, and society for comprehensive calculation. The data used mainly came from multiple sources to ensure the authority and diversity of the data (Table 2).
Table 2.
Data sources.
Before data processing, all spatial data underwent coordinate unification and projection transformation (using the CGCS2000_GK_CM_117E coordinate system). For a refined spatial analysis, the entire study area was divided into regular grid cells of 500 m ×500 m, generating a total of 15,970 valid grids. All spatial operations and index calculations were carried out under this standard grid system, ensuring the consistency and comparability of the data.
The specific data processing and indexing were mainly carried out through the GIS platform. For blue spatial elements, vector patches of ponds, rivers, lakes, etc., are classified and extracted based on land survey data, and their area proportions and densities within each grid are calculated. For POI-type data such as hotels and parks, kernel density analysis is used to transform them into continuous spatial density surfaces. For mobile phone signaling data, the population activity values of each grid during different time periods are obtained through aggregation calculation. The population vitality data comes from the mobile signal data provided by China Mobile Communications Group. In order to improve the representativeness of the data, this study selected data from three days in 2024: 2 November (Saturday, rest day), 5 November (Tuesday, working day), and 1 October (Tuesday, holiday). The average population vitality grid values were calculated during the daytime (8:00–9:00) and nighttime (20:00–21:00) on working and rest days, respectively, to reflect the typical patterns of urban economic activities and avoid the interference of special events or weather on a single day as much as possible. For the accessibility of parks and large blue spaces, based on road network data, the network analysis method was used to calculate the service area. Ultimately, through weighted overlay analysis, the standardized indicators were combined within grid cells to generate the spatial distribution of the Urban Sustainability Index (USI).
3.3. Research Methods
The method used in this study solves different levels of problems in a logical order: (1) * Getis Ord Gi and kernel density estimation: used to describe the spatial pattern and clustering characteristics of USI and various BGI elements (preliminary answer to research question 1). (2) Geographic detector: The core is used to diagnose which BGI elements and their interactions are the main driving forces of USI spatial differentiation, and quantify their explanatory power (research question 2). (3) Geodetector coupled with Shap analysis:: Coupled with geographic detectors, further validate key driving factors, and reveal the nonlinear directions and marginal effects of each factor’s influence, enriching the understanding of the mechanism. (4) Space priority intervention model: Based on the analysis of the above mechanism, conduct spatial partitioning * * (research question 3). Each method progresses layer by layer, complements each other, and has no substantial overlap.
3.3.1. Getis-Ord Gi*
The Getis-Ord Gi* is a commonly used method for exploring the spatial autocorrelation of features. This technique can detect hot spots (areas with high clustered values) and cold spots (areas with low clustered values) in a study area [32,33]. Note that a feature with a high value may not necessarily be a statistically significant hot spot. To be considered a statistically significant hot spot, an area must meet two conditions: (1) it has a high feature value; (2) it is spatially surrounded by other areas with high feature values. In this study, the Getis-Ord was used to assess the spatial autocorrelation characteristics of each driving factor at the urban scale, as follows:
where is the z-score, higher z-scores (hot spots) indicate better sustainability, while lower z-scores (cold spots) indicate the opposite; xj is the USI score of city j; wi,j is the spatial weight between urban area i and urban area j; X is the mean value of USI; n is the total grid number of urban areas; S is the standard deviation of USI scores for all urban areas.
3.3.2. Kernel Density Estimation (KDE)
KDE visually presents the density distribution of features and is used to identify dispersed and concentrated areas of features. It reveals the process of changes in element density and can reveal regional differences in the overall pattern of element evolution [34]. This article focuses on expressing the spatial clustering characteristics of elements using KDE, and extracts the spatial clustering pattern of elements based on this. The predicted density of the new (x, y) location is determined by Formula (2):
In this formula,
i = 1, …, n is the input point. Only include points in the sum if they are within a radius distance of the (x, y) location.
Popi is the population field value of the I point, and it is an optional parameter.
Disti is the distance between point i and the (x, y) location.
3.3.3. GeoDetector
GeoDetector is widely used in the study of natural and economic and social influencing factors [35]. The method quantifies the importance of independent variables relative to dependent variables by analyzing the overall variability between different geospatial regions; it also shows significant advantages in dealing with mixed data [36]. Since the scientific problem of this paper is essentially to detect the spatial pattern of BGI distribution, USI, and the drivers behind them, and since the type of drivers involves mixed data, the method is quite suitable for this study. The GeoDetector carries four functional modules for factor detection, interaction detection, risk detection, and ecological detection, with algorithms and related software available at http://www.geodetector.cn, accessed on 21 March 2021.
In this paper, two functional modules, factor detection and interaction detection, were used to study the influencing factor forces and their interactions in the area and type indicators of BGI in Zhenjiang and the indicators of USI. The factor detection module is used to detect whether the difference in the geographical distribution of independent variables is the cause of the spatial differentiation of dependent variables, and the interaction detection module is mainly to detect whether the respective variables have independent effects in explaining the dependent variables or whether they interact to produce enhanced or weakened explanatory power.
In GeoDetector, the q index is used to measure the influence of the driving factor (Xi) on the spatial variation in attribute (Yi), where q (Xi) represents the direct influence and q (Xi ∩ Yj) represents the interactive influence. The maximum value of q index is one, and the minimum value is zero. The value of the q index will be larger if the independent variable has a stronger influence on the dependent variable. GeoDetector calculates the q index by analyzing the similarity between the geographical distribution patterns of X and Y. The basic principle it follows is that the software will create a higher q index when the geographical distribution pattern between the independent variable and the dependent variable is more similar [37]. The q index is calculated as follows [38]:
where h is the classification number of the influence factor (Xi). Because the spatial clustering algorithm is generally adopted when comparing and analyzing the similarity of geographical distribution patterns, this data discretization process can improve the stability and smoothness of the model. For the h layer and the study area, Nh and N, respectively, represent the number of grid cells, and represent the variance of the level of urban sustainable development (Yi) and SSW and SST represent the sum of squares. According to the relationship between the interaction influence and the direct influence (Max (q (Xi)), q (Xj)), min (Min (q (Xi), q (Xj)) and sum (q (Xi) + q (Xj)), the interaction relationship is divided into five types (Table 2) [39].
3.3.4. Spatial-First Intervention Area Identification
Priority Index model: Construct a synergy index that integrates blue–green infrastructure and sustainability indices to divide the study area into three priority intervention levels: high, medium, and low.
The operational definition of “collaboration”, in this study, “blue–green infrastructure collaboration” is characterized by two quantifiable indicators: (i) spatial coupling degree, such as the clustering relationship between BGI density and USI in space revealed by the global Moran index; (ii) interactive explanatory power (q-value): When two or more BGI elements measured by a geographic detector (such as sponge facility density X9 and park density X14) act together, the explanatory power of USI variance exceeds the sum of their independent explanatory powers (i.e., non-linear enhancement).
Priority intervention zone partitioning logic: Partitioning is based on the following rules to ensure reproducibility of the process:
High priority area: identified as a “low USI low BGI density/low synergy” clustering area (from Getis Ord Gi*), and located in ecologically sensitive or high development pressure areas. These areas are system weaknesses.
Medium priority area: identified as “medium USI medium BGI density” or “high BGI background low facility synergy” area. These areas are the main battlefield for improving overall system efficiency.
Low priority area: identified as a “high USI high BGI density/high synergy” clustering area, or an area with excellent ecological background and low development pressure. The strategy focuses on protection and maintenance.
3.4. The Spatio-Temporal Evolution Pattern of Blue–Green Infrastructure
The area of green spaces in Zhenjiang City has generally shown a trend of “slight decline” from 2009 to 2024, but the changes in the areas of various types of blue spaces have different characteristics. Among them, the river area in Zhenjiang increased by 453.56 ha between 2009 and 2024, an increase of 1.56%. Rivers showed a trend of shrinking first and then recovering between 2017 and 2024. From 2009 to 2024, the area of lakes and marshes in Zhenjiang increased significantly, by 614.38 and 311.63 ha, respectively. The total area of ponds decreased significantly (Table 3, Figure 4 and Figure 5). This is due to the implementation of “black and odorous water body” treatment, “sponge city” pilot projects, and “wetland protection” projects in Zhenjiang City to increase the quantity and quality of blue spaces.
Table 3.
Area (hectares) of various blue–green spaces in Zhenjiang City from 2009 to 2024.
Figure 4.
Numerical evolution characteristics of Blue–Green Space classification in different periods (2009–2024).
Figure 5.
Blue–Green Space classification map.
In contrast, the area of green space in Zhenjiang has shown an overall trend of “increasing first and then decreasing” between 2009 and 2024. Among them, forest area and urban green space have increased steadily, while cultivated land area has shown a trend of first increasing and then decreasing but remaining stable overall. This shows that Zhenjiang attaches great importance to urban park greening and has mitigated the degradation of farmland and enhanced the sustainability of the city by implementing the national farmland red line policy.
4. Results
4.1. Spatial Pattern Characteristics of Urban Sustainability
The average urban sustainability index of Zhenjiang City is 0.36, which is generally at a medium level. The spatial distribution shows a significant “high center, low periphery, multi-core” cluster structure (Figure 6). This pattern not only reflects the spatial differentiation of natural geographical conditions, but also embodies the spatial distribution characteristics of the synergy effect of the “blue space—sponge” system.
Figure 6.
Spatial distribution map of USI.
High sustainability areas (USI > 0.5) account for 6.1% of the total area, mainly concentrated in areas such as the Yangtze River Wetland belt, Xijindu Historical and Cultural block, Nanshan National Forest Park, etc. These areas not only have superior natural backgrounds, but more importantly, through systematic sponge infrastructure construction, they have achieved functional synergy between blue ecosystems and green sponge facilities, forming urban “sustainability highlands”. For example, along the Yangtze River, the area’s rain and flood regulation capacity has been significantly enhanced through the organic combination of ecological revetments and storage facilities.
Moderate sustainability (0.3 ≤ USI ≤ 0.5) accounts for the largest proportion, 73.4%, encircling high sustainability in a “C” shape, including most mature built-up areas and parts of the suburban ecotone. These areas typically have a certain coverage of sponge facilities, but the synergy between wetlands and sponge facilities needs to be improved. They are key areas for optimizing the synergy of the “blue—green” system in the future.
Low and very low sustainability areas (USI < 0.3) account for 20.5%, mainly located at the junction of the southwestern part of the city with Nanjing, the northeastern part with Changzhou, and some old urban areas with aging infrastructure. These areas are generally characterized by high levels of development, a lack of green space, poor ecological connectivity, insufficient coverage of sponge facilities, and a lack of effective connection with existing wetland systems, resulting in a lower overall sustainability level.
4.2. Dimensional Decomposition of Urban Sustainability
From the three dimensions of sustainability composition [40,41]: The multi—dimensional decomposition of urban sustainability facilitates a more granular understanding of how different aspects of the urban system—environment, economy, and society—contribute to overall sustainability. By examining each dimension individually, we can uncover specific strengths and weaknesses within the study area, identify targeted opportunities for intervention, and clarify the pathways through which BGI operates to enhance urban sustainability.
4.2.1. Environmental Dimension
The environmental sustainability of Zhenjiang City shows a clustered spatial distribution that decreases from the periphery to the center. Jurong City in the west of the city and Dantu District in the south have higher environmental sustainability than the study area average. The quality of the high-tech Zone and the Economic Development Zone is slightly below average, and the eastern part of the Economic Development Zone has the worst environmental sustainability. In the southern part of the urban core and the northern part of Dantu District, there are more parks, green spaces, and wetlands, and the vegetation coverage is high. In contrast, industrial enterprises are concentrated in the economic development Zone and the High-tech Zone, which also include more wasteland and bare land. As a result, poor green coverage and air quality are the main reasons for the low environmental sustainability in these areas.
The blue spatial distribution shows a distinct pattern of “higher north and lower south”, and the riverside area, with its close connection to the Yangtze River, has formed wetland units of significant scale and complete ecological functions (X1). The ponds are mainly concentrated in the western part of Jurong City, the southwestern part of Dantu District, and the riverside area of the urban core (X2). These pond systems, through the organic combination with community-level sponge facilities such as rain gardens and infiltration ponds, have constructed an efficient microcirculation system for rainwater management at the local scale. Ditch wetlands are widely distributed in Yangzhong City, Danyang City, and the western plain polder area of Jurong City (X3), and their dense linear networks are deeply integrated with ecological ditches, grass swales, and other sponge facilities, significantly enhancing the regional water system connectivity and water resource allocation capacity (Figure 7).
Figure 7.
Spatial distribution map of independent variables (Environmental System: X1–X6).
Both permanent rivers and inland tidal flats exhibit significant characteristics of agglomeration along the main stream of the Yangtze River on the north side (X4, X5), and these corridor-type blue spaces have effectively enhanced the ecological stability and rain and flood resilience of the Yangtze River shoreline through collaborative design with green sponge facilities such as ecological revetments and riverbank wetland purification areas. The lakes and reservoirs are mainly distributed in the low-lying areas of the Ningzhen Mountains and Maoshan Mountains (X6), and most of these water bodies undertake regional storage functions or are formed by ecological restoration of mine pits, and play a key role in mountain hydrological regulation through their coordinated operation with large sponge facilities such as pre-reservoirs and storage ponds (Figure 7).
Further research indicates that green spaces and green corridors contribute significantly to the improvement of environmental sustainability through systematic integration with sponge facilities. In areas with good vegetation coverage such as the riverside area in the central urban area, Jinshan Lake, and Nanshan Scenic Area, not only do environmental indicators such as X7, X8, X9, and X10 show high value aggregation, but more importantly, a complex system of efficient coordination of blue (wetland), green (vegetation), and green sponge facilities is formed. A multiplier effect of ecological service functions has been achieved (Figure 8).
Figure 8.
Spatial distribution map of independent variables (Environmental System: X7–X10).
4.2.2. Economic Dimension
The population vitality index, as a core indicator of urban economic vitality, is closely related to the allocation level of BGI in terms of its spatial distribution characteristics, and together constitutes an important driving force for urban sustainable development. While urban public service facilities provide convenient living services for residents, the degree of synergy between their spatial layout and sponge facilities has also become a key factor affecting regional economic sustainability (Figure 9).
Figure 9.
Spatial distribution map of independent variables (Economic System).
The spatial distribution of hotel facilities shows a significant multi-core agglomeration pattern, mainly concentrated in commercial centers such as the Dashikou business district, Wuyue business district of the Economic Development Zone, and Dantu Baolong business district (X11). It is notable that these high-density hotel clusters often overlap highly with areas with well-developed sponge facilities, reflecting the preference of commercial investment for areas with well-developed ecological infrastructure and demonstrating the positive promoting effect of the “wetland—sponge” system on commercial vitality.
Daytime human activities show typical characteristics of “multi-core agglomeration, dispersed distribution, and decreasing circles” (X12). The degree of aggregation of human activities is closely related to regional functional positioning: urban centers host a large number of aggregated activities such as commercial shopping, dining and entertainment, business office, etc., resulting in generally higher social-ecological exposure in these areas; The peripheral ecological spaces, on the other hand, show a relatively dispersed distribution pattern due to the lower intensity of activities. This spatial differentiation suggests that we need to build more sponge facilities in highly developed areas to relieve the ecological pressure brought about by high-intensity human activities.
Compared with the daytime activity pattern, the evening vitality pattern shows a distinct leisure-oriented shift (X13). Recreation areas such as Xijindu Historical District and Nanshan Ecological District have seen a significant increase in vitality at 20:00, showing a “core spillover” effect from commercial centers to cultural ecological spaces. This phenomenon not only reflects the growing demand of citizens for ecological and cultural spaces, but also highlights the economic value of enhancing the environmental quality of historical districts and ecological scenic spots through sponge facilities, providing empirical evidence for the diversified benefits of “gray–green” infrastructure.
4.2.3. The Social Dimension
Social sustainability is a key dimension for measuring the overall level of sustainable development of a city, and its spatial distribution characteristics are closely related to the coordinated allocation of BGI (Figure 10).
Figure 10.
Spatial distribution map of independent variables (Social System).
The density of park facilities shows a spatial pattern of decreasing gradients from the urban core to the periphery, while distinct service aggregation nodes are formed in various regional centers (X14). This distribution pattern is highly consistent with the key areas for the construction of sponge facilities, especially in the old urban areas. Through the coordinated layout of sponge facilities such as rain gardens and permeable pavement with park facilities, the regional flood prevention capacity and the comfort of the outdoor recreational environment have been effectively enhanced, demonstrating the supporting role of gray infrastructure for social service functions.
The distribution of the youth population shows an agglomeration feature of “multi-center and networked” spaces (X15). In addition to the traditional urban center, there are also significant youth population clusters in the peripheral areas, such as the Wuyue business district in the Economic Development Zone and the Dantu Baolong business district. This distribution pattern is not only influenced by the housing price gradient, but also closely related to the well-developed “wet–sponge” system construction in these areas—by creating a community environment with blue and green integration and ecological livability, combined with complete industrial park supporting facilities, a strong attraction for the youth group is formed, demonstrating the regulatory function of ecological infrastructure on the population structure.
The spatial distribution of cultural heritage shows the remarkable feature of being highly concentrated in the old town center (X16). New urban areas such as the Economic Development Zone, High-Tech Zone, and Nanxu New Town have relatively scarce historical and cultural resources due to their shorter development history. However, these areas have achieved an organic unity of cultural protection and ecological construction by combining the construction of sponge facilities with the shaping of cultural landscapes and applying green technologies such as ecological revetments and stormwater wetlands in historical areas like the ancient canal corridor and Xijindu, while preserving the authenticity of cultural heritage and enhancing the environmental resilience of historical spaces.
This spatial pattern indicates that the improvement of social sustainability depends not only on the improvement of traditional public service facilities, but also on the coordinated integration of BGI to build an urban environment that is ecologically resilient, culturally vibrant, and socially inclusive.
4.3. Spatial Relationship Between Wetland—Sponge System and Urban Sustainability Synergy
Global spatial autocorrelation analysis indicated that the Global Moran’s I index for the synergy between the wetland—sponge system and the urban sustainability index was 0.85 (Z = 150.43, p < 0.01), confirming the significant positive agglomeration characteristics of the synergy between the wetland—sponge system and the urban sustainability index in space. The cluster map clearly identified “high–high” clusters (mainly distributed in the central urban area and the well-developed Yangzhong wet–sponge system in the east) and “low–low” clusters (mainly concentrated in the western and southeastern administrative regions and new urban areas and industrial zones).
Spatial cluster analysis further reveals the detailed synergy mechanism (Figure 11):
Figure 11.
Cluster diagram of synergy between wetland–sponge system and USI.
The “high USI-high BGI concentration” areas are mainly distributed along the Yangtze River floodplain and tidal wetland, and these areas, through the systematic integration of large storage facilities, ecological detention areas, and natural wetlands, form the “sustainability skeleton” of the city and play a key role in responding to extreme climate events.
The “low USI–low BGI concentration” areas overlap highly with the rapid urbanization frontier (especially the administrative boundaries) and industrial plots. These areas are not only lacking in a wetland resource background, but more importantly, there is a lack of effective connection between sponge facilities and residual wetlands, resulting in the severe degradation of ecological functions.
It is worth noting that the “high USI” patches scattered within built-up areas often overlap with the space of sponge-transformed reservoir and pond wetlands or ecologically restored river wetlands. These cases demonstrate that even small-scale wetlands, when combined with appropriate sponge facilities, can significantly enhance the sustainability of the built environment at the local scale.
In summary, the degree of synergy between wetlands and sponge facilities shows a significant spatial coupling relationship with the level of urban sustainability, and different combinations of wetlands with matching sponge facilities show obvious efficiency gradients, which provide an important spatial optimization basis for urban sustainability improvement based on the synergy of BGI.
4.4. Blue–Green Infrastructure Enhances the Synergistic Driving Mechanism for Urban Sustainability
To delve deeper into the intrinsic mechanisms by which blue–green infrastructure affects urban sustainability, this study employed geodetectors to focus on the synergistic explanatory power of the blue spatial attribute factor and the sponge facility indicator. Factor detection results (Table 4) showed that the co-configuration of sponge facility density (X9) and park facility density (X14) (q = 0.698) was the most explanatory driver, indicating that the greater the sponge facility density, the stronger the correlation with park facility density. In terms of the blue–green space association, the co-configuration of artificial ditches (X3) and sponge facilities (X9) (q = 0.243) was the most explanatory driver, followed by the combination of lakes and reservoirs (X6) and sponge facilities (X9) (q = 0.232). This finding statistically confirms that “type-matching—facility synergy” is the key mechanism that determines the effectiveness of sustainability improvement.
Table 4.
q values of interactions of green sponge facilities with blue infrastructure and parks.
Notably, the explanatory power of a single blue–green infrastructure attribute factor is relatively limited, with wetland area (q = 0.001) and wetland type (q = 0.004–0.079) both performing weakly. However, when these factors are combined in synergy with the corresponding sponge facility indicators, their explanatory power is significantly enhanced, and there is a common nonlinear enhancement effect between the wetland attribute and the sponge facility indicators. This indicates that it is difficult to achieve optimal sustainability benefits by relying solely on blue space protection or sponge facility construction. Only through the precise matching and systematic integration of the two can the synergistic gain effect of gray–green infrastructure be fully exerted (Figure 12).
Figure 12.
Driver factor identification map based on geodetector (* are factors with strong explanatory power).
These results indicate that the improvement of urban sustainability not only depends on the inherent endowment conditions of blue and green infrastructure resources themselves, but also on the degree of synergy and allocation patterns within the blue and green infrastructure. This provides an important theoretical basis and practical guidance for optimizing the spatial allocation of blue–green–gray infrastructure [41].
4.5. Coupled Analysis of Geodetectors with Machine Learning
To further validate and deepen the analysis results of the geodetector and enhance the ability to interpret the driving mechanism, this study introduces the explainability method in machine learning—SHAP—to construct a coupled analysis framework of the geodetector and machine learning. The framework aims not only to identify the key factors that affect urban sustainability, but also to quantify the contribution of each factor to the model output and its direction of action, thereby revealing in greater detail the nonlinear mechanisms and interaction effects of blue–green infrastructure on sustainability.
First, a random forest regression model is constructed based on a subset of key drivers screened by geodetectors, with the Urban Sustainability Index (USI) as the dependent variable and the various indicators of blue–green infrastructure as the independent variables. The model performed well on the training set with a root mean square error (RMSE) of 0.392, indicating good predictive performance (Figure 13). By analyzing the variations in RMSE under different numbers of factors, it was found that the model error was minimized and stabilized when the number of factors was 11, verifying the validity and simplicity of the subset of fundamental driving factors identified by the geodetector.
Figure 13.
Identify the basic driving factor set based on the coupling model of geographic detectors and machine learning.
The trained random forest model was then interpreted using the SHAP method. The SHAP values can quantify the positive or negative contribution of each feature to a single prediction and its magnitude. Overall, there are significant differences in the contribution of each feature to model predictions. Among them, the average absolute contribution of SHAP for the blue–green space area index (BGSAI, X1), natural pond distribution (X2), and water quality (X10) is the highest (Figure 14), indicating that they are the dominant factors controlling model predictions. This finding corroborates the factor detection results of the geodetector, jointly highlighting the fundamental role of ecological background quality (particularly water body area and water quality) in urban sustainability systems.
Figure 14.
Manners and degrees of influence of the essential driving factors on the distribution of Urban Sustainable Indicators (USI).
Specifically, the high SHAP value of X1 (blue–green space area index) (red dots are concentrated on the right side) indicates that the larger the blue–green space area, the stronger the positive contribution to urban sustainability. This supports the hypothesis that the scale of the ecological base is the foundation of sustainability. The significance of X2 (natural pond distribution) as a representative of decentralized blue spaces highlights the crucial role of microwater bodies in local climate regulation, stormwater storage and infiltration, and biodiversity support, especially in high-density built-up areas. The high contribution of X10 (water quality) directly reflects the constraining effect of water environment health on urban sustainability, and good water quality is a prerequisite for the ecological, social, and economic benefits of blue spaces.
It is notable that sponge facility density (X9) and hotel facility density (X11) also show higher SHAP contributions, but slightly lower than the three environmental background factors mentioned above. This further indicates that although artificial interventions (such as sponge facilities) and economic vitality representations are crucial, their effectiveness largely depends on good ecological background conditions.
Intrinsic consistency can be found by comparing the SHAP-dependent map with the interactive detection results of the geodetector. For example, X9 and X14 (park facility density) showed a strong synergistic positive effect in the SHAP analysis, which is in perfect agreement with the geodetector’s conclusion that the interaction q value between the two was the highest (0.698). Furthermore, the SHAP analysis revealed that certain factors (such as X3 artificial ditches, X8 vegetation coverage) had nonlinear threshold effects on the USI in different value intervals, complementing the details of the geodetector in identifying complex nonlinear relationships.
In summary, the coupled analysis of the geodetector with machine learning not only verified the spatial explanatory power of the key drivers through statistical means but also quantified the global and local contributions of each factor through model interpretability techniques and revealed their nonlinear modes of action. This dual validation framework of “spatial correlation detection + machine learning interpretation” enhances the robustness and depth of conclusions about the coordinated driving mechanism of blue–green infrastructure and provides methodological references for understanding the behavior of complex, multi-element systems. Future research could build on this and further integrate time series and causal inference methods to reveal the evolutionary path of this driving mechanism from a dynamic perspective (Figure 13 and Figure 14).
4.6. Priority Intervention Area Division
The analysis shows that there is a significant spatial divergence in the degree of synergy between sustainability levels and the density of blue–green infrastructure distribution within the study area. Zoning calculations show that the traditional old town core has a relatively better match (0.275) due to the historically formed BGI synergy base. Emerging development zones, administrative divisions, and industrial areas have poor compatibility due to the imbalance of the BGI system caused by rapid urbanization and management system gaps (>0.35).
Based on the analysis in the previous text, the study area is divided into three intervention levels:
High-priority intervention areas (17.8%). These mainly include the following: (1) scattered degraded wetlands and their surrounding green spaces in the old urban area, where sponge facilities are aging and disconnected from the wetland system. (2) Polluted or landfilled wetlands in the eastern industrial zone, facing dual pressures of loss of ecological function and rain and flood risks. (3) Wetlands in the fringe areas of urban expansion that are threatened by encroachment, such as the upper and lower lake wetlands between Dantu and Danyang, whose natural regulation and storage functions have not been effectively connected with the regional sponge system, it is suggested that urban sponge parks be built to promote regional revitalization. These areas are the “shortest links” in collaborative governance and are in urgent need of comprehensive projects such as wetland ecological restoration, sponge facility renovation, and spatial function replacement.
Priority intervention areas (46.5%). These mainly include the following: (1) built-up areas with a single function, where small blue spaces connected to the sponge facilities can be added by “filling in the gaps”. (2) Key breakpoints of ecological corridors that require the restoration of corridor connectivity through sponge means, such as ecological revetments and stormwater wetlands. (3) Areas where infrastructure conditions are relatively good but BGI coordination is insufficient. These areas are the “main battlefields” for enhancing the synergy of blue–green infrastructure and should focus on optimizing the connectivity and composite functions of the ecological network.
Low-priority intervention areas (35.7%): mainly natural blue spaces that have been strictly protected (such as parts of the tidal flats along the Yangtze River and wetlands in Nanshan Forest Park) and areas with good ecological background and low development pressure. These areas have formed a relatively complete BGI synergy system, with strategies focusing on strict conservation, effectiveness monitoring, and adaptive maintenance.
5. Discussion
5.1. Strategic Recommendations from the Perspective of Blue–Green Infrastructure Synergy
The findings of this study suggest that the high-value areas of urban sustainability are mainly concentrated in the core areas where the blue–green infrastructure background is excellent, the facilities are highly coordinated, and the population is economically dynamic. Low-value areas, on the other hand, are mostly located in urban fringes or administrative regions where blue spaces are shrinking, green sponge facilities are inadequately covered, and social service functions are weak, revealing the systematic characteristic process of the “environment–economy–society” multi-dimensional interwoven influence. Based on this, strategies for enhancing urban sustainability under the guidance of the blue–green infrastructure theory are proposed.
5.1.1. Strengthen the Coordinated Configuration of Sponge Facilities and Park Green Spaces to Build a Functionally Complex Green Sponge Network
According to the research results, the co-configuration of sponge facility density (X9) and park facility density (X14) (q = 0.698) is the most explanatory driver for urban sustainability. This suggests that the value of green infrastructure lies not only in its physical presence but also in its synergy and integration with other functions. Sponge facilities give parks and green spaces flexible hydrological regulation functions, while parks provide valuable landing spaces and beautiful landscape carriers for sponge facilities. The combination of the two enhances the ecological environment quality and public space attractiveness of the region, thereby generating positive feedback on economic vitality and social equity. Therefore, future urban planning should focus on promoting the deep integration of “sponge city” construction and the concept of the “park city”. On the one hand, in new urban construction and old urban renewal, the systematic embedding of sponge facilities such as rain gardens, infiltration ponds, and ecological depressions should be prioritized in the park and green space system, upgrading single landscape green spaces to “sponge parks” with rainwater storage and water purification functions. On the other hand, transform existing parks into sponge parks and use them as key nodes to connect them through linear facilities such as ecological corridors and green streets to build a multi-functional and multi-beneficial green sponge network.
5.1.2. Implement Precise Ecological Restoration Based on Blue Space Typology to Enhance Its Functional Linkage with the Urban System
Geodetector interaction results show significant differences in contribution when different types of blue spaces are combined with sponge facilities. For example, the explanatory power of artificial ditches (X3) in synergy with sponge facilities (q = 0.243) is higher than that of inland tidal flats (X5, q = 0.226). This reveals the differentiated roles played by different blue spaces in urbanization and the unique pressures they face. Therefore, the governance of urban water environments should not adopt a one-size-fits-all strategy, but should follow the precise principle of typology. First, a blue space classification protection and restoration system should be established. For water bodies with strong connectivity such as artificial ditches, the focus is on ecological revetment transformation and water quality maintenance, strengthening their dual functions as “ecological veins” and “sponge channels”; For water bodies such as lakes and reservoirs, their flood detention areas should be strictly protected and they should operate in coordination with large-scale storage facilities; For scattered ponds, attention should be paid to their microcirculation connectivity with community-level sponge facilities to give full play to their flexible value as “local regulatory cells”. Secondly, in the ecological restoration of blue spaces, social needs must be coupled. Through means such as improving the quality of waterfront spaces and building waterfront slow traffic systems, the results of ecological restoration should be transformed into visible and perceptible social benefits, enhancing the positive feedback between blue spaces and urban vitality.
5.1.3. Identify Combinations of Significant Impact Factors and Carry out Spatially Precise Collaborative Interventions
According to the research results, urban sustainability development is not determined by a single dimension of indicators, but is driven by the non-linear enhancement of multiple factor combinations within blue–green infrastructure. Through geodetectors and spatial analysis, we can identify the combination of indicators that have the most significant impact on sustainability. Based on this, a mechanism for identifying the “blue–green synergistic features” of urban space should be established, dividing different synergistic functional zones based on the contributions and interactions of each factor in the sustainability index, so as to achieve differentiated and precise planning intervention. Examples include the following:
(1) For “high synergy—high vitality” areas (such as old town waterfront areas), the strategy focuses on “maintenance and optimization”, with an emphasis on the refined management of existing blue–green systems to ensure the continuous and efficient operation of their synergy functions.
(2) For areas with a strong blue–green background and weak facility synergy (such as some suburban areas), the strategy focuses on “connection and activation”, prioritizing the shortcomings of green infrastructure such as sponge facilities, strengthening the connection of the blue–green system, and moderately introducing public service functions.
(3) For “ecologically sensitive–development-intensive” areas (such as the frontiers of urban expansion), the core of the strategy lies in “protection and relief”, drawing ecological conservation red lines, strictly restricting development, and guiding their development towards ecological conservation and low-intensity recreation.
Through this feature recognition and classification guidance, based on data diagnosis, limited ecological investments can be precisely directed to the most critical areas, achieving a transformation from extensive management to intelligent governance.
5.2. Limitations of the Research and Future Directions
In terms of indicator selection and data acquisition, this study, based on multi-source spatio-temporal big data, constructs an assessment framework for urban sustainability covering the three dimensions of environment, economy, and society, and explores the synergistic driving mechanisms of blue–green infrastructure. However, there are still certain limitations in the study.
First, there is an imbalance in precision at the metric quantification level. Environmental dimension indicators, such as blue space areas and sponge facility density, benefit from remote sensing and planning data and have higher quantification accuracy; Some key concepts in the social dimension, such as soft factors like the level of community governance and public ecological satisfaction, have not been fully quantified and incorporated, which limits the in-depth interpretation of the social ecological synergy mechanism.
Secondly, although this study used mobile signaling data from multiple dates to enhance representativeness, the data were still focused on October, November 2024, and did not cover seasonal variations and extreme weather scenarios throughout the year. Future research can more comprehensively characterize the spatiotemporal dynamics of urban vitality and its association with blue–green infrastructure by obtaining longer period time series data.
Thirdly, in terms of research methods, the capture of dynamic and process mechanisms is still insufficient. This study, based mainly on cross-sectional data from 2024, presents a static snapshot. The synergy of blue–green infrastructure, especially the dynamic response process under disturbances such as extreme rainfall, was not demonstrated. In addition, although geodetectors can reveal statistical correlations and interactions among factors, they cannot precisely depict the direction and intensity of their causal relationships.
Finally, in terms of the empirical scope, the universality of the conclusion remains to be further tested. The case and conclusion of this study focus on Zhenjiang, a typical city in the Jiangnan water network region. Cities in different climate zones and at different stages of development may have significant differences in the composition of their blue–green infrastructure, the pressures they face, and their paths of synergy.
In future research, on the one hand, the indicator system needs to be further enriched and optimized, especially by integrating multi-source data such as social media and questionnaires to enhance the quantification of the social dimension. On the other hand, long-term series data should be introduced to track the dynamic coupling process of blue–green infrastructure and urban sustainability, and process models such as SWMM and InVEST can be considered for coupling to simulate and validate the synergy. In addition, applying this assessment framework to more comparative studies of cities of different sizes and types will help to distill more universal blue–green infrastructure synergy models and provide richer Chinese samples and theoretical support for the sustainable development of global cities.
5.3. Comparisons with Domestic and International Studies and Discussions on Synergy Mechanisms
The results of this study show a relationship of inheritance and development with existing studies. Compared with Li et al.’s study in Changchun [40], both studies confirmed at the commonality level that there is a significant positive association between the distribution of blue–green infrastructure and the urban sustainability index, and that core ecological elements such as water bodies show a higher comprehensive contribution in various land uses.
At the level of differences and innovations, the findings of this study are more revealing: traditional studies have mostly reported a linear decline in ecological quality with increasing urbanization intensity, such as the single core pattern of “high in the east and low in the west” presented in the Changchun case, which is highly consistent with the distribution of macro ecological land. However, the study found that Zhenjiang presented a “high center, low periphery, multi-core” cluster structure, a differentiation pattern that broke the traditional perception. We believe this reflects that Zhenjiang, as a national sponge pilot city, has effectively maintained and enhanced ecological service functions in the highly urbanized central urban area through systematic BGI coordinated infrastructure construction, demonstrating the potential of scientific planning and engineering intervention to overcome the threat of ecological decay.
In terms of driving mechanisms, existing studies have mostly emphasized the fundamental role of morphological patterns (such as landscape connectivity), but this study identifies the synergistic relationship between sponge facility coverage and land development intensity as the key driving force. This difference reveals the dominant mechanism of cities at different stages of development: cities in rapid transition are more regulated by the dynamic game process of “artificial ecological intervention—natural background response” compared to cities with relatively stable forms.
These contrasts suggest that the formation mechanism of urban sustainability is significantly context-dependent. The national sponge pilot policy reshapes the performance output path of “blue–green” infrastructure through concentrated funding and project construction. Therefore, the optimization strategy needs to be adaptively designed in light of the local natural background, urbanization stage, and governance model. This study provides a new analytical dimension for understanding the differentiated roles of ecological infrastructure in different urban contexts and a framework for evaluating the effectiveness of similar policy-driven ecological projects by introducing a collaborative perspective and interactive probing methods.
6. Conclusions
This study constructs a comprehensive assessment framework, taking Zhenjiang, a national sponge city pilot city in China, as an example, to explore the synergy mechanism of blue–green infrastructure and its enhancement of urban sustainability. By fusing multi-source spatio-temporal data and using spatial analysis and geodetector models, this study quantified the complex nonlinear relationship between the components of blue–green infrastructure and the composite urban sustainability index.
The main findings reveal three key conclusions. First, the spatial pattern of urban sustainability is not a simple gradient but a “high center, low periphery, multi-core” cluster structure, which has a significant positive spatial correlation with the distribution of blue–green infrastructure. Secondly, the contribution of different dimensions to overall sustainability is uneven; among the three dimensions evaluated, the economic dimension, particularly the economic vitality represented by daytime population vitality, is the most significant contributor. Third, and most crucially, the analysis shows that improvements in sustainability are not driven by isolated blue–green infrastructure elements, but by their synergistic interactions. The co-configuration of sponge facility density and park facility density was identified as the most influential driver (q = 0.698), highlighting the extreme importance of functional integration within green infrastructure. In addition, the interaction between blue infrastructure elements (such as rivers and ponds) and green sponge facilities generally shows a nonlinear enhancement effect, indicating that the combined impact goes beyond the simple sum of individual contributions. This strongly suggests that we must look beyond fragmented planning and view blue–green infrastructure from a systemic and synergistic perspective.
This study contributes both in theory and practice. Theoretically, it advances the concept of blue–green infrastructure from a collection of discrete elements into an interrelated collaborative system and provides a methodological framework for quantifying the often-overlooked nonlinear interactions among its components. In practice, the spatial identification of high-, medium-, and low-priority intervention areas, as well as the proposed “type matching–facility synergy” principle, provides a scientific and actionable decision-making tool for precise ecological space planning in high-density urbanized areas, and direct guidance for the deep integration of the sponge city and park city concepts.
Despite these achievements, there are still some limitations in this study, which also point to future research directions. The assessment was mainly based on cross-sectional data, which, while capturing snapshots of spatial relationships, failed to reveal the dynamic resilience-promoting response process of blue–green infrastructure synergies under extreme climate events or long-term urbanization pressures. In addition, the quantification of social dimensions, such as the level of community governance and public perception of ecosystem services, remains constrained by data availability. Future research should integrate process models (such as hydrological models and social surveys) with long time series data to simulate and validate the dynamic evolution of synergies. In addition, applying and adapting this assessment framework to cities in different climate zones and development stages is of great value for testing its universality and revealing context-dependent pathways by which blue–green infrastructure promotes urban sustainability.
In summary, the study shows that the path to sustainability for high-density cities lies not only in increasing the number of blue–green spaces but also in fostering their functional synergies through strategic planning. The findings confirm that precise planning based on the synergy of blue–green infrastructure is a key lever for building resilient, livable, and sustainable urban futures.
The “multidimensional evaluation of spatial correlation mechanisms for the determination of zoning policy” framework constructed in this study, although taking Zhenjiang, a sponge water network pilot city in Jiangnan, as a case study, has a transferable methodological core. This framework does not rely on specific BGI types or policy labels, but is based on the universally existing logic of interactions between “ecological elements-urban vitality-social equity”. By adjusting the indicator pool to adapt to local data availability and recalibrating the spatial units and parameters in the analysis, this framework can be applied to cities in other climate zones and different stages of development to diagnose the collaborative status and optimization potential of their blue–green infrastructure systems, providing a universal analytical tool for the refined implementation of nature based urban solutions on a global scale.
Author Contributions
Conceptualization, P.L. and C.L.; methodology, P.L. and C.L.; software P.L. and J.Z.; validation, H.W., P.L. and J.Z.; formal analysis, P.L. and J.C. investigation, P.L.; resources, P.L. and C.L.; data curation, S.X. and P.L.; writing—original draft preparation, P.L. and H.W.; writing—review and editing P.L.; visualization, P.L., H.W. and S.X.; supervision, C.L.; project administration, C.L.; funding acquisition, C.L. and H.W. All authors have read and agreed to the published version of the manuscript.
Funding
This research was funded by the National Natural Science Foundation of China, grant number “52078316”; Jiangsu Provincial Social Science Foundation General Project, grant number “24SHB001”; National Natural Science Foundation of China, grant number “52208009”; 2025 General project of philosophy and social sciences research in Colleges and Universities in Jiangsu Province, project number “2025SJYB1629”: Research on the Construction and Revitalization Inheritance of Spatial Pedigree of Traditional Villages Based on Multi-source Data Fusion.
Data Availability Statement
The data used and analyzed in this study are available from the corresponding author upon reasonable request.
Conflicts of Interest
Author Pengcheng Liu was employed by the company Zhenjiang Planning Survey and Design Group Co., Ltd. The remaining authors declare that the research was conducted in the absence of any commercial or financial relationships that could be construed as a potential conflict of interest.
References
- Zeng, L.; Wang, Z.; Liu, H.; Huang, X.; Chen, X. Influences of urbanization on algal community and water clarity in lakes in typical international Wetland cities: Evidence from Wuhan, Central China. Prog. Phys. Geogr.-Earth Environ. 2025, 49, 221–235. [Google Scholar] [CrossRef] [Scilit]
- Yang, M.; Dong, X. Enhancing Water Quality in Urban Areas: A Spatiotemporal Optimization Framework for Green-Gray Infrastructure. Sci. Total Environ. 2020, 703, 134980. [Google Scholar] [CrossRef] [Scilit]
- Coutts, C.; Hahn, M. Green Infrastructure, Ecosystem Services, and Human Health. Int. J. Environ. Res. Public Health 2015, 12, 9768–9798. [Google Scholar] [CrossRef] [Scilit]
- Kati, V.; Jari, N. Bottom-up thinking: Identifying socio-cultural values of ecosystem services in local blue-green infrastructure planning in Helsinki, Finland. Land Use Policy 2016, 50, 537–547. [Google Scholar] [CrossRef] [Scilit]
- Zheng, S.; He, Y.; Han, B.; Xu, D.; Ouyang, Z. Ideas and Methods for Ecological Specialized Planning in the Phase of Urban Master Planning. Planners 2018, 34, 52–58. [Google Scholar]
- Wang, K.; Wang, Z.; Fan, Y.; Wu, Y. A Comprehensive Modelling Framework for Identifying Green Infrastructure Layout in Urban Flood Management of the Yellow River Basin. ISPRS Int. J. Geo-Inf. 2025, 14, 414. [Google Scholar] [CrossRef] [Scilit]
- Balist, J.; Darabi, H.; Hoveyzavi, A. Quantifying the Cooling Nexus of Green-Blue Infrastructure in Hyper-Arid Cities: A Spatial Ecosystem Services Approach. Buildings 2025, 15, 3975. [Google Scholar] [CrossRef] [Scilit]
- Tyler, S.; Moench, M. A Framework for Urban Climate Resilience. Clim. Dev. 2012, 4, 311–326. [Google Scholar] [CrossRef] [Scilit]
- Michael, K.; Deshpande, T.; Ziervogel, G. Examining vulnerability in a dynamic urban setting: The case of Bangalore’s interstate migrant waste pickers. Clim. Dev. 2019, 12, 667–678. [Google Scholar] [CrossRef] [Scilit]
- Mathey, J.; Hennersdorf, J.; Lehmann, I.; Wende, W. Qualifying the urban structure type approach for urban green space analysis—A case study of Dresden, Germany. Ecol. Indic. 2021, 125, 107519. [Google Scholar] [CrossRef] [Scilit]
- Zhang, G.; Wang, Y.; Wang, Y.; Peng, Y. Linking Visual Perception of Urban Greenery to Resident Preference in High-Density Residential Areas Through Mobile Point-Cloud-Based Assessment. Buildings 2025, 15, 4275. [Google Scholar] [CrossRef] [Scilit]
- Gunawardena, K.R.; Wells, M.J.; Kershaw, T. Utilising green and bluespace to mitigate urban heat island intensity. Sci. Total Environ. 2017, 584, 1040–1055. [Google Scholar] [CrossRef] [Scilit] [PubMed]
- Wolch, J.; Byrneb, J.; Newell, J.P. Urban Green Space, Public Health, and Environmental Justice: The Challenge of Making Cities ‘Just Green Enough’. Landsc. Urban Plan. 2014, 125, 234–244. [Google Scholar] [CrossRef] [Scilit]
- Chen, J.; Wang, S.; Wu, R. Optimization of the integrated green-gray-blue system to deal with urban flood under multi-objective decision-making. Water Sci. Technol. 2024, 89, 434–453. [Google Scholar] [CrossRef] [Scilit]
- Yin, H.; Xiao, R.; Fei, X.; Zhang, Z.; Gao, Z.; Wan, Y.; Tan, W.; Jiang, W.; Cao, W.; Guo, Y. Analyzing “economy-society-environment” sustainability from the perspective of urban spatial structure: A case study of the Yangtze River delta urban agglomeration. Sustain. Cities Soc. 2023, 96, 104691. [Google Scholar] [CrossRef] [Scilit]
- Wang, H.; Shan, Y.; Xia, S.; Cao, J. Traditional Village Morphological Characteristics and Driving Mechanism from a Rural Sustainability Perspective: Evidence from Jiangsu Province. Buildings 2024, 14, 1302. [Google Scholar] [CrossRef] [Scilit]
- Liu, B.; Wang, D.; Mao, G.; Yang, A.; Jiao, Y.; Zhang, K. Spatial Evolution of Grassland Ecological Carrying Capacity and Low-Carbon Development Pathways for Animal Husbandry in Inner Mongolia. Land 2025, 14, 1092. [Google Scholar] [CrossRef] [Scilit]
- Song, R.; Li, X. Urban Human Settlement Vulnerability Evolution and Mechanisms: The Case of Anhui Province, China. Land 2023, 12, 994. [Google Scholar] [CrossRef] [Scilit]
- Zhang, Y.; Tian, N.; Chen, A.; Qiu, J. Identification of a wetland ecological network for urban heat island effect mitigation in Changchun, China. Ecol. Indic. 2023, 150, 110248. [Google Scholar] [CrossRef] [Scilit]
- Iqbal, A.; Soni, L.; Qazi, A.W.; Nazir, H. Utilizing Remote Sensing for Sponge City Development: Enhancing Flood Management and Urban Resilience in Karachi. Remote Sens. 2025, 17, 1818. [Google Scholar] [CrossRef] [Scilit]
- Kissiedu, N.E.; Asibey, M.O.; Asare, O.A.; Asare, E.T.-M. Wetland transformation and the implications for ecological resilience in peri-urban Ghana. Land Use Policy 2025, 157, 107671. [Google Scholar] [CrossRef] [Scilit]
- Wu, C.; Chen, W. Indicator system construction and health assessment of wetland ecosystem—Taking Hongze Lake Wetland, China as an example. Ecol. Indic. 2020, 112, 106164. [Google Scholar] [CrossRef] [Scilit]
- Cheng, Q.; Chen, R.; Xu, W.; Wang, M. Characteristics of Spatial and Temporal Evolution of Coastal Wetland Landscape Patterns and Prediction Analysis—A Case Study of Panjin Wetland, China. Land 2025, 14, 118. [Google Scholar] [CrossRef] [Scilit]
- McNabb, T.; Charters, F.J.; Challies, E.; Dionisio, R. Unlocking urban blue-green infrastructure: An interdisciplinary literature review analysing co-benefits and synergies between bio-physical and socio-cultural outcomes. Blue-Green Syst. 2024, 6, 217. [Google Scholar] [CrossRef] [Scilit]
- Chen, W.; Gu, T.; Xiang, J.; Luo, T.; Zeng, J.; Yuan, Y. Ecological restoration zoning of territorial space in China: An ecosystem health perspective. J. Environ. Manag. 2024, 364, 121371. [Google Scholar] [CrossRef] [Scilit] [PubMed]
- Alves, A.; Vojinovic, Z.; Kapelan, Z.; Sanchez, A.; Gersonius, B. Exploring trade-offs among the multiple benefits of green-blue-grey infrastructure for urban flood mitigation. Sci. Total Environ. 2020, 703, 134980. [Google Scholar] [CrossRef] [Scilit] [PubMed]
- Peng, X.; Wen, S. The Economic Performance of Urban Sponge Parks Uncovered by an Integrated Evaluation Approach. Land 2025, 14, 1099. [Google Scholar] [CrossRef] [Scilit]
- Jiang, W.; Wang, X.; Li, Z. The sustainable development process and future research trends of international wetland cities. J. Nat. Resour. 2024, 39, 6. [Google Scholar] [CrossRef] [Scilit]
- Dushkova, D.; Taherkhani, M.; Konstantinova, A.; Vasenev, V.I.; Dovletyarova, E.A. Understanding Factors Affecting the Use of Urban Parks Through the Lens of Ecosystem Services and Blue–Green Infrastructure: The Case of Gorky Park, Moscow, Russia. Land 2025, 14, 237. [Google Scholar] [CrossRef] [Scilit]
- Wang, M.; Su, Y.; Wang, J. How to Improve Blue–Green–Gray Infrastructure to Optimize River Cooling Island Effect on Riparian Zone for Outdoor Activities in Summer. Land 2025, 14, 1330. [Google Scholar] [CrossRef] [Scilit]
- Song, S.; Zhang, X.; Wang, S.; Gong, Y. Ecological Management Zoning Identification by Coupling Blue-Green and Gray Infrastructure Networks: A Case Study of Guizhou Province, China. Land 2025, 14, 204. [Google Scholar] [CrossRef] [Scilit]
- Han, R.; Feng, C.; Xu, N.; Guo, L. Spatial Heterogeneous Relationship between Ecosystem Services and Human Disturbances: A Case Study in Chuandong, China. Sci. Total Environ. 2020, 721, 137818. [Google Scholar] [CrossRef] [Scilit]
- Shaker, R.; Altman, Y.; Deng, C.; Vaz, E.; Forsythe, K. Investigating Urban Heat Island through Spatial Analysis of New York City Streetscapes. J. Clean. Prod. 2019, 233, 972–992. [Google Scholar] [CrossRef] [Scilit]
- Li, M.; Yan, Y.; Ying, Z.; Zhou, L. Measuring Villagers’ Perceptions of Changes in the Landscape Values of Traditional Villages. ISPRS Int. J. Geo-Inf. 2024, 13, 60. [Google Scholar] [CrossRef] [Scilit]
- Wang, J.F.; Hu, Y. Environmental health risk detection with GeogDetector. Environ. Model. Softw. 2012, 33, 114–115. [Google Scholar] [CrossRef] [Scilit]
- Liu, J.; Xu, Q.; Yi, J.; Huang, X. Analysis of the heterogeneity of urban expansion landscape patterns and driving factors based on a combined Multi-Order Adjacency Index and Geodetector model. Ecol. Indic. 2022, 136, 108655. [Google Scholar] [CrossRef] [Scilit]
- Zhao, S.; Zhang, C.; Qi, J. The Key Factors Driving the Development of New Towns by Mother Cities and Regions: Evidence from China. ISPRS Int. J. Geo-Inf. 2021, 10, 223. [Google Scholar] [CrossRef] [Scilit]
- Wang, H.; Qin, F.; Xu, C.; Li, B.; Guo, L.; Wang, Z. Evaluating the suitability of urban development land with a Geodetector. Ecol. Indic. 2021, 123, 107339. [Google Scholar] [CrossRef] [Scilit]
- Ma, Y.; Zhang, P.; Zhao, K.; Zhou, Y.; Zhao, S. A Dynamic Performance and Differentiation Management Policy for Urban Construction Land Use Change in Gansu, China. Land 2022, 11, 942. [Google Scholar] [CrossRef] [Scilit]
- Li, Y.; Wang, G.; Chen, T.; Zhang, R.; Zhou, L.; Yan, L. Nature-Based Solutions in “Forest–Wetland” Spatial Planning Strategies to Promote Sustainable City Development in Tianjin, China. Land 2022, 11, 1227. [Google Scholar] [CrossRef] [Scilit]
- Wang, H.; Liu, P.; Shan, Y.; Zhang, J.; Xia, S. Evolutionary Characteristics, Improvement Strategies and Driving Mechanisms of the Human Settlement Environment in Chinese Traditional Villages Based on Historical Hydrological Resilience Assessment. Buildings 2025, 15, 4264. [Google Scholar] [CrossRef] [Scilit]
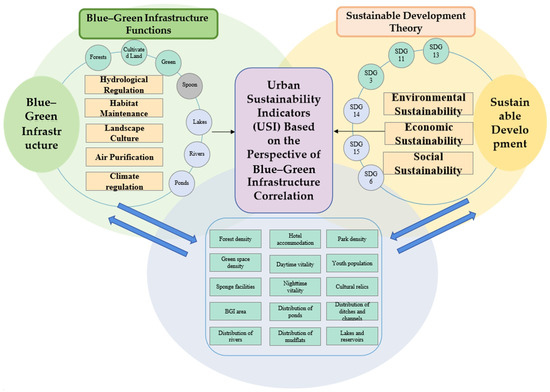
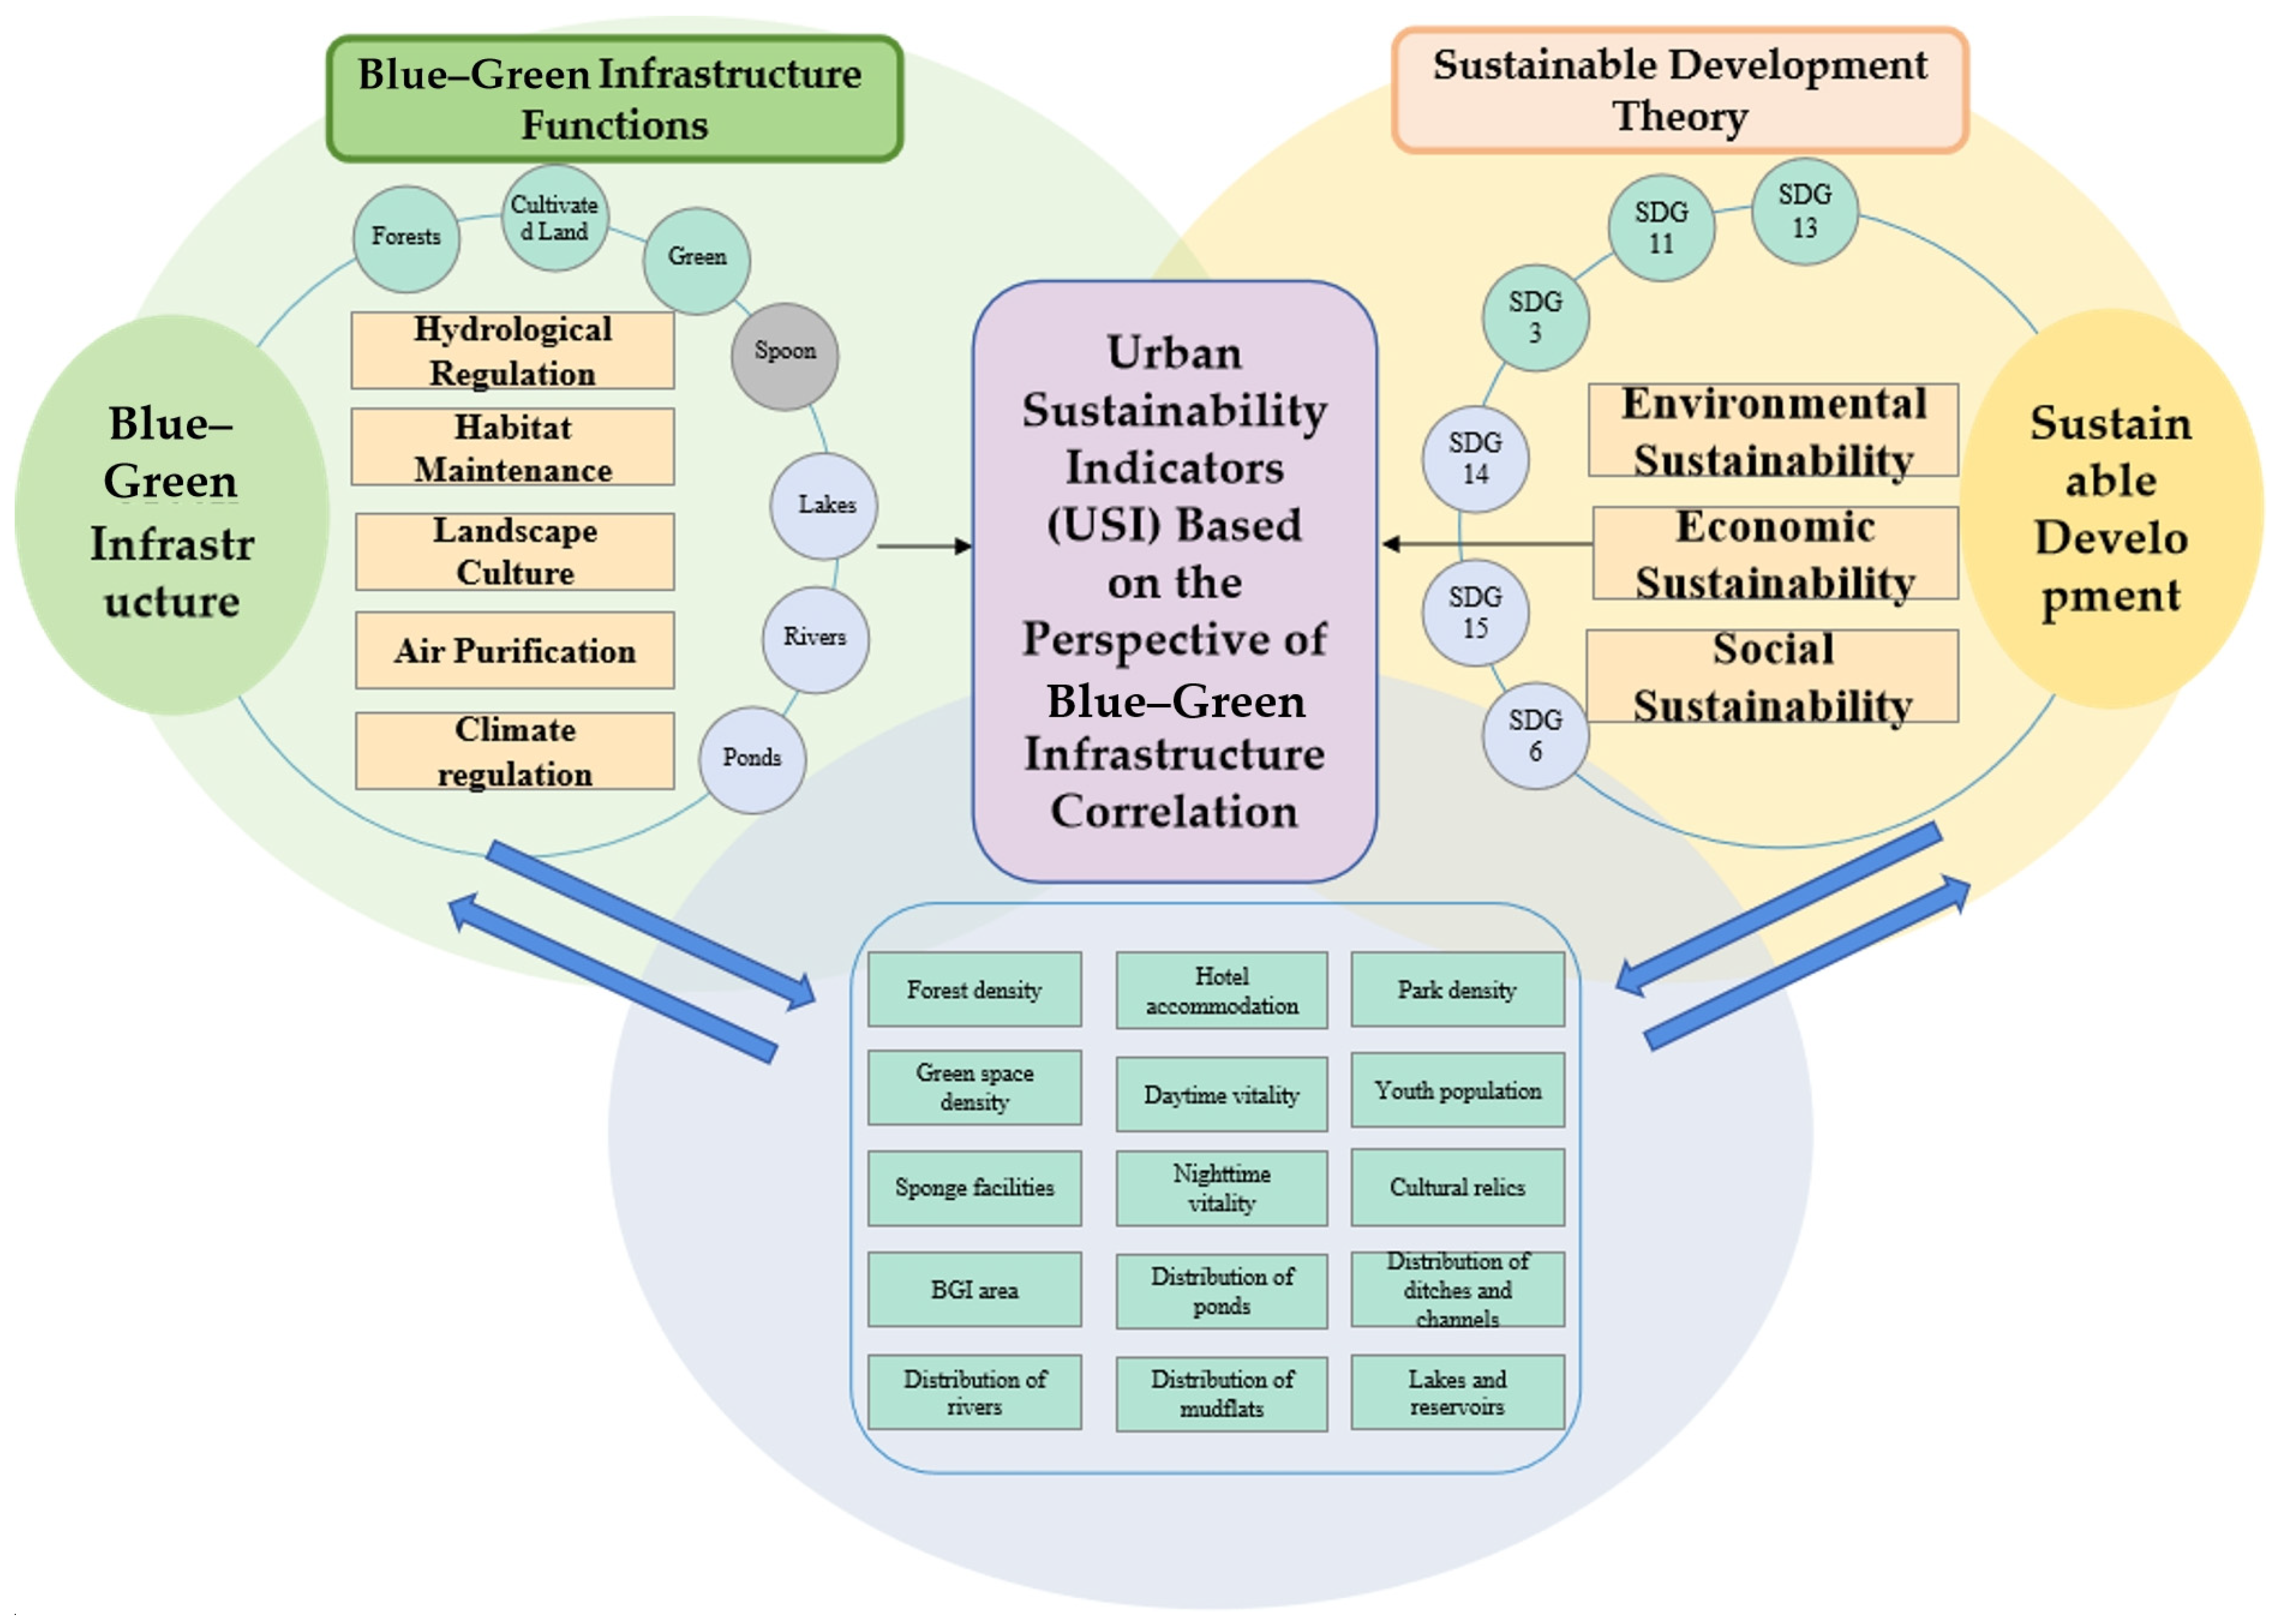
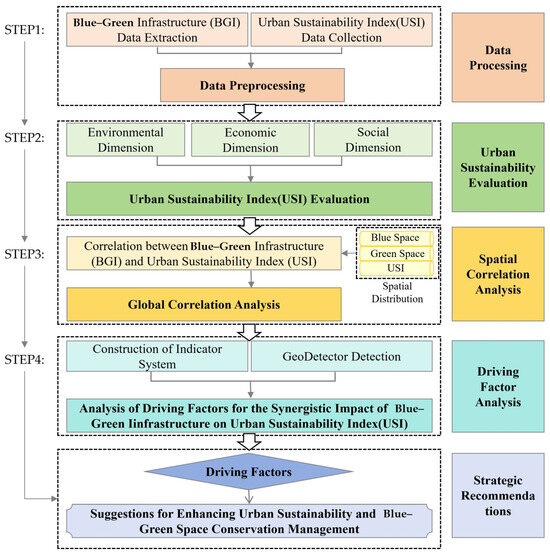
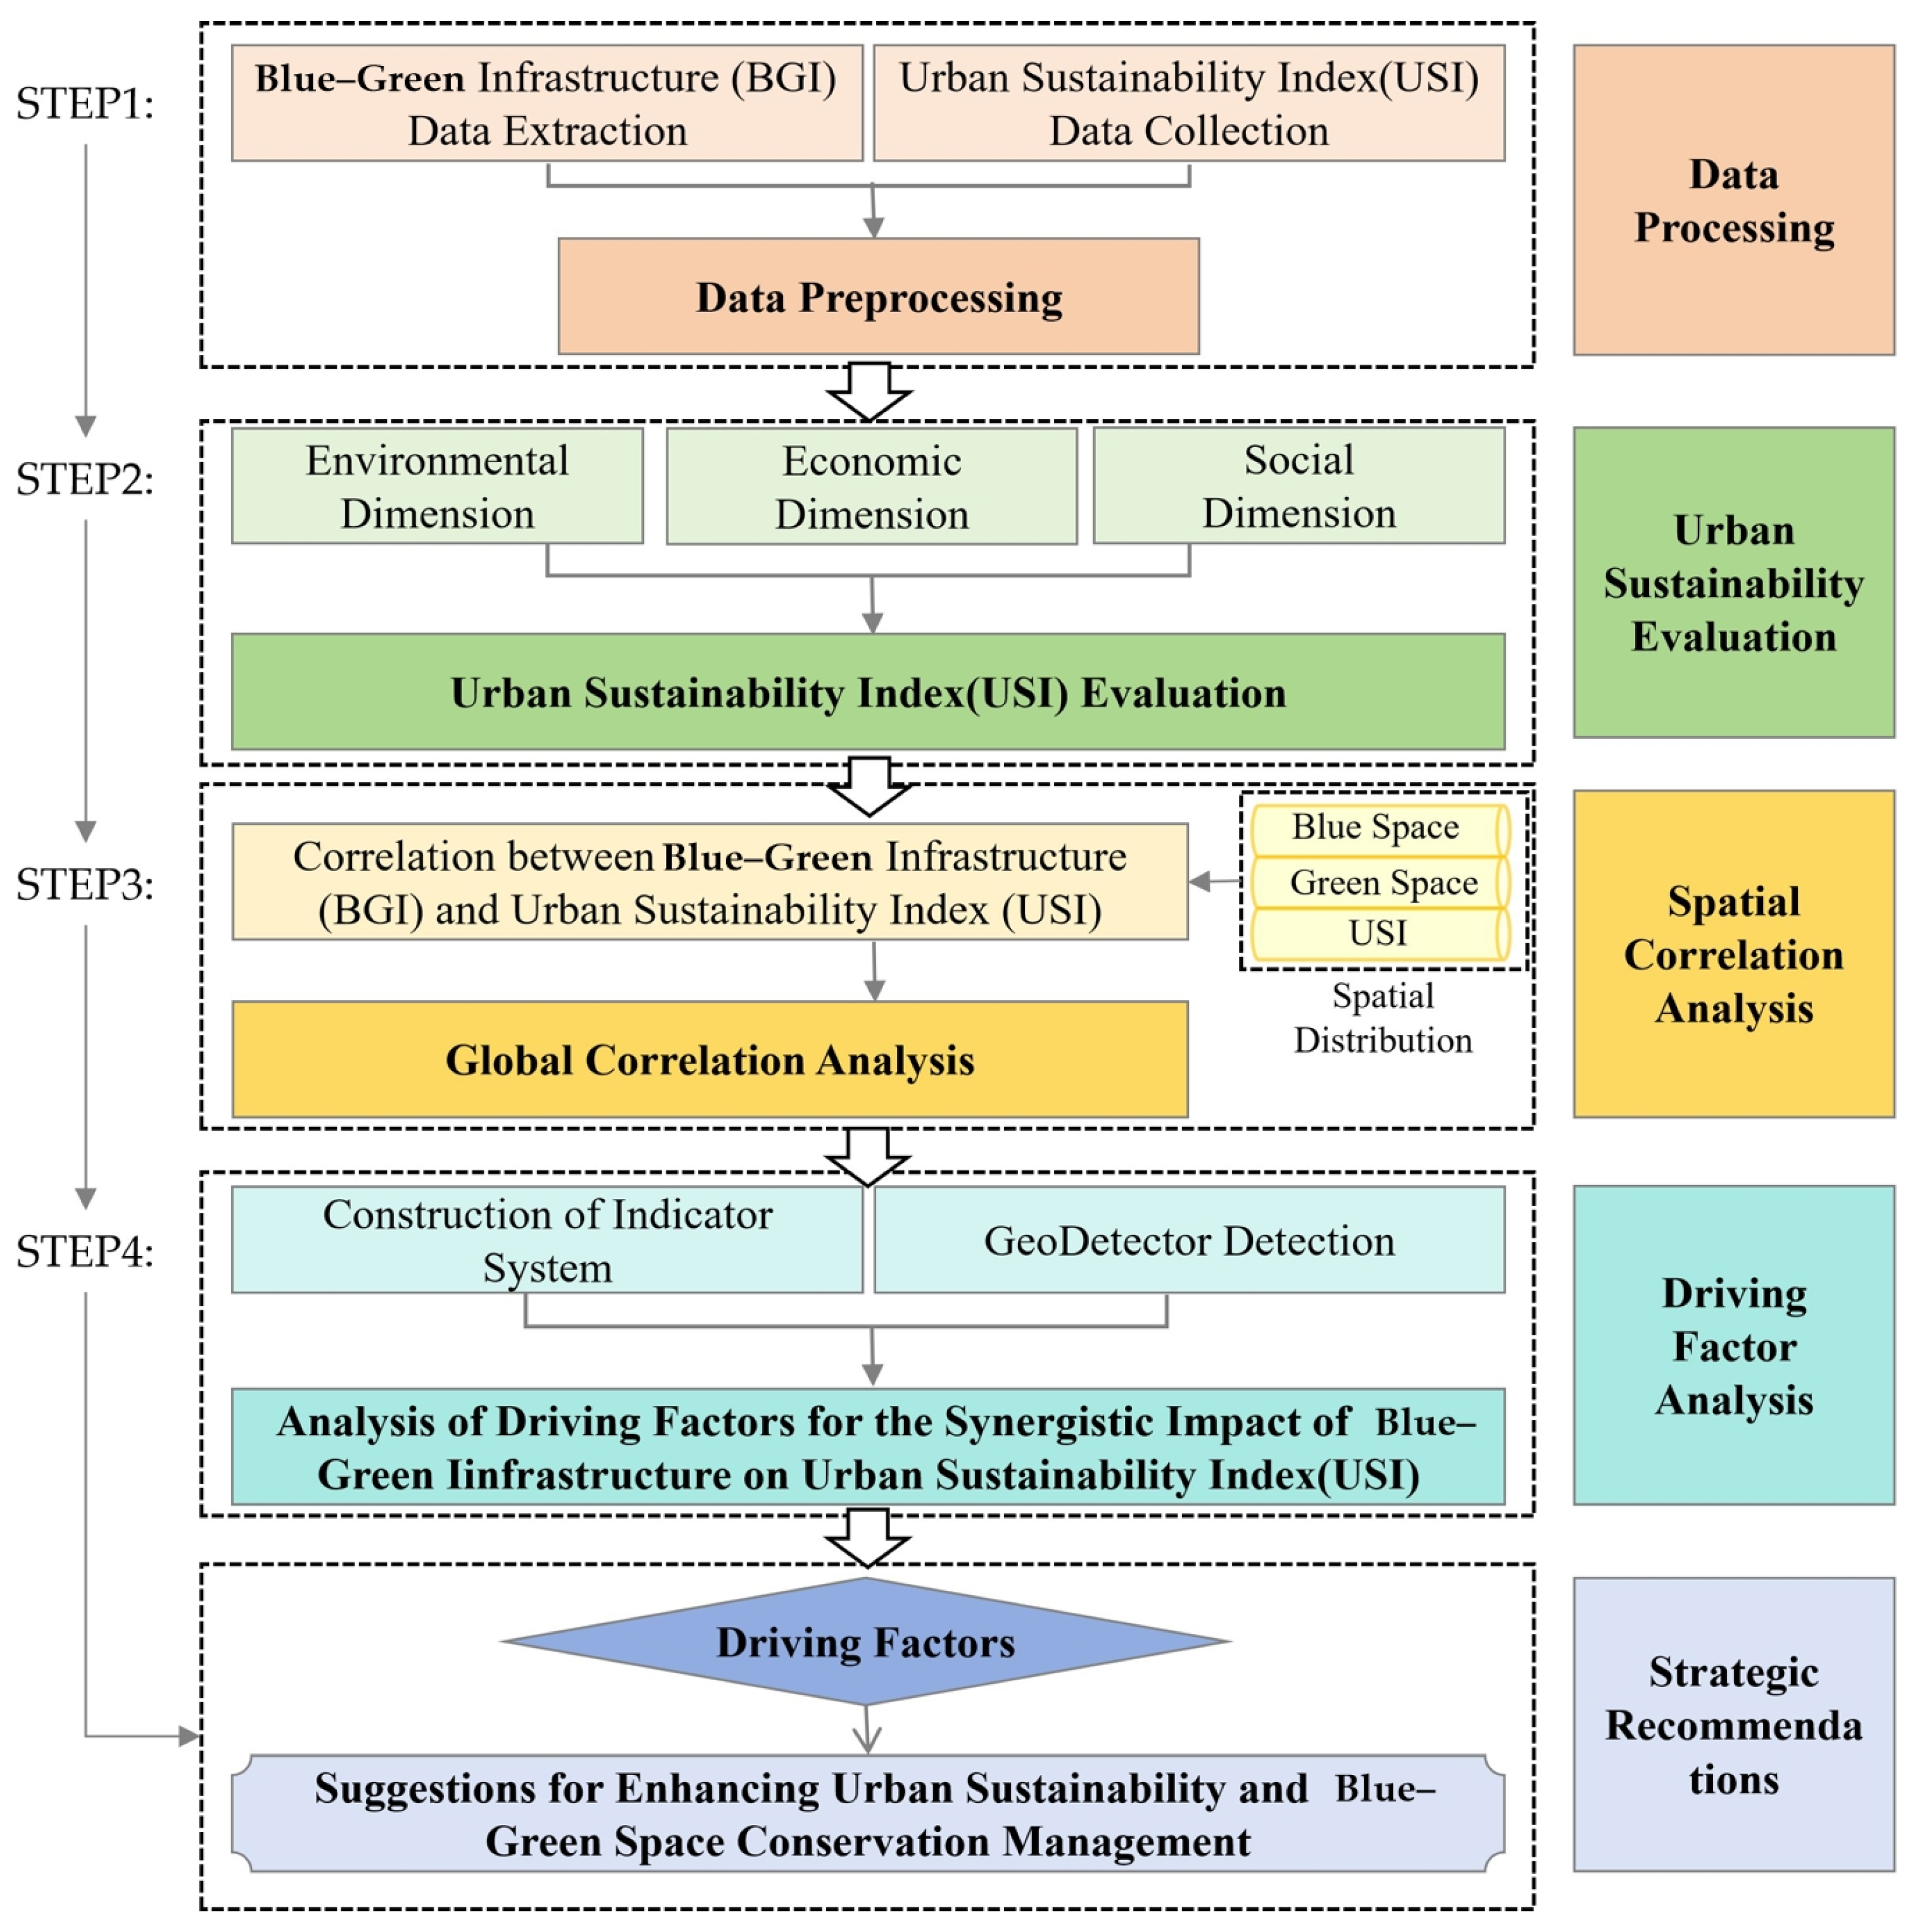
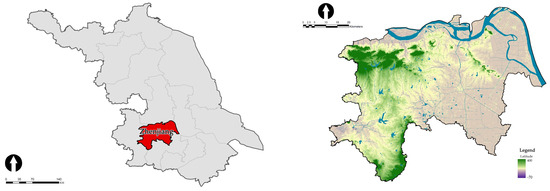
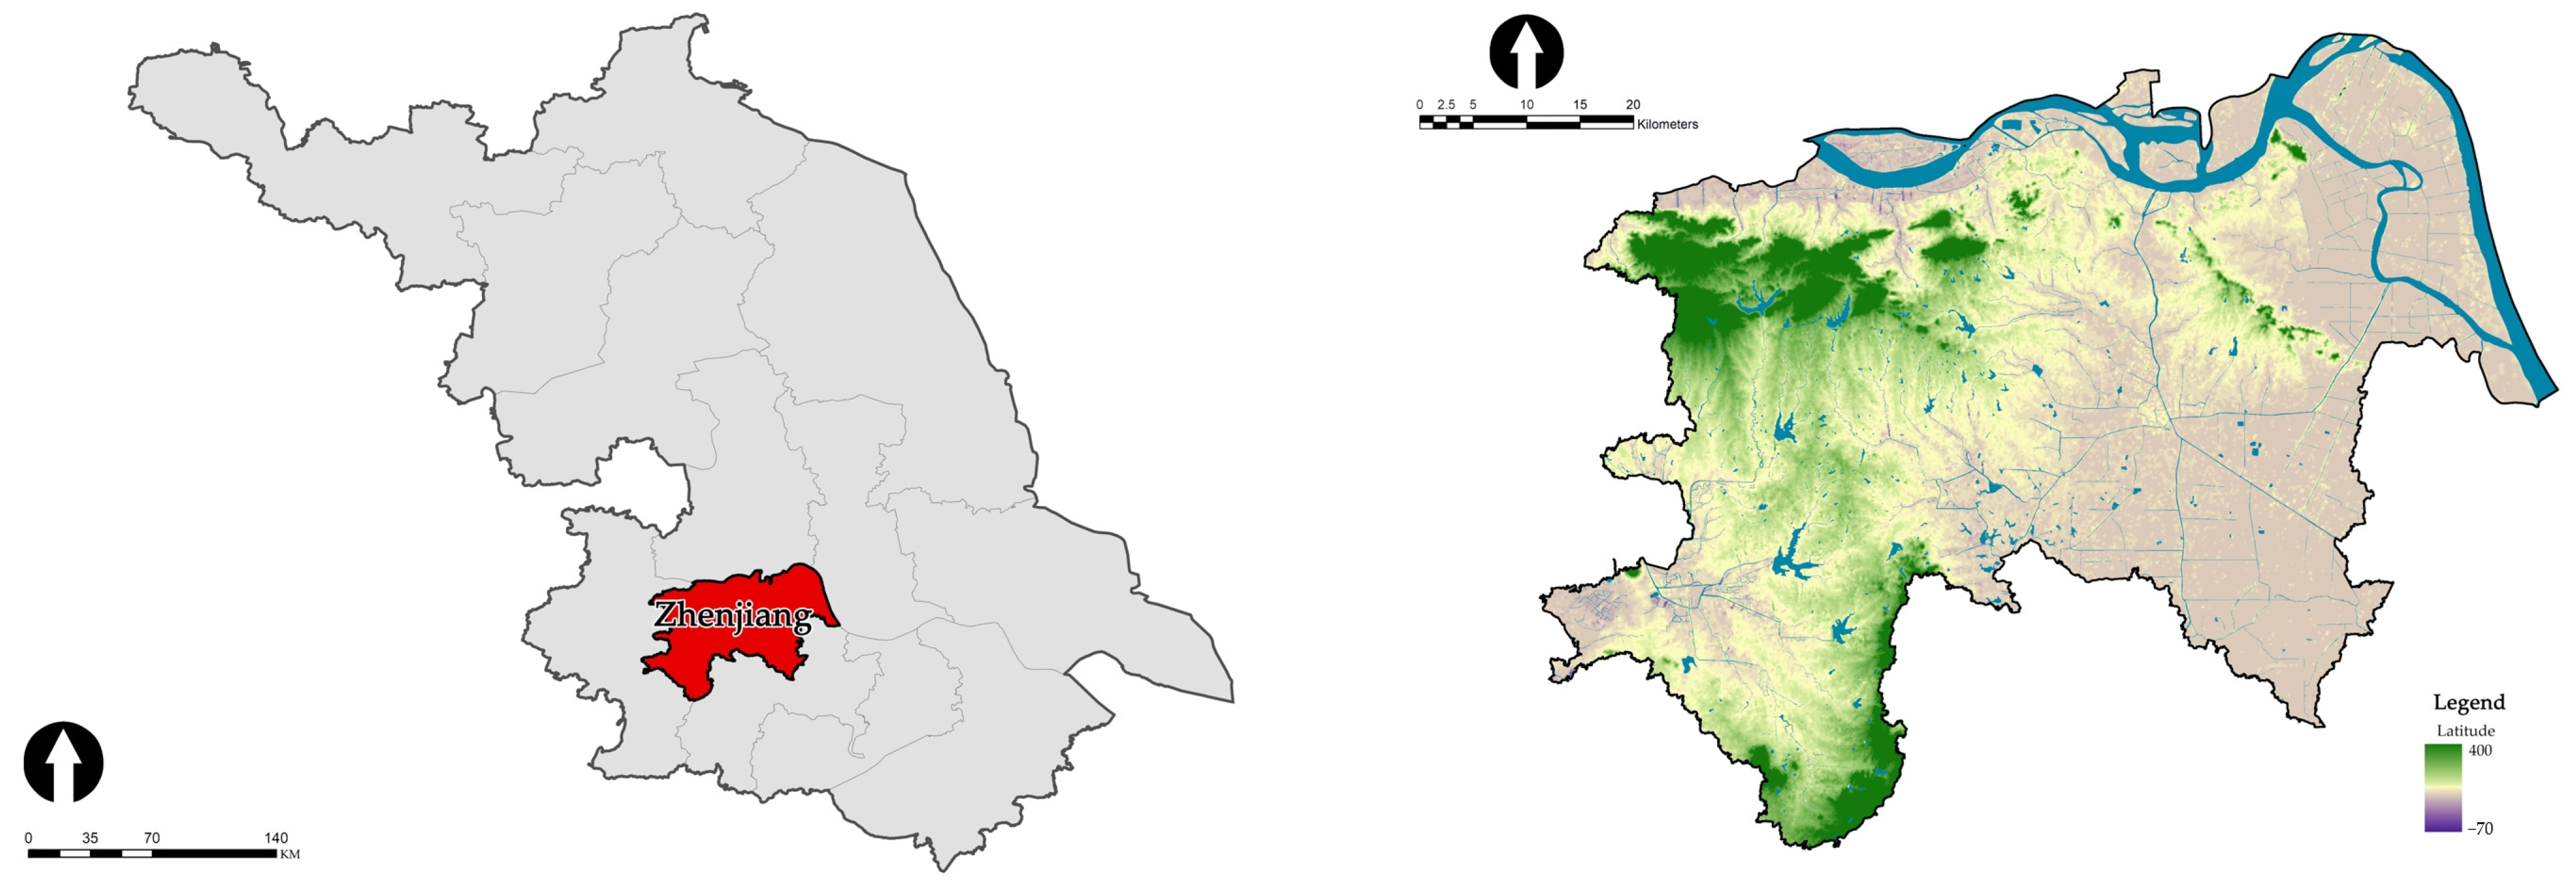
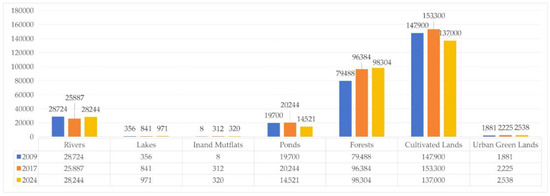
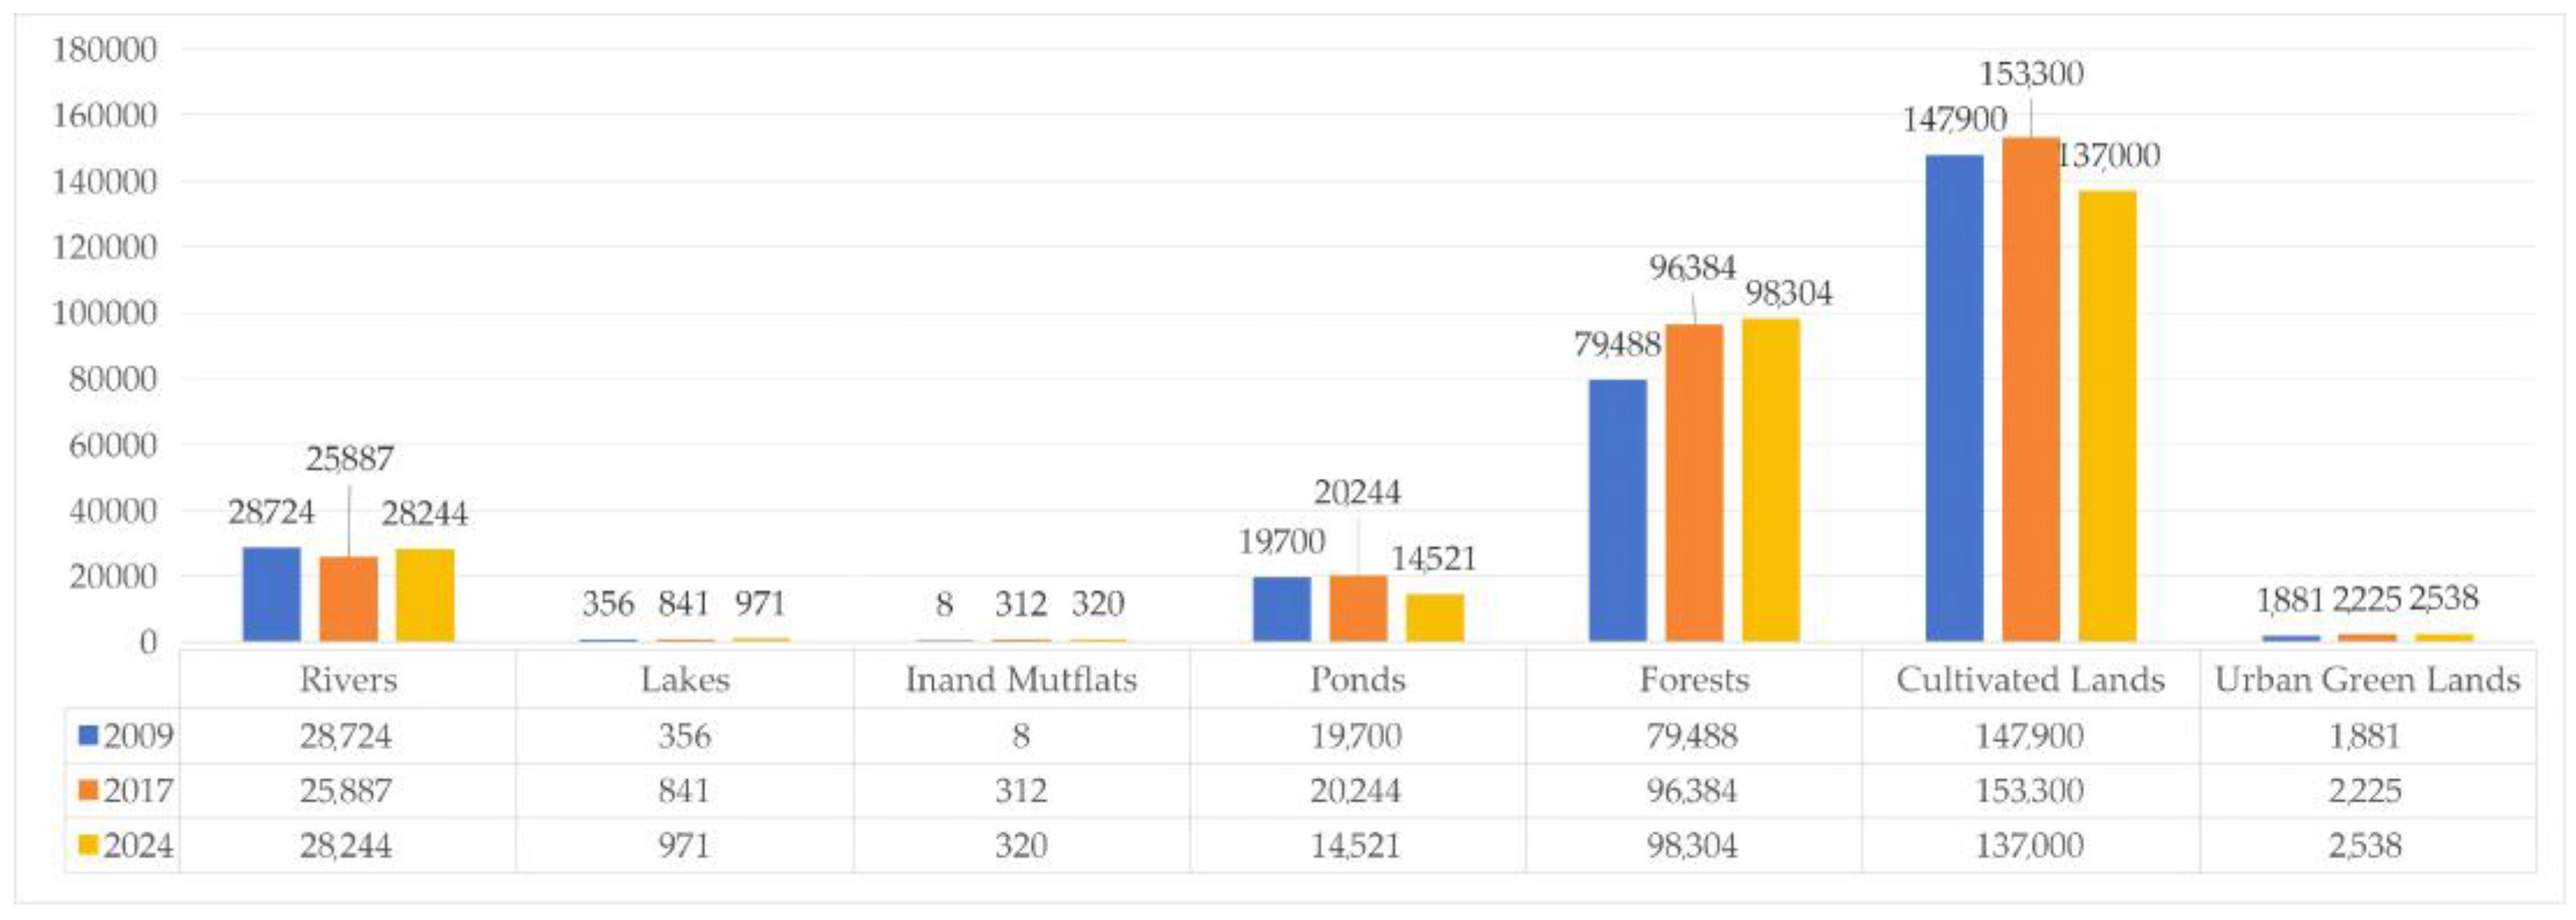
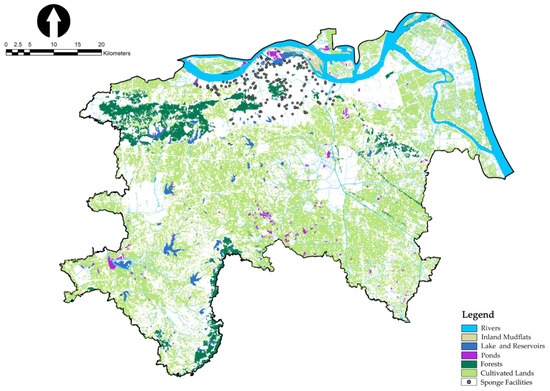
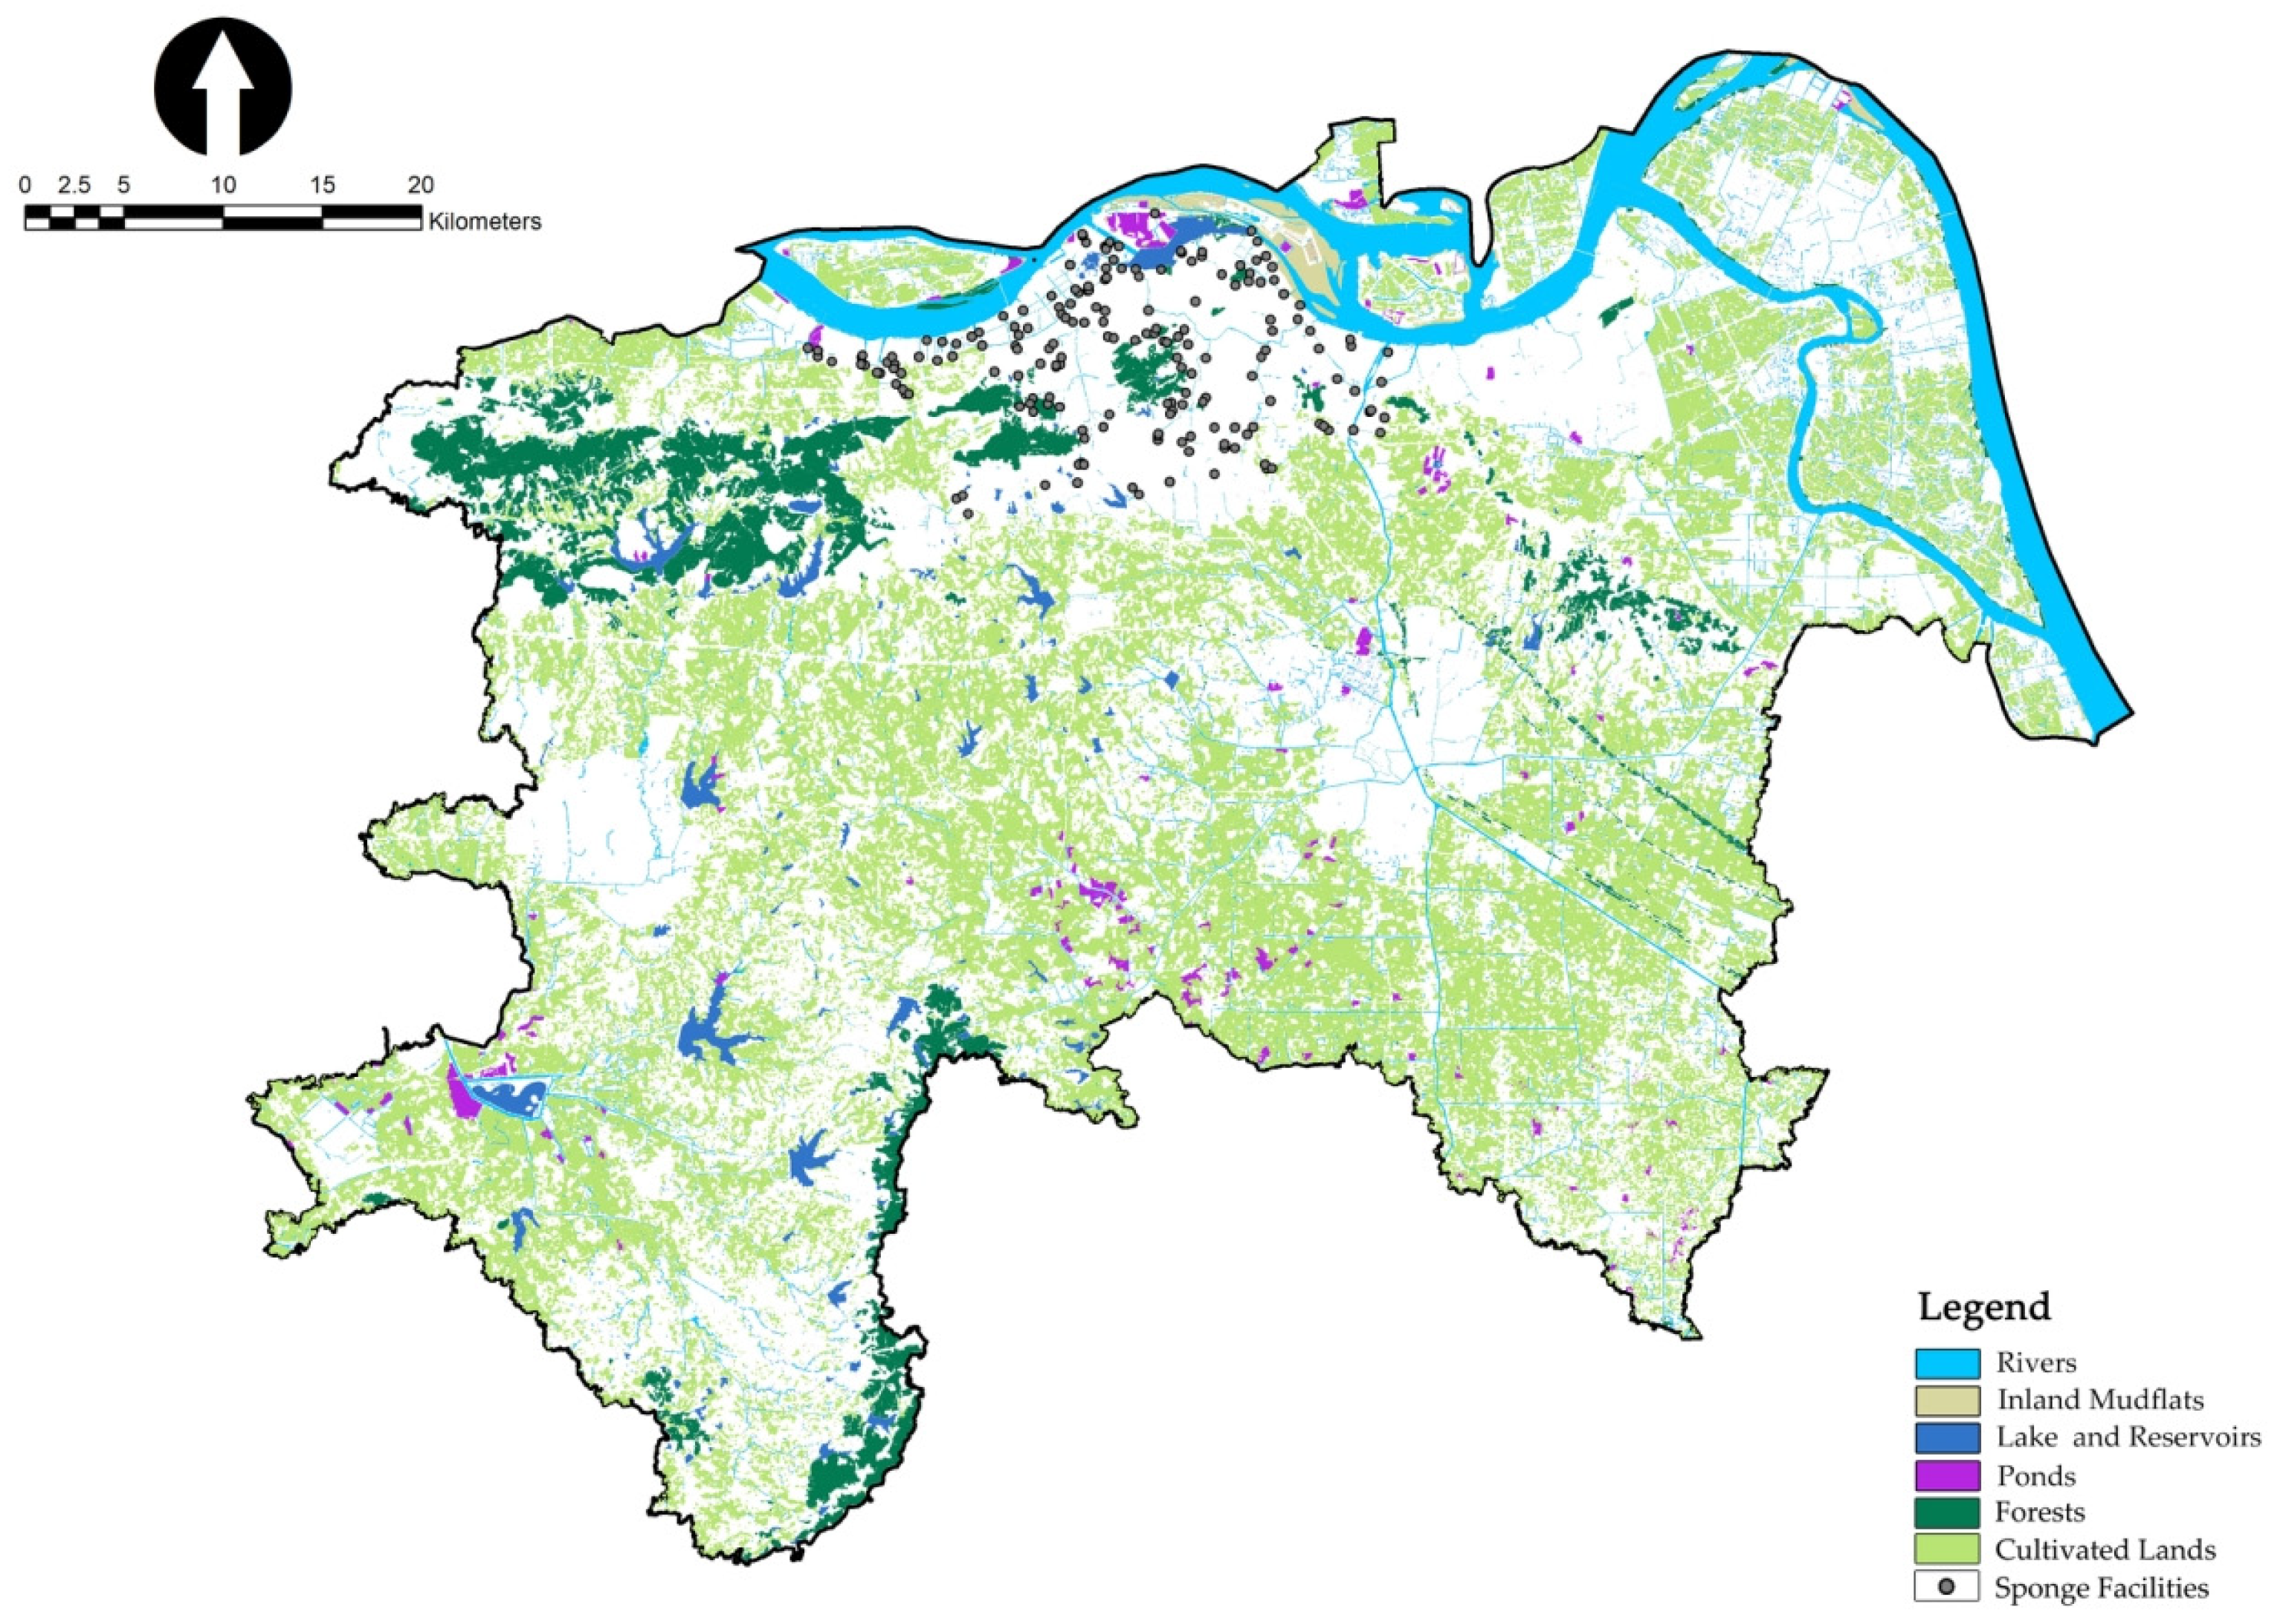
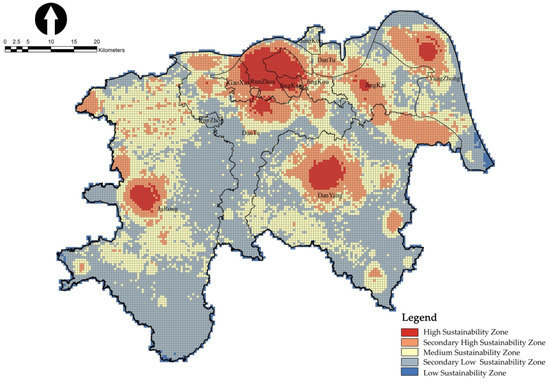
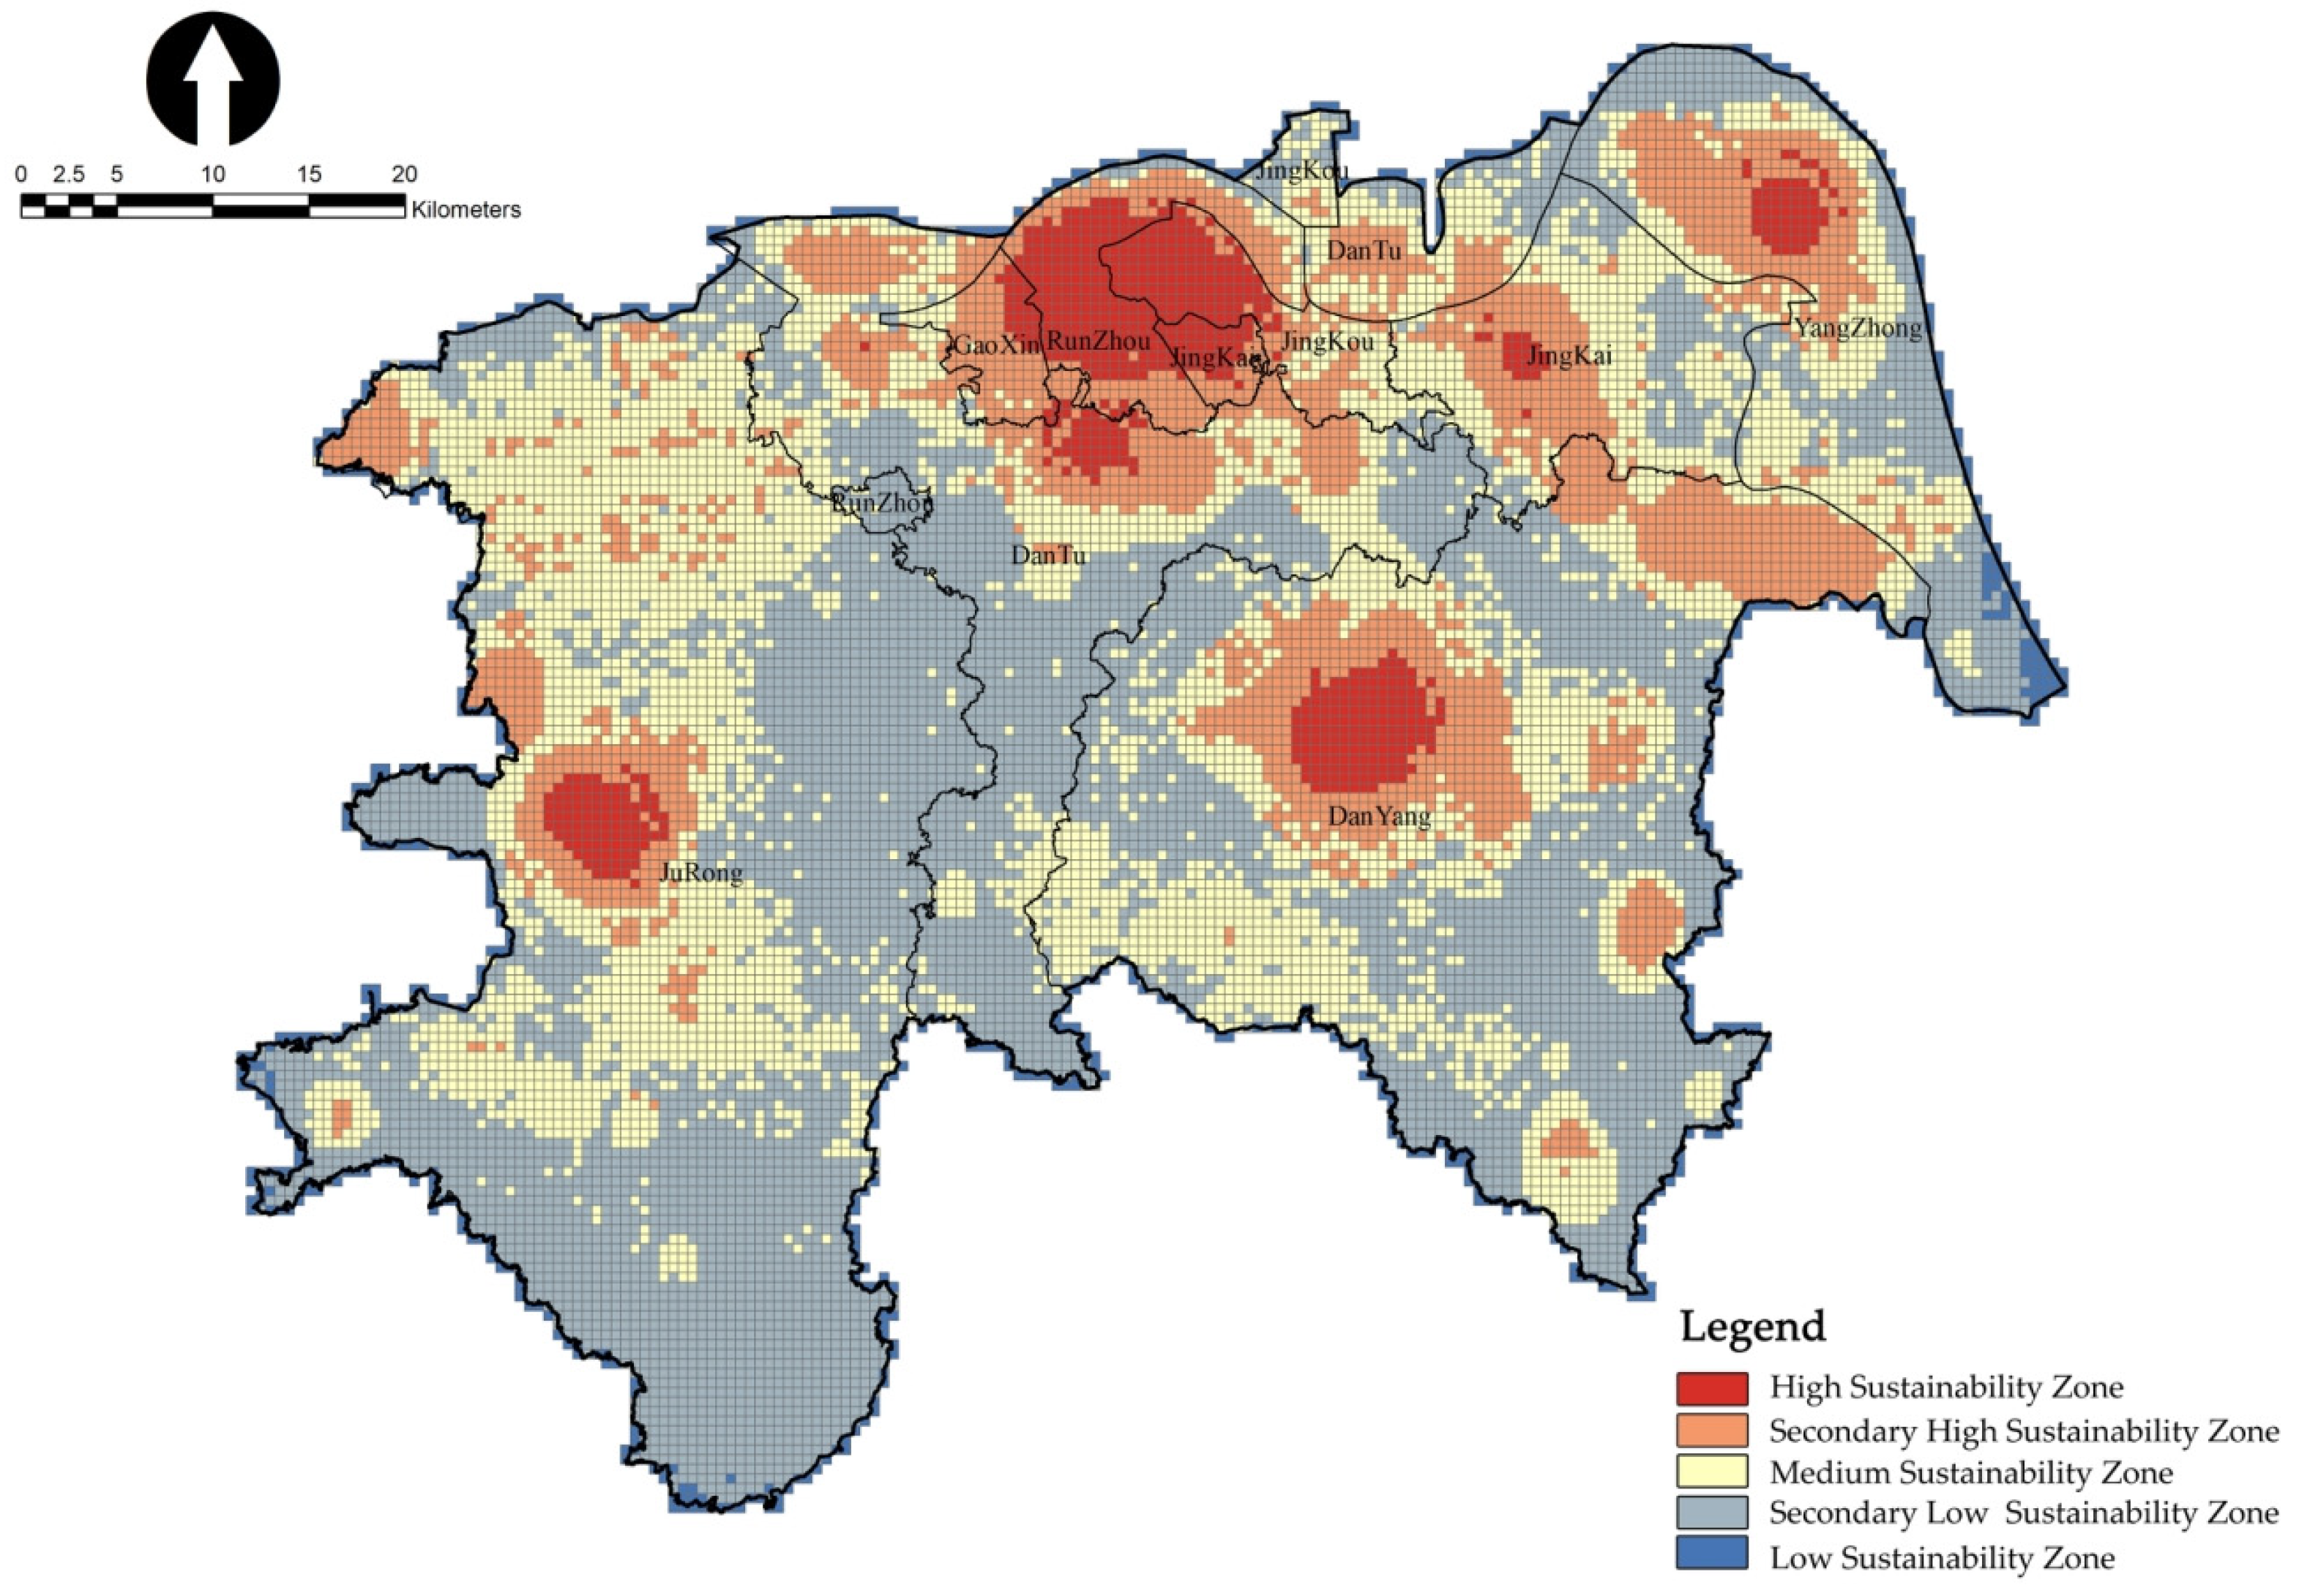
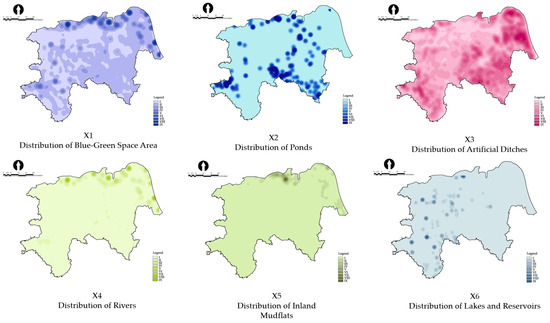
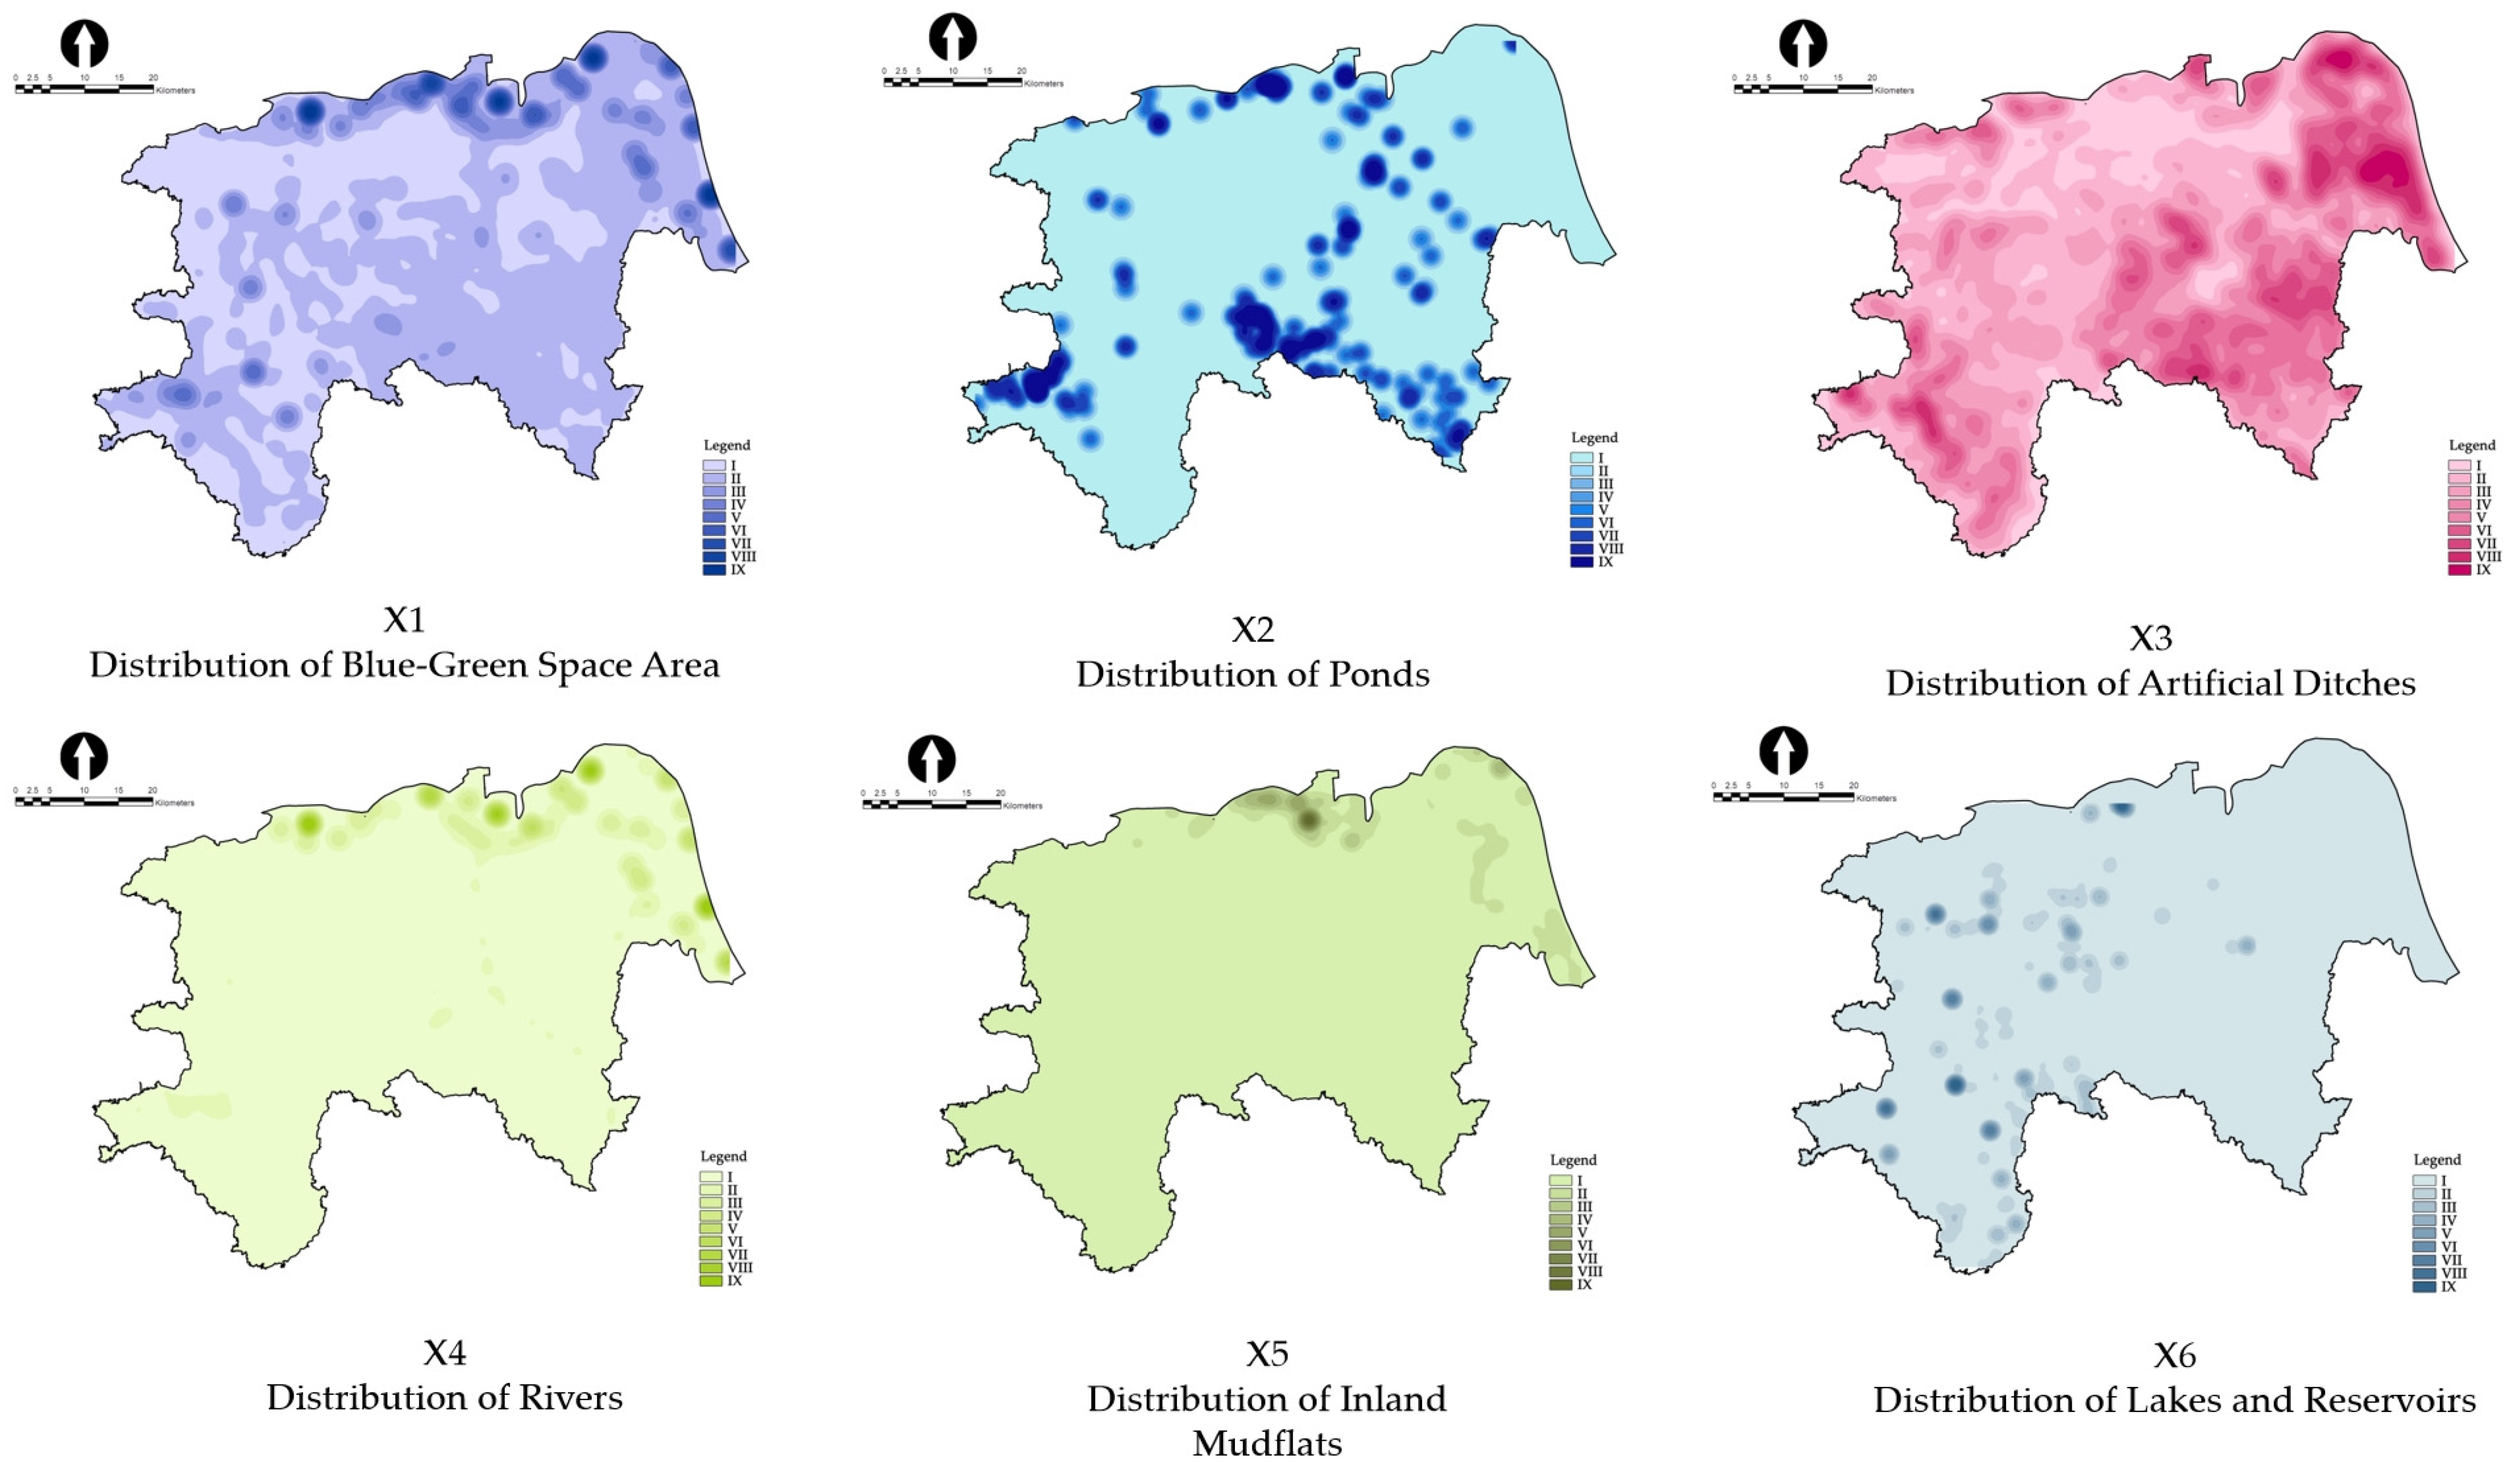
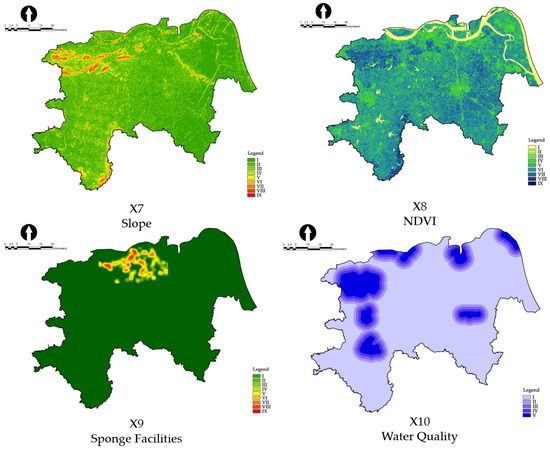
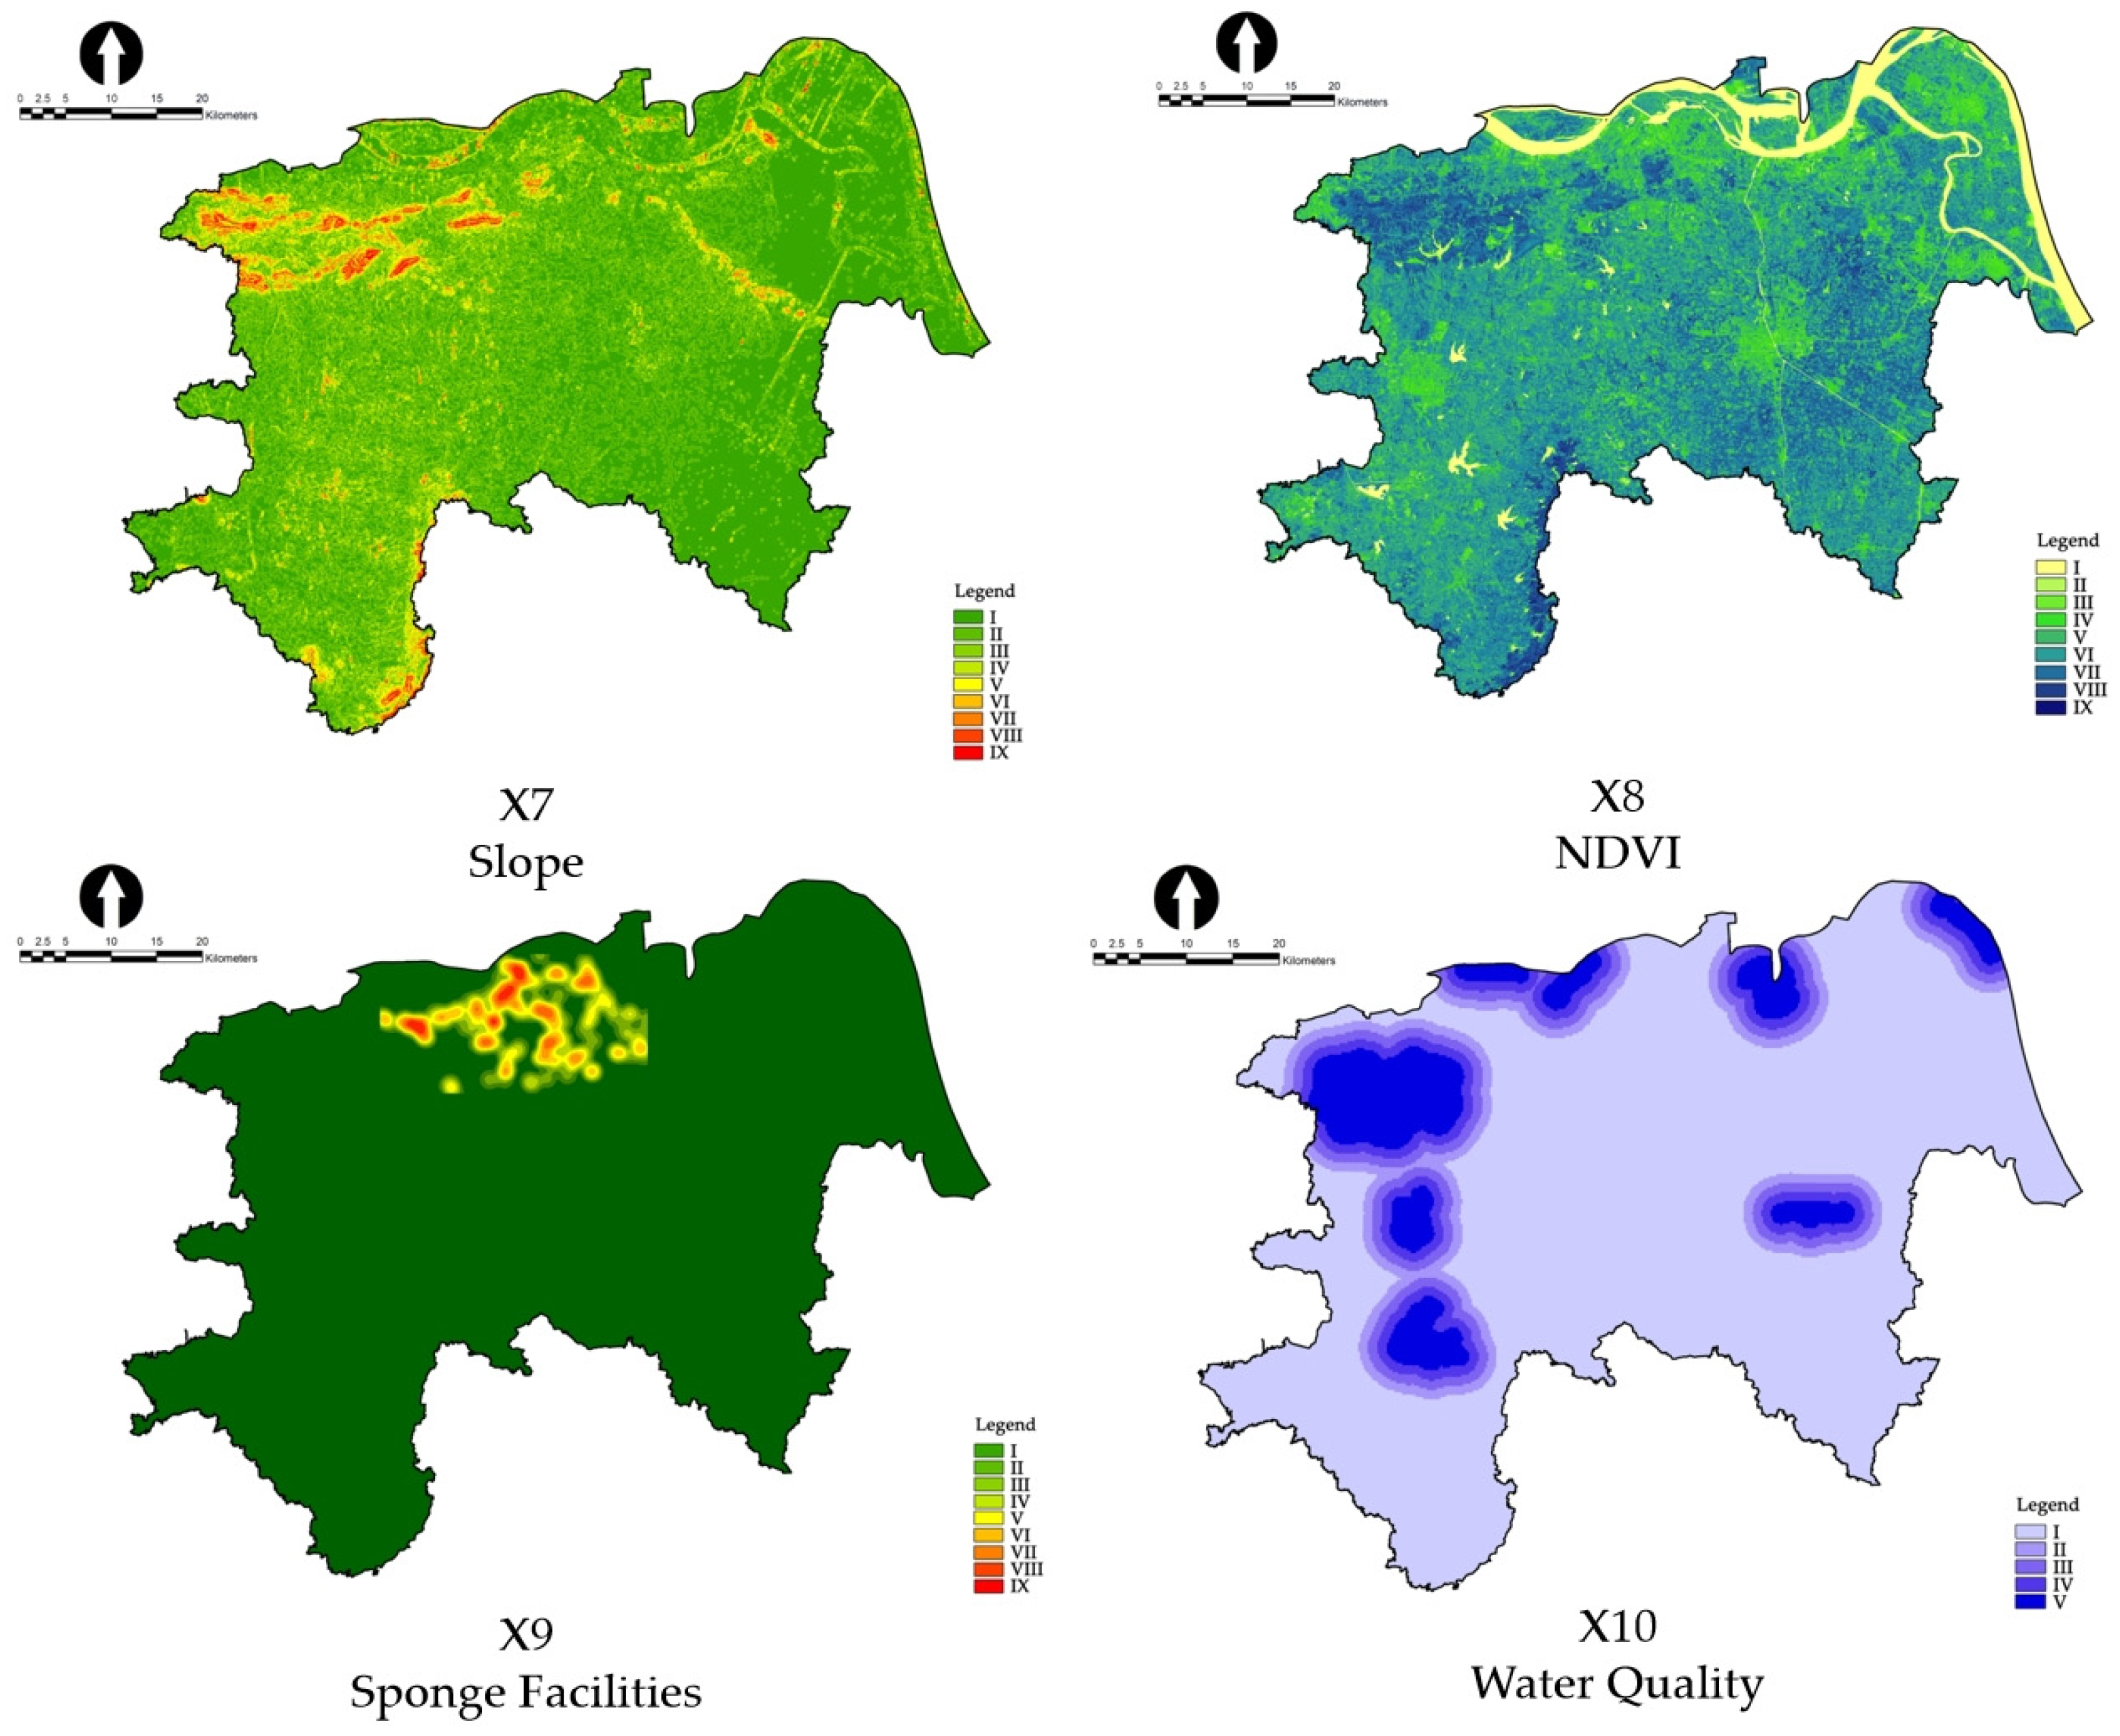
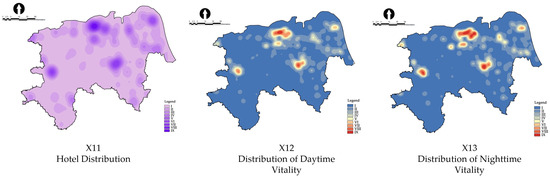
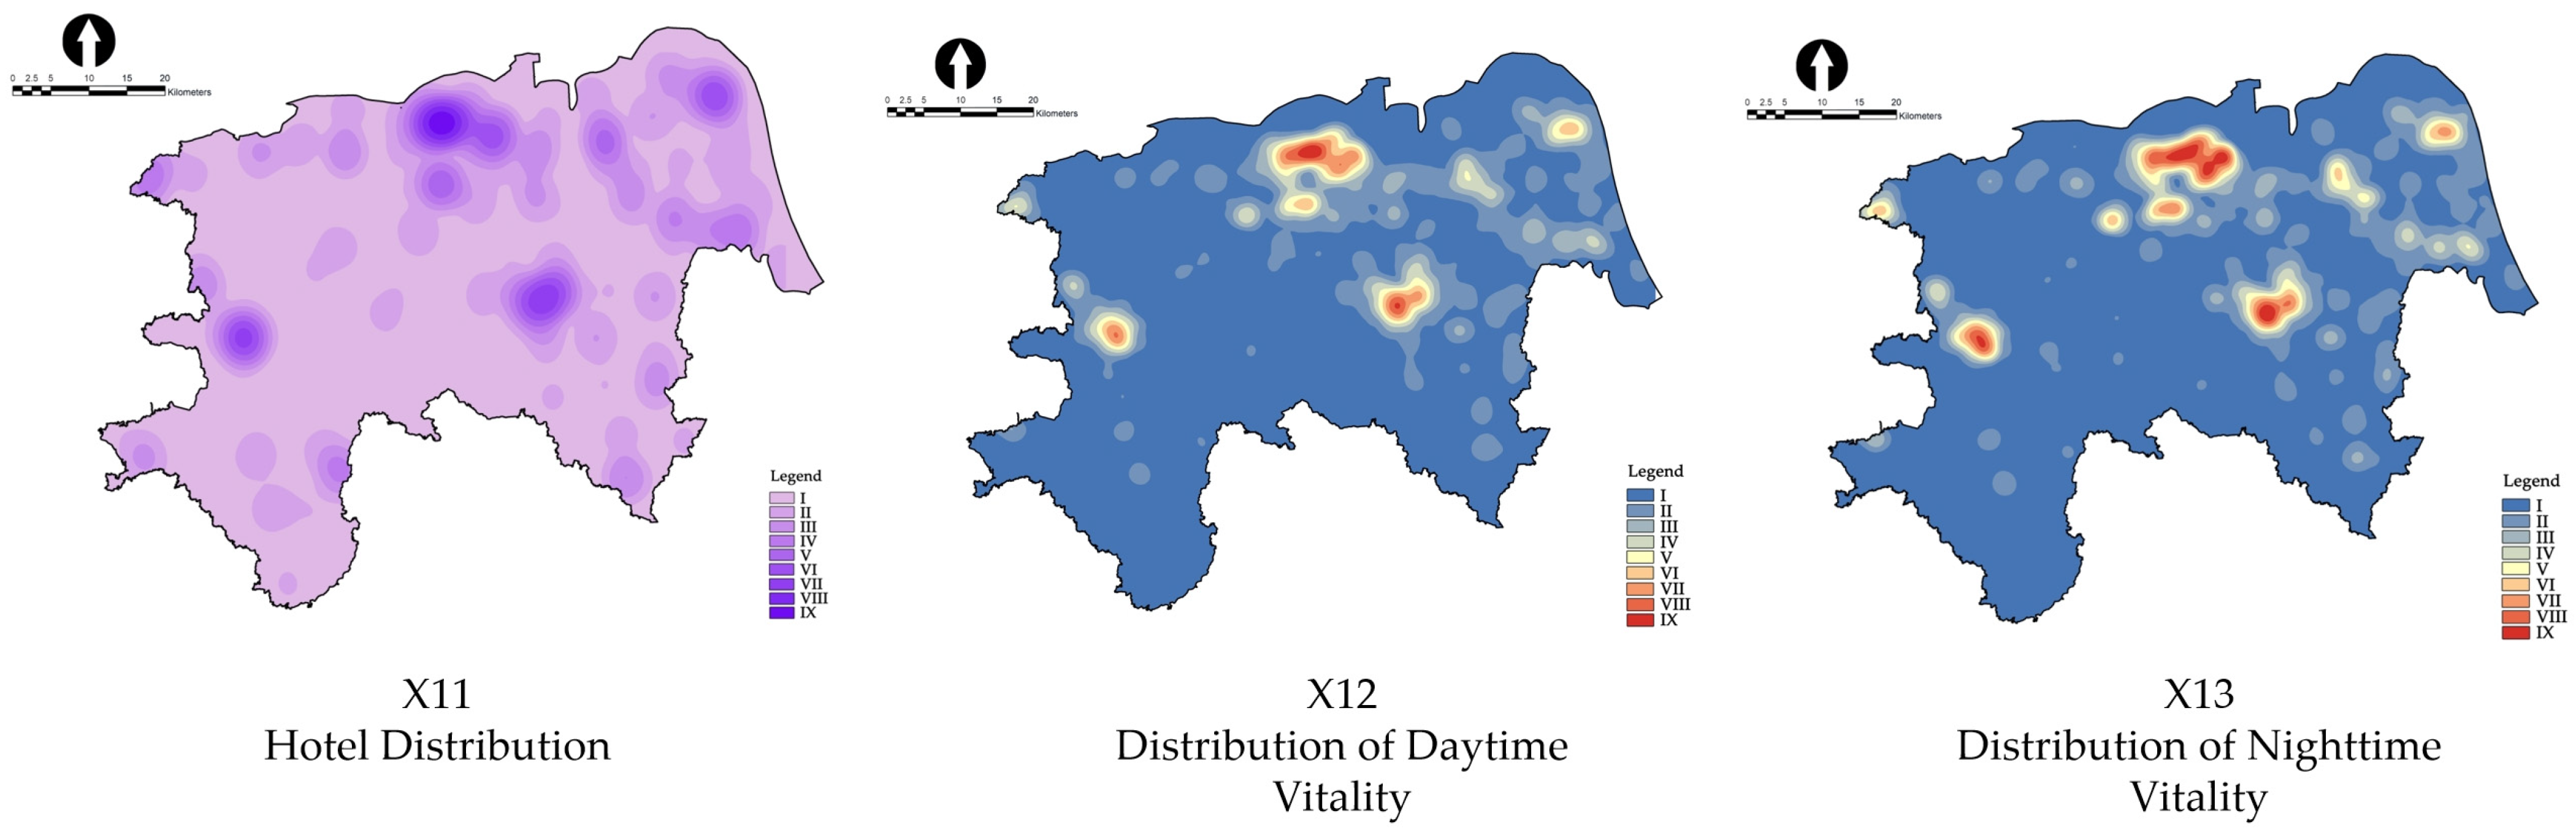
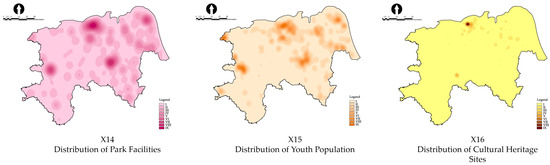
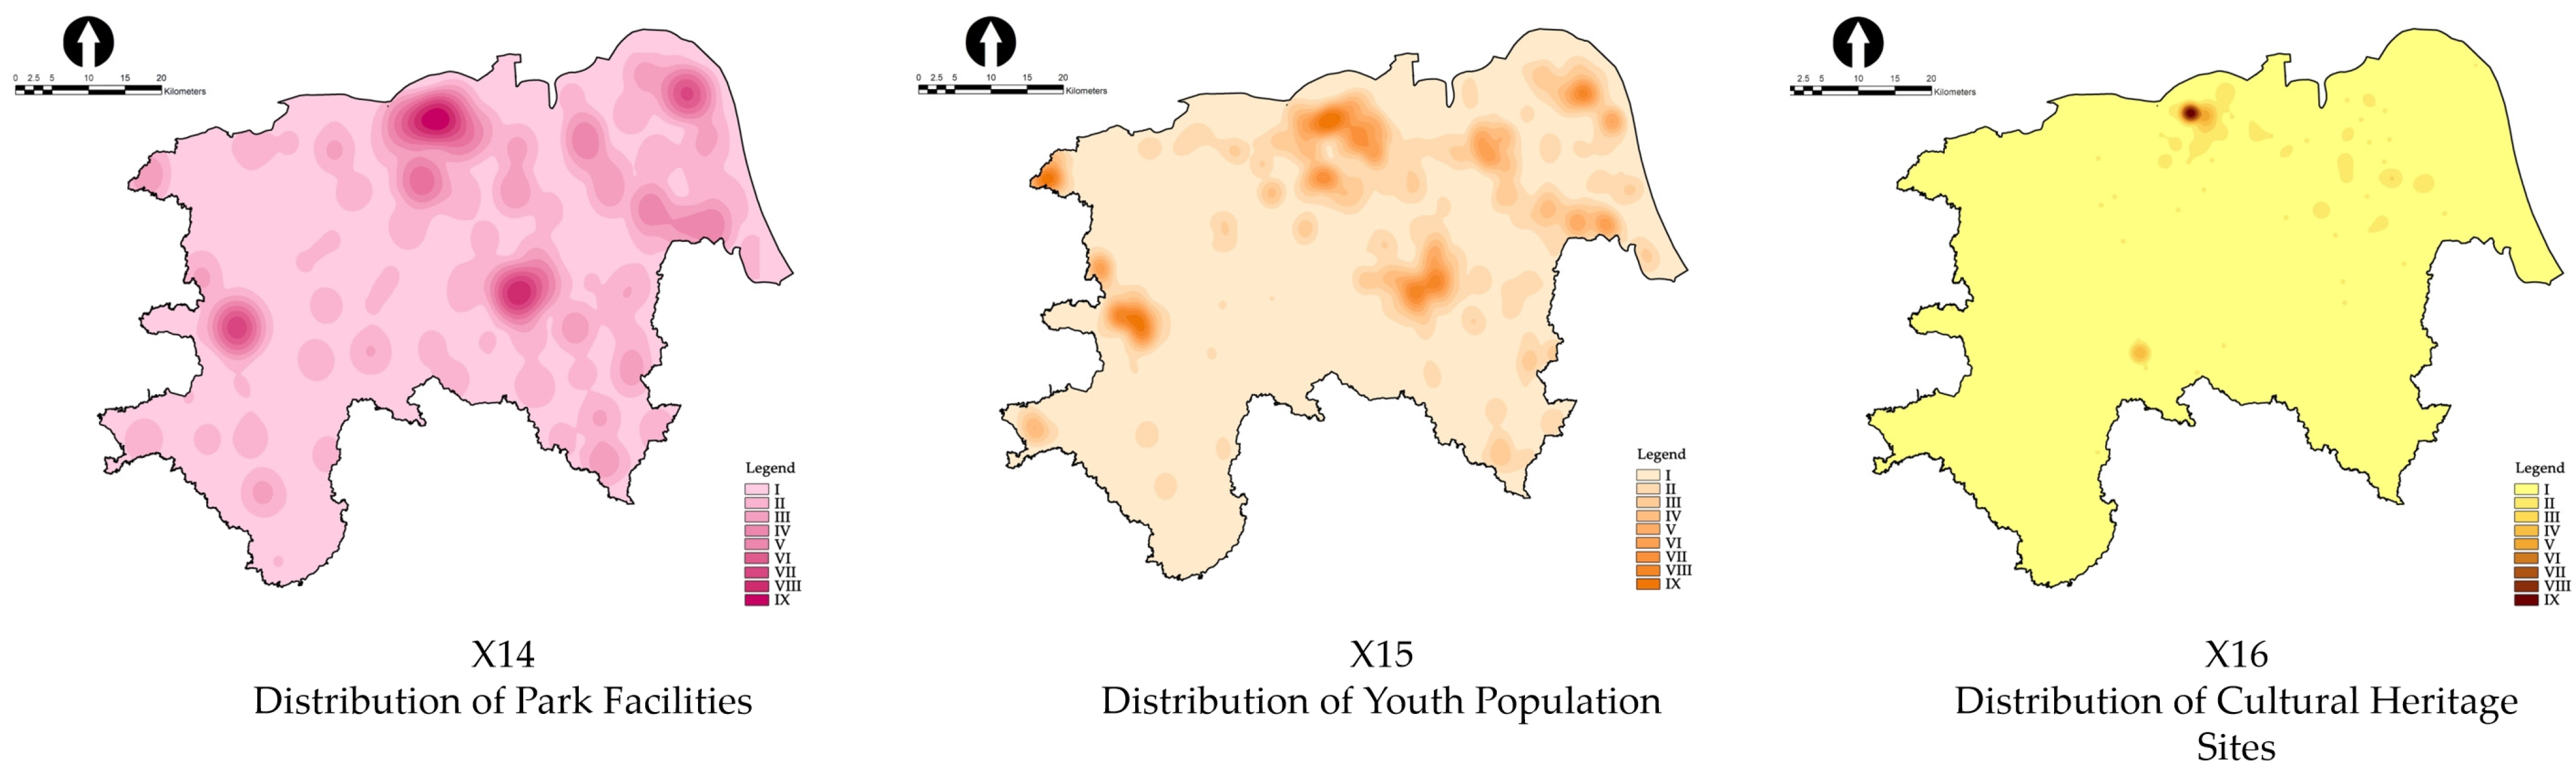
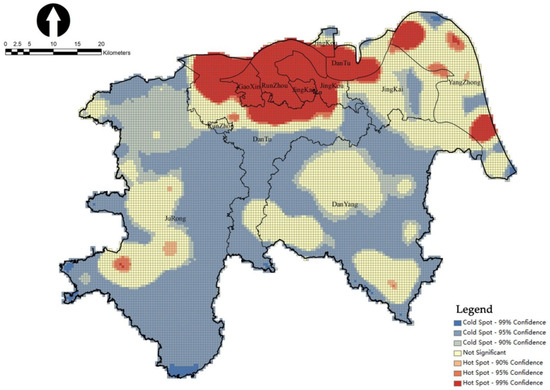
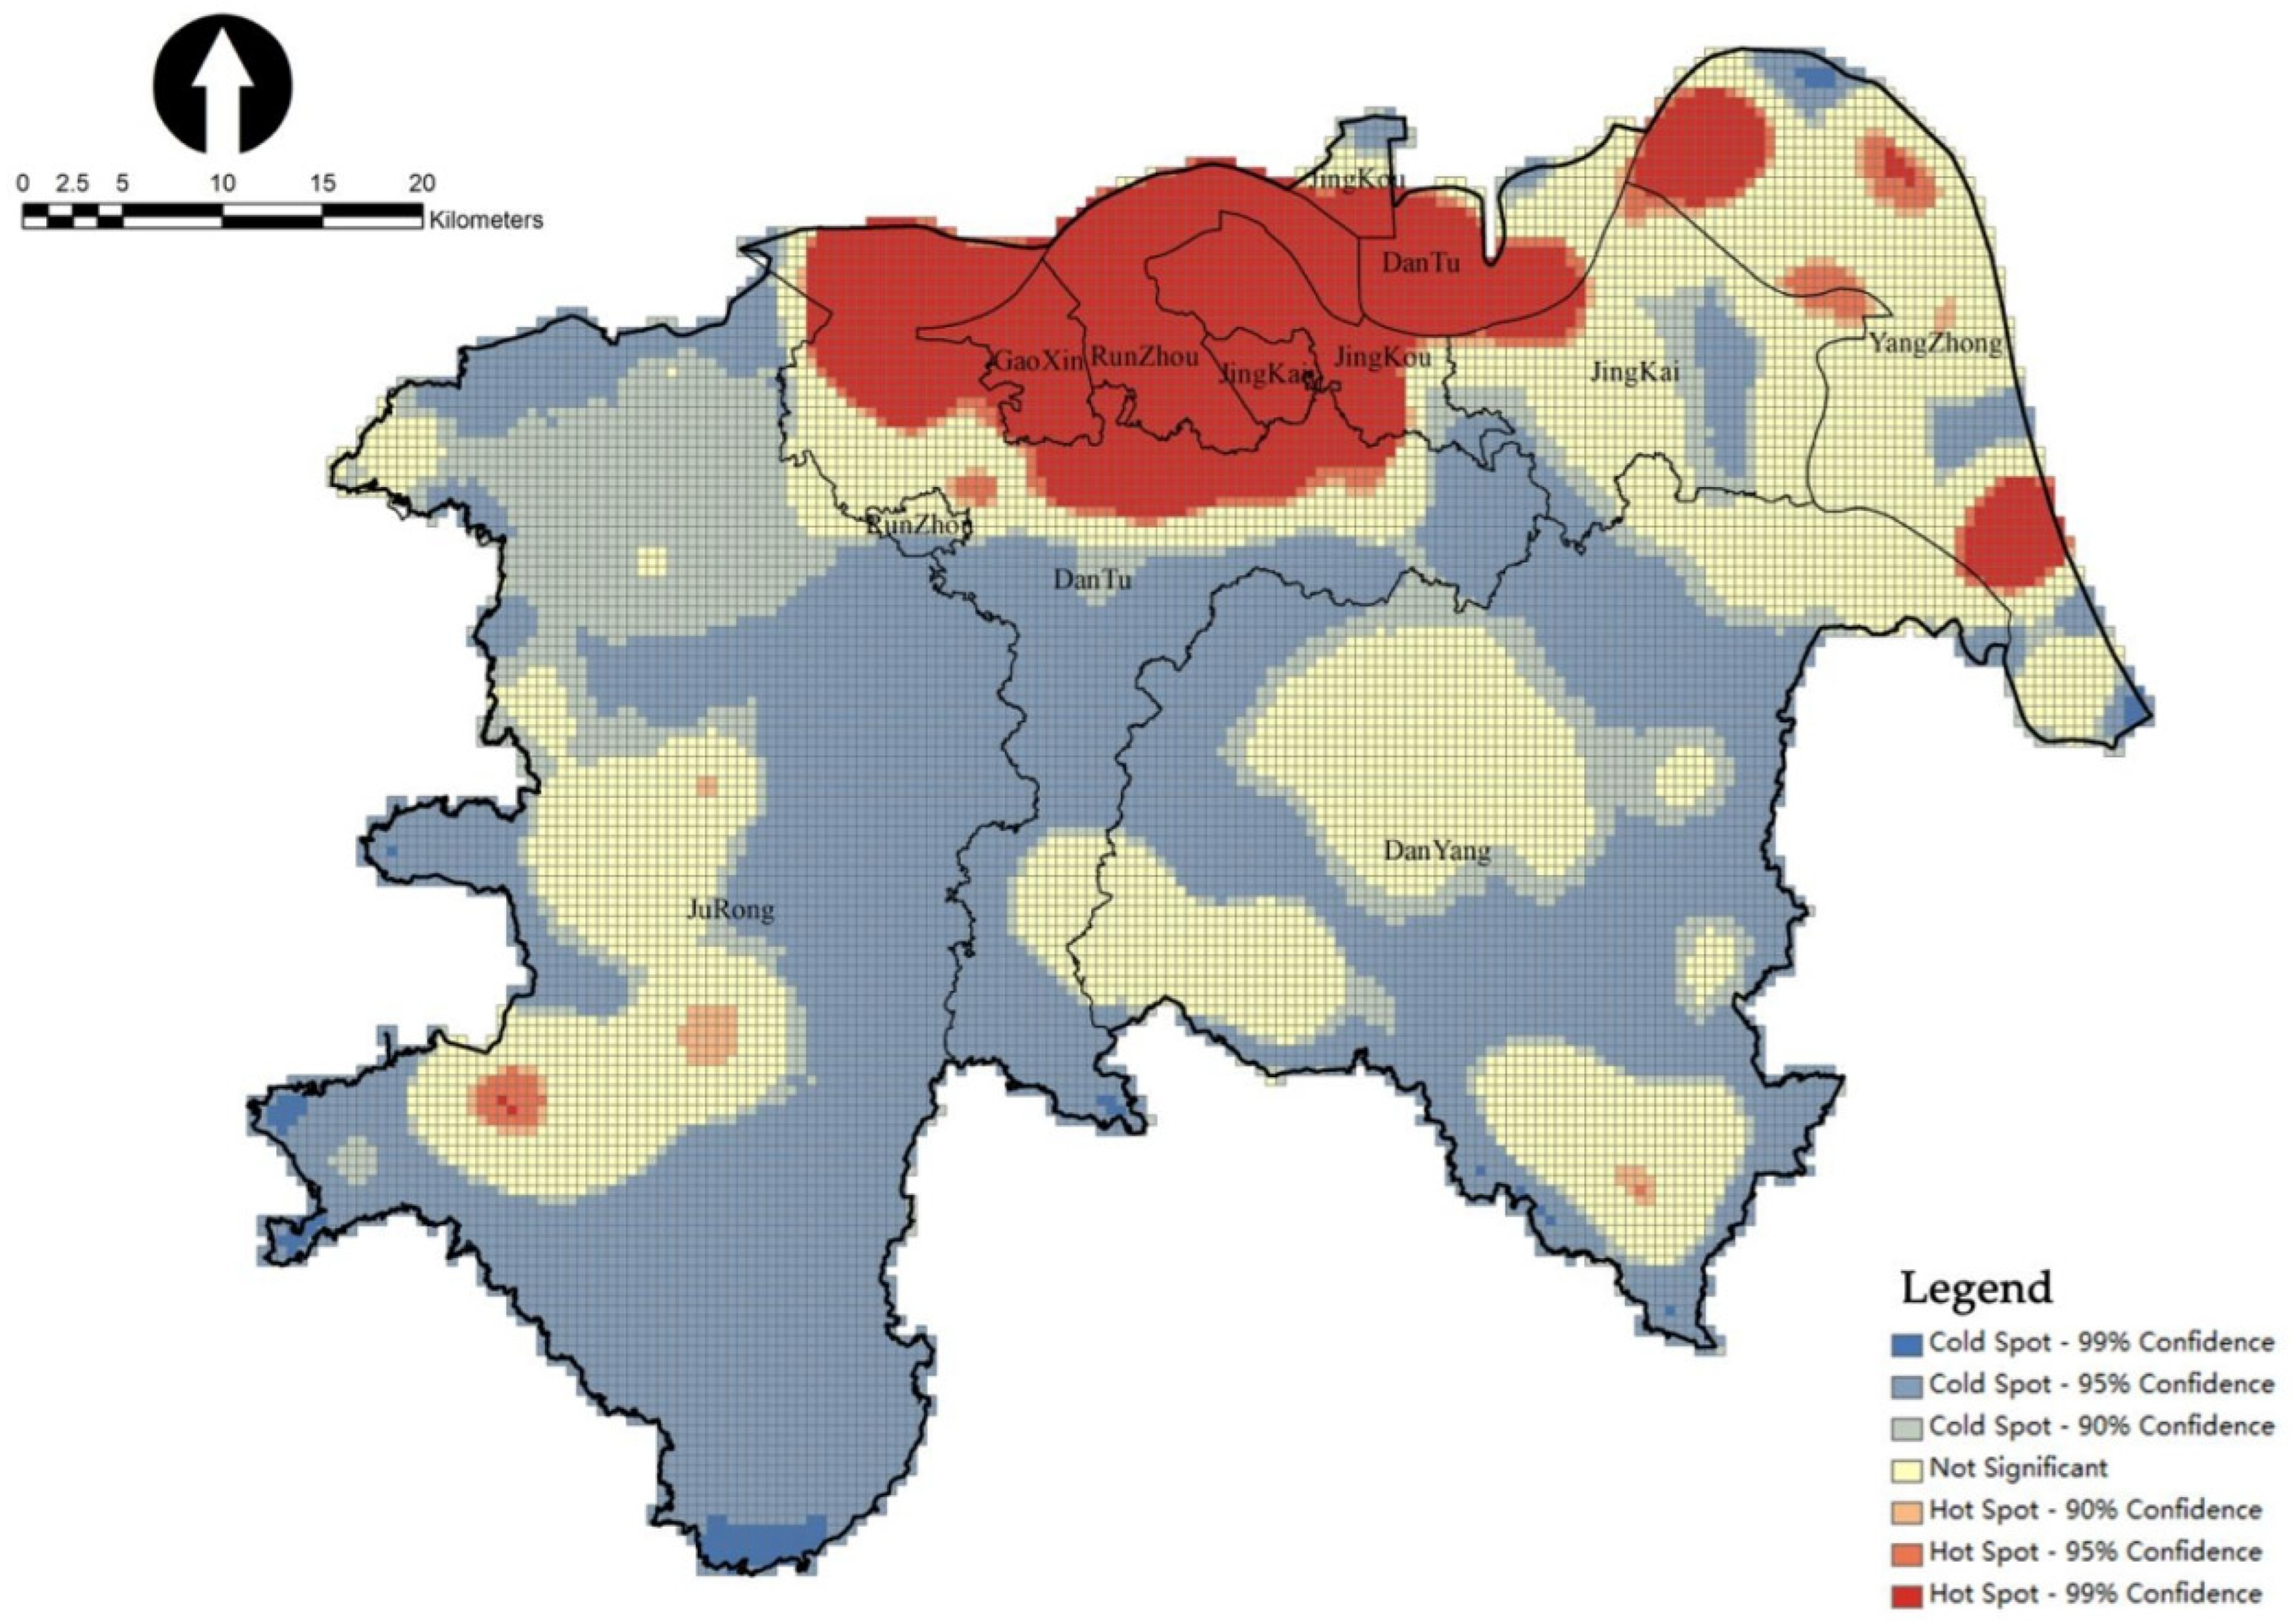
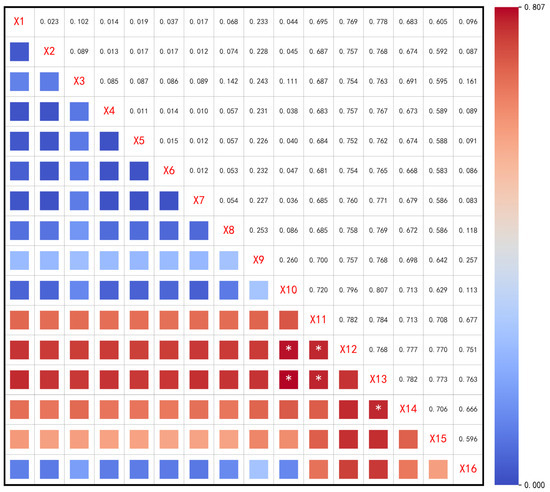
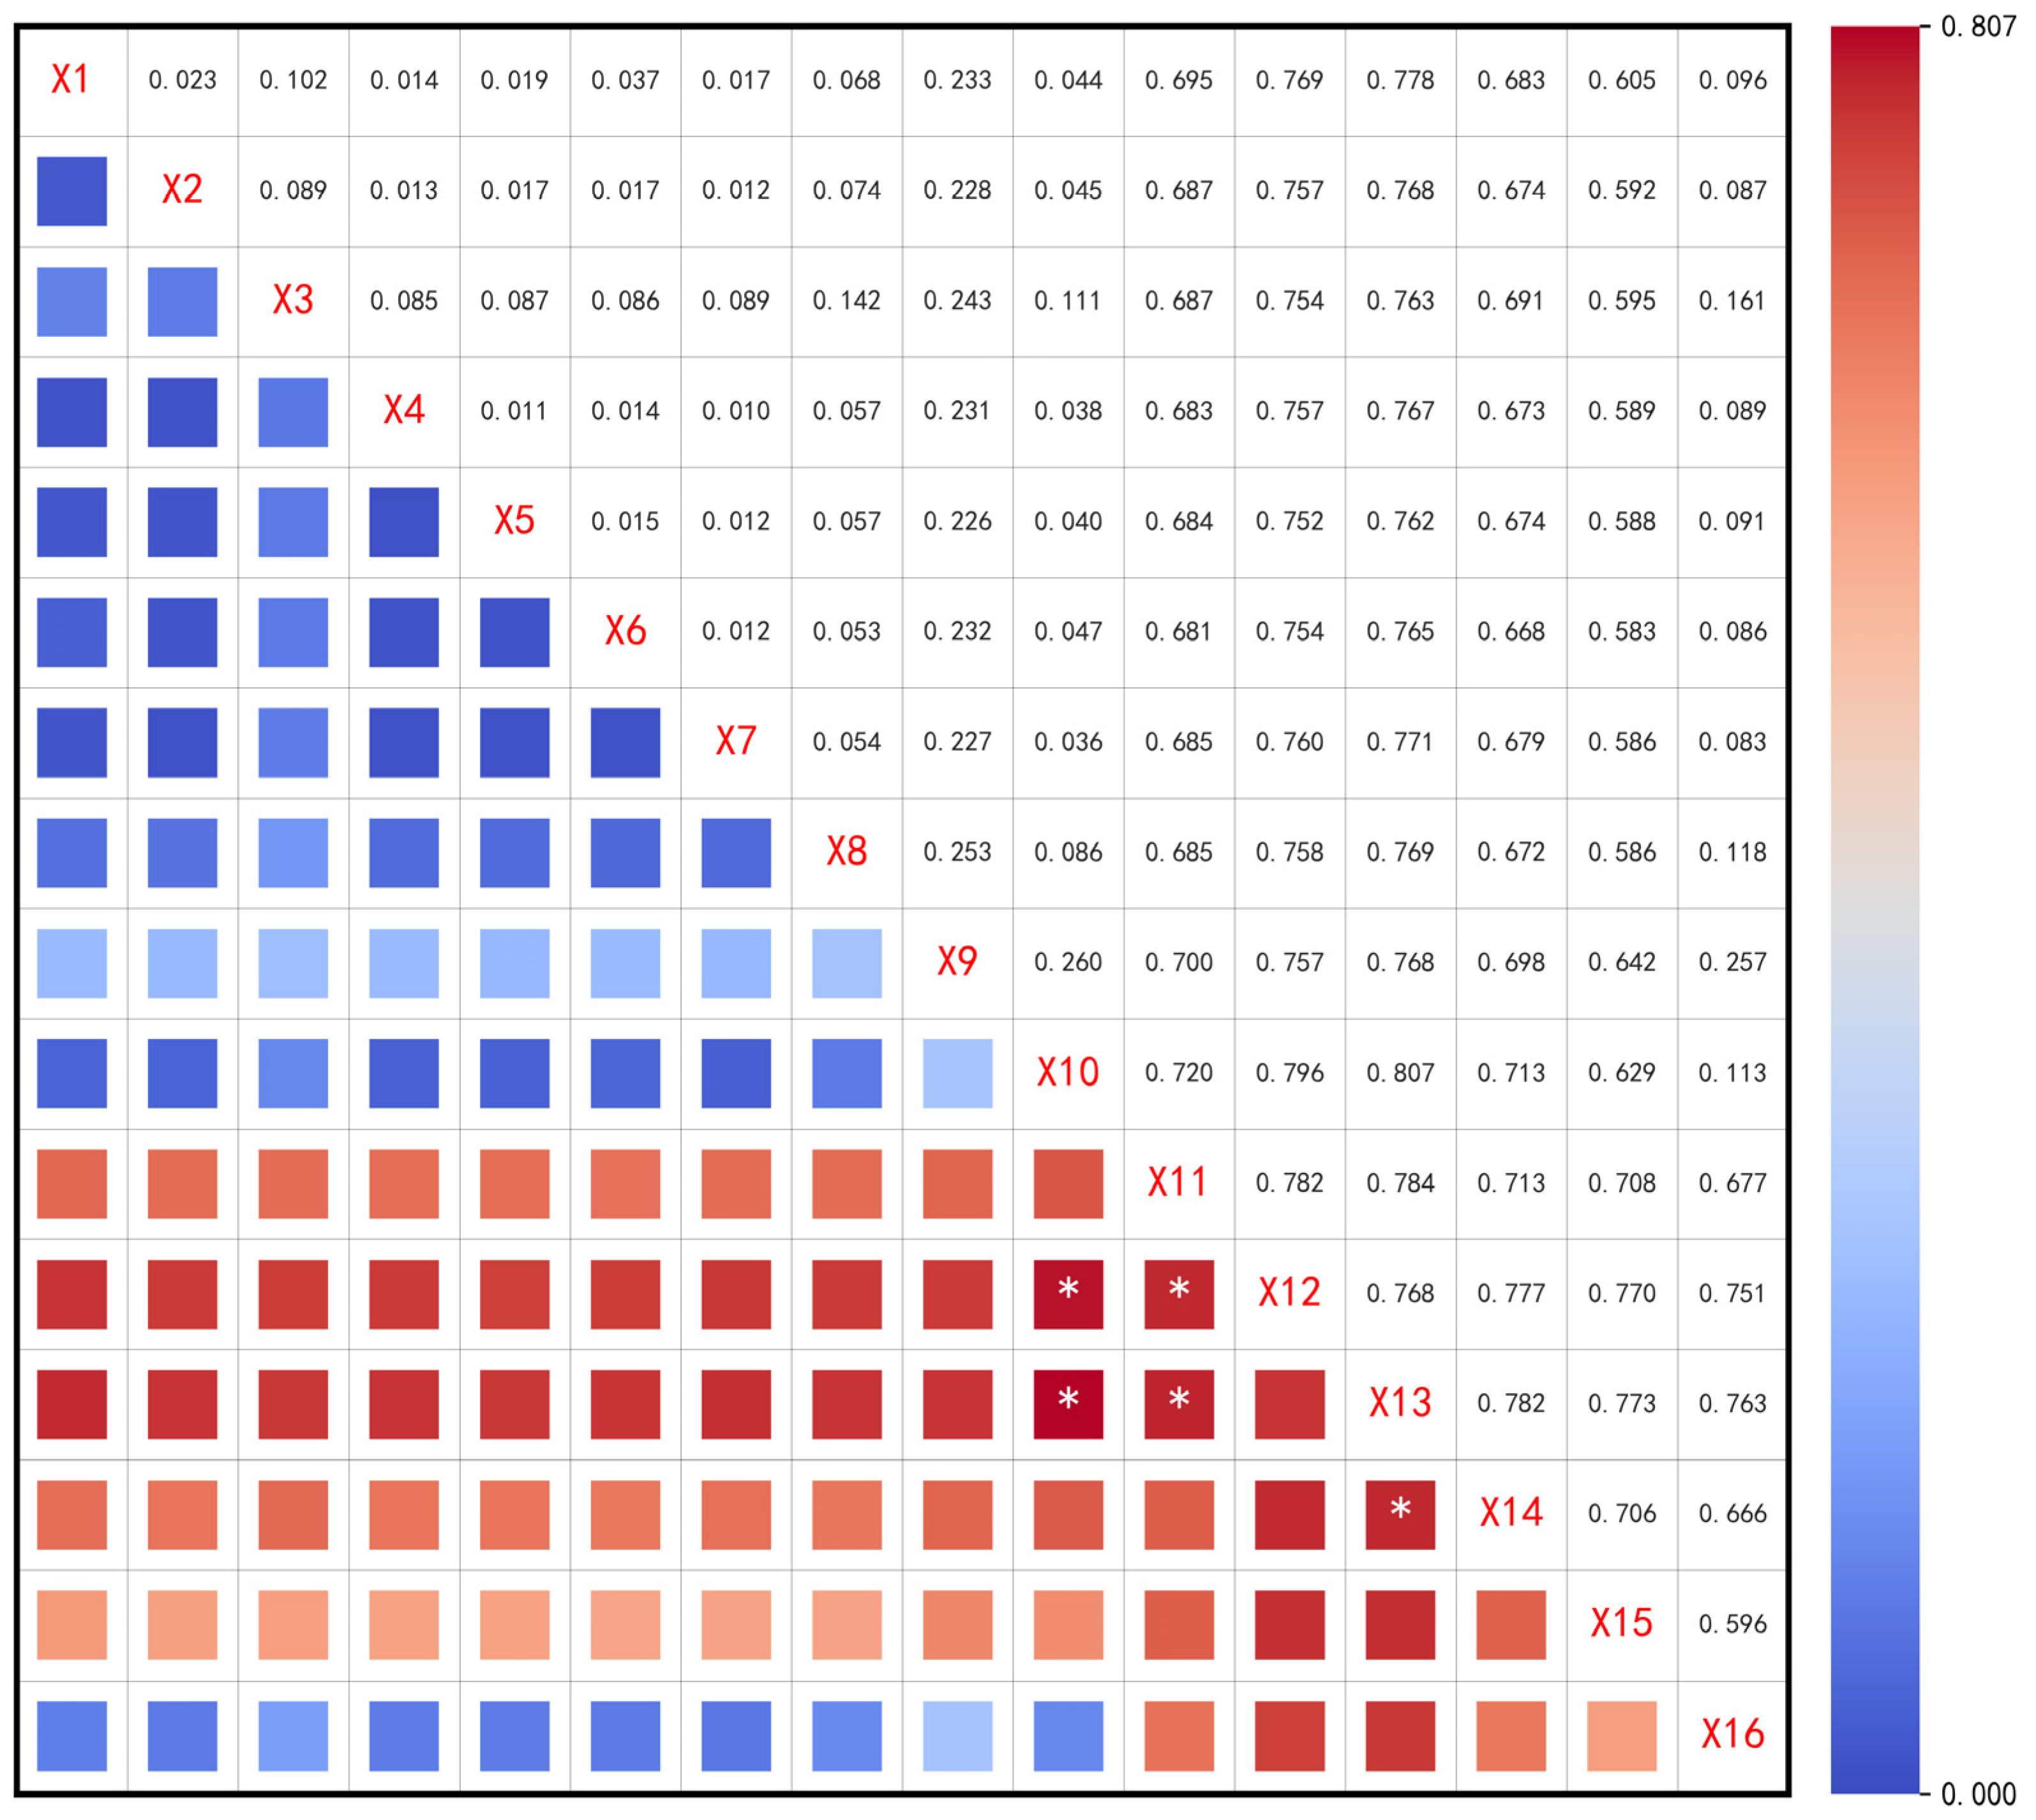
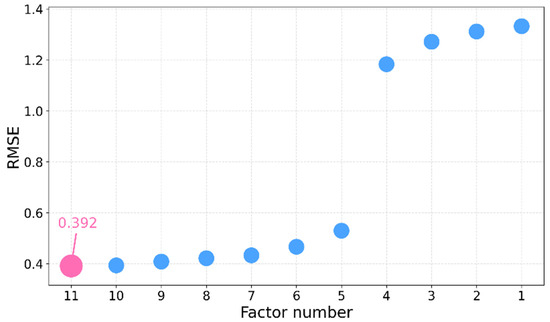
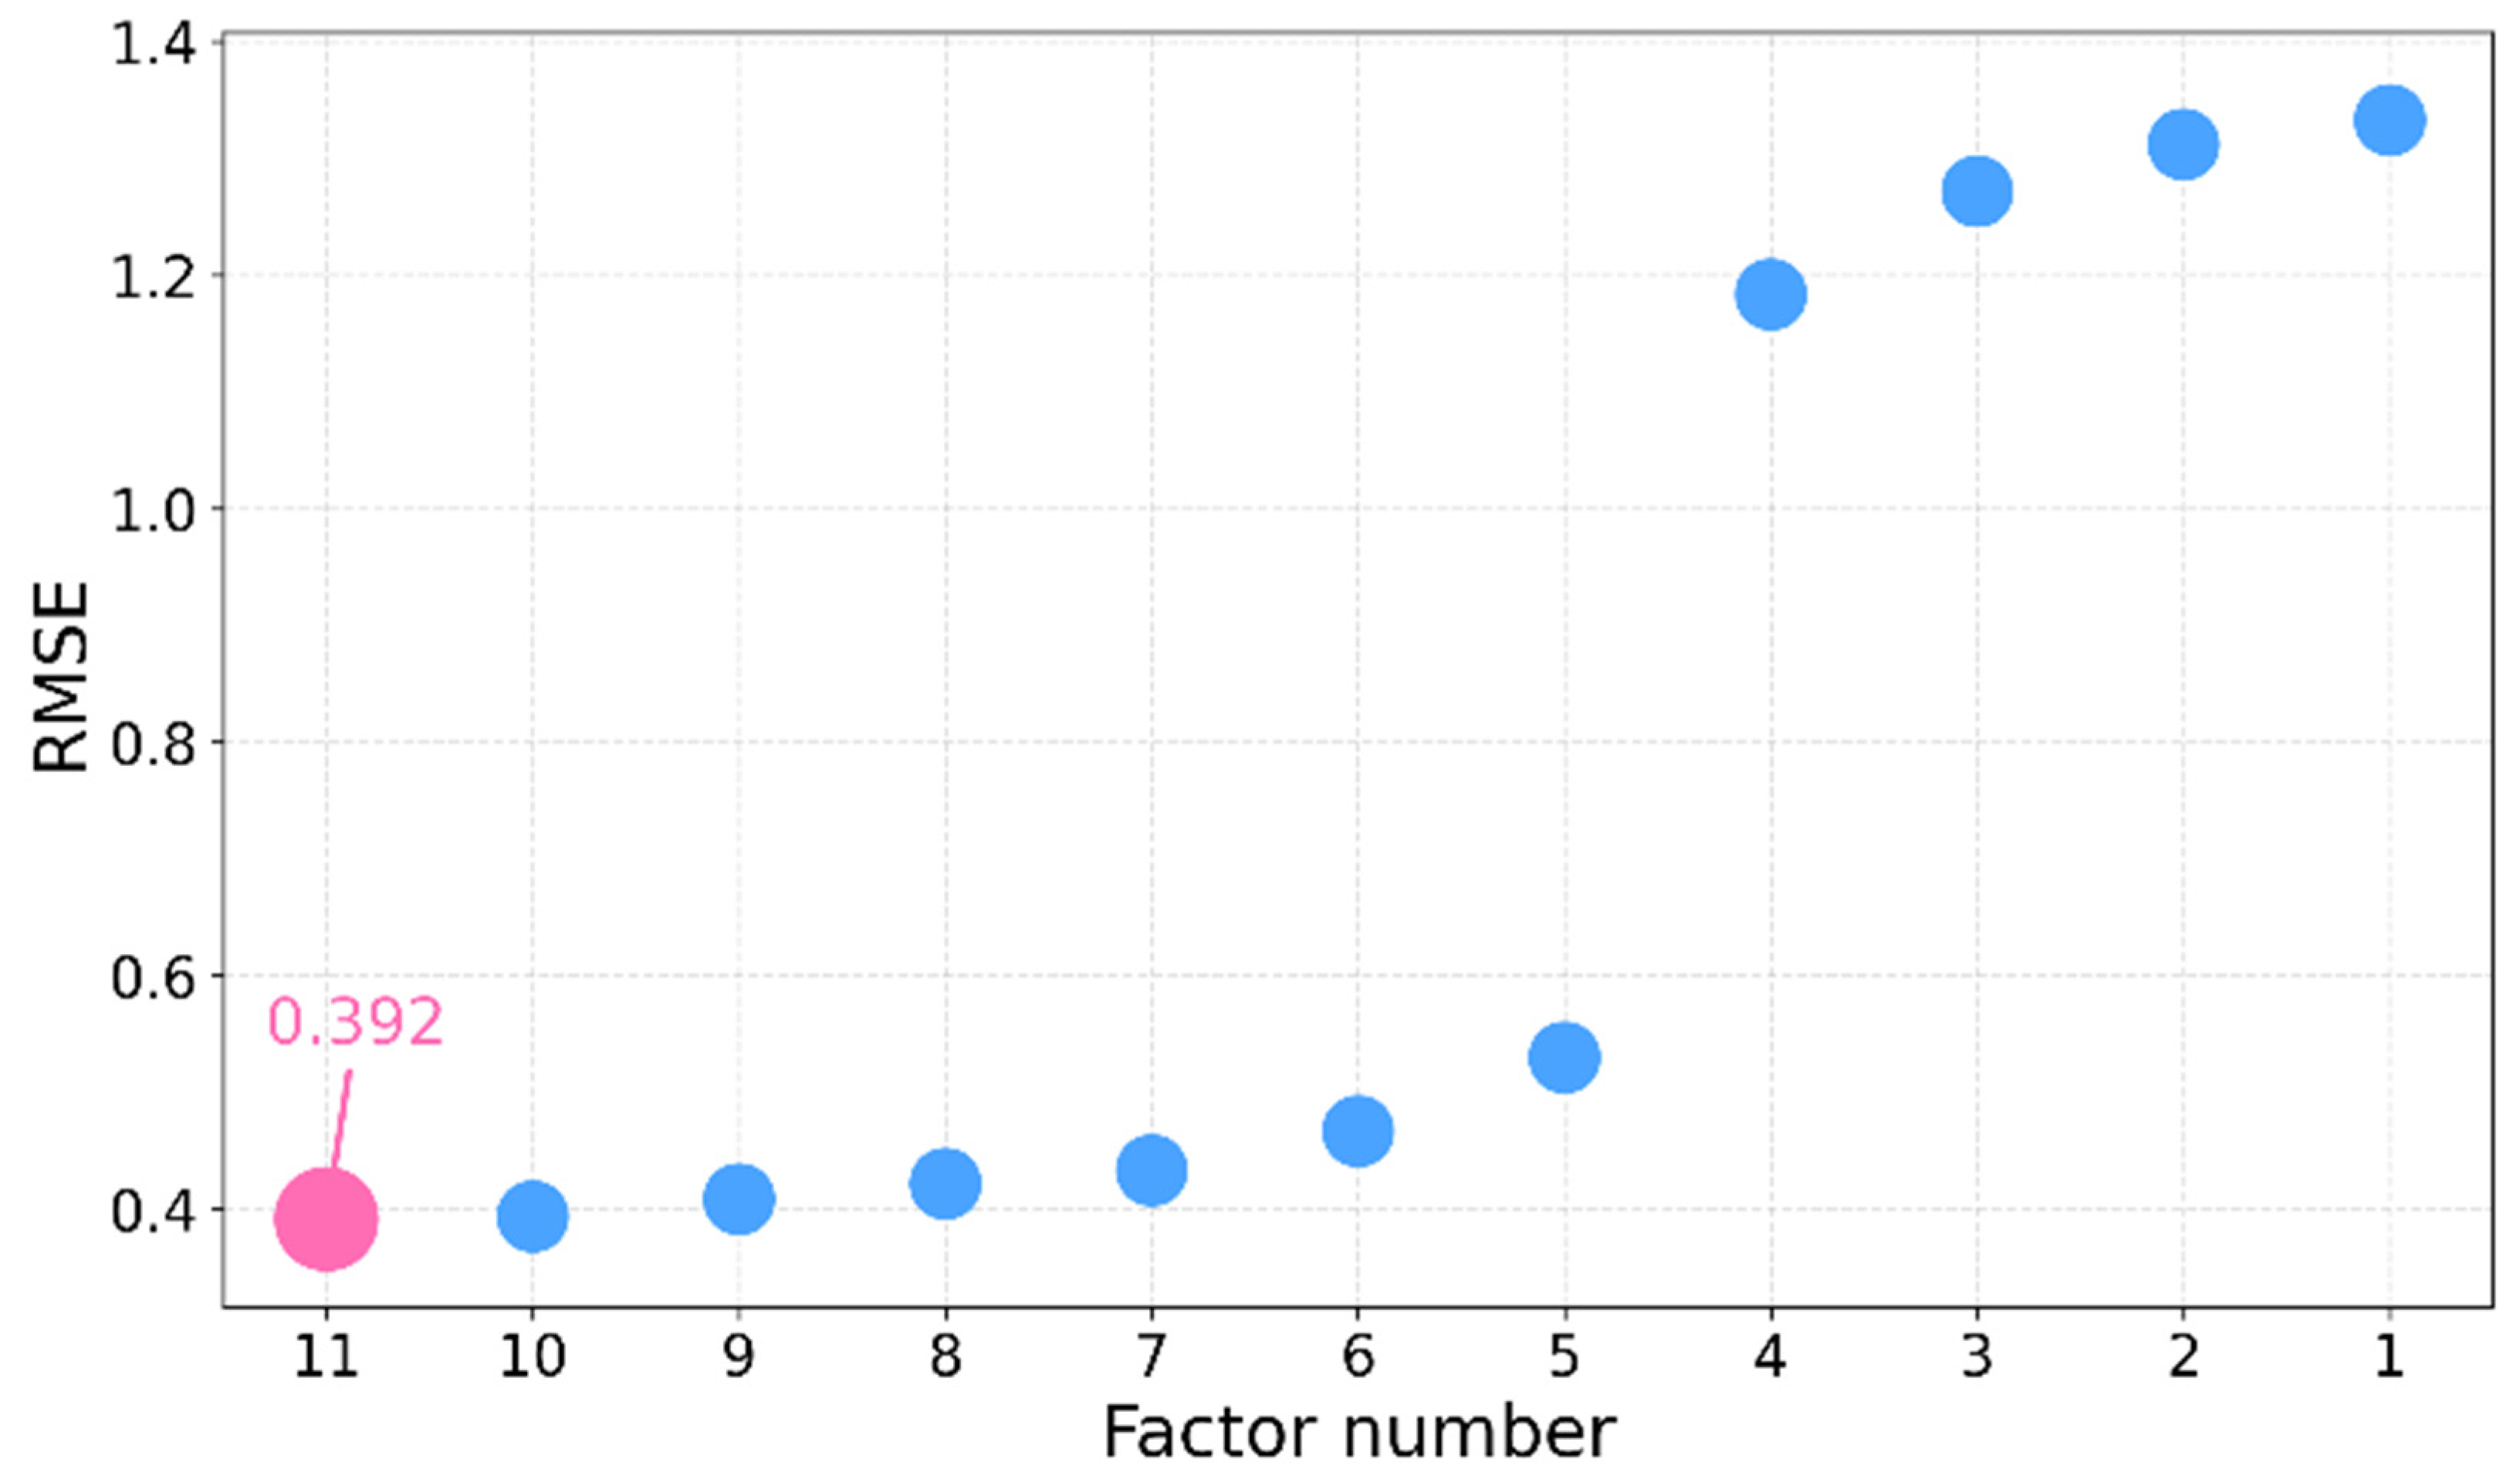
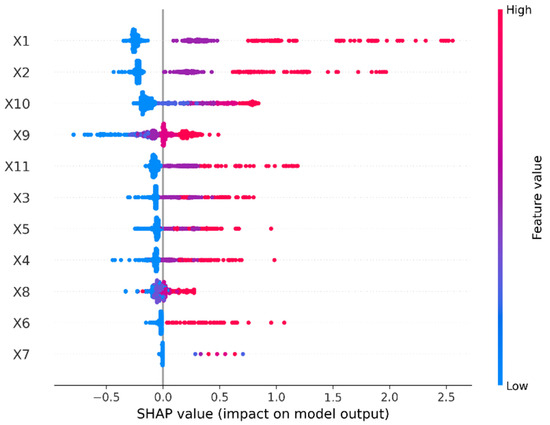
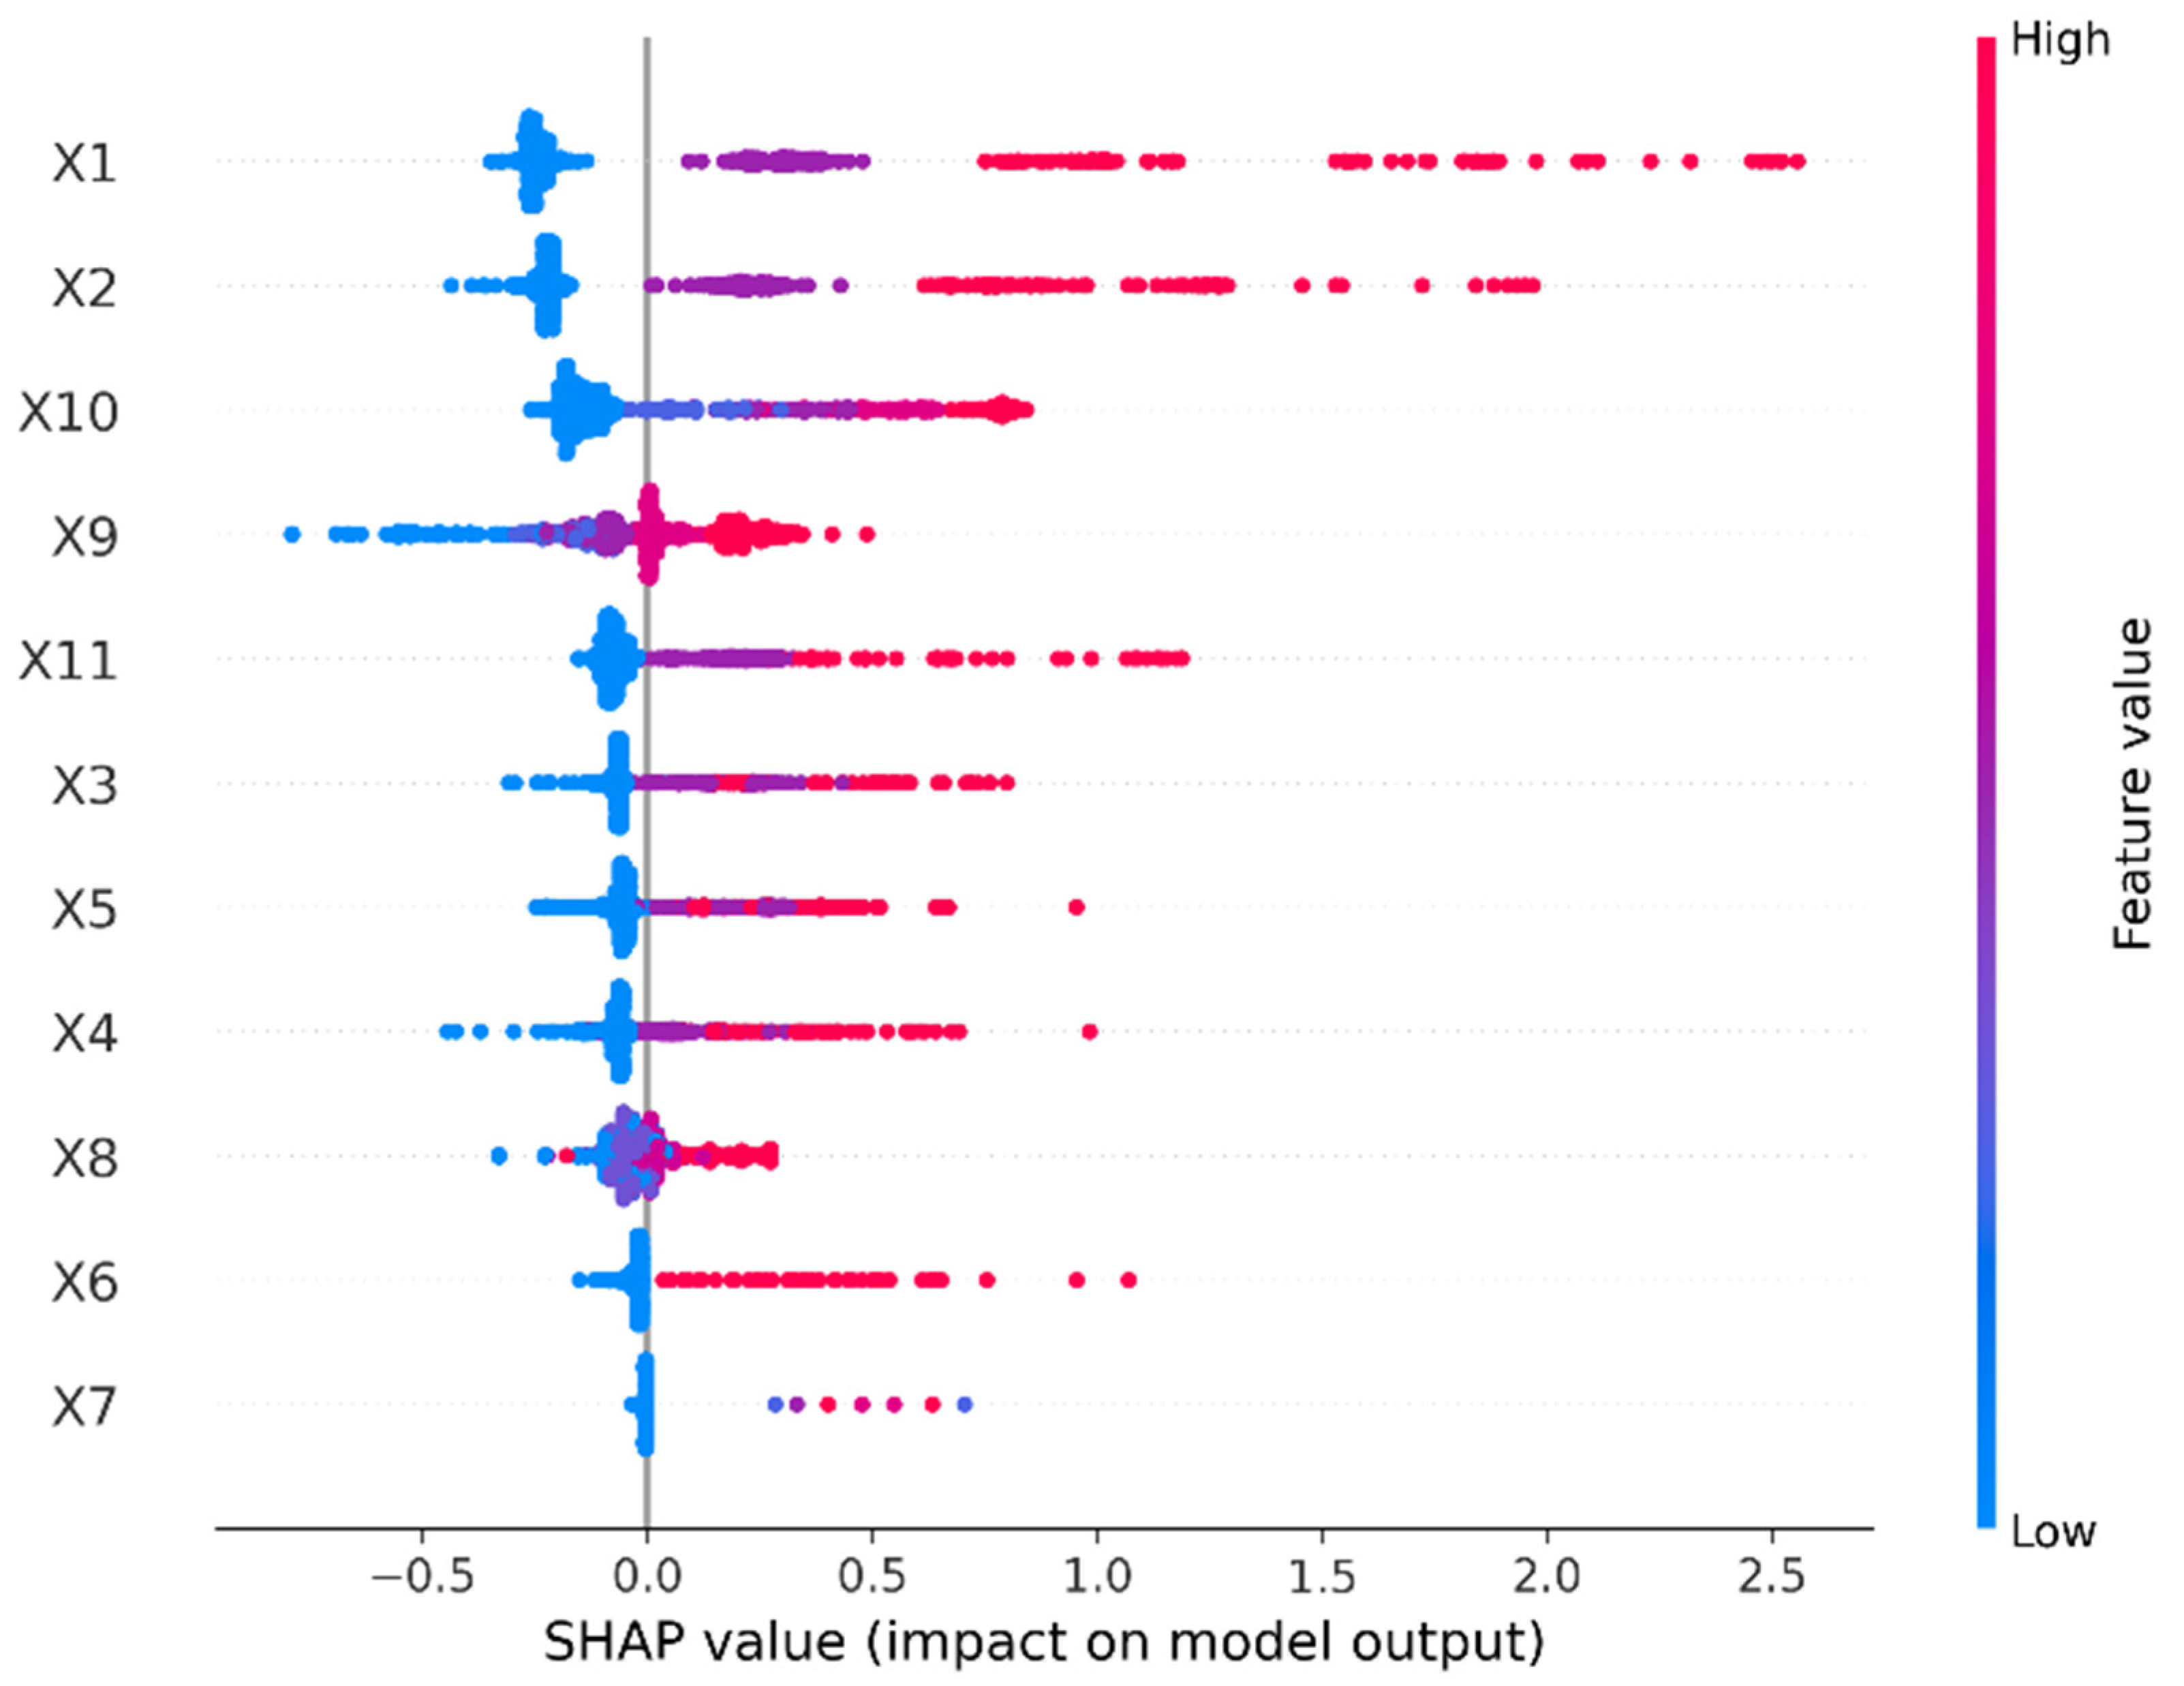

Disclaimer/Publisher’s Note: The statements, opinions and data contained in all publications are solely those of the individual author(s) and contributor(s) and not of MDPI and/or the editor(s). MDPI and/or the editor(s) disclaim responsibility for any injury to people or property resulting from any ideas, methods, instructions or products referred to in the content. |
© 2026 by the authors. Licensee MDPI, Basel, Switzerland. This article is an open access article distributed under the terms and conditions of the Creative Commons Attribution (CC BY) license.