


Abstract
Based on a balanced panel of nine provincial-level forest-park systems in the Yellow River Basin over 2013–2022 (90 province-year observations), this study measures the tourism eco-efficiency of forest parks and examines its spatiotemporal evolution and determinants. The unit of analysis is the aggregated forest-park system of each province (i.e., all registered forest parks within each province, aggregated to the provincial level), not individual parks. We combine a slacks-based super-efficiency (super-SBM) model—with four inputs, three desirable outputs, and three undesirable outputs—with the global Malmquist–Luenberger (GML) index, standard deviational ellipse (SDE) analysis, and a random-effects panel Tobit model. To remove price effects, monetary variables were deflated to constant 2012 prices; a small number of missing observations were completed by linear interpolation. The results show that: (1) Mean tourism eco-efficiency was 0.778, rising from 0.486 in 2013 to a peak of 1.077 in 2019, declining to 0.897–0.905 in 2020–2021 under the COVID-19 shock, and recovering to 1.143 in 2022. The mean GML index was 1.182, and mean technological change (TC) exceeded mean efficiency change (EC), suggesting that frontier shifts contributed more to measured productivity growth than efficiency change over the study period, although this conclusion rests on the pooled sample and is examined for robustness. (2) Eco-efficiency was spatially heterogeneous, with lower values in the upper reaches and higher values in the middle and lower reaches; the SDE was oriented east–west and its centroid shifted southeast-to-northwest by a modest distance. (3) At the 5–1% level, per capita GDP and tourism revenue share were positively associated with eco-efficiency and forest-park density negatively associated; highway mileage was positively associated only at the 10% level (p = 0.069); forest cover and employee density were not significant. Because the undesirable-output indicators are provincial industrial emissions allocated to forest parks by the tourism-revenue-to-GDP ratio, and because one regressor (tourism revenue share) is mechanically related to a desirable output, the associations reported here should be interpreted as observational, non-causal evidence. Policy implications are drawn accordingly.
1. Introduction
As an important ecological security barrier and economic zone in China, the Yellow River Basin contains numerous forest parks spanning alpine, canyon, riparian, desert, and wetland ecosystems. These parks meet public demand for ecotourism and put into practice the principle that lucid waters and lush mountains are invaluable assets [1]. However, the rapid growth of ecotourism in the basin has been accompanied by uneven ecological quality, uneven resource use, and tensions between ecological protection and economic returns [2,3,4]. However, recent basin-specific evidence on these trade-offs remains limited. Coordinating tourism-led economic development with ecological conservation has therefore become an urgent issue for forest parks across the basin.
The concept of eco-efficiency originated in industrial ecology and was first proposed by Schaltegger and Sturm in 1990; its core premise is to maximize economic output per unit of ecological input [5,6]. As an extension to tourism, tourism eco-efficiency measures the relationship between the economic benefits and environmental impacts of tourism, with the aim of generating greater economic returns at lower environmental cost [7]. Gössling et al. [8] defined tourism eco-efficiency as the ratio of economic returns to the environmental impacts of tourism activities; Zhen [4] quantified it as the ratio of tourism revenue to tourism energy consumption and carbon emissions. Although scholars differ in emphasis, the underlying logic is consistent: achieving an optimal balance between economic gains and ecological costs. The concept of forest tourism eco-efficiency is derived from this broader notion [9].
To date, scholars have conducted extensive research on the measurement, spatiotemporal patterns, and influencing factors of tourism eco-efficiency in protected areas. Three points are nevertheless worth emphasizing. First, on measurement, single-indicator ratios are simple but cannot capture the multi-input, multi-output nature of tourism; parametric stochastic frontier analysis (SFA) requires an a priori production functional form and may confound statistical noise with inefficiency, whereas data envelopment analysis (DEA) and its slacks-based extensions (SBM, super-SBM) are non-parametric and readily accommodate undesirable outputs [10]. When many decision-making units (DMUs) are rated fully efficient, super-SBM allows their ranking by excluding the evaluated DMU from the reference set. Second, on spatial scale, existing studies have operationalized eco-efficiency at the national [11,12,13], river-basin [14], urban-agglomeration [15], and provincial [16,17,18] levels; comparatively few explicitly state whether the observation unit is the individual park, the park system of a province, or a region, and aggregation to larger units inevitably masks within-unit heterogeneity. Third, on determinants, the Tobit model, qualitative comparative analysis, and machine learning methods have been used with indicators built around the tourism economy, technology, human capital, and infrastructure [12,13,15]; however, when a regressor such as the share of tourism revenue is itself derived from the revenue used as a desirable output, the potential for mechanical circularity and endogeneity is rarely examined.
Against this background, four gaps remain. (i) Evidence on tourism eco-efficiency specifically for forest parks in the Yellow River Basin is still scarce, and existing basin studies rarely distinguish park-level from province-level measurements. (ii) Undesirable outputs in forest-park studies are commonly proxied by regional industrial emissions, yet the allocation rule and its measurement error are seldom discussed. (iii) The small number of provincial DMUs and the suitability of the Tobit specification are rarely assessed. (iv) The causal status of policy attributions is rarely separated from associational evidence. This study therefore aims to: (a) measure tourism eco-efficiency of forest parks aggregated at the provincial level; (b) examine its static and dynamic evolution during 2013–2022 using the super-SBM model and the GML index; (c) describe its spatial distribution and centroid movement with the SDE; and (d) estimate the association between eco-efficiency and economic conditions, accessibility, market size, resource endowment, human resources, and resource concentration using a panel Tobit model, while explicitly acknowledging the observational, non-experimental nature of the design.
2. Materials and Methods
2.1. Study Area and Unit of Analysis
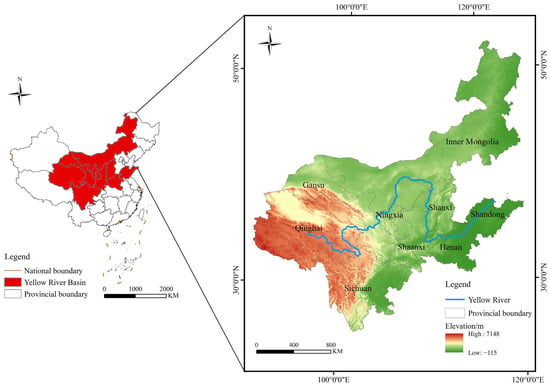
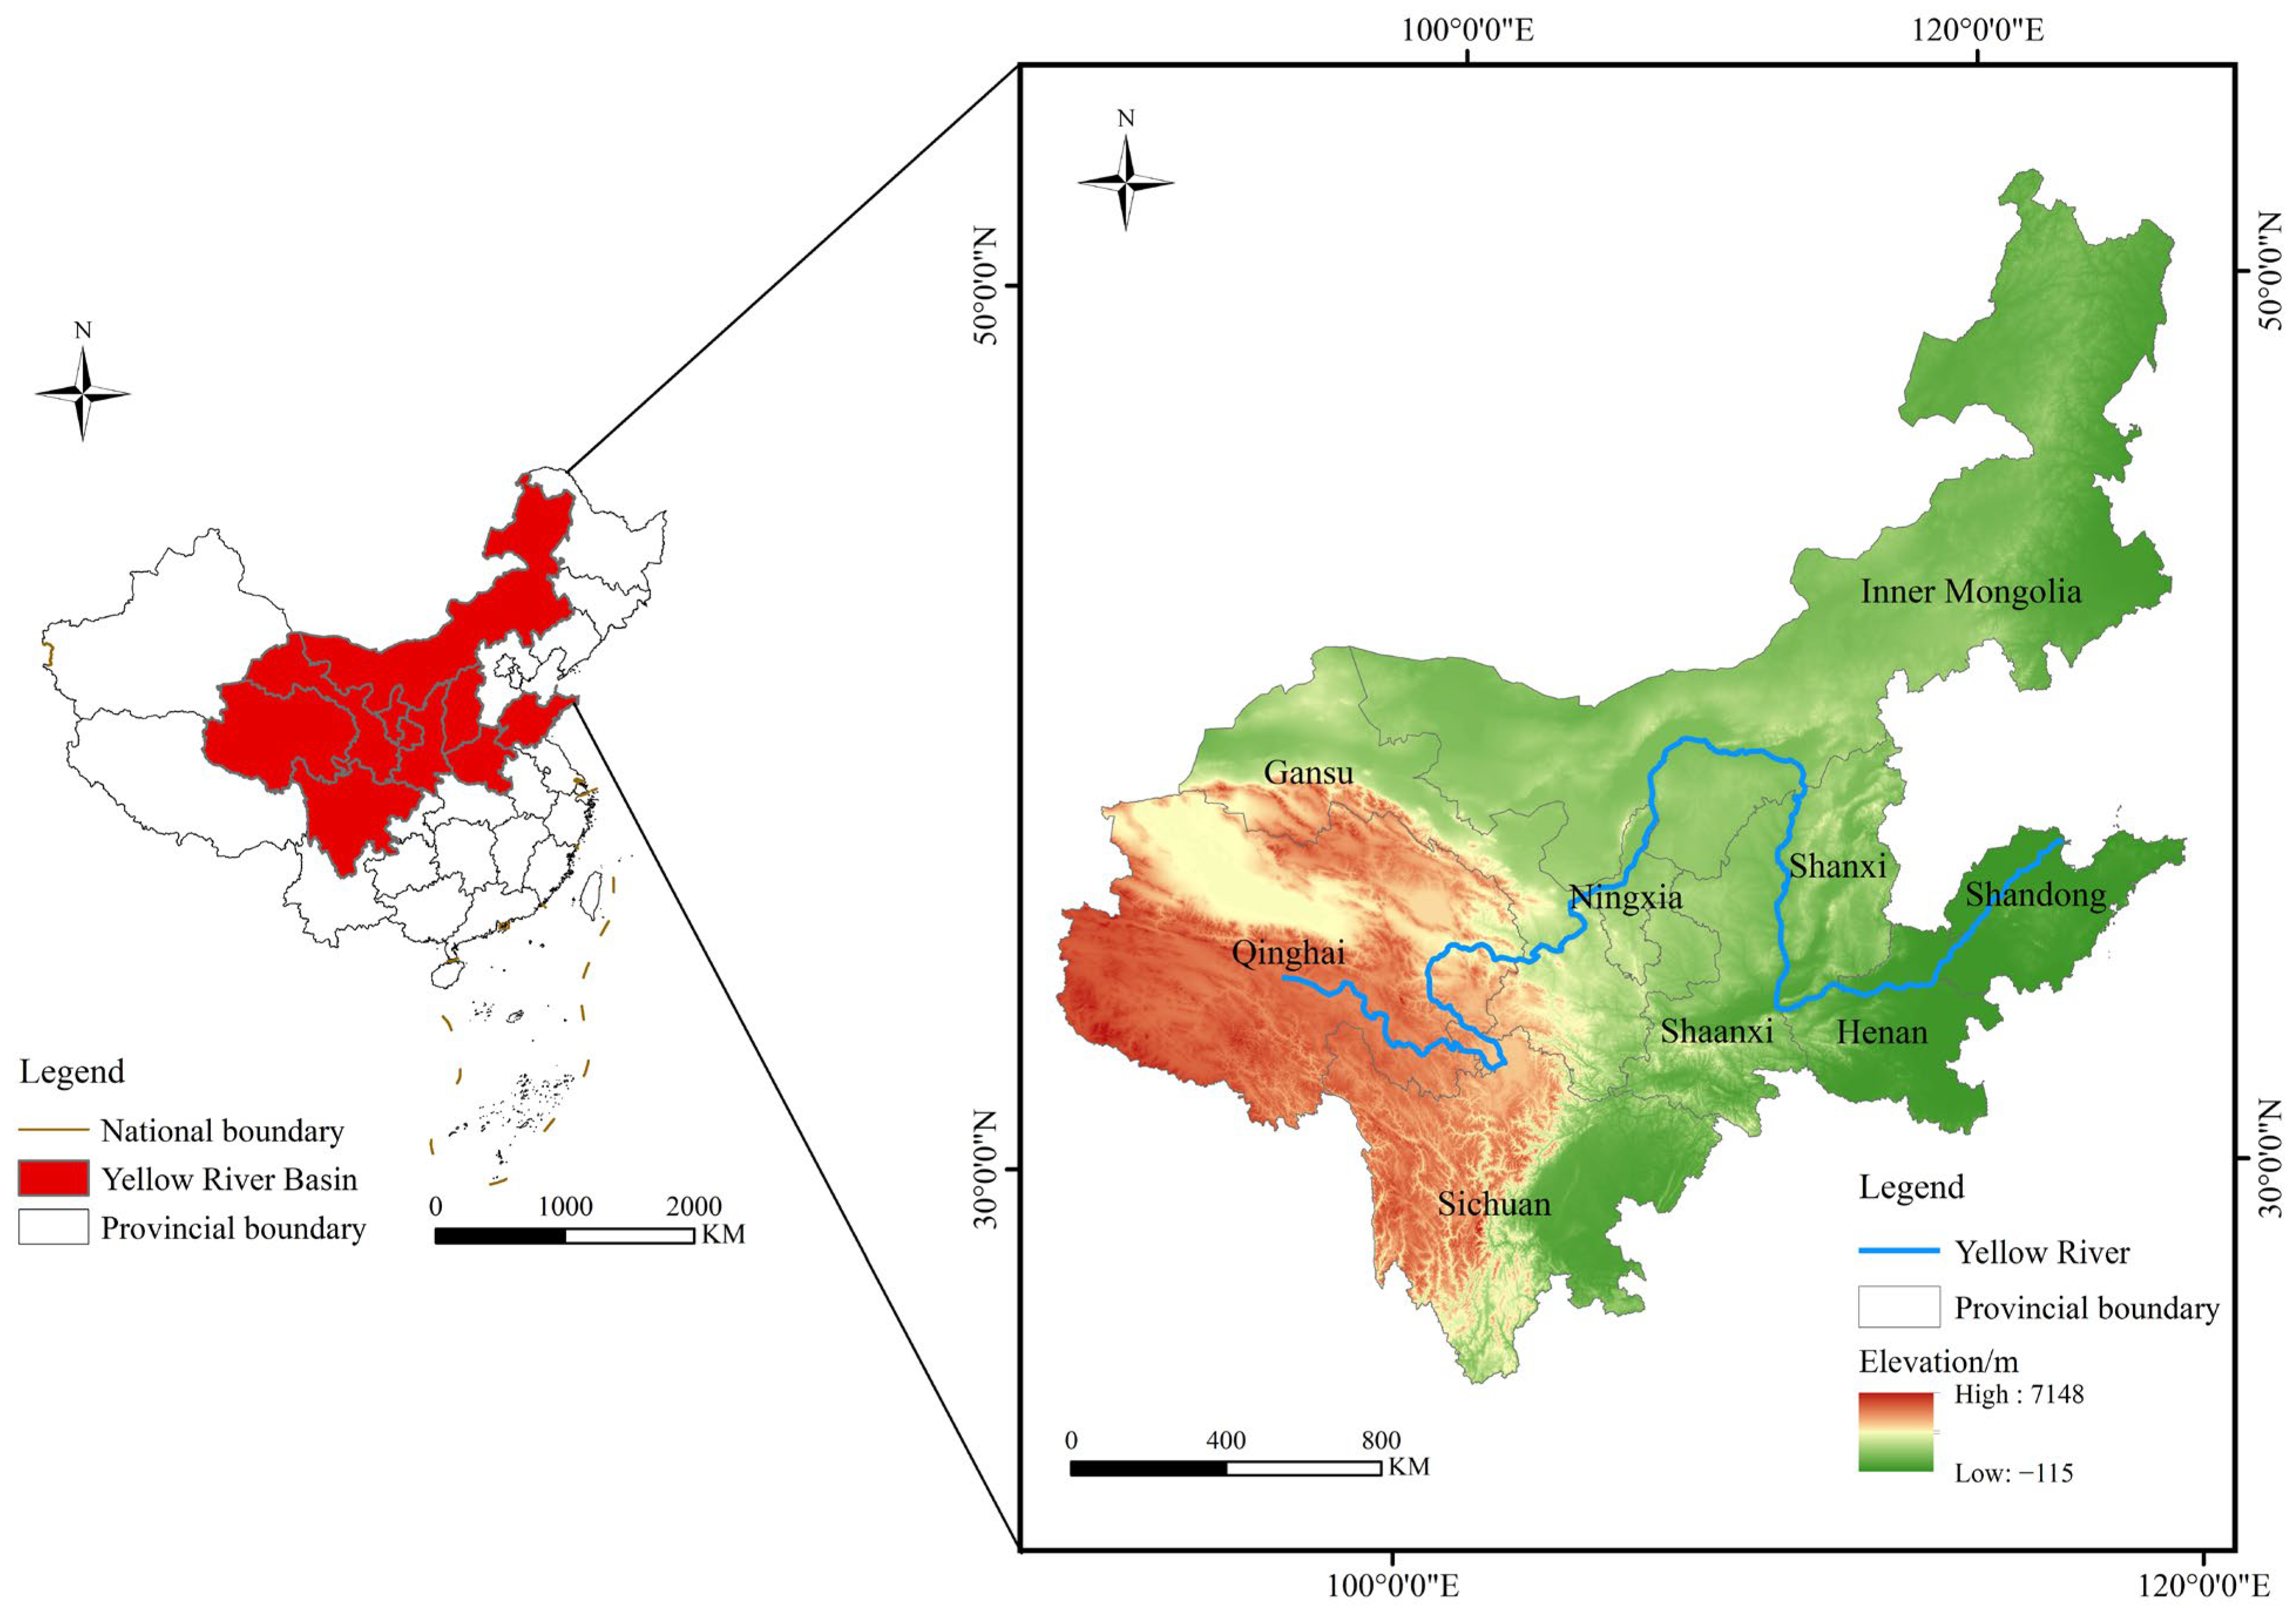
The Yellow River Basin extends from 96° E to 119° E and from approximately 32° N to 42° N. Originating in the Bayan Har Mountains in the west and emptying into the Bohai Sea in the east, the main stem flows through nine provincial-level regions—Qinghai, Sichuan, Gansu, Ningxia, Inner Mongolia, Shaanxi, Shanxi, Henan, and Shandong—with a total length of approximately 5464 km and a drainage area of about 795,000 km2 (Figure 1). The nine regions are the provincial units that the Ministry of Water Resources identifies as lying substantially within the basin; because several provinces only partially lie within the basin, the analysis uses province-level forest-park aggregates and does not reallocate area to the basin boundary. The forest parks covered are all registered forest parks (national, provincial, and municipal) recorded in the China Forestry and Grassland Statistical Yearbook; no single-park census of environmental pressure is available, which motivates the provincial aggregation discussed below.
Figure 1.
Overview of the study area, showing the nine provincial units, the basin boundary, and administrative boundaries. Map produced using the standard map with approval number GS (2024) 0650; no modifications were made to the boundary lines.
By the end of 2024, forest area in the basin had reached approximately 8.14 million hectares. This figure is reported only as recent contextual information and is not used in the 2013–2022 estimation.
2.2. Analytical Framework
The decision-making unit (DMU) throughout this study is the aggregated forest-park system of one province in one year. Inputs and outputs are obtained by aggregating (summing) area, staff, capital investment, visitors, and tourism revenue across all registered forest parks in that province; forest carbon sequestration is estimated from provincial growing stock. Undesirable outputs are provincial industrial emissions allocated to the provincial forest-park system by the rule given in Section 2.4. The sample therefore contains nine DMUs per year over ten years (2013–2022), i.e., a balanced panel of 90 observations. Because the super-SBM model here uses ten variables (four inputs, three desirable outputs, and three undesirable outputs), the widely used rule of thumb that the number of DMUs should be at least two to three times the total number of variables (n ≥ 20–30) is not met. We acknowledge that nine DMUs per cross-section limit discrimination and may produce a relatively large share of efficient units; the super-SBM specification is used partly to rank already-efficient DMUs, and this limitation is discussed explicitly in Section 4.4 and Section 5.
2.2.1. Super-SBM Model
Conventional CCR/BCC DEA models ignore slack variables and are unsuitable for systems that include undesirable outputs. The SBM model of Tone [19] addresses slacks but cannot rank DMUs that all attain a score of 1. The super-SBM model overcomes this by excluding the evaluated DMU from the reference set, allowing efficient DMUs to receive scores greater than 1 [20]. We use a non-oriented, variable-treatment-of-undesirable-outputs super-SBM model under the assumption of constant returns to scale (CRS); a variable-returns-to-scale (VRS) specification is reported as a robustness check. Because only nine provincial decision-making units (DMUs) are available in each year, constructing annual DEA frontiers would provide limited discriminatory power relative to the ten input–output indicators. Therefore, all 90 province-year observations (9 provinces × 10 years) were pooled to construct a common production frontier for the static super-SBM analysis. Consequently, the effective reference set for the static efficiency evaluation consists of all 90 province-year observations rather than only the nine DMUs observed in a single year. With m inputs, s1 desirable outputs, and s2 undesirable outputs, the super-SBM efficiency score ρ* of the evaluated DMU is:
where ρ* is the tourism eco-efficiency score (larger is better); xi0, yr0, and bk0 are the observed input, desirable output, and undesirable output of the evaluated DMU; X-0, Y-0, and B-0 denote the input, desirable-output, and undesirable-output matrices after excluding the evaluated DMU from the reference set; si−, sgr, and sbk are the corresponding slack variables; and λ is the non-negative weight vector. Variables were not transformed before estimation, but monetary series were deflated (Section 2.4); outlier screening was carried out, and no observations were removed.The static Super-SBM model was implemented using MATLAB R2021b (MathWorks, Natick, MA, USA).
2.2.2. Global Malmquist–Luenberger (GML) Index
The super-SBM score describes static efficiency, whereas the GML index [9,20] measures productivity change and decomposes it into efficiency change (EC, catching-up) and technological change (TC, frontier shift). A global technology set GT is constructed as the union of all contemporaneous technologies over 2013–2022, so that all indices are computed against a common benchmark and are transitive. Specifically, each contemporaneous technology is defined by the nine provincial DMUs observed in a given year, whereas the global technology set combines these annual frontiers into a common benchmark for intertemporal productivity comparison. Therefore, unlike the pooled frontier used in the static super-SBM analysis, the GML index is evaluated against the global technology set constructed from all annual contemporaneous frontiers. The GML index between period t and t + 1 is:
where Dg is the global directional distance function; and x, y, and b are the vectors of inputs, desirable outputs, and undesirable outputs, respectively. The interpretation convention is: GML > 1 indicates improvement in eco-efficiency productivity, GML = 1 indicates no change, and GML < 1 indicates deterioration.
GML_t, t + 1 = EC_t, t + 1 × TC_t, t + 1
2.2.3. Standard Deviation Ellipse (SDE)
The SDE [21] describes the directional trend and dispersion of a spatial distribution. The SDE analysis was conducted using ArcGIS (version 10.8.2) [actual version] (Esri, Redlands, CA, USA).Applied to only nine provincial units, it is used as a descriptive rather than inferential tool. Each province was represented by the geographic centroid of the provincial administrative unit and weighted by its annual tourism eco-efficiency score, located at the provincial geographic centroid, and all coordinates are projected to an equal-area projected coordinate system. The weighted mean center and the standard deviations along the major and minor axes are calculated as follows:
where (, ) is the weighted mean center of the ellipse; n is the number of spatial units; (xi, yi) are the projected centroid coordinates of unit i; i = xi − X and = y − Y are the centered coordinates; wi is the tourism eco-efficiency weight; θ is the rotation angle of the ellipse; and σx and σγ denote the standard deviations along the major and minor axes, respectively.
2.2.4. Random-Effects Panel Tobit Model
This study employs a random-effects panel Tobit model to examine the statistical associations between provincial tourism eco-efficiency and the explanatory variables using provincial panel data for 2013–2022. The model accounts for unobserved province-specific heterogeneity through a province-level random effect. The super-SBM efficiency scores range from 0.167 to 1.274, and values greater than 1 represent super-efficiency scores rather than observations censored at an upper boundary. Accordingly, the Tobit specification is treated as an empirical modeling choice rather than a model required by censoring. Clustering near the efficiency frontier alone does not establish the suitability of this specification. The model is expressed as follows:
where i and t index the province and year; β is the coefficient vector; ui is the province random effect; and εit is the idiosyncratic error. Given the characteristics of the dependent variable and the limited number of provincial units, the model specification and statistical inference should be interpreted with caution. The estimated coefficients are interpreted as observational statistical associations rather than causal effects. Variance inflation factors (VIFs) and a correlation matrix are used to assess potential multicollinearity, and standard errors are clustered at the provincial level where feasible. The limitations of the model specification and the need to compare alternative panel estimators are further discussed in the Discussion section.
Y*it = β′Xit + ui + εit, Yit = Y*it (observed)
2.3. Indicator System
Guided by data availability, comparability, and rigor, and following Ding et al. [11], Lin et al. [17], and Li et al. [22], an input–output system was constructed (Table 1). Inputs are total forest-park area, infrastructure level, number of staff, and annual capital investment; desirable outputs are total tourism revenue, visitor volume, and forest carbon sequestration; and undesirable outputs are industrial wastewater, sulfur dioxide (SO2), and solid waste allocated to forest parks (Section 2.4).
Table 1.
Evaluation indicator system for forest-park tourism eco-efficiency.
Two indicator choices require explicit justification (Table 2). First, forest carbon sequestration is retained because it captures an ecosystem co-benefit of forest parks that is jointly produced with tourism; because it is mechanically related to forest area, we recognize a degree of double-counting and examine the sensitivity of results to its exclusion. Second, total revenue and visitor volume are retained together because they measure value and volume, respectively.
Table 2.
Descriptive statistics of indicators.
2.4. Data Sources and Processing
The study period is 2013–2022. Primary data came from successive editions of the China Forestry and Grassland Statistical Yearbook (titled the China Forestry Statistical Yearbook before 2018), the China Statistical Yearbook, the China Environmental Statistical Yearbook, and provincial statistical yearbooks. Infrastructure level was obtained using principal component analysis in Stata 18.0; carbon sequestration was estimated from growing stock using standard conversion factors [9]. Because park-specific emission data are unavailable, provincial SO2 and solid waste are used as proxies and are allocated to the provincial forest-park system in proportion to the share of forest-park tourism revenue in regional GDP:
where UE_p,it is the amount of undesirable output p (p = wastewater, SO2, and solid waste) attributed to forest parks in province i in year t; IND_p,it is the provincial industrial emission; Rev_FP,it is forest-park tourism revenue; and GDP_it is regional GDP. We emphasize that Equation (7) is an allocation proxy: it does not establish that these emissions are generated by visitors or park operations, and environmental conclusions must be read with this caveat. A sensitivity analysis that (i) drops the proxy undesirable outputs and (ii) uses a single environmental indicator is reported in Section 3.3.3.
Missing observations (a small share of the 90 × 10 matrix, concentrated in early yearbook editions) were completed by linear interpolation; the number and location of imputed cells are listed in, and a re-estimation excluding interpolated observations is reported as a robustness check. Monetary variables were deflated to constant 2012 prices using the CPI for tourism revenue and the fixed-asset investment price index for capital investment. The dataset and analysis scripts are archived; see the Data Availability Statement.
3. Results
3.1. Temporal Evolution of Tourism Eco-Efficiency
The super-SBM model was run in MATLAB 2021b. The resulting province-year efficiency scores are reported in Table 3; the basin mean reported in the text is the simple (unweighted) average across the nine provincial DMUs.
Table 3.
Tourism eco-efficiency by province and year, 2013–2022. The mean is the simple average across provinces; SD is the cross-province standard deviation within each year.
It should be noted that the static tourism eco-efficiency scores reported in Table 3 were estimated against a pooled production frontier constructed from all 90 province-year observations (nine provinces × 10 years). By contrast, the GML decomposition presented in the following section is based on the global technology set, which is constructed as the union of annual contemporaneous frontiers. This distinction should be considered when interpreting the static efficiency scores and productivity changes.
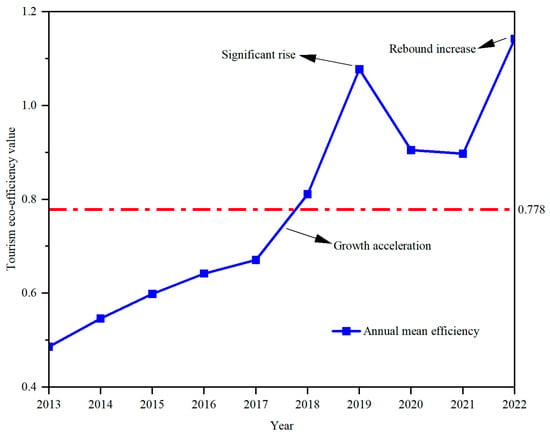
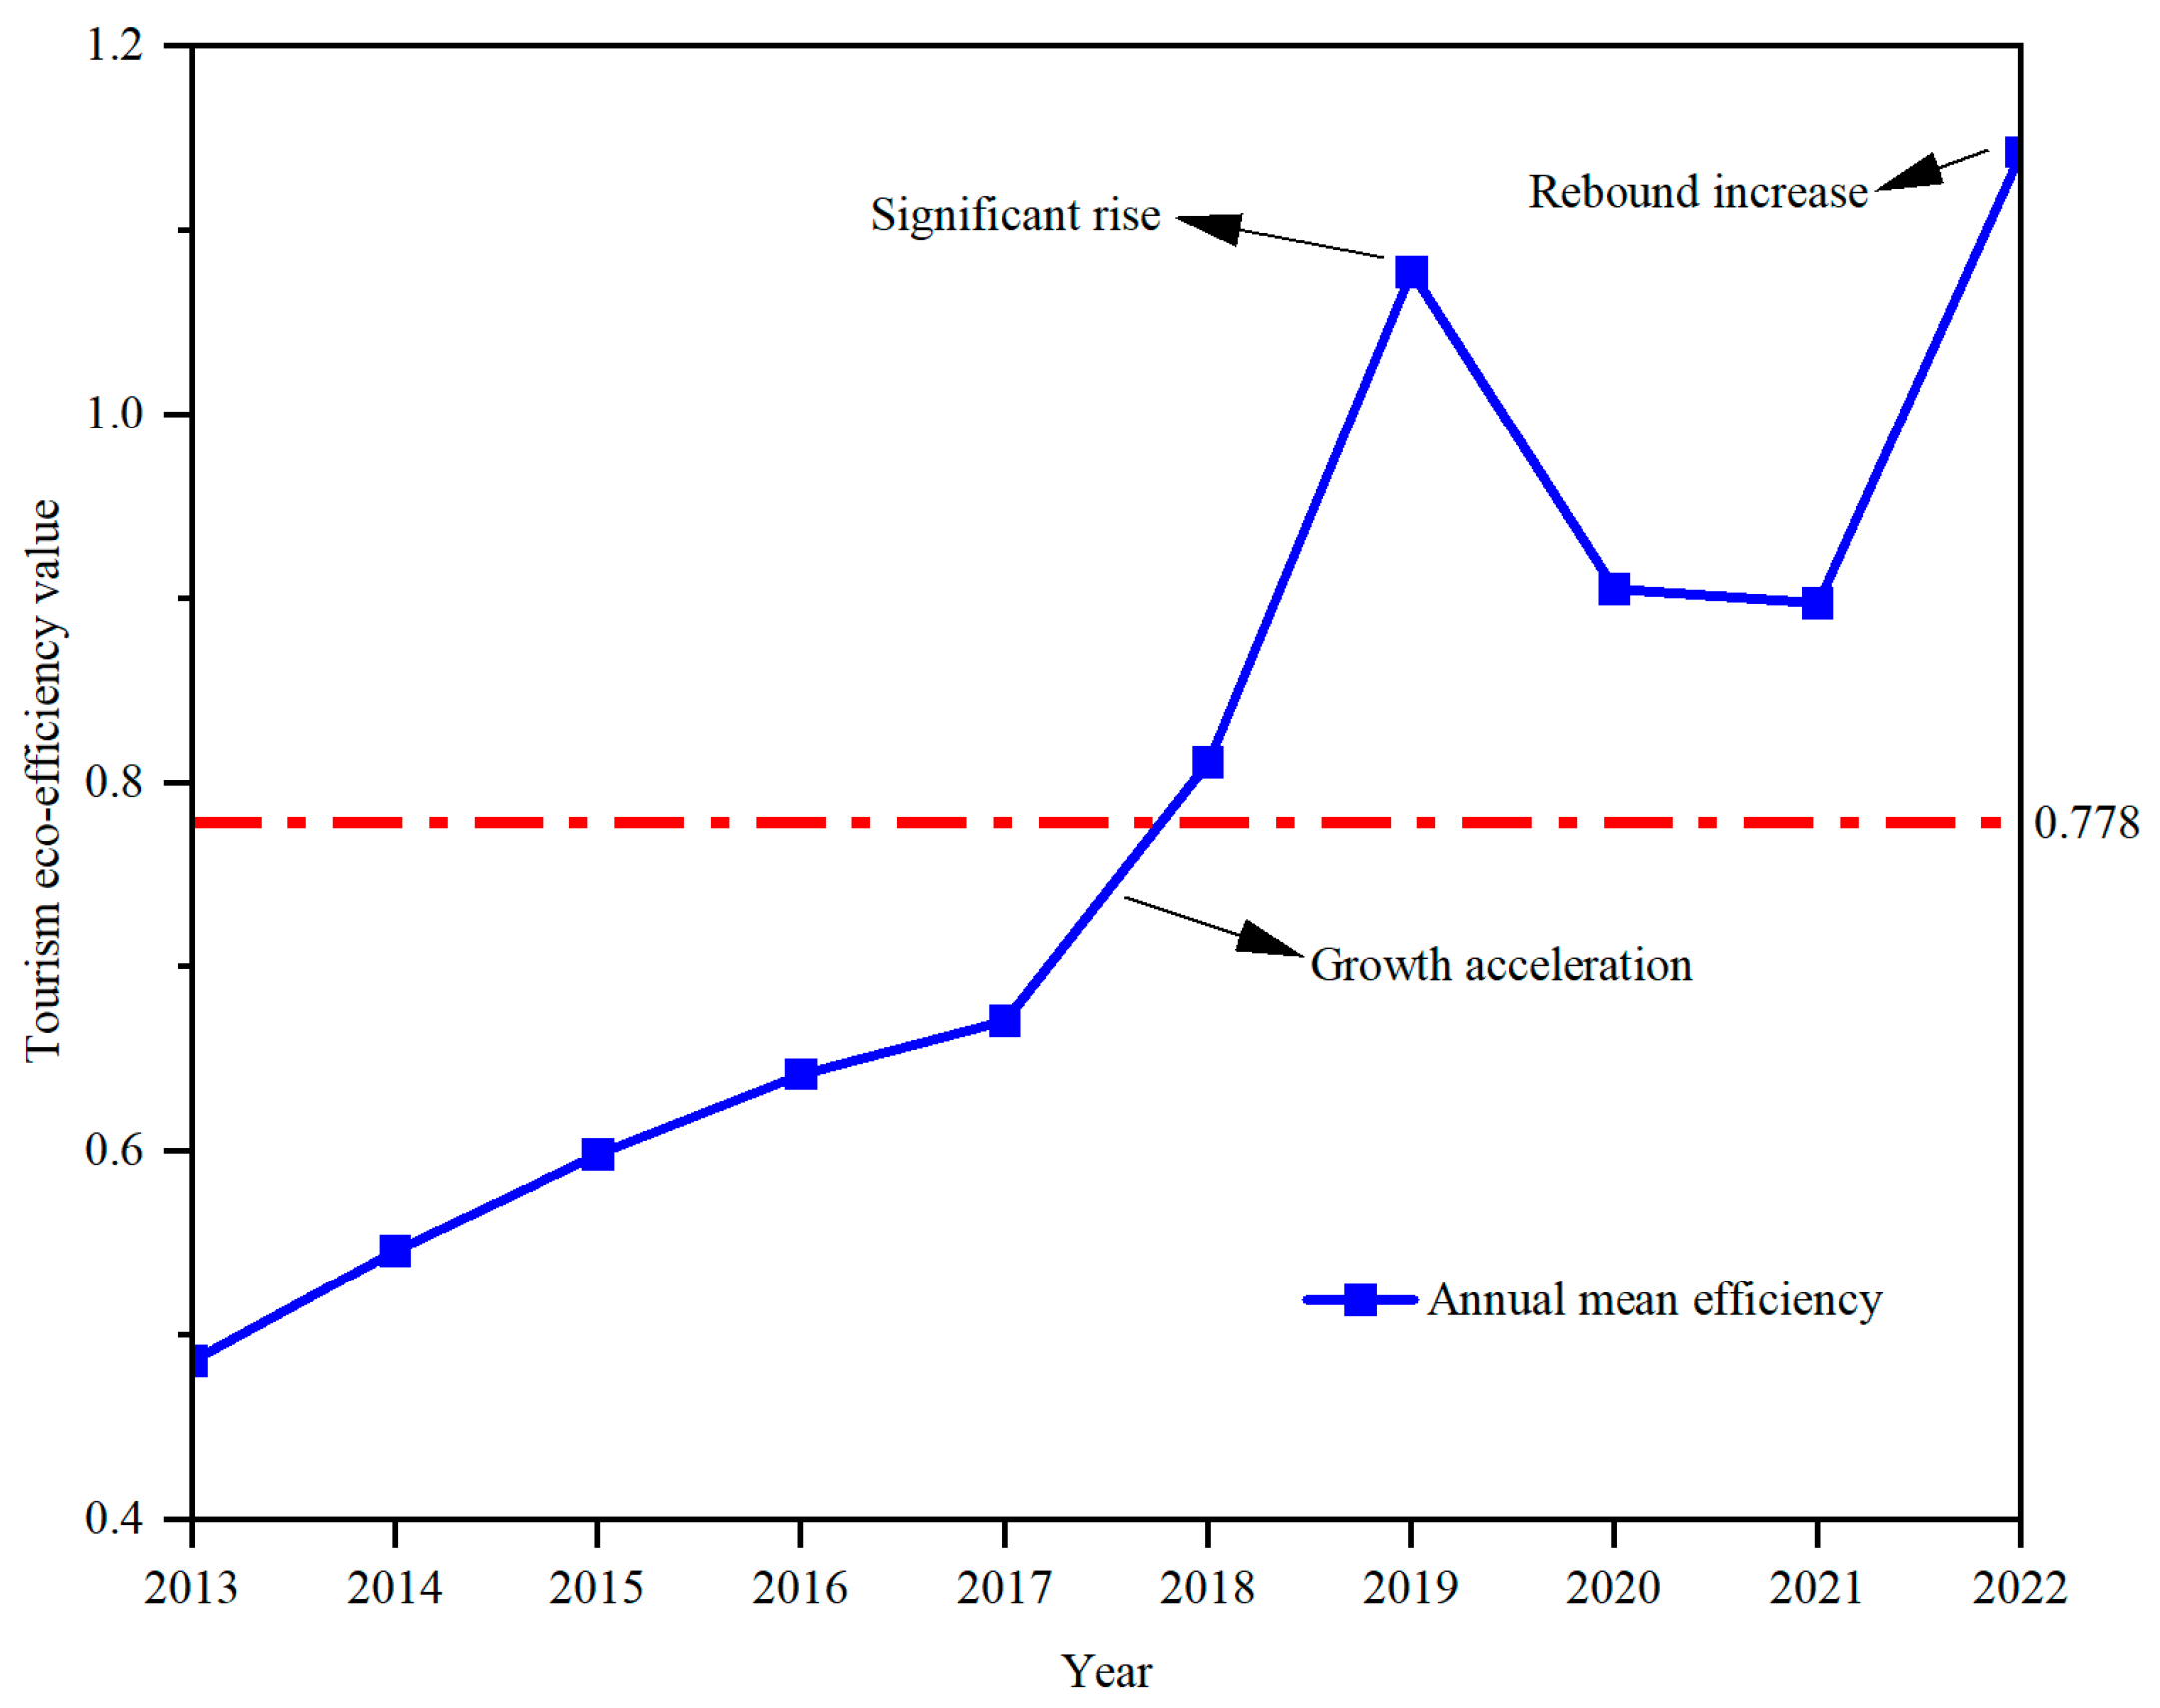
Over 2013–2022, the basin-wide simple mean rose from 0.486 to 1.143 (a 135% increase), with an overall mean of 0.778 (range 0.167–1.274; median 0.957). The year-on-year path shows a steady rise over 2013–2019, a temporary decline in 2020–2021, and recovery in 2022 (Figure 2). The 2019 peak coincides in time with the elevation of Yellow River Basin ecological protection and high-quality development as a national strategy; this concurrence is reported as a plausible contextual explanation rather than as a causal estimate, since the present design cannot identify policy effects. The 2020–2021 decline should be interpreted with particular caution: because tourism revenue and visitor volume enter the model as desirable outputs, the COVID-19 shock reduced these outputs mechanically, so part of the measured decline reflects model construction rather than a pure fall in underlying efficiency. Qinghai illustrates this most clearly: its score jumped from 0.443 in 2018 to 1.193 in 2019, fell to 0.270 in 2020, and recovered to 1.024 in 2022. In 2022, all nine provinces exceeded 1.0; this indicates a relatively rapid return to efficient frontiers under the specified model, but it is not, by itself, evidence of ecological resilience.
Figure 2.
Aggregate evolution trends of mean tourism eco-efficiency, 2013–2022, with cross-province dispersion (mean ± SD) shown as shaded intervals.
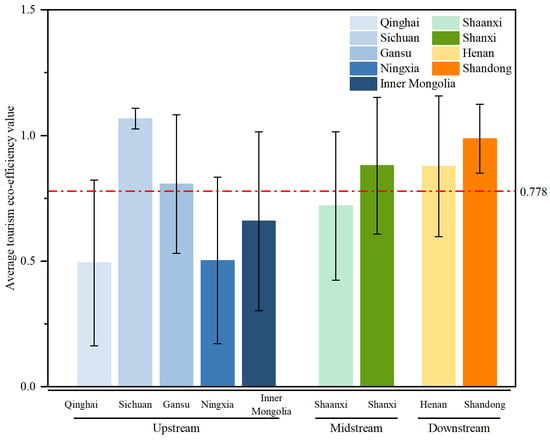
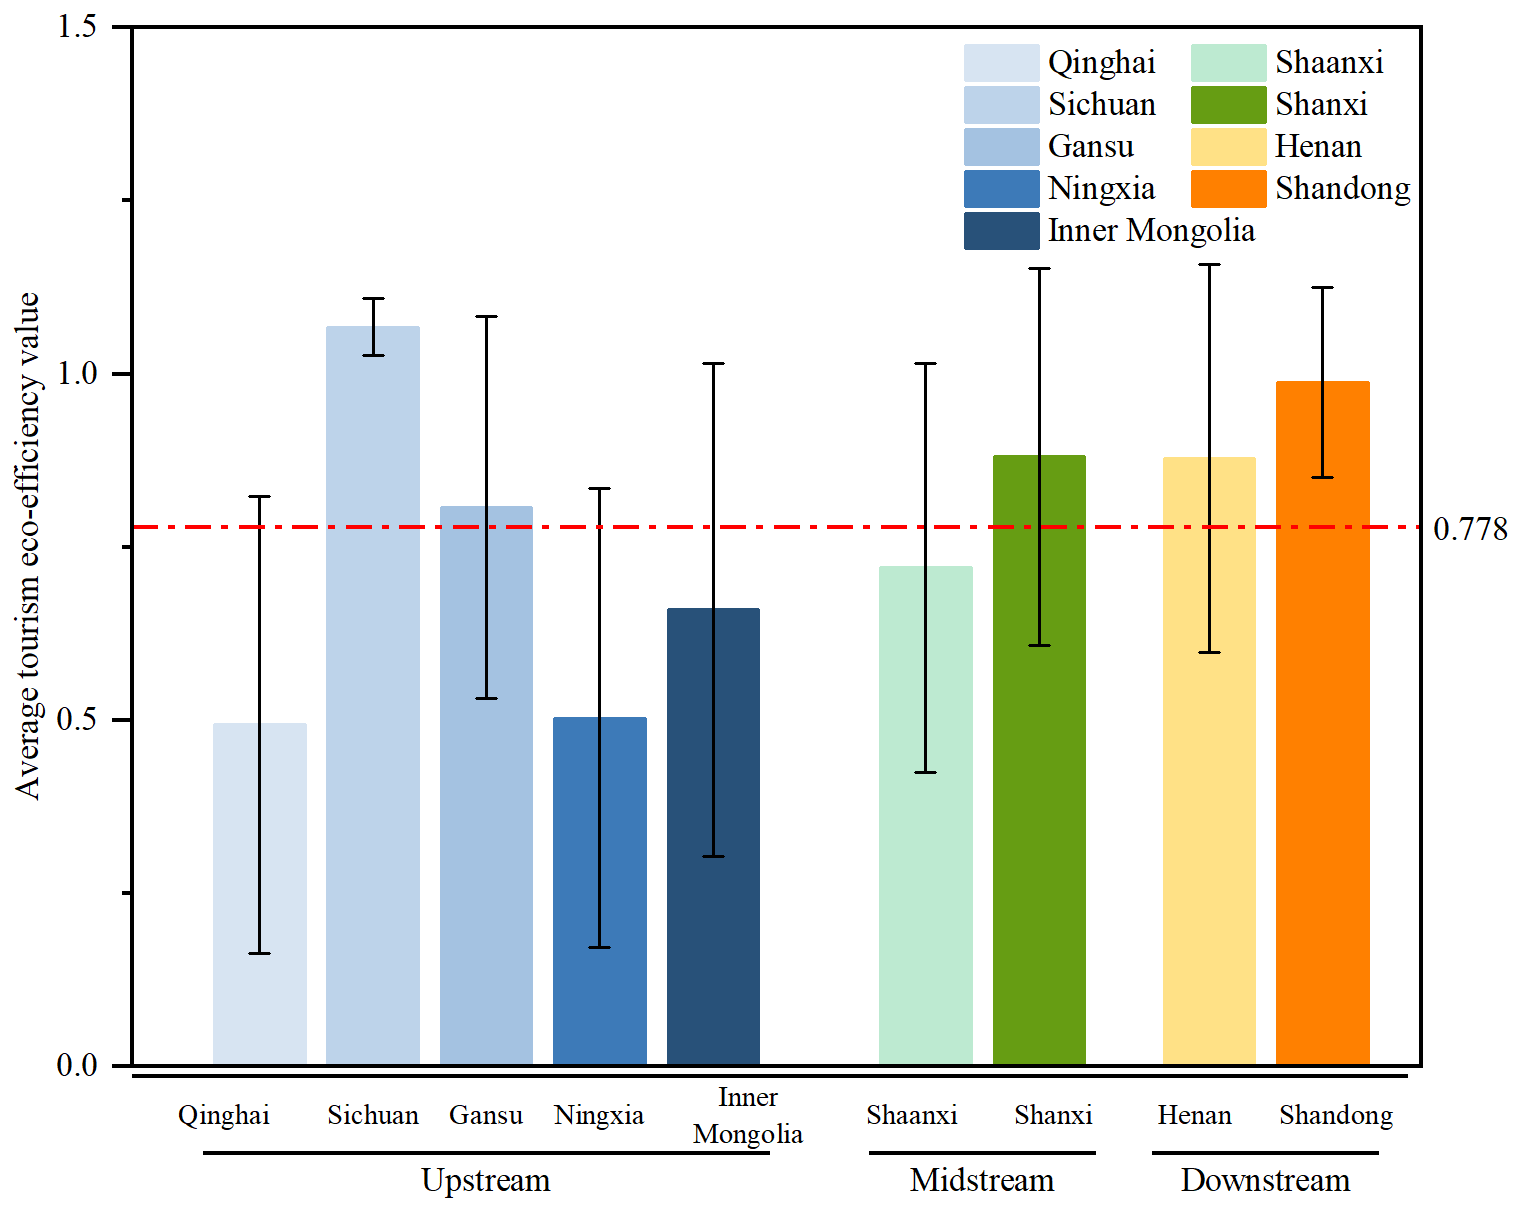
At the provincial level, the pattern is one of lower efficiency in the upper reaches and higher efficiency in the middle and lower reaches (Figure 3). Following the conventional division of the basin [14], the upper reaches comprise Inner Mongolia, Gansu, Qinghai, Sichuan, and Ningxia; the middle reaches comprise Shanxi and Shaanxi; and the lower reaches comprise Shandong and Henan. Sichuan is assigned to the upper reaches because its basin portion lies in the upper reaches; provinces that span more than one basin section are assigned by their dominant basin portion. Sichuan ranked first (mean 1.068), and Qinghai ranked last (mean 0.493).
Figure 3.
Mean tourism eco-efficiency by sub-region, 2013–2022.
GML Index Dynamics and Decomposition
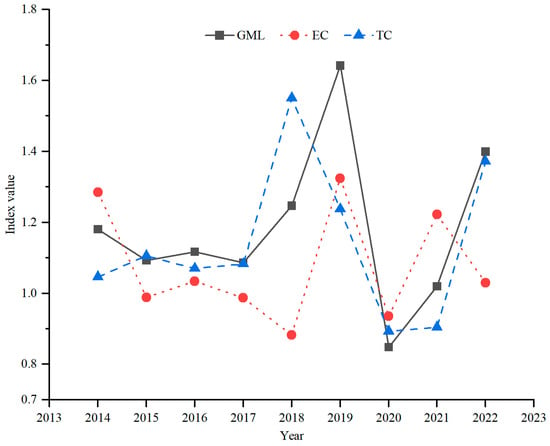
The mean GML index value by sub-region is reported in Table 4. The basin’s mean GML index value was 1.182; except in 2020 (mean 0.848), the annual mean exceeded 1, indicating a net improvement in most years, with the strongest growth in 2019 (1.642). All three sub-regions recorded mean GML index values above 1 (upper: 1.229, middle: 1.148, and lower: 1.097).
Table 4.
Mean GML index value by sub-region and year, 2014–2022.
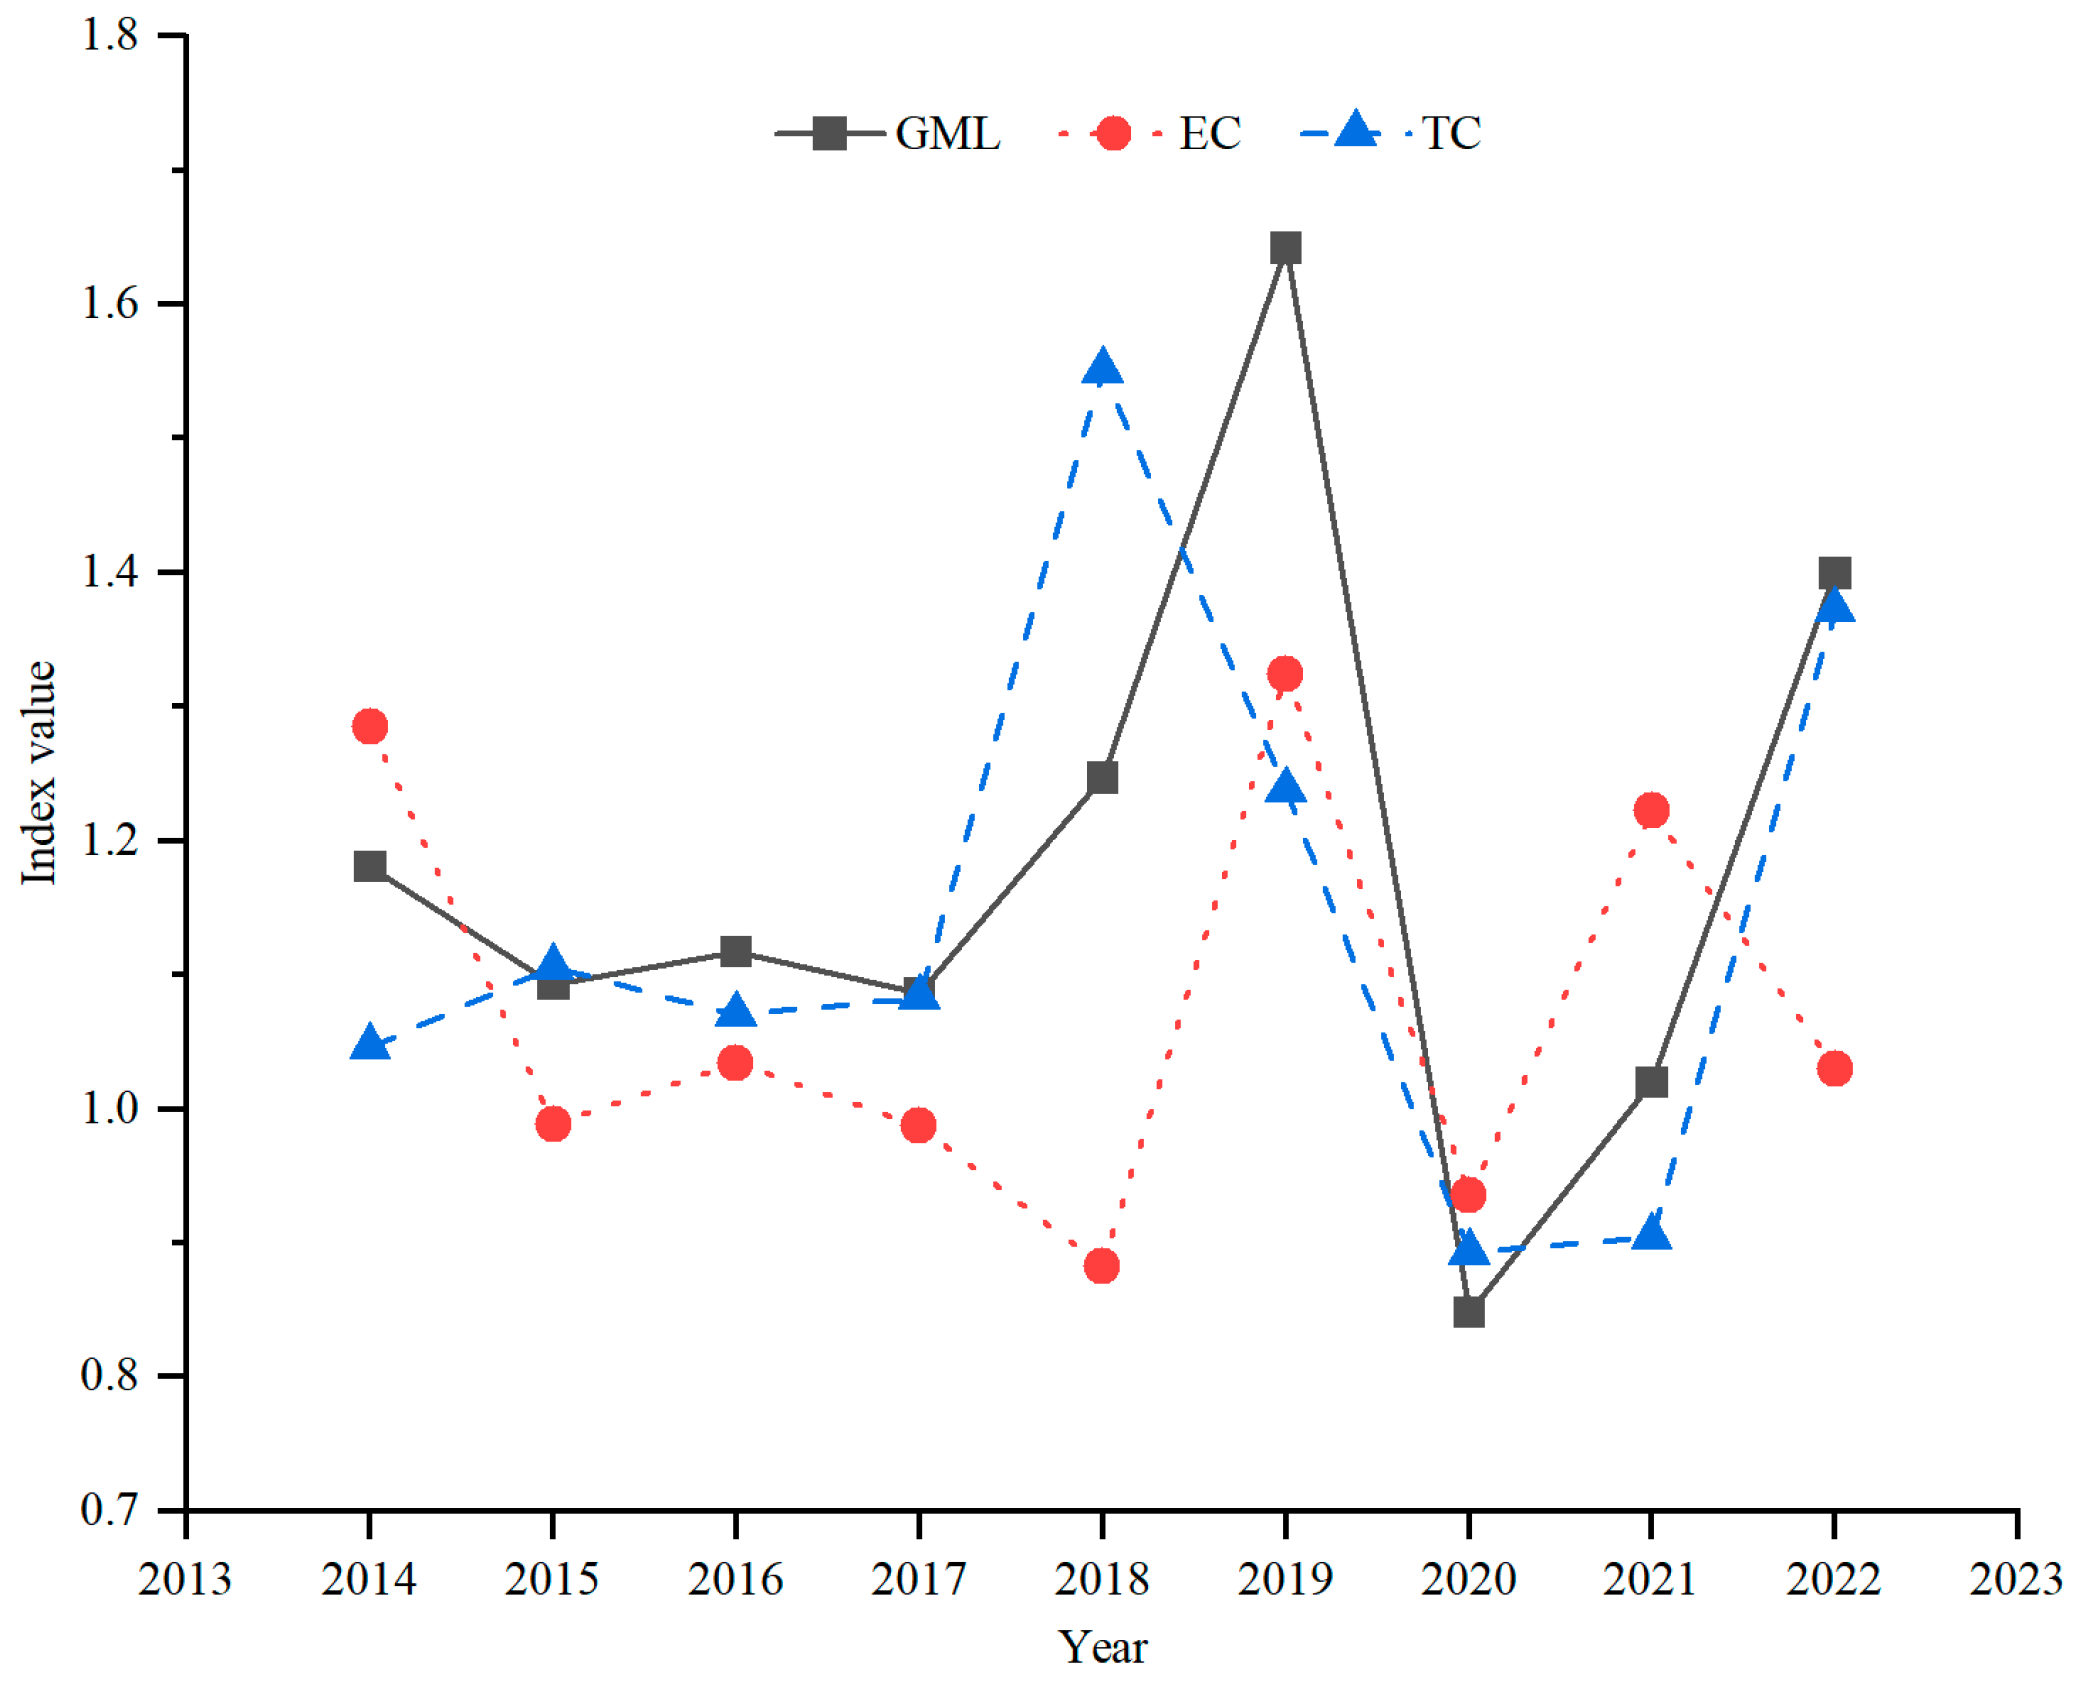
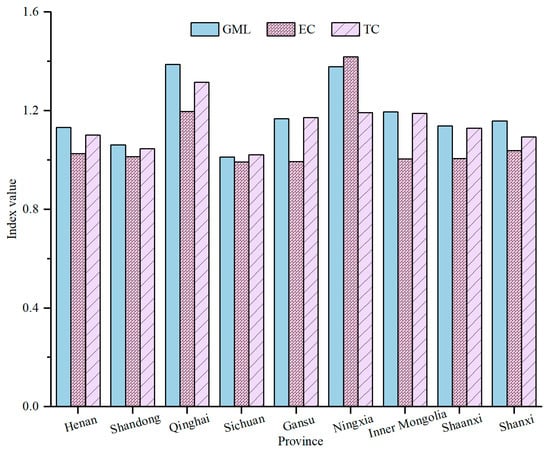
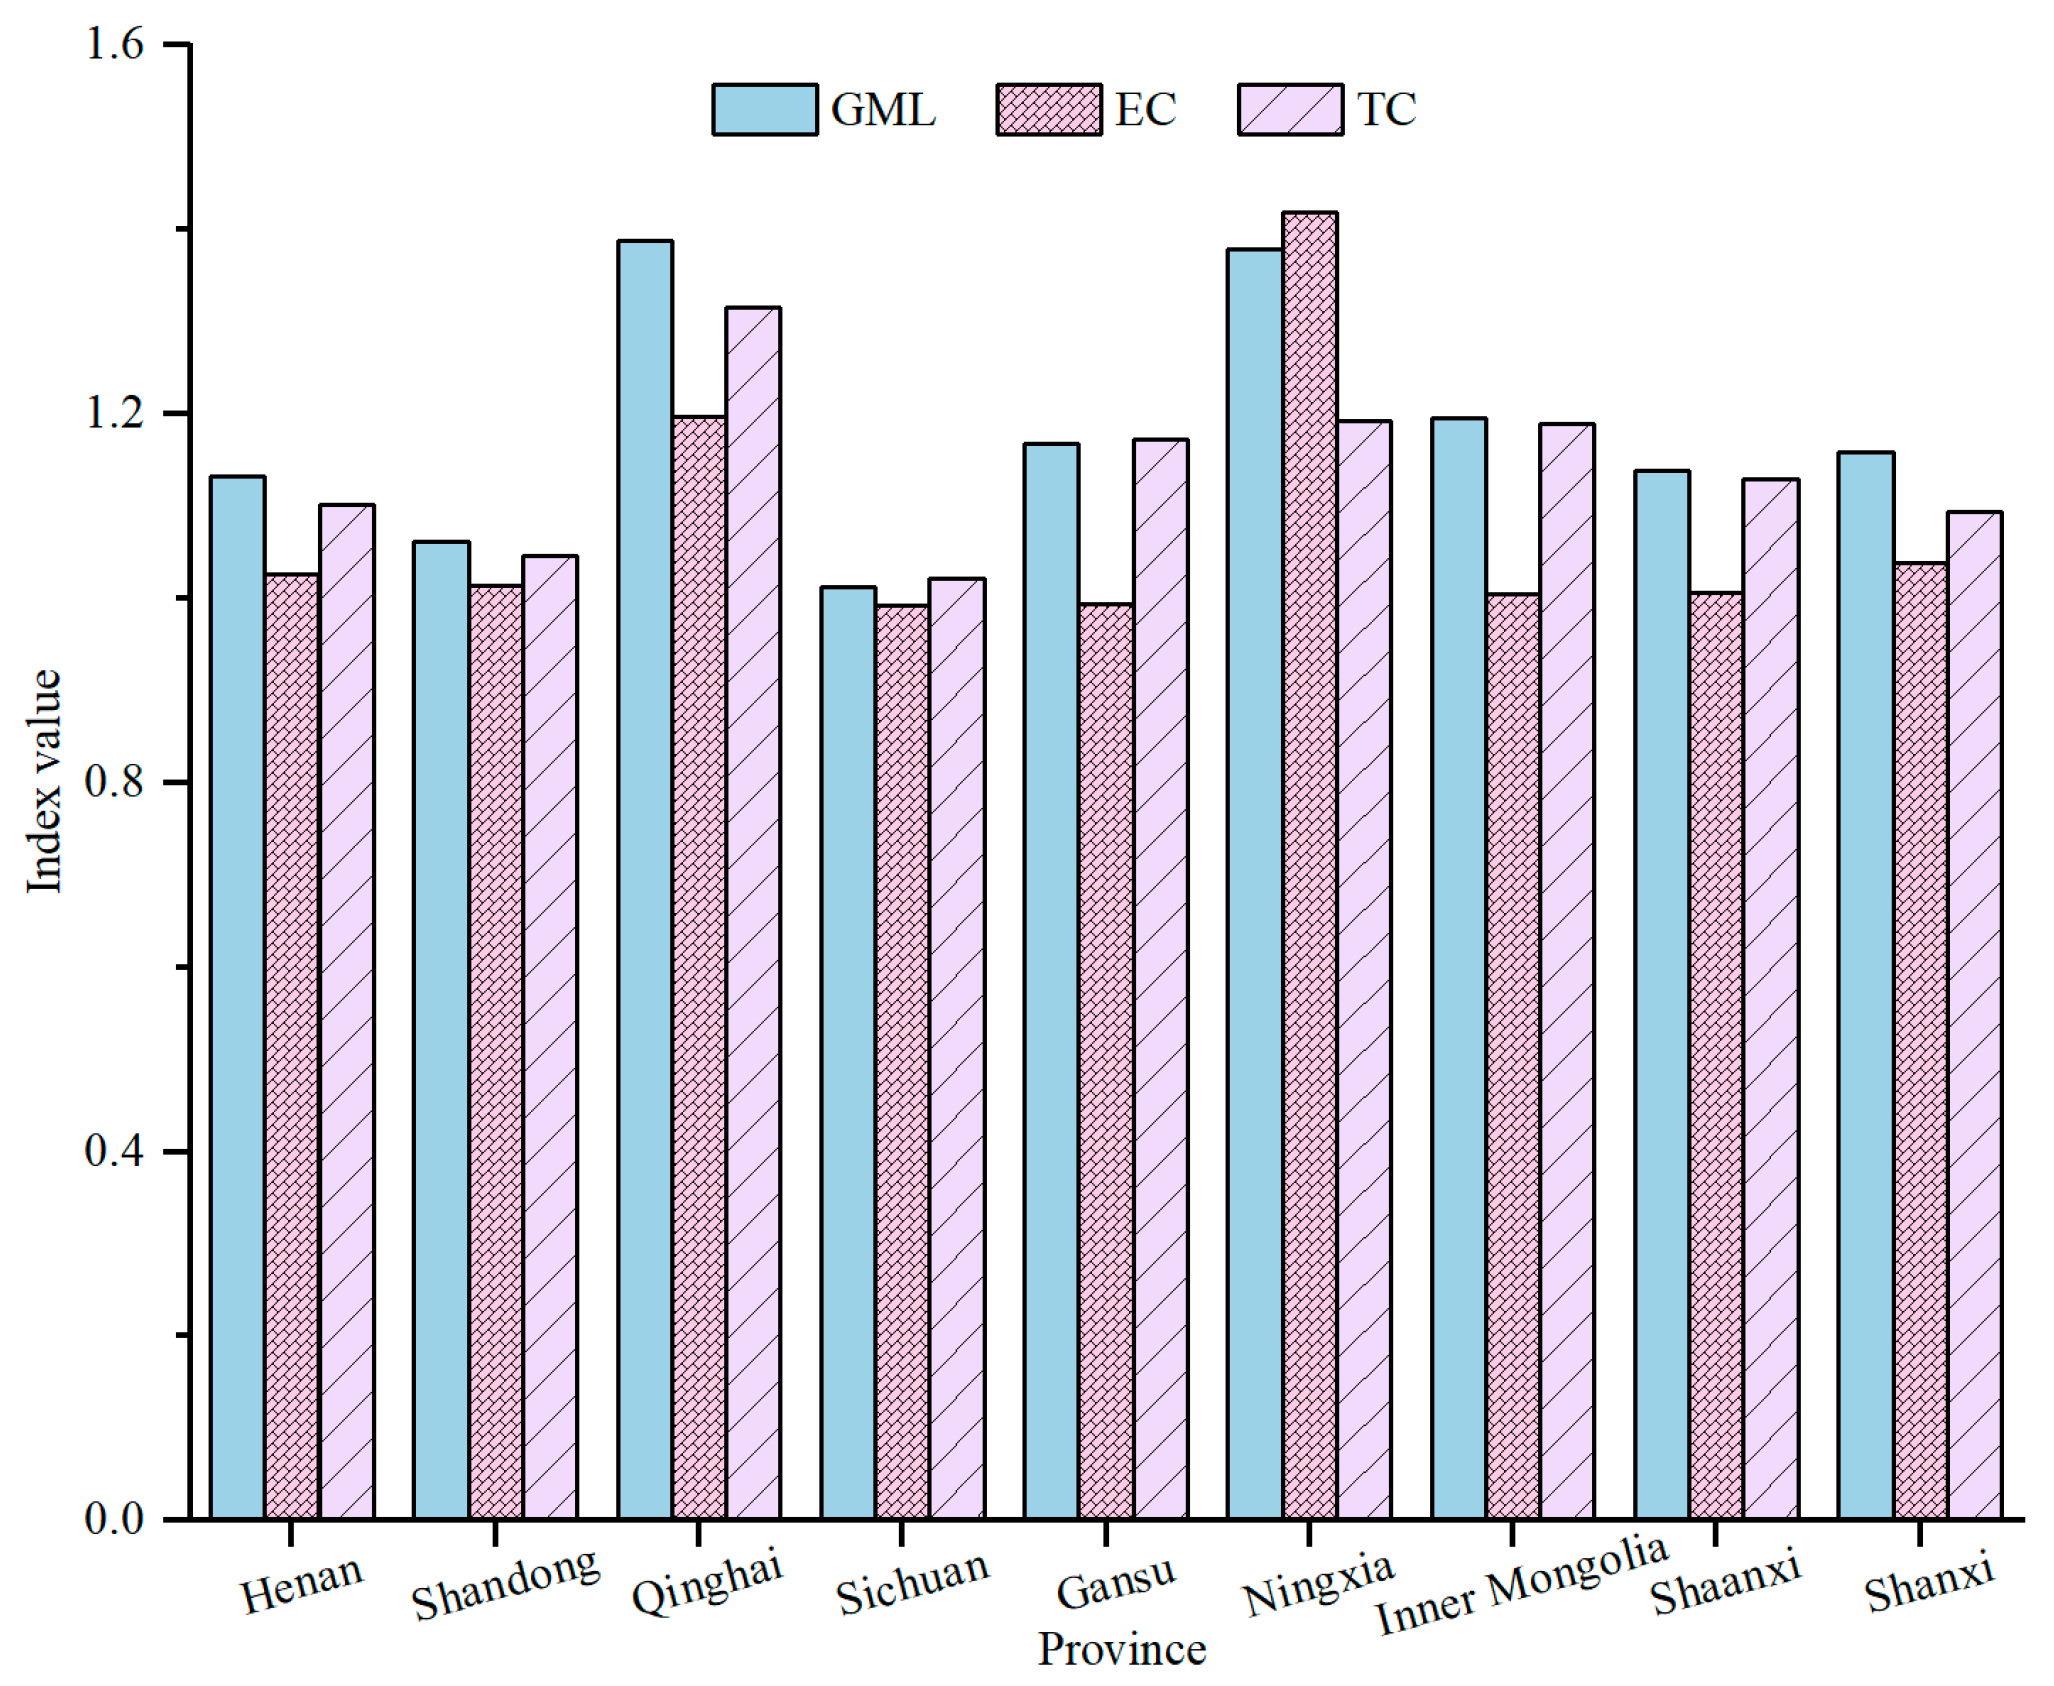
Decomposing the GML index into EC and TC (Figure 4 and Figure 5) shows that mean TC exceeds mean EC over the period, and that the TC series tracks the GML series more closely than EC does. We therefore describe technological (frontier) progress as the dominant proximate source of productivity gain, while noting that this statement rests on comparing the two sample means and is corroborated by the province-level classification: most provinces are technology-driven (TC > EC), whereas Ningxia is efficiency-driven (EC > TC). The sub-regional pattern—upper reaches improving fastest from a lower base—is consistent with conditional catch-up, but the explanations offered (resource endowments, product differentiation, and policy support) are contextual and should not be read as causal.
Figure 4.
Basin-wide GML, EC, and TC indices, 2014–2022.
Figure 5.
Province-level decomposition of GML into EC and TC.
3.2. Spatial Evolution
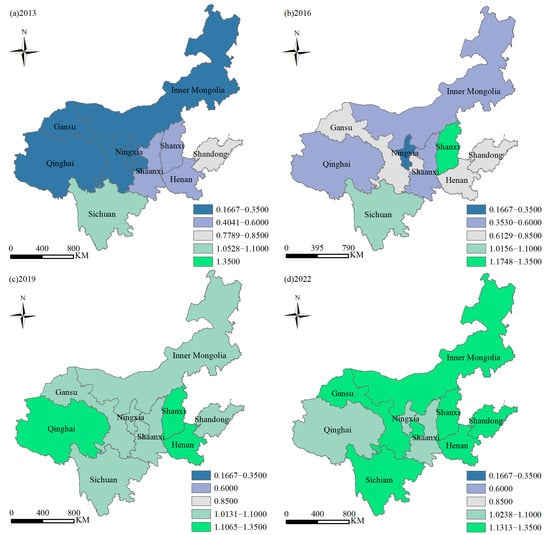
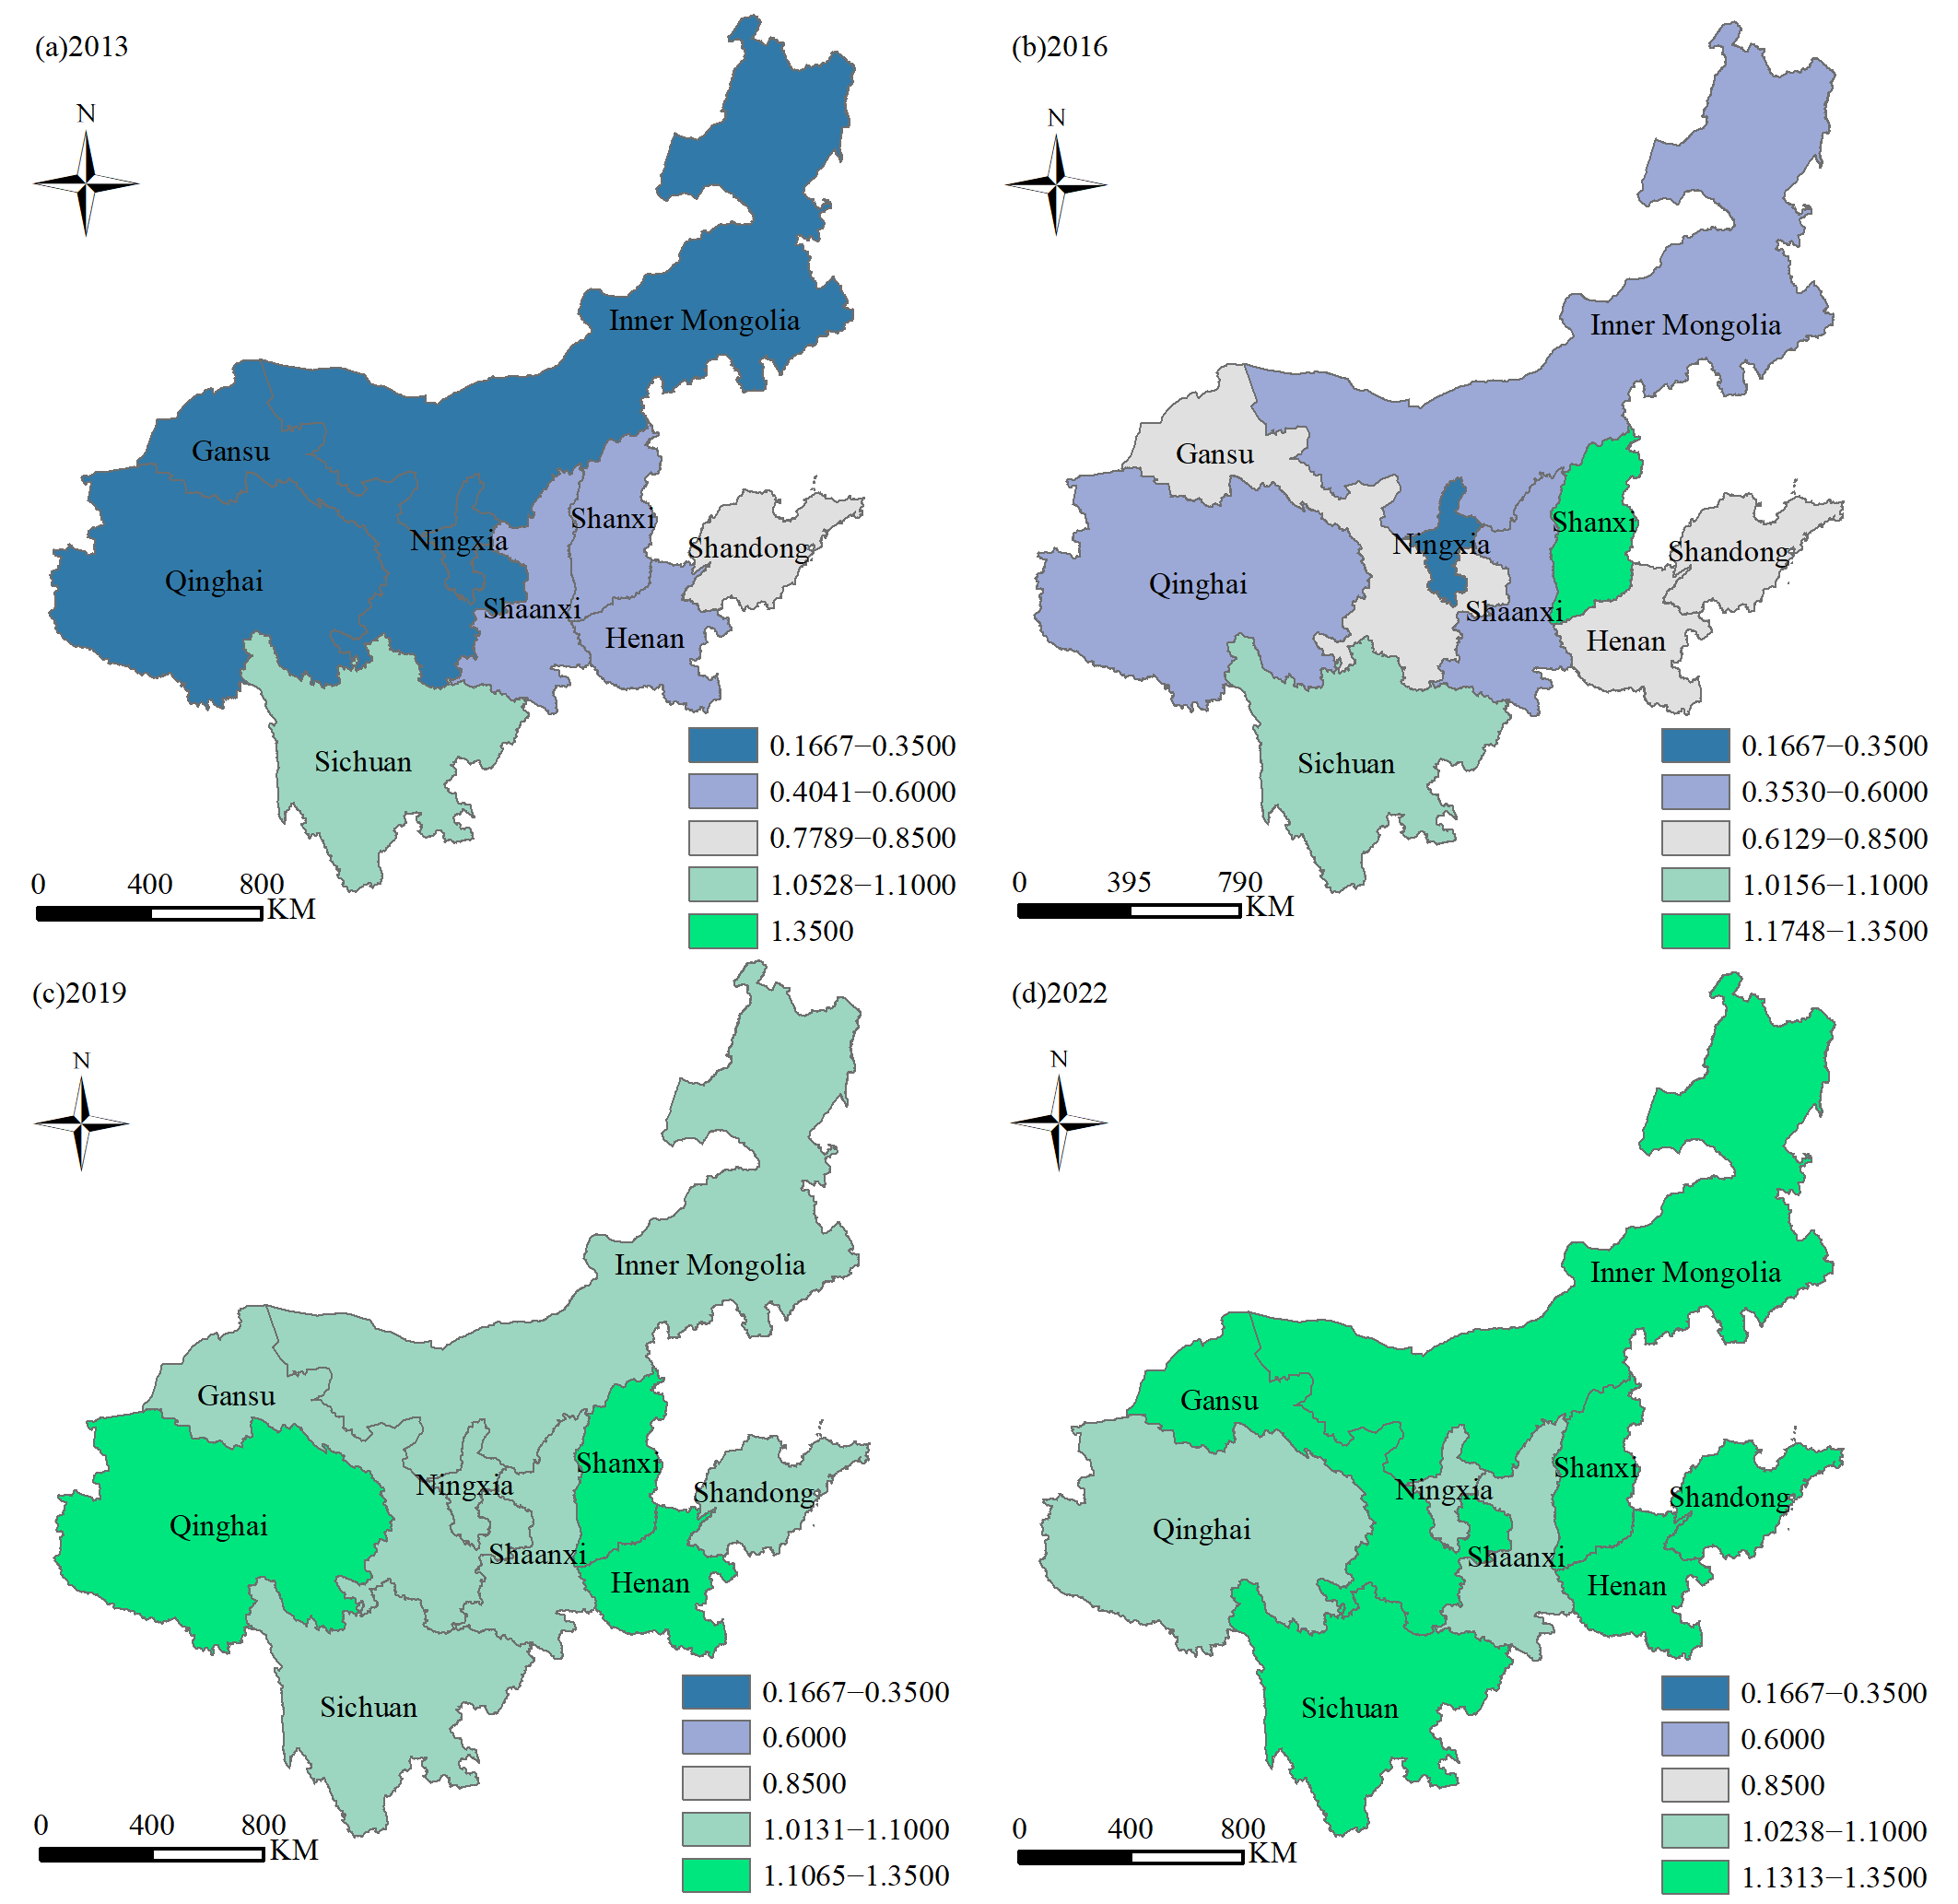
Spatial distributions are mapped at four snapshot years—2013, 2016, 2019, and 2022 (Figure 6). To ensure temporal comparability, fixed efficiency intervals were applied to all four snapshots rather than recalculating Jenks breaks separately for each year: low (0–<0.35), relatively low (0.35–<0.6), medium (0.6–<0.85), relatively high (0.85–<1.1), and high (1.1–<1.35). With only nine spatial units, cluster expansion or contraction is described descriptively rather than as a formal test.
Figure 6.
Spatial distribution of tourism eco-efficiency in 2013, 2016, 2019, and 2022, with the scale bar, north arrow, legend, projected CRS, and data source.
Between the 2013 and 2019 and 2022 snapshots, higher-efficiency provinces expanded: in 2013, only Sichuan was relatively high-efficiency, whereas by 2019 and 2022, all nine provinces had reached at least the relatively high-efficiency class in those two snapshots. The apparent disappearance of low-efficiency areas is therefore a feature of the selected snapshot years: it should not be read as a smooth monotonic improvement, because Qinghai fell back to 0.270 in 2020 and 0.359 in 2021 (years not shown in the four-panel map). “Hotspots” and “coordinated coverage” are not asserted here in the absence of a formal local cluster test.
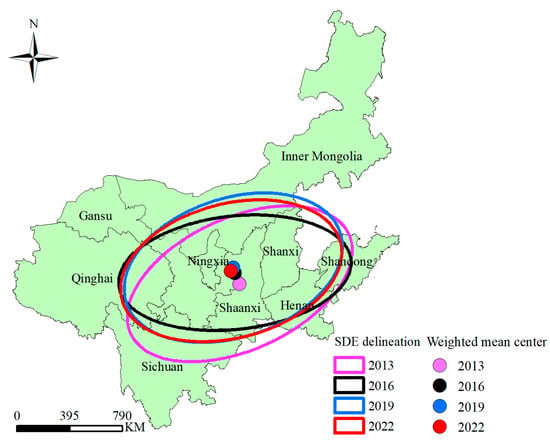
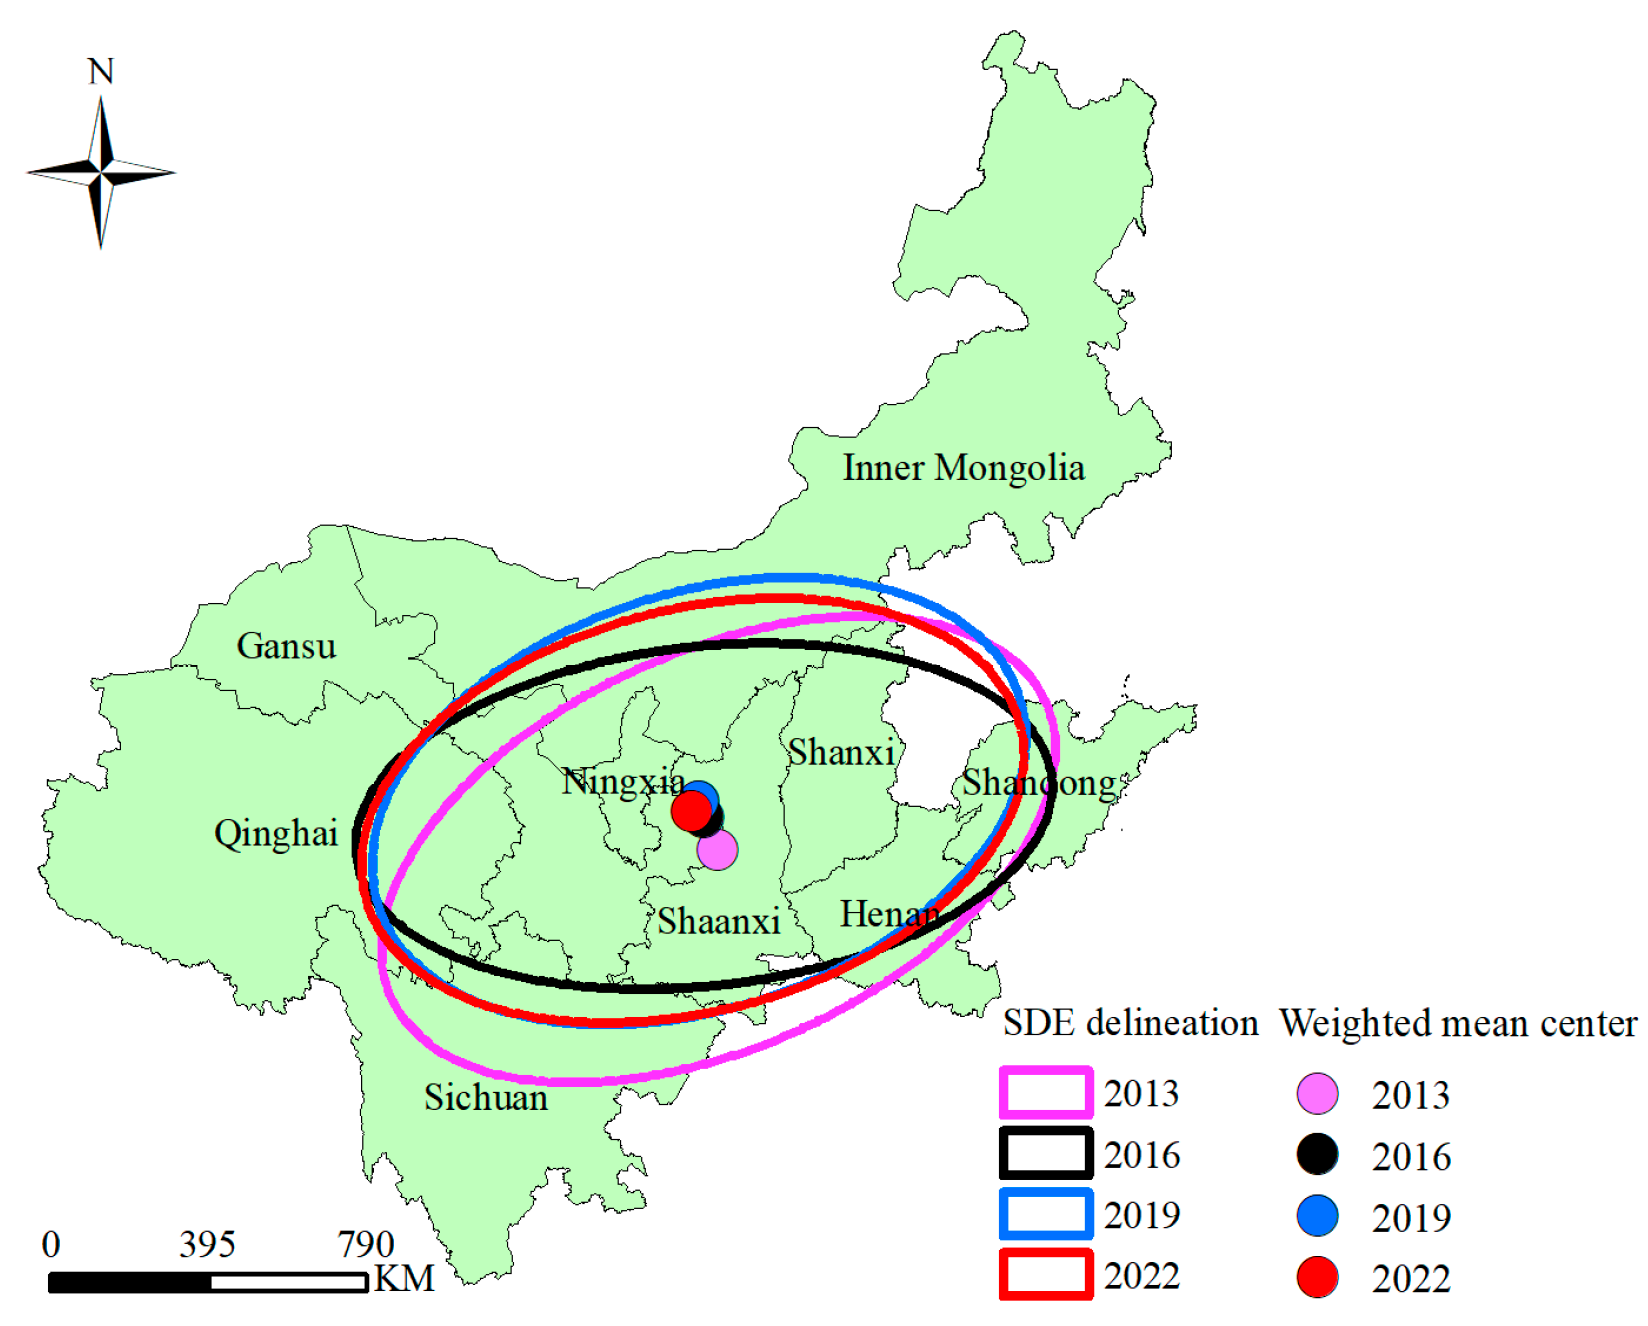
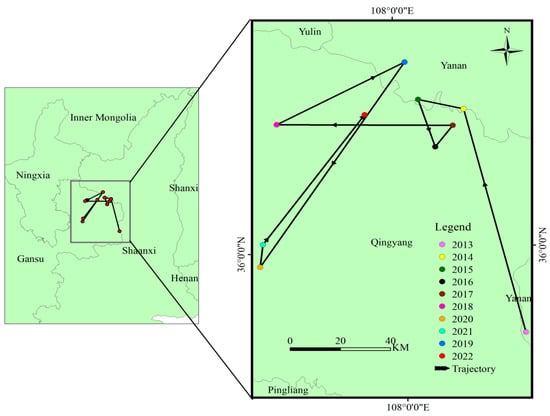
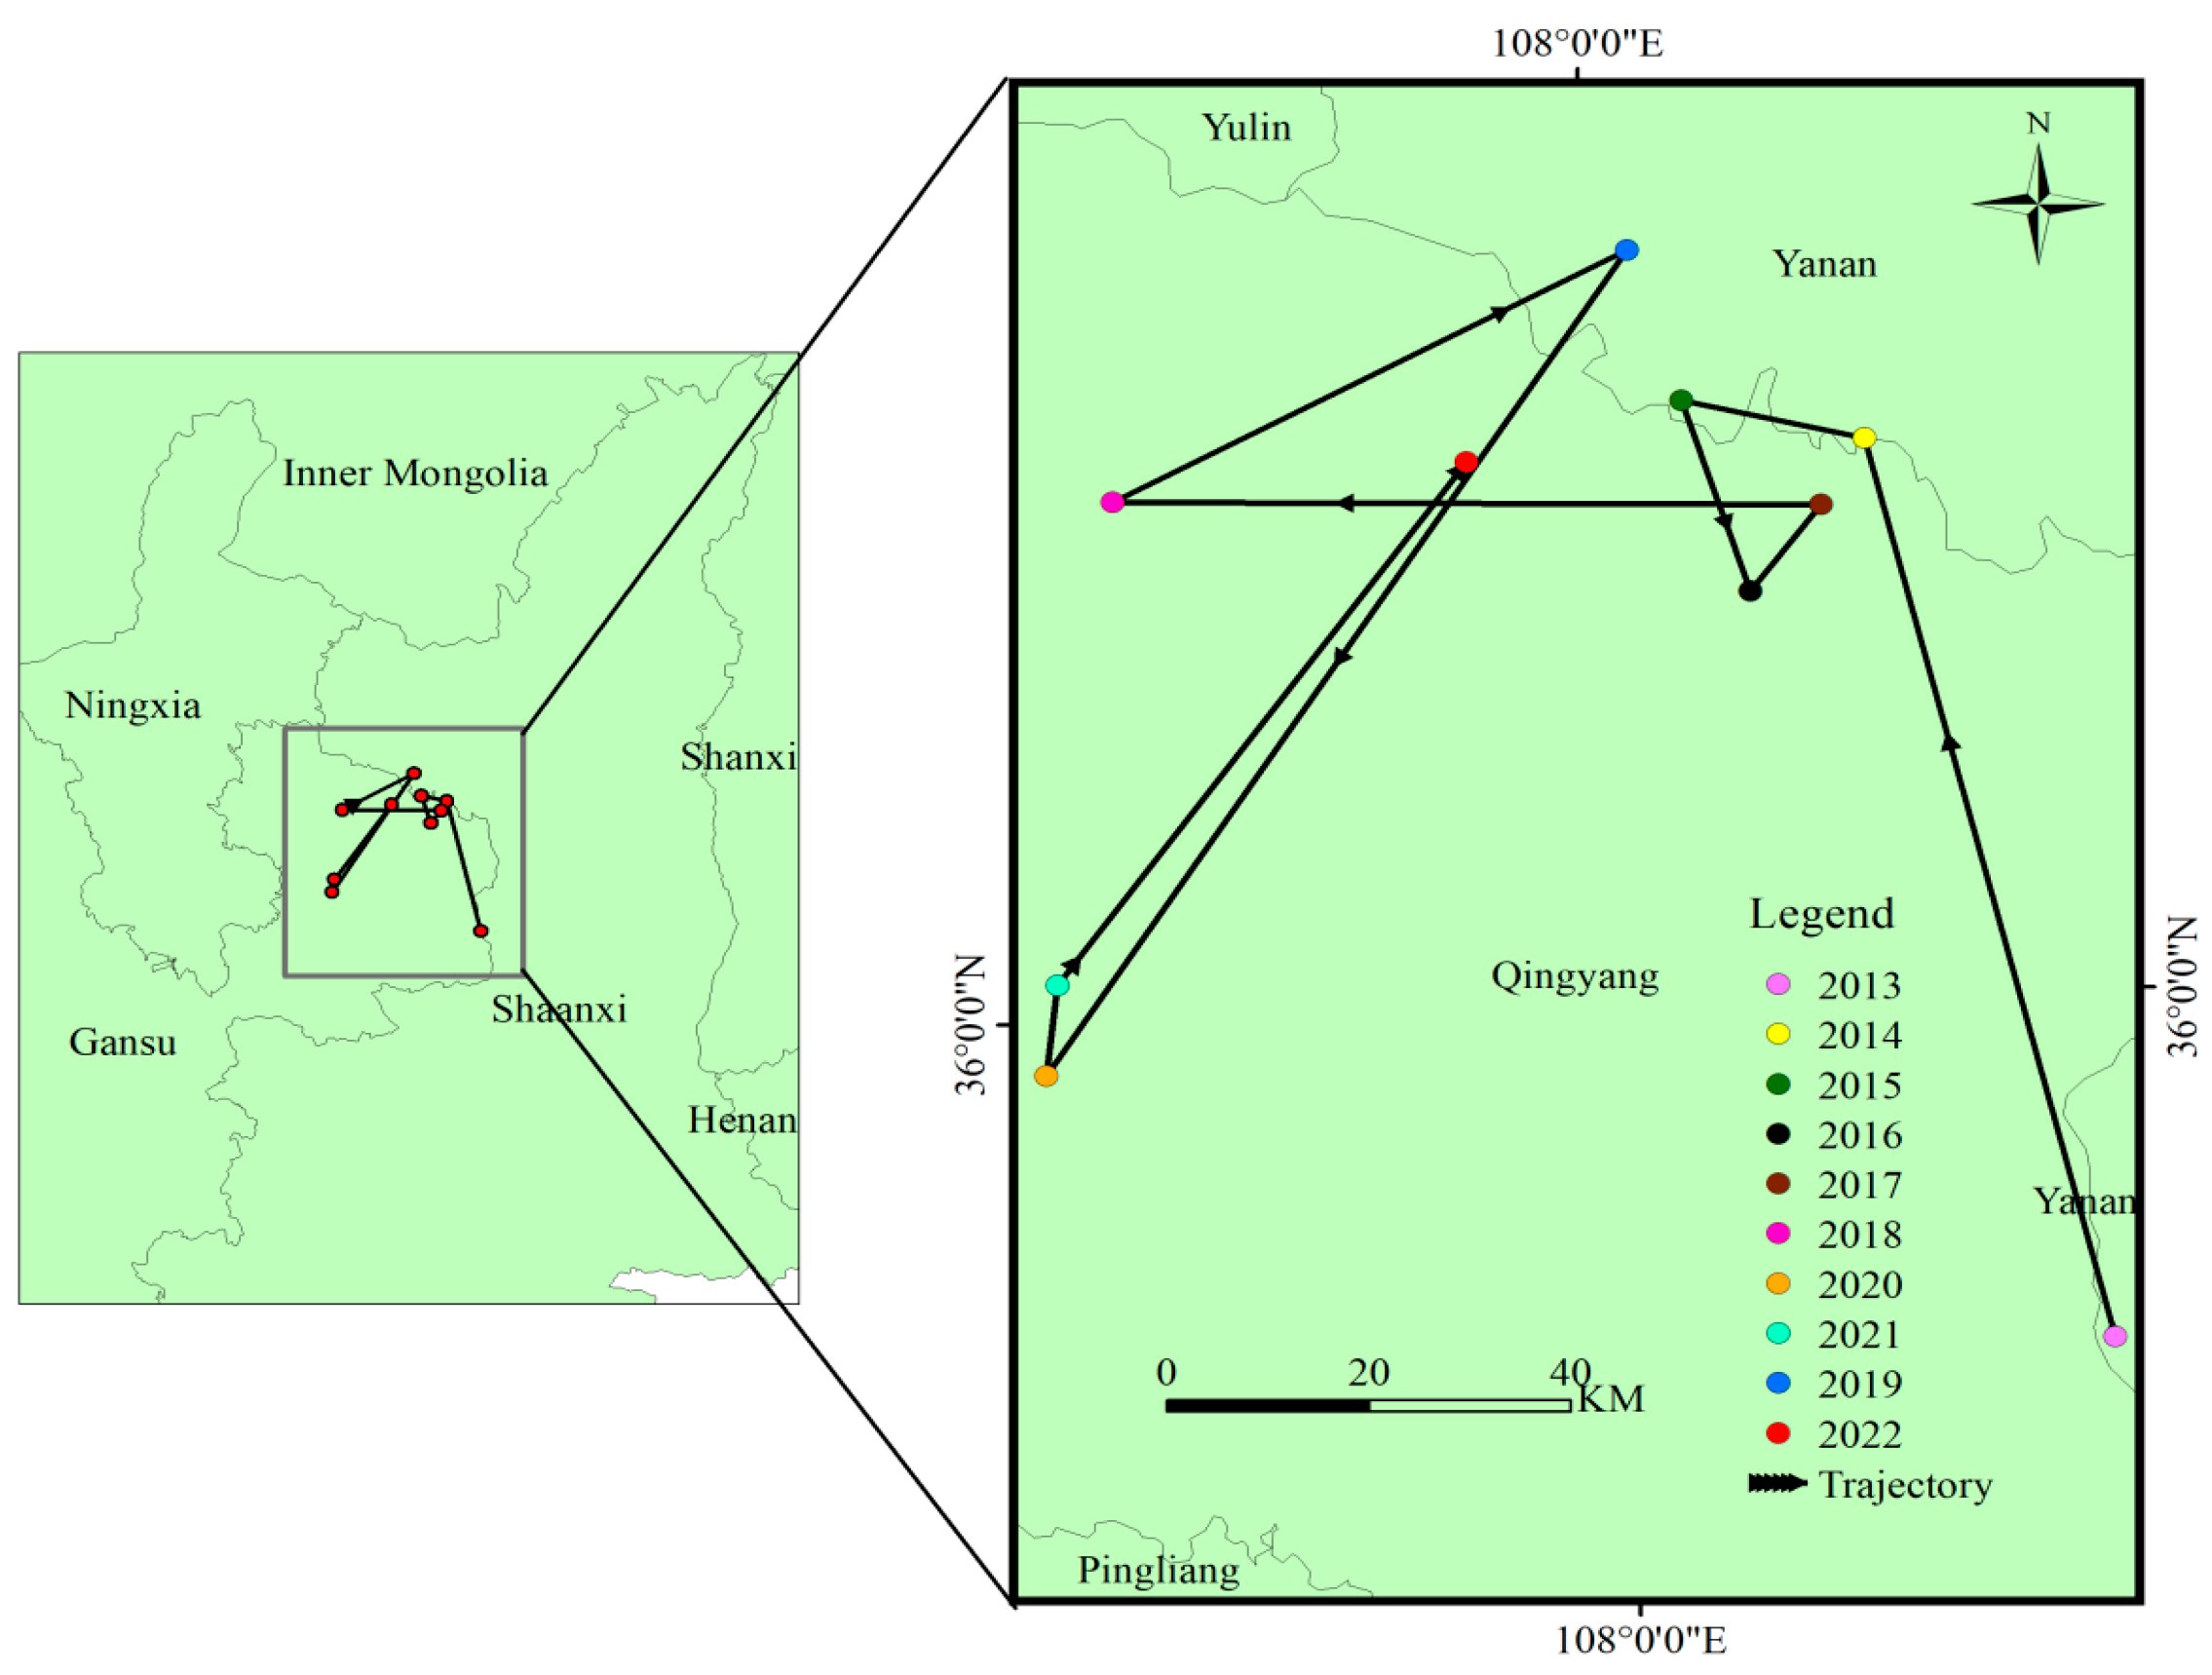
The SDE (Figure 7) was consistently oriented east–west: the semi-major axis fluctuated between 814.35 and 917.19 km and shortened by 49.22 km over the period, while the semi-minor axis lengthened by 6.53 km, indicating a slight reduction in east–west directional imbalance. The centroid lay mainly on the border between Yan’an (Shaanxi) and Qingyang (Gansu) and moved southeast to northwest with a total displacement of only a few tens of kilometers, i.e., a small movement relative to the basin length of about 5464 km.
Figure 7.
Standard deviation ellipse, 2013–2022.
3.3. Influencing Factors
3.3.1. Factor Selection
Six factors were selected along six dimensions (Table 5): economic development (per capita GDP), forest resource endowment (forest cover), transportation accessibility (classified highway mileage, i.e., the stock of expressway, first- and second-class highways in 104 km), market scale (tourism revenue as a share of GDP), human resources (employee density = staff per hm2 of forest-park area), and resource concentration (forest-park density = forest-park area per km2 of regional area). We note that employee density and park density may capture scale or land-use conditions rather than human-capital quality or resource concentration per se, and that tourism revenue share is mechanically related to the revenue used as a desirable output (Figure 8); both issues are addressed in Section 3.3.3 and Section 4.
Figure 8.
Migration trajectory of the eco-efficiency centroid.
Table 5.
Influencing factors, definitions, and units.
3.3.2. Tobit Regression Results
Table 6 reports the estimates from the random-effects panel Tobit model estimated in Stata 18.0 to examine the statistical associations between provincial tourism eco-efficiency and the explanatory variables. The analysis comprises 90 observations from nine provinces over the period 2013–2022. The super-SBM efficiency scores range from 0.167 to 1.274 and are not censored at a known threshold. Accordingly, the Tobit specification is treated as an empirical modeling choice rather than a model required by censoring, and the clustering of scores near the efficiency frontier alone does not establish its suitability. The estimated coefficients are therefore interpreted as conditional statistical associations rather than causal effects. Given the limited number of provincial units, the statistical significance of the estimates should also be interpreted cautiously.
Table 6.
Panel Tobit results (dependent variable: super-SBM eco-efficiency). Robust/province-clustered standard errors are in parentheses.
Per capita GDP is positively associated with tourism eco-efficiency at the 1% significance level. This association may reflect the greater fiscal capacity of wealthier provinces to invest in green infrastructure and management, as well as potentially stronger demand for higher-quality ecotourism. However, the observational nature of the analysis does not establish that higher per capita GDP directly causes improvements in eco-efficiency.
Classified highway mileage is positively associated with eco-efficiency at the 10% significance level (p = 0.069). This result is consistent with the possibility that improved transport accessibility is associated with better tourism performance, but the evidence is weaker than that for per capita GDP. The finding should therefore be regarded as suggestive rather than conclusive.
The coefficient for tourism revenue share is positive and statistically significant in Table 6. However, this result requires particular caution because tourism revenue share is mechanically related to tourism revenue, which is included as a desirable output in the super-SBM model, and also enters the allocation formula for undesirable outputs in Equation (8). Its estimated association may therefore partly reflect the construction of the dependent variable rather than an independent economic relationship. For this reason, the coefficient is treated as supplementary evidence and is not used as a primary basis for drawing conclusions about the determinants of tourism eco-efficiency. It should be interpreted as an association under the current specification, not as evidence of an independent or causal effect.
Forest-park density is negatively associated with eco-efficiency at the 5% significance level. One possible interpretation is that a higher concentration of forest parks may be associated with congestion or greater pressure on local resources. Nevertheless, this association may also reflect differences in provincial characteristics, land-use regulation, or scale effects. The result therefore does not establish that a higher forest-park density necessarily reduces eco-efficiency.
Forest cover rate and employee density are not statistically significant in the estimated model. These results do not demonstrate that the two factors are unrelated to tourism eco-efficiency; rather, their associations cannot be established clearly from the present sample. The short provincial panel and the limited number of provincial units further warrant caution when interpreting the absence of statistical significance.
Overall, the regression results provide exploratory evidence of statistical associations between selected provincial characteristics and tourism eco-efficiency. However, the lack of a known censoring threshold for the dependent variable, the limited number of provincial units, and the potential mechanical relationship between tourism revenue share and the construction of the efficiency measure constrain the interpretation of the estimates. The findings should therefore be understood as observational evidence rather than definitive evidence of causal determinants. Comparing alternative panel estimators would be a useful direction for further validation.
3.3.3. Robustness Checks
To assess sensitivity, we re-estimated the determinants under: (i) random-effects GLS and pooled OLS as alternative estimators to the Tobit; (ii) one-year lagged regressors to mitigate reverse causality; (iii) exclusion of 2020–2021 to remove the exceptional COVID-19 shock; (iv) exclusion of interpolated observations; (v) alternative undesirable-output scenarios (dropping the proxy undesirable outputs and using a single environmental indicator); and (vi) leave-one-province-out re-estimation. VIF values and a correlation matrix indicate no severe multicollinearity (all VIF < 10). Across these checks, the signs and significance of per capita GDP, tourism revenue share, and forest-park density are stable; the highway-mileage coefficient remains positive but imprecisely estimated.
4. Discussion
4.1. Temporal Evolution and the Role of Technological Progress
The fluctuating upward trend during 2013–2022 is broadly consistent with previous basin studies [10,14]. We separate the empirical finding (mean of 0.778, rising to 1.077 in 2019 and 1.143 in 2022) from plausible explanations. The concurrence of the 2019 peak with the elevation of the basin strategy is temporal, not causal; no difference-in-differences or interrupted time-series design is used. The 2020–2021 decline is partly a mechanical consequence of the model, because revenue and visitors are the very outputs that the pandemic suppressed. The GML decomposition—TC exceeding EC—is consistent with Lin et al. [17] for northeast China and with Zhang et al. [20] for less-developed regions, and the contrast with efficiency-driven Ningxia fits a stage-of-development interpretation.
4.2. Spatial Heterogeneity
The upper-low, lower-high gradient agrees with [10,14]. The highest GML index value being in the upper reaches despite the region having the lowest static efficiency suggests conditional catch-up, consistent with [11]. The east–west SDE orientation and the small centroid displacement indicate a stable core structure. Importantly, the absence of a low-efficiency class in the 2019 and 2022 snapshots reflects an upward, compressed distribution rather than uniformly high absolute efficiency, and it does not hold in 2020–2021 (Qinghai).
The regression findings should be interpreted in light of the specification of the second-stage model. Although Tobit models have been used in previous DEA-efficiency studies, the super-SBM scores in this study are not censored at a known threshold, so the Tobit specification is not uniquely warranted by censoring. The estimated coefficients therefore indicate conditional associations at the provincial level and should not be interpreted as causal effects. In addition, the analysis covers only nine provincial units over ten years, which limits the strength of statistical inference. Future research using a larger sample should compare random-effects GLS and other suitable panel estimators with Tobit results to assess the sensitivity of these associations.
4.3. Driving Mechanisms
The positive association with economic development agrees with [23,24,25]; the weaker 10% accessibility effect qualifies the strong transport story sometimes reported. The positive market-size coefficient must be weighed against the potential circularity noted above. The non-significance of human resources reinforces that staff counts are a poor proxy for human-capital quality, and the non-significance of forest endowment indicates that abundance alone does not produce efficiency. The negative density association suggests congestion rather than a universal agglomeration benefit.
4.4. Limitations
This study has several limitations that should be considered when interpreting the findings. First, the undesirable outputs were approximated using provincial industrial emissions allocated according to the tourism-revenue/GDP ratio. Although this proxy has been adopted in previous forest-park studies and enables consistent measurement at the provincial level, it cannot fully capture the actual environmental impacts generated by individual forest parks. Consequently, the estimated eco-efficiency values should be interpreted with caution. Future research should incorporate park-level environmental monitoring data or more direct measures of tourism-related emissions when such data become available.
Second, the analysis is conducted at the provincial level, which masks heterogeneity among individual forest parks within the same province. Therefore, the findings should be interpreted as applying to aggregated provincial forest-park systems rather than to individual parks.
Third, tourism revenue share is mechanically related to both the desirable output (tourism revenue) and the allocation rule for undesirable outputs. Consequently, its estimated regression coefficient may partially reflect model construction rather than an independent economic relationship and should therefore be interpreted with particular caution.
Fourth, only nine provincial decision-making units (DMUs) are available for each year. Although the pooled frontier improves discrimination in the static super-SBM analysis, the relatively small number of DMUs may still reduce the discriminatory power of DEA, particularly in intertemporal productivity measurement.
Fifth, carbon sequestration was approximated from forest growing stock, which may introduce measurement uncertainty, while linear interpolation for missing observations and the disruption caused by the COVID-19 pandemic may also influence the estimated temporal trends.
Finally, the regression analysis has several methodological limitations. First, although a random-effects panel Tobit model was estimated, the super-SBM efficiency scores are not strictly censored at a known threshold, and the choice of the Tobit specification therefore requires further validation. Second, the analysis is based on only nine provincial-level units. Although the panel covers ten years, the small number of provincial clusters may limit the reliability of conventional cluster-robust statistical inference. Third, the potential mechanical relationship between tourism revenue share and the construction of the efficiency measure may affect the interpretation of its coefficient. These limitations mean that the regression findings should be regarded as exploratory evidence of provincial-level statistical associations rather than conclusive evidence of causal effects. Future research could assess the robustness of these findings using alternative regression specifications and more disaggregated data.
Future research should construct park-level panel datasets, directly measure tourism-related environmental pressures (e.g., energy consumption, water use, waste generation, and transport emissions per visitor), incorporate mobility and carrying-capacity indicators, examine spatial spillover effects, and employ alternative econometric specifications and quasi-experimental designs to further validate the present findings.
5. Conclusions
This study assessed the spatiotemporal dynamics of tourism eco-efficiency in the provincial forest-park systems of nine provinces in the Yellow River Basin from 2013 to 2022 using the super-SBM model, the global Malmquist–Luenberger (GML) index, the standard deviational ellipse (SDE), and panel regression analysis. The findings provide a provincial-level account of changes in tourism eco-efficiency and its statistical associations with selected socioeconomic and environmental factors.
The results reveal three main patterns. First, mean tourism eco-efficiency was 0.778, while the mean GML index was 1.182, indicating overall productivity growth during the study period. GML decomposition showed that technological change contributed more to productivity growth than efficiency change. Eco-efficiency declined in 2020–2021 and recovered in 2022, although these temporal changes do not establish the causal effects of the COVID-19 pandemic or specific policy interventions. Second, tourism eco-efficiency displayed a clear spatial gradient, with relatively lower levels in the upper reaches and higher levels in the lower reaches of the Yellow River Basin. The SDE results indicated a broadly east–west orientation and only modest shifts in the distribution centroid over time. These results describe the spatial distribution at the provincial level and do not demonstrate spatial spillover effects. Third, the regression results showed positive associations between tourism eco-efficiency and per capita GDP and tourism revenue share, and a negative association with forest-park density. Classified highway mileage was statistically significant only at the 10% level, whereas forest cover and employee density were not statistically significant.
These findings should be interpreted in light of several methodological and data limitations. The analysis is based on nine provincial units, limiting the strength of statistical inference and potentially masking heterogeneity among individual forest parks. In addition, provincial industrial-emission indicators serve as proxies for tourism-related environmental pressures rather than direct measurements of environmental impacts within forest parks. The positive association involving tourism revenue share also requires caution because this variable is related to tourism revenue, an output in the efficiency measurement, and enters the undesirable-output allocation formula. Furthermore, the super-SBM scores are not censored at a known threshold; therefore, the Tobit specification is not justified by censoring alone, and the regression estimates should be interpreted as observational associations rather than causal effects. Future research should incorporate park-level environmental monitoring data, expand the number of observational units where feasible, and compare alternative panel estimators, including random-effects GLS, to assess the robustness of the observed associations. Such efforts could provide a more detailed empirical basis for improving tourism eco-efficiency assessment and supporting context-specific management of forest-park systems in the Yellow River Basin.
Author Contributions
Conceptualization, E.G., T.Z., and Z.L.; methodology, E.G., Y.M. (Yanan Ma), K.G., T.G., T.Z., and Z.L.; software, E.G., Y.M. (Yanan Ma), K.G., T.G., T.Z., and Z.L.; validation, E.G., Y.M. (Yanan Ma), K.G., T.G., S.Y., R.H., T.Z., and Z.L.; formal analysis, E.G., Y.M. (Yanan Ma), K.G., T.G., S.Y., R.H., T.Z., and Z.L.; investigation, E.G., Y.M. (Yanan Ma), K.G., T.G., and Z.L.; resources, E.G., T.Z., and Z.L.; data curation, E.G., Y.M. (Yanan Ma), K.G., T.G., S.Y., R.H., T.Z., and Z.L.; writing—original draft preparation, E.G., Y.M. (Yanan Ma), K.G., and T.G.; writing—review and editing, E.G., Y.M. (Yanan Ma), K.G., T.G., S.Y., R.H., T.Z., and Z.L.; visualization, E.G., Y.M. (Yanmin Mei), and K.G.; supervision, T.Z. and Z.L.; project administration, E.G., T.Z., and Z.L.; funding acquisition, E.G., T.Z., and Z.L. All authors have read and agreed to the published version of the manuscript.
Funding
This research was funded by the Theoretical Research Center of the Office of the Henan Provincial Political Consultative Conference Project “Research on the High Quality Integrated Development of Red Culture and Tourism in the Revolutionary Old Area of Dabie Mountains-Taking Xinyang City as an Example”(2026ZXLL020); the Key Specialty Project of Ordinary Colleges and Universities in Shaoxing City, Zhejiang Province, “Landscape Architecture” (SXSZY202412); the University-Enterprise Cooperation Specialised Flower Project of Zhejiang Shuren University (2025330101003917); the Annual Fund for Philosophy and Social Sciences Planning of Henan Province (2024BJJ164); the Research Program of Henan Federation of Social Sciences (SKL-2025-2542); the 2025 Cultural and Tourism Research Projects of the Henan Provincial Department of Culture and Tourism (22); the 2025 Cultural and Tourism Research Projects funded by the Henan Provincial Department of Culture and Tourism (Nos. 21 and 22); the Henan Province Science and Technology Research Project (262102110271); the Postgraduate Education Reform and Quality Improvement Project of Henan Province (YJS2025AL63); and the Henan Province Science and Technology Special Envoy Project (30804984).
Institutional Review Board Statement
Not applicable. This study uses only aggregated, publicly available secondary statistics and involves no human or animal subjects.
Informed Consent Statement
Not applicable.
Data Availability Statement
The dataset, MATLAB R2021b/Stata 18/ArcGIS (version 10.8.2) scripts, study are available from the corresponding authors upon reasonable request, subject to the terms of the underlying yearbook copyrights.
Conflicts of Interest
Author Yanmin Mei was employed by the company Hangzhou Lin’an Zhexi Grand Canyon Flowers Co., Ltd. The remaining authors declare that the research was conducted in the absence of any commercial or financial relationships that could be construed as a potential conflict of interest.
References
- Sun, J.L.; Huang, R.Q. Promoting Ecological Environment Protection in the Yellow River Basin and Writing a New Chapter for the Construction of Beautiful China in the Yellow River. Environ. Prot. 2024, 52, 11. [Google Scholar]
- Zheng, J.S.; Yin, C.J.; Sun, S.J. Spatio-temporal changes of forest ecological quality in the Yellow River Basin from 2000 to 2020. Chin. J. Ecol. 2025, 44, 2. [Google Scholar]
- Zhao, L.; Feng, X.; Zhang, X.B.; Song, X.; Wu, D. Spatio-temporal Evolution and Ecological Welfare Performance in the Yellow River Basin under the Goal of Common Prosperity. Hum. Geogr. 2025, 40, 4. [Google Scholar]
- Zhen, Y. Research on Tourism Eco-efficiency of Tourist Destinations Based on Greenhouse Gas Emissions—A Case Study of Zhangjiajie. J. Anhui Agric. Sci. 2013, 41, 8. [Google Scholar]
- Saedpanah, S.; Amanollahi, J. Environmental pollution and geo-ecological risk assessment of the Qhorveh mining area in western Iran. Environ. Pollut. 2019, 253, 811–820. [Google Scholar] [CrossRef] [Scilit]
- Schaltegger, S.; Sturm, A. Ökologische rationalität. Die Unternehm. 1990, 44, 273–290. [Google Scholar]
- Ma, Y.; Liu, J. Core Values and Improvement Strategies of Tourism Eco-efficiency in the Context of Green Development. Tour. Trib. 2016, 31, 9. [Google Scholar]
- Gössling, S.; Peeters, P.; Ceron, J.-P.; Dubois, G.; Patterson, T.; Richardson, R.B. The eco-efficiency of tourism. Ecol. Econ. 2004, 54, 4. [Google Scholar] [CrossRef] [Scilit]
- Li, B. Study on Measurement and Driving Mechanism of Ecological Efficiency of Forest Tourism. Master’s Thesis, Shenyang Agricultural University, Shenyang, China, 2022. [Google Scholar]
- Wang, S.P.; Teng, T.W.; Bao, H. Spatio-Temporal Evolution and Driving Factors of Urban Tourism Efficiency in the Yellow River Basin. J. Stat. Inf. 2023, 38, 5. [Google Scholar]
- Ding, Z.M.; Lai, Q.F.; Huang, X.J. Study on the Spatial Differences and Convergences of the Tourism Efficiency in the Forest Parks of China. For. Econ. 2016, 38, 11. [Google Scholar]
- Zhang, P.P.; Bao, Q.F.; Liu, S. The Analysis of Management Efficiency and Influencing Factors of China’s Forest Parks—Based on Three-stage Super-efficiency SBM Model. For. Econ. 2021, 43, 1. [Google Scholar]
- Zhai, Y.J. Research on Tourism Eco-Efficiency of Provincial Forest Parks in China. Master’s Thesis, Northeast Forestry University, Harbin, China, 2023. [Google Scholar]
- Li, L.Y. Research on the Temporal and Spatial Differentiation of the Tourism Ecological Efficiency in the Yellow River Basin. Master’s Thesis, Inner Mongolia University of Finance and Economics, Hohhot, China, 2025. [Google Scholar]
- Zhu, L.; Li, Y.N.; Qing, Q. A Study on Spatial-Temporal Pattern of National Forest Parks Tourism Efficiency of City Group in the Middle Reaches of Yangtze River and Its Influence Mechanism. J. Anhui Agric. Univ. Soc. Sci. Ed. 2023, 32, 5. [Google Scholar]
- He, F.F.; Huang, X.J. Study on Tourism Efficiency of Forest Parks in Fujian based on Dynamic Network DEA. Issues For. Econ. 2022, 42, 1. [Google Scholar]
- Lin, L.Y.Z.; Lü, J.H.; Ji, Y.Y. The Ecological Efficiency and Influencing Factors of Forest Parks Tourism in the Three Provinces of Northeast China. Issues For. Econ. 2024, 44, 5. [Google Scholar]
- Zhao, J.; Guo, P.Y.; Wang, H. Spatial-temporal Variation of Tourism Eco-efficiency and Its Influencing Factors in Shaanxi Province. J. South China Norm. Univ. Nat. Sci. Ed. 2024, 56, 2. [Google Scholar]
- Tone, K. A slacks-based measure of super-efficiency in data envelopment analysis. Eur. J. Oper. Res. 2002, 143, 1. [Google Scholar] [CrossRef] [Scilit]
- Zhang, P.Y.; Zheng, T.; Huang, Y.M. Regional Differences and Dynamic Evolution of China’s Tourism Economic Efficiency. Stat. Decis. 2021, 37, 3. [Google Scholar]
- Ren, Y.X. Spatial Differences and Convergence Evolution of Tourism Eco-Efficiency in Chinese Forest Parks. J. Jiangsu Vocat. Inst. Commer. 2019, 6. [Google Scholar]
- Li, D.L.; Zhai, Y.J.; Tian, G. Spatial and Temporal Variation in Tourism Eco-efficiency of Inter-provincial Forest Parks in China Using Game Intersection. J. Northeast. For. Univ. 2022, 50, 3. [Google Scholar]
- Wei, Z.X.; Guo, W.T. A Study on the Spatial-Temporal Characteristics and Influential Factors of Tourism Ecological Efficiency. Ecol. Econ. 2021, 37, 2. [Google Scholar]
- Wang, Z.F.; Li, Q. The spatio-temporal evolution of tourism efficiency and its interactive response with ecological environment in urban agglomeration in the middle reaches of the Yangtze River. J. Shaanxi Norm. Univ. Nat. Sci. Ed. 2023, 51, 2. [Google Scholar]
- Lu, F.; Gong, H.P. Measurement, Spatio-temporal Characteristics and Influencing Factors of Tourism Eco-efficiency in China. Stat. Decis. 2020, 36, 16. [Google Scholar] [CrossRef]

Disclaimer/Publisher’s Note: The statements, opinions and data contained in all publications are solely those of the individual author(s) and contributor(s) and not of MDPI and/or the editor(s). MDPI and/or the editor(s) disclaim responsibility for any injury to people or property resulting from any ideas, methods, instructions or products referred to in the content. |
© 2026 by the authors. Licensee MDPI, Basel, Switzerland. This article is an open access article distributed under the terms and conditions of the Creative Commons Attribution (CC BY) license.