


Abstract
Certified organic plant production has become an important component of China’s agricultural sustainability transition, yet its development remains temporally volatile and regionally uneven. Using a balanced panel of 31 provincial-level regions from 2014 to 2023, constructed from 118,953 product-level certification records, this study examines the temporal dynamics, spatial heterogeneity, and provincial factors associated with certification-recorded production of primary organic plant products. Descriptive statistics and concentration indicators are used to characterize temporal changes and regional disparities, while annual Global Moran’s I statistics assess spatial autocorrelation. A two-way fixed-effects (TWFE) model is then used to estimate conditional within-province associations, and spatial autoregressive (SAR), spatial error (SEM), and Spatial Durbin (SDM) models are employed as diagnostic comparisons for residual spatial dependence. Robustness analyses include winsorization, exclusion of 2023, one-year-lagged explanatory variables, and an alternative production-intensity measure. The results show pronounced temporal volatility and persistent regional concentration. Global Moran’s I indicates significant positive spatial autocorrelation in 2018–2021 and 2023, but not in the remaining years. In the baseline TWFE specification, urbanization rate and e-commerce purchasing volume are positively associated with certified organic plant production, whereas population size shows a significant negative conditional association. The negative association with population size is the most consistent across robustness checks, while the positive associations with urbanization and e-commerce are less stable under lagged or alternative specifications. Spatial-model comparisons provide no evidence of robust residual spatial dependence after observed covariates and province and year fixed effects are controlled for, supporting the more parsimonious TWFE specification. Given the observational design, these estimates should be interpreted as associations rather than causal effects. The findings demonstrate the importance of distinguishing descriptive geographical clustering from residual spatial dependence when assessing the regional development of certified organic agriculture.
1. Introduction
Over the past decade, organic agriculture has become one of the fastest-growing sectors within global sustainable food systems. According to FiBL and IFOAM—Organics International, global organic farmland reached approximately 98.9 million hectares in 2023, accounting for about 2.1% of the world’s agricultural land. In the same year, global retail sales of organic food and beverages exceeded EUR 136 billion. These trends reflect the continued expansion of organic production and consumption in response to concerns regarding food quality, environmental degradation, biodiversity loss, and the sustainability of conventional agricultural systems [1].
At the same time, growing concerns regarding food safety, environmental degradation, climate change, and excessive chemical input use have accelerated the global transition toward sustainable agricultural systems [2,3]. Organic agriculture, characterized by reduced chemical dependence, ecological sustainability, and environmentally friendly production practices, has increasingly been regarded as an important pathway toward agricultural green transition and rural sustainability [4].
Organic production differs from conventional agriculture not only in the restriction of synthetic chemical inputs but also in its reliance on regulated production, certification, traceability, and management practices. Consequently, the development of organic agriculture reflects the interaction of ecological production requirements, agricultural resource endowments, market demand, institutional arrangements, and market-access conditions [5]. Understanding these interacting dimensions is particularly important in large countries where agricultural resources and market conditions vary substantially across regions [6].
As the world’s largest developing country and one of the largest agricultural producers, China has also experienced rapid growth in organic agriculture under the combined influence of market expansion, policy support, and green development strategies. By 2023, China had become one of the world’s largest organic markets, with organic retail sales of approximately EUR 12.6 billion, ranking behind only the United States and Germany and accounting for about 9% of the global organic market [1], making China one of the world’s largest organic consumer markets [7]. Meanwhile, the number of certified organic agricultural products and organic production bases has continued to increase [8].
China’s organic production is governed by a national certification framework. During the early part of the study period, certification was implemented under the 2014 Organic Product Certification Implementation Rules [9]. These rules were subsequently revised in 2019 [10], and the revised implementation rules, together with the national standard GB/T 19630-2019, came into effect on 1 January 2020 [11]. Organic certification certificates are generally valid for one year and specify the certified product category, production location, and certified quantity. The national standard also requires a conversion period before conventional land can qualify for organic production. For plant production, the conversion period is at least 24 months before sowing for annual crops, at least 24 months before harvest for grassland and perennial forage crops, and at least 36 months before harvest for other perennial crops; certain newly reclaimed or long-abandoned land is subject to a minimum 12-month conversion period. The study period therefore spans an important update of China’s organic certification framework. However, the present analysis does not identify the causal effect of this regulatory revision, and changes in certified production around 2020 are not attributed to the reform without additional evidence.
Organic certification covers a broad range of products, including plant, livestock, aquatic, and processed products [9]. Because these product groups differ substantially in biological production processes, land requirements, market organization, and measurement units, aggregating them into a single production indicator may obscure meaningful differences and create comparability problems [9]. The present study therefore focuses specifically on primary organic plant products, for which production quantities can be defined on a more consistent mass basis and linked more directly to provincial agricultural production conditions.
Despite the overall development of the organic sector, certified organic plant production remains unevenly distributed across China. Provinces differ substantially in agricultural resource endowments, production infrastructure, market development, urbanization, ecological production conditions, and access to digital markets [12]. Such differences may contribute to substantial interprovincial variation in both the scale and evolution of certified organic plant production [13]. Moreover, neighboring provinces may exhibit similar production patterns because of shared climatic, agricultural, market, or institutional conditions, making spatial dependence an empirical issue that warrants explicit testing rather than an assumption.
Existing research on organic agriculture has devoted considerable attention to consumer preferences [14], willingness to pay [15], certification, environmental attitudes [16], and farm-level adoption [17,18]. A growing literature has also examined the geographical distribution of organic farming. Nevertheless, three gaps remain. First, relatively limited evidence is available on the long-term provincial evolution and concentration of certified organic plant production in China. Second, regional studies often consider production, market, ecological, or digital conditions separately, leaving their joint associations less well understood. Third, descriptive spatial clustering is sometimes interpreted as evidence of spatial interaction without testing whether such dependence remains after regional characteristics and unobserved province- and year-specific factors are controlled for. These gaps are particularly relevant in the Chinese context, where large interprovincial differences coexist with rapid changes in market access, urbanization, and digital commerce.
Conceptually, the regional development of certified organic plant production can be understood as the outcome of several interconnected conditions. Agricultural production capacity determines the physical and technological basis for production [19]; market conditions shape potential demand and commercialization opportunities [20]; ecological production conditions influence the feasibility and costs of transitioning from conventional to organic systems [21]; and digital market development may alter access to geographically dispersed markets. These relationships are embedded within a spatial context in which neighboring provinces may share similar environmental, economic, and institutional characteristics [22]. Rather than treating these dimensions as independent theoretical explanations, this study integrates them into a common regional framework and evaluates their empirical associations after controlling for persistent provincial heterogeneity and common temporal shocks.
Against this background, this study uses a balanced panel of 31 provincial-level regions from 2014 to 2023 to investigate the temporal dynamics, spatial heterogeneity, and associated factors of certification-recorded primary organic plant production in China. Specifically, the study first examines temporal changes and regional concentration using descriptive and distributional indicators. Second, annual Global Moran’s I statistics are used to assess whether certified production exhibits significant geographical clustering. Third, a two-way fixed-effects model is employed to estimate the associations of agricultural production conditions, market characteristics, ecological indicators, and e-commerce development with certified organic plant production. Finally, SAR, SEM, and SDM specifications are compared with the non-spatial model to determine whether meaningful residual spatial dependence remains after observed covariates and fixed effects are taken into account.
This study makes three main contributions. First, it constructs a more internally comparable measure of provincial certified organic production by focusing on primary plant products and screening heterogeneous product categories and measurement units in the underlying certification records. This improves the consistency between the dependent variable and the agricultural production conditions examined in the empirical model. Second, it provides nationwide evidence on the temporal evolution and regional concentration of certified organic plant production over a ten-year period while jointly evaluating production, market, ecological, demographic, and digital-market conditions within a two-way fixed-effects framework. Third, it explicitly distinguishes descriptive spatial clustering from residual spatial dependence by combining annual Moran’s I statistics with systematic comparisons of non-spatial and spatial panel specifications. This approach provides a more cautious basis for evaluating claims of regional interaction and spillover in organic agricultural development.
2. Theoretical Framework
Regional variation in certified organic plant production may reflect the combined influence of agricultural production conditions, market and demographic characteristics, ecological transition conditions, digital market development, and spatial context. Rather than treating these dimensions as independent explanations, this study integrates them into a common provincial-level analytical framework.
The framework distinguishes between factors that characterize the production base of a province, factors related to market demand and demographic structure, ecological conditions associated with the transition from conventional to organic production, and the broader digital market environment. These relationships are embedded within a spatial context because neighboring provinces may share similar climatic, agricultural, economic, and institutional characteristics. Spatial dependence is therefore treated as an empirical possibility to be tested rather than as a predetermined spillover mechanism.
Accordingly, the empirical framework comprises five interconnected dimensions: production conditions, market and demographic conditions, ecological transition conditions, digital market conditions, and spatial context.
2.1. Production Conditions
Agricultural production theory emphasizes the role of land, infrastructure, capital, and technology in shaping agricultural output [23]. Although organic plant production differs from conventional agriculture in its restrictions on synthetic inputs and its certification requirements, it still depends on an underlying agricultural production base [24].
Effective irrigation can improve water availability and production stability, while agricultural machinery may facilitate standardized cultivation, field management, and harvesting. These characteristics may therefore provide favorable conditions for the development of certified organic plant production. Total sown area captures the broader scale of regional crop production and the land base within which organic cultivation can potentially develop. Provinces with larger cultivated areas may have greater physical capacity to allocate land to certified organic plant production. Accordingly, total sown area is expected to be positively associated with certified organic plant production.
At the same time, a larger conventional agricultural production base does not necessarily translate directly into a larger organic sector. Organic certification requires compliance with specific production standards and conversion requirements, so the relationship between general agricultural scale and certified organic production may depend on how agricultural resources are allocated and managed.
In the empirical analysis, effective irrigation area (A1), total agricultural machinery power (A2), and total sown area (A3) are therefore used to characterize provincial agricultural production conditions.
2.2. Market and Demographic Conditions
Agricultural location theory emphasizes that the viability of agricultural production is related not only to production conditions but also to proximity and access to markets [25]. This consideration is particularly relevant for certified organic products, which often target differentiated consumer markets and may face additional certification, marketing, and distribution costs.
Higher disposable income may increase consumers’ capacity to purchase premium agricultural products, while urbanization can concentrate consumers, retail infrastructure, logistics services, and market demand. These conditions may create a more favorable commercial environment for certified organic plant products.
Population size represents a broader demographic dimension of regional market potential. A larger population may expand the potential consumer base for differentiated agricultural products and support greater market demand, distribution activity, and commercialization opportunities. Accordingly, population size is expected to be positively associated with certified organic plant production. The empirical analysis subsequently evaluates whether this theoretically expected relationship is supported after other provincial characteristics and fixed effects are controlled for.
Accordingly, urban disposable income (B1), urbanization rate (B2), and population size (B3) are used to characterize provincial market and demographic conditions.
2.3. Ecological Transition Conditions
Sustainable agriculture theory emphasizes the need to reconcile agricultural production with environmental protection and resource conservation [26]. Organic production is particularly relevant to this transition because certified organic systems restrict the use of synthetic fertilizers and pesticides and require compliance with specific production standards.
At the regional level, intensive reliance on chemical inputs may indicate a conventional production structure from which transition to organic management could require substantial technological, managerial, and institutional adjustment. Provinces with higher fertilizer or pesticide use may therefore face different transition conditions from regions where agricultural production is less dependent on chemical inputs.
Nevertheless, provincial fertilizer and pesticide use are broad indicators of conventional agricultural intensity rather than direct measures of chemical inputs applied on certified organic land. Their estimated coefficients should therefore be interpreted as regional associations rather than direct measures of organic-farm management practices.
This study uses fertilizer application (C1) and pesticide use (C2) to represent the ecological transition conditions of provincial agriculture.
2.4. Digital Market Conditions
The expansion of e-commerce has altered the market environment in which agricultural products are distributed and consumed. Digital platforms can broaden access to geographically dispersed consumers, improve information flows, and complement conventional retail and distribution channels. These functions may be particularly relevant for differentiated products such as certified organic products, whose producers and consumers may be geographically separated [27].
However, the present study does not directly observe online sales of organic plant products or the digital adoption behavior of certified producers. Instead, e-commerce purchasing volume (D1) is used as a proxy for the broader provincial digital market environment. A higher value therefore indicates a more developed regional e-commerce market rather than direct participation of organic producers in digital channels.
The empirical analysis examines whether this broader digital market condition is associated with certification-recorded organic plant production, without assuming a causal effect of e-commerce development.
2.5. Spatial Context and Dependence
Agricultural production is inherently spatial because neighboring regions often share climatic conditions, resource endowments, transportation networks, market environments, and institutional characteristics [28]. As a result, provinces with similar levels of certified organic plant production may be geographically clustered even in the absence of direct spillover mechanisms.
Spatial correlation may also arise from interactions among regions, including trade relationships, policy learning, technology exchange, or shared logistics systems. However, such mechanisms cannot be inferred solely from geographical clustering. A significant Moran’s I, for example, indicates that similar values are spatially associated but does not by itself identify why the association occurs.
This study therefore treats spatial dependence as an empirical question. Annual Global Moran’s I statistics are first used to examine descriptive spatial clustering. Spatial panel specifications are then compared with the non-spatial TWFE model to determine whether statistically meaningful residual spatial dependence remains after observed provincial characteristics, province fixed effects, and year fixed effects are controlled for.
Only if such dependence is supported by the econometric evidence would stronger interpretations concerning interregional spatial interaction be warranted.
2.6. Integrated Analytical Framework
Based on the preceding discussion, this study conceptualizes certified organic plant production as the outcome of interacting regional conditions rather than a single dominant factor (Figure 1). Agricultural production conditions provide the physical and technological basis for cultivation; market and demographic conditions characterize the potential commercial environment; ecological indicators reflect the broader context of transition from conventional production systems; and e-commerce development captures one dimension of the digital market environment.
Figure 1.
Theoretical framework diagram.
These relationships are embedded within a spatial context. Provinces may display similar production patterns because they share regional characteristics or because interregional interactions exist. The analytical strategy therefore separates two questions: (1) which observed provincial characteristics are associated with within-province changes in certified organic plant production; and (2) whether meaningful spatial dependence remains after these characteristics and unobserved province- and year-specific effects are controlled for.
The first question is examined using a two-way fixed-effects model, while the second is assessed using annual spatial-autocorrelation statistics and comparisons among non-spatial and spatial panel specifications. This framework avoids treating spatial clustering as synonymous with spatial spillover and provides a more conservative basis for interpreting regional differences in certified organic plant production.
3. Materials and Methods
3.1. Data Sources
3.1.1. Organic Certification Records and Construction of the Dependent Variable
The certification records used to construct the dependent variable were obtained from the Qiyan Social Science Big Data Platform, specifically from the Agricultural Research (CCAD) database under “Agricultural Product Research → China Food Safety Research Database → Food and Agricultural Product Certification → Organic Product Certificate Information Table. The database was obtained from the “Food and Agricultural Product Certification Information System” of the State Administra-tion for Market Regulation (SAMR) [29]. The database provides product-level organic certification records containing information on certified products, certificate holders, certification years, product categories, certification scope, and certification-recorded annual production quantities.
The original database covers a wide range of organic product categories, including primary plant products, livestock and animal-origin products, aquatic products, processed products, propagation materials, and other certified products. The composition of the original certification records is summarized in Table 1. Of the 155,527 records covering 2014–2023, primary plant products accounted for 119,174 records (76.63%), followed by processed products (14.36%), primary livestock and animal-origin products (4.62%), and primary aquatic products (3.81%). Unclassified and other non-comparable categories together accounted for less than 1% of the records. The substantial presence of product groups with different biological production processes and measurement units demonstrates why directly aggregating all certification records into a single production indicator would be inappropriate.
Table 1.
Composition of organic certification records by broad product category (2014–2023).
To construct a more internally comparable dependent variable, the main analysis was therefore restricted to “primary organic plant products with production quantities recorded on a mass basis”. These products include cereals and pulses, vegetables, fruits and nuts, tea and related beverage or spice crops, oil crops, medicinal and herbal plants, edible fungi, forage and sugar crops, and other unprocessed primary plant products. Livestock and animal-origin products, aquatic products, processed products, propagation materials, and other non-comparable product categories were excluded.
For the 2014–2023 study period, 119,174 records were initially identified as candidate primary-plant observations. Records with missing or non-numeric production quantities were removed. Potentially unusual observations were then traced back to the underlying certification information rather than being excluded solely on statistical grounds. Three exceptionally large plant-product records for which the reported production quantities could not be verified against explicit tonnage information in the corresponding certification scope were excluded. No exact duplicate records were identified in the retained candidate sample. The final dataset contained “118,953 product-level certification records”, which were aggregated by province and year.
The resulting dependent variable, Y, represents “annual provincial certification-recorded production of primary organic plant products, measured in metric tons”. It should therefore be interpreted as certification-recorded production rather than independently verified realized output, sales volume, or actual market supply.
3.1.2. Socioeconomic and Agricultural Variables
Provincial socioeconomic and agricultural variables were primarily obtained from the “China Statistical Yearbook” and corresponding official statistical sources for the period 2014–2023. The variables include effective irrigation area, total agricultural machinery power, total sown area, per capita urban disposable income, urbanization rate, population size, fertilizer application, pesticide use, and e-commerce purchasing volume.
All explanatory variables were matched with the certification-based dependent variable by province and year, producing a balanced panel of “31 provincial-level regions over 10 years”, corresponding to “310 province-year observations”. The statistical definitions and measurement units of the explanatory variables were checked for consistency before model estimation.
3.1.3. Spatial Data
Provincial administrative boundary data were used to construct the spatial structure of the analysis. A first-order geographical contiguity matrix was generated based on whether two provincial-level regions share a common land boundary. The resulting matrix was row-standardized before the spatial analyses.
Hainan does not share a land boundary with any other provincial-level region in the sample and is therefore retained as a spatial island with a zero spatial-weight row in the baseline contiguity matrix. The same province ordering was used for the spatial matrix and the panel dataset to ensure consistency across all spatial analyses.
3.2. Variable Definition and Transformation
The dependent variable is annual provincial certification-recorded production of primary organic plant products (Table 2). Because the production distribution is strongly right-skewed and varies substantially across provinces, the natural logarithm of production is used in the econometric analysis and is denoted as lnY. All province-year production observations in the final analytical sample are positive; therefore, no constant was added before logarithmic transformation and no observations were removed because of zero production.
Table 2.
Definition of Variables.
Based on the theoretical framework, the explanatory variables are organized into four substantive dimensions (Table 2). First, “production conditions” are represented by effective irrigation area (A1), total agricultural machinery power (A2), and total sown area (A3). Second, “market and demographic conditions” are represented by per capita urban disposable income (B1), urbanization rate (B2), and population size (B3). Third, “ecological transition conditions” are represented by fertilizer application (C1) and pesticide use (C2). Fourth, “digital market conditions” are proxied by e-commerce purchasing volume (D1).
E-commerce purchasing volume should be interpreted as a proxy for the broader provincial digital market environment rather than as a direct measure of online transactions in certified organic products. Likewise, fertilizer and pesticide use characterize the overall agricultural production environment of a province and do not measure chemical inputs applied specifically on certified organic land.
To place explanatory variables measured in different units on a comparable scale, all explanatory variables were standardized using pooled z-scores before regression estimation. The dependent variable remained in natural-logarithmic form. Consequently, the estimated coefficients indicate the change in log certified organic plant production associated with a one-standard-deviation change in the corresponding explanatory variable, conditional on the remaining covariates and fixed effects.
Multicollinearity was assessed using correlation diagnostics and variance inflation factors calculated from the within-transformed explanatory variables. All within-VIF values were below 2.5, with the VIF for population size equal to approximately 1.62. These results indicate no evidence of serious multicollinearity in the fixed-effects specification. Population size was therefore retained in the baseline model. The pooled and two-way within-transformed correlation matrices, together with the corresponding within-VIF diagnostics, are reported in Supplementary Table S1.
3.3. Spatial Autocorrelation Analysis
Global Moran’s I was calculated annually to examine whether provinces with similar levels of certified organic plant production tend to be geographically clustered [30]. The statistic is expressed as:
where Yi and Yj represent the observed values of certified organic agricultural production in regions i and j; wij denotes the spatial weight matrix; S0 represents the sum of all spatial weights.
The baseline spatial weight matrix is a row-standardized first-order geographical contiguity matrix. Provinces sharing a common land boundary are assigned a positive spatial link, while non-neighboring provinces receive a weight of zero. Hainan is retained as a spatial island with a zero row.
Statistical significance was evaluated using 9999 random permutations for each year. Positive and statistically significant values of Moran’s I indicate that provinces with similar levels of certified organic plant production are more geographically clustered than would be expected under spatial randomness.
Global Moran’s I is used in this study as a descriptive diagnostic of spatial clustering. A statistically significant Moran’s I does not, by itself, identify a spatial spillover mechanism or justify a particular spatial econometric specification. Whether residual spatial dependence remains after observed covariates, province fixed effects, and year fixed effects are controlled for is evaluated separately through comparisons among non-spatial and spatial panel models.
3.4. Two-Way Fixed Effects Model
To examine the provincial characteristics associated with certification-recorded primary organic plant production, this study employs a two-way fixed-effects (TWFE) model:
where lnYit denotes the natural logarithm of certified organic agricultural production in province i in year t; Xit represents the vector of explanatory variables; μi captures province fixed effects; λt captures year fixed effects; and εit denotes the error term.
lnYit = α + βXit + μi + λt + εit
Province fixed effects absorb time-invariant regional characteristics that may be related to certified organic plant production, including relatively persistent differences in natural endowments, geographical conditions, and long-standing agricultural structures. Year fixed effects control for shocks common to all provinces in a given year, such as national macroeconomic changes, regulatory developments, and other nationwide temporal influences.
Because repeated observations within the same province may exhibit serial correlation and heteroskedasticity, standard errors are clustered at the provincial level. The TWFE coefficients therefore capture conditional within-province associations over time rather than cross-sectional differences between provinces. Given the observational nature of the data, the estimated coefficients are interpreted as associations and not as causal effects.
3.5. Spatial Model Comparison
Annual Global Moran’s I statistics are used to identify descriptive spatial clustering, but spatial autocorrelation in the dependent variable does not necessarily imply that residual spatial dependence remains after provincial characteristics and fixed effects are controlled for. Therefore, this study does not select a spatial model solely on the basis of Moran’s I. Instead, the non-spatial TWFE specification is compared with three commonly used spatial panel models: the spatial autoregressive model (SAR), spatial error model (SEM), and Spatial Durbin Model (SDM).
The SAR specification is expressed as:
where i and j index provinces and t indexes years. lnY_it denotes the natural logarithm of certification-recorded primary organic plant production in province i at time t; wij is the ij-th element of the row-standardized spatial weight matrix; ΣjwijlnYjt is the spatially weighted value of the dependent variable in neighboring provinces; X_it is the vector of explanatory variables; β is the corresponding coefficient vector; μi and τt M specification is written as denote province and year fixed effects; and ε_it is the idiosyncratic error term. The parameter ρ is the spatial autoregressive coefficient. A statistically significant ρ would indicate residual spatial dependence in the dependent variable after the included covariates and fixed effects are controlled for. It does not, by itself, identify the substantive mechanism generating that dependence.
lnYit = ρΣjwijlnYjt + β′Xit + μi + τt + εit
The SEM specification is written as [31]:
where μ_it denotes the spatially structured disturbance term and μ it is the remaining idiosyncratic error. The parameter λ is the spatial error coefficient and captures spatial correlation in the disturbance process. Unlike the SAR model, the SEM does not specify a direct spatial relationship between observed production levels in neighboring provinces. A statistically significant λ would instead suggest that unobserved shocks or omitted factors affecting certified organic plant production are spatially correlated across neighboring provinces.
lnYit = β′Xit + μi + τt + uit
uit = λΣjwijujt + εit
The SDM specification extends the SAR model by incorporating spatially lagged explanatory variables:
where , equivalently wXt, represents the spatially weighted explanatory variables of neighboring provinces, and θ is the corresponding coefficient vector. The remaining notation is defined as above. The SDM therefore allows both neighboring outcomes and neighboring explanatory variables to enter the conditional specification. Importantly, the coefficients in θ should not be interpreted directly as marginal spatial spillover effects. When ρ ≠ 0, changes in an explanatory variable may propagate through the spatial multiplier (1 − ρw)−1, so formal direct, indirect, and total effects require a separate partial-derivative decomposition.
In the present study, the SAR, SEM, and SDM specifications are estimated primarily to determine whether statistically meaningful residual spatial dependence remains after observed provincial characteristics and two-way fixed effects are controlled for. Model comparison is based on the statistical significance of the spatial parameters, log-likelihood values, AIC, BIC, and likelihood-ratio tests where appropriate. Because the spatial parameters and model-comparison results do not support the SDM as the preferred specification, covariate-specific direct and indirect effects are not interpreted as substantive spillover effects.
The SDM is therefore not assumed a priori to be the preferred specification. More complex spatial interpretations, including covariate-specific spillover effects, are considered only when the spatial model is empirically supported by the model-comparison results.
3.6. Robustness and Sensitivity Analyses
Several robustness and sensitivity analyses are conducted to evaluate whether the baseline TWFE results depend on extreme observations, the unusually strong increase in certified production in 2023, contemporaneous specification, or the particular definition of the dependent variable [32].
First, the logarithm of certified organic plant production is winsorized at the 1st and 99th percentiles to reduce the influence of the tails of the production distribution.
Second, the TWFE model is re-estimated after excluding all observations from 2023. This specification examines whether the baseline associations are disproportionately influenced by the marked nationwide increase in certification-recorded plant production observed in that year.
Third, all explanatory variables are lagged by one year. The lagged specification reduces the mechanical contemporaneous relationship between current explanatory variables and current certified production and provides a more conservative assessment of temporal ordering. However, this procedure does not by itself establish causal identification.
Finally, an alternative production-intensity measure is constructed by dividing certification-recorded primary organic plant production by total crop sown area before logarithmic transformation. Because the dependent variable in the revised analysis is restricted to primary plant products, this normalization is conceptually more comparable than when heterogeneous livestock, aquatic, and processed products are included. Nevertheless, total crop sown area is not equivalent to certified organic area, so this specification is treated as a sensitivity analysis rather than as an alternative principal outcome.
Across the robustness analyses, attention is given to the direction, magnitude, and statistical significance of the principal coefficients rather than to statistical significance alone.
3.7. Analytical Procedures
The empirical analysis proceeds in four main stages, as summarized in Figure 1.
First, temporal changes and regional disparities in certification-recorded primary organic plant production are examined using national totals, annual growth rates, provincial means and medians, the coefficient of variation, the Gini coefficient, and concentration ratios.
Second, annual Global Moran’s I statistics are calculated using the row-standardized geographical contiguity matrix and 9999 random permutations to evaluate descriptive spatial clustering.
Third, the TWFE model is used to estimate within-province associations between certified organic plant production and production conditions, market and demographic conditions, ecological transition conditions, and digital market conditions.
Fourth, the TWFE specification is compared with SAR, SEM, and SDM models to determine whether meaningful residual spatial dependence remains after observed covariates and province and year fixed effects are controlled for.
Robustness and sensitivity analyses are subsequently used to assess the stability of the principal TWFE findings under alternative treatments of extreme values, the 2023 observation period, temporal ordering, and production normalization.
To complement these descriptive indicators, provincial choropleth maps are used to visualize the geographical distribution of certification-recorded primary organic plant production in four representative years (2014, 2018, 2021, and 2023). Production is expressed in (104) metric tons, and the same seven fixed class intervals (0–5, 6–20, 21–50, 51–100, 101–200, 201–500, and 501+) are applied uniformly to all four panels to ensure direct temporal comparability. The maps are used for descriptive visualization rather than as a statistical test of spatial autocorrelation.
4. Results
4.1. Temporal and Regional Patterns of Certified Organic Plant Production
Certified organic plant production in China exhibited substantial temporal variation during 2014–2023 rather than a continuous linear growth trajectory. As shown in Table 3, total certification-recorded primary organic plant production was approximately 4.09 million tons in 2014 and declined slightly to 3.91 million tons in 2015. Production subsequently increased to 5.45 million tons in 2016 and remained at a similar level in 2017. A period of contraction followed, with national production declining from 4.62 million tons in 2018 to 3.47 million tons in 2020. Production recovered in 2021 and 2022, reaching 4.79 and 5.26 million tons, respectively, before increasing markedly to 24.62 million tons in 2023.
Table 3.
Temporal evolution and regional concentration of certified organic plant production (2014–2023).
The annual growth rates further illustrate the pronounced temporal volatility. The largest declines occurred in 2018 (−16.35%) and 2019 (−17.91%), whereas production increased by 37.76% in 2021 and 9.79% in 2022. The most substantial change occurred in 2023, when national certification-recorded production increased by 368.51% relative to the previous year. This increase was broadly distributed across provinces rather than being attributable to a single provincial observation: production increased in 30 of the 31 provincial-level regions, and 29 provinces recorded more than a twofold increase. Nevertheless, because the present analysis does not identify the causes of this nationwide change, the 2023 increase is treated as a descriptive temporal pattern rather than evidence of a specific causal mechanism.
Substantial interprovincial heterogeneity persisted throughout the study period. The coefficient of variation ranged from approximately 1.40 to 2.19, while the Gini coefficient remained between 0.60 and 0.72. The four largest provincial producers accounted for approximately 52–71% of national certified plant production, and the eight largest provinces accounted for approximately 69–81%. Provincial means also consistently exceeded medians, indicating a right-skewed distribution in which a relatively small number of provinces accounted for a substantial share of national certification-recorded production.
The provincial maps provide a complementary visualization of this regional heterogeneity (Figure 2). Using identical class intervals across all four representative years, the maps show substantial differences in certification-recorded production among provinces and changes in the geographical distribution of higher-production categories over time. The 2023 panel is particularly distinctive, with a larger number of provinces entering higher production classes, consistent with the broad-based national increase reported above. Because the classification thresholds are held constant across all panels, differences in color intensity are directly comparable across years. These maps describe the geographical distribution of production; whether the observed patterns constitute statistically significant spatial clustering is examined separately using Global Moran’s I in Section 4.2.
Figure 2.
Spatial distribution of certification-recorded primary organic plant production in China in 2014, 2018, 2021, and 2023.
Overall, the descriptive results indicate that certified organic plant production in China is characterized by pronounced temporal volatility and persistent regional concentration. Although the geographical composition of production changes over time, regional inequality remains a notable feature of the certified organic plant sector.
4.2. Spatial Autocorrelation of Certified Organic Plant Production
Table 4 reports annual Global Moran’s I statistics for the natural logarithm of certification-recorded primary organic plant production. The estimates indicate that the degree of spatial clustering changed considerably over the study period.
Table 4.
Global Moran’s I of Certification-Recorded Primary Organic Plant Production (2014–2023).
During 2014–2017, Moran’s I remained positive but was not statistically significant at the 5% level. The estimated statistics ranged from 0.070 to 0.158, providing insufficient evidence of systematic geographical clustering during these years.
A different pattern emerged between 2018 and 2021. Moran’s I was positive and statistically significant in each of these four years, with values ranging from 0.193 to 0.207. These results indicate that provinces with similar levels of certified organic plant production were more geographically clustered than would be expected under spatial randomness during this period.
In 2022, Moran’s I decreased to −0.006 and was statistically insignificant (p = 0.805), indicating virtually no detectable global spatial autocorrelation. In 2023, however, Moran’s I increased substantially to 0.282 and became statistically significant (p = 0.008), representing the strongest evidence of positive geographical clustering observed during the study period.
Overall, the annual Moran’s I results indicate temporally varying rather than persistent spatial autocorrelation. Significant positive clustering is observed in 2018–2021 and 2023, but not throughout the entire 2014–2023 period. Accordingly, these descriptive spatial patterns do not by themselves establish persistent spatial dependence or regional spillover effects. Whether spatial dependence remains after provincial characteristics and two-way fixed effects are controlled for is examined through the subsequent spatial-model comparison.
4.3. Two-Way Fixed Effects Results
Table 5 reports the results of the two-way fixed-effects model. The dependent variable is the natural logarithm of certification-recorded primary organic plant production, while all explanatory variables are standardized using pooled z-scores. Province and year fixed effects are included, and standard errors are clustered at the provincial level.
Table 5.
Two-way fixed-effects estimates for certified organic plant production.
Three explanatory variables are statistically significant in the baseline specification. Urbanization rate (B2) is positively associated with certified organic plant production (β = 1.465, p = 0.036). Because the explanatory variables are standardized, this coefficient indicates that a one-standard-deviation increase in the urbanization rate is associated with a 1.465-unit increase in log certified organic plant production, conditional on the remaining covariates and fixed effects.
E-commerce purchasing volume (D1) also exhibits a positive and statistically significant association (β = 0.320, p = 0.025). This result indicates a positive contemporaneous relationship between the broader provincial e-commerce environment and certification-recorded organic plant production. The coefficient should not be interpreted as an elasticity because D1 is standardized rather than expressed in logarithmic form.
By contrast, population size (B3) exhibits a statistically significant negative conditional association (β = −4.066, p = 0.002). This estimate reflects within-province changes over time after controlling for the remaining explanatory variables, province fixed effects, and year fixed effects. It therefore does not imply that provinces with larger populations necessarily have lower levels of certified organic plant production.
Effective irrigation area (A1), agricultural machinery power (A2), total sown area (A3), urban disposable income (B1), fertilizer application (C1), and pesticide use (C2) are not statistically significant at the 5% level in the baseline model. The corresponding coefficients therefore do not provide sufficient evidence of independent within-province associations with certification-recorded organic plant production after the full set of controls and fixed effects is introduced.
The model has an overall (R2) of 0.870 and an adjusted (R2) of 0.847, whereas the within (R2) is 0.072. The large difference between the overall and within (R2) indicates that a substantial share of total variation is associated with province and year fixed effects. Accordingly, the overall (R2) should not be interpreted as the proportion of within-province temporal variation explained solely by the observed explanatory variables.
4.4. Results of Spatial Model Comparison
The annual Moran’s I results indicate significant positive spatial clustering in several individual years. However, spatial clustering in the dependent variable does not necessarily imply that substantial spatial dependence remains after observed provincial characteristics and two-way fixed effects are controlled for. To examine this issue, the baseline TWFE specification was compared with SAR, SEM, and SDM models using the geographical-contiguity spatial weight matrix.
As shown in Table 6, the estimated spatial autoregressive coefficient in the SAR model is small and negative (ρ = −0.032). The SAR specification does not provide a statistically significant improvement over the non-spatial TWFE model (LR test, p = 0.711). Similarly, the spatial error coefficient in the SEM is negative and statistically insignificant (λ = −0.043), and the SEM does not significantly improve upon the TWFE specification (LR test, p = 0.631).
Table 6.
Comparison of Non-Spatial and Spatial Panel Models.
The SDM produces a spatial autoregressive coefficient of (ρ = −0.051), which is also statistically insignificant (p = 0.561). In addition, the SDM does not provide a statistically significant improvement over the SAR specification (LR test, (p = 0.489)). Thus, the more highly parameterized SDM is not supported by the model-comparison results.
The information criteria lead to the same conclusion. The TWFE specification has the lowest AIC (618.916) and BIC (805.745) among the four models. The corresponding AIC values are 620.779 for the SAR, 620.685 for the SEM, and 630.324 for the SDM. The BIC values are likewise higher for all three spatial specifications.
Taken together, these results provide no evidence of robust residual spatial dependence after observed provincial characteristics, province fixed effects, and year fixed effects are controlled for. The significant Moran’s I statistics observed in several years therefore appear to describe geographical clustering in the raw production pattern rather than persistent spatial dependence in the conditional regression process.
Accordingly, the TWFE model is retained as the principal econometric specification. The spatial models are used as diagnostic comparisons, and the results do not support stronger claims regarding persistent regional spillover effects or covariate-specific spatial diffusion.
4.5. Results of Robustness and Sensitivity Analyses
A series of robustness and sensitivity analyses was conducted to examine whether the principal TWFE findings depend on extreme observations, the marked increase in certified production in 2023, contemporaneous model specification, or the definition of the dependent variable. Table 7 reports the results for the three variables that are statistically significant in the baseline model: urbanization rate (B2), population size (B3), and e-commerce purchasing volume (D1).
Table 7.
Robustness and Sensitivity Analyses for the Principal TWFE Associations.
First, the dependent variable was winsorized at the 1st and 99th percentiles. The coefficient of urbanization rate remained positive and statistically significant (β = 1.335, p = 0.027), while population size remained significantly negative (β = −3.919, p < 0.001). E-commerce purchasing volume also retained a significant positive coefficient (β = 0.327, p = 0.023). These results indicate that the baseline associations are not driven by observations in the extreme tails of the production distribution.
Second, the model was re-estimated after excluding all observations from 2023, when national certification-recorded plant production increased particularly sharply. The results remain broadly consistent with the baseline estimates. Urbanization rate remains positively associated with certified organic plant production (β = 1.750, p = 0.032), population size remains negatively associated (β = −4.541, p < 0.001), and e-commerce purchasing volume remains positively associated (β = 0.583, p = 0.011). The principal contemporaneous findings are therefore not attributable solely to the strong increase observed in 2023.
Third, all explanatory variables were lagged by one year. Under this specification, the coefficient of population size remains negative and statistically significant (β = −3.574, p = 0.024). By contrast, the coefficients of urbanization rate (β = 0.777, p = 0.368) and e-commerce purchasing volume (β = 0.394, p = 0.094) are no longer statistically significant at the 5% level. The e-commerce coefficient remains positive and is marginally significant at the 10% level, but the result is insufficient to support a causal interpretation. Similarly, the baseline urbanization association should be interpreted as contemporaneous rather than as evidence that increasing urbanization subsequently raises certified organic plant production.
Finally, an alternative production-intensity indicator was constructed by dividing certification-recorded primary organic plant production by total crop sown area. In this specification, urbanization rate remains positively associated with production intensity (β = 1.336, p = 0.042), while population size remains significantly negative (β = −3.608, p = 0.005). The coefficient of e-commerce purchasing volume remains positive but is no longer statistically significant at the 5% level (β = 0.260, p = 0.070). Because total crop sown area is not equivalent to certified organic area, this result is treated as a sensitivity analysis rather than as an alternative principal outcome.
Overall, population size exhibits the most consistent association across the alternative specifications. The positive contemporaneous associations of urbanization and e-commerce are robust to winsorization and the exclusion of 2023, but they are not robust to the one-year-lagged specification. These findings reinforce the need to interpret the baseline TWFE coefficients as conditional associations rather than causal effects.
5. Discussion
5.1. Temporal Volatility in Certified Organic Plant Production
The results show that certification-recorded primary organic plant production in China did not follow a smooth or continuously increasing trajectory between 2014 and 2023. Instead, national production fluctuated considerably, including several years of decline followed by recovery and a particularly large increase in 2023. This pattern cautions against interpreting the development of certified organic agriculture as a simple process of continuous expansion.
The fluctuations may reflect the combined influence of changes in certification activity, market conditions, production decisions, regulatory environments, and broader agricultural conditions [33]. However, the present data do not allow these possible explanations to be separately identified. In particular, the marked increase observed in 2023 should not be attributed to a specific regulatory, market, or macroeconomic event without additional evidence.
The 2023 increase is nevertheless noteworthy because it was not generated by a single provincial observation. Production increased in almost all provincial-level regions, suggesting that the change was geographically widespread. At the same time, the magnitude of the increase reinforces the importance of sensitivity analysis. The TWFE results remain broadly similar when 2023 is excluded, indicating that the main contemporaneous associations identified in the baseline specification are not solely attributable to this unusual year.
These findings therefore support a characterization of China’s certified organic plant sector as temporally volatile rather than as following a clearly defined sequence of expansion, adjustment, and restructuring. This more cautious interpretation is consistent with the nature of certification-recorded data, which capture certification-recorded production quantities rather than independently verified realized market output.
5.2. Persistent Regional Concentration and Changing Spatial Patterns
Certified organic plant production also remains highly uneven across provinces. The consistently high coefficients of variation, Gini coefficients, and CR4 and CR8 concentration ratios indicate that a relatively small number of provinces account for a substantial share of national certified production.
However, regional concentration should not be interpreted as a completely fixed geographical structure. The degree of concentration changes across years, and annual Moran’s I statistics show that statistically significant geographical clustering is present in some years but absent in others. These findings suggest that regional heterogeneity is persistent, whereas the strength of geographical clustering varies over time.
This distinction is important. A high concentration ratio indicates that production is unevenly distributed among provinces, whereas Moran’s I evaluates whether provinces with similar production levels are geographically adjacent. A sector can therefore remain highly concentrated without exhibiting statistically significant spatial autocorrelation in every year.
The results consequently provide stronger evidence for persistent regional inequality than for a continuous process of spatial restructuring or geographical diffusion. Changes in the relative positions of individual provinces may reflect differences in agricultural conditions, certification activity, market development, or other regional characteristics, but these mechanisms are not directly identified by the descriptive spatial analysis.
5.3. Market, Demographic, and Digital Conditions
Among the explanatory variables, urbanization rate, population size, and e-commerce purchasing volume are statistically significant in the baseline TWFE model, although their robustness patterns differ.
The positive association between urbanization and certified organic plant production is consistent with the possibility that more urbanized provinces provide stronger market environments for differentiated agricultural products. Urbanization may be associated with greater concentration of consumers, retail infrastructure, logistics networks, and commercial services [34]. These conditions may increase the commercial opportunities available to certified organic products [35]. Importantly, however, the urbanization coefficient becomes statistically insignificant when explanatory variables are lagged by one year. The finding should therefore be interpreted as a contemporaneous conditional association rather than evidence that urbanization causes subsequent growth in certified organic plant production.
Population size exhibits a negative conditional association and is the most stable of the three significant baseline variables across the sensitivity analyses. This result should not be interpreted as indicating that more populous provinces necessarily produce less organic output. The TWFE coefficient is identified from changes within provinces over time after controlling for urbanization, income, agricultural production conditions, ecological indicators, e-commerce development, and common year effects.
One possible interpretation is that population growth may coincide with increasing competition for agricultural land and broader structural shifts away from land-intensive primary production. It may also capture demographic and economic changes not fully represented by the other covariates. These mechanisms remain interpretive possibilities rather than empirically identified channels. Further research using more disaggregated land-use, producer, and demographic data would be required to explain the negative conditional relationship.
E-commerce purchasing volume is positively associated with certified organic plant production in the baseline model and remains significant after winsorization and the exclusion of 2023. This result is consistent with the argument that a more developed digital market environment may be associated with better access to geographically dispersed consumers and improved circulation opportunities for differentiated agricultural products.
Nevertheless, D1 measures aggregate provincial e-commerce purchasing activity rather than online sales of certified organic products or the digital adoption of organic producers. Moreover, its coefficient becomes statistically insignificant at the 5% level when explanatory variables are lagged by one year and when production is normalized by total sown area. The evidence therefore supports a positive contemporaneous association between the broader digital market environment and certified organic plant production, but it does not establish a causal effect of e-commerce development.
5.4. Agricultural Production and Ecological Transition Conditions
In contrast to the market and demographic variables discussed above, effective irrigation area, agricultural machinery power, total sown area, urban disposable income, fertilizer application, and pesticide use are not statistically significant in the baseline TWFE specification.
The absence of statistical significance should not be interpreted as evidence that agricultural infrastructure or ecological conditions are irrelevant to organic production. Rather, the results indicate that changes in these broad provincial indicators are not independently associated with changes in certified organic plant production once the remaining covariates, province fixed effects, and year fixed effects are controlled for.
This finding is particularly important for interpreting irrigation and mechanization. These variables characterize the general agricultural production environment of a province rather than infrastructure specifically used by certified organic producers [36]. Similarly, total sown area captures the overall crop-production base but does not measure certified organic land. Their lack of statistical significance may therefore partly reflect the difference between province-wide agricultural capacity and the more specific conditions under which certified organic production occurs.
The same caution applies to fertilizer and pesticide use. Organic standards restrict the use of synthetic chemical inputs within certified production systems, but the fertilizer and pesticide variables used in this study refer to overall provincial agriculture. They should therefore be understood as indicators of the broader conventional agricultural environment rather than direct measures of practices on certified organic farms.
The non-significant coefficients consequently provide no empirical basis for claiming that fertilizer use constrains certified organic plant production or that irrigation and mechanization promote it within the present dataset. More direct measures of certified organic land, farm-level management, input use, certification costs, and conversion conditions would be needed to test these mechanisms more precisely.
5.5. Descriptive Spatial Clustering Versus Residual Spatial Dependence
One of the most important methodological findings of this study is the distinction between descriptive geographical clustering and econometrically identified spatial dependence.
Annual Moran’s I statistics indicate significant positive spatial autocorrelation in 2018–2021 and 2023. At the descriptive level, provinces with similar levels of certified organic plant production therefore tended to be geographically clustered in these years. However, this pattern is not present throughout the study period and disappears entirely in 2022.
More importantly, the SAR, SEM, and SDM results provide no evidence of statistically significant residual spatial dependence after observed provincial characteristics and province and year fixed effects are controlled for. The spatial autoregressive parameter in the SAR, the spatial error parameter in the SEM, and the spatial autoregressive parameter in the SDM are all statistically insignificant. Model-selection criteria also favor the more parsimonious TWFE specification.
These findings indicate that significant Moran’s I statistics should not automatically be interpreted as evidence of interregional spillover. Descriptive clustering may arise because neighboring provinces share similar climatic conditions, agricultural structures, market environments, institutional settings, or other characteristics. Once observable covariates and persistent provincial and common temporal factors are controlled for, the present analysis does not identify additional robust spatial dependence.
Accordingly, the results do not support the earlier interpretation of China’s organic agricultural development as a process of “local growth–regional diffusion–dynamic restructuring.” Nor do they provide sufficient evidence to attribute regional patterns to technology diffusion, policy learning, industrial cooperation, or market spillovers.
Instead, the evidence supports a more conservative conclusion: certified organic plant production is regionally concentrated and exhibits significant geographical clustering in particular years, but robust conditional spatial spillovers are not detected. This distinction is important both substantively and methodologically, because it prevents descriptive spatial similarity from being conflated with evidence of interregional transmission mechanisms.
6. Conclusions and Policy Implications
6.1. Conclusions
Using a balanced panel of 31 provincial-level regions in China from 2014 to 2023, this study examined the temporal dynamics, regional heterogeneity, and provincial factors associated with certification-recorded production of primary organic plant products. The analysis combined descriptive concentration measures, annual Global Moran’s I statistics, a two-way fixed-effects model, spatial-model comparisons, and robustness analyses.
The results reveal substantial temporal volatility in certified organic plant production. National production did not follow a continuous growth trajectory during the study period, but instead experienced several periods of decline and recovery, followed by a particularly large increase in 2023. This increase was geographically widespread rather than being attributable to a single province. Nevertheless, the present analysis does not identify the specific institutional, market, or production factors underlying this change, and the 2023 increase should therefore be interpreted primarily as a descriptive temporal feature.
Regional disparities also remained pronounced throughout the study period. The coefficient of variation, Gini coefficient, and concentration ratios consistently indicate that a relatively small number of provinces accounted for a substantial proportion of national certified organic plant production. At the same time, spatial clustering was not continuously present. Global Moran’s I was statistically significant in 2018–2021 and 2023, whereas no significant global spatial autocorrelation was detected in the remaining years. The spatial distribution of certified production is therefore characterized by persistent regional concentration but temporally varying geographical clustering.
The TWFE results further show that urbanization rate and e-commerce purchasing volume are positively associated with certified organic plant production, whereas population size exhibits a significant negative conditional association. The negative population coefficient remains relatively stable across alternative specifications. By contrast, the positive associations of urbanization and e-commerce remain significant under several contemporaneous robustness tests but become statistically insignificant at the 5% level when explanatory variables are lagged by one year. These findings therefore support an interpretation in terms of conditional associations rather than causal effects.
The remaining production and ecological variables—including effective irrigation area, agricultural machinery power, total sown area, urban disposable income, fertilizer application, and pesticide use—are not statistically significant in the baseline model. The results consequently do not provide sufficient evidence that changes in these broad provincial indicators are independently associated with changes in certified organic plant production after other covariates and fixed effects are controlled for.
Finally, comparison of the TWFE, SAR, SEM, and SDM specifications reveals no robust residual spatial dependence after observed provincial characteristics and province and year fixed effects are taken into account. The spatial parameters are statistically insignificant, and model-selection criteria favor the more parsimonious TWFE specification. This finding highlights an important distinction between regional concentration, descriptive spatial clustering, and econometrically identified spatial dependence. Significant geographical clustering in particular years should not automatically be interpreted as evidence of persistent regional spillover effects.
6.2. Policy Implications
Several policy implications follow from these findings. First, the persistent regional concentration of certified organic plant production suggests that organic agricultural policy should take provincial heterogeneity into account. Regions differ substantially in agricultural structures, market environments, demographic conditions, and certification activity. A uniform development strategy may therefore be less appropriate than policies adapted to regional characteristics and existing production conditions.
Second, the positive contemporaneous associations of urbanization and e-commerce with certified organic plant production suggest that the broader market environment may be relevant to the development of the organic sector. Improving certification transparency, product traceability, logistics services, market information, and access to digital distribution channels may help create more favorable market conditions for certified organic producers. In particular, digital channels may provide additional opportunities for producers located away from major consumer markets to access geographically dispersed demand. However, because the e-commerce relationship is not robust to the lagged specification, these policy implications should be interpreted cautiously rather than as evidence of a proven causal effect.
Third, the results emphasize the importance of improving the quality and consistency of organic certification data. More standardized reporting of product categories, production units, certification status, certified land area, renewal records, and production quantities would improve the monitoring of regional organic agricultural development and strengthen the empirical basis for future policy evaluation.
Finally, the absence of robust residual spatial dependence suggests that policy should not assume that organic agricultural development in one province will automatically generate measurable spillover effects in neighboring provinces. Cross-regional cooperation in certification, logistics, information exchange, and market development may still be valuable, but such cooperation should be justified by institutional and practical considerations rather than by presumed spatial spillovers that are not supported by the present econometric results.
6.3. Limitations and Future Research
Several limitations should be acknowledged. The dependent variable represents certification-recorded production rather than independently verified realized output or market sales, and the analysis does not distinguish among individual plant-product categories. In addition, several explanatory variables are broad provincial proxies. For example, e-commerce purchasing volume represents the overall digital market environment rather than direct online sales of certified organic products, while fertilizer and pesticide use describe general provincial agriculture rather than management practices on certified organic land.
The provincial scale may also conceal substantial within-province heterogeneity, and the observational panel design does not establish causal relationships despite the use of province and year fixed effects and lagged-variable sensitivity tests. Future research could therefore use crop-specific and more spatially disaggregated data, direct measures of certified organic land and digital transactions, alternative measures of interregional connectivity, and stronger identification strategies—for example, dynamic panel approaches such as panel vector autoregression or random-intercept cross-lagged panel models, which have been applied to examine reciprocal dynamics between online engagement and behavioral outcomes [37,38].
Supplementary Materials
The following supporting information can be downloaded at: https://www.mdpi.com/article/10.3390/land15112065/s1, Table S1: Correlation Matrices and Multicollinearity Diagnostics.
Author Contributions
Conceptualization, Y.Y., S.W. and T.D.; Methodology, Y.Y.; Software, Y.Y.; Validation, Y.Y.; Formal analysis, Y.Y.; Investigation, Y.Y.; Resources, S.W., Q.W. and T.D.; Data curation, Y.Y. and Q.W.; Writing—original draft, Y.Y. and S.W.; Writing—review and editing, Y.Y., S.W., Q.W. and T.D.; Visualization, Y.Y., S.W., Q.W. and T.D.; Supervision, S.W., Q.W. and T.D.; Project administration, S.W., Q.W. and T.D.; Funding acquisition, S.W., Q.W. and T.D. All authors have read and agreed to the published version of the manuscript.
Funding
This research was supported by the China Scholarship Council (No. 202309370027).
Institutional Review Board Statement
Not applicable.
Informed Consent Statement
Not applicable.
Data Availability Statement
The data that support the findings of this study are available from the Qiyan Social Science Big Data Platform (CCAD database) at “https://r.qiyandata.com/data/navigate (accessed on 15 August 2025)”, under “Agricultural Research (CCAD) > Agricultural Product Research > China Food Safety Research Database > Food and Agricultural Product Certification > Organic Product Certificate Information Table.” Restrictions may apply to the availability of these data because access to the database may require institutional authorization. The processed data underlying the analyses presented in this study are available from the corresponding author upon reasonable request.
Conflicts of Interest
The authors declare no conflicts of interest.
References
- Willer, H.; Trávníček, J.; Schlatter, B. The World of Organic Agriculture. Statistics and Emerging Trends 2025; Research Institute of Organic Agriculture (FiBL): Frick, Switzerland; IFOAM—Organics International: Bonn, Germany, 2025. [Google Scholar]
- Yang, Y.; Wang, S.; Wang, Q.; Azadi, H.; Dogot, T. Perceived Value and Organic Food Purchase Intention for Sustainable Agricultural Development: An Extended Theory of Planned Behavior in Shandong, China. Sustainability 2026, 18, 10419. [Google Scholar] [CrossRef] [Scilit]
- Derunova, E.; Vasilchenko, M.; Firsova, A.; Vavilina, A.; Makarova, E.L.; Makarova, E.A. Priorities for Sustainable Development of Regional Agri-Food Systems in the Context of Achieving Food Security. Sustainability 2026, 18, 7994. [Google Scholar] [CrossRef] [Scilit]
- Tahat, M.M.; Alananbeh, K.M.; Othman, Y.A.; Leskovar, D.I. Soil Health and Sustainable Agriculture. Sustainability 2020, 12, 4859. [Google Scholar] [CrossRef] [Scilit]
- Barbieri, P.; Pellerin, S.; Seufert, V.; Smith, L.; Ramankutty, N.; Nesme, T. Global option space for organic agriculture is delimited by nitrogen availability. Nat. Food 2021, 2, 363–372. [Google Scholar] [CrossRef] [Scilit] [PubMed]
- Wang, Q.; Yang, R.; Zhang, Y.; Yang, Y.; Hao, A.; Yin, Y.; Li, Y. Inequality of carbon emissions between urban and rural residents in China and emission reduction strategies: Evidence from Shandong Province. Front. Ecol. Evol. 2024, 12, 1256448. [Google Scholar] [CrossRef] [Scilit]
- Systemiq. China’s Food Future; Gordon and Betty Moore Foundation: Palo Alto, CA, USA, 2026. [Google Scholar]
- State Administration for Market Regulation China Food and Agricultural Product Certification System. Available online: https://ffip.cnca.cn/food/login(0901) (accessed on 10 October 2025). (In Chinese)
- The State Administration for Market Regulation. Measures for the Administration of Organic Product Certification. 1 April 2014. Available online: https://www.samr.gov.cn/zw/zfxxgk/fdzdgknr/fgs/art/2023/art_8af5fb561be24a5b9c8a63a56421450e.html (accessed on 12 October 2025). (In Chinese)
- CNCA. Revised Organic Product Certification Implementation Rules; CNCA: Beijing, China, 2019.
- GB/T 19630-2019; Organic Products—Requirements for Production, Processing, Labeling and Management System. State Administration for Market Regulation: Beijing, China, 2019.
- Hu, S.; Wang, Y.; Liu, Y. Understanding organic agriculture based on coupled human-earth systems for sustainable land use and rural development in China. Land Use Policy 2025, 152, 107506. [Google Scholar] [CrossRef] [Scilit]
- Guo, H.; Li, Y.; Hou, M.; Wang, X. The Spatial Distribution and Impacts of Organic Certificates in Southwest China. Sustainability 2023, 15, 14663. [Google Scholar] [CrossRef] [Scilit]
- Aweke, A.T. Health and environmental attitudes as drivers of willingness to pay for organic meat: A study of Norwegian consumers Health and environmental attitudes as drivers of willingness to pay for organic meat: A study of Norwegian consumers. J. Agr. Food Res. 2025, 19, 101711. [Google Scholar] [CrossRef] [Scilit]
- Lu, J.; Liu, Y.; Jing, Q.; Zhang, W. Chinese consumers’ perceptions, attitude, and purchase intention of organic products. Appetite 2025, 214, 108142. [Google Scholar] [CrossRef] [Scilit] [PubMed]
- Zhang, A.; Schrobback, P.; Ha, T.M.; Maxwell, C.; Kinch, N.; Loechel, B.; Feng, N. Sustainable production value vs self-oriented product value in driving organic beef consumption: A comparative analysis of China, the UK and Vietnam. Br. Food J. 2025, 127, 2107–2128. [Google Scholar] [CrossRef] [Scilit]
- Paffarini, C.; Torquati, B.; Cecchini, L. The impact of multiple labeling on consumer choices for extra virgin olive oil: A cross-country study. Agric. Food Econ. 2025, 13, 26–28. [Google Scholar] [CrossRef] [Scilit]
- Quinn, C.; Allen, K.; Quinn, J.; Razo, A.; Andersen, S.; Brown, H. Cultivating connections: A comparison of food producer and consumer values and implications for the viability of local food networks. Agric. Hum. Values 2025, 42, 2233–2246. [Google Scholar] [CrossRef] [Scilit]
- Dima, S.J.; Odero, A.N. Organic Farming for Sustainable Agricultural Production. A Brief Theoretical Review and Preliminary Empirical Evidence. Environ. Resour. Econ. 1997, 10, 177–188. [Google Scholar] [CrossRef] [Scilit]
- O’Kelly, M.; Bryan, D. Agricultural location theory: Von Thunen’s contribution to economic geography. Prog. Hum. Geogr. 1996, 20, 457–475. [Google Scholar] [CrossRef] [Scilit]
- Martínez-Cuenca, M.R.; Martínez-Alcántara, B.; Legaz, F.; Bermejo, A.; Quinones, A. Liquid Organic Fertilizers for Sustainable Agriculture: Nutrient Uptake of Organic versus Mineral Fertilizers in Citrus Trees. PLoS ONE 2016, 11, e0161619. [Google Scholar] [CrossRef] [Scilit] [PubMed]
- Boncinelli, F.; Bartolini, F.; Brunori, G.; Casini, L. Spatial analysis of the participation in agri-environment measures for organic farming. Renew. Agric. Food Syst. 2016, 31, 375–386. [Google Scholar] [CrossRef] [Scilit]
- Hayami, Y.; Ruttan, V.W. Agricultural Development: An International Perspective; The Johns Hopkins University Press: Baltimore, MD, USA, 1985. [Google Scholar]
- Malek, Ž.; Tieskens, K.F.; Verburg, P.H. Explaining the global spatial distribution of organic crop producers. Agric. Syst. 2019, 176, 102680. [Google Scholar] [CrossRef] [Scilit]
- Melamid, A. Von Thunen’s Isolated State: An English Edition of Der Isolierte Staat. Geogr. Rev. 1967, 57, 574–576. [Google Scholar] [CrossRef] [Scilit] [PubMed]
- Pretty, J. Agricultural sustainability: Concepts, principles and evidence. Philos. Trans. R. Soc. B Biol. Sci. 2008, 363, 447–465. [Google Scholar] [CrossRef] [Scilit] [PubMed]
- Qin, Q.; Guo, H.; Shi, X.; Chen, K. Rural E-commerce and County Economic Development in China. China World Econ. 2023, 31, 26–60. [Google Scholar] [CrossRef] [Scilit]
- Krugman, P. Increasing Returns and Economic Geography. J. Polit. Econ. 1991, 99, 483–499. [Google Scholar] [CrossRef] [Scilit] [PubMed]
- CNCA. China’s Organic Product Certification and Organic Industry Development (2024); CNCA: Beijing, China, 2024.
- Moran, P.A.P. Notes on Continuous Stochastic Phenomena. Biometrika 1950, 37, 17. [Google Scholar] [CrossRef] [Scilit]
- Elhorst, J.P. Spatial Econometrics: From Cross-Sectional Data to Spatial Panels; Springer Nature: Berlin/Heidelberg, Germany, 2013. [Google Scholar]
- Cameron, A.C.; Miller, D.L. A Practitioner’s Guide to Cluster-Robust Inference. J. Hum. Resour. 2015, 50, 317–372. [Google Scholar] [CrossRef] [Scilit]
- García-Velázquez, L.; Sánchez-Cueto, P.; Lladó, S.; Gozalo, B.; Ochoa, V.; Bongiorno, G.; Clocchiatti, A.; Barral, M.P.; Stathopoulos, N.; Zoka, M.; et al. Optimizing biodiversity, multifunctionality and yield when transitioning to organic farming. Nat. Sustain. 2026, 9, 682–691. [Google Scholar] [CrossRef] [Scilit]
- Wang, S.; Yang, Y.; Yin, H.; Zhao, J.; Wang, T.; Yang, X.; Ren, J.; Yin, C. Towards Digital Transformation of Agriculture for Sustainable Development in China: Experience and Lessons Learned. Sustainability 2025, 17, 3756. [Google Scholar] [CrossRef] [Scilit]
- Nagy, L.B.; Unger-Plasek, B.; Lakner, Z.; Temesi, Á. Confidence in organic food: A cross-country choice based conjoint analysis of credibility factors. Humanit. Soc. Sci. Commun. 2023, 10, 762. [Google Scholar] [CrossRef] [Scilit]
- Staton, T.; Davison, N.; Westaway, S.; Arguile, L.; Adams, N.; Aguilera, V.; Bellamy, L.; Bolger, A.; Gantlett, R.; Jacobs, S.; et al. Leverage points for the uptake of organic food production and consumption in the United Kingdom. Commun. Earth Environ. 2024, 5, 449. [Google Scholar] [CrossRef] [Scilit]
- Sun, H. The dynamic relationships among AI-assisted formative assessment in music teaching, feedback literacy, and music learning engagement. Front. Psychol. 2026, 17, 1919875. [Google Scholar] [CrossRef] [Scilit] [PubMed]
- Wang, L.; Ma, Y.; Yan, Z.; Zhang, L.; Hu, Y.; Zhao, S. Giving or receiving: Impact of online socializing in online fitness community on physical activity and emotional state. Comput. Hum. Behav. 2025, 169, 108669. [Google Scholar] [CrossRef] [Scilit]
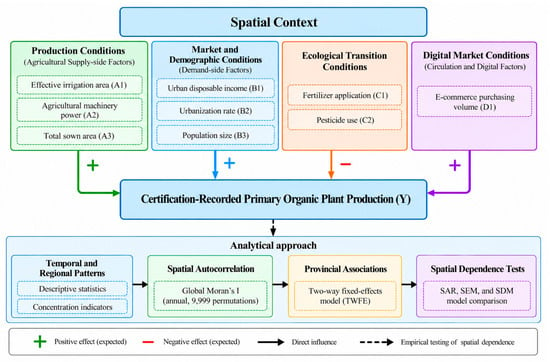
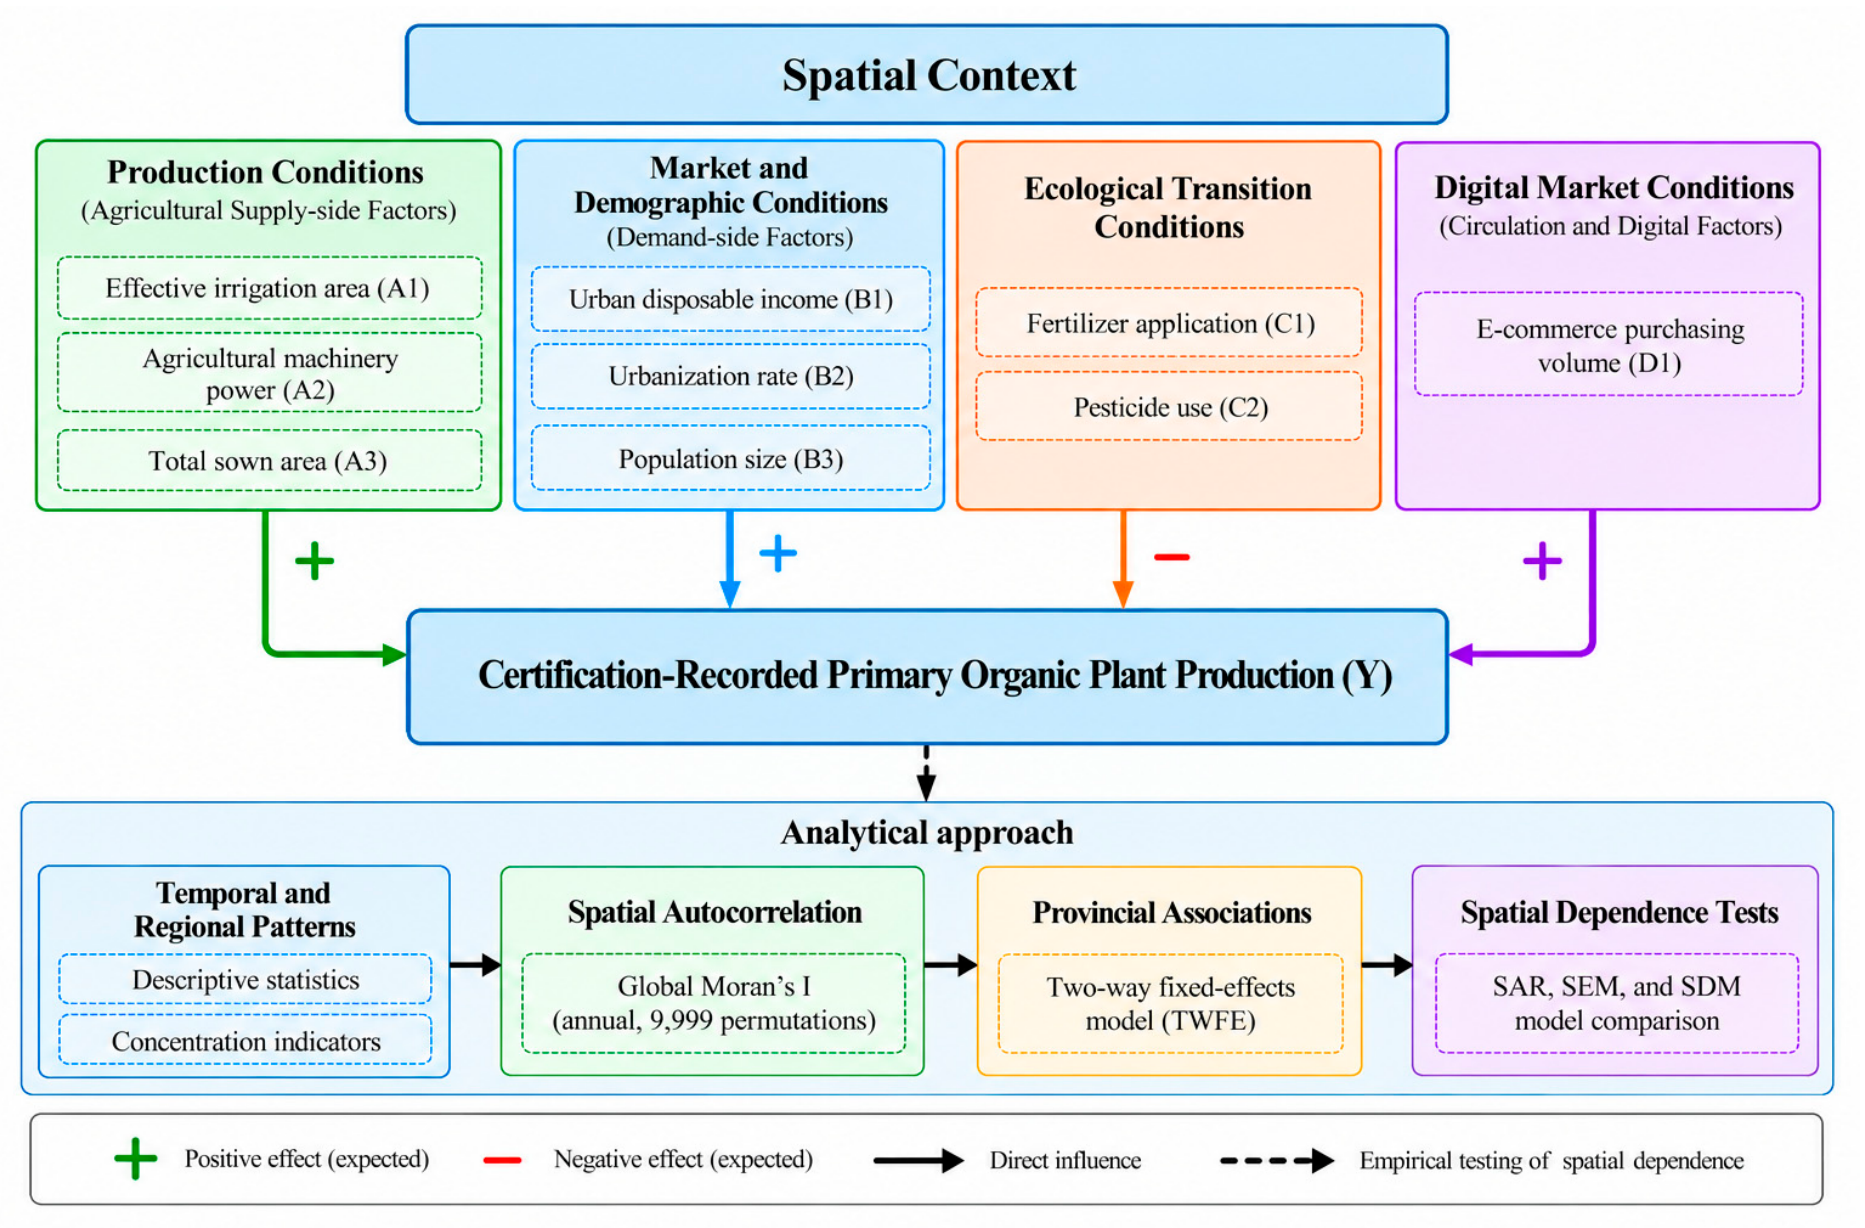
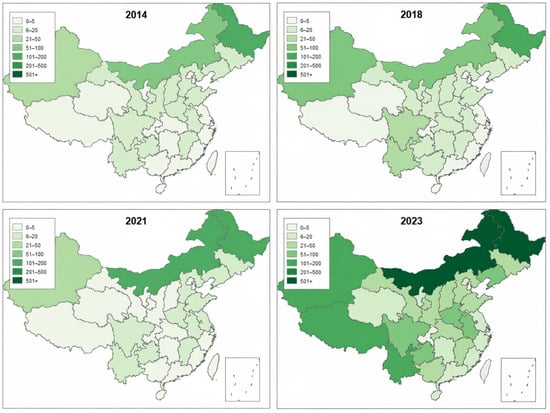
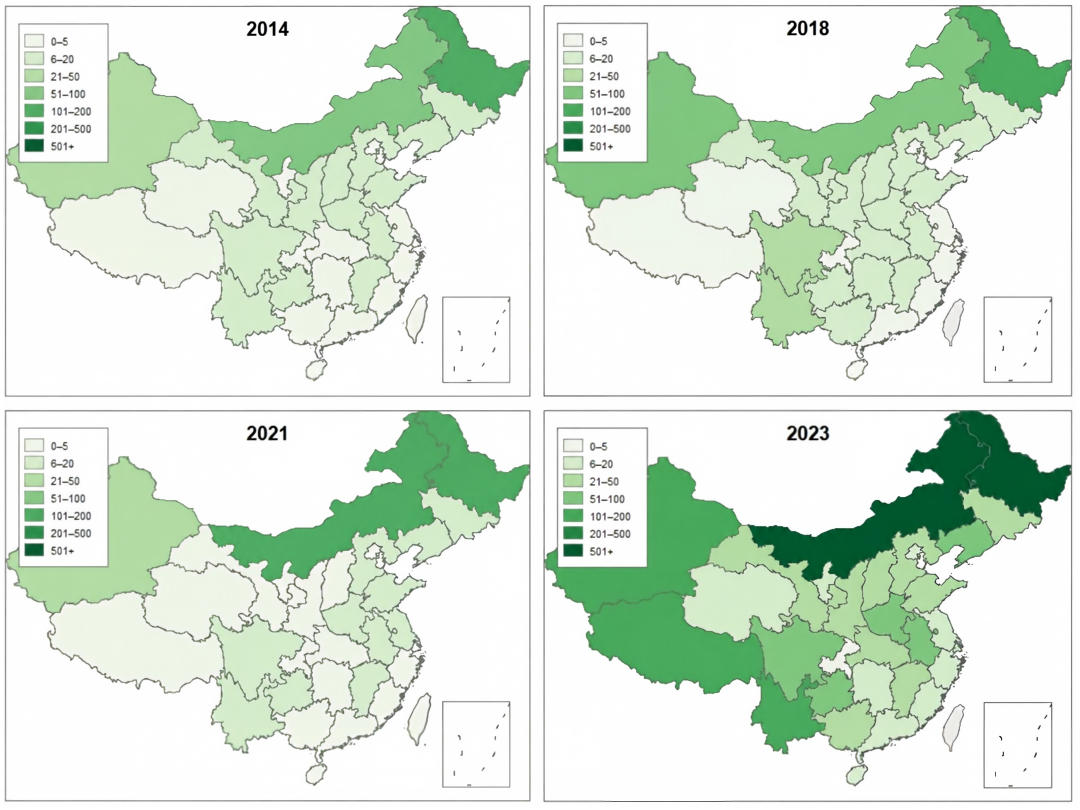

Disclaimer/Publisher’s Note: The statements, opinions and data contained in all publications are solely those of the individual author(s) and contributor(s) and not of MDPI and/or the editor(s). MDPI and/or the editor(s) disclaim responsibility for any injury to people or property resulting from any ideas, methods, instructions or products referred to in the content. |
© 2026 by the authors. Licensee MDPI, Basel, Switzerland. This article is an open access article distributed under the terms and conditions of the Creative Commons Attribution (CC BY) license.