


Abstract
China has implemented long-term and large-scale initiatives to address land and ecosystem sustainability challenges, yet their ecological outcomes and regional differentiation remain insufficiently synthesized within a unified ecological regionalization framework. This study integrates government policies and planning documents, official reports and news, academic publications, and spatial ecological datasets to assess China’s ecological protection and restoration practices and to identify major ecological problems and strategic orientations across 57 ecodistricts. A total of 472 documentary records were retained after screening, and spatial assessments of soil erosion sensitivity, sandification sensitivity, rocky-desertification sensitivity, and vegetation change were conducted using harmonized ecological regionalization units. Between 2005 and 2020, approximately 4.1% of the mapped area experienced ecosystem-type change, while vegetation exhibited an overall greening tendency. National monitoring also indicates continued reductions in soil and water loss, sandification, and rocky desertification. However, ecological pressures remain strongly differentiated among regions, and more than 80% of ecodistricts face three or more major ecological problems. Dominant strategic orientations also vary spatially: protection-oriented strategies are more common in relatively intact and less disturbed regions, restoration-oriented strategies are concentrated in areas with stronger degradation and human disturbance, and integrated protection–restoration strategies occur mainly where conservation and intensive land use coexist. These findings demonstrate that China has achieved substantial overall ecological improvement, but recovery remains spatially uneven and constrained by overlapping pressures. China’s experience suggests that long-term commitment, sustained investment, ecological regionalization, and differentiated interventions are important for ecosystem sustainability, while context-specific adaptation and explicit consideration of social–ecological trade-offs are essential for broader transferability.
1. Introduction
The pursuit of sustainable development represents a multifaceted global challenge. Policy advancements, international collaboration, climate change mitigation, and ecosystem service preservation are intricately interlinked across spatial and temporal scales [1,2]. Simultaneously addressing these intertwined challenges demands holistic and systemic measures [2,3]. Such measures must account for diverse elements, varying scales, and temporal dynamics. These include the intricate interactions between human systems and natural ecosystems [4], comprehensive system-wide and regional dynamics [5], and the complexities of temporal sequencing [6]. Consequently, such measures are pivotal in mitigating uncoordinated and potentially detrimental impacts [2].
Sustainable development policies must prioritize the preservation of ecosystem services that underpin human well-being and ensure ecological equilibrium [7]. Unsustainable exploitation and degradation of natural resources have subjected China to profound ecological and environmental crises, indirectly intensifying social challenges such as poverty and famine [8]. By the mid-19th century, the rapid expansion of China’s population and economy marked a pivotal turning point in its ecological history. To expedite development, China undertook large-scale exploitation of its ecological resources, often at the expense of environmental integrity. The widespread depletion of ecological components, the decline in ecosystem functionality, and the deterioration of environmental quality collectively precipitated large-scale ecological crises across China. Around the mid-20th century, substantial forest resources were exploited to support industrial and economic development [9], contributing to widespread environmental degradation. Natural forest area declined from approximately 102.0 Mha in 1949 to 98.2 Mha in 1975 and further to 66.7 Mha in 1993, illustrating the sustained pressure on forest ecosystems during this period. Together with broader socioeconomic and climatic factors, these environmental pressures exacerbated ecological and livelihood vulnerability [8]. Following 1960, forests and grasslands were extensively converted to farmland in efforts to increase agricultural production, often without adequate ecological planning. Soil erosion also became a major environmental concern: approximately 360 Mha of land was affected, with annual soil loss estimated at about 5 billion tons. Of the affected area, approximately 75 Mha was located within the Yangtze and Yellow River basins, contributing to serious problems of sedimentation, flooding, and water-quality deterioration [9,10,11]. This unregulated exploitation precipitated the rapid degradation of various ecosystems [8,12]. Uncontrolled deforestation continued beyond 1990 [13,14], resulting in serious ecological problems such as water pollution, soil erosion, and desertification [12,15,16]. In response to these ecological crises, China has developed a comprehensive framework of policies and implemented an array of ecological programs. These initiatives are designed to tackle critical challenges, including water and soil loss, biodiversity decline, and escalating desertification. These integrated sustainable development measures have produced substantial ecological improvements. China’s forest cover increased markedly, reaching 22.2% of the national land area in 2015, while the extent of protected areas approximately doubled [9,17]. Conservation and restoration efforts have also contributed to increasing vegetation greenness. In the Three-North region, barren and sparsely vegetated land decreased by approximately 7 Mha between 2001 and 2010, reaching 178.65 Mha by 2010. A historic shift has taken place regarding desertification, accompanied by a marked reduction in the frequency of dust storms [18,19]. Soil and water erosion has been alleviated, together with reductions in sediment loads and improvements in water quality. Across 11 major river systems in China, soil erosion decreased by an average of 45.4% during 2003–2007 compared with 1998–2002 [17,20]. In addition, the establishment of an extensive nature reserve system has effectively curbed the decline in biodiversity [21,22].
Ecological restoration represents a pivotal, integrative, and sustainable approach to land and ecosystem management [23]. It leverages the synergy of natural resilience and targeted human interventions to restore and rehabilitate ecosystem components and structures, with the ultimate goal of enhancing human well-being and ensuring ecological equilibrium [24]. Numerous studies have examined major national ecological initiatives in China, including the Three-North Shelterbelt Program [18,19], the Grain-for-Green Program [12], the Natural Forest Conservation Program [21], and the Ecological Conservation and Restoration of Mountains, Waters, Forests, Fields, Lakes, and Grasslands Program [25]. China’s large-scale and comprehensive land and ecosystem sustainability initiatives provide an important case for evaluating the effectiveness and limitations of national-scale ecological interventions. The problem of ecosystem degradation has been significantly alleviated. This underscores the feasibility of overcoming the challenges associated with implementing the Sustainable Development Goals (SDGs) at the national scale. National-scale assessments of China’s ecological conservation and restoration have increased substantially in recent years [26]. Comprehensive national responses to ecological sustainability challenges remain underexplored.
The purpose of this study is to systematically assess China’s long-term responses to land and ecosystem sustainability challenges and to reveal how ecological problems and corresponding strategic orientations vary across ecological regions. To achieve this, we integrate government policies and planning documents, official reports and news, academic publications, and spatial ecological datasets to (1) characterize the evolution and overall outcomes of China’s ecological protection and restoration efforts; (2) assess the spatial differentiation of major ecological pressures and vegetation change within a hierarchical ecological regionalization framework and identify the dominant and co-occurring ecological problems across ecodistricts; and (3) classify the dominant protection–restoration orientations of different ecodistricts and examine the institutional mechanisms, transferable lessons, and potential trade-offs associated with China’s experience. By linking national-scale ecological changes with ecological regionalization and region-specific strategic responses, this study aims to provide a more spatially differentiated understanding of China’s ecosystem sustainability practices and to offer reference for the design of context-specific ecological governance strategies in other regions and countries.
2. Methodology
2.1. Selection of Ecological Regionalization
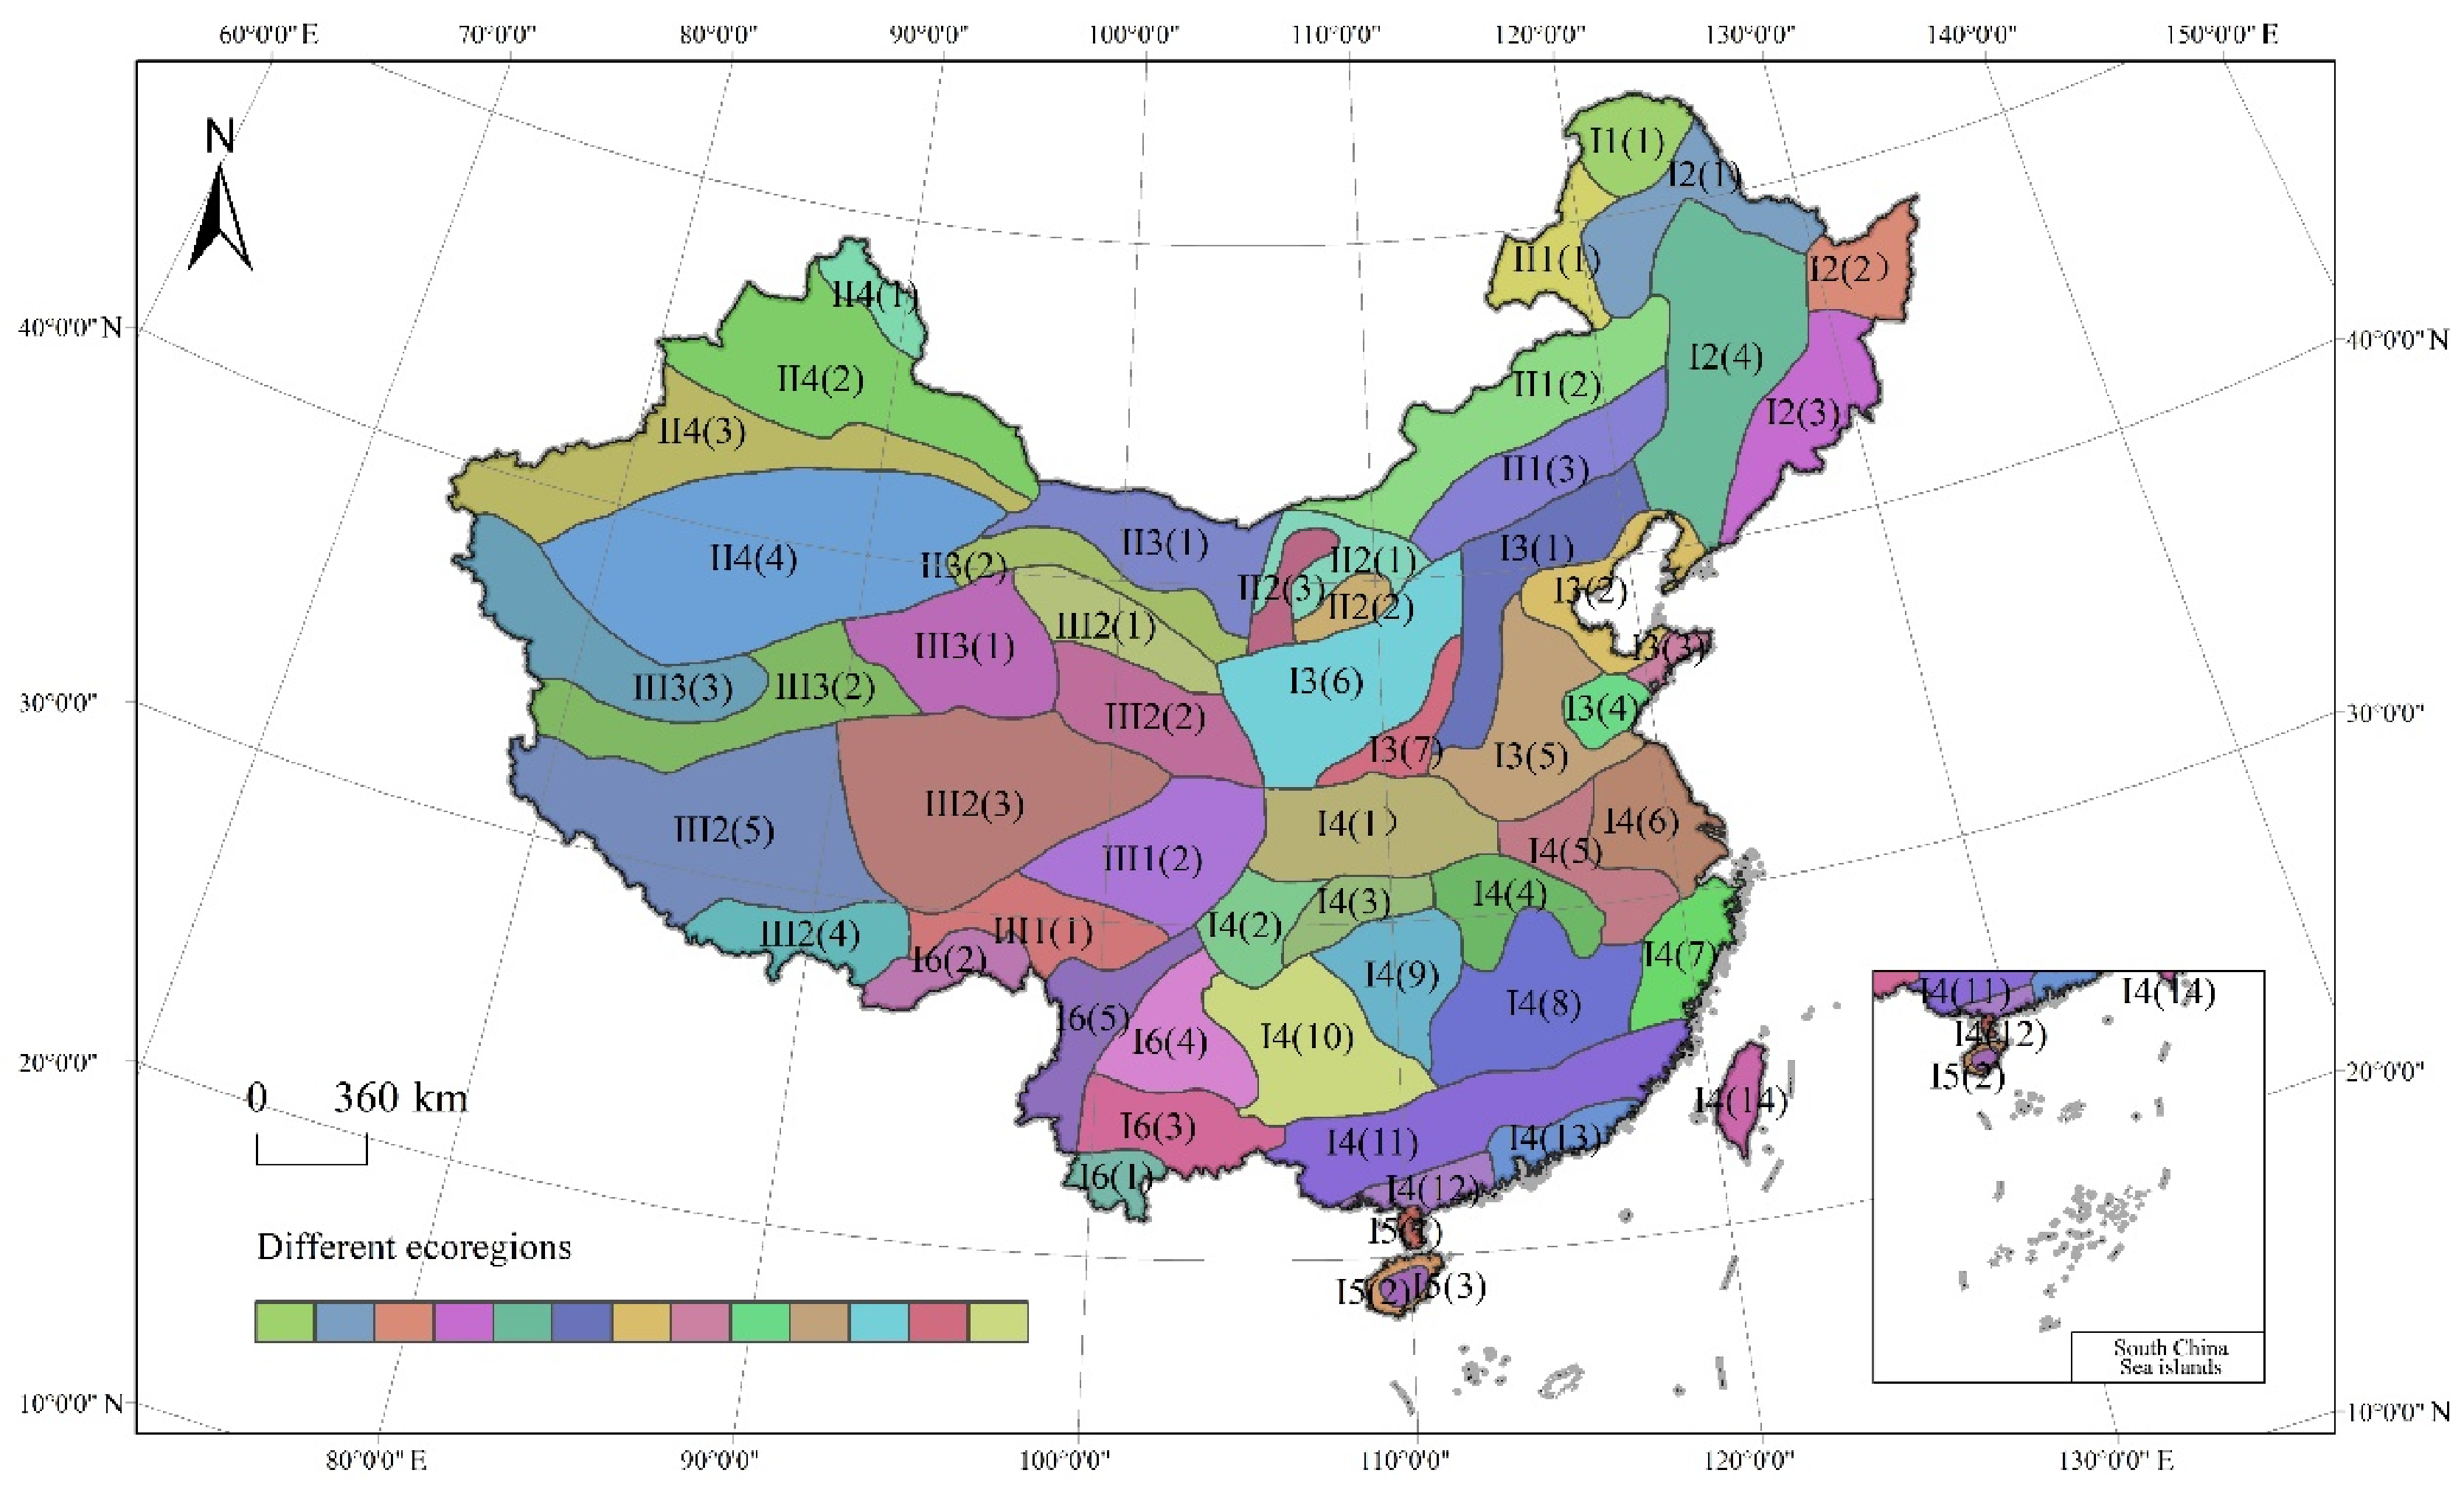
Ecological regionalization underpins the rational management and sustainable utilization of ecosystems and natural resources, providing a scientific foundation for ecological environment construction and environmental management policy formulation. As ecology develops, the study of human–ecosystem interactions has become a key field of ecological research. Consequently, ecological regionalization and ecological mapping have garnered increasing attention and have been extensively developed in many countries. This study draws on the ecological regionalization scheme of China by academician Fu Bojie, a renowned Chinese natural geographer and landscape ecologist [27]. The scheme represents an in-depth study of the characteristics and regulations of China’s ecological territories, ecological service functions, ecological assets, ecological sensitivity, and the impact of human activities on the ecological environment. It comprehensively considers natural and anthropogenic elements such as light, temperature, water, soil, wind, heat, vegetation, topography, geomorphology, and human activities. It establishes the principles, methods, and indicator systems of China’s ecological regionalization, and then merges and distinguishes the relevant ecological regions. It divides China into 3 ecological domains, 13 ecoregions, and 57 ecodistricts (Figure 1). Here, ecoregion and ecodistrict denote distinct hierarchical levels of the ecological regionalization system rather than interchangeable spatial units.
Figure 1.
Ecoregions map of China (the names of the detailed ecological regions are shown in Table A1: Ecological regionalization of China).
2.2. Identification of Major Ecological Problems and Orientation of Ecological Conservation and Restoration
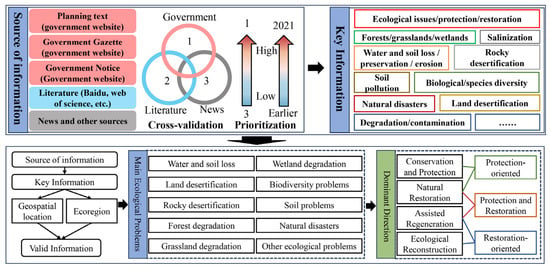
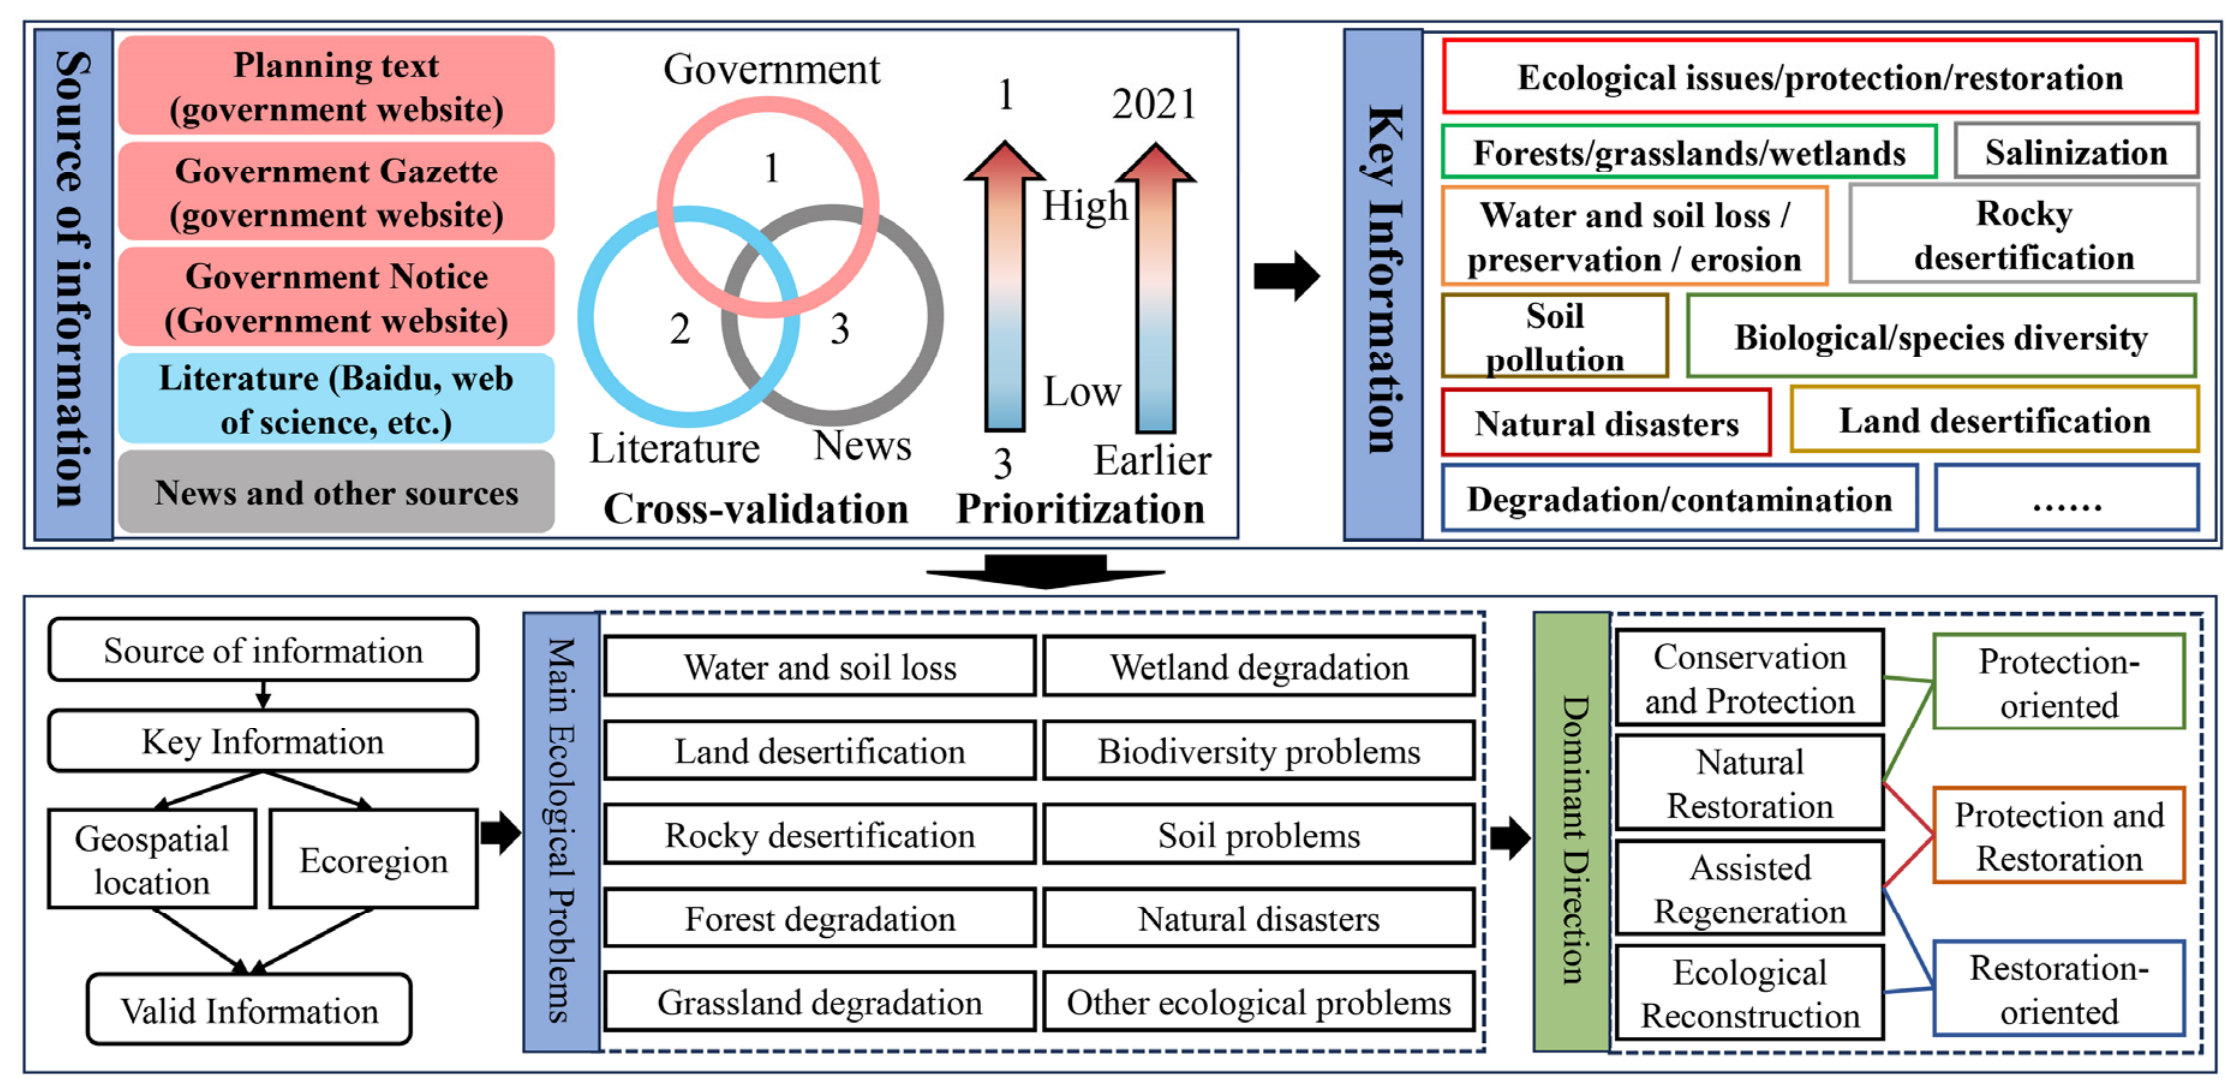
This study establishes a robust data extraction framework based on targeted keywords and source classification (Figure 2). It integrates ecosystem issues across ecological zones to enhance contextual specificity at the regional scale. The information used to identify ecological problems and protection–restoration measures was compiled from multiple source types. Government information was collected from official government websites and included local policy documents, ecological conservation and restoration plans, implementation plans, official announcements, and government news reports. Academic publications were retrieved from the China National Knowledge Infrastructure (CNKI) and Web of Science databases and focused on regional ecological problems, ecological protection, and ecological restoration in China. Keywords—such as ecological degradation, protection, restoration, forests, grasslands, wetlands, biodiversity, water and soil loss, land desertification, and rocky desertification—were extracted from government documents, official news (announcements), and academic publications. Several thousand records were initially retrieved. After screening for relevance to the study objectives, spatial applicability, ecological content, and information on protection or restoration practices, 472 records were retained for analysis. Among the records retained after screening, government documents, official news reports and academic publications accounted for 8.5%, 16.9% and 74.6%, respectively. Because these records constituted the analytical source database rather than individually cited evidence, they were not all included in the manuscript reference list. These data were combined with geospatial information and refined through expert review. The resulting synthesis enabled systematic identification and analysis of ecological conditions and challenges across different ecodistricts.
Figure 2.
Research framework for major ecological problems and strategic orientations.
The study period was terminated in 2021 to maintain temporal consistency among policy, project, and ecological-condition datasets. The 2020–2021 period also coincided with disruptions to project implementation and information reporting associated with the COVID-19 pandemic. Extending the assessment beyond 2021 would therefore introduce temporal inconsistencies among the heterogeneous data sources and was considered beyond the scope of the present study.
In the information screening process, this study considered plans, bulletins, and announcements on the ecological status and problems of districts issued by various government levels as the most authoritative and credible sources (priority information sources), conducting preliminary screening chronologically. The status and problems related to each eco-region in recent years were summarized based on these principles. When government information was unavailable, the study screened the relevant literature (secondary sources) and integrated the information chronologically. If neither primary nor secondary sources were available, news was used as an alternative source to screen information about the ecological status and problems of the zone. The actual screening process often involves three levels of information sources—government, the scholarly literature, and news—to cross-verify and identify the ecological status and problems of each zone more scientifically.
The International Society for Ecological Restoration (SER), in its International Standards for Ecological Restoration Practices, categorizes ecological restoration into three types: natural regeneration, assisted regeneration, and ecological reconstruction [28]. Based on this, China has set higher standards and more detailed categories for ecological restoration. A policy document jointly issued by China’s Ministry of Natural Resources, the Ministry of Ecology and Environment, and other relevant government departments identifies four types of ecological restoration models [29]. These are protection and conservation, natural restoration, assisted regeneration, and ecological reconstruction. This study adopts these four classification modes, aligning with China’s reality, and merges and summarizes them. Three dominant directions were identified: protection-oriented, restoration-oriented, and combined protection and restoration. This aims to provide a foundational reference for future comprehensive ecological protection and restoration efforts in China. The determination of dominant ecological governance directions is based on the specific ecological issues and policy measures within each ecodistrict. For example, ecodistricts in which soil erosion control and afforestation predominate are classified as restoration-oriented, whereas those emphasizing biodiversity conservation and forest management are categorized as protection-oriented. Ecodistricts in which protection and restoration measures occur with comparable frequency (<20 percentage points) are classified as integrated protection–restoration areas.
2.3. Attention to Ecological Problems
A substantial proportion of the academic literature, government documents, and news reports use administrative boundaries as their primary spatial units of analysis or reporting. Consequently, this study adopted bibliometric methods to analyze the status of diverse ecosystems in China at the administrative scale, leveraging the results to identify and prioritize critical ecological challenges. The primary research literature sources were retrieved from the China National Knowledge Infrastructure (CNKI) and Web of Science databases. Keywords related to ecological issues and geographic locations were extracted, and the literature records were categorized by province and city. Disparities in economic capacity and research capabilities among China’s cities and provinces may lead to cognitive biases arising from information asymmetry. To reduce potential bias associated with differences in publication volume among regions, the frequency of the literature addressing individual ecological issues was normalized before regional comparison. The corresponding calculation formula is detailed as follows:
In the formula, Ac represents the ecological attention index for a specific city or region. Lse denotes the total frequency of occurrences in the literature in which a specific type of ecological issue is the primary theme within a given region or city. Lall represents the total volume of literature collected for a specific region or city. To enable regional comparability, Ac was standardized in this study. Acs refers to the standardized ecological attention index, A to the ecological attention index of an ecological district, and Acsi to that of a city within the ecological district. It should be added that administrative unit data were spatially converted to the ecological regionalization framework through GIS-based boundary overlay. To improve spatial precision, county-level administrative units were used rather than prefecture-level cities. County boundaries were intersected with the boundaries of ecological domains, ecoregions, and ecodistricts, and the resulting spatial correspondence was used to aggregate administrative information to ecological units. This finer administrative resolution reduces, but does not eliminate, the uncertainty arising from the mismatch between administrative and ecological boundaries.
2.4. Ecological Sensitivity and Vegetation Change Assessment
Soil erosion sensitivity was assessed based on the principal factors represented in the Universal Soil Loss Equation framework. Rainfall erosivity, soil erodibility, topographic conditions, and vegetation cover were selected as the major controlling factors. Specifically, the evaluation factors included rainfall erosivity (Ri), soil erodibility (Ki), the slope-length and slope-steepness factor (LSi), and the land-cover factor (Ci). GIS-based spatial overlay analysis was used to integrate the single-factor sensitivity layers and derive the soil erosion sensitivity index for each spatial unit.
where SSi represents the soil erosion sensitivity index of spatial unit i; Ri, Ki, LSi, and Ci denote the sensitivity values associated with rainfall erosivity, soil erodibility, topographic conditions, and vegetation cover, respectively. In addition, the natural breaks method was used for sensitivity classification in this study.
Sandification sensitivity was evaluated using four major controlling factors: aridity, the number of days with sand-carrying winds, soil texture, and vegetation cover. The sensitivity layer for each factor was first generated and then integrated using GIS-based spatial overlay analysis to obtain the sandification sensitivity index:
where Di represents the sandification sensitivity index of spatial unit i; Ii, Wi, Ki, and Ci denote the sensitivity values corresponding to the aridity index, number of days with sand-carrying winds, soil texture, and vegetation cover, respectively.
Rocky-desertification sensitivity was assessed primarily on the basis of karst distribution, terrain slope, and vegetation cover. Within karst areas, vegetation cover and terrain slope sensitivity layers were classified and integrated using GIS-based spatial overlay analysis to derive the rocky-desertification sensitivity index:
where Si represents the rocky-desertification sensitivity index of spatial unit i, and Ci and Pi denote the sensitivity values associated with vegetation cover and terrain slope, respectively. The vegetation-cover data and processing procedures were consistent with those used in the sandification assessment, whereas the terrain-slope data were processed in a manner that was consistent with the topographic data used in the soil erosion assessment.
To characterize ecological sensitivity at different levels of ecological regionalization, the areas of different sensitivity classes were summarized for each ecological domain, ecoregion, and ecodistrict. The proportions of sensitive area and highly sensitive area were calculated using the corresponding class areas relative to the total valid area of each ecological unit. In addition, a comprehensive sensitivity index was calculated as follows:
where An represents the area assigned to sensitivity class n, n is the numerical weight corresponding to that sensitivity level, m is the total number of sensitivity classes, and Atotal represents the total valid area of the ecological unit.
Vegetation change was assessed using the Normalized Difference Vegetation Index (NDVI). To minimize the influence of persistently non-vegetated surfaces, pixels with NDVI values ≤ 0.1 in both 2005 and 2020 were excluded from the vegetation-change analysis. Pixels with NDVI > 0.1 in either year were retained so that transitions from vegetated to sparsely vegetated conditions, or vice versa, could still be captured [30]. The NDVI change was calculated as follows:
ΔNDVI = NDVI2020 − NDVI2005
Because minor NDVI fluctuations may result from interannual climatic variability and residual remote-sensing uncertainty, changes within −0.01 ≤ ΔNDVI ≤ 0.01 were classified as stable or minimal change. Pixels with ΔNDVI > 0.01 were classified as vegetation increase, whereas those with ΔNDVI < −0.01 were classified as a vegetation decrease. For each ecological unit, the mean ΔNDVI and the proportions of vegetation-increase, stable, and vegetation-decrease areas were calculated.
Soil erosion sensitivity, sandification sensitivity, and rocky-desertification sensitivity data were obtained from the Research Center for Eco-Environmental Sciences, Chinese Academy of Sciences, with 2020 used as the common reference year for spatial comparison (https://rcees.cas.cn/). Ecosystem data were obtained from the Resource and Environmental Science and Data Center, Chinese Academy of Sciences, and the 2020 dataset was used to characterize contemporary ecosystem distribution (https://www.resdc.cn/). NDVI data for 2005 and 2020 were obtained from the same data center and were used to quantify the vegetation change over the 2005–2020 period.
3. Result Analysis
3.1. National Patterns of Ecosystem Distribution and Change
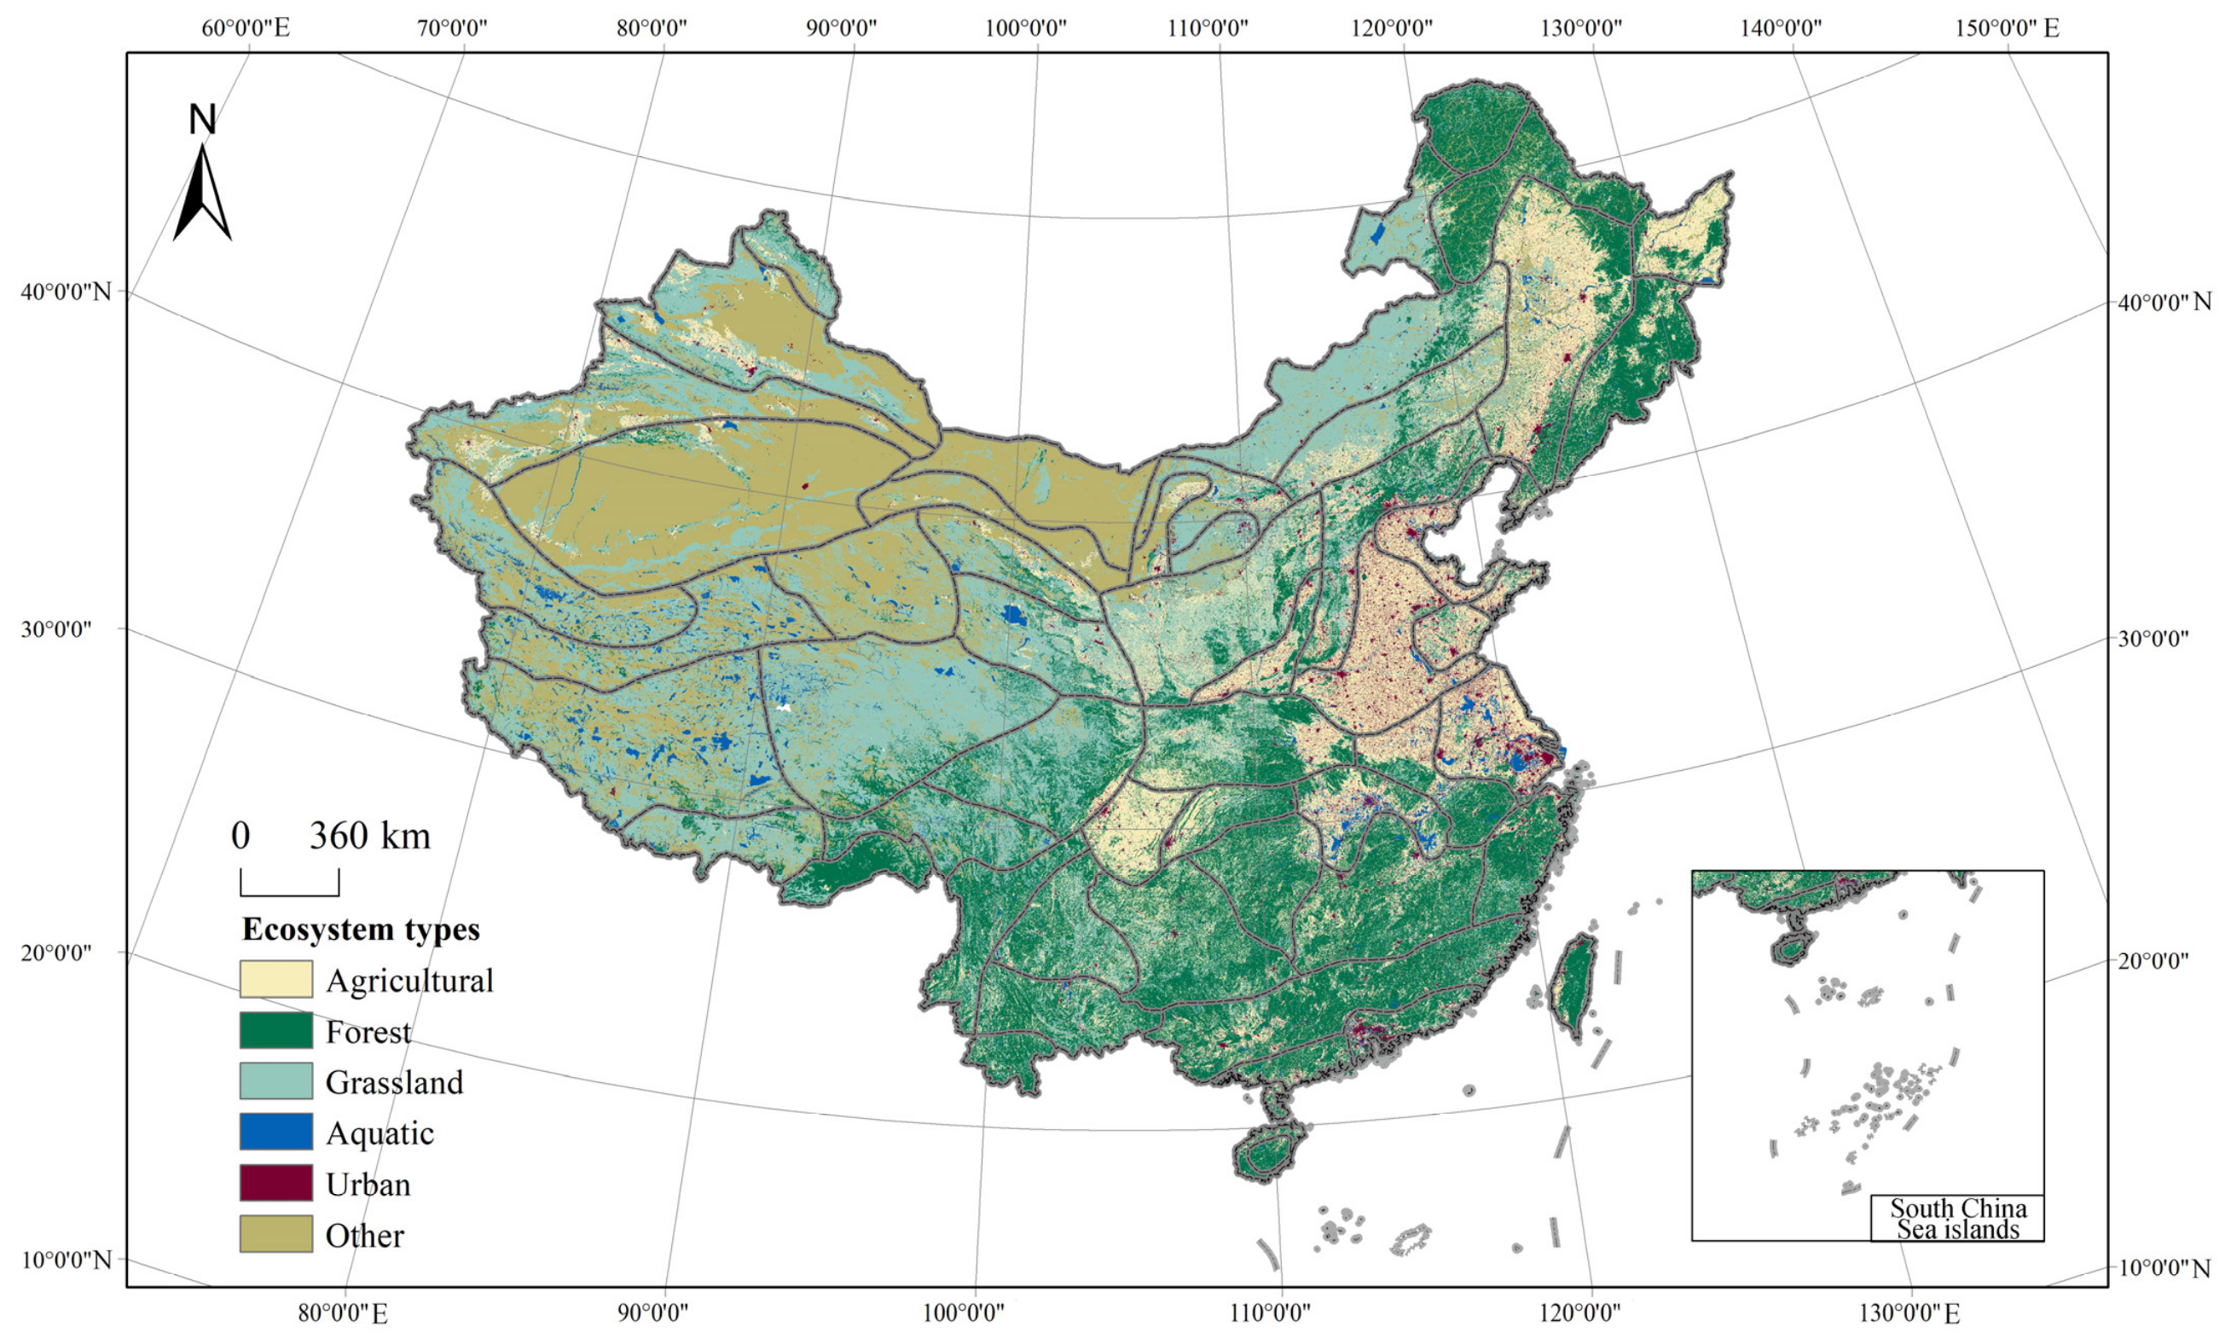
In 2020, China’s terrestrial ecosystems were dominated by grassland (2.72 million km2, 28.6%), forest (2.28 million km2, 23.97%), and other ecosystems (2.18 million km2, 22.9%), followed by agricultural (1.76 million km2, 18.5%), aquatic (0.29 million km2, 3.1%), and urban ecosystems (0.27 million km2, 2.8%). In the classification adopted in this study, other ecosystems are dominated by desert, Gobi, and bare land, whereas other land-cover types included in this category occupy relatively small areas. The national spatial pattern broadly reflects China’s climatic and topographic gradients: forest ecosystems are concentrated mainly in humid mountainous regions; grasslands occur extensively across the northern and western plateaus; agricultural and urban ecosystems are concentrated in major plains and basins; and other ecosystems are primarily distributed in the arid northwest and the northern Tibetan Plateau (Figure 3).
Figure 3.
Ecosystem distribution map of China in 2020.
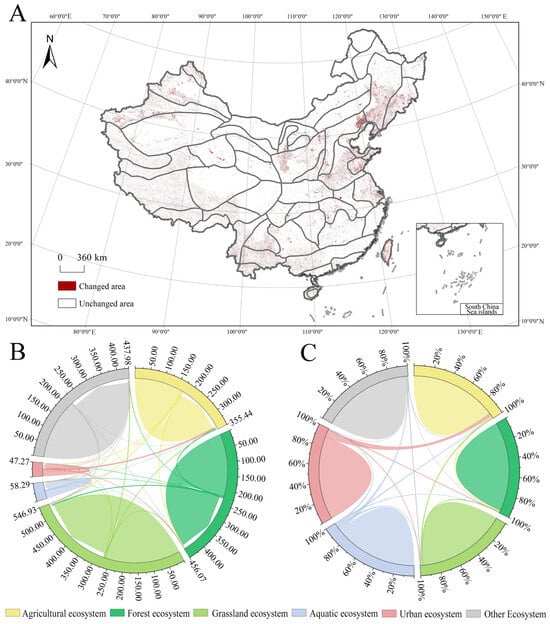
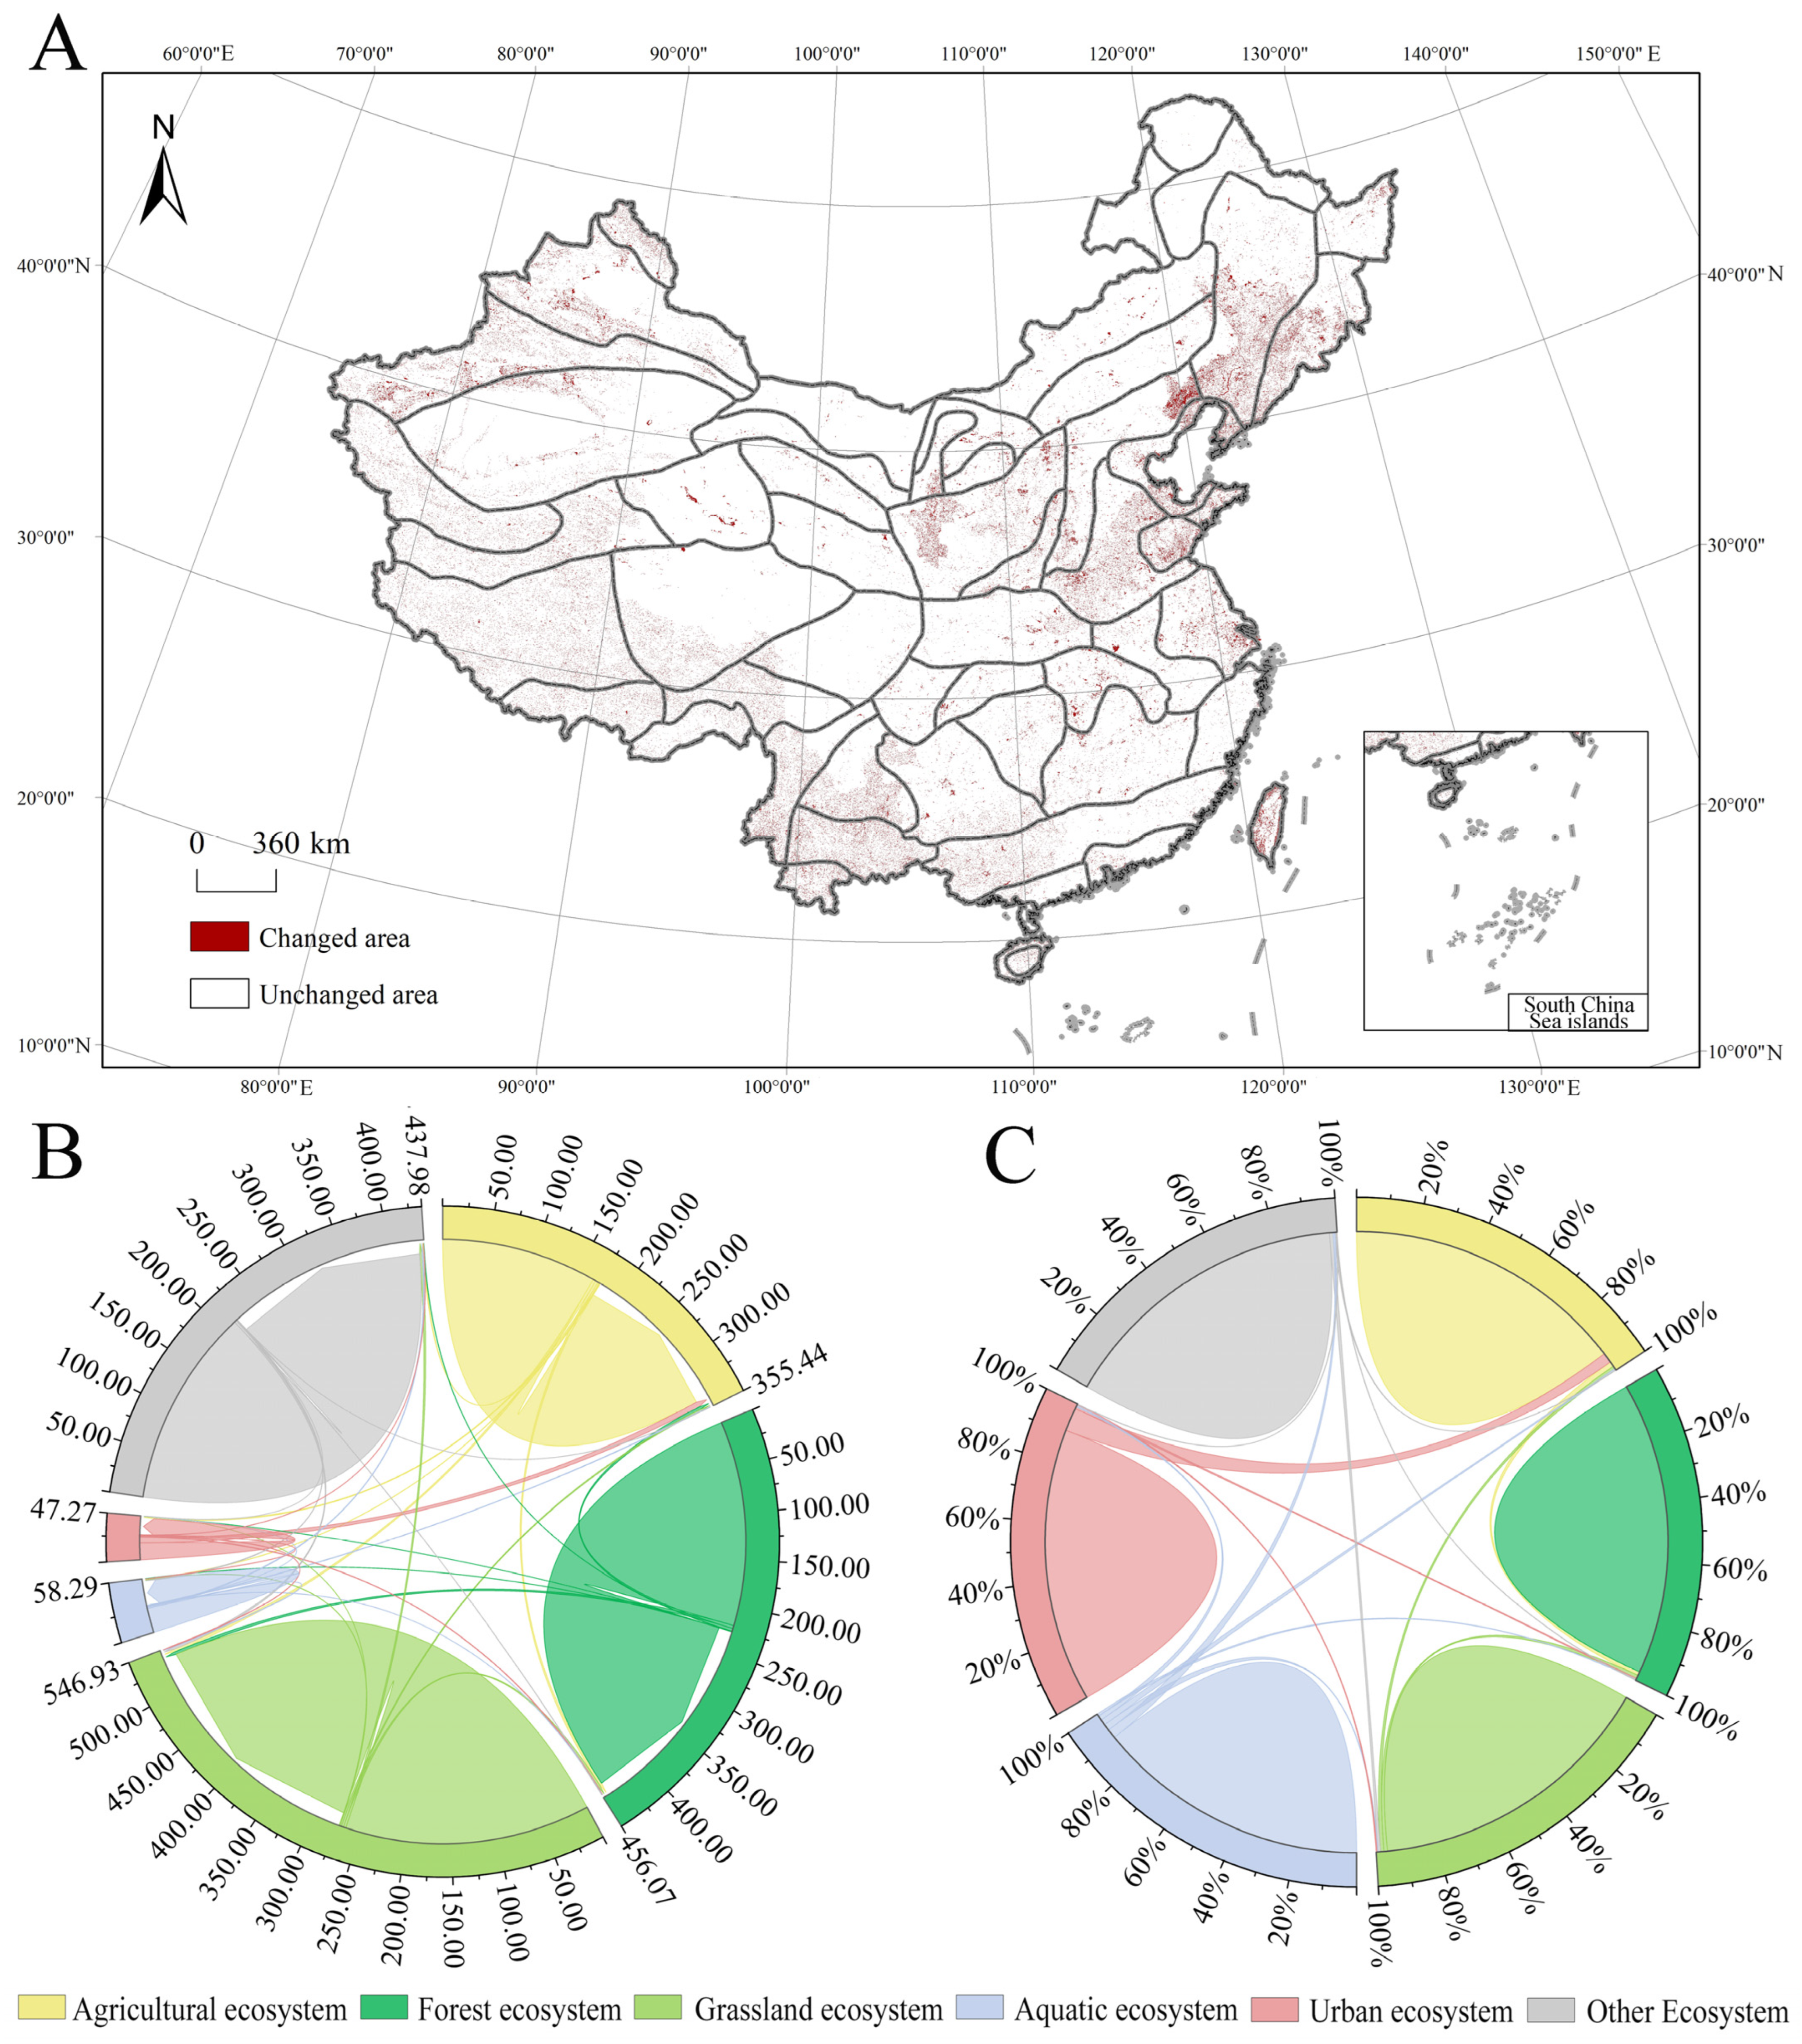
Comparison between 2005 and 2020 shows that approximately 4.1% of the mapped area experienced a change in ecosystem category, whereas the remaining 95.9% retained the same ecosystem type (Figure 4A). Although the total proportion of changed area was relatively limited, ecosystem transitions were spatially dispersed across China. Urban, aquatic, and forest ecosystems expanded during this period, whereas agricultural, grassland, and other ecosystems contracted. Urban ecosystems showed the largest net increase (67,601 km2), followed by aquatic ecosystems (6712 km2) and forest ecosystems (246 km2). In contrast, agricultural ecosystems decreased by 30,003 km2, grassland ecosystems by 26,906 km2, and other ecosystems by 17,650 km2.
Figure 4.
Ecosystem transfers in China, 2005–2020 ((A): China’s ecosystem change map; (B): area; (C): proportion).
The transition network further indicates that agricultural–urban and grassland–forest conversions were among the most prominent ecosystem transitions during this period (Figure 4B,C). Urban expansion occurred primarily through the conversion of agricultural ecosystems, whereas substantial bidirectional conversion occurred between grassland and forest ecosystems. Overall, ecosystem-type changes between 2005 and 2020 were limited in total areal extent but spatially heterogeneous, providing the national background for the subsequent analysis of regionally differentiated ecological problems.
3.2. Status of Important Ecological Problems in China
3.2.1. Soil and Water Loss
Soil and water loss remains a widespread ecological challenge in China. As of 2021, the affected area was approximately 2.6742 million km2, accounting for 27.9% of the national territory. Water erosion covered approximately 1.106 million km2, whereas wind erosion affected approximately 1.568 million km2. Compared with 2020 (2.6927 million km2), the total affected area decreased by 18,500 km2, corresponding to a reduction of 0.69%. At the administrative scale, the largest affected areas were concentrated in Xinjiang and Inner Mongolia, while relatively high proportions of affected land were also observed in Shanxi and Shaanxi. Overall, western China accounted for the majority of the nationally monitored soil and water loss area (Figure 5).
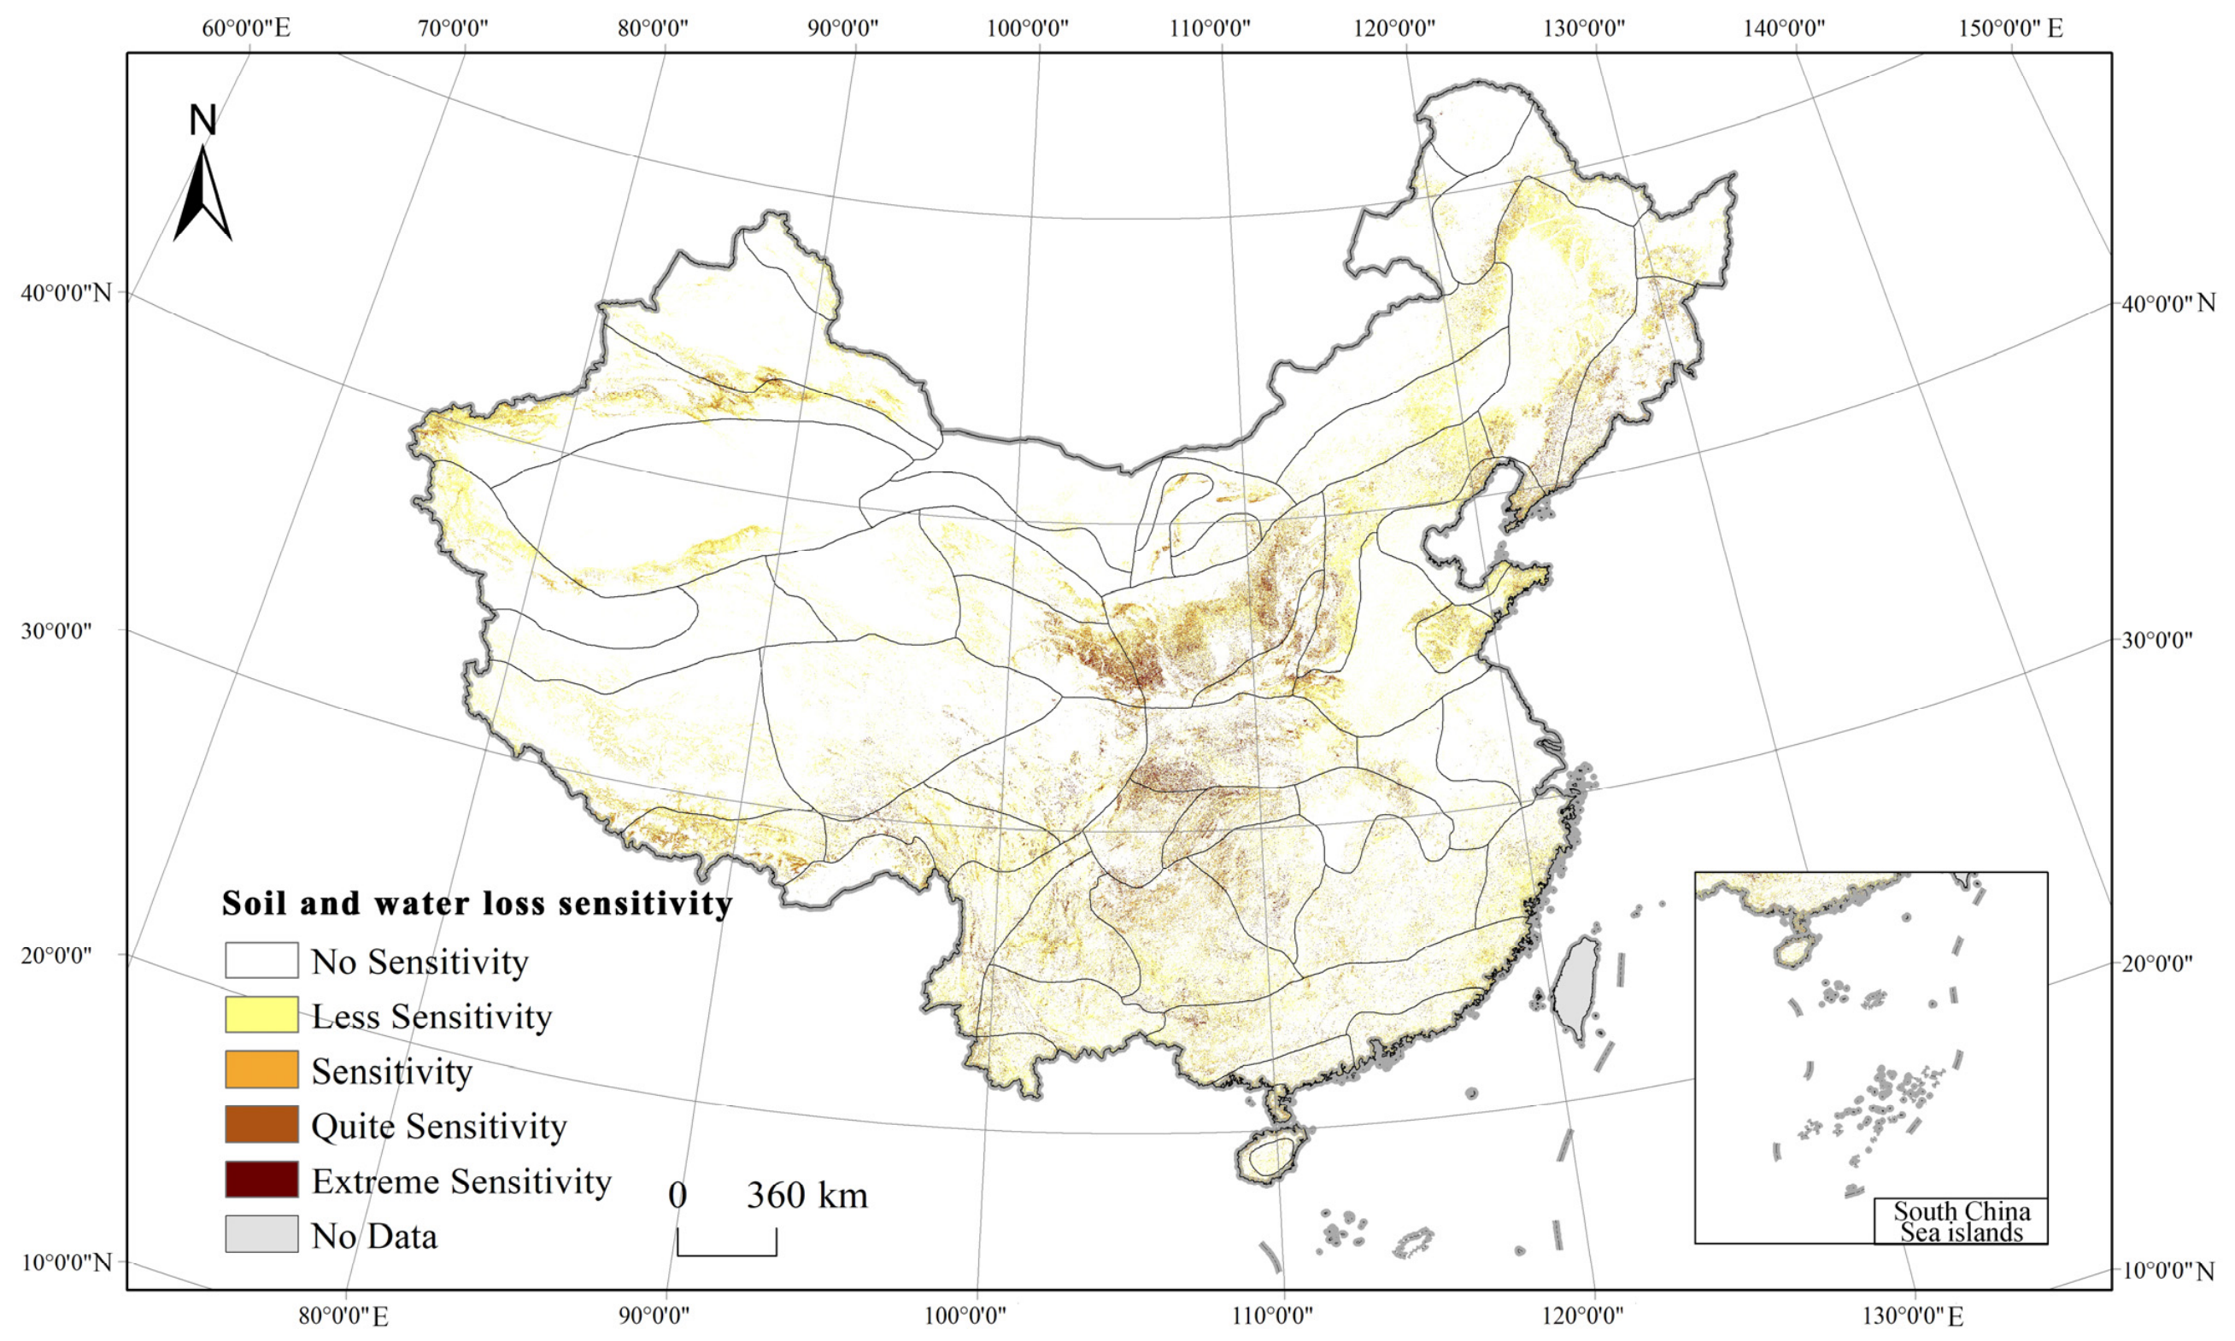
The soil and water loss sensitivity assessment reveals a distinctly different pattern when examined within the ecological regionalization framework (Figure 6). Across the ecodistricts with valid raster coverage, 85.64% of the assessed area was classified as No Sensitivity and 9.88% as Less Sensitive, whereas areas classified as Sensitive, Quite Sensitive, and Extremely Sensitive accounted for 1.97%, 1.51%, and 1.00%, respectively. Thus, areas classified as Sensitive or above represented 4.49% of the assessed area, of which 2.51% was classified as Quite Sensitive or Extremely Sensitive.
Clear differences were observed among the three ecological domains. The Eastern humid and semi-humid ecological domain (I) had the highest proportion of Quite Sensitive and Extremely Sensitive areas, at 4.10%, compared with 1.65% in the Qinghai–Tibet Plateau alpine domain (III) and 0.53% in the Northwest arid and semi-arid domain (II). At the ecoregion level, the warm-temperate humid and semi-humid deciduous broad-leaved forest ecoregion (I3) showed the highest proportion of high-sensitivity area (6.13%), followed by the South Asian monsoon humid and semi-humid evergreen broadleaf forest ecoregion (I6; 4.10%) and the subtropical humid evergreen broad-leaved forest ecoregion (I4; 4.08%). Spatial differentiation was even more pronounced at the ecodistrict level. The Three Gorges Reservoir sensitive ecodistrict [I4(3)] and the soil- and water-loss-sensitive ecodistrict of the Loess Plateau [I3(6)] had the highest proportions of Quite Sensitive and Extremely Sensitive areas, reaching 11.96% and 11.66%, respectively. Relatively high proportions were also observed in the Chengdu Plain agricultural ecodistrict [I4(2), 9.65%], Qinba Mountain evergreen–deciduous broadleaf forest ecodistrict [I4(1), 8.85%], Fenwei River Valley agricultural ecodistrict [I3(7), 8.28%], and Eastern Qinghai agricultural and pastoral ecodistrict [III2(2), 8.11%]. These results demonstrate marked ecological-zone differentiation in soil-erosion sensitivity that is not fully captured by administrative statistics alone. In particular, the distribution of monitored soil and water loss area and the spatial pattern of erosion sensitivity do not completely coincide, indicating that they characterize different dimensions of regional erosion risk.
Figure 5.
Top 20 water and soil loss provinces in China.
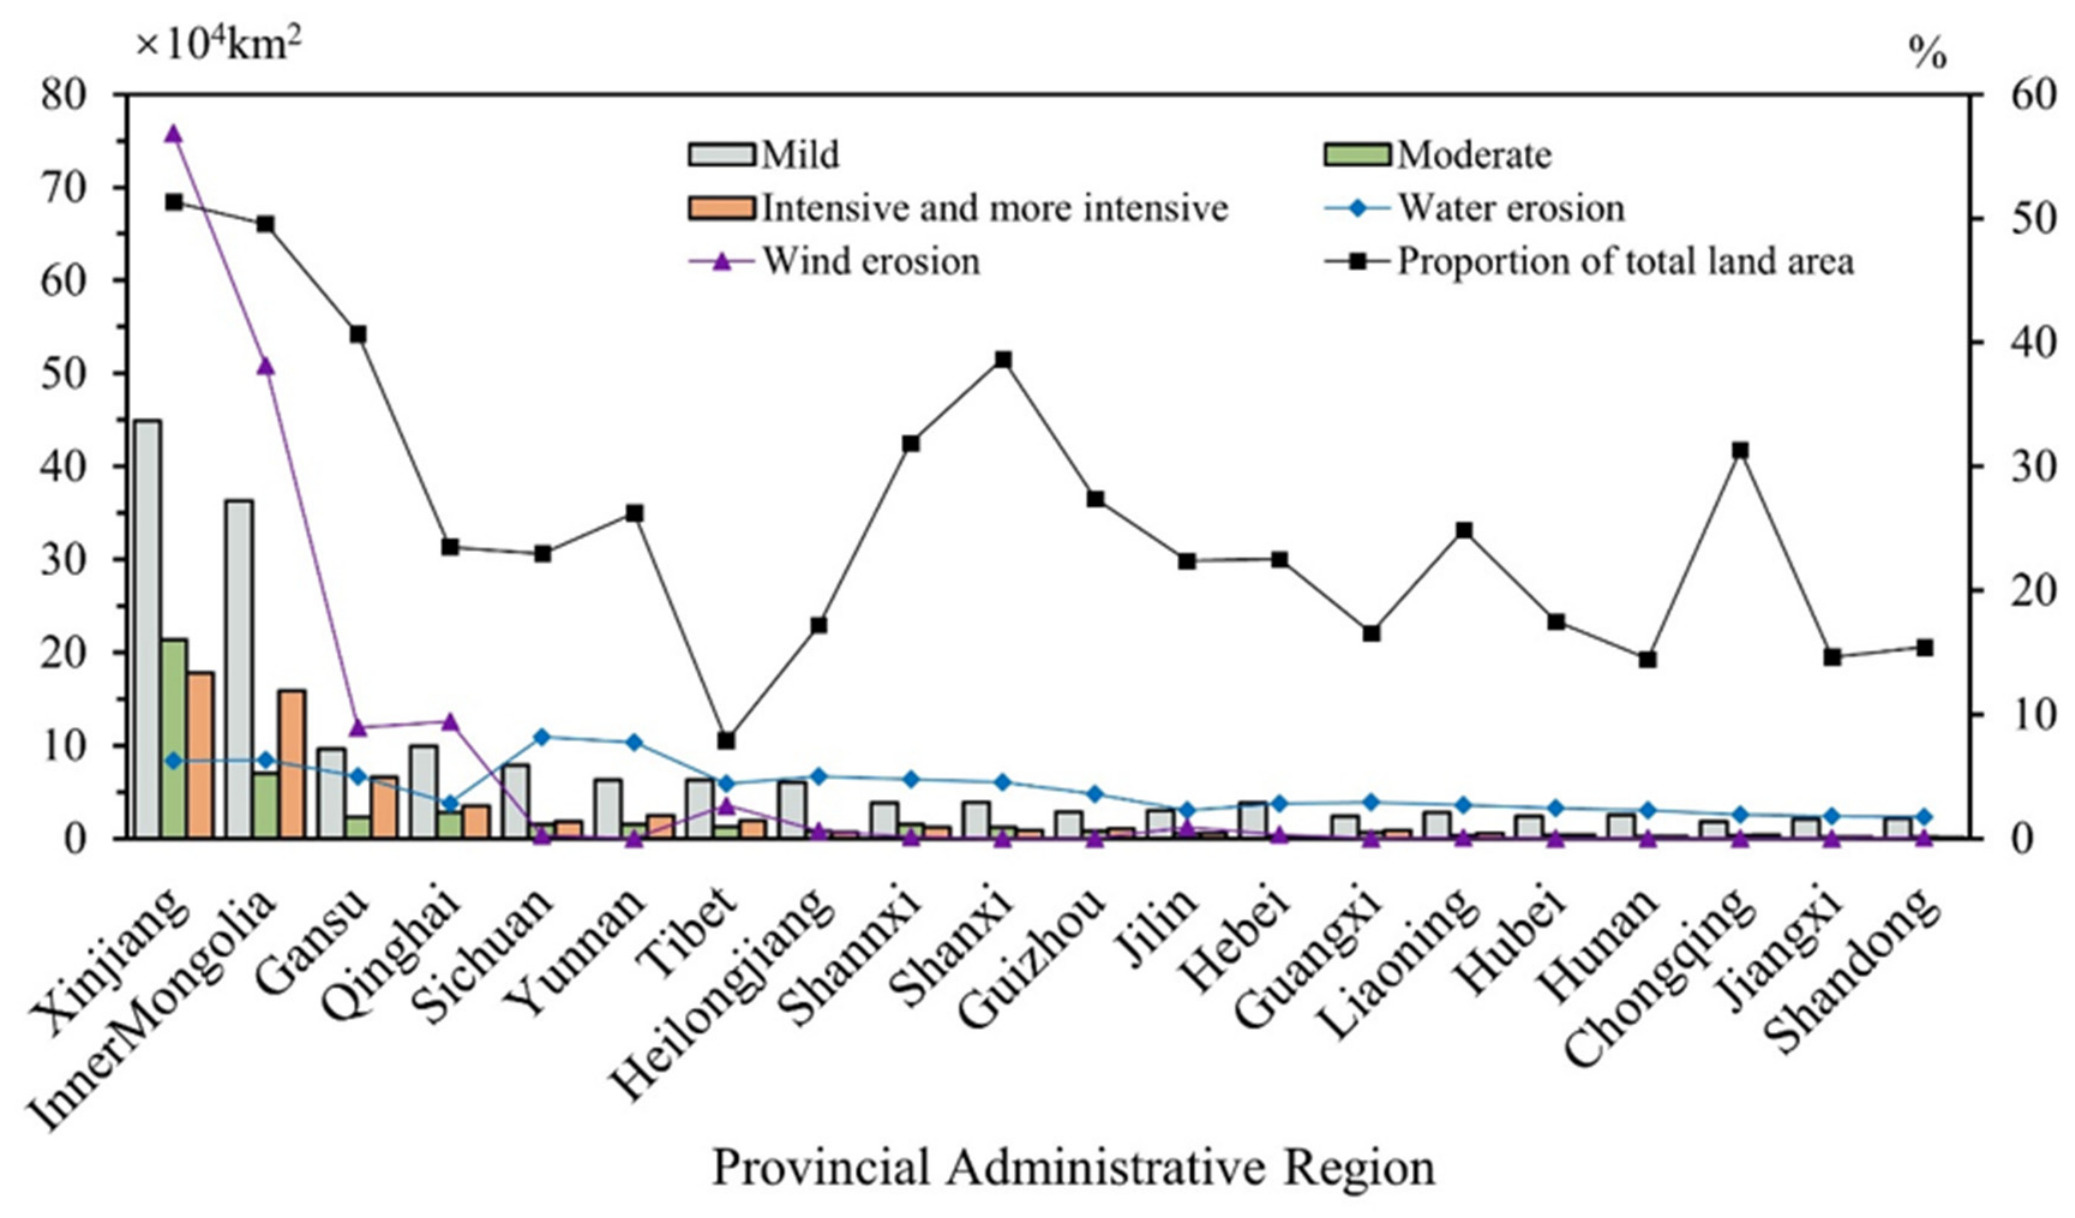
Figure 6.
Spatial distribution of soil and water loss sensitivity across China’s ecological regions.
3.2.2. Sandification
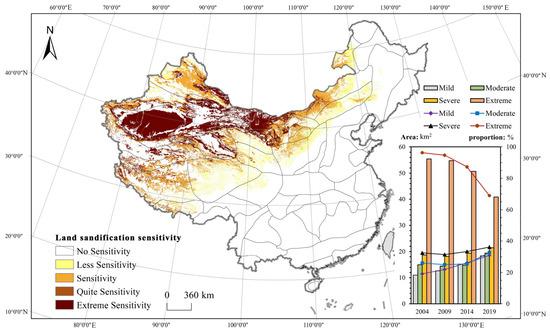
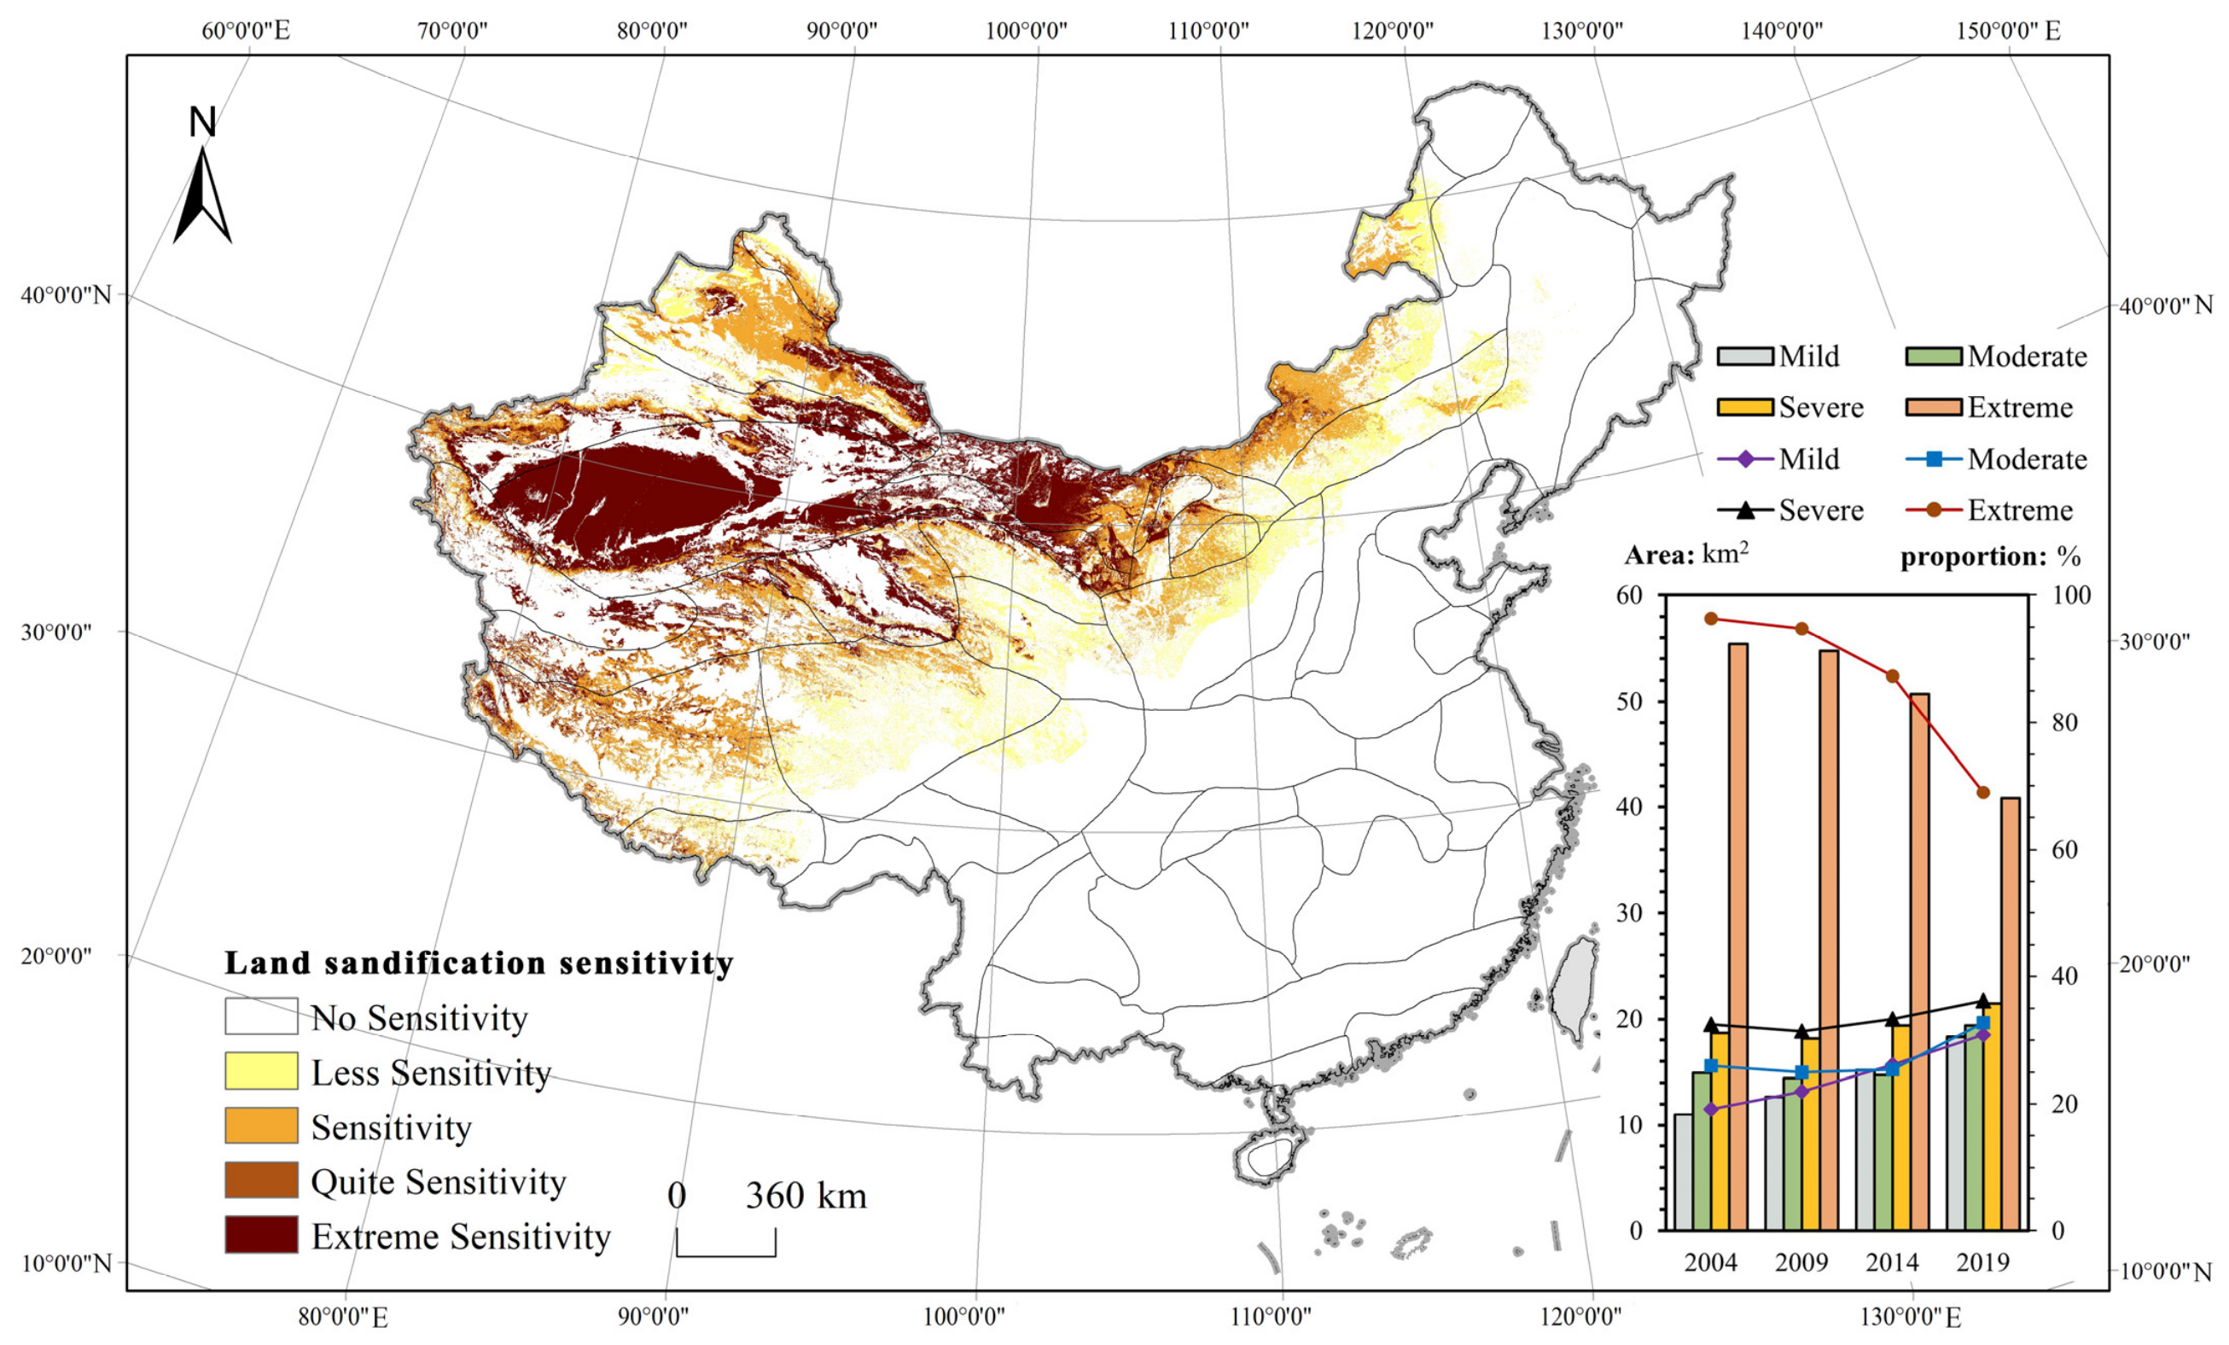
According to China’s Sixth National Survey on Desertification and Sandification, the total area of sandified land in China was approximately 1.6878 million km2, accounting for 17.58% of the national land area. National monitoring indicates a sustained improvement in sandification conditions, with the area of sandified land declining continuously across four consecutive monitoring periods (2004, 2009, 2014, and 2019). The average annual change shifted from an expansion of 3436 km2 at the end of the last century to a reduction of 6680 km2 during 2014–2019. Vegetation conditions in sandy areas also improved substantially: average vegetation cover reached 20.22% in 2019, 1.90 percentage points higher than in 2014, while wind erosion of sandy soils decreased markedly compared with 2000 (Figure 7). Nevertheless, large areas of northern and northwestern China remain susceptible to sandification, highlighting the need for continued prevention and restoration.
Figure 7.
Spatial distribution of land sandification sensitivity across China’s ecological regions.
The sandification-sensitivity assessment reveals pronounced spatial differentiation across China’s ecological regions Non-zero sandification sensitivity was identified in 25 ecodistricts. Across all areas exhibiting sandification sensitivity, 19.60% was classified as Less Sensitive, 33.33% as Sensitive, 8.64% as Quite Sensitive, and 38.42% as Extremely Sensitive. Spatially, the Northwest arid and semi-arid ecological domain (II) contained 62.47% of the total sandification-sensitive area, followed by the Qinghai–Tibet Plateau alpine domain (III) with 32.79%, whereas only 4.74% occurred in the Eastern humid and semi-humid ecological domain (I). The severity composition also differed substantially among ecological domains. Extremely Sensitive accounted for 49.67% of the sensitive area within Domain II, compared with 22.53% in Domain III and only 0.24% in Domain I.
At the ecoregion level, sandification sensitivity was highly concentrated in a limited number of regions. The arid desert ecoregion (II4) accounted for 36.11% of the total sensitive area, followed by the alpine grassland and alpine meadow ecoregion of the Qinghai–Tibet Plateau (III2; 20.16%), the alpine desert and semi-desert ecoregion (III3; 11.88%), the semi-arid steppe ecoregion (II1; 11.86%), and the arid and semi-desert ecoregion (II3; 9.82%). Together, these five ecoregions contained approximately 89.8% of the total sandification-sensitive area. However, their severity profiles differed markedly. Quite Sensitive and Extremely Sensitive areas accounted for 86.08% of the sensitive area in II3, 69.69% in II4, and 60.37% in III3, indicating particularly strong sandification susceptibility in arid and alpine desert environments.
At the ecodistrict level, the strongest sandification sensitivity was concentrated in northwestern China. The Alxa Plateau semi-desert ecodistrict [II3(1)] had the highest proportion of land exhibiting sandification sensitivity (71.52%), of which 61.02% of the total ecodistrict area was classified as Quite Sensitive or Extremely Sensitive. The Maowusu Sand Desert ecodistrict [II2(2)] also exhibited a high overall sensitive-area proportion (69.46%), although most of this area belonged to the intermediate sensitivity classes and only 1.15% was classified as Quite Sensitive or Extremely Sensitive. In contrast, the Tarim Basin desert and Gobi ecodistrict [II4(4)] combined a large sensitive-area proportion (62.02%) with very high severity, with 59.53% of the ecodistrict classified as Quite Sensitive or Extremely Sensitive. Similarly high severity occurred in the Hexi Corridor Oasis agricultural ecodistrict [II3(2)], where the corresponding proportion reached 50.77%. These results demonstrate that sandification risk is not only spatially concentrated in arid and semi-arid ecological regions but also differs considerably in severity among ecodistricts, underscoring the need for differentiated regional prevention and restoration strategies.
3.2.3. Rocky Desertification
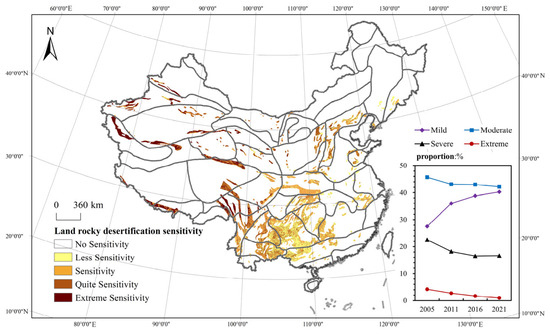
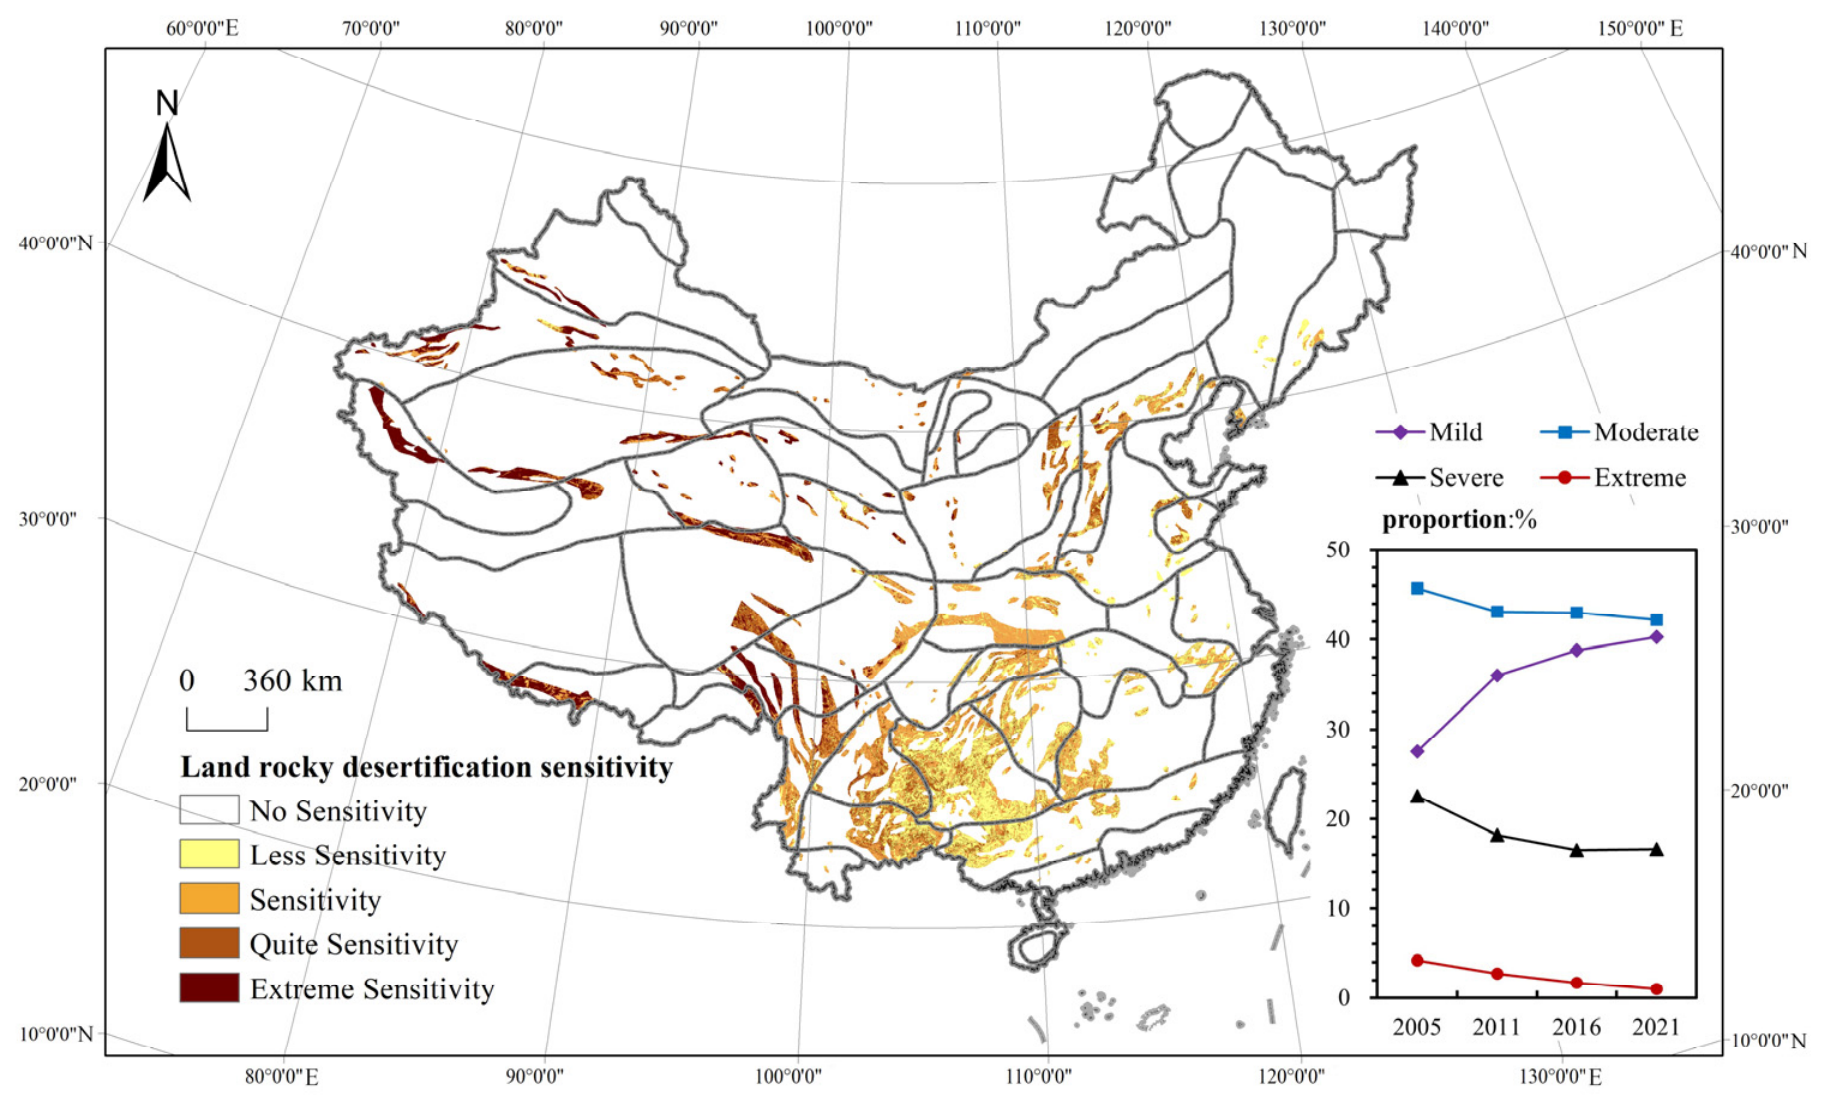
Rocky desertification remains an important ecological challenge in China, particularly in regions characterized by extensive carbonate-rock exposure. According to national monitoring data, the area affected by rocky desertification was approximately 72,232 km2 in 2021. Compared with 2016, the affected area decreased by 33,308 km2 over five years, corresponding to an average annual reduction of approximately 6662 km2. The severity of rocky desertification also declined, with decreases observed across mild, moderate, severe, and extreme categories. These changes indicate a general improvement in rocky-desertification conditions, although areas of severe and extreme rocky desertification remain and continue to require targeted management.
The rocky-desertification sensitivity assessment reveals pronounced spatial differentiation across China’s ecological regions (Figure 8). Non-zero rocky-desertification sensitivity was identified in 45 ecodistricts. Across all sensitive areas, 28.86% was classified as Less Sensitive, 35.68% as Sensitive, 23.02% as Quite Sensitive, and 12.44% as Extremely Sensitive. Thus, Quite Sensitive and Extremely Sensitive areas together accounted for 35.47% of the total sensitive area. Considerable differences were observed among the three ecological domains. The Eastern humid and semi-humid ecological domain (I) contained 75.22% of the total rocky-desertification-sensitive area, substantially exceeding the Qinghai–Tibet Plateau alpine domain (III; 17.32%) and the Northwest arid and semi-arid domain (II; 7.46%). However, the severity composition exhibited an opposite pattern. Quite Sensitive and Extremely Sensitive areas accounted for only 23.13% of the sensitive area in Domain I, compared with 77.58% in Domain II and 70.92% in Domain III. This contrast indicates that the spatial extent and severity of rocky-desertification sensitivity do not necessarily coincide.
Figure 8.
Spatial distribution of rocky desertification sensitivity across China’s ecological regions.
At the ecoregion level, sensitivity was concentrated primarily in the subtropical humid evergreen broad-leaved forest ecoregion (I4) and the South Asian monsoon humid and semi-humid evergreen broadleaf forest ecoregion (I6), which accounted for 44.49% and 19.88% of the total sensitive area, respectively. The warm-temperate humid and semi-humid deciduous broad-leaved forest ecoregion (I3; 9.91%) and the alpine grassland and alpine meadow ecoregion of the Qinghai–Tibet Plateau (III2; 7.88%) also contained substantial sensitive areas. Together, these four ecoregions accounted for approximately 82.2% of the total rocky-desertification-sensitive area.
3.2.4. Vegetation Change
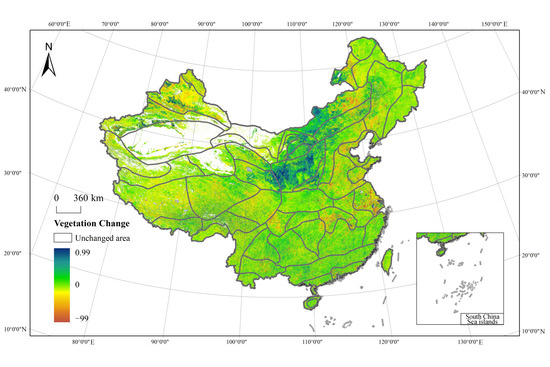
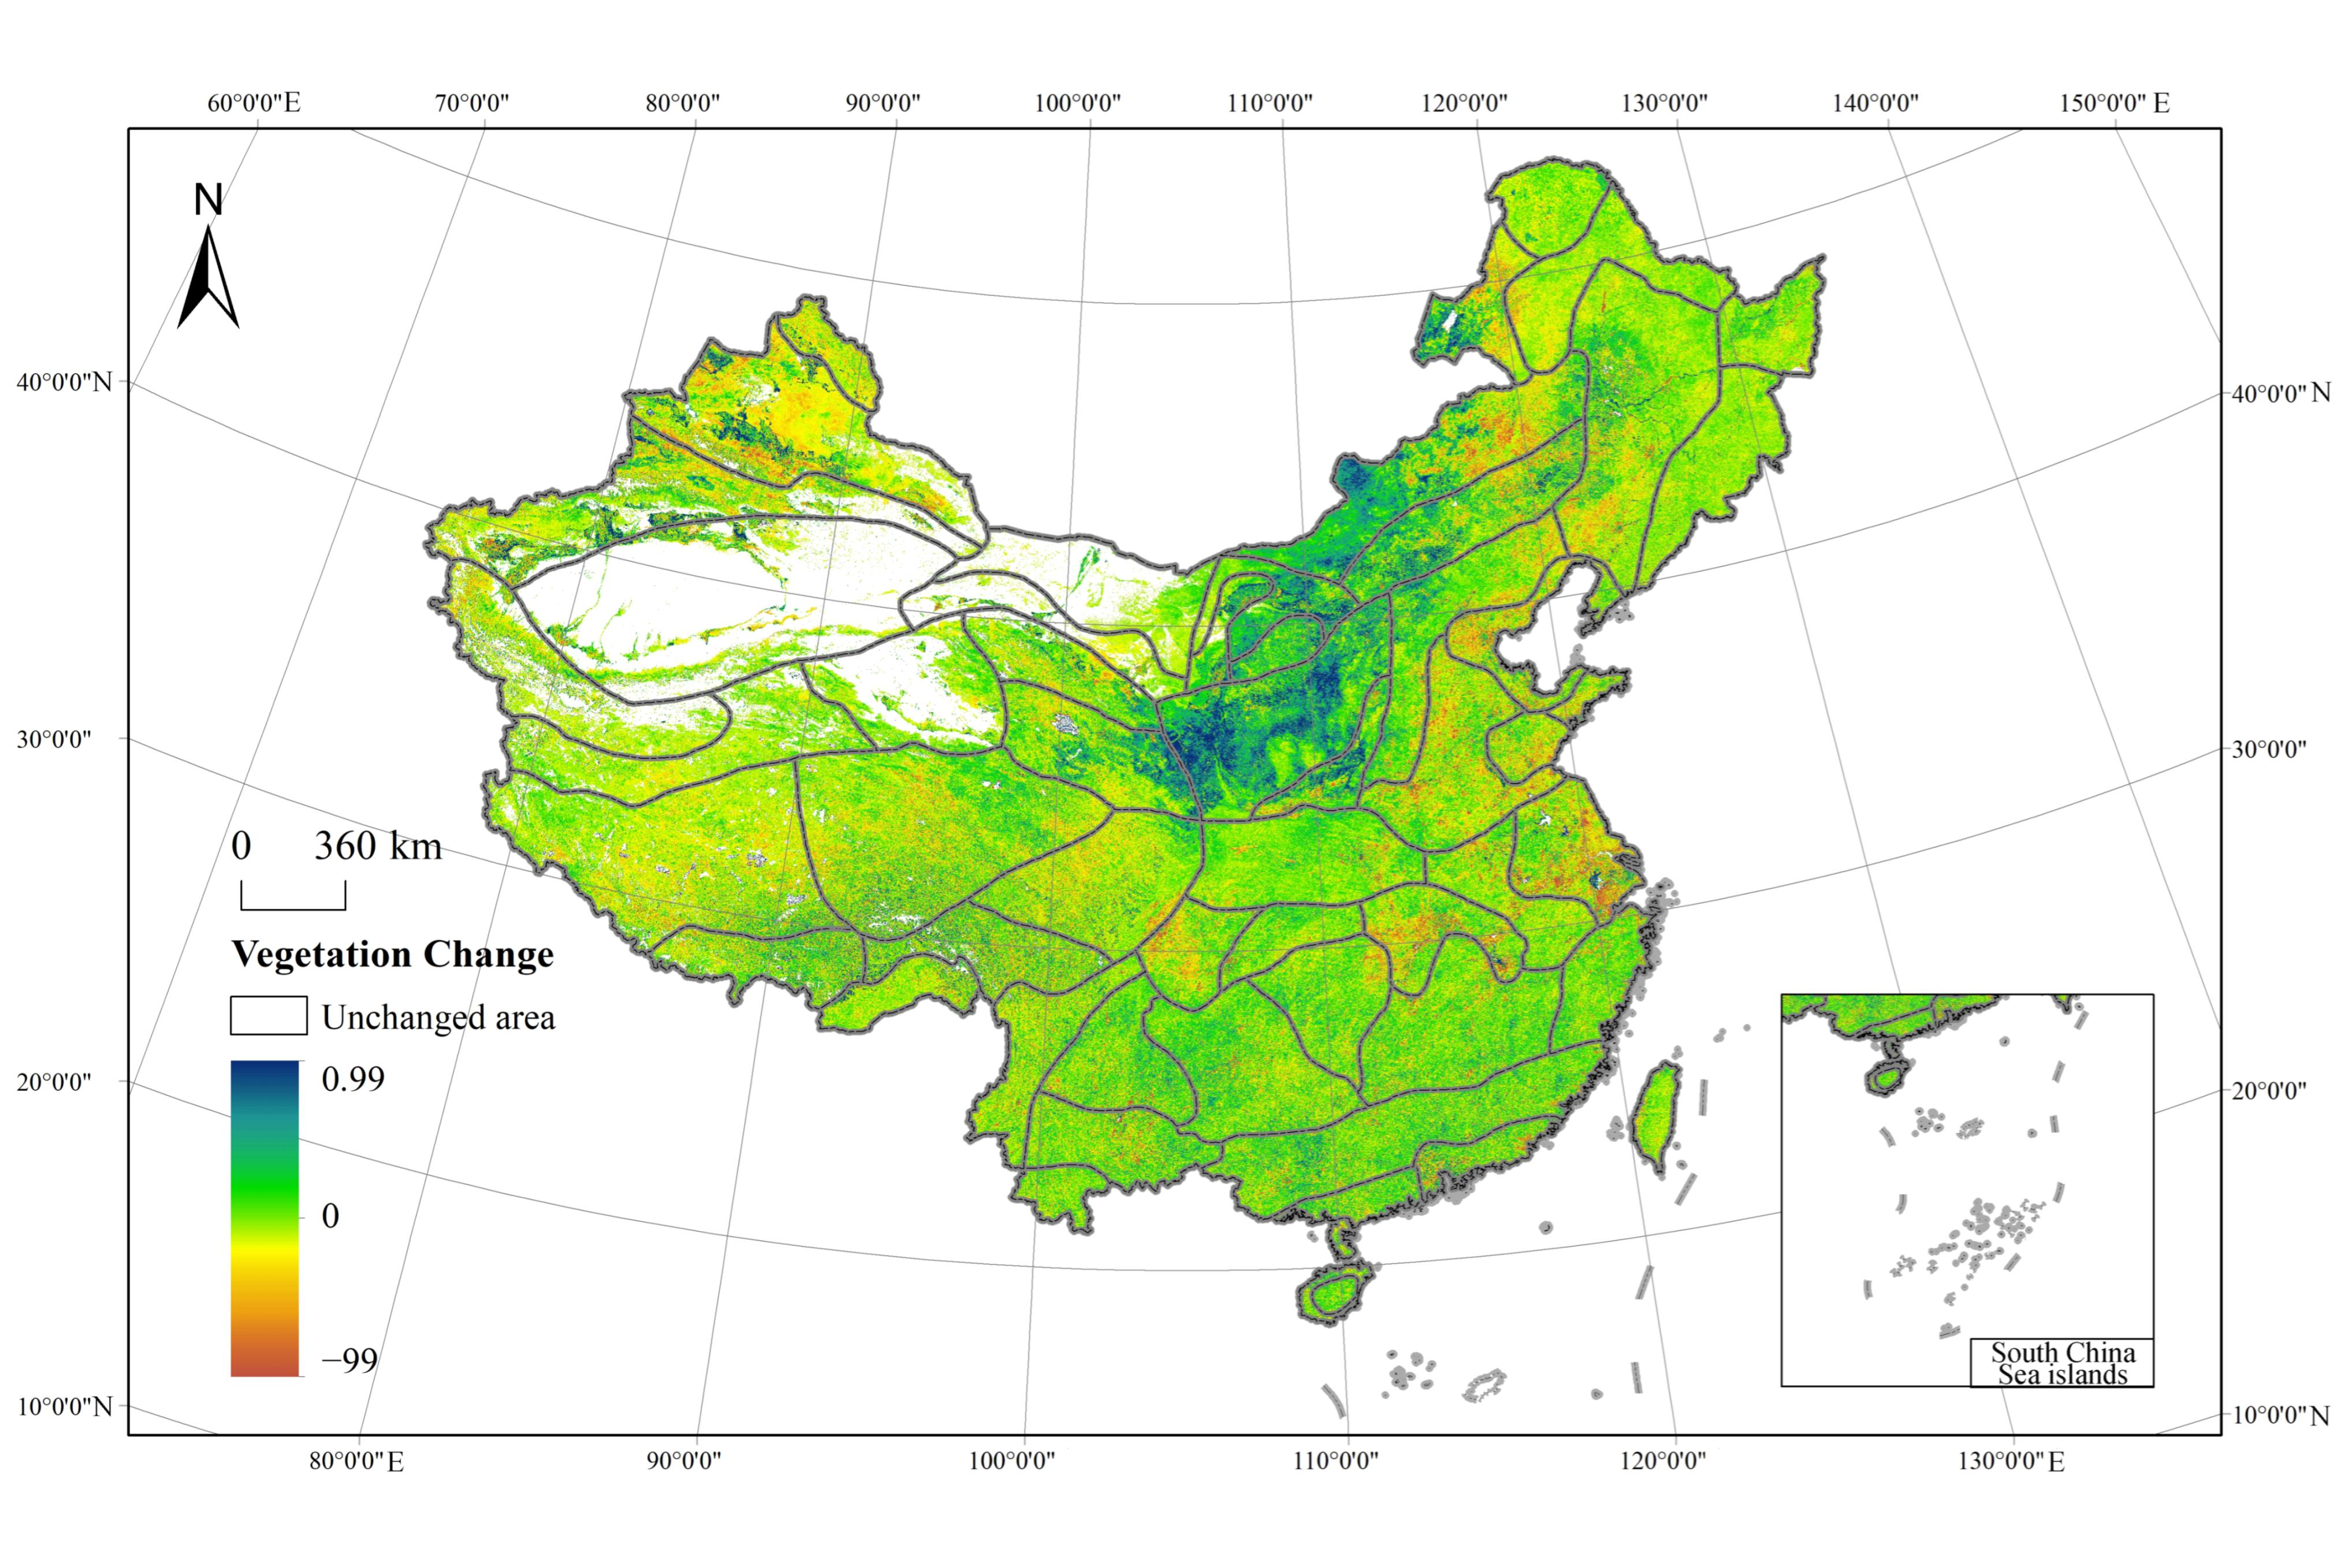
The vegetation change between 2005 and 2020 showed an overall greening tendency but substantial spatial heterogeneity across China (Figure 9). After excluding persistently non-vegetated areas and treating NDVI changes within ±0.01 as stable or minimal change, the mean NDVI change across areas with valid vegetation coverage was +0.0275. Approximately 59.00% of the assessed vegetation area experienced an NDVI increase, whereas 26.40% showed a decrease and 14.60% remained stable or exhibited only minor fluctuations. Vegetation-change patterns differed among the three ecological domains. The Eastern humid and semi-humid ecological domain (I) had the largest proportion of vegetation-increase area (62.84%), followed by the Northwest arid and semi-arid domain (II; 55.68%) and the Qinghai–Tibet Plateau alpine domain (III; 53.75%). In contrast, the mean magnitude of NDVI increase was highest in Domain II (+0.0373), compared with +0.0272 in Domain I and +0.0199 in Domain III. Thus, vegetation improvement was more spatially widespread in the eastern domain, whereas stronger average increases occurred in parts of the northwestern domain.
Figure 9.
Distribution of NDVI changes in China.
At the ecoregion level, the most pronounced vegetation improvement occurred in the semi-arid desert steppe ecoregion (II2), where the mean NDVI increased by 0.0905 and 85.99% of the assessed vegetation area showed an increase. Relatively strong improvement was also observed in the semi-arid steppe ecoregion (II1) and the warm-temperate humid and semi-humid deciduous broad-leaved forest ecoregion (I3), with mean NDVI changes of +0.0503 and +0.0480, respectively. However, substantial internal heterogeneity remained within several ecoregions; for example, only 41.90% of the assessed area in the arid desert ecoregion (II4) exhibited NDVI increases, while 39.66% experienced decreases.
At the ecodistrict level, the strongest vegetation improvement occurred in the soil- and water-loss-sensitive ecodistrict of the Loess Plateau [I3(6)], where mean NDVI increased by 0.1239 and 91.97% of the assessed area exhibited vegetation increase. Strong greening was also observed in the Hetao Plain irrigated agricultural ecodistrict [II2(1)] and the Maowusu Sand Desert ecodistrict [II2(2)], with mean NDVI increases of 0.0964 and 0.0959, respectively, and vegetation-increase proportions of 82.69% and 90.19%. In contrast, vegetation decline was more evident in several densely developed eastern ecodistricts. The Yangtze River Delta urban and peri-urban agricultural ecodistrict [I4(6)] exhibited the largest mean decline (−0.0182), with 48.05% of the assessed area showing decreasing NDVI. Negative mean changes were also observed in the Bohai Rim urban and peri-urban agricultural ecodistrict [I3(2); −0.0117], the Jiaodong Peninsula deciduous broadleaf forest ecodistrict [I3(3); −0.0095], and the hilly deciduous broad-leaved forest ecodistrict of south-central Shandong [I3(4); −0.0086]. Overall, these patterns indicate that vegetation change is strongly differentiated among ecological regions, with marked improvement in several erosion- and sandification-prone northern regions and localized declines in some intensively urbanized and developed eastern regions.
4. Ecological Challenges and Strategic Orientations Across China’s Ecodistricts
4.1. Ecological Attention Across Ecological Districts
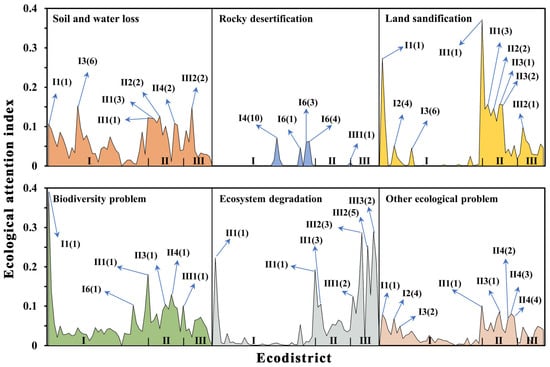
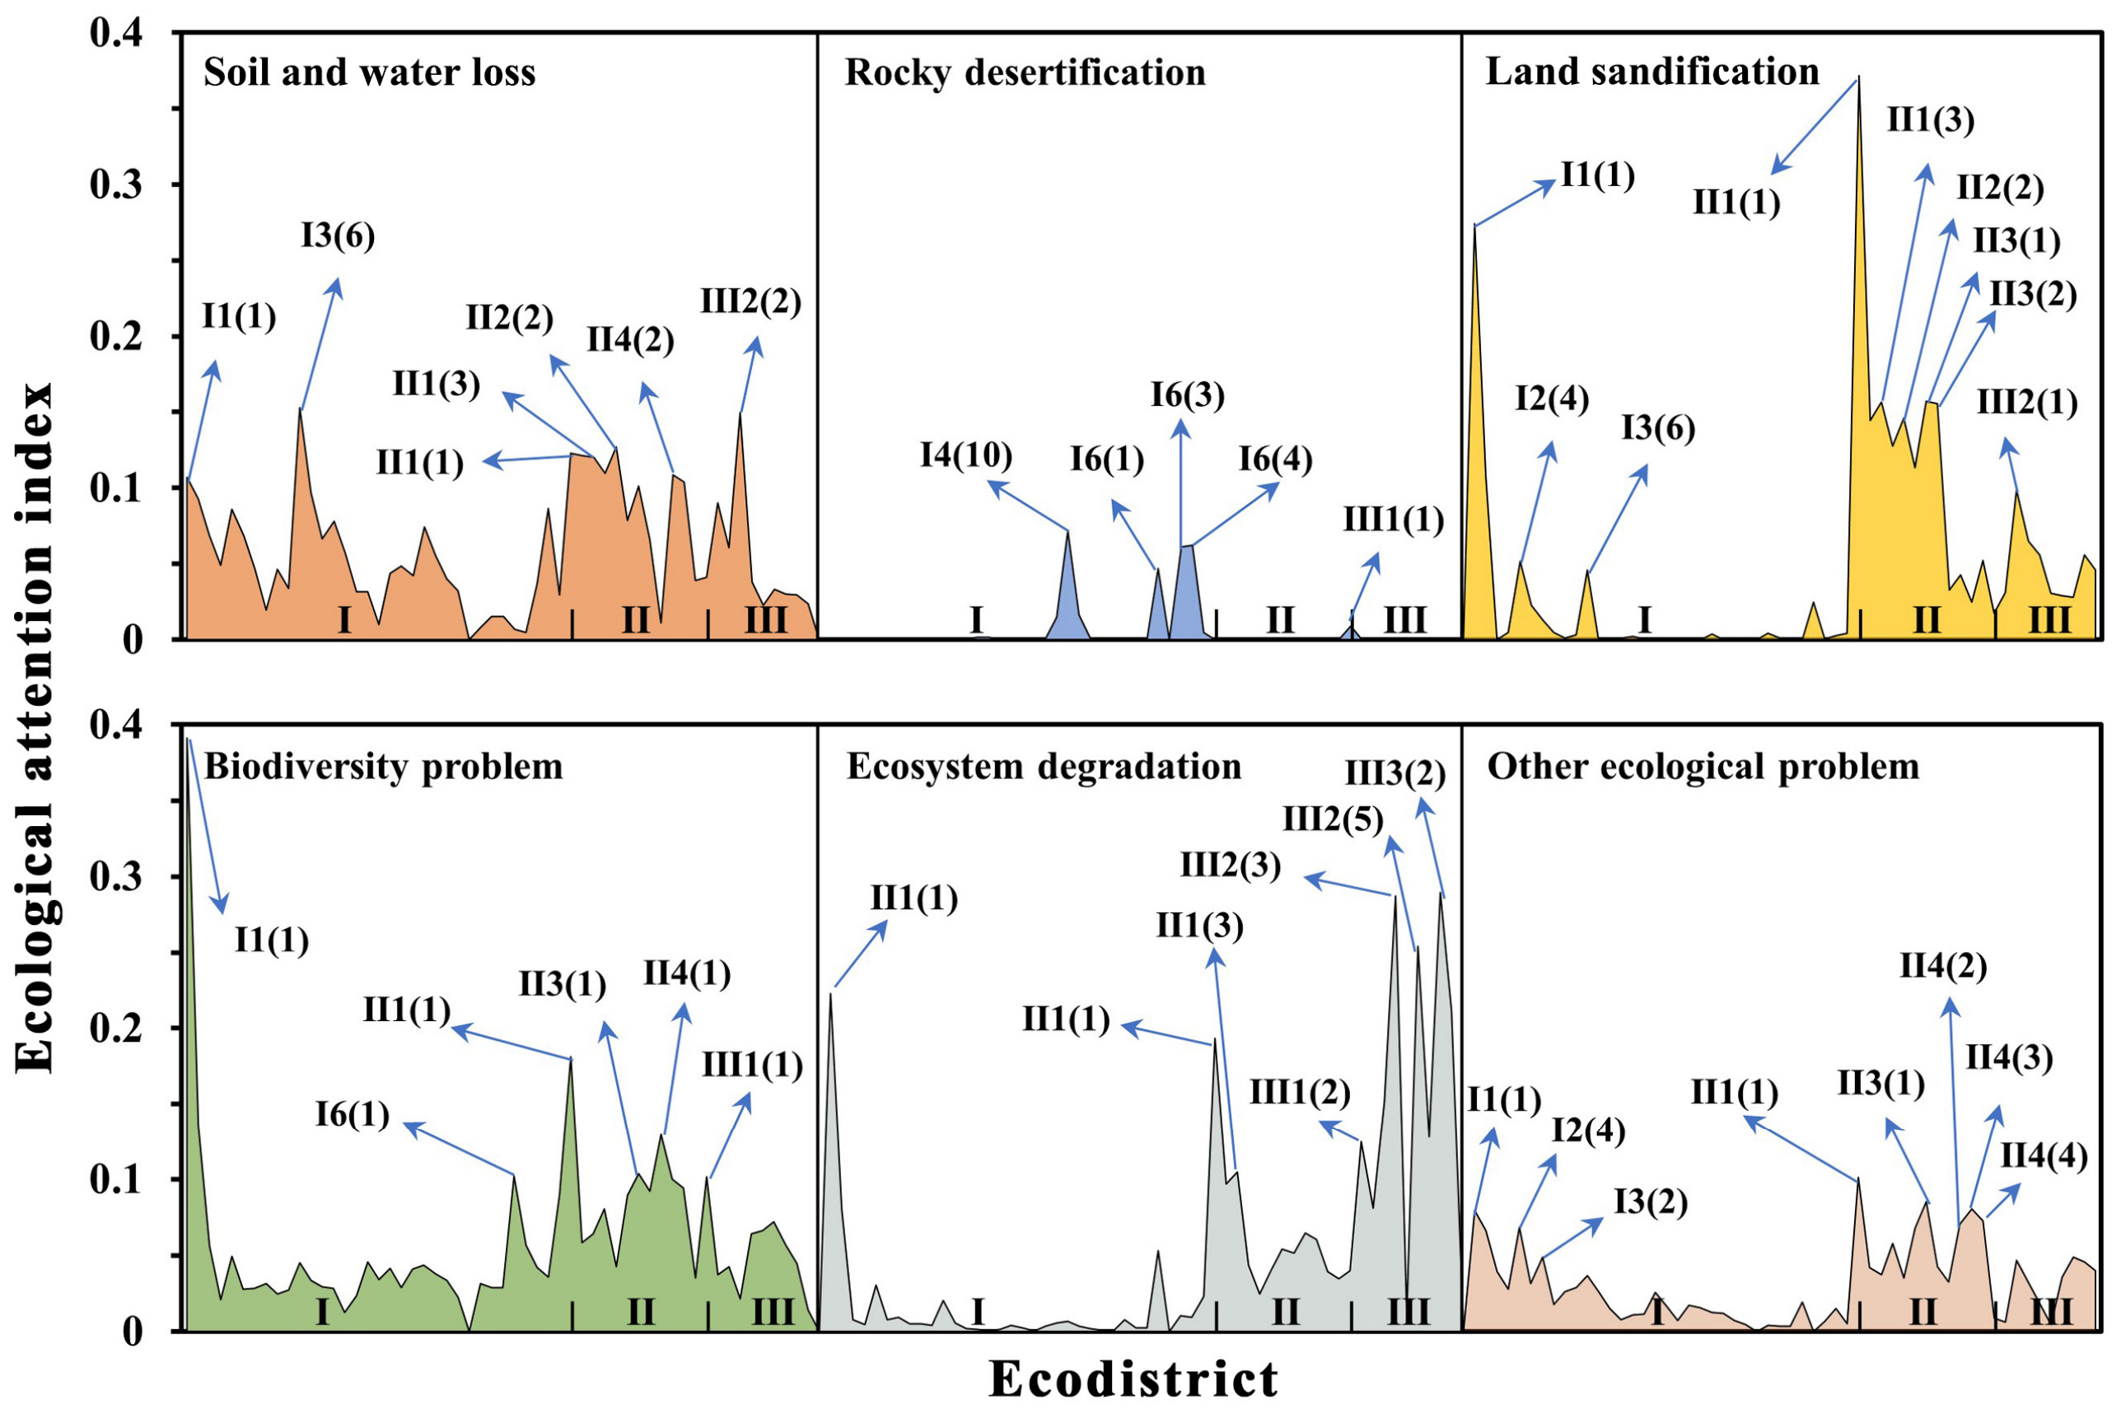
The ecological attention index reveals substantial spatial variation in the emphasis placed on different ecological problems across China’s ecodistricts (Figure 10). Soil and water loss and biodiversity-related issues receive relatively broad attention, whereas the spatial patterns of sandification, rocky desertification, and ecosystem degradation are more regionally concentrated. Relatively high attention to soil and water loss was observed in several northern and north-central ecodistricts, particularly the soil- and water-loss-sensitive ecodistrict of the Loess Plateau [I3(6)], the fragile agro-pastoral ecodistrict on the southeastern margin of the Inner Mongolia Plateau [II1(3)], and the Eastern Qinghai agricultural and pastoral ecodistrict [III2(2)]. Biodiversity-related attention was comparatively high in ecodistricts of northwestern and southwestern China, including the Alxa Plateau semi-desert ecodistrict [II3(1)], Hulunbuir grassland ecodistrict [II1(1)], and the evergreen broad-leaved forest and dark coniferous forest ecodistrict on the southeastern Tibetan Plateau [III1(1)]. The Northern Daxinganling coniferous forest ecodistrict [I1(1)] also showed relatively high attention to biodiversity. Attention to sandification was concentrated mainly in northern and northwestern ecological regions, whereas rocky-desertification attention was concentrated primarily in the karst regions of southwestern China, including the Guizhou–Guangxi karst sensitive ecodistrict [I4(10)] and ecodistricts of the Yunnan–Guizhou Plateau. Attention to ecosystem degradation was relatively prominent in the Daxinganling region, Inner Mongolia Plateau, and Qinghai–Tibet Plateau. Other ecological concerns, including salinization, mining-related ecological impacts, and soil pollution, were distributed across multiple ecodistricts. Overall, the ecological attention index reflects the relative research and policy attention received by different ecological problems within each region, rather than the physical severity of the ecological problems themselves. The spatial patterns, therefore, provide a complementary information layer for the subsequent identification of dominant ecological problems.
Figure 10.
Attention to ecological problems in each ecological district.
4.2. Identification of Major Ecological Problems Across Ecological Districts
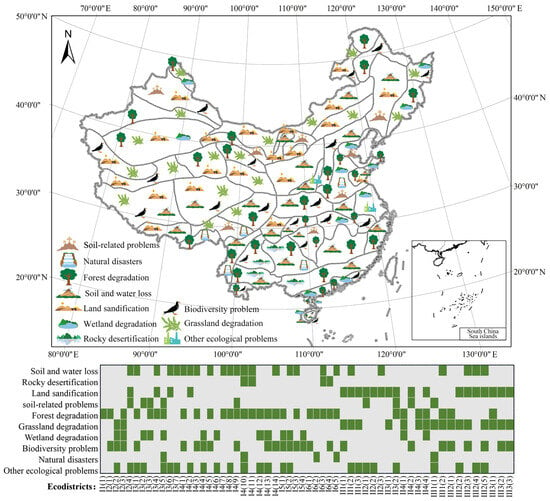
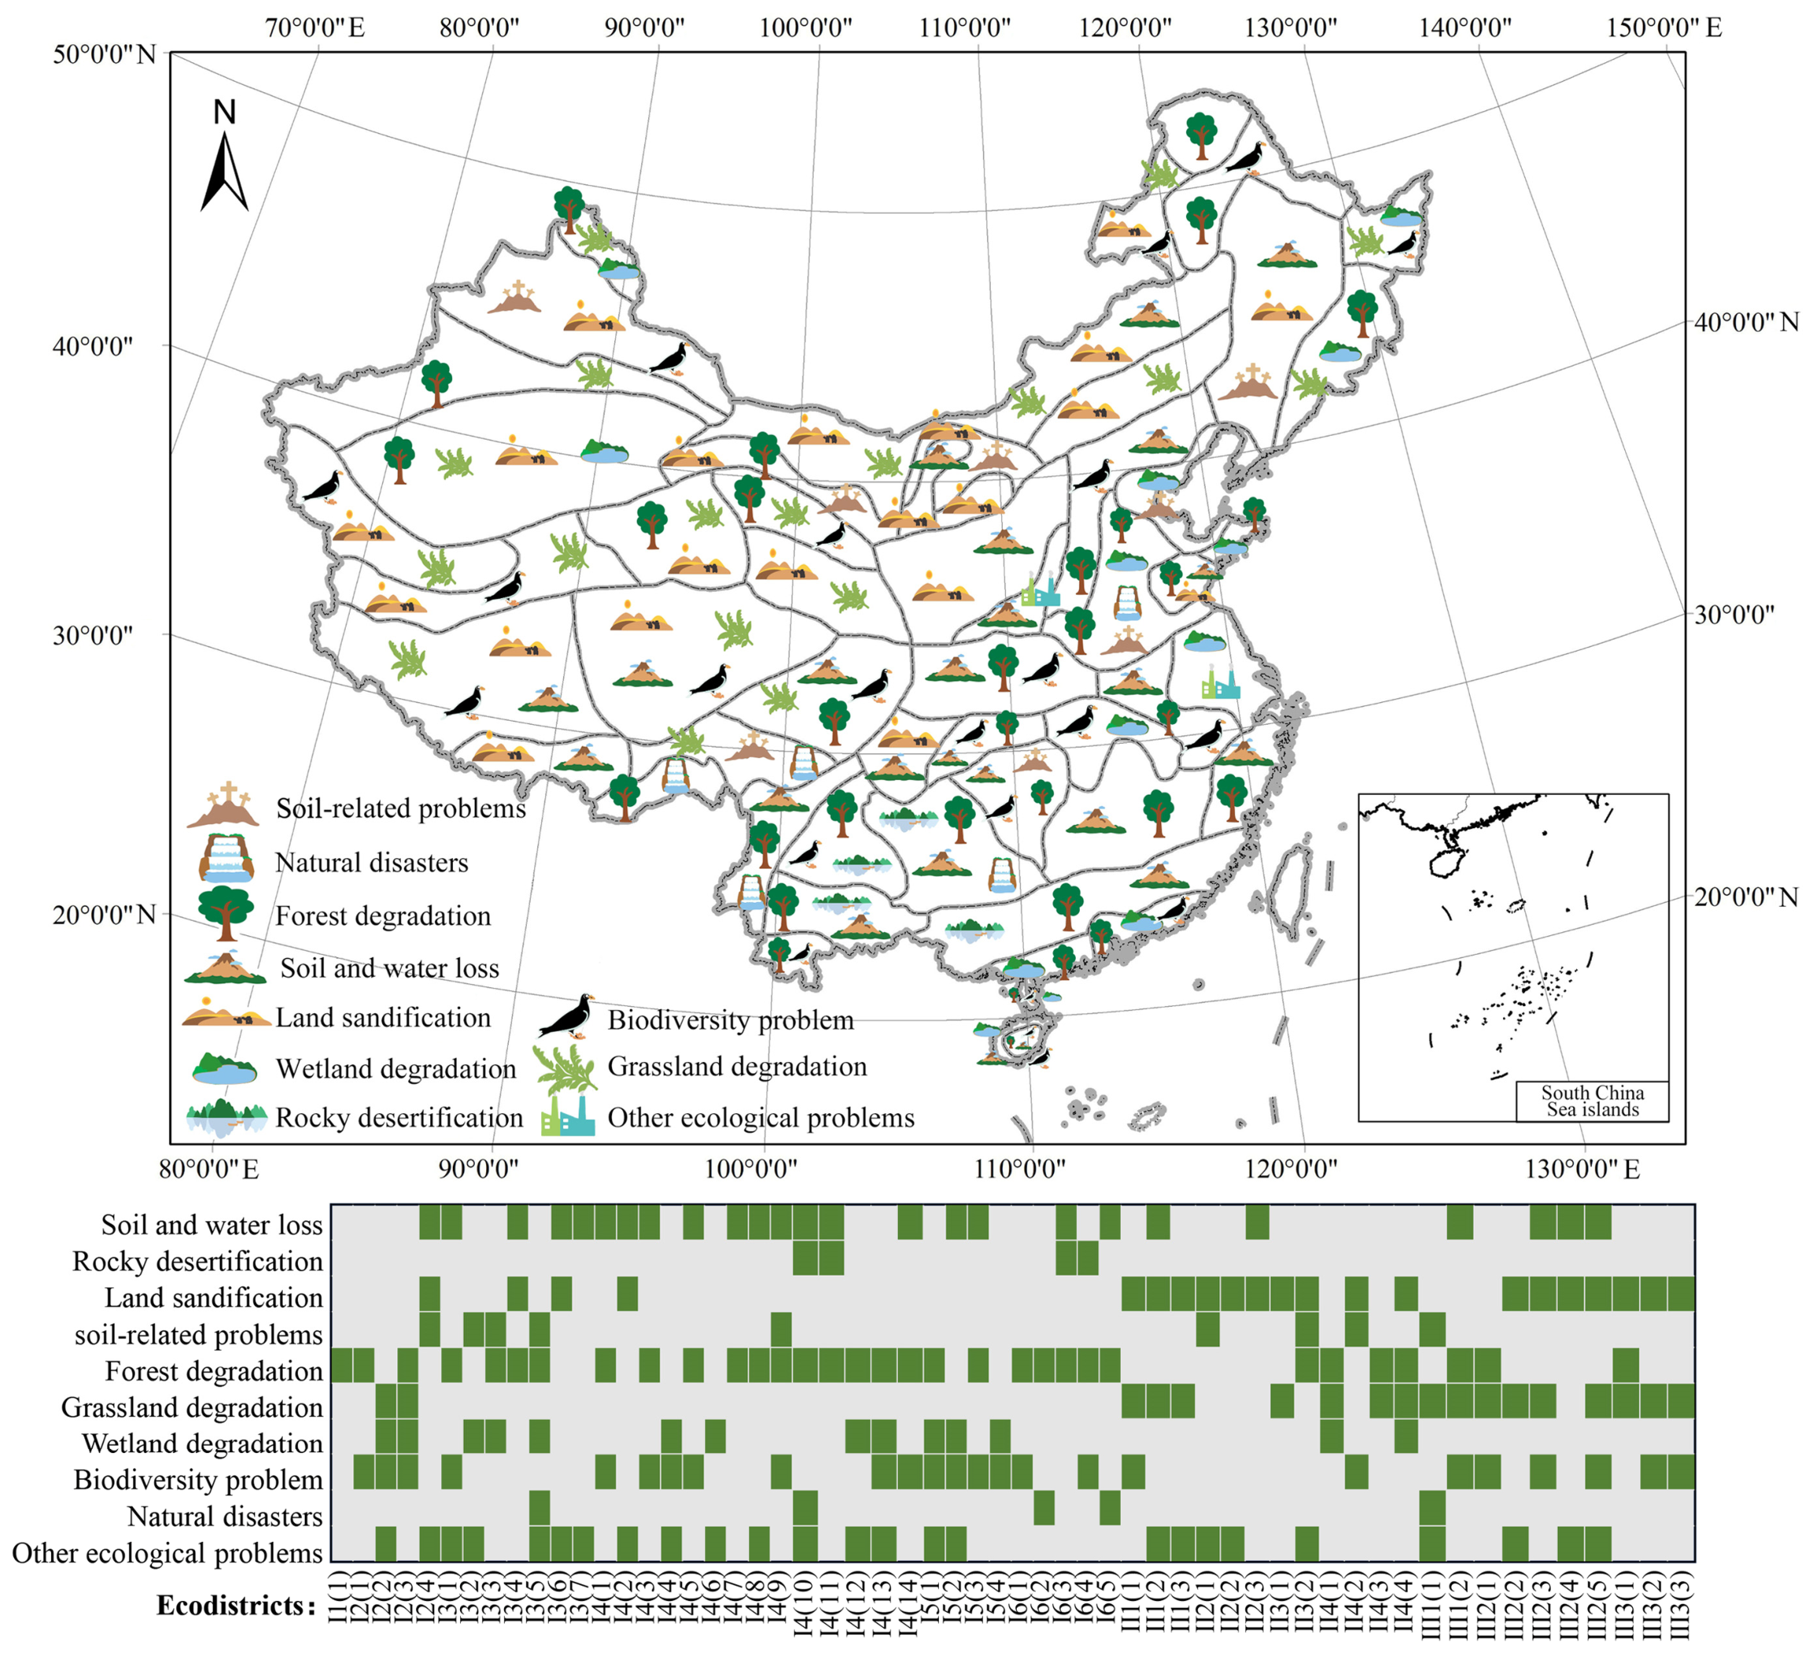
Using the proposed identification framework, we identified the dominant ecological problems across China’s 57 ecodistricts (Figure 11). These problems include soil and water loss, sandification, rocky desertification, forest degradation, grassland degradation, wetland degradation, biodiversity loss, soil-related problems, natural disasters, and other ecological pressures. The distribution of these problems varies markedly among ecodistricts because of differences in natural conditions, ecosystem structure, and human disturbance. Forest degradation was the most widespread ecological problem, occurring in 32 ecodistricts. Soil and water loss and biodiversity loss were each identified as major problems in 25 ecodistricts. Sandification affected 21 ecodistricts, while grassland and wetland degradation occurred in 18 ecodistricts. Soil and water loss was concentrated mainly in the eastern humid and semi-humid domain and several transitional ecological regions, whereas sandification was concentrated in the northwestern arid and semi-arid domain and parts of the Qinghai–Tibet Plateau. Biodiversity-related problems were particularly prominent in southwestern forest regions and alpine ecological zones. More than 80% of the ecodistricts were affected by three or more ecological problems, indicating that ecological degradation commonly occurs as a combination of multiple stressors rather than as a single isolated problem. The heatmap further illustrates the composition and co-occurrence of these ecological problems across individual ecodistricts. Such differences in problem combinations provide an important basis for distinguishing subsequent protection-oriented, restoration-oriented, and integrated protection–restoration strategies.
Figure 11.
Map of major ecological problems in different ecoregions of China.
4.3. Dominant Strategic Orientations Across Ecological Districts
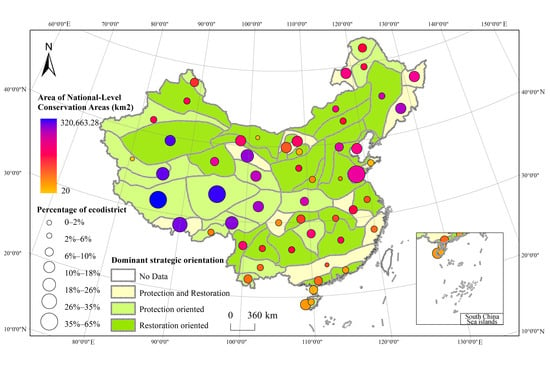
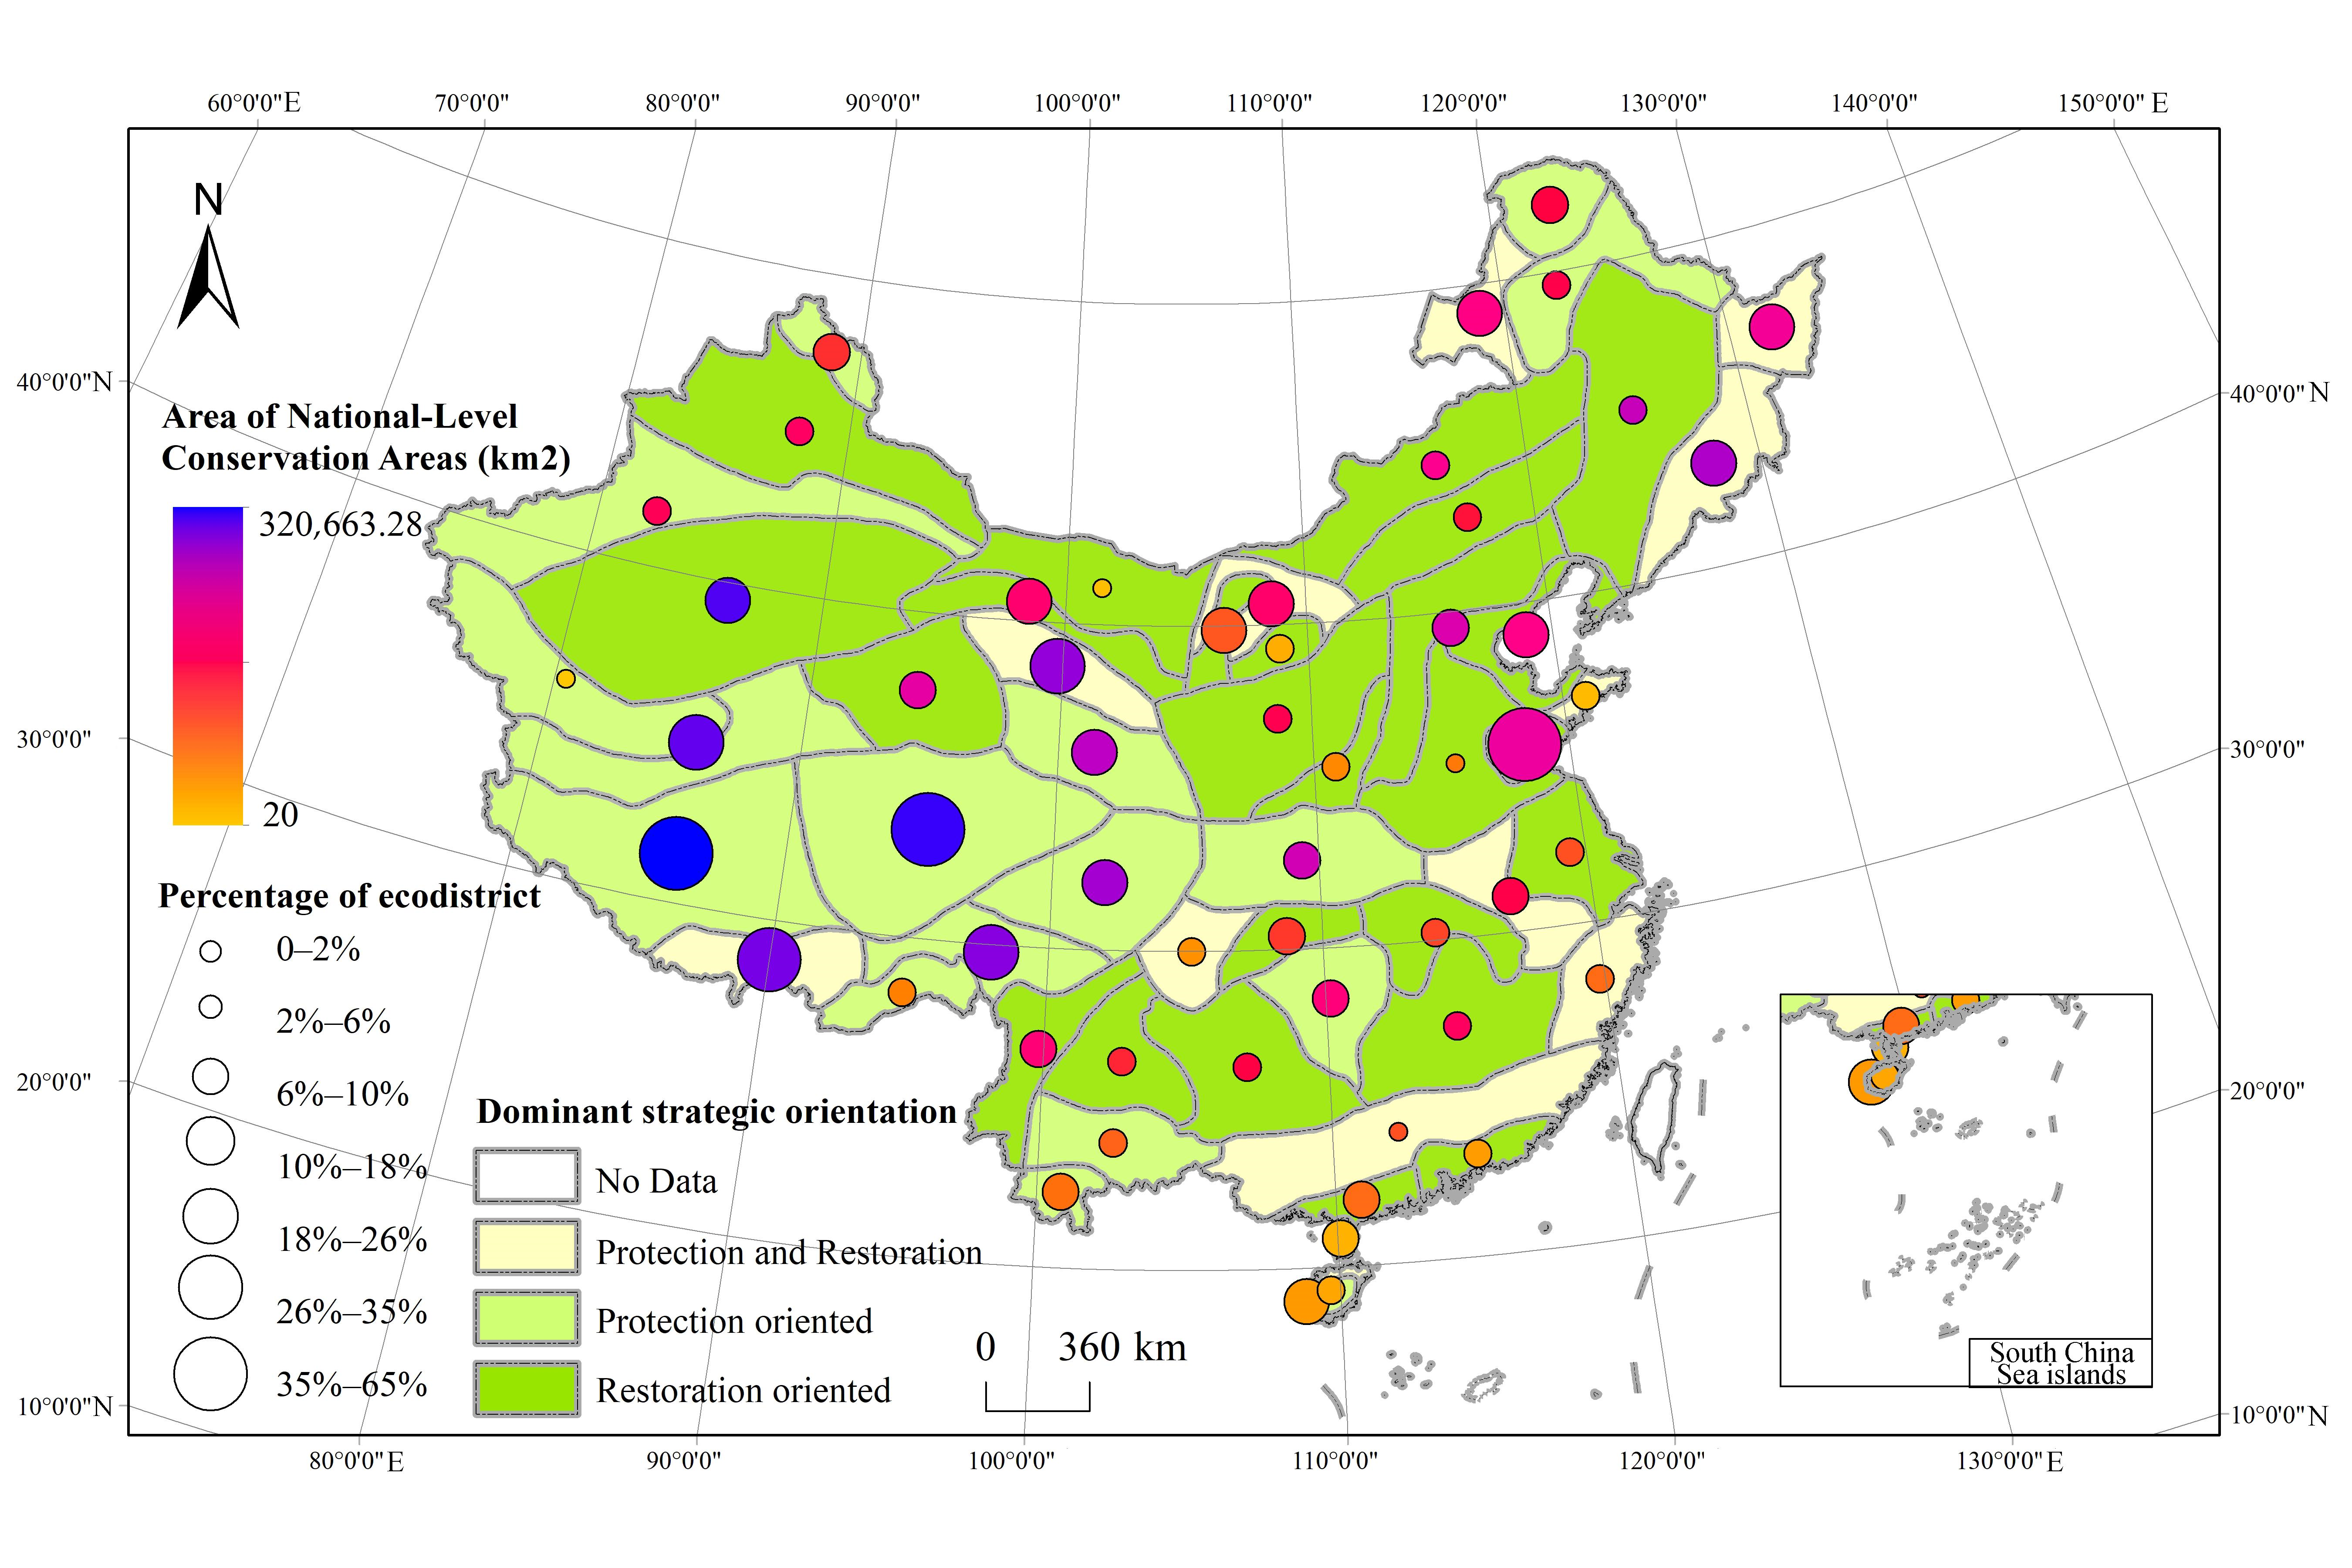
Based on the ecological problems and the relative prevalence of protection and restoration measures identified from the multi-source database, the dominant strategic orientation of each ecodistrict was classified as protection-oriented, restoration-oriented, or integrated protection–restoration. To characterize existing conservation intensity across ecodistricts, national nature reserves, national forest parks, and national geoparks were spatially overlaid with ecodistrict boundaries (Figure 12). The protected-area overlay was used only to describe the existing conservation context and was not employed as a criterion for determining the dominant strategic orientation. Clear spatial differences were observed among the three strategic orientations. Protection-oriented ecodistricts were generally concentrated in regions with relatively limited human disturbance and comparatively greater existing conservation coverage, particularly in border and remote ecological regions. A representative example is the Northern Daxinganling coniferous forest ecodistrict [I1(1)]. In contrast, restoration-oriented ecodistricts were more commonly associated with areas experiencing stronger human disturbance or prominent ecological degradation, including soil and water loss, sandification, and rocky desertification. Representative examples include the Northeast Plains agricultural ecodistrict [I2(4)] and the Guizhou–Guangxi karst sensitive ecodistrict [I4(10)]. Ecological districts characterized by integrated protection–restoration strategies were mainly distributed in agro-ecological regions and eastern tropical and subtropical forest regions, where ecological conservation and restoration demands coexist. Examples include the hilly deciduous broad-leaved forest ecodistrict of south-central Shandong Province [I3(4)] and the Coastal Hills agricultural ecodistrict in Southwest Guangdong [I4(12)]. These spatial differences indicate that dominant strategic orientations vary according to the combination of ecological pressures, human disturbance, and existing conservation conditions across ecodistricts.
Figure 12.
Dominant strategic orientations and existing conservation coverage across China’s ecodistricts.
5. Discussion
5.1. Ecological Gains and Regional Differentiation in China
China’s sustained investment in land and ecosystem sustainability programs has delivered transformative impacts and far-reaching implications across multiple dimensions. National monitoring indicates continued reductions in soil and water loss, sandification, and rocky desertification, while the vegetation analysis also shows an overall greening tendency. Although the official monitoring statistics originate from different national survey cycles, the spatial sensitivity datasets used for regional comparison in this study were standardized to a common reference period around 2020. Taken together, these results indicate a broad improvement in several major dimensions of ecosystem condition. The ecosystem transition results further indicate that China’s ecological change during 2005–2020 was characterized more by spatially concentrated restructuring than by nationwide replacement of ecosystem types. Only approximately 4.1% of the mapped area changed ecosystem category, but the dominant transitions were closely associated with contrasting forms of land-use change. Agricultural-to-urban conversion was particularly evident in intensively developed regions, whereas transitions between grassland and forest were more prominent in areas affected by ecological restoration and vegetation recovery. This pattern suggests that the national-scale stability of ecosystem composition can coexist with substantial local restructuring, and therefore aggregate changes alone may obscure ecologically important regional dynamics. However, this overall improvement is characterized by pronounced spatial heterogeneity. The ecological regionalization analysis shows that the types, magnitudes, and spatial extent of ecological change differ considerably among ecological domains, ecoregions, and ecodistricts. Vegetation improvement was more spatially widespread in the Eastern humid and semi-humid domain, whereas the Northwest arid and semi-arid domain exhibited a greater mean increase in NDVI. Particularly pronounced vegetation improvement occurred in the soil- and water-loss-sensitive ecodistrict of the Loess Plateau [I3(6)], the Hetao Plain irrigated agricultural ecodistrict [II2(1)], and the Maowusu Sand Desert ecodistrict [II2(2)]. In contrast, several intensively developed eastern ecodistricts, including the Yangtze River Delta urban and peri-urban agricultural ecodistrict [I4(6)], showed localized vegetation decline. These contrasting patterns demonstrate that national ecological improvement has not followed a uniform spatial trajectory. The sensitivity assessments also reveal that the spatial extent of an ecological problem does not necessarily correspond to its severity. Sandification sensitivity was concentrated mainly in the Northwest arid and semi-arid domain, where both the extent and severity were relatively high, whereas rocky-desertification sensitivity showed a different pattern: the Eastern humid and semi-humid domain contained the largest share of sensitive area, but the Northwest and Qinghai–Tibet domains exhibited substantially higher proportions of highly sensitive classes. Similar contrasts were evident among individual ecodistricts. These results indicate that regional ecological vulnerability should be evaluated by considering both the spatial extent and intensity of ecological pressures, rather than relying on a single aggregate indicator. Regional differentiation is also reflected in the distribution and co-occurrence of ecological pressures. Sandification sensitivity is concentrated mainly in the Northwest arid and semi-arid domain and parts of the Qinghai–Tibet Plateau, whereas rocky-desertification sensitivity is particularly prominent in southwestern karst regions. Soil and water loss, biodiversity decline, forest degradation, grassland degradation, and other ecological problems frequently overlap within the same ecodistricts. More than 80% of the 57 ecodistricts were identified as facing three or more major ecological problems. Vegetation change provides an additional example of this complexity. Although 59.0% of the assessed vegetation area exhibited increasing NDVI between 2005 and 2020, greening was not synonymous with the elimination of ecological vulnerability. Strong NDVI increases in the Loess Plateau and Maowusu Sand Desert coincided with persistent sensitivity to soil erosion and sandification, respectively, whereas several intensively developed eastern ecodistricts showed localized vegetation decline. These contrasting patterns demonstrate that ecosystem recovery is multidimensional and that improvement in vegetation condition should be interpreted together with underlying ecological sensitivities and human disturbance.
These spatial patterns are broadly consistent with previous studies documenting vegetation recovery and ecological restoration in northern China and the Loess Plateau, which has become an internationally recognized case of large-scale ecological restoration and soil conservation [31,32]. Previous research has also shown that major ecological programs have generated socioeconomic co-benefits, including livelihood improvement and poverty alleviation [33]. Nevertheless, the spatial correspondence between ecological improvement and long-term conservation or restoration initiatives should not be interpreted as direct causal attribution in this study. Rather, our results show that sustained ecological intervention has occurred alongside substantial overall improvement, while also revealing that outcomes remain strongly conditioned by regional ecological characteristics, human disturbance, and the coexistence of multiple environmental pressures. These findings provide the empirical basis for examining the institutional mechanisms and transferable lessons underlying China’s experience.
5.2. Institutional Mechanisms and Transferable Lessons from China’s Experience
China’s ecological improvements have been supported not only by individual restoration projects, but also by a broader institutional framework characterized by sustained national commitment, long-term investment, and the incorporation of ecological protection and restoration into national development strategies [34,35]. Major projects such as the Three-North Protective Forest Project, Natural Forest Protection Project, and Grain for Green Project are embedded within national development plans, positioning ecosystem protection and restoration as central rather than peripheral policy goals. This integration demonstrates an institutional approach in which ecological objectives are incorporated directly into broader socioeconomic planning. For the international community—particularly developing nations—China’s experience illustrates a practical model for balancing economic growth with ecological integrity.
A second mechanism is the use of spatially differentiated strategies rather than a single nationwide restoration approach. The results of this study show that ecological problems and strategic orientations vary substantially among ecodistricts. Protection-oriented strategies are more common in relatively intact and less disturbed ecological regions, restoration-oriented strategies are concentrated in areas experiencing stronger degradation and human disturbance, and integrated protection–restoration strategies occur mainly where ecological conservation and intensive land use coexist. This differentiation suggests that large-scale national programs can be more effective when broad policy objectives are translated into region-specific actions based on ecological conditions, dominant stressors, and the intensity of human activity. For countries with strong regional environmental contrasts, ecological regionalization can therefore provide an important basis for matching conservation and restoration measures to local ecological needs.
A third lesson concerns governance and implementation. China’s experience underscores the pivotal role of strong state capacity in scaling up ecological restoration. China’s experience emphasizes the role of multi-level coordination, with national strategies implemented through provincial and local institutions, as well as the gradual scaling-up of practices from pilot projects to broader application. Such an approach can reduce the risks associated with applying untested measures over large areas and allows restoration techniques to be adapted to local ecological and socioeconomic conditions. For developing countries facing fragmented governance or limited institutional capacity, this highlights the necessity of coherent governance frameworks and multi-level coordination to enable large-scale restoration. At the same time, several of China’s restoration initiatives are directly linked to poverty alleviation, demonstrating that ecological programs can simultaneously reduce ecosystem vulnerability and improve livelihoods [36]. These mechanisms should not be interpreted as a universally applicable institutional model. Governance capacity, land tenure, financial resources, ecological conditions, and social priorities differ substantially among countries. The transferable value of China’s experience therefore lies more in a set of general principles: long-term commitment, sustained investment, spatial differentiation, phased implementation, multi-level coordination, and the integration of ecological and socioeconomic objectives.
5.3. Critical Reflections and Limits to Transferability
The pronounced regional heterogeneity and widespread co-occurrence of ecological problems identified in this study also highlight the limitations of uniform, large-scale ecological interventions. More than 80% of the ecodistricts face three or more major ecological problems, while the dominant strategic orientations differ substantially among regions. This implies that a measure that is effective for one ecological problem or region may be inappropriate when transferred directly to another. In particular, restoration-oriented interventions in arid and semi-arid regions, karst landscapes, and intensively used agricultural or urban regions need to account for local resource constraints, ecosystem carrying capacity, and interactions among multiple ecological pressures. The differentiated protection, restoration, and integrated protection–restoration orientations identified in this study therefore reflect not only contrasting management priorities, but also the need to avoid one-size-fits-all solutions.
Previous studies show that large-scale ecological restoration can generate unintended environmental consequences when intervention intensity or restoration type is poorly matched to local conditions. For example, some afforestation measures implemented under the Three-North Shelterbelt Program have been questioned because of limited ecological benefits or adverse effects on vegetation survival in water-limited areas, while afforestation of degraded land and cropland may also produce negative net benefits under certain conditions [37,38]. These concerns are particularly relevant to the spatial patterns identified here, because regions showing ecological improvement may still remain sensitive to sandification, soil erosion, or other forms of degradation. Ecological recovery should therefore not be evaluated solely by increases in vegetation cover or other single indicators, but by whether restoration improves the overall ecosystem structure, function, and long-term resilience. Trade-offs are also socio-economic and institutional. The long-term effectiveness of restoration programs also depends on the incentives of governments, local communities, and other stakeholders, particularly where ecological objectives interact with economic costs and livelihood needs. Consequently, the trade-offs between benefits and costs for stakeholders represent substantial barriers to the attainment of sustainability goals [39]. In addition, these sustainable measures also pose other risks and challenges, such as the risk of ecological homogenization, insufficient local participation in certain projects, and the challenge of maintaining long-term ecological and economic sustainability. These issues suggest that the effectiveness of ecological programs depends not only on technical restoration measures, but also on participation, incentive design, adaptive management, and continued monitoring.
Accordingly, the international value of China’s experience lies as much in the challenges encountered as in the achievements obtained. Large-scale and sustained investment can create substantial ecological gains, but replication without consideration of local ecological and institutional conditions may generate new risks or reduce cost-effectiveness. For the international community, the more transferable lesson is therefore to combine long-term commitment with ecological regionalization, locally appropriate intervention, adaptive monitoring, and explicit evaluation of social–ecological trade-offs. Rather than replicating individual Chinese projects, ecological restoration strategies should be adapted to local environmental constraints, governance capacity, and development priorities.
Several limitations should be acknowledged. First, part of the information used in this study was originally reported for administrative units and subsequently transformed into ecological regionalization units through spatial overlay. Although county-level data were used instead of prefecture-level data to improve spatial precision, administrative and ecological boundaries do not fully coincide. This mismatch may introduce spatial aggregation uncertainty, particularly where counties intersect multiple ecodistricts, and may lead to effects analogous to the modifiable areal unit problem (MAUP). Second, although the principal spatial datasets used for ecological sensitivity assessment were harmonized to a common reference year, some official monitoring statistics originate from different national survey cycles because the corresponding monitoring programs are conducted and released at different times. These data were therefore used primarily to characterize the status and trajectory of individual ecological problems rather than for direct synchronous comparison. Future studies could reduce these uncertainties by incorporating finer-resolution gridded, site-level, or consistently timed monitoring data.
6. Conclusions
China has made sustained and large-scale efforts to improve land and ecosystem sustainability, and the overall ecological outcomes have been substantial. National monitoring indicates continued reductions in soil and water loss, sandification, and rocky desertification, while vegetation change shows an overall greening tendency. Ecosystem-type changes between 2005 and 2020 were limited in total extent but spatially heterogeneous, indicating that ecological improvement has occurred alongside continuing land-use transformation and regional environmental pressures. These findings suggest that China has made considerable progress in reversing several forms of ecosystem degradation, although ecological recovery remains incomplete and unevenly distributed.
Ecological regionalization further reveals that national trends conceal pronounced spatial differences in both ecological pressures and restoration outcomes. Soil-erosion sensitivity, sandification sensitivity, rocky-desertification sensitivity, and vegetation change exhibit distinct distributions among ecological domains, ecoregions, and ecodistricts. More than 80% of the 57 ecodistricts face three or more major ecological problems, demonstrating that ecosystem sustainability is commonly constrained by multiple overlapping pressures rather than by isolated environmental problems. Correspondingly, dominant strategic orientations also differ spatially: protection-oriented approaches are more prevalent in relatively intact and less disturbed regions, restoration-oriented approaches occur mainly in areas subject to stronger degradation and human disturbance, and integrated protection–restoration strategies are characteristic of regions where ecological conservation and intensive land use coexist. These results highlight the importance of matching ecological interventions to regional environmental conditions and combinations of dominant stressors.
China’s experience demonstrates the potential value of long-term policy commitment, sustained investment, multi-level coordination, ecological regionalization, and differentiated protection and restoration strategies. However, large-scale interventions may also generate ecological and socioeconomic trade-offs when restoration measures are poorly matched to local resource constraints, ecosystem carrying capacity, or livelihood conditions. Therefore, the international relevance of China’s experience lies not in the direct replication of particular projects or institutional arrangements, but in the broader principle of combining long-term commitment with region-specific intervention, adaptive management, and explicit consideration of social–ecological trade-offs. Both the achievements and the unintended consequences of China’s experience can provide useful references for countries seeking context-specific pathways toward land and ecosystem sustainability.
Author Contributions
Conceptualization, Supervision, Methodology, Formal analysis, Visualization, Writing—Original draft preparation, Data curation, S.L.; Conceptualization, Methodology, Visualization, Supervision, Data curation, K.W.; Conceptualization, Methodology, Supervision, J.Z.; Supervision, Z.F.; Data curation, Y.Z. and B.F. All authors have read and agreed to the published version of the manuscript.
Funding
This research was funded by China Postdoctoral Science Foundation (grant number 2026M790778) and Science and Technology Project of China Huaneng Group (grant number: HNKJ24-71).
Data Availability Statement
The data supporting the findings of this study are available from the corresponding author upon reasonable request.
Conflicts of Interest
The authors declare no conflicts of interest.
Appendix A
Table A1.
Ecological regionalization of China.
References
- Guo, X.Y.; Zhang, Y.X.; Guo, D.F.; Lu, W.T.; Xu, H. How does ecological protection redline policy affect regional land use and ecosystem services? Environ. Impact Assess. Rev. 2023, 100, 107062. [Google Scholar] [CrossRef] [Scilit]
- Liu, J.G.; Mooney, H.; Hull, V.; Davis, S.J.; Gaskell, J.; Hertel, T.; Lubchenco, J.; Seto, K.C.; Gleick, P.; Kremen, C.; et al. Systems integration for global sustainability. Science 2015, 347, 1258832. [Google Scholar] [CrossRef] [Scilit]
- Mooney, H.A.; Duraiappah, A.; Larigauderie, A. Evolution of natural and social science interactions in global change research programs. Proc. Natl. Acad. Sci. USA 2013, 110, 3665–3672. [Google Scholar] [CrossRef] [Scilit]
- Shindell, D.; Kuylenstierna, J.C.I.; Vignati, E.; van Dingenen, R.; Amann, M.; Klimont, Z.; Anenberg, S.C.; Muller, N.; Janssens-Maenhout, G.; Raes, F.; et al. Simultaneously Mitigating Near-Term Climate Change and Improving Human Health and Food Security. Science 2012, 335, 183–189. [Google Scholar] [CrossRef] [Scilit]
- Reis, S.; Grennfelt, P.; Klimont, Z.; Amann, M.; ApSimon, H.; Hettelingh, J.P.; Holland, M.; LeGall, A.C.; Maas, R.; Posch, M.; et al. From Acid Rain to Climate Change. Science 2012, 338, 1153–1154. [Google Scholar] [CrossRef] [Scilit]
- Hejazi, M.; Edmonds, J.; Clarke, L.; Kyle, P.; Davies, E.; Chaturvedi, V.; Wise, M.; Patel, P.; Eom, J.; Calvin, K.; et al. Long-term global water projections using six socioeconomic scenarios in an integrated assessment modeling framework. Technol. Forecast. Soc. Change 2014, 81, 205–226. [Google Scholar] [CrossRef] [Scilit]
- Zhang, L.X.; Shi, L.; Yang, F. Assessing ecosystem service dynamics in China’s coastal shelterbelt: Implications for ecosystem restoration. Environ. Impact Assess. Rev. 2024, 106, 107515. [Google Scholar] [CrossRef] [Scilit]
- Han, Z. Historical geography and environmental history in China. J. Chin. Stud. 2016, 1, 4. [Google Scholar] [CrossRef] [Scilit]
- He, F.N.; Ge, Q.S.; Dai, J.H.; Rao, Y.J. Forest change of China in recent 300 years. J. Geogr. Sci. 2008, 18, 59–72. [Google Scholar] [CrossRef] [Scilit]
- Miao, L.J.; Zhu, F.; Sun, Z.L.; Moore, J.C.; Cui, X.F. China’s Land-Use Changes during the Past 300 Years: A Historical Perspective. Int. J. Environ. Res. Public Health 2016, 13, 847. [Google Scholar] [CrossRef] [Scilit]
- Miao, L.J.; Zhu, F.; He, B.; Ferrat, M.; Liu, Q.; Cao, X.; Cui, X.F. Synthesis of China’s land use in the past 300 years. Glob. Planet. Change 2013, 100, 224–233. [Google Scholar] [CrossRef] [Scilit]
- Xu, J.T.; Yin, R.S.; Li, Z.; Liu, C. China’s ecological rehabilitation: Unprecedented efforts, dramatic impacts, and requisite policies. Ecol. Econ. 2006, 57, 595–607. [Google Scholar] [CrossRef] [Scilit]
- Ren, G.P.; Young, S.S.; Wang, L.; Wang, W.; Long, Y.C.; Wu, R.D.; Li, J.S.; Zhu, J.G.; Yu, D.W. Effectiveness of China’s National Forest Protection Program and nature reserves. Conserv. Biol. 2015, 29, 1368–1377. [Google Scholar] [CrossRef] [Scilit]
- Yu, D.P.; Zhou, L.; Zhou, W.M.; Ding, H.; Wang, Q.W.; Wang, Y.; Wu, X.Q.; Dai, L.M. Forest Management in Northeast China: History, Problems, and Challenges. Environ. Manag. 2011, 48, 1122–1135. [Google Scholar] [CrossRef] [Scilit]
- Chen, Y.; Tang, H. Desertification in north China: Background, anthropogenic impacts and failures in combating it. Land Degrad. Dev. 2005, 16, 367–376. [Google Scholar] [CrossRef] [Scilit]
- Douglas, I. Land degradation, soil conservation and the sediment load of the Yellow River, China: Review and assessment. Land Degrad. Dev. 1989, 1, 141–151. [Google Scholar] [CrossRef] [Scilit]
- Chen, Y.P.; Wang, K.B.; Lin, Y.S.; Shi, W.Y.; Song, Y.; He, X.H. Balancing green and grain trade. Nat. Geosci. 2015, 8, 739–741. [Google Scholar] [CrossRef] [Scilit]
- Wang, F.; Pan, X.B.; Wang, D.F.; Shen, C.Y.; Lu, Q. Combating desertification in China: Past, present and future. Land Use Policy 2013, 31, 311–313. [Google Scholar] [CrossRef] [Scilit]
- Cheng, L.L.; Lu, Q.; Wu, B.; Yin, C.B.; Bao, Y.S.; Gong, L.Y. Estimation of the Costs of Desertification in China: A Critical Review. Land Degrad. Dev. 2018, 29, 975–983. [Google Scholar] [CrossRef] [Scilit]
- Wang, S.A.; Fu, B.J.; Piao, S.L.; Lu, Y.H.; Ciais, P.; Feng, X.M.; Wang, Y.F. Reduced sediment transport in the Yellow River due to anthropogenic changes. Nat. Geosci. 2016, 9, 38–41. [Google Scholar] [CrossRef] [Scilit]
- Liu, J.G.; Li, S.X.; Ouyang, Z.Y.; Tam, C.; Chen, X.D. Ecological and socioeconomic effects of China’s policies for ecosystem services. Proc. Natl. Acad. Sci. USA 2008, 105, 9477–9482. [Google Scholar] [CrossRef] [Scilit]
- Viña, A.; McConnell, W.J.; Yang, H.B.; Xu, Z.C.; Liu, J.G. Effects of conservation policy on China’s forest recovery. Sci. Adv. 2016, 2, e1500965. [Google Scholar] [CrossRef] [Scilit]
- Chen, Z.X.; Yang, Y.J.; Zhou, L.; Hou, H.P.; Zhang, Y.Z.; Liang, J.; Zhang, S.L. Ecological restoration in mining areas in the context of the Belt and Road initiative: Capability and challenges. Environ. Impact Assess. Rev. 2022, 95, 106767. [Google Scholar] [CrossRef] [Scilit]
- Huang, C.B.; Zhao, D.Y.; Deng, L. Landscape pattern simulation for ecosystem service value regulation of Three Gorges Reservoir Area, China. Environ. Impact Assess. Rev. 2022, 95, 106798. [Google Scholar] [CrossRef] [Scilit]
- Gao, M.W.; Hu, Y.C.; Bai, Y.P. Construction of ecological security pattern in national land space from the perspective of the community of life in mountain, water, forest, field, lake and grass: A case study in Guangxi Hechi, China. Ecol. Indic. 2022, 139, 108867. [Google Scholar] [CrossRef] [Scilit]
- Tong, X.W.; Brandt, M.; Yue, Y.M.; Horion, S.; Wang, K.L.; De Keersmaecker, W.; Tian, F.; Schurgers, G.; Xiao, X.M.; Luo, Y.Q.; et al. Increased vegetation growth and carbon stock in China karst via ecological engineering. Nat. Sustain. 2018, 1, 44–50. [Google Scholar] [CrossRef] [Scilit]
- Fu, B.J.; Liu, G.H.; Chen, L.D.; Ma, K.M.; Li, J.R. Scheme of ecological regionalization in China. Acta Ecol. Sin. 2001, 21, 1–6. [Google Scholar]
- Gann, G.D.; McDonald, T.; Walder, B.; Aronson, J.; Nelson, C.R.; Jonson, J.; Hallett, J.G.; Eisenberg, C.; Guariguata, M.R.; Liu, J.G.; et al. International principles and standards for the practice of ecological restoration. Second edition. Restor. Ecol. 2019, 27, S3–S46. [Google Scholar] [CrossRef] [Scilit]
- Ministry of Natural Resources of the People’s Republic of China; Ministry of Finance of the People’s Republic of China; Ministry of Ecology and Environment of the People’s Republic of China. Guidelines for Ecological Protection and Restoration Projects of Mountains, Waters, Forests, Fields, Lakes and Grasses (Trial). 2020. Available online: https://www.cgs.gov.cn/zcwj/202009/t20200921_820730.html (accessed on 9 October 2026).
- Weiss, J.L.; Gutzler, D.S.; Coonrod, J.E.A.; Dahm, C.N. Long-term vegetation monitoring with NDVI in a diverse semi-arid setting, central New Mexico, USA. J. Arid Environ. 2004, 58, 272. [Google Scholar] [CrossRef] [Scilit]
- Liu, L.M.; Gao, Y.C.; Chen, J.R.; Zvomuya, F.; He, H.L. Ecological restoration success on the Loess Plateau of China: A qualitative and quantitative exploration based on rephotography. Earth Surf. Process. Landf. 2024, 49, 1081–1098. [Google Scholar] [CrossRef] [Scilit]
- Wu, X.T.; Wei, Y.P.; Fu, B.J.; Wang, S.; Zhao, Y.; Moran, E.F. Evolution and effects of the social-ecological system over a millennium in China’s Loess Plateau. Sci. Adv. 2020, 6, eabc0276. [Google Scholar] [CrossRef] [Scilit]
- Bryan, B.A.; Gao, L.; Ye, Y.Q.; Sun, X.F.; Connor, J.D.; Crossman, N.D.; Stafford-Smith, M.; Wu, J.G.; He, C.Y.; Yu, D.Y.; et al. China’s response to a national land-system sustainability emergency. Nature 2018, 559, 193–204. [Google Scholar] [CrossRef] [Scilit]
- He, J.; Bao, C.K.; Shu, T.F.; Yun, X.X.; Jiang, D.H.; Brown, L. Framework for integration of urban planning, strategic environmental assessment and ecological planning for urban sustainability within the context of China. Environ. Impact Assess. Rev. 2011, 31, 549–560. [Google Scholar] [CrossRef] [Scilit]
- Rozas-Vásquez, D.; Fürst, C.; Geneletti, D. Integrating ecosystem services in spatial planning and strategic environmental assessment: The role of the cascade model. Environ. Impact Assess. Rev. 2019, 78, 106291. [Google Scholar] [CrossRef] [Scilit]
- Elion. Kubiqi Desert Becomes Model for Desertification Control. PR Newswire, 6 August 2015.
- Cao, S.; Suo, X.; Xia, C. Payoff from afforestation under the Three-North Shelter Forest Program. J. Clean. Prod. 2020, 256, 120461. [Google Scholar] [CrossRef] [Scilit]
- Zhao, T.; Xia, C.; Suo, X.; Cao, S. Cost-benefit evaluation of Chinese ecological restoration programs. Acta Ecol. Sin. 2021, 41, 4757–4764. [Google Scholar] [CrossRef] [Scilit]
- Qi, X.; Cheng, Y.; Zhang, Y.; Xu, Y.; Xu, L. Water and Soil Conservation from the Perspective of Stakeholders: Evidence from China and Policy Implications. Clean-Soil Air Water 2014, 42, 956–962. [Google Scholar] [CrossRef] [Scilit]
Disclaimer/Publisher’s Note: The statements, opinions and data contained in all publications are solely those of the individual author(s) and contributor(s) and not of MDPI and/or the editor(s). MDPI and/or the editor(s) disclaim responsibility for any injury to people or property resulting from any ideas, methods, instructions or products referred to in the content. |
© 2026 by the authors. Licensee MDPI, Basel, Switzerland. This article is an open access article distributed under the terms and conditions of the Creative Commons Attribution (CC BY) license.