


Abstract
Promoting synergies between ecological conservation and low-carbon development is an important pathway toward sustainable development. As a major institutional initiative for natural ecological conservation in China, the National Park (NP) pilot policy may affect regional carbon emissions by improving ecological spatial governance and resource utilization. This study uses balanced panel data for 2749 Chinese counties from 2014 to 2024 and applies the Callaway and Sant’Anna difference-in-differences estimator for multiple time periods (CSDID) to examine the impact of the NP pilot policy on carbon emissions. The results show that, first, the NP pilot policy significantly reduces county-level carbon emissions. Second, the mechanism analysis suggests that the policy may reduce carbon emissions through industrial structure upgrading and lower energy consumption. Third, the heterogeneity analysis shows statistically significant carbon-reduction effects in economically better-off counties and counties located in key cities for environmental protection. Fourth, the spatial spillover analysis demonstrates that the policy not only reduces carbon emissions within the pilot regions but also generates significant carbon-reduction effects in neighboring areas. This study clarifies how China’s NP pilot policy may support local low-carbon transitions and provides evidence on the synergy between ecological conservation and climate governance.
1. Introduction
In the face of global environmental challenges such as climate change and ecosystem degradation, how to coordinate ecological conservation with economic and social development has become an important concern for the international community [1]. The Global Carbon Budget 2025 projects global fossil CO2 emissions to reach approximately 38.1 billion tonnes in 2025, about 1.0% higher than in 2024 and a record high [2]. Against the backdrop of growing pressure on global climate governance, effectively controlling carbon emissions while maintaining economic development has become an important issue for countries pursuing green transitions. In response, China has set the strategic goals of peaking carbon emissions before 2030 and achieving carbon neutrality before 2060 and has incorporated green and low-carbon development into its overall national modernization plan [3]. Achieving these goals requires not only adjustments to the energy structure and the industrial transformation [4], but also further examination of the potential synergistic emission-reduction effects of different types of ecological and environmental policies. Compared with environmental regulations, energy policies, and other policies that directly target pollutant emissions and energy use, nature conservation policies primarily aim to maintain ecosystem integrity and improve environmental quality [5]. However, sufficient empirical evidence is still lacking on whether these policies can reduce regional carbon emissions and through what changes in economic activity.
The NP pilot policy provides an important institutional setting for examining the relationship between ecological conservation and carbon emission reduction. As a major initiative in the reform of China’s protected area system, national parks focus on protecting nationally representative natural ecosystems [6,7]. They integrate different types of protected areas, strengthen unified conservation and management, reduce fragmented management, and regulate related economic activities [8]. Traditional environmental policies directly affect production activities by restricting pollutant emissions or adjusting energy use [9]. In contrast, the NP pilot policy first changes resource use and economic activities within protected areas and their surrounding regions. These changes on the one hand may reduce regional carbon emissions by restricting resource exploitation, adjusting industrial activities, and reducing energy demand [10]. On the other hand, the development of related industries, such as ecotourism, may generate new economic activities and energy demand, which may affect the actual emission-reduction effect of the policy [11]. Therefore, whether the NP pilot policy can reduce carbon emissions and through which changes in economic activities are important questions for understanding the climate effects of nature conservation policies.
However, existing studies have not fully established the theoretical and empirical links between nature conservation institutions and reduction in carbon emissions. Related research has developed along two relatively separate strands. The first strand examines the factors influencing carbon emissions. It investigates the formation of carbon emissions from the perspectives of economic development, technological progress, and policy regulation. At the economic development level, relevant factors include new urbanization [12], trade openness [13], and growing tourism demand [14]. In terms of technological change, relevant factors include technological innovation [15], energy structure optimization [16], artificial intelligence [17], the digital economy [18], and digital infrastructure development [19]. In terms of policy regulation, environmental regulation [20], carbon taxes [21], and carbon emissions trading [22] can also reduce emissions. The second strand examines the economic, ecological, and land-use effects of NPs and protected areas. Research topics include economic growth [23], residents’ income [24,25,26], ecological conservation performance [27], biodiversity [28], and land-use change [29]. Some studies have also examined reforms of protected area management systems [30]. Others have explored the effects of protection intensity on forest carbon stocks [31]. Taken together, prior research offers valuable insights into the environmental consequences of nature conservation institutions. Overall, research on carbon emissions mainly focuses on conventional environmental regulation, technological innovation, and energy transition. By contrast, NP research primarily examines ecological conservation, biodiversity, ecosystem services, and socioeconomic impacts [8]. Whether and how the NP pilot policy, as a form of territorial spatial governance, affects carbon emissions remains insufficiently explored.
To fill this gap, this study employs the CSDID estimator developed by Callaway and Sant’Anna [32] and treats the NP pilot policy as a quasi-natural experiment. Using panel data for 2749 Chinese counties from 2014 to 2024, it systematically examines the policy’s effect on county-level carbon emissions. It further analyzes the underlying mechanisms from the perspectives of industrial structure and energy consumption. The study also examines differences in policy effects across levels of economic development and environmental governance contexts. Finally, the analysis is extended to surrounding counties to identify potential cross-regional spillover effects on carbon emission reduction.
The contributions of this study are fourfold. First, it strengthens the link between research on nature conservation policies and climate governance. Existing studies have paid insufficient attention to the carbon-reduction effects of nature conservation policies. This study views the NP pilot policy as an institution for territorial spatial governance oriented toward ecological conservation and examines the policy’s effect on regional carbon emissions. It provides empirical evidence of the climate benefits of nature conservation institutions and also broadens the scope of research on ecological conservation policies and regional low-carbon development.
Second, this study examines industrial structure upgrading and energy consumption as two potential channels linking the NP pilot policy to county-level carbon emissions. It analyzes whether the policy affects county-level carbon emissions through industrial structure upgrading and energy consumption. This reveals the economic transmission pathways through which nature conservation policies generate carbon-reduction effects and also provides evidence on the mechanisms linking ecological conservation with emission-reduction goals.
Third, this study extends the contextual analysis of the carbon-reduction effects of the NP pilot policy. It examines policy heterogeneity based on county-level economic development and whether the county is located in a key city for environmental protection. Statistically significant carbon-reduction effects are found in counties with higher levels of economic development and those located in key cities for environmental protection. This provides empirical evidence on how county-level development conditions and city-level environmental governance affect policy outcomes.
Fourth, the study extends the assessment from pilot counties to surrounding counties. The results show that the NP pilot policy not only reduces carbon emissions in pilot counties but also generates significant spillover effects in neighboring counties. This deepens the understanding of the cross-regional climate benefits of nature conservation policies and provides a reference for differentiated policy implementation and coordinated regional emission reduction.
2. Theoretical Analysis and Hypothesis Development
Carbon emissions mainly arise from fossil energy consumption in industrial production, household activities, transportation, and building operations [33]. Their scale depends not only on technological development but also on industrial structure, resource use, and the organization of economic activities [34]. According to institutional change theory, the NP pilot policy places the protection of natural ecosystems at its core. It strengthens ecological constraints on regional activities by defining protected areas, implementing zoning controls, regulating natural resource use, and restricting development activities.
As the conservation framework is gradually implemented, local governments must adapt their industrial development and project planning to new ecological and environmental governance requirements. Enterprises and residents must also adjust their production, business operations, and daily activities, leading to changes in regional production structures and resource input patterns [10]. For one thing, ecological constraints increase the development costs of resource-intensive industries with high environmental impacts. They also create opportunities for green industries, such as ecotourism and modern services, thereby promoting industrial structure upgrading. For another, environmental constraints and green development requirements encourage economic actors to improve energy efficiency and consumption patterns, thereby reducing regional energy consumption [35]. Therefore, the NP pilot policy may affect carbon emissions through industrial structure upgrading and lower energy consumption.
First, the NP pilot policy reduces carbon emissions by promoting industrial structure upgrading. On the one hand, the policy changes the development conditions of different industries and thereby upgrades the regional industrial structure. The Overall Plan for Establishing a National Park System explicitly calls for strict controls over planning and construction [36]. It states that, except for activities that do not damage ecosystems, all other development and construction activities are prohibited. Permitted activities include improvements to local residents’ production and living facilities, nature-based sightseeing, scientific research, education, and tourism. The plan also requires industrial and mining enterprises that do not meet conservation and planning requirements to gradually relocate from NP areas. It establishes a gradual withdrawal mechanism for existing mining rights and encourages local residents and enterprises to participate in NP concession projects. These arrangements change the entry conditions and development opportunities of different industries. Resource-dependent industries face stricter ecological and environmental constraints. Meanwhile, more development opportunities are created for industries suited to ecological resource use. This promotes the reallocation of capital, labor, and other production factors and shifts the regional industrial structure toward services and green development.
On the other hand, industrial structure upgrading further affects carbon emissions by changing the shares of different industries in regional economic activities. Industries differ significantly in their energy demand and carbon intensity. Resource-dependent industries, such as mining and traditional manufacturing, generally have high levels of energy consumption and carbon emissions [37]. In contrast, modern services and environmentally friendly industries impose relatively low pressures on resources and the environment [38]. As the share of resource-dependent industries declines and that of environmentally friendly industries increases, regional economies become less dependent on energy-intensive production. Carbon emissions consequently decrease. Therefore, the NP pilot policy promotes industrial structure upgrading by changing industrial development conditions, thereby reducing carbon emissions.
Second, the NP pilot policy reduces carbon emissions by lowering energy consumption. National Park development emphasizes resource conservation and ecological protection. It sets higher resource and environmental standards for business operations, infrastructure construction, and residents’ production and daily activities. These requirements encourage enterprises, public institutions, and residents to improve energy efficiency and shift toward cleaner energy sources. For business operations, stricter environmental standards and routine supervision increase the environmental costs of energy-intensive and inefficient production. This encourages businesses to improve production processes, upgrade energy-consuming equipment, strengthen energy management, and increase energy efficiency [39].
For residents, NP development improves infrastructure, community-based ecological conservation, and public services in pilot areas. These improvements create favorable conditions for clean energy use and energy-saving lifestyles. For example, the Shennongjia National Park pilot implemented an electricity-for-fuelwood program, thereby reducing residents’ dependence on fuelwood [40]. In the Sanjiangyuan National Park region, Qinghai has continued the Green Electricity for Sanjiangyuan initiative. During designated periods, all electricity demand for urban and rural production and daily life was supplied by hydropower, solar power, wind power, and other clean energy sources [41]. In addition, nature education and public participation can strengthen awareness of ecological conservation and energy saving, encouraging residents to reduce daily energy waste [42,43]. The NP pilot policy therefore reduces regional energy consumption by adjusting energy inputs in business operations and residents’ daily lives.
Lower energy consumption directly reduces regional carbon emissions [44]. Fossil energy consumption in industrial production, transportation, building operations, and daily life is a major source of carbon emissions. Both the scale and structure of energy consumption directly affect regional carbon emissions. The NP pilot policy encourages businesses to improve energy efficiency and residents to optimize household energy use, thereby reducing regional energy inputs. Meanwhile, a shift toward cleaner energy sources reduces carbon emissions from fossil fuel use and generates regional carbon-reduction effects.
Accordingly, this study proposes the following hypotheses.
H1.
The NP pilot policy contributes to reducing carbon emissions.
H2.
The NP pilot policy reduces carbon emissions by promoting industrial structure upgrading.
H3.
The NP pilot policy reduces carbon emissions by reducing energy consumption.
3. Materials and Methods
3.1. Study Area
To examine whether the NP pilot policy can reduce carbon emissions, this study selects China’s NP pilot areas as its research setting for three reasons. First, China has extensive and diverse natural ecosystems, including forests, grasslands, wetlands, deserts, alpine ecosystems, and tropical rainforests. National Park development covers different ecological and geographical regions. This provides diverse settings for examining the environmental effects of ecological conservation policies under different natural and economic conditions. Second, China’s NP development has clear policy objectives and a unified institutional framework. The NP system reform focuses on protecting natural ecosystems. It integrates existing protected areas, unifies natural resource management, and strengthens ecological conservation institutions. This reform shifts nature conservation from fragmented management [45] toward an NP system, providing a clear institutional setting for identifying the overall effects of ecological conservation policies. Third, the development of China’s NP system has followed a gradual process from central-level planning to local pilot implementation. Different NP pilots were launched in different years and covered multiple county-level administrative areas. This created a research sample with clear temporal and spatial policy variation, facilitating the identification of the policy’s causal effects using a quasi-natural experimental approach.
From the perspective of policy development, China’s NP system evolved gradually from top-level design to pilot implementation. In 2013, the Third Plenary Session of the 18th CPC Central Committee first proposed establishing a national park system. In 2015, the Pilot Plan for Establishing a National Park System was issued, officially launching the national park system pilots. Pilot programs were subsequently implemented in ten areas, including Sanjiangyuan, Giant Panda, Northeast China Tiger and Leopard, Qilian Mountain, Shennongjia, Wuyishan, Qianjiangyuan, Nanshan, Shangri-La Potatso, and Hainan Tropical Rainforest. Together, these pilot areas covered 12 provinces. The pilot reforms focused on integrating protected areas, unifying natural resource management, regulating territorial spatial use, providing ecological conservation compensation, and promoting coordinated community development. These reforms established a relatively unified institutional framework while preserving regional differences in ecosystem types, economic development, and resource use. Such regional differences within a unified institutional setting provide favorable conditions for examining the economic and environmental effects of the NP pilot policy.
As shown in Figure 1, the ten NP pilot areas are distributed across Northeast China, the eastern hilly regions, the mountainous areas of central and western China, the Qinghai–Tibet Plateau, and Hainan Island. They cover various ecosystem types, including forests, grasslands, wetlands, alpine ecosystems, and tropical rainforests. This study uses county-level administrative areas as the basic unit of analysis and constructs a balanced panel of 2749 Chinese county-level administrative units from 2014 to 2024. Based on the spatial overlap between NP pilot areas and county-level administrative boundaries, counties covered by the pilot areas are assigned to the treatment group. The year in which the corresponding pilot began is defined as the first year in which each county was treated. Counties not covered by any NP pilot during the sample period form the control group. The final treatment group includes 70 counties, while the control group includes 2679 counties. The NP pilots cover different regions and were implemented in stages. This spatial and temporal variation provides a quasi-natural experimental setting for using the CSDID approach to identify the policy’s effect on county-level carbon emission reduction.
Figure 1.
Spatial Distribution of China’s National Park Pilots and County-Level Study Sample.
3.2. Model Construction
The NP pilots were introduced in stages, and counties entered the program at different times. In this setting, treatment effects may vary across both treatment cohorts and calendar-time. Under staggered treatment, traditional two-way fixed-effects models may be affected by heterogeneous treatment effects. They may therefore fail to accurately capture the actual effects across treatment cohorts and different stages of policy implementation. To address this issue, this study employs the CSDID method [32]. Based on group-time average treatment effects, this method identifies the dynamic effects of the staggered implementation of the NP pilot policy on county-level carbon emissions. It allows policy effects to vary across treatment cohorts and identifies how these effects change over calendar time and relative treatment time.
According to the implementation schedule, 2016, 2017, and 2019 are defined as the first treatment years for three policy cohorts. These cohorts correspond to counties that entered the NP pilots in different batches, while counties that never entered the pilots form the untreated group. Based on this classification, the study identifies the policy’s effect on county-level carbon emission reduction through the overall average treatment effect, dynamic treatment effects, and heterogeneous treatment effects.
3.2.1. Static Treatment Effects
Assume that the sample period consists of T periods, with t denoting the year. Define Dit as the policy treatment indicator. If county i has entered the NP pilot by year t, the indicator equals 1; otherwise, it equals 0. Define g as the year in which county i first enters the pilot, namely the treatment cohort year. Based on the county-level sample and the timing of the pilot programs, the three treatment cohorts are 2016, 2017, and 2019, such that Γ = {2016, 2017, 2019}. Counties that never enter the NP pilot form the untreated group. Let Gig be the cohort indicator. If county i first receives treatment in year g, the indicator equals 1; otherwise, it equals 0. Let CEit denote the observed carbon emissions of county i in year t, CEit(0) denote the potential outcome without treatment, and CEit(g) denote the potential outcome when the county first receives treatment in year g. The relationship between the observed and potential outcomes is expressed as follows.
Based on Equation (1), this study defines the group-time average treatment effect as follows.
ATT(g,t) = E[CEit(g) − CEit(0)|Gig = 1]
The ATT(g,t) represents the average policy effect in year t for counties first treated in year g. It allows treatment effects to vary across implementation cohorts and calendar years.
To improve the robustness of the estimates, this study uses the Improved Doubly Robust DiD Estimator (DRIMP) proposed by Sant’Anna and Zhao [46] to estimate the group-time average treatment effect. This method jointly specifies a treatment probability model and a model for changes in untreated outcomes. The treatment probability model is estimated using inverse probability tilting, while the outcome-change model is estimated using weighted least squares. The estimator is doubly robust. It consistently estimates the average treatment effect on the treated if at least one of the two models is correctly specified. When both models are correctly specified, the estimator is also locally efficient and improves the robustness of statistical inference.
In this equation, the control variables are denoted by Xi,t. The treatment probability estimated using inverse probability tilting is denoted by Pg(Xi,t), while Ci is the indicator for the untreated group. The outcome-change function estimated using the untreated group is denoted by , and δ represents the baseline-period specification.
Callaway and Sant’Anna further provide several aggregation methods for describing the overall causal effect of the policy from different perspectives. This study defines the overall treatment effect as follows.
In this equation, w(g,t) denotes the aggregation weight. This study uses the overall average treatment effect aggregation scheme, with the weight expressed as follows.
Here, Ng is the number of treated counties in cohort g, and T is the final year of the sample. The Overall ATT uses the simple aggregation of post-treatment group-time effects, with weights proportional to cohort size. The overall ATT is used as the main measure of the policy effect. A significantly negative estimate of the overall ATT indicates that the NP pilot policy reduces carbon emissions, thereby supporting Hypothesis H1.
3.2.2. Dynamic Treatment Effects
The CSDID model identifies not only the static treatment effect after policy implementation but also how the policy effect changes with event time. For this purpose, this study constructs the event-time variable e = t − g. When e = 0, county i has just entered the NP pilot. When e = 1, county i is in the first year after treatment. When e < 0, it refers to a relative period before policy implementation. Accordingly, the dynamic treatment effect of the NP pilot policy is expressed as follows.
This method follows a logic similar to that of an event-study approach. It captures changes in treatment effects before and after policy implementation and provides an indirect test of the parallel trends assumption. When e ≥ 0, θes(e) represents the average policy effect at event time e after policy implementation. When e < 0, the corresponding pre-treatment estimate indicates whether the treatment and control groups had systematically different trends before policy implementation.
3.2.3. Heterogeneous Treatment Effects
Because the effects of the NP pilot policy may vary across calendar-time and treatment cohorts, this study further examines both types of heterogeneity. Calendar-time heterogeneity focuses on how the policy’s effect on county-level carbon emissions changes across calendar years. Cohort heterogeneity focuses on differences in policy effects across treatment cohorts. The calendar-time-specific heterogeneous treatment effect is expressed as follows.
In this equation, τ denotes a specific year. The cohort-specific heterogeneous treatment effect is expressed as follows.
In this equation, γ denotes a specific treatment cohort.
These specifications identify the overall average treatment effect, dynamic treatment effects, calendar-time-specific heterogeneous effects, and cohort-specific heterogeneous effects of the NP pilot policy. The overall average treatment effect tests whether the policy generates an overall carbon-reduction effect. The dynamic treatment effects capture how the policy effect evolves over time. Calendar-time and cohort heterogeneity further reveal differences across implementation stages and treatment cohorts.
3.3. Variable Definitions
3.3.1. Explained Variable
The dependent variable is county-level carbon emissions (CE). The data are obtained from the carbon dioxide emissions dataset of the Emissions Database for Global Atmospheric Research (EDGAR). EDGAR estimates carbon dioxide emissions using a technology-based emission factor approach [47]. The estimates consider the activity level, technology mix, emission factors, and emission-reduction measures of different sectors. EDGAR then uses spatial proxy data, such as the locations of energy and industrial facilities, road networks, and population distribution, to allocate the estimated emissions to geographical grid cells. This produces emissions data with a high spatial resolution. Based on these data, this study spatially matches the EDGAR emissions grids with China’s 2024 county-level administrative boundary vector data. Grid-level emissions are aggregated within county boundaries to obtain annual carbon dioxide emissions for each county in China. To reduce right skewness and heteroskedasticity and facilitate the economic interpretation of the regression coefficients, the natural logarithm of annual county-level carbon dioxide emissions is used as the county-level carbon emissions measure.
3.3.2. Control Variables
To account for the potential influence of county-level socioeconomic development, population size, and government behavior on the relationship between the NP pilot policy and carbon emissions, this study includes a set of control variables based on related research [23]. These variables include per capita GDP (GDP), human capital (HC), fiscal pressure (FS), financial development (FIN), population density (PO), internet penetration (TE), and capital investment (FI). Table 1 presents the definitions and calculation methods of these variables.
Table 1.
Definitions of Key Variables.
3.4. Sample Selection and Data Sources
Regarding sample selection, this study uses county-level panel data from China for the period 2014–2024 to examine the effect of the NP pilot policy on county-level carbon emissions. The starting year is selected mainly because China’s State Council issued the Air Pollution Prevention and Control Action Plan in September 2013. The plan introduced systematic measures for industrial restructuring, energy use, and air pollution control. Setting 2014 as the starting year ensures that all observations fall after the introduction of this major environmental policy. This helps reduce potential interference caused by spanning this policy change and provides a relatively consistent macro-policy setting for comparisons before and after the NP pilot policy.
County-level carbon emissions data are obtained from EDGAR. This database has broad temporal and spatial coverage and uses relatively consistent accounting methods. It therefore provides a comparable basis for assessing carbon emissions across counties [48]. The EDGAR gridded data are spatially matched with county-level administrative boundaries to calculate annual carbon dioxide emissions for each county. County-level control variables capturing socioeconomic development, public finance, financial development, population, and education were primarily obtained from the China County Statistical Yearbook and the China Regional Economy Statistical Yearbook. Missing values for specific counties and years were first filled using statistical yearbooks of the respective counties, county-level cities, and districts, statistical bulletins on national economic and social development, and county-level statistics reported in provincial and municipal statistical yearbooks. For the small number of missing observations remaining in intermediate years, linear interpolation is applied after verifying consistency in statistical definitions and data comparability.
During data processing, all continuous variables are winsorized to reduce the influence of extreme observations on parameter estimates. Counties affected by administrative boundary adjustments are harmonized according to a consistent county-level administrative framework over the study period. This ensures the comparability of county-level observations across years. Stata 18 is used for data processing and empirical analysis, while Python 3.12 is used to produce the spatial distribution maps. The final balanced panel covers 2749 county-level administrative units over 11 years from 2014 to 2024, yielding 30,239 county-year observations. Table 1 presents the definitions and calculation methods of the main variables.
4. Empirical Results and Analysis
4.1. Descriptive Statistics
Table 2 presents the descriptive statistics of the variables. During the sample period, the natural logarithm of county-level carbon emissions ranged from 10.898 to 17.200, with a mean of 14.156 and a standard deviation of 1.433. This indicates substantial differences in carbon emissions across counties.
Table 2.
Descriptive Statistics.
Figure 2 shows the spatial distribution of county-level carbon emissions at the beginning and end of the sample period. Overall, high-emission counties were mainly concentrated in the eastern coastal and some northern regions, while most counties in southwestern China had relatively low emissions. County-level carbon emissions therefore displayed clear spatial differences. Calculations based on the study sample further show that, from 2014 to 2024, average carbon emissions in the treatment group increased from 1.8781 million tonnes to 2.0865 million tonnes, representing a cumulative increase of 11.10%. Average emissions in the control group increased from 3.6443 million tonnes to 4.3516 million tonnes, representing a cumulative increase of 19.41%.
Figure 2.
Spatial Distribution of County-Level Carbon Emissions.
Although average carbon emissions were consistently higher in the control group, emissions increased over time in both groups. This indicates that county-level economic activities were still accompanied by some emissions growth during the sample period. However, the cumulative increase in the treatment group was 8.31 percentage points lower than that in the control group. This provides preliminary evidence that carbon emissions grew more slowly in NP pilot counties.
4.2. The Effect of the NP Pilot Policy on County-Level Carbon Emissions
4.2.1. Results for Static Treatment Effects
Table 3 reports the overall treatment effect of the NP pilot policy on carbon emissions. Panel A presents the overall average treatment effect (Overall ATT), the average treatment effect aggregated by calendar time (CAverage), and the average treatment effect aggregated by cohort (GAverage). Panel B presents the pre-treatment parallel trends test for all group-time average treatment effects. After including the control variables and clustering standard errors at the county level, the Overall ATT is −0.0672 and is significant at the 5% level. This indicates that the NP pilot policy significantly reduces carbon emissions in treated counties. Because the dependent variable is the natural logarithm of total county-level carbon dioxide emissions, the estimate indicates an average reduction of approximately 6.50% after policy implementation.
Table 3.
The Effect of the NP Pilot Policy on County-Level Carbon Emissions.
In Panel B, the joint pre-treatment trends test has a p-value of 0.1629. The null hypothesis that the relevant pre-treatment effects are jointly equal to zero cannot be rejected, and no significant differences in pre-treatment trends are detected. This result supports the identification of the policy effect. Overall, the baseline estimates show that the NP pilot policy significantly reduces carbon emissions in pilot counties, supporting Hypothesis H1.
4.2.2. Results for Dynamic Treatment Effects
Figure 3 presents the dynamic treatment effects. Before the implementation of the NP pilot policy, the estimated coefficients generally fluctuate around zero, and all 95% confidence intervals include zero. None of the pre-treatment coefficients differ significantly from zero. Their 95% confidence intervals also contain zero, indicating no significant systematic differences between the treatment and untreated groups before policy implementation. These results provide empirical support for the parallel trends assumption underlying the baseline estimates.
Figure 3.
Dynamic Treatment Effects.
After policy implementation, all estimated coefficients are negative, and their absolute values generally increase over time. The estimates are not significant during the initial implementation period but gradually become significantly negative in subsequent years. This indicates that the carbon-reduction effect of the NP pilot policy emerges with a time lag and continues to strengthen during the sample period. One possible reason is that NP development involves industrial restructuring, changes in production and business operations, improvements in energy use, and adjustments to community development patterns. These policy effects generally take time to produce observable changes in carbon emissions. Therefore, the dynamic estimates support the overall carbon-reduction effect of the NP pilot policy and also reveal a time lag in its effect.
4.2.3. Results for Heterogeneous Treatment Effects
Table 3 reports the aggregated treatment effects, while Figure 4 presents the calendar-time- and cohort-specific estimates. Regarding calendar-time heterogeneity, Table 3 shows that CAverage is −0.0649 and is significant at the 5% level. This result is broadly consistent with the Overall ATT and indicates that the NP pilot policy significantly reduces county-level carbon emissions. The estimated coefficients for 2016–2019 are relatively small in absolute value, and most are not statistically significant. After 2020, their absolute values generally increase. The estimated coefficients for 2022, 2023, and 2024 are −0.0891, −0.1145, and −0.1236, respectively. All are significant at the 5% level or higher. These findings indicate that the carbon-reduction effect becomes more pronounced later in the sample period. This is consistent with the time lag shown by the dynamic treatment effects.
Figure 4.
Heterogeneous Treatment Effects.
Regarding cohort heterogeneity, GAverage is −0.0629 and is significant at the 5% level. The average treatment effect for the 2016 cohort is −0.0859 and is significant at the 1% level. The estimated coefficient for the 2017 cohort is −0.0282 but is not statistically significant. The coefficient for the 2019 cohort is 0.0161 and is also not significant. These results indicate that the overall carbon-reduction effect is mainly driven by counties that entered the pilot in 2016. This earlier cohort had a longer period of policy exposure, allowing more time for ecological conservation, industrial restructuring, and energy transition measures to take effect. This finding is also consistent with the dynamic treatment effect estimates. The confidence intervals for the 2017 and 2019 cohorts are relatively wide. These cohorts include only 12 and 9 treated counties, respectively, suggesting that differences across cohorts may also be influenced by sample size.
4.3. Robustness Tests
4.3.1. Placebo Test
To examine whether the baseline results could have arisen from random treatment assignment, this study conducts a randomized placebo test. Specifically, 70 counties are randomly selected from the 2679 counties that were never treated. Of these counties, 49, 12, and 9 are assigned placebo implementation years of 2016, 2017, and 2019, respectively. This preserves the cohort sizes and timing structure of the actual treatment group. The procedure is repeated 500 times. Each simulation uses the same control variables and Overall ATT aggregation method as the baseline estimation, and all simulations are completed successfully. Table 4 reports the corresponding statistical results. Across the 500 simulations, the mean estimated treatment effect is −0.0012, with a standard deviation of 0.0294. This indicates that the estimates under random assignment are concentrated around zero. In contrast, the Overall ATT of the actual policy is −0.0672. This estimate lies well outside the central region of the placebo distribution and falls in its left tail. Only 10 of the 500 simulations produce an estimate with an absolute value equal to or greater than that of the actual estimate. The corresponding two-sided empirical p-value is 0.0200. After applying the plus-one correction, the p-value is 0.0220, which remains below the 5% significance level. These results indicate that random assignment is unlikely to produce an estimate as large as or more extreme than the actual policy effect.
Table 4.
Randomized Placebo Test.
Figure 5 shows that the Overall ATT estimates under random assignment are mainly concentrated around zero, and the kernel density curve of the placebo estimates peaks at an Overall ATT close to zero. Most of the corresponding p-values lie above 0.10, the threshold marked by the horizontal dashed line. This indicates that the placebo policy does not produce a consistent carbon-reduction effect. In contrast, the baseline estimate of −0.0672 lies well outside the central region of the placebo estimates and falls in the left tail of the distribution. This shows that a negative effect of the magnitude observed for the actual policy rarely occurs under random assignment. It therefore provides further evidence supporting the robustness of the finding that the NP pilot policy reduces county-level carbon emissions.
Figure 5.
Placebo Test.
4.3.2. Replacing the Explained Variable
To examine whether the baseline findings are sensitive to the measurement of carbon emissions, this study uses the natural logarithm of per capita carbon emissions as an alternative dependent variable [49]. This variable is calculated as the natural logarithm of the ratio of total county-level carbon dioxide emissions to population. Column (1) of Table 5 shows that the Overall ATT is −0.0576 after replacing the dependent variable and is significant at the 10% level. This indicates that the NP pilot policy reduces not only total county-level carbon emissions but also per capita emissions. The p-value of the joint pre-treatment trends test is 0.8723. Therefore, the null hypothesis that the relevant pre-treatment effects are jointly equal to zero cannot be rejected. These results provide further support for H1 from the perspective of per capita emissions.
Table 5.
Robustness Tests.
4.3.3. Replacing the Estimation Method
To examine whether the baseline results are sensitive to the choice of estimation method, this study uses two alternative estimators within the CSDID framework. The improved doubly robust estimator used in the baseline analysis (DRIMP) is replaced by the doubly robust inverse probability weighting estimator (DRIPW) and the inverse probability weighting estimator (IPW). The DRIPW estimator combines outcome regression with propensity-score weighting, while the IPW estimator constructs weights using propensity scores. Columns (2) and (3) of Table 5 show that the Overall ATT estimates obtained using these methods are −0.0661 and −0.0666, respectively. Both estimates are significant at the 5% level. The corresponding p-values of the joint pre-treatment trends tests are 0.1510 and 0.1861, respectively. Neither test rejects the null hypothesis. These results provide further support for the conclusion that the NP pilot policy reduces county-level carbon emissions.
4.3.4. Excluding Competing Policies
To reduce potential confounding effects from other environmental policies implemented during the same period, this study separately adds variables for the carbon emissions trading pilot and the low-carbon city pilot policy to the baseline model. The carbon-reduction effect of the NP pilot policy is then re-estimated. Columns (4) and (5) of Table 5 show that the Overall ATT estimates are −0.0658 and −0.0672 after controlling for the two policies, respectively. Both estimates are significant at the 5% level. The corresponding p-values of the joint pre-treatment trends tests are 0.1693 and 0.1865. Neither test rejects the null hypothesis that the relevant pre-treatment effects are jointly equal to zero. Overall, the carbon-reduction effect of the NP pilot policy remains supported after accounting separately for these policies, further strengthening the robustness of the baseline findings.
4.4. Mechanism Tests
The preceding empirical results show that the NP pilot policy significantly reduces county-level carbon emissions. Building on these findings, this study further examines the possible mechanisms underlying the policy effect. According to the preceding theoretical analysis, industrial structure upgrading and reduced energy consumption are two important transmission channels. On the one hand, the NP pilot policy changes the development conditions and expected returns of different industries, thereby guiding the reallocation of production factors. This effect should be reflected in a shift in the industrial structure toward the service sector. On the other hand, ecological conservation constraints may encourage economic actors and residents to improve their energy use and strengthen energy-saving management. This effect should be reflected in lower energy consumption. Following the outcome-based channel-testing approach used in recent county-level evaluations of staggered policies, this study re-estimates the CSDID model with industrial structure upgrading and energy consumption as the respective outcome variables [50].
Industrial structure upgrading is measured by the share of value added from the tertiary industry in gross regional product and is denoted by TS [51]. Column (1) of Table 6 and Figure 6a present the average and dynamic policy effects. First, the Overall ATT of the NP pilot policy on TS is 0.0276 and is significant at the 1% level. Second, none of the pre-treatment estimates differ significantly from zero, and all 95% confidence intervals include zero. The p-value of the joint pre-treatment trends test is 0.2599. Therefore, the null hypothesis that the relevant pre-treatment effects are jointly equal to zero cannot be rejected. No systematic differences in pre-treatment trends are found between the treatment and untreated groups. After policy implementation, the estimates are generally positive and gradually increase, indicating that the structural response develops over time. Existing studies show that industrial structure upgrading and the reallocation of economic activity toward relatively less carbon-intensive sectors can reduce carbon emissions, particularly by decreasing dependence on energy-intensive production and improving energy efficiency [52,53]. Taken together with the baseline finding that the NP pilot policy significantly reduces carbon emissions, these results provide evidence consistent with the industrial-structure channel proposed in Hypothesis H2.
Table 6.
Mechanism Test.
Figure 6.
Dynamic Effects and Placebo Test for Industrial Structure Upgrading.
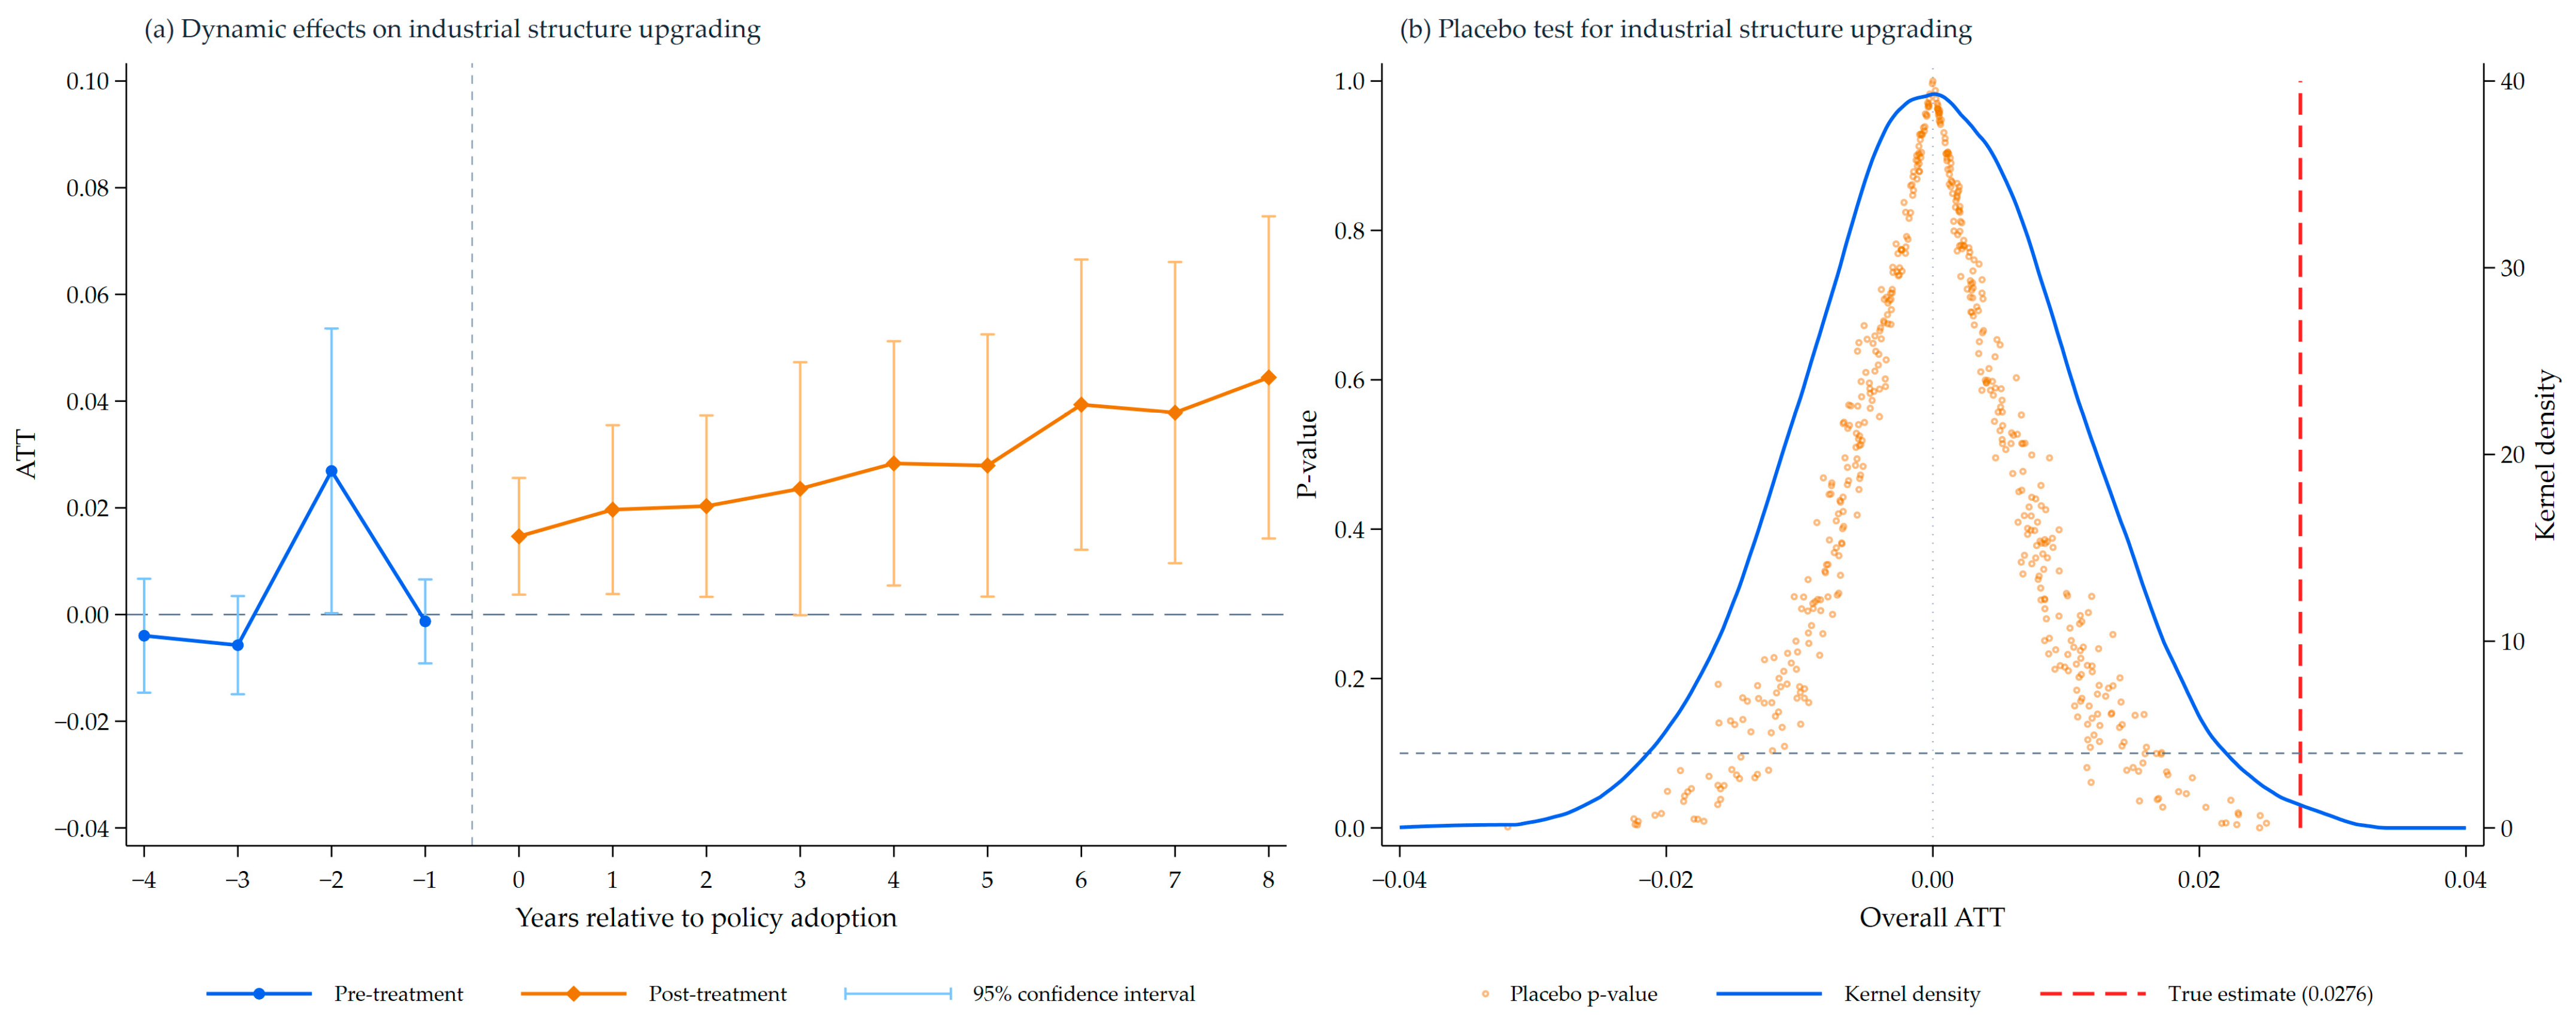
Figure 6b presents the placebo test for industrial structure upgrading. The estimates from 500 random assignments are mainly concentrated around zero, while the actual policy estimate of 0.0276 lies in the right tail of the randomization distribution. It is clearly outside the central region of the placebo effects. Most randomized estimates are not statistically significant, whereas the actual estimate is significant at the 1% level. This indicates that randomly assigning pilot counties and implementation years generally does not produce an industrial structure upgrading effect similar to the actual policy effect. The result is therefore unlikely to be driven by the chance spatial distribution of pilot areas or other random factors.
County-level total electricity consumption and the supply of coal gas, natural gas, and liquefied petroleum gas are converted into standard coal equivalents using the corresponding conversion factors and then aggregated. After conversion and aggregation, the natural logarithm of the resulting value is used to measure energy consumption (EC) [54]. Because county-level energy statistics contain a substantial number of missing observations, county-level data are used wherever available, while data from the corresponding prefecture-level cities are used to supplement missing county-year observations. Column (2) of Table 6 and Figure 7a present the average and dynamic policy effects. The Overall ATT of the NP pilot policy on EC is −0.1674 and is significant at the 5% level. This indicates that energy consumption decreases significantly in treated areas after policy implementation. None of the pre-treatment estimates differ significantly from zero, and all 95% confidence intervals include zero. The p-value of the joint pre-treatment trends test is 0.4012. The null hypothesis that the relevant pre-treatment effects are jointly equal to zero cannot be rejected, and no significant differences in pre-treatment trends are detected. After policy implementation, the point estimates are generally negative and remain relatively stable across most periods, suggesting that the reduction in energy consumption persists following policy adoption. Existing studies have established that lower fossil-energy use and improvements in energy efficiency are important contributors to carbon-emission reduction [4,44]. Taken together with the baseline finding that the NP pilot policy significantly reduces carbon emissions, these results provide evidence consistent with the energy-consumption channel proposed in Hypothesis H3.
Figure 7.
Dynamic Effects and Placebo Test for Energy Consumption.
Figure 7b presents the placebo test for energy consumption. The randomized estimates are mainly distributed around zero, while the actual policy estimate of −0.1674 lies in the left tail of the randomization distribution. It clearly differs from most placebo effects. Most randomized estimates do not reach conventional significance levels, whereas the actual estimate is significant at the 5% level. This indicates that randomly generated policy assignments are unlikely to reproduce the reduction in energy consumption observed in the actual sample. The result is therefore less likely to be explained by the chance spatial distribution of pilot areas or other random factors.
4.5. Heterogeneity Analysis
The preceding empirical analysis shows that the NP pilot policy significantly reduces county-level carbon emissions on average. However, the effectiveness of this form of territorial spatial governance may vary with local economic conditions and environmental governance contexts. This section therefore examines policy heterogeneity along two dimensions, namely county-level economic development and location in a key city for environmental protection.
4.5.1. Heterogeneity of Economic Development Level
County-level economic development is an important factor affecting the effectiveness of ecological conservation policies. The NP pilot policy changes the conditions for local economic activities by strengthening natural resource protection and land-use restrictions. However, whether these constraints lead to industrial transformation and carbon reduction may depend on local economic conditions and adjustment capacity. On the one hand, counties with higher levels of economic development generally have more diversified industrial systems. These systems provide more opportunities for capital and labor moving away from traditional resource-based activities, thereby reducing the cost of industrial adjustment. On the other hand, stronger economic conditions may provide financial and technological support for upgrading energy-saving equipment, improving business management, and developing environmentally friendly industries.
Counties at different levels of economic development may therefore respond differently to similar ecological conservation requirements. To examine this heterogeneity, the sample is divided into lower- and higher-development groups based on per capita GDP before policy implementation. The Overall ATT of the NP pilot policy is then estimated separately for each group. Using a pre-policy economic indicator for grouping helps reduce the influence of economic changes after policy implementation. Columns (1) and (2) of Table 7 show that the Overall ATT is −0.0423 for the lower-development group and is not statistically significant at conventional levels. For the higher-development group, the estimate is −0.0735 and is significant at the 5% level. However, the joint pre-treatment trends test yields a p-value of 0.0001 for the lower-development group, indicating rejection of the null hypothesis. For the higher-development group, the corresponding p-value is 0.3988, and the null hypothesis cannot be rejected. Therefore, the estimate for the lower-development group should be interpreted with caution.
Table 7.
Heterogeneity Analysis.
The significant result for the higher-development group may reflect the role of local economic conditions in supporting industrial restructuring. After the NP pilot policy strengthens ecological conservation constraints, economic activities that depend on resource extraction must seek new development paths. Counties with higher levels of economic development generally have better market conditions and supporting services. These advantages help transform ecological resources into opportunities for nature education, ecological experiences, and related services. When these activities create new sources of employment and income, capital and labor can move more easily across industries. Ecological conservation constraints are then more likely to shift the industrial structure toward services. This finding is consistent with the industrial structure upgrading mechanism discussed above. Stronger economic conditions may also improve the ability of economic actors to reduce energy use. Equipment upgrades and energy-saving improvements generally require initial investment, while their benefits emerge gradually during subsequent operations. Economic actors with better access to funding and technology may be more able to meet ecological conservation requirements by upgrading equipment and improving operational management. These adjustments can reduce energy consumption in production and daily activities. By comparison, counties with weaker economic conditions may face insufficient development of alternative industries and stronger financing constraints. As a result, ecological conservation requirements may take longer to produce emission-reduction effects.
4.5.2. Heterogeneity by Location in a Key City for Environmental Protection
The environmental governance context of the city in which a county is located may affect the implementation of the NP pilot policy and its coordination with existing policies. Although the policy primarily targets specific ecological spaces, its implementation involves regulating resource development, managing construction projects, and adjusting local economic activities. It must therefore be integrated with the governance systems of both the county and its host city. Similar ecological conservation requirements may produce different outcomes under different environmental governance conditions.
Counties located in key cities for environmental protection may receive more sustained attention and have stronger monitoring, enforcement, and policy coordination. These conditions can help translate ecological conservation goals into changes in specific economic activities. To examine this heterogeneity, counties are grouped according to whether their host cities are designated as key cities for environmental protection. The Overall ATT of the NP pilot policy is then estimated separately for each group. Columns (3) and (4) of Table 7 show that the estimate is −0.0606 for counties outside key cities for environmental protection and is significant at the 10% level. For counties located in key cities for environmental protection, the estimate is −0.1137 and is significant at the 1% level. The p-values of the joint pre-treatment trends tests are 0.2945 and 0.2535, respectively. Neither test rejects the null hypothesis. Based on the point estimates and their statistical significance, the carbon-reduction effect appears more pronounced in counties located in key cities for environmental protection.
This result may reflect the support provided by existing environmental governance conditions. The ecological spatial protection and resource development restrictions introduced by the NP pilot policy require sustained supervision and interdepartmental coordination to generate actual behavioral changes. In regions with stronger environmental governance, local governments may be better able to identify development activities that do not meet conservation requirements. They may also be better able to coordinate management responsibilities and monitor the implementation of corrective and exit measures. Ecological conservation constraints can therefore create more stable policy expectations and encourage enterprises and other economic actors to adjust their investment and operating decisions. Existing environmental governance arrangements may also complement the NP pilot policy. Existing arrangements mainly affect pollution control, production operations, and energy use. The NP pilot policy further adjusts the boundaries of economic activities through ecological spatial protection and resource development restrictions. When both types of requirements operate together, economic actors must consider the environmental performance of existing activities and reassess the locations, resource inputs, and operating methods of future projects. This may strengthen incentives for industrial restructuring and energy-saving management, allowing the policy’s conservation requirements to be more fully translated into emission reductions.
5. Further Analysis
The carbon-reduction effect of the NP pilot policy may extend beyond the pilot areas. On the one hand, NP development may generate demonstration and diffusion effects. Ecological conservation experience, environmental governance practices, and green development concepts developed in pilot areas may spread to neighboring areas through policy learning, technological diffusion, and cross-regional ecological cooperation. This may encourage neighboring areas to strengthen environmental governance and reduce carbon emissions. Meanwhile, ecosystems and environmental pollution often cross administrative boundaries. Ecological restoration and environmental improvements resulting from NP development may therefore generate positive externalities for surrounding areas.
On the other hand, the ecological conservation constraints imposed by the NP pilot policy may lead to the spatial displacement of carbon emissions. Regional economic theory and the pollution haven hypothesis suggest that stricter environmental regulations may increase the production costs of energy-intensive and high-emission enterprises. This may encourage these enterprises or industries to relocate to neighboring areas with less stringent environmental regulations. In this case, lower carbon emissions in pilot areas may be accompanied by higher emissions in surrounding areas, resulting in carbon leakage. Therefore, examining only the policy’s effect on carbon emissions in pilot counties is insufficient to determine whether it achieves genuine regional carbon reduction or merely changes the spatial distribution of emissions. To examine whether the NP pilot policy affects carbon emissions in neighboring counties, this study constructs a CSDID model based on exposure to neighboring pilot areas.
5.1. Spatial Spillover Model Construction
Let Ti denote the year in which county i first enters the NP pilot. For counties entering the pilot in 2016, 2017, or 2019, Ti takes the corresponding year. For counties that never enter the pilot during the sample period, Ti = 0. In the spatial spillover analysis, i denotes a non-pilot county exposed to a neighboring pilot, while j denotes another county spatially connected to county i. Thus, Ti = 0 indicates that county i never enters the pilot, while Tj > 0 indicates that the connected county j enters the pilot. Let denote an element of spatial weight matrix m. When , counties i and j are spatially connected under matrix m. When , no such connection exists. For county i, which never enters the pilot, the first year of exposure to a neighboring pilot is defined as follows.
Let denote the potential carbon emissions of county i in year t when it is first exposed to a neighboring pilot in year h. Let denote its potential carbon emissions when it remains unexposed to neighboring pilots throughout the sample period. For counties first exposed in year h, the group-time average spatial spillover effect in year t is defined as follows.
The ATTSP,m(h, t) measures the average change in carbon emissions in year t for counties first exposed to a neighboring pilot in year h, relative to counties that remain unexposed throughout the sample period. A negative and statistically significant estimate indicates that the NP pilot policy reduces carbon emissions in surrounding non-pilot counties. This represents a negative spatial spillover effect and indicates coordinated carbon reduction across counties. The spatial spillover effects are estimated using the same CSDID framework and DRIMP, as in the baseline analysis. This study reports the Overall ATT, the CAverage, the GAverage, and dynamic spatial spillover effects.
This study uses a Rook contiguity matrix and a K4 nearest-neighbor matrix to represent spatial connections between counties. The Rook matrix defines a spatial connection according to whether two counties share a section of their administrative boundaries. Let Lij denote the length of the common boundary between counties i and j. Two counties are considered Rook-contiguous if they share a boundary longer than zero. Counties that touch only at a single point are not considered contiguous [55].
Because some counties may not share a boundary with any other county in the sample, this study also constructs a K4 nearest-neighbor matrix [56]. The matrix is based on the great-circle distances between county areal centroids. Let N4(i) denote the set of the four counties nearest to county i.
The K4 relationship is symmetrized using the union rule. Counties i and j are considered spatially connected if county j is among the four nearest neighbors of county i, or county i is among the four nearest neighbors of county j. To exclude K4 relationships between geographically distant counties, a distance limit of 150 km is also applied. Let dij denote the great-circle distance between the areal centroids of counties i and j, measured in kilometers.
5.2. Spatial Spillover Effect Analysis
Table 8 reports the estimates under different definitions of spatial connections. The overall average spatial spillover effects under the Rook and K4 matrices are −0.0581 and −0.0453, respectively. Both estimates are significant at the 1% level. Under the K4 matrix with the 150 km limit, the estimate is −0.0416 and is significant at the 5% level. These results indicate that the NP pilot policy reduces carbon emissions not only in pilot counties but also in spatially connected non-pilot counties. The policy therefore generates cross-county carbon-reduction spillover effects under the spatial definitions and identification conditions used in this study. One possible explanation is that the effects of ecological conservation, industrial entry restrictions, pollution control, and changes in energy use are not confined to the administrative boundaries of pilot counties. They may extend to surrounding counties through shared ecosystems, cross-regional environmental governance, industrial linkages, and the movement of production factors.
Table 8.
Spatial Spillover Effects of the NP Pilot Policy on County-Level Carbon Emissions.
Table 8 also reports the joint tests of trends before exposure to neighboring pilots. The p-values under the Rook, K4, and K4 with the 150 km limit specifications are 0.1835, 0.1523, and 0.2237, respectively. All are above 10%. Therefore, the null hypothesis that all treatment effects before neighboring-policy exposure are jointly equal to zero cannot be rejected. No significant differences in pre-exposure trends are found between exposed and never-exposed counties. The dynamic effects in Figure 8a, Figure 9a and Figure 10a provide further support for the identification of spatial spillover effects. Under all three spatial specifications, the pre-exposure estimates generally fluctuate around zero, and their confidence intervals include zero.
Figure 8.
Dynamic Spatial Spillover Effects and Placebo Test under the Rook Matrix.
Figure 9.
Dynamic Spatial Spillover Effects and Placebo Test under the K4 Matrix.
Figure 10.
Dynamic Spatial Spillover Effects and Placebo Test under the K4 Matrix within a 150 km Distance Limit.
Figure 8b, Figure 9b and Figure 10b present the corresponding randomized placebo tests. Under all three spatial weight matrices, the placebo estimates are concentrated around zero, whereas the actual estimates of −0.0581, −0.0453, and −0.0416 are located in the left tails of their respective placebo distributions. Most placebo estimates do not reach conventional levels of statistical significance. These results indicate that randomly assigned neighboring-policy exposure is unlikely to generate spatial spillover effects comparable to those observed in the actual sample, providing further support for the robustness of the spatial spillover findings.
6. Discussion
The findings show that the NP pilot policy is significantly associated with lower carbon emissions in pilot counties. This effect becomes more pronounced after the policy has been in place for some time. These findings provide new empirical evidence for understanding the climate benefits of nature conservation institutions. Existing studies of protected areas have mainly focused on socioeconomic effects, including tourism development, residents’ livelihoods, and local economic activities [23,57]. Their effects on carbon emissions have received relatively limited attention. This study extends research on the effects of the NP pilot policy by considering its institutional characteristics. The NP system emphasizes ecological conservation and restricts intensive development and resource use. The results show that NP pilots primarily aimed at ecological conservation may also reduce emissions by changing resource-use patterns and economic activities.
Regarding the potential mechanisms, the results show that the NP pilot policy promotes industrial structure upgrading and reduces energy consumption. These findings are consistent with the possibility that both factors contribute to the policy’s carbon-reduction effect. Further analysis finds statistically significant carbon-reduction effects in counties with higher levels of economic development and those located in key cities for environmental protection. This indicates that the transformation of nature conservation constraints into low-carbon development outcomes may depend on both local economic conditions and existing environmental governance. Stronger economic foundations can support the development of alternative industries and investment in energy conservation. More developed environmental supervision and interdepartmental coordination can improve policy implementation. These findings provide empirical evidence for understanding the relationship between nature conservation policies and regional low-carbon development. Although the NP system primarily aims to protect ecosystems and biodiversity, ecological conservation requirements may be linked to industrial restructuring and changes in energy use under specific institutional and economic conditions. These links can generate synergies between ecological conservation and carbon reduction.
This study also extends the analysis from pilot counties to neighboring areas. Whether conservation policies cause constrained activities to move elsewhere is important when evaluating their overall environmental benefits. Factor mobility, market linkages, and learning may strengthen or weaken the regional benefits of conservation policies. Moreover, deforestation leakage around national parks may vary with transport conditions and tourism opportunities [58,59]. Under several definitions of spatial connections, this study finds reductions in carbon emissions in neighboring counties. This suggests that the emission-reduction benefits of NP pilots may extend beyond the areas directly covered by the policy. Evaluations of the NP pilot policy should therefore consider the responses of surrounding areas and strengthen coordination between conservation management and regional development. However, the current analysis cannot determine whether effects in the same direction exist across different distance ranges. Future research should use data on industrial linkages, transport flows, energy consumption, and cross-regional governance to examine the spatial transmission of the policy more directly.
This study has several limitations. First, because of data constraints, the mechanism analysis focuses mainly on industrial structure upgrading and energy consumption. It therefore does not cover all possible channels through which the NP pilot policy may affect county-level carbon emissions. Other potential channels include stronger ecosystem carbon sinks, green technological innovation, changes in the energy mix, ecological compensation, fiscal transfers, and behavioral changes among residents and enterprises. Future research could combine enterprise, household, fiscal, and ecological monitoring data to identify these mechanisms more systematically. It could also distinguish between reductions in carbon emissions and increases in ecosystem carbon sinks.
Second, the cohort-specific results indicate that the overall carbon-reduction effect is driven mainly by the 2016 treatment cohort. The estimates for the 2017 and 2019 cohorts are not statistically significant, and their confidence intervals are relatively wide. In particular, the 2019 cohort contains only nine treated counties and has a shorter post-treatment observation period. These features limit the precision of the cohort-specific estimates and do not necessarily imply the absence of policy effects in the later cohorts. Therefore, the Overall ATT should not be interpreted as an equally strong effect across all treatment cohorts. Future research using longer follow-up periods and evidence from subsequent NP implementation cohorts is needed to determine whether comparable effects emerge for later adopters.
Third, the findings are mainly based on the institutional context of China’s NP pilots, and their external applicability requires further examination. China’s NP system features strong territorial spatial governance and government coordination. Other countries and regions differ in their protected area institutions, land tenure arrangements, community participation mechanisms, and local governance models. The findings on the relationship between national parks and regional carbon reduction therefore remain context-dependent. Future studies could compare policy effects across different types of national parks, regions, and nature conservation institutions. Such comparisons could further assess the generalizability of the findings from the joint perspectives of land governance, ecological conservation, and regional sustainable development.
Finally, the spatial analysis identifies spatial connections mainly through geographical contiguity and distance. It cannot fully capture the actual regional connections created by industrial chains, transport networks, and population movements. Future research could combine enterprise, energy, transport, and ecological monitoring data to identify the effects of different policy instruments. It could also examine the overall effects of NP development on regional economies and residents’ welfare in greater detail.
7. Conclusions and Implications
7.1. Research Conclusions
This study treats China’s NP pilot policy as a quasi-natural experiment. Using panel data for 2749 Chinese counties from 2014 to 2024, it applies CSDID to examine the policy’s effect on county-level carbon emissions and its underlying mechanisms. The findings are as follows. First, the NP pilot policy significantly reduces county-level carbon emissions. Second, the mechanism analysis suggests that the policy may reduce carbon emissions through industrial structure upgrading and lower energy consumption. Third, the heterogeneity analysis shows that the NP pilot policy has statistically significant carbon-reduction effects in counties with higher levels of economic development and those located in key cities for environmental protection. Fourth, further analysis shows that the policy reduces carbon emissions not only in pilot counties but also in surrounding areas.
7.2. Policy Implications
First, China’s NP system and territorial spatial governance should be continuously improved to fully realize the climate co-benefits of ecological conservation. While maintaining ecological conservation as the primary objective, China’s NP system can incorporate carbon emissions and energy use as complementary monitoring indicators. It should also be coordinated with carbon-reduction targets, territorial spatial planning, and regional green development policies. Land-use changes, regional carbon emissions, and energy consumption can be incorporated into a comprehensive monitoring system for NP planning, development, and performance evaluation. This would enable systematic assessments of both ecological conservation and climate effects. Long-term fiscal support and ecological conservation compensation mechanisms should also be improved. These measures can provide stable support for ecological restoration, community development, energy infrastructure upgrades, and green infrastructure construction. National Park governance can thereby better coordinate ecological conservation with low-carbon development.
Second, green transition policies for areas surrounding national parks should be improved from the perspectives of industrial structure and energy consumption. Industrial development should reflect the resource endowments and ecological carrying capacity of NP areas. Environmentally friendly industries, including ecotourism, nature education, ecological agriculture, and ecological products, should be developed. Capital, technology, and labor should be guided toward less resource-intensive sectors. This can gradually reduce local dependence on traditional resource extraction and high-emission industries. Regarding energy use, energy waste by enterprises and residents can be reduced through equipment upgrades, energy-saving technologies, community energy infrastructure improvements, and better energy management. Household energy conditions in national parks and surrounding communities should also be improved. Enterprises and residents affected by conservation requirements should receive vocational training, employment support, and appropriate compensation to reduce the costs of the green transition.
Third, cross-regional coordination mechanisms for ecological conservation and carbon reduction should be established to strengthen the positive spatial spillover effects of the NP pilot policy. Planning coordination, information sharing, and joint supervision should be strengthened between NP management agencies and surrounding local governments. For national parks spanning multiple administrative areas, joint monitoring, coordinated ecological compensation, and green-industry cooperation mechanisms should be developed. Attention should also be paid to the potential relocation of high-emission activities to surrounding areas. Coordinating environmental access standards and strengthening cross-regional supervision can help consolidate the regional carbon-reduction effects of NP development.
Author Contributions
Conceptualization, Y.Z. (Yuyao Zhao) and Y.Z. (Yating Zeng); methodology, Y.Z. (Yuyao Zhao) and Y.Z. (Yating Zeng); software, Y.Z. (Yuyao Zhao); validation, Y.Z. (Yuyao Zhao) and Y.Z. (Yating Zeng); formal analysis, Y.Z. (Yuyao Zhao); investigation, Y.Z. (Yuyao Zhao); resources, Y.Z. (Yating Zeng); data curation, Y.Z. (Yuyao Zhao); writing—original draft preparation, Y.Z. (Yuyao Zhao); writing—review and editing, Y.Z. (Yuyao Zhao) and Y.Z. (Yating Zeng); visualization, Y.Z. (Yating Zeng); supervision, Y.Z. (Yating Zeng); project administration, Y.Z. (Yating Zeng). All authors have read and agreed to the published version of the manuscript.
Funding
This research was funded by Beijing University of Chemical Technology through the following two projects. Beijing University of Chemical Technology 2024 Graduate Education and Teaching Reform Project (G-PT-202425); Beijing University of Chemical Technology 2024 Graduate Course Ideological and Political Education Construction Project (MBA551).
Data Availability Statement
The CO2 emissions data used in this study are publicly available from the EDGAR. County-level socioeconomic control variables were primarily obtained from the China County Statistical Yearbook and the China Regional Economy Statistical Yearbook. Missing observations were supplemented using statistical yearbooks of the respective counties, county-level cities, and districts, statistical bulletins on national economic and social development, and county-level statistics reported in provincial and municipal statistical yearbooks. Access to the underlying data is subject to the terms and conditions of the respective data providers.
Conflicts of Interest
The authors declare no conflicts of interest.
References
- Wang, F.; Yang, R.; Fisher, J.D. Living in harmony with nature: From concept to an index revealing gaps in nature wellbeing and human contributions. Environ. Impact Assess. Rev. 2026, 119, 108357. [Google Scholar] [CrossRef] [Scilit]
- Friedlingstein, P.; O’Sullivan, M.; Jones, M.W.; Andrew, R.M.; Bakker, D.C.E.; Hauck, J.; Landschützer, P.; Le Quéré, C.; Li, H.; Luijkx, I.T.; et al. Global Carbon Budget 2025. Earth Syst. Sci. Data 2026, 18, 3211–3288. [Google Scholar] [CrossRef] [Scilit]
- Liu, Z.; Deng, Z.; He, G.; Wang, H.; Zhang, X.; Lin, J.; Qi, Y.; Liang, X. Challenges and opportunities for carbon neutrality in China. Nat. Rev. Earth Environ. 2022, 3, 141–155. [Google Scholar] [CrossRef] [Scilit]
- Guan, D.; Meng, J.; Reiner, D.M.; Zhang, N.; Shan, Y.; Mi, Z.; Shao, S.; Liu, Z.; Zhang, Q.; Davis, S.J. Structural decline in China’s CO2 emissions through transitions in industry and energy systems. Nat. Geosci. 2018, 11, 551–555. [Google Scholar] [CrossRef] [Scilit]
- Feng, Y.; Cao, Y.; Chan, M.Y.; Ye, Z.; Zhao, Z.; Yu, L.; Liang, Y.; Carver, S.; Yang, R. Assessing ecosystem integrity in protected areas: A systematic review of methods and applications. Biol. Conserv. 2025, 305, 111057. [Google Scholar] [CrossRef] [Scilit]
- Zang, Z.; Guo, Z.; Fan, X.; Han, M.; Du, A.; Xu, W.; Ouyang, Z. Assessing the performance of the pilot national parks in China. Ecol. Indic. 2022, 145, 109699. [Google Scholar] [CrossRef] [Scilit]
- Wang, J.H.Z. National parks in China: Parks for people or for the nation? Land Use Policy 2019, 81, 825–833. [Google Scholar] [CrossRef] [Scilit]
- Zhang, X.; Luo, H.; Shu, X.; Zhang, L. The ecological and economic impacts of national park pilot projects in China. Ecol. Econ. 2026, 243, 108936. [Google Scholar] [CrossRef] [Scilit]
- Shapiro, J.S.; Walker, R. Why is pollution from US manufacturing declining? The roles of environmental regulation, productivity, and trade. Am. Econ. Rev. 2018, 108, 3814–3854. [Google Scholar] [CrossRef] [Scilit]
- Cheng, A.T.; Sims, K.R.E.; Yi, Y. Economic development and conservation impacts of China’s nature reserves. J. Environ. Econ. Manag. 2023, 121, 102848. [Google Scholar] [CrossRef] [Scilit]
- Ma, B.; Cai, Z.; Zheng, J.; Wen, Y. Conservation, ecotourism, poverty, and income inequality: A case study of nature reserves in Qinling, China. World Dev. 2019, 115, 236–244. [Google Scholar] [CrossRef] [Scilit]
- Xu, A.; Song, M.; Wu, Y.; Luo, Y.; Zhu, Y.; Qiu, K. Effects of new urbanization on China’s carbon emissions: A quasi-natural experiment based on the improved PSM-DID model. Technol. Forecast. Soc. Change 2024, 200, 123164. [Google Scholar] [CrossRef] [Scilit]
- Wang, Q.; Zhang, F.; Li, R.; Sun, J. Does artificial intelligence promote energy transition and curb carbon emissions? The role of trade openness. J. Clean. Prod. 2024, 447, 141298. [Google Scholar] [CrossRef] [Scilit]
- Sun, Y.-Y.; Faturay, F.; Lenzen, M.; Gössling, S.; Higham, J. Drivers of global tourism carbon emissions. Nat. Commun. 2024, 15, 10384. [Google Scholar] [CrossRef] [Scilit] [PubMed]
- Yin, S.; Zhou, Y.; Bai, C. Impact of Renewable Energy Technological Innovation on Urban Low-Carbon Transition: Taking the Yangtze River Economic Belt as an Example. Energy 2025, 333, 137432. [Google Scholar] [CrossRef] [Scilit]
- Yang, L.; Ma, J.; Li, Z. From high carbon to low carbon research on the driving path of energy structure transformation under uniform and differential carbon taxes. J. Clean. Prod. 2026, 571, 148808. [Google Scholar] [CrossRef] [Scilit]
- Cao, Q.; Chi, C.; Shan, J. Can artificial intelligence technology reduce carbon emissions? A global perspective. Energy Econ. 2025, 143, 108285. [Google Scholar] [CrossRef] [Scilit]
- Ma, Z.; Xiao, H.; Li, J.; Chen, H.; Chen, W. Study on how the digital economy affects urban carbon emissions. Renew. Sustain. Energy Rev. 2025, 207, 114910. [Google Scholar] [CrossRef] [Scilit]
- Peng, H.-R.; Ling, K.; Zhang, Y.-J. The carbon emission reduction effect of digital infrastructure development: Evidence from the Broadband China policy. J. Clean. Prod. 2024, 434, 140060. [Google Scholar] [CrossRef] [Scilit]
- Gater, G.; Chen, X.H.; Tee, K. The Impact of China’s Environmental Regulations on Carbon Intensity. J. Environ. Manag. 2026, 410, 130031. [Google Scholar] [CrossRef] [Scilit] [PubMed]
- Ahmad, M.; Li, X.F.; Wu, Q. Carbon taxes and emission trading systems: Which one is more effective in reducing carbon emissions?—A meta-analysis. J. Clean. Prod. 2024, 476, 143761. [Google Scholar] [CrossRef] [Scilit]
- Feng, X.; Zhao, Y.; Yan, R. Does carbon emission trading policy has emission reduction effect?—An empirical study based on quasi-natural experiment method. J. Environ. Manag. 2024, 351, 119791. [Google Scholar] [CrossRef] [Scilit] [PubMed]
- Pan, Y.; Yang, G.; Wang, H.; Chen, W.; Wei, X.; Zhou, J. Economic impacts and spatial spillovers of the national park pilot policy: Evidence from Yunnan, China. Land 2026, 15, 222. [Google Scholar] [CrossRef] [Scilit]
- Zhang, J.; Yin, N.; Li, Y.; Yu, J.; Zhao, W.; Liu, Y.; Fu, B.; Wang, S. Socioeconomic impacts of a protected area in China: An assessment from rural communities of Qianjiangyuan National Park Pilot. Land Use Policy 2020, 99, 104849. [Google Scholar] [CrossRef] [Scilit]
- Xu, M.; Ma, Z.; Gao, J.; Li, M. The impact of farmers’ participation in national park construction on household income in China: Evidence from the Qinling Area of the Giant Panda National Park. J. Environ. Manag. 2025, 386, 125743. [Google Scholar] [CrossRef] [Scilit] [PubMed]
- Tan, S.; Zhong, Y.D.; Yang, F.; Gong, X.J. The impact of Nanshan National Park concession policy on farmers’ income in China. Glob. Ecol. Conserv. 2021, 31, e01804. [Google Scholar] [CrossRef] [Scilit]
- Wang, S.; Song, S.; Shi, M.; Hu, S.; Xing, S.; Bai, H.; Xu, D. China’s national park construction contributes to carbon peaking and neutrality goals. Land 2023, 12, 1402. [Google Scholar] [CrossRef] [Scilit]
- Ma, B.; Zeng, W.; Xie, Y.; Wang, Z.; Hu, G.; Li, Q.; Cao, R.; Zhuo, Y.; Zhang, T. Boundary delineation and grading functional zoning of Sanjiangyuan National Park based on biodiversity importance evaluations. Sci. Total Environ. 2022, 825, 154068. [Google Scholar] [CrossRef] [Scilit] [PubMed]
- Adiego, A.; Gale, T.; Aladrén, L.A.L.; Báez-Montenegro, A.; Hernández-Moreno, Á. Rural property subdivision: Land use change patterns and water rights around Cerro Castillo National Park, Chilean Patagonia. Land 2025, 14, 1877. [Google Scholar] [CrossRef] [Scilit]
- Bai, Y.; Fang, Z.; Hughes, A.C.; Huang, Z.; Jiang, B.; Quan, R.; Ma, K. How to go forward and beyond: Future tasks of China’s protected areas system. J. Clean. Prod. 2024, 443, 141132. [Google Scholar] [CrossRef] [Scilit]
- Fu, Y.; Li, W.; Niu, Z.; Chen, F.; Zhang, B.; Qiao, H.; Wang, L.; Svenning, J.-C. Enhanced forest carbon gains from stronger protection in China’s protected areas. Nat. Commun. 2026, 17, 2609. [Google Scholar] [CrossRef] [Scilit] [PubMed]
- Callaway, B.; Sant’Anna, P.H.C. Difference-in-Differences with multiple time periods. J. Econom. 2021, 225, 200–230. [Google Scholar] [CrossRef] [Scilit]
- Huo, D.; Huang, X.; Dou, X.; Ciais, P.; Li, Y.; Deng, Z.; Wang, Y.; Cui, D.; Benkhelifa, F.; Sun, T.; et al. Carbon Monitor Cities near-real-time daily estimates of CO2 emissions from 1500 cities worldwide. Sci. Data 2022, 9, 533. [Google Scholar] [CrossRef] [Scilit] [PubMed]
- Gu, H.; Chen, X.; Sun, H.; Huan, C.; Wang, B. How Does Land Urbanization Affect Carbon Emissions in China? Evidence from 209 Cities and Three Heterogeneous Regions in the East of the Hu Line of China. Land 2025, 14, 910. [Google Scholar] [CrossRef] [Scilit]
- Yan, Z.; Zhou, Z.; Du, K. How does environmental regulatory stringency affect energy consumption? Evidence from Chinese firms. Energy Econ. 2023, 118, 106503. [Google Scholar] [CrossRef] [Scilit]
- General Office of the CPC Central Committee; General Office of the State Council. Overall Plan for Establishing a National Park System. 2017. Available online: https://www.forestry.gov.cn/c/www/gwywj/35639.jhtml (accessed on 20 September 2026).
- Chen, W.; Wu, F.; Geng, W.; Yu, G. Carbon Emissions in China’s Industrial Sectors. Resour. Conserv. Recycl. 2017, 117, 264–273. [Google Scholar] [CrossRef] [Scilit]
- Hou, H.; Wang, J.; Yuan, M.; Liang, S.; Liu, T.; Wang, H.; Bai, H.; Xu, H. Estimating the Mitigation Potential of the Chinese Service Sector Using Embodied Carbon Emissions Accounting. Environ. Impact Assess. Rev. 2021, 86, 106510. [Google Scholar] [CrossRef] [Scilit]
- Su, L. Environmental regulation and corporate green innovation: Evidence from the implementation of the total energy consumption target in China. J. Bus. Econ. 2025, 95, 499–526. [Google Scholar] [CrossRef] [Scilit]
- Department of Social Development, National Development and Reform Commission. Progress of the National Park System Pilot VII—Shennongjia National Park. 2021. Available online: https://www.ndrc.gov.cn/fzggw/jgsj/shs/sjdt/202104/t20210425_1277249.html (accessed on 20 September 2026).
- Xie, T.; Li, N.; Li, J. Green Electricity Empowers Sanjiangyuan and Promotes Green Transformation. Economic Information Daily, 14 August 2020. Available online: https://www.nea.gov.cn/2020-08/14/c_139306886.htm (accessed on 20 September 2026).
- Ardoin, N.M.; Bowers, A.W.; Gaillard, E. Environmental education outcomes for conservation: A systematic review. Biol. Conserv. 2020, 241, 108224. [Google Scholar] [CrossRef] [Scilit]
- Ghosh, A.; Satya Prasad, V.K. Evaluating the influence of environmental factors on household solar PV pro-environmental behavioral intentions: A meta-analysis review. Renew. Sustain. Energy Rev. 2024, 190, 114047. [Google Scholar] [CrossRef] [Scilit]
- Ma, X.; Wang, C.; Dong, B.; Gu, G.; Chen, R.; Li, Y.; Zou, H.; Zhang, W.; Li, Q. Carbon emissions from energy consumption in China: Its measurement and driving factors. Sci. Total Environ. 2019, 648, 1411–1420. [Google Scholar] [CrossRef] [Scilit] [PubMed]
- Li, J.; Wang, W.; Axmacher, J.C.; Zhang, Y.; Zhu, Y. Streamlining China’s protected areas. Science 2016, 351, 1160. [Google Scholar] [CrossRef] [Scilit] [PubMed]
- Sant’Anna, P.H.C.; Zhao, J. Doubly robust difference-in-differences estimators. J. Econom. 2020, 219, 101–122. [Google Scholar] [CrossRef] [Scilit]
- Wang, M.; Cai, B. A two-level comparison of CO2 emission data in China: Evidence from three gridded data sources. J. Clean. Prod. 2017, 148, 194–201. [Google Scholar] [CrossRef] [Scilit]
- Gao, M.; Ma, K.; Yu, J. The Characteristics and Drivers of China’s City-Level Urban–Rural Activity Sectors’ Carbon Intensity Gap during Urban Land Expansion. Energy Policy 2023, 181, 113725. [Google Scholar] [CrossRef] [Scilit]
- Oyekola, O.; Emediegwu, L.E.; Animashaun, J.O. Commodity windfalls, political regimes, and environmental quality. Energy Econ. 2024, 138, 107813. [Google Scholar] [CrossRef] [Scilit]
- Zhou, Y.; Li, P.; Sun, M.; Tan, W. Can photovoltaic poverty alleviation reduce multidimensional energy poverty? Evidence from 1928 counties in China. Energy Econ. 2026, 154, 109135. [Google Scholar] [CrossRef] [Scilit]
- Liu, J.; Zhang, J.; Ma, X.; Zhao, B.; Zhang, M. The road to sustainable development: Can the new energy demonstration city policy promote the industrial structure transformation? Renew. Energy 2024, 237, 121721. [Google Scholar] [CrossRef] [Scilit]
- Zhao, J.; Jiang, Q.; Dong, X.; Dong, K.; Jiang, H. How does industrial structure adjustment reduce CO2 emissions? Spatial and mediation effects analysis for China. Energy Econ. 2022, 105, 105704. [Google Scholar] [CrossRef] [Scilit]
- Huang, H.; Chen, Z.; Tan, C.; Liu, H. Using a three-tier structural decomposition analysis to assess industrial structure transformation and carbon emissions in China. Energy 2025, 335, 137817. [Google Scholar] [CrossRef] [Scilit]
- Lin, S.; Lin, Q.; Wang, Q.; Shi, C.; Ausloos, M. Driving green transformation through the national digital economy innovation pilot: A quasi-experimental study on reducing urban energy intensity in 282 Chinese cities. Sustainability 2025, 17, 5687. [Google Scholar] [CrossRef] [Scilit]
- Anselin, L.; Rey, S.J. Modern Spatial Econometrics in Practice: A Guide to GeoDa, GeoDaSpace and PySAL; GeoDa Press: Chicago, IL, USA, 2014. [Google Scholar]
- Anselin, L. Distance-Band Spatial Weights. GeoDa Workbook 2020. Available online: https://geodacenter.github.io/workbook/4b_dist_weights/lab4b.html (accessed on 20 September 2026).
- Ferraro, P.J.; Hanauer, M.M. Quantifying causal mechanisms to determine how protected areas affect poverty through changes in ecosystem services and infrastructure. Proc. Natl. Acad. Sci. USA 2014, 111, 4332–4337. [Google Scholar] [CrossRef] [Scilit] [PubMed]
- Pfaff, A.; Robalino, J. Spillovers from conservation programs. Annu. Rev. Resour. Econ. 2017, 9, 299–315. [Google Scholar] [CrossRef] [Scilit]
- Robalino, J.; Pfaff, A.; Villalobos, L. Heterogeneous local spillovers from protected areas in Costa Rica. J. Assoc. Environ. Resour. Econ. 2017, 4, 795–820. [Google Scholar] [CrossRef] [Scilit] [PubMed]
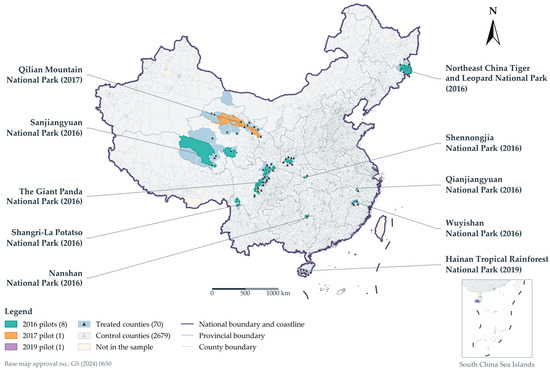
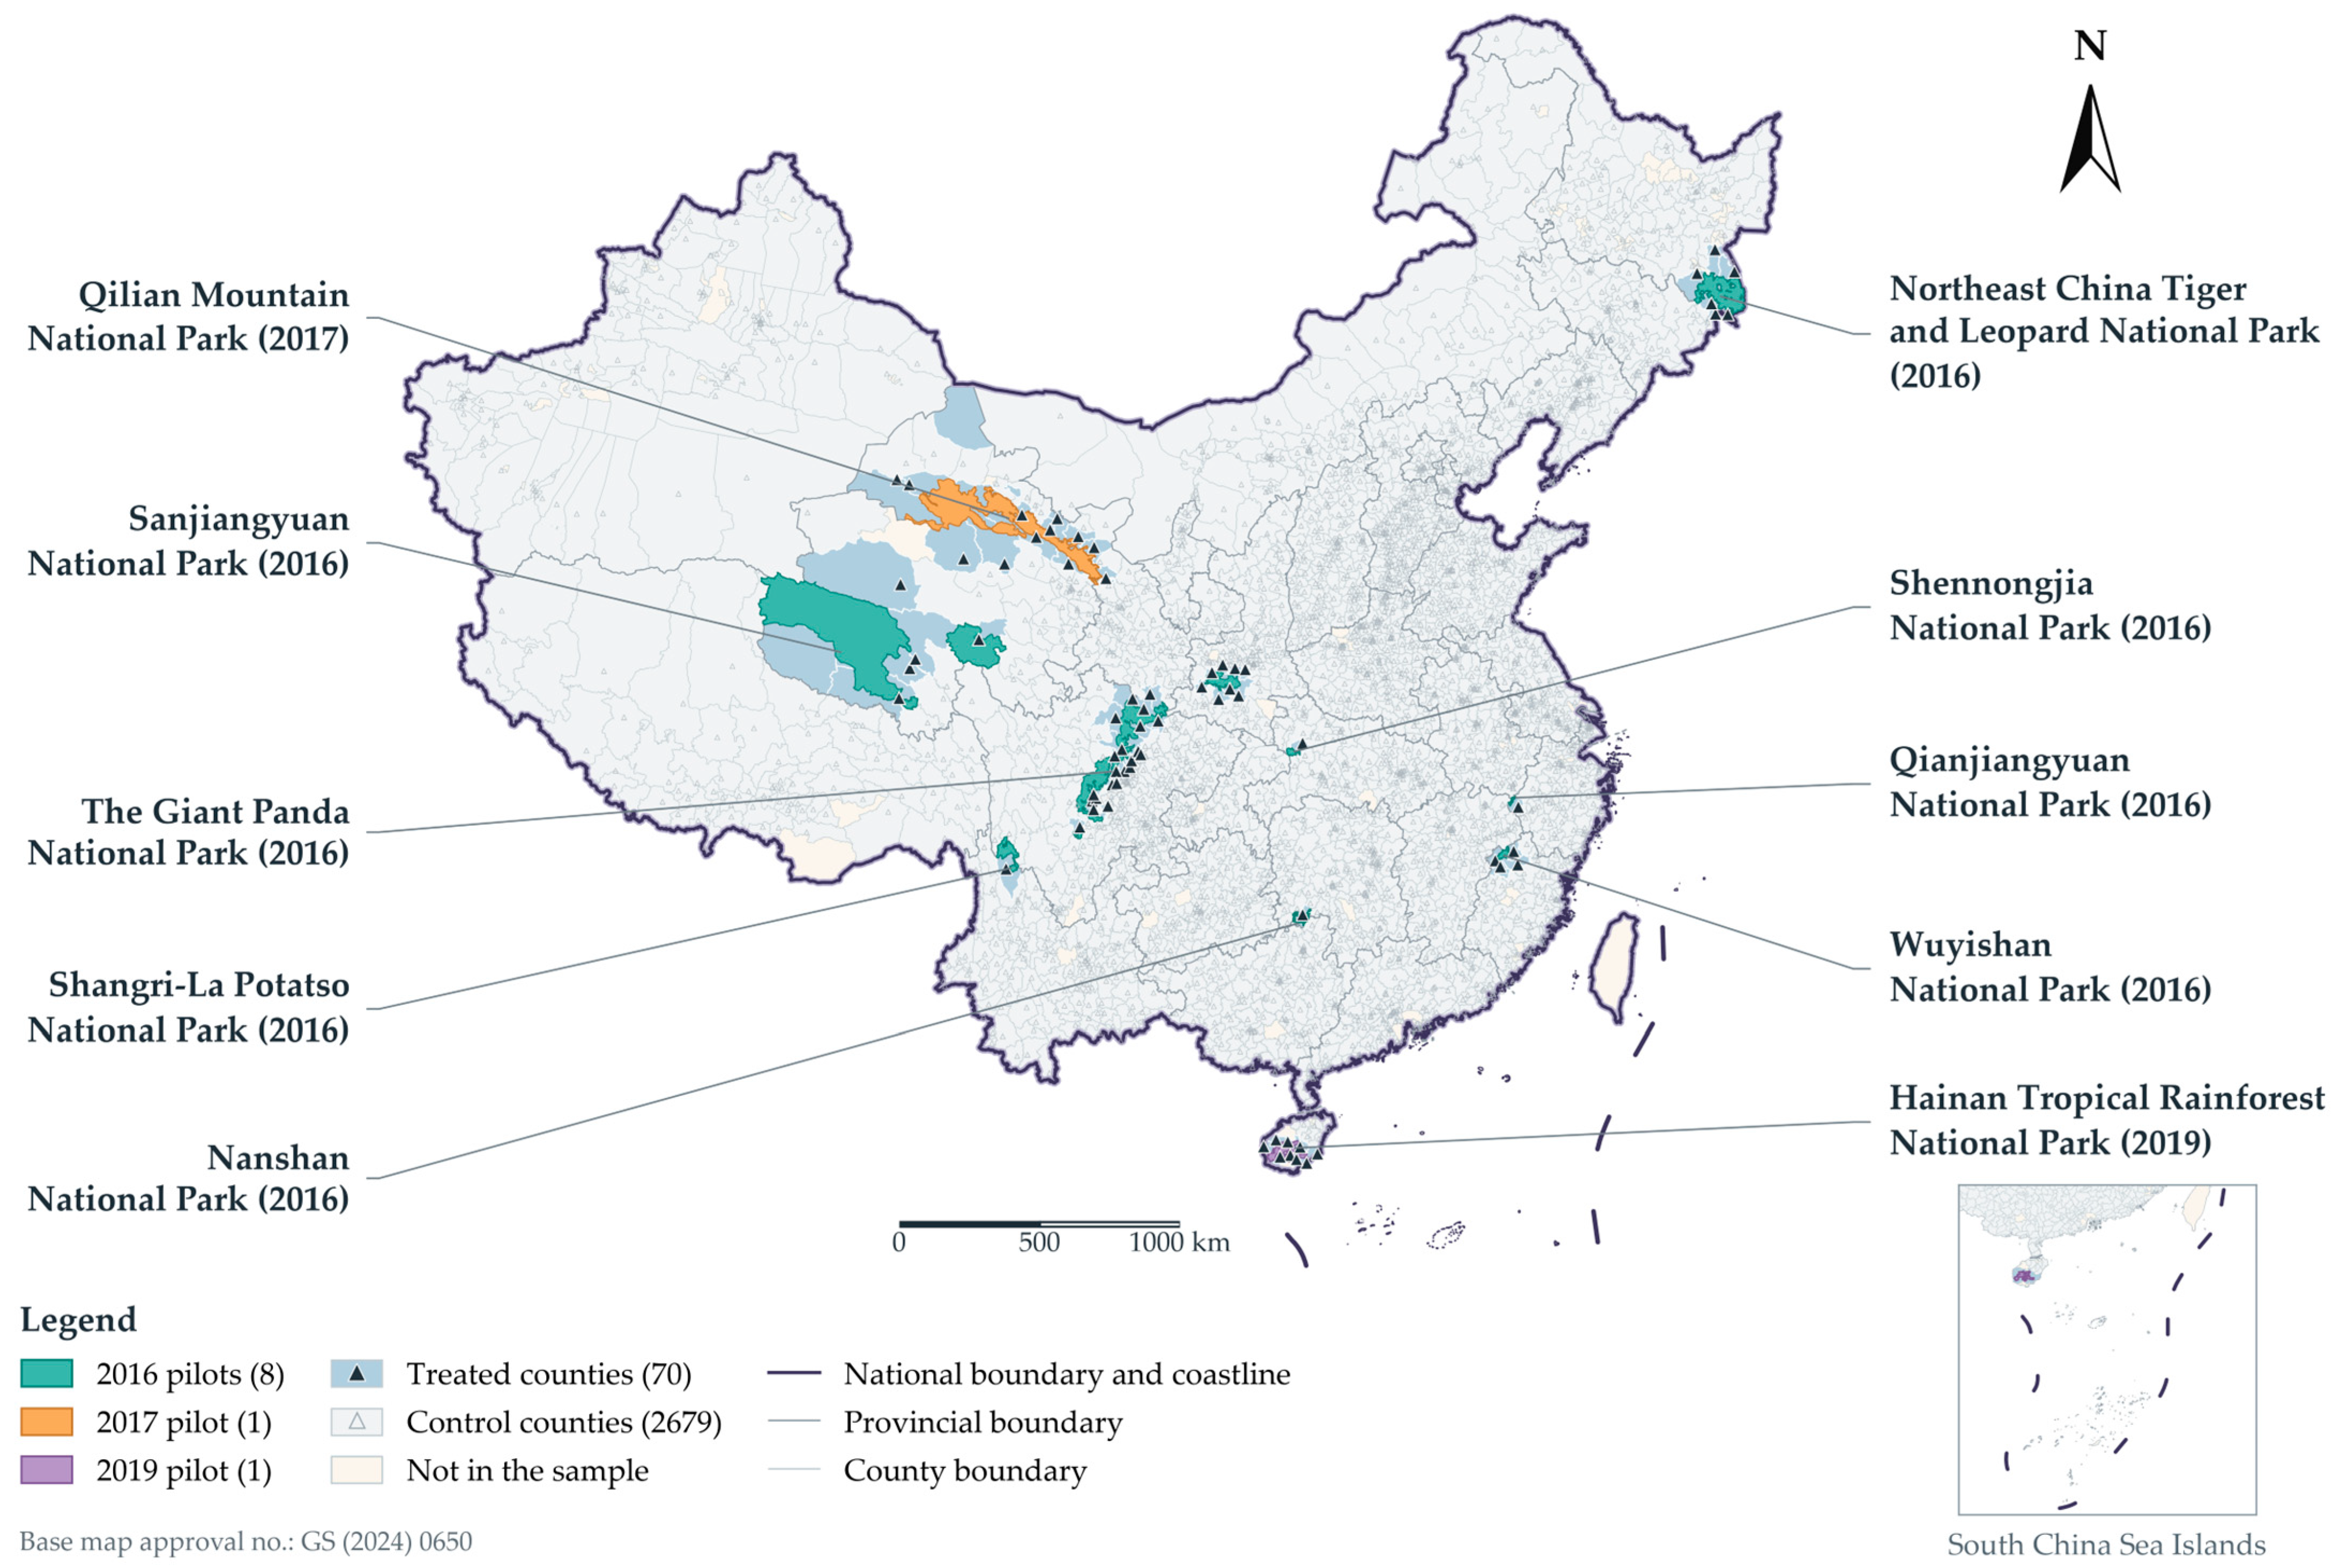
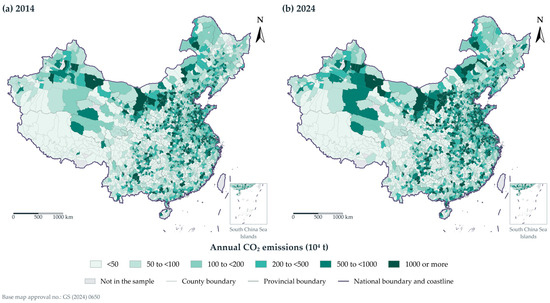
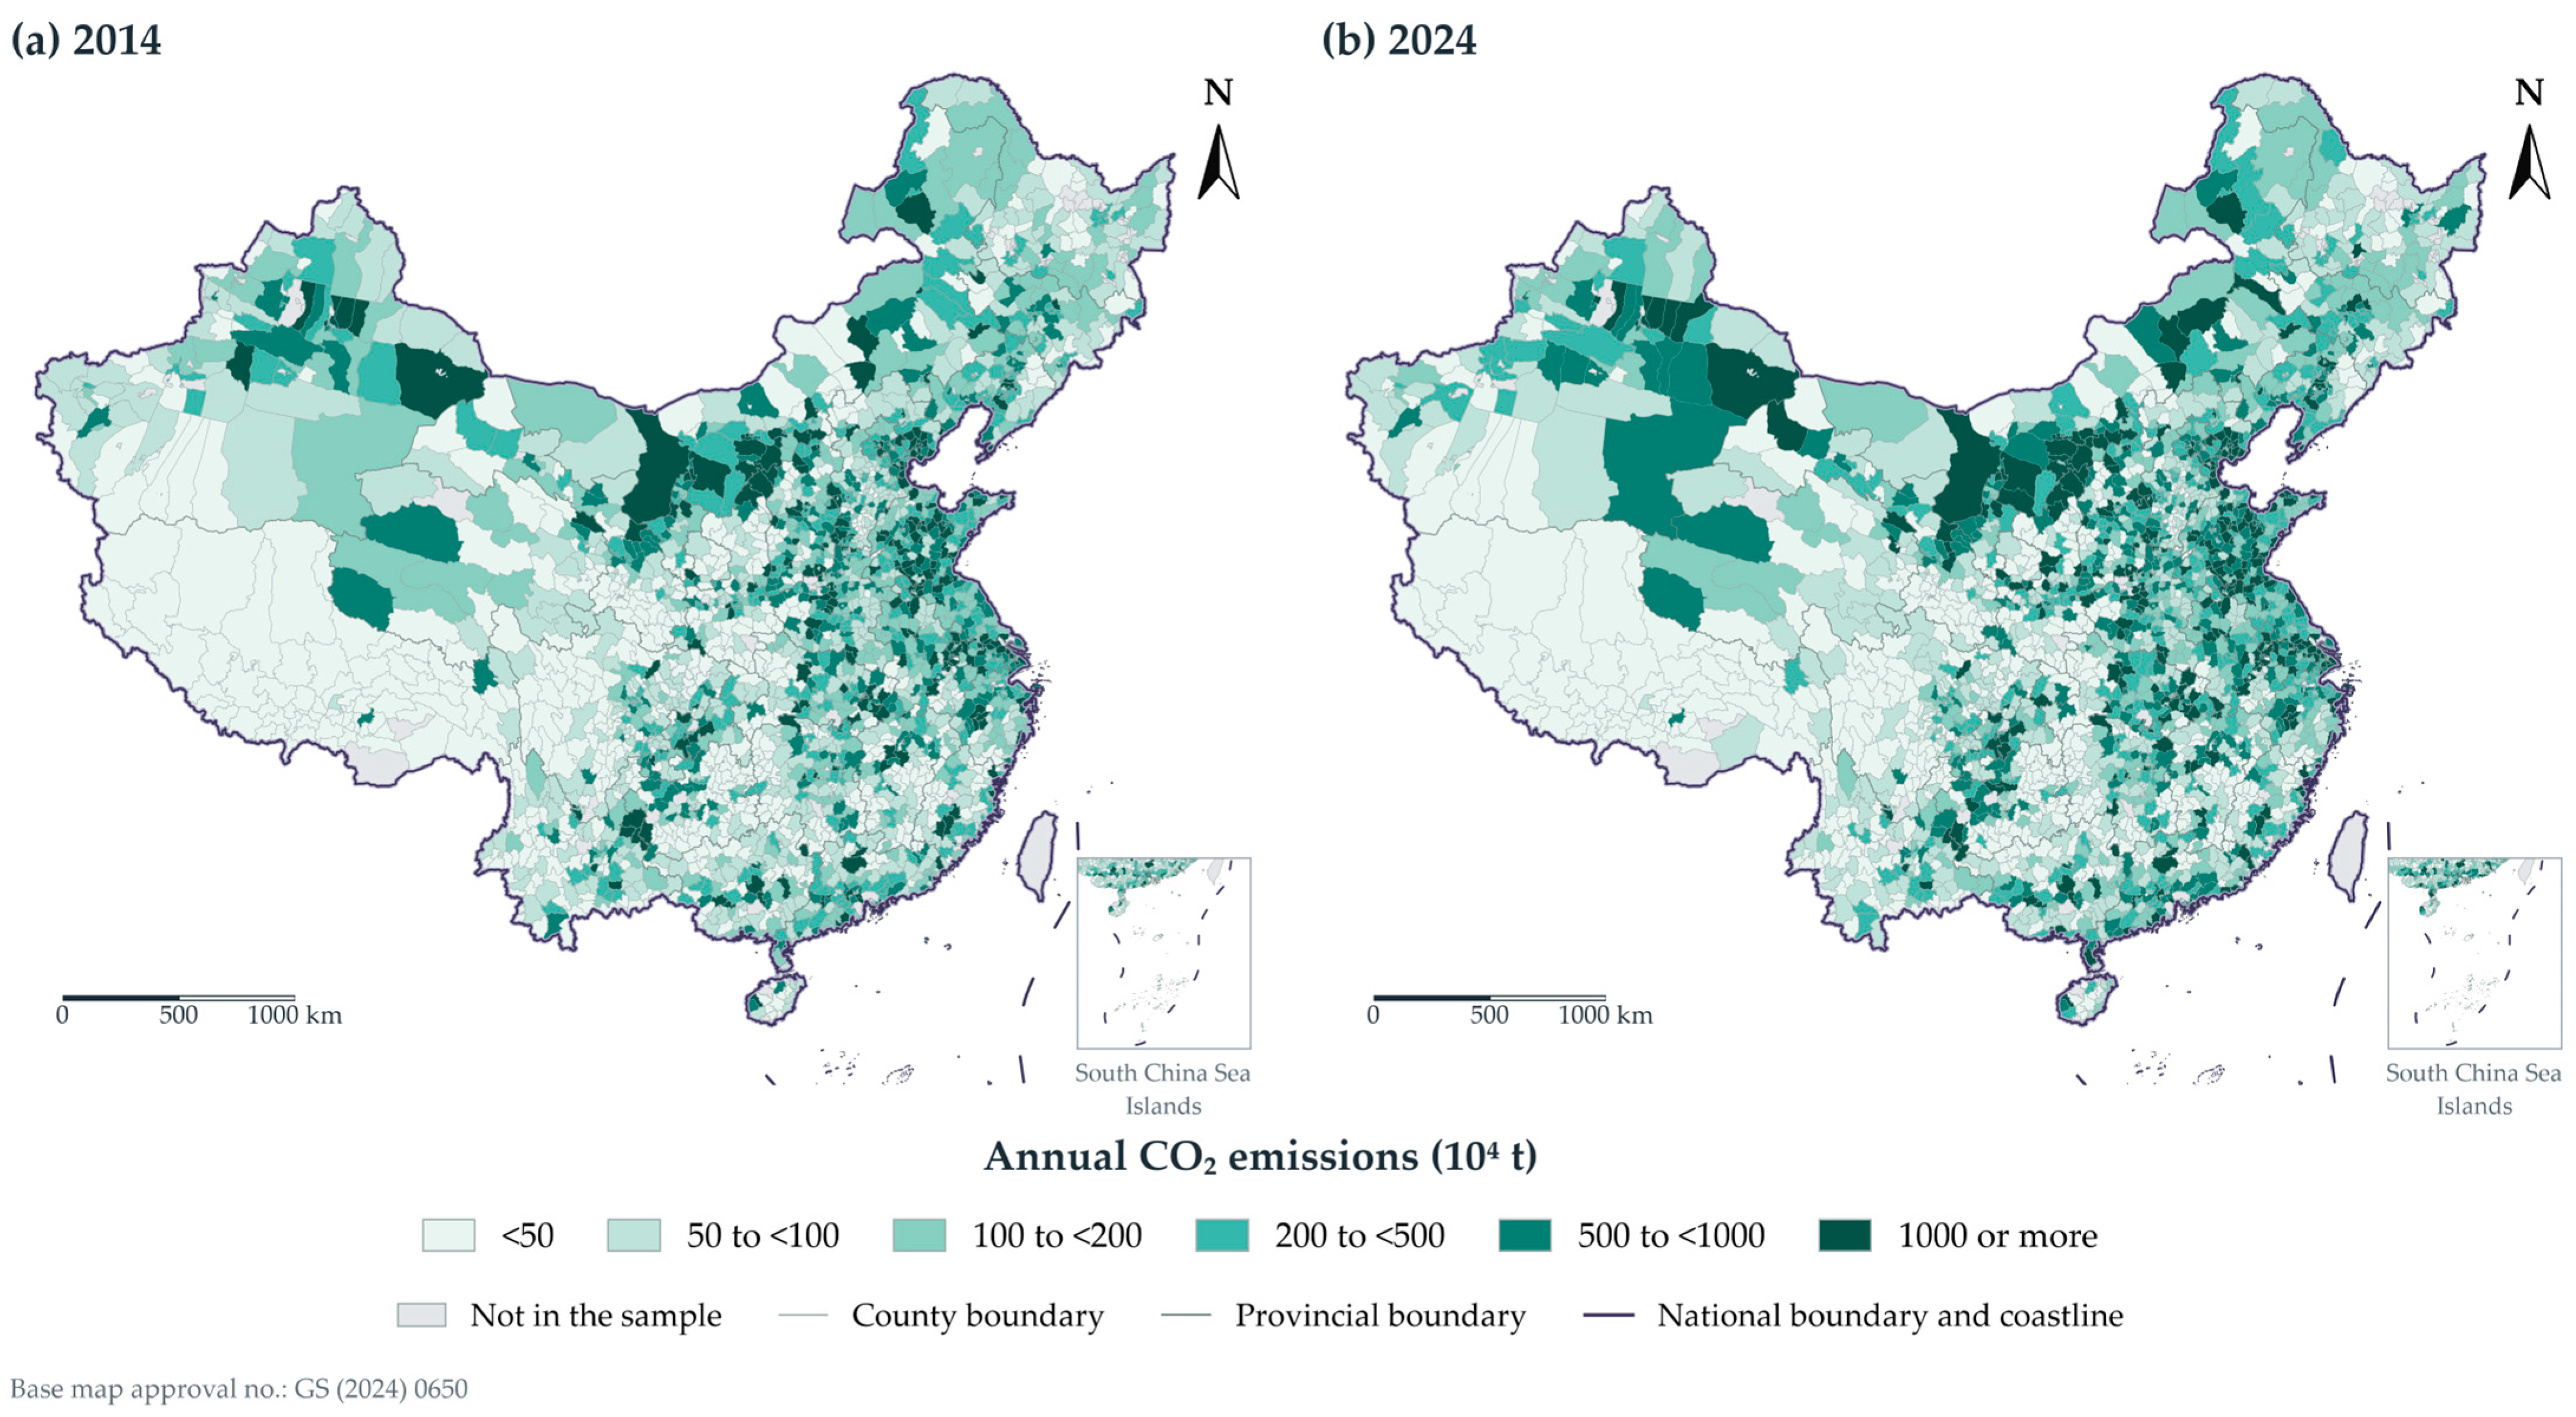
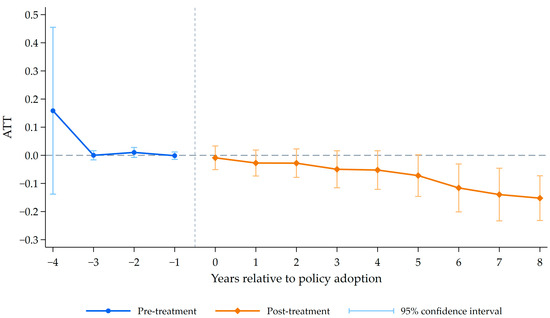
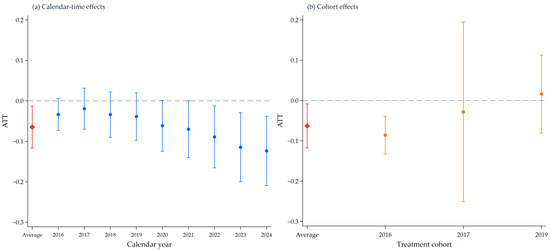
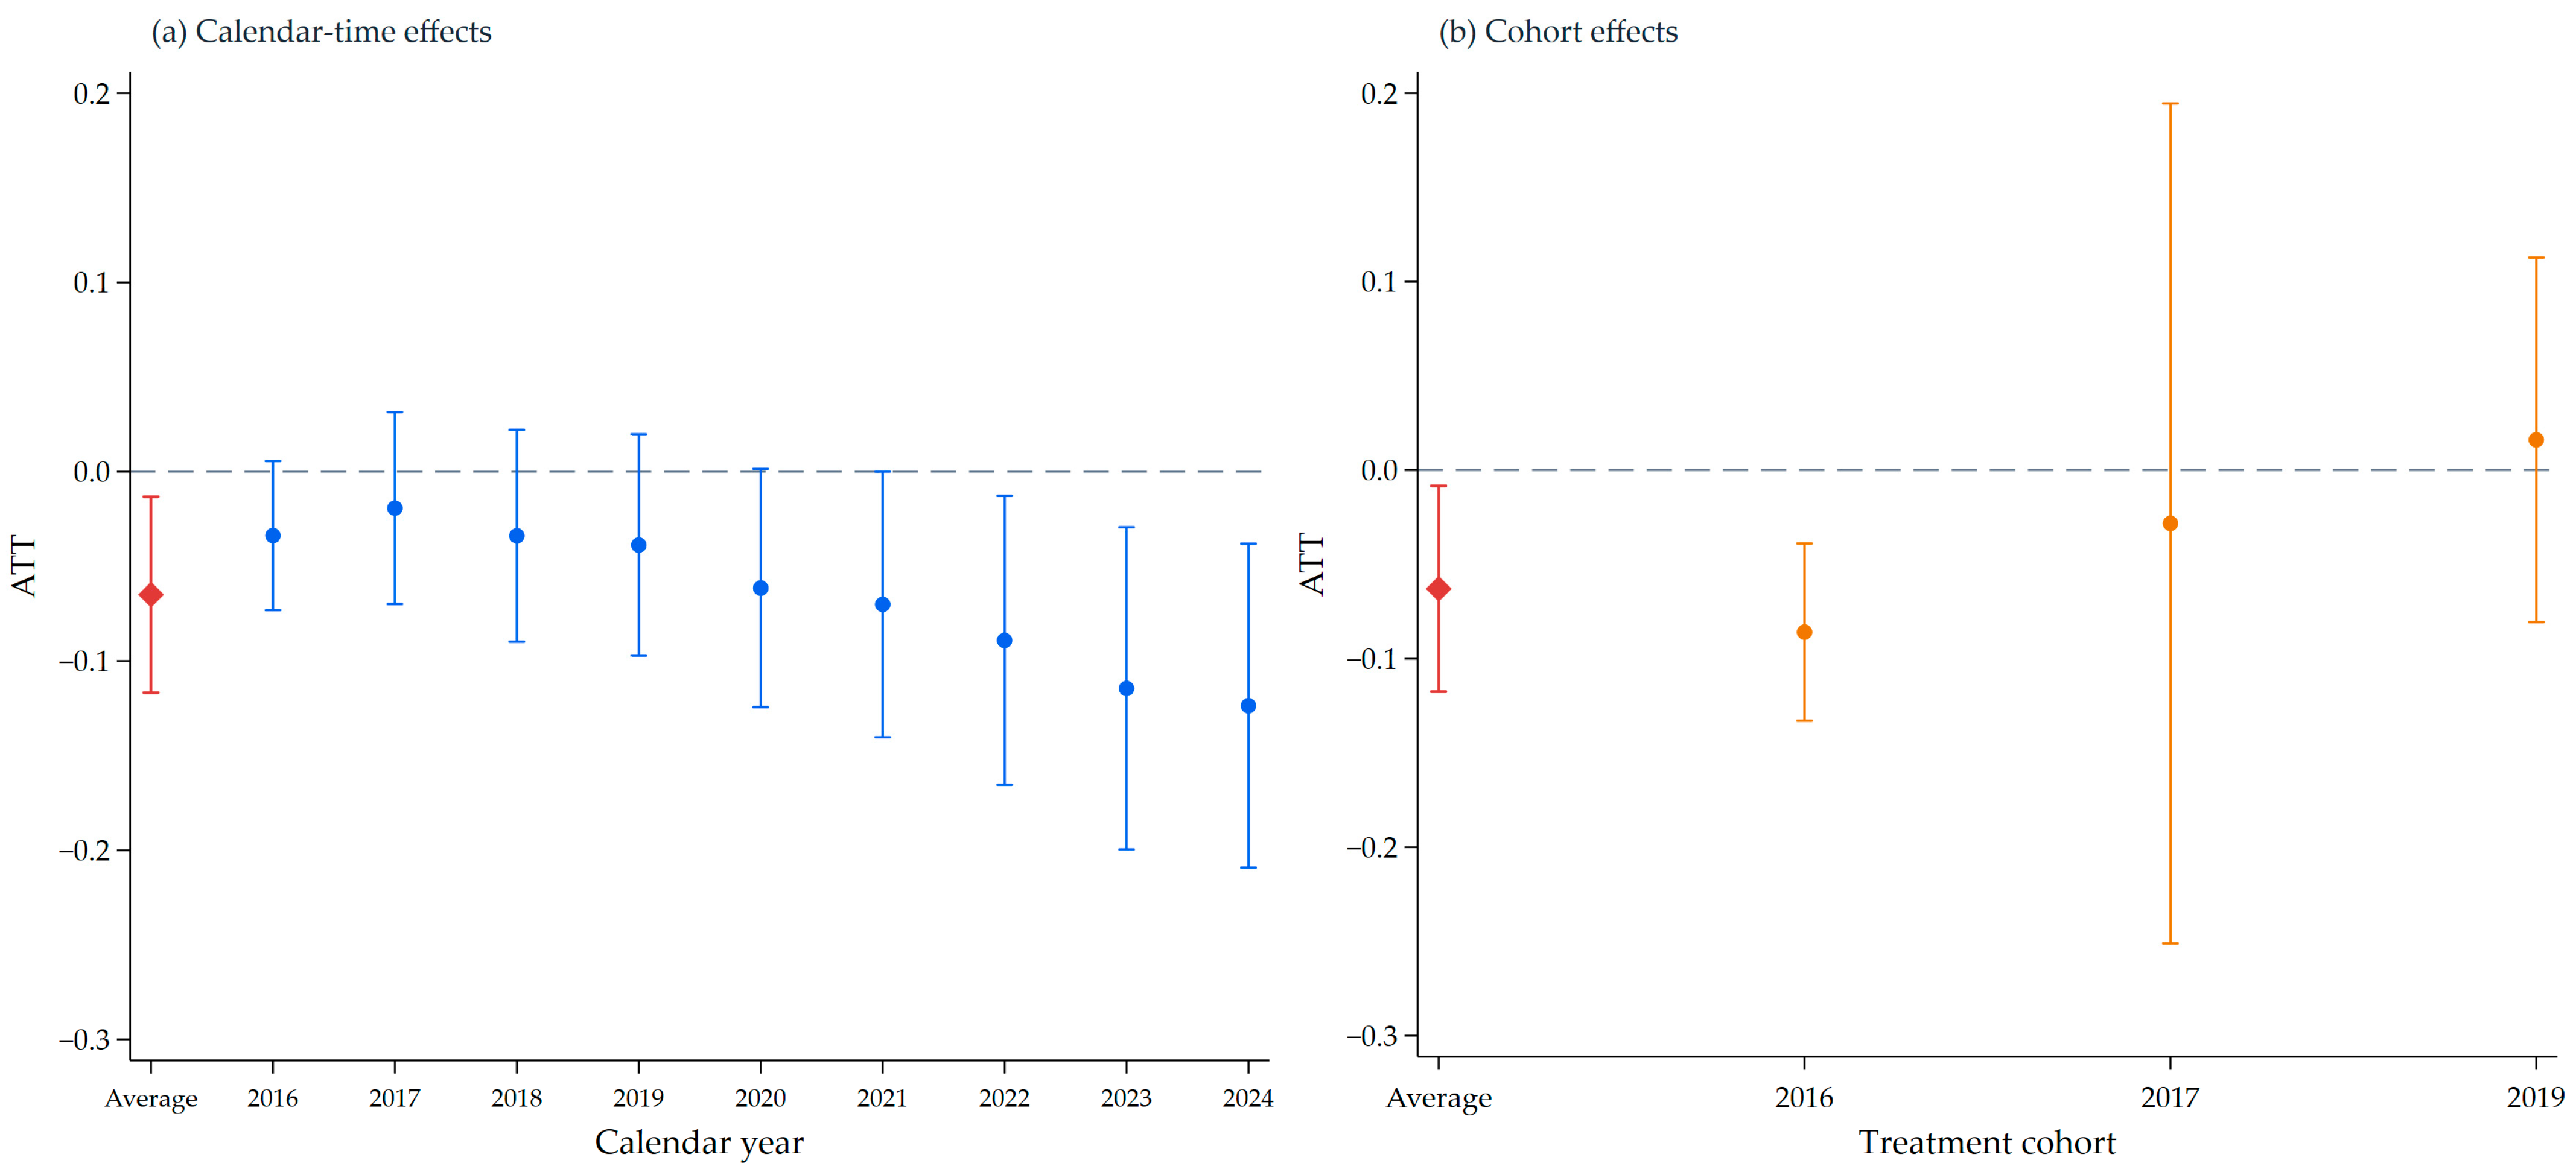
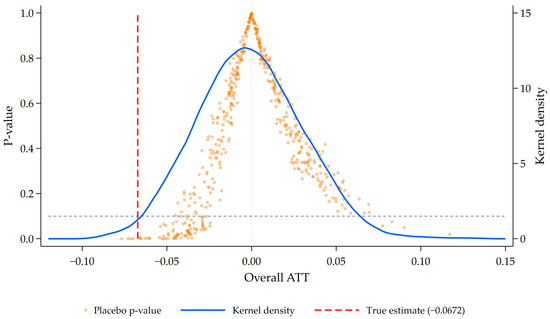
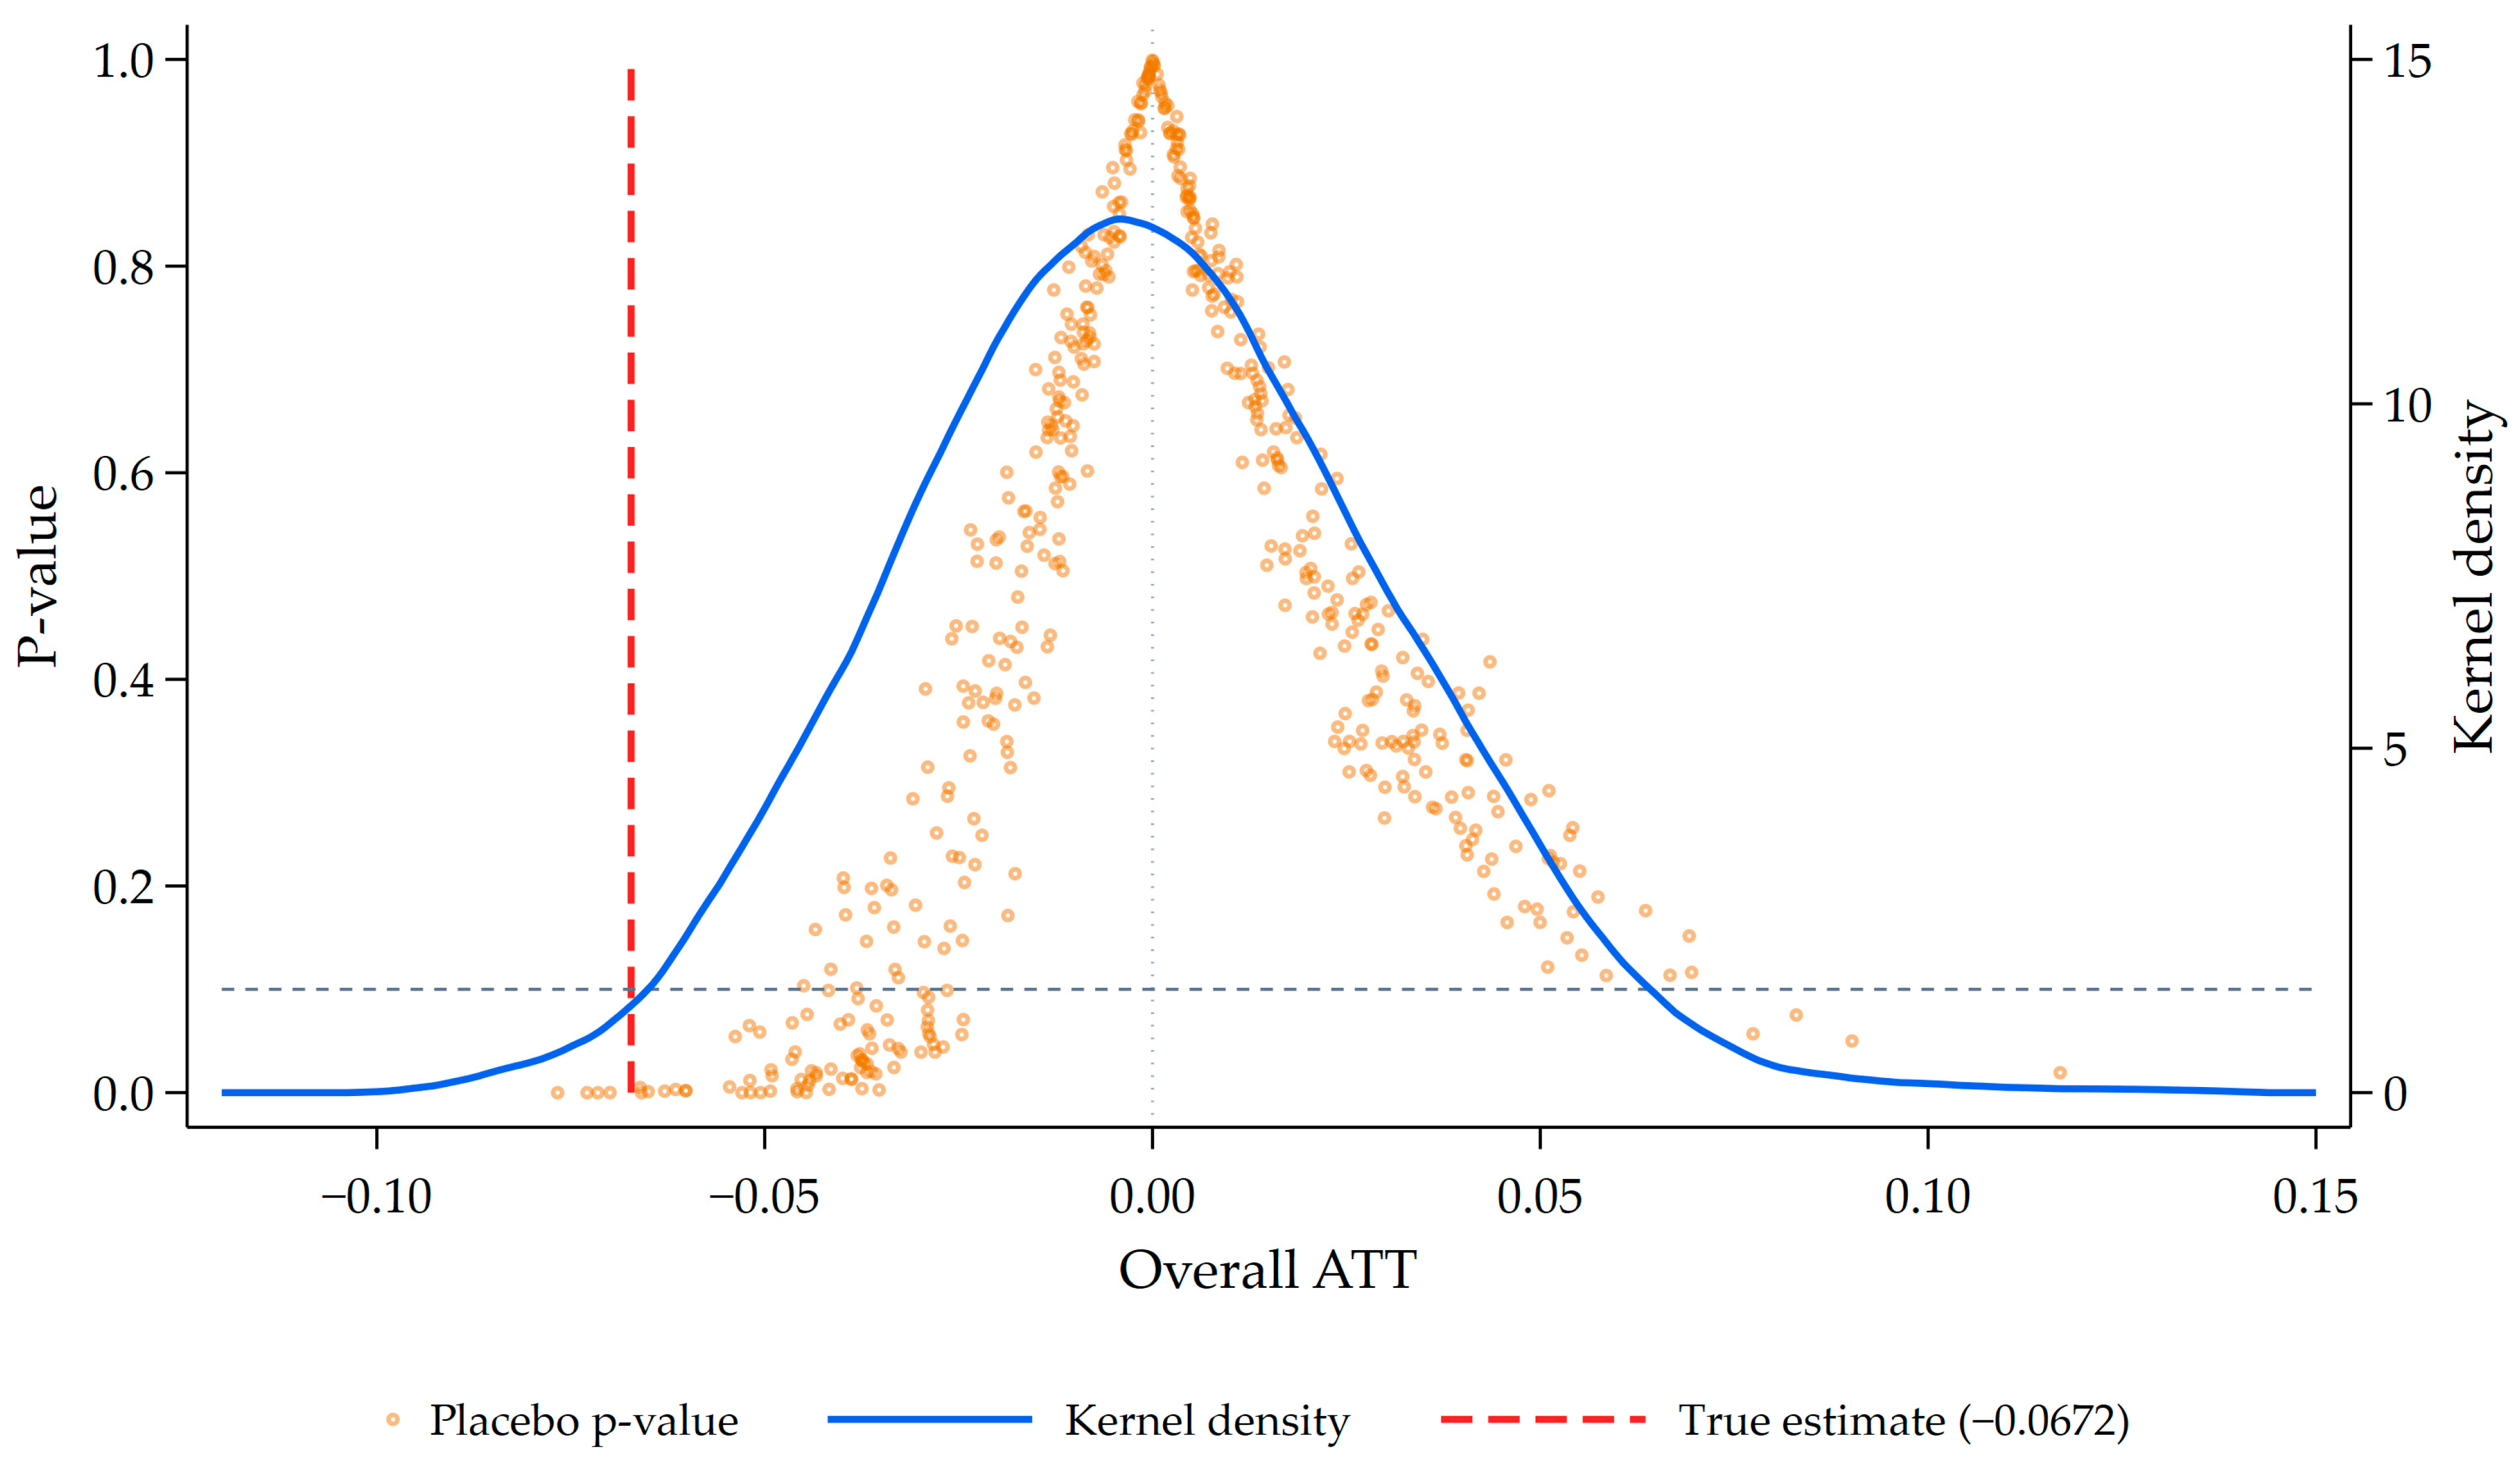
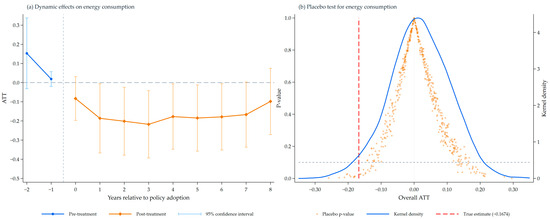
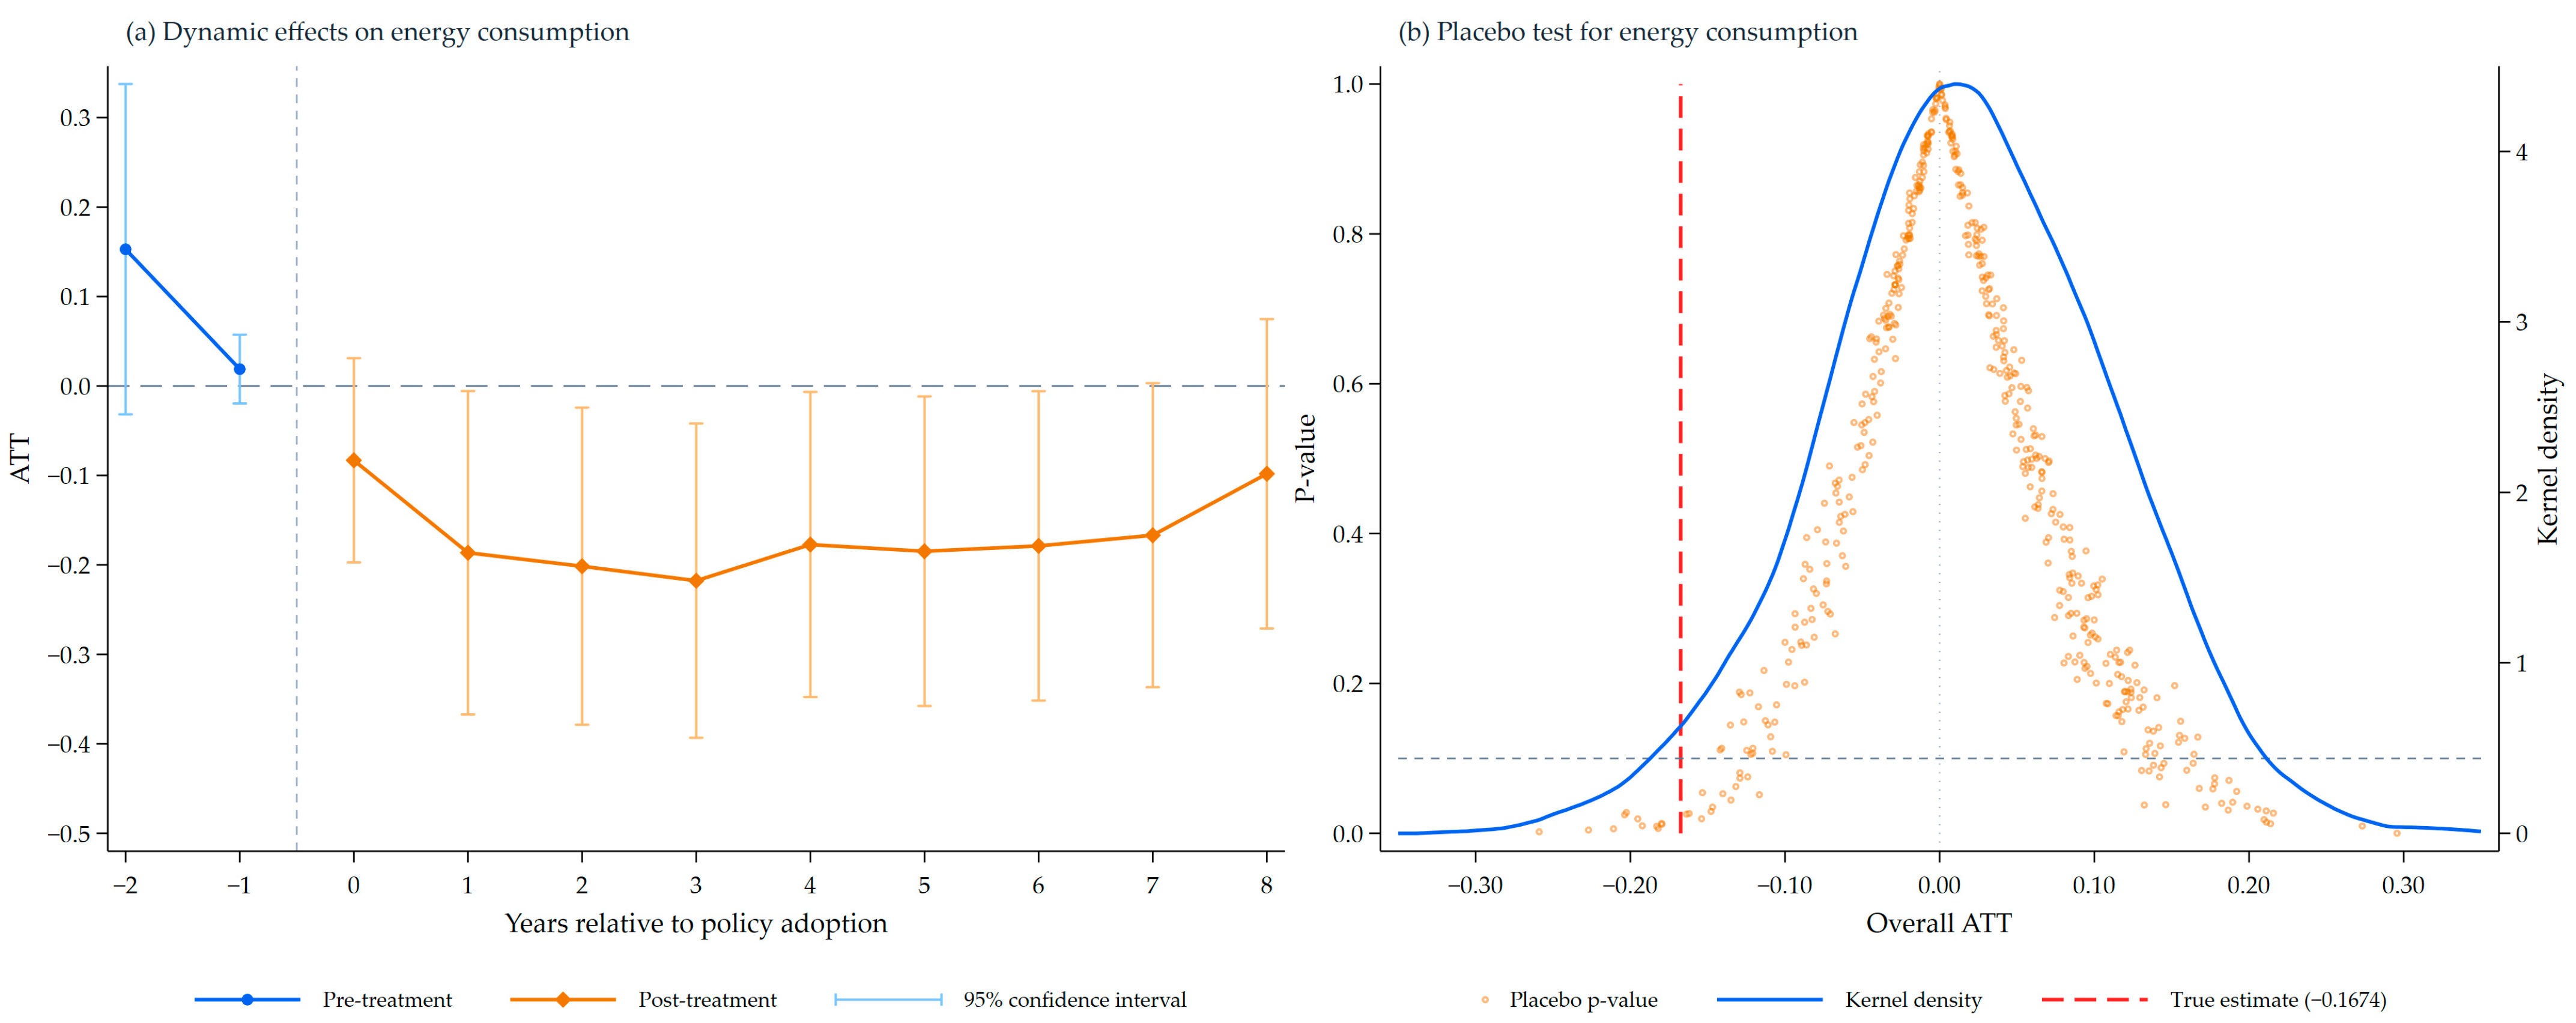
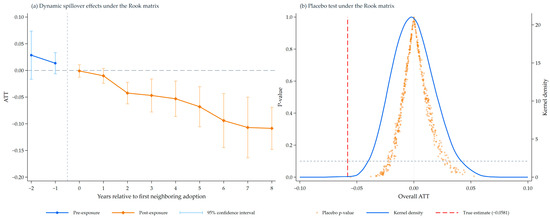
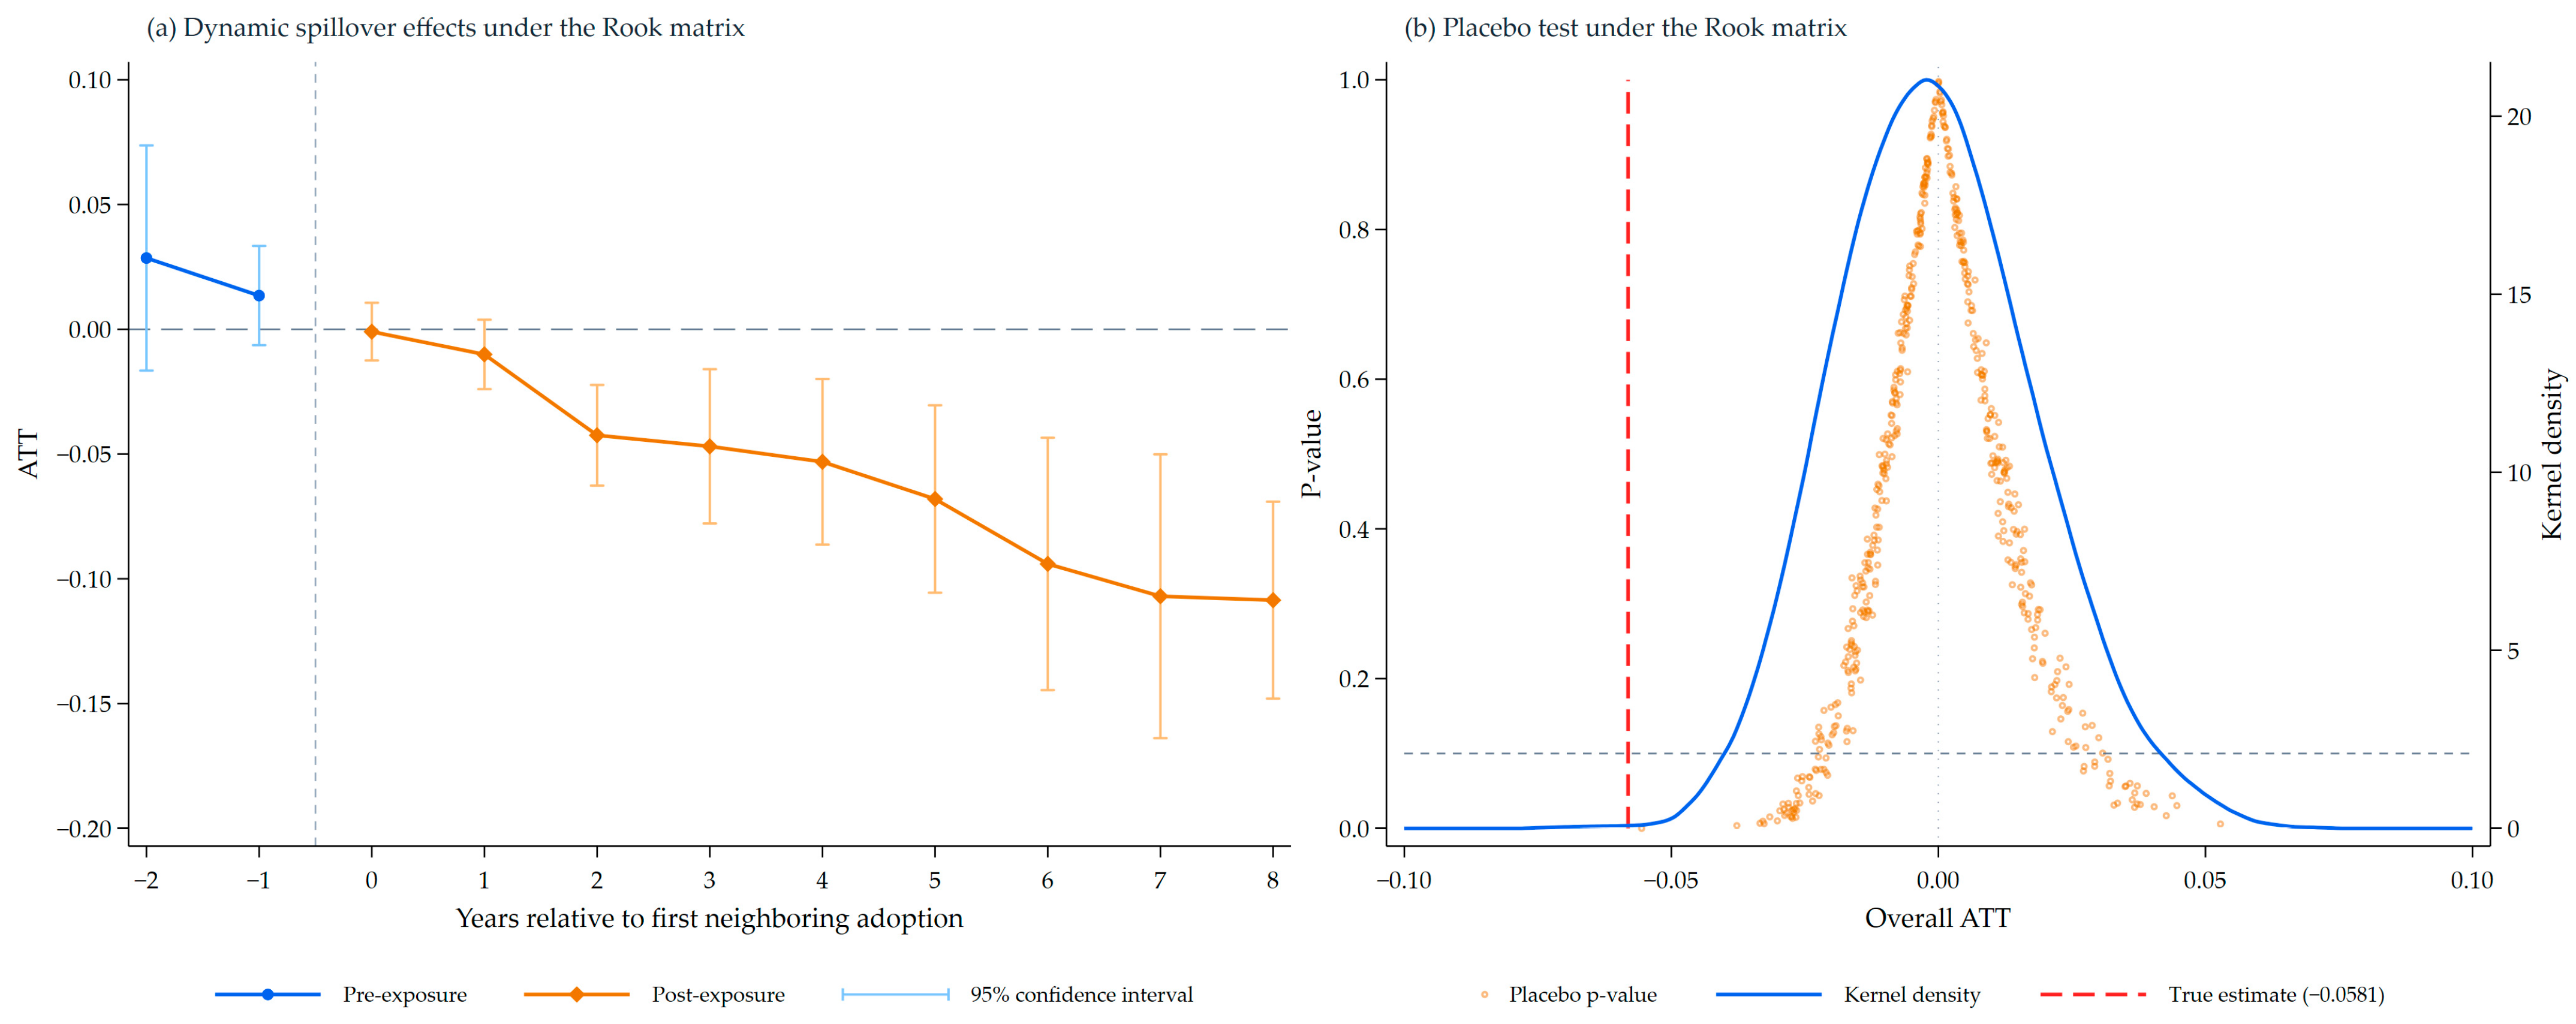
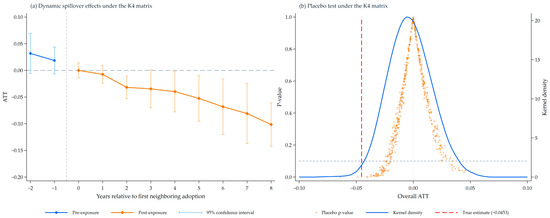
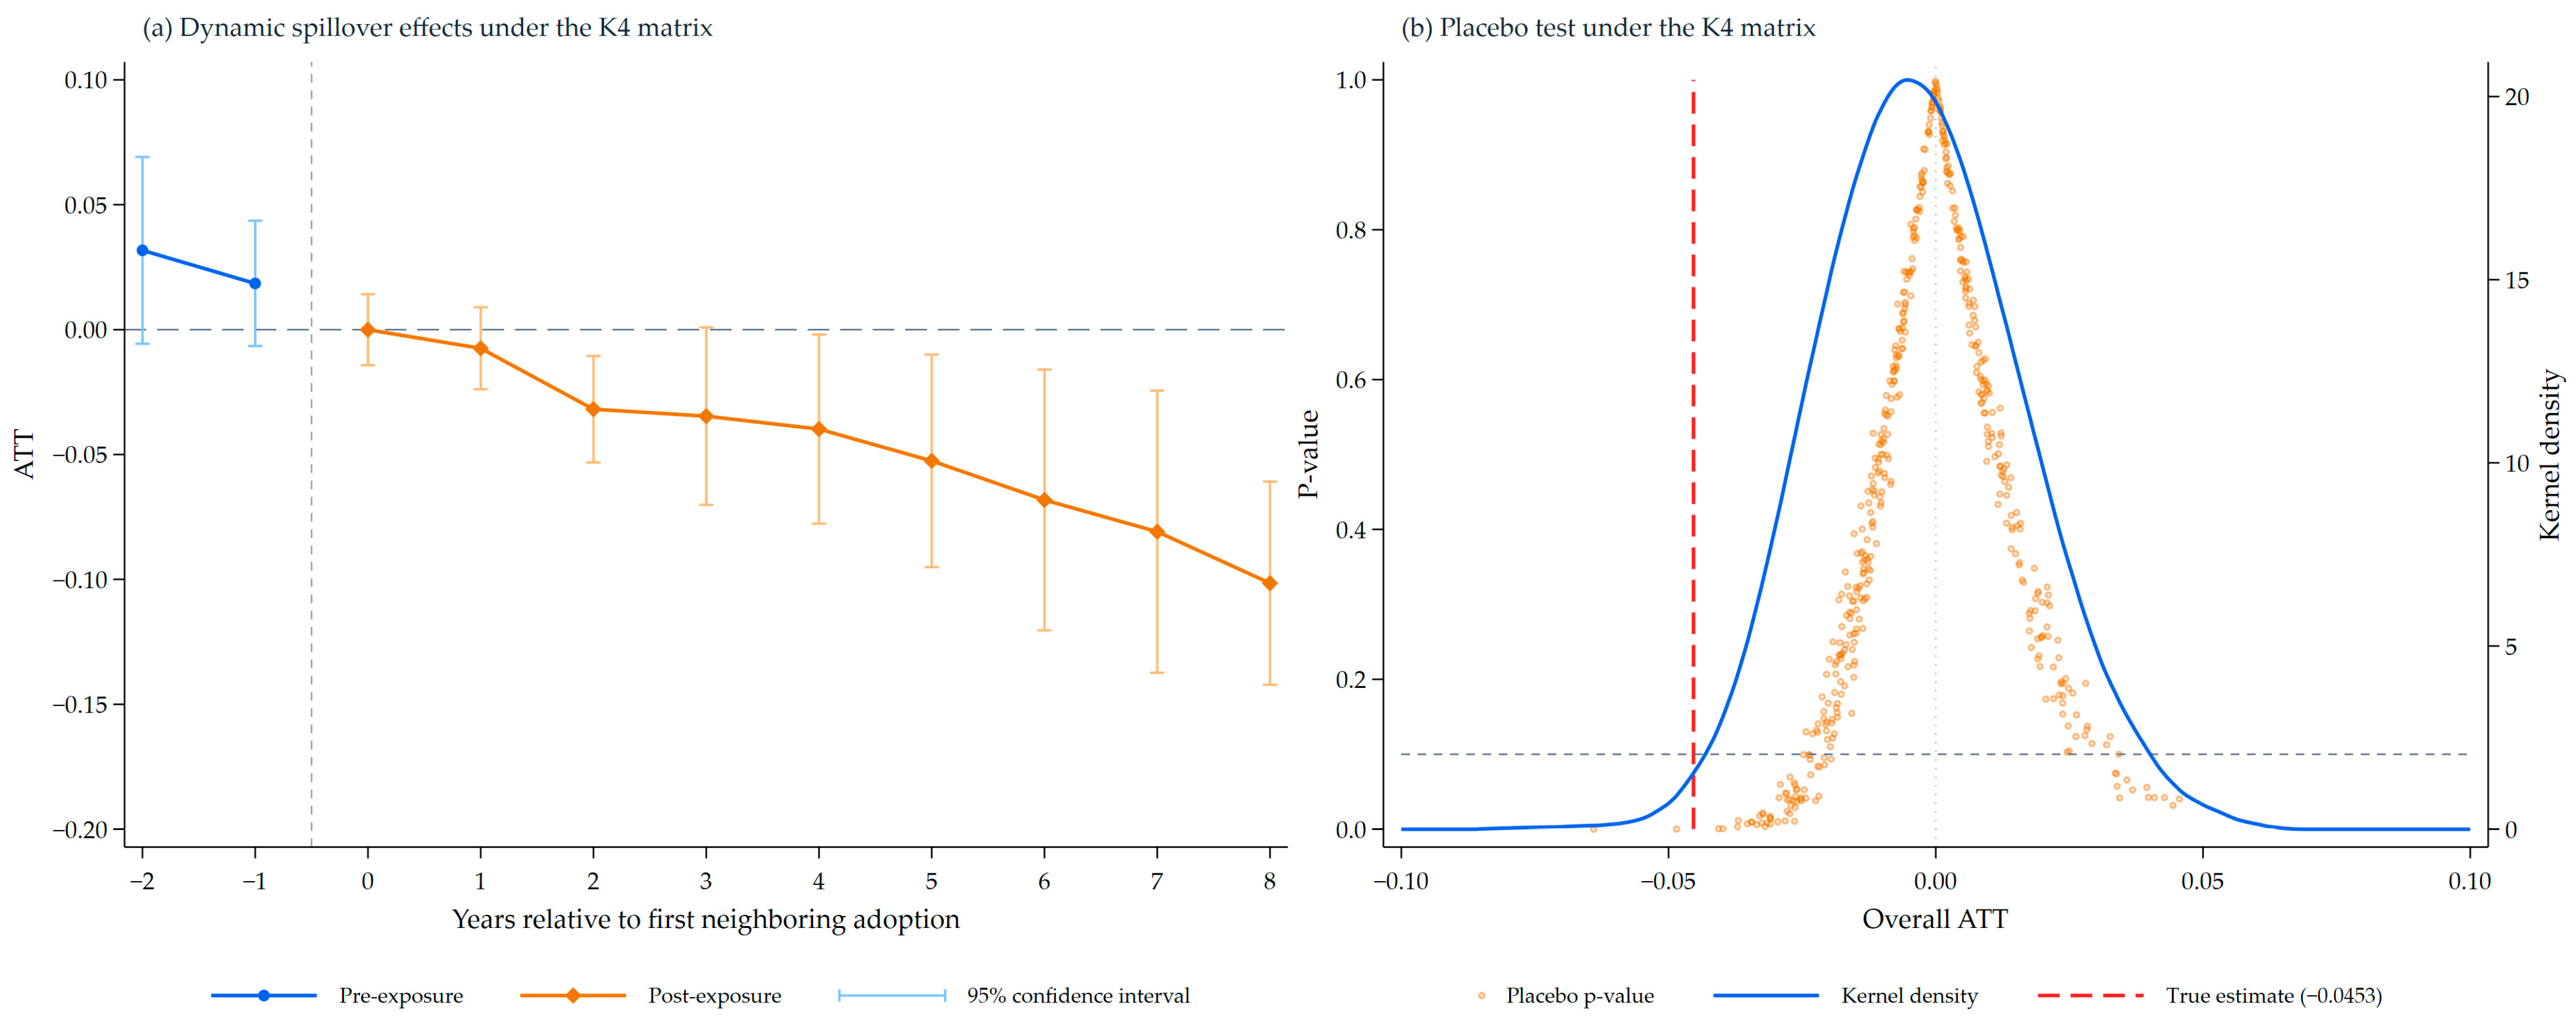
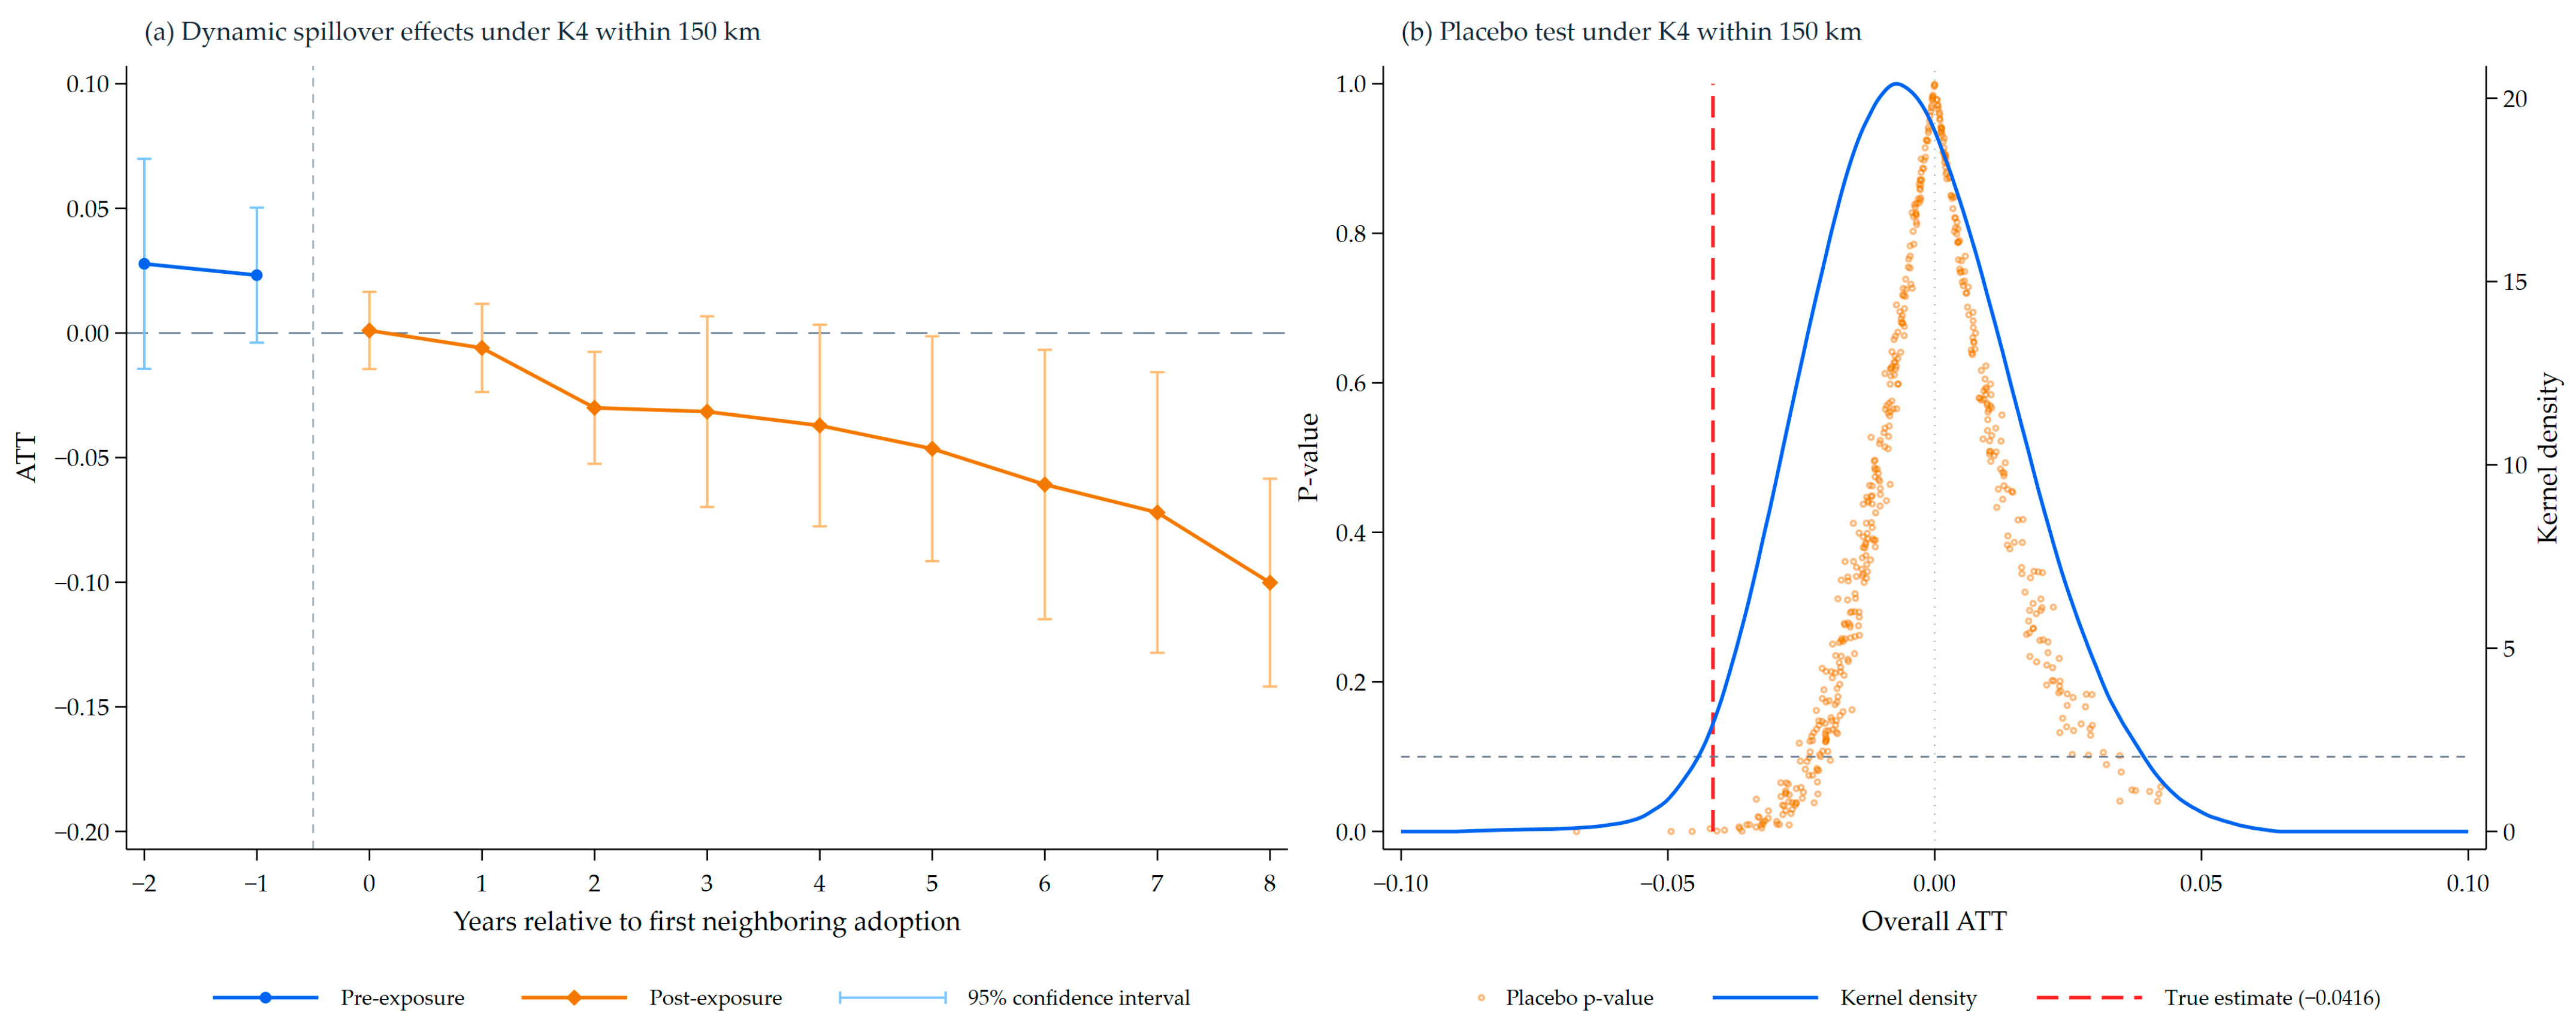

Disclaimer/Publisher’s Note: The statements, opinions and data contained in all publications are solely those of the individual author(s) and contributor(s) and not of MDPI and/or the editor(s). MDPI and/or the editor(s) disclaim responsibility for any injury to people or property resulting from any ideas, methods, instructions or products referred to in the content. |
© 2026 by the authors. Licensee MDPI, Basel, Switzerland. This article is an open access article distributed under the terms and conditions of the Creative Commons Attribution (CC BY) license.