


Abstract
Brazil is among the global leaders of native vegetation conversion and agricultural expansion rates. The rates of native vegetation suppression and recovery, as well as the drivers underlying land conversion dynamics, vary among the six Brazilian biomes. Here we analyze the trajectories of four native vegetation types, three anthropic classes and water in Brazil and its biomes between 1985 and 2024. Using trajectory analysis, we also investigate land change history in areas of cropland expansion. The proportion of trajectories varied between native vegetation types and biomes, with forests showing a larger proportion of stable areas, savannas a higher proportion of loss and grasslands and wetlands a greater proportion of trajectories involving alternation, mostly in the Pantanal. Pasture gain was proportionally higher in Pantanal and the Amazon while in the Atlantic Forest its loss was proportionally higher than in other biomes. Gain of croplands was proportionally higher in the Amazon, Cerrado and Caatinga. The proportion of native vegetation and pasture trajectories in areas of croplands expansion also varied markedly between and within biomes. Our analysis advances the original trajectories method by examining per-pixel trajectories across different classes, revealing crucial regional differences in land use history.
Keywords:
farming; land use and land cover change; MapBiomas; mapping; time-series; Landsat; Brazilian biomes 1. Introduction
Brazil hosts global hotspots of biodiversity [1] and contains one of the world’s largest extents of tropical forests and persistent water extent [2]. Nevertheless, recent global assessments of land use and land cover (LULC) change consistently indicate Brazil as one of the leading countries in native vegetation conversion and agricultural expansion rates.
Zalles et al. [3], analyzing the anthropogenic impact on natural land in South America between 1985 and 2018, reported that it increased in Brazil more than in any other analyzed country (64% increase, totaling 398.8 ± 19.7 Mha by 2018). Radwan et al. [4] stated that, between 1992 and 2018, South America had the largest areas of forest-to-agriculture transition among all continents, with Brazil, Argentina, Paraguay and Bolivia as the main contributors. Despite a reduction in deforestation in 2023, 2024 and 2025, Brazil still presented more than twice the deforestation area in Bolivia, which is the second country in the tropical deforestation rank [5]. Another global analysis of LULC change found that Brazil had the highest national aboveground biomass carbon reduction between 2000 and 2020, contributing 34% to the global total loss [2]. The same analysis indicated that Brazil and India had the largest net cropland gain in the period. Additionally, Brazil and China account for a major part of global pasture/rangelands expansion area between 1960 and 2019 [6]. Recent data on LULC mapping in Brazil indicate that croplands increased from 18.6 Mha in 1985 to approximately 62.7 Mha in 2024 [7]. The conversion of native vegetation to croplands and pastures in Brazil has resulted in substantial environmental impacts, including habitat and biodiversity loss, greenhouse gas emissions, disruption of carbon and nutrient cycles, and changes in regional climate and hydrological regimes (e.g., [8,9,10,11,12]).
The rates of native vegetation suppression and recovery, as well as the processes and economic activities underlying land conversion dynamics, vary substantially among the six Brazilian biomes, namely, Amazon, Atlantic Forest, Caatinga, Cerrado, Pampa and Pantanal. These biomes also differ in terms of vegetation structure and composition, biodiversity, soil characteristics, hydrological dynamics, climate conditions and land use history. Souza Jr. et al. [13] described the main characteristics of the Brazilian biomes and analyzed temporal trends in major LULC classes, including patterns of vegetation loss and gain, water–land transitions, and shifts among land uses between 1985 and 2017. Their analysis was based on annual LULC maps produced by MapBiomas using the Landsat series archive and the Google Earth Engine platform. MapBiomas is a collaborative network of non-governmental organizations (NGOs), universities, research institutions and tech startups that produces open-access LULC data for Brazil and other tropical and subtropical regions.
Other relevant studies using MapBiomas LULC data have characterized specific land use categories and biomes (e.g., [14,15,16,17,18,19,20]), including the analysis of transitions between LULC classes. Studies on land use and land cover change in Brazil based on other datasets generally cover only one or two biomes or states and do not analyze the losses and gains of each class on a per-pixel basis throughout the time series (e.g., [21,22,23]).
Bilintoh et al. [24] presented a novel method to analyze and summarize pixel-level trajectories, identifying whether a class was present or absent at the beginning and at the end of the time series and whether losses and gains occurred in a single event or if there was alternation with other LULC classes. By moving beyond conventional net area change estimates, this approach reveals landscape dynamics and transitions that are otherwise overlooked. Furthermore, Bilintoh et al. [24] use, as reference area, the union of all pixels where the class was present at any time point during the time series, rather than the initial class area, which is usually adopted in conventional change estimates. This approach overcomes common limitations of land change studies and improves comparisons across classes, territories and time intervals. More recently, Bilintoh et al. [25] and Pontius and Fonseca [26] presented new concepts and features of trajectory analysis and applied the referred methods to the understanding of LULC changes in an active agricultural frontier in western Bahia, Brazil, using MapBiomas data.
In this study, we analyze the trajectories of major LULC classes in Brazil based on a 40-year time series of MapBiomas Collection 10 data through the methods introduced by Bilintoh et al. [24]. Moving beyond the conventionally reported net area changes in each class, we generate maps of the underlying dynamics of gross gain, loss, and alternation over the time series. Specifically, we quantify and evaluate the historical trajectories of the four main native vegetation types, three anthropic classes and water bodies across all six Brazilian biomes, revealing similarities and differences between them. Furthermore, considering that cropland and pasture are the main land uses in Brazil and the expansion of croplands recorded in the MapBiomas time series, we explore the potential of joint analysis of the trajectories of such classes, mosaic of uses and native vegetation, to reveal patterns of LULC change history. These analyses seek to answer the following questions:
- (1)
- How do the main natural and anthropogenic classes differ in terms of trajectory proportions between 1985 and 2024? Which ones experienced the greatest proportions of gross losses, gains, and alternations over the historical series?
- (2)
- What are the similarities and differences in the trajectories of each class among Brazilian biomes?
- (3)
- Which LULC trajectories predominated in areas of cropland expansion between 1985 and 2024? Specifically, what sequences of native vegetation, pasture, and mosaic of land uses preceded cropland expansion, and how did these trajectories vary across Brazilian biomes?
Our study is the first to apply Bilintoh’s methods to all Brazilian biomes. In addition, we build on previous work by explicitly considering the trajectories of different classes within the same pixel, revealing their replacement sequence. Such joint analysis of trajectories of multiple classes provides a deeper understanding of landscape dynamics, underlying processes, and historical patterns of change between classes, allowing for the identification of the dominant land-change pathways in each Brazilian biome.
2. Materials and Methods
The current analysis encompassed the entire Brazilian territory, considering its six unique biomes (Figure 1). The main vegetation and land use characteristics of the Brazilian biomes are summarized in Table 1. The MapBiomas network, initiated in 2015 in Brazil, provides annual LULC maps based on Landsat imagery (Souza Jr. et al. [13]). The mapping evolved year by year and is updated through the annual launch of new collections. In this study, we used Collection 10 of MapBiomas data [7], comprising a time series of annual LULC classification from 1985 to 2024 at a 30 m spatial resolution. All data, classification maps, and statistics are openly available through the MapBiomas website (https://brasil.mapbiomas.org/ (accessed on 29 September 2026)) and platform (https://plataforma.brasil.mapbiomas.org/ (accessed on 29 September 2026)).
Figure 1.
Map of the six Brazilian biomes.
Table 1.
Native vegetation and land cover and land use characteristics of the Brazilian biomes.
Given the continental extension and heterogeneity of the Brazilian territory, maps were produced separately for each biome and assembled with cross-cutting themes (i.e., pasture, cropland, coastal zone, mining and urban infrastructure). The first step was to generate annual Landsat mosaics comprising specific temporal windows to optimize the spectral contrast and better discriminate the LULC classes across biomes and cross-cutting themes. The second step was to derive all feature space attributes from the Landsat bands to train one random forest classifier (feature space definition) for each year [27]. Then, training samples were acquired yearly in each biome and cross-cutting theme according to their information availability and statistical needs. The output of the random forest classifier is one LULC map per year for the entire territory based on the training dataset of that year. The exceptions are the classes Aquaculture, Mining, Center Pivot of Irrigation, Rice, Palm Oil, and Citrus, which had their areas of occurrence identified using the U-Net convolutional neural network classifier (CNN; [28]). Finally, spatial-temporal filters were applied over the classified data for noise removal and temporal stabilization. Subsequently, the filtered LULC maps of each biome and cross-cutting theme were hierarchically merged (integrated) based on a set of prevalence rules. The prevalence rules were set using expert knowledge and are described in Annex V of MapBiomas [29]. Spatial and temporal filters were once again applied to the integrated maps to create the final Collection 10 product. All image processing, classification, and post-classification procedures to produce the LULC maps were implemented in JavaScript ES5 and Python 3.12 using Google Earth Engine (Mountain View, CA, USA).
The accuracy assessment of the LULC maps was based on 75,000 independent random samples per year from 1985 to 2022, stratified by terrain slope and topographic charts. The samples were labeled according to MapBiomas LULC classes by experts after the visual interpretation of Landsat data, MODIS-NDVI series, and high-resolution imagery from Google Earth (when available) and are available for download at https://brasil.mapbiomas.org/downloads/pontos-de-validacao/ (accessed on 29 September 2026). The classification legend comprises four hierarchical levels, with five Level-1 classes and increasingly detailed thematic classes at lower levels. At the second legend level, the global accuracy was 87.2% in 1985 and 90.3% in 2024, with allocation disagreement ranging from 9.0% and 7.1% and quantity disagreement from 3.7% to 2.5%. Users and Producers accuracy in 1985 and 2024 for each class included in the current study are presented in the Supplementary Materials (Figure S1). More information concerning the methods of MapBiomas accuracy assessment can be found at MapBiomas [30]. An overview of the building blocks of the MapBiomas image-processing protocol to reconstruct annual LULC maps is presented in the Supplementary Materials (Figure S2); the methodological details for each biome and theme can be found in Souza Jr et al. [13] and in https://brasil.mapbiomas.org/downloads/documentos-e-notas-tecnicas/ (accessed on 29 September 2026) and all codes for MapBiomas LULC mapping are available at https://github.com/mapbiomas-brazil (accessed on 29 September 2026).
To align with the terminology of other MapBiomas publications, here we use the term “class” to refer to the vegetation cover or land use identified in the mapping, instead of the word “category” used by Bilintoh et al. [24]. To answer the first and second questions posed in the Introduction, we focused on eight classes of the second legend hierarchical level: forest formation, savanna formation, grassland, wetland, pasture, cropland (referred to as agriculture in the MapBiomas legend), urban area, and water (referred to as rivers, lakes and oceans in the MapBiomas legend). MapBiomas includes in the cropland class mainly map commodities in medium and large areas, such as soybeans, rice, sugarcane, among others (for a complete list, see Annex III of MapBiomas ATBD [29]) and may omit crops in small areas such as cassava and banana.
For the third question, we merged all MapBiomas native vegetation classes into a single trajectory map. We also considered in this analysis the trajectory of the class named mosaic of uses, which typically corresponds to small rural properties with mixed rural activities where it was not possible to distinguish between pastures and croplands. This class may also be a transitional state, such as fallow areas, secondary vegetation developing in abandoned pastures or ecological restoration processes prior to reaching forest size and structure, the earlier stages of silviculture or crop cultivation. In the Amazon biome, the class mosaic of uses is not mapped in the current MapBiomas collection. In Pampa, there are no savanna formations and the natural grassland areas are often used for raising cattle instead of the planted exotic pastures common in other biomes. Additionally, the cropland area in the Pantanal and the wetland area in Caatinga are negligible. Therefore, these classes were not analyzed in these biomes. In the Pantanal, the grassland, wetland and water classes jointly represent positions along the flood-pulse gradient rather than mutually independent land covers, and the alternation among them is expected; this is discussed in detail in Section 4.1. A full definition of each class can be found in Annex III of MapBiomas [29] and the absolute area of each class per year and biome during the time series is available at https://plataforma.mapbiomas.org/ (accessed on 29 September 2026).
Based on the MapBiomas Collection 10 time series of maps of Brazil, we analyzed each of the eight LULC classes using Bilintoh’s methods, which classify pixels in one of eight trajectories (hereafter TR) (Table 2). Both TR1 and TR2 have exactly one change during the time interval, corresponding to the class loss or gain, respectively. Alternation is a pair of loss and gain at a location during the time series. Both TR3 and TR4 have an odd number of changes equal or greater than three, but in TR3 the class is present at the beginning of the time interval and absent at the end (“loss with alternation”) and in TR4 the opposite occurs (“gain with alternation”). TR5 and TR6 have an even number of changes equal or greater than two, but in TR5 the class is present both at the beginning and the end, while in TR6 the class is absent at the beginning and at the end of the time interval. Therefore, TRs 3 to 6 present alternation. Trajectories 7 and 8 have zero changes, denoting stable presence and stable absence, respectively. Real examples of trajectories can be found in Figure S3 in the Supplementary Materials.
Table 2.
Characteristics, associated colors, and examples of the eight trajectories (TR). P and AB denote, respectively, presence and absence, either at the beginning (y1) or at the end of the time interval (y5). Letters in parentheses indicate stability (S) or change events (L = loss; G = gain; AL = alternation with other classes). In the examples, the value 1 denotes class presence, zero denotes absence, and y is the time step (annual in the current study). Except for TR7 and TR8, other sequences of change along the time steps are possible in each TR. Adapted from Bilintoh et al. [24].
Bilintoh et al. [24] created the concept of “unified size”, which is the territory corresponding to the union of pixels that have presence of the class at any time point (i.e., summing the pixel areas of all trajectories from TR1 to TR7, excluding only pixels in TR8, where the class was not present during the time series), hereafter referred to as class unified area. For each class unified area, we quantified the proportion of pixels in each TR, both at the country and at the biome scales. Following Bilintoh et al. [24], we also quantified for each class, at the national scale, the relative contribution of three components of change: quantity, alternation and exchange. Quantity measures the absolute net change in the area of each class. If a class experiences both gross loss and gross gain, then the overall change is greater than the quantity component. The overall change minus the quantity component is the allocation change, which has two subcomponents: exchange and alternation. Exchange measures the simultaneous gain at some locations and loss at other locations between time point 0 and the final time point of the series. Alternation measures pairs of gain and loss at an observation through the time series. Additionally, aiming to reveal the temporal patterns of changes, graphs showing gross losses and gains in 5-year intervals over the historical series are presented. The horizontal axis shows time intervals, while the vertical axis shows the annual change as a percentage of the class unified area. In these graphs, although the loss or gain is allocated to the 5-year intervals, the trajectory considered for each pixel relates to the entire historical series. For example, the percentage of the unified class area showing positive change in TR6 within a given interval indicates the area of pixels with TR6 (based on the full historical series) that exhibited a gain during that interval.
In order to investigate the histories of LULC change in areas of cropland expansion (the third question in our specific objectives), further exploring the potential of trajectory analysis in revealing patterns of LULC change, we first produced a single trajectory map of all native vegetation classes. Then we crossed this map with the cropland, pasture, and mosaic of uses trajectory maps. We accomplished that with simple bands mathematical operations, by multiplying the cropland trajectory map by 1000, vegetation by 100, pasture by 10 and adding all these images to the mosaic of uses trajectory map, in order to identify the trajectory of each class in each pixel (hereafter referred to as joint trajectories). Then, we selected all pixels where cropland was absent in 1985 and present in 2024, i.e., showed either TR2 or TR4. We explored this result at the national and biome scales to provide insights into the trajectories of pasture, mosaic of uses and native vegetation classes in areas where cropland has expanded in the studied time interval. To maintain the cloud computing workflow used to generate the land use and land cover maps, we adapted the trajectory methods presented by Bilintoh et al. [24] to JavaScript codes in the Google Earth Engine (GEE) platform. The maps of trajectories produced are all available for direct download as public assets in the GEE platform. The asset IDs and the JavaScript codes can be found on GitHub (https://github.com/joaosiqueira/mapbiomas-trajectories-paper/tree/main (accessed on 29 September 2026)).
3. Results
3.1. Trajectories of LULC Classes in Brazil
The estimated unified class areas (i.e., the sum of all pixels where each class was present at any point in the time series; see Section 2) vary widely across LULC classes and biomes, and their extents in km2—by biome and for Brazil—are presented in Table 3.
Table 3.
Unified classes area extents (i.e., the sum of the areas of all trajectories, with the exception of TR8) in km2 for each LULC class, biome, and for Brazil (Total). CRO = cropland, FOR = forest formation, GRA = grasslands, PAS = pasture, SAV = savanna formation, URB = urban area, WAT = water, WET = wetland, AMZ = Amazon, CAA = Caatinga, CER = Cerrado, ATL = Atlantic Forest, PAM = Pampa and PAN = Pantanal.
All vegetation classes exhibited net loss (Figure 2). The importance of the alternation component varied among them, being greater in wetlands and grasslands than in savanna and forest formations, while exchange was more expressive in grasslands (Figure 2). Among the natural classes analyzed, forest formation exhibited the highest proportion of stable presence (TR7) during the study period, accounting for 77.8% of its unified area (Figure 3). In contrast, savanna and grassland formations displayed more dynamic patterns, with 53.0% and 40.0% stable presence, respectively. As observed for other native vegetation classes, except for wetlands, most of forest formation loss occurred as a one-time event, with TR1 accounting for 14.4% of the forest formation unified area, whereas alternation with other classes followed by loss (TR3) represented only 1.5%. Savanna formation presented the highest proportion of loss, with 24.0% of loss without alternation and 3.8% of loss with alternation. Compared to other native vegetation classes, wetlands, however, showed the highest proportion of loss with alternation (13.5%). Grasslands showed the highest proportion of gain with alternation during the period (16.7% of its unified area). This gain was not evenly distributed across biomes and often occurred at the expense of losses in other natural areas (see Section 3.2).
Figure 2.
Three components of change for the eight analyzed classes in Brazil between 1985 and 2024. L indicates net loss and G net gain.
Figure 3.
Proportion of trajectories (TR) in land cover and land use classes in Brazil between 1985 and 2024. The TRs are described in Table 2. CRO = cropland, FOR = forest formation, GRA = grasslands, PAS = pasture, SAV = savanna formation, URB = urban area, WAT = water, WET = wetland. For each class, 100% is the territory corresponding to the union of pixels that have the presence of the class at any time point (i.e., excluding the pixels in TR8), presented in Table 3.
It is observed that the gross loss of forest formations increased until 2005, fell drastically in the following period, but began to rise again from 2015 onwards (Figure 4a). Gross losses of savanna formations (proportionally more intense than those of forests), on the other hand, showed a more gradual decline over the series, with an increase in the final interval (2020–2024). For wetlands and grasslands, gross gains and losses appear to be better distributed throughout the historical series.
Figure 4.
Gross gains and losses of each study class in five-year intervals expressed as the annual percentage of the unified class area (unified size). The horizontal gross loss and gross gain lines indicate change averaged over the temporal extent. (a) Forest Formation; (b) Savanna Formation; (c) Wetland; (d) Grassland; (e) Pasture; (f) Cropland; (g) Urban Area; (h) Water.
The water class, as expected, is highly dynamic, with a large proportion of trajectories involving alternation with other classes, which is also evident in the distribution of the three components of change (Figure 2). The most common trajectories were alternation with absence at both the beginning and end of the time series (21.0% in TR6) and presence at the beginning followed by alternation and loss at the end (14.6% in TR3) (Figure 3). Less than half (45.9%) of the water class-unified area showed stable presence.
The three anthropogenic classes showed a net gain, which was most pronounced in croplands and urban areas, while exchange was more pronounced in pastures (Figure 2). The anthropic classes showed a high proportion of gain without alternation, particularly cropland and urban areas, which showed 53.9% and 58.6% of their unified areas, respectively, in this trajectory. Conversely, pasture showed the highest proportion of loss without (12.7% in TR1) and with alternation (3.3% in TR3) among the anthropic classes. Gross pasture losses showed a slight increase over the historical series, while gross gains decreased; agriculture, on the other hand, exhibited a more variable temporal pattern, with an abrupt decrease in gross gain in the last time interval (Figure 4e,f). Urban areas showed the greatest stability, with more than 97% of their unified area either in gain without alternation (58.6% in TR2) or stable presence (38.8% in TR7) categories (Figure 3).
3.2. Trajectories of LULC Classes in the Brazilian Biomes
The proportions of pixels in the seven trajectories (excluding TR8) for each class and biome are presented in Figure 5, and the absolute extent in km2 of each trajectory within each class and biome are provided in the Supplementary Materials (Tables S1–S6). The maps of pasture and cropland trajectories are presented in Figure 6 and the maps of other classes can be found in the Supplementary Materials (from Figures S4–S8), except for urban areas, which are too small to be visualized at this scale. The proportion of each biome area occupied by each of the studied classes in 1985 and in 2024 is presented in Figure S9.
Figure 5.
Proportion of trajectories (TR) in land cover and land use classes in the Brazilian biomes between 1985 and 2024. The TRs are described in Table 2. CRO = cropland, FOR = forest formation, GRA = grasslands, PAS = pasture, SAV = savanna formation, URB = urban area, WAT = water, WET = wetlands. For each class, 100% is the territory corresponding to the union of pixels that have the class present at any time point (i.e., excluding the pixels in TR8), presented in Table 3. The estimated area (km2) of each trajectory in each LULC class in each biome is presented in Tables S1–S6.
Figure 6.
Map of trajectories (TR) of pastures (left) and cropland (right) in Brazil between 1985 and 2024. The TRs are described in Table 2.
The higher proportions of stable (TR7) forest formation were in the Amazon (82.9%) and Caatinga (75.8%), while Pampa showed the smaller proportion (41.1%) of forest in this TR. Nevertheless, Pampa showed the second largest proportion of forest formation gain without alternation (11.3% in TR2), slightly smaller than that in the Atlantic Forest (12.3%). Forest formation loss without alternation (TR1) ranged from 24.9% in the Cerrado to 9.4% in the Caatinga.
Savanna formation displayed stable presence in the biomes, varying between 59.8% in Caatinga and 33.0% in Pantanal. The proportion of savanna loss without alternation was higher in Cerrado (28.1%) and in the Atlantic Forest (24.4%), and lower in the Caatinga (18.2%).
The proportion of grassland trajectories varied across biomes. The class presented a higher proportion of stable presence in the Amazon (80.3%) and Cerrado (65.3%), although the latter was also the biome with the highest proportion of loss without alternation of grasslands (31.9% in TR1). When accounting for loss with alternation, Pampa becomes the biome with the highest loss of grasslands (11.9% of loss with and 27.1% without alternation). Pantanal showed a particular pattern of grasslands trajectories, with 79.7% of the unified area in categories where the class was absent at the beginning of the period and there was alternation with other classes during the time interval (61.85% in TR4, with presence at the end, and 17.9% in TR6, with absence at the end).
Cerrado, Amazon, and Pampa biomes showed the highest proportion of stable presence of wetlands (76.0%, 42.8%, and 42.7% of the class unified area, respectively), while in Pantanal this trajectory occupied less than 1% of the class unified area. Conversely, most wetlands in Pantanal were present during, but not at the beginning or at the end of the time series (57.6% of unified area in TR6) or showed loss with alternation (36.1% in TR3), although a relatively small gain of wetlands with alternation also occurred (3.2% in TR4).
The higher proportions of pasture gain without alternation (TR2) were in the Amazon (59.5%) and Pantanal (58.9%). In the Atlantic Forest, conversely, the gain of pasture was lower (11.1%) and the loss without alternation of this class was higher than in other biomes (25.0%). For cropland, the Atlantic Forest and Pampa showed the highest proportion of stable presence (TR7 with 27.4% and 22.7% respectively). Gain without alternation (TR2) in this class was higher in the Amazon (75.5%), Cerrado (68.9%) and Caatinga (65.5%).
TR proportions in the water class also varied among biomes. The most distinct patterns were the high proportion of stable presence in Pampa (85.1% in TR7) and, conversely, the predominance of categories involving alternation in Pantanal, mostly with presence at the beginning, alternation, and absence at the end (53.4% in TR3), but also with absence at the beginning, alternation with other classes, and absence at the end (32.6% in TR6). Finally, the gain in urban areas was comparatively lower in Pantanal and Pampa (47.4% and 44.9% in TR2, respectively) than in other biomes.
3.3. Joint Trajectories: The Case of the Expansion of Croplands over Pastures, Mosaic of Uses and Vegetation Classes
The estimated total area where cropland was absent in 1985 and present in 2024, i.e., showed either TR2 or TR4, in Brazil exceeds 476,000 km2—an area about the size of Sweden. The trajectory “pasture loss-cropland gain” without occurrence of vegetation or mosaic of uses (V8P1M8C2 in Figure 7) was predominant, representing 18% of this area. The conversion “vegetation-cropland” without occurrence of pasture or mosaic of uses during the time series (V1P8M8C2) represented 15% of the area, while areas with vegetation at the beginning of the time series, replaced by pastures and then by croplands (V1P6M8C2) totaled 14%. Other common joint trajectories included “vegetation loss-mosaic of uses-cropland gain” (V1P8M6C2), “pasture loss-mosaic of uses-cropland gain” (V8P1M6C2) and “mosaic of uses loss-cropland gain” (V8P8M1C2; Figure 7). The same analysis at the biome scale, however, reveals distinct regional patterns.
Figure 7.
Proportion of joint trajectories in areas where cropland was absent in 1985 and present in 2024 in Brazil. Pas = pasture, Veg = native vegetation, Mos = mosaic of uses, Cro = cropland. Brackets indicate the alternation between classes, with unknown order and number of changes. Within the parentheses are the trajectory numbers for each class. The letters stand for the classes (V = vegetation, P = pasture, M = mosaic of uses, C = cropland) and numbers inform the respective trajectory, as described in Table 2. For instance, V1P8M8C2 refers to areas where vegetation showed TR1, both pasture and mosaic of uses TR8, and cropland TR2.
The four most common joint trajectories starting with cropland absence and ending with cropland gain per biome (excluding Pantanal due to its negligible cropland area) are presented in Figure 8. In the Amazon, most cropland expansion occurred in areas where vegetation was replaced by pasture and the latter was replaced by cropland. This pattern is spatially depicted in Figure 9. Between 1985 and 2024, a massive loss of forest formations was seen outside indigenous territories in the region of the headwaters of the Xingu River, close to the borders of the Amazon and Cerrado Biomes (Figure 9A). In the upper part of Figure 9B, the blue pixels correspond to areas where pastures have replaced forests during this period and were still present in 2024, while the yellow pixels, close to the southern border of the Amazon biome, correspond to areas where pastures replaced forests, but were present only for some years during the time series, and were replaced by crops (Figure 9C). The vegetation–pasture–cropland joint trajectory can be visualized in the red pixels of Figure 10A, while the dark blue pixels correspond to areas where pasture was already present in 1985 and was replaced by cropland. The absence of the mosaic of uses class in the Amazon joint trajectories is due to the fact that such areas are classified either in the pasture or in the cropland classes in this biome.
Figure 8.
Estimated proportion of the four most common joint trajectories in each of the five analyzed Brazilian biomes in areas where cropland was absent in 1985 and present in 2024. Pas = pasture, Veg = native vegetation, Mos = mosaic of uses, Cro = cropland. Brackets indicate the alternation between classes, with unknown order and number of changes. Within the parentheses are the trajectory numbers for each class. The letters stand for the classes, as in Figure 7, and numbers inform the respective trajectory, as described in Table 2. For instance, V1P8M8C2 refers to areas where vegetation showed TR1, both pasture and mosaic of uses TR8, and cropland TR2. Pantanal was not included in the analysis because of its negligible cropland area.
Figure 9.
Trajectories of (A) forest formations, (B) pasture, and (C) cropland between 1985 and 2024 in the region of the headwaters of the Xingu River, in the south of the Amazon biome. Trajectories are described in Table 2.
Figure 10.
Joint trajectories of vegetation, pasture, and mosaic of uses in pixels where cropland was absent in 1985 and present in 2024. Only the most common joint trajectories are shown. Pas = pasture, Veg = native vegetation, Mos = mosaic of uses, Cro = cropland. Within the parentheses are the trajectory numbers for each class. The letters stand for the classes, as in Figure 7, and numbers inform the respective trajectory, as described in Table 2. (A) East of the Xingu River headwaters, near the boundaries of the Amazon and Cerrado biomes; (B) area in the MATOPIBA region; (C) area in the south of the Cerrado biome; (D) area in the north of the Cerrado biome;
In Pampa, most of the cropland expansion was in areas of vegetation loss without pasture or mosaic of uses occurrence, although the presence of mosaic of uses before cropland gain was also relatively common (Figure 8). In Cerrado, the most common joint trajectory was also “vegetation loss-cropland gain”, but “pasture loss-cropland gain” and “vegetation loss-mosaic of uses-cropland gain” were also relatively common. The spatial distribution of such joint trajectories varied across the biome (Figure 10B–D). Large, continuous areas where native vegetation loss was followed directly by cropland gain, without an intervening pasture or mosaic of uses, were concentrated in the northern Cerrado and in the MATOPIBA region (an active agricultural frontier encompassing parts of the states of Maranhão, Tocantins, Piauí, and Bahia) (Figure 10D and Figure 10B, respectively). In contrast, cropland expansion in areas where native vegetation was absent throughout the study period (V8) was more common in other parts of the biome, reflecting a transition from livestock production to cropland in a patchy spatial pattern (Figure 10C).
In the Atlantic Forest, the two most common joint trajectories were pasture at the beginning of the time series and conversion to cropland or the occurrence of the mosaic of uses class between pasture and cropland (Figure 8). In Caatinga, the conversion of pasture to cropland was the most common joint trajectory and “mosaic of uses-pasture-cropland” was the second most important. Some areas of cropland expansion in this biome were vegetated in 1985 but were occupied either by the mosaic of uses class or pastures before cropland gain.
4. Discussion
4.1. Trajectories of LULC Classes in Brazil and in the Biomes
Although all vegetation classes showed a net loss, the contribution of alternation and exchange varies among them, highlighting the importance of understanding the spatiotemporal patterns of gross losses and gains, particularly in wetlands, grasslands, and savanna formations. Temporal patterns of gross gains and losses also varied among vegetation classes. The sharp decline in forest loss after 2005 coincided with the implementation of the Action Plan for the Prevention and Control of Deforestation in the Legal Amazon (PPCDAm) and resulted from a combination of factors, including strengthened environmental monitoring and law enforcement, expansion of protected areas and Indigenous lands, restrictions on rural credit, supply-chain interventions such as the Soy Moratorium and cattle agreements, and changes in agricultural commodity prices, a pattern already widely discussed in the literature, e.g., [31,32]. The Savanna formation, on the other hand, showed a more gradual decline in gross loss until 2020. In addition to MapBiomas data, annual INPE/PRODES data also indicate a marked intensification of native vegetation loss in the Cerrado during the early 2020s, with deforestation increasing from approximately 6319 km2 in 2019 to 11,000 km2 in 2023, before declining in 2024 [33].
In the Atlantic Forest and Pampa biomes, the proportions of forest gain (TR2 and TR4) were closer to those of forest loss (TR1 and TR3) than in the other biomes, indicating lower net change in forest cover within these biomes, with a slight increase in the Pampa and a slight decrease in the Atlantic Forest. This pattern of low net change in forest cover was previously identified in the Atlantic Forest by Rosa et al. [16], who highlighted the negative effects of the hidden replacement of old-growth forests by younger secondary forests. Amaral et al. [34] reported an annual average loss of 18,000 ha of mature forest in the Atlantic Forest between 2010 and 2020, which is surprisingly high considering that this vegetation has been fully protected by specific legislation since 2006 (Federal Law 11,428). This ongoing loss threatens both biodiversity and the ecosystem services provided by the biome.
The higher proportional stability of forests in the Amazon biome should not be interpreted as indicating low absolute deforestation during the study period, given the vast extent of standing Amazon forests. Although deforestation in the biome declined sharply between 2004 and 2012, it increased again between 2013 and 2022 [35,36], followed by a decline in 2023 and 2024 [7,37]. Despite the relatively high proportion of stable forest presence during the study period, the balance between forest loss (TR1 and TR3) and gain (TR2 and TR4) remained skewed toward loss, as observed in the other biomes. It is worth noting that the unified forest area in the Amazon accounts for approximately 80.1% of the total unified forest area in Brazil (Table 3), highlighting the biome’s importance for the preservation of this type of native vegetation and the ecosystem services it provides.
Savanna formation exhibited the highest proportion of loss without alternation (TR1) among the native vegetation classes. This vegetation type is protected by fewer and weaker legal mechanisms than forests and has been extensively cleared, particularly in the Cerrado and Caatinga biomes (Figure S5). Between 1985 and 2017, 18% of the Cerrado savannas were lost, corresponding to approximately 344,000 ha yr−1 [14]. In the Caatinga, 11% of the savanna formation was lost between 1985 and 2019, while pasture area increased by 62% and cropland by 284% [20]. The lower cultural and political priority given to savanna conservation, compared with forests, threatens their remarkable biodiversity and the essential ecosystem services they provide, with potentially serious consequences for agribusiness, food security, climate change mitigation, and neighboring biomes [38].
In the Pantanal, savannas exhibited a greater expansion trajectory (approximately 13.5% in TR2 and TR4 combined) than in the other biomes. This pattern may be associated with the woody encroachment process observed in the biome [39], whereby savannas have expanded over grassland areas, particularly those that have dried and are no longer strongly influenced by the annual flood pulse. Additional analyses and fieldwork would be necessary to examine this hypothesis. During the study period, 461,000 hectares of savanna formations replaced grasslands, wetlands, and water bodies, representing nearly one-fifth of the current savanna area in the Pantanal. Thus, the savanna class is fundamental for interpreting landscape dynamics in the Pantanal, as it reflects not only deforestation (particularly through TR1 and TR3 trajectories) but possibly also broader landscape transformations, such as woody encroachment. Nunes et al. [39] warned that continued woody encroachment poses significant risks to biodiversity and ecosystem functioning.
Although grasslands showed a higher proportion of gain with alternation than the other native vegetation classes, most of this area is located in the Pantanal, where it is associated with the weakening of the flood pulse over the study period. The same process is reflected in the high proportions of TR3 and TR6 for water and wetlands in this biome, as grasslands alternate with these classes and emerge when floodplains dry. Two distinct components underlie this pattern: the first is a long-term trend of declining flood intensity and inundated extent documented for the biome [40]. The second is the position of the endpoints within the multi-annual flood cycle: the first years of the series (1985–1990) fall within one of the wettest phases of the Paraguay River record, monitored at Ladário since 1900 [41], whereas the final years (2019–2024) fall within a prolonged dry phase, culminating in the extreme droughts and wildfires of 2020 and 2024 [42,43]. The series thus captures the biome at two opposite points of this cycle, which accentuates the transitions recorded among the water, wetland and grassland classes; shifting the endpoints within the series would not remove this effect, since the trend and the cycle act in the same direction throughout the period.
These dynamics are also expressed spatially. Gain with alternation in the wetland class occurs mainly near the western border of the Pantanal, where water exhibits loss with alternation, indicating that this pattern likewise follows the drying trend. Furthermore, the substantial proportional gain of pasture in the biome occurs primarily over forest, savanna and grassland areas classified as TR6, which were predominantly covered by water or wetlands at the beginning of the time series.
In the Cerrado, wetlands exhibited both the highest proportion of stable areas and the highest proportion of loss without alternation compared to the other biomes. Durigan et al. [44] argued that the neglect of Cerrado wetlands places at risk the specialized plant and animal communities adapted to their hydrological dynamics, as well as the essential ecosystem services they provide, including sustaining the headwaters of many major Brazilian rivers. The conversion of wetlands to agriculture and pasture, together with major hydrological alterations in wetlands of the Cerrado and the Pantanal–Amazon transition zone, has been documented in the literature [45].
The proportions of trajectories in the water class may be influenced by climatic conditions during the first and last years of the time series. Atmospheric processes associated with the transition from La Niña (2022–2023) to El Niño (2023) produced exceptionally dry and warm conditions across the Amazon, Cerrado, and Pantanal in 2023 and 2024 [43,46], likely contributing to surface water loss [47] and consequently increasing the proportion of trajectories ending with water absence (TR1, TR3, and TR6). Gain without alternation in the water class may be associated with the expansion of artificial reservoirs for hydroelectric generation, irrigation, and livestock watering, and the importance of this phenomenon can be tested in future studies. In the Caatinga, the high proportion of trajectories with alternation (TR3, TR4, TR5, and TR6) reflects the biome’s marked seasonality, whereas the Pampa exhibited the highest proportion of stable water presence (TR7), owing to its extensive area of permanent lakes. At the national scale, only 45.9% of the unified water area remained permanently present throughout the study period (TR7), underscoring the importance of improving our understanding of surface water dynamics in Brazil, including distinguishing between natural and anthropogenic water bodies.
Regarding the anthropic classes, pasture exhibited a proportionally lower gain without alternation (TR2), lower overall quantity gain and higher importance of exchange than both urban areas and cropland at the national scale. In an analysis of the period between 2010 and 2018, Santos et al. [17] found that 31.7 Mha of pastureland in Brazil were converted to other uses or land cover types, while approximately 30.8 Mha of new pastureland were identified during the same period. Pasture loss without alternation (TR1) occurred predominantly in the southwestern Atlantic Forest (Figure 6), the only biome where TR1 exceeded pasture gain (TR2). This pattern is associated with subsequent cropland expansion over former pasture areas (see below). Other major areas of cropland gain without alternation are concentrated in the northern Pampa, the southern Amazon, and in several regions of the Cerrado (Figure 6). The proportional gain of cropland without alternation (TR2) was also substantial in the Caatinga, although cropland still occupies only a small fraction of the biome (Figure S9), as previously reported by Rocha et al. [20]. This expansion occurred primarily in the northern portion of the biome near the coast, but also in smaller, scattered clusters throughout the region.
The slowdown in cropland expansion since 2020 may be partly linked to the stabilization of the sugarcane planted area—also documented by the IBGE [48]—and could indicate that the MapBiomas data fail to capture some of the soybean expansion that occurred during this period, given that the soybean area documented by the IBGE was 7.4% larger in 2024. The joint trajectory analysis discussed in the following section provides a deeper understanding of the different LULC histories underlying cropland expansion.
4.2. Joint Trajectories: The Case of Agricultural Expansion
Although at the national level, only 15% of cropland expansion (TR2 and TR4) resulted from the direct conversion of native vegetation to cropland, this joint trajectory accounted for a larger proportion of the expanded area in the Pampa and Cerrado biomes, whereas it was less common in the Amazon, Atlantic Forest, and Caatinga. However, it is important to note that a large proportion of the native grasslands in the Pampa that was converted to cropland had been used for cattle grazing for a few centuries and therefore functioned as natural pastures. This production system is considered sustainable because it reconciles livestock production with the conservation of native vegetation and carbon sequestration [49]. Consequently, the expansion of cropland over these areas may threaten the rich biodiversity and ecosystem services provided by the Pampa grasslands [15].
The joint trajectories associated with cropland expansion varied spatially across the Cerrado biome and a better understanding of these intra-regional differences and their temporal evolution is important for guiding conservation strategies and rural development policies. The Atlantic Forest was the biome with the lowest proportion of trajectories involving native vegetation loss among the four most common joint trajectories associated with cropland expansion, which occurred predominantly over pasture or mosaic of uses. Because it extends along most of the Brazilian coast, it has the longest history of human occupation and, consequently, had the lowest proportion of native vegetation remaining in 1985. Agricultural intensification in the biome between 1985 and 2020 has previously been reported by Caballero et al. [19]. Nevertheless, Rosa et al. [16] suggested that cropland expansion over pastures located on flat terrain may be displacing cattle ranching to steeper areas within the biome, thereby contributing to the deforestation of older forests. Furthermore, some cropland expansion into recently deforested areas was also observed. We estimate that, in 5.0% of the area converted to cropland between 1985 and 2024, native vegetation loss, followed by a mosaic of uses, preceded cropland establishment. In an additional 3.5% of the expansion area, native vegetation was lost without alternation (TR1), and neither pasture nor mosaic of uses was mapped before cropland expansion. A recent assessment based on MapBiomas data estimated that more than 50,000 hectares of soybean were planted in 2022 in areas that had been deforested within the previous five years in the Atlantic Forest biome [50].
The joint trajectory from native vegetation to pasture and subsequently to cropland in the Amazon is observed mainly along the southern edge of the biome and has been previously documented in the literature (e.g., [19,51,52]). As in the Atlantic Forest, this pasture-to-cropland replacement may induce deforestation leakage through the displacement of cattle ranching to neighboring regions or, in the Amazon case, to the Cerrado biome [53]. Applying the methodology proposed by Bilintoh et al. [24] using shorter time intervals focused on specific policy periods (e.g., before and after the Soy Moratorium or the Zero-Deforestation Cattle Agreements) and at finer regional scales may provide a valuable approach for improving our understanding of these indirect land use change processes.
Therefore, the analysis of joint trajectories reveals that agricultural expansion has followed distinct LULC histories across the Brazilian biomes, consistent with findings from previous studies [19,51,52]. In the Amazon, the vegetation–pasture–cropland trajectory predominates, whereas direct conversion from vegetation to cropland is more common in the Cerrado and Pampa than in the other biomes. In the Atlantic Forest, agricultural expansion more frequently originates in areas previously occupied by pasture and/or a mosaic of land uses. In contrast, the Caatinga exhibits a more heterogeneous distribution of trajectories, with no single pathway clearly predominating.
4.3. Limitations and Further Potential of the Method
MapBiomas LULC maps are produced using a series of spatial and temporal filters designed to reduce classification errors and incorrect class transitions [29]. Nevertheless, some inconsistent transitions are likely to remain, particularly along the edges of LULC patches, potentially leading to an overestimation of interannual class alternation, as observed by Matos et al. [54] for MapBiomas Collection 9. Bilintoh’s method is particularly useful for detecting such unlikely transitions and is currently being used to improve MapBiomas post-processing filters and to correct misclassification errors.
Properly assessing the accuracy of the trajectory results presented here is challenging because it would require a sufficient number of reference samples for each trajectory within each LULC class. Although MapBiomas Collection 10 achieved high classification accuracy, trajectory-based analyses are inherently sensitive to classification errors and may therefore overestimate dynamic change. In addition, classification accuracy may vary spatially and temporally, with greater uncertainty expected in highly seasonal or heterogeneous landscapes, such as the Pantanal, the Caatinga, and regions dominated by the mosaic of uses class, reinforcing the need for caution when interpreting the relative abundance of some specific trajectory types. While it is important to acknowledge these limitations, it is reasonable to assume that this will occur in other trajectory studies involving long time series. Future studies should explore trajectory-level validation using independent datasets or high-resolution imagery and a suitable sample design to better quantify these uncertainties. A further consideration is that trajectory assignment depends on the states observed at the first and last time points, so that anomalous conditions in either year can shift a pixel between trajectories. The overall accuracy of the MapBiomas classification was comparable in both anchor years (87.2% in 1985 and 90.3% in 2024 for the second legend level), but interannual environmental variability remains a source of sensitivity, particularly for classes influenced by hydrological regimes. This should be taken into account when interpreting the water, wetland and grassland trajectories, especially in the Pantanal (Section 4.1).
When interpreting the joint trajectory results, it is important to recognize that classes not included in the analysis may also occur during the study period. To simplify both the analysis and the presentation of the results, we excluded forest plantations, urban areas, mining, and other non-vegetated classes from the joint trajectory analysis. For example, in an area where native vegetation follows TR1 and cropland follows TR2, with neither pasture nor mosaic of uses occurring (TR8), a forest plantation could have been established before conversion to cropland. However, forest plantations occupied approximately 90,000 km2 in 2024, corresponding to only 3.3% of the rural land use area (including cropland, pasture, and mosaic of uses) and generally represent medium- to long-term investments. Therefore, including this class would be unlikely to substantially alter the results. The same reasoning applies to the other excluded classes.
Another methodological limitation concerns the uncertainty associated with the mosaic of uses class. As described in the Methods section, this class represents areas with anthropogenic land use that cannot be unambiguously distinguished and may include both pasture and cropland. Consequently, the interpretation of joint trajectories involving the class mosaic of uses should consider these possible land uses. Furthermore, this class was not mapped in the Amazon biome in the current MapBiomas collection. As a result, joint trajectories involving pasture or cropland in this biome may also include land uses that would otherwise be represented by the mosaic of uses class.
Bilintoh’s method offers several additional applications that deserve further exploration. For example, mapping areas characterized by alternation trajectories may facilitate the study of fluctuations in hydroelectric reservoirs, other surface water dynamics, and secondary vegetation dynamics. Because the method spatially summarizes land-change histories over a given period, it also enables a wide range of spatial analyses, including the assessment of patch size, shape, connectivity, and proximity for specific trajectories, as well as investigations of their relationships with environmental or socioeconomic explanatory variables. The method also has potential for comparing different time periods [25,26]. Combining comparisons across time periods with comparisons among biomes or regions could, for example, improve our understanding of deforestation leakage, whereby the replacement of one land use by another indirectly displaces deforestation to different locations. Finally, applying the method to more detailed legend levels would enable the investigation of the roles of specific crop types (e.g., soybean, sugarcane, rice, and cotton) in the conversion of different native vegetation formations.
5. Conclusions
In this study, we assessed the historical trajectories of the four main native vegetation types, three anthropic classes and water bodies across all six Brazilian biomes, revealing similarities and differences between them. Furthermore, considering that cropland and pasture are the main land uses in Brazil and the expansion of croplands recorded in the MapBiomas time series, we explore the potential of joint analysis of the trajectories of such classes, the mosaic of uses and native vegetation to reveal patterns of LULC change history. The trajectory analysis methods used provide an effective framework for revealing and summarizing LULC dynamics at the pixel scale. The “unified size” concept proposed by Bilintoh et al. [24] and adopted here improves comparisons among classes and territories because it is independent of the initial extent of each class. Moreover, it captures the combined contributions of gross gains, gross losses, and alternating trajectories within a single reference area, thereby highlighting changes that may be overlooked when considering only net area changes.
The proportion of trajectories varied between native vegetation types and biomes, with forests showing a larger proportion of stable areas, savannas a higher proportion of loss, and grasslands and wetlands a greater proportion of trajectories involving alternation, mostly in Pantanal. Pasture gain was proportionally higher in Pantanal and the Amazon, while in the Atlantic Forest its loss was proportionally higher than in other biomes. Gain of croplands was proportionally higher in the Amazon, Cerrado and Caatinga. Our analysis further extends the original Bilintoh method by combining trajectories from the most relevant LULC classes, allowing the spatial representation of important regional differences in land use history. The proportion of native vegetation, mosaic of uses and pasture trajectories in areas of croplands expansion varied markedly between and within biomes. Although some of these joint trajectories have previously been described in the literature, this study presents a novel approach for spatially reconstructing LULC histories since the beginning of the Landsat record across all major Brazilian native vegetation types. This framework provides a comprehensive comparison of the land use histories associated with cropland expansion among Brazilian biomes over the last four decades. The same approach can be applied to investigate many other processes, including native vegetation regrowth, forest plantation expansion, surface water dynamics and their spatiotemporal variability, and transitions among agricultural crops, demonstrating its potential to improve the understanding of LULC dynamics across different countries and using a variety of long-term land-cover datasets.
Supplementary Materials
The following supporting information can be downloaded at https://www.mdpi.com/article/10.3390/land15101867/s1: Figure S1: Users and Producers accuracies of the study classes in 1985 and 2024 in MapBiomas Collection 10; Figure S2: Methodological steps to implement MapBiomas land use land cover (LULC) classification protocol in the Google Earth Engine; Figure S3: Real examples of pixel-level trajectories of the pasture class; Figure S4: Map of trajectories (TR) of forest formations in Brazil between 1985 and 2024. The TRs are described in Table 2; Figure S5: Map of trajectories (TR) of savanna formations in Brazil between 1985 and 2024. The TRs are described in Table 2; Figure S6: Map of trajectories (TR) of grasslands in Brazil between 1985 and 2024. The TRs are described in Table 2; Figure S7: Map of trajectories (TR) of wetlands in Brazil between 1985 and 2024. The TRs are described in Table 2; Figure S8: Map of trajectories (TR) of water in Brazil between 1985 and 2024. The TRs are described in Table 2; Figure S9: Proportion of the studied classes in each Brazilian biome area in 1985 and 2024; Table S1: Estimated area (km2) of each trajectory in each LULC class in the Amazon Biome. The TRs are described in Table 2. CRO = cropland, FOR = forest formation, GRA = grasslands, PAS = pasture, SAV = savanna formation, URB = urban area, WAT = water, WET = wetland; Table S2: Estimated area (km2) of each trajectory in each LULC class in the Caatinga Biome. The TRs are described in Table 2. CRO = cropland, FOR = forest formation, GRA = grasslands, PAS = pasture, SAV = savanna formation, URB = urban area, WAT = water, WET = wetland; Table S3: Estimated area (km2) of each trajectory in each LULC class in the Cerrado Biome. The TRs are described in Table 2. CRO = cropland, FOR = forest formation, GRA = grasslands, PAS = pasture, SAV = savanna formation, URB = urban area, WAT = water, WET = wetland; Table S4: Estimated area (km2) of each trajectory in each LULC class in the Atlantic Forest Biome. The TRs are described in Table 2. CRO = cropland, FOR = forest formation, GRA = grasslands, PAS = pasture, SAV = savanna formation, URB = urban area, WAT = water, WET = wetland; Table S5: Estimated area (km2) of each trajectory in each LULC class in the Pampa Biome. The TRs are described in Table 2. CRO = cropland, FOR = forest formation, GRA = grasslands, PAS = pasture, SAV = savanna formation, URB = urban area, WAT = water, WET = wetland; Table S6: Estimated area (km2) of each trajectory in each LULC class in the Pantanal Biome. The TRs are described in Table 2. CRO = cropland, FOR = forest formation, GRA = grasslands, PAS = pasture, SAV = savanna formation, URB = urban area, WAT = water, WET = wetland.
Author Contributions
Conceptualization, M.G.F., M.R. (Marcos Rosa) and J.Z.S.; methodology, M.G.F., M.R. (Marcos Rosa) and J.Z.S.; software, J.S., M.G.F. and M.R. (Marcos Rosa); formal analysis, M.G.F., M.R. (Marcos Rosa) and J.Z.S.; writing—original draft preparation, M.G.F.; writing—review and editing, M.G.F., M.R. (Mariana Ramos), M.R. (Marcos Rosa), J.Z.S., M.B.R.N., A.P.M., A.L.-C., D.C., E.R.R., E.V.-M., J.S., K.M., L.O.J., N.C. and T.A.; supervision, M.R. (Marcos Rosa), J.Z.S. and T.A.; funding acquisition, J.Z.S. and T.A. All authors have read and agreed to the published version of the manuscript.
Funding
This research received no external funding.
Data Availability Statement
All MapBiomas LULC data on which the present analyses in this study were based are openly available through the MapBiomas Website (https://brasil.mapbiomas.org/ (accessed on 29 September 2026)) and Platform (https://plataforma.brasil.mapbiomas.org/ (accessed on 29 September 2026)). The maps of trajectories produced are all available for direct download as public assets in the GEE platform. The asset IDs and JavaScript codes can be found in GitHub (https://github.com/joaosiqueira/mapbiomas-trajectories-paper/tree/main (accessed on 29 September 2026)).
Acknowledgments
We thank all institutions, collaborators, and technical teams involved in the MapBiomas initiative and the institutions that financially support it, listed at https://brasil.mapbiomas.org/ (accessed on 29 September 2026). We also acknowledge the MapBiomas partnership and institutional support provided by the Institute to Support MapBiomas (IAMap) and the Arapyaú Institute. During the preparation of this manuscript/study, the author(s) used Claude Code (Anthropic; version 2.1.288) with the Claude Opus 5.5 model (model ID claude-opus-5-5) for the purposes of code writing and editing. The code was written in Python 3.12 (pandas 2.3.3, NumPy 2.5.3, Matplotlib 3.11.2, XlsxWriter 3.2.9, openpyxl 3.1.5) and with the Google Earth Engine Python API (earthengine-api 1.7.43) and JavaScript API. The authors have reviewed and edited the output and take full responsibility for the content of this publication.
Conflicts of Interest
The authors declare that the research was conducted in the absence of any commercial or financial relationships that could be construed as a potential conflict of interest. The funders of the MapBiomas initiative had no role in the design of the study; in the collection, analyses, or interpretation of data; in the writing of the manuscript; or in the decision to publish the results.
Abbreviations
The following abbreviations are used in this manuscript:
| LULC | Land Use Land Cover |
| TR | Trajectory |
| CRO | Cropland |
| FOR | Forest Formation |
| GRA | Grassland |
| PAS | Pasture |
| SAV | Savanna |
| URB | Urban area |
| WAT | Water |
| WET | Wetland |
| MOS | Mosaic of uses |
| VEG | Native vegetation |
References
- Myers, N.; Mittermeier, R.A.; Mittermeier, C.G.; Da Fonseca, G.A.B.; Kent, J. Biodiversity hotspots for conservation priorities. Nature 2000, 403, 853–858. [Google Scholar] [CrossRef] [Scilit] [PubMed]
- Potapov, P.; Hansen, M.C.; Pickens, A.; Hernandez-Serna, A.; Tyukavina, A.; Turubanova, S.; Zalles, V.; Li, X.; Khan, A.; Stolle, F.; et al. The Global 2000-2020 Land Cover and Land Use Change Dataset Derived From the Landsat Archive: First Results. Front. Remote Sens. 2022, 3, 856903. [Google Scholar] [CrossRef] [Scilit]
- Zalles, V.; Hansen, M.C.; Potapov, P.V.; Parker, D.; Stehman, S.V.; Pickens, A.H.; Parente, L.L.; Ferreira, L.G.; Song, X.P.; Hernandez-Serna, A.; et al. Rapid expansion of human impact on natural land in South America since 1985. Sci. Adv. 2021, 7, eabg1620. [Google Scholar] [CrossRef] [Scilit] [PubMed]
- Radwan, T.M.; Blackburn, G.A.; Whyatt, J.D.; Atkinson, P.M. Global land cover trajectories and transitions. Sci. Rep. 2021, 11, 12814. [Google Scholar] [CrossRef] [Scilit] [PubMed]
- World Resources Institute. Tropical Rainforest Loss Slowed in 2025, But Fire Is a Growing Threat to Forests Worldwide. Available online: https://gfr.wri.org/latest-analysis-deforestation-trends (accessed on 18 May 2026).
- Winkler, K.; Fuchs, R.; Rounsevell, M.; Herold, M. Global land use changes are four times greater than previously estimated. Nat. Commun. 2021, 12, 2501. [Google Scholar] [CrossRef] [Scilit] [PubMed]
- MapBiomas. MapBiomas Project—Collection 10 of the Annual Land Use and Land Cover Maps of Brazil. Available online: https://data.mapbiomas.org/dataset.xhtml?persistentId=doi:10.58053/MapBiomas/IBQPF6 (accessed on 29 September 2026).
- Gatti, L.V.; Basso, L.S.; Miller, J.B.; Gloor, M.; Domingues, L.G.; Cassol, H.L.G.; Tejada, G.; Aragão, L.E.O.C.; Nobre, C.; Peters, W.; et al. Amazonia as a carbon source linked to deforestation and climate change. Nature 2021, 595, 388–393. [Google Scholar] [CrossRef] [Scilit] [PubMed]
- Leite-Filho, A.T.; Soares-Filho, B.S.; Davis, J.L.; Abrahão, G.M.; Börner, J. Deforestation reduces rainfall and agricultural revenues in the Brazilian Amazon. Nat. Commun. 2021, 12, 2591. [Google Scholar] [CrossRef] [Scilit] [PubMed]
- Soltangheisi, A.; de Moraes, M.T.; Cherubin, M.R.; Alvarez, D.O.; de Souza, L.F.; Bieluczyk, W.; Navroski, D.; Teles, A.P.B.; Pavinato, P.S.; Martinelli, L.A.; et al. Forest conversion to pasture affects soil phosphorus dynamics and nutritional status in Brazilian Amazon. Soil Tillage Res. 2019, 194, 104330. [Google Scholar] [CrossRef] [Scilit]
- Prevedello, J.A.; Winck, G.R.; Weber, M.M.; Nichols, E.; Sinervo, B. Impacts of forestation and deforestation on local temperature across the globe. PLoS ONE 2019, 14, e0213368. [Google Scholar] [CrossRef] [Scilit] [PubMed]
- Ochoa-Quintero, J.M.; Gardner, T.A.; Rosa, I.; Ferraz, S.F.d.B.; Sutherland, W.J. Thresholds of species loss in Amazonian deforestation frontier landscapes. Conserv Biol. 2015, 29, 440–451. [Google Scholar] [CrossRef] [Scilit] [PubMed]
- Souza, C.M.; Shimbo, J.Z.; Rosa, M.R.; Parente, L.L.; Alencar, A.A.; Rudorff, B.F.T.; Hasenack, H.; Matsumoto, M.; Ferreira, L.G.; Souza-Filho, P.W.M.; et al. Reconstructing three decades of land use and land cover changes in brazilian biomes with landsat archive and earth engine. Remote Sens. 2020, 12, 2735. [Google Scholar] [CrossRef] [Scilit]
- Alencar, A.; Shimbo, J.Z.; Lenti, F.; Marques, C.B.; Zimbres, B.; Rosa, M.; Arruda, V.; Castro, I.; Ribeiro, J.P.F.M.; Varela, V.; et al. Mapping three decades of changes in the brazilian savanna native vegetation using landsat data processed in the google earth engine platform. Remote Sens. 2020, 12, 924. [Google Scholar] [CrossRef] [Scilit]
- Baeza, S.; Vélez-Martin, E.; De Abelleyra, D.; Banchero, S.; Gallego, F.; Schirmbeck, J.; Veron, S.; Vallejos, M.; Weber, E.; Oyarzabal, M.; et al. Two decades of land cover mapping in the Río de la Plata grassland region: The MapBiomas Pampa initiative. Remote Sens. Appl. 2022, 28, 100834. [Google Scholar] [CrossRef] [Scilit]
- Rosa, M.R.; Brancalion, P.H.S.; Crouzeilles, R.; Tambosi, L.R.; Piffer, P.R.; Lenti, F.E.B.; Hirota, M.; Santiami, E.; Metzger, J.P. Hidden destruction of older forests threatens Brazil’s Atlantic Forest and challenges restoration programs. Sci. Adv. 2021, 7, eabc4547. [Google Scholar] [CrossRef] [Scilit] [PubMed]
- Dos Santos, C.O.; Mesquita, V.V.; Parente, L.L.; de Siqueira Pinto, A.; Ferreira, L.G. Assessing the Wall-to-Wall Spatial and Qualitative Dynamics of the Brazilian Pasturelands 2010–2018, Based on the Analysis of the Landsat Data Archive. Remote Sens. 2022, 14, 1024. [Google Scholar] [CrossRef] [Scilit]
- da Silveira, J.G.; Neto, S.N.d.O.; Canto, A.C.B.D.; Leite, F.F.G.D.; Cordeiro, F.R.; Assad, L.T.; Silva, G.C.C.; Marques, R.d.O.; Dalarme, M.S.L.; Ferreira, I.G.M.; et al. Land Use, Land Cover Change and Sustainable Intensification of Agriculture and Livestock in the Amazon and the Atlantic Forest in Brazil. Sustainability 2022, 14, 2563. [Google Scholar] [CrossRef] [Scilit]
- Caballero, C.B.; Biggs, T.W.; Vergopolan, N.; West, T.A.P.; Ruhoff, A. Transformation of Brazil’s biomes: The dynamics and fate of agriculture and pasture expansion into native vegetation. Sci. Total Environ. 2023, 896, 166323. [Google Scholar] [CrossRef] [Scilit] [PubMed]
- Rocha, W.J.S.F.; Vasconcelos, R.N.; Costa, D.P.; Duverger, S.G.; Lobão, J.S.B.; Souza, D.T.M.; Herrmann, S.M.; Santos, N.A.; Rocha, R.O.F.; Ferreira-Ferreira, J.; et al. Towards Uncovering Three Decades of LULC in the Brazilian Drylands: Caatinga Biome Dynamics (1985–2019). Land 2024, 13, 1250. [Google Scholar] [CrossRef] [Scilit]
- Morton, D.C.; DeFries, R.S.; Shimabukuro, Y.E.; Anderson, L.O.; Arai, E.; Espirito-Santo, F.d.B.; Freitas, R.; Morisette, J. Cropland expansion changes deforestation dynamics in the southern Brazilian Amazon. Proc. Natl. Acad. Sci. USA 2006, 103, 14637–14641. [Google Scholar] [CrossRef] [Scilit] [PubMed]
- Spera, S.A.; Galford, G.L.; Coe, M.T.; Macedo, M.N.; Mustard, J.F. Land-use change affects water recycling in Brazil’s last agricultural frontier. Glob. Change Biol. 2016, 22, 3405–3413. [Google Scholar] [CrossRef] [Scilit] [PubMed]
- Beuchle, R.; Grecchi, R.C.; Shimabukuro, Y.E.; Seliger, R.; Eva, H.D.; Sano, E.; Achard, F. Land cover changes in the Brazilian Cerrado and Caatinga biomes from 1990 to 2010 based on a systematic remote sensing sampling approach. Appl. Geogr. 2015, 58, 116–127. [Google Scholar] [CrossRef] [Scilit]
- Bilintoh, T.M.; Pontius, R.G.; Zhang, A. Methods to compare sites concerning a category’s change during various time intervals. GIScience Remote Sens. 2024, 61, 2409484. [Google Scholar] [CrossRef] [Scilit]
- Bilintoh, T.M.; Pontius, R.G.; Oliveira, G.L.T.; Shimbo, J. A GIS Method to Analyze Trajectories of Gross Changes Through Multiple Temporal Resolutions With an Application to Brazilian Soybean Cultivation. Trans. GIS 2025, 29, e70169. [Google Scholar] [CrossRef] [Scilit]
- Pontius, R.G.; Fonseca, A.V.G. A GIS Method to Summarize Changes Among Classes During a Time Series With an Application to Land Cover in Western Bahia, Brazil. Trans. GIS 2025, 29, e70136. [Google Scholar] [CrossRef] [Scilit]
- Breiman, L. Random Forests. Mach. Learn 2001, 45, 5–32. [Google Scholar] [CrossRef] [Scilit]
- Ronneberger, O.; Fischer, P.; Brox, T. U-Net: Convolutional Networks for Biomedical Image Segmentation. arXiv 2015, arXiv:1505.04597. [Google Scholar]
- MapBiomas. MapBiomas General ‘Handbook’ Algorithm Theoretical Basis Document (ATBD) Collection 10. 2025. Available online: https://data.mapbiomas.org/dataset.xhtml?persistentId=doi:10.58053/MapBiomas/2XSLB3 (accessed on 29 September 2026).
- MapBiomas. Accuracy Assessment—Appendix 15 Collection 10. 2025. Available online: https://data.mapbiomas.org/dataset.xhtml?persistentId=doi:10.58053/MapBiomas/WU9XMG (accessed on 29 September 2026).
- Assunção, J.; Gandour, C.; Rocha, R. Deforestation slowdown in the Brazilian Amazon: Prices or policies? Environ. Dev. Econ. 2015, 20, 697–722. [Google Scholar] [CrossRef] [Scilit]
- Nepstad, D.; McGrath, D.; Stickler, C.; Alencar, A.; Azevedo, A.; Swette, B.; Bezerra, T.; DiGiano, M.; Shimada, J.; da Motta, R.S.; et al. Slowing Amazon deforestation through public policy and interventions in beef and soy supply chains. Science 2014, 344, 1118–1123. [Google Scholar] [CrossRef] [Scilit] [PubMed]
- INPE—Instituto Nacional de Pesquisas Espaciais. PRODES Cerrado: Annual Rates of Native Vegetation Suppression in the Cerrado Biome; TerraBrasilis Geographic Data Platform: São José dos Campos, Brazil, 2026. [Google Scholar]
- Amaral, S.; Metzger, J.P.; Rosa, M.; Adorno, B.V.; Gonçalves, G.C.; Guedes Pinto, L.F. Alarming patterns of mature forest loss in the Brazilian Atlantic Forest. Nat. Sustain 2025, 8, 256–264. [Google Scholar] [CrossRef] [Scilit]
- Silva Junior, C.H.L.; Pessôa, A.C.M.; Carvalho, N.S.; Reis, J.B.C.; Anderson, L.O.; Aragão, L.E.O.C. The Brazilian Amazon deforestation rate in 2020 is the greatest of the decade. Nat. Ecol. Evol. 2021, 5, 144–145. [Google Scholar] [CrossRef] [Scilit] [PubMed]
- Souza, C.M.; Oliveira, L.A.; de Souza Filho, J.S.; Ferreira, B.G.; Fonseca, A.V.; Siqueira, J.V. Landsat sub-pixel land cover dynamics in the Brazilian Amazon. Front. For. Glob. Change 2023, 6, 1294552. [Google Scholar] [CrossRef] [Scilit]
- INPE. Prodes (Desmatamento). Available online: https://terrabrasilis.dpi.inpe.br/app/dashboard/deforestation/biomes/amazon/increments (accessed on 15 October 2025).
- Pereira, C.C.; Fernandes, S.; Kenedy-Siqueira, W.; Negreiros, D.; Fernandes, G.W.; Fearnside, P.M. Brazil’s Cerrado cannot be a sacrifice zone for the Amazon: Financial assistance and stricter laws are needed. BioScience 2024, 74, 584–585. [Google Scholar] [CrossRef] [Scilit]
- Nunes da Cunha, C.; Barbosa da Silva, F.H.; da Costa, C.P.; Junk, W.J. Woody Encroachment and Its Control in Periodically Flooded Grasslands of the Pantanal, a Large Brazilian Wetland. In Flora and Vegetation of the Pantanal Wetland; Damasceno-Junior, G.A., Pott, A., Eds.; Springer: Berlin/Heidelberg, Germany, 2021; pp. 491–512. [Google Scholar] [CrossRef] [Scilit] [PubMed]
- Ivory, S.J.; McGlue, M.M.; Spera, S.; Silva, A.; Bergier, I. Vegetation, rainfall, and pulsing hydrology in the Pantanal, the world’s largest tropical wetland. Environ. Res. Lett. 2019, 14, 124017. [Google Scholar] [CrossRef] [Scilit]
- Marengo, J.A.; Cunha, A.P.; Cuartas, L.A.; Leal, K.R.D.; Broedel, E.; Seluchi, M.E.; Michelin, C.M.; Baião, C.F.D.P.; Angulo, E.C.; Almeida, E.K.; et al. Extreme drought in the Brazilian Pantanal in 2019–2020: Characterization, causes, and impacts. Front. Water 2021, 3, 639204. [Google Scholar] [CrossRef] [Scilit]
- Garcia, L.C.; Szabo, J.K.; Roque, F.d.O.; Pereira, A.d.M.M.; da Cunha, C.N.; Damasceno-Júnior, G.A.; Morato, R.G.; Tomas, W.M.; Libonati, R.; Ribeiro, D.B. Record-breaking wildfires in the world’s largest continuous tropical wetland: Integrative fire management is urgently needed for both biodiversity and humans. J. Environ. Manag. 2021, 293, 112870. [Google Scholar] [CrossRef] [Scilit] [PubMed]
- Alencar, A.; Arruda, V.; Martenexen, F.; Reis Rosa, E.; Vélez-Martin, E.; Guedes Pinto, L.; Galano Duverger, S.; Monteiro, N.; Silva, W. Fogo no Brasil em 2024: O Retrato Fundiário da Área Queimada nos Biomas. 2024. Available online: https://ipam.org.br/wp-content/uploads/2024/09/NT_Fogo_Fundiario_PT_v01.pdf (accessed on 15 October 2025).
- Durigan, G.; Munhoz, C.B.; Zakia, M.J.B.; Oliveira, R.S.; Pilon, N.A.; Valle, R.S.T.D.; Walter, B.M.; Honda, E.A.; Pott, A. Cerrado wetlands: Multiple ecosystems deserving legal protection as a unique and irreplaceable treasure. Perspect. Ecol. Conserv. 2022, 20, 185–196. [Google Scholar] [CrossRef] [Scilit]
- Barros-Rosa, L.; Lima, L.B.; Penha, J.; Couto, E.G.; Dias, A.P.; Johnson, M.; Lima-Junior, D.P. Policy-driven wetland degradation by artificial drainages in Brazil. Environ. Res. Lett. 2026, 21, 134004. [Google Scholar] [CrossRef] [Scilit]
- Espinoza, J.-C.; Jimenez, J.C.; Marengo, J.A.; Schongart, J.; Ronchail, J.; Lavado-Casimiro, W.; Ribeiro, J.V.M. The new record of drought and warmth in the Amazon in 2023 related to regional and global climatic features. Sci. Rep. 2024, 14, 8107. [Google Scholar] [CrossRef] [Scilit] [PubMed]
- Souza, C.M.; Marengo, J.; Ferreira, B.; Ribeiro, J.; Schirmbeck, L.W.; Schirmbeck, J.; Hirye, M.; Cunha, A.; Wiederhecker, H.C.; Latuf, M.O. Amazon severe drought in 2023 triggered surface water loss. Environ. Res. Clim. 2024, 3, 041002. [Google Scholar] [CrossRef] [Scilit]
- IBGE—Instituto Brasileiro de Geografia e Estatística. Produção Agrícola Municipal 2024 (PAM 2024); IBGE—Instituto Brasileiro de Geografia e Estatística: Rio de Janeiro, Brazil, 2024.
- Roberti, D.R.; Mergen, A.; Gotuzzo, R.A.; Veeck, G.P.; Bremm, T.; Marin, L.; de Quadros, F.L.F.; Jacques, R.J.S. Sustainability in Natural Grassland in the Brazilian Pampa Biome: Livestock Production with CO2 Absorption. Sustainability 2024, 16, 3672. [Google Scholar] [CrossRef] [Scilit]
- Pereira, O.; Bernasconi, P. Brazilian Soy Exports and Deforestation. Trase. Available online: https://trase.earth/insights/brazilian-soy-exports-and-deforestation (accessed on 16 October 2025).
- Zalles, V.; Hansen, M.C.; Potapov, P.V.; Stehman, S.V.; Tyukavina, A.; Pickens, A.; Song, X.-P.; Adusei, B.; Okpa, C.; Aguilar, R.; et al. Near doubling of Brazil’s intensive row crop area since 2000. Proc. Natl. Acad. Sci. USA 2019, 116, 428–435. [Google Scholar] [CrossRef] [Scilit] [PubMed]
- Song, X.-P.; Hansen, M.C.; Potapov, P.; Adusei, B.; Pickering, J.; Adami, M.; Lima, A.; Zalles, V.; Stehman, S.V.; Di Bella, C.M.; et al. Massive soybean expansion in South America since 2000 and implications for conservation. Nat. Sustain 2021, 4, 784–792. [Google Scholar] [CrossRef] [Scilit] [PubMed]
- Moffette, F.; Gibbs, H.K. Agricultural Displacement and Deforestation Leakage in the Brazilian Legal Amazon. Land Econ. 2021, 97, 155–179. [Google Scholar] [CrossRef] [Scilit]
- Matos, A.P.; Hunter, M.; Pontius, R.G.; Baumann, L.R.; Parente, L.L.; Ferreira, L.G. Accounting for alternation in temporal quality analysis in MapBiomas Brazil. Int. J. Digit Earth 2025, 18, 2528604. [Google Scholar] [CrossRef] [Scilit]
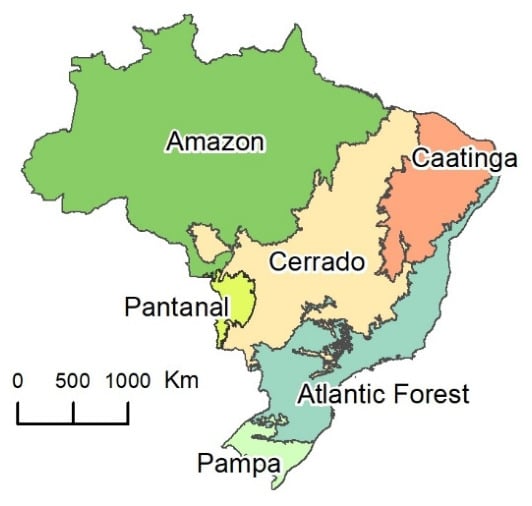
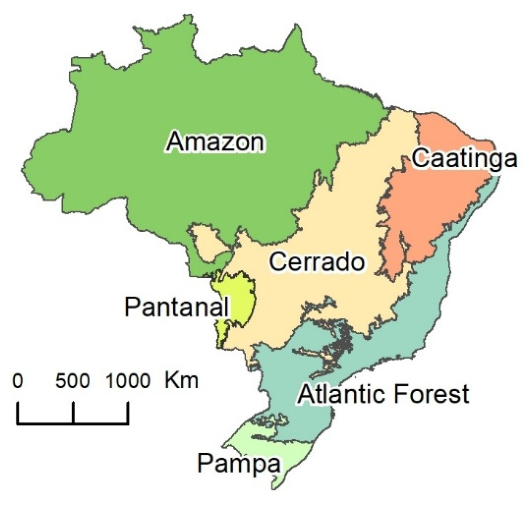
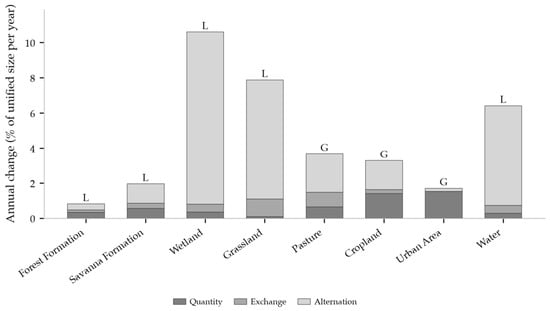
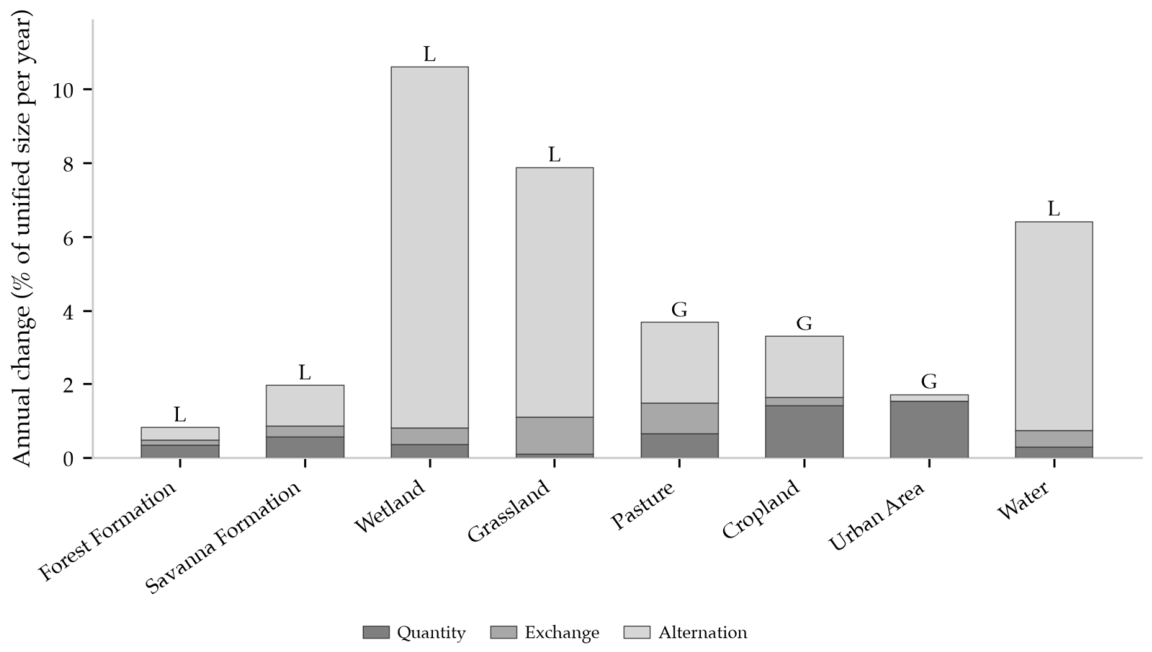
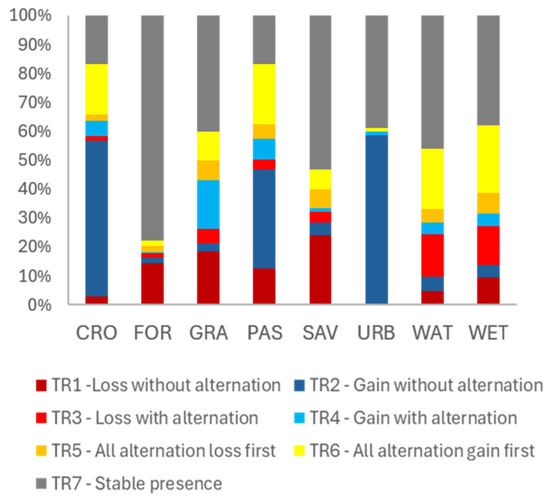
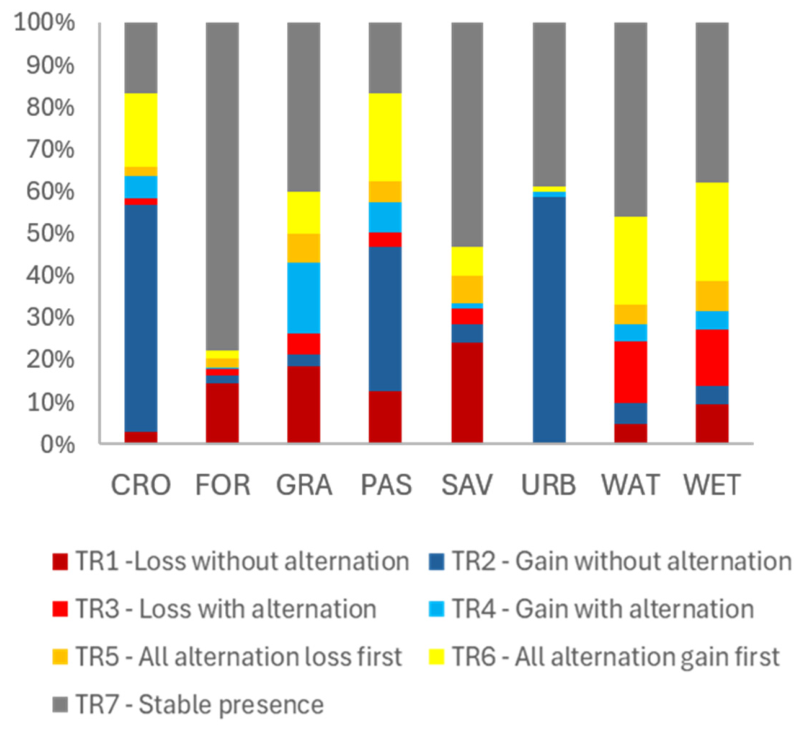
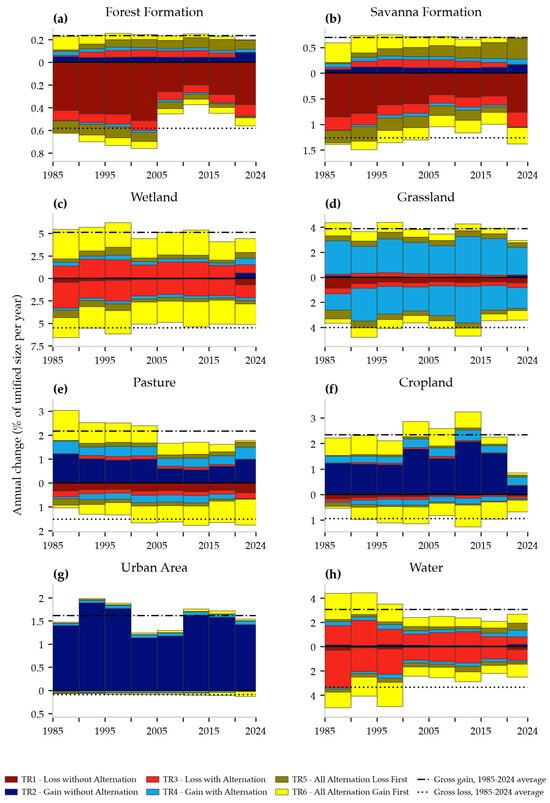
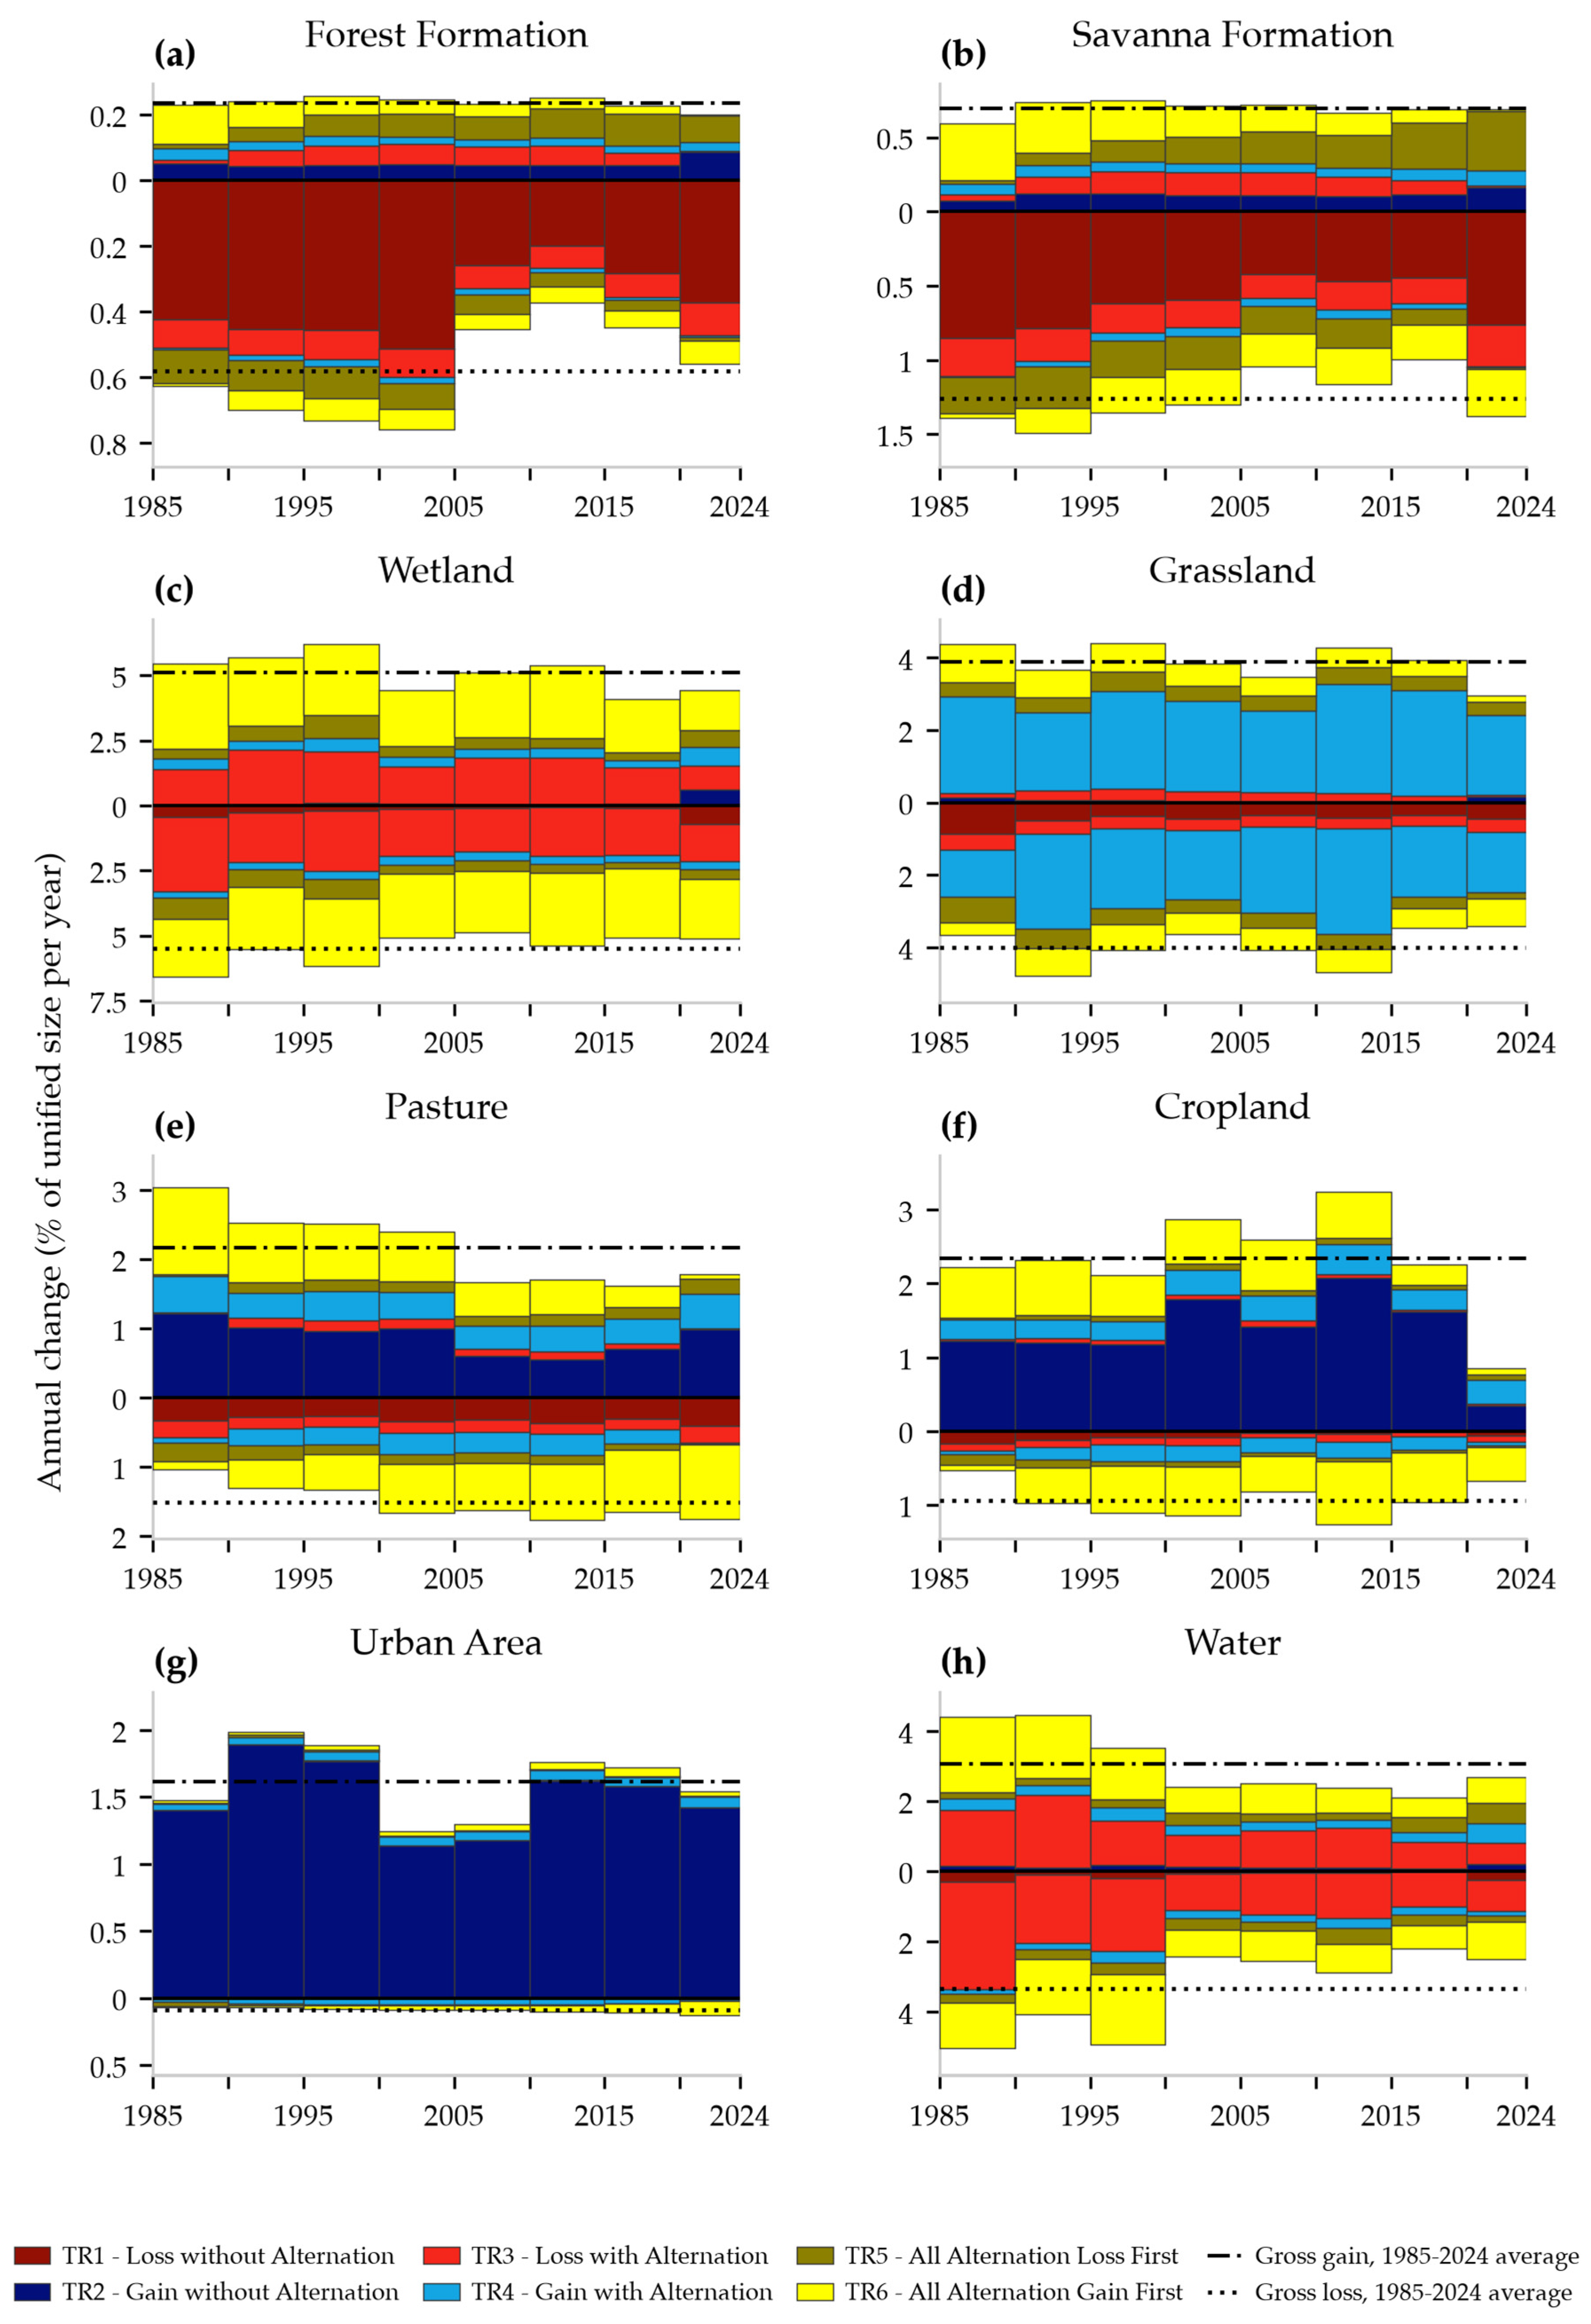
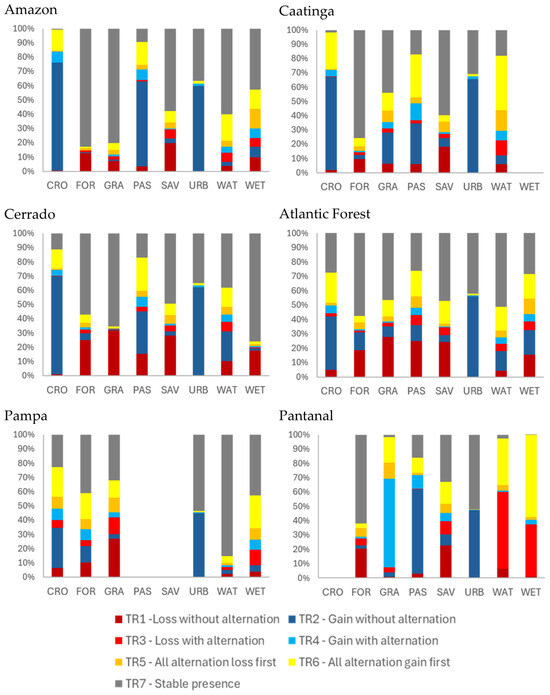
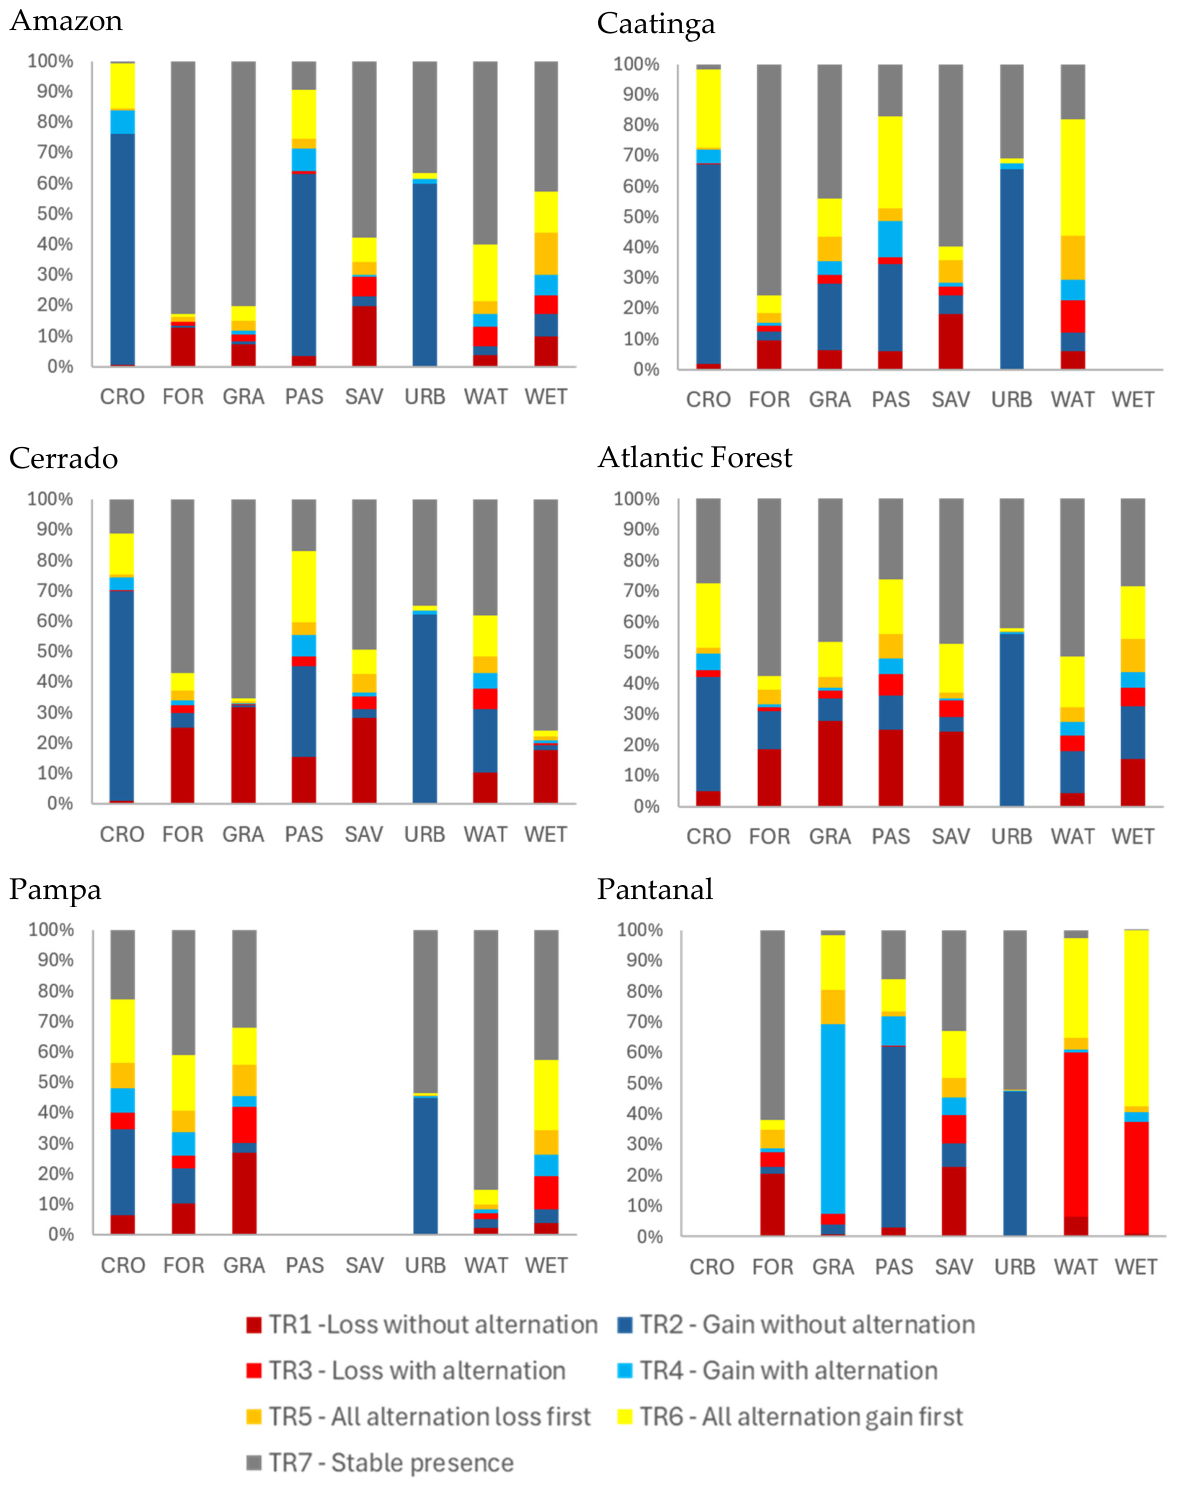
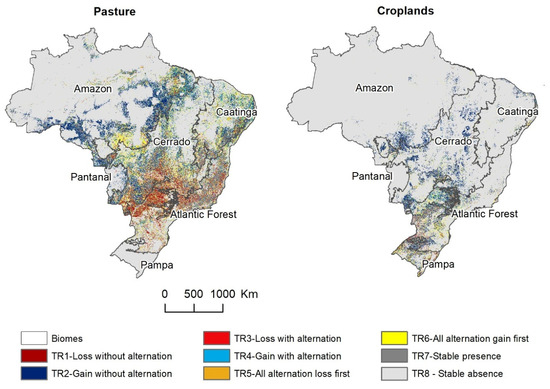
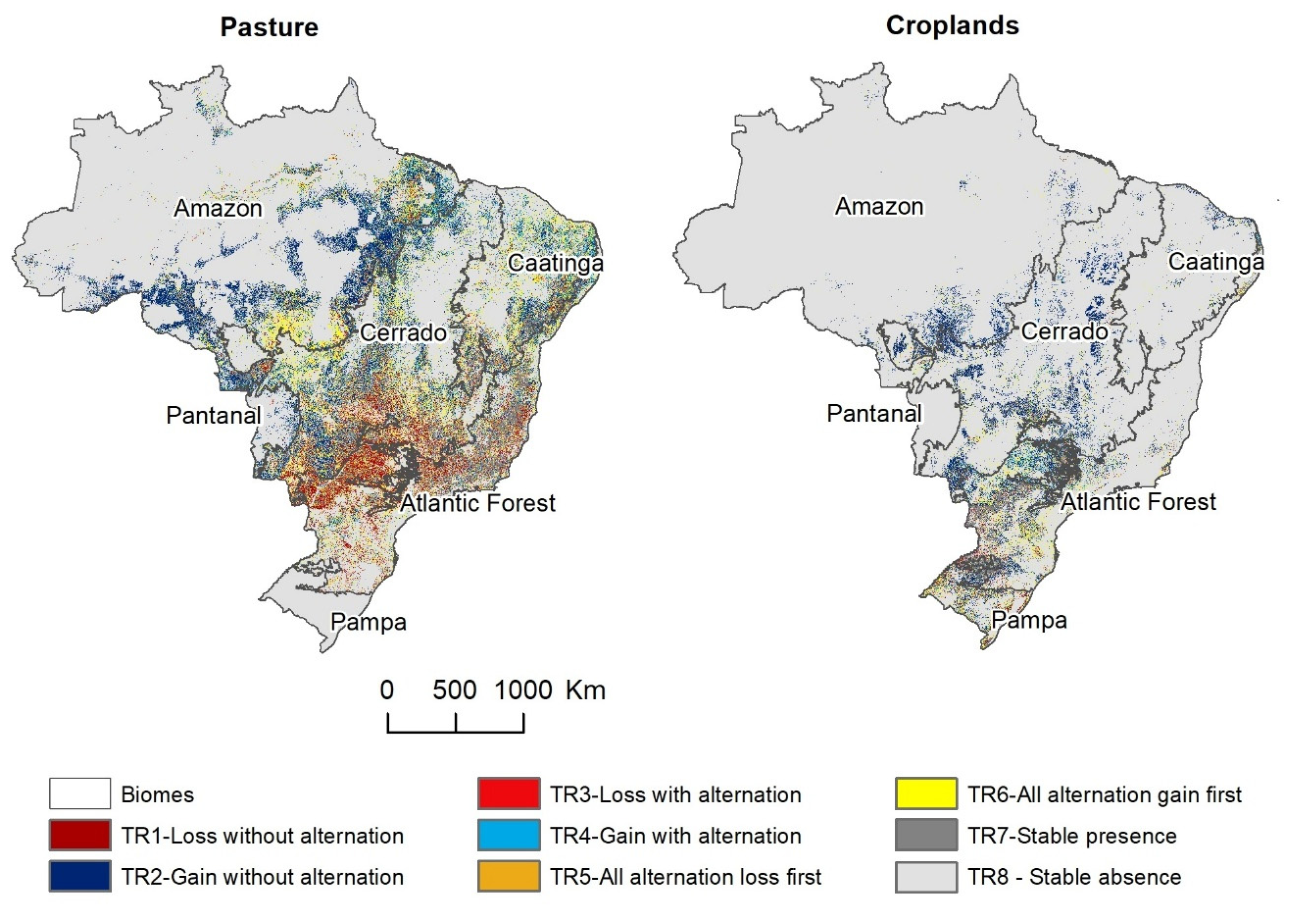
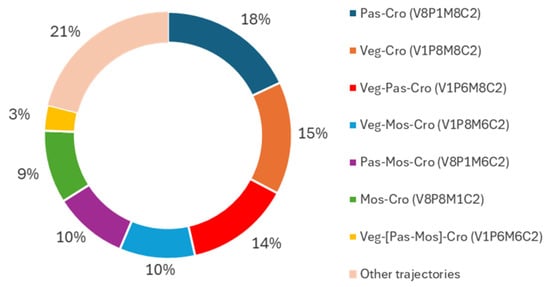
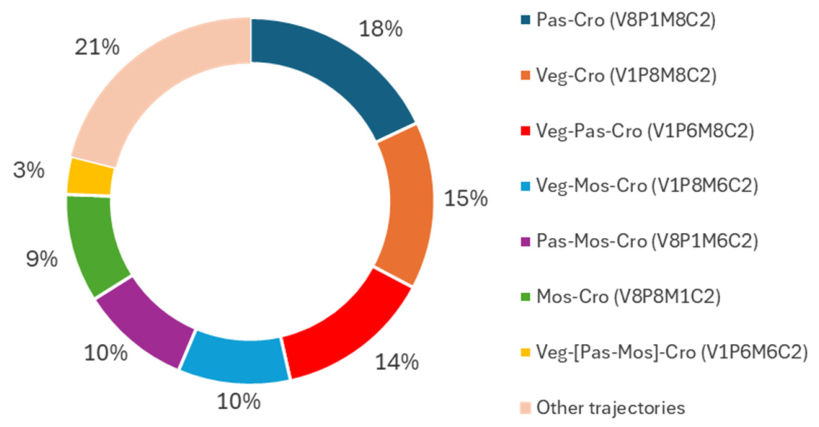
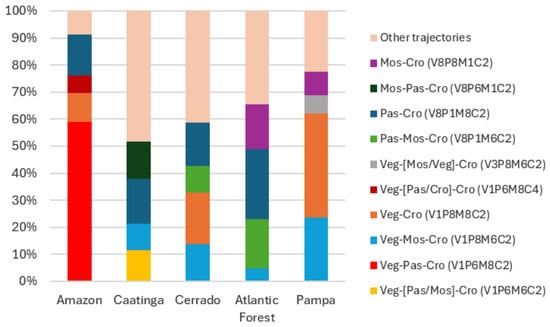
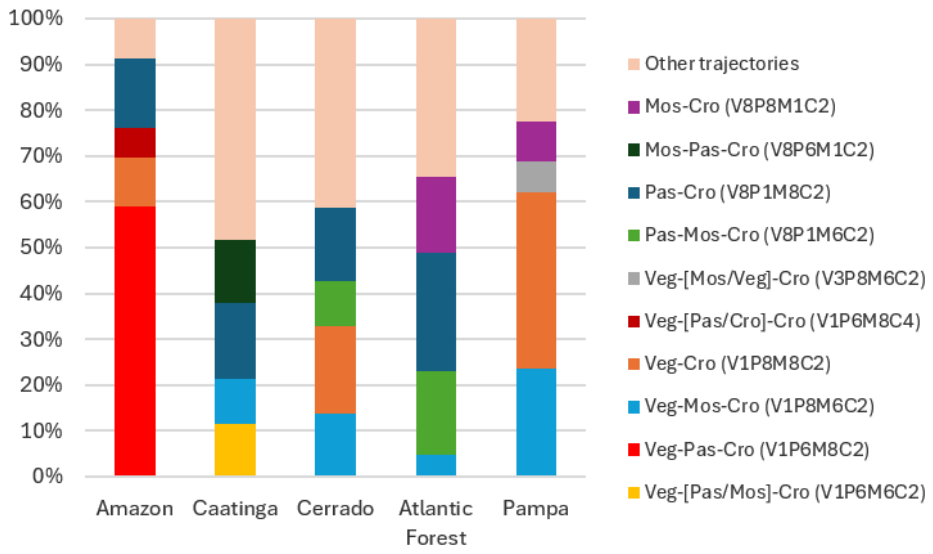
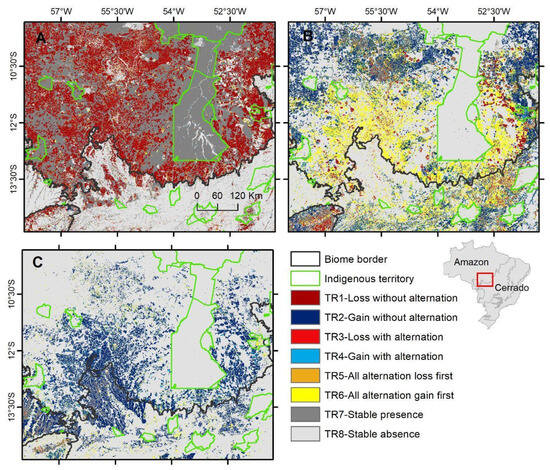
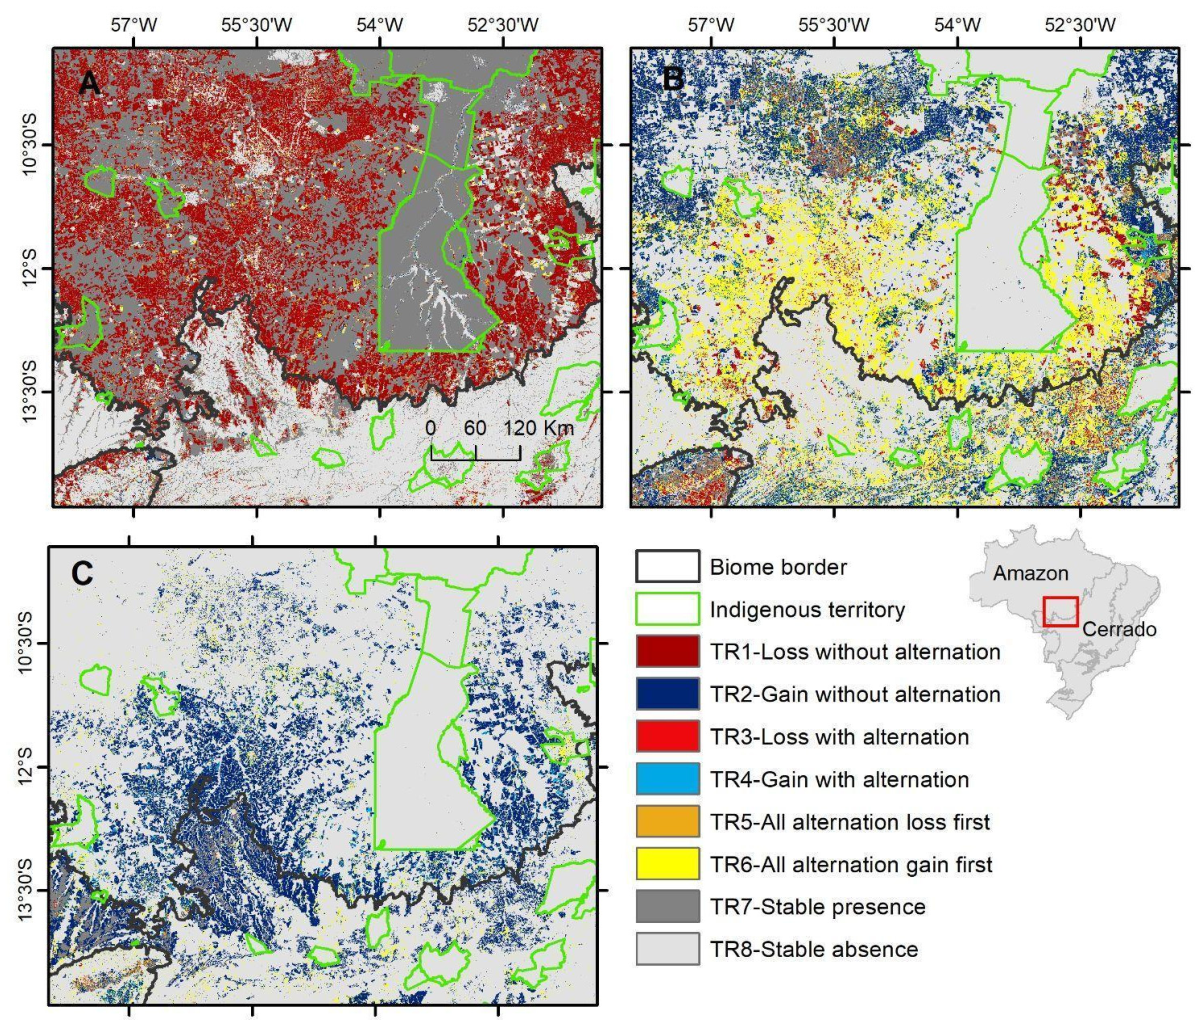
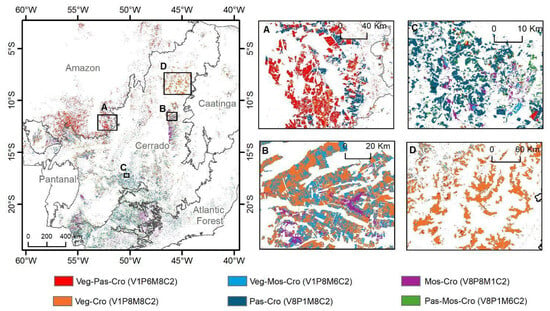
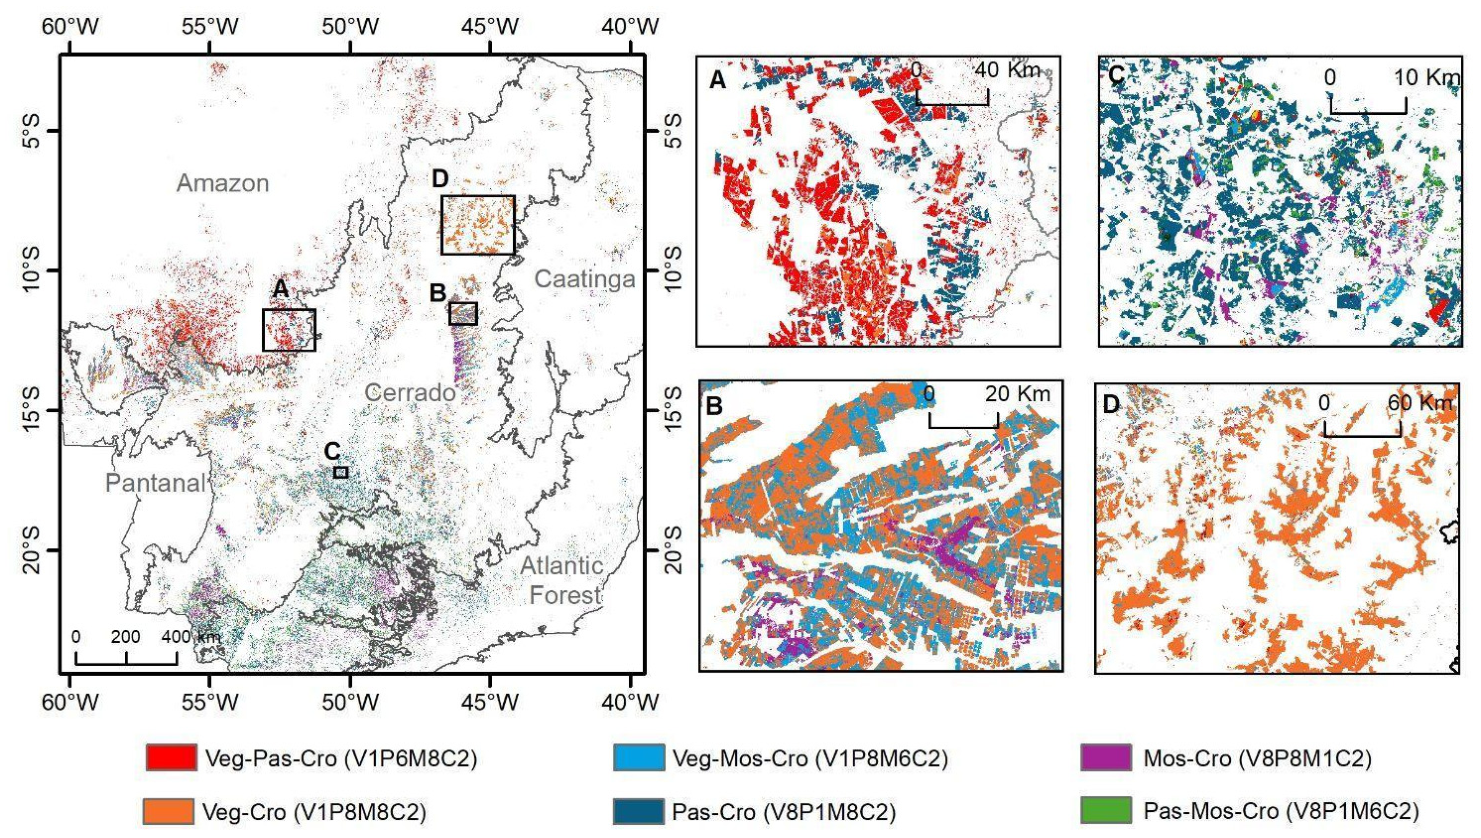

Disclaimer/Publisher’s Note: The statements, opinions and data contained in all publications are solely those of the individual author(s) and contributor(s) and not of MDPI and/or the editor(s). MDPI and/or the editor(s) disclaim responsibility for any injury to people or property resulting from any ideas, methods, instructions or products referred to in the content. |
© 2026 by the authors. Licensee MDPI, Basel, Switzerland. This article is an open access article distributed under the terms and conditions of the Creative Commons Attribution (CC BY) license.