


Abstract
As a typical nature-based solution, urban parks play an important role in mitigating urban heat island effects. Although previous studies highlighted the complex impacts of landscape morphology on urban park cooling effects (PCE), the interactions and impact thresholds between specific features on PCE remain insufficiently explored across different scales. Here, taking 119 parks in Wuhan, China, as examples, the PCE and their responses to landscape morphology were quantified across three scales, including 47 small, 41 medium, and 31 large parks. Results showed that 79.8% of parks (95) exhibited obvious cooling effects. From small to large parks, the largest park cooling distance (LPCD), area (LPCA), and intensity (LPCI), as well as the accumulative park cooling gradient (APCG) and intensity (APCI), showed upward trends, while largest park cooling efficiency (LPCE) declined. Scale-dependent differences in landscape morphology impacting PCE were evident. In small and medium parks, LPCD and LPCA were mainly shaped by the surrounding environment, while LPCI and LPCE were primarily determined by internal morphology. In large parks, LPCA, APCI, and APCG were impacted by the surrounding environment, while LPCD and LPCI were dominated by internal morphology. Moreover, interactions between specific landscape morphology features significantly enhanced the model explanatory power and exhibited clear impact thresholds on PCE. Overall, this study enhances our understanding of cross-scale cooling mechanisms of urban parks and offers practical implications for heat-governance-oriented park planning.
1. Introduction
Rapid global urbanization and industrialization have increased land-surface energy absorption and anthropogenic heat emissions, making urban thermal challenges one of the most serious environmental issues [1]. Excessive heat stress poses severe threats to urban economies and public health [2]. According to the Lancet Countdown 2025 report, rising global temperatures cause approximately one death every minute from heat-related illnesses, with an annual average of 546,000 deaths from 2012 to 2021 [3]. In 2022, China experienced 21 days of extreme heat exposure (>35 °C), resulting in more than 50,000 heat-related deaths and labor productivity losses exceeding $310 billion [4]. July 2024 became the hottest month on record, with the global mean surface temperature exceeding the 1850–1900 average by more than 1.5 °C [5]. The urban heat island effects (UHI) has emerged as a key issue in tackling thermal challenges under rapid urbanization [6]. Therefore, identifying effective strategies to mitigate UHI and optimize residents’ thermal comfort has become a critical pathway toward achieving sustainable cities and communities [7].
Enhancing vegetation coverage and introducing water surfaces are widely acknowledged as effective nature-based solution (NBS) strategies to mitigate UHI in cities [8,9]. As a typical type of NBS, urban parks integrate vegetation and water elements and exhibit significant cooling effects, and are highly valued for their environmental friendliness and cost-effectiveness [6]. Vegetation in parks can greatly lower land-surface temperature (LST) and air temperature through shading and evapotranspiration [10], while water can store thermal energy and reflect solar radiation [11]. The combined mechanisms of vegetation and water make temperatures within urban parks significantly lower than that of the surrounding areas, forming a distinct urban cool island effect. Therefore, evaluating the urban park cooling effects (PCE) and revealing their underlying mechanisms has become an important issue for policymakers [12]. However, most existing studies have focused on macro scales of PCE, such as climatic zones, metropolitan areas, or entire city scales, implicitly assuming homogeneous cooling responses across park scales and thus providing generalized planning recommendations. In practice, park scale fundamentally constrains cooling intensity, spatial extent, and dominant biophysical processes, as parks of different sizes exhibit distinct cooling magnitudes and spatial ranges [6,13], such as small, medium, and large parks. Small parks tend to rely on localized shading and immediate surroundings, whereas large parks can generate broader cooling footprints and interact more strongly with surrounding urban fabrics, leading to scale-dependent cooling pathways and planning needs [6]. Ignoring scale differences may therefore obscure key cooling mechanisms and result in ineffective or even misleading design interventions. Revealing the multi-scale PCE is thus essential for advancing urban park planning and formulating targeted thermal management strategies.
Landscape morphology describes the spatial organization, form, and structural composition of urban landscapes during the process of urbanization [14]. By regulating the absorption, reflection, and emission of solar radiation within and around urban parks, landscape morphology exerts a significant influence on PCE [15]. Previous research has demonstrated that PCE depend on specific internal features within parks, such as park area, park shape, landscape composition, and landscape configuration [6,16]. For example, larger, more compact, and more complexly shaped parks usually exhibit stronger cooling effects [14]. However, analyses that focus solely on internal landscape morphology make it difficult to capture the spatial heterogeneity of PCE. In recent years, increasing attention has been paid to the role of three-dimensional features surrounding parks in shaping PCE, such as building density, building height, and sky visibility [17]. Nevertheless, most studies focused on single driving factors, ignoring the joint and interactive impacts of internal morphology and surrounding environment on multi-scale PCE mechanisms, especially from a multi-scale perspective. For example, in small urban parks, internal features such as vegetation density or canopy configuration may primarily regulate localized shading and near-surface cooling, while park shape or spatial continuity can exert a stronger influence on cooling intensity and spatial extent in large parks [13]. Similarly, the surrounding landscape characteristics, such as building density or sky view factor, may play a more dominant role in shaping cooling distance in small parks, while their influence may diminish or interact differently in larger parks [6]. This limitation would limit the development of robust theoretical foundation for multi-dimensional optimization strategies aimed to mitigate UHI [12]. Therefore, developing a multi-dimensional landscape morphology framework that integrates both internal morphology and surrounding environments of parks is important to comprehensively understand the driving mechanisms of PCE across different spatial scales.
Relationships between landscape morphology and PCE are complex and multi-dimensional. Traditional statistical methods, such as ordinary least squares regression (OLS) [18], correlation analysis [19], and multiple linear regression (MLS) [20], have been widely applied due to their simplicity and efficiency. However, their reliance on linear assumptions and normality constraints increases the multicollinearity risk among predictors and limits their ability to capture nonlinear responses [21]. Given the high robustness in handling nonlinear relationships, machine learning has been widely employed to analyze the impacts of landscape morphology on PCE, such as Random Forest (RF) regression, Elastic Network regression, and eXtreme Gradient Boosting (XGBoost) [21,22]. Although machine learning performs well in identifying the relative contributions of individual independent variables to a dependent variable, they are typical ‘black-box’ models that struggle to reveal the complex interactions [23,24]. Landscape morphology features often do not act independently; instead, cooling effects arise from interactions among internal and surrounding attributes. For example, park shape may interact with vegetation structure, while park size can jointly impact cooling intensity and spatial extent with surrounding building density [25]. Ignoring such interactions may obscure key cooling pathways and lead to incomplete or even misleading interpretations of dominant drivers. Fortunately, the Shapley Additive Explanation (SHAP) technique can reveal contributions of interpretable variables while explicitly capturing their interactions [26], thereby improving the transparency and interpretability of machine learning models. Moreover, SHAP-based dependence analyses enable the identification of impact thresholds, beyond which the marginal cooling benefits of specific landscape features may saturate or change direction [27]. Recognizing these thresholds is particularly important for urban planning, as it helps avoid inefficient design interventions and supports the formulation of cost-effective, evidence-based cooling strategies. Therefore, by combining machine learning and SHAP technology, this study systematically reveals the driving mechanism of landscape morphology on PCE across different scales, including relative contributions, interactions, and impact thresholds.
Wuhan, one of China’s well-known “furnace cities”, has long faced severe challenges in mitigating UHI. Here, taking 119 urban parks in Wuhan as an example, we aimed to reveal the driving mechanisms of landscape morphology on PCE across different scales, including 47 small, 41 medium, and 31 large parks, respectively. Firstly, by linking four maximum-impacted and two accumulative-impacted indicators, the spatial characteristics of PCE across different scales were quantified, including the largest park cooling distance (LPCD), the largest park cooling area (LPCA), the largest park cooling intensity (LPCI), the largest park cooling efficiency (LPCE), the accumulative park cooling gradient (APCG), and the accumulative park cooling intensity (APCI), respectively. Secondly, a comprehensive analytical framework was proposed to explain landscape morphology of urban parks, encompassing eleven internal morphology features and six surrounding environment features. Finally, by combining RF and SHAP, the driving mechanisms of landscape morphology on PCE across different scales were explored, including relative contributions, interactions, and impact thresholds. These findings provide a robust foundation and actionable insights for heat-focused urban park planning.
2. Materials and Methods
2.1. Study Area
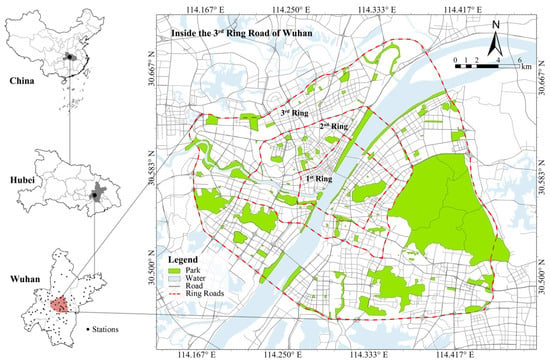
Wuhan, one of China’s largest megacities, is located in the middle reaches of the Yangtze River, which are featured by a humid subtropical monsoon climate (Figure 1). Over recent decades, Wuhan has experienced rapid urbanization and industrialization, resulting in increasingly severe thermal environment issues. For example, from June to September in 2024, Wuhan recorded more than 50 days with daily high temperatures ≥ 35 °C, ranking it one of the hottest cities in China. In 2023, the local government launched the Implementation Plan for the Special Urban Greening and Cooling Action in Wuhan, which aims to build 200 new parks over the next three years, covering approximately 3000 hm2. Mitigating UHI through urban parks has become a key strategy for thermal environment management in Wuhan [28,29]. As the most urbanized area of the city, the Third Ring Road zone hosts a large number of urban parks that have not experienced significant land cover changes in recent years. Thus, 119 urban parks were selected in this study (Figure 1). Referring to previous studies [6], these parks were classified by fixed area thresholds into 47 small parks (<10 hm2), 41 medium parks (10–50 hm2), and 31 large parks (>50 hm2).
Figure 1.
Geographical location of the 119 urban parks within the Third Ring Road of Wuhan, and that of 109 air automatic meteorological stations in Wuhan.
2.2. Data Sources
Area of interest (AOI) data in 2024 were used to identify the park boundaries, derived from the A’map (https://www.amap.com/). AOI provide geographic and spatial information about urban park boundary, which were further refined through manual visual interpretation based on Google Maps and Baidu Maps. To match the resolution of land-surface temperature data (30 m), all parks smaller than 0.09 hm2 were excluded from this analysis. Finally, 119 parks were identified within the Third Ring Road of Wuhan (Figure 1), ranging from 0.38 hm2 (Tugongshan Park) to 2393.24 hm2 (Donghu Tingtao Scenic Area), with an average size of 102.65 hm2. Referring to previous studies [6], these parks were further classified by fixed area thresholds into three scales, including 47 small parks (<10 hm2), 41 medium parks (10–50 hm2), and 31 large parks (>50 hm2).
Landsat 9 TIRS images, together with data from Wuhan’s automatic meteorological stations, were used to assess PCE. The Landsat 9 TIRS images on 5 July 2024 with a local time of 10:56 were sourced from the USGS (https://earthexplorer.usgs.gov/). LST was retrieved from the Landsat 9 TIRS Band 10 using the single-window algorithm [30]. Although LST is a key indicator for assessing PCE [31,32], its relationship with local air temperature still requires validation. Hourly air temperature data at local 11:00 from 109 automatic meteorological stations in Wuhan were obtained from the Resources and Environmental Science Data Platform (https://www.resdc.cn/Default.aspx). Linear regression between LST and air temperature yielded an R2 of 0.75, indicating that LST is a reliable proxy for air temperature.
The Landsat 9 OLI imageries and building vector data were used to characterize landscape morphology to quantify the driving mechanisms of PCE across different scales. Based on Landsat 9 OLI imageries and the RF classifier, three land use and land cover (LULC) types were mapped to calculate the internal morphology of urban parks, including water, vegetation, and impervious surfaces, achieving an overall classification accuracy of 88.72%. In addition, Landsat 9 OLI imagery was also used to derive the Normalized Difference Vegetation Index (NDVI) and surface radiation (SR) to characterize vegetation growth status and surface reflectance properties of urban parks. Building vector data of 2024, provided by A’map, was used to characterize surrounding environment features around urban parks, such as building height (BH) and building floor area ratio (FAR).
2.3. Methods
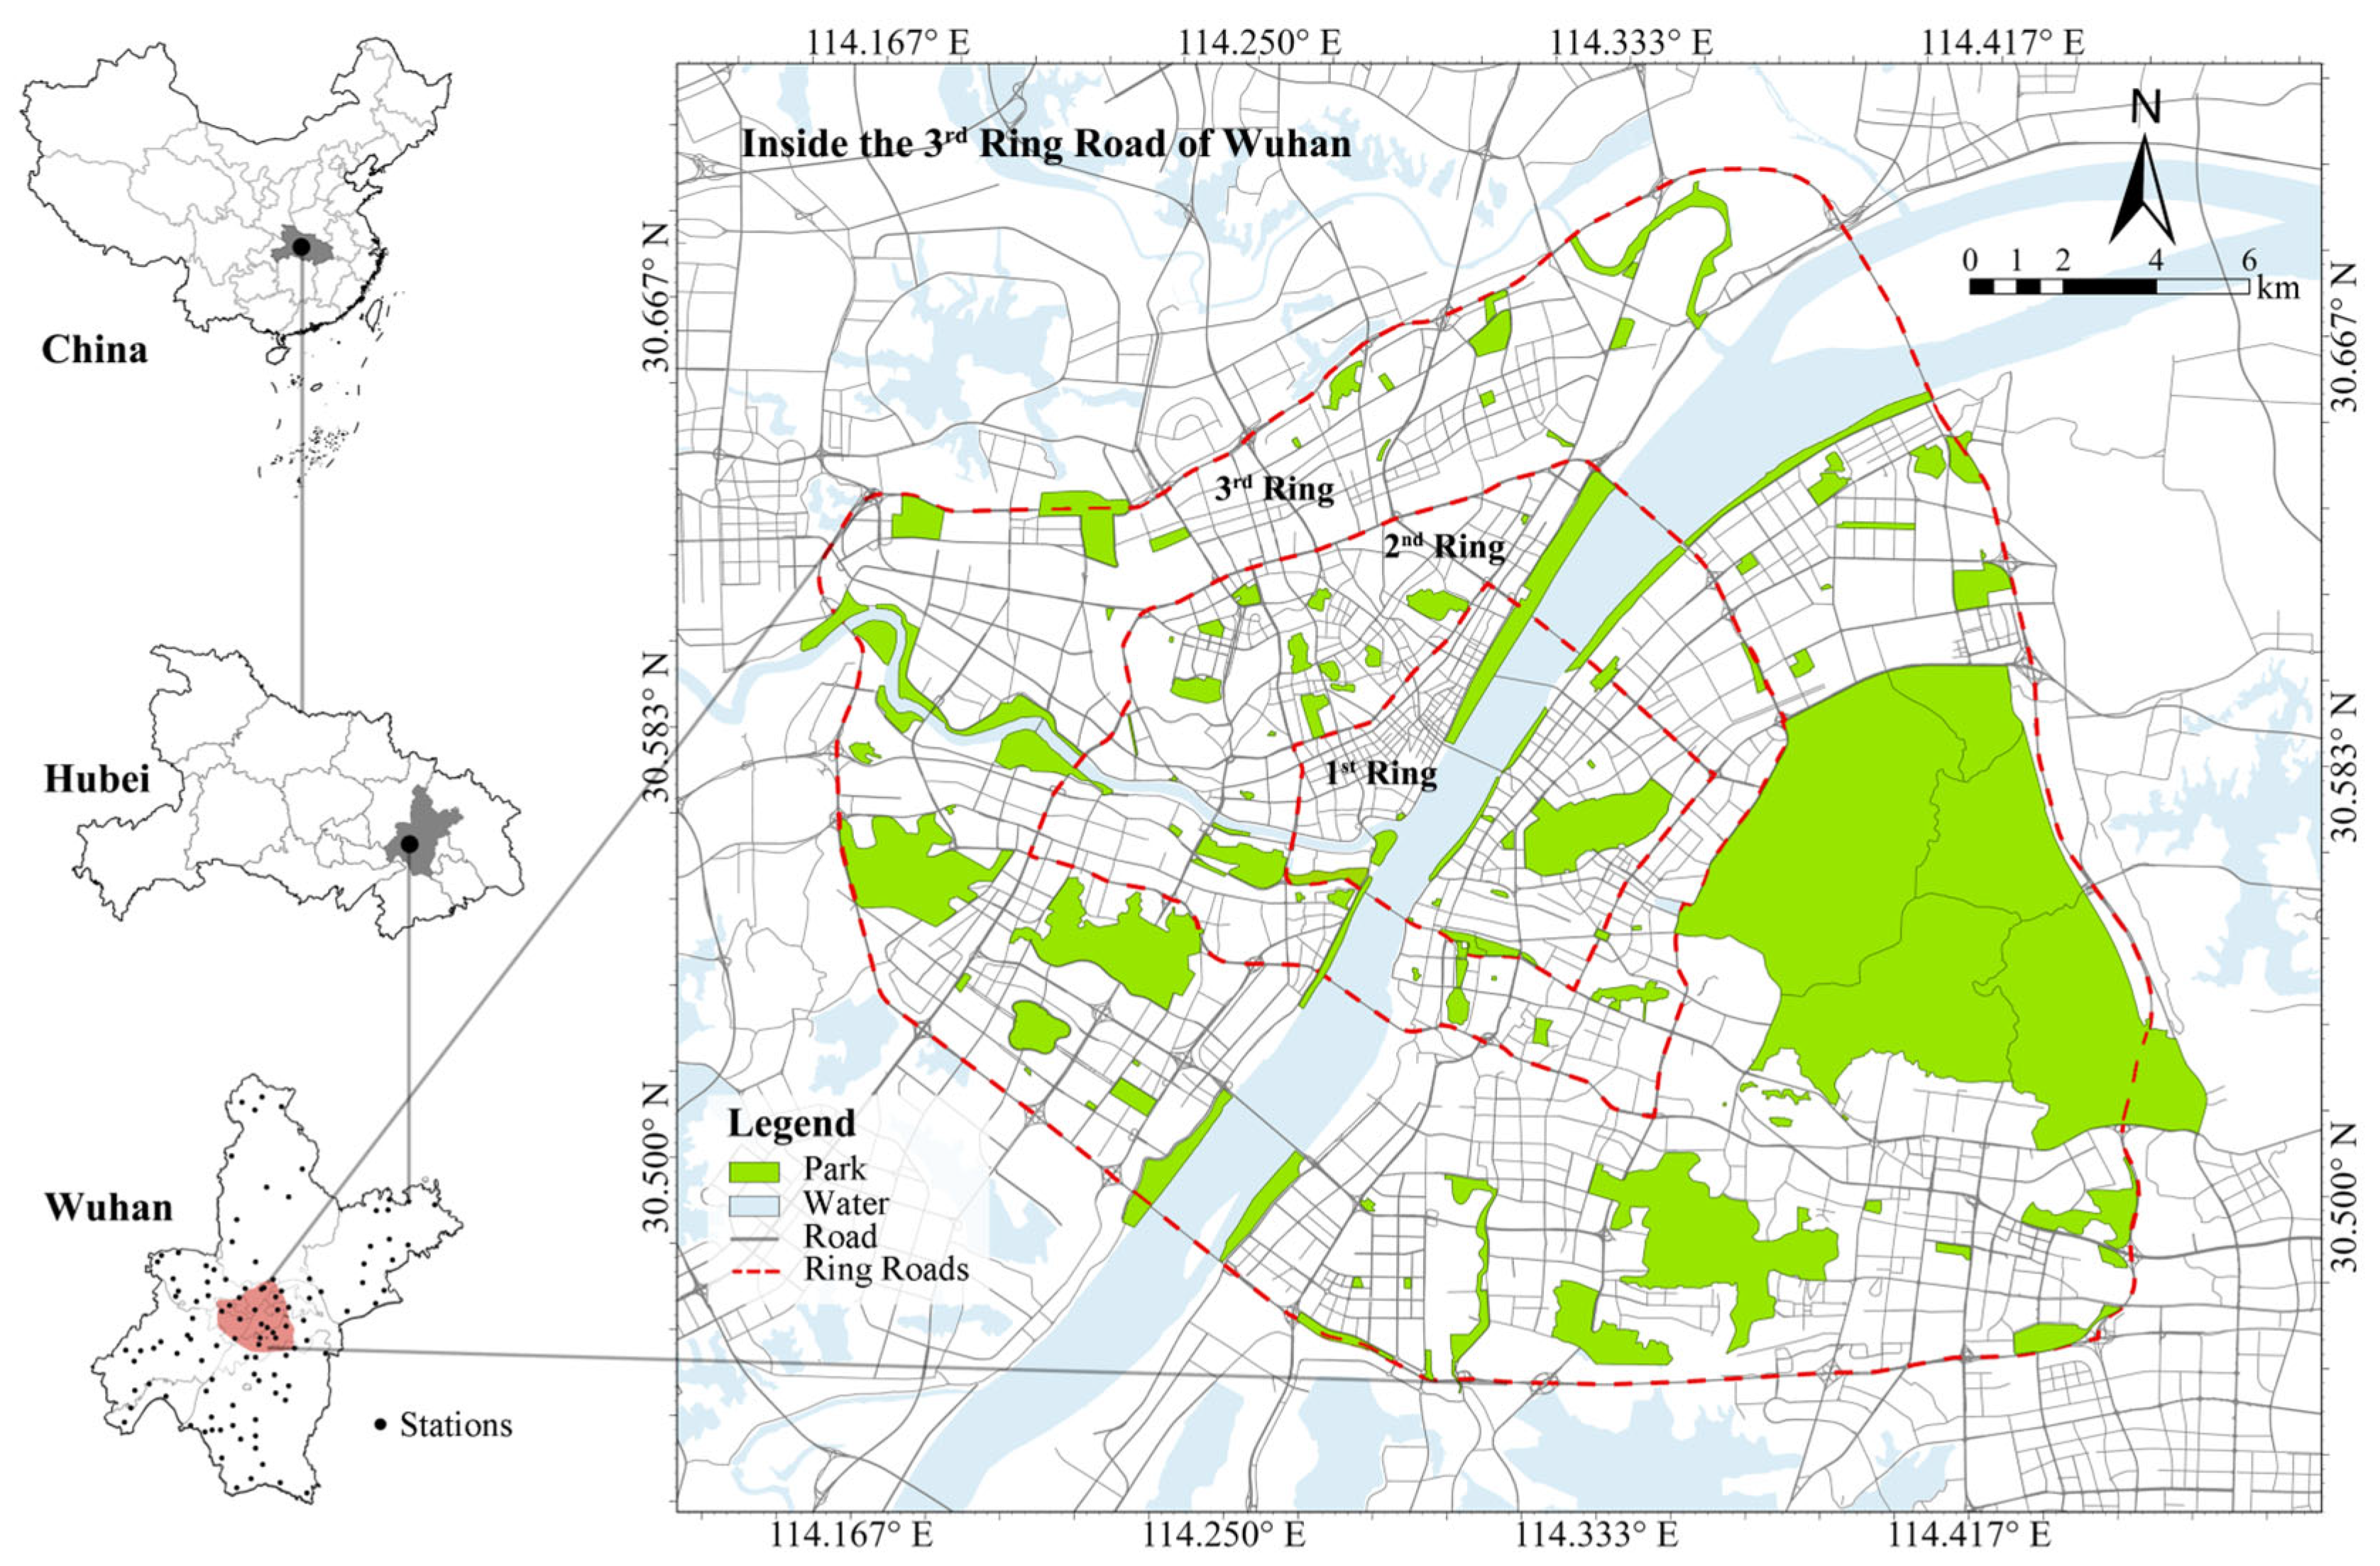
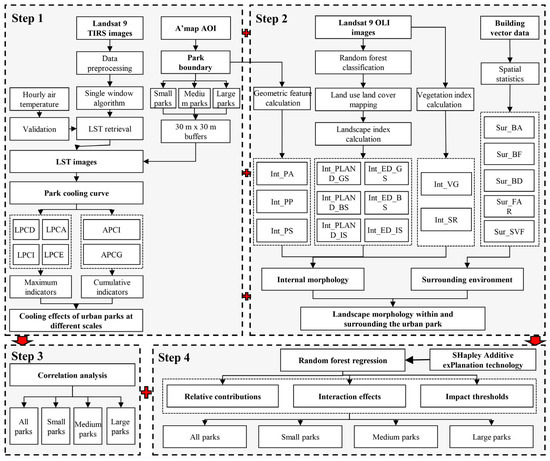
A conceptual framework was proposed to reveal the multi-scale impacts of landscape morphology on PCE (Figure 2), including four major steps: Firstly, based on the Landsat TIRS images and A’map AOI, six cooling indicators were quantified to assess the cooling effects of urban parks at different scales, including LPCD, LPCA, LPCI, LPCE, APCI, and APCG, respectively. Secondly, based on the park boundary, Landsat 9 OLI images, and building vector data, a framework of landscape morphology was proposed in this study, including 11 internal morphology features and 6 surrounding environment features. Thirdly, based on the spearman’s non-parametric correlation analysis, the correlation relationships between landscape morphology and the six cooling indicators at different scales. Finally, based on RF regression and SHAP technology, the driving mechanisms of landscape morphology on urban park cooling effects were revealed at different scales, including relative contributions, interactions, and impact thresholds, respectively.
Figure 2.
A conceptual framework of this study.
2.3.1. Calculation of PCE
Four maximum-impacted and two cumulative-impacted indicators were selected to quantify PCE, including LPCD, LPCA, LPCI, LPCE, APCI, and APCG [17,33]. To match the resolution of LST images (30 m), 30 buffer zones (each 30 m in width) were generated outward from each park boundary. The average LST within each buffer ring was then calculated for each park, and a cubic polynomial model was fitted to reveal the relationship between LST and buffer distance from the urban park boundary [34] (Equation (1)):
where is the distance from the park boundary to the buffer ring and is the average LST within that buffer ring.
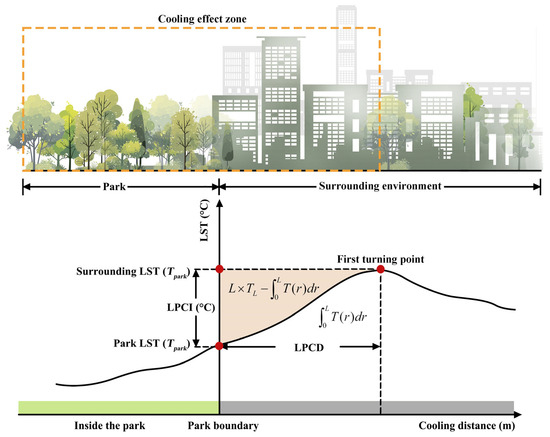
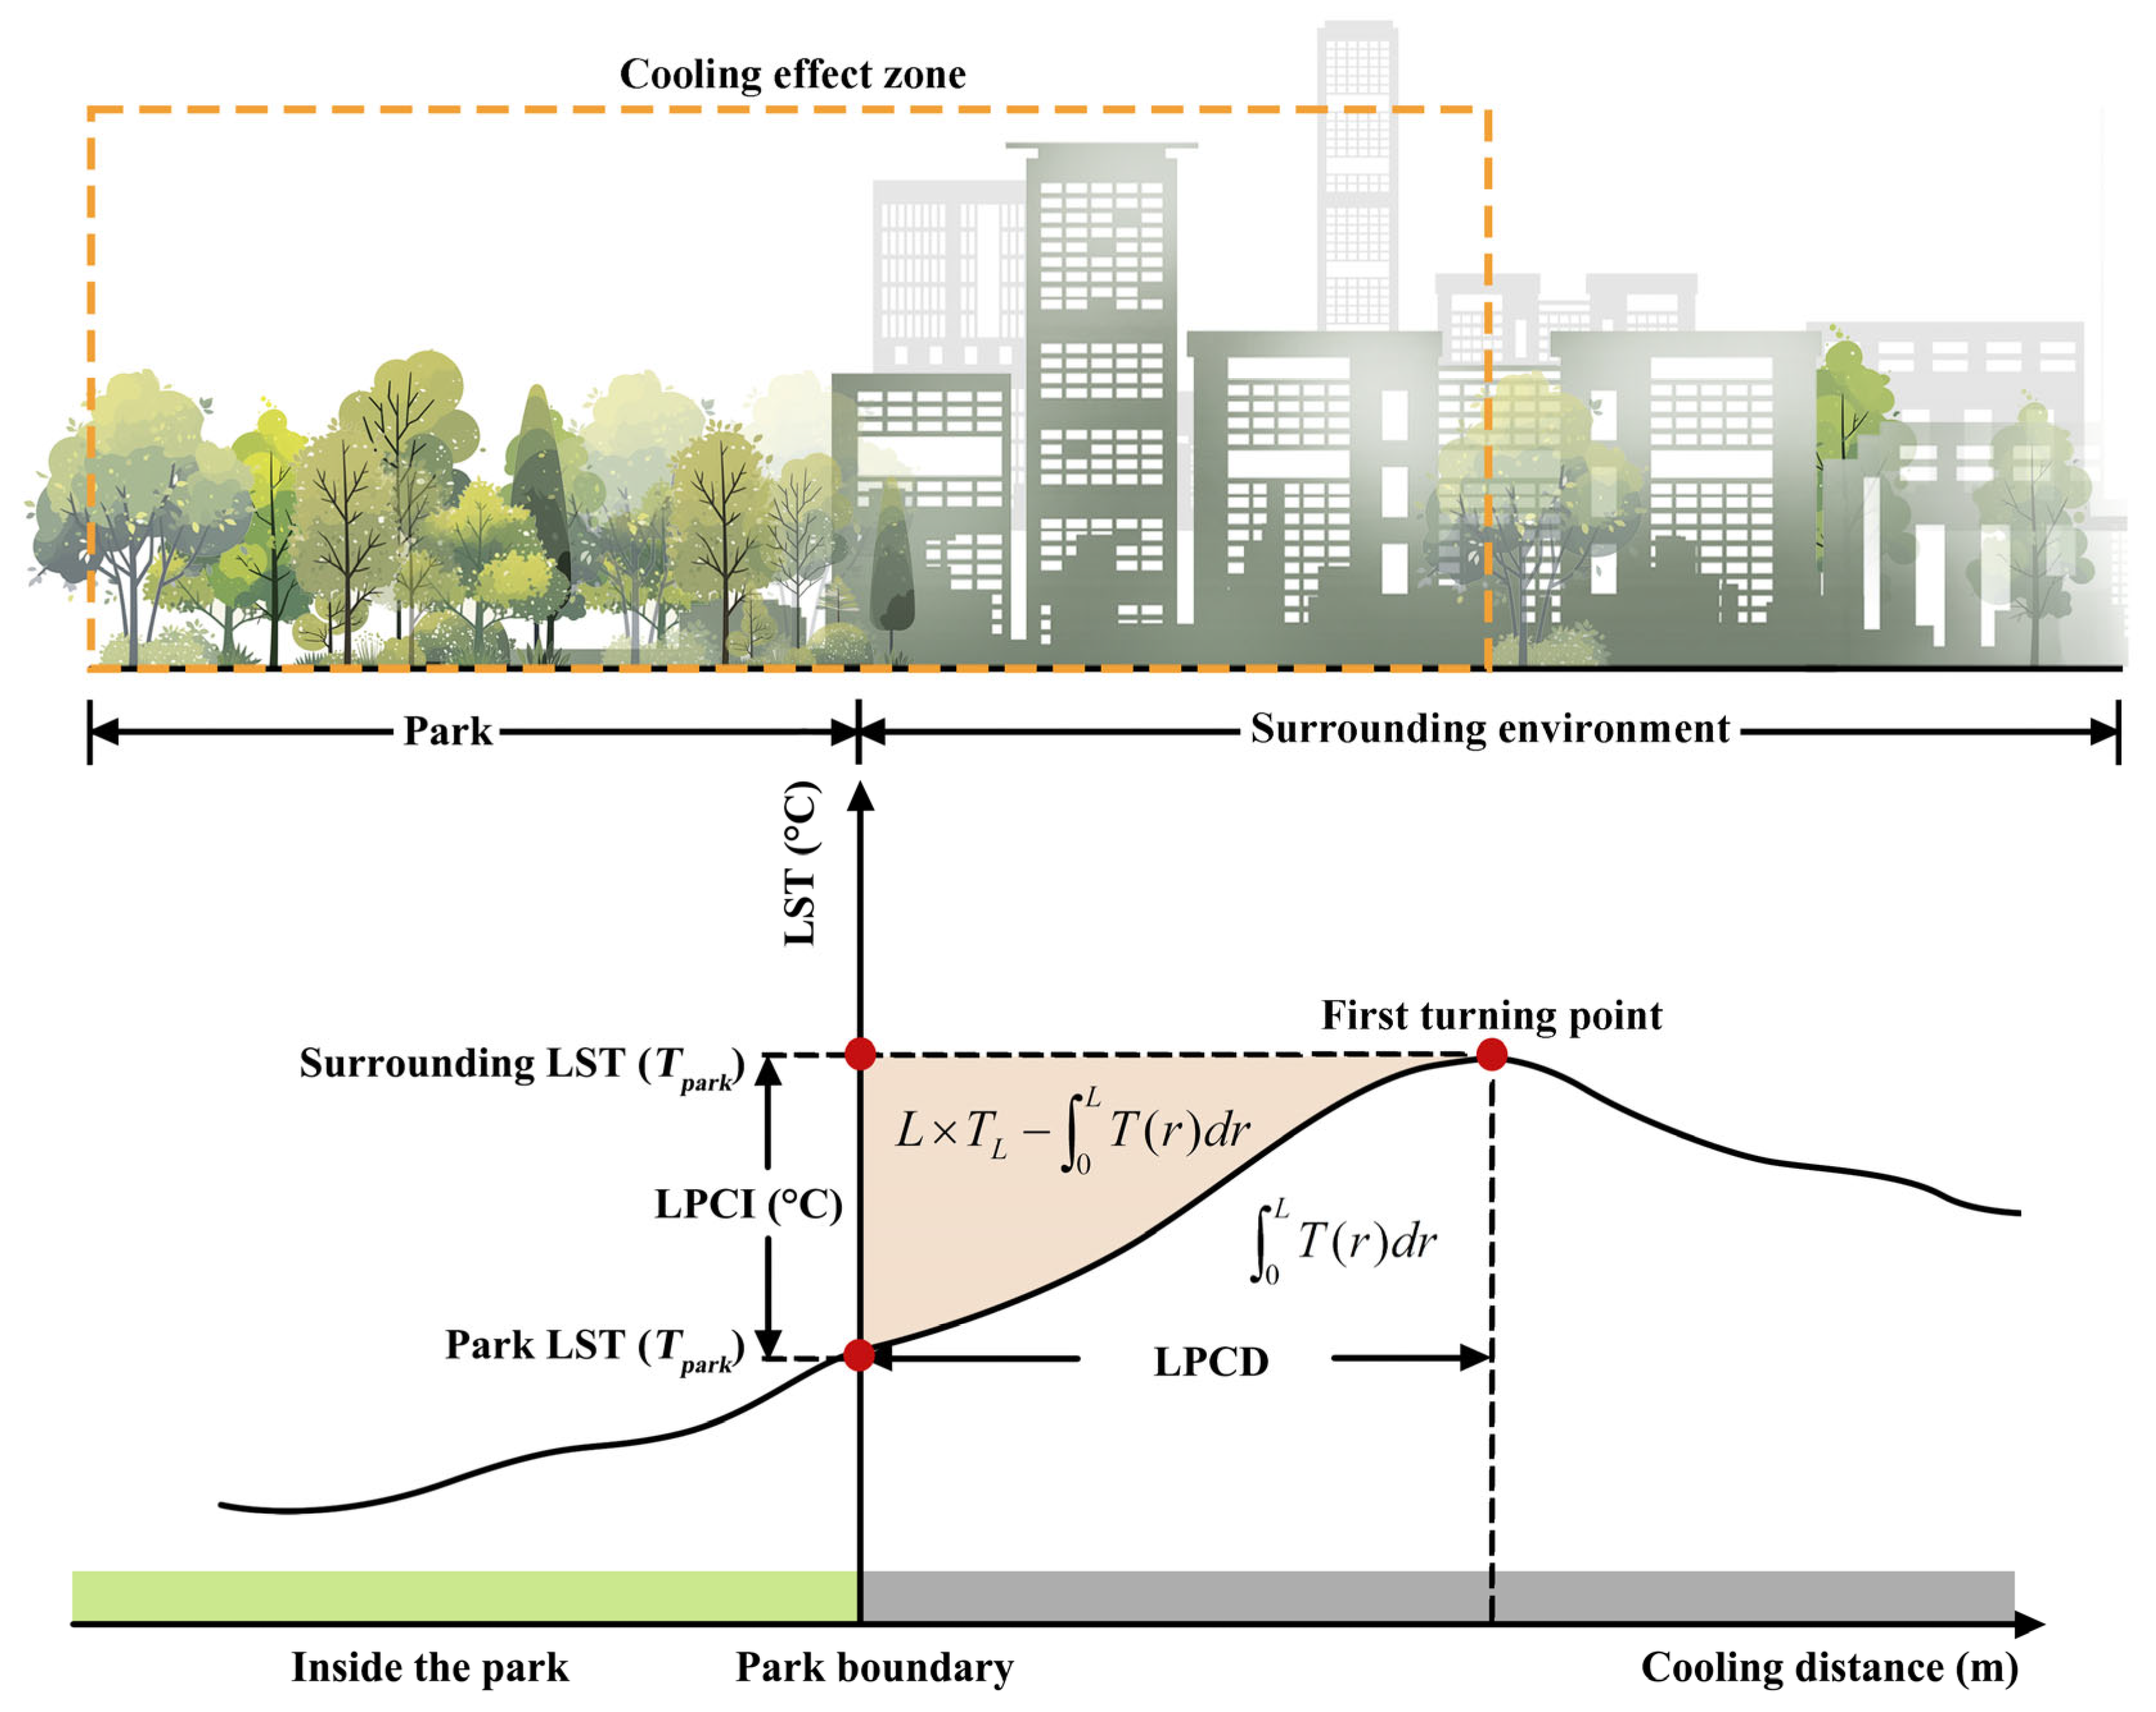
LST within the buffer rings typically increased with buffer distance from the urban park boundary, although the rate of increase gradually declined. When the first derivative of equaled zero, LST reached its maximum value, which was defined as the first turning point (FTP, Figure 3). The LST at the FTP was recognized as the surrounding LST (). The distance from the park boundary to the FTP was defined as LPCD. The buffer area most affected by park cooling was defined as LPCA. The temperature difference between and the park LST was defined as LPCI. The area ratio between LPCA and the park area was defined as LPCE [35]. However, PCE was a nonlinear and spatially continuous process influenced by varying environmental conditions. Relying solely on maximum-impacted indicators cannot fully capture the gradual spatial variation in LST. Therefore, two cumulative-impacted indicators, APCG and APCI, were also used in this study [36]. It was worth noting that the synergistic cooling effects of nearby multiple parks were difficult to distinguish and were not the focus of this study. To address overlapping buffer zones, a nearest-distance principle was applied, where overlapping buffer zones of two or more parks were divided equally according to their distance from each park boundary [11].
Figure 3.
Variation curve of LST change in the process of urban park cooling.
2.3.2. Quantification of Landscape Morphology
Based on previous research and data availability [17,37], a framework of landscape morphology was proposed, including 11 internal morphology features and 5 surrounding environmental features (Table 1). These selected features were not limited to two-dimensional or three-dimensional aspects of landscape morphology. To better reveal the heterogeneous impacts of landscape morphology on PCE, the spatial statistical range of surrounding environment features was limited to LPCA of each park, rather than the entire buffer zone.
Table 1.
Landscape morphology features of urban parks used in this study.
2.3.3. Correlation Analysis
Spearman’s non-parametric correlation analysis was used to evaluate the relationships between landscape morphology features and the six cooling indicators, with significance tested at the 5% level. This analysis helped to clarify whether specific landscape morphology features were positively or negatively associated with PCE.
2.3.4. RF Model and SHAP Value
RF regression, an ensemble of decision trees, captured nonlinear interactions among variables and was well recognized for its robustness to overfitting, particularly in small-to-medium-sized datasets. [27,38]. The mean decrease in accuracy (MDA) of RF was used to quantify the relative contributions of landscape morphology to PCE. A higher MDA value indicates higher relative contribution to PCE. In the fitted RF models, approximately 2/3 of the samples were used to train each tree and the remaining 1/3 were treated as out-of-bag (OOB) samples for internal validation. The OOB error provided an unbiased estimate of generalization performance without requiring an external test set. In this study, the OOB errors for the overall parks, small parks, medium parks, and large parks were all below 0.08. To further assess model robustness, a five-fold cross-validation was used to verify the fitting accuracy of fitted RF models. The fitted values for all cooling indicators across different scales exceeded 0.74, suggesting that the selected landscape morphology features can effectively explain the variations in PCE.
However, RF was a black-box model that can only quantify the relative contributions of independent variables to the dependent variable and cannot reveal their marginal effects. SHAP was a post hoc interpretation tool for models such as RF and XGBoost [39]. Based on cooperative game theory, SHAP locally quantifies each factor’s contribution to model predictions through its marginal effects (SHAP value). Therefore, SHAP was employed to analyze how landscape morphology influences variations in PCE, including interactions between features and impact thresholds.
3. Results
3.1. Cooling Effects of Urban Parks Across Scales
3.1.1. Spatial Distribution of LST
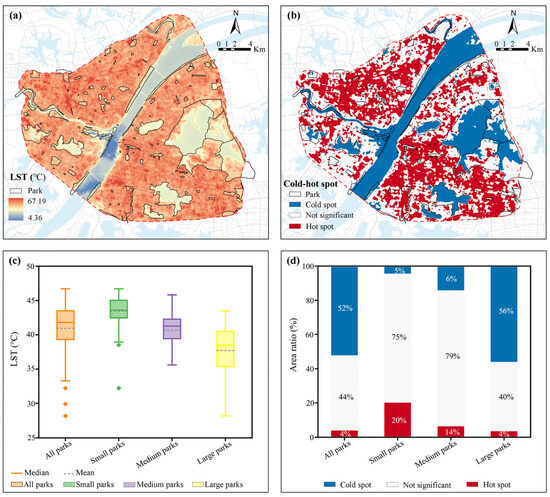
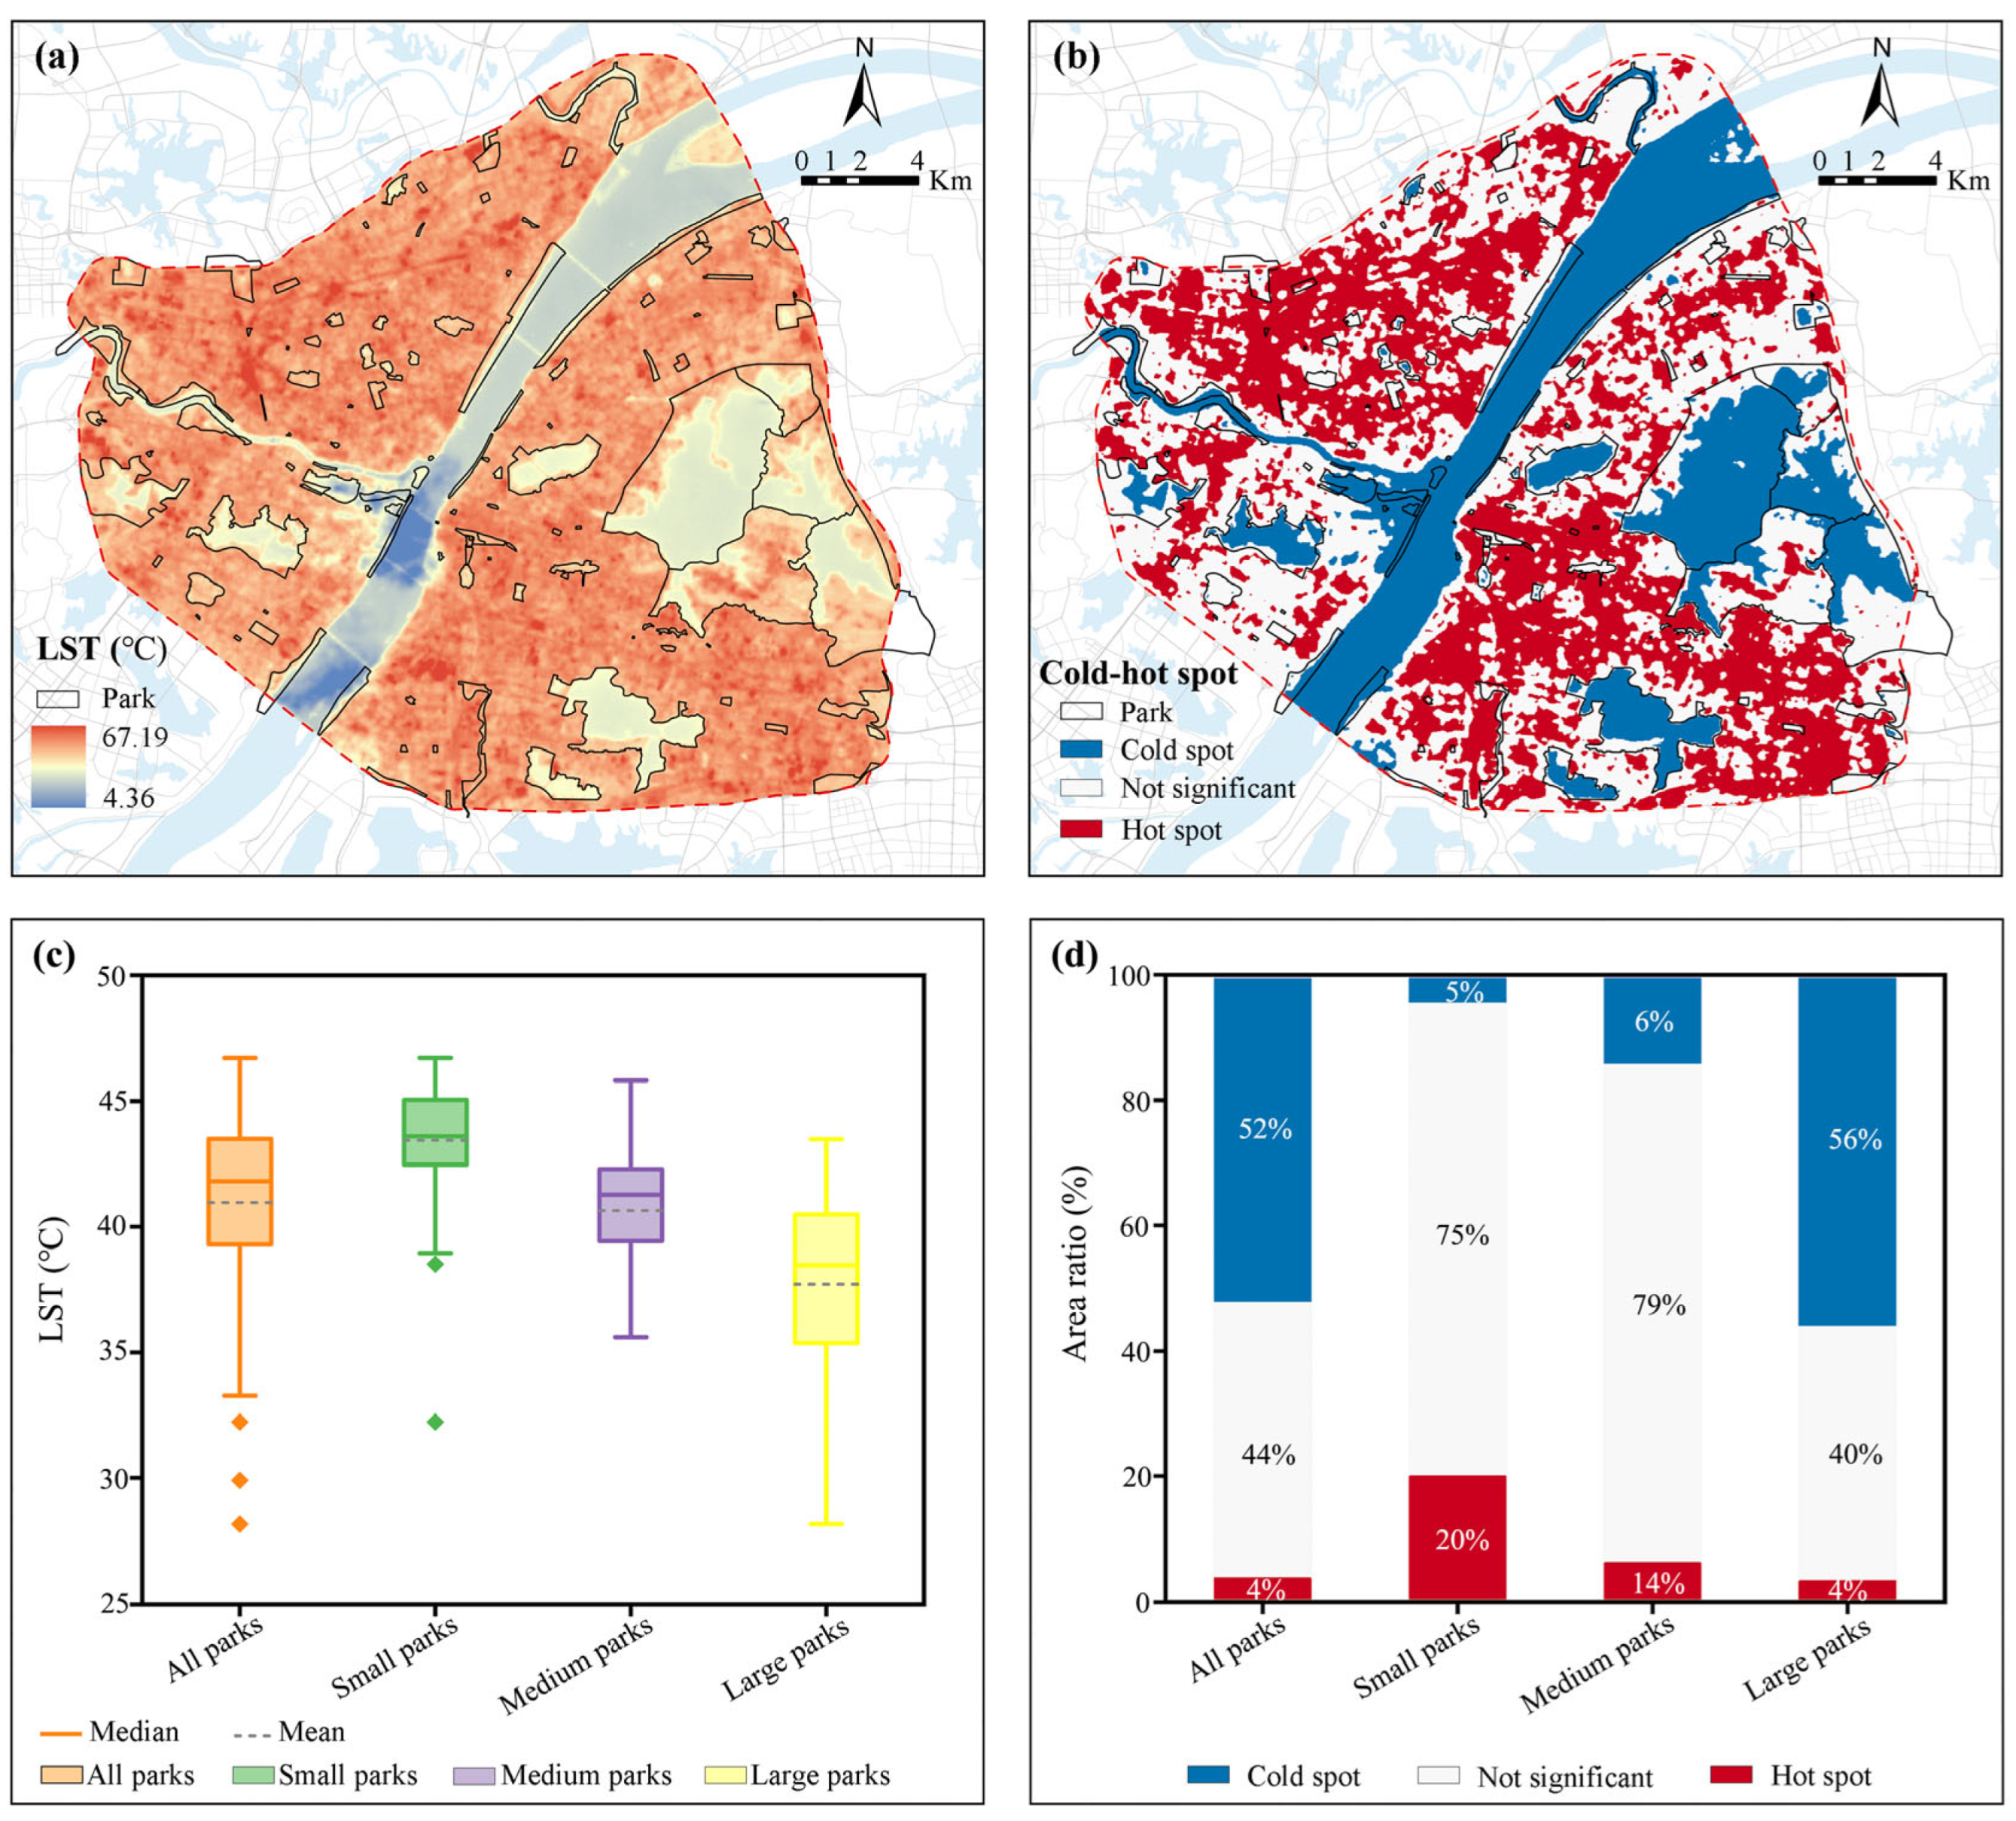
The spatial distribution of LST exhibited significant spatial heterogeneity (Figure 4a). The average LST of all urban parks was 40.9 °C, notably lower than that of the study area (42.1 °C). Among different park scales, small parks showed the highest average LST, followed by medium parks and large parks (Figure 4c). The average LSTs of medium and large parks were lower than 2.8 to 5.8 °C of these small parks. These results indicated that medium and large parks showed stronger effects in reducing LST compared to small parks.
Figure 4.
Spatial distribution of LST and hotspot of urban parks in the Third Ring of Wuhan in summer. (a) Distribution of LST in the study area. (b) Distribution of the cold and hot spots of LST in the study area. (c) Boxplot of the park LST across different scales. (d) Area ratio of the cold and hot spots of park LST across different scales.
Furthermore, we explored the LST clustering patterns within urban parks (Figure 4b). The distribution of hot and cold spots of LST varied according to the presence of water surfaces. Parks with water bodies usually exhibited significant cold spot patterns. For all parks, 52% of the areas were significant cold spots, while only 4% were hot spots. This highlighted the importance of urban parks in reducing surface temperature. Interestingly, we observed that from small to large parks, the area ratios of cold spots increased, while the area ratios of hot spots decreased. However, the area ratios of hot spots were much higher than those of cold spots in small parks, suggesting the limited cooling effects of small parks.
3.1.2. Spatial Distributions of PCE Across Scales
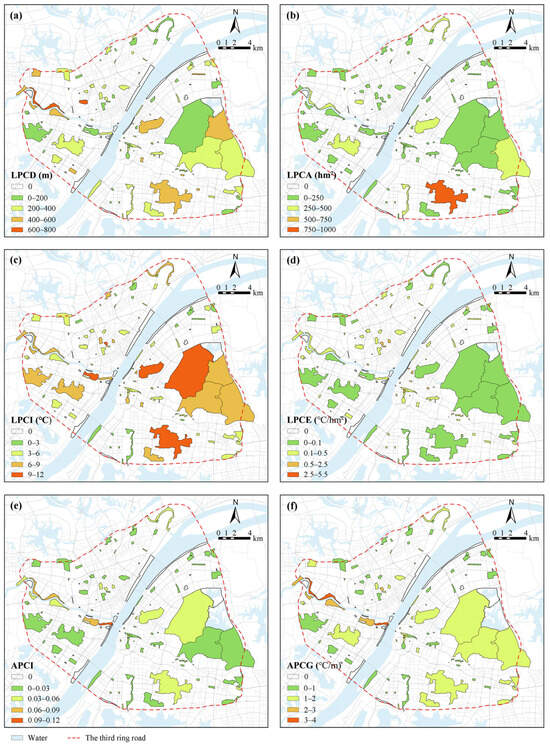
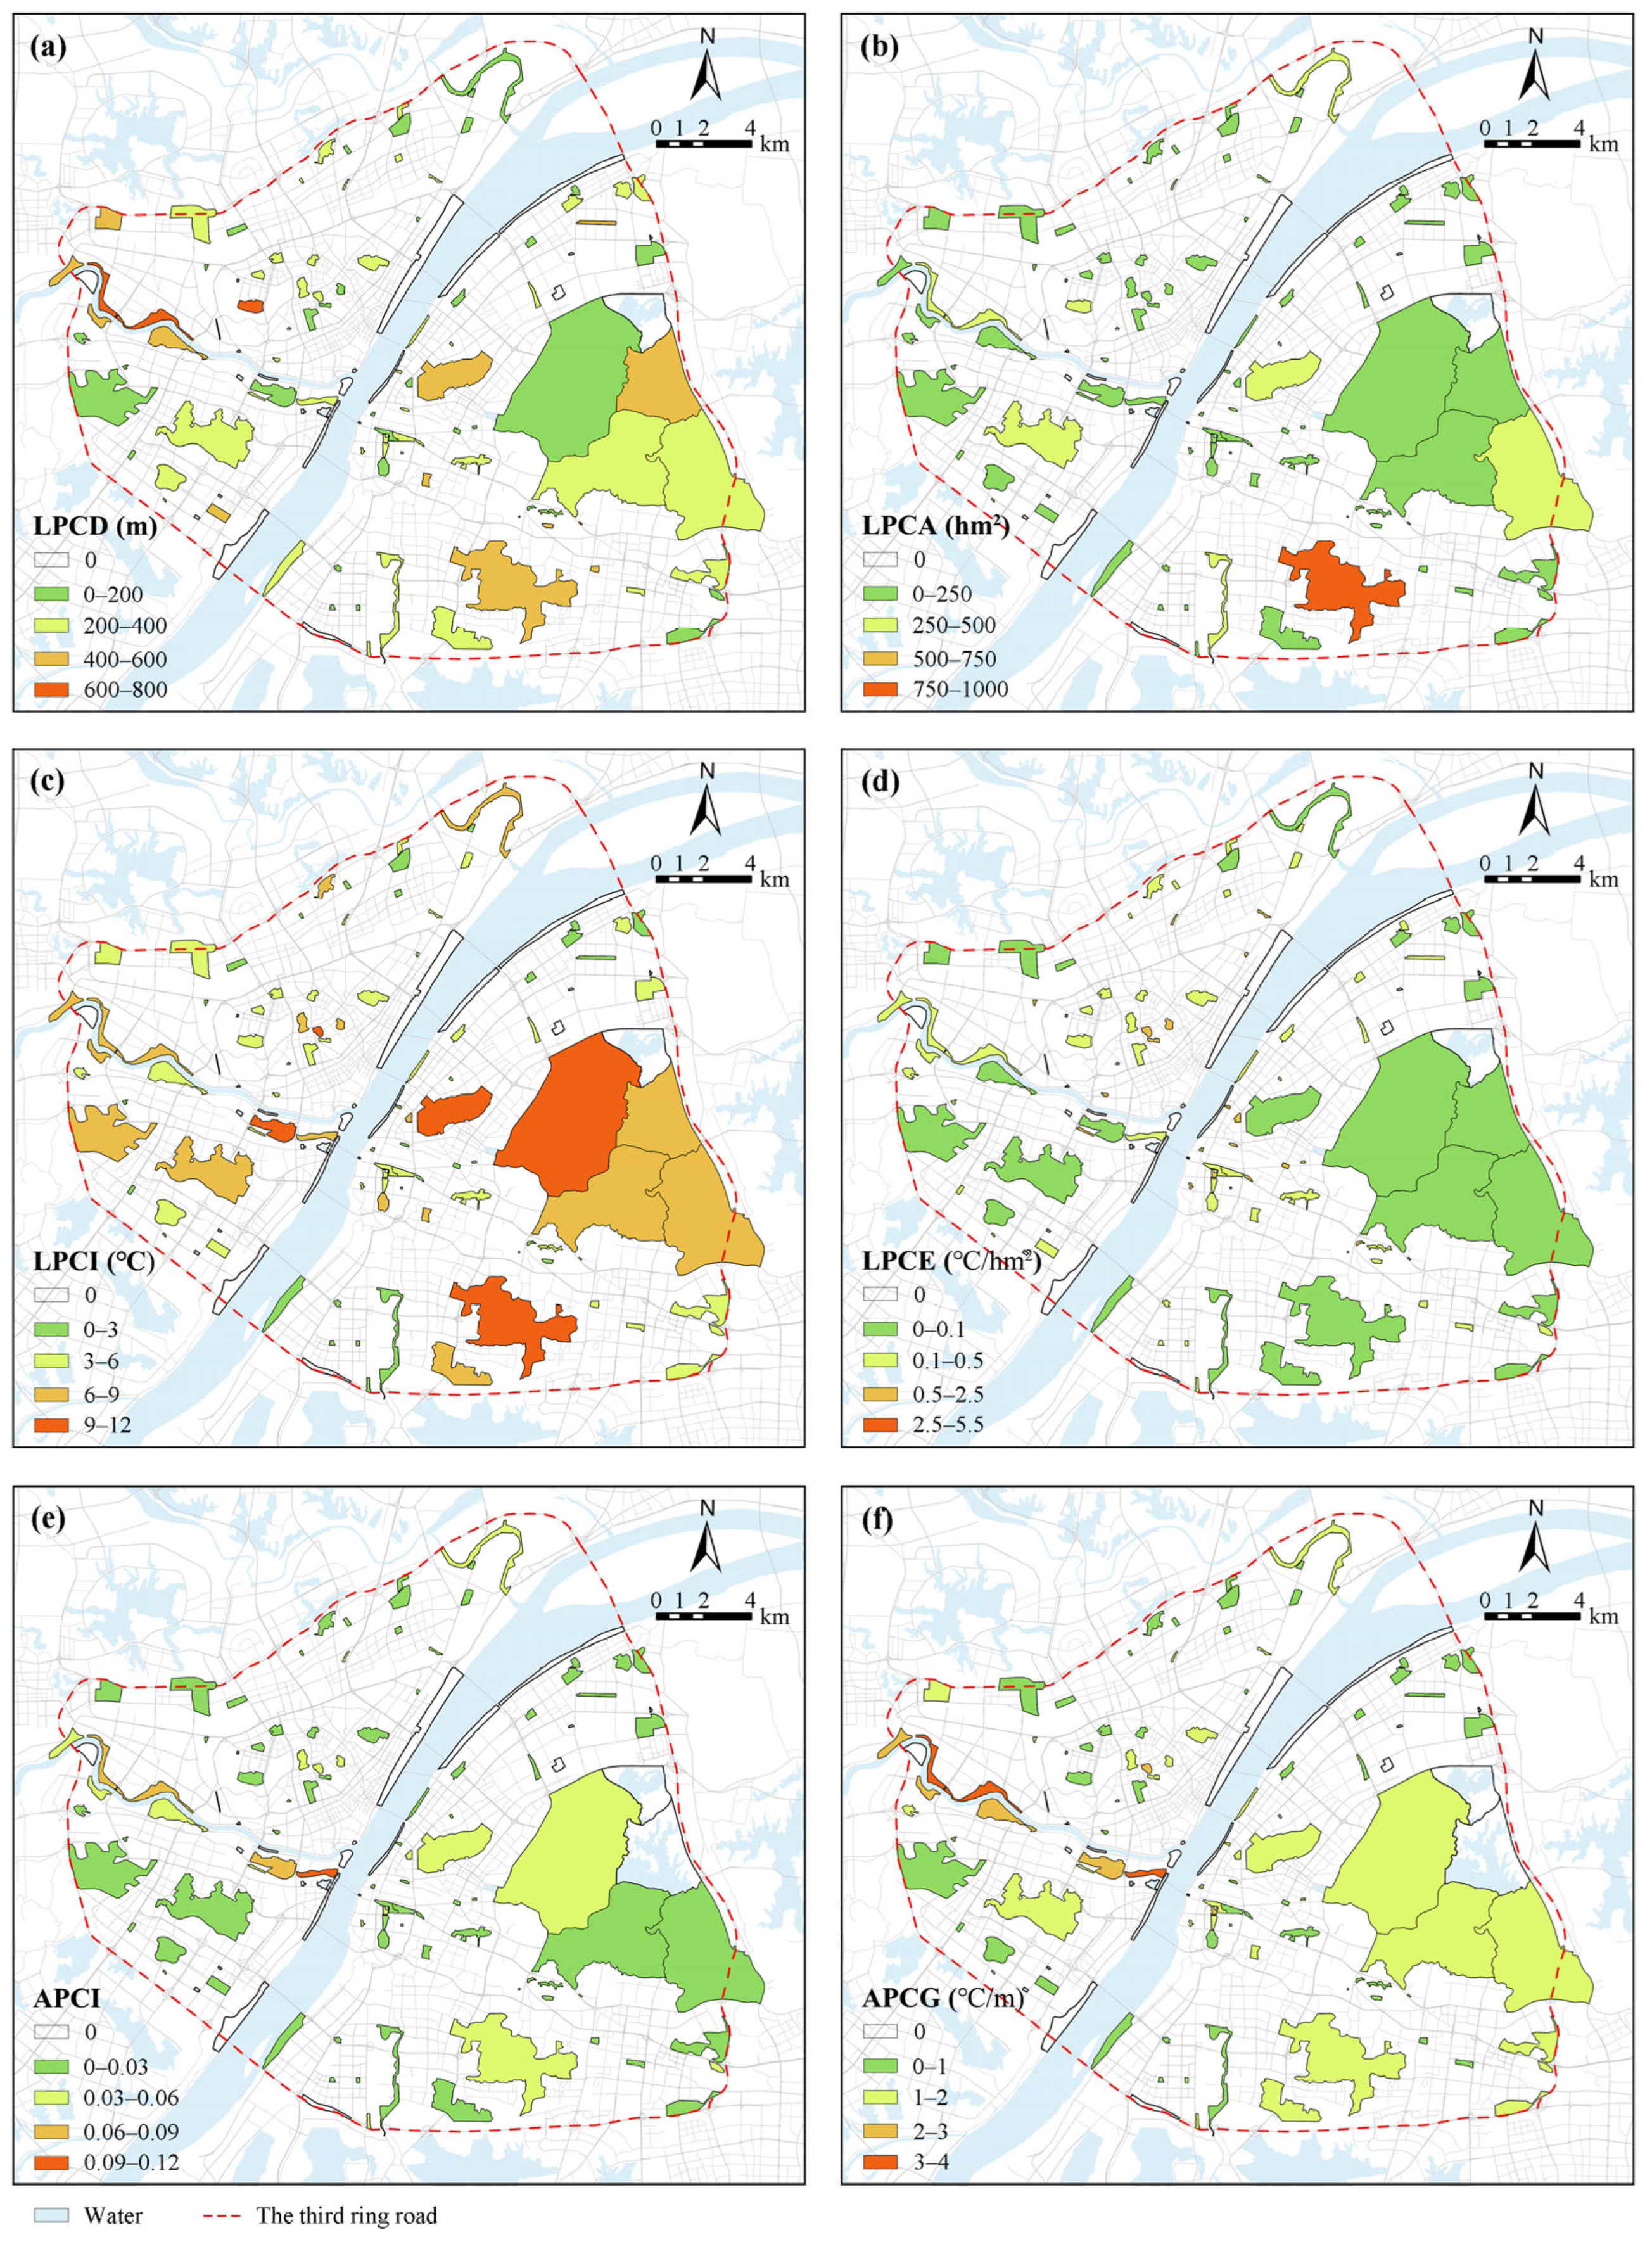
Of the parks, 79.8% (95) exhibited significant cooling effects in the study area (Figure 5). From the perspective of maximum-impacted indicators of (LPCD, LPCA, LPCI, LPCE), we found that the highest LPCD value fell in the range of 600–800 m (e.g., Hanjiang Park, 786 m). The maximum LPCA was 963.4 hm2 (Nanhu Huaxi Park), while the LPCA values of most parks concentrated in the range of 0–250 hm2. The highest LPCI value was 11.22 °C at Nanhu Huaxi Park. Wangshan Park exhibited the highest LPCE value of 5.0 °C/hm2. From the perspective of cumulative-impacted indicators (APCI and APCG), we observed that most APCI values were concentrated in the range of 0–0.06, with Guishan Park showing the maximum value of 0.11. The spatial distribution of APCG was similar to that of APCI, with the highest value being 3.7 (Hanjiang Park).
Figure 5.
Spatial distribution of the six cooling indicators in the Third Ring of Wuhan in summer, including LPCD (a), LPCA (b), LPCI (c), LPCE (d), APCI (e), and APCG (f).
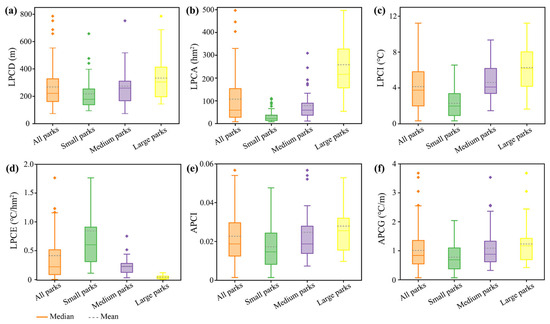
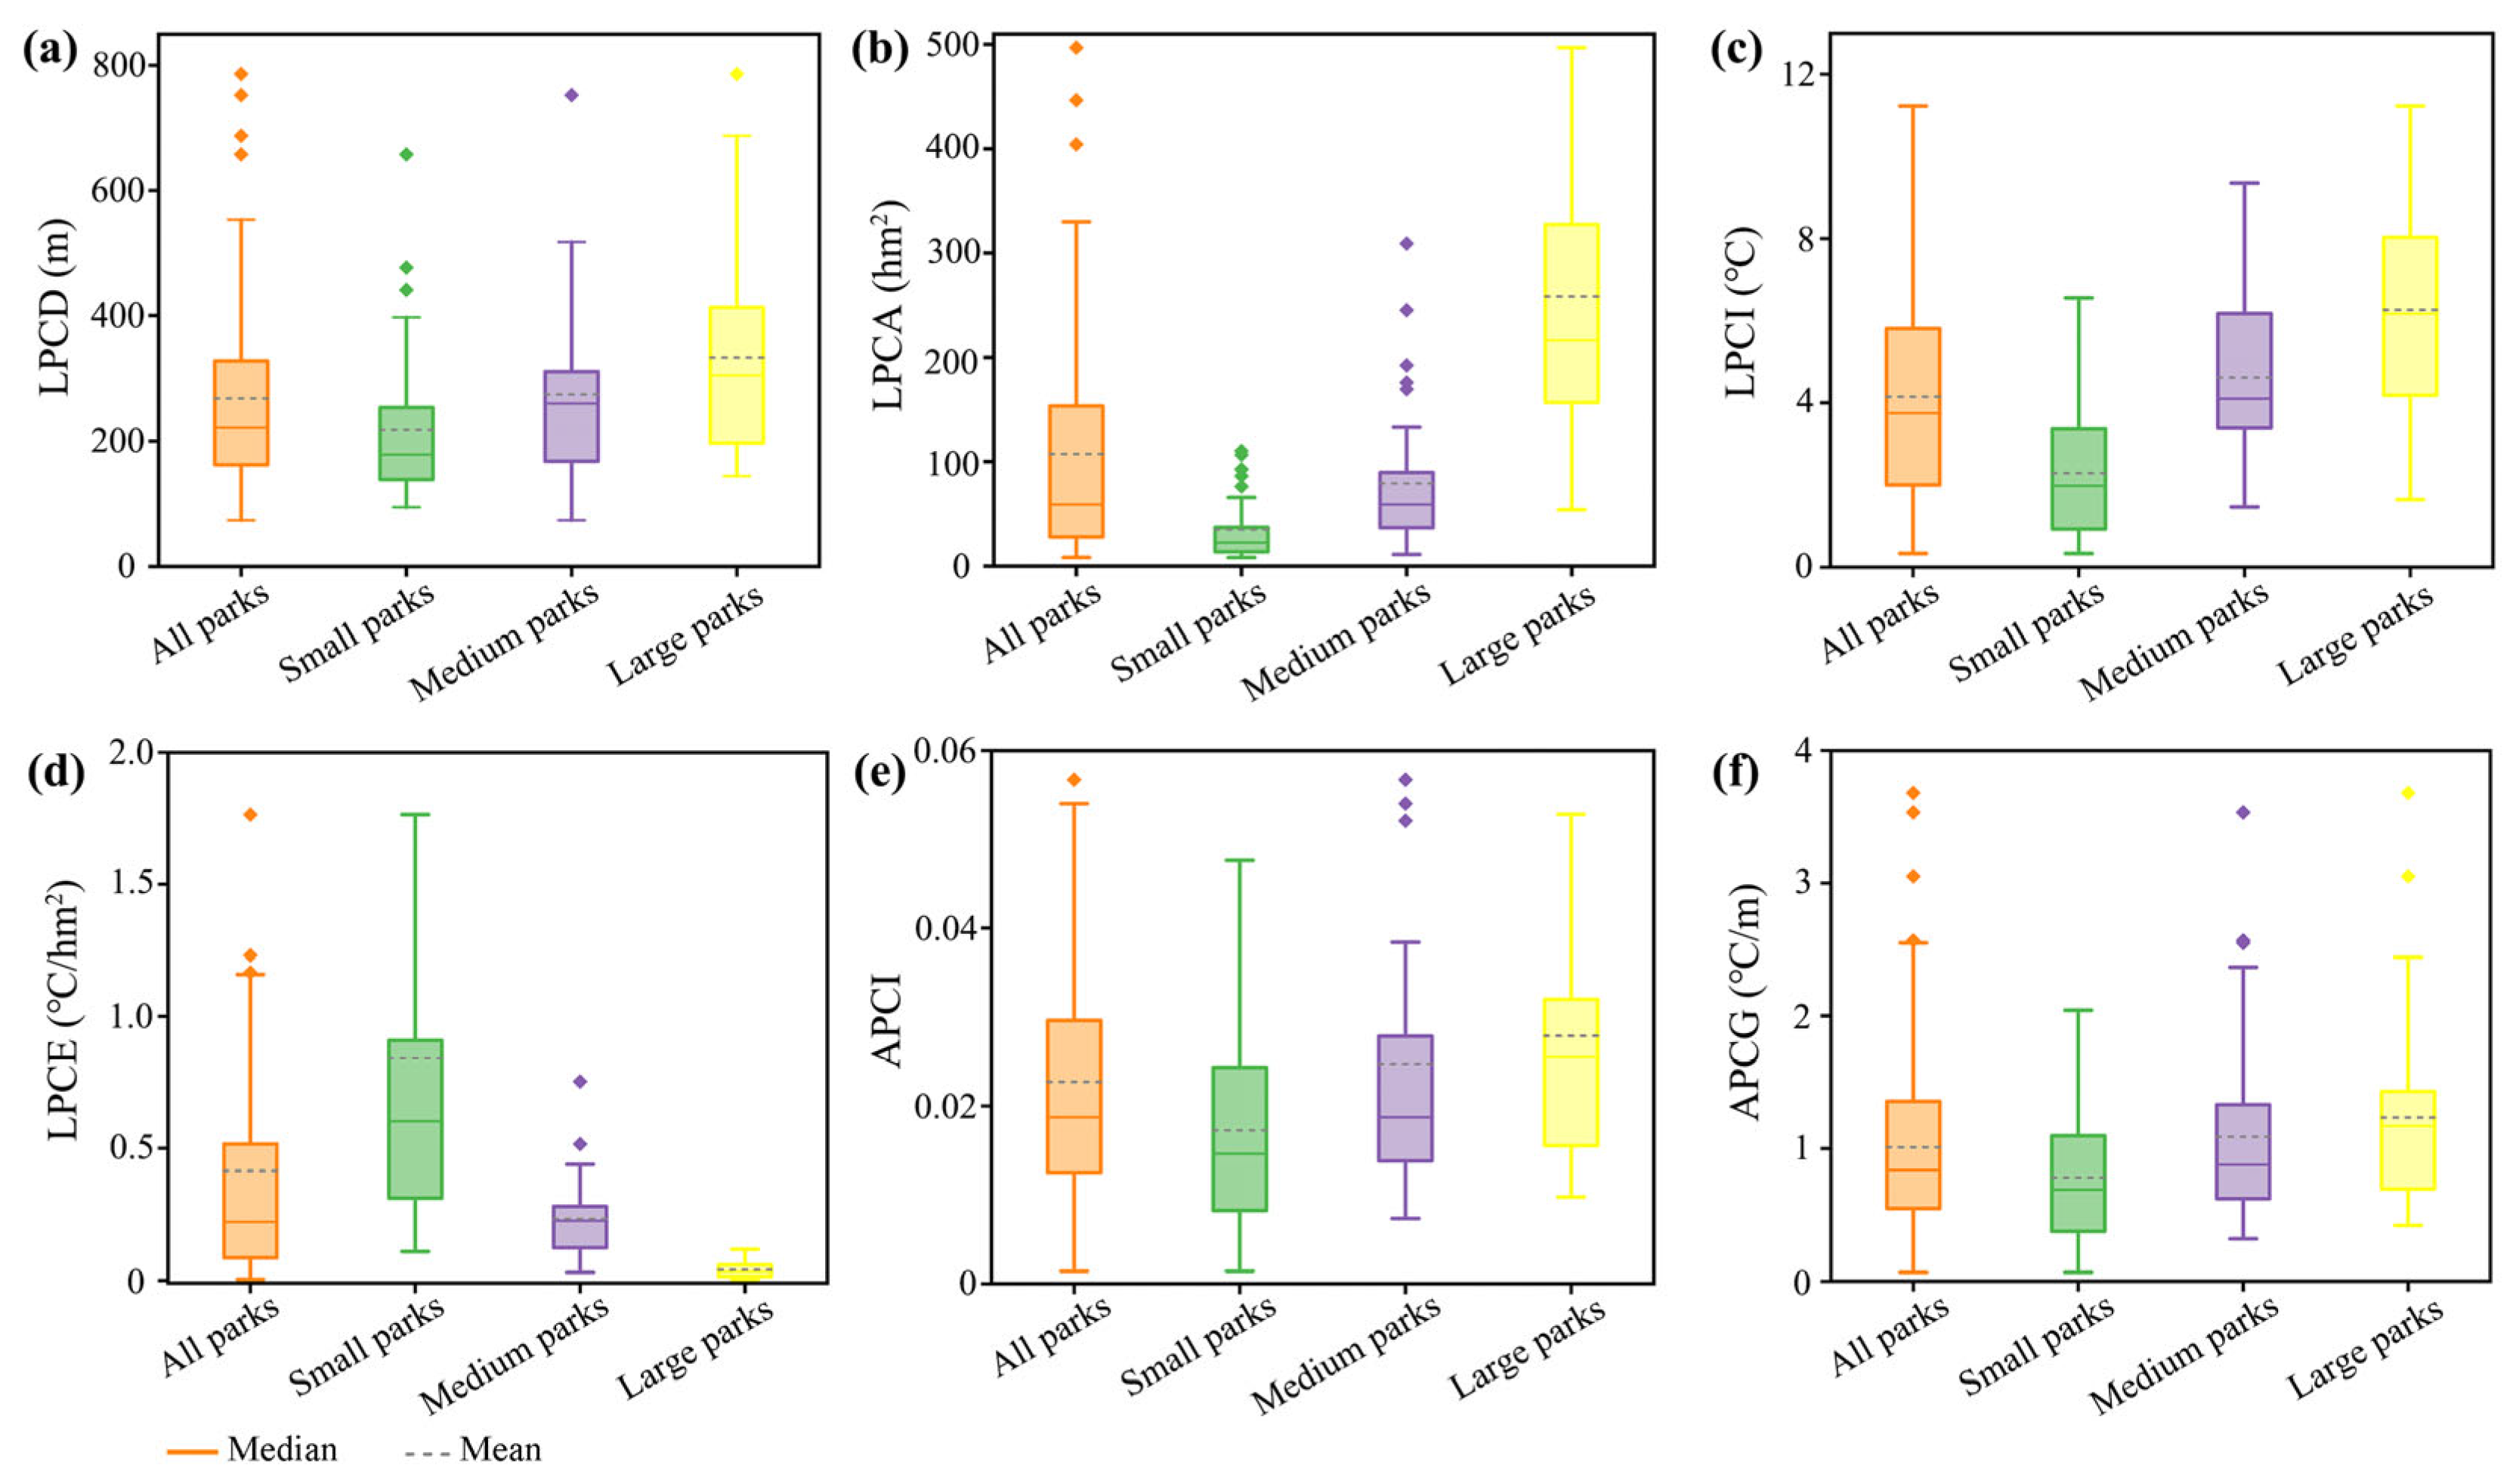
The cooling effects of urban parks exhibited significant differences with distinct patterns across different park scales (Figure 6). LPCD, LPCA, LPCI, APCI, and APCG generally increased with park area, while LPCE decreased. This suggested possible trade-offs among these cooling indices across different scales. The LPCA of large parks was markedly higher than that of small and medium parks, while differences in APCI and APCG across scales were relatively minor. In terms of distribution concentration, LPCD, LPCA, and LPCI were more tightly clustered in small and medium parks, while large parks exhibited more scattered values with the greatest variations. In contrast, LPCE showed the opposite pattern, with the highest variations in small parks and values in large parks concentrated near zero.
Figure 6.
Boxplot of the six cooling indicators of urban parks across different scales, including LPCD (a), LPCA (b), LPCI (c), LPCE (d), APCI (e), and APCG (f), respectively.
Across all park scales, all six cooling indicators displayed a statistical characteristic that their mean values were greater than the median values. The mean–median gaps were most significant for LPCA and LPCE, with mean values more than twice the corresponding medians. LPCI showed the smallest mean–median gap, with the least variation observed in large parks. Overall, values across all parks were mostly at moderate level and most similar to those of medium parks, while the distributions were more dispersed.
3.2. Correlation Between PCE with Landscape Morphology Across Scales
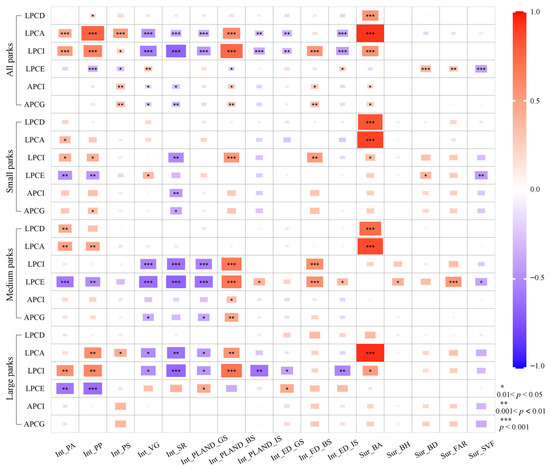
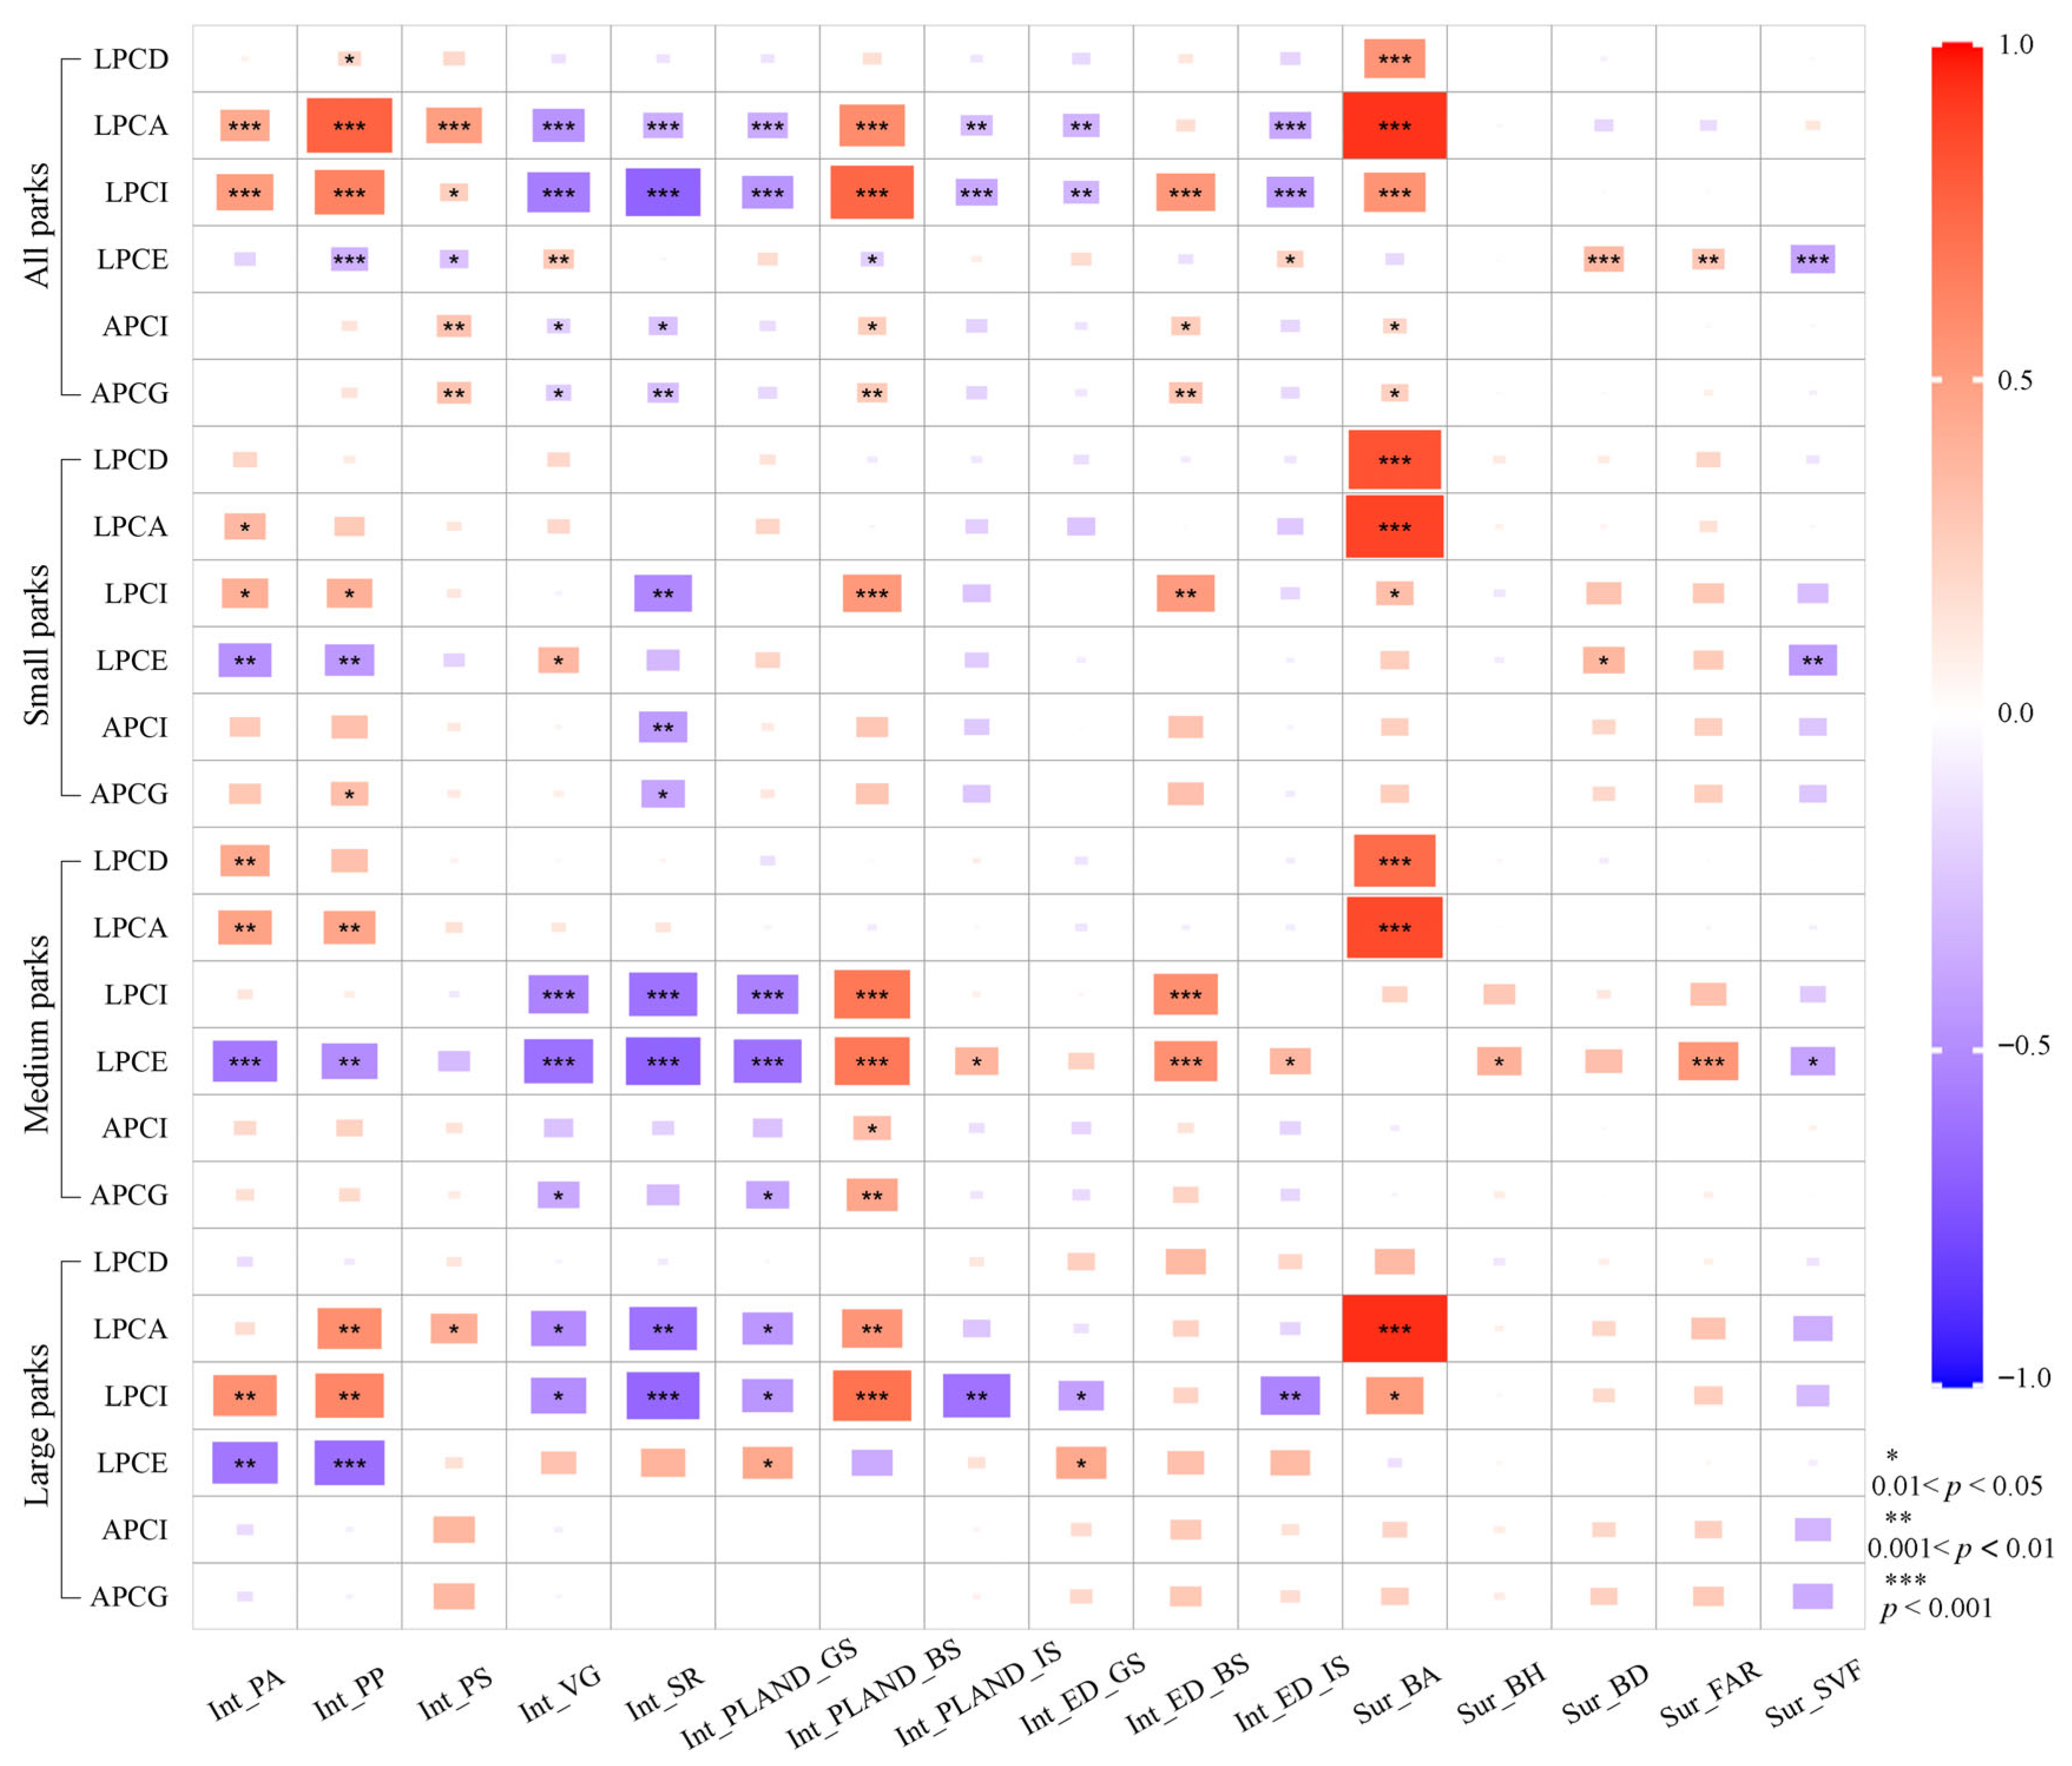
The correlations between PCE and landscape morphology were quantified across different scales (Figure 7). For all parks, internal morphology exhibited the strongest negative correlations with LPCA and LPCI, while Sur_BA also showed a significant positive correlation with LPCA. Int_PP, Int_PS, and Int_PLAND_BS also displayed a relatively strong positive correlation with LPCA, while Int_VG was negatively correlated with it. LPCI was significantly correlated with Int_PLAND_BS, Int_PP, Int_SR, and Int_VG. The remaining park cooling indicators exhibited weak correlations with landscape morphology features. LPCE negatively correlated with Sur_SVF, while LPCD was positively correlated only with Int_PP and Sur_BA. Correlations between landscape morphology and the cumulative-impacted indicators (APCI and APCG) were relatively weak. Overall, internal morphology features of urban parks were highly correlated with the three maximum cooling indicators (LPCA, LPCI, and LPCE), while the surrounding environment features mainly positively correlated with LPCD and LPCA.
Figure 7.
Correlation between landscape morphology and park cooling indicators across different scales, including all parks, small parks, medium parks, and large parks, respectively.
These correlation relationships exhibited significant heterogeneity across different park scales. Taking small parks as an example, LPCD and LPCA showed the strongest positive correlations with Sur_BA. LPCI exhibited an obvious positive correlation with Int_PLAND_BS, while LPCE was negatively correlated with Int_PA, Int_PP, and Sur_SVF. APCI showed a negative correlation with Int_SR. Similar trends were also observed in medium and large parks.
3.3. Impact of Landscape Morphology on PCE Across Scales
3.3.1. Relative Contributions of Landscape Morphology
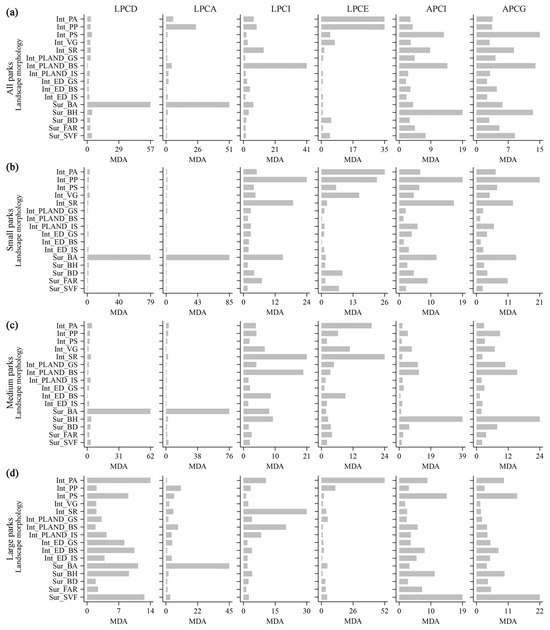
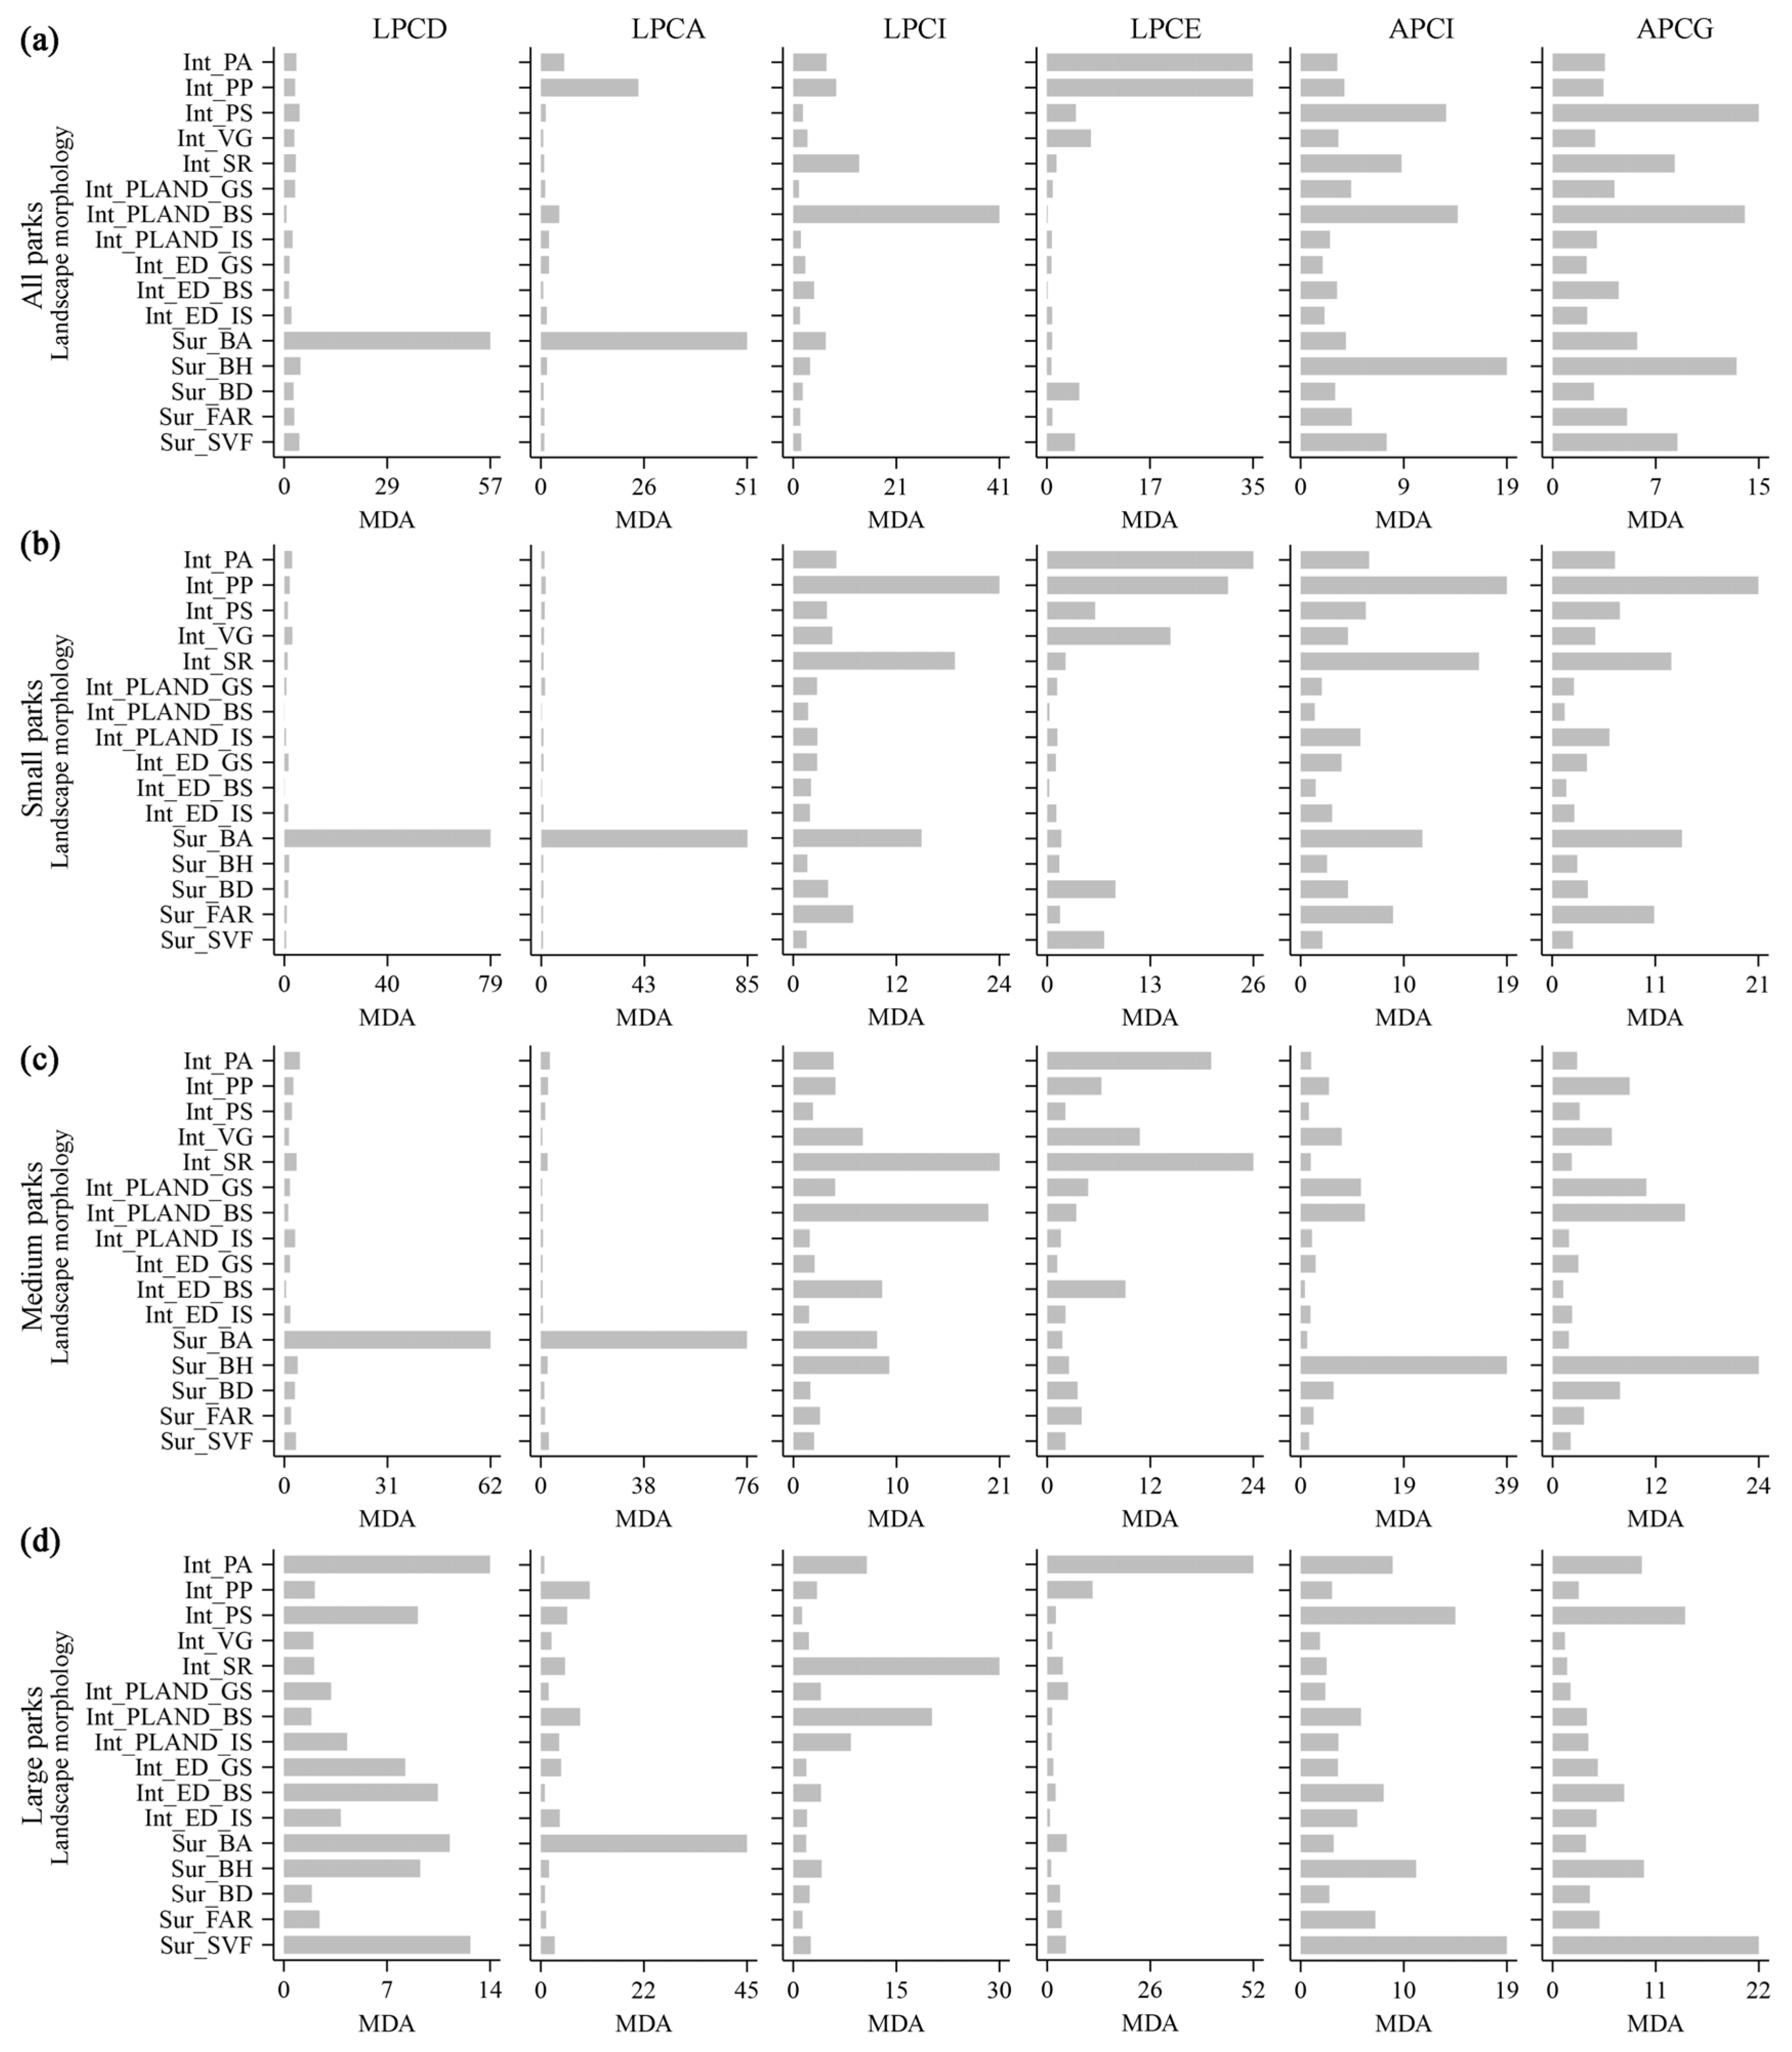
Based on RF regression, the relative contributions of landscape morphology to six cooling indicators were quantified across different scales (Figure 8), including all parks, small parks, medium parks, and large parks. For all parks, Sur_BA had the strongest impact on LPCD and LPCA, with relative contributions of 57.5% and 51.4%, respectively (Figure 8a). Int_PLAND_BS also significantly impacted LPCI, followed by Int_PLAND_GS. Int_PP and Int_PS were the most important landscape morphology features driving the variations in LPCI, with relative contributions of 34.7% and 34.6%, respectively. Additionally, Sur_BH, Int_PLAND_BS, and Int_PS were the key landscape morphology features impacting LPCE, APCI, and APCG.
Figure 8.
Relative contributions of landscape morphology to PCE across different scales, including all parks (a), small parks (b), medium parks (c), and large parks (d). The higher the MDA, the higher the relative contribution.
The relative contributions of landscape morphology to PCE varied across specific cooling indicators and park scales. In small parks, Sur_BA was the most significant contributor to LPCD and LPCA (Figure 8b), with relative contributions of 79.4% and 85.4%, respectively. For LPCI, Int_PP ranked first in the relative contributions, followed by Int_SR and Sur_BA. Internal morphological features were more important than surrounding environmental features for LPCE, APCI, and APCG. In medium parks, LPCD, LPCA, APCI, and APCG were primarily driven by the surrounding environment, particularly Sur_BA. However, LPCI and LPCE were more strongly impacted by internal morphology features, such as Int_PLAND_BS, Int_SR, and Int_PP. In large parks, LPCA, APCI, and APCG were mainly associated with surrounding environment features, such as Sur_SVF, Sur_BA, and Sur_BH, while LPCD and LPCI were determined by internal morphology features, such as Int_PA and Int_PS.
3.3.2. Interaction Effects of Landscape Morphology
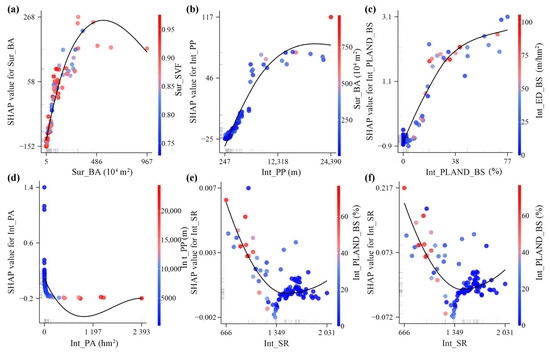
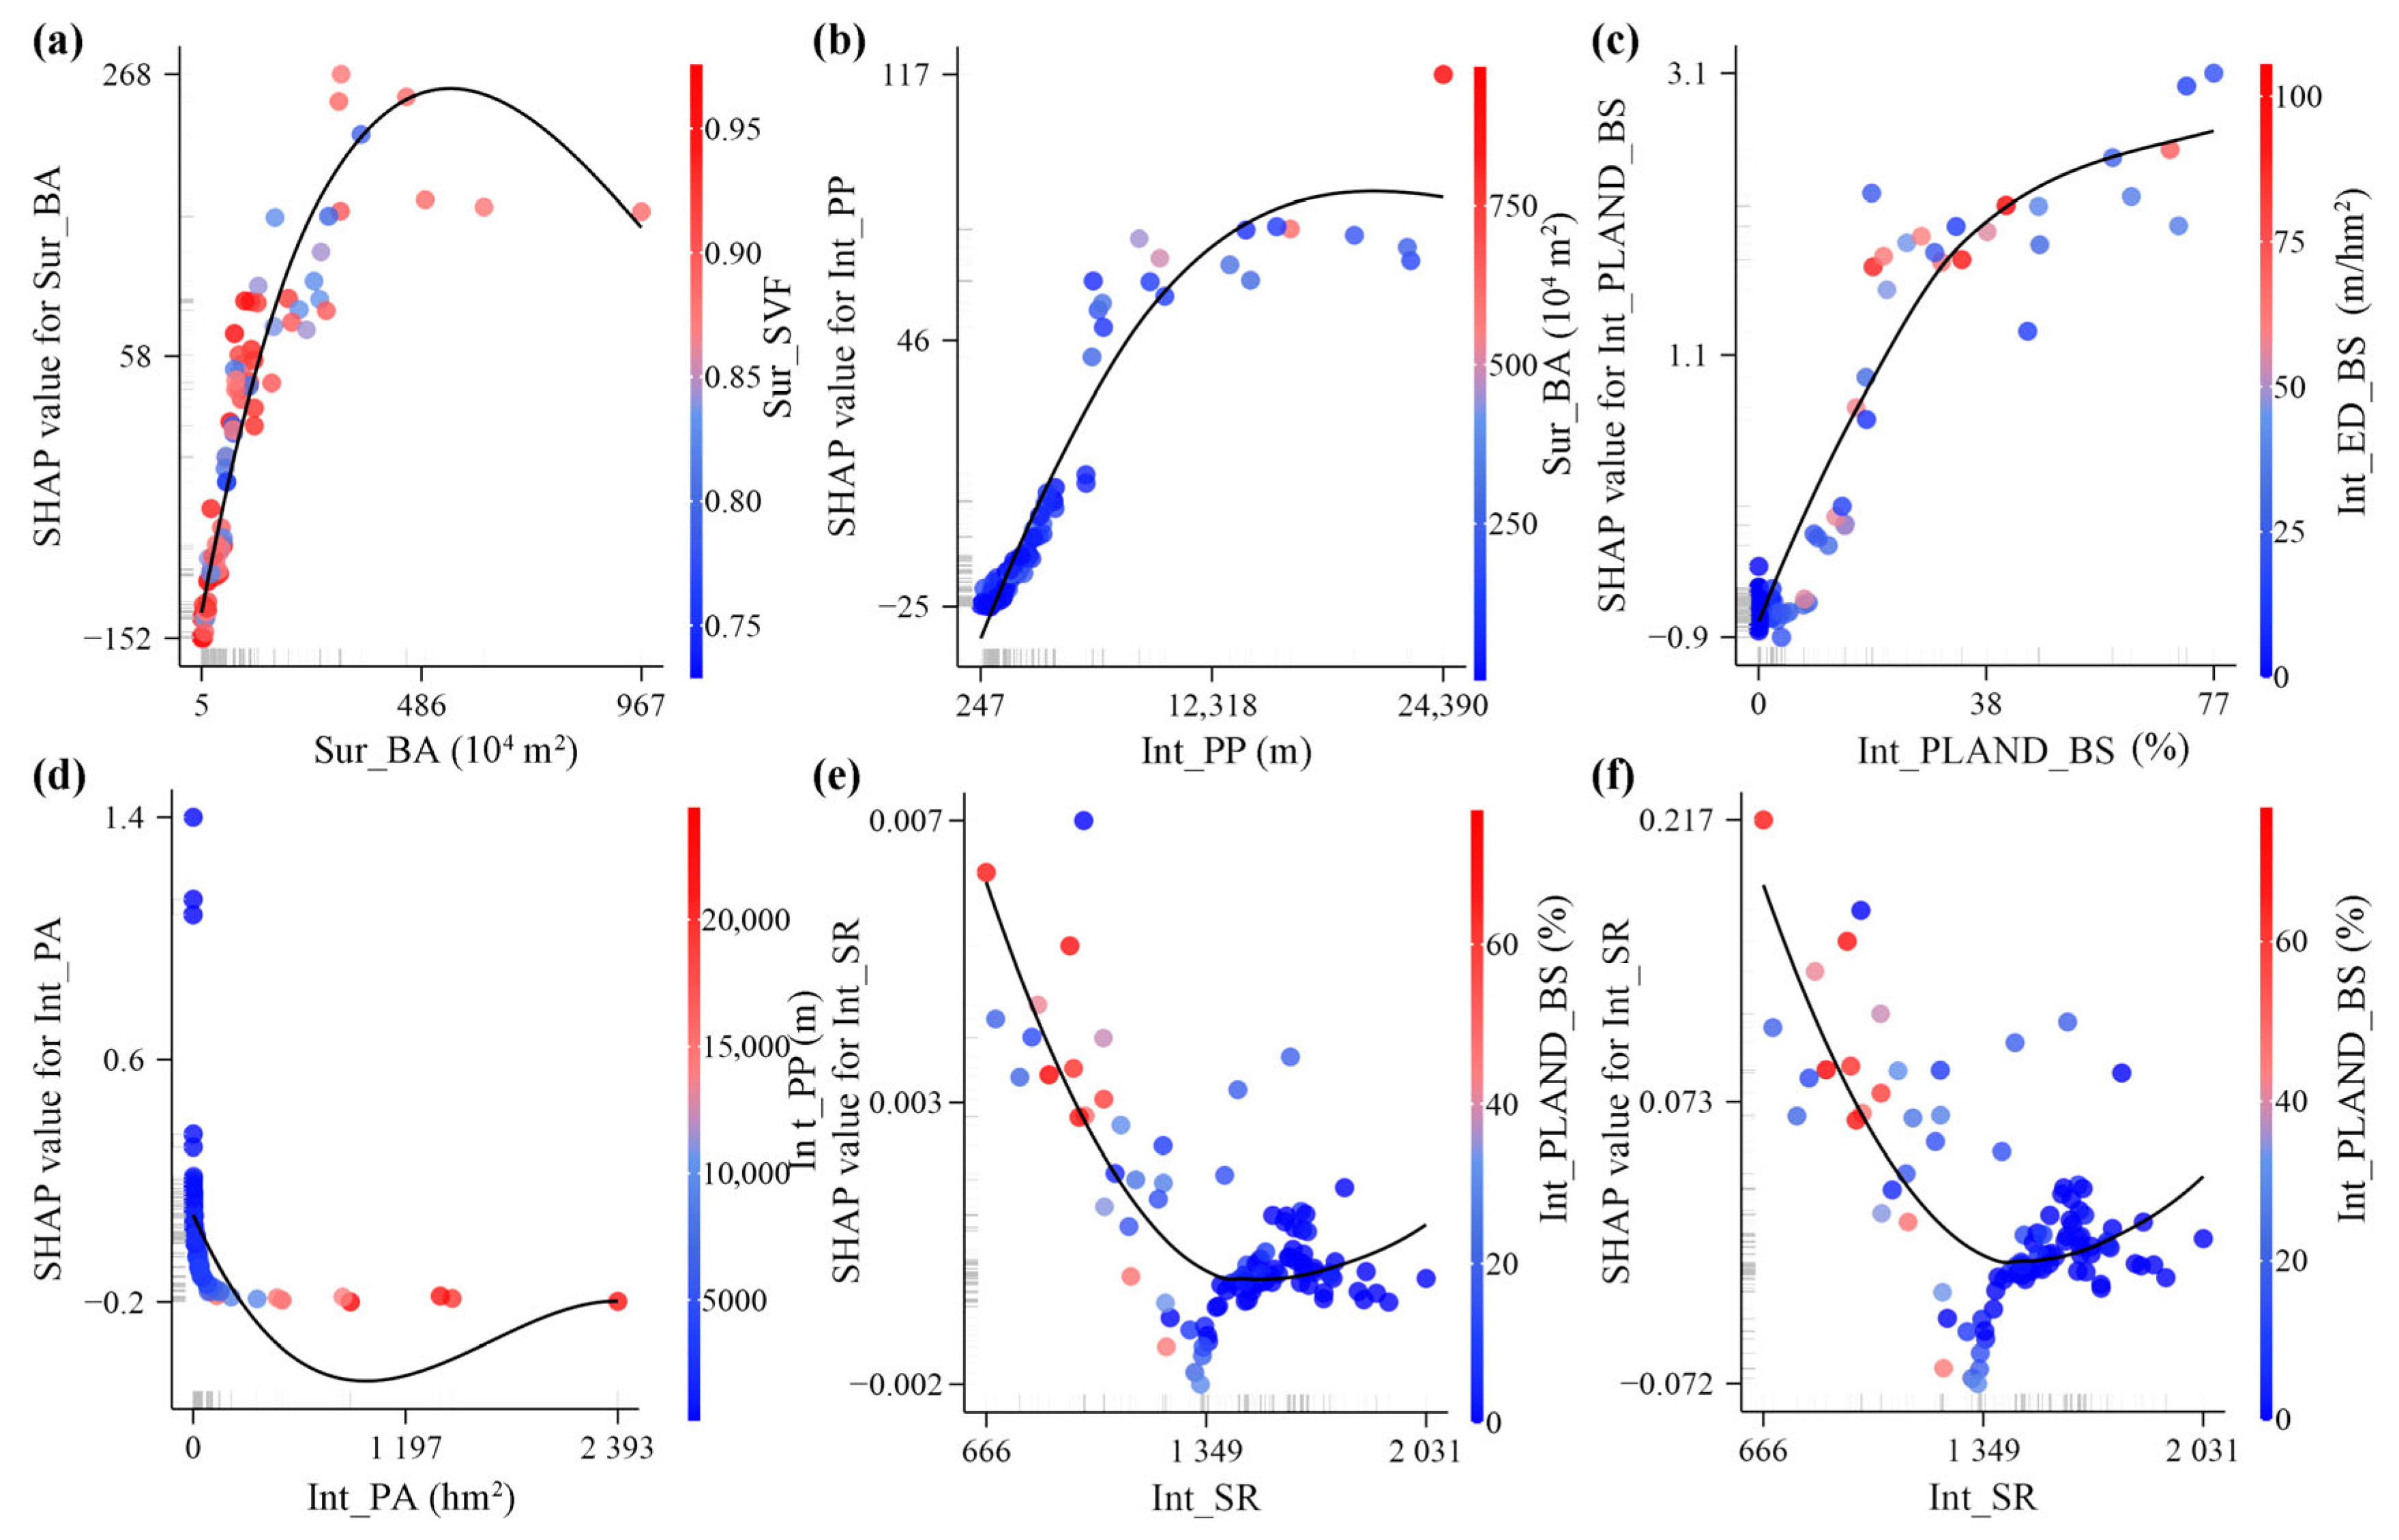
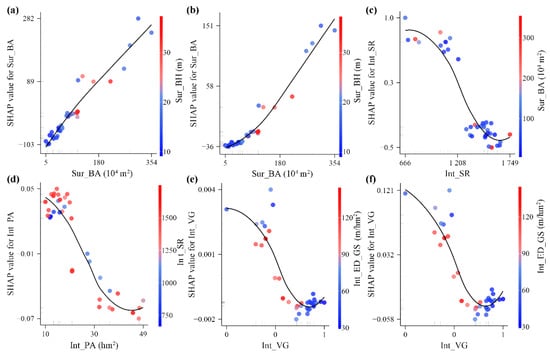
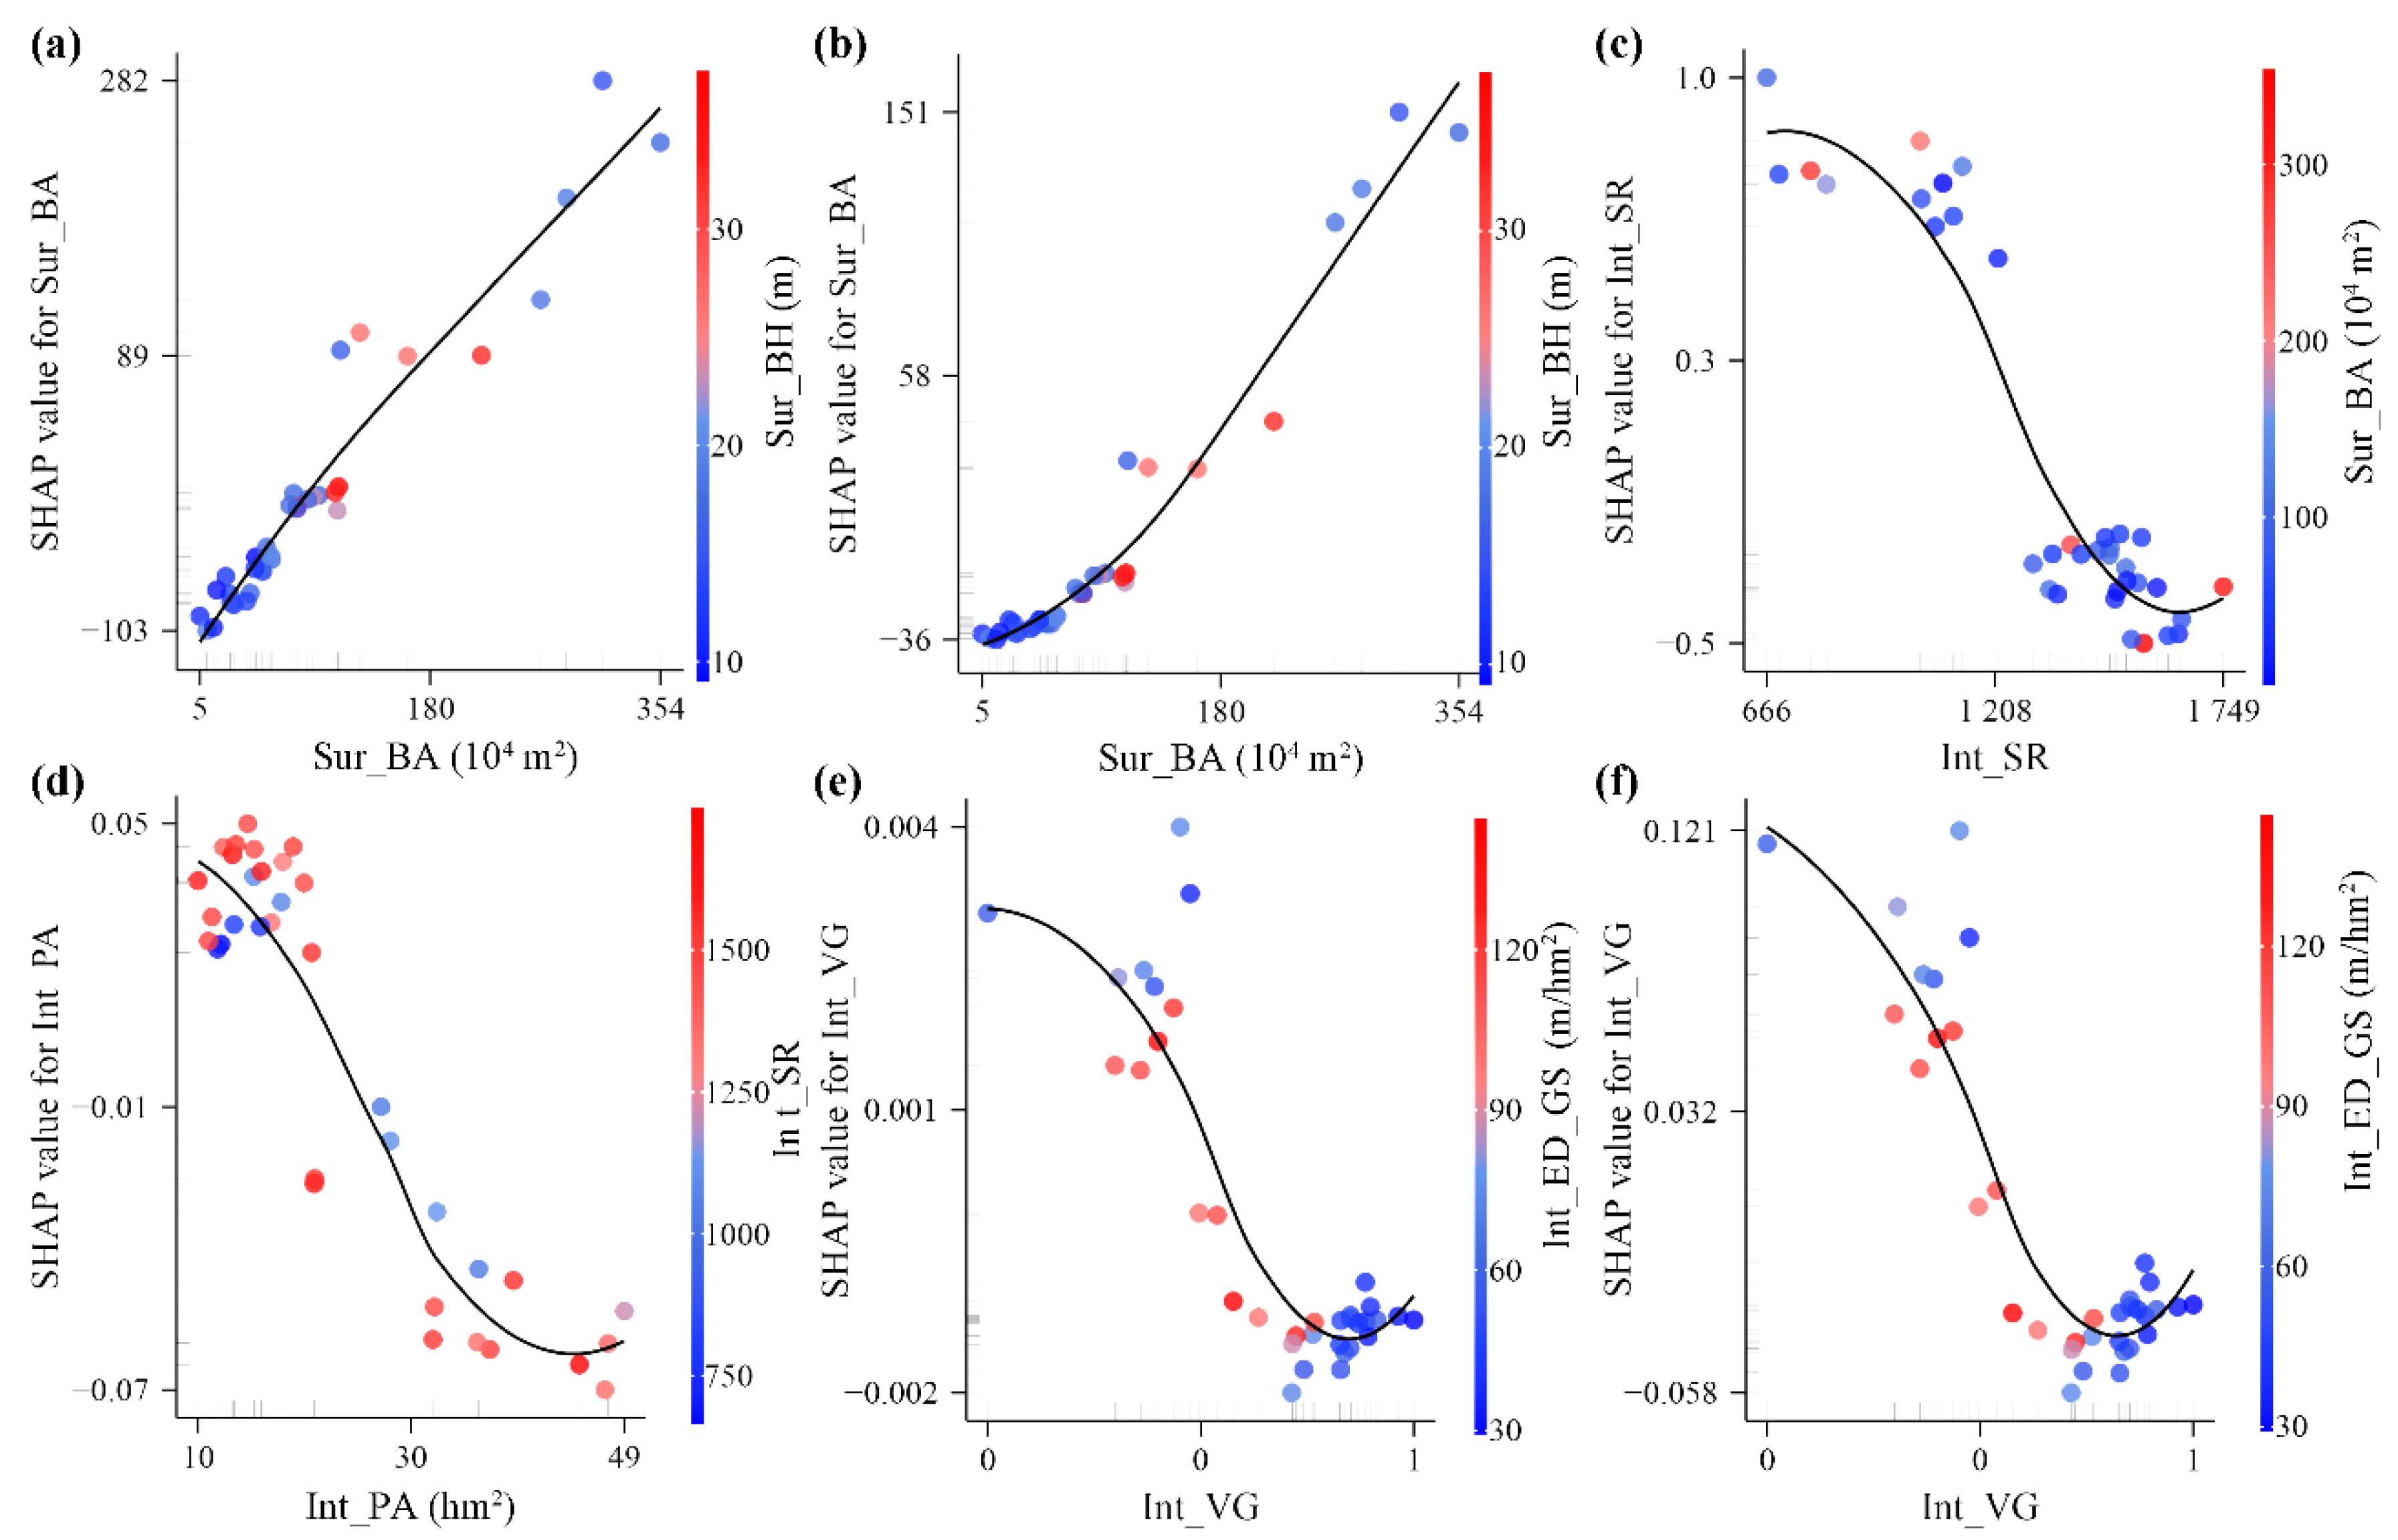
We explored the interaction effects of landscape morphology on PCE across different scales (Figure 9, Figure 10, Figure 11 and Figure 12). Considering that there were 136 pairwise combinations of landscape morphology features for each cooling indicator, we only presented the feature pairs with the strongest interactions for each cooling indicator. For all parks, the top interactions of landscape morphology features for LPCD, LPCA, LPCI, LPCE, APCI, and APCG were Sur_BA and Sur_SVF, Int_PP and Sur_BA, Int_PLAND_BS and Int_ED_BS, Int_PA and Int_PP, Int_SR and Int_PLAND_BS, and Int_SR and Int_PLAND_BS, respectively (Figure 9).
Figure 9.
Interactions of landscape morphology on six cooling indicators for all parks, including LPCD (a), LPCA (b), LPCI (c), LPCE (d), APCI (e), and APCG (f).
Figure 10.
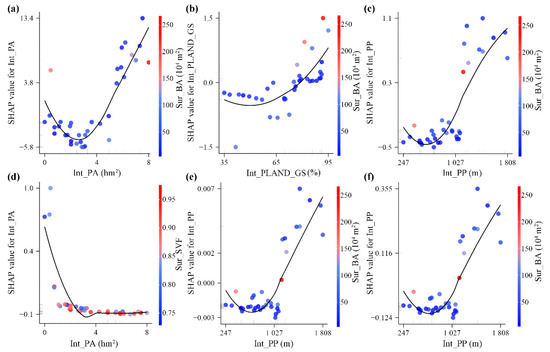
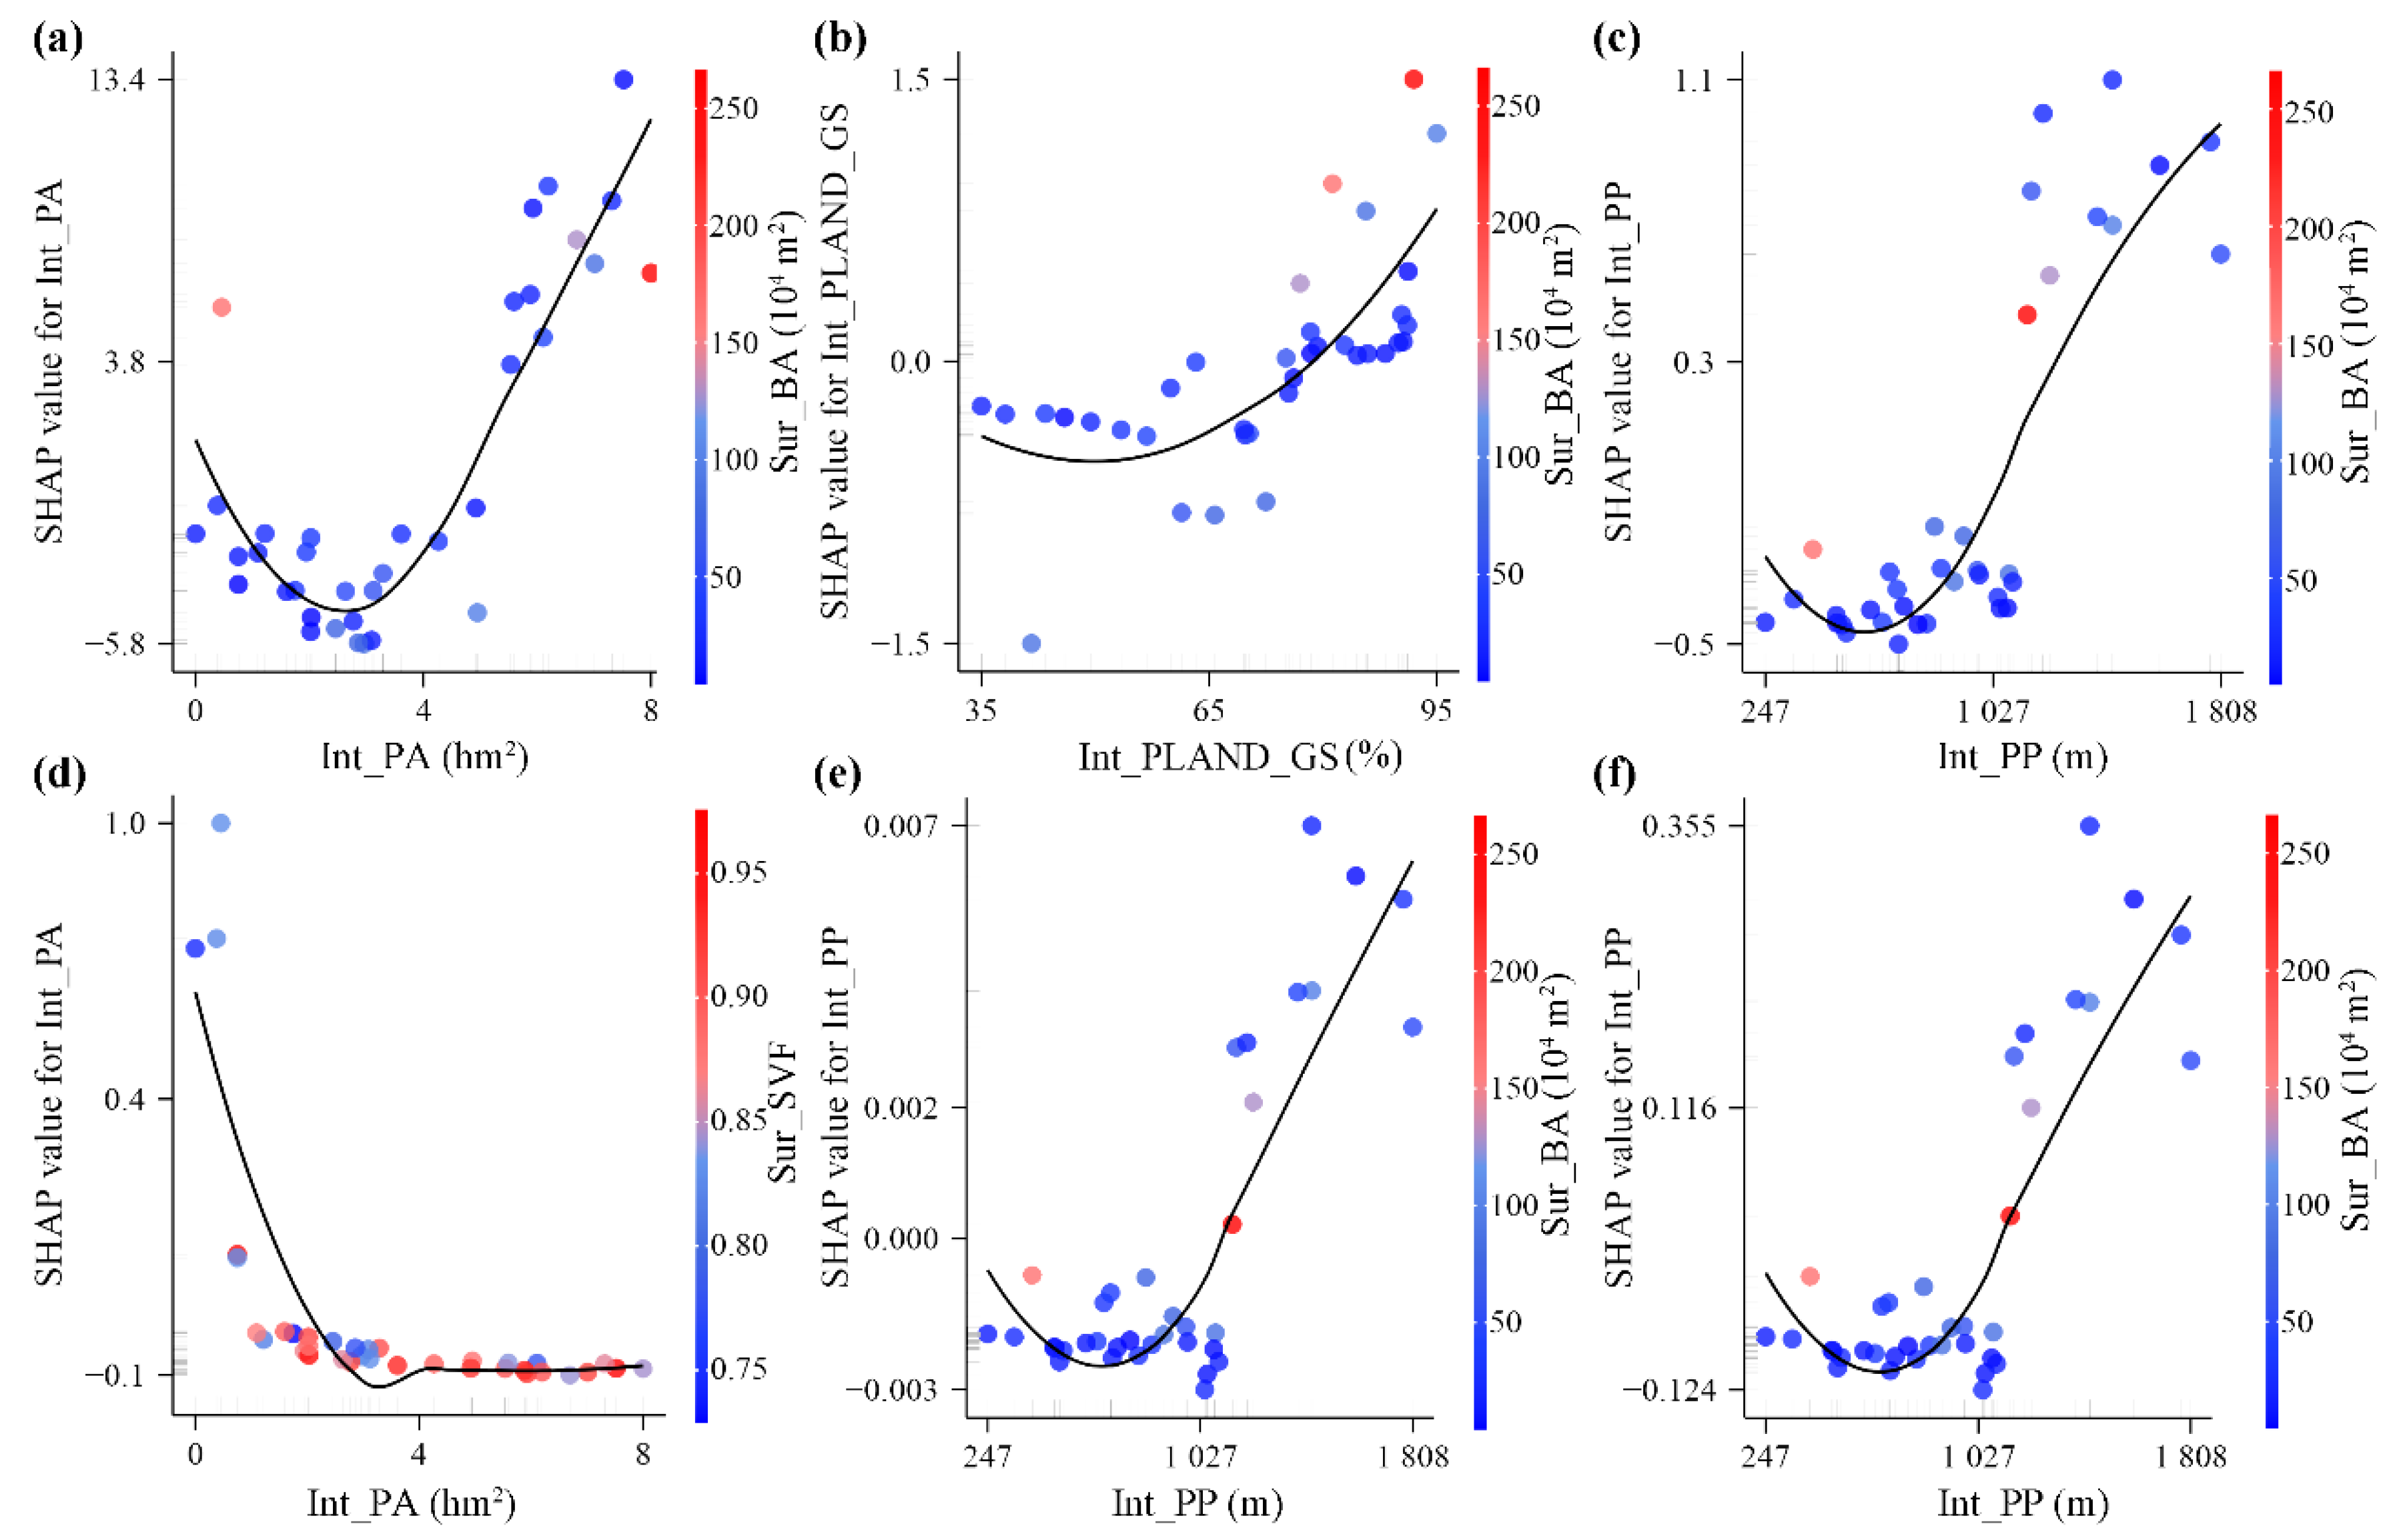
Interactions of landscape morphology on six cooling indicators for small parks, including LPCD (a), LPCA (b), LPCI (c), LPCE (d), APCI (e), and APCG (f).
Figure 11.
Interactions of landscape morphology on six cooling indicators for medium parks, including LPCD (a), LPCA (b), LPCI (c), LPCE (d), APCI (e), and APCG (f).
Figure 12.
Interactions of landscape morphology on six cooling indicators for large parks, including LPCD (a), LPCA (b), LPCI (c), LPCE (d), APCI (e), and APCG (f).
We analyzed the interactions of specific landscape morphology features on six cooling indicators across different park scales. The interactions of landscape morphology features varied across different scales. For example, the top interactions of landscape morphology features in small parks were Int_PA and Sur_BA of LPCD, Int_PLAND_GS and Sur_BA of LPCA, Int_PP and Sur_BA of LPCI, Int_PA and Sur_SVF of LPCE, Int_PP and Sur_BA of APCI, and Int_PP and Sur_BA of APCG (Figure 10). The interactions of landscape morphology features on PCE in medium and large parks are also presented in Figure 11 and Figure 12.
Overall, we found that the interactions between landscape morphology features significantly enhanced the model’s explanatory power for PCE. Moreover, combinations with strong interactions tend to be landscape morphology features that contribute more to PCE. These findings highlighted that the synergistic effects between multiple landscape morphology features exerted a far stronger impact on PCE than individual effects alone.
3.3.3. Impact Thresholds of Landscape Morphology
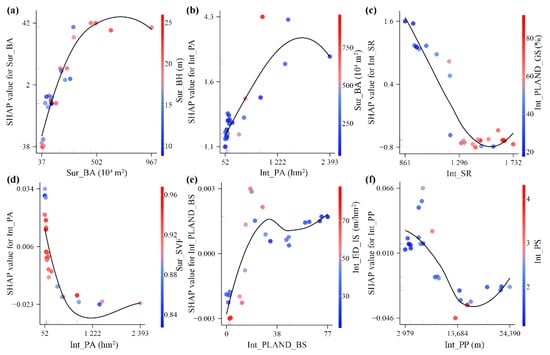
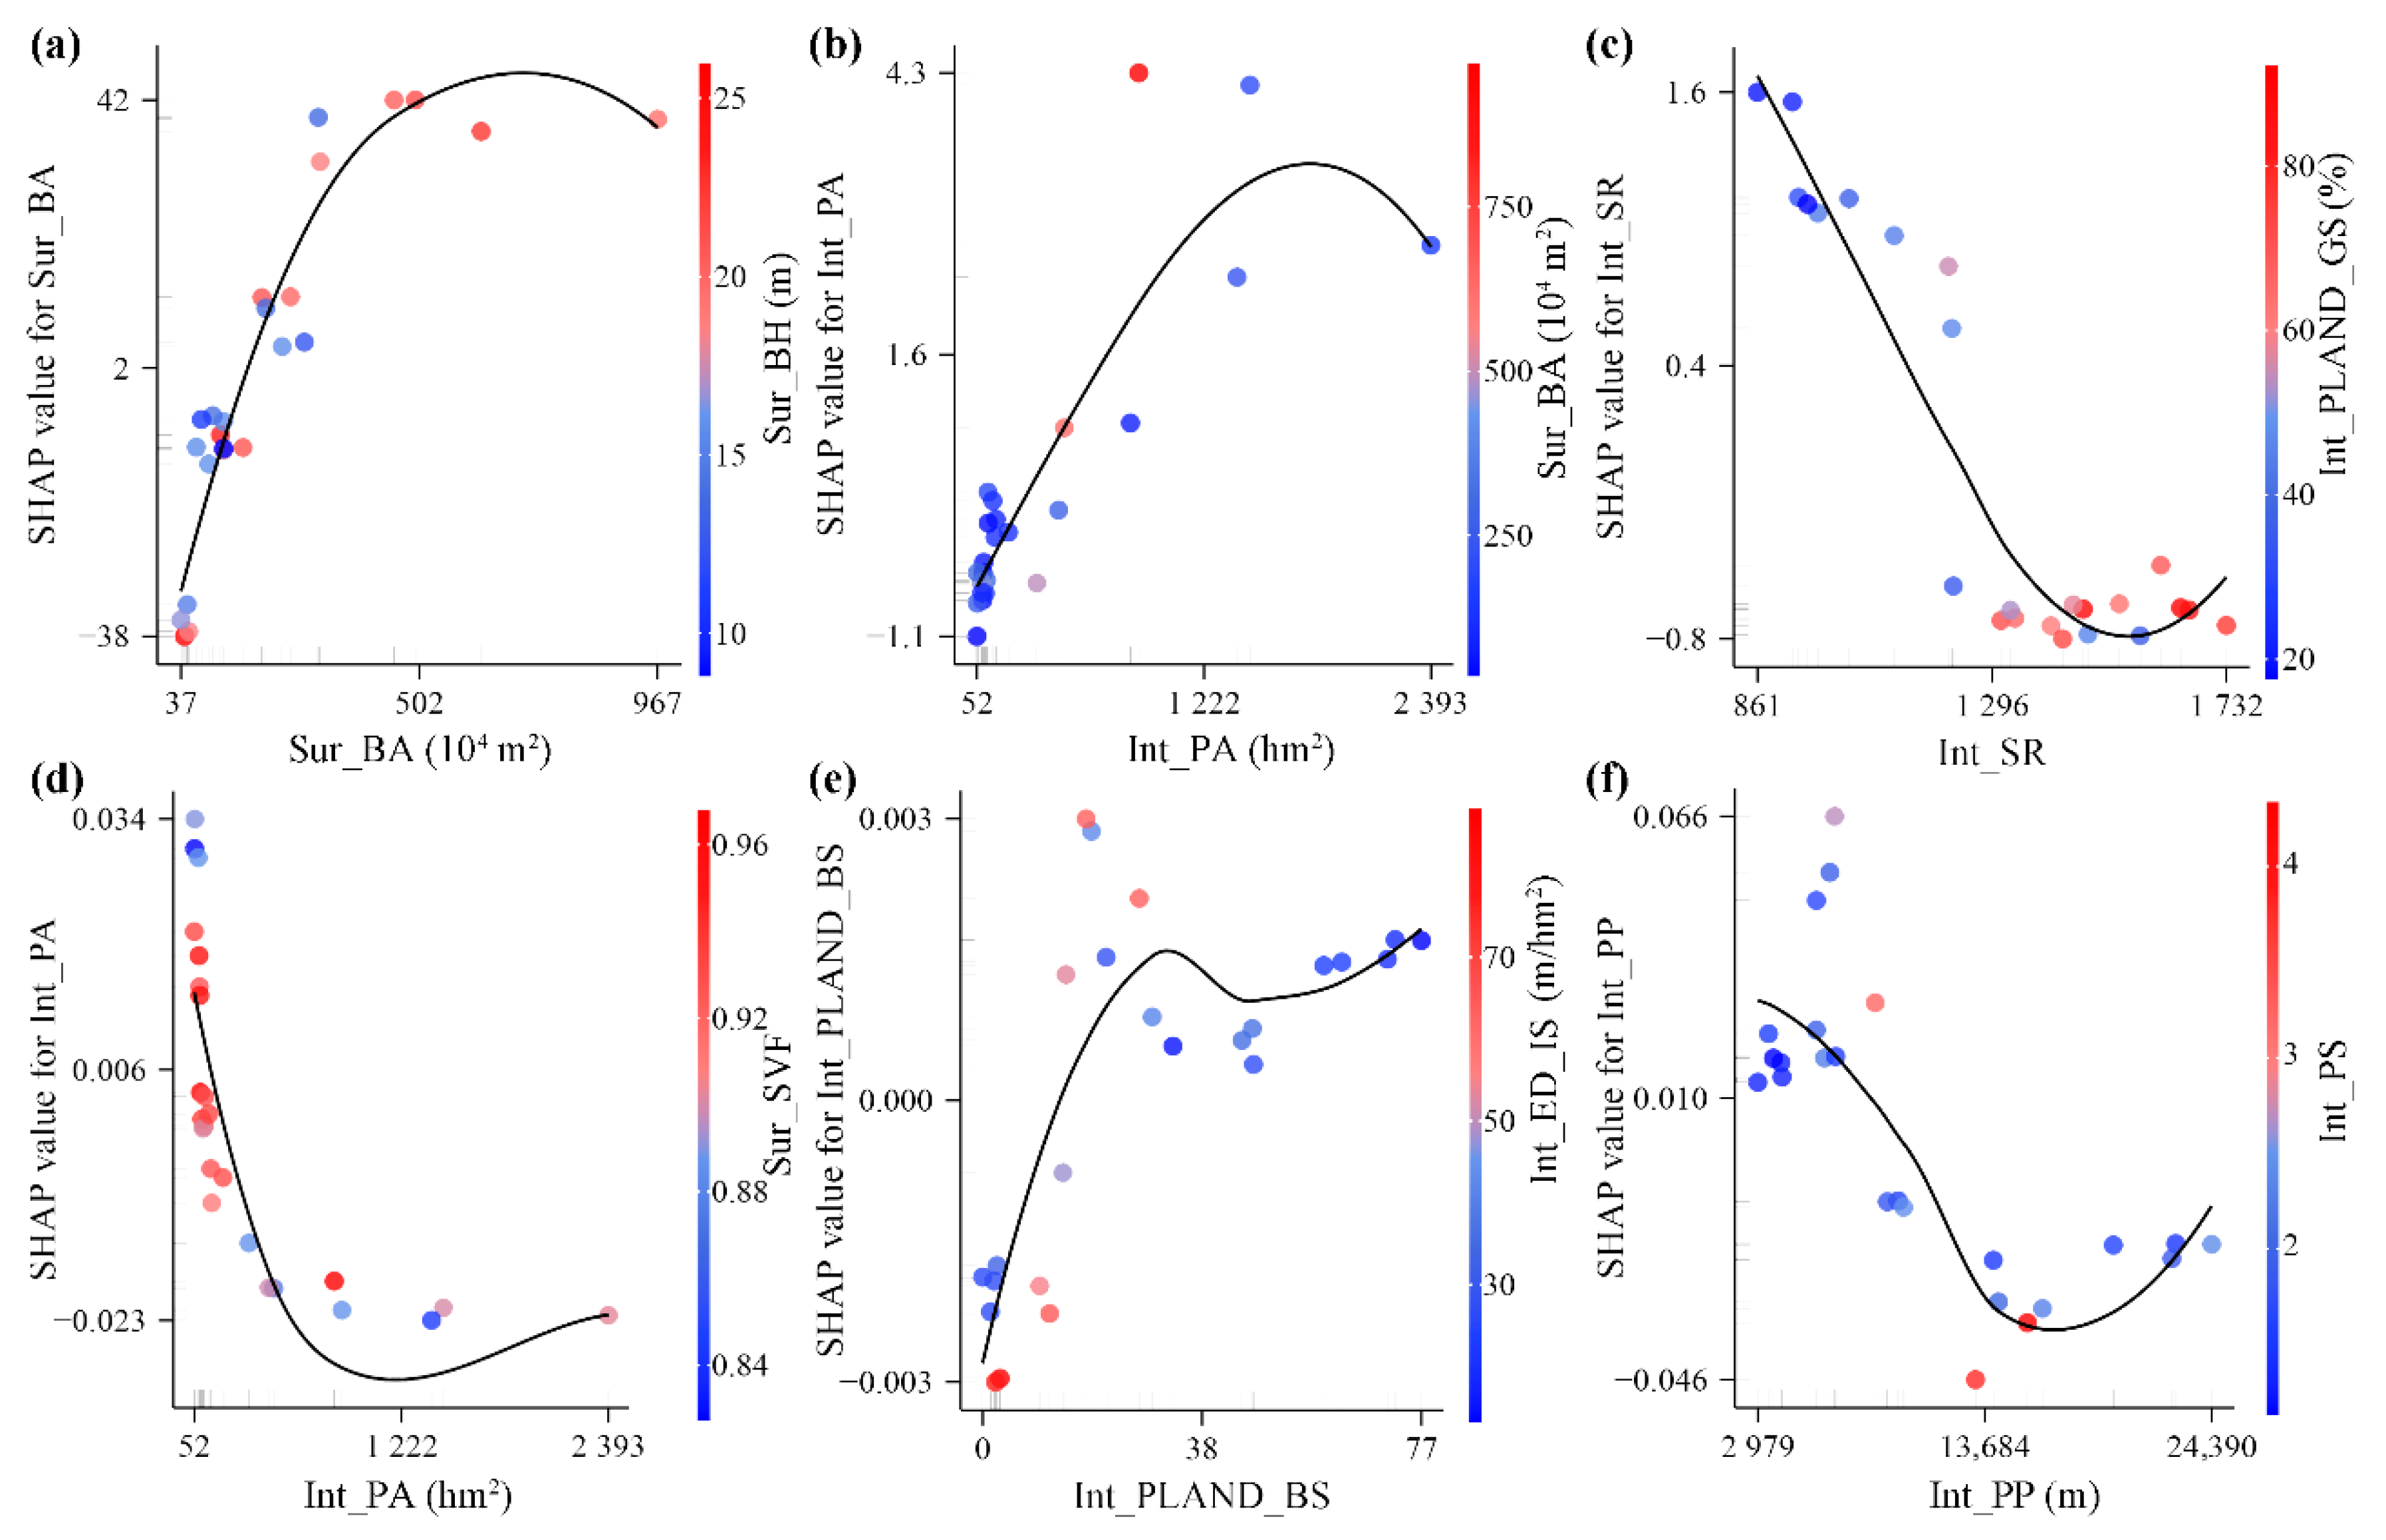
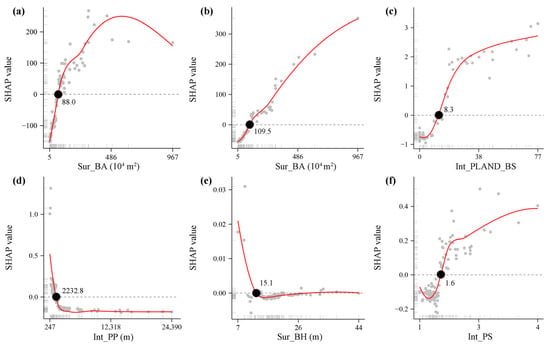
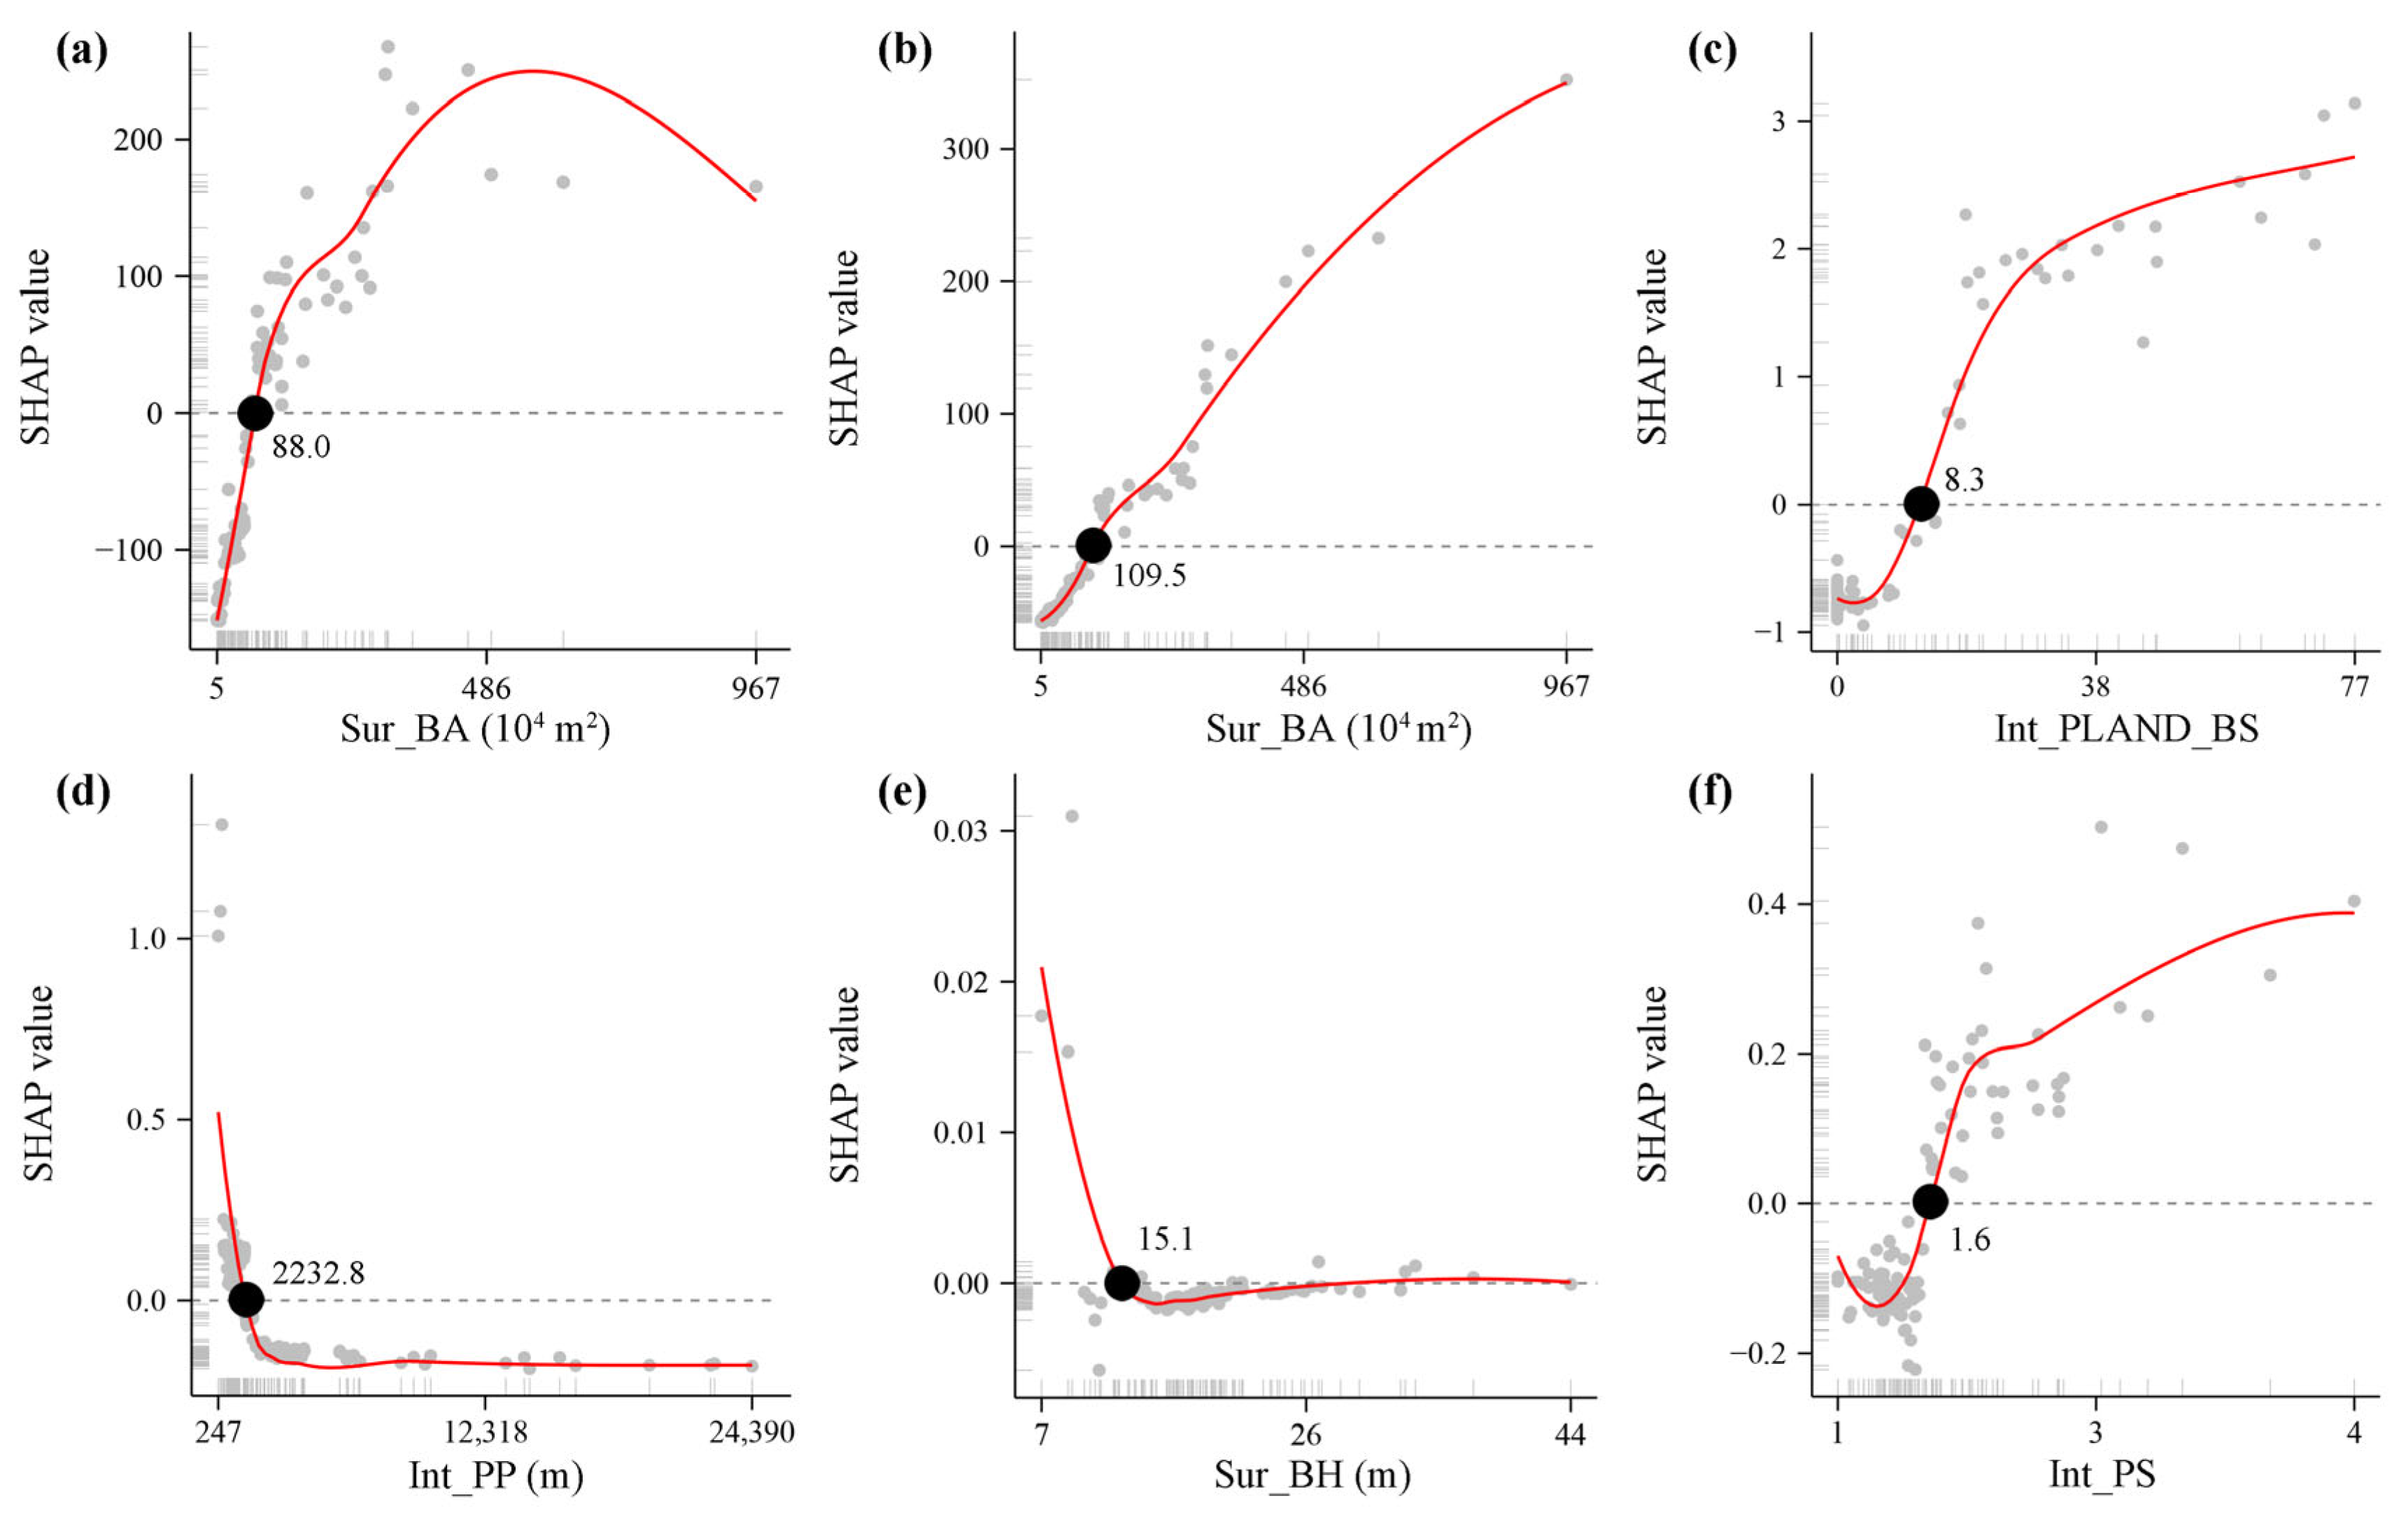
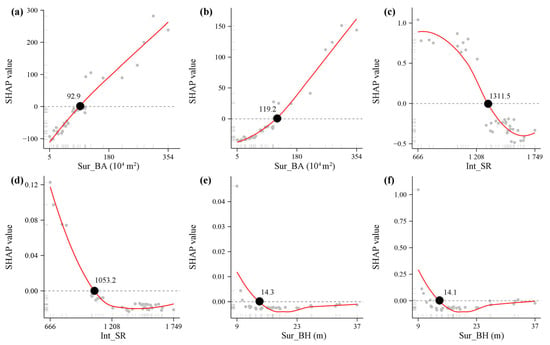
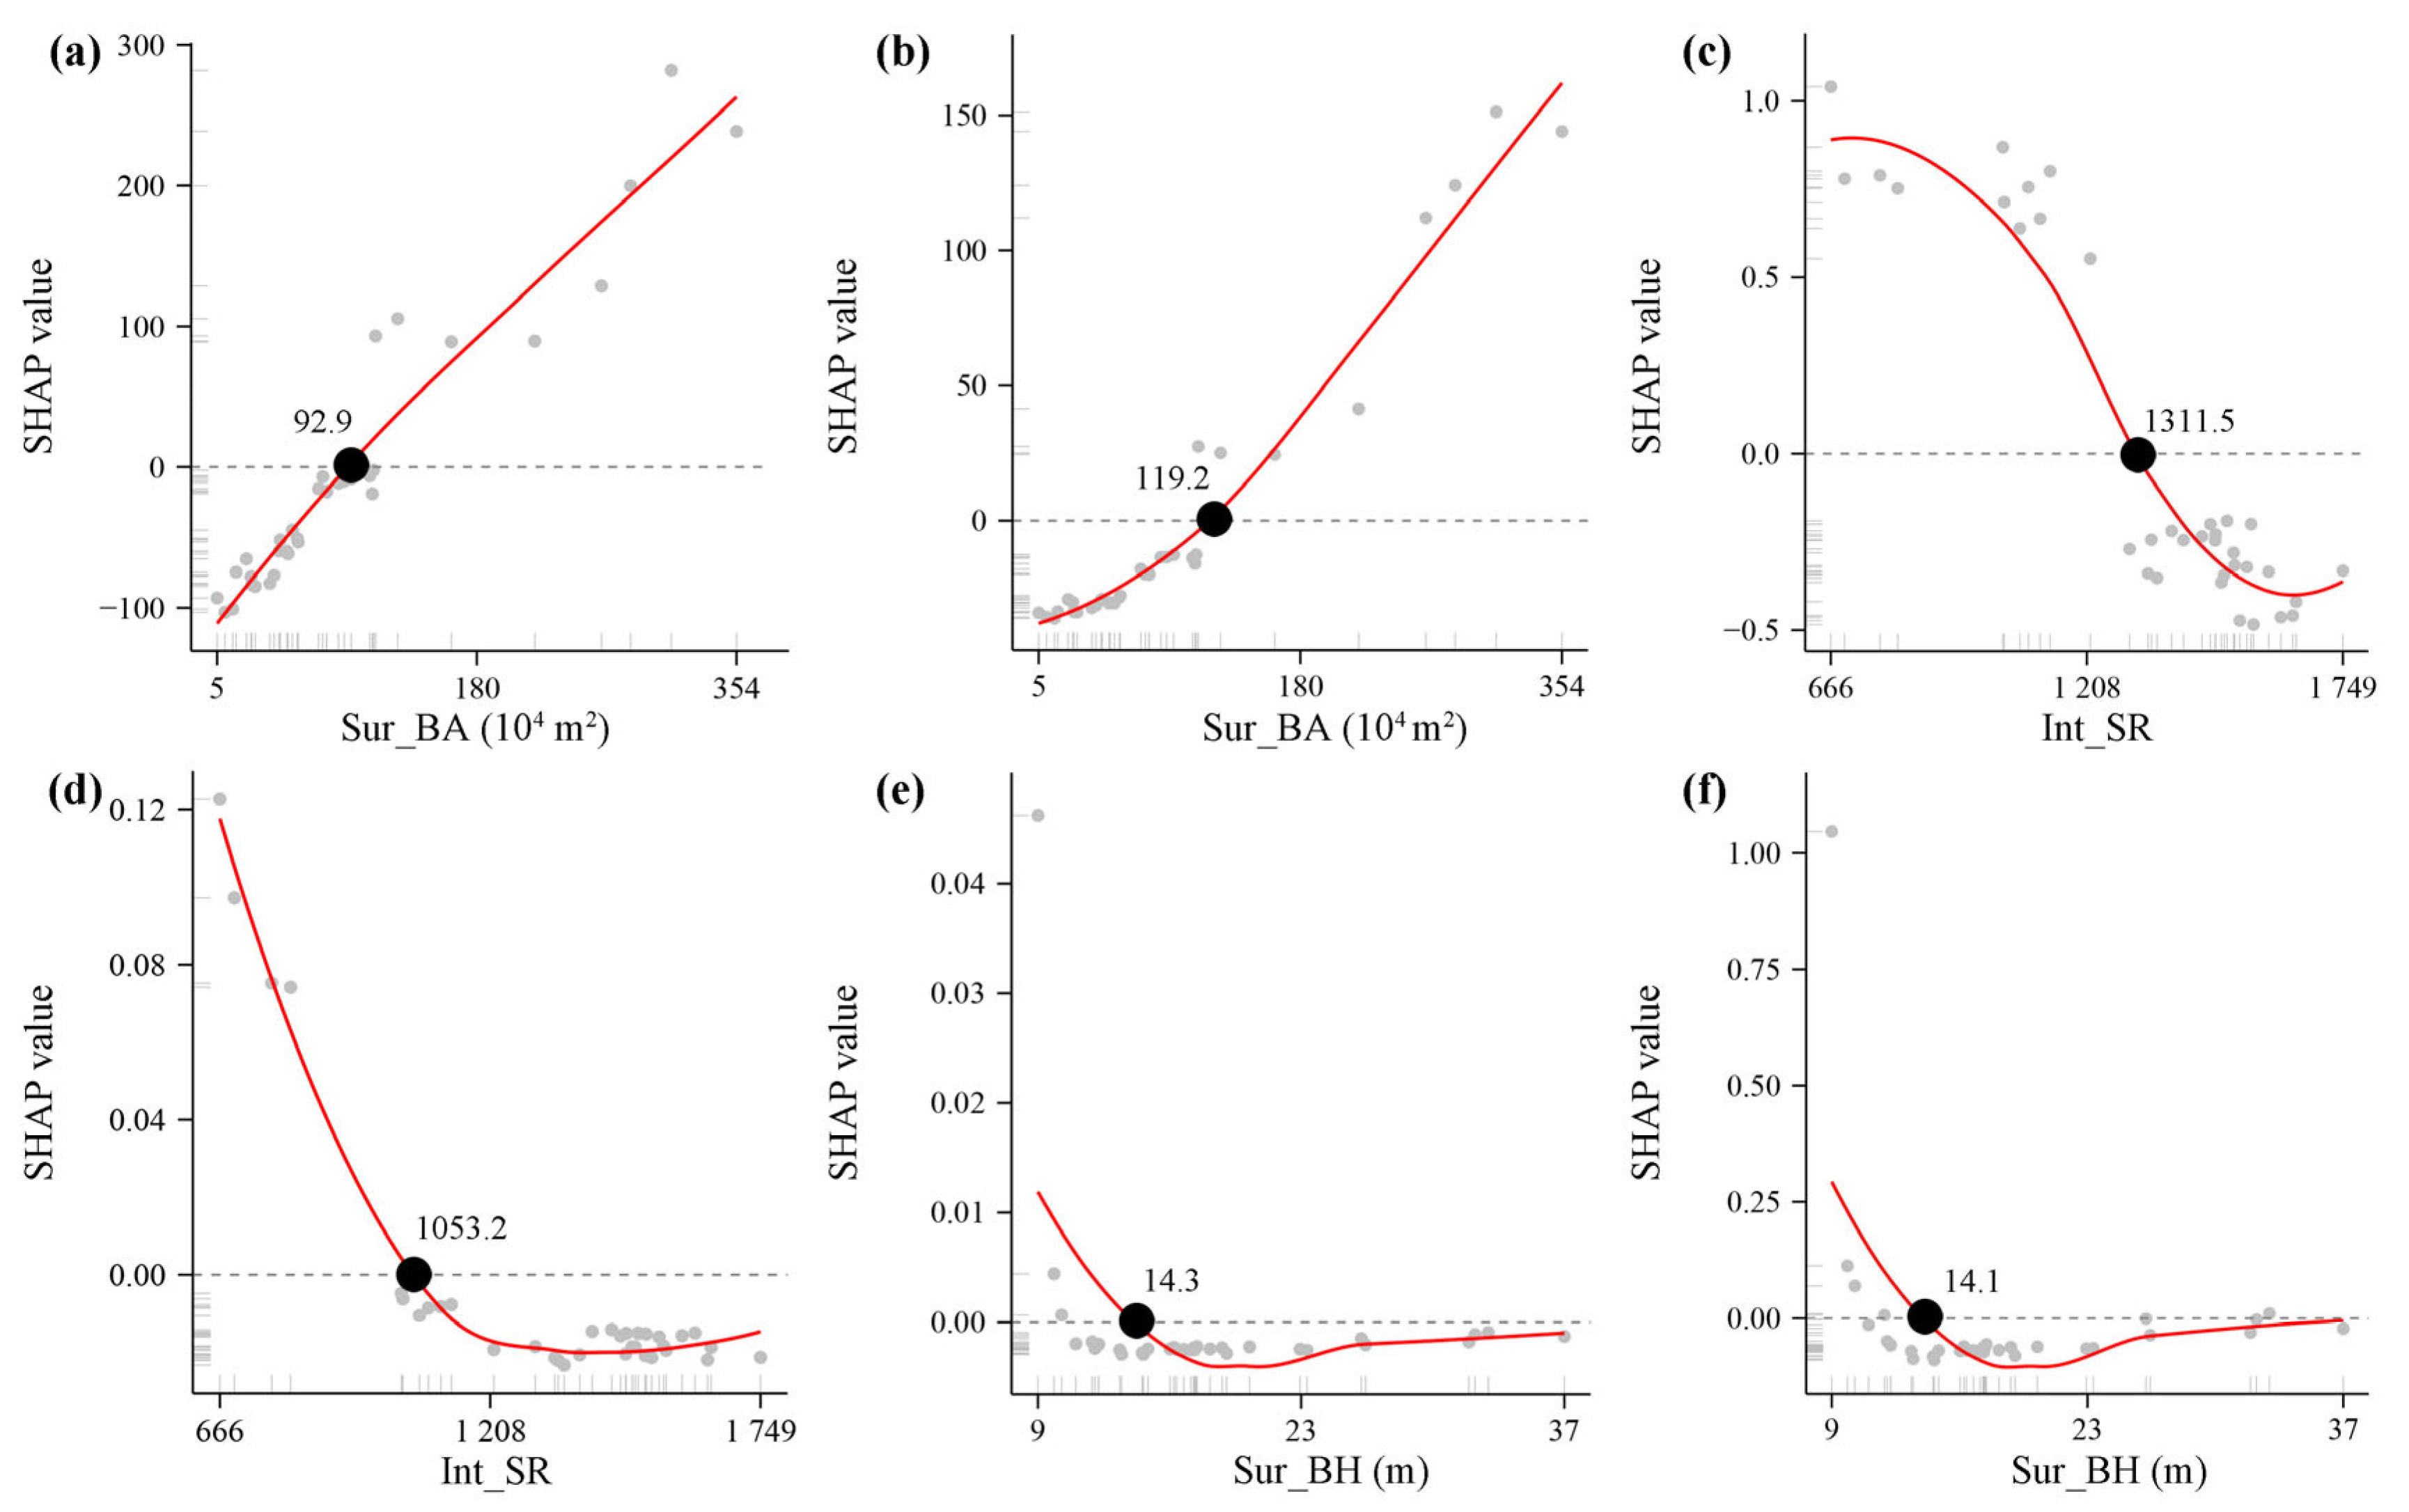
We further examined the impact thresholds of landscape morphology on six cooling indicators across different park scales (Figure 13, Figure 14, Figure 15 and Figure 16). Similarly to the analysis of feature interactions, we focused on the impact thresholds of the most important landscape morphology to PCE based on the relative contribution ranks. For all parks, the positive impact threshold of Sur_BA to LPCD was >88.0 × 10⁴ m2. This indicated that to achieve optimal park cooling distance, the Sur_BA should exceed 8.8 × 10⁵ m2 when planning across all parks. However, when Sur_BA exceeded 510 × 104 m2, this positive effect gradually diminished. The positive impact thresholds of landscape morphology also varied among different cooling indicators. The threshold of Sur_BA for LPCA was >109.5 × 10⁴ m2, while the Int_PLAND_BS for LPCI was >8.3%. The positive impact thresholds of landscape morphology to LPCE, APCI, and APCG were <2232.8 m of Int_PP, <15.1 m of Sur_BH, and >1.6 of Int_PS, respectively.
Figure 13.
Impact thresholds of landscape morphology on the six cooling indicators for all parks, including LPCD (a), LPCA (b), LPCI (c), LPCE (d), APCI (e), and APCG (f). The impact directions and thresholds of the top landscape morphology features are shown based on the highest relative contributions to PCE.
Figure 14.
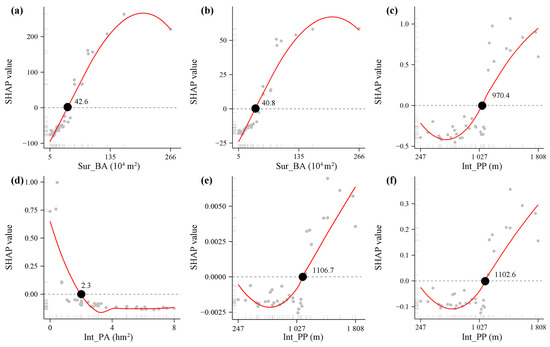
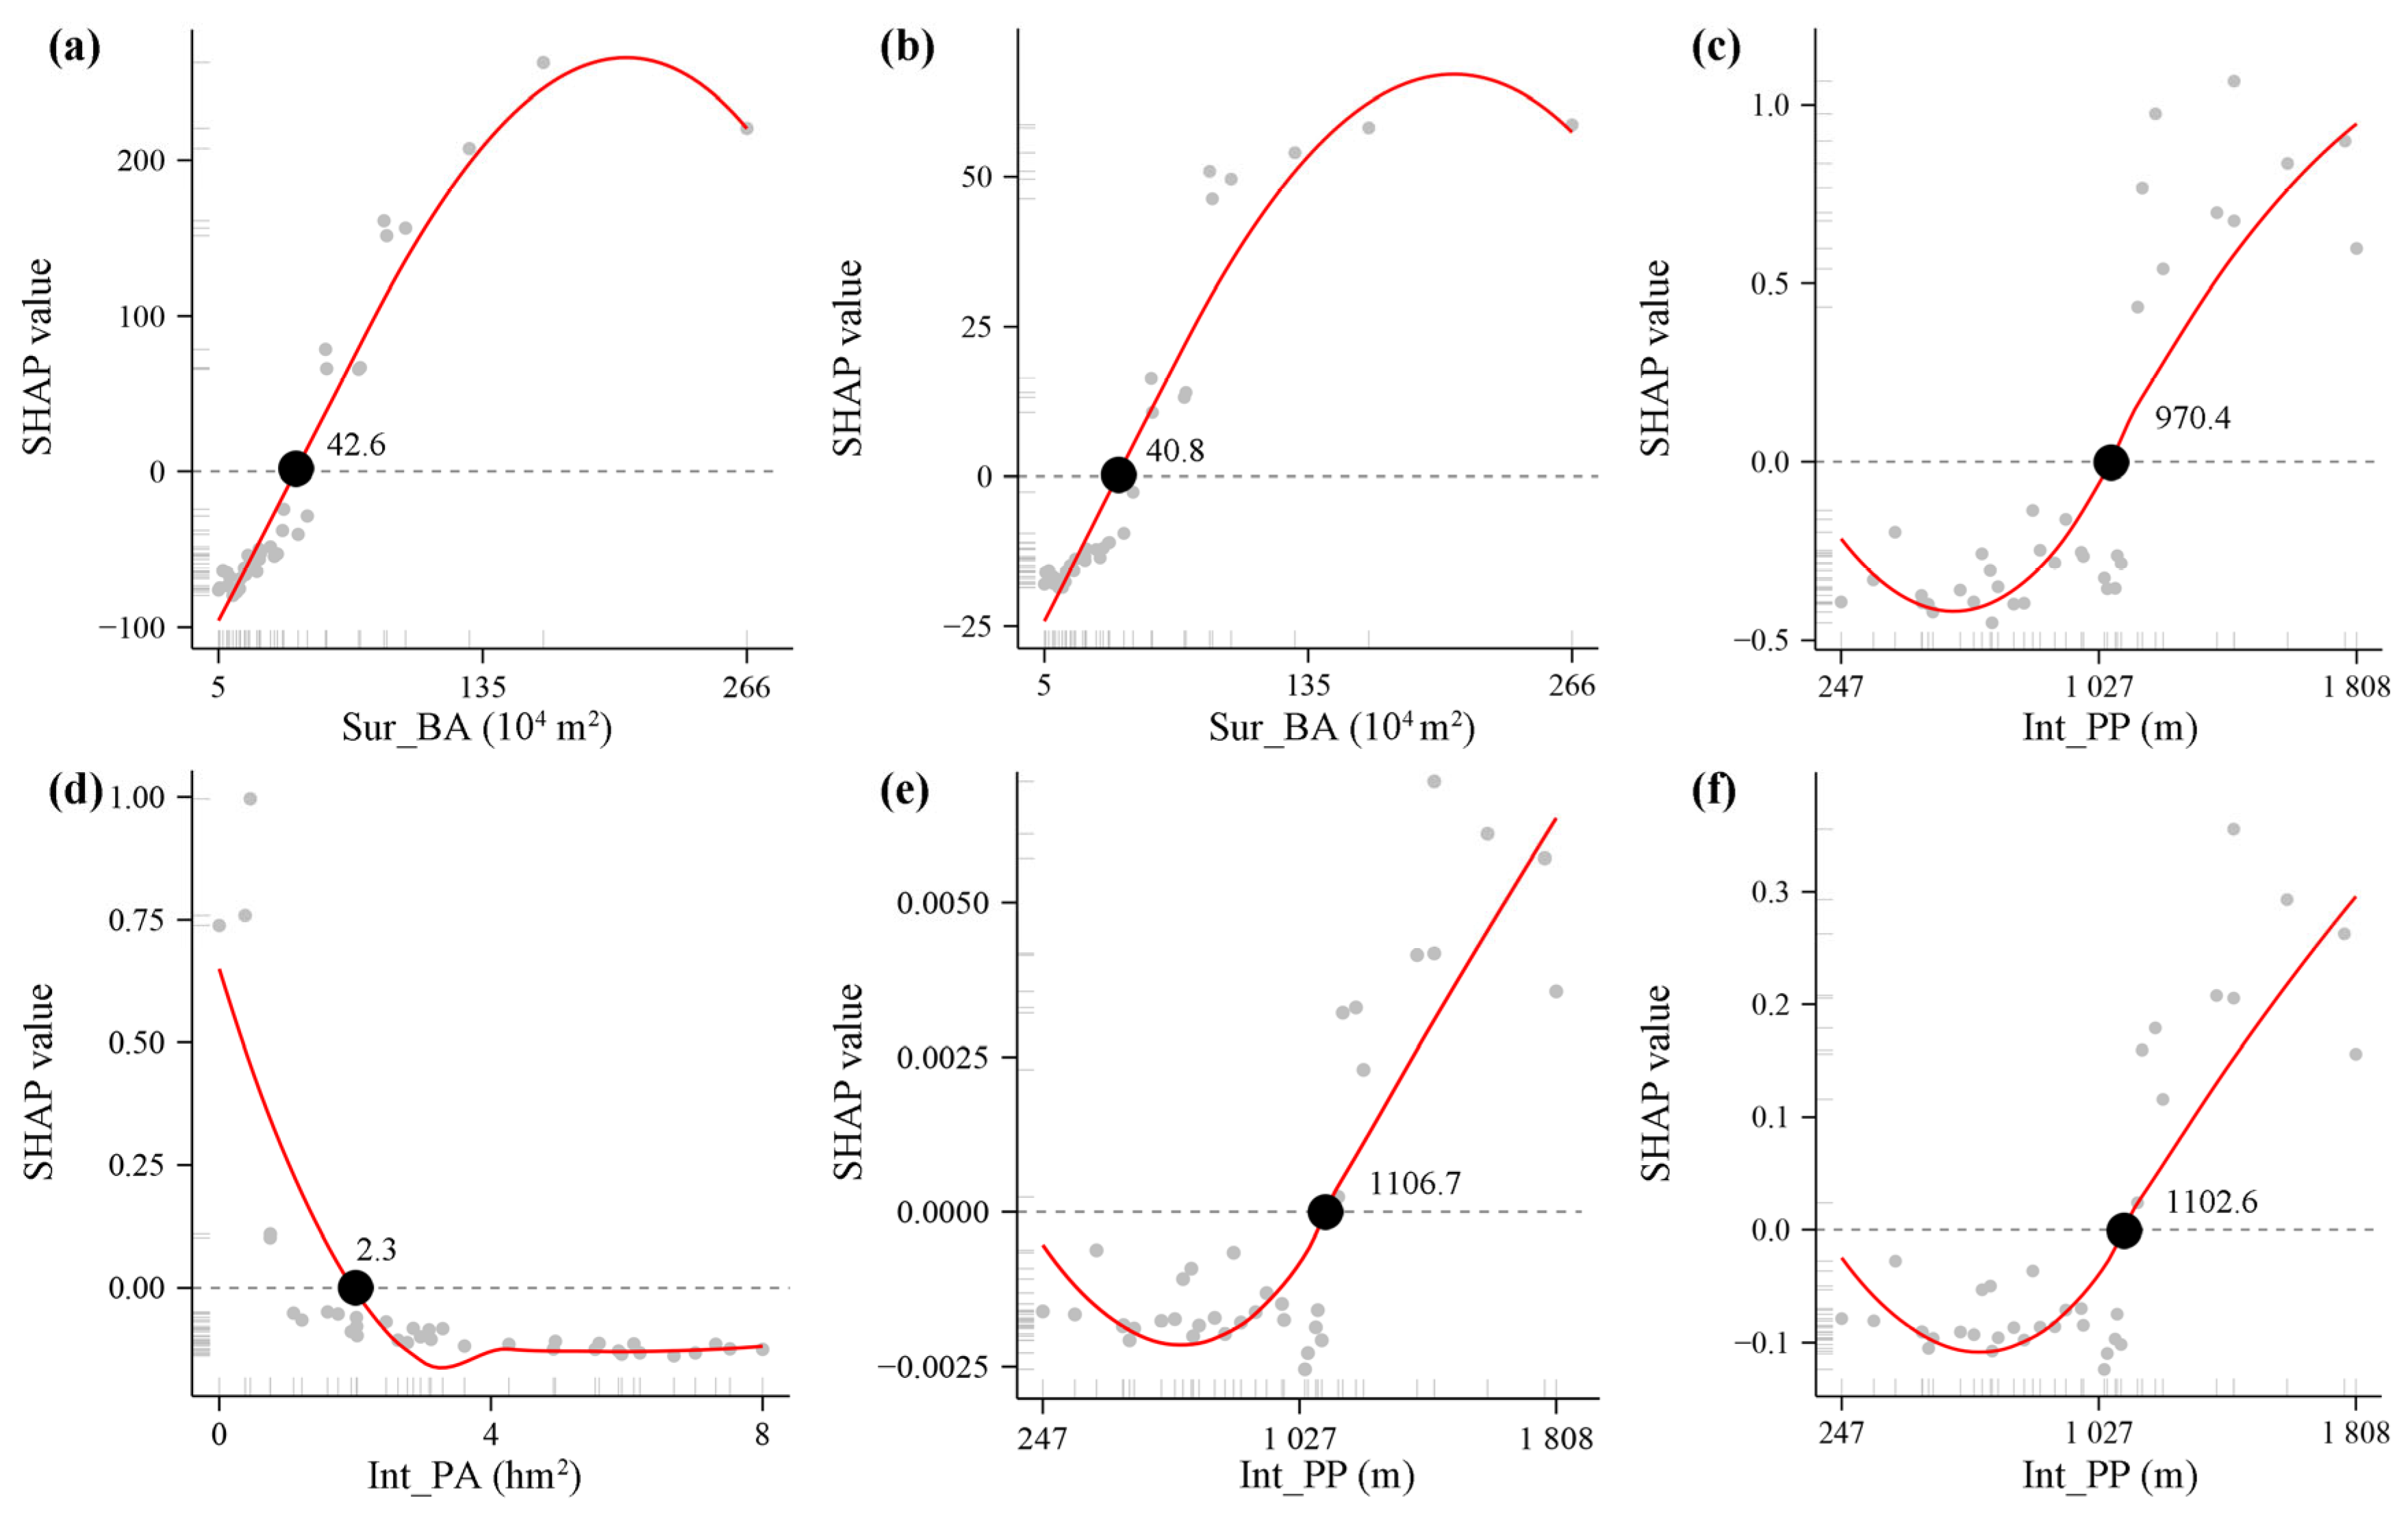
Impact thresholds of landscape morphology on the six cooling effects for small parks, including LPCD (a), LPCA (b), LPCI (c), LPCE (d), APCI (e), and APCG (f). The impact directions and thresholds of the top landscape morphology features are shown according to the strongest relative contributions to the cooling effects of urban parks.
Figure 15.
Impact thresholds of landscape morphology on the six cooling effects for medium parks, including LPCD (a), LPCA (b), LPCI (c), LPCE (d), APCI (e), and APCG (f). The impact directions and thresholds of the top landscape morphology features are shown according to the strongest relative contributions to the cooling effects of urban parks.
Figure 16.
Impact thresholds of landscape morphology on the six cooling effects for large parks, including LPCD (a), LPCA (b), LPCI (c), LPCE (d), APCI (e), and APCG (f). The impact directions and thresholds of the top landscape morphology features are shown according to the strongest relative contributions to the cooling effects of urban parks.
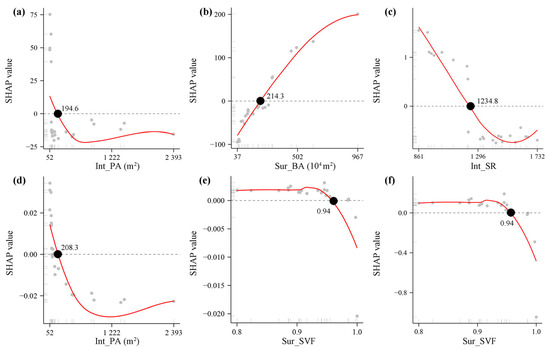
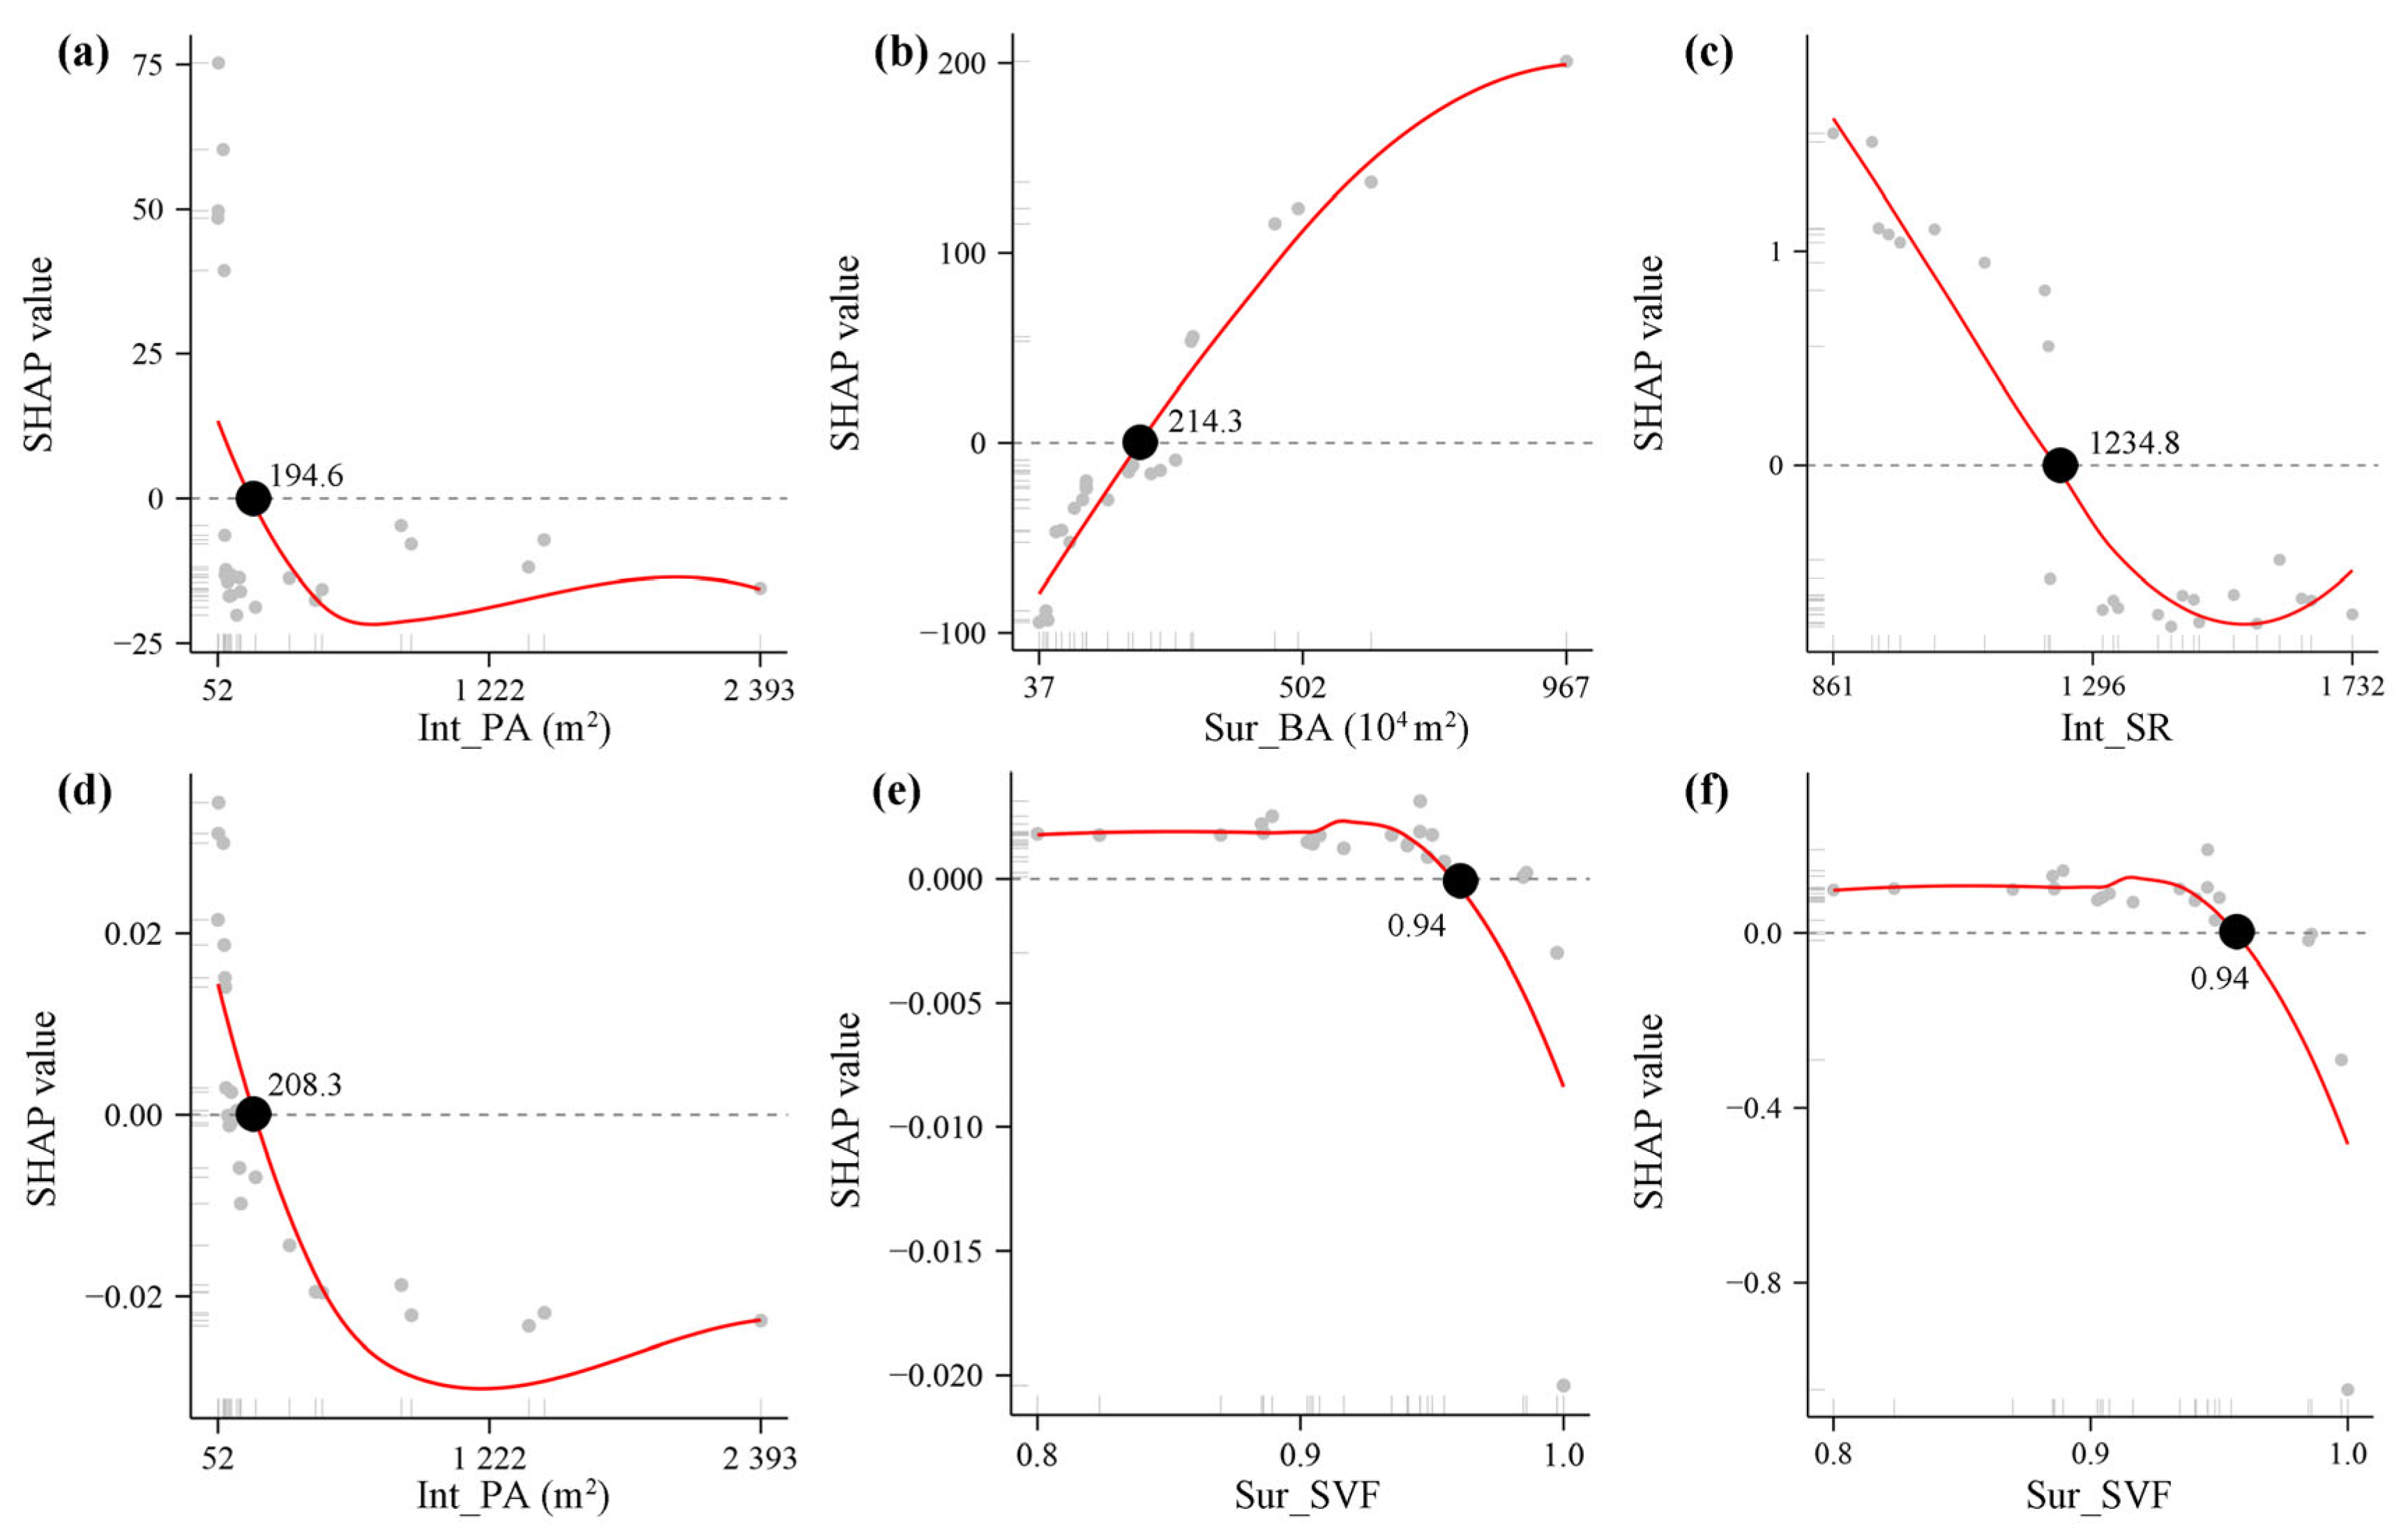
Moreover, the variations in the impact thresholds of landscape morphology features were explored across different scales (Figure 14, Figure 15 and Figure 16). The positive impact thresholds of landscape morphology features on LPCD, LPCA, LPCI, LPCE, APCI, and APCG in small parks were >42.6 × 10⁴ m2 of Sur_BA, >40.8 × 10⁴ m2 of Sur_BA, >970.4 m of Int_PP, <2.3 hm2 of Int_PP, >1106.7 m of Int_PP, and >1102.6 m of Int_PP, respectively. These impact thresholds of landscape morphology in medium and large parks are also presented in Figure 15 and Figure 16.
4. Discussion
As the UHI intensifies, urban parks are widely regarded as effective planning tools to mitigate local temperatures and offer residents with comfortable recreation spaces [6]. Although existing studies highlighted the substantial cooling effects of urban parks during summer [20], a systematic understanding of the scale of cooling mechanisms of urban parks and their driving mechanisms still remains insufficiently explored. Given that park scale critically determines the spatial ranges and intensities of cooling [13], the lack of multi-scale analyses hampers the development of reliable theoretical foundations and practical guidance for urban park planning aimed at mitigating thermal environments. Here, taking 119 urban parks in Wuhan, China, as an example, we aimed to reveal the driving mechanisms of landscape morphology on PCE across different scales, including 47 small, 41 medium, and 31 large parks, respectively.
Results showed that 79.8% of urban parks had notable cooling effects, with significant scale heterogeneity. The average LST within parks decreased with park scale: small parks > medium parks > large parks (Figure 4). Compared with small parks, the average LSTs in medium and large parks were reduced by 2.8–5.8 °C. Larger parks possess greater internal cooling capacity, enhancing their ability to absorb heat and generate cool air [34]. For key cooling indicators, LPCD, LPCA, LPCI, APCI, and APCG increased with increasing park scale, while LPCE decreased. This suggests that larger parks provide extensive and strong cooling, but the cooling efficiency per unit area tends to decline [6]. This pattern could be associated with the fact that large parks act as concentrated cooling sources, while small parks form distributed cooling networks that radiate cool air more effectively, thus improving cooling efficiency in small parks [34]. Additionally, rapid urbanization and industrialization have sharply reduced the availability of urban land. To maintain livable conditions, planners often design small-scale green spaces in densely populated and typically warmer areas, such as pocket parks or community parks [40]. Despite their limited size, small parks still play a critical role in cooling the surrounding residential areas. Therefore, urban park planning for thermal environment management requires optimizing both park scale and cooling effectiveness.
Many studies have demonstrated a strong link between landscape morphology and PCE [39]. Internal morphology was highly correlated with LPCA, LPCI, and LPCE, while the surrounding environment mainly positively correlated with LPCD and LPCA (Figure 7). However, these correlations exhibited significant heterogeneity across different park scales. For example, Int_PA and Int_PP generally showed positive correlations with LPCA and LPCI but negative correlations with LPCE in small parks. This pattern could be related to the fact that larger parks, with greater area and perimeter, usually have a more extensive interface with the surrounding environment, leading to the frequent exchange of cold air inside the park and warm air outside [14]. In contrast, smaller parks tend to form relatively enclosed microclimates, which can enhance internal cooling efficiency. However, although correlation analysis can reveal the impact direction of landscape morphology on cooling indicators, it fails to quantify the magnitude or underlying mechanisms of these effects [17]. The variations in cooling performance are likely driven by a combination of factors, such as shading and evapotranspiration from vegetation, heat storage and reflection by water bodies, and the modulation of airflow by surrounding buildings [6,13,41,42]. These processes interact with park size, shape, and configuration, resulting in scale-dependent cooling patterns [39]. Therefore, more advanced analytical approaches are required to disentangle these complex, nonlinear interactions and to quantify how specific morphology features and their interactions mechanistically influence PCE.
By combining RF and SHAP, we further explored the relative contribution, interaction, and impact threshold of landscape morphology on PCE across different scales (Figure 8, Figure 9, Figure 10, Figure 11, Figure 12, Figure 13, Figure 14, Figure 15 and Figure 16). The relative contribution of landscape morphology on PCE varied with specific cooling indicators. Taking LPCD as an example, Sur_BA was the most influential feature in small and medium parks, while Int_PA and Sur_SVF had the greatest impact in large parks. This could be because small and medium parks are usually located in densely built-up regions, where local microclimates are strongly affected by the Sur_BA [6]. In contrast, large parks are typically situated on urban fringes with weaker UHI. In such contexts, an excessively low SVF can increase solar radiation exposure (i.e., warming) and wind speed (i.e., cooling) within urban canyons [43,44], thereby amplifying temperature difference between the park and its surroundings. Moreover, larger parks tend to have longer cooling radiation distances, which largely determine their cooling distance. For LPCA, Sur_BA exerted a significant effect across all park scales. For LPCI and LPCE, internal morphology features played dominant roles, particularly Int_PP, Int_PA, and Int_SR. For APCI and APCG, Sur_SVF, Sur_BA, and Int_PS were the primary contributors. Importantly, no single features of landscape morphology were enough to fully explain the variations in PCE. These results highlighted the importance of distinguishing parks by scales and simultaneously considering both internal landscape morphology and surrounding environmental features in the studies of PCE.
In addition, interactions among specific landscape morphology features should also be incorporated into urban park planning and design for UHI mitigation. SHAP-based interaction analysis showed that the synergistic effects of multiple landscape morphology features impacted PCE far more than the individual effects of each feature [45]. However, such interactions have often been overlooked in previous studies. For example, in small parks, the interaction between Int_PA and Sur_BA significantly improved the model’s explanatory power for LPCD (Figure 10). This may be because larger park areas combined with denser surrounding buildings make the park cooling benefits more pronounced and spatially distinguishable [44]. For medium parks, the interaction between Sur_BA and Sur_BH also enhanced the model’s interpretability of LPCD (Figure 11). An increased building area expands the potential cooling demand, while greater building height enhances shading and improves vertical air circulation along building façades, collectively contributing to effective cooling [46]. A similar interaction pattern was observed in large parks (Figure 12). Overall, these results highlight the need for synergy-oriented strategies in urban park design, whereby coordinated optimization of internal morphology and the surrounding environment can jointly enhance parks’ thermal regulation capacity.
We also argued the high potential of the impact thresholds of landscape morphology on PCE across different park scales. Existing studies often evaluate the impact strengths of landscape morphology on PCE [14,42], but this focus does not always align with planners’ practical needs. Clear and quantitative thresholds for key indicators are critical for translating scientific findings into actionable urban park design strategies that enhance their thermal regulation capacity. Based on the marginal effects derived from SHAP analysis, we examined the impact thresholds of specific landscape morphology features on PCE across different park scales (Figure 13, Figure 14, Figure 15 and Figure 16). These impact thresholds reflected the shift state in the impacts of landscape morphology on PCE from negative to positive effects [27], thereby providing reliable reference ranges for urban park planning. For example, to maximize LPCD in small parks, Sur_BA should exceed 42.6 × 10⁴ m2, while enhancing LPCE requires Int_PA to be controlled below 2.3 hm2. It should be noted that these thresholds represent recommended ranges rather than absolute or fixed values. This is because park cooling effects are context-dependent and may vary with local climate conditions, surrounding urban form, background thermal environments, and park functional objectives.
In other words, optimizing PCE for thermal environment management should adopt a targeted and goal-oriented approach. Different-scale parks serve distinct roles, ranging from providing broad coverage for more residents to addressing the thermal comfort needs of specific user groups [47,48]. Accordingly, planners should balance cooling benefits against park objectives and budget constraints. Importantly, the key goal of urban park planning is not to maximize a single indicator, but to enhance multiple cooling-related metrics in a coordinated manner. Urban parks should therefore be planned and designed with distinct characteristics that reflect diverse development needs, thereby more effectively mitigate UHI. For instance, if an urban park is intended to benefit a larger number of residents, large-scale parks such as suburban parks or forest parks are preferable, as they can provide wider LPCD, LPCA, and LPCI. In contrast, when the objective is to serve specific groups, such as local residents in surrounding neighborhoods, small-scale parks are more suitable, as they typically exhibit higher LPCE. With limited budgets, a comprehensive park that integrates vegetation and water elements may represent a cost-effective strategy, as such parks generally deliver relatively balanced and stable cooling benefits. Beyond scale-based planning, our findings highlighted the importance of explicitly integrating the driving mechanisms of landscape morphology on PCE into spatial planning, including relative contributions, interactions, and threshold impacts. For example, in large parks, simply increasing area does not necessarily enhance cooling performance; once the park exceeds 194.6 hm2, LPCD tends to decrease. Such threshold-based guidance offers planners a flexible yet quantitative framework for balancing competing design goals. In practice, information on the driving mechanisms of landscape morphology can be used as reference benchmarks to support scenario-based planning, enabling more targeted and efficient implementation of heat-mitigation-oriented park strategies.
We also acknowledge that there are some limitations. Firstly, this study explored the PCE across different scales based solely on instantaneous daytime remote sensing imagery acquired on 5 July 2024, and therefore did not capture diurnal, seasonal, or interannual variations in park cooling performance. Although typical-day analysis based on high-quality thermal imagery is a widely adopted and practical approach in urban climate studies, park cooling effects are strongly influenced by meteorological conditions such as wind speed, wind direction, cloud cover, and antecedent weather patterns [21]. For example, at night, the thermal inertia and relatively stable temperature of water bodies within parks may reduce temperature contrasts with surrounding built-up areas and even lead to localized warming effects [49]. Future studies should therefore integrate multi-temporal observations or long-term monitoring data to better capture the dynamic cooling behavior of urban parks across different temporal scales. Secondly, due to limitations in data resolution and availability, this study only considered the impacts of typical landscape morphology features on PCE, ignoring factors such as mean park-to-building distance, tree age, tree species, aquatic plants, community structure, tree height, canopy size, ventilation conditions, wind speed, windward area index, and building type, as well as the potential synergistic cooling effects of surrounding green spaces and water bodies. [42,50]. The omission of these biophysical, aerodynamic, and structural variables may constrain a more comprehensive interpretation of the mechanisms linking landscape morphology and PCE [51]. In addition, the antagonistic effects of multiple landscape morphology features on PCE were not considered in this study. Future research could benefit from integrating or developing more advanced analytical and modeling frameworks to move beyond pairwise interactions and reveal the compound effects of multiple landscape morphology features on PCE. Thirdly, the identified impacted thresholds of landscape morphology features influencing PCE represent static, summer-specific reference values and do not account for potential dynamic adjustments under different seasonal conditions or surrounding environmental contexts. Future studies should explore seasonally adaptive and context-dependent threshold behaviors of landscape morphology features to provide more flexible and transferable guidance for urban park planning and design. Finally, although Wuhan is a representative humid and hot city in China, the findings of this study were derived from a single-city case and therefore did not explicitly account for regional differences in climate background, prevailing wind regimes, topography, and surface conditions [52]. For instance, cities in arid regions (e.g., Urumqi) or temperate continental climates (e.g., Beijing) may exhibit different relationships between landscape morphology and park cooling effects due to variations in water availability, vegetation phenology, and seasonal thermal dynamics. To enhance the external validity and generalizability of our conclusions, future research should analyze cities with distinct climatic and environmental characteristics and carry out some comparative analyses across climatic zones, thus offering more globally relevant scientific insights for climate-adaptive urban planning.
5. Conclusions
As a typical entire process strategy, urban parks play an important role in mitigating urban heat island effects. Although previous studies highlighted the complex impacts of landscape morphology on urban park cooling effects (PCE), the interactions and impact thresholds between specific features on PCE remain insufficiently explored across different scales. Here, taking 119 urban parks in the furnace city of Wuhan, the PCE and their responses to landscape morphology were quantified across three scales, including 47 small, 41 medium, and 31 large parks. Firstly, by linking four maximum-impacted and two accumulative-impacted indices, the spatial characteristics of urban PCE across different scales were quantified, including the largest park cooling distance (LPCD), the largest park cooling area (LPCA), the largest park cooling intensity (LPCI), the largest park cooling efficiency (LPCE), the accumulative park cooling gradient (APCG), and the accumulative park cooling intensity (APCI), respectively. Secondly, a comprehensive analytical framework was proposed to explain landscape morphology of urban parks, encompassing eleven internal morphology features and six surrounding environment features. Finally, by combining RF and SHAP, the driving mechanisms of landscape morphology on PCE across different scales were explored, including relative contributions, interactions, and impact thresholds.
The results showed that 79.8% of parks (95) exhibited obvious cooling effects. From small to large parks, LPCD, LPCA, LPCI, APCG, and APCI increased, while LPCE decreased. Internal morphology features were significantly associated with LPCI and LPCE in small and medium parks, while they were closely related to LPCA, LPCI, and LPCE in large parks. Surrounding environment features showed a consistently positive correlation with LPCD, LPCA, and LPCE across all scales. Scale-dependent differences in landscape morphology impacting specific cooling indicators were evident. In small parks, LPCD and LPCA were significantly impacted by the surrounding environment, while LPCI, LPCE, APCI, and APCG were mainly affected by internal morphology. In medium parks, LPCD, LPCA, APCI, and APCG were driven by the surrounding environment, while LPCI and LPCE were more strongly impacted by internal morphology. In large parks, LPCA, APCI, and APCG were mainly associated with the surrounding environment, while LPCD and LPCI were determined by internal morphology. Furthermore, interactions among morphology features notably enhanced model explanatory power, and these features exhibited obvious threshold-dependent effects on park cooling effects. These findings enhance our understanding of cross-scale cooling mechanisms of urban parks and provide valuable insights for urban park planning aimed at mitigating urban heat island effects.
Author Contributions
Conceptualization, W.Z. and D.L.; Data Curation, W.Z.; Formal Analysis, W.Z.; Methodology, W.Z. and D.L.; Software, W.Z.; Visualization, W.Z.; Investigation, W.Z.; Writing—Original Draft, W.Z. and D.L.; Funding Acquisition, D.L.; Supervision, D.L.; Writing—Review and Editing, D.L. All authors have read and agreed to the published version of the manuscript.
Funding
This research received no external funding.
Data Availability Statement
The original contributions presented in the study are included in the article. Further inquiries can be directed to the corresponding author.
Conflicts of Interest
The authors declare no conflicts of interest.
References
- Hoegh-Guldberg, O.; Jacob, D.; Taylor, M.; Guillén Bolaños, T.; Bindi, M.; Brown, S.; Camilloni, I.A.; Diedhiou, A.; Djalante, R.; Ebi, K.; et al. The human imperative of stabilizing global climate change at 1.5 °C. Science 2019, 365, eaaw6974. [Google Scholar] [CrossRef] [Scilit] [PubMed]
- Yuan, Y.; Li, X.; Wang, H.; Geng, X.; Gu, J.; Fan, Z.; Wang, X.; Liao, C. Unraveling the global economic and mortality effects of rising urban heat island intensity. Sustain. Cities Soc. 2024, 116, 105902. [Google Scholar] [CrossRef] [Scilit]
- Romanello, M.; Walawender, M.; Hsu, S.-C.; Moskeland, A.; Palmeiro-Silva, Y.; Scamman, D.; Smallcombe, J.W.; Abdullah, S.; Ades, M.; Al-Maruf, A.; et al. The 2025 report of the Lancet Countdown on health and climate change. Lancet 2025, 406, 2804–2857. [Google Scholar] [CrossRef] [Scilit] [PubMed]
- Romanello, M.; Di Napoli, C.; Green, C.; Kennard, H.; Lampard, P.; Scamman, D.; Walawender, M.; Ali, Z.; Ameli, N.; Ayeb-Karlsson, S. The 2023 report of the Lancet Countdown on health and climate change: The imperative for a health-centred response in a world facing irreversible harms. Lancet 2023, 402, 2346–2394. [Google Scholar] [CrossRef] [Scilit]
- Kennedy, J.; Trewin, B.; Betts, R.; Thorne, P.; Foster, P.; Siegmund, P.; Ziese, M.; Mishra, S.; Uhlenbrook, S.; Alvar-Beltran, J. State of the Climate 2024. Update for COP29; World Meteorological Organization: Geneva, Switzerland, 2024. [Google Scholar]
- Li, J.; Chen, D.; Ou, J.; Rui, Q.; Jin, B.; Zhu, Z.; Ding, G. Exploring the integrating factors and size thresholds affecting cooling effects in urban parks: A diurnal balance perspective. Sustain. Cities Soc. 2025, 126, 106386. [Google Scholar] [CrossRef] [Scilit]
- Kumar, P.; Debele, S.E.; Khalili, S.; Halios, C.H.; Sahani, J.; Aghamohammadi, N.; de Fatima Andrade, M.; Athanassiadou, M.; Bhui, K.; Calvillo, N. Urban heat mitigation by green and blue infrastructure: Drivers, effectiveness, and future needs. Innovation 2024, 5, 100588. [Google Scholar] [CrossRef] [Scilit]
- Wang, Y.; Ouyang, W. Investigating the heterogeneity of water cooling effect for cooler cities. Sustain. Cities Soc. 2021, 75, 103281. [Google Scholar] [CrossRef] [Scilit]
- Tan, X.; Sun, X.; Huang, C.; Yuan, Y.; Hou, D. Comparison of cooling effect between green space and water body. Sustain. Cities Soc. 2021, 67, 102711. [Google Scholar] [CrossRef] [Scilit]
- Ziter, C.D.; Pedersen, E.J.; Kucharik, C.J.; Turner, M.G. Scale-dependent interactions between tree canopy cover and impervious surfaces reduce daytime urban heat during summer. Proc. Natl. Acad. Sci. USA 2019, 116, 7575–7580. [Google Scholar] [CrossRef] [Scilit]
- Lu, Y.; Hu, Y.; He, T.; Yue, W.; Shan, Z.; Chen, Y. How does urban form explain water cooling effect heterogeneity: A case study in Wuhan, China. Build. Environ. 2024, 265, 111973. [Google Scholar] [CrossRef] [Scilit]
- Yang, J.; Li, Z.; Zhou, Y.; Bai, X.; Xin, J.; Kang, X.; Nie, G.; Zhang, Y.; Zhou, L.; Xiao, X.; et al. Systematic overestimation of urban Parks’ cooling effects may mislead heat-governance-oriented park planning. Landsc. Urban Plann. 2025, 264, 105467. [Google Scholar] [CrossRef] [Scilit]
- Menteş, Y.; Yilmaz, S.; Qaid, A. The cooling effect of different scales of urban parks on land surface temperatures in cold regions. Energy Build. 2024, 308, 113954. [Google Scholar] [CrossRef] [Scilit]
- Qiu, K.; Jia, B. The roles of landscape both inside the park and the surroundings in park cooling effect. Sustain. Cities Soc. 2020, 52, 101864. [Google Scholar] [CrossRef] [Scilit]
- Zhang, Q.; Zhou, D.; Xu, D.; Rogora, A. Correlation between cooling effect of green space and surrounding urban spatial form: Evidence from 36 urban green spaces. Build. Environ. 2022, 222, 109375. [Google Scholar] [CrossRef] [Scilit]
- Liang, Z.; Liu, H.; Zhou, W.; Wang, M.; Wei, Z.; Fan, Z.; Li, Z. Responding to “city cooling action”: Assessing and visualizing community-level urban park cooling service performance in Nanjing, China. Sustain. Cities Soc. 2024, 116, 105876. [Google Scholar] [CrossRef] [Scilit]
- Peng, J.; Dan, Y.; Qiao, R.; Liu, Y.; Dong, J.; Wu, J. How to quantify the cooling effect of urban parks? Linking maximum and accumulation perspectives. Remote Sens. Environ. 2021, 252, 112135. [Google Scholar] [CrossRef] [Scilit]
- Du, S.; Xiong, Z.; Wang, Y.-C.; Guo, L. Quantifying the multilevel effects of landscape composition and configuration on land surface temperature. Remote Sens. Environ. 2016, 178, 84–92. [Google Scholar] [CrossRef] [Scilit]
- Zhou, L.; Yuan, B.; Hu, F.; Wei, C.; Dang, X.; Sun, D. Understanding the effects of 2D/3D urban morphology on land surface temperature based on local climate zones. Build. Environ. 2022, 208, 108578. [Google Scholar] [CrossRef] [Scilit]
- Xiao, Y.; Piao, Y.; Pan, C.; Lee, D.; Zhao, B. Using buffer analysis to determine urban park cooling intensity: Five estimation methods for Nanjing, China. Sci. Total Environ. 2023, 868, 161463. [Google Scholar] [CrossRef] [Scilit] [PubMed]
- Xiao, Y.; Pan, C.; Zou, W.; Zhao, B.; Pignatta, G.; Xie, H.; You, M.; Lee, D. Seasonal variability and multi-factor analysis of urban park cooling effects: A case study of Nanjing, China. Sustain. Cities Soc. 2025, 131, 106711. [Google Scholar] [CrossRef] [Scilit]
- Zhao, W.; Duan, S.-B.; Li, A.; Yin, G. A practical method for reducing terrain effect on land surface temperature using random forest regression. Remote Sens. Environ. 2019, 221, 635–649. [Google Scholar] [CrossRef] [Scilit]
- Yao, X.; Zhu, Z.; Zeng, X.; Huang, S.; Liu, Q.; Yu, K.; Zhou, X.; Chen, Z.; Liu, J. Linking maximum-impact and cumulative-impact indices to quantify the cooling effect of waterbodies in a subtropical city: A seasonal perspective. Sustain. Cities Soc. 2022, 82, 103902. [Google Scholar] [CrossRef] [Scilit]
- Deng, Y.; Jiang, W.; Ling, Z.; Liu, L.; Sun, S. Revealing the driving factors of urban wetland park cooling effects using Random Forest regression and SHAP algorithm. Sustain. Cities Soc. 2025, 120, 106151. [Google Scholar] [CrossRef] [Scilit]
- Yuan, B.; Zhou, L.; Hu, F.; Wei, C. Effects of 2D/3D urban morphology on land surface temperature: Contribution, response, and interaction. Urban Clim. 2024, 53, 101791. [Google Scholar] [CrossRef] [Scilit]
- Lundberg, S.M.; Lee, S.-I. A unified approach to interpreting model predictions. Adv. Neural Inf. Process. Syst. 2017, 30, 4768–4777. [Google Scholar]
- Liu, M.; Luo, Q.; Huang, R.; Wu, Y.; Zhou, J. Dynamic impacts of urban expansion on vegetation growth in urban environments: A sustainable land management framework. Land Use Policy 2025, 153, 107541. [Google Scholar] [CrossRef] [Scilit]
- Chen, M.; Jia, W.; Yan, L.; Du, C.; Wang, K. Quantification and mapping cooling effect and its accessibility of urban parks in an extreme heat event in a megacity. J. Clean. Prod. 2022, 334, 130252. [Google Scholar] [CrossRef] [Scilit]
- Zhong, Y.; Li, S.; Liang, X.; Guan, Q. Causal inference of urban heat island effect and its spatial heterogeneity: A case study of Wuhan, China. Sustain. Cities Soc. 2024, 115, 105850. [Google Scholar] [CrossRef] [Scilit]
- Geng, X.; Zhang, D.; Sun, W.; Yuan, Y.; Li, C.; Yu, Z. Heterogenous impact of background meteorological factors on the cooling effect of two types of typical urban parks: Evidence from Shanghai, China. Build. Environ. 2024, 265, 112024. [Google Scholar] [CrossRef] [Scilit]
- Yao, X.; Ye, B.; Lan, Y.; Lin, Z.; Zhu, Z.; Yang, F.; Zeng, X. Diurnal contrast of urban park cooling effects in a “Furnace city” using multi-source geospatial data and optimal parameters-based geographical detector model. Sustain. Cities Soc. 2024, 114, 105765. [Google Scholar] [CrossRef] [Scilit]
- Geng, X.; Yu, Z.; Zhang, D.; Li, C.; Yuan, Y.; Wang, X. The influence of local background climate on the dominant factors and threshold-size of the cooling effect of urban parks. Sci. Total Environ. 2022, 823, 153806. [Google Scholar] [CrossRef] [Scilit] [PubMed]
- Algretawee, H. The effect of graduated urban park size on park cooling island and distance relative to land surface temperature (LST). Urban Clim. 2022, 45, 101255. [Google Scholar] [CrossRef] [Scilit]
- Zhang, N.; Zhen, W.; Shi, D.; Zhong, C.; Li, Y. Quantification and mapping of the cooling effect of urban parks on the temperate monsoon climate zone. Sustain. Cities Soc. 2024, 101, 105111. [Google Scholar] [CrossRef] [Scilit]
- Zhou, Y.; Zhao, H.; Mao, S.; Zhang, G.; Jin, Y.; Luo, Y.; Huo, W.; Pan, Z.; An, P.; Lun, F. Studies on urban park cooling effects and their driving factors in China: Considering 276 cities under different climate zones. Build. Environ. 2022, 222, 109441. [Google Scholar] [CrossRef] [Scilit]
- Xiao, Y.; Piao, Y.; Wei, W.; Pan, C.; Lee, D.; Zhao, B. A comprehensive framework of cooling effect-accessibility-urban development to assessing and planning park cooling services. Sustain. Cities Soc. 2023, 98, 104817. [Google Scholar] [CrossRef] [Scilit]
- He, T.; Hu, Y.; Guo, A.; Chen, Y.; Yang, J.; Li, M.; Zhang, M. Quantifying the impact of urban trees on land surface temperature in global cities. ISPRS J. Photogramm. Remote Sens. 2024, 210, 69–79. [Google Scholar] [CrossRef] [Scilit]
- Breiman, L. Random Forests. Mach. Learn. 2001, 45, 5–32. [Google Scholar] [CrossRef] [Scilit]
- Liao, W.; Guldmann, J.-M.; Hu, L.; Cao, Q.; Gan, D.; Li, X. Linking urban park cool island effects to the landscape patterns inside and outside the park: A simultaneous equation modeling approach. Landsc. Urban Plann. 2023, 232, 104681. [Google Scholar] [CrossRef] [Scilit]
- Lin, P.; Lau, S.S.Y.; Qin, H.; Gou, Z. Effects of urban planning indicators on urban heat island: A case study of pocket parks in high-rise high-density environment. Landsc. Urban Plann. 2017, 168, 48–60. [Google Scholar] [CrossRef] [Scilit]
- Cai, X.; Yang, J.; Zhang, Y.; Xiao, X.; Xia, J. Cooling island effect in urban parks from the perspective of internal park landscape. Humanit. Soc. Sci. Commun. 2023, 10, 674. [Google Scholar] [CrossRef] [Scilit]
- Li, Z.; Liu, Q.; Yan, K.; Xiong, D.; Xu, P.; Yan, Y.; Lin, L. Cooling effects of urban parks under various ecological factors. Urban Clim. 2024, 58, 102134. [Google Scholar] [CrossRef] [Scilit]
- Oke, T.R. City size and the urban heat island. Atmos. Environ. (1967) 1973, 7, 769–779. [Google Scholar] [CrossRef] [Scilit]
- Liu, Y.; Xu, Y.; Zhang, F.; Shu, W. A preliminary study on the influence of Beijing urban spatial morphology on near-surface wind speed. Urban Clim. 2020, 34, 100703. [Google Scholar] [CrossRef] [Scilit]
- Liang, Z.; Li, Z.; Fan, Z. Seasonal impacts of built environment and its interactions on urban park cooling effects in Nanjing, China. Build. Environ. 2023, 242, 110580. [Google Scholar] [CrossRef] [Scilit]
- Oke, T.R.; Mills, G.; Christen, A.; Voogt, J.A. Urban Climates; Cambridge University Press: Cambridge, UK, 2017. [Google Scholar]
- Halecki, W.; Stachura, T.; Fudała, W.; Stec, A.; Kuboń, S. Assessment and planning of green spaces in urban parks: A review. Sustain. Cities Soc. 2023, 88, 104280. [Google Scholar] [CrossRef] [Scilit]
- Yao, X.; Yu, K.; Zeng, X.; Lin, Y.; Ye, B.; Shen, X.; Liu, J. How can urban parks be planned to mitigate urban heat island effect in “Furnace cities”? An accumulation perspective. J. Clean. Prod. 2022, 330, 129852. [Google Scholar] [CrossRef] [Scilit]
- Zeng, X.; Luo, Q.; Liu, M.; Chu, Y.; Rong, J.; Zhou, J. Revealing the nighttime warm effects of urban water bodies: Evidence from Wuhan, China. Environ. Impact Assess. Rev. 2026, 118, 108303. [Google Scholar] [CrossRef] [Scilit]
- Vidrih, B.; Medved, S. Multiparametric model of urban park cooling island. Urban For. Urban Green. 2013, 12, 220–229. [Google Scholar] [CrossRef] [Scilit]
- Zhou, S.-Q.; Yu, Z.-W.; Ma, W.-Y.; Yao, X.-H.; Xiong, J.-Q.; Ma, W.-J.; Xiang, S.-Y.; Yuan, Q.; Hao, Y.-Y.; Xu, D.-F. Vertical canopy structure dominates cooling and thermal comfort of urban pocket parks during hot summer days. Landsc. Urban Plann. 2025, 254, 105242. [Google Scholar] [CrossRef] [Scilit]
- Zhou, Y.; Luo, Y.; Yi, X.; Lun, F.; Hu, Q.; Huang, N.; Wen, G.; Zhou, H.; Hu, X. Exploring the influence of local urban heat features on park cooling effects: Insights from Chinese cities. Build. Environ. 2024, 262, 111782. [Google Scholar] [CrossRef] [Scilit]

Disclaimer/Publisher’s Note: The statements, opinions and data contained in all publications are solely those of the individual author(s) and contributor(s) and not of MDPI and/or the editor(s). MDPI and/or the editor(s) disclaim responsibility for any injury to people or property resulting from any ideas, methods, instructions or products referred to in the content. |
© 2026 by the authors. Licensee MDPI, Basel, Switzerland. This article is an open access article distributed under the terms and conditions of the Creative Commons Attribution (CC BY) license.