


Abstract
Against the backdrop of intensifying global climate change and expanding human encroachment into mountainous regions, landslides have increased markedly in both frequency and destructiveness, emerging as a key risk to socio-ecological security and development in mountain areas. Rigorous assessment and forward-looking prediction of landslide disaster vulnerability (LDV) are essential for targeted disaster risk reduction and regional sustainability. However, existing studies largely center on landslide susceptibility or risk, often overlooking the dynamic evolution of adaptive capacity within affected systems and its nonlinear responses across temporal and spatial scales, thereby obscuring the complex mechanisms underpinning LDV. To address this gap, we examine Yunnan Province, a landslide-prone region of China where intensified extreme rainfall and the expansion of human activities in recent years have exacerbated landslide risk. Drawing on the vulnerability scoping diagram (VSD), we construct an exposure–sensitivity–adaptive capacity assessment framework to characterize the spatiotemporal distribution of LDV during 2000–2020. We further develop a multi-model, multi-scale integrated prediction framework, benchmarking the predictive performance of four machine learning algorithms—backpropagation neural network (BPNN), support vector machine (SVM), random forest (RF), and XGBoost—across sample sizes ranging from 2500 to 360,000 to identify the optimal model–scale combination. From 2000 to 2020, LDV in Yunnan declined overall, exhibiting a spatial pattern of “higher in the northwest and lower in the southeast.” High-LDV areas decreased markedly, and sustained enhancement of adaptive capacity was the primary driver of the decline. At approximately the 90,000-cell grid scale, XGBoost performed best, robustly reproducing the observed spatiotemporal evolution and projecting continued declines in LDV during 2030–2050, albeit with decelerating improvement; low-LDV zones show phased fluctuations of “expansion followed by contraction”, whereas high-LDV zones continue to contract northwestward. The proposed multi-model, multi-scale fusion framework enhances the accuracy and robustness of LDV prediction, provides a scientific basis for precise disaster risk reduction strategies and resource optimization in Yunnan, and offers a quantitative reference for resilience building and policy design in analogous regions worldwide.
1. Introduction
Landslide disasters are among the most frequently occurring geological hazards worldwide. They are geological processes in which the geological environment becomes unstable under natural or anthropogenic disturbances, thereby threatening human life, property, and living environments [1]. Over the past decades, the frequency and intensity of extreme meteorological events have increased, and the human footprint has expanded in landslide-prone areas, leading to a global trend of increased frequency and aggravated losses of landslide disasters [2]. Statistics indicate that during 2004–2016, non-earthquake-triggered landslides alone caused approximately 55,997 fatalities across 4862 events [3]. Landslide disasters not only directly endanger the lives of local residents, but also impose long-term and far-reaching impacts on infrastructure, transportation networks, ecological environments, and regional economic development [4]. Nevertheless, appropriately designed disaster risk reduction strategies can effectively reduce disaster-related losses [5,6]. Therefore, the scientific assessment and prediction of landslide disasters has gradually become a research focus and an important strategic task for global disaster risk reduction [7].
Landslide risk analysis or modeling aims to identify the potential economic and social losses a region may incur when affected by landslides and is, therefore, an apt tool for planning effective disaster risk reduction strategies [8,9]. Traditional landslide risk assessments have primarily focused on the probability of hazard occurrence and its socioeconomic impacts—for example, landslide risk and landslide susceptibility. They have often emphasized landslide susceptibility mapping (i.e., the spatial propensity for landslide occurrence conditioned on terrain, geology, and triggering factors) and, separately, landslide risk assessments that combine hazard with exposure and potential losses [10]. Although such approaches help quantify the likelihood of occurrence, they often overlook the intrinsic characteristics of the elements at risk and their post-disaster coping capacity [11]. As research has progressed, scholars have increasingly recognized the importance of vulnerability in disaster response and have introduced the concept into disaster assessments, developing a series of vulnerability assessment models that offer new modes of thinking and perspectives [12,13,14]. Within global change and sustainability science, vulnerability is widely conceptualized as a state of susceptibility to harm that is jointly determined by exposure to multiple environmental and social stressors, the sensitivity of the affected coupled human–environment system, and its capacity to cope, adapt, and recover [15,16]. This literature distinguishes outcome-oriented assessments, which infer vulnerability from observed impacts, and process-oriented approaches that trace how multi-stressor interactions, institutional arrangements, and feedbacks across spatial and temporal scales generate or reduce vulnerability [17]. Turner, Matson, McCarthy, Corell, Christensen, Eckley, Hovelsrud-Broda, Kasperson, Kasperson, Luers, Martello, Mathiesen, Naylor, Polsky, Pulsipher, Schiller, Selin, and Tyler [16], Turner, Kasperson, Matson, McCarthy, Corell, Christensen, Eckley, Kasperson, Luers, Martello, Polsky, Pulsipher, and Schiller [17] emphasize that vulnerability largely resides in the condition and dynamics of place-based social–ecological systems and argue for frameworks that can accommodate nested scales, cross-scale linkages and both biophysical and socioeconomic drivers. Building on these insights, a range of analytical frameworks has been proposed. For instance, the pressure and release (PAR) model conceptualizes disasters as the interaction between hazard events and the progression of vulnerability, emphasizing how root causes, dynamic pressures, and unsafe conditions jointly determine disaster outcomes [18]. In further advances, analytical frameworks such as an agent–hazard–vulnerability–disaster (AHV) model [17] and a damage-based vulnerability (ADV) model [12] have improved vulnerability metrics by tracking how specific socioeconomic agents and their assets are exposed to and affected by hazards. The vulnerability scoping diagram (VSD) proposed by Polsky et al. [19] addresses the problems of spatially uneven distributions and data uncertainty and explicitly decomposes vulnerability into exposure, sensitivity, and adaptive capacity, highlighting how the coupled interactions among these components shape overall vulnerability and providing a template for building comparable, place-based global-change vulnerability assessments. Integrating the VSD framework into landslide disaster assessment enables simultaneous consideration of hazard occurrence probability together with weak links and response capacity within the exposed system. Compared with assessments that focus solely on hazard, a vulnerability framework can more comprehensively characterize the drivers of landslide risk, facilitate identification of the most affected elements, and thereby optimize resource allocation for disaster risk reduction [20]. Consequently, recent scholarship has further advanced systems-oriented vulnerability analysis, advocating the incorporation of socioeconomic indicators and factors related to responses to change to improve the accuracy and applicability of landslide risk assessments [21].
Prospective prediction of landslide disaster vulnerability (LDV) is critical for mitigating future risk and supporting proactive disaster risk reduction [22,23]. From a complex socio-ecological systems perspective, LDV is an emergent property of coupled hazard, exposure, and adaptive capacity processes that operate across multiple spatial and temporal scales rather than a fixed attribute of a place [24,25]. Multi-hazard and climate-risk studies have shown that the magnitude and spatial pattern of estimated vulnerability, as well as the identification of hotspots, are highly sensitive to the spatial resolution at which indicators are represented and aggregated [26,27]. Coarse units can obscure small-area pockets of extreme vulnerability, whereas overly fine units may introduce noise and instability in model performance, implying that scale effects directly shape risk estimates and the prioritization of disaster risk reduction measures. In landslide-prone regions, this is particularly important, because controlling factors such as slope morphology, land use, and settlement patterns are themselves scale-dependent, so LDV patterns derived at one spatial scale cannot be assumed to hold at others [28].
In addition, a growing body of work emphasizes that vulnerability is inherently dynamic. Changes in socioeconomic development, land use patterns, infrastructure investment and governance can strengthen or weaken vulnerability over time, even where hazard frequency remains stable [25,29]. Spatiotemporal analyses based on the VSD and related frameworks have shown that exposure, sensitivity, and adaptive capacity evolve along distinct trajectories, and that long-term trends in vulnerability can be decoupled from trends in hazard occurrence [30]. Ignoring the temporal dimension, therefore, risks misinterpreting present-day LDV patterns as static snapshots, whereas they in fact reflect the cumulative legacy of past exposure and adaptation and will continue to change under future climate and development pathways. Incorporating time explicitly into a model–scale combination framework makes it possible to evaluate not only how spatial resolution influences LDV estimates, but also how different model–scale configurations perform in reproducing and projecting the temporal evolution of LDV.
Despite these insights, most existing landslide susceptibility or risk assessments still adopt a single model and a fixed spatial scale, without systematically exploring how different model–scale–time combinations affect predictive outcomes [31]. Recent advances in machine learning algorithms, such as random forest (RF), support vector machine (SVM), backpropagation neural network (BPNN), and extreme gradient boosting (XGBoost), have demonstrated clear advantages in predictive accuracy and generalization for landslide-related applications [28,32,33]. Empirical work also indicates that model performance exhibits pronounced scale sensitivity, with moderate-resolution data often outperforming very fine or very coarse resolutions [34]. Building on this literature, we design a multi-model, multi-scale, and multi-temporal LDV assessment framework that explicitly benchmarks alternative combinations of spatial resolution and learning algorithms in order to identify robust configurations for reproducing historical LDV dynamics and forecasting their future evolution.
Yunnan lies on the southeastern margin of the Tibetan Plateau, with diverse tectonic settings and landforms and pronounced vertical climatic differentiation; consequently, it experiences frequent and varied geological hazards and is among China’s high-incidence regions for landslide disasters [35]. Mountains and hills are widespread across the province, and landslides, debris flows, and rockfalls have been common historically, occurring especially often under the influence of intense summer rainfall and seismic activity. From 2010 to 2014 alone, Yunnan recorded more than 2000 geological hazard events and at least 577 fatalities, posing long-term threats to residents’ lives, property, and the safety of critical infrastructure [36]. In recent years, increases in extreme rainfall associated with climate change, population aggregation into mountainous areas, and the extension of infrastructure onto steep, high-relief slopes have further exacerbated landslide risk in Yunnan [37]. Given Yunnan’s complex natural environment and the high exposure of people and assets, conducting LDV assessment and simulation there has representative significance for national disaster risk reduction decision-making and regional sustainable development. Accordingly, our objectives are as follows: (i) under the VSD framework, to construct a scale–model-linked LDV assessment and prediction framework that characterizes the vulnerability attributes of population, economy, and environment; (ii) to map the spatiotemporal distribution of LDV in Yunnan during 2000–2020 and reveal spatial clustering patterns and temporal trends in its evolution; and (iii) via multi-model and multi-scale comparison and selection, to predict the future LDV pattern in Yunnan and provide forward-looking guidance for regional disaster-reduction planning. This study offers a scientific basis for enhancing mountain resilience, optimizing resource allocation, and formulating targeted disaster-prevention strategies, while also providing transferable insights for risk management in landslide-affected regions worldwide.
2. Study Area
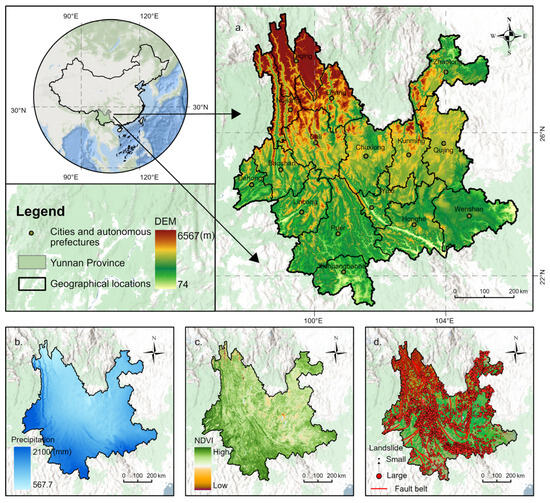
Yunnan Province is located in southwestern China (21°08′–29°15′ N, 97°31′–106°11′ E), covers 394,100 km2, has Kunming as its capital, and administers 16 prefecture-level divisions and 129 counties (county-level cities) (Figure 1). The province has a subtropical plateau monsoon climate characterized by a small annual temperature range, large diurnal range, distinct wet–dry seasons, and mean annual precipitation generally exceeding 900 mm; precipitation decreases from south to north and is concentrated in the May–October rainy season [36]. Vegetation types are diverse, and forest cover reaches 65.04%, indicating abundant forest resources. Yunnan’s terrain is that of a mountainous plateau: mountains account for 88.6% of the area, plains for 4.8%, and hills for 6.4%. The east comprises a gently undulating plateau with various karst landforms, whereas the west consists of the rugged Hengduan Mountains with alternating ranges and deep valleys. Topography is higher in the northwest and lower in the southeast, descending stepwise from north to south, with a mean elevation of 2000 m. Situated within the collision zone between the Indian and Eurasian plates and in a seismically active belt, Yunnan experiences vigorous tectonism and complex geology, leading to frequent landslide disasters. In recent years, ongoing socioeconomic development and infrastructure construction have intensified anthropogenic disturbance of the geological environment, further increasing the frequency of landslide disasters. The spatial distribution of landslide disasters in Yunnan is strongly regional: the western and northeastern alpine-gorge regions are prone areas, and corridors associated with highways, railways, and hydraulic projects are also high-incidence belts. Given the influences of climate change, accelerated urbanization, and human activities, future landslide disaster risk may increase further. Therefore, scientific assessment and prediction of landslide disasters are of great importance.
Figure 1.
Overview of the study area. (a) Geographic location of Yunnan Province; (b) precipitation; (c) NDVI; and (d) landslide disaster occurrence points.
3. Analysis Process and Methods
3.1. VSD Framework and Analytical Workflow
The VSD framework proposed by Polsky, Neff, and Yarnal [19] addresses the problems of spatially uneven distributions and interdependent indicators, and emphasizes the vulnerability effects arising from the joint action of exposure, sensitivity, and adaptive capacity. It has proven effective across numerous case studies. Using Yunnan Province as the case area, we build—under the VSD framework—a multi-scale, multi-model-linked assessment and prediction framework for LDV. First, LDV is decomposed into three dimensions—exposure, sensitivity, and adaptive capacity—represented by a total of 38 indicators, which are converted to spatial layers and standardized. We then apply CRITIC weighting and aggregate the three dimensions via the spatially explicit resilience–vulnerability (SERV) model [12] to obtain the spatiotemporal distribution layers of LDV for 2000–2020 (Equation (1)).
where denotes landslide disaster vulnerability, exposure, sensitivity, and adaptive capacity.
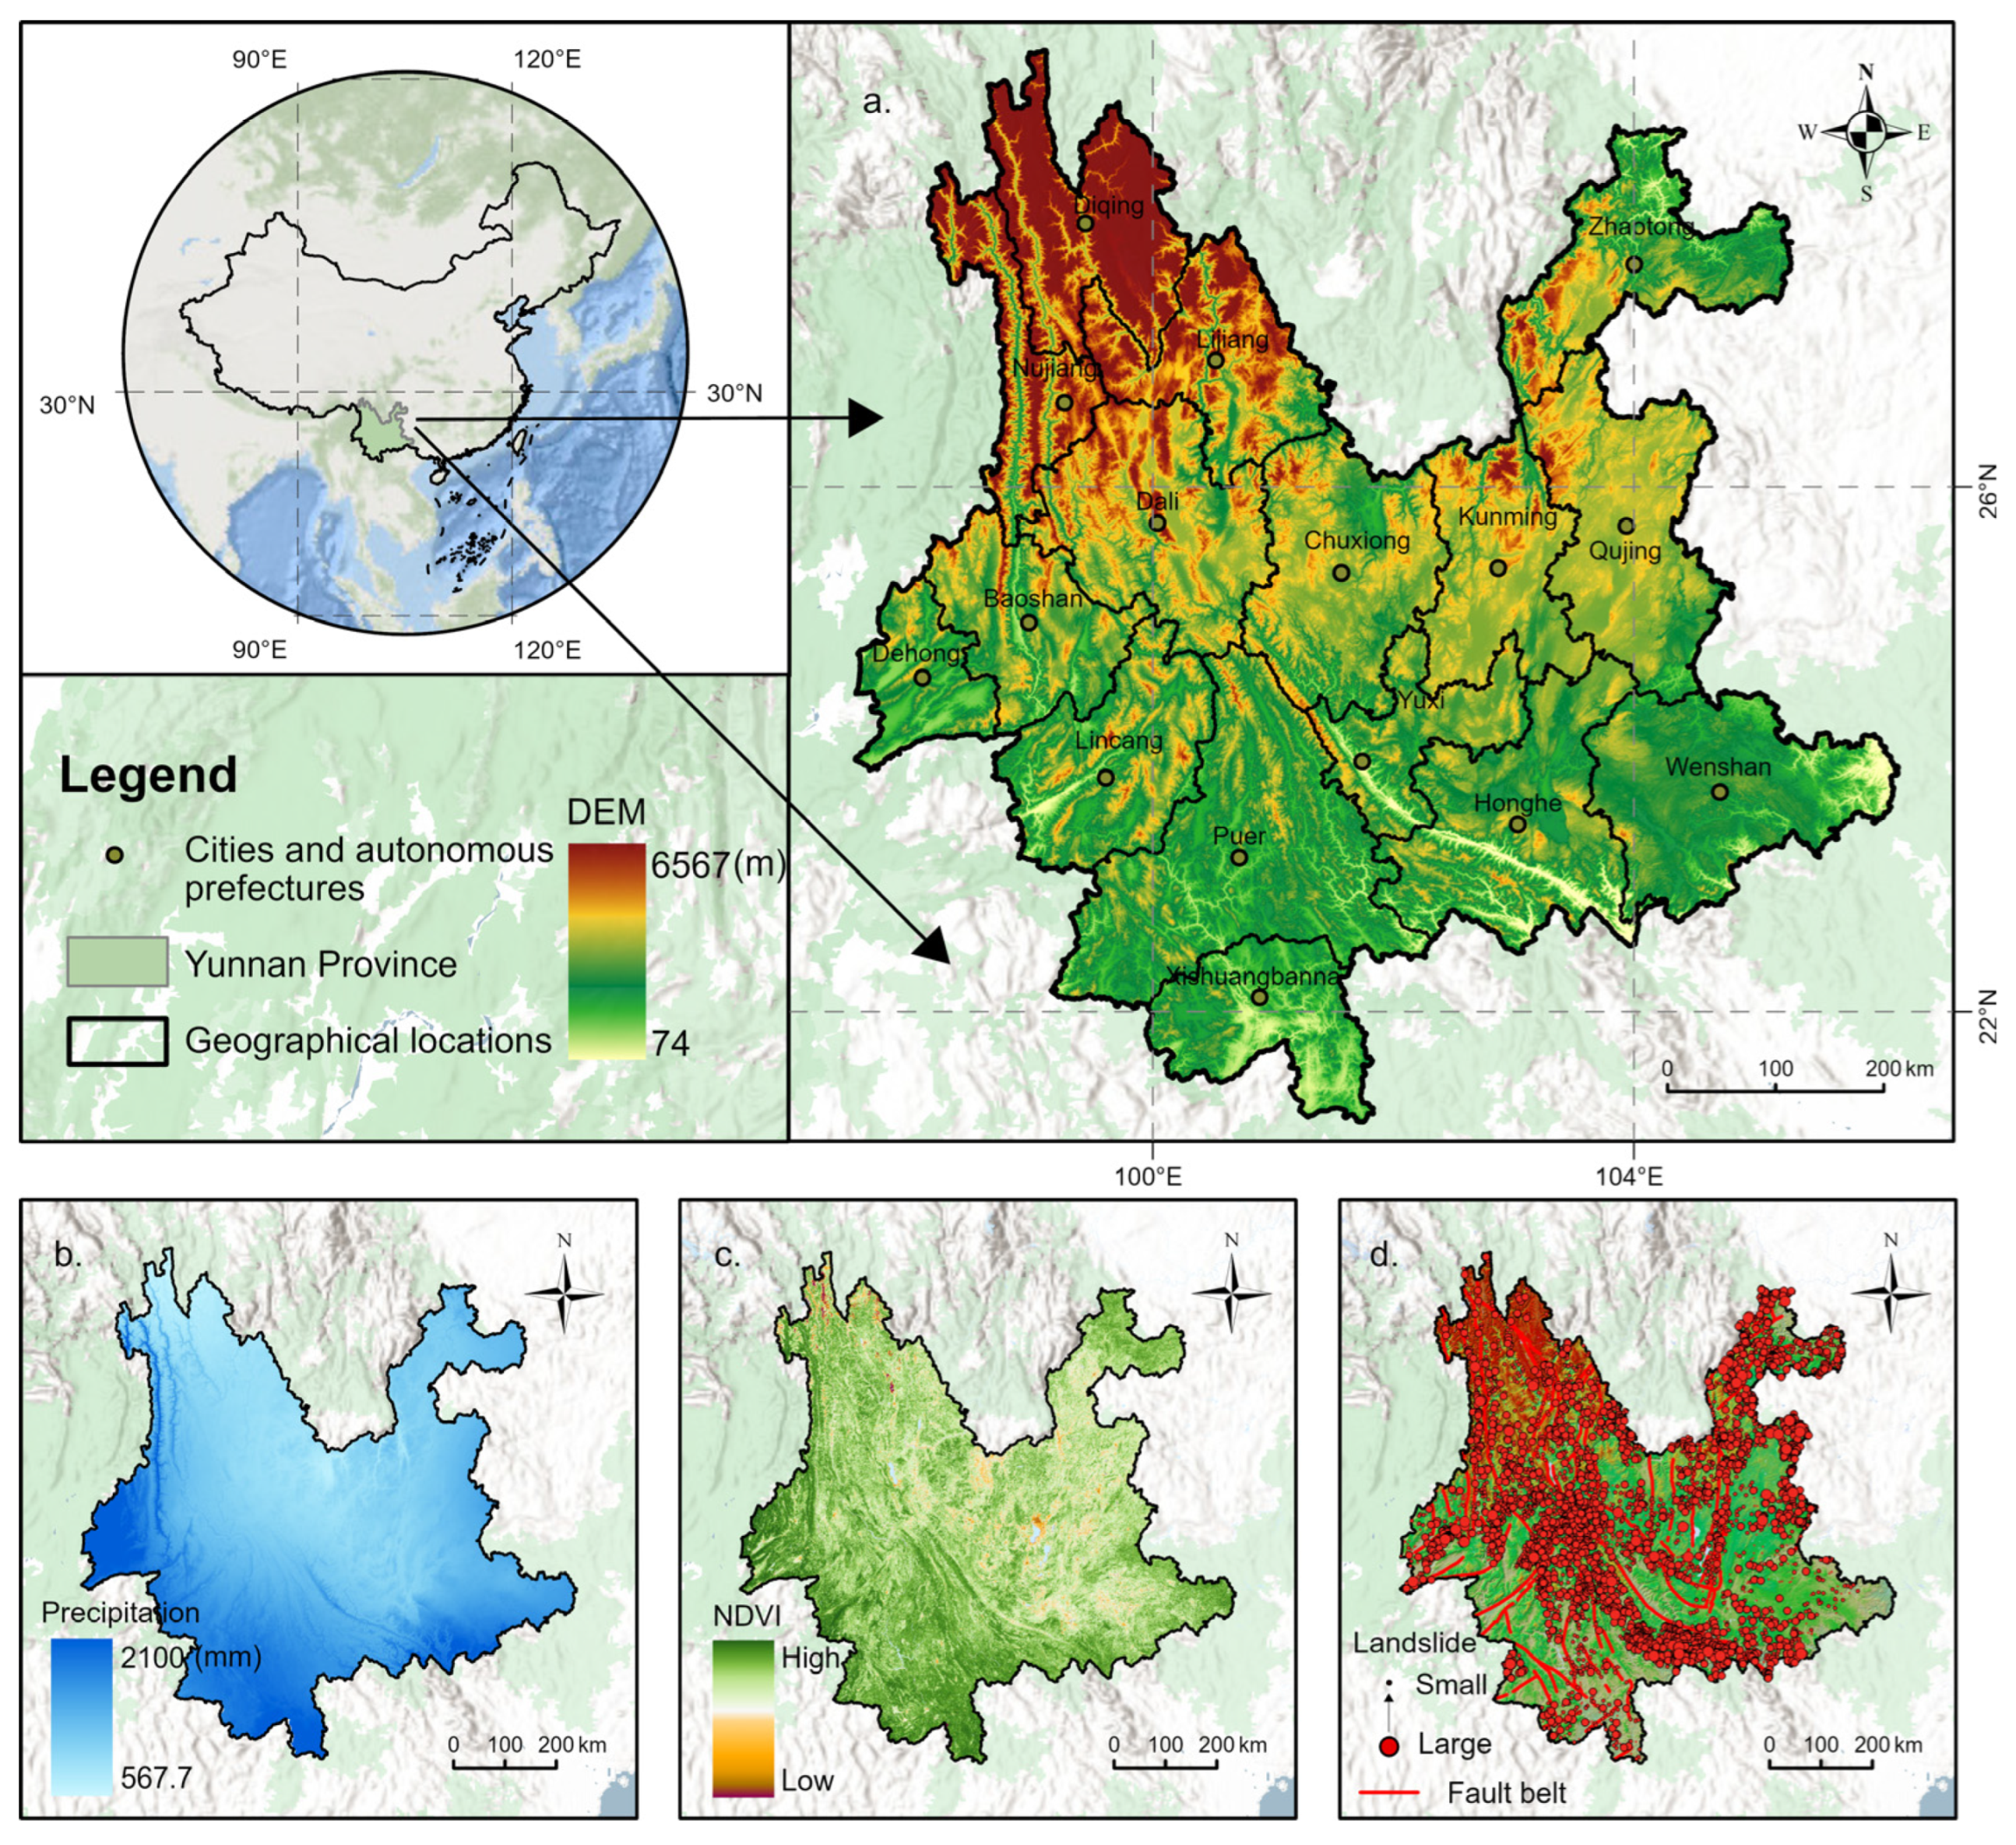
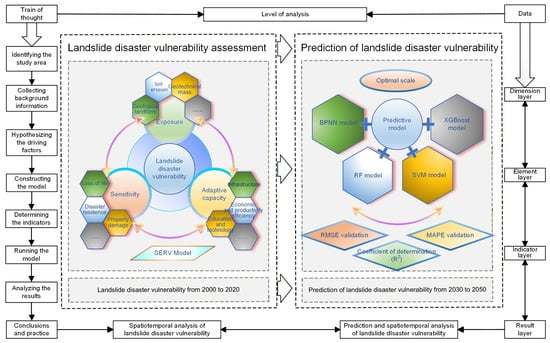
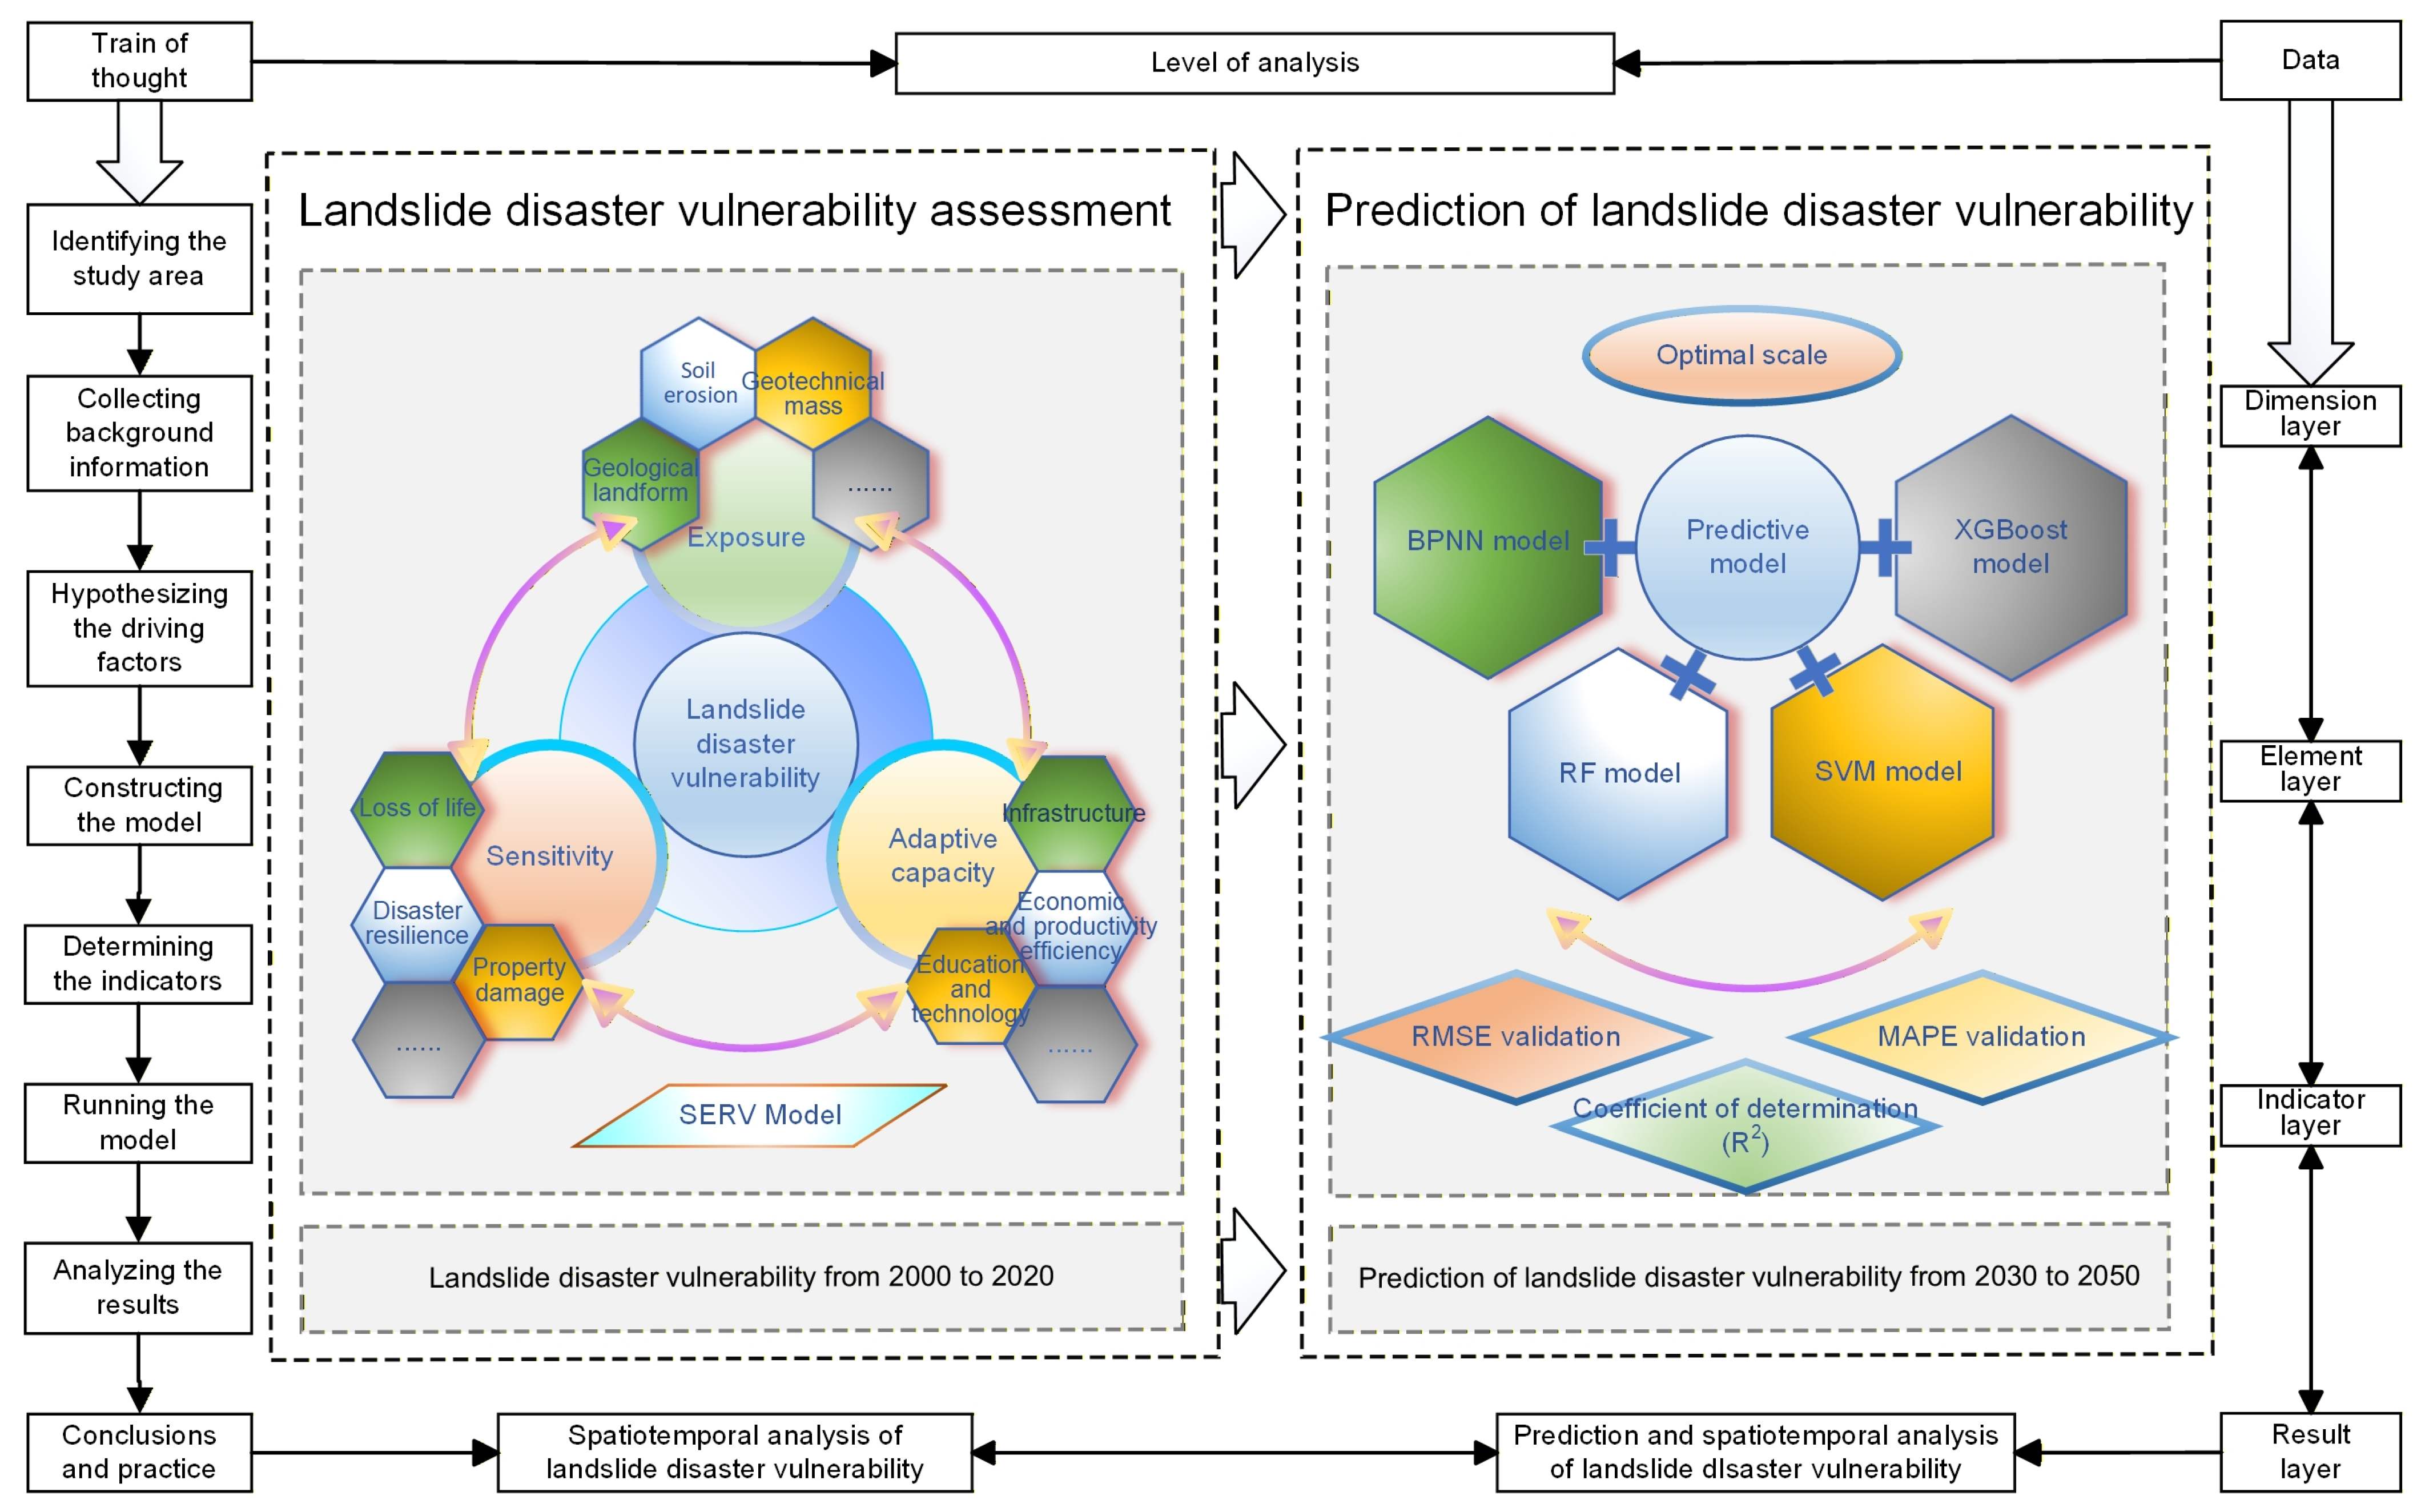
Second, because LDV exhibits scale sensitivity, predictive results vary substantially across spatial scales and models. To further improve predictive accuracy, we use the 2000–2020 LDV maps as training data and fit four machine learning models—BPNN, RF, SVM, and XGBoost—using, in sequence, 2500–360,000 sample points. We conduct a systematic multi-model, multi-scale comparison and select the optimal scale and model to simulate LDV for 2030–2050 (Figure 2).
Figure 2.
Multi-scale, multi-model LDV assessment and prediction framework based on the VSD framework.
3.2. Indicator Selection
Approximately 94% of Yunnan’s area is mountainous, and the geological environment is highly fragile. Influenced by multiple factors, including climate change and human engineering activities, the region has long been a hotspot for geohazards; among these, landslides have persistently constrained Yunnan’s social and economic development. Based on the provincial landslide inventory and prior studies, we select the principal landslide-conditioning factors suited to regional characteristics (Table 1). The calculation procedures and derivation principles of all indicators are documented in Supplementary Text S1, and Supplementary Text S2 provides a conceptual description of the 38 indicators and their assignment to the exposure, sensitivity, and adaptive-capacity dimensions of the LDV framework. The exposure risk of landslide disasters arises from the interaction and coupling of diverse internal and external hazard-inducing factors. Studies indicate that landslides commonly occur in soft-rock strata composed of mixed clastic rocks [38], with the physical and chemical properties of the rock–soil mass as primary controls. Geological–geomorphic conditions indirectly affect geological stability by altering the regional stress field, erosion processes, rainfall infiltration, and the degree of surface fragmentation [39]. Vegetation root systems effectively bind soil, and higher vegetation cover can significantly reduce surface exposure risk [40]. Scouring and erosion by surface runoff can soften bedrock and soil layers, further destabilizing slope structures; under combined infiltration of rainfall, surface, and subsurface runoff, soil erosion readily triggers landslides. Beyond natural drivers, human activities are also important external drivers; excessive disturbance of the land surface weakens rock–soil stability and can trigger hazardous events.
Table 1.
Screening results of indicators for exposure/sensitivity/adaptive capacity.
The sensitivity of landslide disasters refers to the potential degree of damage to the social system under current disaster-prevention and emergency conditions [41,42], primarily manifested as impacts on human life, property, and landscape resources. Indicators of disaster-prevention capacity reflect a region’s existing landslide defense mechanisms and disaster-prevention level, whereas adaptive capacity reflects society’s comprehensive ability to withstand and respond after a disaster [43,44]. Within LDV, adaptive capacity comprises the following three elemental layers: (i) economic and production efficiency, (ii) infrastructure level, and (iii) education and technological capacity. Improvements in economic and production efficiency help strengthen resilience to landslides [36,45], while advances in education and technology enhance the ability of individuals and society to respond to and recover from natural disasters [46]. Infrastructure elements—primarily medical services, communications, and transportation—not only facilitate post-disaster rescue and recovery, but also improve information access, technology introduction, and economic development.
3.3. Data Sources
We integrate multi-source datasets that comprise natural resource data and socioeconomic statistics in order to quantify LDV in Yunnan Province. Detailed sources are listed in Table 2. To enable unified evaluation of LDV, all datasets referenced in Table 1 were resampled. The spatialization workflow is provided in Supplementary Text S3.
Table 2.
Data sources.
3.4. Methods
3.4.1. Data Standardization
We first standardize all indicators to remove the influence of heterogeneous units, which improves comparability and prevents distance distortions caused by scale differences in the original features [11]. This procedure does not alter the statistical distribution of the data, yet it accelerates algorithmic iteration and alleviates inconsistencies in weights across dimensions [14]. Because indicators affect vulnerability in different directions, we adopt corresponding standardization schemes. Positive and negative indicators are normalized by the min–max method. Moderate or optimum type indicators are rendered dimensionless using a fuzzy membership function. The formulas are as follows:
Here is the raw value of the vulnerability indicator. and are the minimum and maximum of the indicator, is the optimal value, and is the standardized value.
3.4.2. CRITIC Weighting
The CRITIC method is an objective weighting approach that determines weights by combining indicator contrast intensity with indicator conflict [52]. Contrast intensity is represented by the standard deviation. A larger standard deviation indicates stronger variability and, therefore, a larger weight. Conflict is measured by correlation. A higher correlation among indicators implies stronger interdependence and smaller distinctiveness, which yields a smaller weight. Normalizing the product of the two quantities produces the objective weight of each indicator. The formulas are as follows:
Here, is the contrast intensity of indicator, is its conflict, and is the objective weight of indicator.
3.4.3. Machine Learning Predictive Models
We employ four machine learning models to evaluate and forecast LDV in Yunnan Province. The models are BPNN, SVM, RF, and XGBoost. Each model has distinct strengths suited to different scenarios and each can effectively support LDV prediction.
BPNN is a deep learning algorithm with a multilayer feedforward architecture trained by error backpropagation. Its principal strength lies in handling complex nonlinearity and it can self-adjust parameters to fit diverse predictive tasks. BPNN can overfit large datasets, so regularization and related strategies are needed to improve generalization [53]. SVM is a binary classifier that separates classes by constructing an optimal hyperplane. Kernel functions map data into higher dimensional spaces, which enables SVM to address nonlinearly separable cases. SVM performs well on small-sample classification tasks with high accuracy, although it can be computationally intensive on large datasets and sensitive to hyperparameters [54]. RF is an ensemble method that trains multiple decision trees and aggregates their predictions. RF is stable and robust, captures complex feature interactions, and is relatively resistant to overfitting. It performs well in LDV assessment, especially for complex datasets [55]. XGBoost is a gradient boosting algorithm that iteratively builds regression trees to reduce residual errors. It incorporates second-order information and regularization, which improves efficiency and predictive accuracy and makes it well suited to large-scale data [56]. Further algorithmic details are provided in Supplementary Text S4.
4. Results
4.1. Spatiotemporal Patterns of LDV and Its Three Dimensions
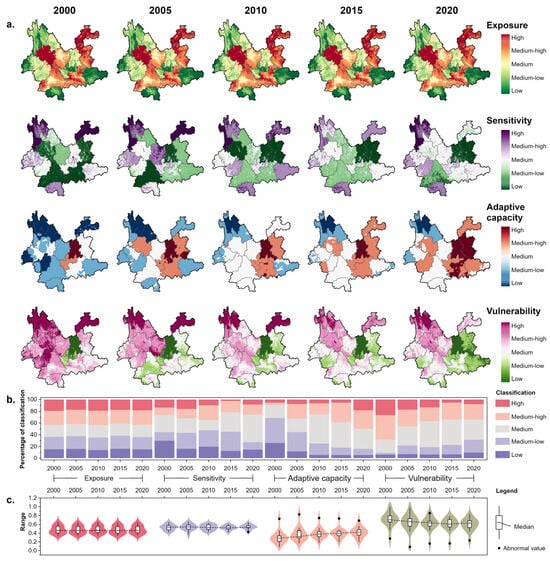
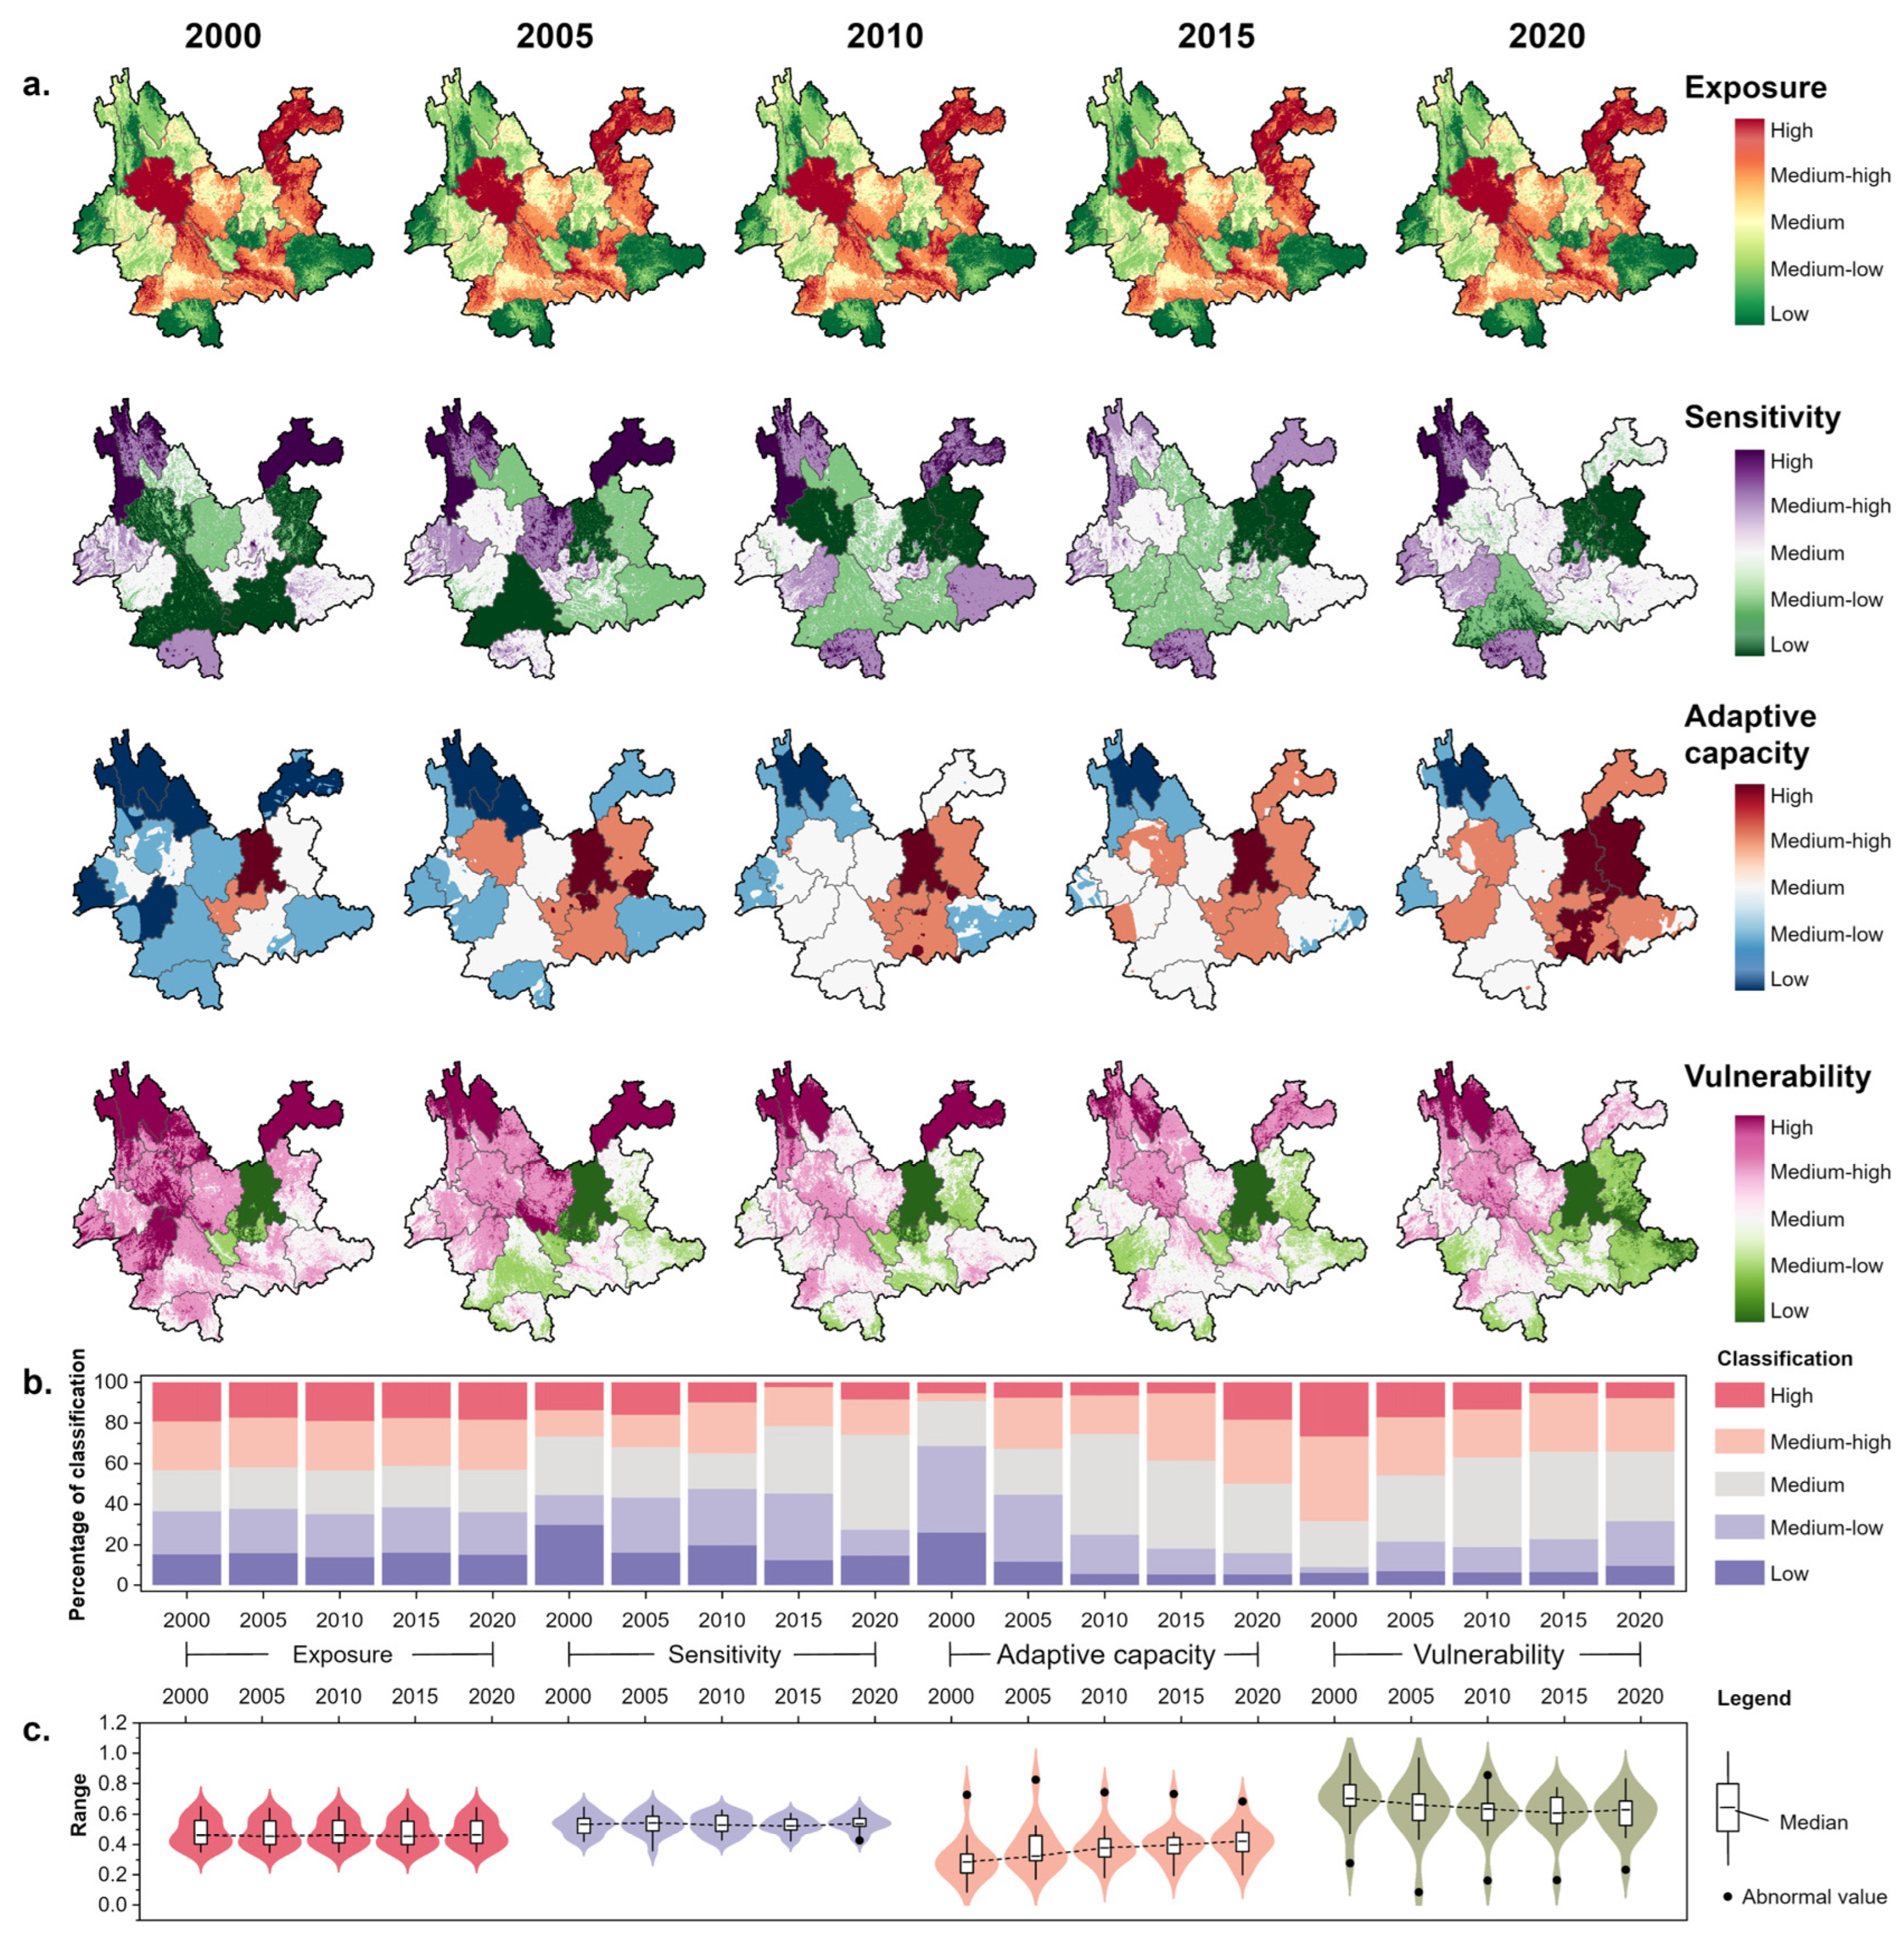
We analyze spatiotemporal variation in exposure, sensitivity, and adaptive capacity for landslides in Yunnan Province from 2000 to 2020 and synthesize these results into an overall assessment of LDV. The findings indicate strong interlinkages and interactions between the three dimensions and LDV, producing marked spatiotemporal dynamics and response relationships (Figure 3).
Figure 3.
Spatiotemporal characteristics of LDV and its dimensions. Panel (a) shows the maps of LDV and the three dimensions for 2000–2020, panel (b) shows class proportions for LDV and each dimension, and panel (c) shows boxplots that summarize distributional features. The median represents the central tendency and the box length equals the interquartile range.
Temporally, exposure shows a W-shaped fluctuation with a small amplitude, with the mean varying between 0.472 and 0.480, which suggests a generally stable exposure level. Sensitivity exhibits an N-shaped trajectory, increasing from 0.532 to 0.539 and peaking in 2020, indicating an enhancement in landslide disaster response capacity. Adaptive capacity rises continuously from 0.302 to 0.421, a gain of 39.5 percent, reflecting a pronounced improvement in the region’s overall capacity to withstand disasters. Medium-to-high fluctuations in exposure and sensitivity help maintain LDV at a medium-to-high level, whereas sustained increases in adaptive capacity significantly reduce LDV and drive its year-on-year decline. These three dimensions jointly shape the evolution of LDV. Spatially, exposure is predominantly at medium-to-high levels and is concentrated along the Hengduan Mountains and other geologically complex areas such as Dali, Pu’er, and Honghe, as well as the northeastern prefectures of Zhaotong and Qujing. Sensitivity is mainly at medium-to-low levels, with high-sensitivity zones concentrated in northwestern Yunnan where fortification capacity is relatively weak. Adaptive capacity is generally low in the early period but increases markedly later, driven by the continuing diffusion of disaster reduction capacity from core areas. The proportion of low and lower adaptive capacity zones falls from 68.7 percent in 2000 to 15.9 percent in 2020. Low-adaptation zones contract toward northwestern Yunnan, whereas high-adaptation zones expand outward from Kunming and Yuxi, with notable improvements in Zhaotong and Wenshan.
Overall, although LDV in Yunnan remains at a medium-to-high level, it shows a positive improving trend in both time and space. The spatiotemporal interaction of exposure, sensitivity, and adaptive capacity produces a ring-like gradient centered on Kunming. High-LDV areas cluster in the northwestern Hengduan Mountains and other economically lagging, topographically complex regions, while low-LDV areas occur around the provincial capital and other locales with stronger economic conditions and gentler relief. Over time, gains in adaptive capacity become the key factor that offsets potential risks arising from exposure and sensitivity [57], shrinking high-LDV extents and enlarging low-LDV areas. The share of high and higher LDV declines from 68.2 percent in 2000 to 34.2 percent in 2020, indicating that disaster risk reduction measures are yielding results.
4.2. Optimal Scale and Optimal Model for LDV
To address the common limitation that prior studies emphasize intra-model tuning while lacking systematic cross-model comparisons [58], and to acknowledge long overlooked scale effects and accuracy heterogeneity across spatial and sampling scales [59], we conduct a multi-model and multi-scale comparison with LDV analysis to improve robustness and transferability. We evaluate four machine learning models, namely BPNN, RF, SVM, and XGBoost, using 2500 to 360,000 samples. After random shuffling, we set the training proportion to 0.7 and adopt seven-fold cross-validation to mitigate overfitting from suboptimal splits and to ensure robustness.
To ensure a fair and consistent comparison among the four algorithms, we adopt a simple but unified hyperparameter selection procedure. For each model (BPNN, RF, SVM and XGBoost), we first define three candidate hyperparameter combinations (denoted A–C) based on preliminary experiments and previous studies. At the 90,000-grid scale, all combinations are trained and evaluated using the same 7-fold cross-validation splits, and their performance is assessed with RMSE, MAPE, and R2 (Supplementary Table S1). For each algorithm, the combination that achieves the lowest RMSE and highest R2 is selected as the benchmark setting for the subsequent multi-scale experiments. The resulting settings are as follows: for BPNN, learning rate 0.1, L2 regularization 1, 100 hidden nodes, and 1000 maximum iterations; for RF, maximum tree depth 10, maximum leaf nodes 50, and 100 trees; for SVM, a third-degree polynomial kernel with convergence tolerance 0.001 and 1000 maximum iterations; and for XGBoost, 100 base learners, learning rate 0.1, L2 regularization 1, and maximum depth 10. Although the absolute values of RMSE, MAPE, and R2 vary slightly across the three combinations for each model, the relative ranking of the four algorithms remains unchanged, and all three XGBoost configurations (RMSE 0.015–0.018, R2 0.98–0.99) consistently outperform the best configurations of the other models.
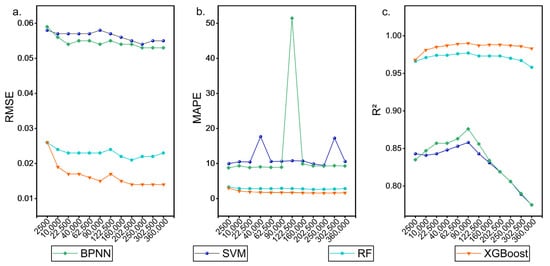
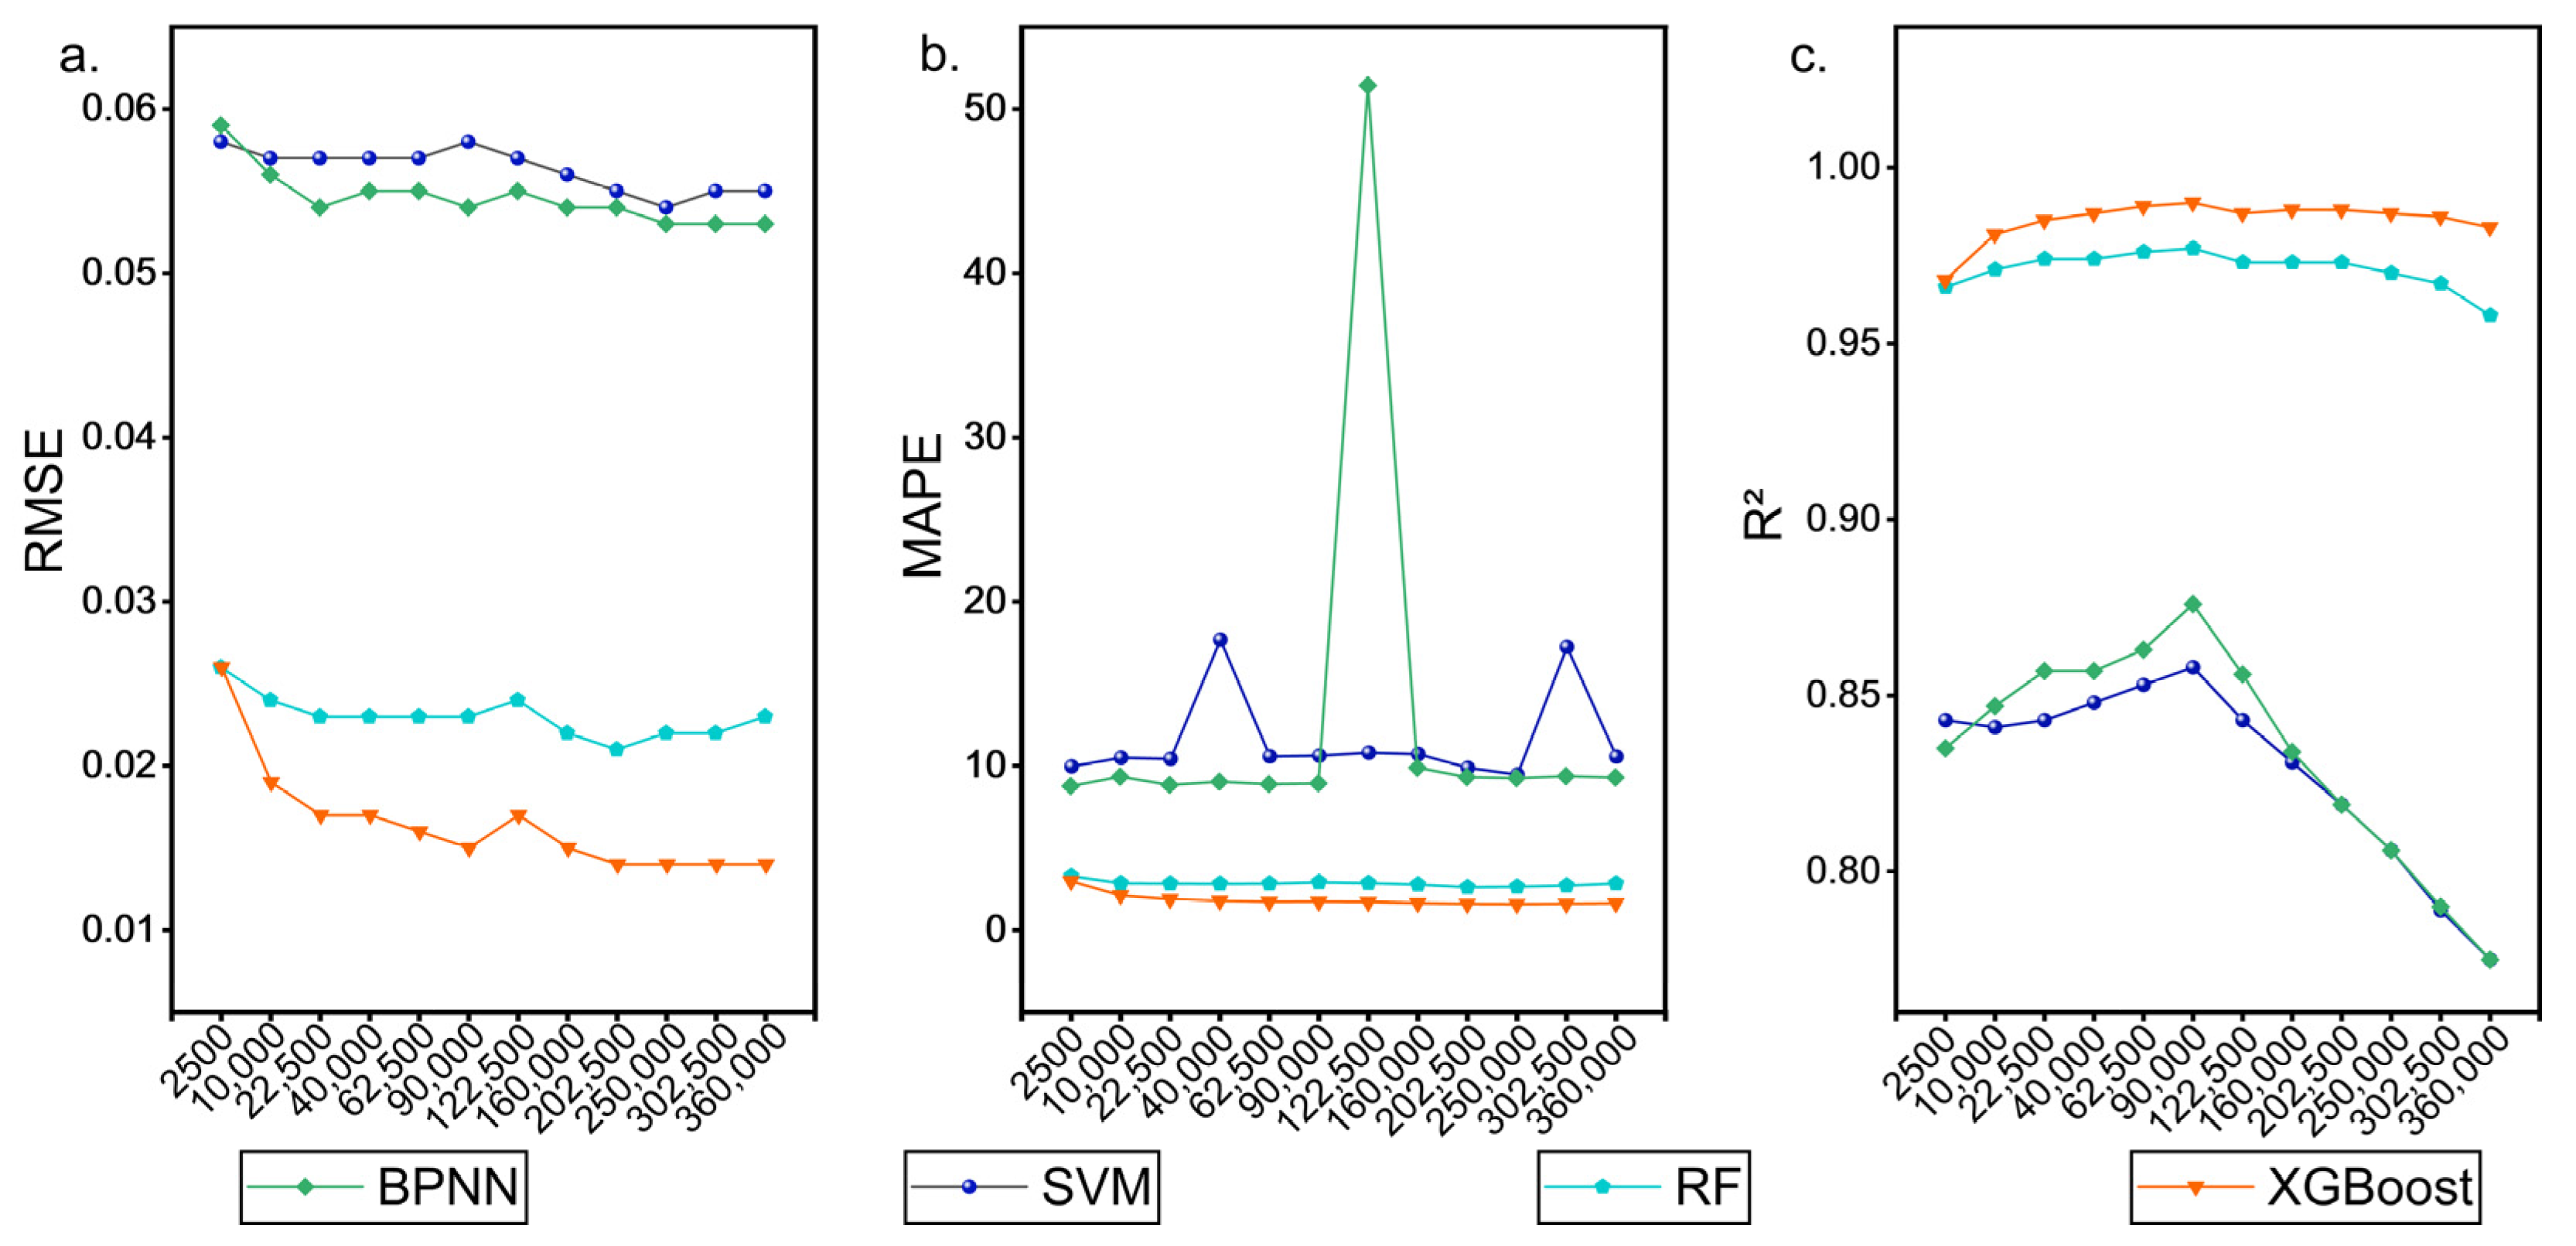
As shown in Figure 4, increasing the number of training samples markedly improves R2 for all models, but beyond a specific scale of 90,000 grid cells, further increases lead to a sharp surge in error. Hence, an appropriate training size improves performance, whereas imprudent sample sizing can mislead results. This is especially true for higher-resolution models where algorithms may penalize patterns that are correctly identified but marginalized by the spatial grid [60]. Across most scales, XGBoost yields smaller errors, the lowest RMSE and MAPE, and the highest R2, outperforming the other models overall. Although our analysis uses Yunnan-only samples, where blindly increasing resolution inflates similar and duplicate samples, XGBoost remains the most suitable choice.
Figure 4.
Prediction accuracy of four machine learning models at different scales, including RMSE, MAPE, and R2. (a) RMSE; (b) MAPE; (c) R2.
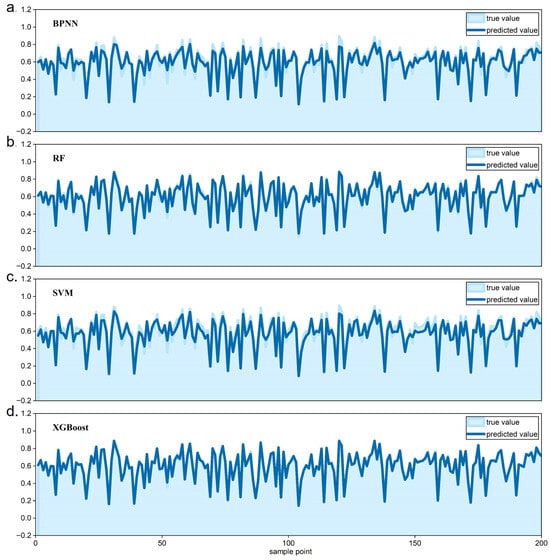
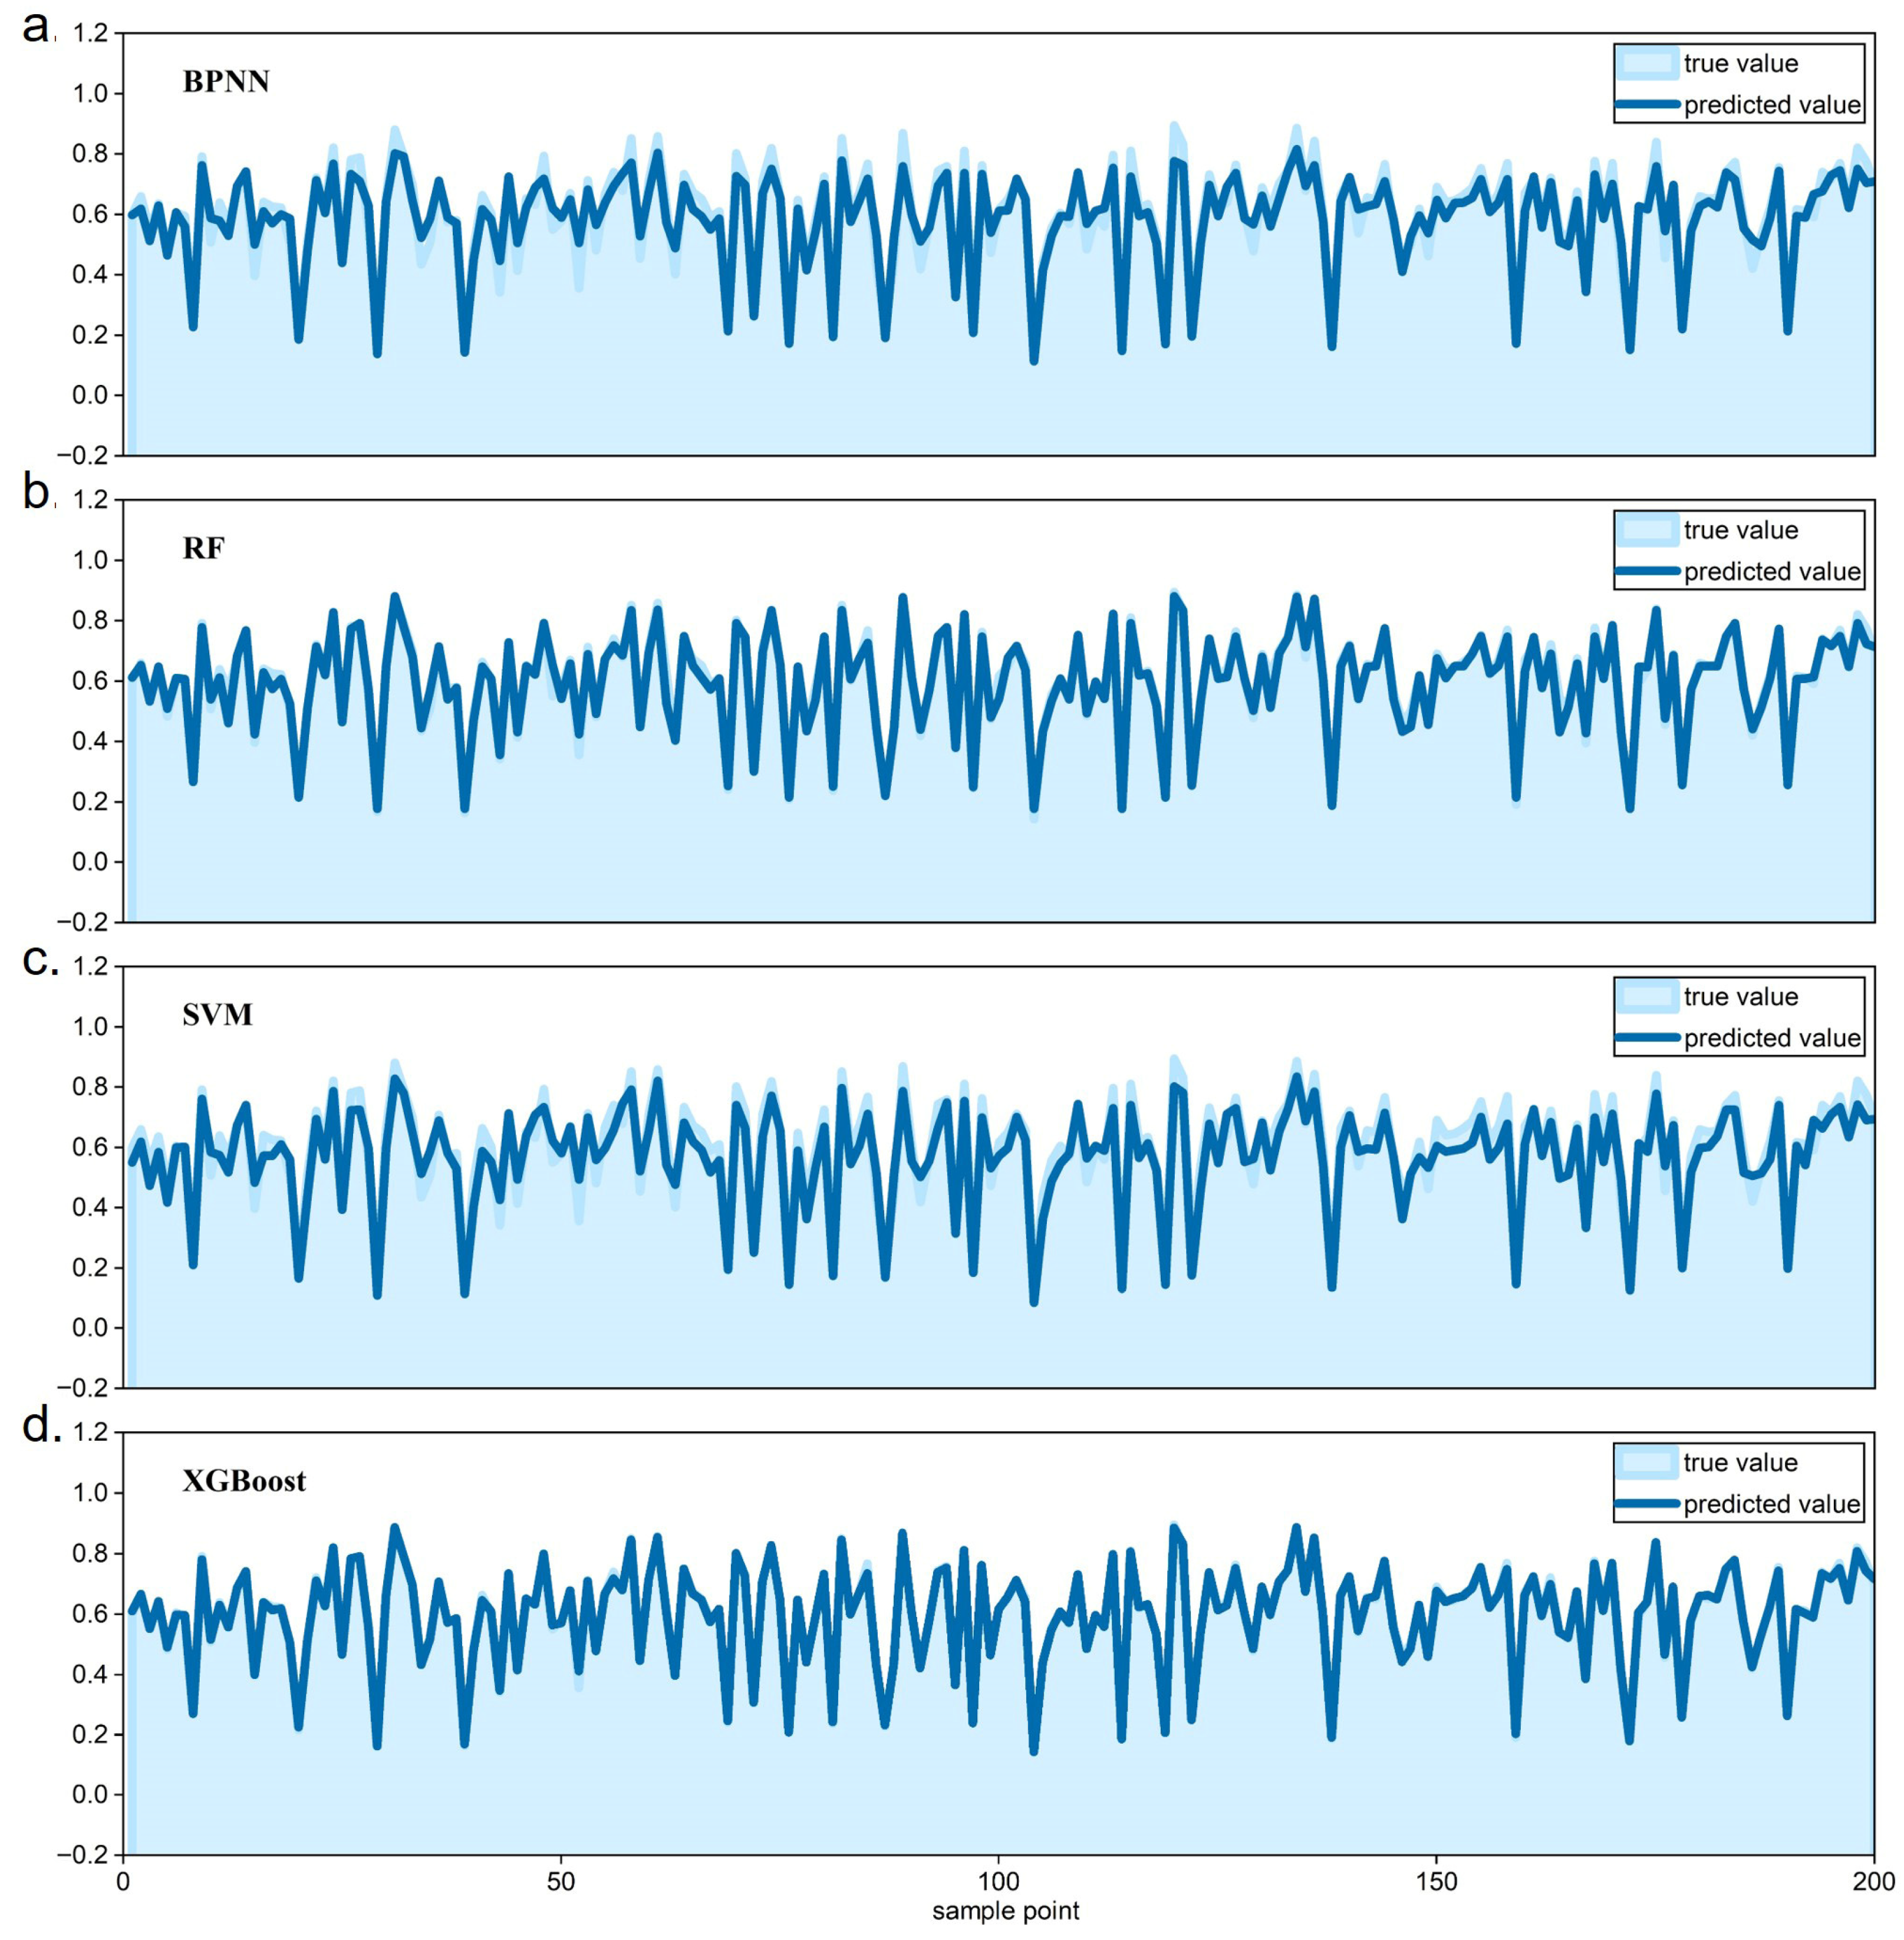
At the 90,000-grid scale, random subsampling comparisons between predictions and observations (Figure 5) show that XGBoost and RF have relatively small deviations across sharp transitions between high and low values, whereas SVM and BPNN have larger deviations in these zones. The deviations are most pronounced for BPNN, indicating insufficient accuracy and weaker stability when handling extreme gradients and boundary samples. Finer checks show amplified residuals for BPNN in these transition belts, with cumulative gaps between observations and predictions, which indicates limited adaptation to local nonlinearity and abrupt variation. By contrast, XGBoost exhibits marked error convergence in these critical areas. Within the transition belts, prediction–observation gaps shrink further and the deviation distribution is more concentrated. Quantitatively, for this independent sample, XGBoost attains the smallest RMSE (0.009), MAPE (1.20%), and MAE (0.007) and the highest R2 (0.997), substantially improving over RF (RMSE = 0.026, MAPE = 3.17%, MAE = 0.017, R2 = 0.977) and the other two models (Supplementary Table S2). Overall, XGBoost demonstrates stronger robustness and higher predictive accuracy, particularly in identifying, characterizing, and handling internal variability, thereby achieving a more stable fit.
Figure 5.
Random-subsample comparisons between observed and predicted values for the four machine learning models. (a) BPNN; (b) RF; (c) SVM; (d) XGBoost.
4.3. LDV Simulation and Projection Based on the Optimal Model and Scale
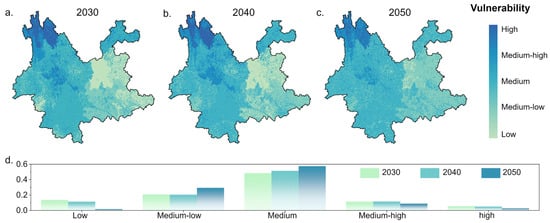
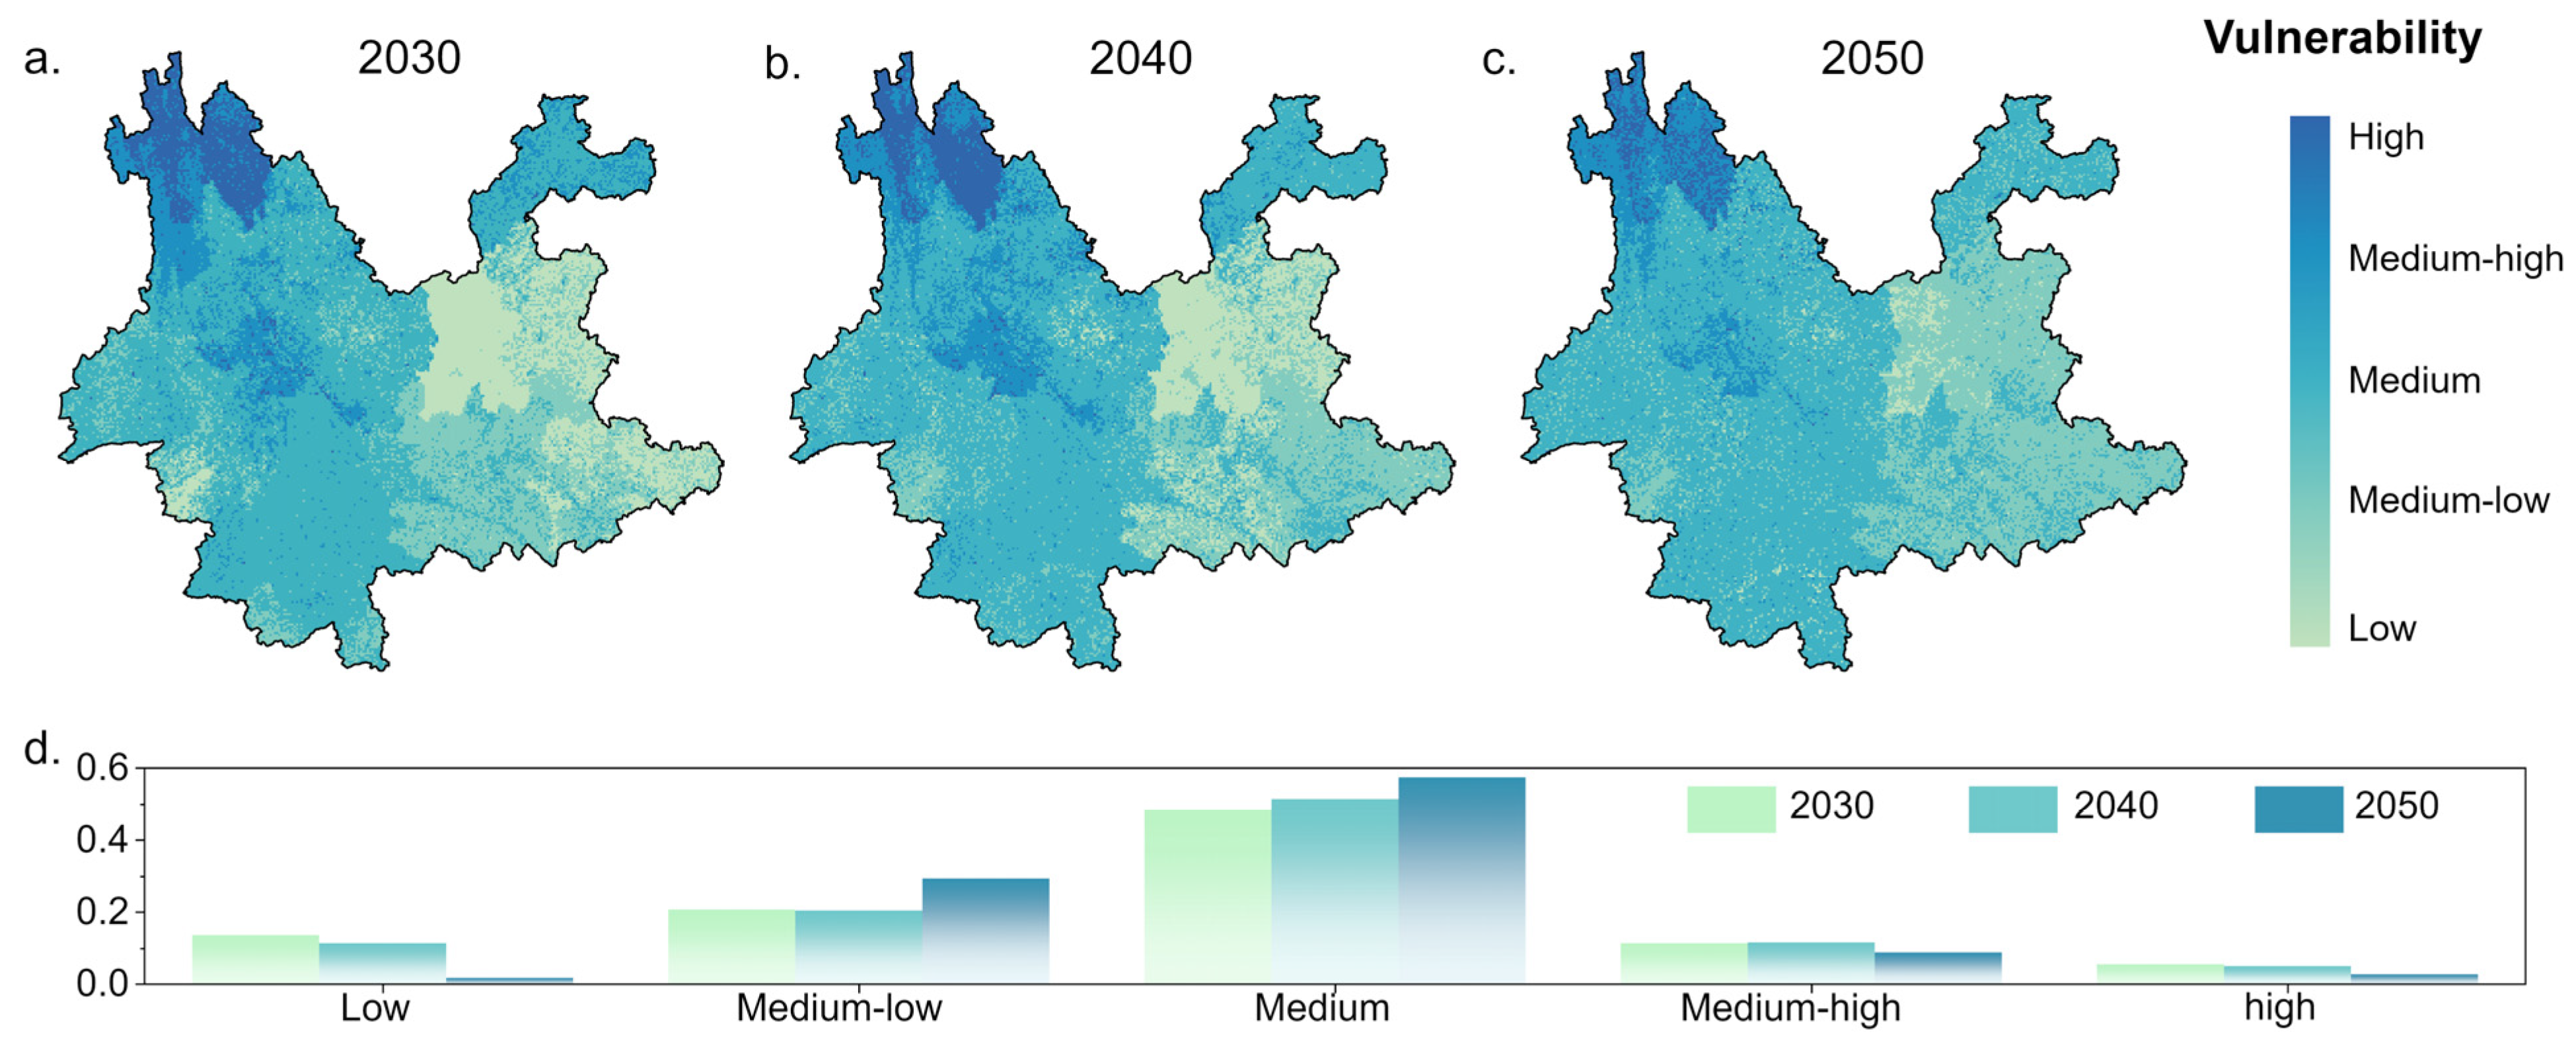
Using the XGBoost model at a scale of 90,000 grid cells, we produce projected LDV maps for Yunnan Province for 2030–2050, as shown in Figure 6. At the provincial scale, LDV continues to decline and conditions improve, yet the magnitude of improvement is modest and the areal extent of low LDV shows a rebound-type decrease.
Figure 6.
LDV projections under the optimal scale and model. Panels (a–c) show LDV for 2030–2050, and panel (d) shows the proportion of each LDV class.
Temporally, during 2030–2050, the shares of medium–high and higher LDV decline markedly, while the shares of moderate and moderately low LDV increase and the low-LDV class continues to decrease. Overall LDV improves province-wide. The reduction in high LDV appears persistent, but improvement within the low-LDV class is likely unstable. In many areas, LDV falls to a moderately low level and then stalls with a slight rebound. Spatially, medium–high and higher LDV continue to contract toward the northwest from 2030 to 2050, with Zhaotong showing a particularly pronounced decline. Benefiting from roughly two decades of structural adjustment and upgrading, Zhaotong’s economy tends toward steady growth, and both sensitivity and adaptive-capacity indices continue to move in favorable directions, so the dividends from declining vulnerability keep being realized over the next thirty years and LDV continues to fall. By 2050, only the northwestern sector maintains relatively high LDV. By contrast, Kunming, Qujing, and Wenshan in the east and southeast rebound from low LDV to lower LDV during 2030–2050. In Honghe, LDV decreases to a low level by 2030–2040 and then rises slightly to lower LDV by 2050, indicating that improvement is not sustained. These rebounds occur mainly in relatively developed jurisdictions, where earlier higher investment in disaster-reduction infrastructure depresses LDV and drives persistent declines during 2000–2020 [61]. At the same time, rising fiscal costs for disaster reduction increase budget pressures. Local governments may, therefore, target a just-adequate compliance threshold or even relax standards to reduce expenditures, which undermines long-term gains [11]. Under such assessment-driven adverse selection, improvements in LDV are difficult to sustain. After LDV drops to a moderately low level, progress stalls and a slight rebound emerges.
5. Discussion
5.1. LDV as the Outcome of Spatiotemporal Interactions Among Three Dimensions and Their Response Mechanisms
LDV assessment reveals the integrated response of exposure, sensitivity, and adaptive capacity. Although high exposure can indicate areas with greater potential loss, high exposure does not necessarily imply high sensitivity. In Yunnan, there is a distinct east–west contrast. The southern segment of the Hengduan Mountains in the west is tectonically active, densely faulted, mechanically weakened, steep, and strongly incised by rivers, which together produce a tectonics–erosion-dominated exposure regime [62,63]. When forcings such as earthquakes and extreme rainfall are superimposed, large and frequent landslides are readily triggered [64,65]. In the east, represented by the Yunnan–Guizhou Plateau, topography is gentler, yet mining, urban construction, and the expansion of sloping cropland modify surface and hydrological processes and generate a human-induced exposure pattern [66]. This contrast in exposure mechanisms underpins the spatial differentiation of landslide risk in Yunnan and provides distinct natural contexts for the roles of sensitivity and adaptation. High exposure does not automatically lead to high vulnerability. LDV in Yunnan is the product of dynamic coupling among exposure, sensitivity, and adaptation.
From 2000 to 2020, provincial LDV declines overall. The fraction of high and higher LDV falls from 68.2 percent to 34.2 percent, indicating that steady gains in adaptation and episodic control of sensitivity play key roles in offsetting exposure [36,67]. During this period, the northwest, constrained by complex geology and economic lag, is trapped in a configuration of lower exposure to people and assets with high sensitivity and low adaptation, which sustains high LDV. For example, although Diqing does not record the province maximum in exposure, fragmented terrain, weak transport connectivity, labor out-migration, and slow modernization limit disaster-reduction investment and heighten sensitivity to disturbance, so frequent landslides keep LDV in the high to very-high classes. In contrast, the northeast, exemplified by Zhaotong, combines industrial transformation and ecological restoration with continued disaster-reduction investment, achieving a favorable pathway of higher exposure with high adaptation and low sensitivity. Sensitivity declines markedly, adaptation rises from low to high, and LDV decreases accordingly. Despite the province-wide decline, high risk remains concentrated in the northwest where geology is complex and development lags, which shows that improvement is not spatially uniform and localized risks require attention [68].
Consistent with projections derived from the optimal grid scale and the optimal model XGBoost, LDV continues to decline in 2030–2050, yet marginal improvement converges and the depth of improvement is limited. The areal extent of low LDV expands and then contracts. High LDV continues to retreat toward the northwest and by 2050 is concentrated in that geologically complex sector. Meanwhile, several more developed cities, including Kunming, Qujing, and Wenshan, rebound from low to lower LDV during 2030–2050, and Honghe declines to low by 2030–2040 and then rises slightly by 2050. In our indicator system, these prefectures already exhibit high adaptive capacity, with elevated levels of local fiscal expenditure, per capita GDP, fixed-asset investment, transport accessibility, and medical and health resources. However, these same cities also experience continued increases in exposure and sensitivity indicators such as land use intensity, road and settlement expansion, population concentration, and the land economic loss modulus, indicating rapid accumulation of people and assets in potentially hazardous environments. Within the SERV formulation (LDV = exposure + sensitivity − adaptive capacity), this combination implies that further reductions in LDV require disproportionately large marginal governance costs, so local governments may tend to seek a threshold level of adaptation that is just sufficient for compliance while incremental investment in adaptive capacity converges over time [11]. Under these conditions, LDV tends to stall at a moderately low level and rebound slightly as development-driven increases in exposure and potential loss partially offset the gains from earlier improvements in adaptive capacity, which makes early declines difficult to sustain. Overall, when natural exposure cannot be altered substantially in the short-to-medium term, the governance elasticity embodied in sensitivity control and adaptation building becomes the decisive variable. If fiscal and assessment systems encourage jurisdictions to remain at a just-adequate threshold, improvements in LDV are unlikely to persist spontaneously.
The spatiotemporal evolution of LDV in Yunnan points to a stable yet uneven reality. The northwest-high and southeast-low pattern persists. The northwest remains the principal arena of high LDV under the joint influence of natural stressors and developmental constraints, which calls for measures such as infrastructure reinforcement, risk transfer, and denser early warning to raise adaptation and counter exposure that is difficult to reduce quickly. In the east and southeast, there is latent risk of governance rebound even without a clear rise in exposure. Once sensitivity control and adaptation construction encounter an investment bottleneck, LDV can deviate from a sustained downward trajectory and enter a volatile regime. Effective policy is not simply additional spending. It requires targeted allocation to vulnerable populations and critical infrastructure, extension of the effective half-life of interventions, and a shift in performance appraisal from compliance to resilience gains in order to avoid a bottleneck–rebound cycle of governance failure [11,69,70]. In summary, Yunnan’s LDV is constrained by the natural baseline and shaped by human activity. It improves over time while spatial disparities harden. Looking ahead, only a coordinated balance among exposure, sensitivity, and adaptation can consolidate low-sensitivity and high-adaptation pathways in places such as Zhaotong, reverse the structural predicament of high sensitivity with low adaptation in the northwest, and guard against governance backsliding in the more developed east, thereby shifting from vulnerability control to sustained resilience building.
5.2. Predictive Accuracy Arises from Coupling Spatial Scale with the Optimal Model
This study shows that the quality of LDV prediction does not depend on simply using a finer grid or a more complex algorithm. It depends on whether the two are matched and whether a balance is achieved between informative signal and interfering noise. If this match is ignored, parameter estimates become unstable as scale changes [71]. Apparent accuracy may seem to improve while no additional useful information is gained, which is especially evident when neighboring samples are similar and when positive and negative classes are imbalanced. Learning curves indicate that the R2 for the four models (BPNN, SVM, RF, and XGBoost) increases sharply at first as sample size grows, but an inflection appears at about ninety thousand grid cells. Adding more samples yields diminishing returns and can even degrade performance because duplicate information increases and errors are amplified [72]. With a higher resolution, grid partitioning problems become more prominent. Boundary cells readily mix heterogeneous signals, and algorithms can misclassify spatially sparse yet genuine patterns as anomalies, yielding results that look more detailed but deviate further from reality [73]. In sum, a suitable grid scale together with an appropriate training size determines the truly useful sample volume, which is the foundation for model stability and for reliable transfer to other regions or periods.
Cross-model comparisons show that predictive performance depends on the alignment between model choice and spatial scale. At roughly ninety thousand grids, tree ensembles (XGBoost and RF) exhibit smaller prediction–observation errors across high–low transition belts, whereas SVM and BPNN show larger errors. For BPNN, residuals accumulate in rugged terrain and stability weakens. Overall, XGBoost attains a lower RMSE and MAPE and higher R2 than the other models. At the same scale, the median LDV is similar across methods, although non-tree models tend to be slightly high-biased. This indicates that the “optimal model” is not the algorithm that is most complex, but the one that balances accuracy and stability at the target scale given the available sample size. Rather than endlessly refining resolution and stacking samples, one should identify the optimal combination within a controllable band of error and stability. Under the XGBoost × ninety thousand grids configuration, projections for 2030–2050 show a province-wide decline in LDV, though the decrease is shallow. The area of low LDV does not expand monotonically, but first grows and then contracts. Spatially, medium–high and higher LDV continues to contract toward the northwest and, by 2050, is concentrated in geologically complex areas, with a particularly strong decline in Zhaotong driven by industrial restructuring and disaster-reduction investment. Meanwhile Kunming, Qujing, Wenshan, and Honghe shift from low LDV back to relatively low LDV. Honghe falls to low LDV during 2030–2040 and then rises slightly by 2050. These rebounds are unlikely to be caused by increased exposure. A more plausible explanation is diminishing marginal returns and a slowdown in investment after interim targets are reached, which yields a plateau near the moderately low level and a mild rebound. Crucially, because model and scale are well matched, these subtle yet important changes can be identified reliably rather than being masked by background noise.
In conclusion, the ceiling on predictive accuracy is jointly determined by the coupling of model characteristics, spatial scale, and effective sample size. Pursuing finer scales or a supposed “best algorithm” in isolation cannot guarantee robust forecasts. In this study area, the learning-curve inflection and uncertainty convergence near ninety thousand grids, together with XGBoost’s stable behavior in transition belts, define an “optimal operating point” under the information–noise trade-off. This configuration both reproduces the northwest-high and southeast-low macro-pattern and detects modest rebounds in more developed areas, thereby informing differentiated governance. We recommend spatially stratified cross-validation combined with staged, multi-scale experiments to locate the learning-curve inflection, then fixing grid size and sample size accordingly. Near that inflection, select a more stable model with XGBoost as a baseline and adopt a small learning rate, moderate regularization, and early stopping to avoid late overfitting. The resulting paradigm—scale first, model second, with the inflection as the boundary—supports forward-looking forecasts that are credible and decision-relevant at provincial and urban–basin scales
5.3. Policy Implications and Practical Engineering Suggestions
Policy and practical engineering suggestions follow from these findings. First, for structurally vulnerable zones, engineers and planners should begin by restoring baseline adaptive capacity. Northwestern Yunnan shows persistently high LDV due to infrastructure gaps and incomplete early warning, even where exposure is not the highest, indicating that engineering practice cannot rely solely on exposure proxies but must directly target deficits in protection, access, and monitoring. Evidence indicates that policies emphasizing infrastructure upgrading and ecological restoration are effective in enhancing social–ecological adaptive capacity and reducing overall susceptibility [74], and they provide a basis for prioritizing concrete engineering interventions in high-LDV zones. Priority actions include slope stabilization and drainage works, establishment of ecological buffer belts as slow variables, and improved community landslide monitoring and early warning to strengthen endogenous defense, so that LDV maps can be translated into specific interventions such as those regrading unstable slopes, constructing or upgrading retaining and drainage structures, and designing hybrid gray–green protection along roads, river corridors, and settlement fringes. Second, the observed rebound in outcomes points to the need to optimize fiscal incentives and performance appraisal so that engineering projects for slope protection, transport corridors, and critical facilities are rewarded for durable reductions in LDV rather than short-term target fulfillment. Local governments may otherwise satisfy minimum standards to avoid penalties. Such threshold compliance undermines the durability of gains and discourages sustained investment in inspection, maintenance, and upgrading of protective works. Decision-makers should dynamically assess LDV fluctuations and tailor strategies to local conditions [11], using LDV trajectories to prioritize where to reinforce existing structures, upgrade design standards, or relocate exposed infrastructure. Practical steps include dynamic performance evaluation and long-term risk monitoring that link fiscal outlays to measured resilience gains, integrating LDV indicators into project appraisal, design briefs, and post-construction audits, which helps avoid short-term target distortion. Third, future strategies should prioritize building system resilience and endogenous response rather than relying only on static risk avoidance or external inputs, aligning structural engineering, land use planning, and ecosystem-based measures within a common resilience-oriented framework. Strengthening adaptive capacity is, therefore, central to practical engineering, from siting and design to operation and retrofit. Measures such as community participation, ecological restoration, and infrastructure improvement can elevate overall resilience [75], particularly when risk-informed design codes and scenario-based recovery planning for education, transport, and other critical infrastructure are used to anticipate and manage future disruptions. A flexible, iterative planning framework with periodic evaluation and timely adjustment should embed resilience building within development processes rather than as an after-the-fact remedy, allowing LDV information to be routinely updated and fed back into engineering decisions on where how and to what standard to build or retrofit.
6. Conclusions
This study innovatively applies the VSD framework to LDV analysis in Yunnan and uses a combined multi-model and multi-scale approach to characterize spatiotemporal evolution during 2000–2020. The results show pronounced spatial clustering and dynamic behavior of LDV. Exposure fluctuates around a stable baseline, sensitivity rises in phases, and adaptive capacity increases markedly, which substantially buffers potential risk. In space and time, LDV exhibits a northwest-high and southeast-low gradient. High-LDV zones cluster in the geologically complex northwestern mountains, while low-LDV zones occur around economically developed areas such as Kunming. With strengthened disaster risk reduction investment, the share of high and higher LDV declines from 68.2 percent in 2000 to 34.2 percent in 2020, indicating sustained improvement. Cross-scale comparisons identify an optimal inflection point at about ninety thousand grids, at which ensemble learning algorithms represented by XGBoost achieve the highest accuracy and stability. Under the optimal configuration, scenario projections for 2030–2050 indicate a continued province-wide decline in LDV, although marginal gains converge. The area of low LDV expands and then contracts, and high LDV continues to retract toward the northwest. Several developed cities, including Kunming, Qujing, and Wenshan, display rebounds from low to lower LDV. This pattern suggests structural bottlenecks of diminishing returns after targets are met, which slows growth in adaptive capacity. Overall, the proposed framework elucidates the main drivers and spatiotemporal trajectories of LDV, improves predictive accuracy and reliability, and provides transferrable experience for risk assessment in similar geological settings.
Beyond these empirical patterns, the study also makes several conceptual and methodological contributions to LDV assessment in mountainous regions. Conceptually, by embedding landslide disaster vulnerability in the VSD–SERV structure, we operationalize the coupled human–environment perspective on vulnerability at the grid-cell scale, explicitly decomposing LDV into exposure, sensitivity, and adaptive capacity and representing each component with a rich set of natural, socioeconomic, and governance indicators. This shifts the focus from hazard-centered susceptibility mapping to a systems-based, place-specific vulnerability metric that can be compared across space and time. Methodologically, we design a dynamic, multi-model, and multi-scale workflow in which LDV fields for 2000–2020 serve as training data to systematically benchmark four representative machine learning algorithms across multiple sample sizes and grid resolutions, followed by unified hyperparameter tuning and independent validation to identify an optimal model–scale configuration. Finally, by coupling this framework with scenario-based projections for 2030–2050, we treat LDV as an evolving outcome shaped by long-term trajectories of exposure, sensitivity, and adaptive capacity, thereby providing a transferable template for dynamic LDV assessment in other data-scarce, hazard-prone mountainous regions.
Despite gains from the multi-model and multi-scale design, limitations remain. First, several inputs, including the landslide disaster density indicator within the exposure dimension, rely on recorded landslide events and disaster statistics, so emergent risks not listed in hazard inventories may be missed and the inventory is likely to be spatially uneven. In practice, records tend to be more complete along roads, in settlements, and in areas with dense monitoring, whereas remote mountainous regions are more prone to underreporting, which can bias exposure assessment and the local spatial pattern of LDV. In such data-sparse areas, LDV may be underestimated relative to its true level, even though the broader northwest–southeast gradient is jointly constrained by geomorphology, climate, and land use. Second, training and validation are restricted to Yunnan, and sample redundancy and boundary effects are evident across resolutions. Generalization to finer data or other regions requires further testing. Third, although the indicator system integrates 38 factors across population, economy, and environment, dynamic elements such as intra-provincial economic heterogeneity, climate change impacts, and micro-level adaptive capacity are not fully represented, which may limit comprehensiveness. Future work should broaden observation sources, refine indicators, and conduct comparative studies across different administrative units and regional contexts. Even with these caveats, the VSD-based multi-model and multi-scale framework offers valuable guidance for improving LDV assessment in mountainous regions.
Supplementary Materials
The following supporting information can be downloaded at: https://www.mdpi.com/article/10.3390/land15010119/s1, Text S1: Indicator calculation; Text S2: Conceptual description and dimensional assignment of indicators; Text S3: Data spatialization; Text S4: Principles of four machine learning methods; Table S1: Performance of four models under three alternative hyperparameter combinations (A–C); Table S2: Performance of four models on an independent random sample at the 90,000-grid scale. Table S3: Types of disaster-bearing bodies and their unit prices. References [53,54,55,56,76,77,78,79,80,81,82,83,84,85,86,87] are cited in the supplementary materials.
Author Contributions
Conceptualization, L.X. and S.T.; methodology, L.X. and S.T.; software, L.X. and R.L.; formal analysis, L.X.; investigation, L.X. and R.L.; data curation, L.X. and R.L.; writing—original draft preparation, L.X. and R.L.; writing—review and editing, S.T.; visualization, R.L.; supervision, S.T. and R.L.; funding acquisition, S.T. All authors have read and agreed to the published version of the manuscript.
Funding
This research was funded by Xing Dian Talent Teacher’s Program of Yunnan Province (Grant NO. XDTT202206).
Data Availability Statement
The original data presented in the study are openly available at https://doi.org/10.17605/OSF.IO/FR8US.
Conflicts of Interest
The authors declare no conflicts of interest.
Abbreviations
The following abbreviations are used in this manuscript:
| LDV | Landslide disaster vulnerability |
| VSD | Vulnerability scoping diagram |
References
- Pande, P.; Raut, J.; Bhagat, R.; Dhengare, S. Integrating social vulnerability to improve landslide susceptibility assessment quality: A hybrid machine learning approach. Discov. Appl. Sci. 2025, 7, 1109. [Google Scholar] [CrossRef] [Scilit]
- Apon, M.; Notoka, K.; Chang, C.N.; Ezung, M.; Thong, G.T.; Walling, T. Analysis of an anthropogenically-induced landslide with emphasis on geological precursors. Results Earth Sci. 2024, 2, 100020. [Google Scholar] [CrossRef] [Scilit]
- Froude, M.J.; Petley, D.N. Global fatal landslide occurrence from 2004 to 2016. Nat. Hazards Earth Syst. Sci. 2018, 18, 2161–2181. [Google Scholar] [CrossRef] [Scilit]
- Tian, N.; Lan, H. The indispensable role of resilience in rational landslide risk management for social sustainability. Geogr. Sustain. 2023, 4, 70–83. [Google Scholar] [CrossRef] [Scilit]
- Alimohammadlou, Y.; Najafi, A.; Yalcin, A. Landslide process and impacts: A proposed classification method. Catena 2013, 104, 219–232. [Google Scholar] [CrossRef] [Scilit]
- Abdelkader, M.M.; Daoud, A.M.A.; Abdel-Gawad, A.G.; Csámer, Á. Improving landslide susceptibility mapping: The role of non-landslide sample selection in machine learning models. Remote Sens. Appl. Soc. Environ. 2025, 40, 101759. [Google Scholar] [CrossRef] [Scilit]
- Franceschini, R.; Rosi, A.; del Soldato, M.; Catani, F.; Casagli, N. Integrating multiple information sources for landslide hazard assessment: The case of Italy. Sci. Rep. 2022, 12, 20724. [Google Scholar] [CrossRef] [Scilit] [PubMed]
- Petley, D. Global patterns of loss of life from landslides. Geology 2012, 40, 927–930. [Google Scholar] [CrossRef] [Scilit]
- Tian, H.-H.; Xiao, T.; Shu, B.; Peng, Z.-W.; Meng, D.-B.; Deng, M. Temporal and spatial pattern analysis and susceptibility assessment of geological hazards in Hunan Province of China from 2015 to 2022. Stoch. Environ. Res. Risk Assess. 2024, 38, 1453–1474. [Google Scholar] [CrossRef] [Scilit]
- Lei, Y.; Huang, J.; Cui, Y.; Jiang, S.-H.; Wu, S.; Ching, J. Time capsule for landslide risk assessment. Georisk Assess. Manag. Risk Eng. Syst. Geohazards 2023, 17, 613–634. [Google Scholar] [CrossRef] [Scilit]
- Xu, L.; Tan, S.; Li, R. Full-chain comprehensive assessment and multi-scenario simulation of geological disaster vulnerability based on the VSD framework: A case study of Yunnan province in China. Ecol. Indic. 2025, 175, 113573. [Google Scholar] [CrossRef] [Scilit]
- Frazier, T.G.; Thompson, C.M.; Dezzani, R.J. A framework for the development of the SERV model: A Spatially Explicit Resilience-Vulnerability model. Appl. Geogr. 2014, 51, 158–172. [Google Scholar] [CrossRef] [Scilit]
- Jia, Y.; Jia, S.; Pang, R. Measurement and impact analysis of social vulnerability to geological disasters in Guizhou Province, China. Sci. Rep. 2024, 14, 25098. [Google Scholar] [CrossRef] [Scilit] [PubMed]
- Li, R.; Chen, J.; Yang, X.; Yin, S.; Shi, R.; Bai, Y.; Xu, L. The impact of population change on social-ecological systems’ vulnerability: A case of the Qinling-Daba Mountains of Southern Shaanxi in China. J. Clean. Prod. 2024, 476, 143682. [Google Scholar] [CrossRef] [Scilit]
- Adger, W.N. Vulnerability. Glob. Environ. Change 2006, 16, 268–281. [Google Scholar] [CrossRef] [Scilit]
- Turner, B.L.; Matson, P.A.; McCarthy, J.J.; Corell, R.W.; Christensen, L.; Eckley, N.; Hovelsrud-Broda, G.K.; Kasperson, J.X.; Kasperson, R.E.; Luers, A.; et al. Illustrating the coupled human–environment system for vulnerability analysis: Three case studies. Proc. Natl. Acad. Sci. USA 2003, 100, 8080–8085. [Google Scholar] [CrossRef] [Scilit]
- Turner, B.L.; Kasperson, R.E.; Matson, P.A.; McCarthy, J.J.; Corell, R.W.; Christensen, L.; Eckley, N.; Kasperson, J.X.; Luers, A.; Martello, M.L.; et al. A framework for vulnerability analysis in sustainability science. Proc. Natl. Acad. Sci. USA 2003, 100, 8074–8079. [Google Scholar] [CrossRef] [Scilit]
- Blaikie, P.; Cannon, T.; Davis, I.; Wisner, B. At Risk: Natural Hazards, People’s Vulnerability and Disasters; Routledge: London, UK, 1994; p. 304. [Google Scholar]
- Polsky, C.; Neff, R.; Yarnal, B. Building comparable global change vulnerability assessments: The vulnerability scoping diagram. Glob. Environ. Change 2007, 17, 472–485. [Google Scholar] [CrossRef] [Scilit]
- Shi, L.; Moser, S. Transformative climate adaptation in the United States: Trends and prospects. Science 2021, 372, eabc8054. [Google Scholar] [CrossRef] [Scilit]
- Caleca, F.; Lombardo, L.; Steger, S.; Tanyas, H.; Raspini, F.; Dahal, A.; Nefros, C.; Mărgărint, M.C.; Drouin, V.; Jemec-Auflič, M.; et al. Pan-European Landslide Risk Assessment: From Theory to Practice. Rev. Geophys. 2025, 63, e2023RG000825. [Google Scholar] [CrossRef] [Scilit]
- Cook, K.L.; Rekapalli, R.; Dietze, M.; Pilz, M.; Cesca, S.; Rao, N.P.; Srinagesh, D.; Paul, H.; Metz, M.; Mandal, P.; et al. Detection and potential early warning of catastrophic flow events with regional seismic networks. Science 2021, 374, 87–92. [Google Scholar] [CrossRef] [Scilit]
- Li, B.V.; Jenkins, C.N.; Xu, W. Strategic protection of landslide vulnerable mountains for biodiversity conservation under land-cover and climate change impacts. Proc. Natl. Acad. Sci. USA 2022, 119, e2113416118. [Google Scholar] [CrossRef] [Scilit]
- Fekete, A.; Damm, M.; Birkmann, J. Scales as a challenge for vulnerability assessment. Nat. Hazards 2010, 55, 729–747. [Google Scholar] [CrossRef] [Scilit]
- Forzieri, G.; Girardello, M.; Ceccherini, G.; Spinoni, J.; Feyen, L.; Hartmann, H.; Beck, P.S.A.; Camps-Valls, G.; Chirici, G.; Mauri, A.; et al. Emergent vulnerability to climate-driven disturbances in European forests. Nat. Commun. 2021, 12, 1081. [Google Scholar] [CrossRef] [Scilit] [PubMed]
- Yarveysi, F.; Alipour, A.; Moftakhari, H.; Jafarzadegan, K.; Moradkhani, H. Block-level vulnerability assessment reveals disproportionate impacts of natural hazards across the conterminous United States. Nat. Commun. 2023, 14, 4222. [Google Scholar] [CrossRef] [Scilit] [PubMed]
- Papathoma-Köhle, M.; Schlögl, M.; Fuchs, S. Vulnerability indicators for natural hazards: An innovative selection and weighting approach. Sci. Rep. 2019, 9, 15026. [Google Scholar] [CrossRef] [Scilit]
- Saha, S.; Sarkar, R.; Roy, J.; Hembram, T.K.; Acharya, S.; Thapa, G.; Drukpa, D. Measuring landslide vulnerability status of Chukha, Bhutan using deep learning algorithms. Sci. Rep. 2021, 11, 16374. [Google Scholar] [CrossRef] [Scilit]
- Sauer, I.J.; Reese, R.; Otto, C.; Geiger, T.; Willner, S.N.; Guillod, B.P.; Bresch, D.N.; Frieler, K. Climate signals in river flood damages emerge under sound regional disaggregation. Nat. Commun. 2021, 12, 2128. [Google Scholar] [CrossRef] [Scilit]
- Cao, J.-s.; Yang, Y.-q.; Deng, Z.-y.; Hu, Y.-d. Spatial and temporal evolution of ecological vulnerability based on vulnerability scoring diagram model in Shennongjia, China. Sci. Rep. 2022, 12, 5168. [Google Scholar] [CrossRef] [Scilit]
- Bergen, K.J.; Johnson, P.A.; de Hoop, M.V.; Beroza, G.C. Machine learning for data-driven discovery in solid Earth geoscience. Science 2019, 363, eaau0323. [Google Scholar] [CrossRef] [Scilit]
- Chang, K.-T.; Merghadi, A.; Yunus, A.P.; Pham, B.T.; Dou, J. Evaluating scale effects of topographic variables in landslide susceptibility models using GIS-based machine learning techniques. Sci. Rep. 2019, 9, 12296. [Google Scholar] [CrossRef] [Scilit]
- Liu, X.-D.; Xiao, T.; Zhang, S.-H.; Sun, P.-H.; Liu, L.-L.; Peng, Z.-W. Comparative study of sampling strategies for machine learning-based landslide susceptibility assessment. Stoch. Environ. Res. Risk Assess. 2024, 38, 4935–4957. [Google Scholar] [CrossRef] [Scilit]
- Luna, J.M.; Gennatas, E.D.; Ungar, L.H.; Eaton, E.; Diffenderfer, E.S.; Jensen, S.T.; Simone, C.B.; Friedman, J.H.; Solberg, T.D.; Valdes, G. Building more accurate decision trees with the additive tree. Proc. Natl. Acad. Sci. USA 2019, 116, 19887–19893. [Google Scholar] [CrossRef] [Scilit]
- Diao, F.; Weng, H.; Ampuero, J.-P.; Shao, Z.; Wang, R.; Long, F.; Xiong, X. Physics-based assessment of earthquake potential on the Anninghe-Zemuhe fault system in southwestern China. Nat. Commun. 2024, 15, 6908. [Google Scholar] [CrossRef] [Scilit] [PubMed]
- Jiang, W.; Deng, Y.; Tang, Z.; Cao, R.; Chen, Z.; Jia, K. Adaptive capacity of mountainous rural communities under restructuring to geological disasters: The case of Yunnan Province. J. Rural. Stud. 2016, 47, 622–629. [Google Scholar] [CrossRef] [Scilit]
- Ouellet, S.M.; Dettmer, J.; Lato, M.J.; Cole, S.; Hutchinson, D.J.; Karrenbach, M.; Dashwood, B.; Chambers, J.E.; Crickmore, R. Previously hidden landslide processes revealed using distributed acoustic sensing with nanostrain-rate sensitivity. Nat. Commun. 2024, 15, 6239. [Google Scholar] [CrossRef] [Scilit]
- Wang, X.; Zhang, C.; Wang, C.; Liu, G.; Wang, H. GIS-based for prediction and prevention of environmental geological disaster susceptibility: From a perspective of sustainable development. Ecotoxicol. Environ. Saf. 2021, 226, 112881. [Google Scholar] [CrossRef] [Scilit]
- Liu, X.; Shao, S.; Shao, S. Landslide susceptibility zonation using the analytical hierarchy process (AHP) in the Great Xi’an Region, China. Sci. Rep. 2024, 14, 2941. [Google Scholar] [CrossRef] [Scilit]
- Chen, W.; Xie, X.; Wang, J.; Pradhan, B.; Hong, H.; Bui, D.T.; Duan, Z.; Ma, J. A comparative study of logistic model tree, random forest, and classification and regression tree models for spatial prediction of landslide susceptibility. CATENA 2017, 151, 147–160. [Google Scholar] [CrossRef] [Scilit]
- Agliata, R.; Bortone, A.; Mollo, L. The impact of the aggregation formula on indicator-based method for the assessment of building susceptibility to hydro-meteorological hazards. Int. J. Disaster Risk Reduct. 2022, 72, 102850. [Google Scholar] [CrossRef] [Scilit]
- Zhang, R.; Jiang, A.; Jiang, L. Exposure-Sensitivity-Adaptability (ESA) framework based evaluation and characteristics analysis of urban disasters vulnerability in China. Ecol. Indic. 2025, 176, 113662. [Google Scholar] [CrossRef] [Scilit]
- Füssel, H.-M. Vulnerability: A generally applicable conceptual framework for climate change research. Glob. Environ. Change 2007, 17, 155–167. [Google Scholar] [CrossRef] [Scilit]
- Waseem, H.B.; Rana, I.A. A holistic approach for assesssing multidimensional adaptive capacity to floods: From conceptualization to empirical assessment. Int. J. Disaster Risk Reduct. 2025, 128, 105729. [Google Scholar] [CrossRef] [Scilit]
- Enerlan, G.P. An analysis on the economic resilience and vulnerability of local economies in the Philippines to hydrometeorological disasters. Int. J. Disaster Risk Reduct. 2023, 84, 103447. [Google Scholar] [CrossRef] [Scilit]
- Muttarak, R.; Lutz, W. Is Education a Key to Reducing Vulnerability to Natural Disasters and hence Unavoidable Climate Change? Ecol. Soc. 2014, 19, 42. [Google Scholar] [CrossRef] [Scilit]
- Miao, C.; Gou, J. CNRDv1.0: The China natural runoff dataset version 1.0 (1961–2018). Natl. Tibet. Plateau Data Cent. 2022. [Google Scholar] [CrossRef]
- Peng, S. 1-km Monthly Precipitation Dataset for China (1901–2024). 2020. Available online: https://zenodo.org/records/3114194 (accessed on 5 January 2026).
- Peng, S. 1-km monthly mean temperature dataset for china (1901–2022). Natl. Tibet. Plateau Data Cent. 2020. [Google Scholar] [CrossRef]
- Yang, J.; Huang, X. The 30m annual land cover dataset and its dynamics in China from 1990 to 2019. Earth Syst. Sci. Data 2021, 13, 3907–3925. [Google Scholar] [CrossRef] [Scilit]
- Dong, J.; Zhou, Y.; You, N. China 30-meter annual maximum NDVI dataset, 2000–2022. 2021. [CrossRef]
- Diakoulaki, D.; Mavrotas, G.; Papayannakis, L. Determining objective weights in multiple criteria problems: The critic method. Computers & Operations Research 1995, 22, 763–770. [Google Scholar] [CrossRef] [Scilit]
- Rumelhart, D.E.; Hinton, G.E.; Williams, R.J. Learning representations by back-propagating errors. Nature 1986, 323, 533–536. [Google Scholar] [CrossRef] [Scilit]
- Cortes, C.; Vapnik, V. Support-vector networks. Mach. Learn. 1995, 20, 273–297. [Google Scholar] [CrossRef] [Scilit]
- Breiman, L. Random Forests. Mach. Learn. 2001, 45, 5–32. [Google Scholar] [CrossRef] [Scilit] [PubMed]
- Chen, T.; Guestrin, C. XGBoost: A Scalable Tree Boosting System. In Proceedings of the 22nd ACM SIGKDD International Conference on Knowledge Discovery and Data Mining, San Francisco, CA, USA, 13–17 August 2016; pp. 785–794. [Google Scholar]
- Espinoza Córdova, F.; Krause, T.; Furlan, E.; Allegri, E.; O’Leary, B.C.; Degia, K.; Trégarot, E.; Cornet, C.C.; de Juan, S.; Fonseca, C.; et al. Framing adaptive capacity of coastal communities: A review of the role of scientific framing in indicator-based adaptive capacity assessments in coastal social-ecological systems. Ocean. Coast. Manag. 2024, 259, 107455. [Google Scholar] [CrossRef] [Scilit]
- Xu, L.; Ning, S.; Xu, X.; Wang, S.; Chen, L.; Long, R.; Zhang, S.; Zhou, Y.; Zhang, M.; Thapa, B.R. Comparative analysis of machine learning models and explainable AI for agriculture drought prediction: A case study of the Ta-pieh mountains. Agric. Water Manag. 2024, 306, 109176. [Google Scholar] [CrossRef] [Scilit]
- Zhang, L.; Zhang, J.; Ming, Z.; Li, H.; Chen, R.; Jia, Y. Effects of changing spatial scale on debris-flow hazard assessment: A case study in the Dadu River basin, China. Sci. Total Environ. 2024, 954, 176482. [Google Scholar] [CrossRef] [Scilit]
- Rougier, J. Ensemble Averaging and Mean Squared Error. J. Clim. 2016, 29, 8865–8870. [Google Scholar] [CrossRef] [Scilit]
- Parida, Y.; Roy Chowdhury, J.; Saini, S.; Dash, D.P. Role of income and government responsiveness in reducing the death toll from floods in Indian states. Sci. Rep. 2022, 12, 16978. [Google Scholar] [CrossRef] [Scilit]
- Zhang, H.-P.; Liu, S.-F.; Yang, N.; Zhang, Y.-Q.; Zhang, G.-W. Geomorphic characteristics of the Minjiang drainage basin (eastern Tibetan Plateau) and its tectonic implications: New insights from a digital elevation model study. Isl. Arc 2006, 15, 239–250. [Google Scholar] [CrossRef] [Scilit]
- Qin, Y.; Zhang, D.; Zheng, W.; Liu, B.; Gong, Z. Spatial distribution of near-fault landslides along Litang fault zones, eastern Tibetan Plateau. Geomorphology 2024, 455, 109189. [Google Scholar] [CrossRef] [Scilit]
- Xin, Z.; Xiaoyu, Z.; Hao, L.; Chenyi, Z.; Zhile, S.; Lijun, J.; Zelin, W.; Zheng, F.; Jiayang, Y.; Xin, Y.; et al. The relationship between geological disasters with land use change, meteorological and hydrological factors: A case study of Neijiang City in Sichuan Province. Ecol. Indic. 2023, 154, 110840. [Google Scholar] [CrossRef] [Scilit]
- Yang, Y.; Tang, P.; Xiao, H.; Yan, X. Preliminary Analysis on Relationships between Geo-hazards and River Systems of Yunnan Province. J. Catastrophology 2017, 32, 36–39. [Google Scholar] [CrossRef]
- Yang, C.; Liu, H.; Li, Q.; Wang, X.; Ma, W.; Liu, C.; Fang, X.; Tang, Y.; Shi, T.; Wang, Q.; et al. Human expansion into Asian highlands in the 21st Century and its effects. Nat. Commun. 2022, 13, 4955. [Google Scholar] [CrossRef] [Scilit] [PubMed]
- Zhang, P.; Jin, T.; Zhang, M.; Zhu, A. Spatial correlation networks characteristics and influence mechanisms of the resilience of Beijing–Tianjin–Hebei urban agglomeration: A complex network perspective. Humanit. Soc. Sci. Commun. 2025, 12, 1434. [Google Scholar] [CrossRef] [Scilit]
- Chen, J.; Yang, X.; Yin, S.; Wu, K. The vulnerability evolution and simulation of the social-ecological systems in the semi-arid area based on the VSD framework. Acta Geogr. Sin. 2016, 71, 1172–1188. [Google Scholar] [CrossRef]
- Lan, H.; Tian, N.; Li, L.; Liu, H.; Peng, J.; Cui, P.; Zhou, C.; Macciotta, R.; Clague, J.J. Poverty control policy may affect the transition of geological disaster risk in China. Humanit. Soc. Sci. Commun. 2022, 9, 80. [Google Scholar] [CrossRef] [Scilit]
- Dai, Z.; Wu, G. Disaster risk reduction policies and perceived community resilience in rural ethnic minority communities in China. Humanit. Soc. Sci. Commun. 2025, 12, 805. [Google Scholar] [CrossRef] [Scilit]
- Li, R.; Chen, J.; Yang, X.; Yin, S.; Xu, L.; Bai, Y. Assessment and prediction of social-ecological systems’ vulnerability based on optimized SVM model: A case study of the Qinling-Daba Mountains in southern Shaanxi. Acta Ecol. Sin. 2025, 45, 2281–2297. [Google Scholar] [CrossRef] [Scilit]
- Li, S.; Ge, Q.; Sun, F.; Ji, Q.; Liu, W.; Liu, R.; Xu, D.; Tao, Z. Annual 30 m land cover dataset on the Tibetan Plateau from 1990 to 2023. Sci. Data 2025, 12, 510. [Google Scholar] [CrossRef] [Scilit]
- Su, Y.; Bu, F.; Zhu, Y.; Yang, L.; Wu, Q.; Zheng, Y.; Zhao, J.; Yu, L.; Jiang, N.; Wang, Y.; et al. Hepatitis B virus core protein as a Rab-GAP suppressor driving liver disease progression. Sci. Bull. 2024, 69, 2580–2595. [Google Scholar] [CrossRef] [Scilit]
- D’Amico, E. Resilient by design: Isolating impactful climate adaptation measures in New England. npj Clim. Action 2025, 4, 80. [Google Scholar] [CrossRef] [Scilit]
- Azhar, M.; Kane, B.; Vahedifard, F.; AghaKouchak, A. Comprehensive portfolio of adaptation measures to safeguard against evolving flood risks in a changing climate. Commun. Earth Environ. 2025, 6, 824. [Google Scholar] [CrossRef] [Scilit]
- Cai, C.; Ding, S.; Shi, Z.; Huang, L.; Zhang, G. Study of applying USLE and geographical information system IDRISI to predict soil erosion in small watershed. J. Soil Water Conserv. 2000, 19–24. [Google Scholar] [CrossRef]
- Hamidou, S.T.; Mehdi, A. Enhancing IDS performance through a comparative analysis of Random Forest, XGBoost, and Deep Neural Networks. Mach. Learn. Appl. 2025, 22, 100738. [Google Scholar] [CrossRef] [Scilit]
- Han, Z.; Li, J.; Yin, H.; Shen, T.; Xu, C. Analysis of ecological security of wetland in Liaohe River delta based on the landscape pattern. Ecol. Environ. Sci. 2010, 19, 701–705. [Google Scholar] [CrossRef]
- Lee, S. Soil erosion assessment and its verification using the Universal Soil Loss Equation and Geographic Information System: A case study at Boun, Korea. Environ. Geol. 2004, 45, 457–465. [Google Scholar] [CrossRef] [Scilit]
- Liu, B.Y.; Nearing, M.A.; Risse, L.M. Slope Length Effects on Soil Loss for Steep Slopes. Soil Sci. Soc. Am. J. 2000, 64, 1759–1763. [Google Scholar] [CrossRef] [Scilit]
- Renard, K.G.; Freimund, J.R. Using monthly precipitation data to estimate the R-factor in the revised USLE. J. Hydrol. 1994, 157, 287–306. [Google Scholar] [CrossRef] [Scilit]
- Shukla, S.; Wood, A.W. Use of a standardized runoff index for characterizing hydrologic drought. Geophys. Res. Lett. 2008, 35. [Google Scholar] [CrossRef] [Scilit]
- Thornwaite, C.W. An approach toward a rational classification of climate. Geogr. Rev. 1948, 38, 55–94. [Google Scholar] [CrossRef] [Scilit]
- Wang, J.; Cheng, W.; Qi, S.; Zhou, C.; Zhang, W.; Tong, C. Sensitive evaluation and spatial analysis of soil and water loss based on USLE and GIS: Taking Taihang Mountain area of Hebei Province as an example. Geogr. Res. 2014, 33, 614–624. [Google Scholar] [CrossRef]
- Yan, J.; Zhang, Y.; Liu, L.; Liu, Y.; Zheng, D. Land use and landscape pattern change: A linkage to the construction of the Qinghai-Xizang Highway. J. Geogr. Sci. 2002, 12, 253–265. [Google Scholar] [CrossRef] [Scilit]
- Zhang, W.; Fu, J. Rainfall erosivity estimation under different rainfall amount. Resour. Sci. 2003, 25, 35–41. [Google Scholar]
- Zhu, L.; Wu, X.; Yin, K.; Liu, X. Risk zonation of landslide in China based on information content model. J. Earth Sci. Environ. 2004, 26, 52–56. [Google Scholar] [CrossRef]

Disclaimer/Publisher’s Note: The statements, opinions and data contained in all publications are solely those of the individual author(s) and contributor(s) and not of MDPI and/or the editor(s). MDPI and/or the editor(s) disclaim responsibility for any injury to people or property resulting from any ideas, methods, instructions or products referred to in the content. |
© 2026 by the authors. Licensee MDPI, Basel, Switzerland. This article is an open access article distributed under the terms and conditions of the Creative Commons Attribution (CC BY) license.