


Abstract
Total nitrogen (TN) is a critical indicator of water eutrophication. Conventional detection methods (e.g., alkaline potassium persulfate digestion and the Kjeldahl method) suffer from complex sample preparation, time-consuming operations, and reagent-induced pollution. Laser-induced breakdown spectroscopy (LIBS) offers unique advantages for rapid water quality analysis, yet it predominantly relies on costly actively Q-switched lasers, with passive Q-switching rarely explored due to multi-pulse output instability. This study employed a passively Q-switched laser as the excitation source for water TN measurement. By optimizing the multi-pulse trigger position, the signal-to-background ratio (SBR) was effectively enhanced. Combined with the substrate liquid–solid conversion method, key parameters (trigger delay, laser energy, argon flow rate) were optimized. Laboratory measurements of KNO3 standard solutions (0–25 mg/L) using cyanogen (CN) molecular spectral lines yielded a coefficient of determination (R2) of 0.98, and a limit of detection (LoD) of 2.19 mg/L. Tests on actual water samples showed relative deviations ranging from 3.93% to 6.39%. These results demonstrate that passively Q-switched LIBS is a viable, cost-effective solution for rapid water nitrogen detection.
1. Introduction
Total nitrogen (TN) is one of the important basic indicators for evaluating water quality. Excessively high TN content can lead to excessive algae reproduction, water eutrophication, and disruption of the ecological balance [1]. Untreated domestic sewage, industrial wastewater, and agricultural fertilizer discharge are the main pollution sources, which seriously affect the quality of surface water and groundwater [2]. Chinese national standards such as “Water Quality for Landscape Environment Use of Reclaimed Urban Sewage” (GB/T 18921—2019) have designated TN as a basic indicator for evaluating water environment quality [3]. Therefore, the determination of TN content in water is crucial for the balance of the aquatic ecosystem.
Existing TN analysis methods (such as alkaline potassium persulfate digestion, ultraviolet spectrophotometry and the Kjeldahl method) have problems including complex pretreatment, long time consumption, and dependence on laboratory conditions, making it difficult to meet the needs of on-site rapid monitoring [4]. Laser-induced breakdown spectroscopy (LIBS) technology has been developed as an alternative analytical technology in fields such as environmental monitoring [5], biomedicine [6], food inspection [7], rock and mineral analysis [8], cultural heritage protection [9], and waste recycling [10], due to its advantages of no complex pretreatment, rapid detection, and simultaneous multi-element analysis [11].
LIBS technology has been successfully applied to the qualitative and quantitative analysis of N elements in substances such as soil [12,13,14] and fertilizers [15]. Usually, atomic emission spectra of N I 744.23 nm and N I 746.83 nm and CN molecular spectra are used as analytical spectral lines [16,17,18,19]. Yan et al. [18] used a portable LIBS system, and based on the 746.83 nm nitrogen atomic characteristic spectral line, the coefficient of determination for nitrate determination was found to be 0.94; Hossen et al. [20] constructed a calibration model using nitrogen peaks such as 493.4 nm, with a maximum coefficient of determination of 0.99 and an RMSPE (Root Mean Square Percentage Error) of 10.8% for estimating soil total nitrogen content; Dib et al. [16] first used the 388.3 nm CN diatomic molecular emission band as the analytical object, achieving a calibration curve correlation coefficient of 0.97 and a detection limit of 0.52% for quantitative detection of nitrogen in biochar-based fertilizers. However, most existing studies focus on solid samples such as soil and fertilizers, and there are few reports on nitrogen detection in water.
In the process of nitrogen (N) detection in water, when the laser is directly focused on the water surface for detection, the detection signal stability is poor and the detection limit is high due to the effects of liquid splashing and plasma quenching [21]. In contrast, the substrate liquid–solid conversion method can achieve higher detection sensitivity. In addition, laser-induced breakdown spectroscopy (LIBS) technology currently mainly uses actively Q-switched lasers, which are costly and complex in structure, while passively Q-switched lasers have the advantages of low cost, simple and compact structure, and small size [22]. However, due to their stability issues, research on nitrogen detection in water based on passively Q-switched multi-pulse lasers remains scarce. In this study, the stability of LIBS signals was improved by selecting the trigger position of multi-pulse lasers, and the plasma signal was enhanced and matrix interference was reduced through multi-pulse output [23]. The purpose of this study is to develop a multi-pulse LIBS system to realize nitrogen detection in water.
The spectrum of N element is significantly affected by detection conditions, so it is necessary to conduct in-depth research on the excitation characteristics of N element in samples. In this study, a LIBS experimental system was constructed based on liquid–solid conversion-assisted LIBS technology and a commercial passively Q-switched Nd: YAG laser. Potassium nitrate standard solutions were selected as the analytical objects, and standard samples with different nitrogen concentrations were prepared. In an argon (Ar) environment, the effects of parameters such as laser energy, trigger pulse sequence, and delay time of the passively Q-switched multi-pulse laser on the excitation characteristics of N element were studied. Combined with the internal standard method, the correlation between spectral information and element content was established. This study will provide a basis for the application of passively Q-switched multi-pulse laser LIBS technology in N element detection in water.
2. Experimental System and Sample Preparation
2.1. Hardware Design of the Experimental Setup
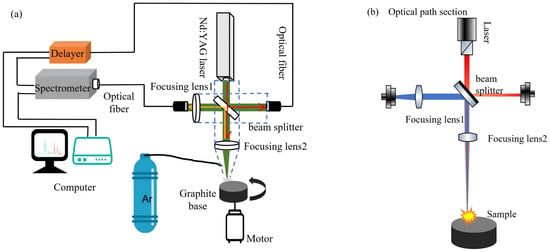
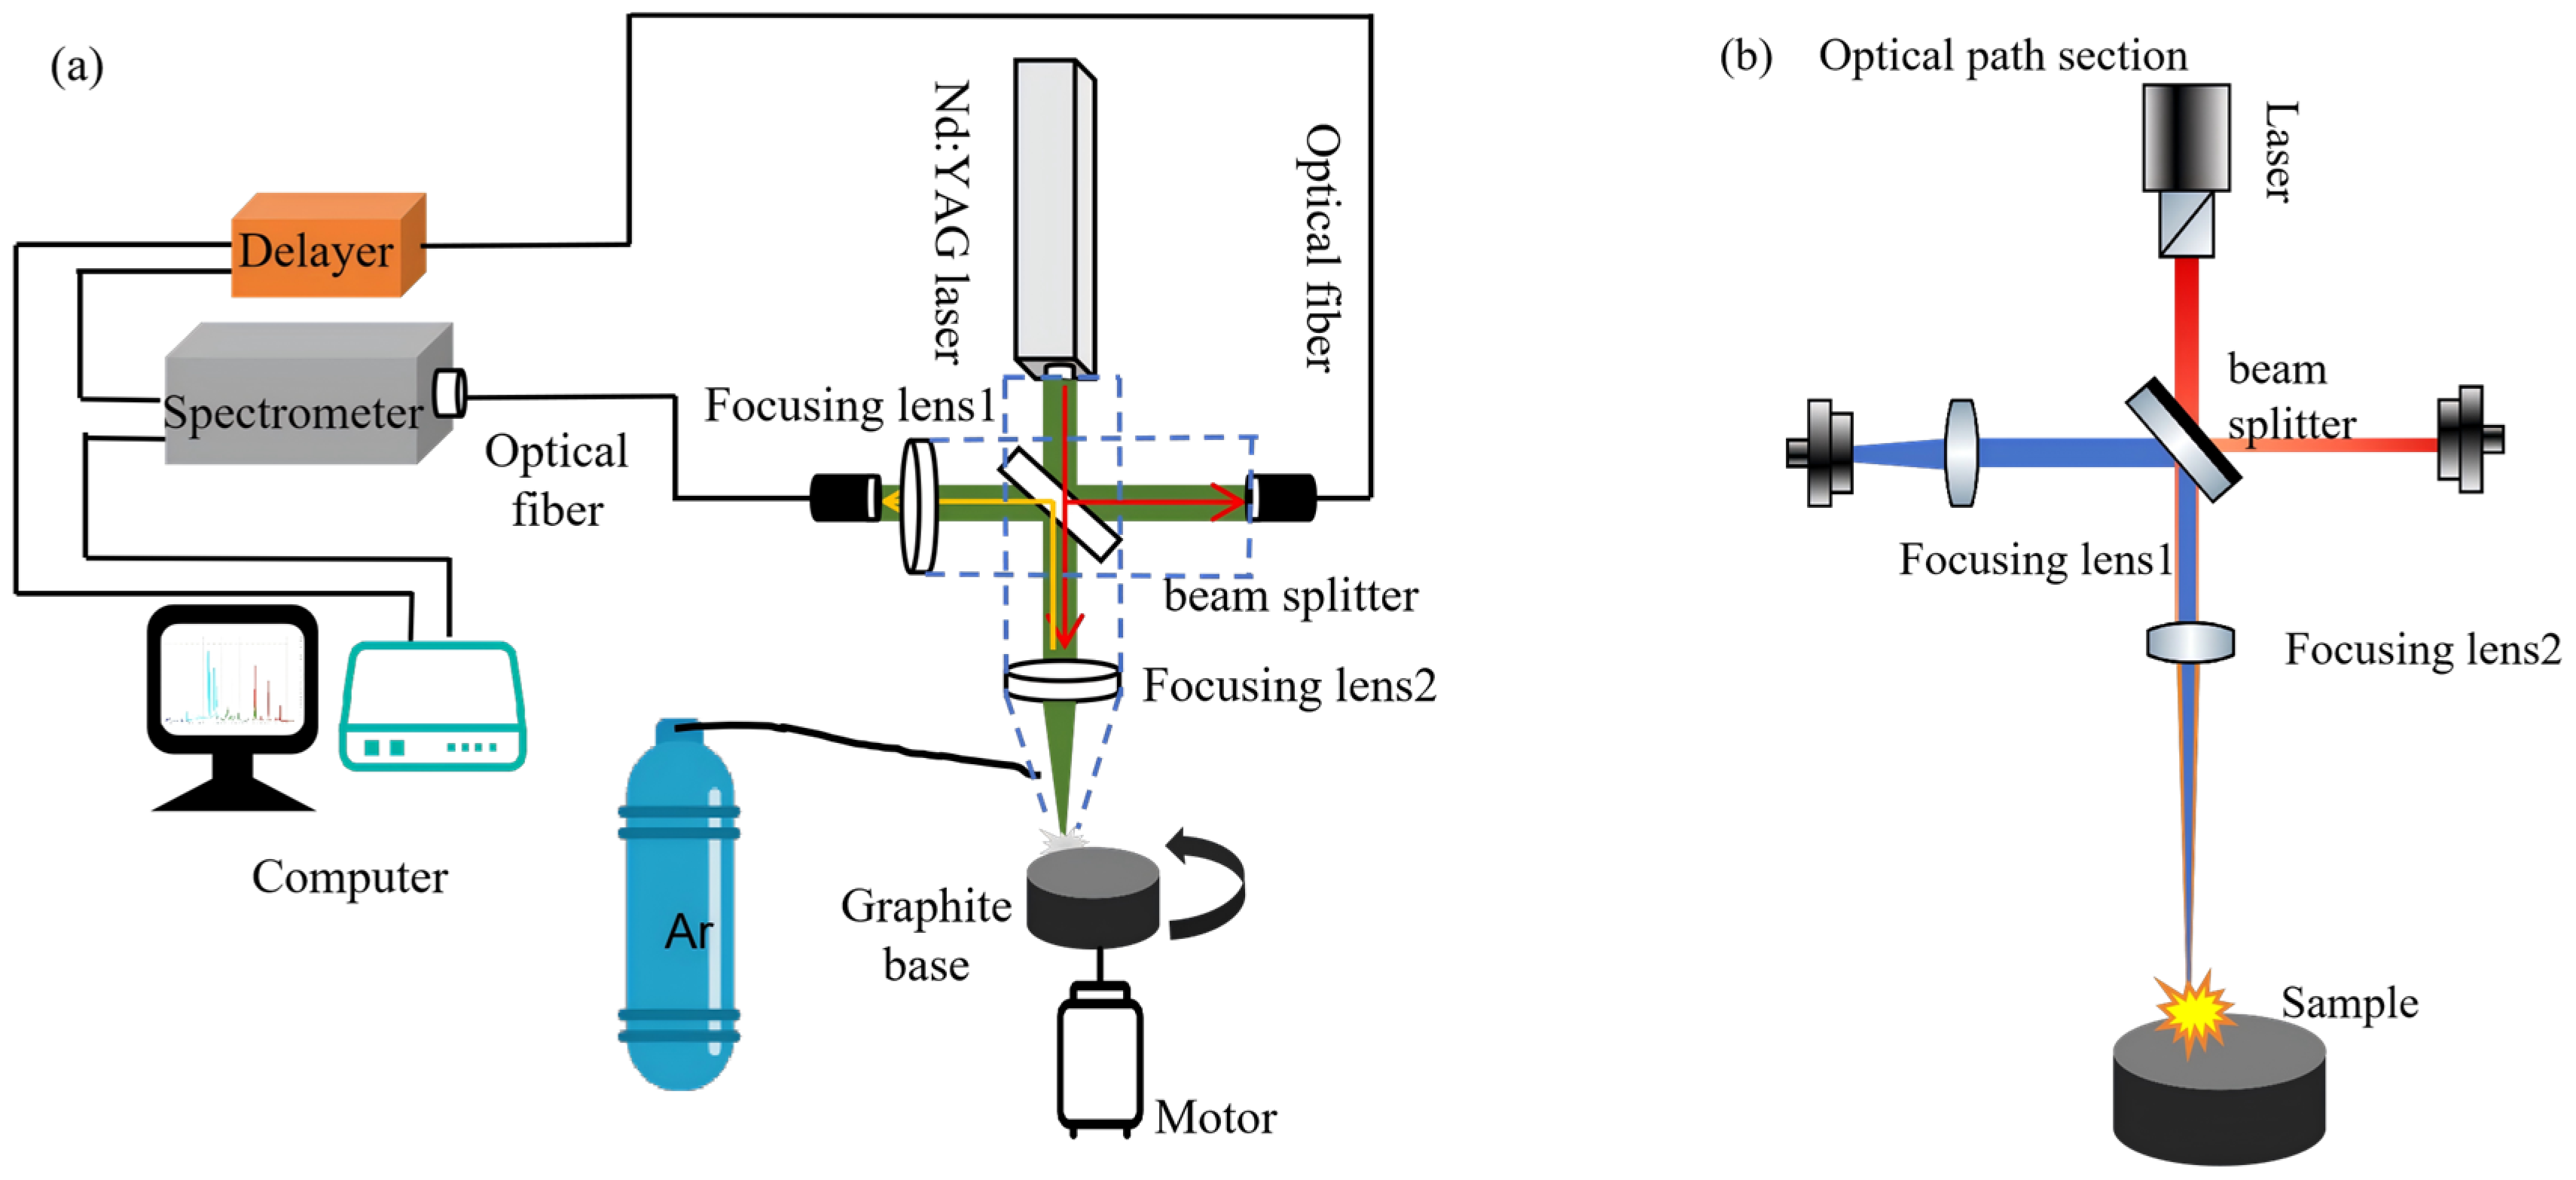
The structure of the laser-induced breakdown spectroscopy detection system used in the study is shown in Figure 1. The laser light source used to excite the plasma is a passively Q-switched multi-pulse Nd: YAG laser. The laser beam emitted by the laser passes through a 45° dichroic mirror (reflectivity greater than 98% in the wavelength range of 200 nm to 700 nm, transmittance greater than 95% in the wavelength range of 750 nm to 1100 nm), and then is focused on the sample surface through a focusing lens (150 mm). A small part of the laser is reflected by the 45° dichroic mirror as the trigger light source for the delayer. The spectral signal emitted outward by the excited plasma returns to the 45° dichroic mirror along the original path and is transmitted to the spectrometer through the focusing lens (30 mm) in the receiving system. The spectrometer used is an Avantes fiber optic spectrometer (AVS-DESKTOP-USB2), manufactured by Avantes, Apeldoorn, Netherlands; sourced and purchased in China. The receiving system is assembled by a lens, a lens barrel, and an optical fiber port adapter ring. The focusing lens and the 45° dichroic mirror are installed in the probe gun. Throughout the experiment, argon gas (purity ≥ 99.9%, Longkou Huadong Gas Co., Ltd., Longkou, China) was introduced from the side of the probe gun to cover the plasma and isolate nitrogen interference from the air. The sample solution to be tested was uniformly deposited in the circular graphite groove and then heated at 80 °C using a heating plate to solidify the target N element on the substrate surface. The sample after liquid–solid conversion is placed on an electric turntable with a rotation speed of 2 r/min to ensure that the laser acts on different areas of the sample during each analysis. In this study, laser-induced breakdown spectra were collected at 20 different positions on the surface of each sample. The displayed spectral curve is obtained by baseline correction, normalization, and averaging of these 20 spectral curves, aiming to further reduce the impact of noise and jitter.
Figure 1.
LIBS experimental system. (a) Schematic diagram of the experimental setup. (b) Laser optical path and spectral collection path.
2.1.1. Laser Emission Module
The experimental setup includes a laser emission module, a pulse selection and delay module, and a spectral collection module. The experimental system uses a passively Q-switched multi-pulse Nd: YAG laser (Pico, Shanghai, China) as the excitation light source, with an operating wavelength of 1064 nm, a frequency selectable between 1 Hz and 10 Hz, a built-in small circulating water cooling system, and a laser-rated energy range of 50 mJ to 2000 mJ. When the laser energy is lower than 700 mJ, three laser pulses are emitted; when the laser energy is between 700 mJ and 1400 mJ, four laser pulses are emitted; when the laser energy is higher than 1400 mJ, five pulses are emitted. The laser pulse width is 20 ns, and the time interval between different pulses is between 20 µs and 35 µs. This laser was selected as the excitation light source due to its advantages of simple operation, low cost, and high repetition frequency.
2.1.2. Spectral Collection Module
The spectrometer is the core component of the spectral collection module. An Avantes four-channel fiber optic spectrometer (Avantes Avsdesktop USB3.0, The Netherlands) was selected for the experiment. Each channel integrates a 2048-pixel linear CCD as the detection device, with a detection wavelength range of 200~570 nm and a spectral resolution of 0.2~0.28 nm.
To solve the problem of plasma spectral collection in the LIBS experimental system, this study optimized the design of the spectral collection path, changing from a lateral collection optical path to an axial collection optical path. The schematic diagram of the optimized design of the collection path is shown in Figure 1. The axial collection optical path system has high integration and good optical path stability; it can use the laser focusing lens to achieve both focusing and signal collection, with a compact structure, which is more suitable for high-stability online detection scenarios. The shape of the spectral curve before and after path optimization was roughly similar, but optimizing the collection path effectively reduced the intensity of the continuous spectral background and improved the quality of spectral collection.
2.1.3. Pulse Selection and Delay Module
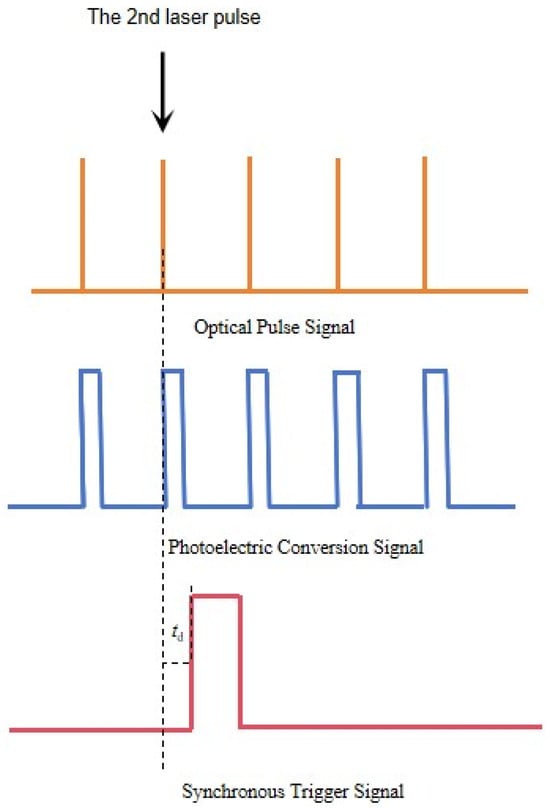
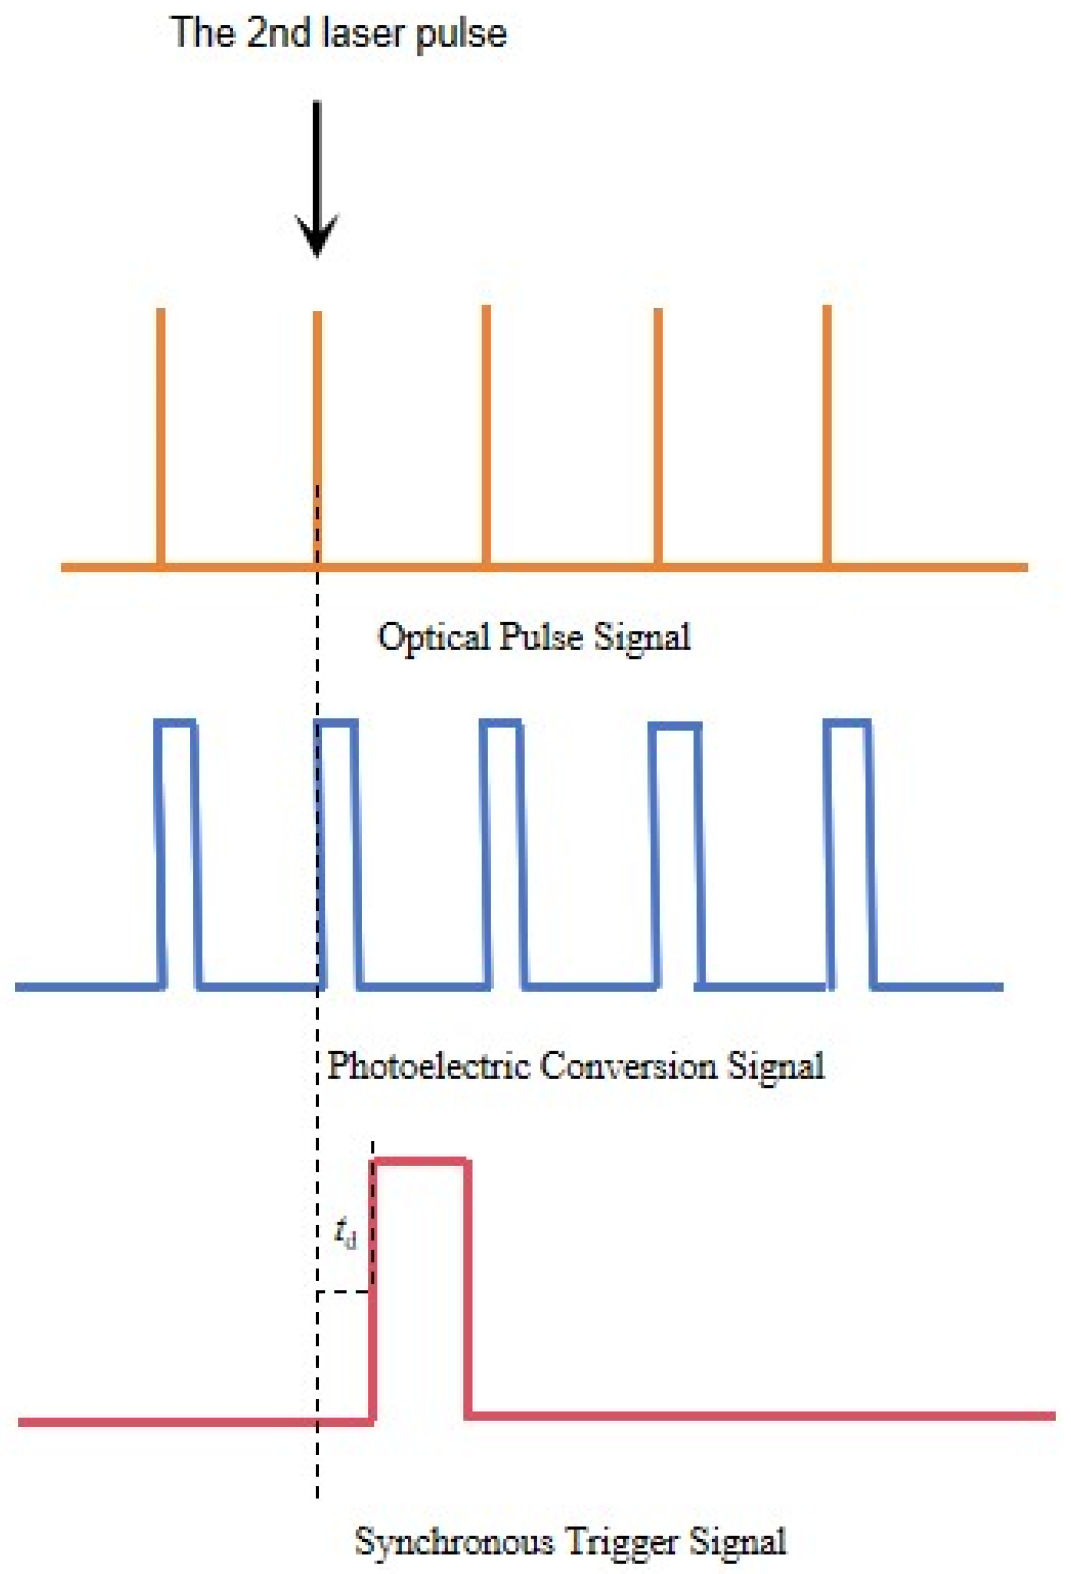
The delayer is the core component of the pulse selection and delay module. The delayer used in the system is independently designed by the laboratory, which can realize the functions of delay and optical pulse selection and triggering. It converts the collected original optical pulse signal into an electrical signal through a photodiode and converts it into a corresponding TTL square wave signal through a gate driver. The photodiode of the delayer is an SFH209P type photodiode, manufactured by OSRAM Opto Semiconductors, Regensburg, Germany, and purchased in China, with an operating wavelength range of 400–1100 nm. The voltage signal converted from the optical pulse signal through the photodiode is an analog signal, which is converted into a TTL signal through the UCC27519 chip, manufactured by OSRAM Opto Semiconductors, Regensburg, Germany, and purchased in China. The TTL signal is delayed to obtain a trigger signal. By selecting different trigger pulses and delays, the intensity, SBR, and stability of the LIBS signal can be improved. The selection of trigger pulses for the TTL signal generated by photoelectric conversion and the generation of delay signals are completed by the STM32F446 chip, manufactured by STMicroelectronics, Geneva, Switzerland, and purchased in China. If the delayer selects the 2nd optical pulse as the trigger pulse, the timing diagram of generating the delay signal with a time delay, td µs is shown in Figure 2.
Figure 2.
Schematic diagram of pulse trigger selection and delay signal.
2.2. Sample Preparation
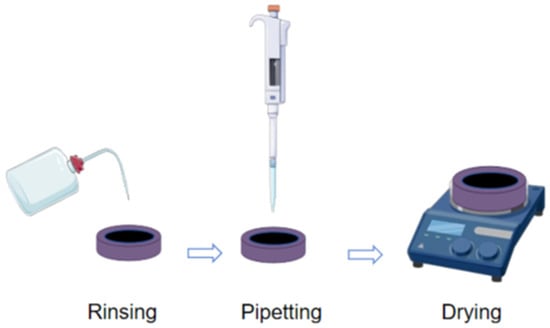
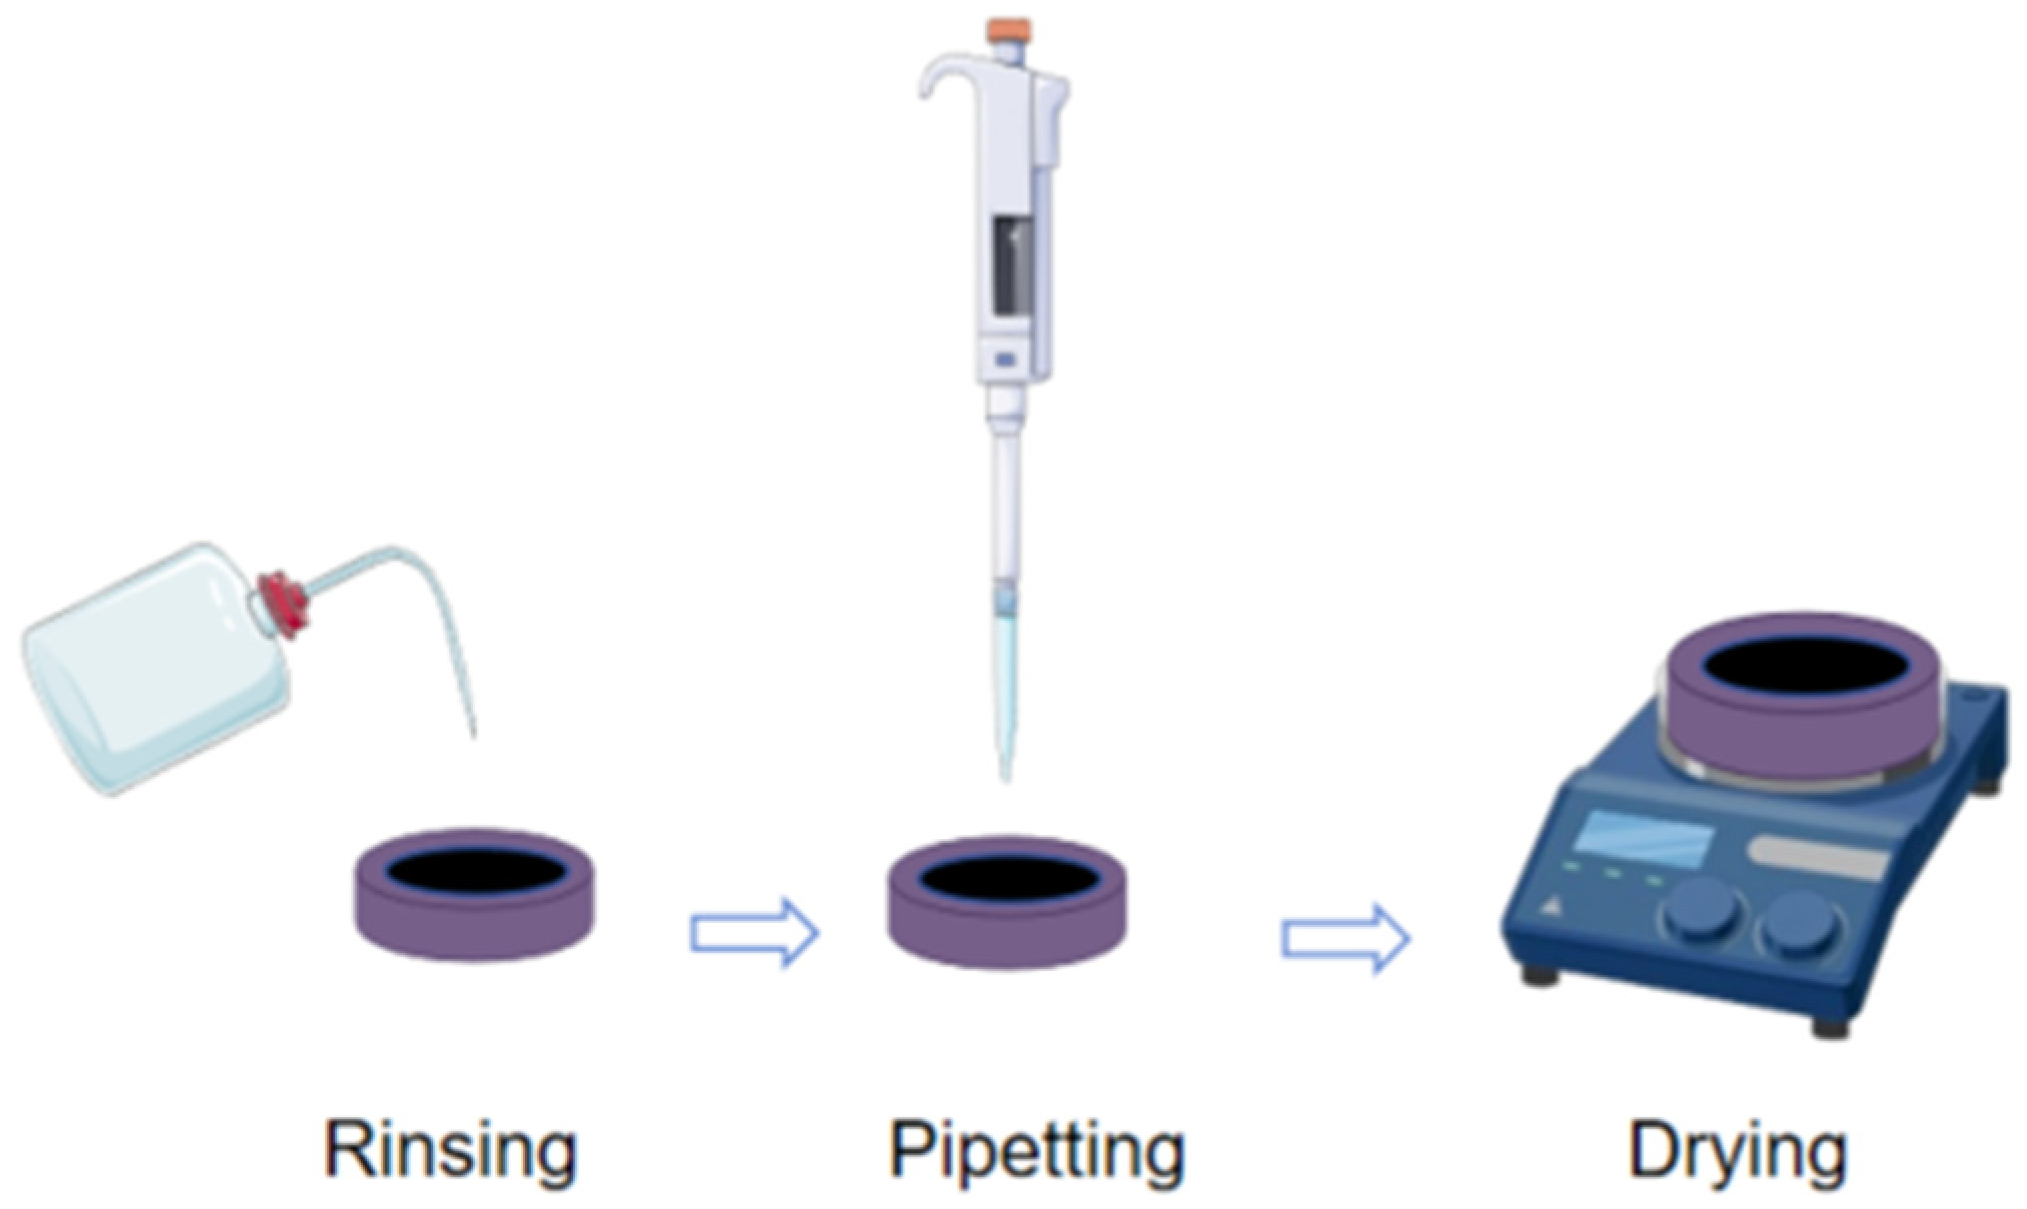
A stock solution was prepared using high-purity potassium nitrate (KNO3) standard solid powder samples (manufactured by Beijing Lianhua Yongxing Technology Development Co., Ltd., Beijing, China). A total of 0.7218 g of KNO3, which had been dried until constant weight and then cooled, was accurately weighed, dissolved in deionized water, and diluted to 1000 mL in a volumetric flask with deionized water, followed by thorough mixing. The N element concentration of this stock solution is 100 mg/L. Standard solutions with N element concentrations ranging from 1 to 25 mg/L were obtained by diluting the stock solution with deionized water, as shown in Table 1. This range covers the typical nitrogen concentration levels in actual water bodies related to eutrophication, meets the requirements of practical water quality evaluation, and ensures good linearity and detection sensitivity within this interval. The solution concentrations are shown in Table 1. The sample pretreatment process is shown in Figure 3. In this study, a circular graphite groove made of high-purity graphite (99.9%, Qingdao Baofeng Graphite Products Co., Ltd., Qingdao, China) was used as the substrate, with an inner diameter of 25 mm, an inner height of 5 mm, and a capacity of 2.4 mL. The circular graphite groove was repeatedly rinsed with pure water to ensure no impurities remained on the surface. Furthermore, 1 mL of the sample solution to be tested was uniformly deposited in the circular graphite groove and then heated at 80 °C using a heating plate to solidify the target N element on the substrate surface.
Table 1.
Concentrations of N in aqueous solutions.
Figure 3.
The sample pre-treatment procedures.
2.3. Methods and Model Evaluation
To evaluate the method and model, the coefficient of determination (R2) of the calibration curve fitting, the root mean square error of cross-validation (RMSECV), the average relative error (ARE), the limit of detection (LOD), and the relative standard deviation (RSD) were used as indicators to evaluate the performance of the prediction model.
3. Results and Discussion
3.1. Analysis of N-Related Spectral Lines
Nitrogen is one of the important non-metallic elements with a relatively high excitation potential. The main sensitive spectral lines of nitrogen atoms (N I) are located in the far-ultraviolet and near-infrared regions. Limited by the detection range of the spectrometer (200–500 nm), the most easily excited spectral line, judging from the magnitude of the energy-level transition, is N I 411.023 nm. The relevant atomic emission spectrum information is shown in Table 2 [24]. In addition to atomic characteristic spectral lines, there are also molecular spectral lines related to nitrogen (N) elements [25], and the specific information is shown in Table 3. Comparing Table 2 and Table 3, it can be seen that the excitation energy level of the CN molecular spectral line is 3.2 eV, which is much lower than the 13.71 eV of the N atomic spectral line. When there are nitrogen-containing substances on the surface of the graphite substrate, the CN molecular spectral line is easier to form.
Table 2.
Parameters of atomic N and C emission lines.
Table 3.
Peak wavelength of molecular bands of the emission lines.
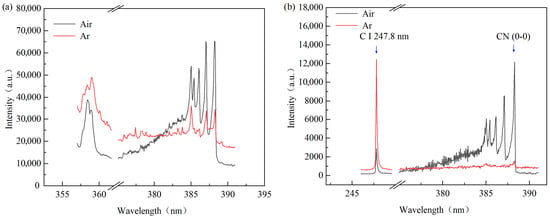
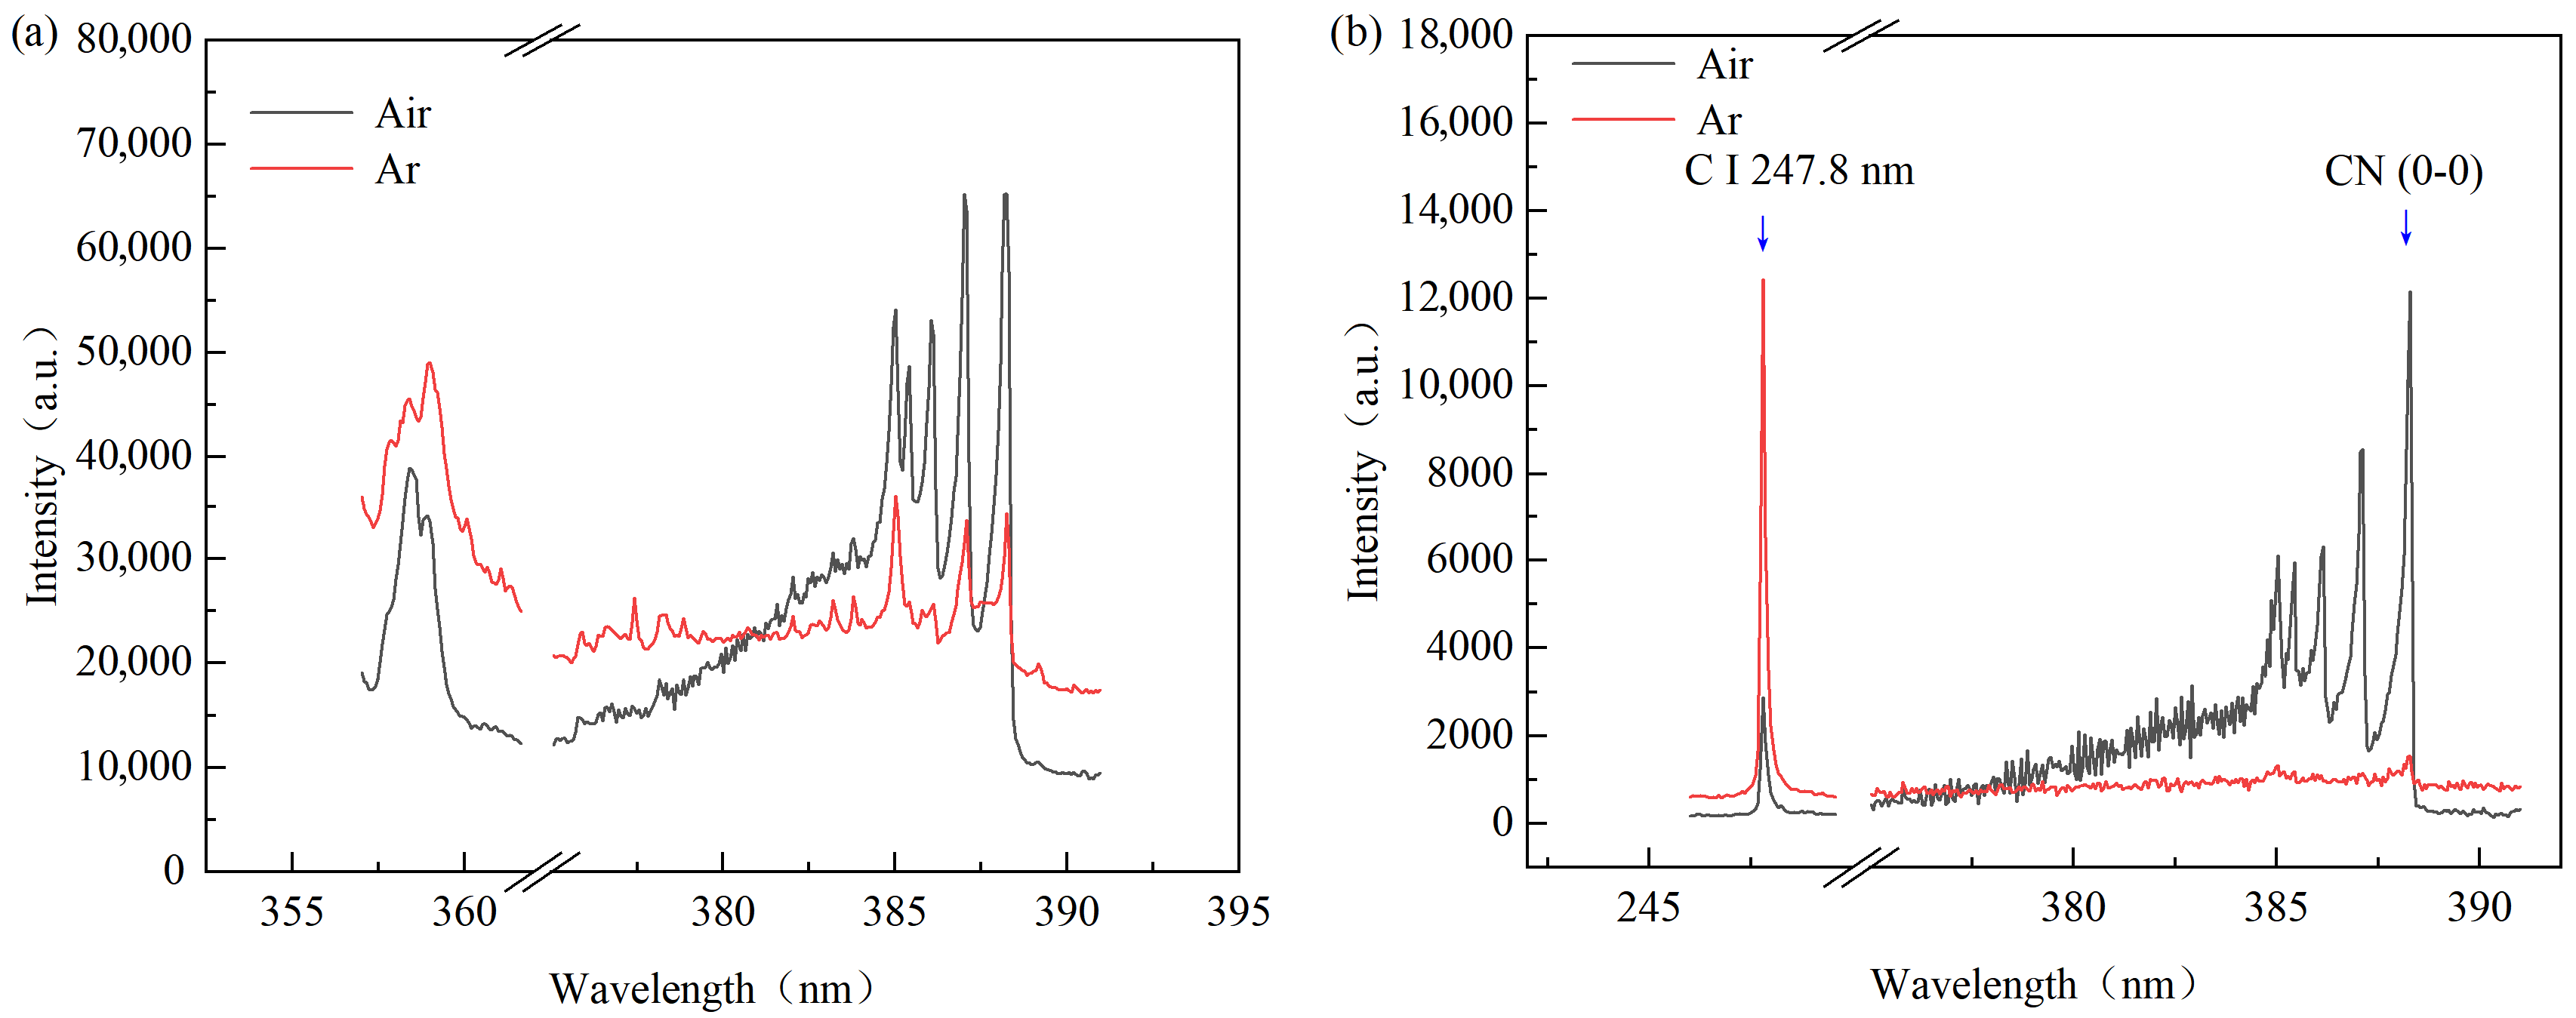
Figure 4 shows the CN molecular spectra of the sample and the blank C sample in air and argon at a laser energy of 2000 mJ. Figure 4a is the spectral diagram of the 10 mg/L sample in the band where CN (0-0) and CN (1-0) are located. It can be seen from the figure that strong CN molecular spectra can be obtained under different atmospheric conditions. The background of the CN molecular spectrum detected under an argon atmosphere is stronger than that detected under an air atmosphere. Figure 4b shows the spectral information of the carbon (C) atomic spectrum and the CN molecular spectrum of the 0 mg/L sample of C (blank C sample) under different atmospheric conditions. It can be seen from the figure that there is no obvious CN molecular spectrum under an argon atmosphere, indicating that the selected graphite substrate contains almost no N element, and most of the N detected in the sample comes from the N in the sample.
Figure 4.
Laser-induced breakdown spectra of the sample and blank C disk in air and argon at a laser energy of 2000 mJ. (a) Band of CN molecular spectrum of 10 mg/L sample. (b) Band of C atomic spectrum and CN molecular spectrum of 0 mg/L sample.
It can be seen from Figure 4 that the N element molecular spectrum measured in the air environment mainly comes from the breakdown of N2 in the air. Generally, in an argon environment, the generation rate of excited particles will increase, resulting in a higher concentration of electrons, thereby enhancing the intensity of the plasma emission spectrum [26,27]. Therefore, the intensity of C atomic spectral lines in an argon atmosphere is significantly stronger than that in an air atmosphere.
In this study, the nitrogen-containing sample solution to be tested was attached to the high-purity graphite substrate by means of liquid–solid conversion. The high-energy pulse laser can ablate the deposited layer and the graphite substrate together, and the surface substances are instantly plasmatized, the chemical bonds of the substances are broken, forming N atoms and C atoms; the plasma gradually expands and cools, and the N atoms and C atoms in the plasma recombine to form CN molecular free radicals [28,29].
Due to the characteristics of vibrational energy levels, the number of excited CN (0-0) particles at 388.3 nm is large, and the SBR of the characteristic peak is significantly better than that of several other characteristic peaks. In this study, the intensity of CN at 388.30 nm and the sum of the intensities of five main spectral lines (385.02 nm, 385.43 nm, 386.10 nm, 387.06 nm, 388.30 nm) were selected as the numerator of the internal standard method, with the C characteristic spectral line at 247.80 nm as the denominator, to conduct modeling research on N in water. The analytical parameter used for modeling is defined as:
where R denotes the normalized spectral intensity ratio, ICN,388.3nm is the intensity of the CN molecular line at 388.3 nm, ∑ICN bands is the sum of the intensities of five main spectral lines (385.02 nm, 385.43 nm, 386.10 nm, 387.06 nm, 388.30 nm), and IC,247.8nm is the intensity of the C atomic line at 247.8 nm. This ratio was then used for quantitative modeling of nitrogen in water.
3.2. Experimental Parameter Analysis and Optimization
3.2.1. Effects of Pulse Selection on SBR and Stability of C and CN Spectra
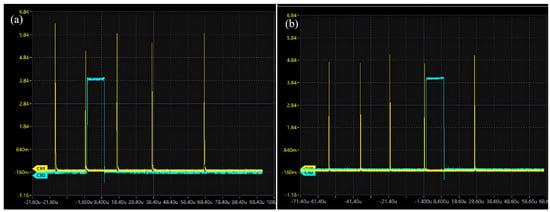
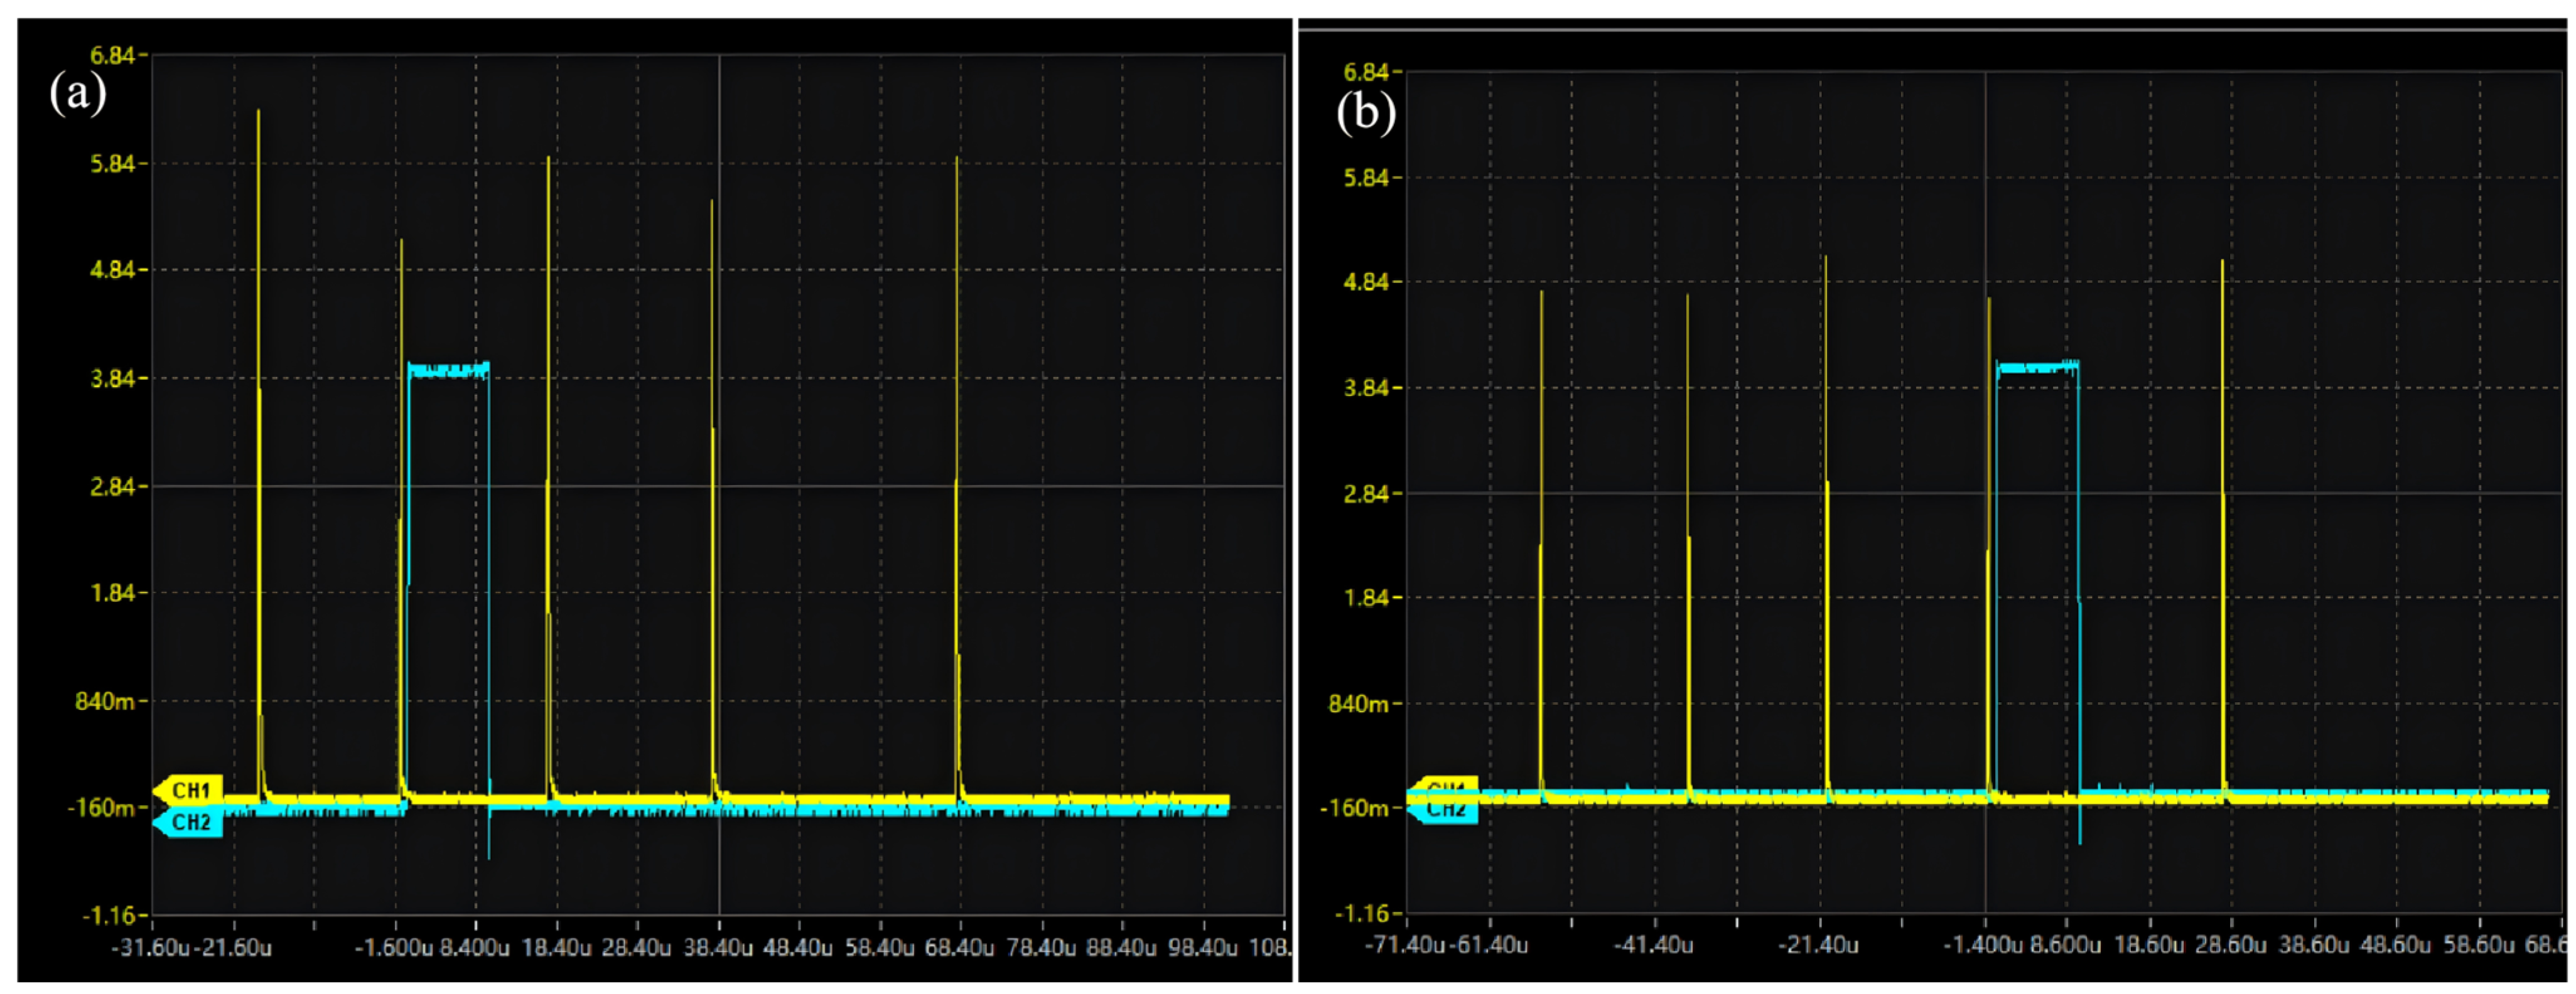
In laser-induced breakdown spectroscopy (LIBS) detection, multi-pulse lasers help enhance signal intensity. Different from mainstream actively Q-switched lasers, the passively Q-switched laser used in this study has the characteristic of continuous multi-pulse triggering, which enables pre-ablation by previous pulses and excitation by subsequent pulses. The self-developed pulse selection function can reduce the impact of strong background noise during the pre-ablation process. Pulse selection uses a delayer to select multiple optical pulses, and the selected pulse is used as the trigger pulse before delay, as shown in Figure 5, where the delayer selects different pulses as trigger pulses. Continuous excitation of plasma is realized through multi-pulse sequences, and the self-developed delayer is used to accurately select the pulse with the optimal timing to trigger spectral collection, which can maximize the improvement of spectral signal intensity and stability.
Figure 5.
Optical pulses and synchronous trigger signals. (a) Select the 2nd pulse, delay 0.5 μs. (b) Select the 4th pulse, delay 0.5 μs.
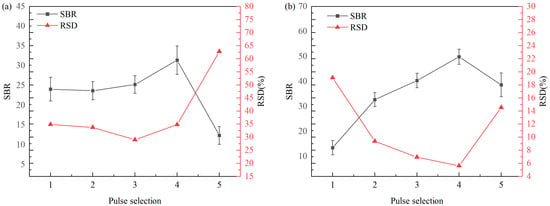
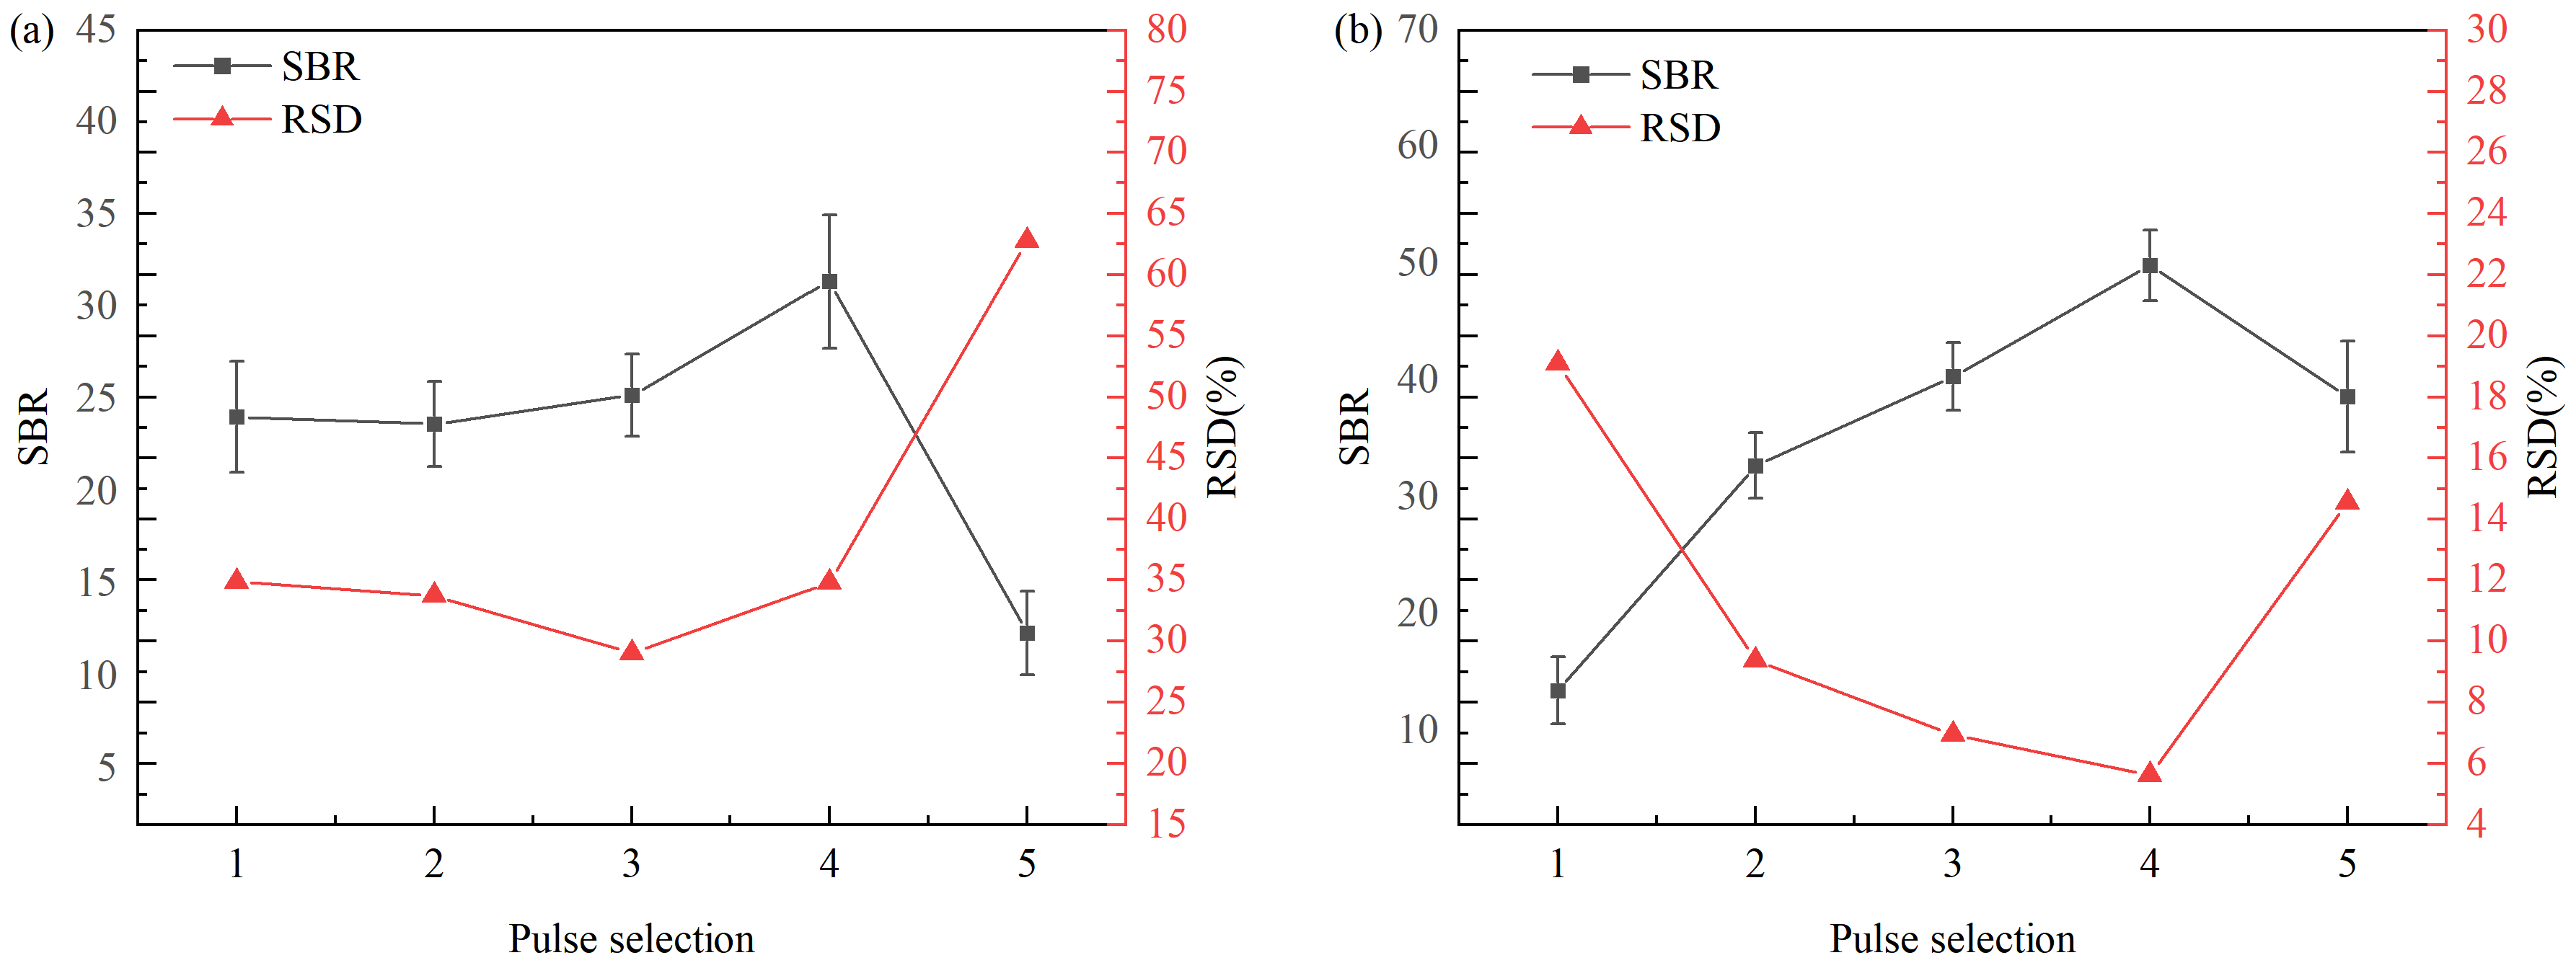
Using blank C samples as the research objects, the 1st to 5th pulses were selected as trigger reference pulses, and spectra were collected at a delay of 0.5 μs when the laser energy was set to 2000 mJ. The relationship between the pulse selection sequence and the SBR and RSD of C and CN characteristic spectral lines is shown in Figure 6.
Figure 6.
Variations in SBR and RSD of C and CN spectra with trigger pulse selection in an air environment. (a) Effects of trigger pulse selection on SBR and RSD of C spectrum. (b) Effects of trigger pulse selection on SBR and RSD of CN spectrum.
With the increase in the trigger pulse number, the SBR of C and CN characteristic spectral lines first increases steadily, reaches the peak at the 4th pulse, and then decreases sharply. During the action of the first few pulses, the initial oxide layer and impurities on the sample surface are gradually removed, the excitation stability of the plasma is gradually improved, the intensity of the characteristic spectral lines increases with the increase in the pulse number, while the background radiation decreases slowly as the ablation environment tends to be stable, so the SBR gradually increases; when the pulse advances to the 4th, the ablation crater enters a stable stage, the electron density and excitation temperature of the plasma are in the optimal state, and the ratio of the intensity of the characteristic spectral lines to the background radiation reaches the maximum; at the 5th pulse, the plasma is gradually quenched, the intensity of the characteristic spectral lines decreases rapidly, so the SBR drops sharply.
As shown in Figure 6a, the RSD of the C characteristic spectral line first decreases slowly, reaches the minimum at the 3rd pulse, and then increases rapidly. In the initial pulse stage, the uneven surface of the sample leads to large fluctuations in the plasma. With the increase in the pulse number, the ablation environment tends to be stable, the consistency of the signals between pulses is improved, and the RSD decreases accordingly; at the 4th and 5th pulses, the gradual quenching of the plasma causes signal fluctuations again, and the RSD increases again. The variation trend of RSD of CN spectral lines is similar to that of C characteristic spectral lines. Considering the variation trends of SBR and RSD comprehensively, to ensure sufficient plasma signal intensity and low background noise, the 4th pulse was selected as the optimal trigger pulse in this study.
3.2.2. Effects of Delay Time on SBR and Stability of C and CN Spectra
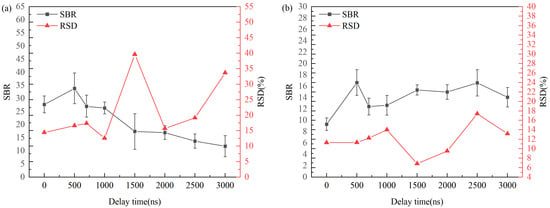
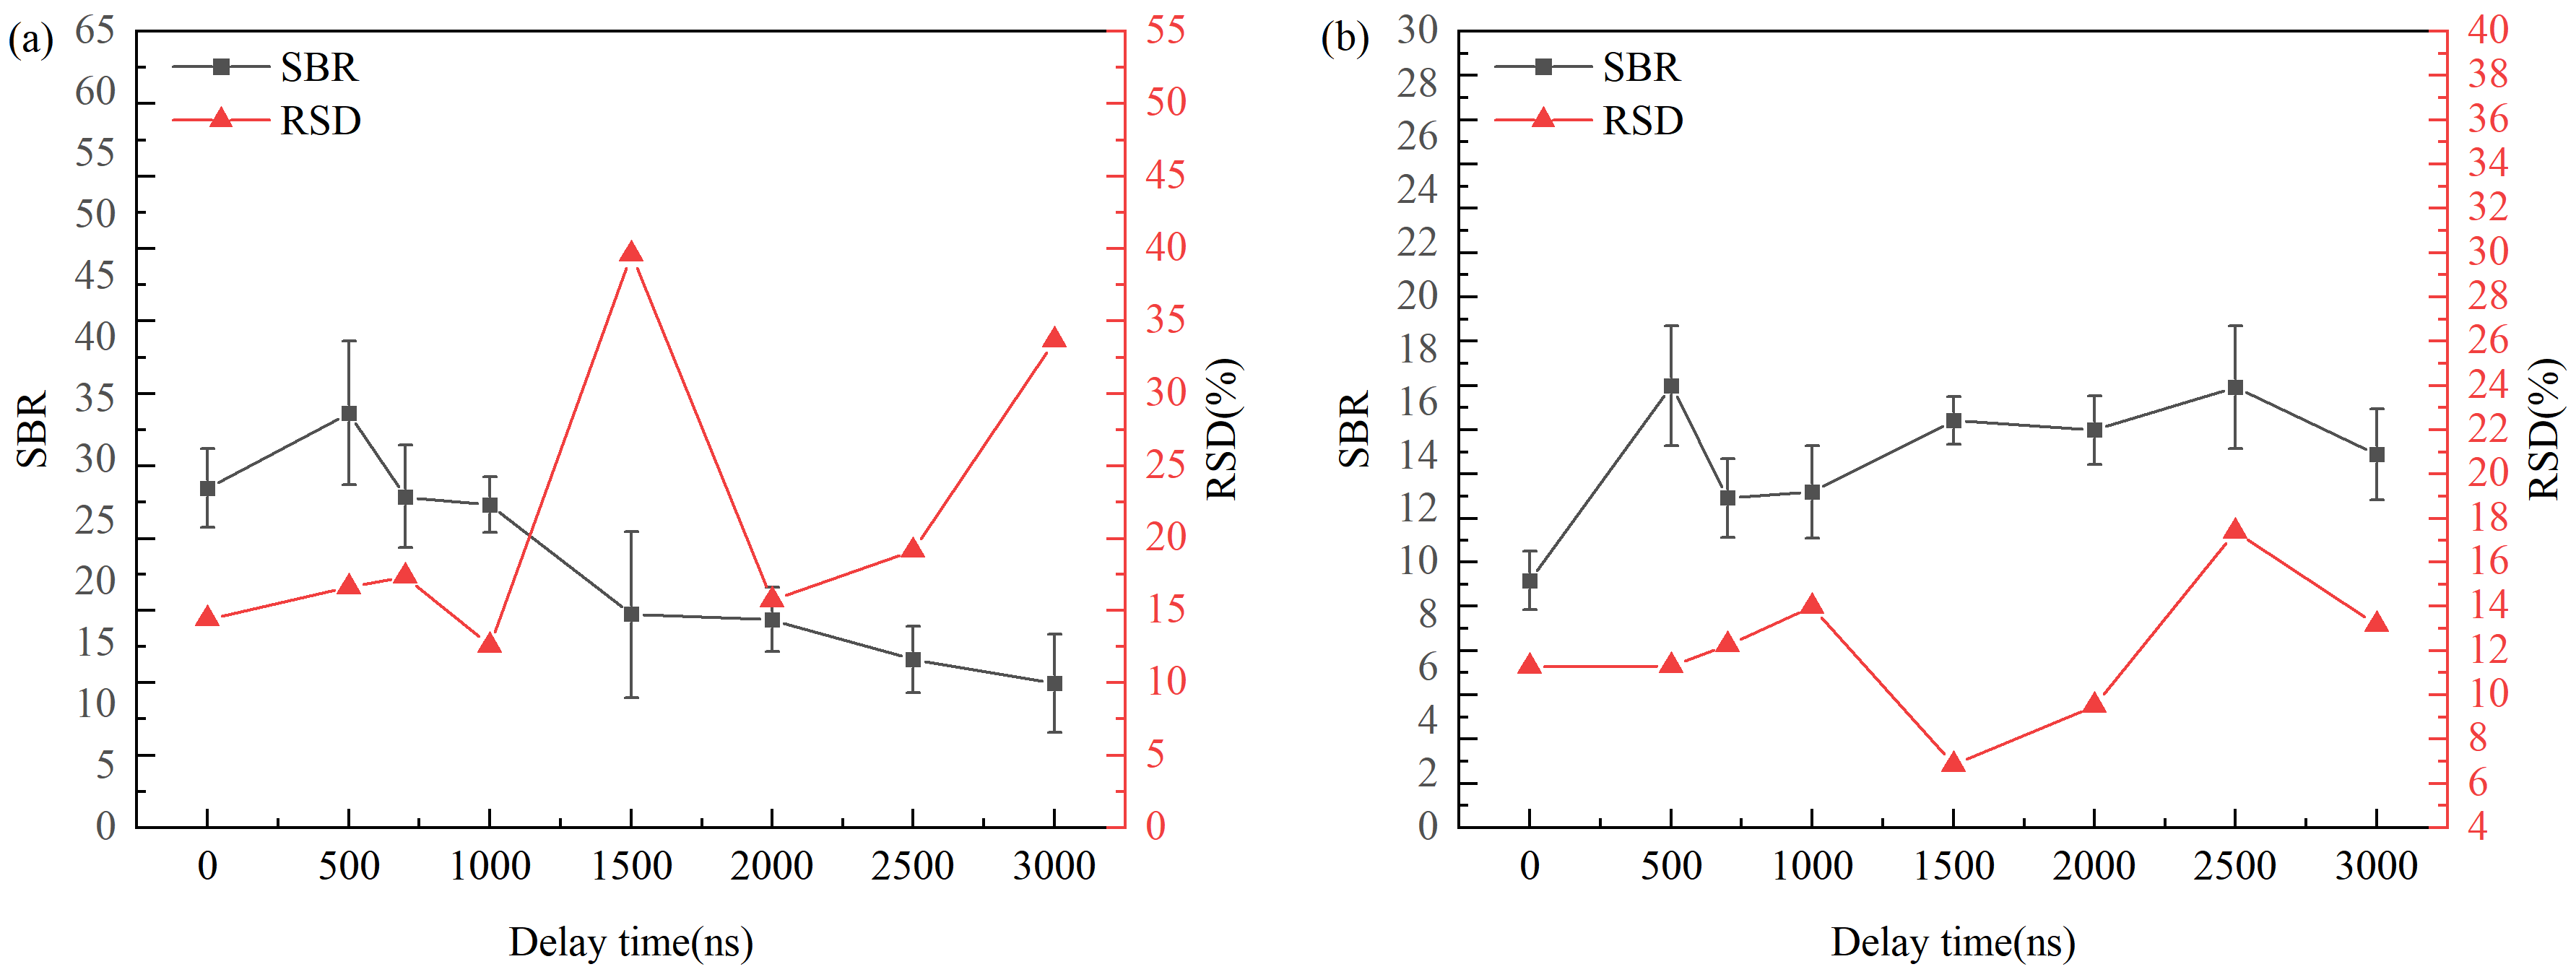
The SBR of the spectrum can be improved and the RSD of the spectrum can be reduced by adjusting the delay, reducing background noise, thereby improving the reliability and stability of the experimental results [30]. Using blank C samples as the research objects, the 4th pulse was selected as the trigger reference pulse when the laser energy was set to 2000 mJ. As shown in Figure 7, with the increase in delay, the SBR of the C characteristic spectral line first increases and then decreases. This is because in the initial stage of laser-induced plasma formation, the continuous background radiation composed of bremsstrahlung and recombination radiation is strong, and the characteristic spectral lines are covered by the background, so the SBR is low; with the increase in delay, the plasma gradually cools and diffuses, and the intensity of the continuous background radiation gradually decreases. In contrast, although the intensity of the characteristic spectral lines also decreases, its decreasing rate may be slower than that of the background radiation. Therefore, under the delay condition of 0.5 μs, the SBR increases significantly and reaches the peak. At the same time, under the delay condition of 0.5 μs, the SBR of the CN characteristic spectral line also reaches the peak, and the RSD of the C and CN characteristic spectral lines is relatively low at this time. To ensure sufficient plasma signal intensity and low background noise, 0.5 μs was selected as the delay time in this experiment.
Figure 7.
Variations in SBR and RSD of C and CN spectra with delay time in air environment. (a) Effects of delay time on SBR and RSD of C spectrum. (b) Effects of delay time on SBR and RSD of CN spectrum.
3.2.3. Effects of Laser Energy on Intensity, SBR, and Stability of C and CN Spectra
Laser energy directly affects plasma characteristics and spectral intensity. With the increase in laser energy, the observed spectral intensity also increases, but other interference signals and background signals are also introduced [30]. In addition, excessive laser energy may lead to plasma instability, which in turn leads to increased self-absorption effect and measurement error, making spectral signal analysis more complex. Therefore, it is necessary to adjust the pulse laser energy to balance the signal intensity, RSD, and SBR, so that the experimental parameters reach the optimal.
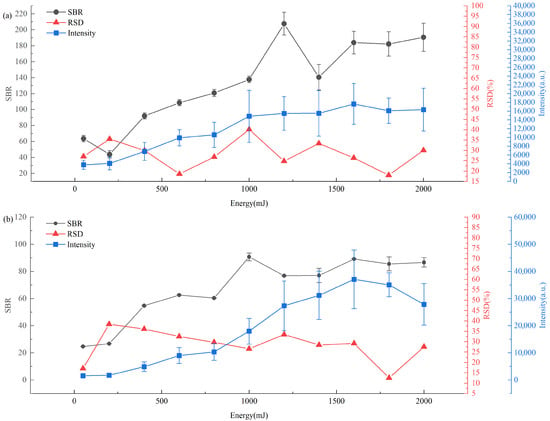
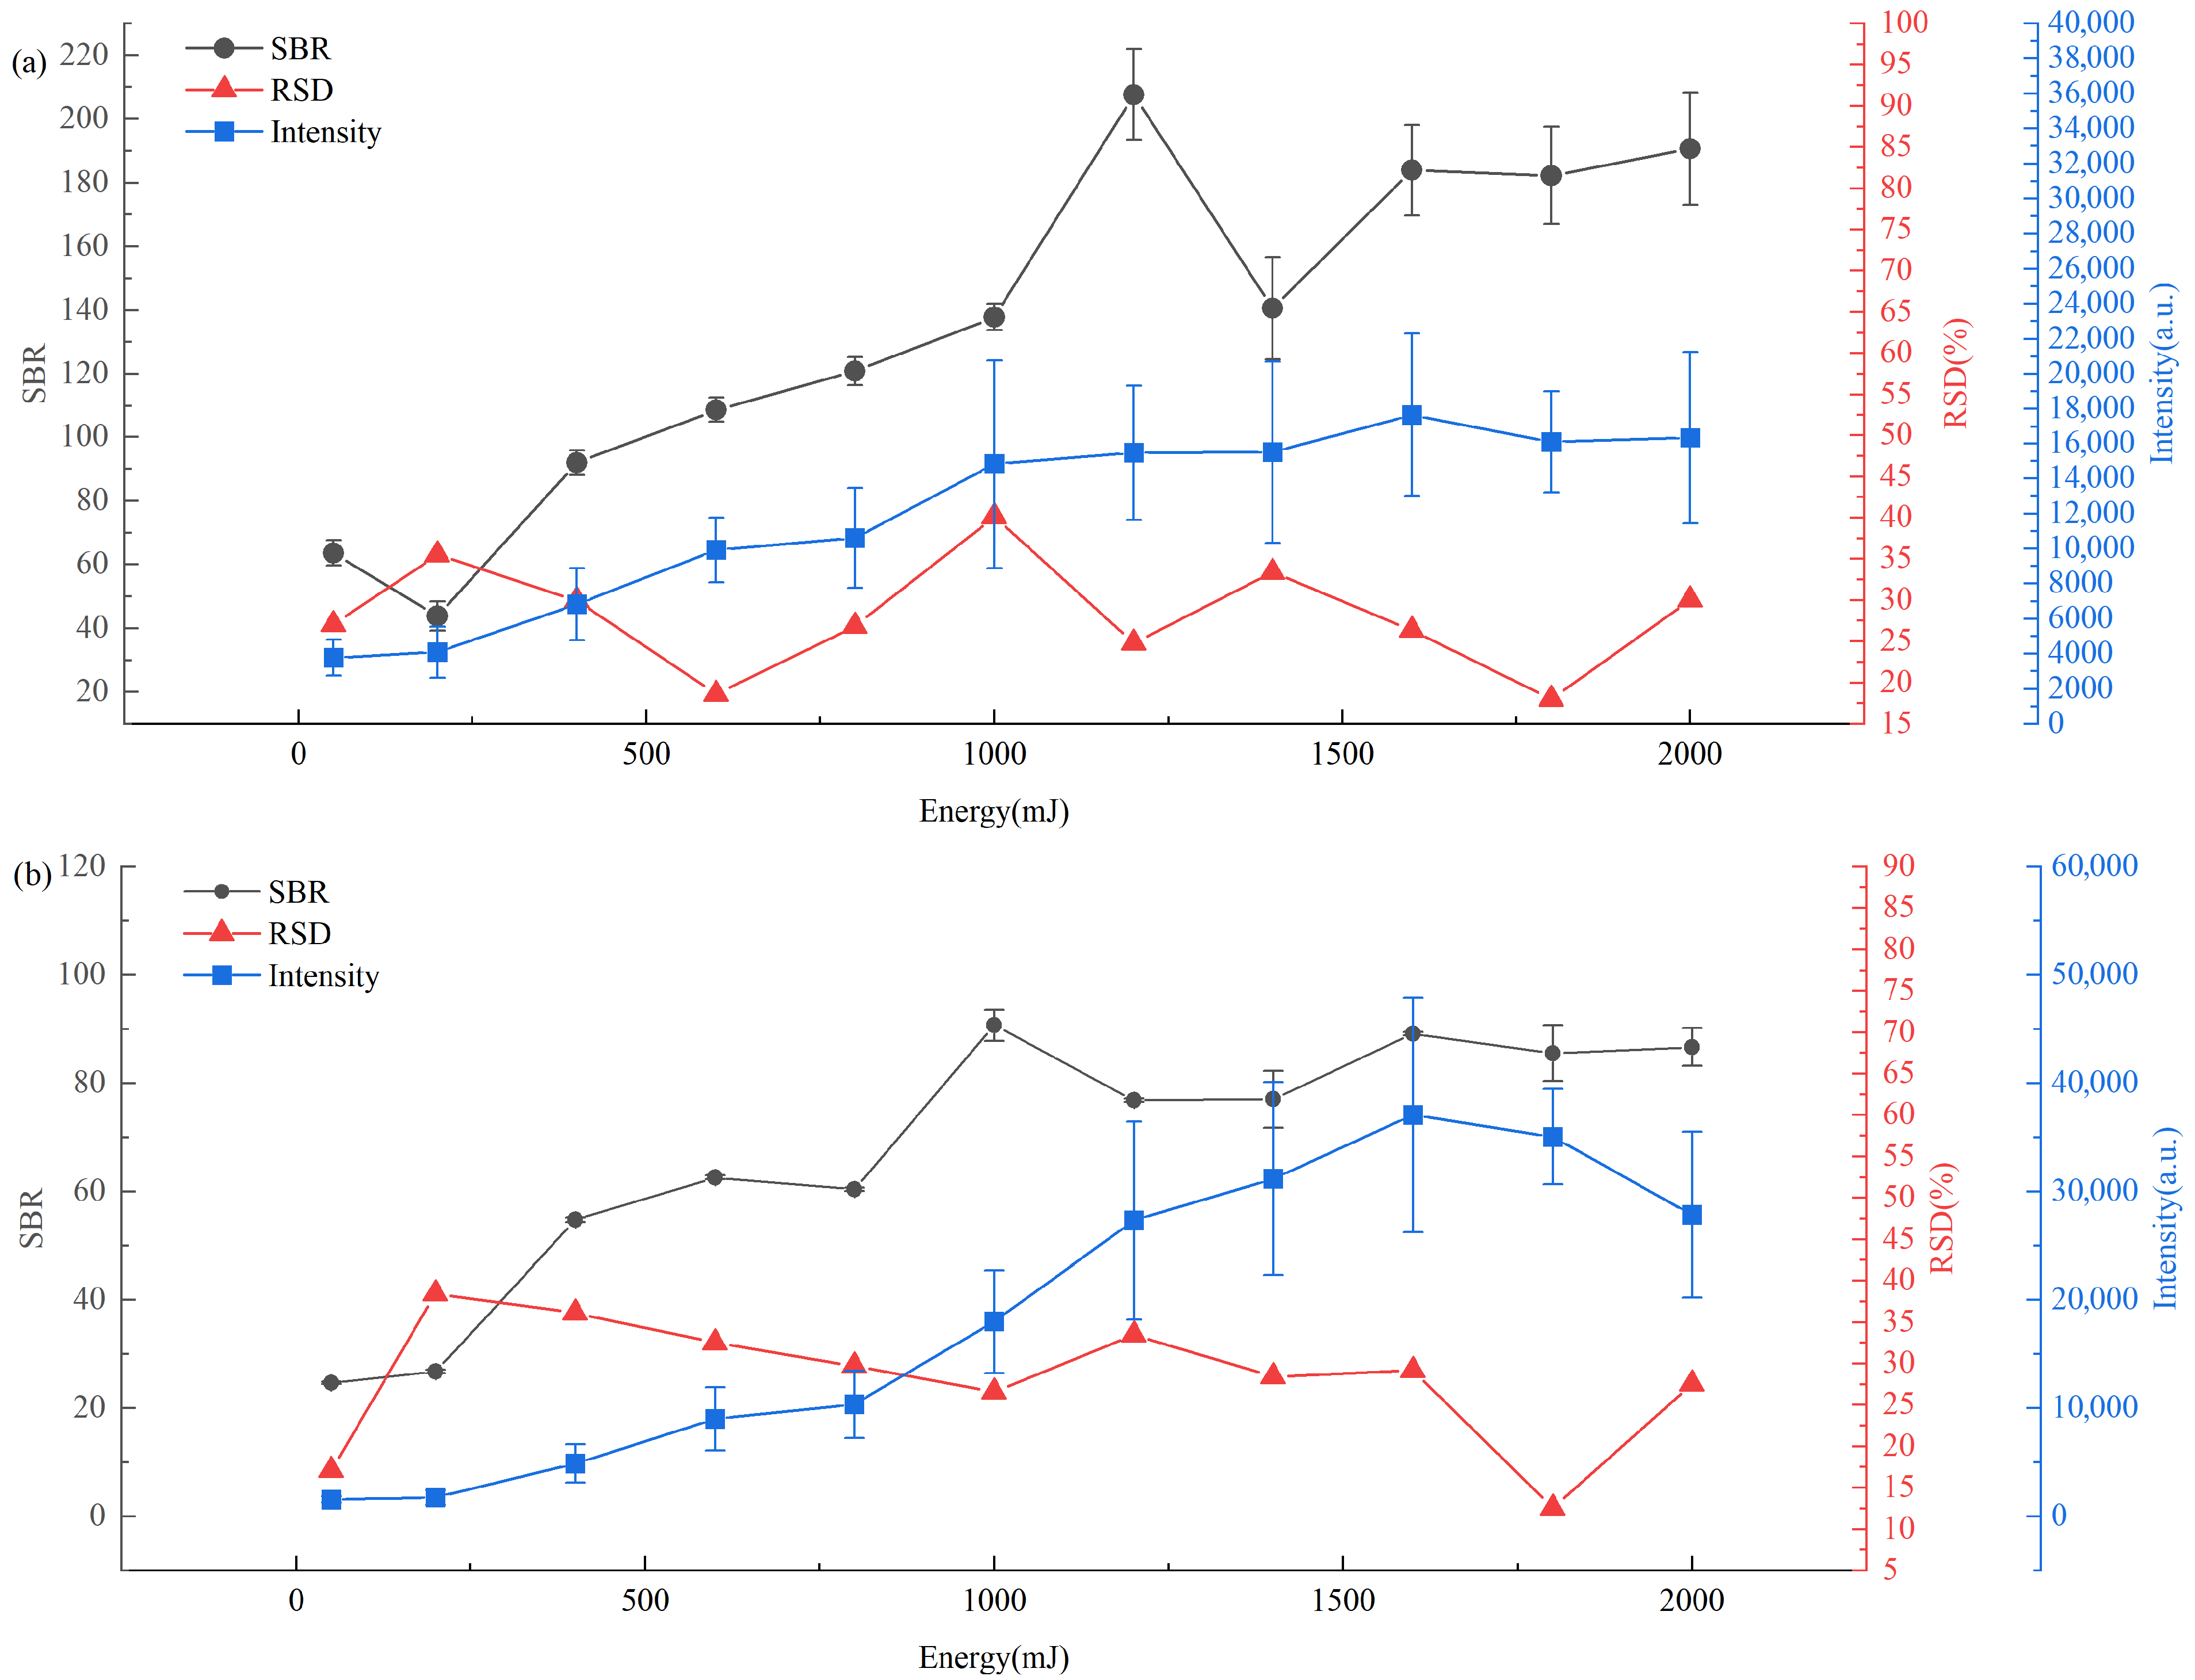
Using blank C samples as the research objects, the 4th pulse was selected as the trigger reference pulse, and spectra were collected at a delay of 0.5 μs. This study systematically investigated the influence of laser energy in the range of 50~2000 mJ on the spectral signal intensity, RSD, and SBR. Figure 8 describes the evolution behavior of the intensity, SBR, and RSD of C characteristic spectral lines and CN spectral lines with laser energy in an air environment.
Figure 8.
Variations in intensity, SBR, and RSD of C and CN spectra with laser energy in air environment. (a) Effects of laser energy on intensity, SBR, and RSD of C spectrum. (b) Effects of laser energy on intensity, SBR, and RSD of CN spectrum.
As shown in Figure 8a,b, when the laser energy is less than 1600 mJ, with the increase in laser energy, the intensity of the C characteristic spectral lines and CN spectral lines gradually increases, and the SBR generally shows an upward trend; when the laser energy is greater than 1600 mJ, the spectral intensity decreases slightly, and the SBR has no obvious change. When the energy is set to 1800 mJ, the RSD of C characteristic spectral lines and CN spectral lines is the smallest, indicating that the CN spectral signal is the most stable under this condition. When the laser energy is lower than 1600 mJ, with the increase in laser energy, more particles are effectively excited and transition, which in turn makes the intensity of carbon element characteristic spectral lines and CN spectral lines gradually increase. When the laser energy is close to and reaches 1600 mJ, the ablation process of the graphite matrix gradually reaches a saturated state, the ablation quality of the matrix no longer increases significantly with the increase in laser energy, and the growth trend of spectral signal intensity slows down, or even decreases slightly. When the laser energy exceeds 1600 mJ, trace impurities in the sample and the graphite matrix are over-excited, producing additional non-target emission signals; excessive laser energy is likely to cause breakdown of the medium, which significantly increases the complexity of the background spectrum and the level of background noise. In this case, the signal intensity of carbon element characteristic spectral lines and CN spectral lines does not increase significantly, while the background noise remains at a high level, so the SBR of both no longer shows an upward trend, but tends to be stable. When the laser energy is set to 1800 mJ, the ablation process and plasma excitation state reach a balance, avoiding the problem of insufficient excitation at low energy, and alleviating the background noise interference at excessively high energy, making the RSD of carbon element characteristic spectral lines and CN spectral lines reach the minimum value. Considering the spectral intensity of characteristic spectral lines, high SBR and RSD comprehensively, the calibrated laser energy value of 1800 mJ was selected as the optimal pulse laser energy value in this experiment, and the laser emitted five laser pulses at that time.
3.2.4. Effects of Argon Flow Rate on SBR and Stability of C and CN Spectra
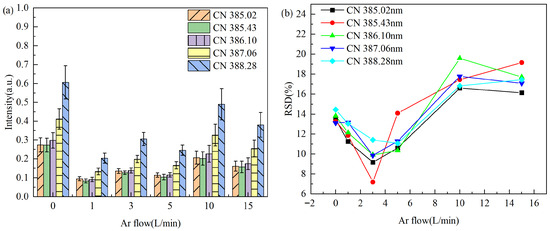
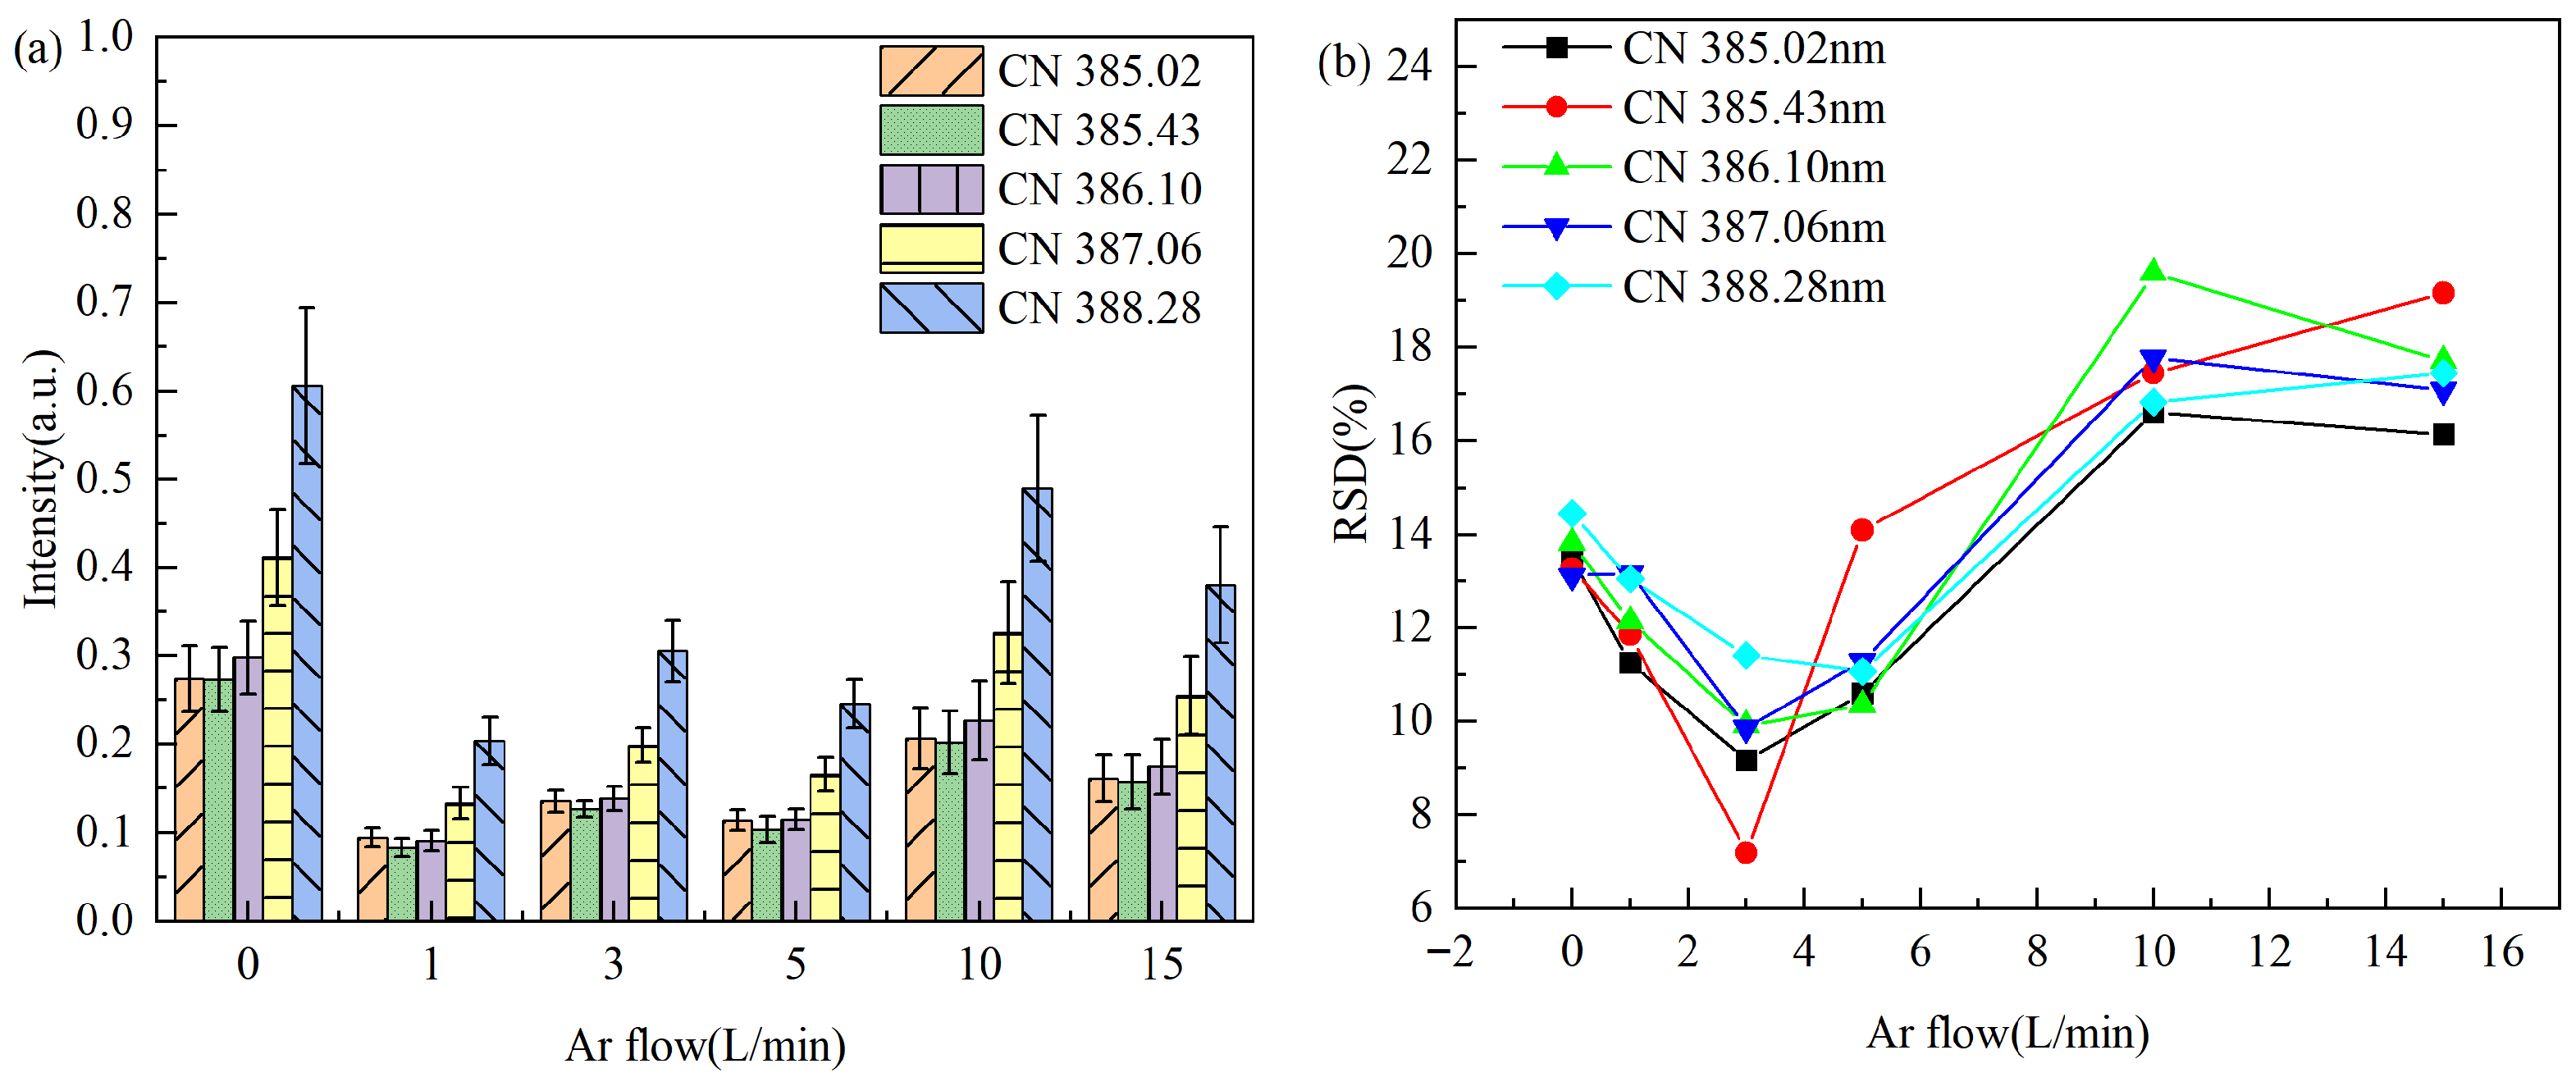
To evaluate the effect of argon environment on the LIBS detection performance, this study took blank carbon disks as objects, set five argon flow rate gradients of 1, 3, 5, 10, 15 L·min−1, and took the air environment as a reference. Using blank C samples as the research objects, the 4th pulse was selected as the trigger reference pulse, and spectra were collected at a delay of 0.5 μs when the laser energy was set to 1800 mJ. By analyzing the CN molecular band in the range of 385–388.3 nm, the inhibition mechanism of argon on nitrogen interference was studied. As shown in Figure 9a, the characteristic emission of CN molecules is significant in the air environment, while the argon environment significantly reduces the intensity of the CN band, reaching the minimum value at 1 L·min−1, which confirms that argon can effectively inhibit atmospheric nitrogen interference. This is because the physical barrier formed by argon excludes air from the detection area, and its inert characteristics also avoid chemical reactions with carbon plasma, blocking the path of environmental nitrogen participating in CN molecule generation [30]. When the argon flow rate exceeds 1 L·min−1, the inhibition effect of the CN signal does not continue to enhance with the increase in flow rate, which is because the high-speed gas flow will disturb the plasma plume, accelerate its cooling, and increase the quenching probability of excited particles, partially offsetting the benefits of a high-purity atmosphere.
Figure 9.
Variations in intensity and RSD of main CN spectral lines with argon flow rate in an argon environment. (a) Effects of gas flow rate on CN spectral intensity. (b) Effects of gas flow rate on RSD of CN spectral line intensity.
As shown in Figure 9b, the RSD of CN characteristic spectral lines first decreases and then increases with the increase in gas flow rate, reaching the minimum value at 3 L·min−1, indicating that the plasma stability is the best under this condition. When the flow rate is too low, the uneven mixing of environmental gases leads to increased plasma fluctuations; when the flow rate is too high, the high-speed gas flow causes hydrodynamic instability of the plasma plume, increasing signal fluctuations.
Therefore, setting appropriate argon flow rate parameters can effectively improve spectral intensity and stability. Controlling the argon flow rate at about 3 L·min−1 can achieve the best balance between effectively eliminating air interference and maintaining plasma stability, providing an important basis for the accurate determination of N elements in the follow-up.
3.3. Analysis of CN Molecular Spectral Characteristics of Samples with Different N Contents
Through the above basic experimental research, the optimized experimental conditions are as follows: laser pulse energy is 1800 mJ, delay time is 0.5 μs, and argon flow rate is 3 L·min−1. For each sample, 20 different positions were selected for detection, and each spectrum was triggered by the 4th laser pulse. All spectral data were subjected to baseline correction, followed by maximum and minimum normalization. The 20 spectra collected from sample solutions with different N contents were averaged to obtain the spectrum of the sample solution.
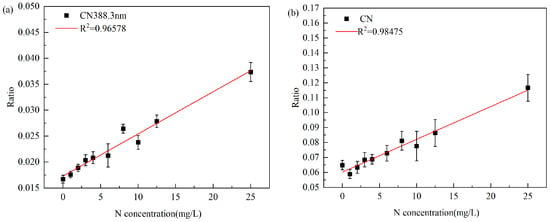
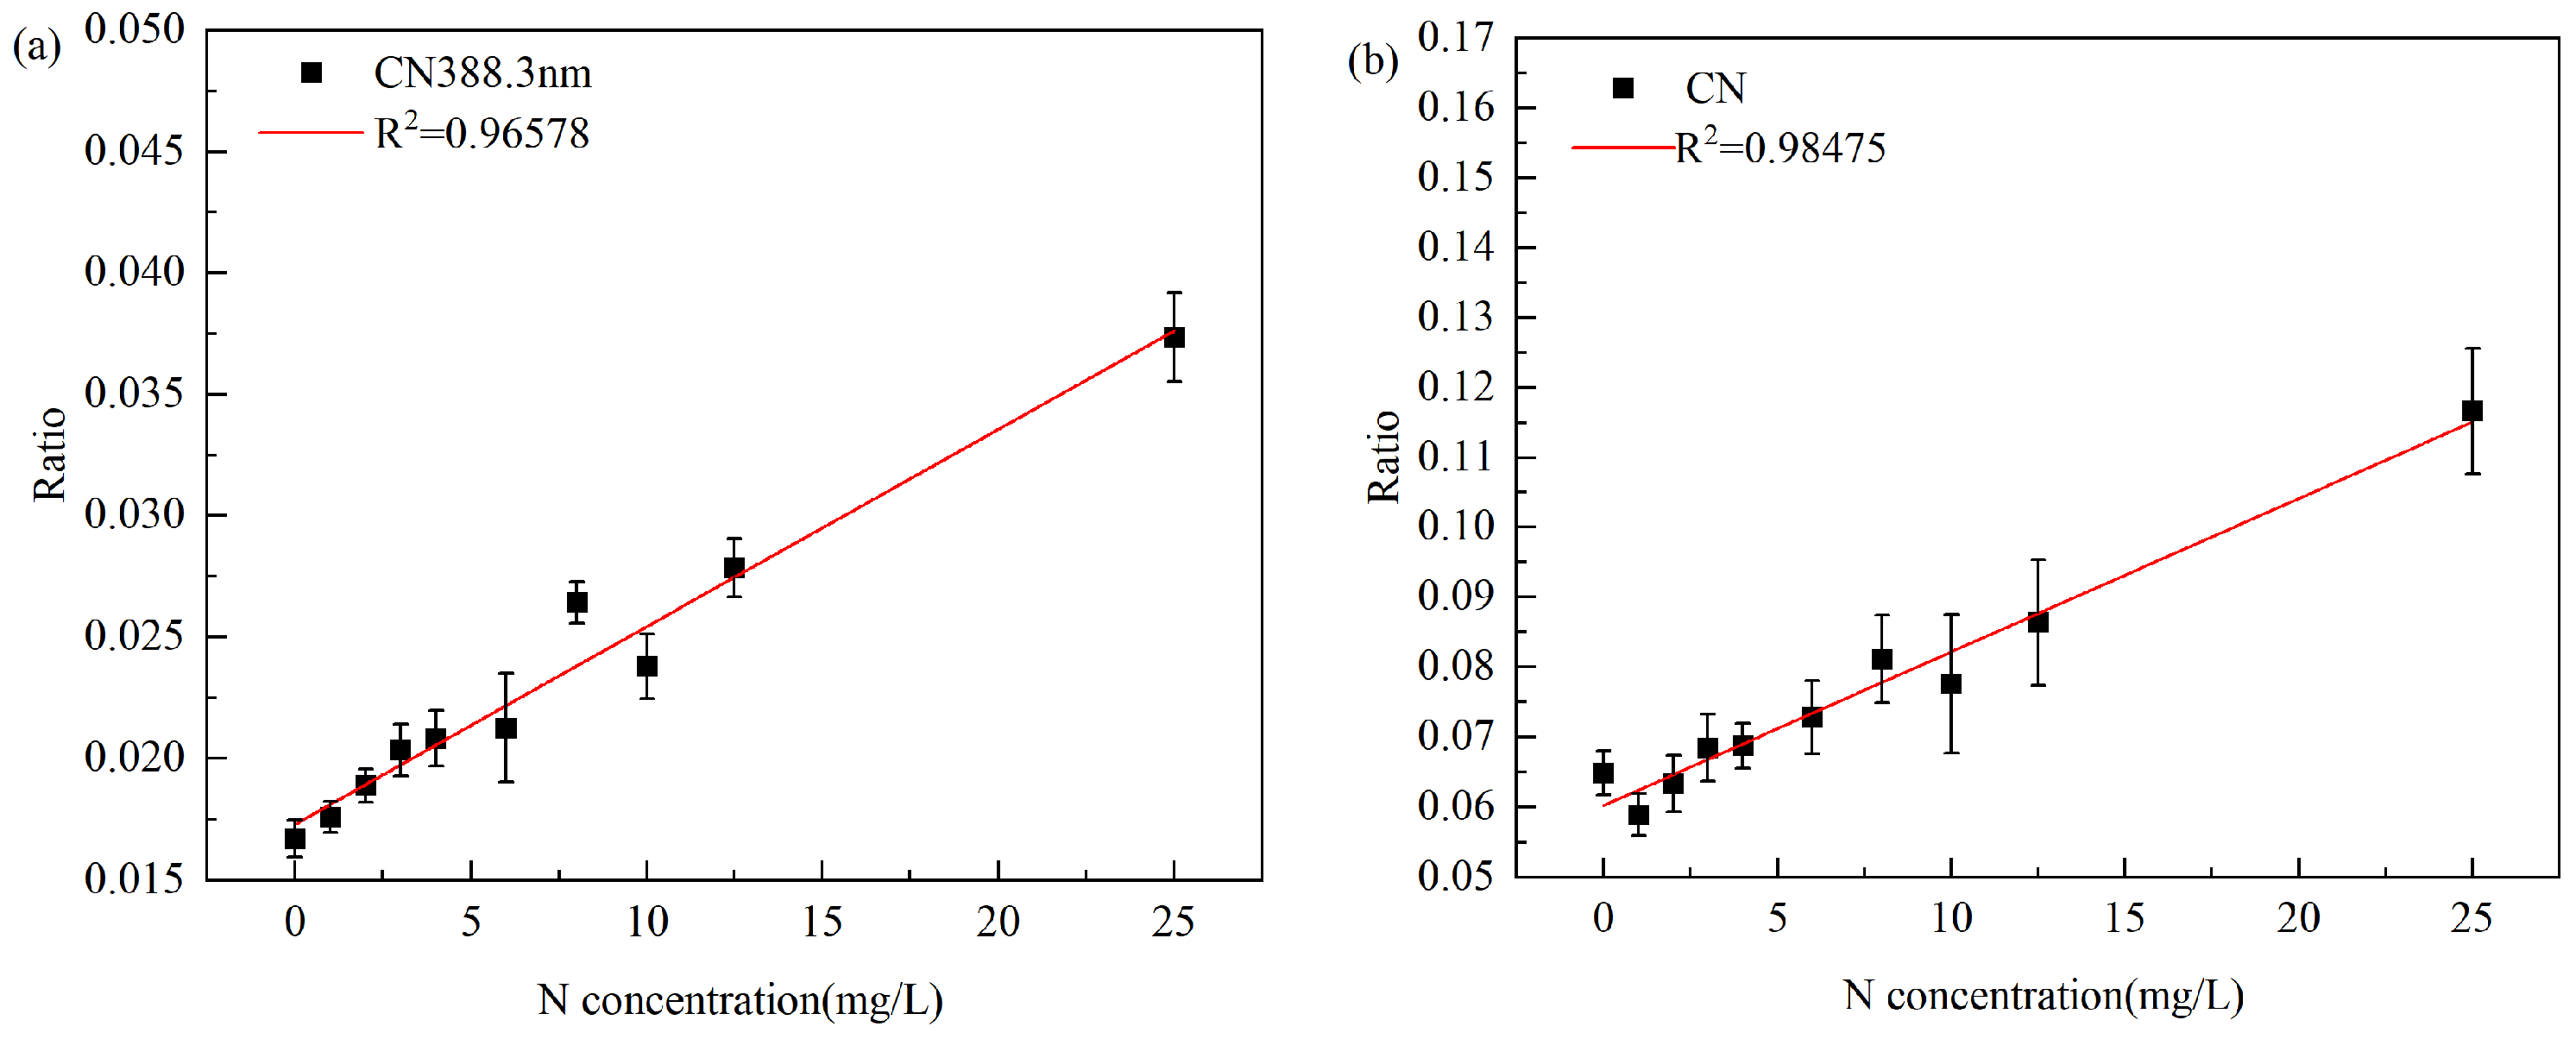
In the quantitative analysis, the ratio of the intensity of the CN 388.3 nm spectral line in the corrected spectrum to the intensity of the C I 247.78 nm internal standard spectral line was used as the dependent variable, and the nitrogen content in the sample was used as the independent variable to establish a calibration curve, as shown in Figure 10a. The coefficient of determination (R2) was 0.96673, the root mean square error of cross-validation (RMSECV) was 1.39 mg/L, the average relative error (ARE) was 22.45%, and the limit of detection (LOD) was 5.62 mg/L. The results show that there is a good linear relationship between the spectral line intensity and nitrogen concentration, and the spectral line intensity shows an upward trend with the increase in nitrogen content.
Figure 10.
N calibration curves established in an argon environment. (a) N calibration curve based on the intensity ratio of CN 388.3 nm to C I 247.80 nm. (b) N calibration curve based on the ratio of the sum of intensity ratios of main peak spectral lines in the CN molecular band to C I 247.80 nm.
To further improve the analytical performance, the sum of the intensities of five main spectral lines (385.02 nm, 385.43 nm, 386.10 nm, 387.06 nm, 388.30 nm) in the CN band after baseline correction was used as the dependent variable, and the nitrogen content in the samples was used as the independent variable to establish a calibration curve, as shown in Figure 10b. The coefficient of determination (R2) was improved to 0.96973, the RMSECV was 1.06 mg/L, the ARE was 21.54%, and the LOD was 2.19 mg/L.
Compared with the single CN 388.3 nm spectral line, the method using the sum of multiple spectral line intensities of the CN band reduces the ARE by 0.91% and improves the LOD by 3.43 mg/L, indicating that this method has a better linear relationship, accuracy, and sensitivity. It should be noted that the prediction deviation observed in the zero-concentration sample is mainly due to the background interference of the remaining N in the environment on the emission spectral lines.
3.4. Real Water Sample Validation
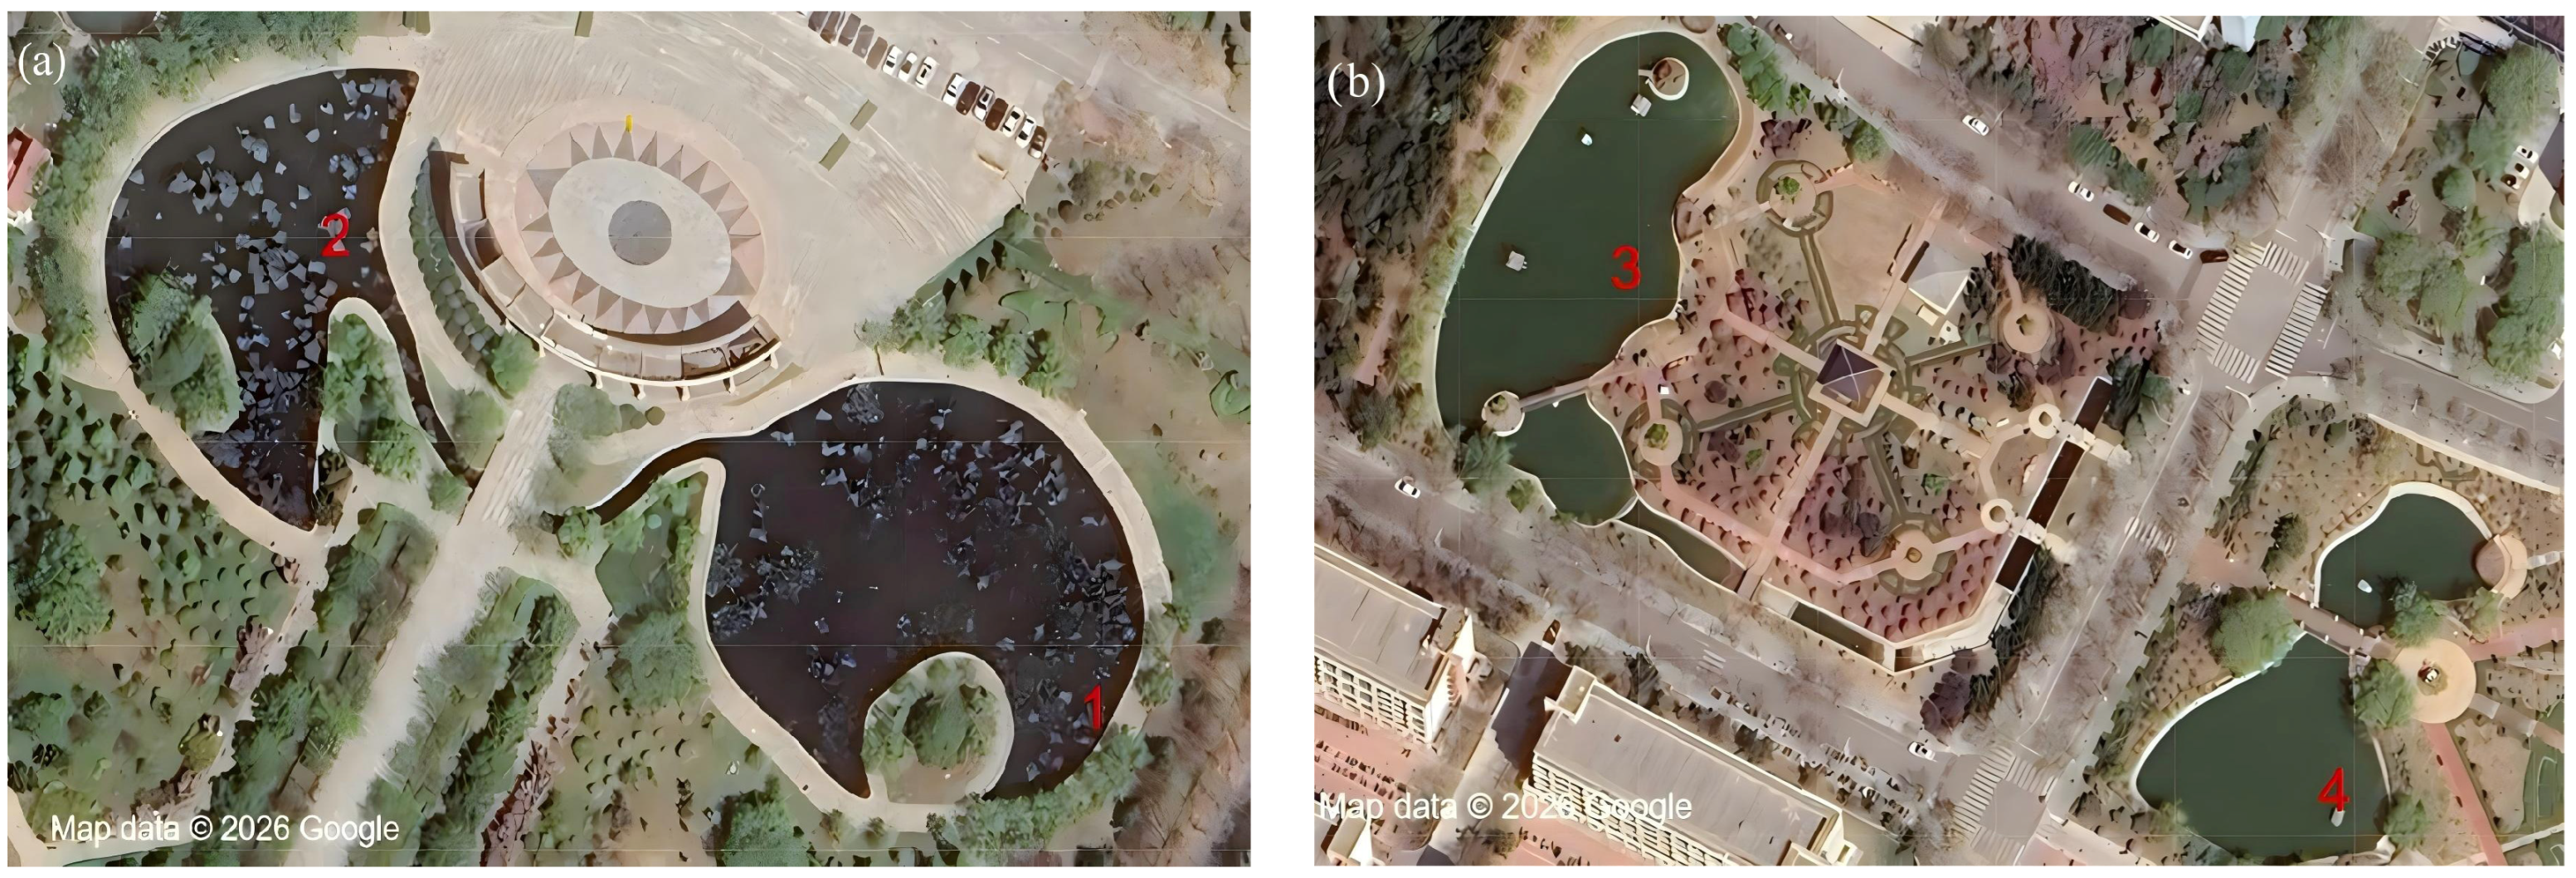
To verify the capability of the proposed method, a comparison between LIBS and UV spectrophotometry was performed on real water samples, including water from Yuehu Lake, Rihu Lake, Tian’ehu Lake, and Dingxianghu Lake. The sampling sites are shown in Figure 11. Table 4 presents the results of N content in the four prepared samples determined by both LIBS and UV spectrophotometry. As can be seen from Table 4, the relative deviations of water samples from Yuehu Lake, Rihu Lake, Tian’ehu Lake, and Dingxianghu Lake ranged from 3.93% to 6.39%. The results indicate that LIBS can achieve comparable total nitrogen analysis results in water to those obtained by UV spectrophotometry.
Figure 11.
Distribution of sampling points for actual water samples. (a) Sampling points of Yuehu Lake and Rihu Lake. (b) Sampling points of Tian’ehu Lake and Dingxianghu Lake.
Table 4.
Determination and error analysis of N in different real water samples.
4. Conclusions
This study achieved quantitative analysis of N in water via liquid–solid conversion based on passively Q-switched multi-pulse LIBS technology, using cyanogen (CN) radical emission instead of N atomic emission. Experimental conditions, including laser energy, delay time, trigger pulse selection, and argon flow rate, were investigated and optimized. Compared with alkaline potassium persulfate digestion–ultraviolet (UV) spectrophotometry, multi-pulse molecular LIBS requires no chemical reagents and can complete the detection of N in solutions within a few minutes. The results show that using the CN characteristic spectral line combined with the sum of CN bands achieved better detection sensitivity and accuracy than using a single CN characteristic spectral line. In an argon atmosphere, quantitative analysis using the CN characteristic spectral line combined with the sum of CN bands reduced the ARE by 0.91%, with the optimal LOD as low as 2.19 mg/L. Compared with UV spectrophotometry, the relative deviation of multi-pulse molecular LIBS ranged from 3.93% to 6.39%. The results indicate that multi-pulse LIBS can achieve comparable total nitrogen analysis results in water to those obtained by UV spectrophotometry.
Author Contributions
Conceptualization, Y.C. and Q.W.; methodology, Y.C.; software, Q.W.; validation, Y.C., Q.W. and Z.T.; formal analysis, Y.C.; investigation, Q.W.; resources, Z.T.; data curation, Y.C.; writing—original draft preparation, Y.C.; writing—review and editing, Q.W. and Z.T.; visualization, Q.W.; supervision, Z.T.; project administration, Z.T.; funding acquisition, Z.T. All authors have read and agreed to the published version of the manuscript.
Funding
This research was funded by the National Key R&D Projects of the Ministry of Science and Technology (Grant No. 2022YFC2807702) and Key Joint Fund projects of the National Nature Fund (Grant No. U22A2008).
Data Availability Statement
The original contributions presented in this study are included in the article. Further inquiries can be directed to the corresponding author.
Conflicts of Interest
The authors declare no conflicts of interest.
Abbreviations
The following abbreviations are used in this manuscript:
| LIBS | Laser-Induced Breakdown Spectroscopy |
| TN | Total nitrogen |
| LOD | Limit of detection |
| ARE | Average relative error |
| SBR | Signal-to-background ratio |
| R2 | The coefficient of determination |
| RMSECV | Root mean square error of cross-validation |
| RSD | Relative standard deviation |
| CN | Cyanogen |
| N | Nitrogen |
| C | Carbon |
References
- Wurtsbaugh, W.A.; Paerl, H.W.; Dodds, W.K. Nutrients, Eutrophication and Harmful Algal Blooms along the Freshwater to Marine Continuum. WIREs Water 2019, 6, e1373. [Google Scholar] [CrossRef] [Scilit]
- Cebe, K.; Balas, L. Monitoring and Modeling Land-Based Marine Pollution. Reg. Stud. Mar. Sci. 2018, 24, 23–39. [Google Scholar] [CrossRef] [Scilit]
- GB/T 18921-2019; Water Quality for Landscape Environment Use of Reclaimed Urban Sewage. Standards Press of China: Beijing, China, 2019.
- Studt, J.L.; Campbell, E.R.; Westrick, D.; Kinnunen-Skidmore, T.; Marceau, A.H.; Campbell, W.H. Non-Toxic Total Nitrogen Determination Using a Low Alkaline Persulfate Digestion. MethodsX 2020, 7, 100791. [Google Scholar] [CrossRef] [Scilit]
- Pereira De Morais, C.; Nicolodelli, G.; Corso Mitsuyuki, M.; Gaioso Da Silva, K.S.; Mauad, F.F.; Mounier, S.; Marcondes Bastos Pereira Milori, D. Total Phosphorus Determination in Eutrophic Tropical River Sediments by Laser-Induced Breakdown Spectroscopy Techniques. Anal. Methods 2021, 13, 77–83. [Google Scholar] [CrossRef] [Scilit]
- Biomedical Applications of Laser-Induced Breakdown Spectroscopy (LIBS). Available online: https://www.spiedigitallibrary.org/conference-proceedings-of-spie/9332/933211/Biomedical-applications-of-laser-induced-breakdown-spectroscopy-LIBS/10.1117/12.2080710.full (accessed on 7 February 2026).
- Markiewicz-Keszycka, M.; Cama-Moncunill, X.; Casado-Gavalda, M.P.; Dixit, Y.; Cama-Moncunill, R.; Cullen, P.J.; Sullivan, C. Laser-Induced Breakdown Spectroscopy (LIBS) for Food Analysis: A Review. Trends Food Sci. Technol. 2017, 65, 80–93. [Google Scholar] [CrossRef] [Scilit]
- Wise, M.A.; Harmon, R.S.; Curry, A.; Jennings, M.; Grimac, Z.; Khashchevskaya, D. Handheld LIBS for Li Exploration: An Example from the Carolina Tin-Spodumene Belt, USA. Minerals 2022, 12, 77. [Google Scholar] [CrossRef] [Scilit]
- Botto, A.; Campanella, B.; Legnaioli, S.; Lezzerini, M.; Lorenzetti, G.; Pagnotta, S.; Poggialini, F.; Palleschi, V. Applications of Laser-Induced Breakdown Spectroscopy in Cultural Heritage and Archaeology: A Critical Review. J. Anal. At. Spectrom. 2019, 34, 81–103. [Google Scholar] [CrossRef] [Scilit]
- Costa, V.C.; Aquino, F.W.B.; Paranhos, C.M.; Pereira-Filho, E.R. Identification and Classification of Polymer E-Waste Using Laser-Induced Breakdown Spectroscopy (LIBS) and Chemometric Tools. Polym. Test. 2017, 59, 390–395. [Google Scholar] [CrossRef] [Scilit]
- Zhang, H.; Chen, Y.; Bi, Z.; Che, X.; Tian, Z. Detection of Phosphorus in Water by Laser-Induced Breakdown Spectroscopy Based on Liquid-Solid Transformation of Graphite Substrate Combined with PLS-SVR Fusion Quantitative Analysis Algorithm. Photonics 2025, 12, 616. [Google Scholar] [CrossRef] [Scilit]
- Rashid, M.; Anwar, H.A.; Aslam, M.S.; Rashid, A. Laser-Induced Breakdown Spectroscopy for Soil Analysis: Recent Advances in Nutrient and Contaminant Detection. Spectr. Eng. Sci. 2025, 3, 279–288. [Google Scholar] [CrossRef]
- Lin, P.; Ma, S.; Shi, Z.; Li, P.; Jiao, L.; Tian, H.; Xing, Z.; Zhao, C.; Dong, D. TransLIBS-CRS: Integrating LIBS with Transfer Learning for Accurate Cross-Regional Soil Total Nitrogen Detection. Smart Agric. Technol. 2025, 12, 101118. [Google Scholar] [CrossRef] [Scilit]
- Liu, C.; Chen, K.; Sun, L.; Zhao, Y.; Yu, K. Estimation of Soil Organic Matter in Maize Fields with Parallel Input Deep Learning Based on Vis-Nirs and Libs Fusion. Social Science Research Network, 29 March 2025. Available online: https://papers.ssrn.com/abstract=5197704 (accessed on 8 February 2026). [CrossRef] [Scilit]
- Hu, J.; Jiang, M.; Sun, H.; Ahmed, S.; Zhang, H.; Zhang, H.; Hernandez, J. Analysis of N and K Elements in Root-Removed Rice Samples Using Laser-Induced Breakdown Spectroscopy: Evaluating Different Modes of Tillage and Fertilization. In Agriculture Value Chain—Challenges and Trends in Academia and Industry: RUC-APS Volume 2; Hernández, J., Kacprzyk, J., Eds.; Springer Nature: Cham, Switzerland, 2025; pp. 189–203. [Google Scholar]
- Dib, S.R.; Nespeca, M.G.; Santos Junior, D.; Ribeiro, C.A.; Crespi, M.S.; Gomes Neto, J.A.; Ferreira, E.C. CN Diatomic Emission for N Determination by LIBS. Microchem. J. 2020, 157, 105107. [Google Scholar] [CrossRef] [Scilit]
- Fernández-Bravo, Á.; Delgado, T.; Lucena, P.; Laserna, J.J. Vibrational Emission Analysis of the CN Molecules in Laser-Induced Breakdown Spectroscopy of Organic Compounds. Spectrochim. Acta Part B At. Spectrosc. 2013, 89, 77–83. [Google Scholar] [CrossRef] [Scilit]
- Yan, X.T.; Donaldson, K.M.; Davidson, C.M.; Gao, Y.; Wu, H.; Houston, A.M.; Kisdi, A. Effects of Sample Pretreatment and Particle Size on the Determination of Nitrogen in Soil by Portable LIBS and Potential Use on Robotic-Borne Remote Martian and Agricultural Soil Analysis Systems. RSC Adv. 2018, 8, 36886–36894. [Google Scholar] [CrossRef] [Scilit] [PubMed]
- Yang, X.; Zhu, P.; Li, D.; Liu, C.; Zhang, X.; Hong, T.; Ren, H.; Hua, Z.; Qin, Z.; Sun, Z.; et al. Reducing Laser Energy to Suppress Air Interference for Plasma Amplification LIBS Detection of Nitrogen in an Aerosol Solution. J. Anal. At. Spectrom. 2025, 40, 498–502. [Google Scholar] [CrossRef] [Scilit]
- Hossen, M.A.; Diwakar, P.K.; Ragi, S. Total Nitrogen Estimation in Agricultural Soils via Aerial Multispectral Imaging and LIBS. Sci. Rep. 2021, 11, 12693. [Google Scholar] [CrossRef] [Scilit] [PubMed]
- Guan, H.; Feng, D.; Chi, Y.; Wang, Y.; Luo, M.; Ma, N. Applications and Technological Advances of LIBS in Water Quality Monitoring. J. Anal. At. Spectrom. 2026, 41, 899–921. [Google Scholar] [CrossRef] [Scilit]
- Carson, C.G.; Goueguel, C.L.; Sanghapi, H.; Jain, J.; McIntyre, D. Evaluation of a Commercially Available Passively Q-Switched Nd:YAG Laser with LiF:F2-Saturable Absorber for Laser-Induced Breakdown Spectroscopy. Opt. Laser Technol. 2016, 79, 146–152. [Google Scholar] [CrossRef] [Scilit]
- Jedlinszki, N.; Galbács, G. An Evaluation of the Analytical Performance of Collinear Multi-Pulse Laser Induced Breakdown Spectroscopy. Microchem. J. 2011, 97, 255–263. [Google Scholar] [CrossRef] [Scilit]
- NIST: Atomic Spectra Database Lines Form. Available online: https://physics.nist.gov/PhysRefData/ASD/lines_form.html (accessed on 8 February 2026).
- Dong, M.; Lu, J.; Yao, S.; Zhong, Z.; Li, J.; Li, J.; Lu, W. Experimental Study on the Characteristics of Molecular Emission Spectroscopy for the Analysis of Solid Materials Containing C and N. Opt. Express 2011, 19, 17021. [Google Scholar] [CrossRef] [Scilit]
- Hai, R.; He, Z.; Yu, X.; Sun, L.; Wu, D.; Ding, H. Comparative Study on Self-Absorption of Laser-Induced Tungsten Plasma in Air and in Argon. Opt. Express OE 2019, 27, 2509–2520. [Google Scholar] [CrossRef] [Scilit]
- Yoon, S.; Choi, H.-W.; Kim, J. Analysis of Changes in Spectral Signal According to Gas Flow Rate in Laser-Induced Breakdown Spectroscopy. Appl. Sci. 2021, 11, 9046. [Google Scholar] [CrossRef] [Scilit]
- Mousavi, S.J.; Hemati Farsani, M.; Darbani, S.M.R.; Mousaviazar, A.; Soltanolkotabi, M.; Eslami Majd, A. CN and C2 Vibrational Spectra Analysis in Molecular LIBS of Organic Materials. Appl. Phys. B 2016, 122, 106. [Google Scholar] [CrossRef] [Scilit]
- García-Gómez, L.; Soriano, J.K.; Vadillo, J.M.; Ikeda, Y. Improved Detection Capabilities of Molecular Emission in Microwave-Enhanced Laser-Induced Plasma. Spectrochim. Acta Part B At. Spectrosc. 2026, 235, 107356. [Google Scholar] [CrossRef] [Scilit]
- Xu, F.; Ma, S.; Zhao, C.; Dong, D. Application of Molecular Emissions in Laser-Induced Breakdown Spectroscopy: A Review. Front. Phys. 2022, 10, 821528. [Google Scholar] [CrossRef] [Scilit]

Disclaimer/Publisher’s Note: The statements, opinions and data contained in all publications are solely those of the individual author(s) and contributor(s) and not of MDPI and/or the editor(s). MDPI and/or the editor(s) disclaim responsibility for any injury to people or property resulting from any ideas, methods, instructions or products referred to in the content. |
© 2026 by the authors. Licensee MDPI, Basel, Switzerland. This article is an open access article distributed under the terms and conditions of the Creative Commons Attribution (CC BY) license.