


Abstract
Persistent droughts and shifting precipitation regimes continue to threaten water security across the United States, with arid and semi-arid regions remaining the most vulnerable. This study examines the spatial and temporal patterns of aridity and water scarcity across drought-prone stations (111) and regions of the U.S. using 30 years (1991–2020) of precipitation records from xmACIS II. Weather stations were categorized into arid (<10 inches/year), semi-arid (10–20 inches/year), and non-arid (>20 inches/year) zones, revealing a distinct west–east gradient: arid and semi-arid conditions prevail across the western and central U.S., while the eastern regions remain largely non-arid. Drought frequency analysis spanning 2000–2019 indicates that certain regions experienced exceptional drought conditions (D3 or higher) for more than 50% of the study period, with localized areas enduring over 300 weeks of extreme drought. Long-term precipitation trends (1920–2020) in Texas, Washington, and South Dakota reflect a modest increase in precipitation; however, CMIP6 multi-model ensemble projections under a 2 °C and 4 °C warming scenario point to divergent future trajectories, with some regions experiencing increased wetness while others face progressive drying. These findings offer actionable insights for drought monitoring and climate adaptation strategies, underscoring the heightened vulnerability of arid and semi-arid zones to intensify water scarcity.
1. Introduction
Aridity and semi-aridity are critical climatic conditions that significantly impact the hydrological cycle, ecosystem stability, and agricultural productivity. These conditions are characterized by low precipitation and high evapotranspiration rates, leading to water scarcity and increased vulnerability to droughts [1]. Understanding the spatial distribution and temporal dynamics of aridity and semi-aridity is essential for effective water resource management, agricultural planning, and climate adaptation strategies.
Climate change is exacerbating aridity in many regions, altering precipitation regimes and increasing evaporative demand [2]. Such shifts threaten water security, especially in areas already prone to drought. Accurate mapping of these zones is a first step toward mitigating risks [3].
The United States, with its diverse climatic regions, experiences varying degrees of aridity and semi-aridity, particularly in the western and central parts of the country [4]. These regions are prone to frequent and severe droughts, which have profound socio-economic and environmental consequences. For instance, the prolonged droughts in California have led to significant agricultural losses, water shortages, and increased wildfire risks [5]. Similarly, the Dust Bowl of the 1930s serves as a historical example of the devastating impacts of prolonged drought and poor land management practices [6].
Recent decades have seen advances in drought monitoring, blending satellite data and ground observations [7]. Yet gaps remain in linking long-term aridity trends to localized drought impacts. Our study bridges this by combining historical data with future climate projections.
For example, the U.S. Drought Monitor (USDM) offers a comprehensive assessment of drought conditions across the country, utilizing various indicators such as precipitation deficits, soil moisture, and streamflow data [8].
Prior station-based aridity classification studies, such as [9,10], have largely relied on satellite-derived Aridity Indices (e.g., AI = P/PET), while USDM-based drought climatology studies, including [11,12], have examined drought frequency and long-term risk using fractal geometry and paleoclimate reconstructions, respectively. However, few studies have simultaneously integrated station-level precipitation classification with accumulated USDM drought duration analysis across aridity zones. Our study addresses both gaps by employing a precipitation-only threshold classification tied directly to USDM monitoring infrastructure, enabling straightforward operational adoption by practitioners. It also links accumulated drought duration in weeks to the underlying aridity class of the affected region.
In general, drought is defined by using various meteorological datasets, e.g., soil moisture, precipitation, temperature, and evapotranspiration. In this study, we aim to map the aridity and semi-aridity over drought-prone areas of the United States using 30 years (1991–2020) of mean precipitation data only. By classifying weather stations based on their annual rainfall, we identify distinct arid, semi-arid, and non-arid zones. This classification clarifies the spatial distribution of these climatic conditions and their correlation with drought occurrences in a simple manner. Additionally, we analyze the percentage of weeks spent in drought conditions and the frequency of severe droughts (D3 or higher) from 2000 to 2019, providing a comprehensive overview of drought dynamics in these regions.
Recent studies have highlighted the importance of mapping and monitoring arid and semi-arid regions to better understand their extent and dynamics. The use of long-term precipitation data, combined with advanced climate models, provides valuable insights into the trends and patterns of aridity [12]. Furthermore, we examine long-term precipitation trends in Texas from 1920 to 2020 to identify potential shifts in regional climate patterns. How do CMIP6 projections align with observed aridity trends under 2 °C and 4 °C warming? Climate model projections (CMIP6) for a 2 °C and 4 °C rise in temperature are also analyzed to predict future changes in precipitation patterns and their implications for arid and semi-arid regions. These projections are crucial for developing adaptive strategies to manage future climate variability and its impacts.
Overall, this research aims to enhance our understanding of the spatial and temporal dynamics of aridity and semi-aridity in the United States. The insights gained from this study are essential for developing targeted drought management and climate adaptation strategies, ensuring resilience in the face of changing climatic conditions.
2. Materials and Methods
Various processes were used to select data sets from across the United States. The primary source of UpToDate data was xmACIS II (Applied Climate Information System, https://xmacis.rcc-acis.org/, ACIS-NOAA, Washington, DC, USA), a tool that provides a wide range of climate-related data. This database includes records from numerous weather stations scattered across the country. Years 1991–2020 were chosen to calculate a 30-year mean of rainfall, offering a reliable representation of long-term precipitation trends and also a snapshot of current climate conditions. A complete station inventory (new Supplementary Table S1) is now provided, listing all 111 stations with: state, location, average precipitation, latitude and longitude. This enables full reproducibility. Stations were selected from xmACIS II if they met all three criteria: (i) ≥90% temporal completeness over 1991–2020; (ii) no evidence of station relocation exceeding 0.5° in latitude/longitude or 100 m in elevation within the period.
A newly developed dataset of statistically downscaled CMIP6 projections using the Localized Constructed Analogs (LOCA2) method, spanning central Mexico to southern Canada at a high spatial resolution of 6 km [13]. The dataset incorporates output from 27 CMIP6 Earth system models, including up to 10 ensemble members per model across three Shared Socioeconomic Pathways (SSP2-4.5, SSP3-7.0, and SSP5-8.5) at 6 km of spatial resolution. Table 1 shows the features of the datasets used in this research.
Table 1.
Summary of primary datasets and methodological elements.
Stations were strategically selected to represent a variety of locations across the western United States. The objective was to create a comprehensive map that highlights areas experiencing arid and semi-arid conditions. To achieve this, two cities were initially chosen from each state. Once a station with continuous and reliable data was identified, it was included in the analysis. In states where arid and semi-arid conditions were more prominent, additional stations were selected to enhance the representation of these regions. This method resulted in a visual map that effectively displays the spatial distribution of dry climates. Ultimately, this approach provided a more detailed understanding of shifting precipitation patterns and the geographical extent of arid and semi-arid zones throughout the western U.S.
In this study, the U.S. Drought Monitor is referenced as a key tool for tracking drought severity and distribution. This map is released weekly every Thursday and highlights drought condition across the United States and its territories. It draws on various data inputs, including precipitation, streamflow, reservoir levels, temperature, evaporative demand, soil moisture, and vegetation health. According to [10], the U.S. Drought Monitor classifies drought severity into five categories: D0 through D4. D0 (Abnormally Dry) indicates areas that may be entering or recovering from drought, with short-term dryness affecting agriculture and fire risk. D1 (Moderate Drought) reflects some crop and pasture damage, lower stream and reservoir levels, and the onset of water shortages, often leading to voluntary water-use restrictions. D2 (Severe Drought) involves likely crop or pasture losses, common water shortages, and imposed restrictions. D3 (Extreme Drought) is associated with major agricultural losses, high fire danger, and widespread water shortages. The most intense level, D4 (Exceptional Drought), signifies exceptional and widespread crop and pasture losses, as well as critical water shortages that may result in emergencies.
Following [13], this study recognizes four conceptual drought types: meteorological drought (precipitation deficits relative to climatological normals), agricultural drought (soil moisture deficits; USDM D1–D2), hydrological drought (streamflow and reservoir depletion; USDM D2–D3), and socioeconomic drought (water supply failure; USDM D4). This typological framework ensures that our aridity classification and drought frequency metrics are grounded in both physical and societal dimensions of water scarcity. These classifications are essential for understanding and communicating the evolving nature of nationwide drought.
While our aridity classification is precipitation-based, we acknowledge that evapotranspiration (ET), soil moisture, and vapor pressure deficit (VPD) are equally critical drought drivers, particularly under warm conditions. To partially account for these factors, USDM D3+ accumulated weeks are used as a complementary severity metric, as the USDM already integrates PDSI, SPI, soil moisture anomalies, and vegetation health indices. Incorporating standardized indices such as the UNEP Aridity Index (AI = P/PET) remains an avenue for future work.
3. Results
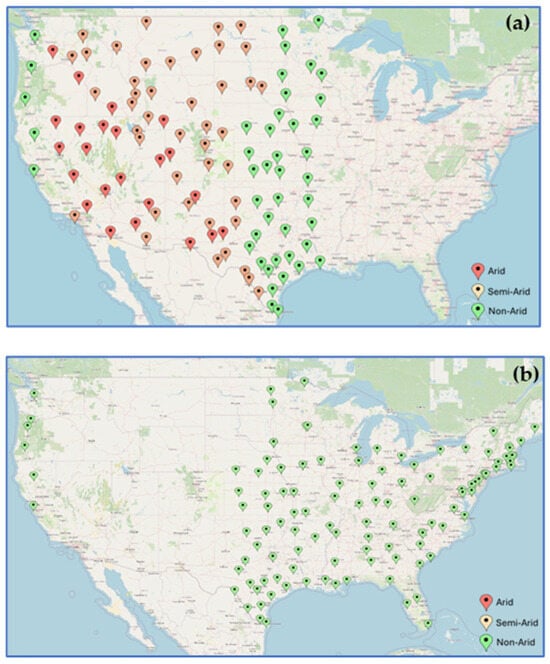
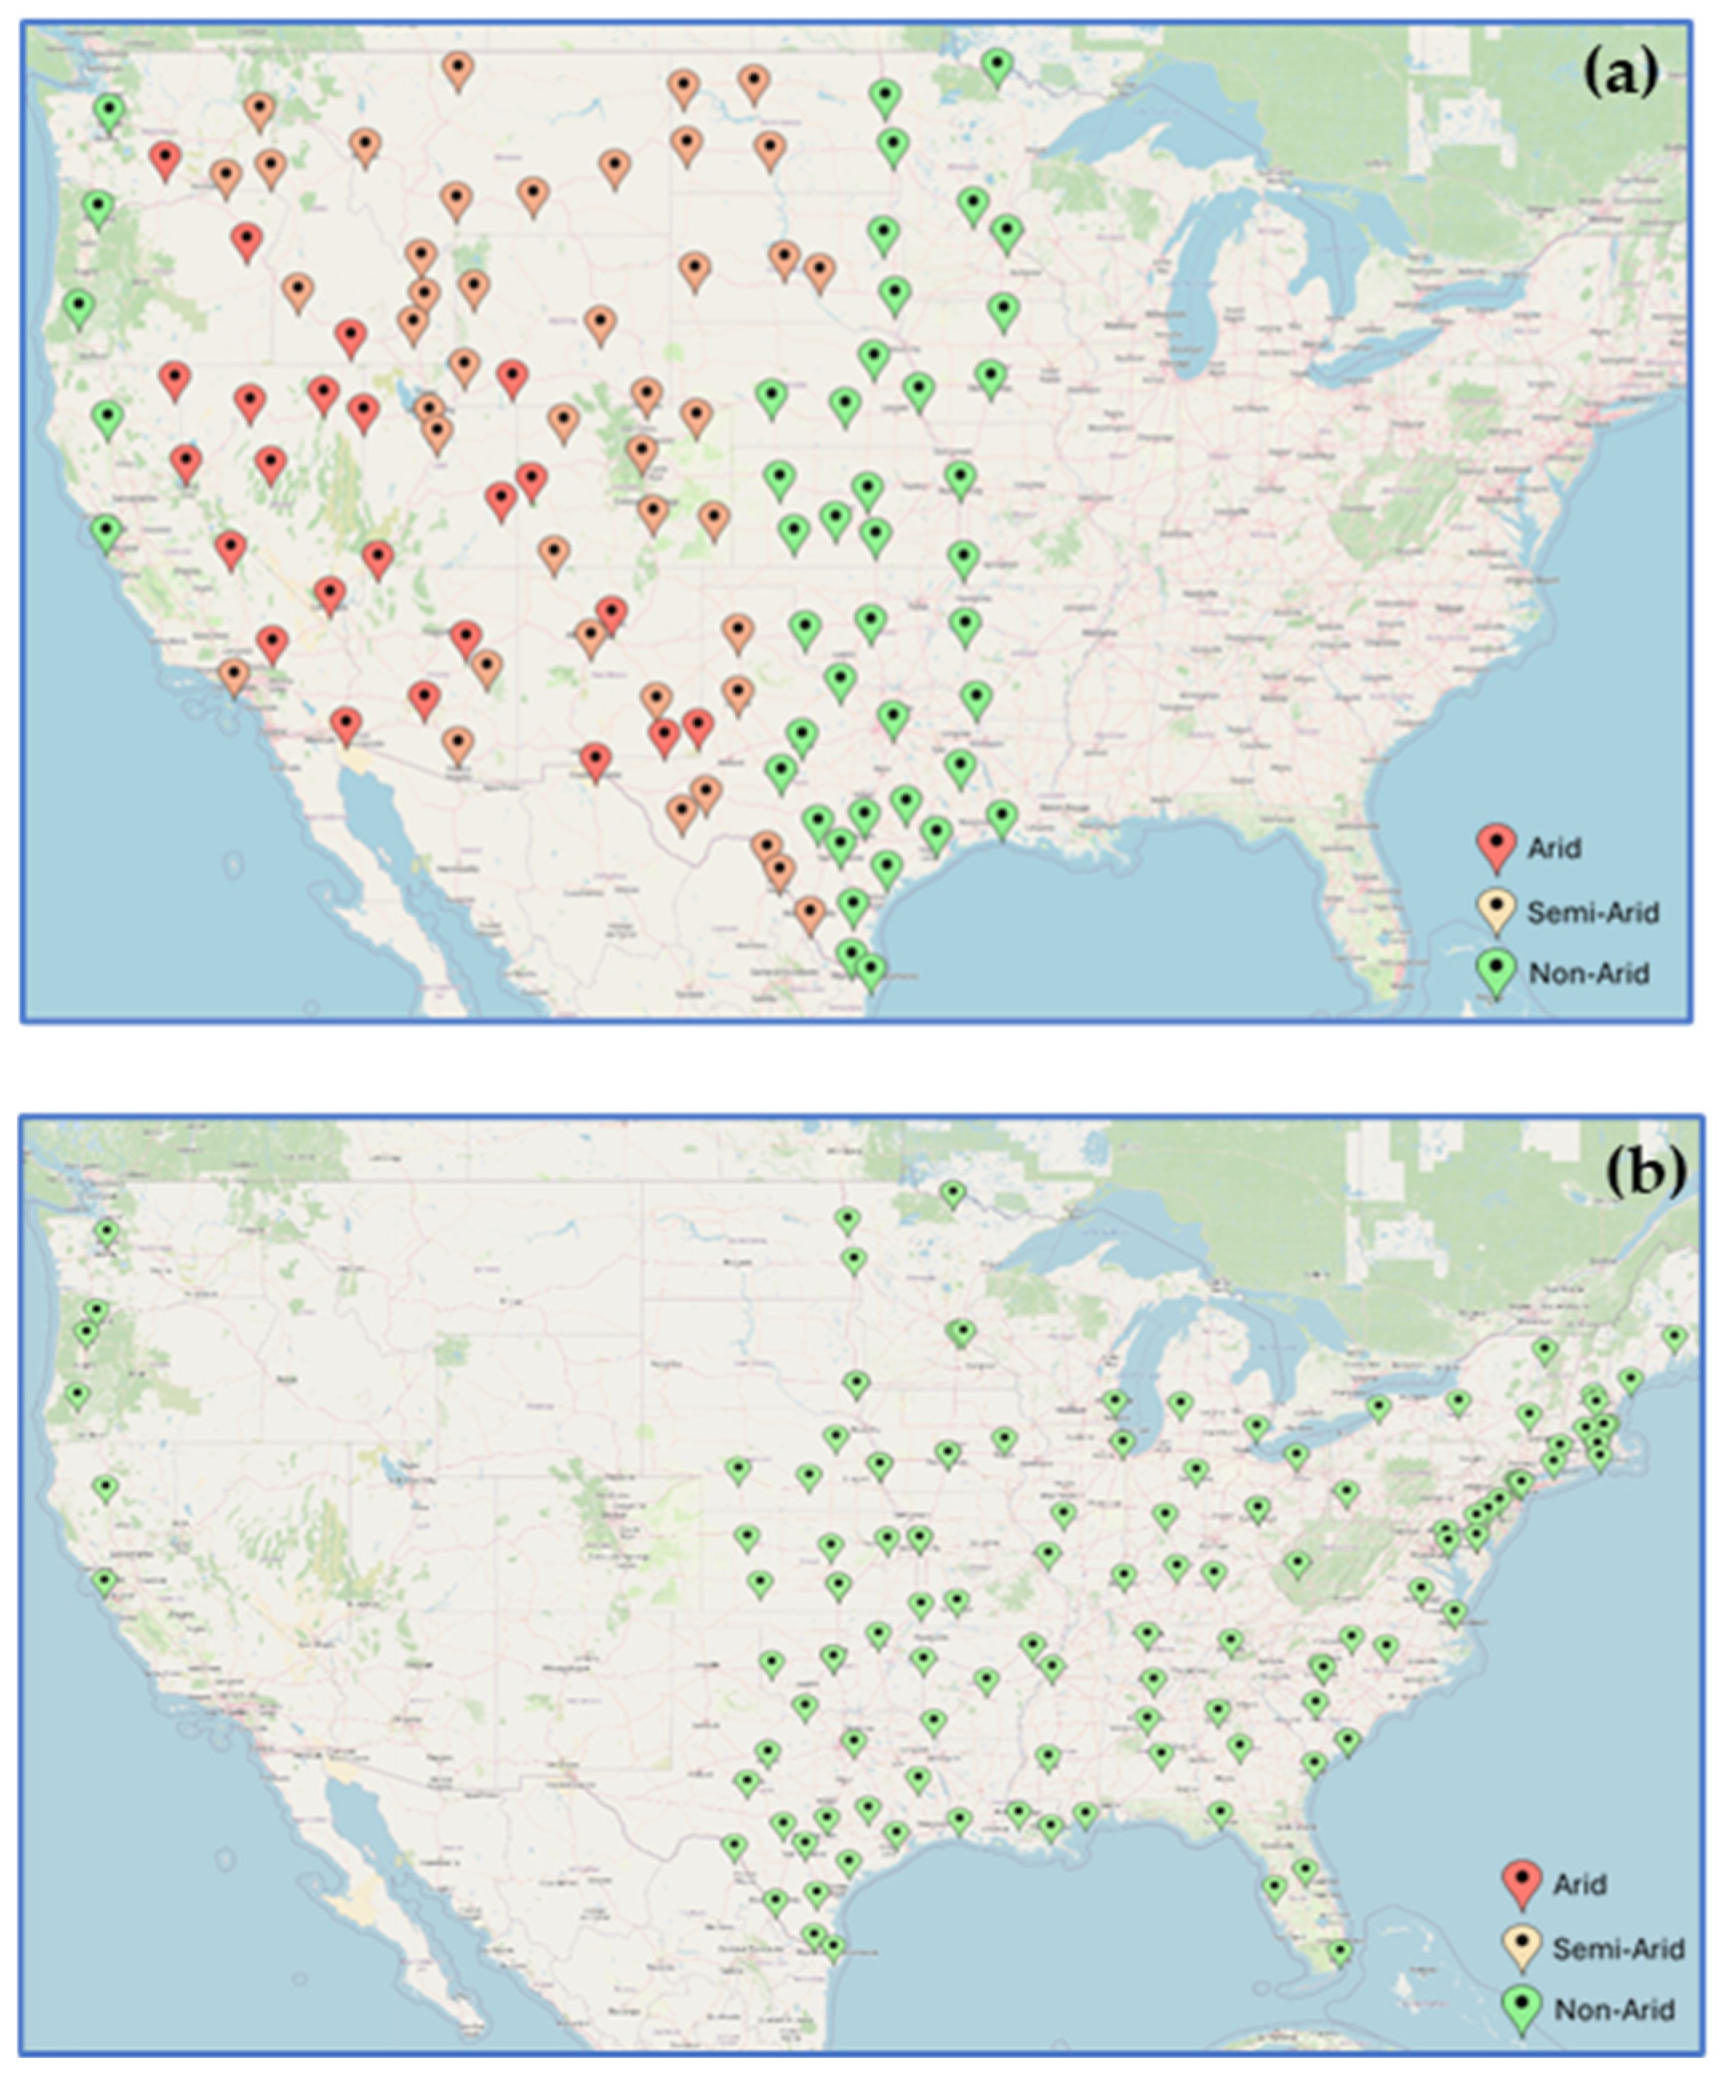
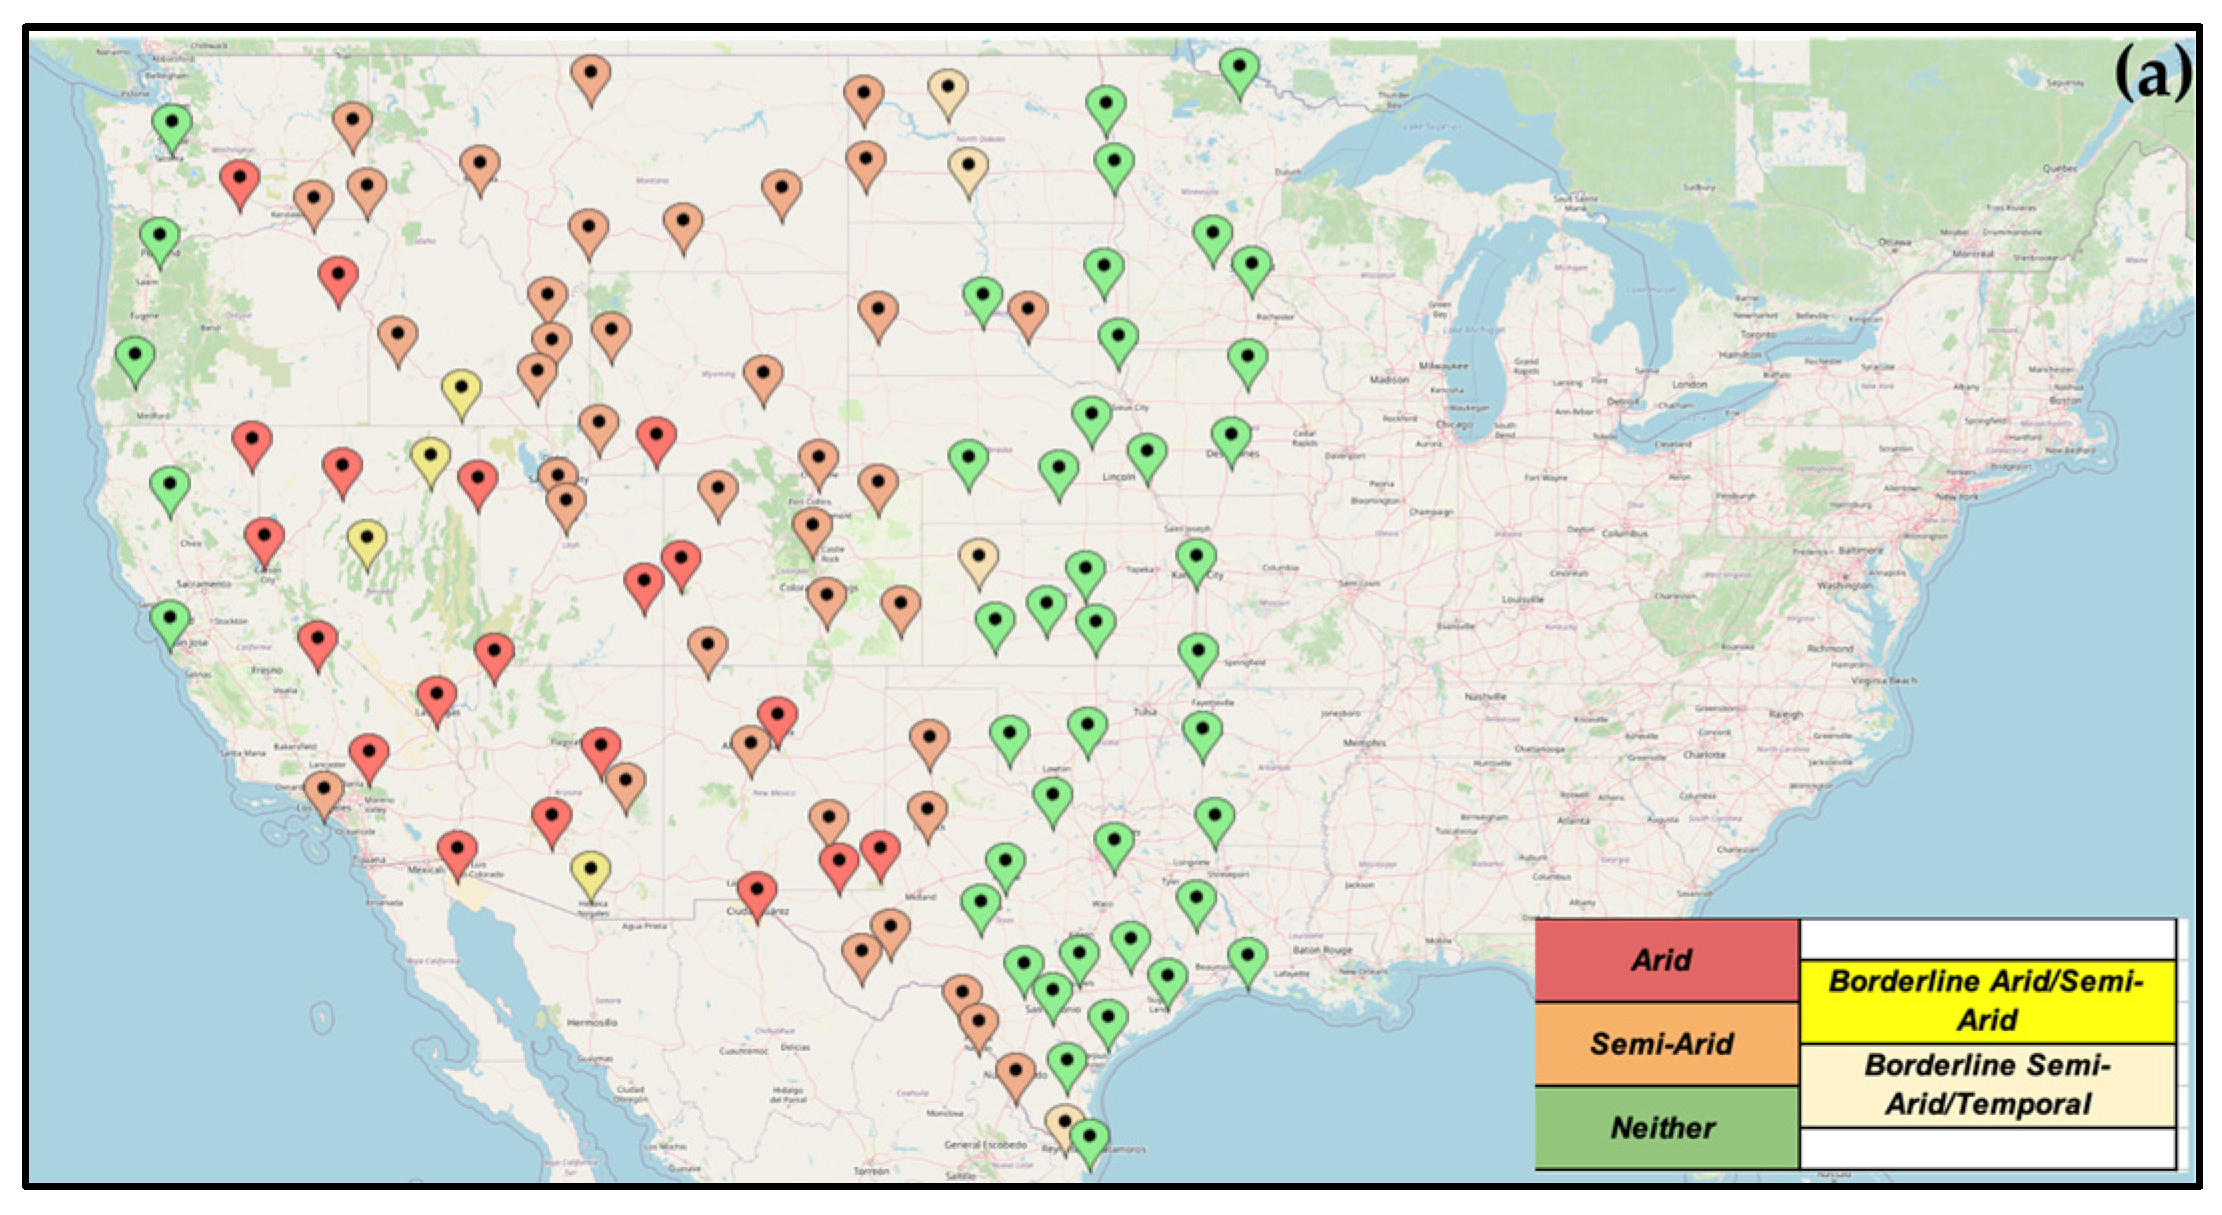
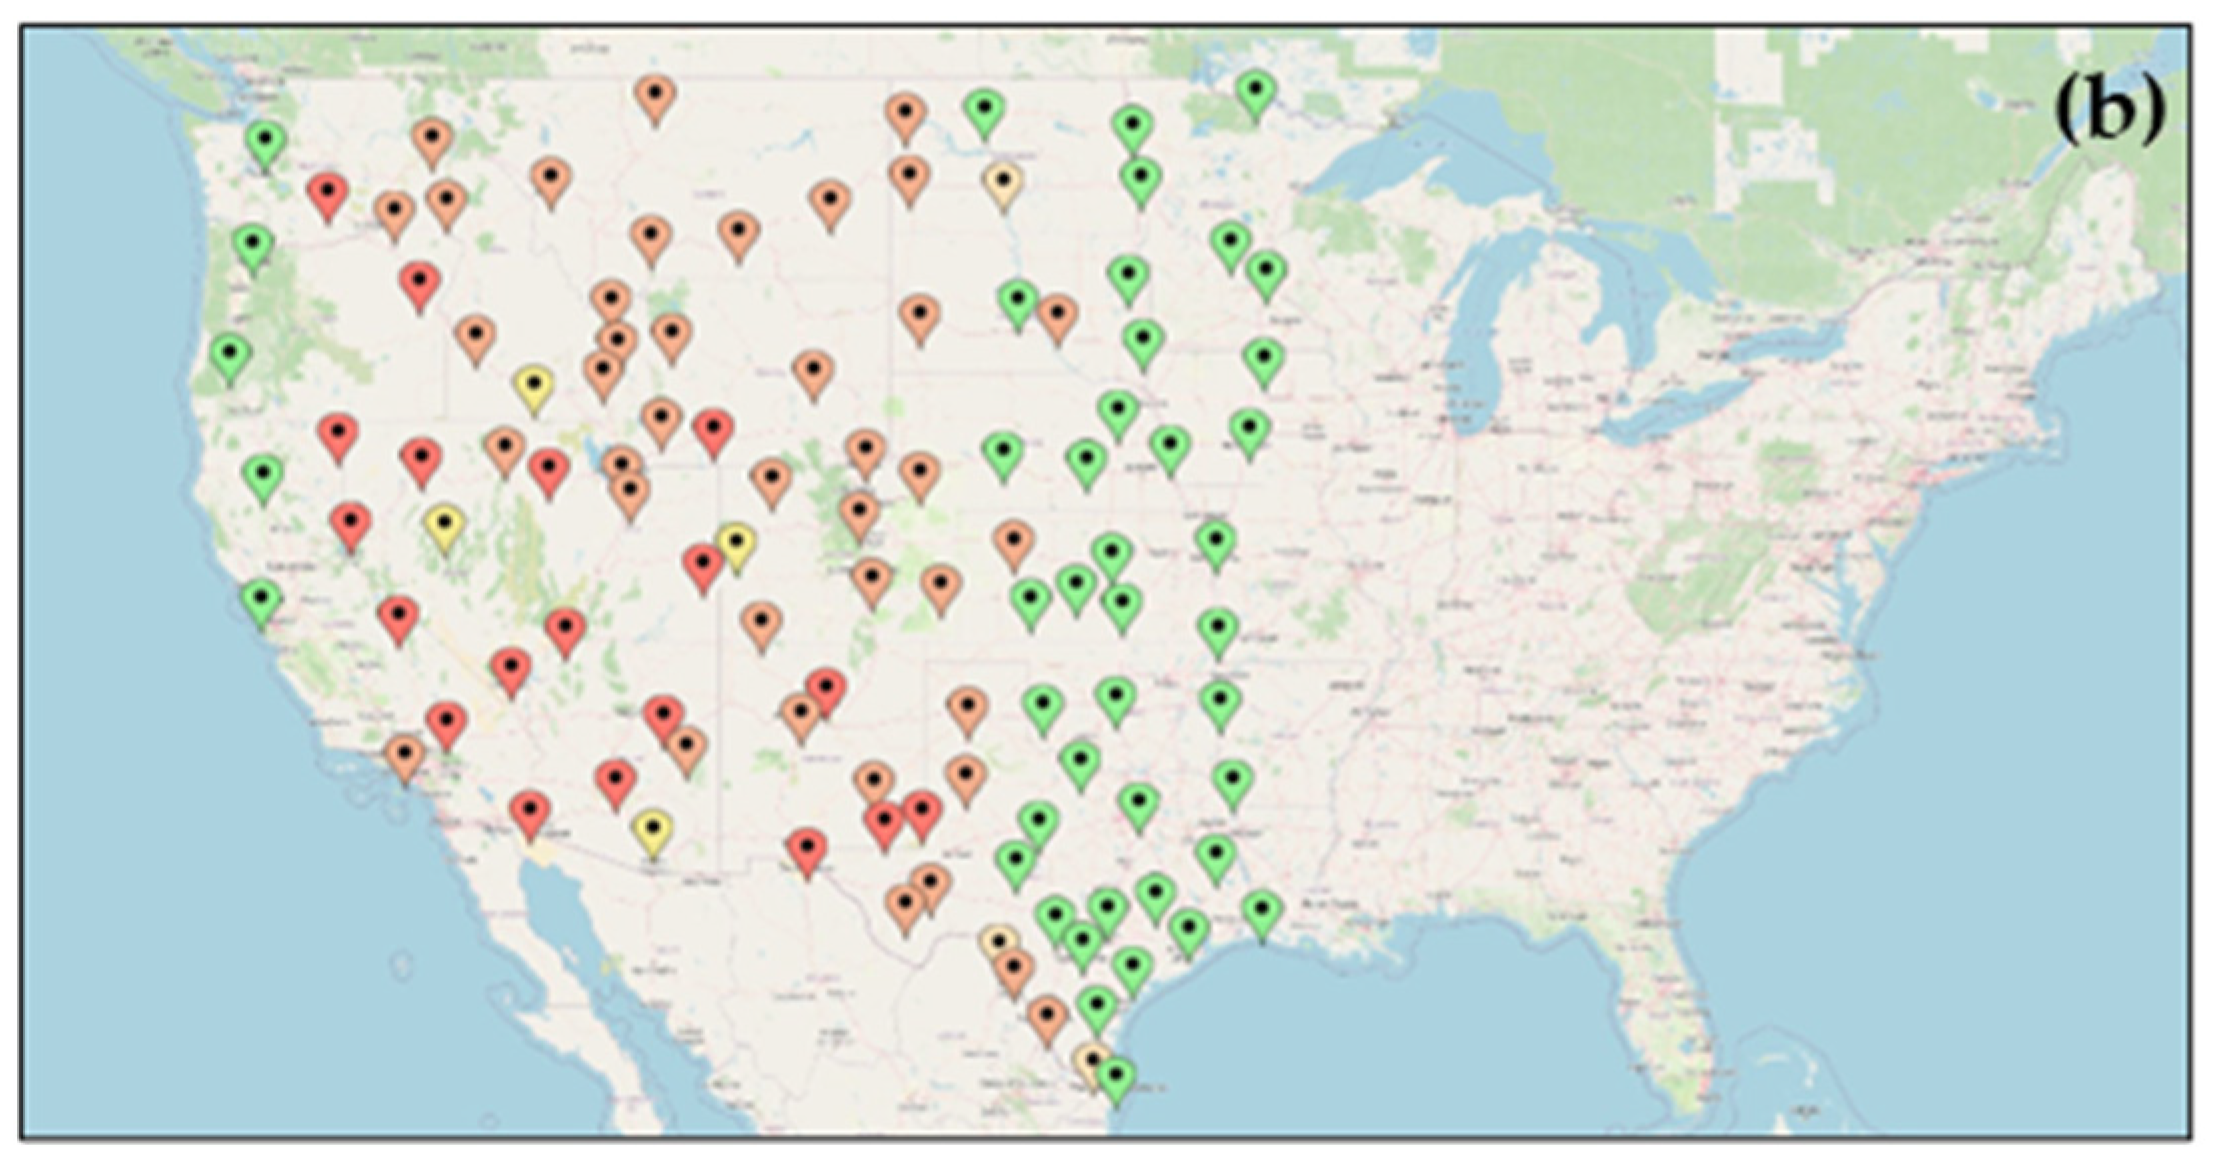
Understanding the spatial distribution of aridity and semi-aridity is crucial for assessing drought-prone regions and their long-term climatic variability. Using a 30-year (1991–2020) mean precipitation dataset, we classified meteorological stations across the contiguous United States into arid, semi-arid, and non-arid categories. This classification provides insights into the geographical extent of dry regions, which is essential for water resource management, agricultural planning, and climate adaptation strategies. The spatial representation of these classifications is depicted in Figure 1a. The map shows the spatial distribution of arid and semi-arid regions (111 meteorological stations), predominantly located in the western and central parts of the country, while non-arid regions are more common in the eastern United States (Figure 1a,b). That is the reason we did not consider the eastern part of the USA (east of the 100th Meridian line) because most of the stations do not fall into the category of aridity or semi-aridity (Figure 1b).
Figure 1.
Mapped different stations (a) west of the 100th Meridian line, a total of 111 stations that identified as arid (23 pins), semi-arid (45 pins) and non-arid (43 pins); (b) east of the 100th Meridian line, a total of 76 stations that identified as non-arid (76 pins). These are based on the 30-year (1991–2020) mean precipitation data over the USA continent. Dark red (<10 in), orange (between 10 and 20 in) and green (>20 in) pins show rainfall.
The map focuses on the spatial distribution of these climatic conditions across the United States. Key observations from the map include:
- Western, Southwestern and Central United States: These regions are predominantly drought-prone areas, feature dark red and orange markers, indicating a high concentration of arid and semi-arid conditions (Figure 1a). The extreme western region shows a few green pins indicating non-arid stations. The map reveals that arid stations are predominantly concentrated in the Southwestern U.S., including regions of California, Nevada, Arizona, and western Texas, where precipitation levels are lowest. Semi-arid stations are primarily located in the Great Plains, parts of the Intermountain West, and some regions of the Southern U.S., highlighting transitional zones between arid and more humid climates. This aligns with known climatic patterns where these areas experience lower precipitation and higher evapotranspiration rates.
- Eastern United States: This region is primarily marked with green markers, indicating non-arid conditions with higher annual precipitation (Figure 1b). The eastern part of the country generally benefits from more consistent and abundant rainfall, supporting a wider range of agricultural and ecological activities.
The classification of weather stations based on long-term precipitation data provides a clear visual representation of the distribution of aridity across the country. The distribution aligns with known climatological patterns, reinforcing the role of regional topography, atmospheric circulation, and proximity to moisture sources in shaping aridity and semi-aridity across the U.S. This information is crucial for understanding regional vulnerabilities to drought and for developing targeted water management and climate adaptation strategies.
Among the most significant findings is the persistent and prolonged duration of drought conditions in several regions, with some areas experiencing continuous or recurrent drought for hundreds of weeks between 2000 and 2019.
Famous maps by Dr. Becky Bolinger (at Drought.gov) illustrate the Percentage of Weeks Spent in Drought Conditions across the United States from 2000 to 2019. In those maps, darker shades indicate a higher percentage of weeks under drought, with dark red representing areas where drought was recorded for more than 50% of the period. Lighter shades denote progressively fewer weeks under drought. Data were sourced from the U.S. Drought Monitor.
Figure 2 highlights the Number of Weeks in Severe to Exceptional Drought across the U.S. over the same period. Here, darker shades correspond to longer durations of the most intense drought categories, with the darkest red indicating regions that experienced exceptional drought for more than 300 weeks. Lighter shade represents areas with fewer weeks of severe drought. This map is also based on data from the U.S. Drought Monitor.
Figure 2.
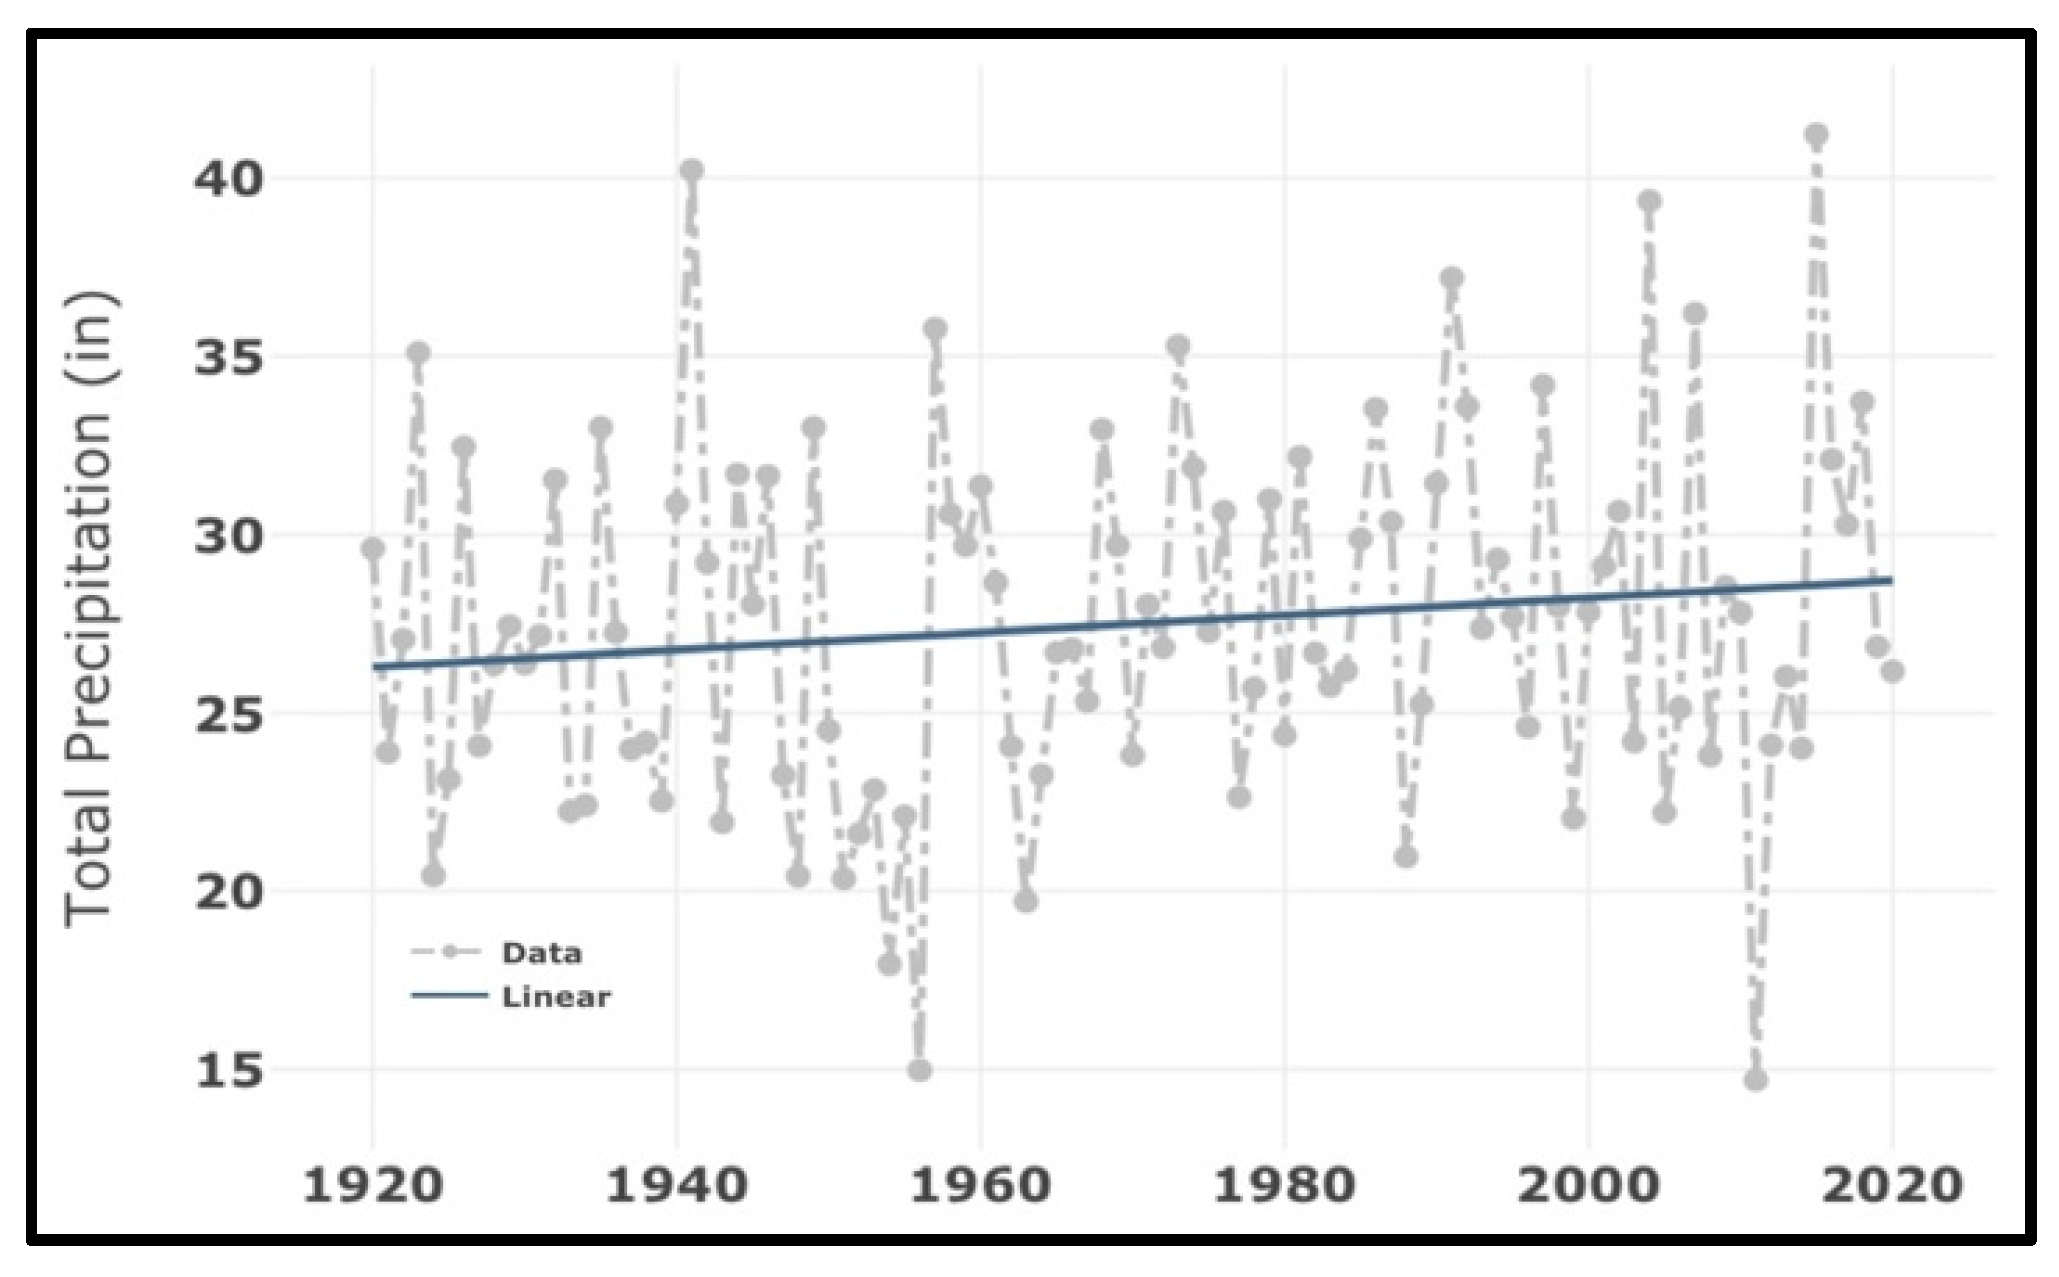
Rate of Change (RoC) analysis in Texas. The mean precipitation was 27.50 in, Std. Dev. 5.04 and annual RoC trend 0.024.
Western and Central United States: Both panels show that these regions experienced a high percentage of weeks in drought and a significant number of weeks in severe drought (D3+). This aligns with known climatic patterns where these areas are more prone to arid and semi-arid conditions.
Regional Variability: The maps illustrate the variability in drought conditions across the country, with some regions experiencing more frequent and severe droughts than others.
Together, these maps illustrate the geographic pattern of drought frequency and severity, revealing which regions face the most persistent and intense conditions. The data sourced from the U.S. Drought Monitor offers valuable insights into the spatial and temporal dynamics of drought, which are crucial for developing adaptive strategies to enhance resilience against future drought conditions.
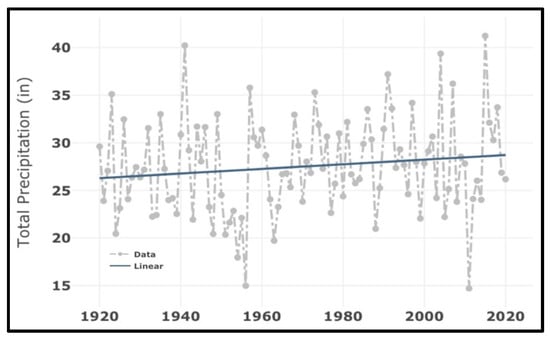
Long-term precipitation analysis reveals a gradual but significant wetting trend across Texas over the past century (Figure 2). This figure shows the total annual precipitation (in inches) for Texas from 1920 to 2020. The grey dots represent yearly precipitation data, and the blue line represents the linear trend over time. The data shows a slight increase in annual precipitation over the 100-year period.
Slight Increase in Annual Precipitation: The linear trend line shows a slight upward slope, indicating a gradual increase in annual precipitation over the 100-year period. This hints that, on average, Texas has experienced a modest increase in rainfall over the past century.
Variability in Precipitation: The scatter of grey dots around the trend line features the year-to-year variability in annual precipitation. Some years show significantly higher or lower precipitation than the trend line, reflecting the natural variability in climate and weather patterns. Whether this trend reflects natural multidecadal variability or anthropogenic climate change requires further attribution studies, but its consistency with warming-induced hydrological cycle intensification warrants attention.
Climate Change and Regional Patterns: The slight increase in annual precipitation may be indicative of broader climatic changes affecting the region. Understanding these trends is crucial for water resource management, agricultural planning, and preparing for the potential impacts of climate change.
Adaptation Strategies: The observed trend and variability underscore the importance of developing adaptive strategies to manage water resources effectively. This includes planning for both wetter and drier years to ensure resilience against climate variability.
Overall, Figure 2 provides valuable insights into the long-term precipitation trends in Texas, highlighting both the gradual increase in rainfall and the significant year-to-year variability. Skill scores related to precipitation over many other aid and semi-arid regions are listed in Table 2 for 100 years (1920–2020). Similarly to Texas, South Dakota, North Dakota, Washington, and Oregon also show a slight increase in annual rate of change in precipitation, and a slight decrease over Wyoming and Arizona. Over a shorter period, the last 30 years (1991–2020), most of the states show a slight decrease in rainfall (Table 3).
Table 2.
Various Matrices over arid and semi-arid states. All data is based on 100-year analysis (1920–2020).
Table 3.
Various Matrices over arid and semi-arid states. All data is based on 30-year analysis (1991–2020).
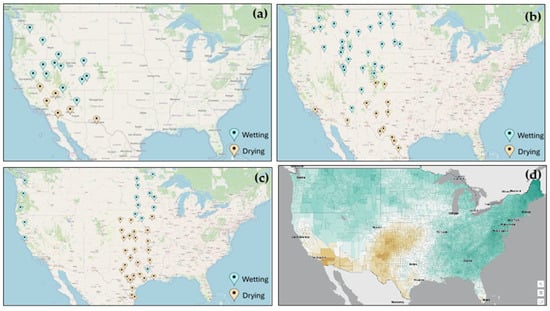
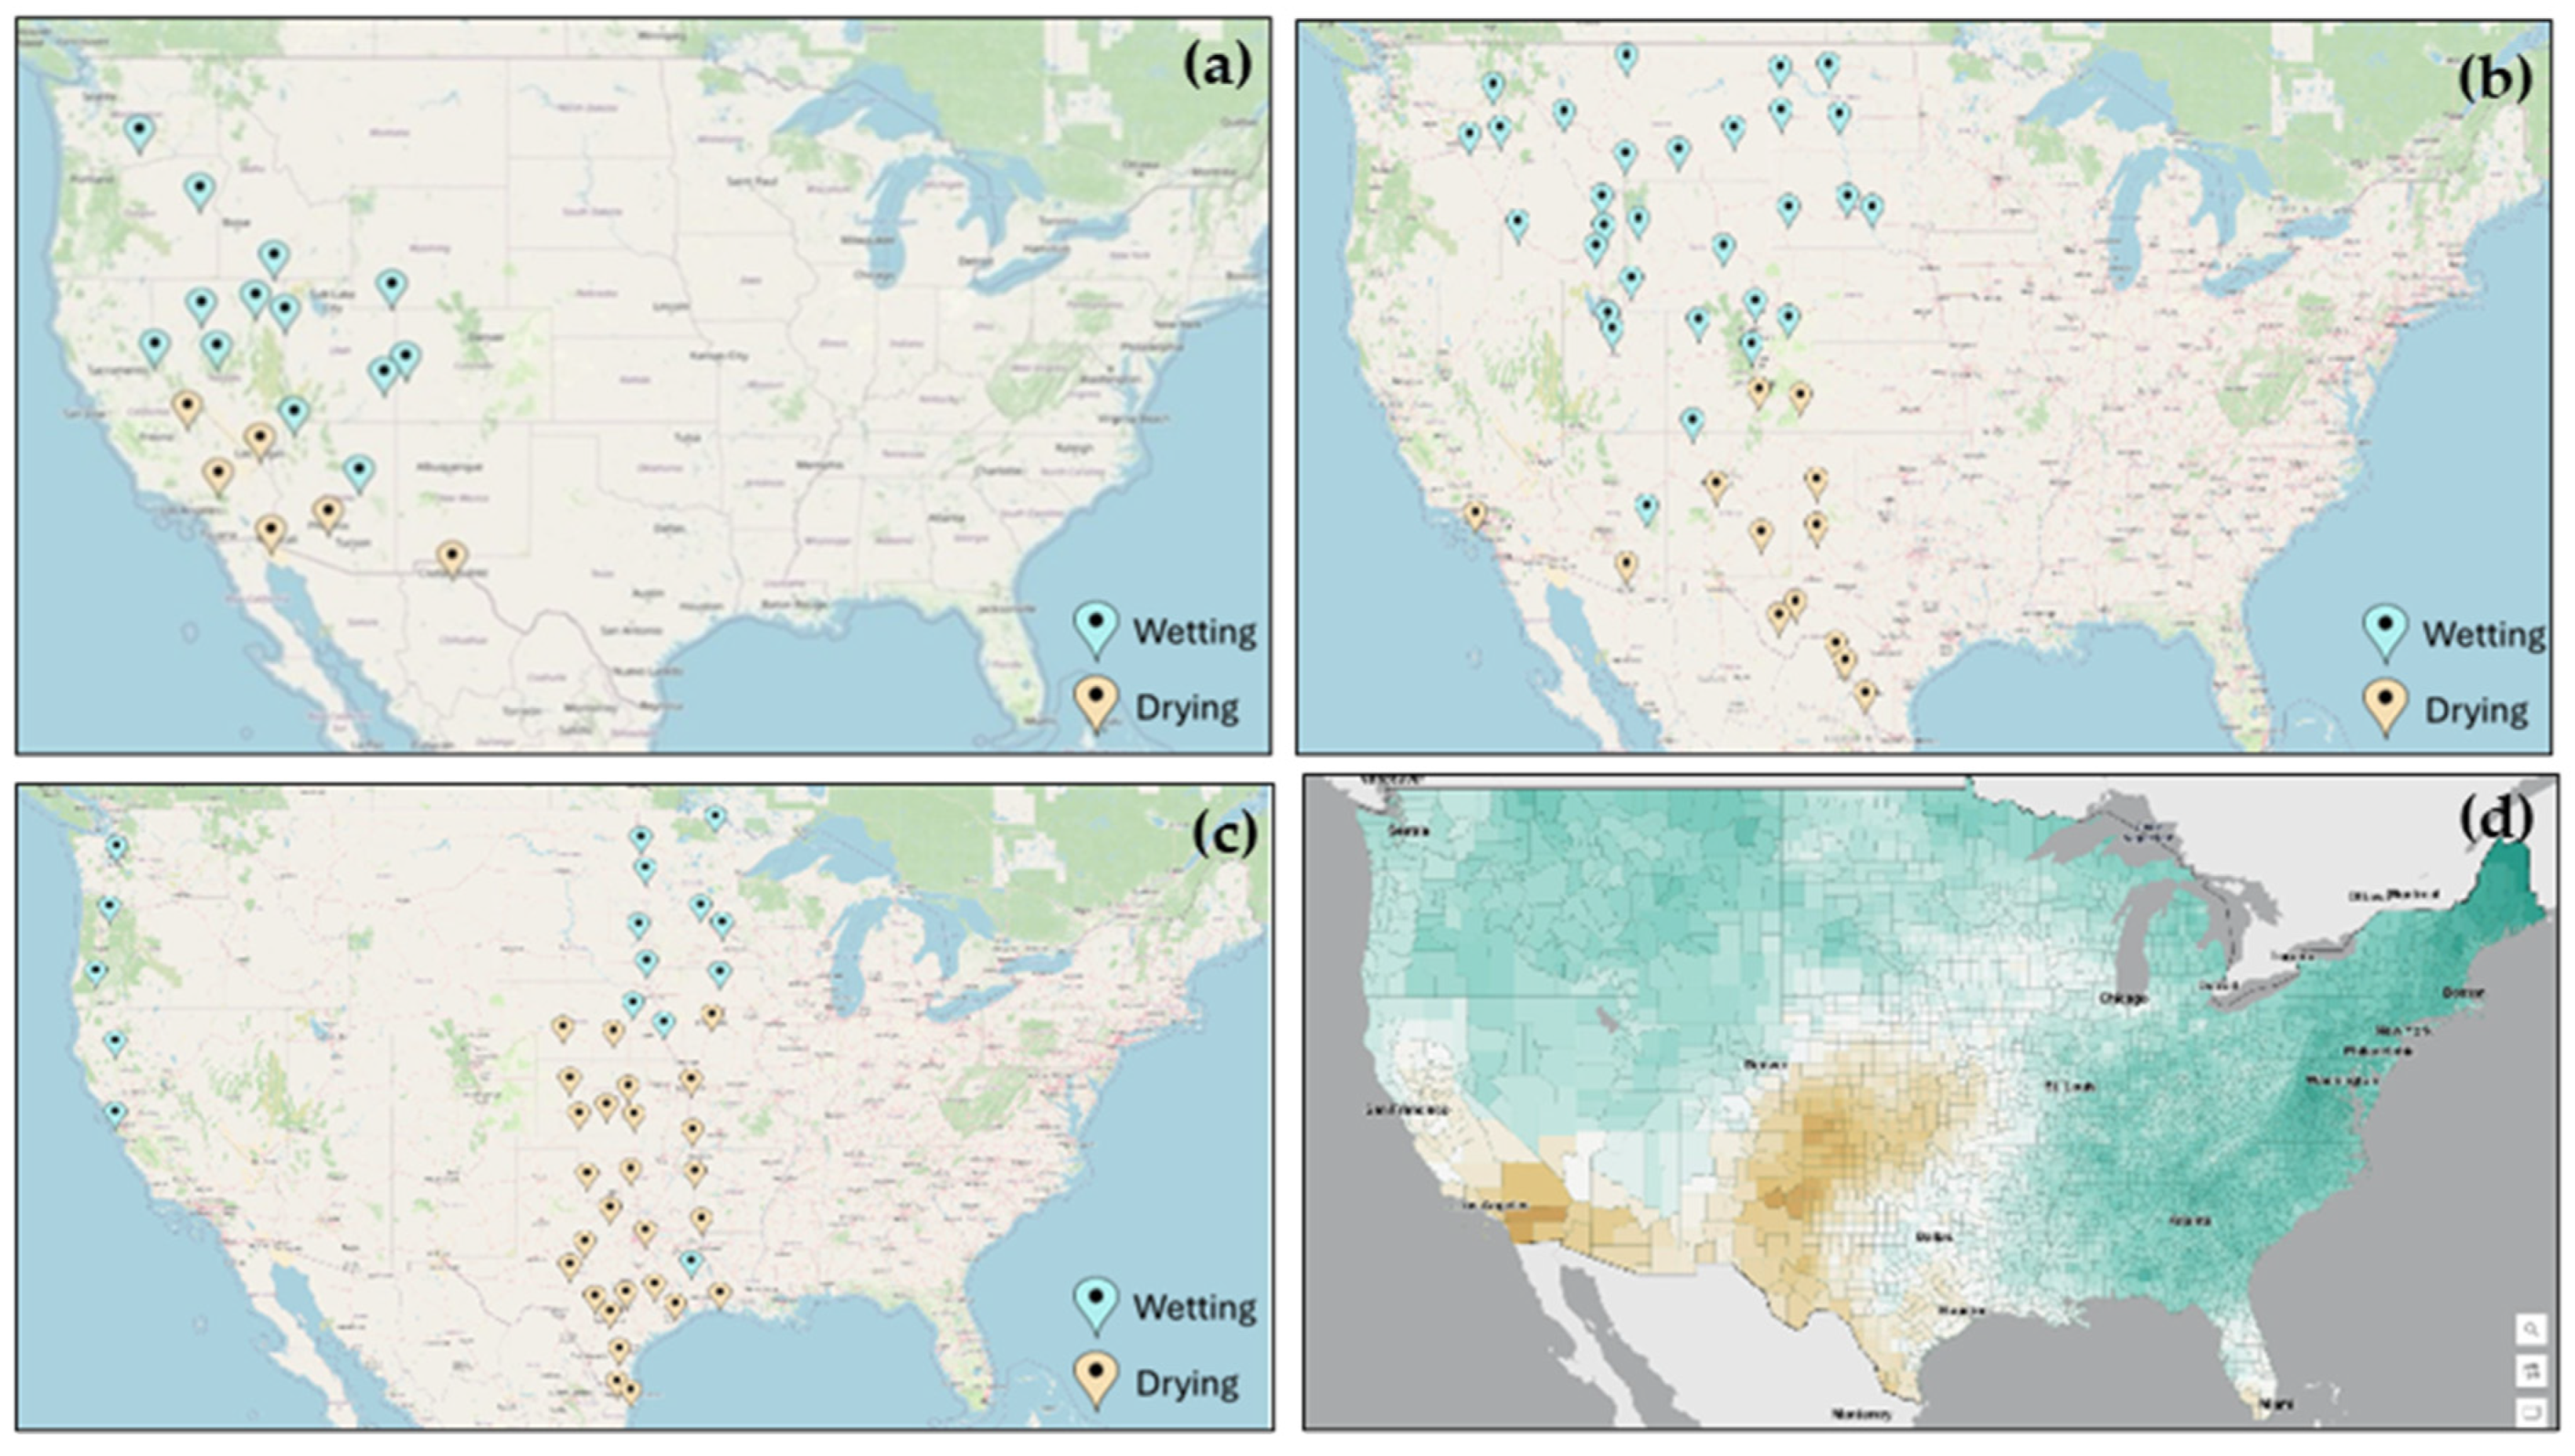
Observed trends (Figure 3a–c) and climate model output from CMIP6 (Figure 3d) for wetting and drying are shown across the United States. The top three panels show the majority of arid, semi-arid, and non-arid stations with wetting and drying trends, respectively, as specified by station markers. The bottom right (Figure 3d) panel displays the CMIP6 climate model output, emphasizing regions projected to experience increased precipitation (wetting, in green) and reduced precipitation (drying, in brown). Further, the figure illustrates the potential impacts of a 2 °C rise in temperature on precipitation patterns, indicating areas that may experience significant changes in wetting and drying trends.
Figure 3.
CMIP6 Precipitation trends for a 2 °C rise above the preindustrial average, showing drier and wetter trends: (a) arid station, (b) semi-arid, (c) non-arid stations, (d) spatial pattern of rainfall (lime and teal show drier and wetter trends).
Arid stations: The first panel (Figure 3a) shows the observed trends in precipitation (a meridional gradient) for arid stations. These stations are marked on the map, indicating areas that have experienced changes in precipitation over the observed period. The trends are categorized into wetting and drying, with markers indicating whether the station has seen an increase or decrease in precipitation. Semi-arid stations, the second panel (Figure 3b) displays the observed trends for semi-arid stations. Similar to the arid stations, these markers reveal whether the stations have experienced wetting or drying trends. Non-Arid Stations: The third panel shows the observed trends for non-arid stations. These markers help to compare the changes in precipitation for regions that are not classified as arid or semi-arid.
This panel presents the CMIP6 climate model projections for precipitation changes under a 2 °C rise in global temperatures (Figure 3d). The map emphasizes regions projected to experience wetting (in green) and drying (in brown).
Wetting regions: Areas projected to see an increase in precipitation are shown in shades of green. The intensity of the green color represents the extent of the wetting trend, with darker shades indicating more significant increases in rainfall.
Drying regions: Areas projected to experience a decrease in precipitation are depicted in shades of brown. The intensity of the brown color represents the severity of the drying trend, with darker shades indicating more substantial reductions in rainfall. These drying patterns (brown regions) coexist with projected wetting trends elsewhere, creating a sharp hydrological divide that correlates strongly with existing climate zones.
Regional variability: The figure highlights the variability in precipitation changes across different regions and climate classifications. Some areas are projected to experience significant wetting trends, while others may face dry conditions.
Impact on arid and semi-arid regions: The observed and projected trends provide insights into how arid and semi-arid regions may be affected by a 2 °C rise in temperatures. We cannot assess regional change but understanding how precipitation at a limited number of stations may change gives us a sense of how the arid region of the U.S. may change.
Climate adaptation: The insights gained from this figure are essential for informing climate adaptation strategies. Policymakers and stakeholders can use this information to develop targeted interventions to enhance resilience in vulnerable regions.
Overall, Figure 3 provides a comprehensive overview of the observed and projected changes in precipitation for arid, semi-arid, and non-arid regions under a 2 °C rise in global temperatures. These insights are crucial for understanding the potential impacts of climate change and for developing effective adaptation strategies.
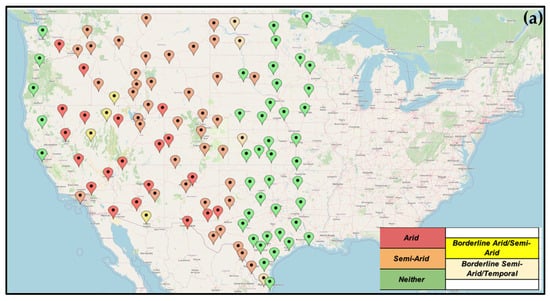
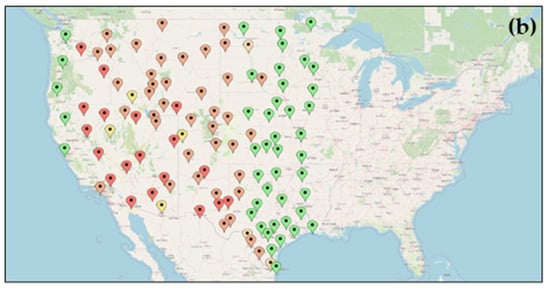
This map visualizes climate classifications across various locations in the United States (Figure 4). It categorizes regions as “Arid” (red), “Semi-Arid” (orange), “Borderline Arid/Semi-Arid” (yellow), “Borderline Semi-Arid” (light green), or “Neither” (dark green), helping to imply levels of aridity and semi-aridity throughout the country. The U.S. Drought Monitor classifies drought severity into five categories, D0 (abnormally dry) through D4 (exceptional drought), based on hydrological and agricultural impact thresholds [10]. The distribution shows more arid and semi-arid conditions predominantly in the western and central U.S., with fewer such classifications in the eastern regions.
Figure 4.
CMIP6 precipitation changes for aridity with detailed categories over selected stations for (a) 2 deg. C. rise, (b) 4 deg. C rise. (b) has the same legend as (a).
Western and Central United States: The map shows a high concentration of red and orange markers in these regions, indicating prevalent arid and semi-arid conditions. This aligns with known climatic patterns where these areas experience lower precipitation and higher evapotranspiration rates. More than 300 weeks were reported as the drought over Nevada, Arizona, and a few areas in Texas and Wyoming.
Eastern United States: This region is predominantly marked with dark green markers, indicating non-arid conditions with higher annual precipitation. The eastern part of the country generally benefits from more consistent and abundant rainfall, supporting a wider range of agricultural and ecological activities.
Transitional zones: The yellow and light green markers highlight transitional zones where the climate fluctuates between arid, semi-arid, and temperate conditions, where precipitation is the boundary in these categories. These areas are particularly important for understanding the impacts of climate variability and for developing adaptive strategies. These transitional zones represent critical hydrological thresholds where small precipitation changes can disproportionately impact water availability, making their classification vital for adaptive management.
Overall, Figure 4 provides a comprehensive overview of the spatial distribution of aridity and semi-aridity across the United States. These insights are crucial for understanding regional vulnerabilities to drought and for developing effective water management and climate adaptation strategies.
Figure 4 presents the projected changes in precipitation for arid and semi-arid regions in the United States under a scenario of a 2 °C and 4 °C rise in global temperature. The projections are based on the CMIP6 climate model outputs, which provide insights into future climate conditions.
The figure highlights regions likely to undergo substantial changes in precipitation patterns, categorized into regions of “Drying” and “Wetting”:
Drying regions: These areas are shown in shades of brown, indicating a projected decrease in precipitation. The intensity of the brown color represents the severity of the drying trend, with darker shades indicating more substantial reductions in rainfall. These regions are primarily located in the western and central parts of the United States, which are already prone to arid and semi-arid conditions.
Wetting regions: These areas are depicted in shades of teal, indicating a projected increase in precipitation. The intensity of the teal color represents the extent of the wetting trend, with darker shades indicating more significant increases in rainfall. These regions are scattered across various parts of the country, proposing that some areas currently experiencing arid or semi-arid conditions may see an increase in precipitation under future climate scenarios.
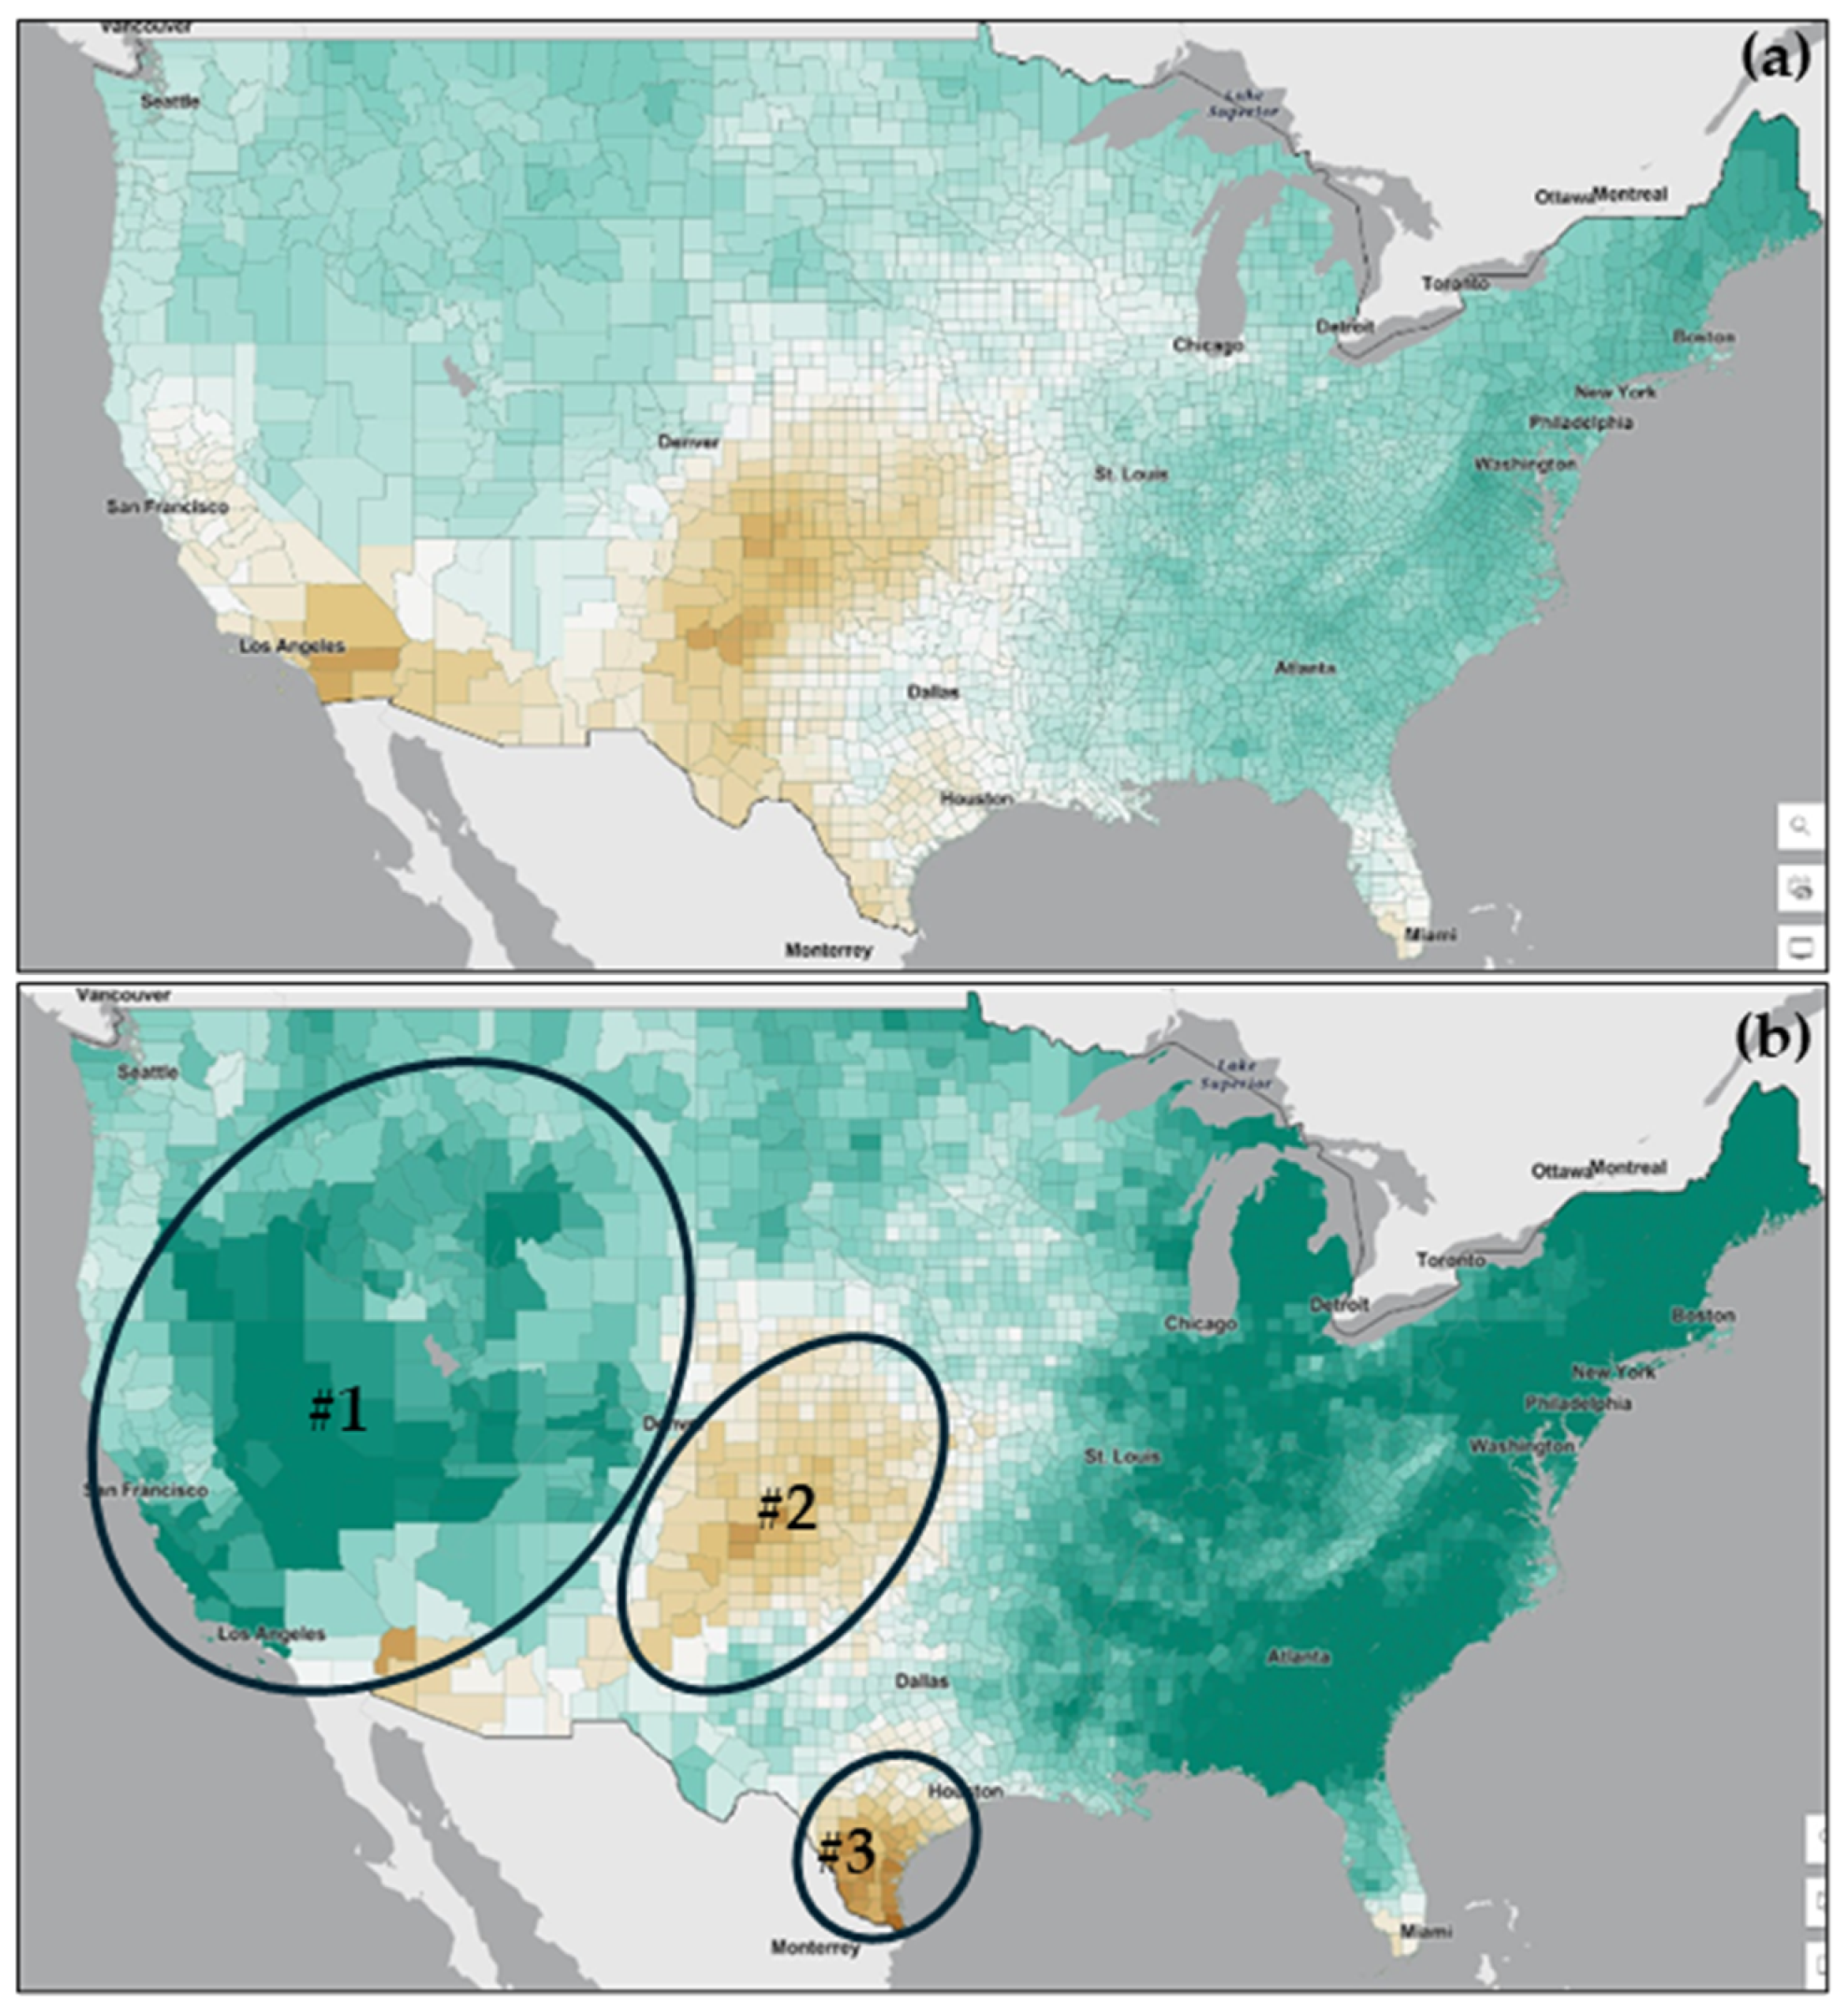
The figure also identifies three specific zones of interest, labeled as #1, #2, and #3 (Figure 5a). These zones are circled and highlighted to remind of areas where significant changes in precipitation are expected. These zones are critical for further analysis and monitoring, as they represent regions where the impacts of climate change on precipitation patterns could be most pronounced. A comparison of model projections’ aridity from a 2 °C rise in global temperature (Figure 4a) to 4 °C (Figure 4 is enhanced over Texas, Nevada, Colorado, Utah, Arizona and North Dakota regions.
Figure 5.
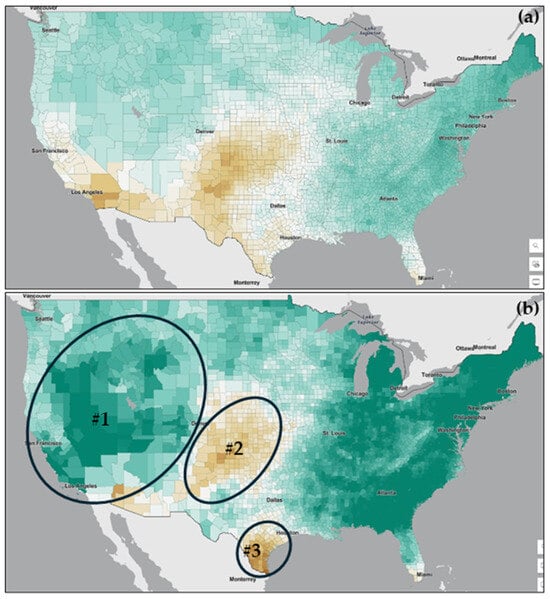
CMIP6 Precipitation changes for arid and semi-arid stations for (a) 2 deg. C rise, (b) 4 deg. C. rise. Lime and teal in the figure represent drier and wetter trends, respectively.
Overall, Figure 5 provides a visual representation of how a 2 °C rise in global temperatures could alter precipitation patterns across arid and semi-arid regions in the United States. The insights gained from this figure are essential for developing adaptive strategies to manage future climate variability and its impacts on water resources, agriculture, and ecosystem stability in these vulnerable regions.
This image shows a CMIP6 climate model output that maps projected precipitation changes for the U.S. with a 2 °C rise in temperature (Figure 5). It highlights areas of “Drying” (in shades of brown) and “Wetting” (in shades of teal) under future climate scenarios. Three specific regions are circled and labeled as #1, #2, and #3, indicating zones of interest where significant changes in precipitation are expected (Figure 5b). Under 4 °C warming, the Southwest and Southern Plains show high confidence (>80% model agreement) for increased drought frequency, even where precipitation changes are uncertain [13].
CMIP6 models show considerable spread in precipitation projections, especially in arid/semi-arid regions, due to differences in parameterizations of convection, land-atmosphere feedback, and ocean-atmosphere coupling [14,15]. This figure presents a CMIP6 climate model output that maps projected precipitation changes across the United States under a scenario of a 2 °C rise in global temperatures (Figure 5a). The map highlights areas expected to experience significant changes in precipitation patterns, categorized into regions of “Drying” and “Wetting”. For the U.S. Southwest and Great Plains, the sign of precipitation changes (wetting vs. drying) under 2 °C warming varies across models, though drying trends dominate in multi-model means [16].
Drying regions: These areas are shown in shades of brown, indicating a projected decrease in precipitation. The intensity of the brown color represents the severity of the drying trend, with darker shades indicating more substantial reductions in rainfall. These drying regions are primarily located in the western and central parts of the United States, which are already prone to arid and semi-arid conditions. This suggests that these areas may face increased water scarcity and heightened drought risk under future climate scenarios.
Wetting regions: These areas are depicted in shades of teal, indicating a projected increase in precipitation. The intensity of the teal color represents the extent of the wetting trend, with darker shades indicating more significant increases in rainfall. These wetting regions are scattered across various parts of the country, advising that some areas currently experiencing arid or semi-arid conditions may see an increase in precipitation under future climate scenarios. This could potentially alleviate some drought conditions but may also lead to other challenges, such as flooding or changes in water management needs.
Figure 5b also identifies three specific zones of interest, labeled as #1, #2, and #3. These zones are circled and highlighted to reveal areas where significant changes in precipitation are expected:
- Zone #1: This area is projected to experience notable drying trends, which could exacerbate existing water scarcity issues and increase the frequency and severity of droughts.
- Zone #2: This region is expected to see significant wetting trends, which may lead to increased water availability but could also pose challenges related to water management and flood risk.
- Zone #3: This area is projected to undergo substantial changes in precipitation patterns, with potential implications for both drying and wetting trends, depending on local conditions and climate variability.
Overall, Figure 5 provides a visual representation of how a 2 °C and 4 °C rise in global temperatures could alter precipitation patterns across arid and semi-arid regions in the United States. The insights gained from this figure are essential for developing adaptive strategies to manage future climate variability and its impacts on water resources, agriculture, and ecosystem stability in these vulnerable regions. Over a county-level model projection’s aridity from a 2 °C rise in global temperature (Figure 5a) to 4 °C (Figure 5b) is increased over Texas, Oklahoma, Kansas, California, Nevada, Florida and many Midwest regions of the USA.
4. Discussion
The mapping of aridity and semi-aridity across the United States, based on 30 years of mean precipitation data, provides valuable insights into the spatial distribution and temporal dynamics of these climatic conditions. The classification of weather stations into arid, semi-arid, and non-arid categories reveals significant regional disparities, with arid and semi-arid conditions predominantly found in the western and central parts of the country. This distribution aligns with previous studies that have identified these regions as particularly vulnerable to drought due to their low precipitation and high evapotranspiration rates [1,12,17,18].
The analysis of drought conditions from 2000 to 2019 highlights the persistent and severe nature of droughts in certain regions. The finding that some areas experienced drought conditions for more than 50% of the time and endured over 300 weeks of severe drought (D3 or higher) underscores the critical need for effective drought management and mitigation strategies. These results are consistent with the U.S. Drought Monitor’s assessments, which have documented the increasing frequency and severity of droughts in these regions.
The long-term precipitation trends in Texas from 1920 to 2020 indicate a slight increase in annual rainfall, suggesting potential shifts in regional climate patterns. This trend may be influenced by various factors, including changes in atmospheric circulation patterns and increased moisture availability due to rising temperatures. However, the overall increase in precipitation does not necessarily translate to reduced drought risk, as the variability and intensity of rainfall also play crucial roles in determining drought conditions [19].
The climate model projections (CMIP6) for a 2 °C rise in temperature predict slight changes in precipitation patterns compared to 4 °C, with some regions expected to experience increased wetting while others face drying trends. These projections highlight the complex and heterogeneous nature of climate change impacts on precipitation. The identification of regions projected to experience significant changes in wetting and drying trends is crucial for developing adaptive strategies to manage future climate variability and its impacts on arid and semi-arid regions [14].
The findings of this study have important implications for water resource management, agricultural planning, and climate adaptation strategies. The identification of arid and semi-arid regions, along with the analysis of drought frequency and severity, provides a basis for targeted interventions to enhance resilience in these vulnerable areas. For instance, water conservation measures, drought-resistant crop varieties, and improved irrigation practices [12] can help mitigate the impacts of drought and ensure sustainable water use.
Future research should focus on refining these projections and exploring the socio-economic impacts of aridity and semi-aridity. Understanding the interactions between climatic, hydrological, and socio-economic factors is essential for developing comprehensive and effective drought management strategies [20]. Additionally, integrating remote sensing data [3] and advanced climate models can enhance the accuracy and resolution of aridity and drought assessments, providing more detailed and actionable information for policymakers and stakeholders.
This study enhances our understanding of the spatial and temporal dynamics of aridity and semi-aridity in the United States. The insights gained from this research on water scarcity [21] are crucial for developing targeted drought management and climate adaptation strategies, ensuring resilience in the face of changing climatic conditions.
5. Conclusions
The analysis covered the entire CONUS but focused on arid and drought-prone regions when examining projected changes in precipitation and aridity. This study provides a detailed spatial and temporal analysis of aridity and semi-aridity across drought-prone regions of the United States, utilizing 30 years of mean precipitation data (1991–2020). The classification of weather stations into arid, semi-arid, and non-arid categories reveals significant regional disparities. Such properties of arid and semi-arid conditions are predominantly found in the western and central parts of the country. These findings underscore the vulnerability of these regions to drought, highlighting the need for targeted water management and conservation strategies.
The analysis of drought conditions from 2000 to 2019 indicates that certain areas experienced prolonged and severe droughts, with some regions facing drought conditions for more than 50% of the time and enduring over 300 weeks of severe drought (D3 or higher). This persistent drought exposure emphasizes the critical need for effective drought mitigation and adaptation measures to enhance resilience in these regions.
Long-term precipitation trends in Texas from 1920 to 2020 show a slight increase in annual rainfall, suggesting potential shifts in regional climate patterns. Climate model projections (CMIP6) for a 2 °C rise in temperature predict slight changes in precipitation patterns, with some regions expected to experience increased wetting while others face drying trends. With a 4 °C temperature rise, a few stations showed increased aridity, shifting from “neither” to semi-arid, or from semi-arid to arid. These projections highlight the importance of adaptive strategies to manage future climate variability and their impact on arid and semi-arid regions.
The following are the limitations of this research work. First, uncertainty in mean precipitation estimates was not quantified; future work should include error propagation and significance testing. Second, the analysis was limited to a subset of stations, potentially reducing spatial representativeness and missing localized aridity transitions. Gridded datasets could improve spatial coverage. Third, aridity was defined by using a single metric; multiple indices would provide more robust results. Finally, inherent climate model uncertainties, including variability, structural differences, and scenario assumptions, highlight the need for ensemble-based, multi-metric approaches in future assessments. Another key limitation of this study is that aridity classification relies on annual precipitation totals alone. Standard indices such as the UNEP Aridity Index (AI = P/PET; arid: AI < 0.20; semi-arid: 0.20–0.50) and the Budyko dryness ratio incorporate potential evapotranspiration and thus capture the energy balance side of water availability. In warm, high-insolation environments such as the Sonoran Desert or the Southern Plains, precipitation-only thresholds tend to underestimate aridity because high temperatures amplify evaporative demand. Future work should replicate this classification using gridded PET products (e.g., MODIS ET, GLEAM, or ERA5 Penman-Monteith PET) to quantify the sensitivity of the aridity boundaries to the chosen metric.
Overall, this research enhances our understanding of the spatial distribution and temporal dynamics of aridity and semi-aridity in the United States. The insights gained from this study are crucial for developing targeted drought management and climate adaptation strategies, ensuring resilience in the face of changing climatic conditions. Future research should focus on refining these projections and exploring the socio-economic impacts of aridity and semi-aridity to inform comprehensive policymaking. We acknowledge that 111 stations may not fully capture the orographic complexity of the western U.S.; future analyses should consider gridded products (PRISM, nClimGrid, Daymet) to address this limitation.
Supplementary Materials
The following supporting information can be downloaded at https://www.mdpi.com/article/10.3390/w18070873/s1. Table S1: List of all the stations (Pins) and their characteristics included in the research work.
Author Contributions
Conceptualization, M.E., M.H. and V.K.; methodology, M.E. and M.H.; software, M.E. and M.H.; validation, M.E., M.H., and V.K.; formal analysis, M.E. and M.H.; investigation, M.H.; resources, M.H. and V.K.; data curation, M.E. and M.H.; writing—original draft preparation, V.K.; writing—review and editing, V.K., M.E. and M.H.; visualization, M.E.; supervision, V.K.; project administration, V.K. and M.H.; funding acquisition, V.K. All authors have read and agreed to the published version of the manuscript.
Funding
This research received no external funding.
Data Availability Statement
The data presented in this study are openly available in XMACIS II at https://xmacis.rcc-acis.org/.
Acknowledgments
We acknowledge UIW and NOAA.
Conflicts of Interest
The authors declare no conflicts of interest. The scientific results and conclusions, as well as any views or opinions expressed herein, are those of the authors and do not necessarily reflect the views of NWS, NOAA, or the Department of Commerce.
Abbreviations
The following abbreviations are used in this manuscript:
| CMIP6 | Coupled Model Intercomparison Project phase 6 |
| UNEP | United Nations Environment Programme |
| IPCC | Intergovernmental Panel on Climate Change |
References
- Maliva, R.; Missimer, T. Aridity and Drought. In Arid Lands Water Evaluation and Management; Maliva, R., Missimer, T., Eds.; Springer: Berlin/Heidelberg, Germany, 2012; pp. 21–39. [Google Scholar]
- Cook, B.I.; Mankin, J.S.; Anchukaitis, K.J. Climate change and aridification. Climate Change and Drought: From Past to Future. Curr. Clim. Change Rep. 2018, 4, 164–179. [Google Scholar] [CrossRef] [Scilit]
- AghaKouchak, A.; Farahmand, A.F.; Melton, F.S.; Teixeira, J.; Anderson, M.C.; Wardlow, B.D.; Hain, C.R. Remote sensing of drought: Progress, challenges, and opportunities. Rev. Geophys. 2015, 53, 452–480. [Google Scholar] [CrossRef] [Scilit]
- Kimura, R.; Moriyama, M. Recent Trends of Annual Aridity Indices and Classification of Arid Regions with Satellite-Based Aridity Indices. Remote Sens. Earth Syst. Sci. 2019, 2, 88–95. [Google Scholar] [CrossRef] [Scilit]
- California Department of Water Resources. California’s Most Significant Droughts: Comparing Historical and Recent Conditions. 2021. Available online: https://cawaterlibrary.net/document/californias-most-significant-droughts-comparing-historical-and-recent-conditions-2/ (accessed on 30 March 2026).
- Worster, D. Dust Bowl: The Southern Plains in the 1930s; Oxford University Press: Oxford, UK, 2004. [Google Scholar]
- Hao, Z.; AghaKouchak, A.; Nakhjiri, N.; Farahmand, A. Global Integrated Drought Monitoring and Prediction System. Sci. Data 2014, 1, 140001. [Google Scholar] [CrossRef] [Scilit]
- U.S. Drought Monitor. Drought Classification and Indicators. 2023. Available online: https://www.drought.gov/ (accessed on 30 March 2026).
- Kimura, R.; Moriyama, M. Determination by MODIS satellite-based methods of recent global trends in land surface aridity and degradation. J. Agric. Meteorol. 2019, 75, 153–159. [Google Scholar] [CrossRef] [Scilit]
- United Nations Environment Program (UNEP). World Atlas of Desertification. 1997. Available online: https://digitallibrary.un.org/record/245955?ln=en (accessed on 30 March 2026).
- Azizi, S.; Azizi, T. Classification of drought severity in contiguous USA during the past 21 years using fractal geometry. EURASIP J. Adv. Signal Process. 2024, 2024, 3. [Google Scholar] [CrossRef] [Scilit]
- Cook, B.I.; Ault, T.R.; Smerdon, J.E. Unprecedented 21st-century drought risk in the American Southwest and Central Plains. Sci. Adv. 2015, 1, e1400082. [Google Scholar] [CrossRef] [Scilit] [PubMed]
- Pierce, D.W.; Cayan, D.R.; Feldman, D.R.; Risser, M.D. Future Increases in North American Extreme Precipitation in CMIP6 Downscaled with LOCA. J. Hydrometeor. 2023, 24, 951–975. [Google Scholar] [CrossRef] [Scilit]
- Wilhite, D.A.; Glantz, M.H. Understanding the Drought Phenomenon: The Role of Definitions. Water Int. 1985, 10, 111–120. Available online: http://digitalcommons.unl.edu/droughtfacpub/20 (accessed on 30 March 2026). [CrossRef] [Scilit]
- IPCC. Climate Change 2021: The Physical Science Basis. Contribution of Working Group I to the Sixth Assessment Report of the Intergovernmental Panel on Climate Change; Cambridge University Press: Cambridge, UK, 2021. [Google Scholar]
- Tebaldi, C.; Debeire, K.; Eyring, V.; Fischer, E.; Fyfe, J.; Friedlingstein, P.; Knutti, R.; Lowe, J.; O’Neill, B.; Sanderson, B.; et al. Climate model projections from the Scenario Model Intercomparison Project (ScenarioMIP) of CMIP6. Earth Sys. Dyn. 2021, 12, 253–293. [Google Scholar] [CrossRef] [Scilit]
- Seager, R.; Vecchi, G.A. Greenhouse warming and the 21st century hydroclimate of southwestern North America. Proc. Natl. Acad. Sci. USA 2010, 107, 21277–21282. [Google Scholar] [CrossRef] [Scilit] [PubMed]
- Trenberth, K.E.; Dai, A.; van der Schrier, G.; Jones, P.D.; Barichivich, J.; Briffa, K.R.; Sheffield, J. Global warming and changes in drought. Nat. Clim. Change 2014, 4, 17–22. [Google Scholar] [CrossRef] [Scilit]
- Gleick, P.H. Global freshwater resources: Soft-path solutions for the 21st century. Science 2003, 302, 1524–1528. [Google Scholar] [CrossRef] [Scilit] [PubMed]
- Huang, J.; Yu, H.; Guan, X.; Wang, G.; Guo, R. Accelerated dryland expansion under climate change. Nat. Clim. Change 2020, 6, 166–171. [Google Scholar] [CrossRef] [Scilit]
- Vörösmarty, C.J.; Green, P.; Salisbury, J.; Lammers, R.B. Global water resources: Vulnerability from climate change and population growth. Science 2000, 289, 284–288. [Google Scholar] [CrossRef] [Scilit] [PubMed]

Disclaimer/Publisher’s Note: The statements, opinions and data contained in all publications are solely those of the individual author(s) and contributor(s) and not of MDPI and/or the editor(s). MDPI and/or the editor(s) disclaim responsibility for any injury to people or property resulting from any ideas, methods, instructions or products referred to in the content. |
© 2026 by the authors. Licensee MDPI, Basel, Switzerland. This article is an open access article distributed under the terms and conditions of the Creative Commons Attribution (CC BY) license.