


Abstract
As urbanization expands, the loss of pervious surfaces has led to greater stormwater runoff and contributed to an increase in urban flooding—localized flooding in areas not formally designated as flood zones. This study evaluates the potential of decentralized active rainwater harvesting (RWH) to mitigate urban flooding in semi-arid urban environments. A neighborhood in northeast El Paso, Texas, was selected as a pilot site. Using a GIS-HEC-HMS modeling framework, approximately 9000 residential parcels were analyzed to assess rooftop harvesting capacity, runoff potential, and system feasibility under different adoption rates and antecedent moisture conditions. Land cover and building footprints were extracted using supervised machine learning to generate stormwater runoff parameters and catchment areas for rainfall-runoff simulations for storms with return periods ranging from 1 to 50 years. The results indicate that for 1- and 2-year storms, a 25% adoption rate may reduce street runoff by 16–19% from 13.1 to 10.6 × 10³ m3 and from 31 to 26.1 × 10³ m3. Increasing adoption to 50% yields substantially greater reductions of approximately 30–36%. Even higher-magnitude storms (5- and 10-year events) experience measurable decreases in runoff volume, with reductions of 10% for the 5-year storms and up to 10.4% for the 10-year storm at the 25% adoption and 20–22% across the same events at 50% adoption. Overall, the results of this study demonstrate that GIS and HEC-HMS are effective tools for evaluating urban flood mitigation strategies, and that decentralized RWH offers a viable method for reducing flood risk in urbanized settings when adoption levels and storage capacities are considered.
1. Introduction
Stormwater becomes a concern when existing infrastructure reaches capacity, and excess runoff accumulates on streets in low-lying areas. Highly urbanized areas, such as residential neighborhoods, often experience high runoff during rainfall events due to impervious surfaces, including rooftops, paved areas, and streets. To prevent downstream areas from flooding, storage facilities such as detention ponds, wet ponds, and infiltration basins have been constructed off-site to reduce peak discharge rates [1].
Urban flooding refers to rapid-onset flooding that causes public inconvenience by overwhelming existing storm infrastructure, such as storm drains, resulting in traffic disruptions and road closures. Heavy rainfall over a short period is enough to flood intersections, even in non-designated flood-risk areas. In contrast to extreme flood events, urban flooding disrupts daily activities and, in some cases, causes only minor property damage. Based on a wide range of literature spanning hydrology, transportation, and safety impacts, Moftakhari [2] defines urban flooding as flooding greater than 3 cm but less than 10 cm. This depth range has since been adopted in subsequent studies examining nuisance flooding and shallow urban ponding across different contexts [3,4]. In this study, we adopt the term urban flooding to describe rainfall-generated overland flow and ponding in urban areas before runoff enters the drainage system [5]. While some literature applies “nuisance flooding” more broadly [6] this manuscript uses “recurrent urban flooding” throughout to ensure clarity and consistency. The lack of severity associated with nuisance flooding leads to these events being overlooked, contributing to a limited understanding of their effects and cumulative societal costs [3]. Urban flooding, particularly in already developed areas, can be costly.
Green infrastructure (GI) is increasingly used to reduce flooding by promoting on-site water retention and infiltration. Standard GI methods include permeable pavements, green roofs, bioswales, and rain gardens [7]. Green roofs consist of a plant layer added to an existing roof, typically including a drainage layer, root barrier, and waterproof membrane [7]. Their capacity is limited to approximately 5 cm; any excess rainwater will overflow. Rain gardens, also known as bioretention areas, are shallow, landscaped depressions designed to capture and filter stormwater before it reaches stormwater infrastructure. They are ideally located near buildings to collect runoff from roofs and parking areas. These gardens are composed of porous media, with a growing medium that retains some water; however, their capacity to reduce urban flooding is limited [8]. Similarly, bioswales are excavated channels strategically placed to slow the infiltration of water into the subsoil. It is crucial to consider that green infrastructure strategies must be tailored to the local climate and site conditions, such as the arid and semi-arid conditions of the desert Southwest in the United States, where low rainfall, high evaporation, and poor soil conditions can limit their effectiveness and cost-efficiency. In the last few decades, implementing low-impact development (LID) practices, a subset of GI, at the site-level, has been used to reduce runoff by mimicking pre-development infiltration rates [9] which also reduces the cost of constructing downstream storage facilities [2]. EPA defines low-impact development as “systems and practices that use or mimic natural processes that result in the infiltration, evapotranspiration, or use of stormwater” [10]. LID principles include reducing impervious areas, intercepting stormwater before it reaches impervious surfaces, and detaining and infiltrating it on site [11].
To support effective flood control measures, we must first identify sites prone to urban flooding and assess their vulnerability based on location and site characteristics.
Rainwater harvesting (RWH) is an umbrella term for LID methods used to capture and utilize rainwater and includes two approaches: (1) active and (2) passive. Active RWH uses catchment areas, such as rooftops, where rainwater is conveyed by gutters to a storage tank. These systems enable storing water for later use in gardening, outdoor cleaning, and other domestic purposes. However, in some studies, the terminology differs: “passive” refers to small storage devices such as rain barrels, whereas “active” refers to larger tanks equipped with pumps or automated controls [12]. In this study, “passive” denotes landscape-based modifications (e.g., xeriscaping and infiltration basins), whereas “active” refers to rooftop-based tank storage [13,14]. This clarification ensures consistency in the terminology applied throughout this study (Table 1).
Table 1.
Comparison of rainwater harvesting (RWH) terminology used in this study and common alternatives.
Passive RWH includes practices such as xeriscaping, bioswales, and infiltration basins [15,16]. Active RWH, by contrast, relies on storage infrastructure to retain collected water for later outdoor use. Key design parameters include rainfall volume, roof catchment area, storage capacity, and water demand, whereas passive systems involve similar considerations but exclude storage tanks [14].
RWH serves as an alternative or complement to other GI practices, thereby mitigating urban flooding. For example, rooftop runoff can be conveyed and stored in above-ground tanks regardless of the roof slope [7] making active RWH a flexible strategy for addressing water scarcity while providing an alternative water source [17]. Over time, RWH has been used as an LID strategy to decrease urban runoff volumes [11]. The motivation behind LID is to reduce impervious surfaces through site drainage practices that treat stormwater as a resource rather than a nuisance. One such practice is the use of rain barrels to store water that would otherwise flow onto streets and affect built environments. While widespread adoption of RWH has the potential to reduce runoff, its effectiveness ultimately depends on residents’ use of the collected water.
RWH utilizes existing rooftop surfaces, which are often underused in urban water management, particularly in highly urbanized environments. In dense cities with limited available land, RWH serves as a viable stormwater management strategy because it does not compete with parking areas, sidewalks, or other critical urban infrastructure [18]. Other GI practices, such as permeable pavement and bioswales, are commonly used to manage stormwater; however, unlike these systems, RWH uniquely provides the additional benefit of storing captured rainfall for subsequent non-potable uses.
Reported runoff reduction rates for RWH are highly demand-dependent and vary with rainfall volume and storage capacity. Previous studies have documented RWH runoff reductions ranging from 18–57.7% [19]. In contrast, a study conducted in New York evaluated the hydrologic effects of multiple LID practices on runoff volume and peak flow mitigation have found that permeable pavement exhibited the greatest peak flow reduction among these practices [20]. The study included a controlled scenario incorporating three GI practices: RWH; permeable pavement; and bioretention, where the selection and spatial allocation of each practice within sub-watersheds were prescribed by the authors. However, based on previous studies the greatest runoff reduction rates are typically achieved through the combined implementation of multiple GI technologies, such as bioswales and permeable pavement, rather than through individual practices alone [5,20].
The objective of this study is to explore the use of GIS and HEC-HMS to assess the feasibility and effectiveness of active RWH systems in mitigating urban flooding within a neighborhood. Specifically, the study aims to evaluate the potential of decentralized RWH to reduce flood volumes in semi-arid cities like El Paso, Texas.
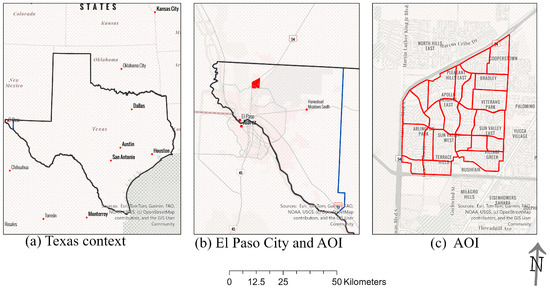
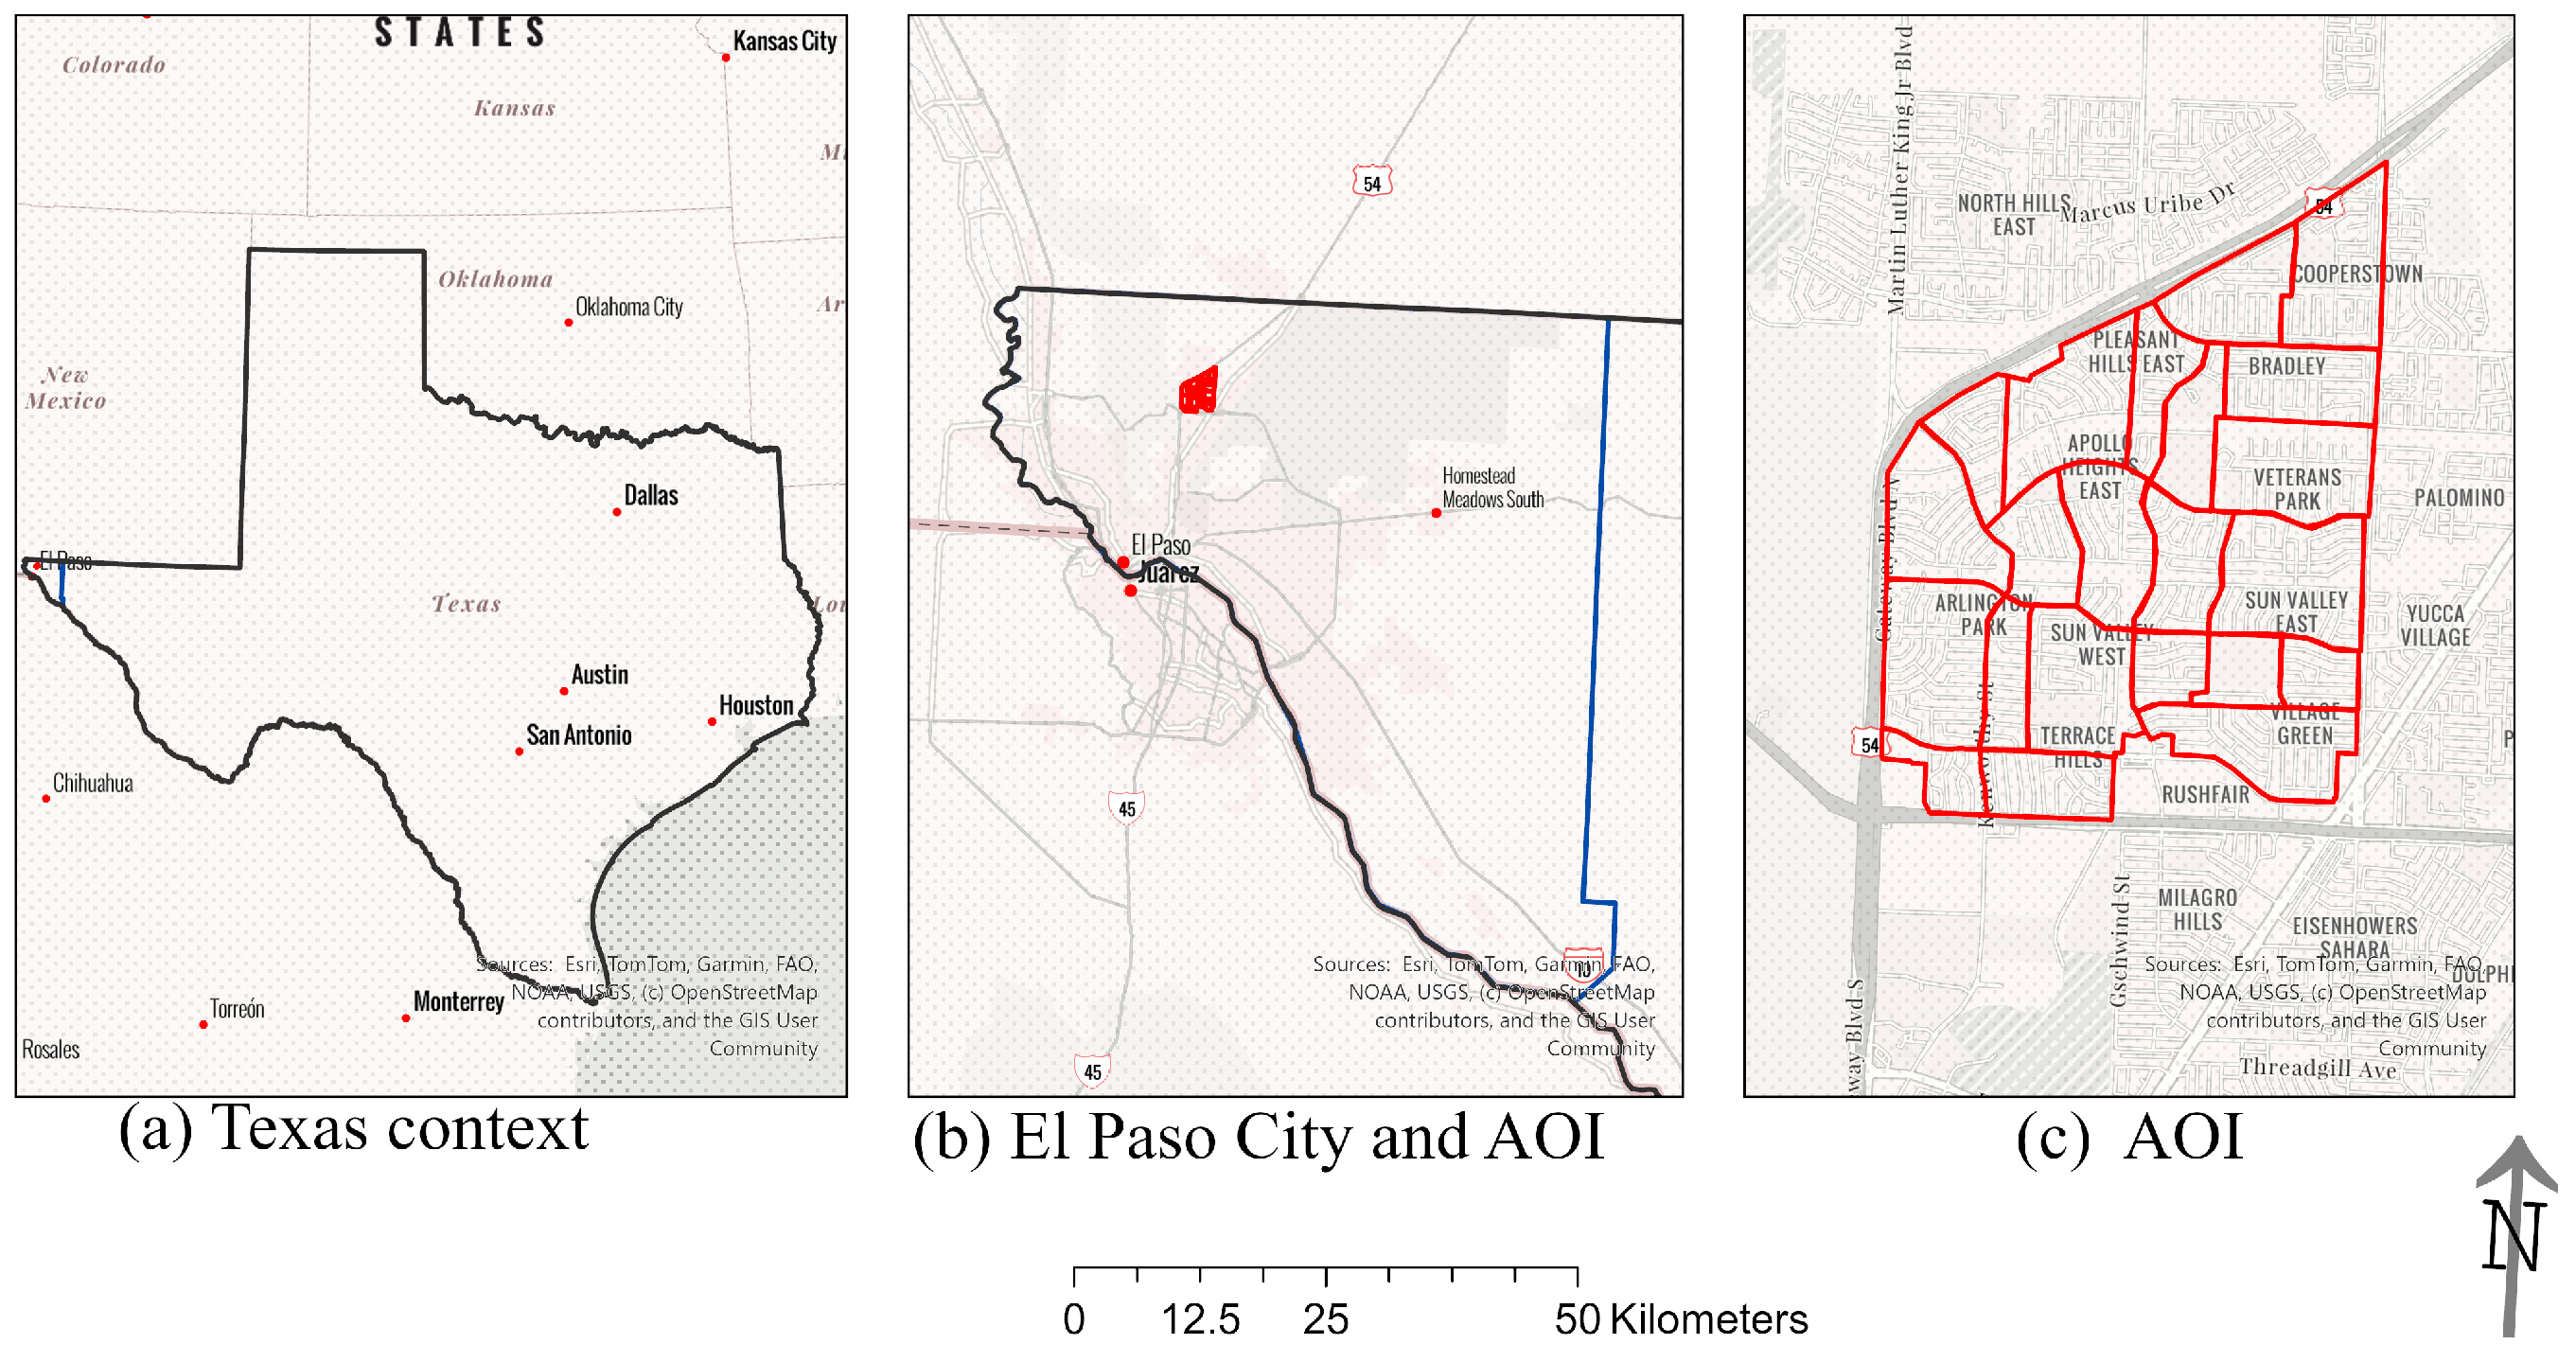
The area of interest (AOI) used as a pilot in this study is a neighborhood in the northeast region of El Paso, Texas (Figure 1). El Paso is considered a desert, characterized by high temperatures, and receiving an average annual precipitation of 22.86 cm with an average temperature of 67 °F. However, summer monsoons can bring heavy rain from June through September. Flooding from rainfall, occurring in both monsoon and non-monsoon seasons, threatens communities, especially in highly urbanized areas where impervious surfaces generate substantial runoff.
Figure 1.
Location of the study Area of Interest (AOI) in El Paso, Texas; (a) regional context situating El Paso within the state; major cities are shown as red dots; (b) city-scale view with the AOI outlined in red; and (c) detailed AOI viewused for hydrological and RWH analyses, with red lines indicating sub-basin boundaries.
These events can overwhelm existing stormwater infrastructure, leading to urban flooding that affects roadways, sidewalks, and residential properties. This specific neighborhood was selected as a pilot study because it represents the city’s typical residential characteristics, with high imperviousness. This study further investigates RWH as a potential strategy to mitigate stormwater volumes in semi-arid climates. Although RWH has often been explored in the context of water supply, few studies have explicitly evaluated its feasibility as a flood mitigation strategy. The methodology presented here integrates a GIS-based approach and HEC-HMS framework to assess the potential contribution of distributed households. In this study, flood mitigation is evaluated in terms of runoff volume reduction recognizing that translating these reductions to flood depths would require hydraulic modeling. The intent of this study is not to reproduce household-scale water-use behavior or inter-event tank dynamics but rather to develop a scalable GIS-based framework for assessing the potential flood-mitigation benefits of decentralized active RWH at neighborhood scale. Accordingly, the reported results represent an upper bound on runoff reduction under physically constrained storage, rather than a guarantee of performance across all storm-sequence scenarios.
2. Materials and Methods
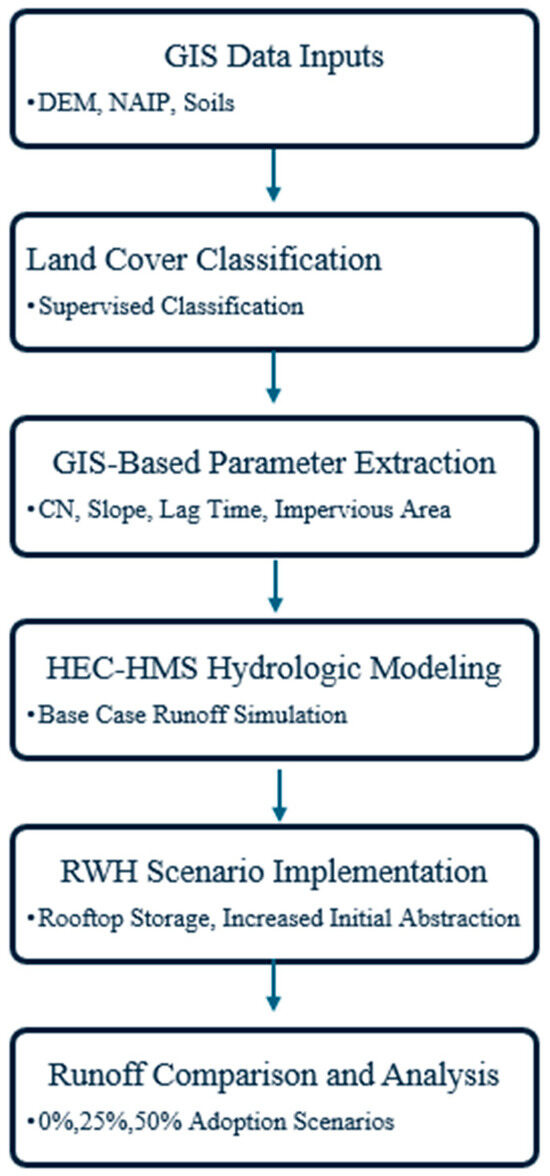
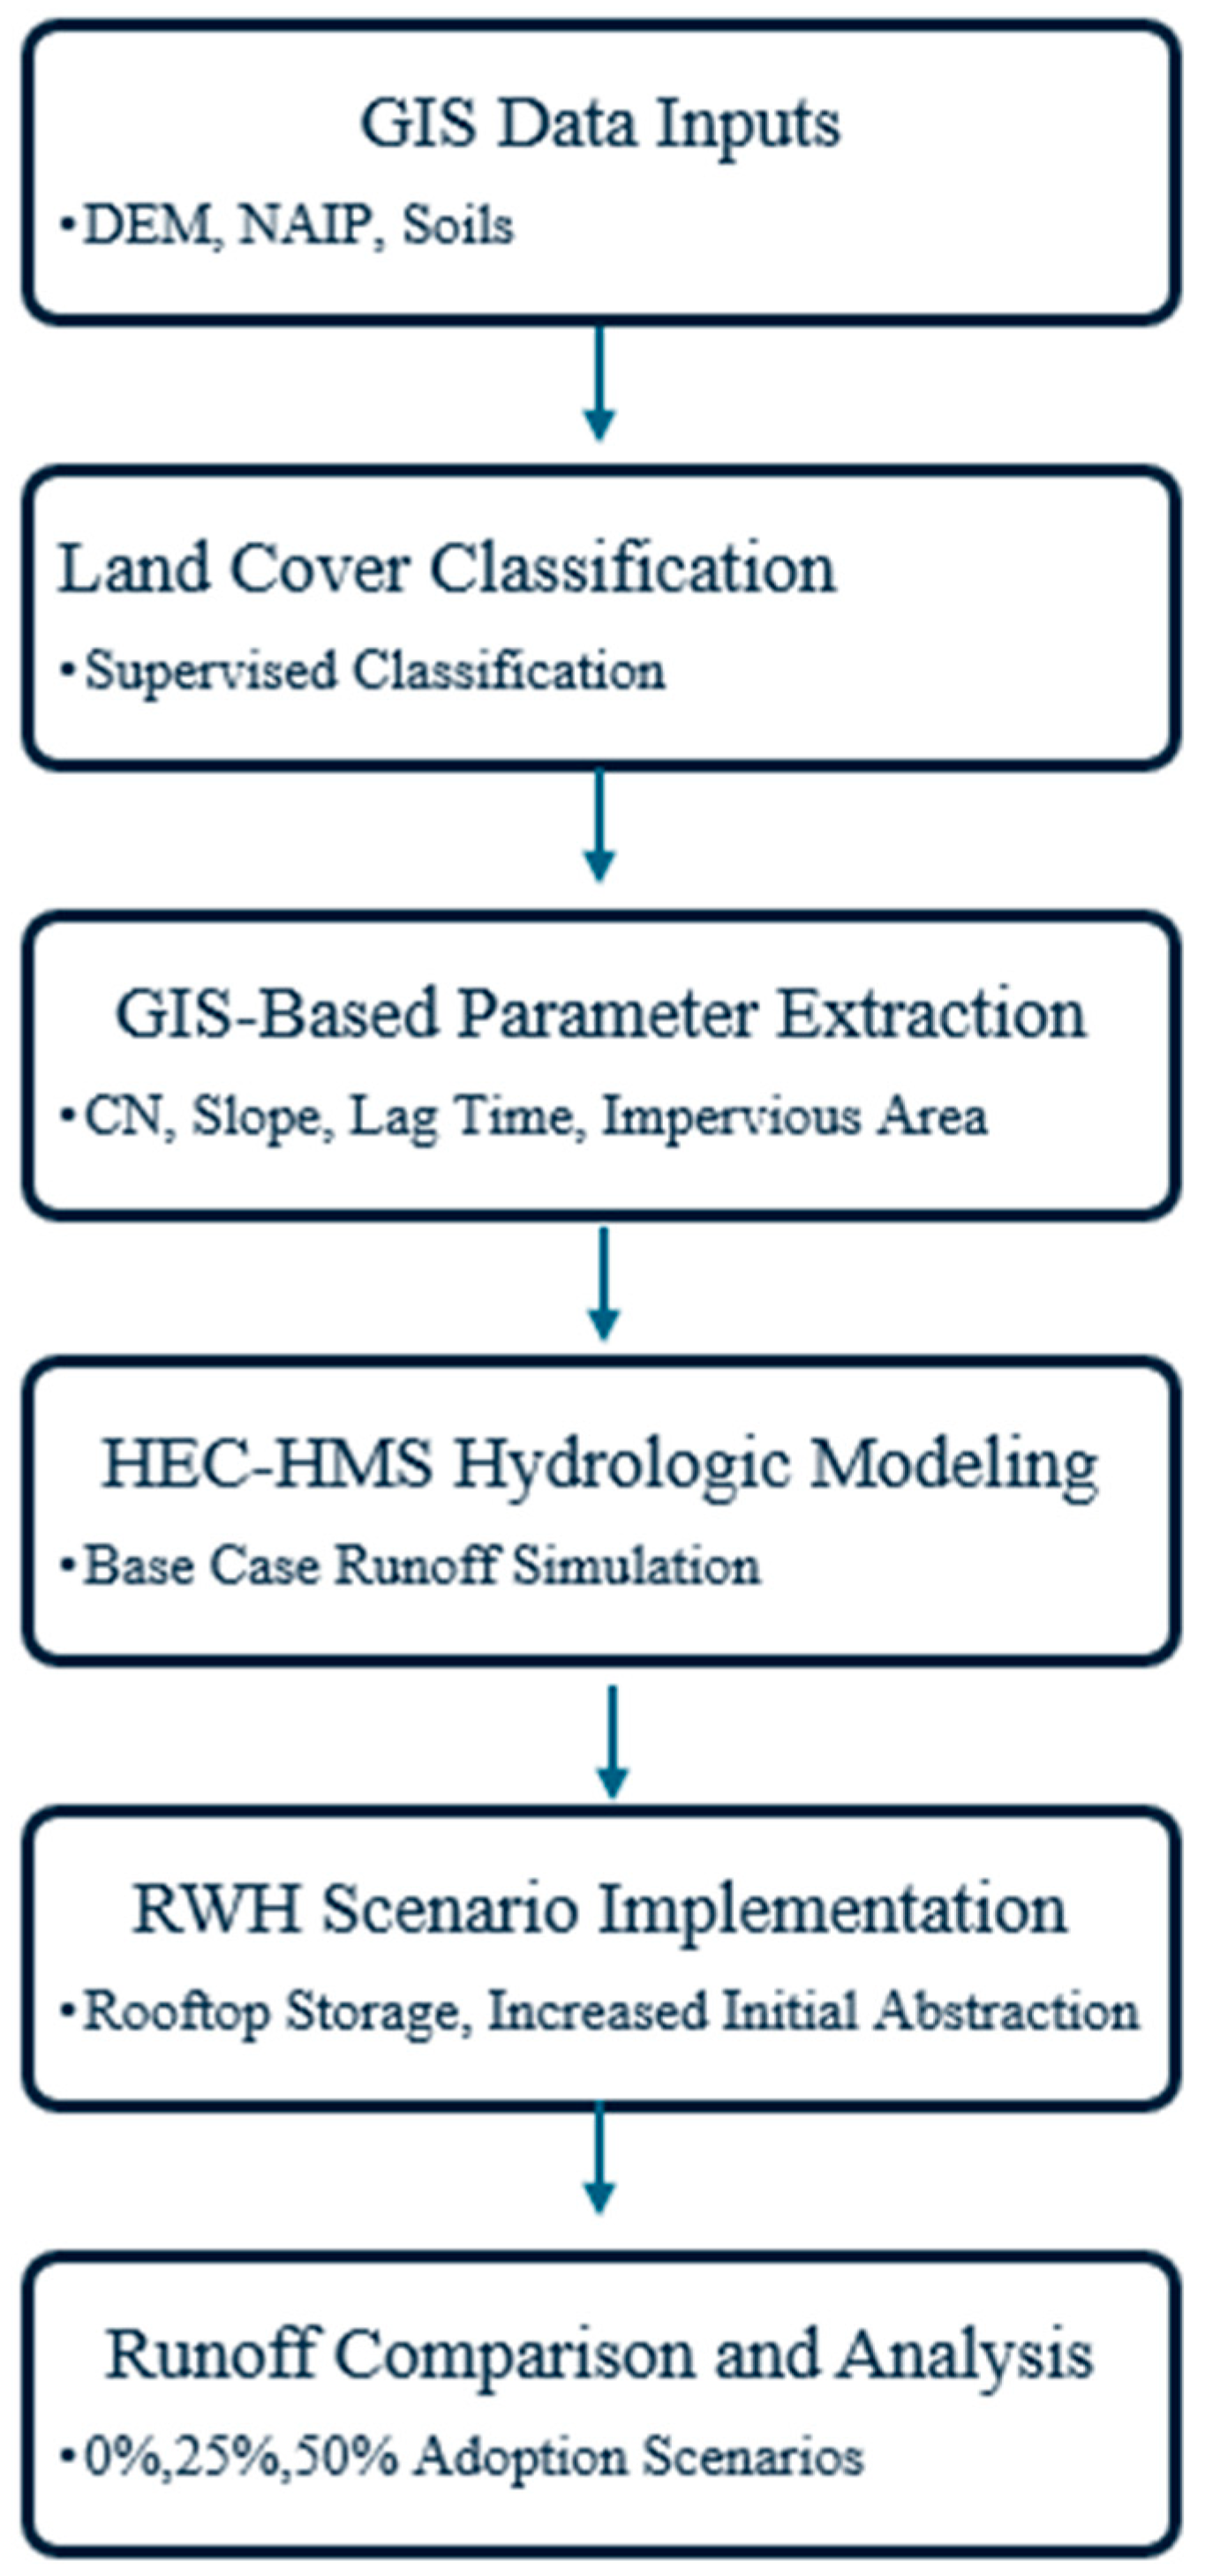
This study employed an integrated methodological approach that combines geospatial analysis and hydrological modeling. The methods included a GIS-based approach [21,22,23,24,25] using ArcGIS Pro 3.1 [26]. The hydrological modeling was performed using the US Corps of Engineers HEC-HMS [27]. This approach allowed for the development of a hydrological model capable of estimating stormwater volumes under various rainfall scenarios (Figure 2).
Figure 2.
Overall Methodology.
Findings from a mixed-methods survey [28] in the same AOI, which combined qualitative and quantitative data, were used to inform the selection of viable RWH scenarios. The survey distribution included both online and in-person methods and targeted households within the AOI. The survey was distributed in 2021 and lasted for 6 months. The 37-question, IRB-approved survey was designed to assess perceptions of RWH together with and climate change, and the willingness to participate in RWH adoption. The survey was administered in both English and Spanish. It included 32 closed-ended questions and 5 open-ended questions. The questionnaire was organized into six sections. A total of 105 responses were received, yielding a response rate of 66.9% with a 95% confidence level and an 8% margin of error. These sections gathered demographic and socio-economic information, examined people’s current views and knowledge of RWH, and explored whether concern about climate change is linked to a willingness to change household habits. To ensure everyone started with the same understanding, each section began with simple definitions of “active” methods, such as rain barrels, and “passive” methods that use landscape infiltration. Results indicate that approximately 72% of respondents were willing to adopt RWH highlighting strong implementation potential. However, the lack of education and financial constraints were identified as the primary barriers to adoption [28].
2.1. Soil Conservation Service-Curve Number (SCS-CN) Land Cover Method
The United States Department of Agriculture’s (USDA) Natural Resources Conservation Service (NRCS) provides guidance for urban hydrology in small watersheds through the SCS-Curve Number (CN) method [29]. SCS-CN is a simplified approach for estimating storm runoff volume and peak discharge from a watershed. The USDA defines an “urban watershed” as a watershed in which impervious surfaces predominate. This study applies the SCS-CN method to quantify runoff volumes generated under multiple rainfall scenarios within a residential watershed, accounting for both impervious (e.g., roads, sidewalks, and parking lots) and pervious areas (e.g., gardens, parks, and other non-paved surfaces). The method estimates runoff as a function of the CN, which reflects land characteristics, hydrologic soil group, and antecedent conditions. Urban land cover is classified into two categories: (1) Fully Developed Urban Areas (Vegetation established) and (2) Developing Urban Areas. Each class is assigned a CN based on the underlying hydrologic soil group (A–D), which represents soil infiltration capacity and runoff potential. Using GIS-based land-cover analysis and USDA soil data, hydrologic groups were assigned, along with corresponding CN values. Weighted CN for each subbasin was calculated using Equation (1), based on the area () for each land cover type. This approach follows the procedures outlined in Urban Hydrology for Small Watersheds (Technical Release No. 55) [29].
To account for antecedent moisture conditions, CN were adjusted to represent dry (AMC-I), average (AMC-II), and wet (AMC-III) conditions using standard conversion equations. CN can be adjusted based on wet or dry antecedent conditions. Dry soils are represented as CN(I) and have the following formula:
With CN(II) representing average CN conditions and wet conditions, CN(III) can be defined using the following formula:
These AMC scenarios were treated as discrete modeling cases rather than event-specific conditions.
From the CN, maximum retention can also be calculated. Maximum Retention (S) relates to soil and cover properties of the watershed and the relationship with the CN is evaluated using Equation (4) [29].
Potential maximum retention is the infiltration that occurs after runoff has begun in the AOI. Terrain-based parameters required for lagtime were derived using ArcGIS [23]. The slope was calculated from the digital elevation model (DEM) within ArcGIS, and the remaining variable needed was hydraulic length. Hydraulic or flow length refers to the flow path that runoff would take from the most distant point in the watershed to the watershed outlet. The travel time for the water to move along the hydraulic path was then used to calculate lag time () using Equation (5).
where
L = Hydraulic Length (m)
S = Maximum Retention (mm)
Y = Watershed Slope (%)
2.2. GIS-Based Approach
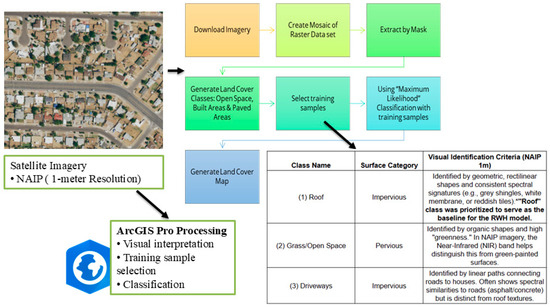
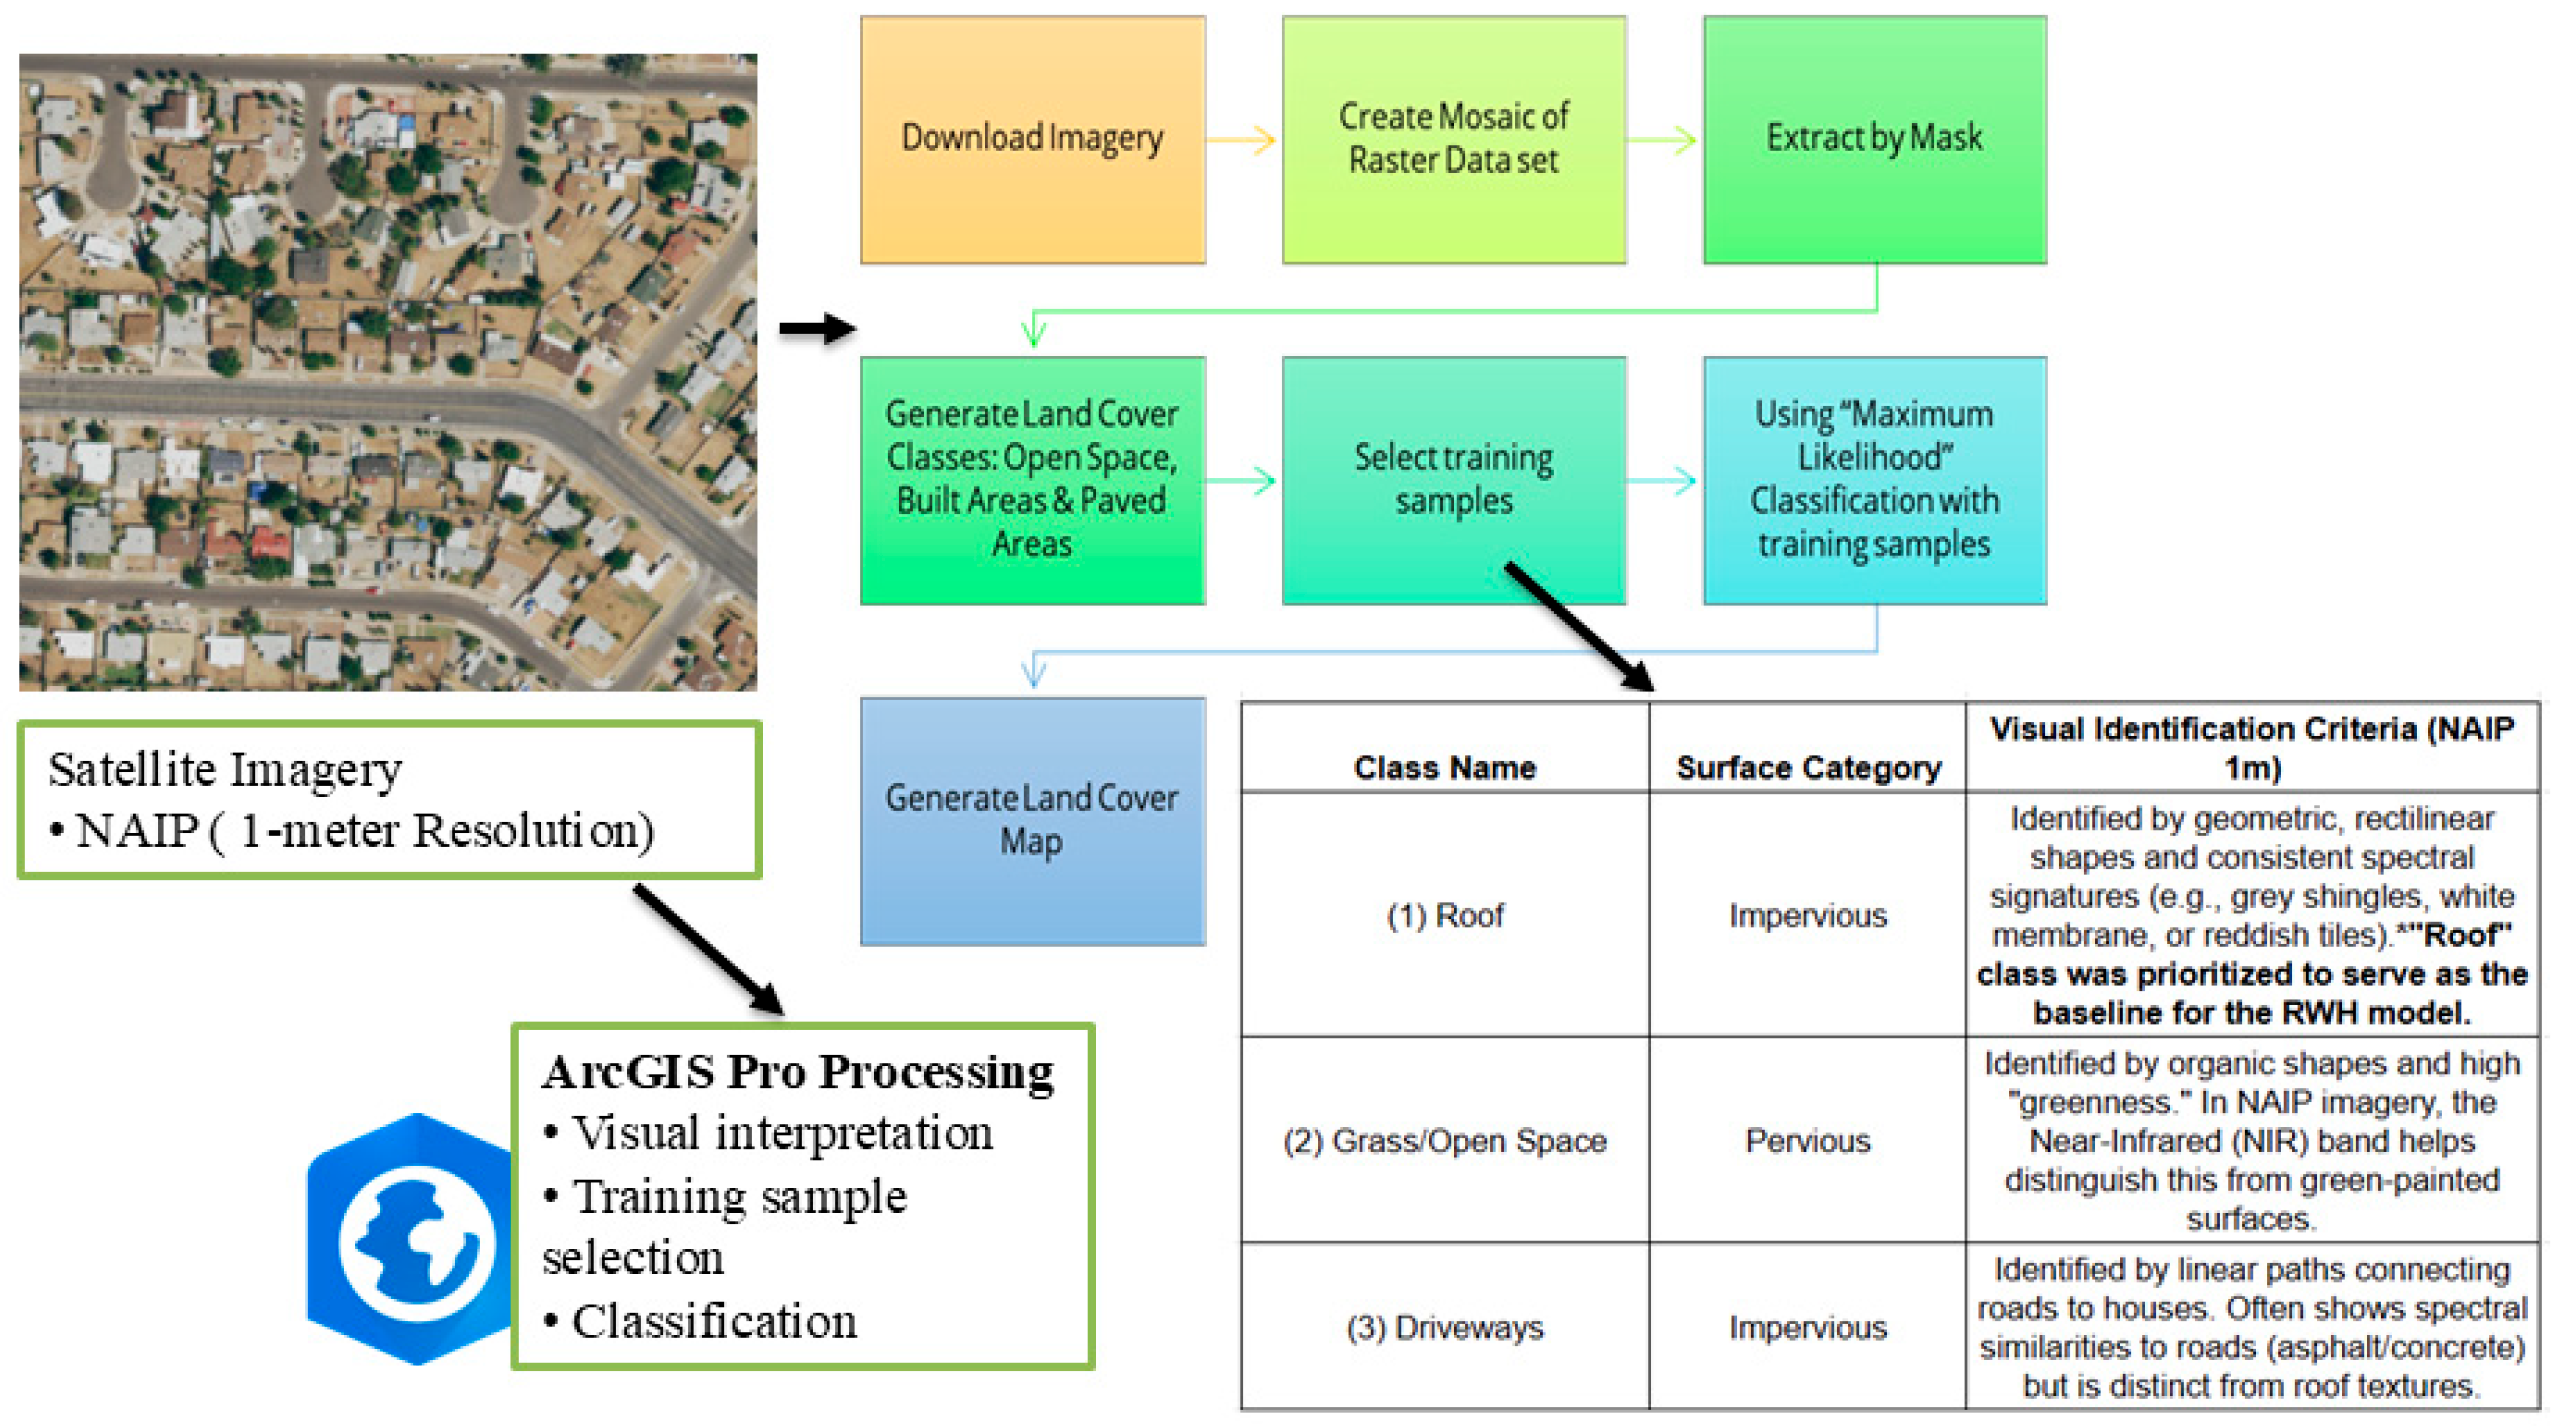
Based on the land-cover analysis performed in GIS [26], key variables were extracted to initiate hydrological calculations. The resolution and spatial extent must be sufficient to digitize the image thusenabling visual examination of land-cover types in a residential area. The imagery used was obtained from the NOAA National Agriculture Imagery Program (NAIP) [30]. The imagery comprised four spectral bands with 8-bit radiometric resolution and a spatial resolution of 1 m. Once the AOI was imported into ArcGIS, the next step was to identify land-cover classes of interest. In this case, the focus was on a primarily residential area as seen in Figure 3. Applicable land classes included (1) open space, (2) roof area, and (3) paved areas.
Figure 3.
Land-cover classification process for the study area. The asterisk (*) indicates that the Roof class was prioritized as the baseline for the RWH analysis.
This specific breakdown was selected to ensure that the roof areas were accurately recorded as a distinct land-cover type on the land-cover map. In the RWH analysis, open space indicates which areas have pervious or non-pervious surfaces.
For the AOI, a supervised classification method was applied using training sites drawn exclusively from within the study area to represent the local land-cover types. Based on the predefined land-cover breakdown (e.g., Roof, Grass/Open Space, and Driveways), a schema was created and implemented in the GIS-based training samples manager. The breakdown classification framework started with two parent classes: Impervious; and Pervious.
- The Impervious parent class refers to all land cover that doesn’t retain or infiltrate water and includes: (1) Roof Areas; (2) Driveways/Paved Areas; and (3) Streets.
- The Pervious parent class encompasses all land types that permit infiltration and includes: (1) Grass/Open Space; (2) Trees/Greenery; and (3) Bare Earth.
For each subclass, various drawing tools were used to generate polygons over features corresponding to the category within the AOI, using the 1 m NAIP imagery for visual verification. Increasing the number of samples per class in a study improves classification accuracy. Once training samples were created, the statistical signatures for each land cover type were saved for subsequent classification.
The classification method was pixel-based, using the Maximum Likelihood classifier. This classification method assumes that the statistical information for the classes in each raster band is “normally distributed” and then assigns each pixel to the specified categories based on probability. Ultimately, the pixel is classified as the class with the highest probability. Once the classification process was complete, a land cover map was generated. There are various tools available to revise a classified raster, such as the “Reclassifier Tool (RT)”, which allows for the visual inspection of the pixels in each class. Based on this pictorial review, through analysis, any incorrect pixels identified in a class were reclassified as needed to be included in the correct land class.
An accuracy assessment was completed to evaluate the performance of the supervised classification utilized for rooftop delineation. Independent validation points were created using random sampling. A confusion matrix was generated to compute overall accuracy, obtain users’ and producers’ accuracy, and the Kappa coefficient.
Additionally, similar classes can be grouped into a generalized class. As specified earlier, each class was designated a parent classof either pervious or impervious. RT generates a new map of the two primary classes, as identified in the land-cover assessment using hydrological formulas.
To quantify the distribution of land-cover types within each watershed, the generalized land-cover map was overlaid on the 22 delineated watersheds. Using the Spatial Analyst toolbox, a cross-tabulated area table was generated from two datasets (Land Cover Classification and Watersheds) to calculate the area of each of the six specified land-cover classes within each basin. This approach was also applied at the parcel level to determine the total area of each class for each property. Tabulating areas in the Spatial Analyst toolbox enables analysis of two datasets: Land Cover Classification; and Watersheds. This method was also used to tabulate parcel-level areas determining the total size of each class for each home in the area. A secondary tool, slope raster zonal statistics, was used to join raster datasets and summarize a raster’s values within the zone of another raster.
2.3. HEC-HMS Model Development and Setup
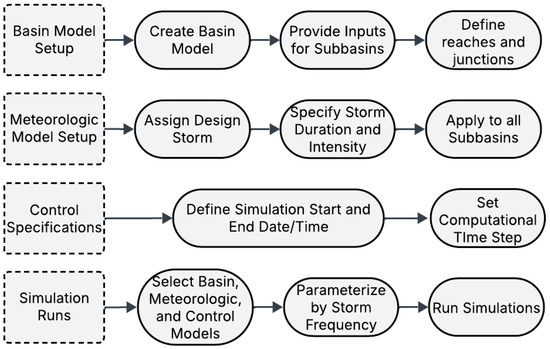
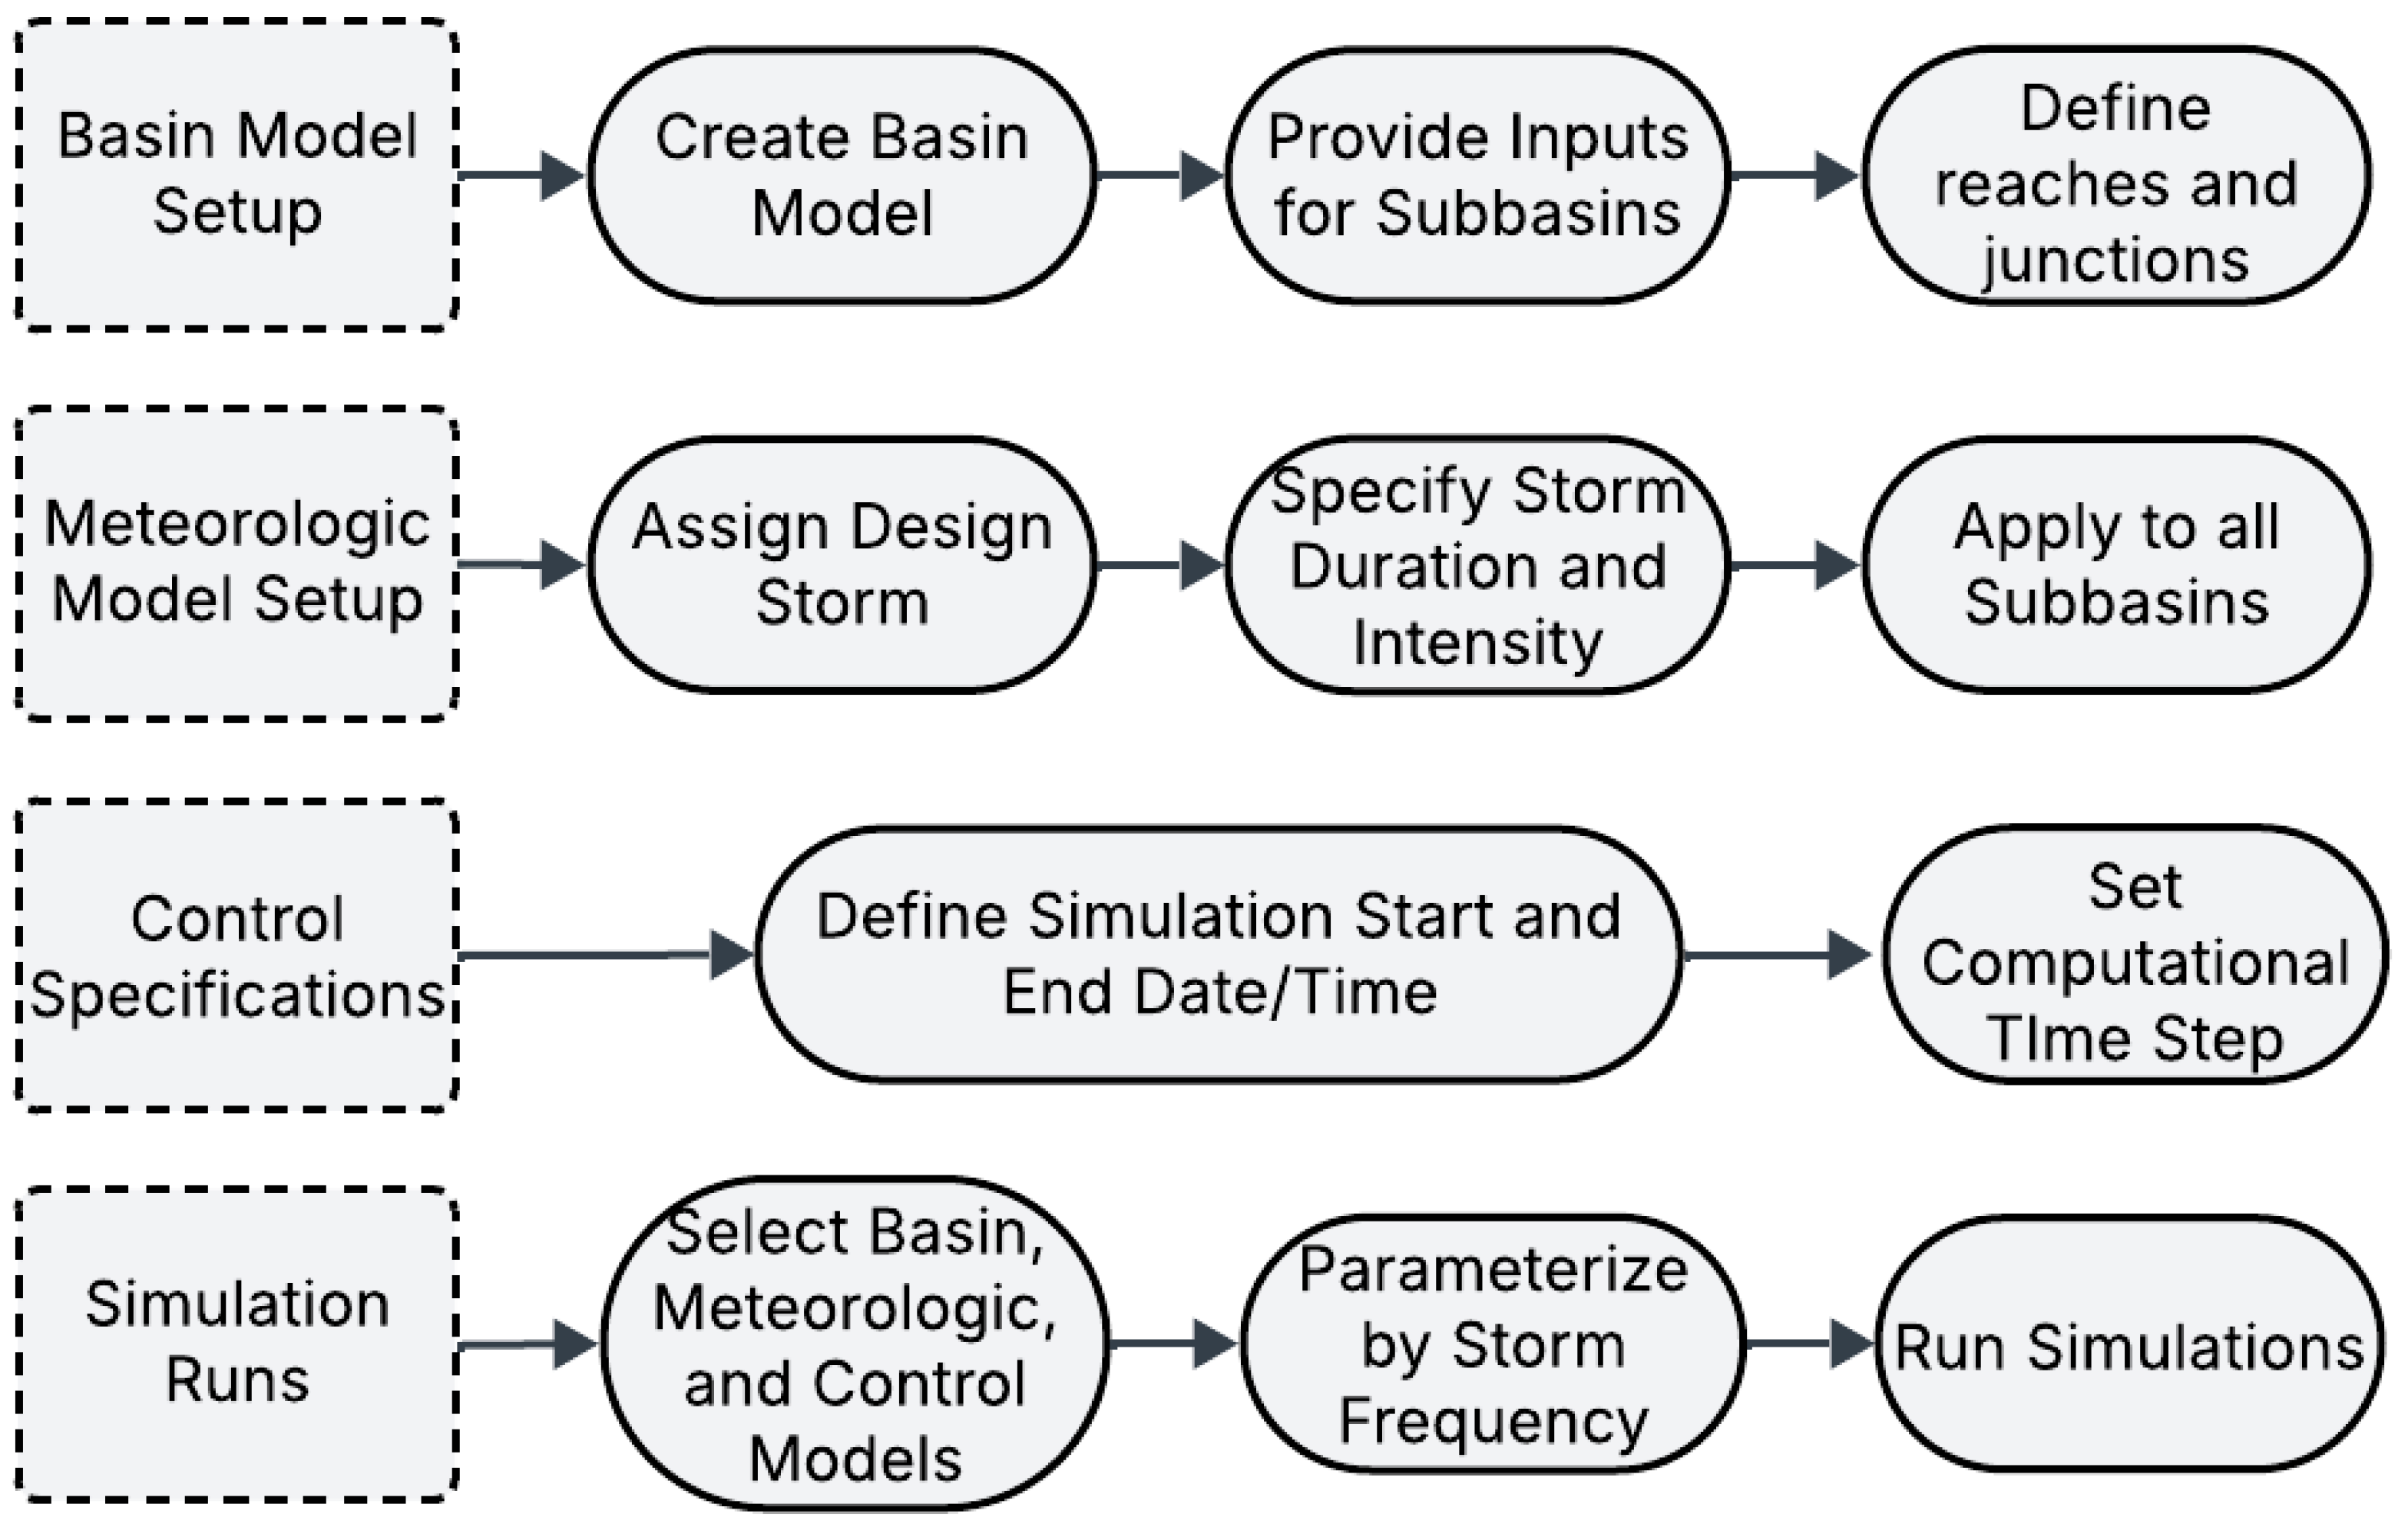
The general steps for the hydrological model are illustrated in Figure 4.
Figure 4.
HEC-HMS Flow Chart.
HEC-HMS [27] enables hydrological simulation, using different specifications to quantify the volume generated across scenarios. Using information generated from the land-cover analysis to calculate hydrologic parameters, a model was developed in HEC-HMS. In the ArcGIS process, 22 watersheds were delineated and in HEC-HMS, these will be referred to as the “sub-basins.” Each sub-basin requires parameters previously calculated using formulas from the SCS-CN method, also known as the TR-55 Method. The parameters needed will depend on the Loss and Transform method specified. In this case, since all calculations were done following the SCS-CN procedure, the SCS Curve Number will be selected as the Loss Method, while the Transform method will be denoted as “SCS Unit Hydrograph.” Once these changes have been made, the CN and lag time (in minutes) will be entered. This process was repeated for all 22 subbasins until all information was included. Additionally, the outlines of all created watersheds were imported into the program to aid in creating a schematic that visually represents each sub-basin.
After defining the basins, and incorporating parameters generated beforehand in GIS, the junction tool was used to merge sub-basin flows at each downstream node. The meteorological model was then created, selecting ‘Frequency Storm’ when prompted. Storm duration, intensity duration, and depth values were then added. The El Paso Drainage Design Manual (EPDDM) [31] was used to select the Intensity–Duration–Frequency equations and total rainfall depth for the areas assigned within the AOI which falls within the City’s central drainage region. The recurrence storm intervals, storms with return periods of 1 year, 2 years, 5 years, 10 years, 25 years, and 50 years, were modeled using a 1 h duration to represent better short, high-intensity rainfall events, which are often the main drivers for urban flooding. Rather than applying a uniform 1 h rainfall intensity, the design storm was implemented in HEC-HMS, with the total 1 h depth distributed across time increments based on the rainfall depth specified in the drainage design manual. This ensures the temporal evolution of rainfall intensity during the 1 h event allows runoff generation to respond to the timing of the rainfall peak.
The 24 h duration is widely used in hydrologic applications (e.g., TR-55) and provides a conservative estimate of the total event volume. However, in this study, a 1 h duration will be used as it offers a more realistic representation of localized flooding dynamics. In the semi-arid climate of El Paso, Texas, precipitation is dominated by short-duration convective storms, particularly during the summer monsoon season, which delivers most of the city’s ~nine inches of annual rainfall. Analysis of NOAA daily precipitation records over the past 25 years indicates that rainfall events lasting a full 24 h are uncommon, with only five such multi-day events identified, and just one in the past decade [32]. These rare, prolonged events are typically associated with sustained moisture rather than intense rainfall, whereas short-duration storms remain the primary drivers of urban runoff and nuisance flooding. Accordingly, 24 h storm durations were excluded from this analysis. This approach ensures that the RWH potential is expressed as an upper bound, representing the maximum storage requirement associated with a given return-period storm.
Control specifications define the simulation period including the start and end dates (and times) for each modeled frequency storm. The simulation runs begin once the basin model setup is complete with meteorological (Table 2) and control specifications.
Table 2.
Frequency Storm data from EPDDM (cm).
When modeling storm events, such as 1-year or 5-year storms, meteorological conditions vary across runs, whereas other parameters remain constant. After the model executes successfully, a global summary table will be generated, listing elements in hydrologic order and their runoff volumes. This study did not perform formal calibration or validation of HEC-HMS outputs because observed event-based runoff was unavailable at the neighborhood scale. Instead, the model was applied as a comparative framework, with consistent parameters and storm inputs across all scenarios, to evaluate the potential reductions in runoff volume associated with varying levels of residential RWH adoption.
2.4. Rainwater Harvesting
In an urban setting, a neighborhood-scale watershed consists of a group of homes. Each home contributes to the neighborhood watershed through areas such as (1) Roof, (2) Grass Open space, and (3) Driveways. Collectively, these individual home areas constitute part of a larger watershed system. The area for each watershed was calculated in GIS before modeling in HEC-HMS. For the implementation of active RWH, the analysis focused on the roof area, which was extracted for each home and summed up to obtain the total area per subdivision.
The rainfall volume for each home was calculated by converting rainfall from inches to meters and treating each roof catchment area as a basin. For storm events analyzed in HEC-HMS, specific event rainfall can be used to replace the average annual rainfall. Runoff volume is determined from sloped roof surfaces, incorporating a runoff coefficient based on the material’s imperviousness and rain intensity which is higher for more impervious surfaces. Grass, with coefficients ranging from 0.05 to 0.35, varies according to soil quality and location. For Texas, roof coefficients range from 0.75 to 0.95, as specified by TXDOT standards [33]. Additionally, approximately 10–20% of rainwater is assumed to be lost due to evaporation [13]. Thus, it must be accounted for when determining the amount of water collected.
In this case study, if all 9335 homes in the AOI have combined roof areas, they would constitute RWH catchment. Using the same rainfall depth applied in HEC-HMS, the harvested rainwater was calculated compared with the storm’s total water volume.
RWH was implemented in HEC-HMS by modifying the initial abstraction parameters within the loss function. Initial abstraction (Ia) represents the losses that occur before runoff starts, defined as:
where S (mm) is the maximum potential retention calculated using Equation (4).
To account for the additional storage provided by RWH, the original Ia was increased by the storm-specific abstraction depth for subbasin-level capture estimates.
Rooftop footprints were delineated in GIS, then quantified within each subbasin’s boundaries to obtain a total area. As previously mentioned, findings from a mixed-methods study [28] were used to evaluate different adoption scenarios. In this study, approximately 72% of participants expressed interest in adopting RWH systems. However, when a fixed tank capacity is introduced, the amount of runoff that can be captured becomes limited by the available storage volume rather than by user adoption alone. For this reason, the analysis in this study was capped at a 25% and 50% adoption level representing a realistic upper bound that accounts for both behavioral willingness and practical storage constraints. For each frequency storm (event), the rainfall volume available on rooftops was calculated as:
where Is the roof runoff coefficient and is equal to the water lost due to the initial diversion. represents the total rooftop runoff volume available for harvesting prior to storage constraints. To provide a more practical assessment, a fixed-capacity scenario was applied using a household tank size of 4 m3 which is a commonly available size selected based on physical storage constraints. Tanks were assumed to have maximum available storage at the onset of each storm and were subject to a first-flush diversion. This assumption represents an upper-bound storage availability consistent with design storm practice with partially filled tanks during closely spaced storm events that reduce the captured volume. The total available storage capacity was then calculated to be:
The actual captured rainwater volume, constrained by storage capacity, was determined as:
where represents the effective volume captured by RWH systems and is always than or equal to .
The captured volume was converted to a uniform rainfall depth distributed over the subbasin.
Subsequently, the previously obtained Ia value for each subbasin was added to generate an abstraction parameter that could be included in HEC-HMS to represent RWH. Initial abstraction (Ia) was increased to represent rooftop rainfall removal prior to runoff generation, rather than modifying CNs or impervious area, to maintain the physical interpretation of infiltration and land-surface properties. This method enhances scalability and reproducibility because Ia can be systematically adjusted across extensive spatial domains without the need to modify land cover or soil parameters at the parcel level. Utilizing a single, physically interpretable parameter facilitates application at neighborhood or city scales and supports future automation of the workflow within GIS-based hydrologic modeling frameworks.
To evaluate sensitivity to antecedent moisture conditions, simulations were conducted under AMC-I, AMC-II, and AMC-III conditions using adjusted CN. Under wetter antecedent conditions (AMC-III), higher initial runoff volumes reduce the relative effectiveness of RWH because available tank storage fills more rapidly limiting additional capture. These scenarios provide a conservative limit on RWH performance under conditions where prior rainfall or incomplete tank drawdown may reduce available storage.
This approach ensures that the rainfall stored in the distributed tanks is removed from the rainfall excess computation and therefore does not contribute to the surface runoff calculated in the simulations. Because the modeling framework focuses on runoff generation rather than hydraulic routing or inlet behavior, the reduction in the modeled runoff represents a decrease in water available to enter the stormwater drainage system rather than the prediction of street-level inundation.
The outputs from these simulations will provide estimates for comparing varying levels of adoption and changes in total runoff, serving as a basis for applying AI/ML methods to identify and predict areas that could benefit from RWH implementation.
3. Results
As mentioned, the AOI is in the northeast region of El Paso, Texas, in a neighborhood within the central drainage region.
3.1. Land Use and Curve Number Results
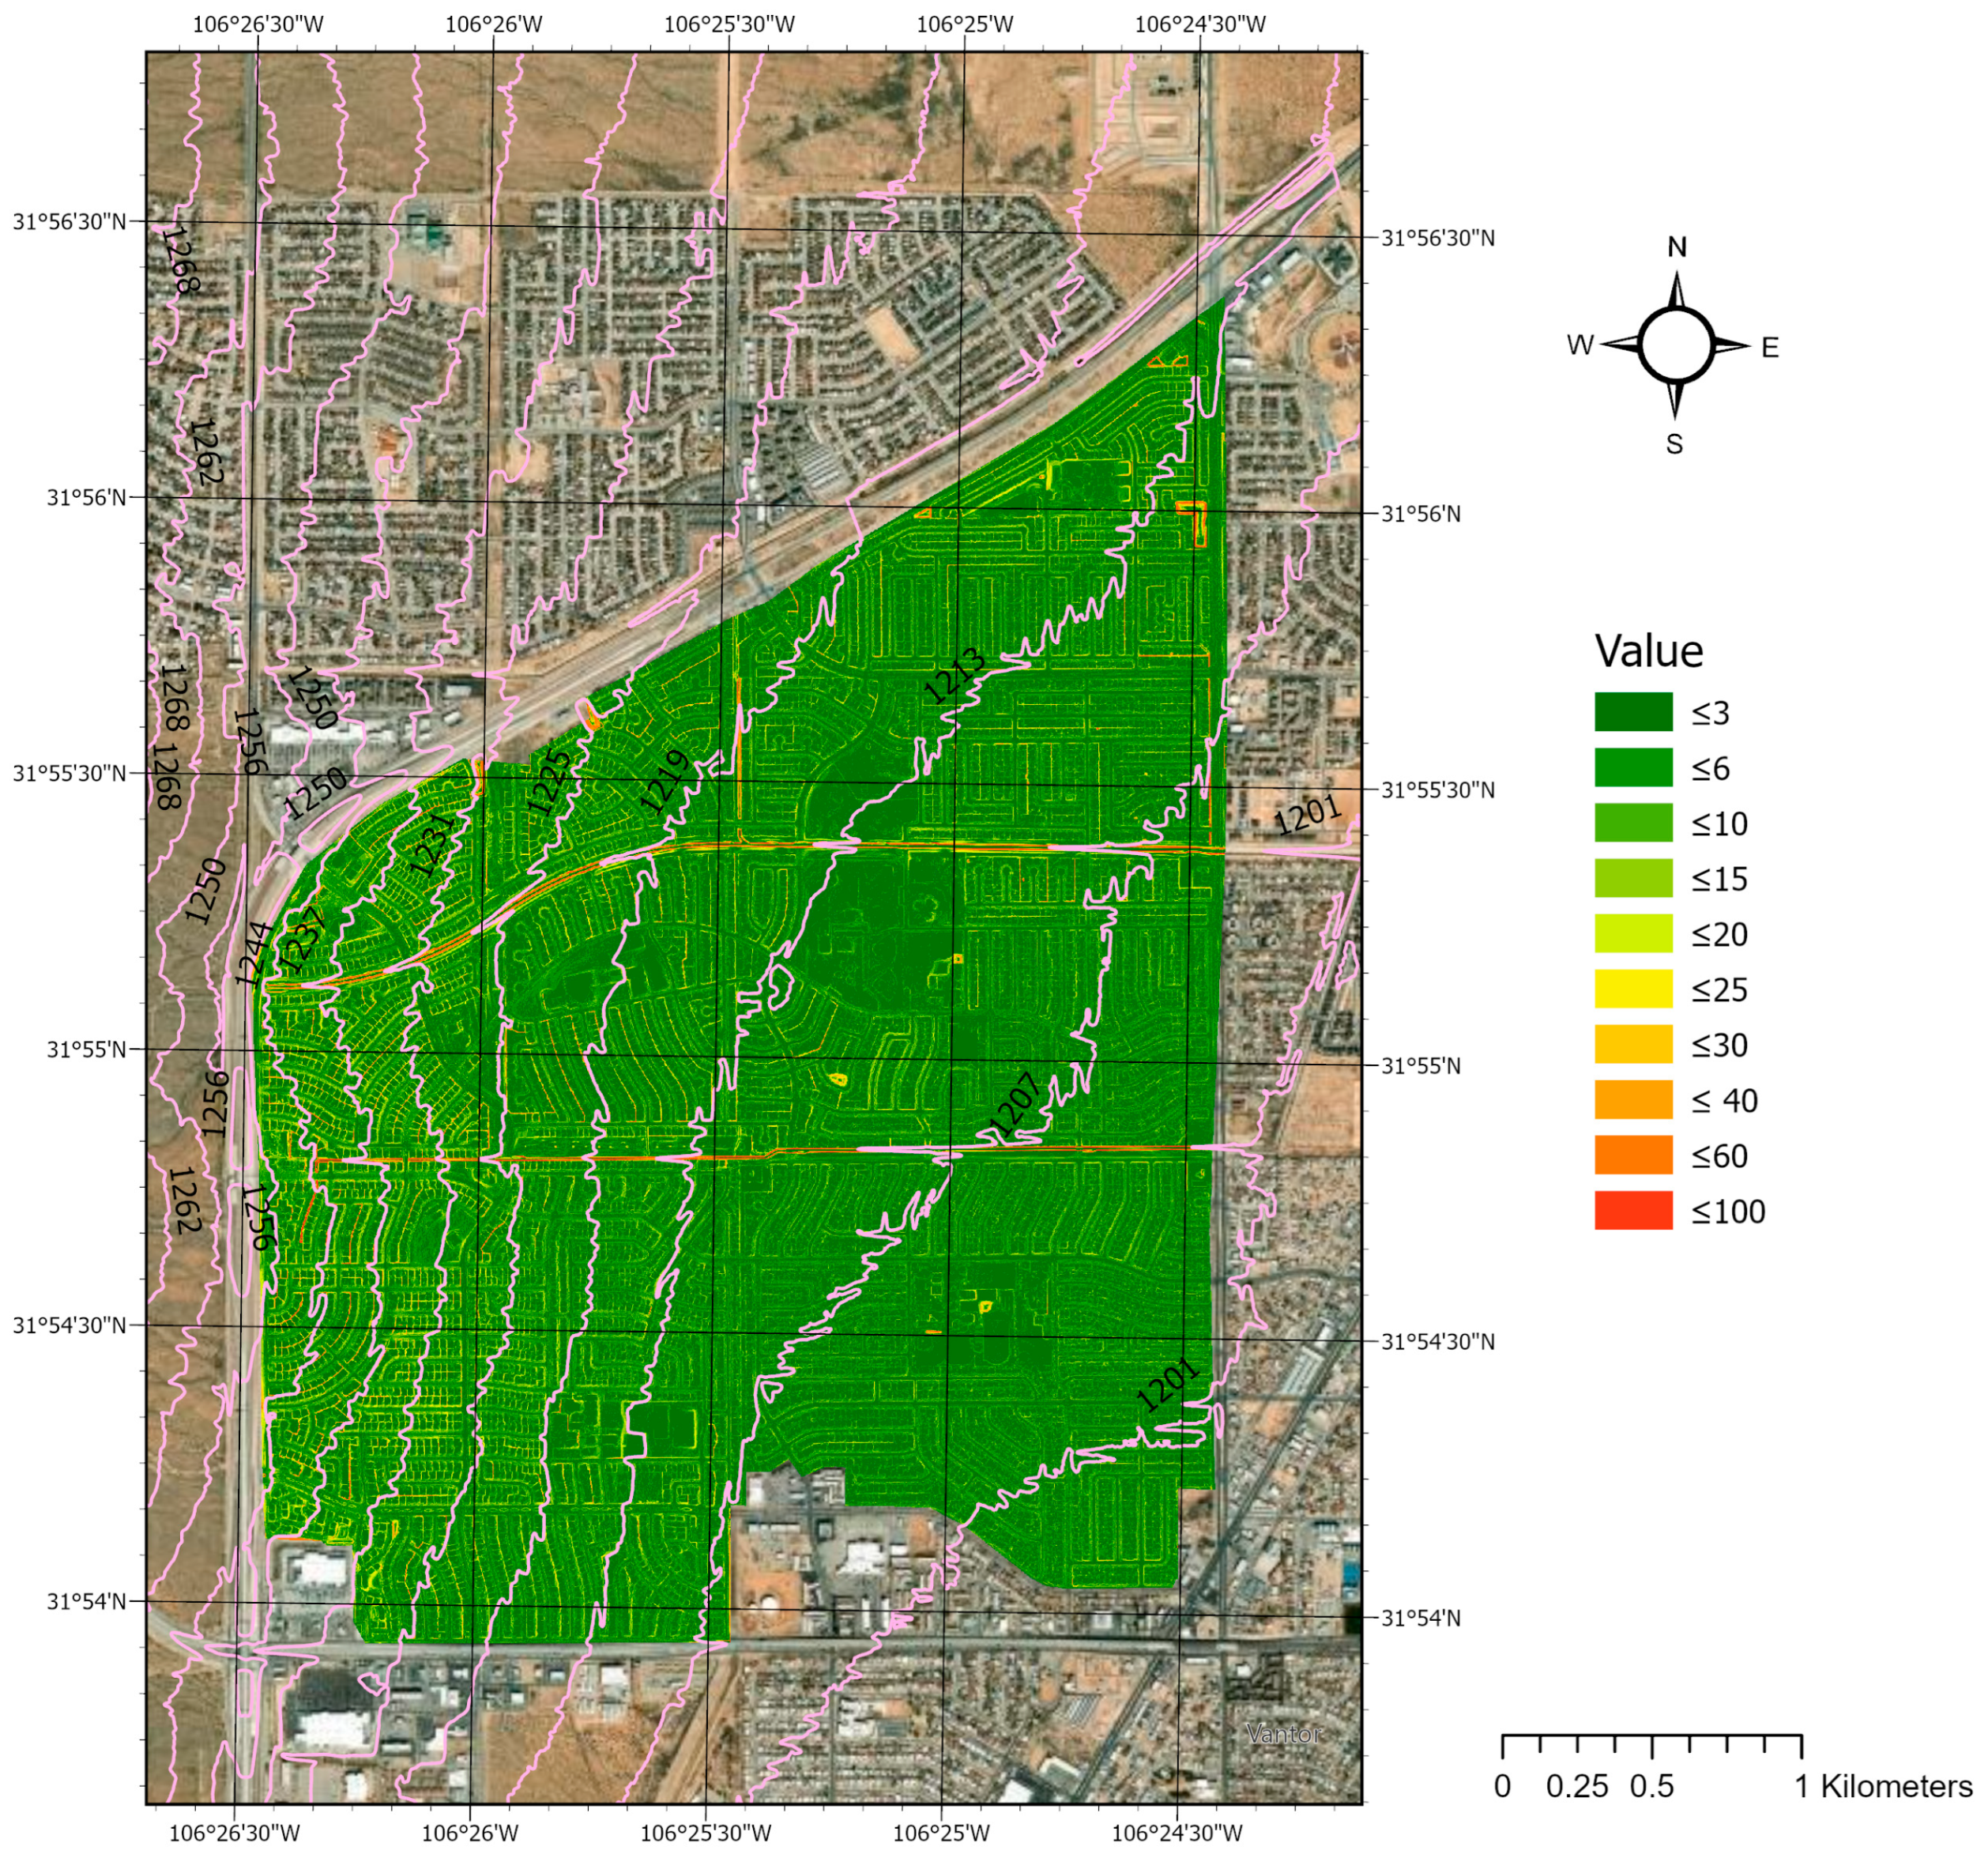
Using GIS, the total area of each watershed was distinguished between pervious and impervious components. The first step in the analysis was to process the digital elevation model to create an elevation map, which revealed a general southeastward slope with the highest elevation recorded at 1252.1 m on the southwest side of the AOI (Figure 5). Additionally, the slope (percent rise) was calculated to identify steeper areas, which were then used to estimate hydrological parameters (Figure 5). Zonal statistics were applied to obtain raster values within each parcel boundary.
Figure 5.
Slope (percent rise) of the study area in El Paso, Texas. The color scale represents slope values, pink contour lines indicate topographic elevation (m), and the graticule denotes geographic coordinates in degrees, minutes, and seconds.
The typical range for CN was from 30, indicating a permeable surface with high infiltration rates, to 100, indicating a highly impervious area with minimal to no infiltration. For sites within the AOI, typical CN values for pervious regions ranged from 52 to 72, depending on the site’s hydrological group (Table 3). A CN of 98 was assigned to impervious areas based on NRCS values, with runoff sensitivity primarily influenced by pervious land covers. The results are presented in Table 3.
Table 3.
Hydrological Soil Group and Weighted CN for each Sub-basin.
The higher elevations are in the western area. Runoff flows from the higher elevations into residential areas in the northeast corner and on the southeast side, which are among the basins with the highest CN (86–88). Areas on the southwest side and middle of the AOI have lower CN (77–79), suggesting better infiltration (Table 3).
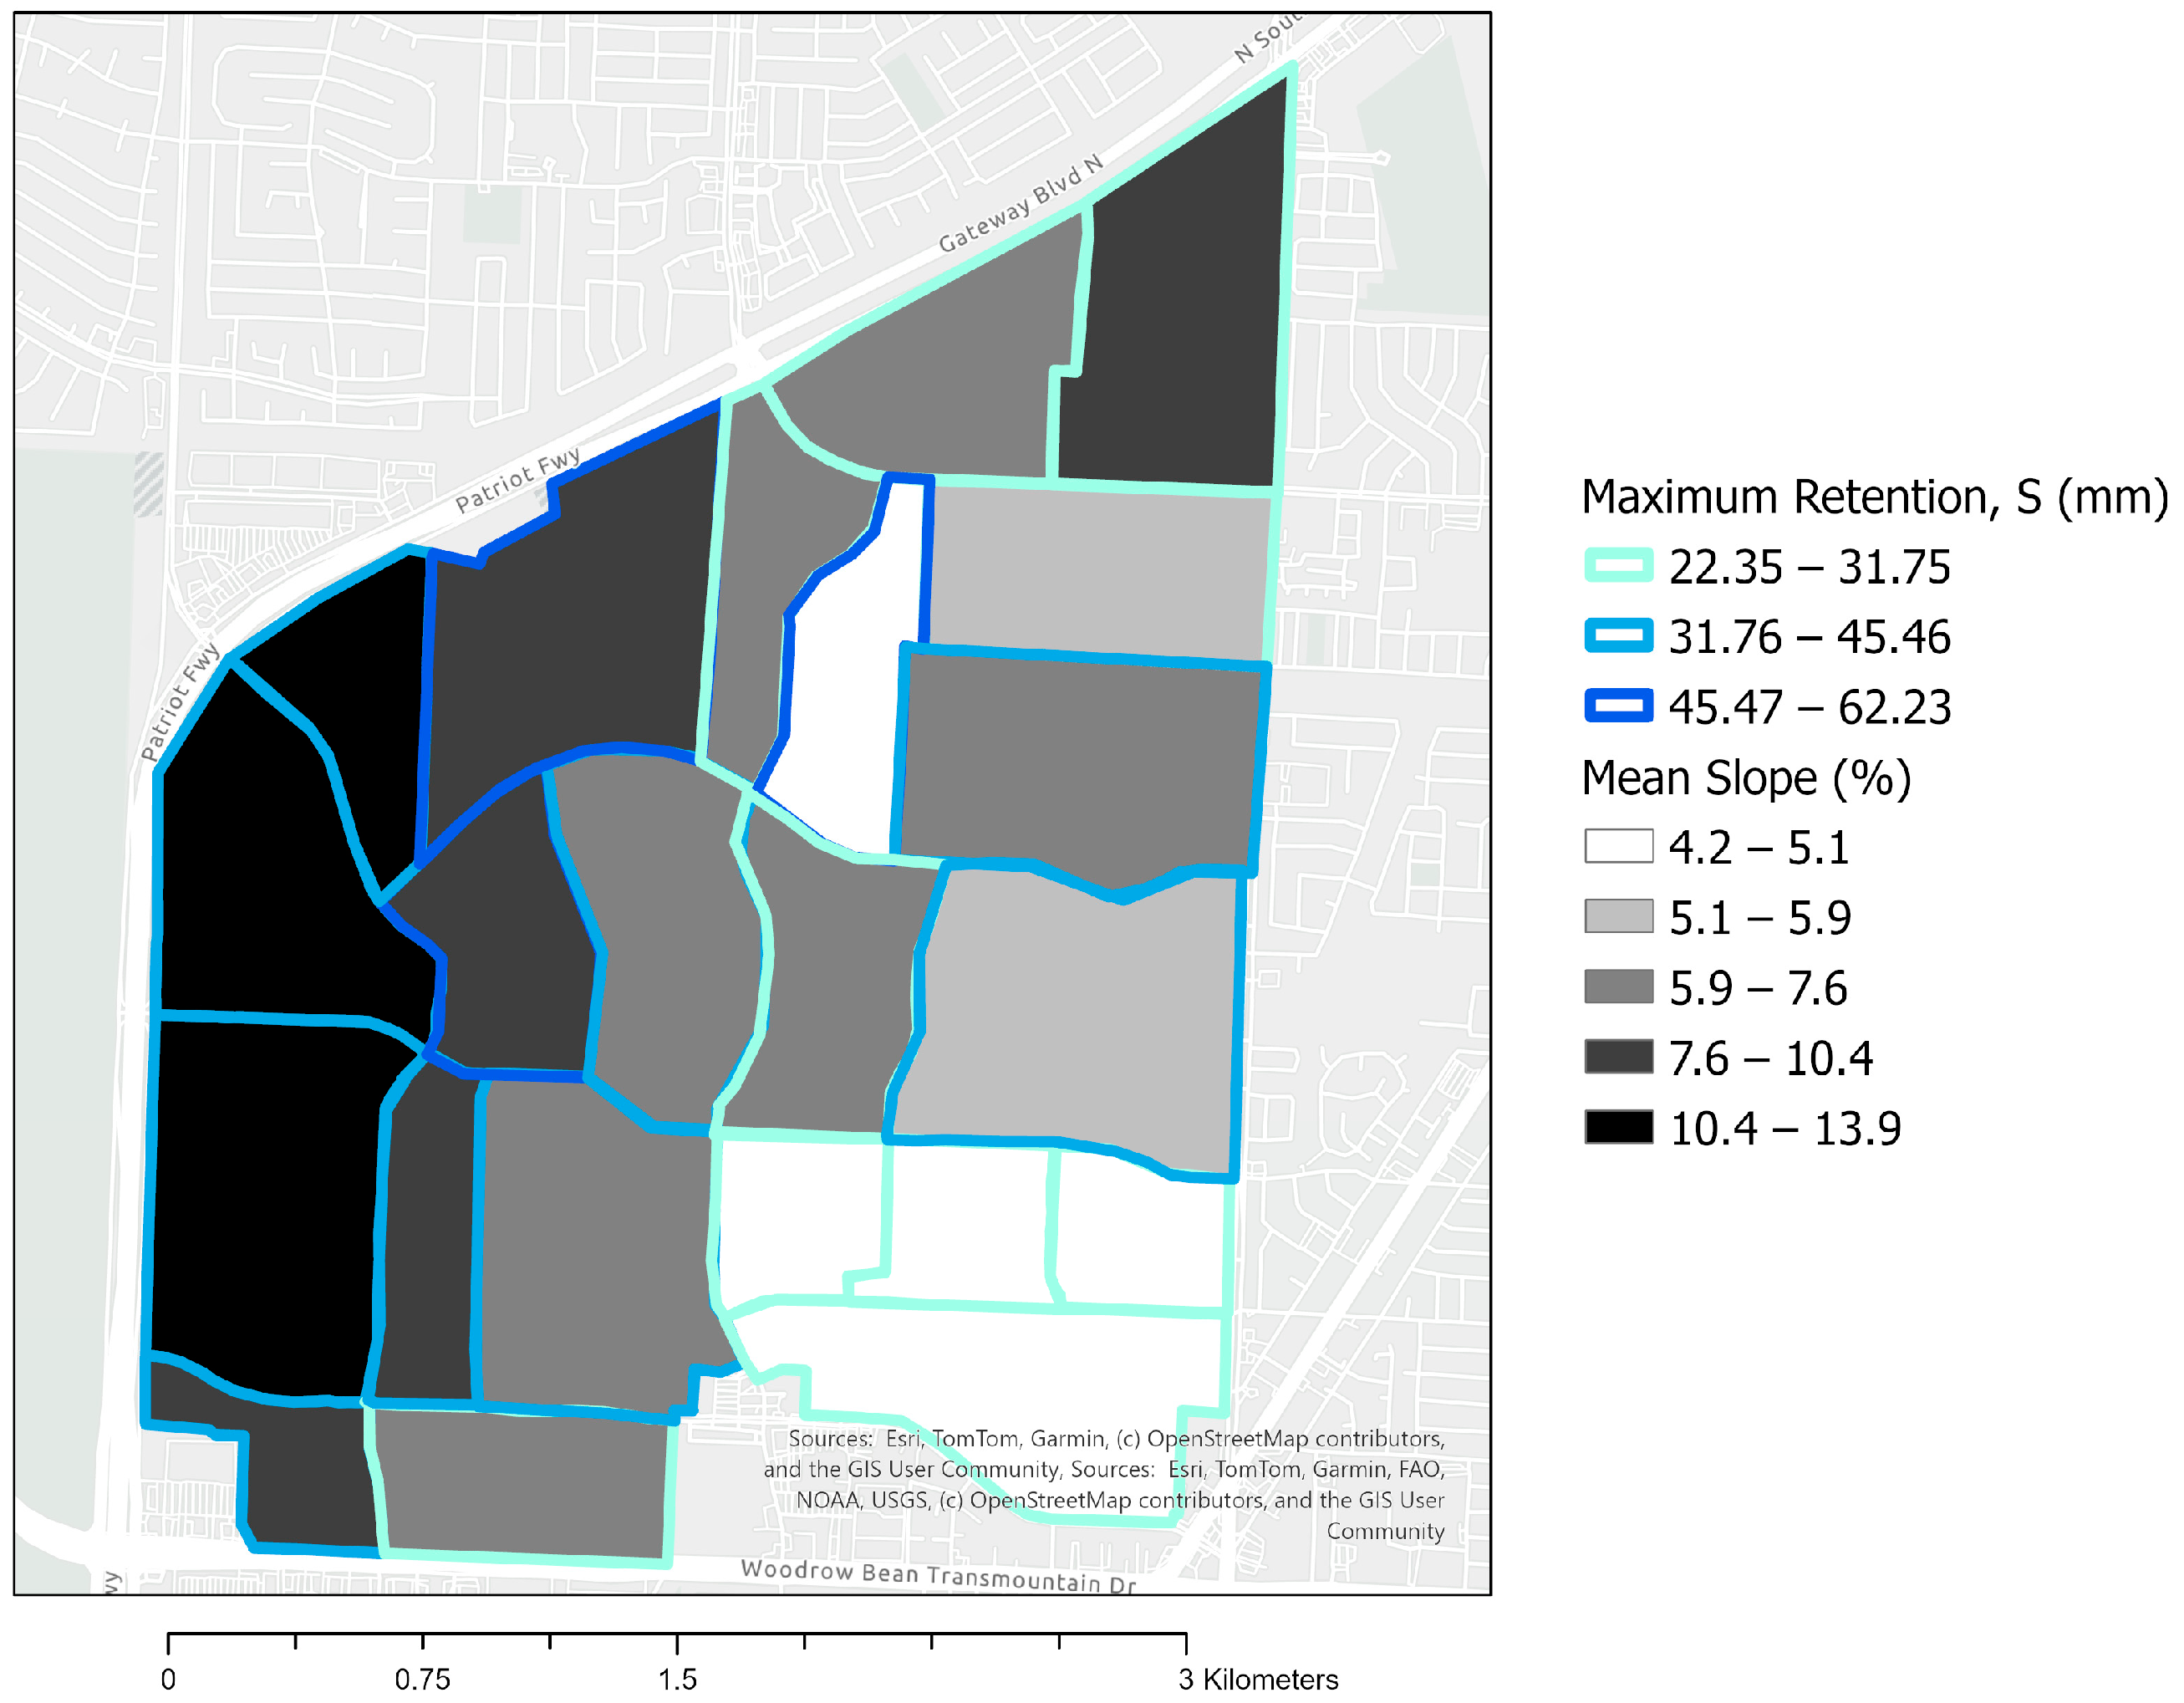
Maximum retention (S), which is the watershed’s capacity to store rainfall before generating runoff, was computed from the CN values using the NRCS relation (Equation (2)). The results are shown in Figure 6 where the dark blue outlined areas represent the highest retention. This indicates that the potential infiltration after runoff was 45.47 mm to 62.23 mm in those areas. It is important to note that the area with the highest S values was also the area with the lowest CN. Additionally, the slopes within each sub-basin were averaged, as shown in Figure 6, to determine the watershed slope percentage (Y), which was used as a parameter in the lag time equation (Equation (5)).
Figure 6.
Mean slope (%) and maximum retention (S) in millimeters for subbasin in the AOI.
The hydraulic length is the longest path water can take from the point of entry to the point of exit. This was obtained from GIS and recorded in Table 4. With all three parameters, hydraulic length, maximum retention, and slope, the lag time was calculated using Equation (5).
Table 4.
Hydrological Parameters obtained from GIS and Calculated Parameters.
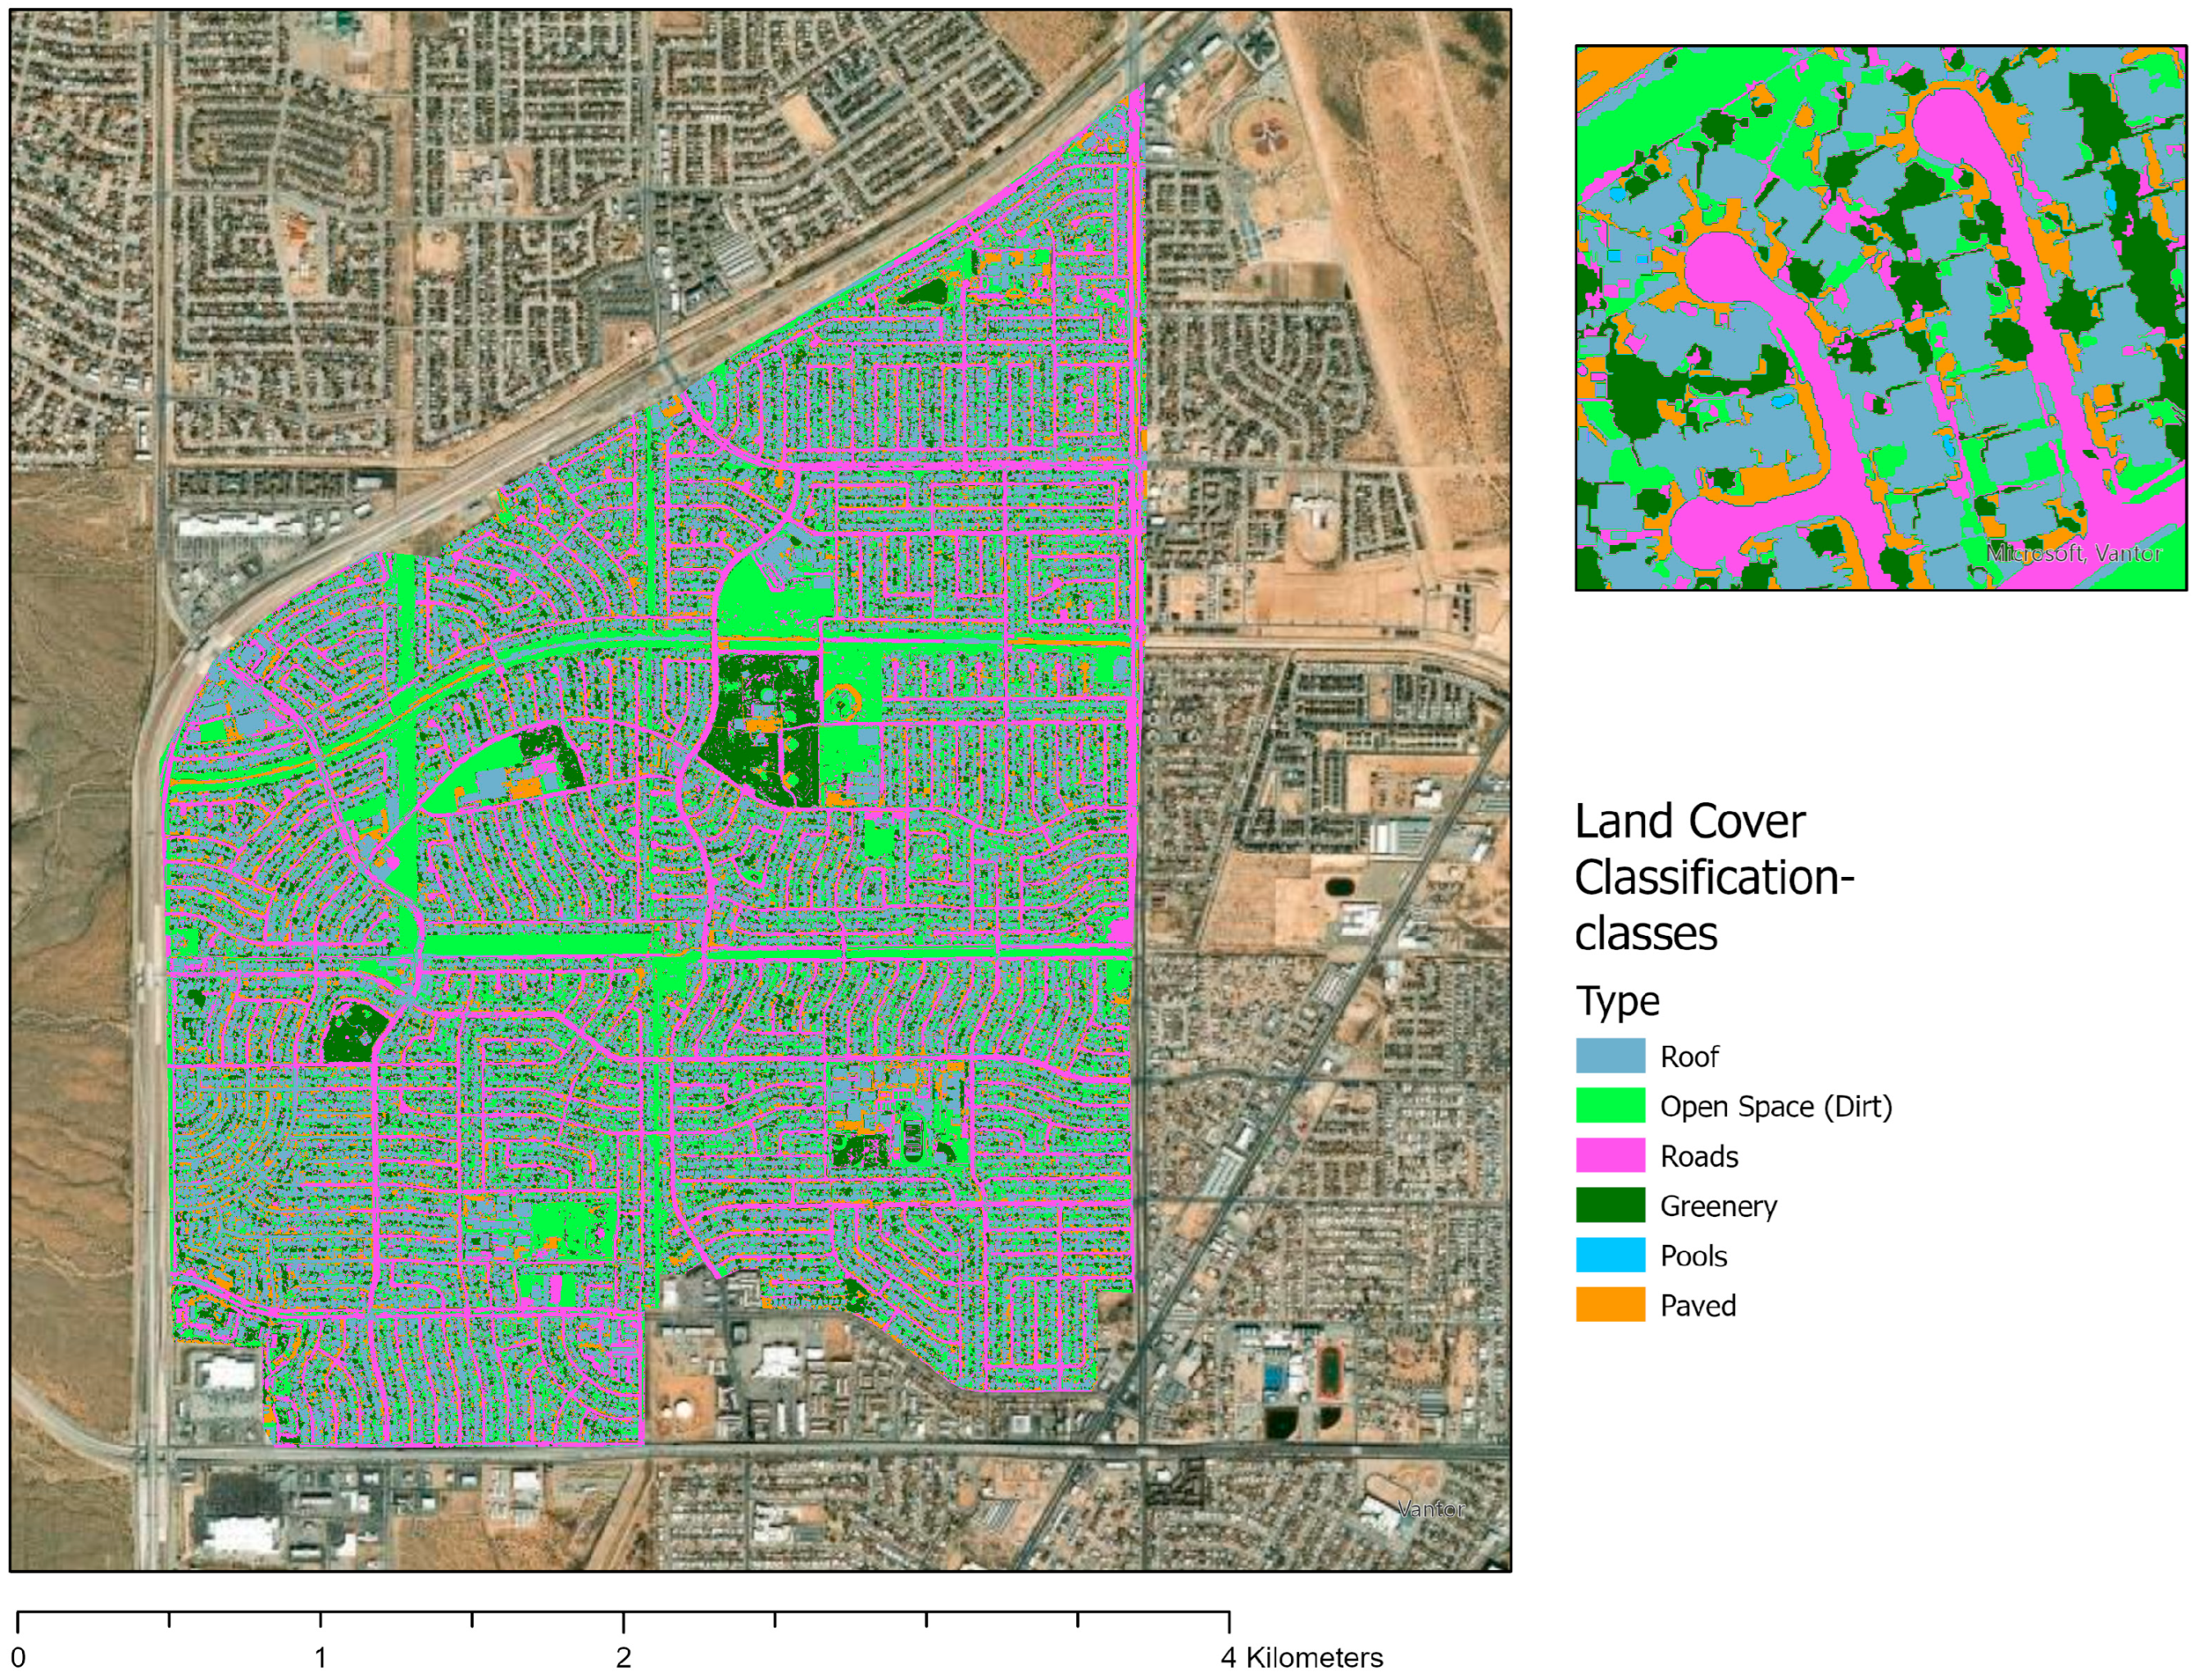
In addition to obtaining the SCS parameters, a land cover map was generated (Figure 7). The land cover map was created using trained datasets (training samples) that were representative of each class: (1) Roof, (2) Open Space, (3) Roads, (4) Greenery, (5) Pools, and (6) Paved areas.
Figure 7.
Land Cover Map.
Accuracy Assessment
An accuracy assessment was performed to verify the quality of the information. Specifically the land-type categories used for the stormwater calculations and subsequent analysis. Completing the accuracy assessment and interpreting the confusion matrix results confirmed that the land cover map was generated accurately and was representative of the underlying raster, thereby enabling continuation of the land cover analysis. The validation was based on stratified random and random sampling of reference points within the AOI with equal representation across classes. Confusion matrix-based metrics indicated a strong classification performance with an average Kappa coefficient of 0.932 indicating a high level of agreement between the classified map and the reference data and confirming the suitability of the land-cover dataset for further analysis. Rooftop classes, which directly represent RWH potential, exhibited high user and producer accuracies, 94% and 96%, respectively, whereas minor misclassification occurred between rooftops and other impervious surfaces. Overall, the accuracy assessment confirmed the suitability of the land-cover dataset for estimating roof area and subsequent analyses.
3.2. Analysis of HEC-HMS Model Simulations
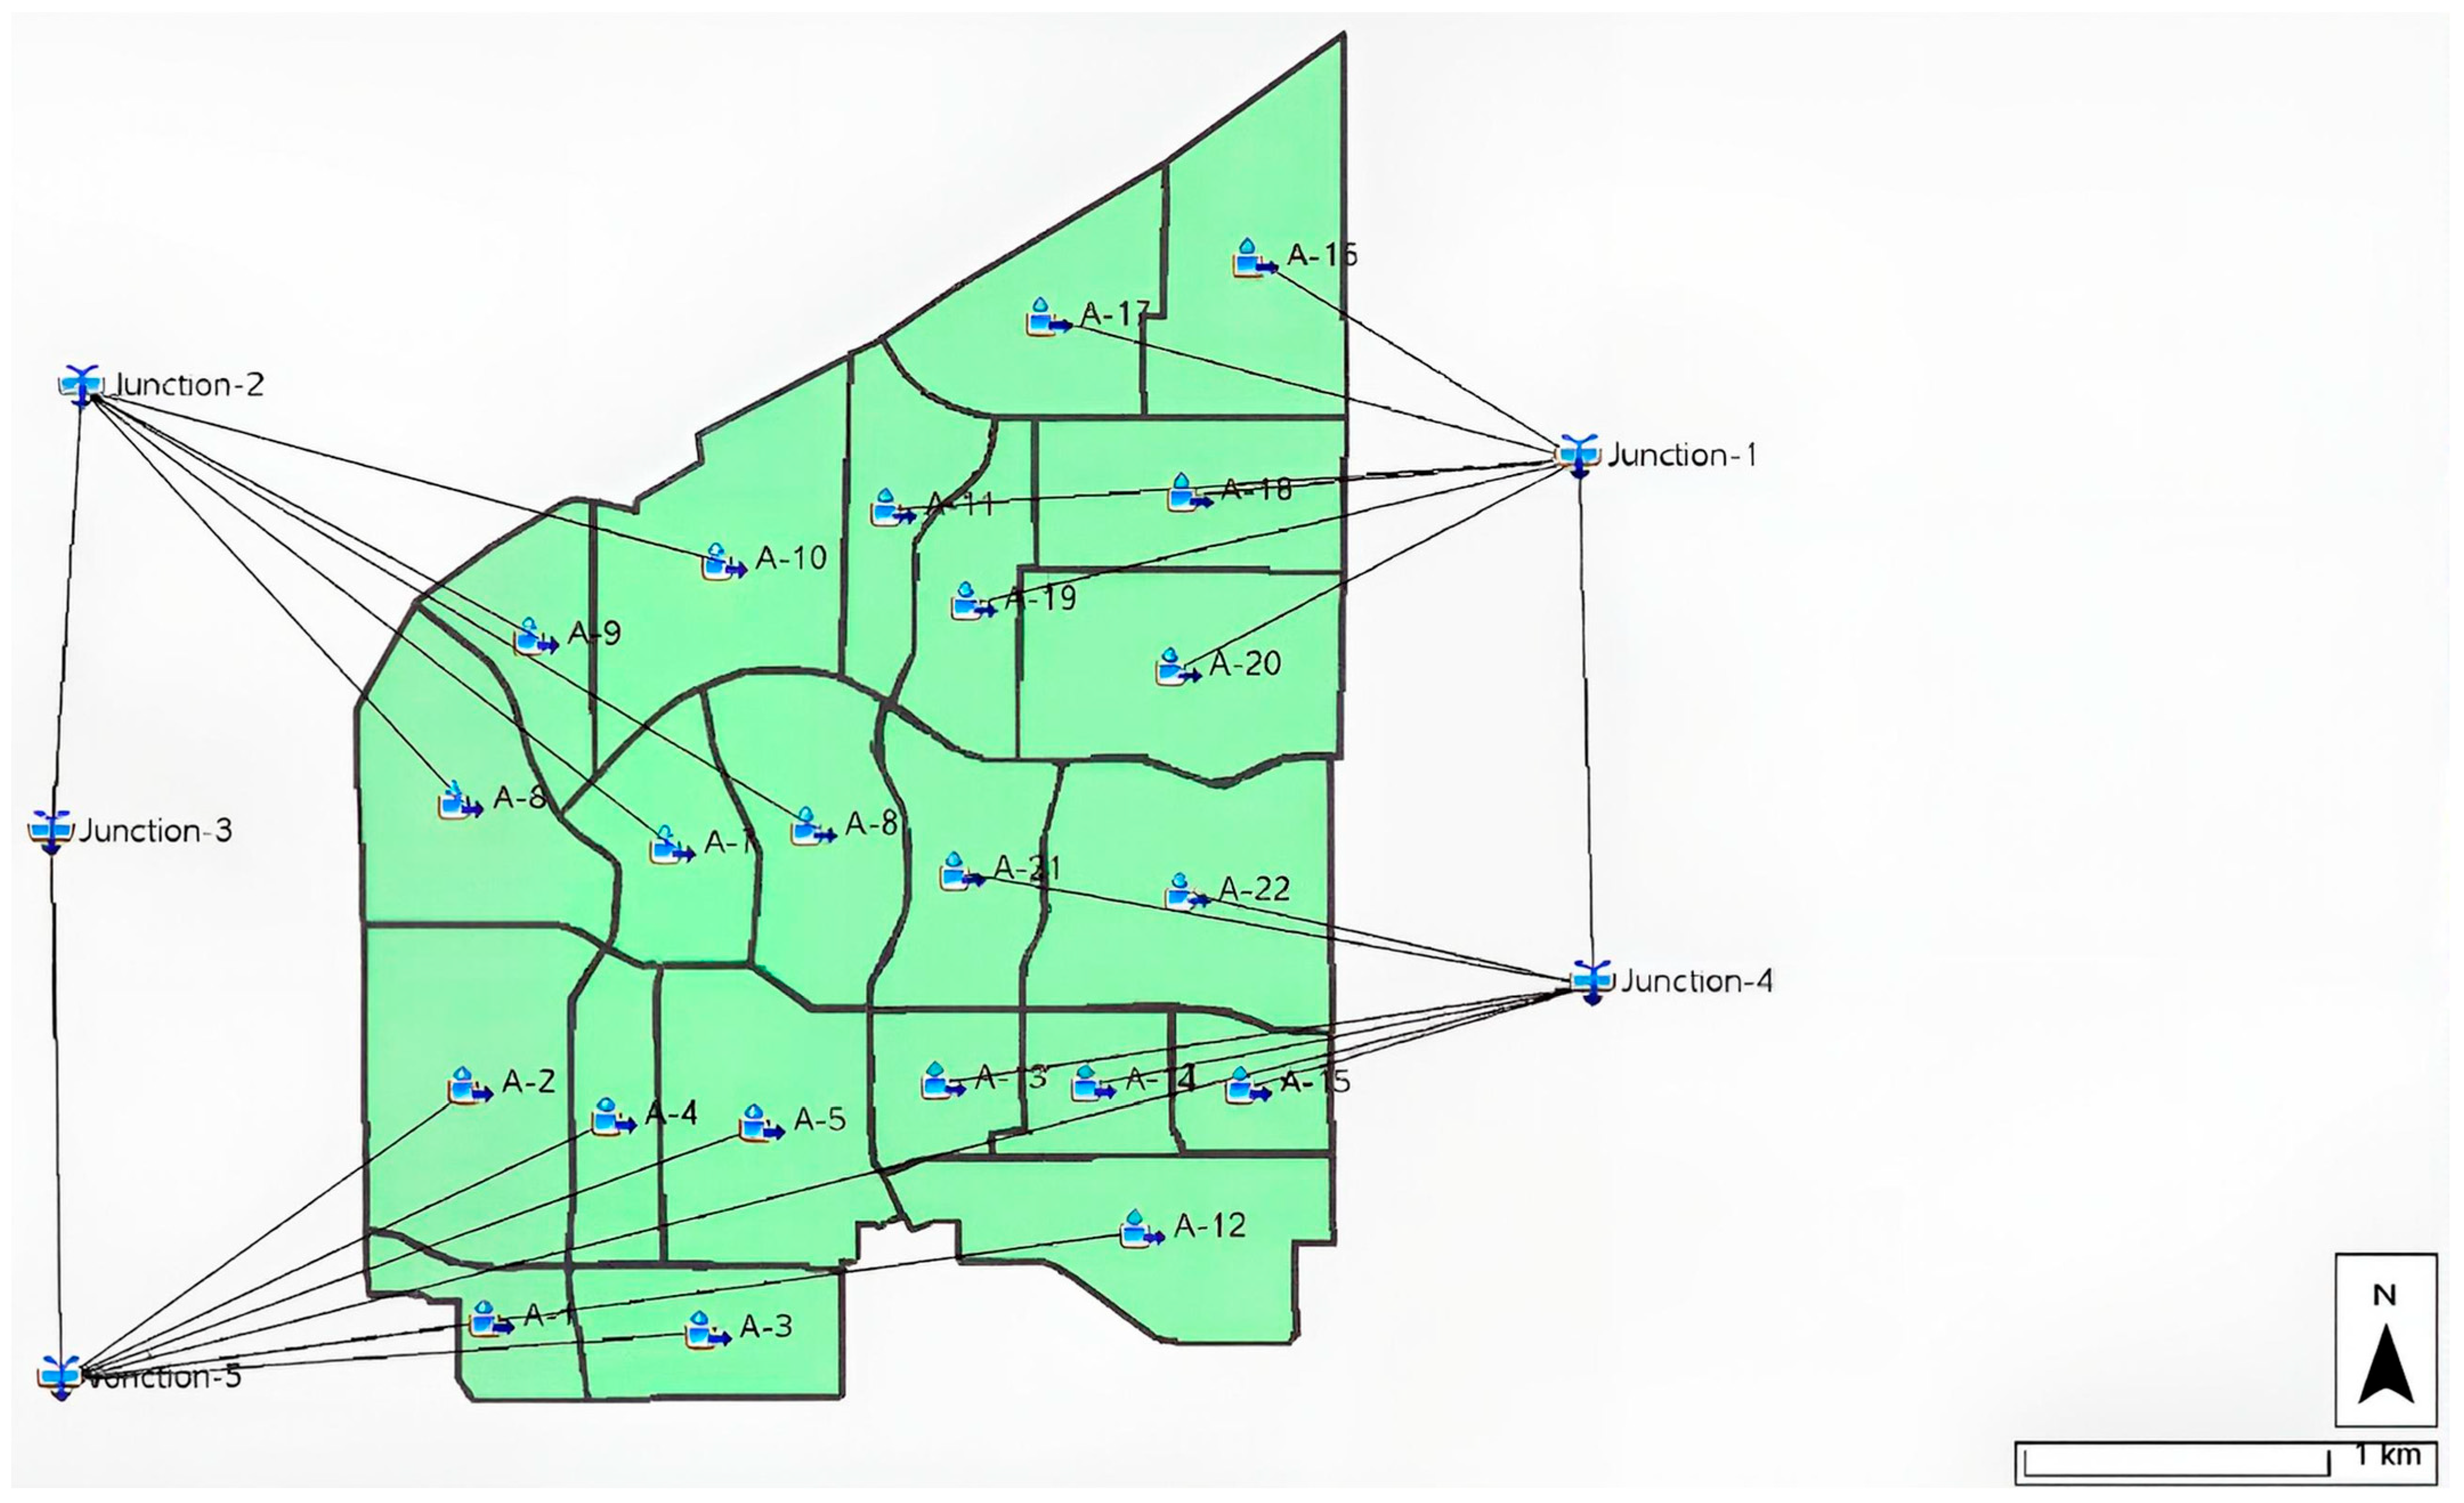
The HEC-HMS model encompasses all 22 basins and five junctions (Figure 8). Each intersection quantifies flow between two to five subbasins, and the final junction in the model is connected to all other junctions to compute the total volume generated.
Figure 8.
Schematic representation of the HEC-HMS hydrological model structure, illustrating delineated sub-basins and junction nodes used in the simulation.
Once the basin model was completed, meteorological and control specifications were incorporated to run simulations. Each run used a different storm frequency, ranging from 1-year to 50-year, and incorporated the equations and rainfall depths from the EPDDM [31] for the central drainage region of El Paso. Each run generated the total runoff volume and peak flow.
For the RWH analysis, each run used the same basin model, with characteristics and control specifications developed in the HEC-HMS framework. The only change made was the addition of an initial abstraction for each subbasin. Each run using one of the eight frequency storms yielded the results shown in Table 5. Smaller-range frequency storms, such as 1-, 2-, and 5-year storms, are more likely to occur because their rainfall depths have higher probabilities; for example, a 5-year storm has a 20% probability of occurrence. The peak discharge generated in a 1-Year storm was 6 m3/s compared to the peak discharge of 123.4 m3/s for a 50-year storm (Table 5). While the peak discharge for a 1-Year storm was more manageable, the peak discharge for a 50-Year storm enables evaluation of the feasibility of mitigating other storms.
Table 5.
HEC-HMS Peak Discharge and Volume Results.
3.3. Degree of Implementation
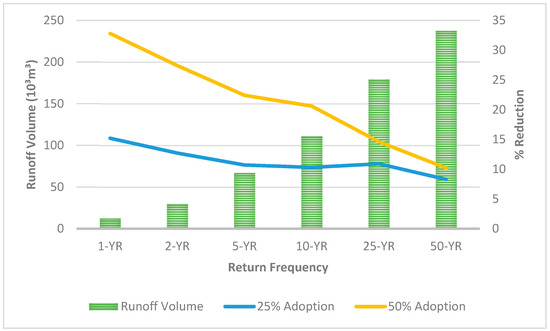
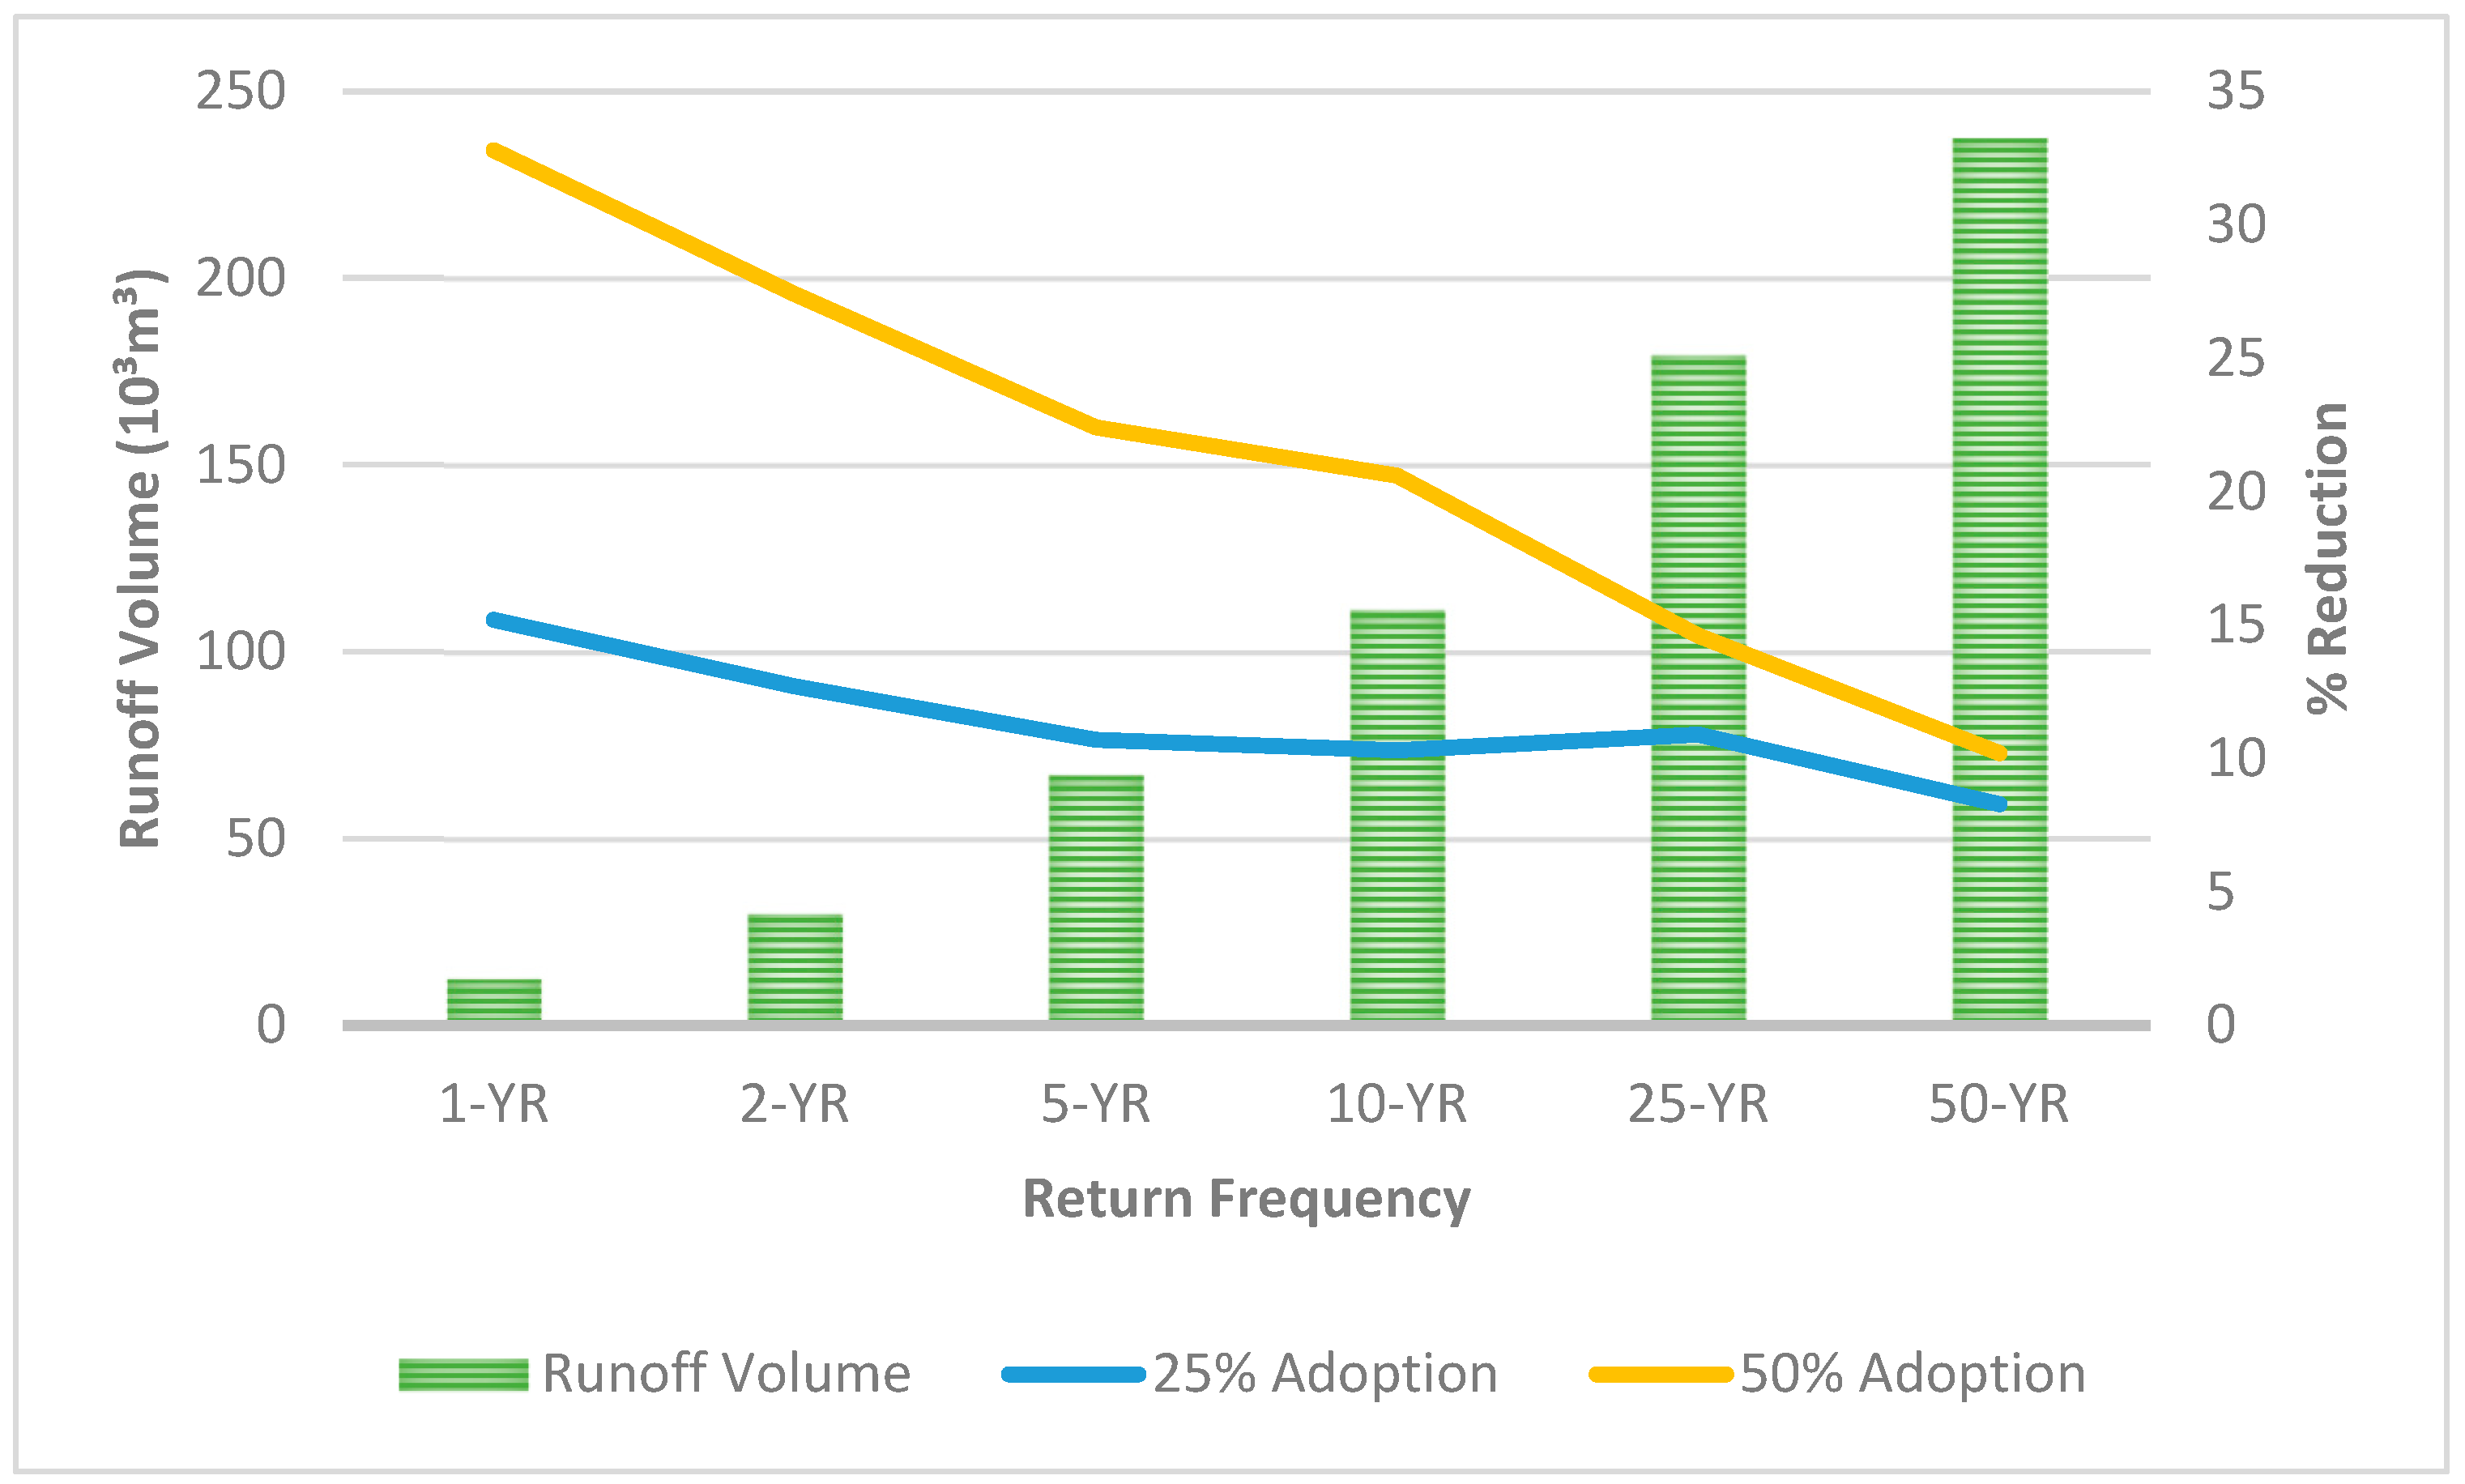
The effect of distributed RWH implementation was evaluated using two potential adoption levels (25% and 50%) and a fixed tank size of 4 m3. The levels represent conservative yet realistic participation rates. For each 1 h design storm, the modified initial abstraction was applied to the hydrological model to represent water retained by rooftop capture and the results were compared with those under the baseline condition without RWH. The percentage of roof-generated runoff captured under each storm scenario is shown in Figure 9, illustrating how adoption levels influence rooftop capture across the 1 h design storms (Figure 9).
Figure 9.
Percentage of Total Runoff Reduced by Rooftop Storage under Different Adoption Scenarios based on a 4 m3 tank size.
Under a 25% adoption, it was determined that for the more common storms, 1-year and 2-year, there is a significant decrease in runoff from 12.5 m3 to 9.2 m3 and from 29.9 m3 to 24.1 m3, respectively (Figure 9). All runoff volumes are reported in units of 1000 m3, consistent with HEC-HMS output. The decrease is more pronounced for events of 5 and 10-year recurrence. When adoption increases from 25% to 50%, runoff reductions become more pronounced from 12.5 m3 to 7.1 m3 and from 29.9 m3 to 19.9 m3, representing reductions of 43.2% to 33.4% in runoff. For storms with recurrence rates of 5 and 10 years there is still a reduction but only about 11.87–13.43% for 25% adoption, with the decrease being approximately 20–25% when adoption increases to 50% (Figure 9).
3.4. RWH Storage Tank Scenarios
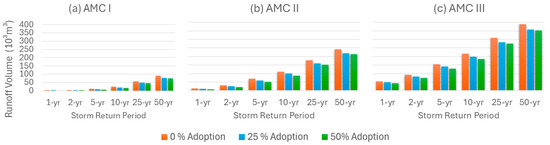
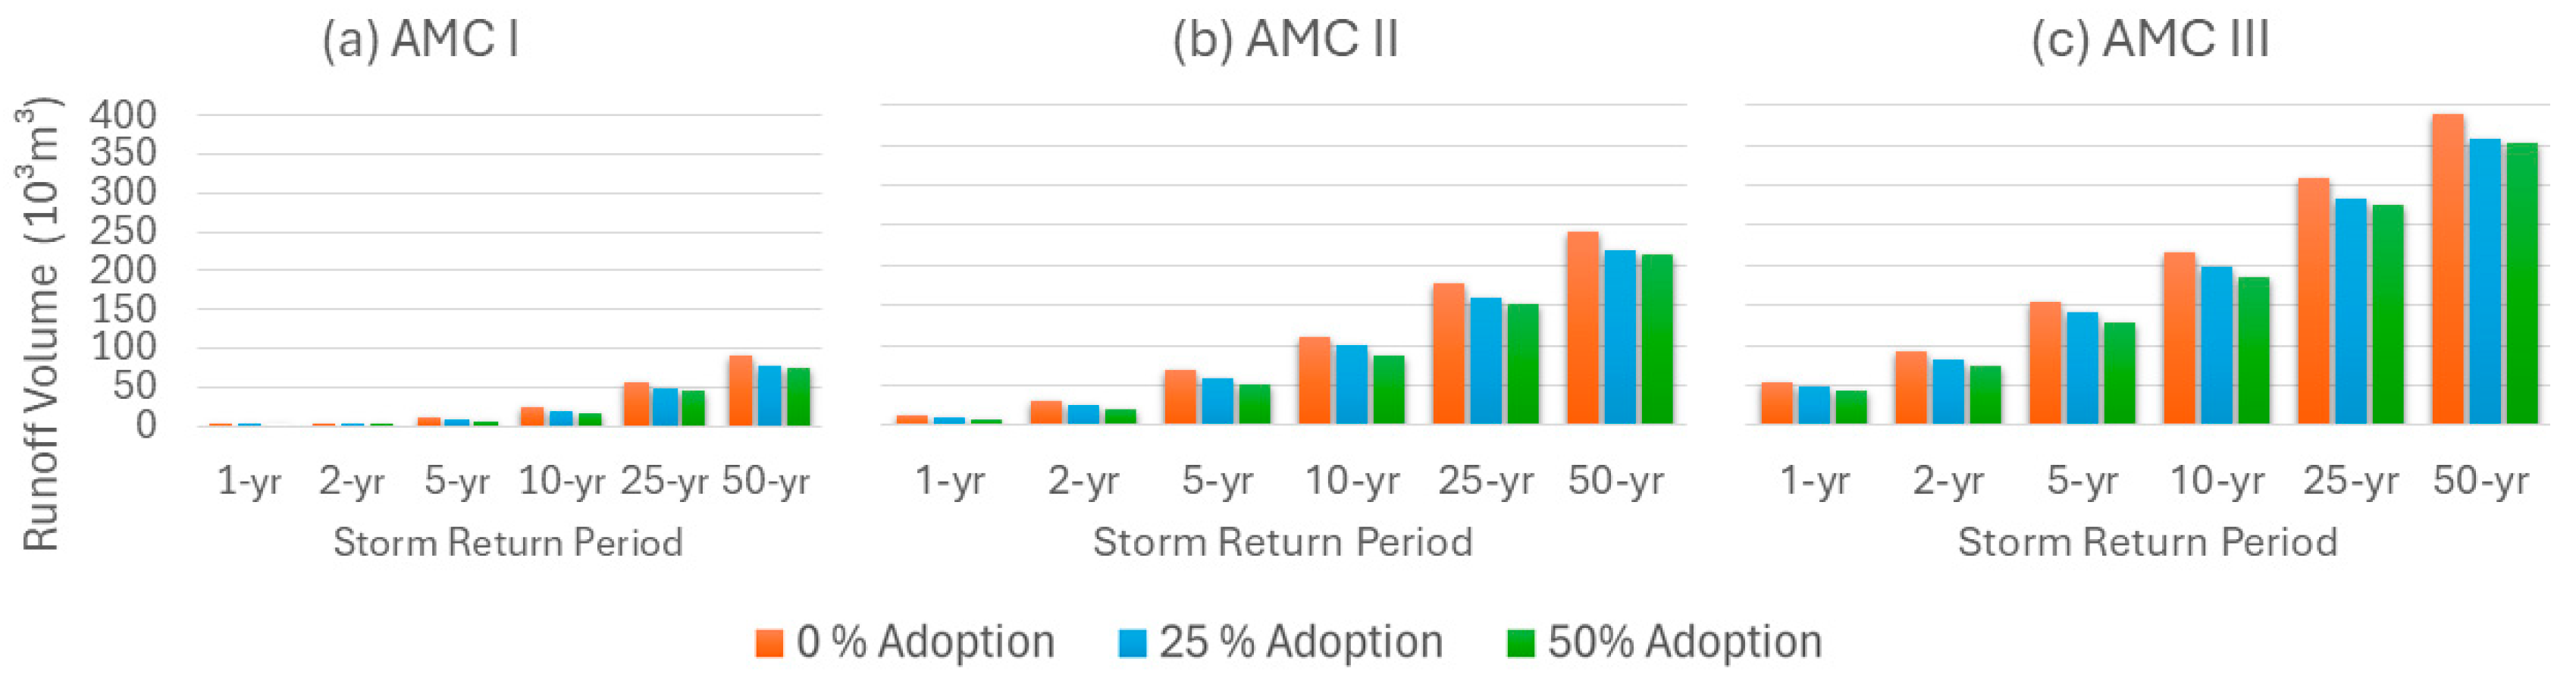
To account for factors influencing runoff volume, this analysis considered three antecedent conditions. AMC-I denotes “dry” conditions, under which the watershed is assumed to absorb a larger share of the initial abstraction. AMC- II represents average conditions, whereas AMC-III represents “wet” or saturated conditions that limit infiltration and increase runoff potential. CNs were adjusted accordingly using Equations (1) and (2). For storm frequencies ranging from 1 to 50 years, the “base” model with no RWH produces the greatest runoff under AMC-III and significantly less runoff under AMC-I (Figure 10a–c). Incorporating RWH at 25% and 50% adoption levels results in a notable reduction in runoff volume with the greatest decrease at 25% (Figure 10). Although further reductions are observed at 50% adoption, the incremental benefit is smaller due to the fixed storage capacity of 4 m3 (Figure 10). In this framework, not only are the area’s existing conditions considered but also the runoff generated by the same storm, which determines the amount of water that can be captured through RWH.
Figure 10.
Runoff volume under (a) AMC I, (b) AMC II, and (c) AMC III conditions for 1-, 2-, 5-, 10-, 25-, and 50-year storm return periods. Bars represent RWH adoption scenarios of 0%, 25%, and 50%.
3.5. Sensitivity to Climate Change and Population Growth
The results presented in this study are based on stationary rainfall data and current land-use conditions. Changes such as increased rainfall due to climate change could affect the previously calculated runoff volumes and, in turn, increase the storage requirements for RWH systems. For example, if rainfall increased by 10%, the projected 4 m3 tank would need to be increased to 4.4 m3. Similarly, continued urbanization and population growth are expected to increase impervious coverage, amplifying stormwater volumes. While this analysis provides a helpful baseline for evaluating the potential effectiveness of RWH under different conditions, these factors underscore the importance of incorporating climate change, land-use change, and population growth projections into subsequent analyses. Doing so would allow for a more comprehensive assessment of the scalability of RWH strategies under changing hydrologic and urban conditions.
4. Conclusions
This study demonstrated how GIS and HEC-HMS can be integrated to evaluate the feasibility and effectiveness of active RWH systems for mitigating urban flooding. Results indicate that residential RWH can meaningfully reduce runoff volumes even under conservative participation scenarios (Figure 9 and Figure 10). At 25% adoption, runoff reductions ranged from approximately 10–13% during frequent storms, while increasing adoption to 50% yielded larger reductions of 12–25%. For less frequent 5- and 10-year storms, reductions were smaller but still notable, reflecting storage limitations during higher-intensity events. Antecedent moisture conditions further influenced performance, with wetter conditions generating higher runoff volumes and filling storage more rapidly, thereby reducing the relative capture potential compared to dry conditions (Figure 10). The reported runoff reductions represent watershed-scale reductions in outlet volume and should be interpreted as indicators of potential flood mitigation rather than direct reductions in street-level inundation depth or extent. For the AOI, the watershed-scale approach is supported to evaluate the local volumetric impacts of RWH. As this framework is applied to a larger city-wide application, hydraulic modeling will be incorporated to explicitly link runoff volume reduction to changes in inundation depth, extent, and overflow behavior.
This study also demonstrated that decentralized RWH is a viable and scalable strategy for reducing localized flooding in semi-arid urban environments such as El Paso. By integrating land-cover mapping, roof-area estimation, and hydrological modeling, a streamlined framework was developed that enabled direct comparison of rooftop storage capacity and storm runoff. Key findings include the model’s scalability across various adoption scenarios achieved through community participation and thereby serving as a modular solution for urban stormwater management. Additionally, the developed workflow provides a replicable approach for other municipalities to assess the potential of RWH using essential hydrological input parameters.
RWH was modeled by increasing the initial abstraction (Ia) in the SCS–CN loss method with Ia limited to the available rooftop storage volume of 4 m3 per household. This method removes rooftop rainfall before runoff forms but it does not simulate tank overflow or changes in storage and discharge over time. When the tank is full, any extra rainfall is added back to surface runoff, without considering when or how the overflow happens. This means the model captures reductions in runoff volume at the catchment level, but it simplifies the effects on peak flow, flood depth, and flow paths during larger storms. Future studies will include detailed tank storage and hydraulic routing to better measure overflow and downstream flooding.
This study developed a transferable GIS-based framework coupled with HEC-HMS to evaluate the potential of distributed rooftop RWH in an AOI. The approach quantified runoff reductions at the subbasin scale. Future work will incorporate a city-wide hydraulic model to further investigate street-level inundation and flow conveyance within larger urban drainage networks.
This study provided a framework that can be replicated using land-cover and soil-type data along with local drainage and rainfall data to other regions. RWH performance is expected to vary with regional climatology, rainfall frequency, roof density, and urban composition, particularly in coastal or wetter regions where storage availability and drainage dynamics might differ.
To fully evaluate RWH as a stormwater mitigation strategy on a larger scale, future research must compare its performance with other broader GI options like rain gardens, bioswales, and permeable pavement, which promote infiltration but often require larger land areas and ongoing maintenance [34,35]. Broader adoption will depend on supportive policies and incentive programs that promote RWH, such as rebate initiatives in Arizona that provide monetary assistance to offset upfront installation costs [36]. In addition to financial support, workshops and demonstrations can not only educate communities but also promote participation.
While this study demonstrates that RWH can provide measurable reductions in runoff volume, real-world implementation depends on social, economic, and institutional factors. Previous research shows that RWH is often adopted out of necessity due to water scarcity or cost savings, rather than as a proactive, pro-environmental strategy [18,37,38]. Understanding public perceptions is therefore critical, as awareness, knowledge, and attitudes strongly influence adoption decisions [37].
Case studies from Austin, Tucson, and Portland indicate that high upfront installation costs remain the primary barrier to residential RWH adoption even where rebates are available, while ongoing maintenance responsibilities further limit participation, particularly for active systems [39]. Cities like Tucson, Arizona, that combine financial incentives with regulatory integration and public education have shown the greatest success in overcoming these barriers. This is consistent with our findings, where 72% of respondents in the AOI expressed willingness to adopt RWH [28]. These results indicate that the hydrologic benefits identified in this study are technically achievable, but their realization at scale will depend on coordinated policy support, targeted incentives, and public outreach efforts.
Within this broader policy and implementation context it is crucial to clearly define the scope of the present analysis. This study focused on the first step of quantifying the potential capture volume from rooftops across different storm events while demonstrating the magnitude of this potential is an essential prerequisite for building community interest and policy support.
Finally, future work will refine the RWH representation by incorporating tank continuity and household water-use scenarios to capture storage availability between storm events better. The GIS and machine learning (ML) components will be expanded by using more advanced classification techniques and sensitivity analyses to improve model robustness and overall system representation.
Author Contributions
Conceptualization, I.S.; Methodology, I.L.; Writing—original draft, I.L.; Writing—review & editing, I.S.; Supervision, I.S.; Funding acquisition, I.S. All authors have read and agreed to the published version of the manuscript.
Funding
This study was supported by The National Oceanic and Atmospheric Administration (NOAA)—Cooperative Science Center (CSC) for Earth System Sciences and Remote Sensing Technologies (CESSRST-II) under the Cooperative Agreement Award #NA22SEC4810016.
Data Availability Statement
The original contributions presented in this study are included in the article. Further inquiries can be directed at the corresponding authors.
Acknowledgments
We would like to thank the NOAA Office of Education, the Educational Partnership Program with Minority Serving Institutions (NOAA-EPP/MSI) and the NOAA-CESSRST-II for providing us with full fellowship support. The statements, findings, conclusions and recommendations are those of the authors and do not necessarily reflect the views of NOAA.
Conflicts of Interest
The authors declare no conflicts of interest. The funders had no role in the design of the study, in the collection, analysis, or interpretation of data, in the writing of the manuscript, or in the decision to publish the results.
Abbreviations
The following abbreviations are used in this manuscript:
| RWH | Rainwater Harvesting |
| HEC-HMS | Hydrologic Engineering Center-Hydrologic Modeling System |
| GIS | Geographic Information System |
| CN | Curve Number |
| LID | Low-Impact Development |
| ML | Machine Learning |
References
- Gilroy, K.L.; McCuen, R.H. Spatio-temporal effects of low impact development practices. J. Hydrol. 2009, 367, 228–236. [Google Scholar] [CrossRef] [Scilit]
- Moftakhari, H.R.; AghaKouchak, A.; Sanders, B.F.; Allaire, M.; Matthew, R.A. What Is Nuisance Flooding? Defining and Monitoring an Emerging Challenge. Water Resour. Res. 2018, 54, 4218–4227. [Google Scholar] [CrossRef] [Scilit]
- Vega, A.J.; Miller, P.W.; Rohli, R.V.; Heavilin, J. Synoptic climatology of nuisance flooding along the Atlantic and Gulf of Mexico coasts, USA. Nat. Hazards 2020, 105, 1281–1297. [Google Scholar] [CrossRef] [Scilit]
- Bakhrel, U.; Brake, N.; Feizbahr, M.; Kim, Y.J.; Asli, H.H.; Haselbach, L.; Macon, S.J. Identifying Urban Pluvial Frequency Flooding Hotspots Using the Topographic Control Index and Remote Sensing Radar Images for Early Warning Systems. Water 2025, 17, 3500. [Google Scholar] [CrossRef] [Scilit]
- Falconer, R.; Cobby, D.; Smyth, P.; Astle, G.; Dent, J.; Golding, B. Pluvial flooding: New approaches in flood warning, mapping and risk management. J. Flood Risk Manag. 2009, 2, 198–208. [Google Scholar] [CrossRef] [Scilit]
- Moftakhari, H.R.; AghaKouchak, A.; Sanders, B.F.; Matthew, R.A. Cumulative hazard: The case of nuisance flooding. Earth’s Future 2017, 5, 214–223. [Google Scholar] [CrossRef] [Scilit]
- Cristiano, E.; Farris, S.; Deidda, R.; Viola, F. Comparison of blue-green solutions for urban flood mitigation: A multi-city large-scale analysis. PLoS ONE 2021, 16, e0246429. [Google Scholar] [CrossRef] [Scilit] [PubMed]
- Qin, Y. Urban Flooding Mitigation Techniques: A Systematic Review and Future Studies. Water 2020, 12, 3579. [Google Scholar] [CrossRef] [Scilit]
- Department of Environmental Resources. Low-Impact Development Design Strategies. 1999. Available online: https://cfpub.epa.gov/watertrain/pdf/LID_National_Manual.pdf (accessed on 15 November 2025).
- U.S. Environmental Protection Agency (EPA). Nonpoint Source: Urban Areas. 1 August 2025. Available online: https://www.epa.gov/nps/nonpoint-source-urban-areas (accessed on 15 November 2025).
- Maliva, R.G. Low Impact Development and Rainwater Harvesting. In Anthropogenic Aquifer Recharge; Springer Hydrogeology: Berlin/Heidelberg, Germany, 2020. [Google Scholar] [CrossRef] [Scilit]
- Solloway, C. Rainwater Harvesting-Conservation, Credit, Codes and Cost Literature Review. 2013. Available online: https://www.epa.gov/sites/default/files/2015-11/documents/rainharvesting.pdf (accessed on 15 November 2025).
- Texas Water Development Board. The Texas Manual on Rainwater Harvesting. 2005. Available online: https://www.twdb.texas.gov/publications/brochures/conservation/doc/RainwaterHarvestingManual_3rdedition.pdf (accessed on 15 November 2025).
- Crosson, C.; Tong, D.; Zhang, Y.; Zhong, Q. Rainwater as a renewable resource to achieve net zero urban water in water stressed cities. Resour. Conserv. Recycl. 2021, 164, 105203. [Google Scholar] [CrossRef] [Scilit]
- Daily, C. Passive Rainwater Harvesting. 2014. Available online: https://wrrc.arizona.edu/publication/passive-water-harvesting (accessed on 15 November 2025).
- Kinkade-Levario, H. Design for Water: Rainwater Harvesting, Stormwater Catchment, and Alternate Water Reuse; New Society Publishers: Gabriol, BC, Canada, 2007. [Google Scholar]
- Lepcha, R.; Patra, S.K.; Ray, R.; Thapa, S.; Baral, D.; Saha, S. Rooftop rainwater harvesting a solution to water scarcity: A review. Groundw. Sustain. Dev. 2024, 26, 101305. [Google Scholar] [CrossRef] [Scilit]
- Melville-Shreeve, P.; Ward, S.; Butler, D. Rainwater Harvesting Typologies for UK Houses: A Multi Criteria Analysis of System Configurations. Water 2016, 8, 129. [Google Scholar] [CrossRef] [Scilit]
- Teston, A.; Scolaro, T.P.; Maykot, J.K.; Ghisi, E. Comprehensive Environmental Assessment of Rainwater Harvesting Systems: A Literature Review. Water 2022, 14, 2716. [Google Scholar] [CrossRef] [Scilit]
- Zahmatkesh, Z.; Burian, S.J.; Karamouz, M.; Tavakol-Davani, H.; Goharian, E. Low-Impact Development Practices to Mitigate Climate Change Effects on Urban Stormwater Runoff: Case Study of New York City. J. Irrig. Drain. Eng. 2015, 141, 04014043. [Google Scholar] [CrossRef] [Scilit]
- Adham, A.; Sayl, K.N.; Abed, R.; Abdeladhim, M.A.; Wesseling, J.G.; Riksen, M.; Fleskens, L.; Karim, U.; Ritsema, C.J. A GIS-based approach for identifying potential sites for harvesting rainwater in the Western Desert of Iraq. Int. Soil Water Conserv. Res. 2018, 6, 297–304. [Google Scholar] [CrossRef] [Scilit]
- Preeti, P.; Rahman, A. Application of GIS in Rainwater Harvesting Research: A Scoping Review. Asian J. Water Environ. Pollut. 2021, 18, 29–35. [Google Scholar] [CrossRef] [Scilit]
- Zhong, Q.; Tong, D.; Crosson, C.; Zhang, Y. A GIS-based approach to assessing the capacity of rainwater harvesting for addressing outdoor irrigation. Landsc. Urban Plan. 2022, 223, 104416. [Google Scholar] [CrossRef] [Scilit]
- Ndeketeya, A.; Dundu, M. Application of HEC-HMS Model for Evaluation of Rainwater Harvesting Potential in a Semi-arid City. Water Resour. Manag. 2021, 35, 4217–4232. [Google Scholar] [CrossRef] [Scilit]
- Bedient, P.B.; Huber, W.C.; Vieux, B.E. Hydrology and Floodplain Analysis. J. Am. Water Resour. Assoc. 2013, 38, 1169. [Google Scholar]
- Environmental Systems Research Institute (ESRI). ArcGIS Pro (Version 3.1). Available online: https://www.esri.com/en-us/arcgis/products/arcgis-pro/overview (accessed on 15 November 2025).
- U.S. Army Corps of Engineers Hydrologic Engineering Center. HEC-HMS Hydrologic Modeling System User’s Manual (Version 4.10). 2021. Available online: https://www.hec.usace.army.mil/software/hec-hms/documentation.aspx (accessed on 15 November 2025).
- Lopez, I.; Santiago, I. How Active Rainwater Harvesting May Help Reduce Nuisance Flooding: Flood Analysis and Social Barriers to Adoption. In Proceedings of the 2023 ASEE Annual Conference & Exposition, Baltimore, MD, USA, 25–28 June 2023. [Google Scholar] [CrossRef] [Scilit]
- Urban Hydrology for Small Watersheds TR-55. 1986. Available online: https://www.nrc.gov/docs/ML1421/ML14219A437.pdf (accessed on 15 November 2025).
- Aerial Photography Field Office, USDA Farm Service Agency; U. S. Department of Agriculture. National Agriculture Imagery Program (NAIP) Imagery. 2022. Available online: https://datagateway.nrcs.usda.gov/ (accessed on 15 November 2025).
- City of El Paso. Stormwater Design Manual. 2022. Available online: https://www.elpasotexas.gov/assets/Documents/CoEP/Planning-and-Inspections/Planning-Divisions/Combined-Storm-Water-Design-Manual.pdf (accessed on 15 November 2025).
- NWS-NOAA. NOAA Online Weather Data. Available online: https://www.weather.gov/wrh/Climate?wfo=epz (accessed on 15 November 2025).
- Texas Department of Transportation. (-09). Hydraulic Design Manual—Chapter 4. Available online: https://ftp.txdot.gov/pub/txdot/crossroads/des/documents/h-h-section/hh-2019-hdm.pdf (accessed on 15 November 2025).
- Heidari, B.; Schmidt, A.R.; Minsker, B. Cost/benefit assessment of green infrastructure: Spatial scale effects on uncertainty and sensitivity. J. Environ. Manag. 2022, 302, 114009. [Google Scholar] [CrossRef] [Scilit]
- Kuruppu, U.; Rahman, A.; Rahman, M.A. Permeable pavement as a stormwater best management practice: A review and discussion. Environ. Earth Sci. 2019, 78, 327. [Google Scholar] [CrossRef] [Scilit]
- City of Tucson. Low-Income Conservation Programs. Available online: https://www.tucsonaz.gov/Departments/Water/Conservation/Low-Income-Conservation-Programs (accessed on 15 November 2025).
- Gerlak, A.K.; Elder, A.; Thomure, T.; Shipek, C.; Zuniga-Teran, A.; Pavao-Zuckerman, M.; Gupta, N.; Matsler, M.; Berger, L.; Henry, A.D.; et al. Green Infrastructure: Lessons in Governance and Collaboration from Tucson. Environ. Sci. Policy Sustain. Dev. 2021, 63, 15–24. [Google Scholar] [CrossRef] [Scilit]
- Ranasingha, C.M.; Wattage, P. Rainwater Harvesting (RWH) Systems: Is the Conservation of Water in Colombo Urban Areas Worth It? Conservation 2024, 4, 23–35. [Google Scholar] [CrossRef] [Scilit]
- Fricano, R.J.; Grass, A.K. Evaluating American Rainwater Harvesting Policy: A Case Study of Three U.S. Cities. J. Sustain. Dev. 2014, 7, 133. [Google Scholar] [CrossRef] [Scilit]

Disclaimer/Publisher’s Note: The statements, opinions and data contained in all publications are solely those of the individual author(s) and contributor(s) and not of MDPI and/or the editor(s). MDPI and/or the editor(s) disclaim responsibility for any injury to people or property resulting from any ideas, methods, instructions or products referred to in the content. |
© 2026 by the authors. Licensee MDPI, Basel, Switzerland. This article is an open access article distributed under the terms and conditions of the Creative Commons Attribution (CC BY) license.