


Abstract
The combined effects of climate change and socio-economic development have intensified the risk of water supply–demand imbalance in China. To project future trends, this study develops a multi-scenario coupled prediction framework integrating climate, socio-economic, and human activity drivers, combining data-driven and physically based modeling approaches to assess terrestrial water storage imbalance in nine major river basins under six representative SSP–RCP scenarios through the end of the 21st century. Using ISIMIP multi-model runoff outputs along with GDP and population projections, agricultural, industrial, and domestic water demands were estimated. A Water Conflict Index was proposed by integrating the Water Supply–Demand Stress Index and the Standardized Hydrological Runoff Index to identify high-risk basins. Results show that under high-emission scenarios, the WCI in the Yellow River, Hai River, and Northwest Rivers remains high, peaking during 2040–2069, while low-emission scenarios significantly alleviate stress in most basins. Water allocation inequity is mainly driven by insufficient supply in arid northern regions and limited redistribution capacity in resource-rich southern basins. Targeted strategies are recommended for different risk types, including inter-basin water transfer, optimization of water use structure and pricing policies, and the development of resilient management systems, providing scenario-based quantitative support for future water security and policy-making in China.
1. Introduction
Global freshwater systems are under mounting stress from rapid population growth, intensified socio-economic activity, and a warming climate [1]. Between 1900 and 2010, annual global water withdrawals surged from about 500 km3 to nearly 4000 km3, while per capita renewable freshwater availability declined by roughly 60% since 1961, a rate far exceeding natural recharge capacity [2,3]. This widening gap between supply and demand has transformed water security from a regional concern into a global challenge that directly threatens food production, ecosystem stability, and sustainable development [4]. China epitomizes these global pressures [5]. Although it supports 21% of the world’s population, the nation possesses only about 6% of global freshwater resources, leaving per capita availability at merely one-quarter of the world’s average [6]. The challenge is compounded by a striking north–south contrast in water distribution. Southern basins such as the Yangtze and Pearl Rivers receive abundant precipitation (annual mean > 1200 mm) yet frequently endure floods, whereas northern basins, including the Yellow, Huai, and Hai Rivers, receive less than 600 mm annually but sustain nearly 45% of the country’s agricultural irrigation [7]. As a result, the North China Plain has become a hotspot of groundwater overexploitation, with the affected area exceeding 180,000 km2 [8,9,10]. Intensifying extremes of droughts and floods further aggravate these imbalances, making cross-basin regulation and scientifically grounded allocation urgent prerequisites for national water security [11,12].
China’s water use profile is also undergoing a profound transformation alongside rapid urbanization and industrial restructuring. According to the China Water Resources Bulletin (2023), agricultural water use has remained relatively stable at 61–63% of total consumption from 2010 to 2022, but industrial use fell sharply from 24% to 16%, while domestic and ecological demands continued to climb [13,14]. These structural shifts imply that future water allocation will be influenced not only by climatic variability but also by evolving patterns of urban growth, industrial upgrading, and ecosystem protection, rendering water management decisions increasingly complex [15].
Forecasting future terrestrial water storage (TWS), a key indicator linking water supply, food security, and ecological stability, has traditionally relied on two distinct paradigms [16]. Data-driven methods integrate satellite observations such as Gravity Recovery and Climate Experiment (GRACE)/GRACE-Follow On (GRACE-FO) and Sentinel radar with machine learning to capture nonlinear relationships between TWS and climate, excelling in short-term forecasting but lacking physical interpretability [17,18]. Physically based hydrological models, driven by GCM/RCM climate projections and tools such as SWAT, offer process-level rigor and scenario flexibility, yet are sensitive to parameterization and computationally demanding [19,20]. Despite important advances, most studies remain confined to individual basins and rarely represent the dynamic cross-basin interactions that dominate China’s water cycle [21,22]. Moreover, few frameworks comprehensively integrate the coupled effects of climate change, socio-economic growth, and human water use behavior, which jointly determine future water storage imbalance [23].
These limitations hinder accurate identification of high-risk regions and impede the development of effective mitigation strategies. Addressing this gap requires an integrated framework capable of multi-scenario, multi-basin coupled simulation that merges the predictive power of data-driven methods with the process realism of physically based models [24,25]. To meet this challenge, this study develops a multi-scenario coupled prediction framework that unites climate projections, socio-economic drivers, and human activity indicators. The framework projects runoff across China’s nine major river basins using ISIMIP multi-model outputs under six representative scenarios through the end of the 21st century, estimates sectoral demands for agricultural, industrial, and domestic water using GDP and population trajectories, and introduces composite metrics, including a Water Stress Index (WSDSI) and a Water Conflict Index (WCI), to quantify supply–demand imbalance and identify basins at highest risk.
By revealing how climate forcing and socio-economic development jointly shape future TWS, this research provides actionable guidance for cross-basin water allocation strategies. The findings are expected to inform the 14th Five-Year Water Resources Allocation Plan and the National Comprehensive Water Resources Plan 2035, offering quantitative, scenario-based evidence to support long-term water security policy-making.
2. Materials and Data
2.1. Study Area
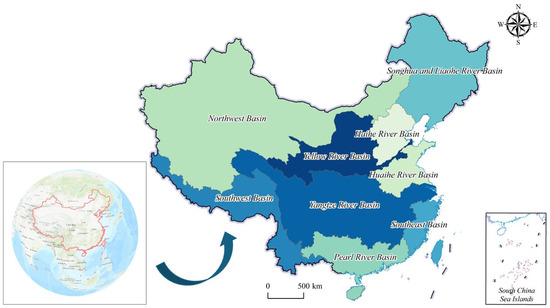
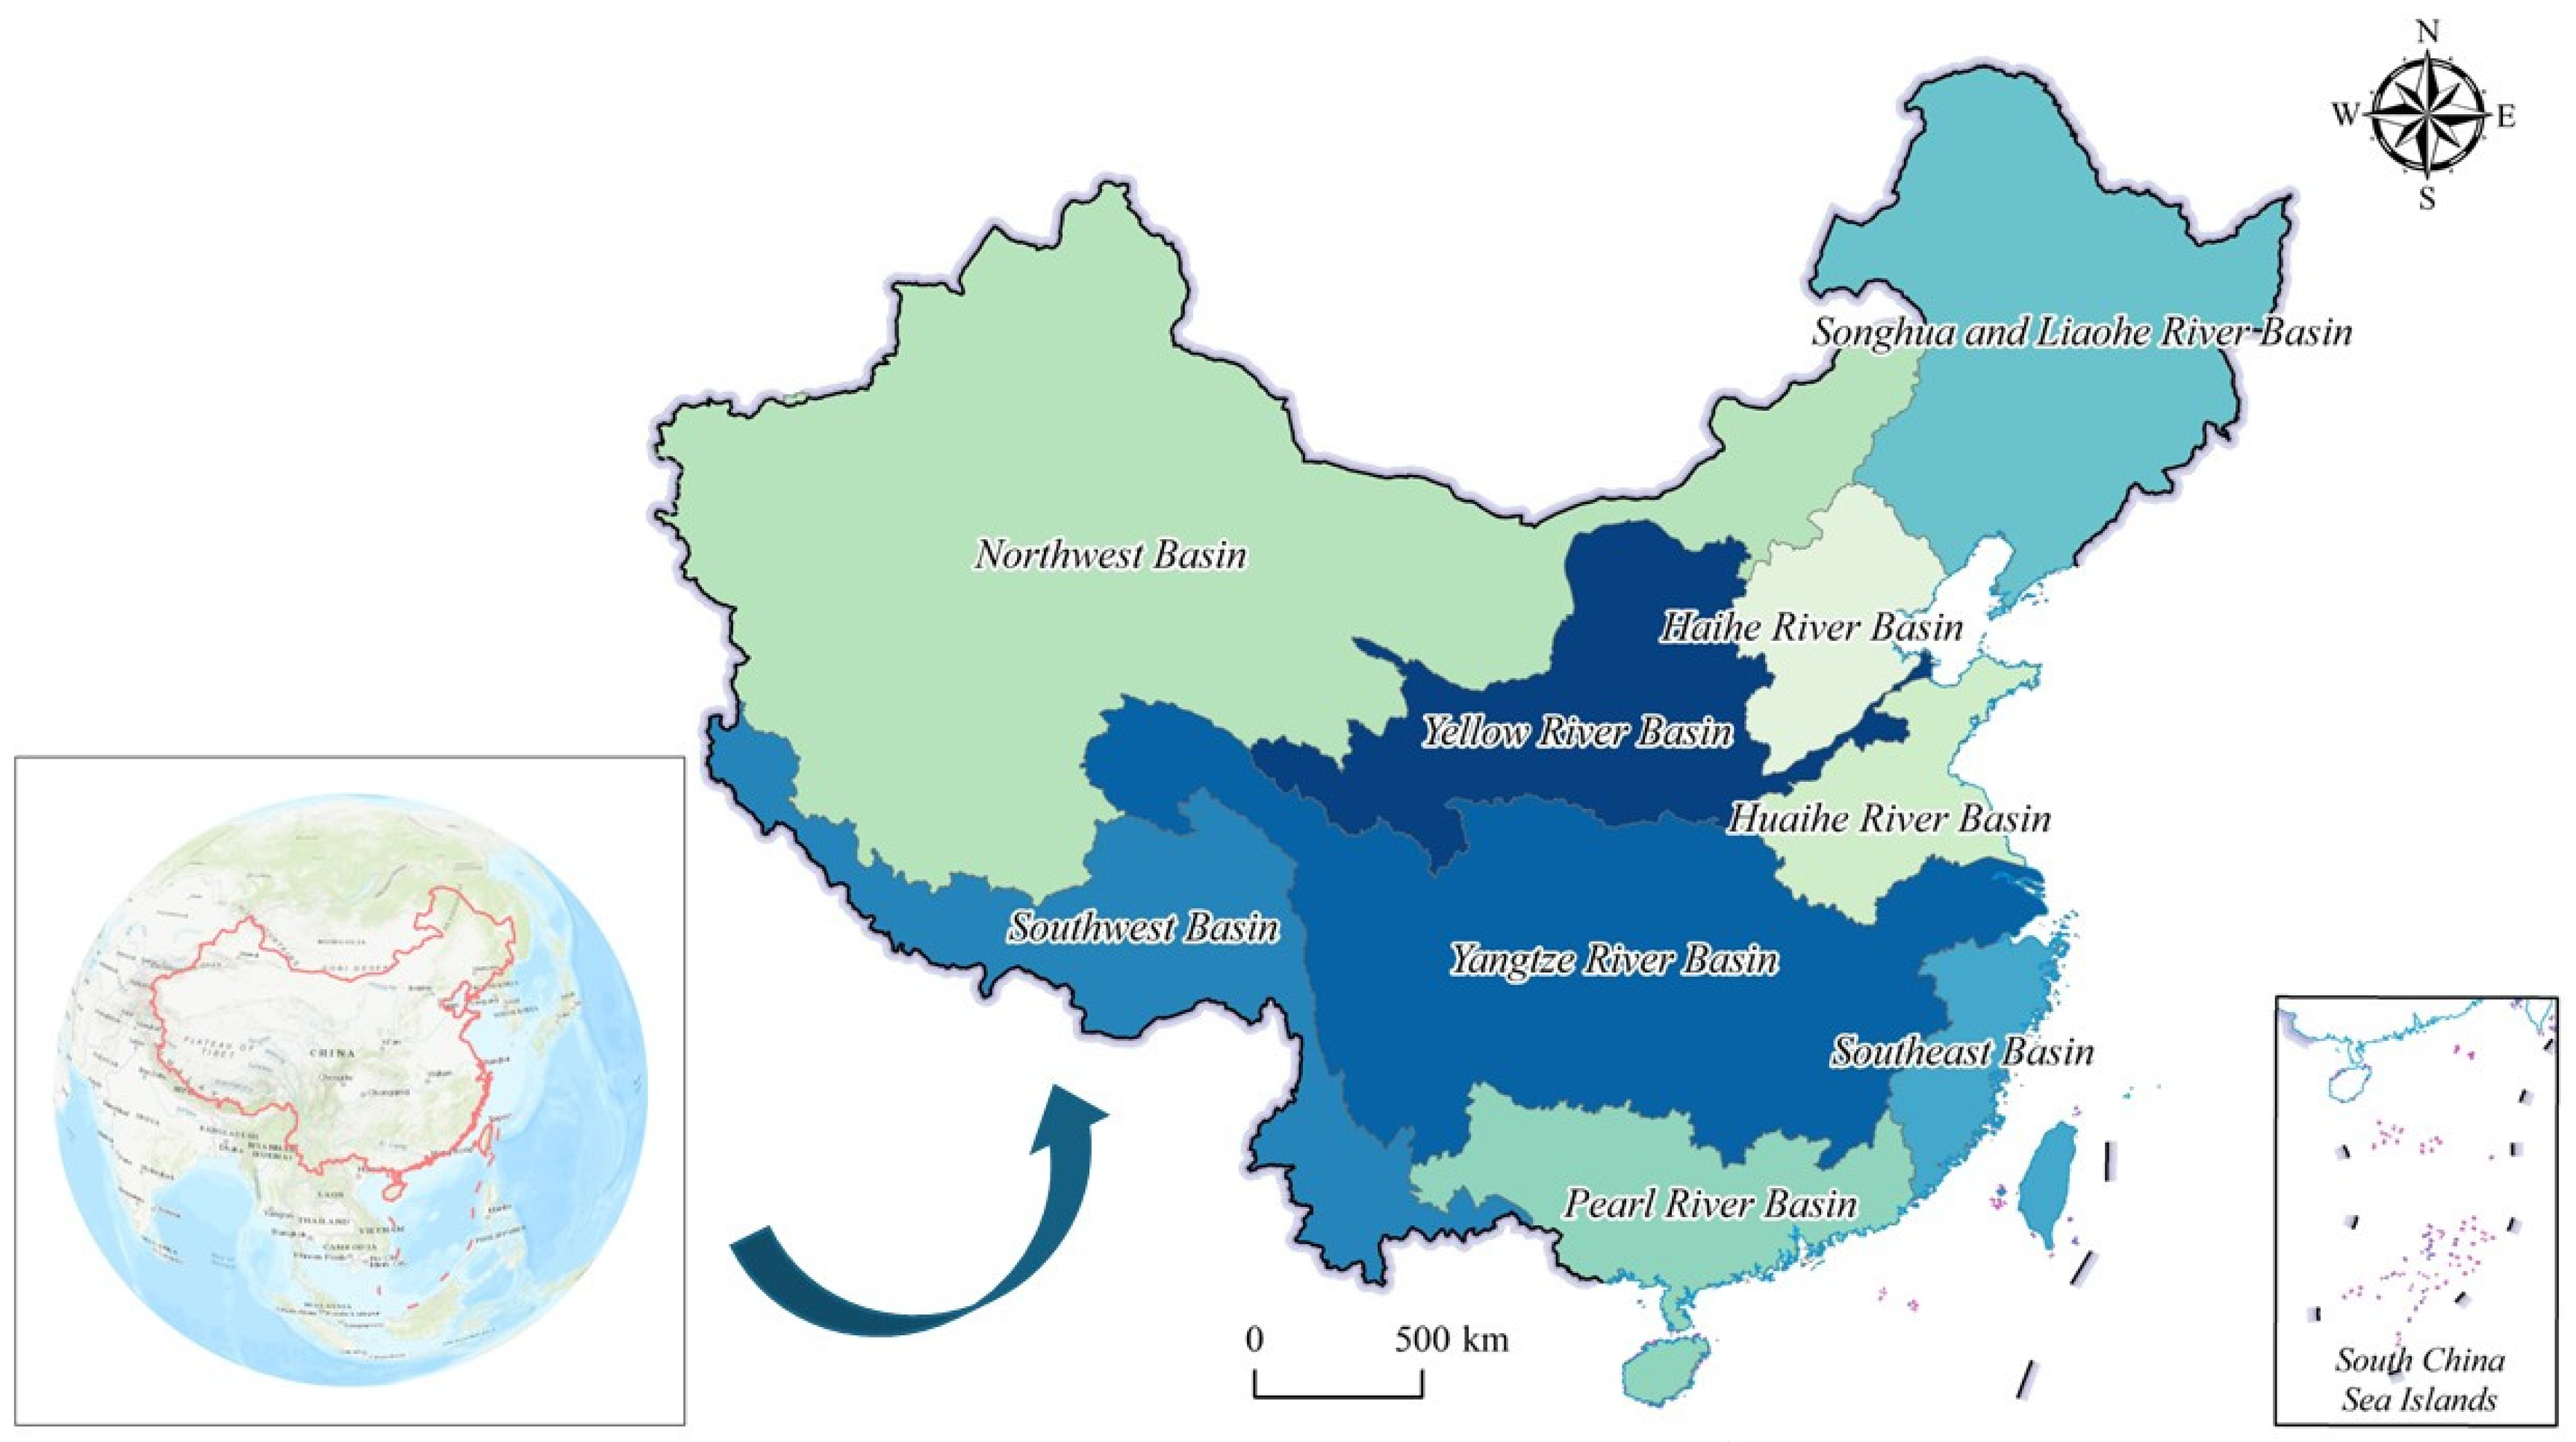
This study encompasses China and its nine major river basins (as shown in Figure 1), namely the Southeast Basin (SEB), Southwest Basin (SWB), Haihe River Basin (HRB), Yangtze River Basin (YZRB), Huaihe River Basin (HHRB), Yellow River Basin (YRB), Northwest Basin (NWB), Songhua–Liao River Basin (SLRB), and Pearl River Basin (PRB) [26]. Geographically, China is situated between 17–56° N and 73–135° E, with a total land area of approximately 9.6 million square km. The country is characterized by diverse topography and landforms, as well as highly complex climatic conditions [27,28].
Figure 1.
The location distribution of the 9 major river basins in China.
The YZRB and PRB lie within the subtropical monsoon climate zone, characterized by dense river networks and abundant water resources [29]. The YZRB, the largest basin in China, covers approximately 1.8 million km2 and produces an average annual runoff of 950 billion m3. The PRB, with an area of about 450,000 km2, generates more than 330 billion m3 of annual runoff, serving as a critical water source for southern China [30,31]. In contrast, the YRB, HHRB, HRB, and SLRB are located in the temperate monsoon climate zone, where hot, rainy summers alternate with cold, dry winters. The YRB spans roughly 750,000 km2 with an annual runoff of 58 billion m3, yet complex water regulation and allocation have resulted in severe regional water shortages [32]. The NWB, encompassing arid regions such as the Qinghai–Tibet Plateau, has an annual runoff of only 62 billion m3, making water scarcity a defining challenge in this region [33].
2.2. Data
The runoff and agricultural water use datasets for 1981–2099 employed in this study were obtained from the Inter-Sectoral Impact Model Intercomparison Project (ISIMIP, https://data.isimip.org/) with a spatial resolution of 0.5°. At the scale of major river basins, basin-aggregated indicators are relatively insensitive to grid-level resolution, while maintaining consistency across models and scenarios is critical for long-term assessments. ISIMIP Phase 2 comprises two subprojects: 2a, which evaluates model performance for the period 1971–2010, and 2b, which provides climate-change impact projections for the period 1850–2099. To simulate water supply and agricultural withdrawal processes, we adopted two Global Hydrological Models (GHMs), H08 (https://h08.nies.go.jp/) and WaterGAP2 (https://www.uni-frankfurt.de/45218031/WaterGAP accessed on 10 October 2025), and one Land Surface Model (LSM), Lund–Potsdam–Jena Managed Land (LPJmL) (https://www.pik-potsdam.de/en/institute/departments/activities/biosphere-water-modelling/lpjml, accessed on 10 October 2025). These models represent large-scale hydrological and agricultural water use dynamics and were used jointly to estimate both natural runoff and sectoral water demands. The GHMs and LSM were driven by meteorological forcing from different periods to capture historical and future conditions [34,35]. For the historical period (1971–2010), the models used WATCH/WFD meteorological variables [36], including humidity, temperature, precipitation, wind speed, air pressure, and radiation, as input. For the future period (2011–2099), meteorological inputs were derived from four Global Climate Models (GCMs) within ISIMIP2b: GFDL-ESM2M, HadGEM2-ES, IPSL-CM5A-LR, and MIROC5 (Table 1). These GCMs encompass diverse climate system representations and feedback mechanisms, ensuring a wide range of plausible future climates. All GCM outputs underwent statistical bias correction to minimize systematic errors and enhance the reliability of the climate projections used to drive the hydrological simulations [37].
Table 1.
Overview of four Global Climate Models (GCMs) used in ISIMIP2b.
For the historical period (1971–2010), all hydrological simulations were driven by the WATCH/WFD meteorological forcing dataset. This dataset has been extensively evaluated against in situ observations and reanalysis products and is widely adopted in large-scale hydrological model intercomparison studies. Moreover, the Global Hydrological Models (H08, WaterGAP2) and the Land Surface Model (LPJmL) employed in this study are part of the ISIMIP Phase 2 framework, in which their ability to reproduce historical meteorological and hydrological conditions has been systematically evaluated within ISIMIP Phase 2a. Therefore, the historical simulations used in this study are based on a validated climate–hydrology modeling framework rather than untested climate model outputs.
Runoff and agricultural water use variables used in this study are taken from ISIMIP simulations. Climate-driven impacts on vegetation and evapotranspiration are internally reflected in the adopted models, particularly in LPJmL, which represents vegetation and managed land processes. Agricultural water demand from H08 and LPJmL is simulated consistently with the same climate forcing, thereby propagating climate-induced changes in crop water requirements and irrigation demand into the water balance.
Two Representative Concentration Pathway (RCP) scenarios were considered: RCP2.6, representing a low-emission pathway with a radiative forcing of 2.6 W m−2 by 2100, and RCP8.5, representing a high-emission pathway with a radiative forcing of 8.5 W m−2 [32,38]. RCP2.6 assumes significant mitigation of greenhouse gas emissions, while RCP8.5 reflects continued growth in emissions leading to stronger warming. Both pathways are widely adopted in CMIP5 climate-change studies [39]. By combining multiple hydrological models, bias-corrected GCM outputs, and contrasting low- and high-emission scenarios, this study provides a robust foundation for assessing the potential impacts of future climate change on water resources and agricultural water withdrawals [40,41]. The multi-model, multi-scenario design allows comprehensive evaluation of uncertainties and supports the development of effective adaptation and management strategies [42].
Future industrial and domestic water demands were projected using the Shared Socioeconomic Pathways (SSPs) framework, which outlines alternative global socio-economic development trajectories [32,43]. SSP1 through SSP5 describe, respectively, sustainable development, baseline trends, regional rivalry, unequal growth, and fossil-fueled development. China’s GDP and population data for 2010–2099 were obtained from the Science Data Bank (https://www.scidb.cn/) at a 0.5° spatial resolution and were bias-adjusted to ensure consistency with historical records [44]. To capture a wide range of socio-economic and climatic futures for comprehensive water security assessment, six representative SSP–RCP combinations were selected: SSP1–RCP2.6, SSP2–RCP2.6, SSP3–RCP8.5, SSP4–RCP2.6, SSP4–RCP8.5, and SSP5–RCP8.5 (refer to Text S1).
In addition, GRACE and GRACE-FO mascon solutions from three independent processing centers [45], namely the Center for Space Research (CSR) at the University of Texas at Austin, the Jet Propulsion Laboratory (JPL), and the German Research Centre for Geosciences (GFZ), were utilized to provide satellite-based observations of terrestrial water storage [46,47]. The mascon datasets were first gap-filled to address missing months, then resampled to a uniform 0.5° spatial resolution to match the hydrological model outputs, and subsequently averaged across the three centers to reduce processing biases and enhance signal reliability [48]. The resulting Terrestrial Water Storage Anomaly (TWSA) time series for the study area was used to evaluate the consistency of modeled total water demand trends and to ensure that long-term changes in water storage were realistically captured [49].
3. Method
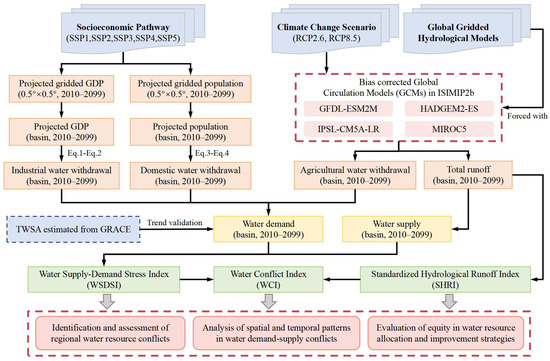
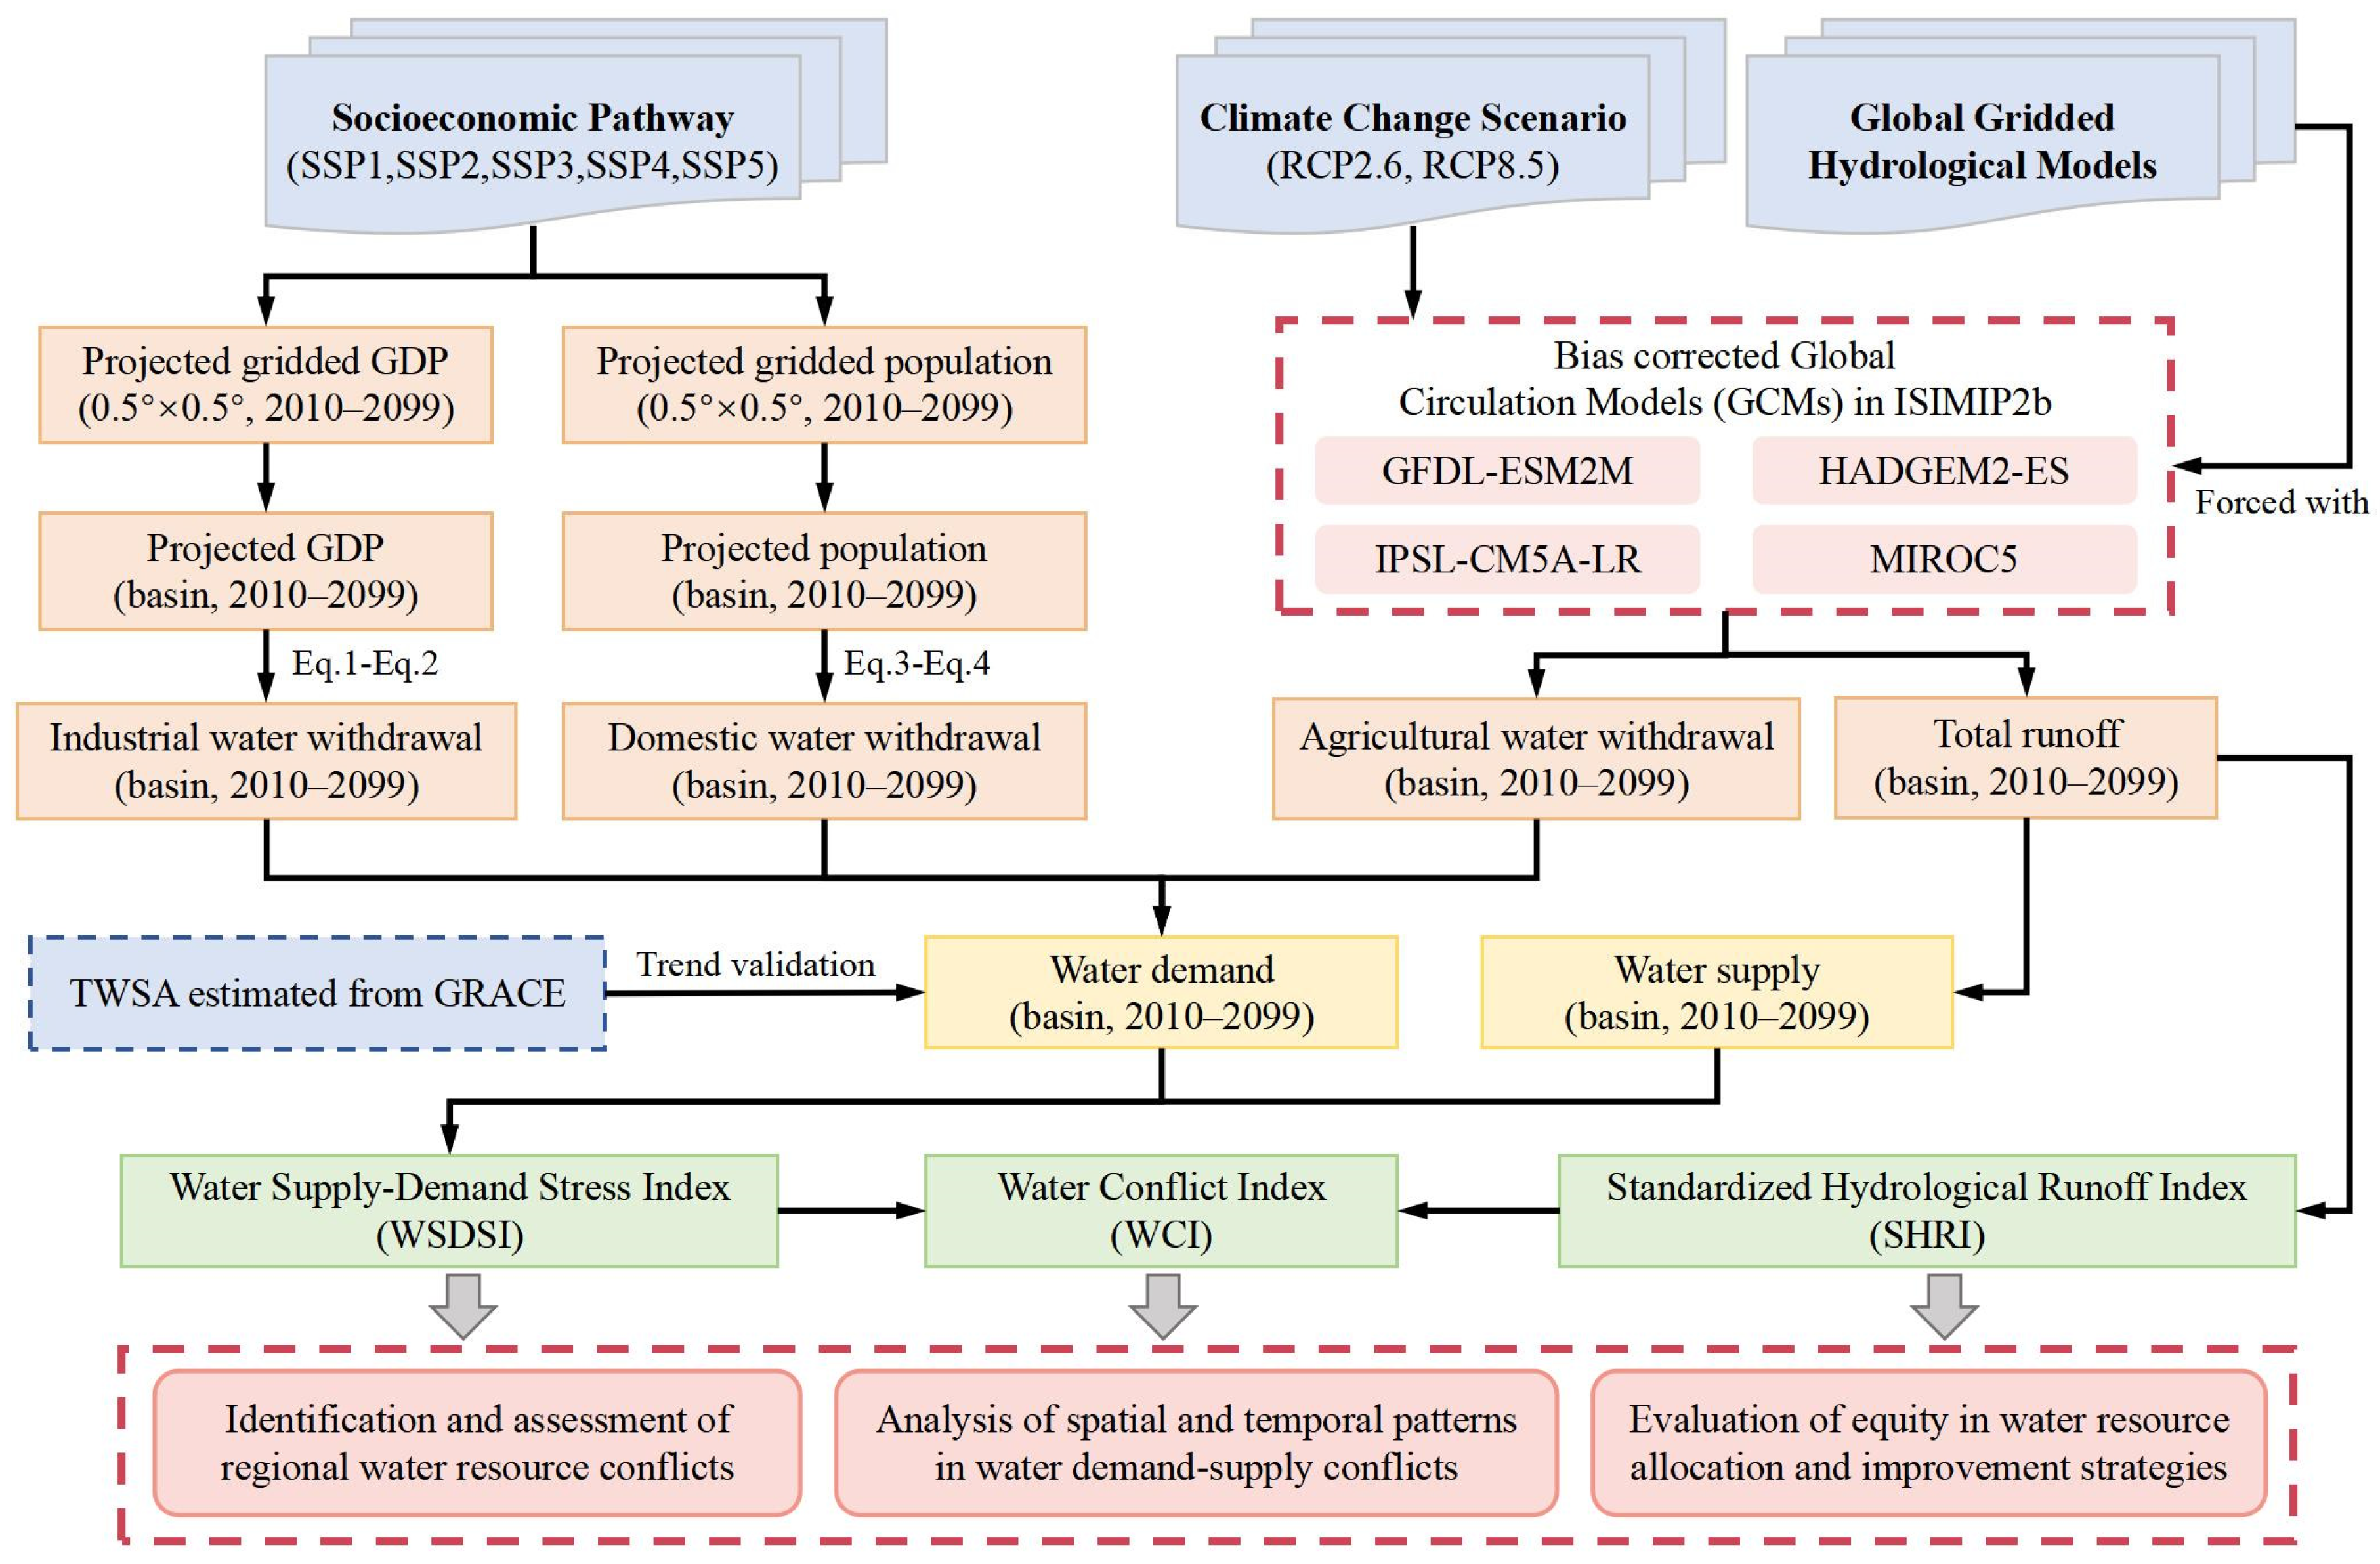
Under different socioeconomic pathways and climate change scenarios, the projected 0.5° grid GDP and population data were aggregated to the basin scale and combined with simulated total runoff to estimate agricultural, industrial, and domestic water demands. Based on these estimates, changes in the balance between water supply and demand were assessed. Furthermore, the WSDSI and the SHRI were calculated, and a WCI was developed to characterize potential risks of water resource conflicts. The overall research framework is illustrated in Figure 2.
Figure 2.
Methodology flow chart.
3.1. Water Supply Estimation Method
Basin-scale water supply was quantified as the multi-year total runoff simulated under the selected climate scenarios. Bias-corrected meteorological data from four Global Climate Models (GFDL-ESM2M, HadGEM2-ES, IPSL-CM5A-LR, and MIROC5) provided by the ISIMIP2b project were used to drive three hydrological models: H08, LPJmL, and WaterGAP2. These models represent key components of the hydrological cycle and water resource management and were each run for both low- and high-emission scenarios (RCP2.6 and RCP8.5). Because the runoff series are produced by hydrological/land-surface models, the impacts of climate-driven land-surface responses (including vegetation-related evapotranspiration changes represented in LPJmL) are inherently reflected in the runoff projections. All grid-based runoff outputs were aggregated to the basin scale prior to analysis, thereby reducing sensitivity to the native grid resolution.
For each scenario, the three model outputs were aggregated to produce annual and multi-year runoff series for China’s nine major river basins. The ensemble mean was taken as the best estimate of basin water supply, while the inter-model spread was used to characterize uncertainty. This multi-model, multi-scenario approach reduces the influence of individual model biases and captures the range of potential climate impacts on future water availability.
3.2. Water Withdrawal Estimation Method
In estimating water withdrawals, this study focuses on three major sectors: agriculture, industry, and domestic use. To accurately project future water demand under different scenarios, sector-specific demand models were developed and analyzed under six SSPs. These scenarios reflect variations in economic development, technological progress, and climate policies, enabling an assessment of water demand trajectories under alternative development pathways.
Agricultural water demand was derived from simulations using the H08 and LPJmL models under two climate change scenarios (RCP2.6 and RCP8.5). The input data were consistent with those used for water supply estimation, including bias-corrected GCM meteorological variables. By combining the results of the two models, basin-scale time series of agricultural water demand were obtained, capturing potential variations under different climate pathways.
Industrial water demand is determined by industrial value added and water use intensity [50,51]. Industrial water use intensity () represents the water consumption per unit of industrial output and is influenced by technological progress, structural adjustments, and policy regulation. Its temporal change was estimated as:
where is the industrial water use intensity in the base year (year 2010), and is a parameter defined under different SSPs that reflects the declining trend in intensity (refer to Text S2). Industrial water demand () was then calculated as:
where denotes the industrial value added in year t.
Domestic water demand is primarily driven by population growth and rising living standards [52,53]. Domestic water use intensity was assumed to increase linearly with time:
where represents the growth rate of domestic water use intensity under different scenarios. Accordingly, domestic water demand was calculated as:
where is the population size in year .
Finally, total water withdrawal was calculated as the sum of agricultural, industrial, and domestic demands:
By integrating demand projections across the three sectors, this study provides estimates of future total water withdrawal, offering a scientific basis for water resource management and policy formulation.
3.3. Method for Constructing the Water Conflict Index
To quantitatively assess basin-scale water supply-demand imbalances and potential conflict risks under future scenarios, this study developed an evaluation framework consisting of the WSDSI, SHRI, and WCI.
3.3.1. Estimation of the Water Supply-Demand Stress Index
With accelerating climate change, population growth, and industrialization, the imbalance between water supply and demand has become increasingly prominent. To quantify the level of stress between water demand and supply, this study adopts the Water Supply-Demand Stress Index (WSDSI):
Here, “” refers to the sum of agricultural, industrial, and domestic water use over a given period, while “” represents the available supply during the same period, including natural runoff, groundwater, precipitation, and reservoir storage. A higher WSDSI value indicates greater water stress and higher risk of imbalance, whereas a lower value suggests a more adequate supply. This index serves as a tool for assessing water sustainability and supporting management decisions under different scenarios.
3.3.2. Estimation of the Standardized Hydrological Runoff Index
The Standardized Hydrological Runoff Index (SHRI) is designed to measure deviations in runoff relative to the historical average. Based on the standardization of historical runoff records, it reflects anomalies over a given period and provides an assessment of water abundance or scarcity. The probability density function of the Gamma distribution is defined as:
where is the shape parameter, is the scale parameter, and is runoff. Parameters are estimated using Maximum Likelihood Estimation (MLE). The fitted Gamma distribution is then used to calculate the cumulative distribution function (CDF):
Finally, the CDF is transformed into a standardized score using the percent point function (PPF) of the standard normal distribution:
A value of indicates above-average runoff (relatively abundant water resources), while reflects below-average runoff (increased scarcity). With its standardized and comparable nature, SHRI is suitable for cross-regional and temporal comparisons and provides quantitative support for water management and drought warning.
3.3.3. Estimation of the Water Conflict Index
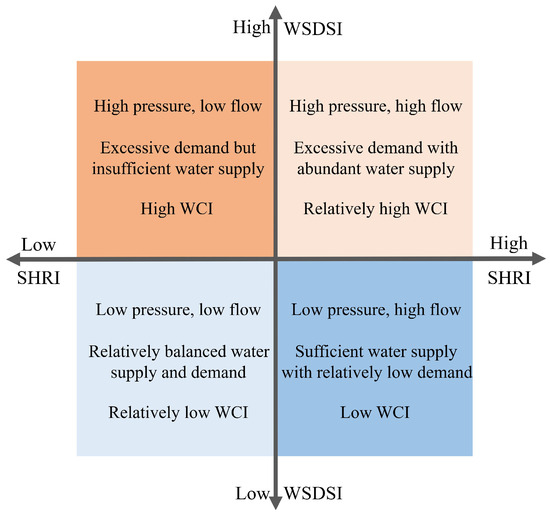
WCI integrates SHRI and WSDSI to evaluate water supply-demand imbalances and potential conflict risks. SHRI characterizes the variability of water supply, while WSDSI represents water use pressure. Their combination enables quantification of conflict risks under different scenarios. As illustrated in Figure 3, conflict risk is highest when SHRI is low and WSDSI is high, and lowest when SHRI is high and WSDSI is low. The calculation is expressed as:
where denotes the normalized value of SHRI. This index provides a quantitative basis for water resource management, supporting the identification of high-risk areas and the formulation of preventive and regulatory measures.
Figure 3.
Relationship between water conflict risk and the distribution of SHRI and WSDSI.
4. Results
4.1. Projections of Future Water Supply and Water Withdrawal
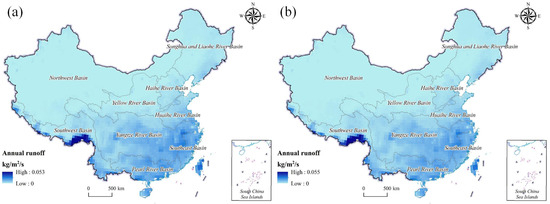
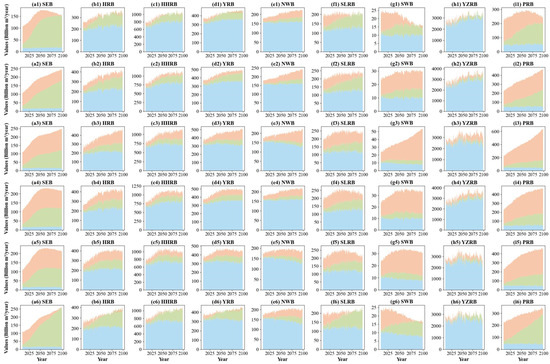
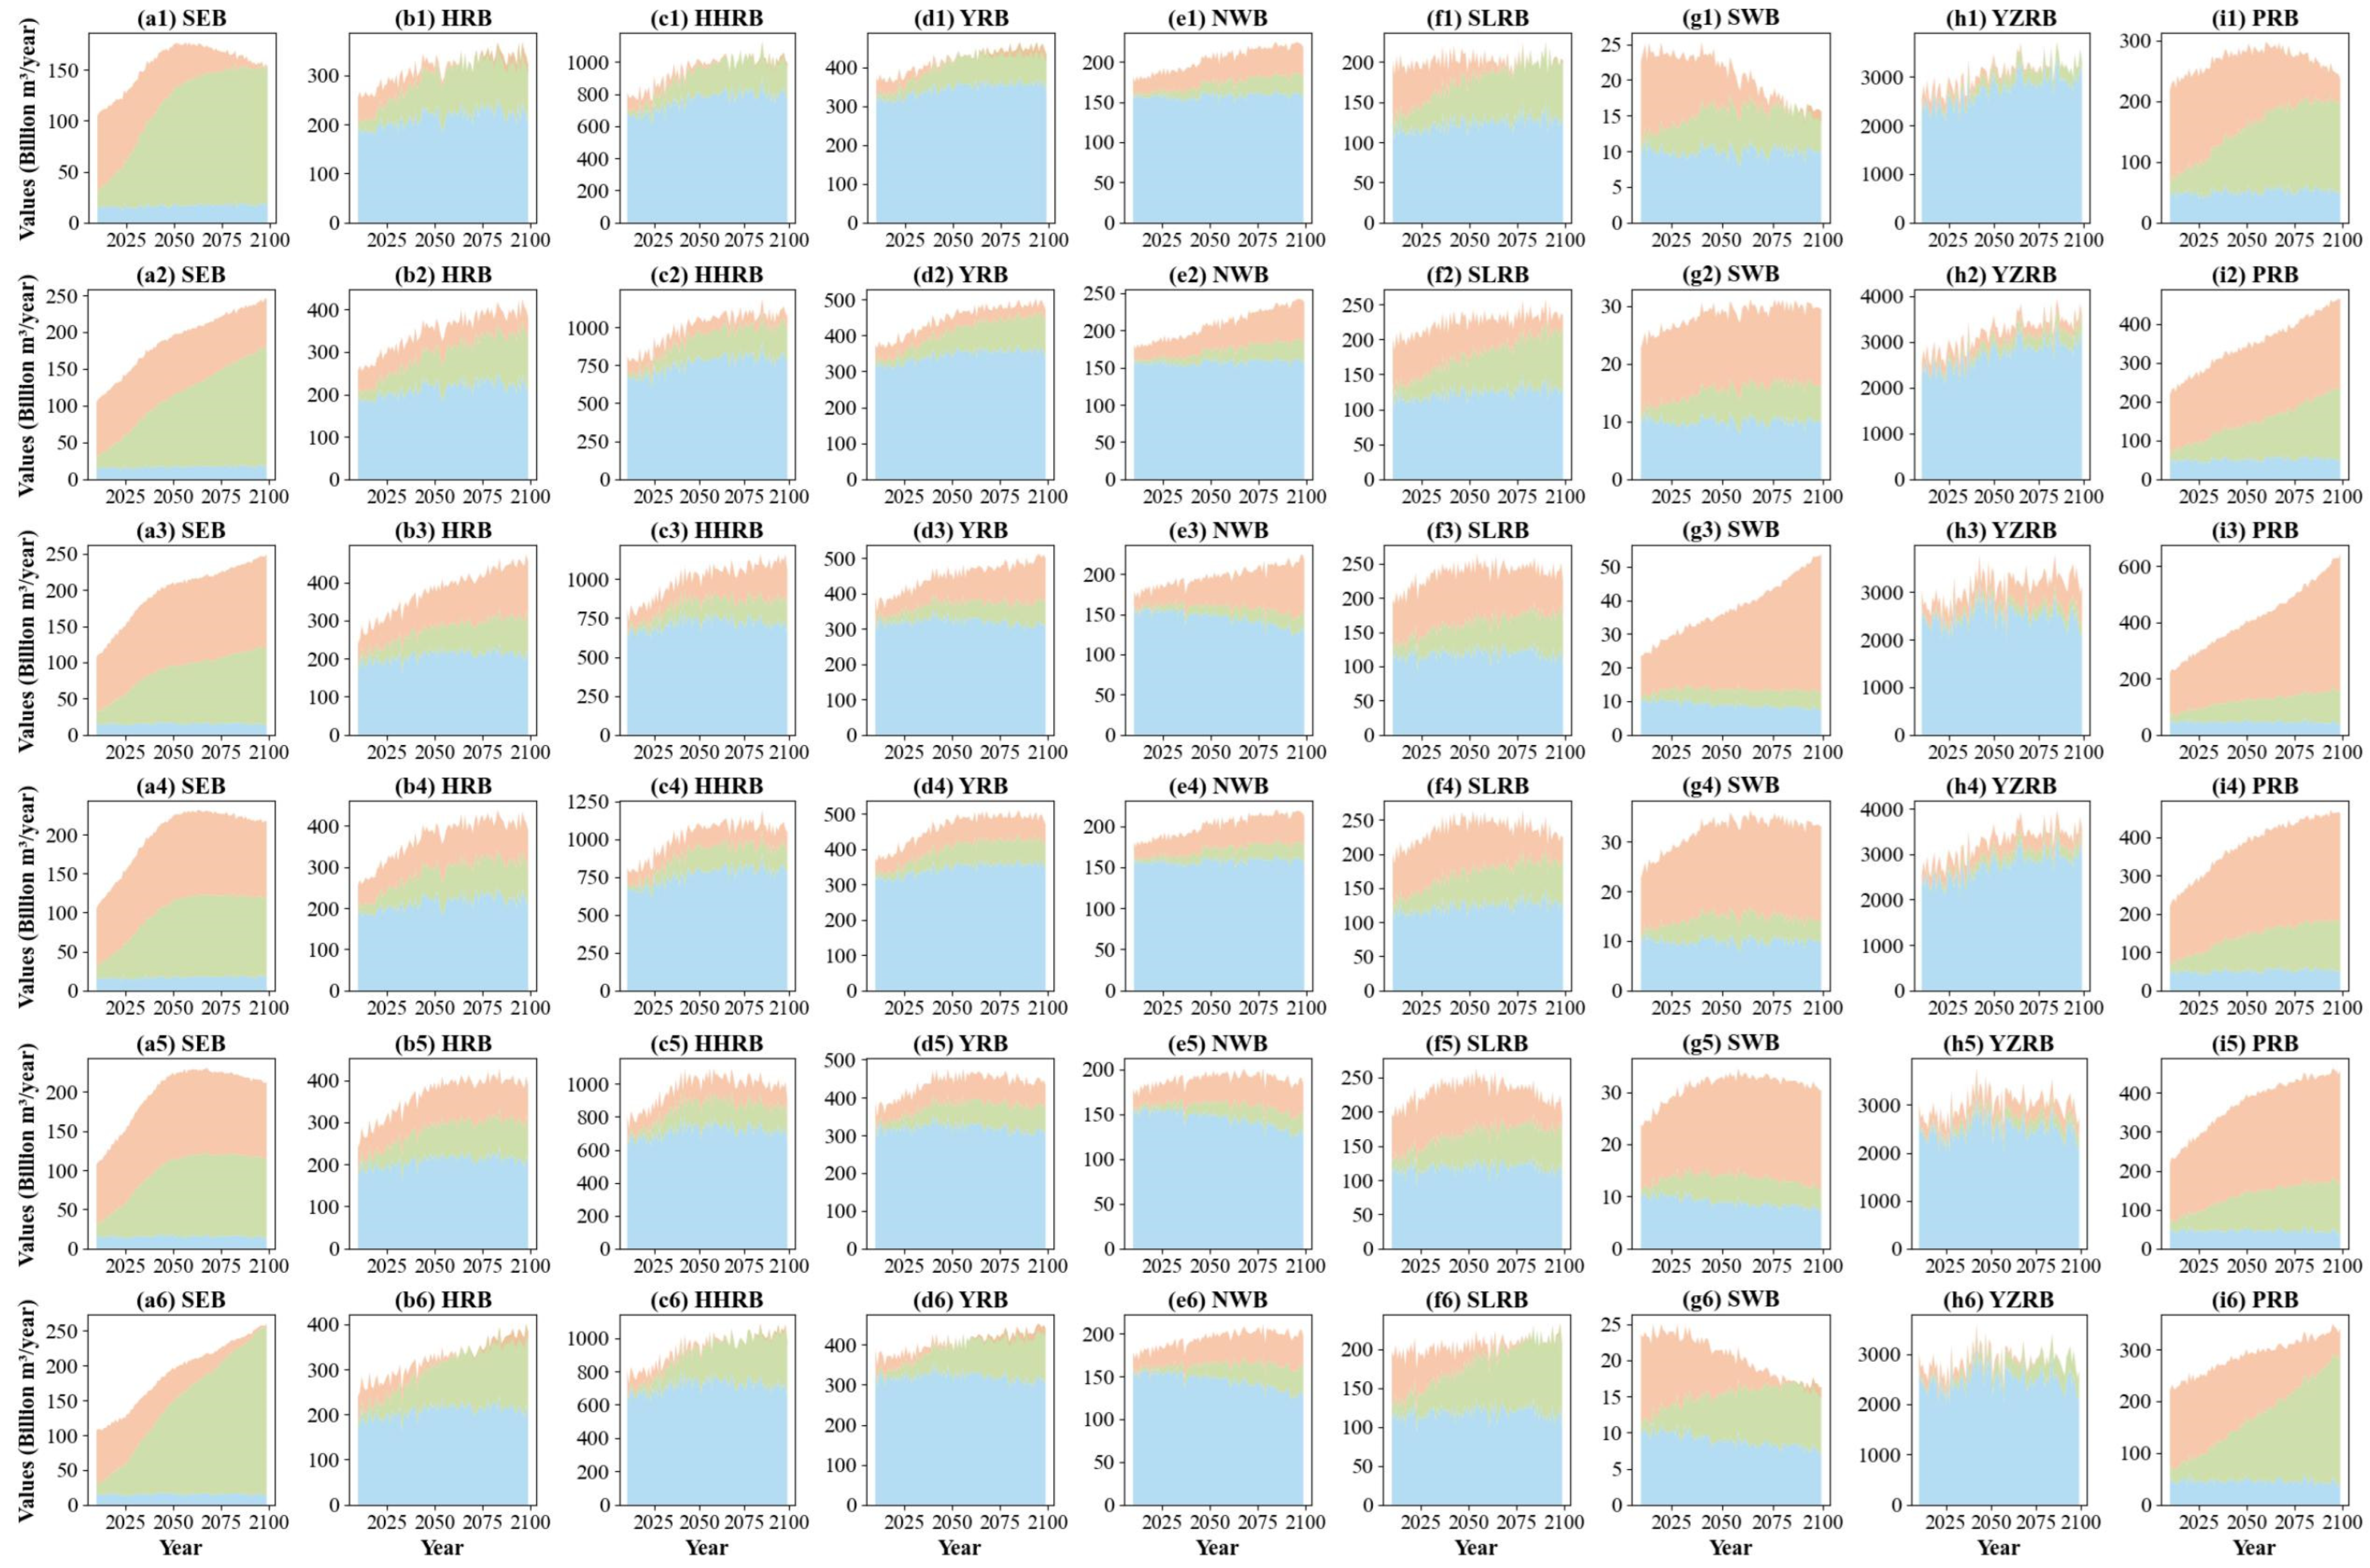
This study explores the future trends in water supply and water demand, particularly under different climate scenarios. The results show that water resources in China exhibit a significant north–south divide. Southern basins (e.g., SWB, YZRB, and PRB) exhibit substantially higher annual runoff (0.045–0.055 kg/m2/s) than northern basins such as the YRB and NWB (generally below 0.020 kg/m2/s) (illustrated in Figure 4). Under the low-emission scenario, the annual runoff in the SWB reaches 0.053 kg/m2/s, and increases further to 0.055 kg/m2/s under the high-emission scenario. In contrast, northern basins, such as the NWB, SLRB, and YRB, experience persistently low runoff, indicating ongoing water scarcity. The analysis of water demand changes reveals structural differences across basins. For instance, as shown in Figure 5, in the YRB, agricultural water uses accounts for 75% of total demand under the low-emission scenario. Under the high-emission scenario, industrial water use accounts for more than 80% of total demand in the SEB and PRB, while agricultural water use dominates in the YRB, exceeding 70% of total withdrawals. Low-carbon development pathways significantly reduce domestic water use, while high-emission scenarios lead to substantial increases in demand across all sectors. By comparing water demand and supply changes across different scenarios, the study clearly highlights the varying degrees of water stress across regions and the future challenges they will face.
Figure 4.
Mean Annual Total Runoff under Two RCP Scenarios. (a) Mean annual total runoff under the RCP2.6 scenario, (b) Mean annual total runoff under the RCP8.5 scenario.
Figure 5.
Trends in water demand across the nine major river basins under six scenarios. Blue indicates agricultural use, green indicates industrial use, and orange indicates domestic use. From the first to the sixth row, the scenarios are: Scenario 1: SSP1–RCP2.6; Scenario 2: SSP2–RCP2.6; Scenario 3: SSP3–RCP8.5; Scenario 4: SSP4–RCP2.6; Scenario 5: SSP4–RCP8.5; Scenario 6: SSP5–RCP8.5.
Additionally, to evaluate the realism of the selected climate–hydrology modeling framework during the historical period, two independent validation approaches were employed. First, observed water use data from the China Water Resources Bulletin (2010–2020) were employed to evaluate the historical consistency of the simulated water withdrawal and supply using Root Mean Square Error (RMSE), Nash-Sutcliffe Efficiency (NSE), and KGE metrics. RMSE, NSE, and KGE metrics were calculated to assess the model’s accuracy during the historical period [54,55]. The results showed that Scenarios 1 and 2 had relatively low prediction errors during the historical period, with RMSE values of 8.5 and 10.2, and NSE values of 0.75 and 0.67, respectively, indicating high prediction accuracy in these scenarios (as shown in Table 2). In contrast, Scenario 6 exhibited higher uncertainty over the long term, with an RMSE of 18.1 and an NSE of 0.39, reflecting significant prediction errors due to assumptions of rapid economic growth and high-water demand in the high-emission scenario.
Table 2.
Error Analysis of Model Prediction Accuracy.
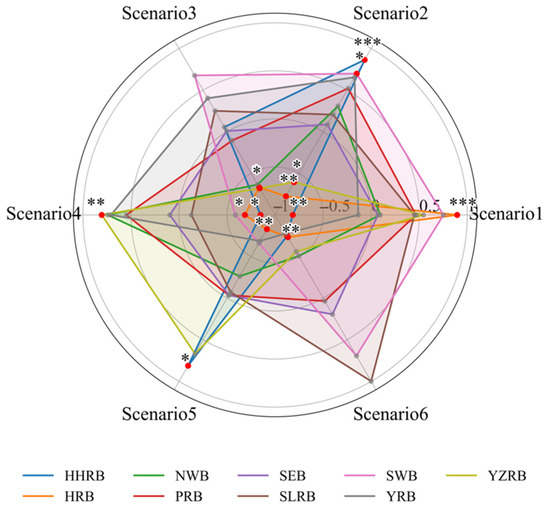
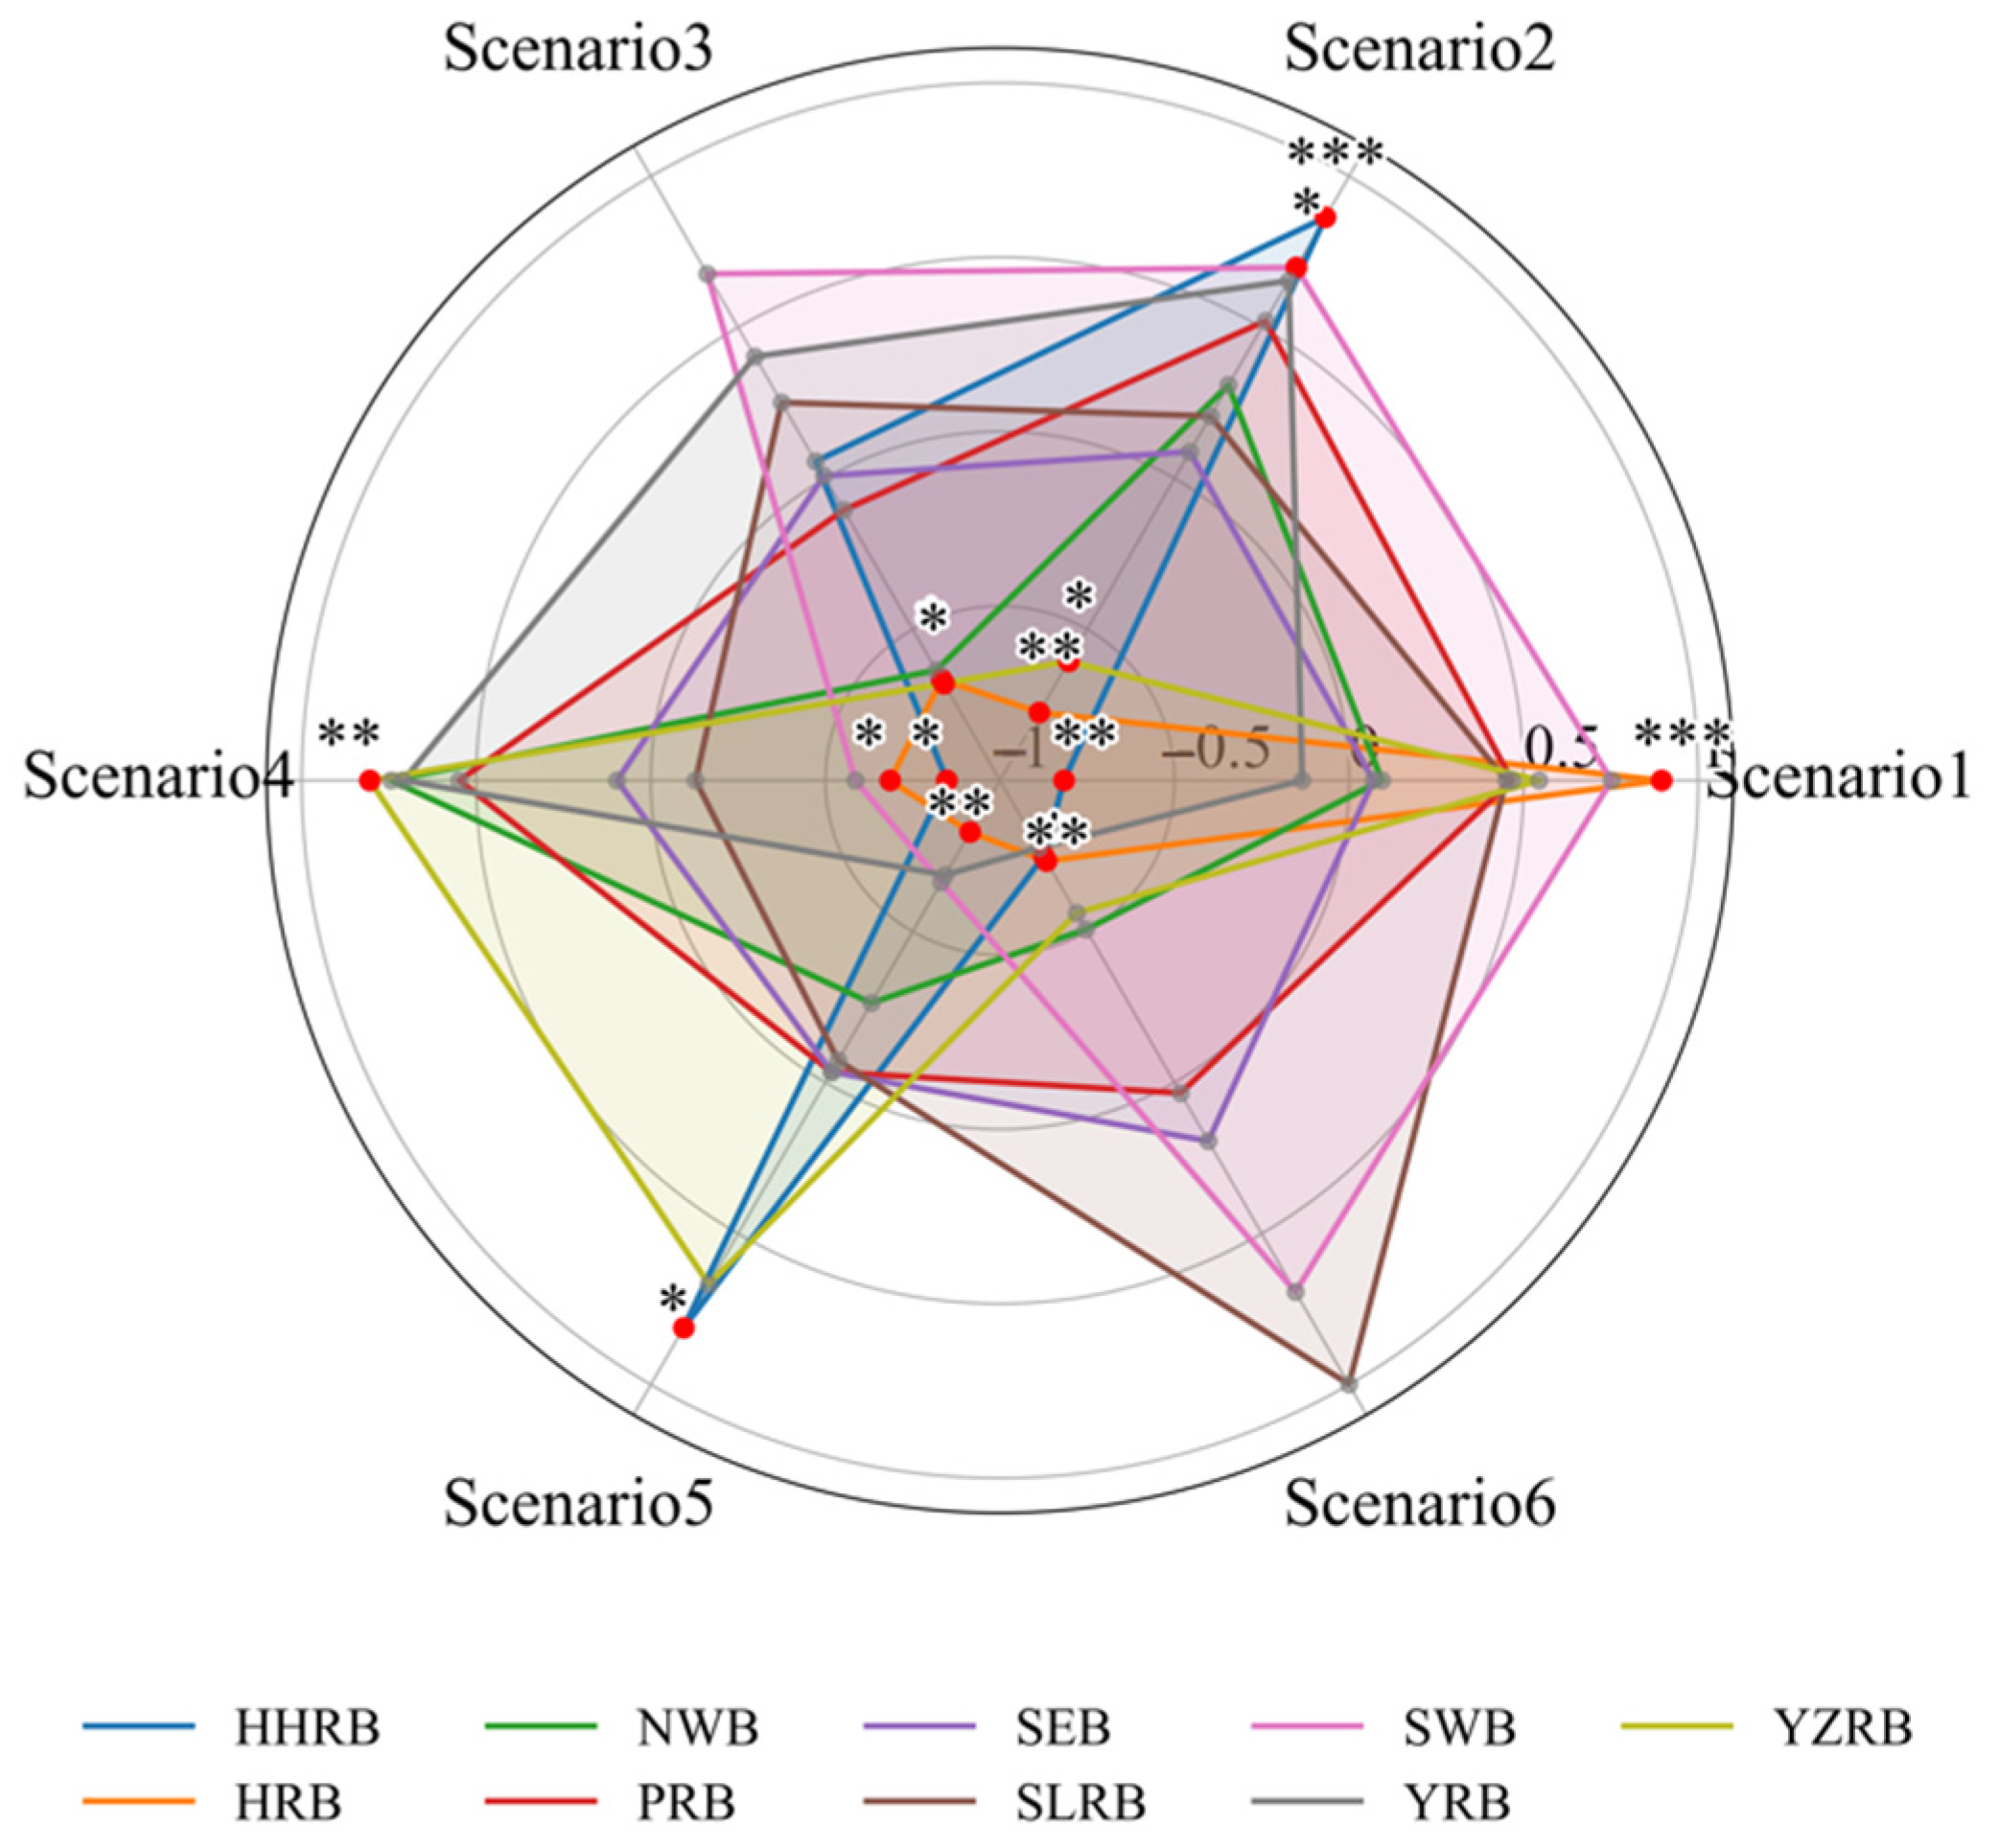
Furthermore, the study also used GRACE/GRACE-FO satellite data to examine the consistency between simulated water demand and variations in terrestrial water storage. GRACE data provide high-precision measurements of changes in surface water, groundwater, and soil moisture. The results indicated a significant negative correlation between TWSA and water demand in the HRB (−0.666 to −0.895), especially in agriculture-dominated basins, where this correlation was more pronounced (as shown in Figure 6). In contrast, basins where water resources are primarily driven by natural processes showed weaker correlations between TWSA and water demand.
Figure 6.
Consistency Analysis between Simulated Water Withdrawal and TWSA Variation Trends. *** indicates a significance test at p < 0.001, ** indicates p < 0.01, and * indicates p < 0.05; the red dots in the figure represent values that passed the significance test.
4.2. Spatiotemporal Variations in WSDSI and SHRI
The analysis demonstrates significant temporal and spatial variability in water stress and water availability, which are driven by both climate change and socio-economic development under different scenarios.
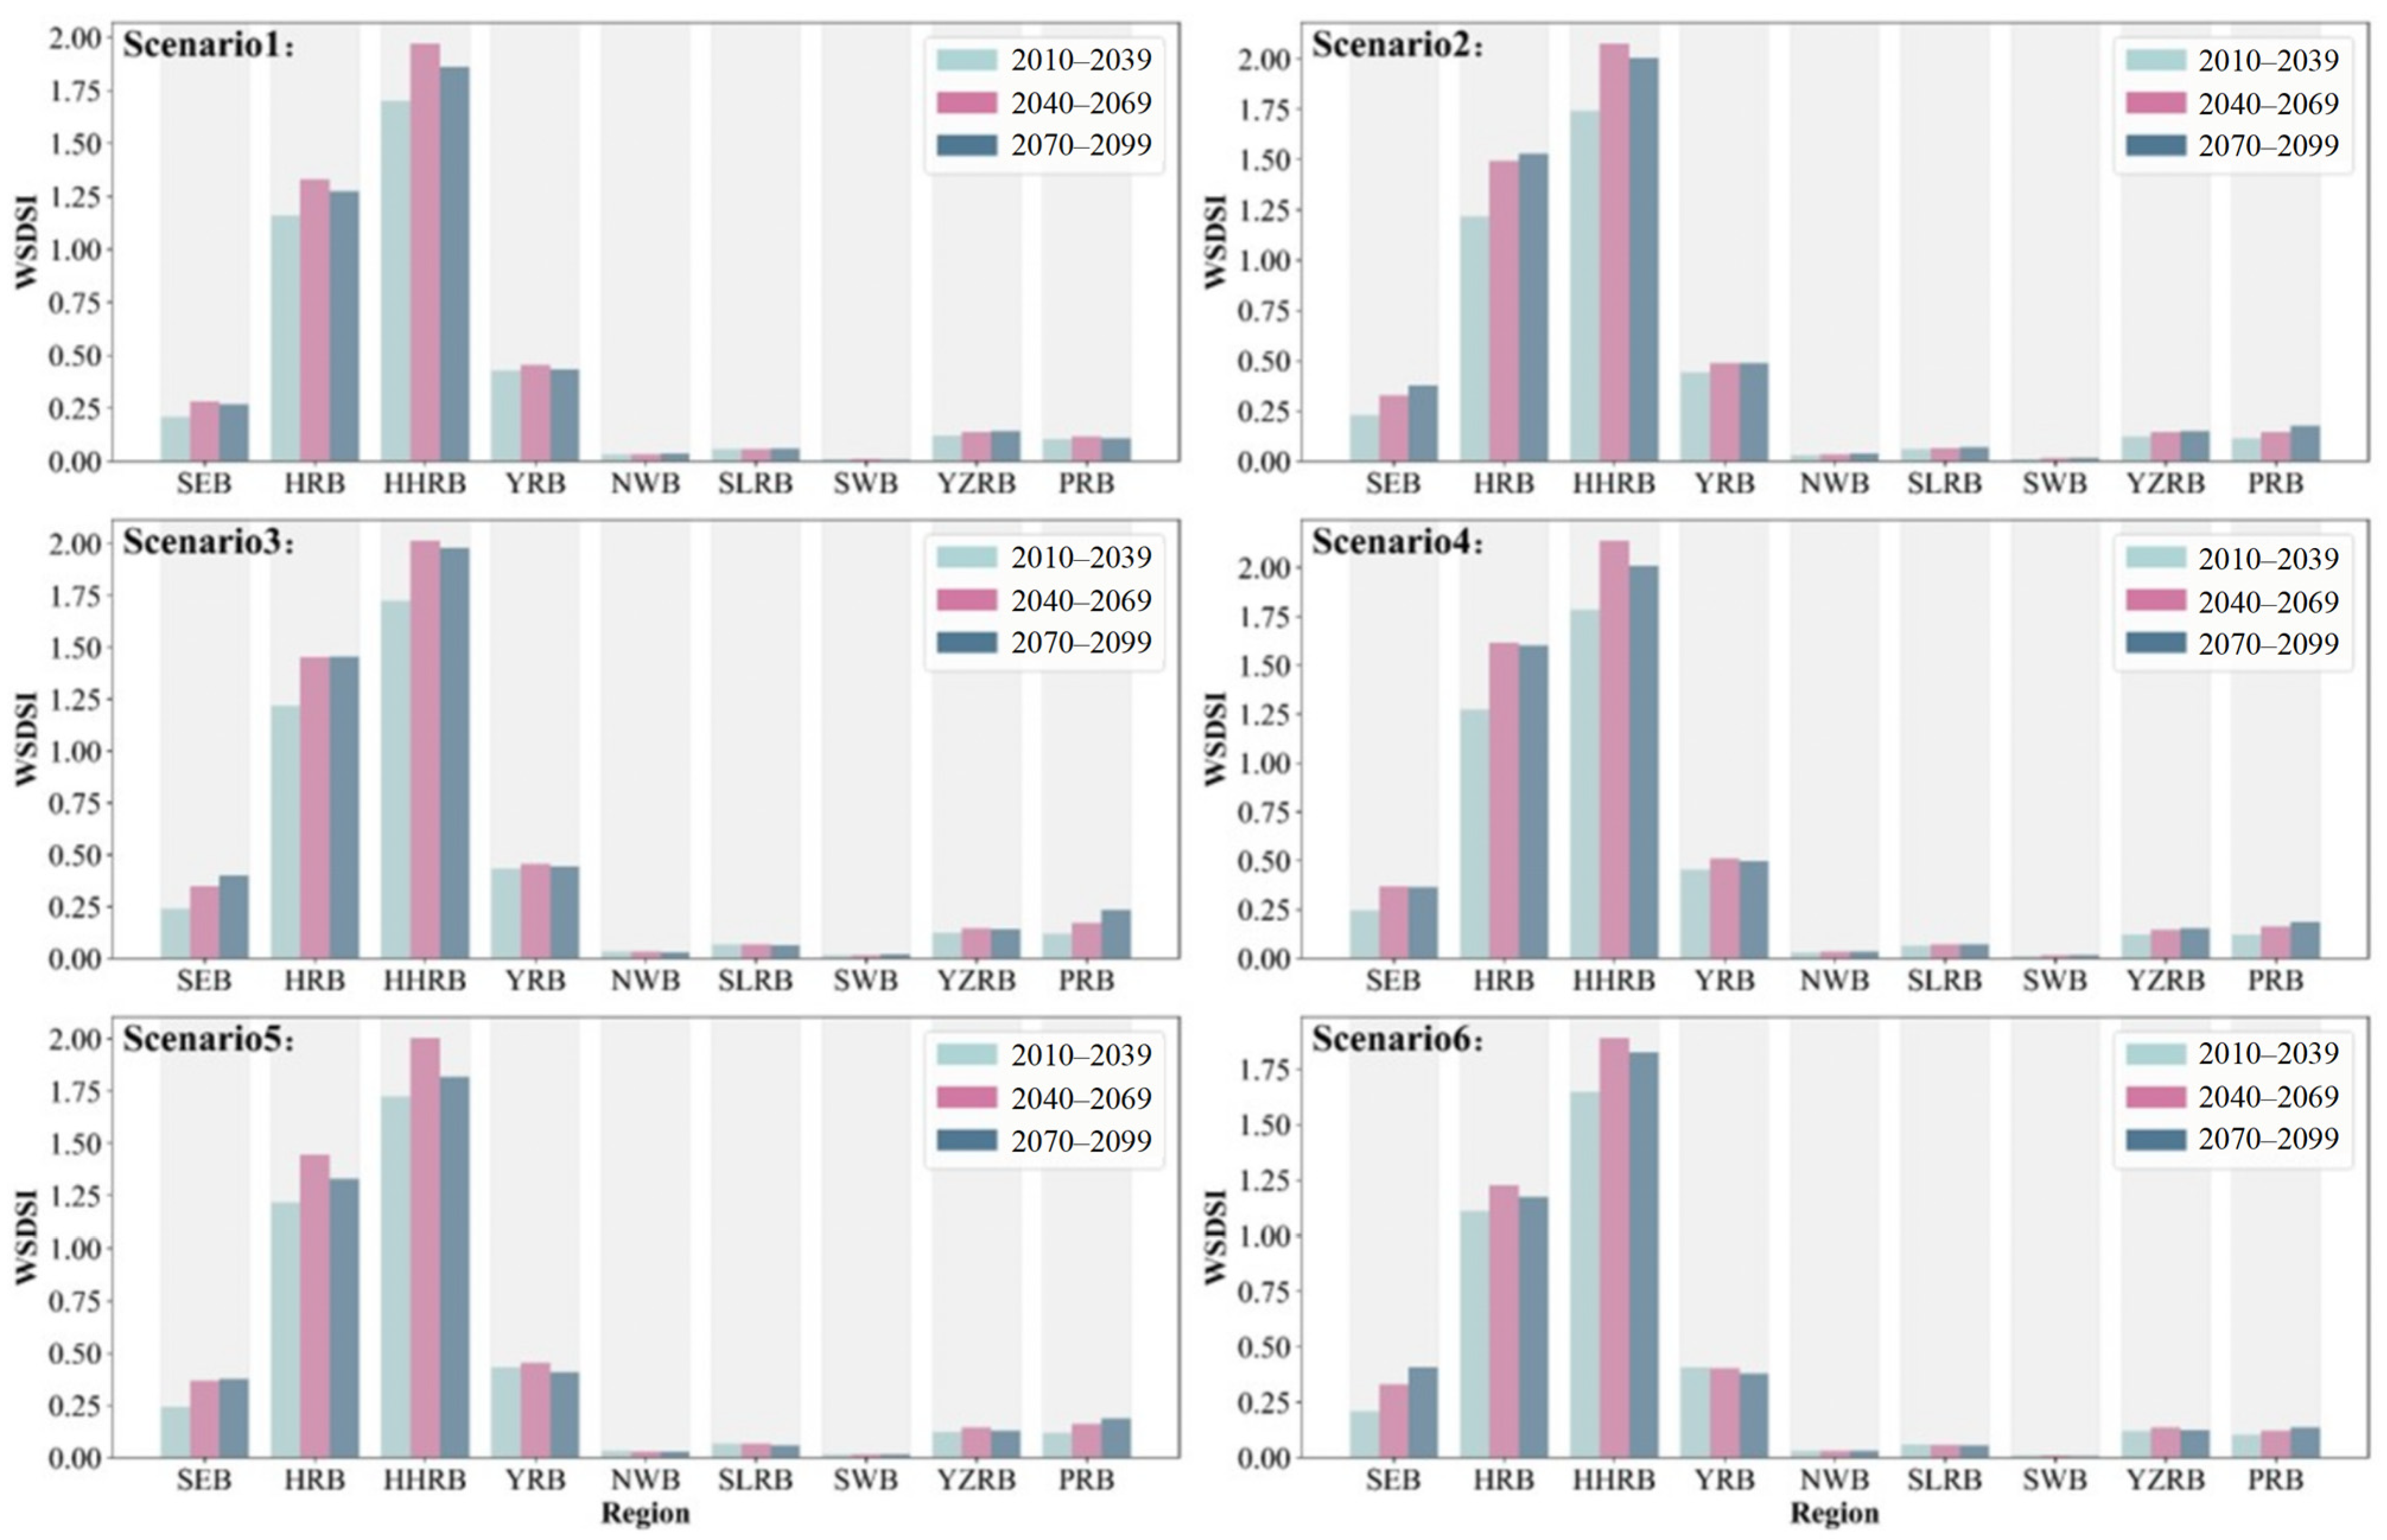
As illustrated in Figure 7, the WSDSI values remain relatively low from 2010 to 2039 across most regions. However, from 2040 to 2069, a noticeable peak in WSDSI values is observed in most basins, indicating increased water stress due to rising demand and population growth. In the YRB and HRB, WSDSI reaches 1.4 and 1.7, respectively, under Scenario 1. In particular, HRB experiences the most pronounced increase, with WSDSI rising from 0.9 in 2010 to 1.4 in the 2060s. Similarly, the HHRB reaches a WSDSI value of 1.7 by 2040 in Scenario 1, marking a peak in water stress. In contrast, the SEB and YZRB maintain relatively stable and low WSDSI values of around 0.2, reflecting secure water conditions throughout the study period.
Figure 7.
Trend of WSDSI changes across the nine major river basins under six scenarios.
Spatially, HRB and HHRB consistently report the highest WSDSI values across all scenarios, with peak values ranging from approximately 1.6 to 1.8 during 2040–2069. The WSDSI value for HRB peaks at 1.6 and HHRB at 1.8 under Scenario 4, indicating the severe supply-demand imbalances in these basins, mainly driven by high population density and industrial water demand. The SLRB and PRB maintain moderate WSDSI levels, with SLRB reaching 0.6 by 2070–2099 under the high-emission Scenario 6. The YZRB shows relatively stable WSDSI values throughout the study period, remaining close to 0.4–0.6 under most scenarios with only minor interdecadal variability.
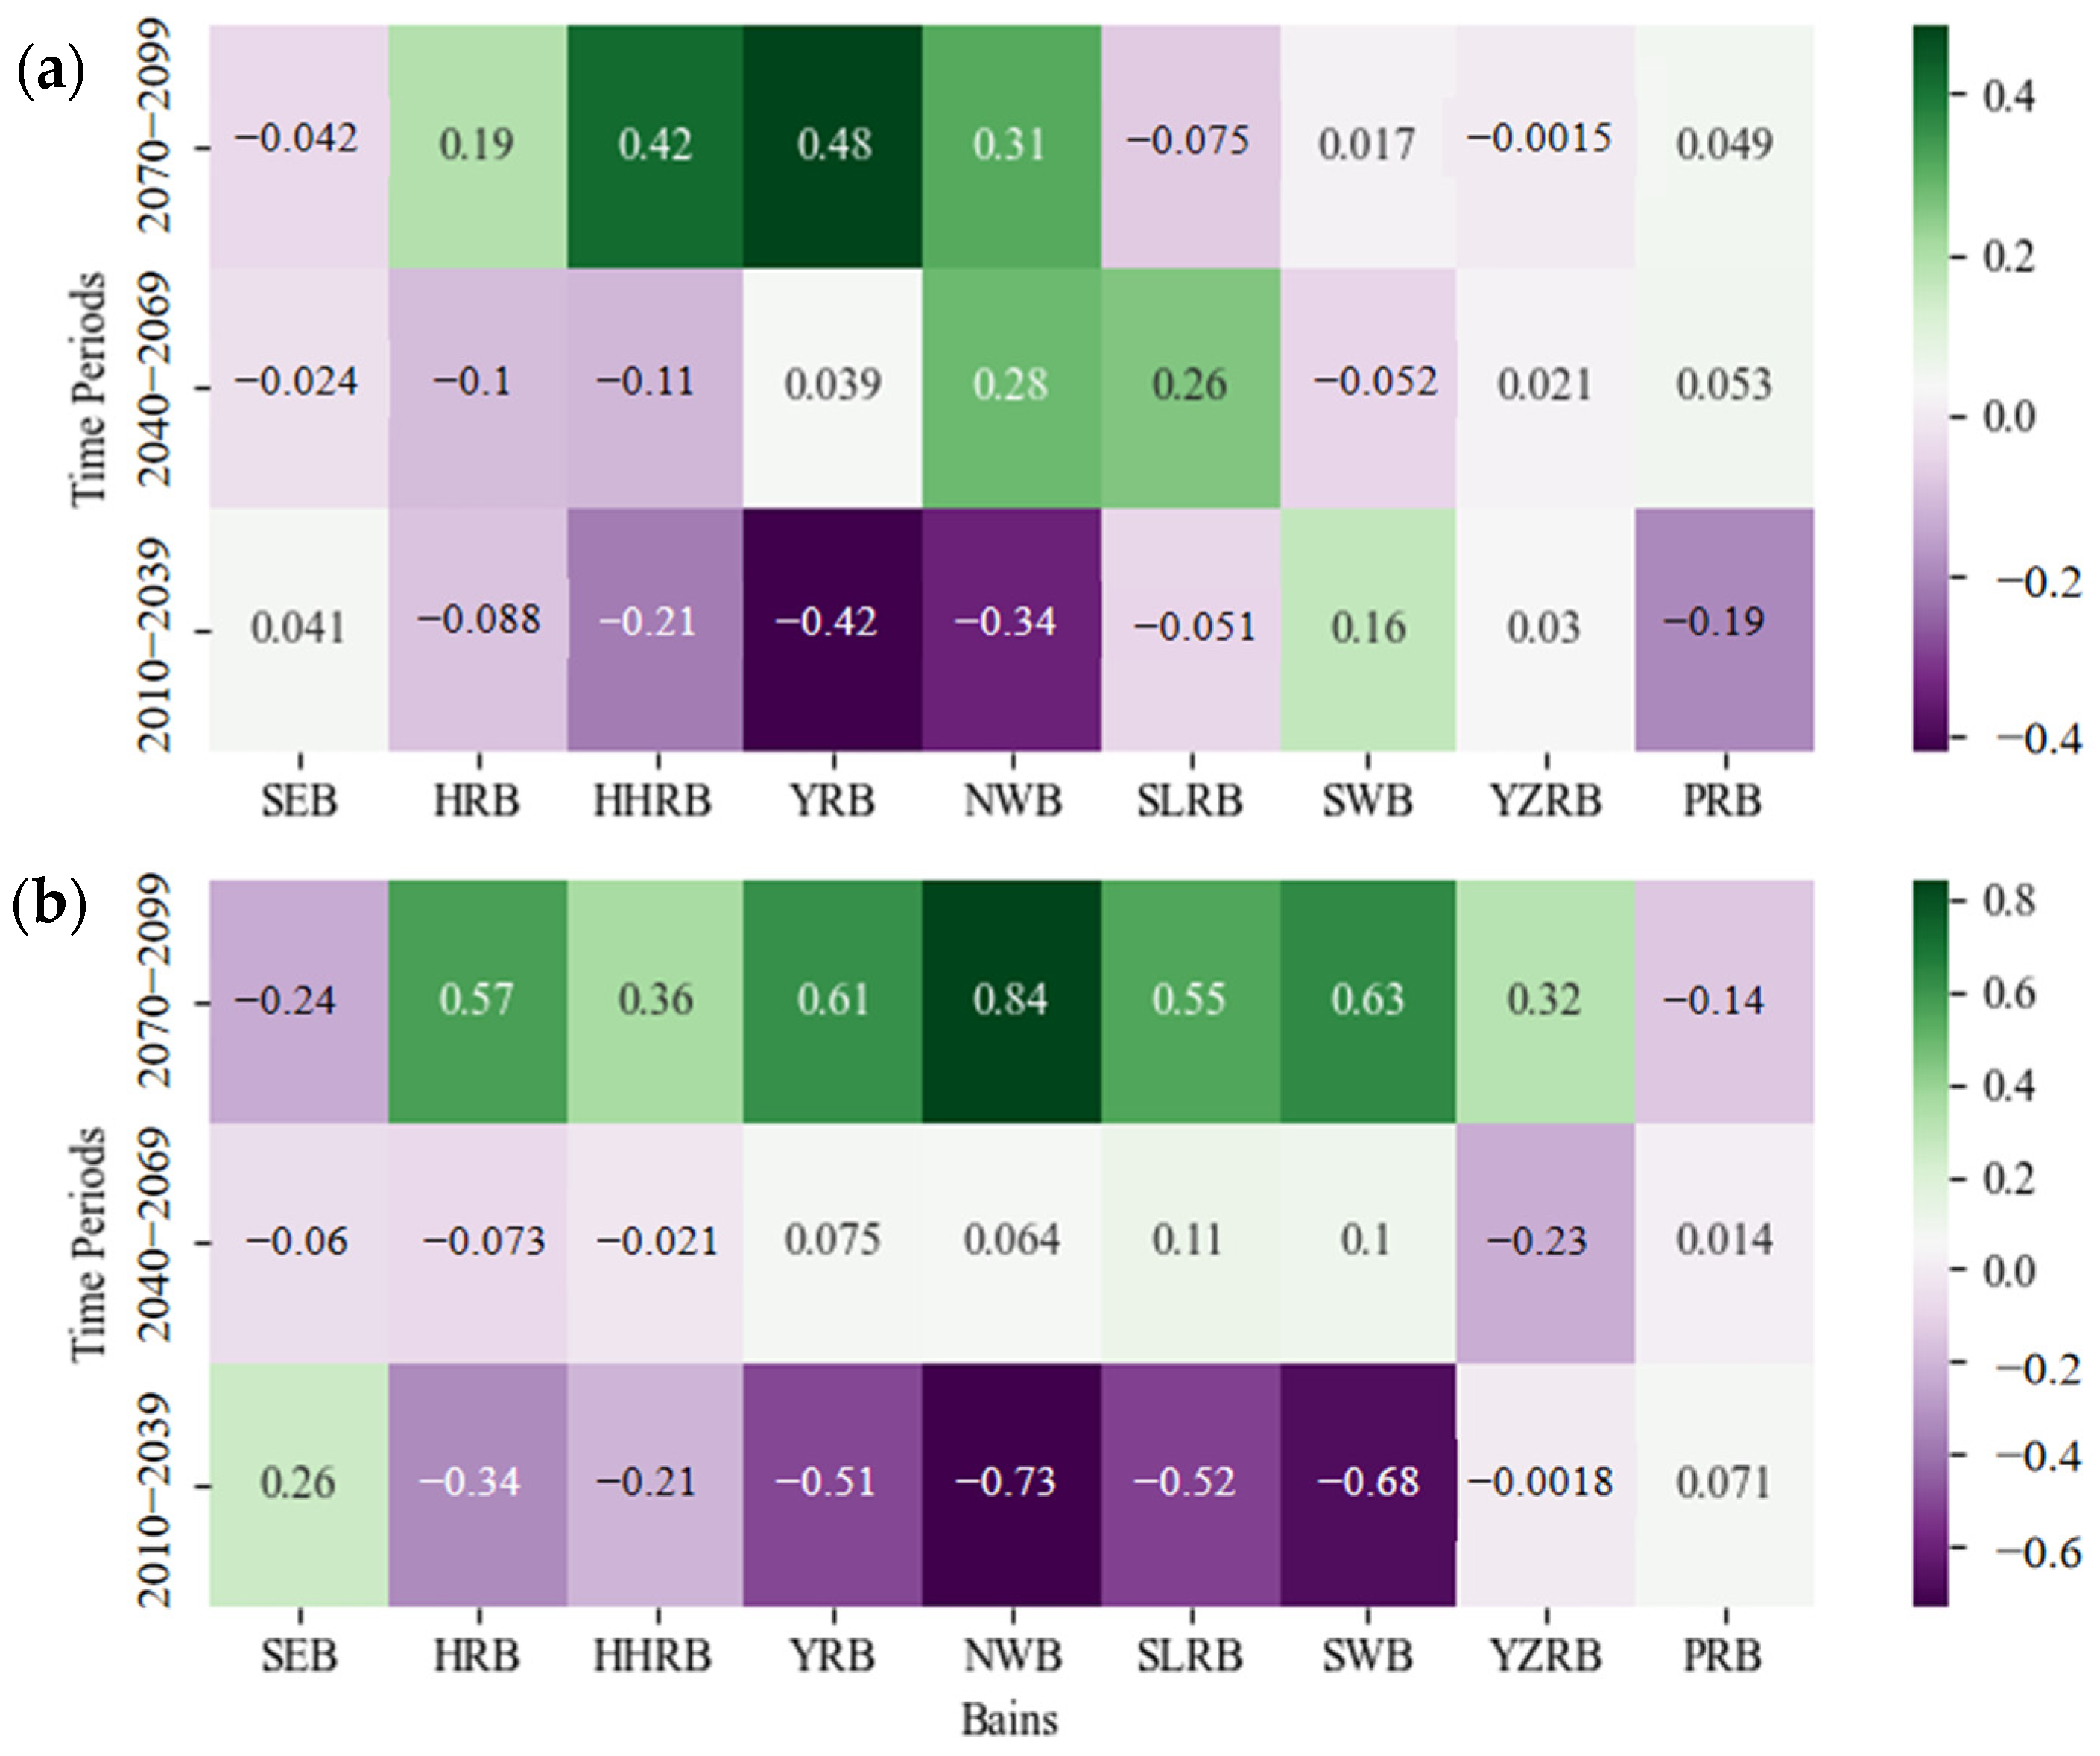
The SHRI values, see Figure 8 which reflect water availability relative to historical averages, also exhibit substantial regional variations. Southern basins such as the SEB and PRB show persistently positive SHRI values (generally above 0.4), indicating relatively abundant water availability. In contrast, northern basins like the NWB and YRB show negative SHRI values, indicating persistent water scarcity. For instance, under the high-emission RCP8.5 scenario, the SHRI for the YRB is consistently below −0.5, reflecting significant water stress. This trend is particularly evident in Scenario 6, where SHRI values remain negative for much of the century, indicating continued water scarcity in the northern basins.
Figure 8.
Heatmaps of the SHRI for the nine major river basins under two scenarios: (a) SHRI under the RCP2.6 scenario; (b) SHRI under the RCP8.5 scenario.
When comparing the different socio-economic and emission scenarios, water stress intensifies under high-emission scenarios, as reflected by higher WSDSI values and persistently negative SHRI values in northern basins. Scenarios 2 and 4 produce the highest WSDSI peaks, particularly in HRB and HHRB, where WSDSI reaches 1.6 and 1.8, respectively, under Scenario 4. These results suggest that stronger management and technological interventions will be needed in these regions to mitigate water stress. In Scenario 6, which assumes the highest emissions and unbalanced socio-economic development, the WSDSI in many northern and arid basins remains high, particularly in the HRB and NWB, underlining the importance of adaptive water management strategies in these regions.
Overall, the spatiotemporal variations in WSDSI and SHRI highlight the complex and region-specific challenges posed by future water supply and demand imbalances in China. These findings underscore the need for differentiated water management strategies tailored to the specific conditions of each basin. Particularly in high-demand and low-supply regions, policies should focus on strengthening water conservation, improving water allocation efficiency, and enhancing climate adaptation measures to ensure sustainable water resources management across the country.
4.3. Trends of the Water Conflict Index in China
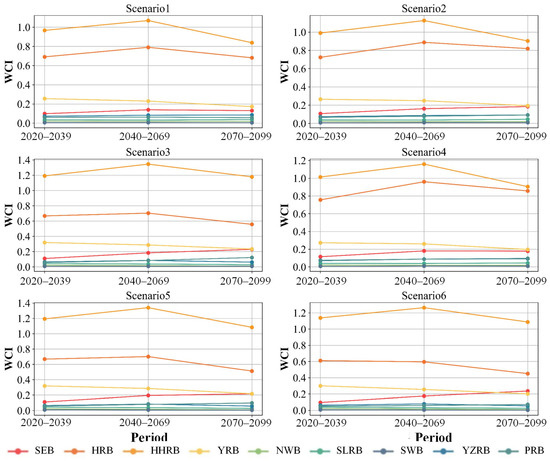
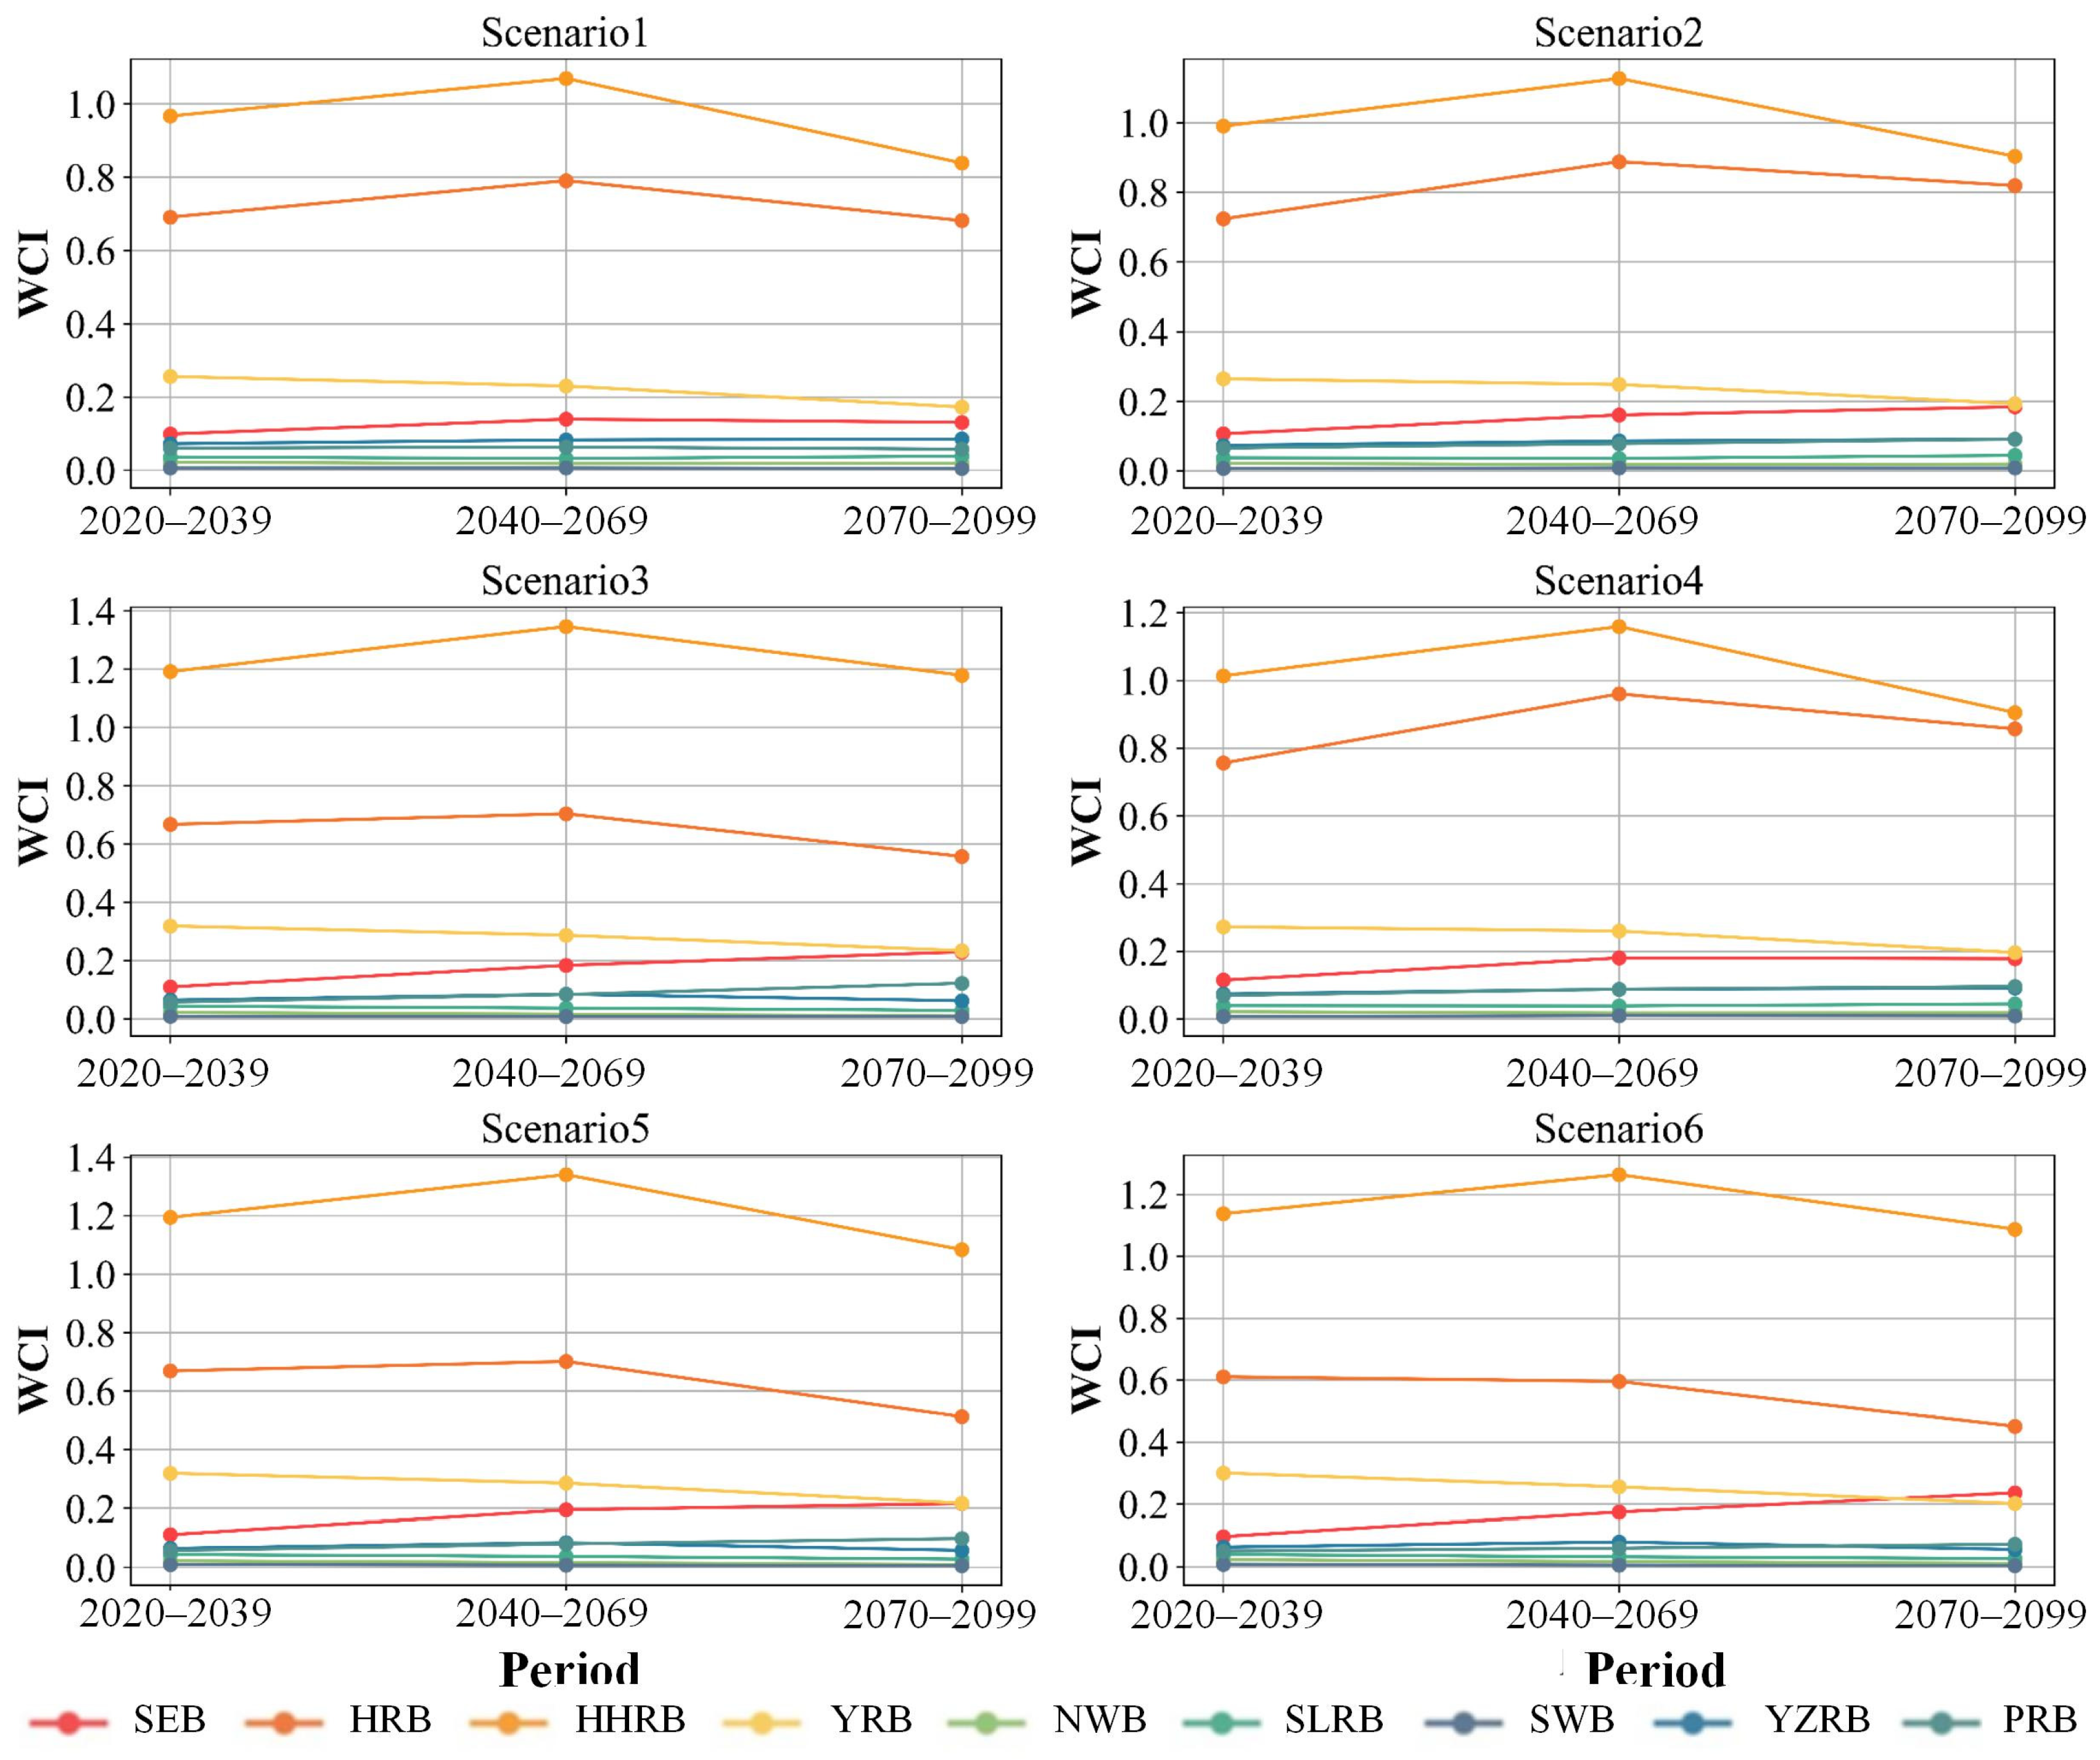
The WCI, calculated using Equation (10) and shown in Figure 9, further underscores these patterns. The YRB and HRB remain at high WCI levels throughout the study period, with index values peaking during 2040–2069 and remaining approximately 30–50% higher than those in the YZRB and PRB. Even with some decline after 2070, risks remain elevated. The YZRB, PRB, SWB, NWB, and SLRB maintain low WCI values, indicating limited conflict risks, whereas the HHRB falls into a medium-risk category, with future pressures likely to intensify due to both climatic and demand-driven factors. Several southern basins maintain relatively stable and low conflict risk, with WCI values remaining persistently low and markedly lower than those of the YRB and HRB throughout the study period.
Figure 9.
Trend of WCI changes across the nine major river basins under six scenarios.
Overall, water stress under low-emission scenarios is relatively moderate, supporting stable management strategies, whereas high-emission scenarios lead to greater volatility and concentrated risks in northern, high-demand basins, requiring more adaptive and forward-looking management approaches to address future uncertainties.
5. Discussion
5.1. Spatiotemporal Patterns of Water Supply-Demand Conflicts
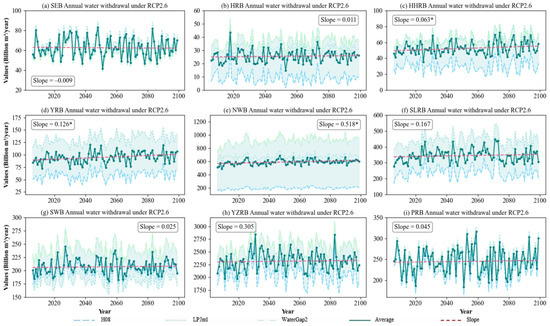
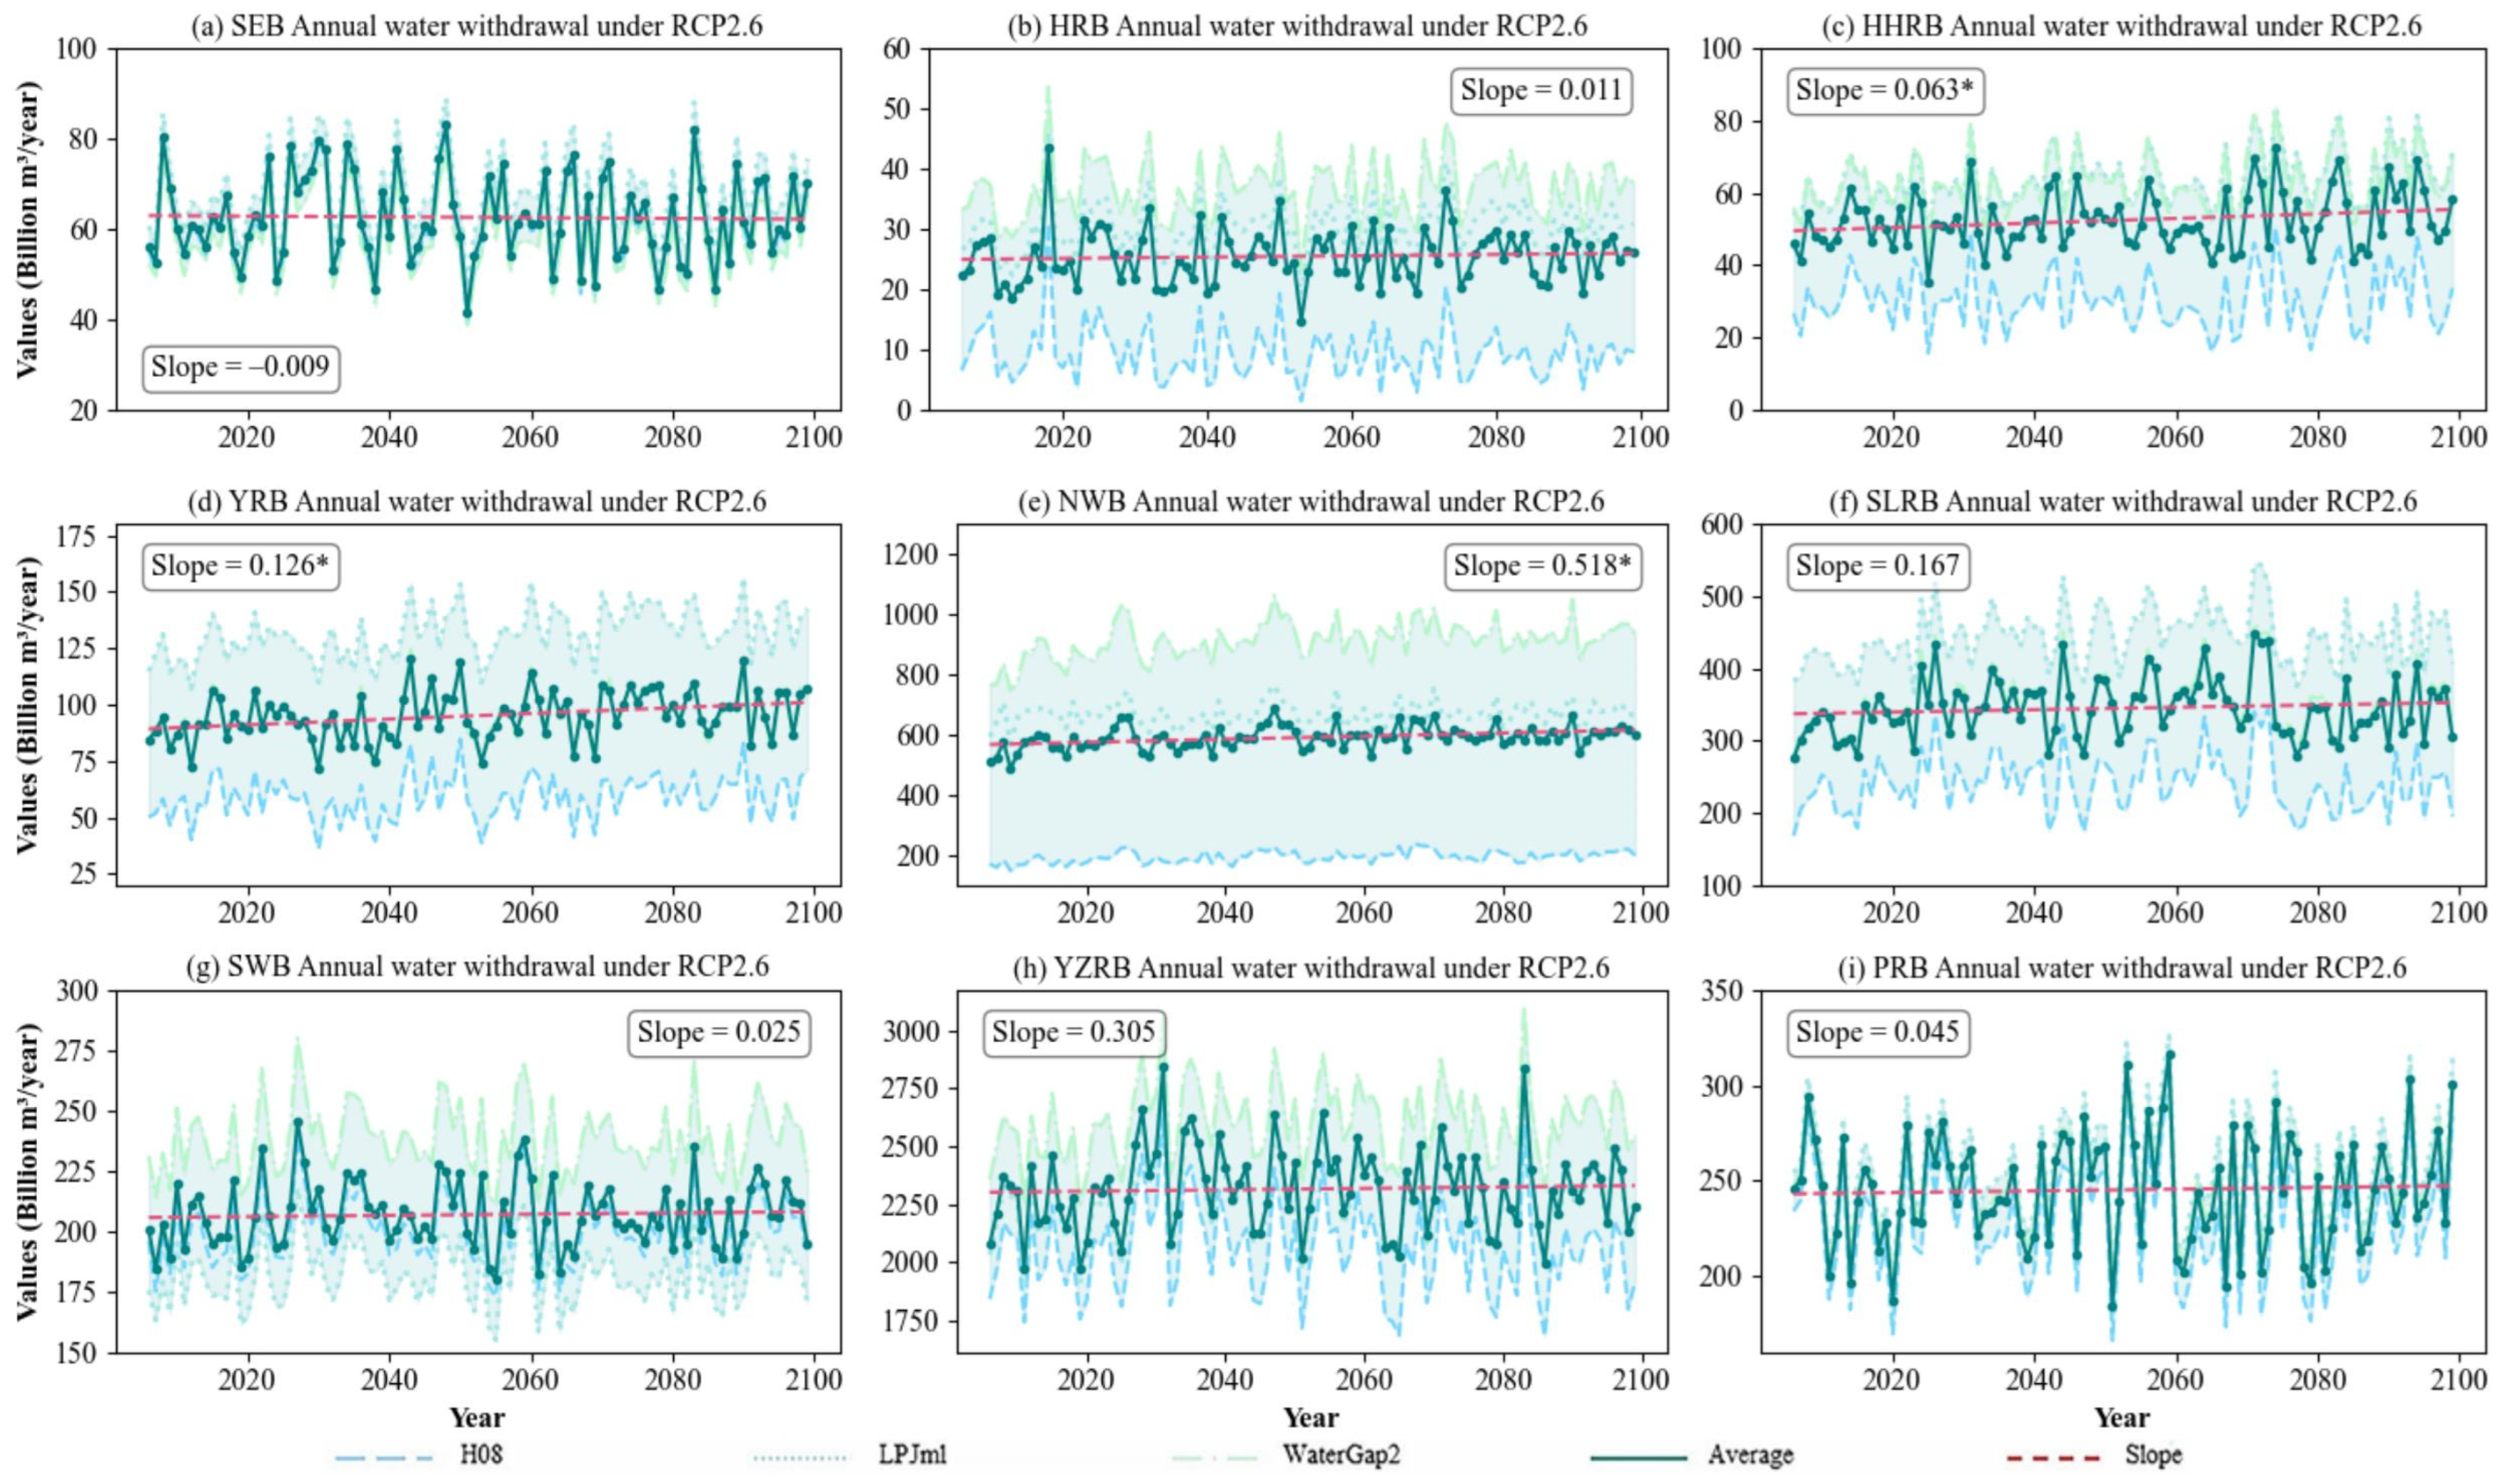
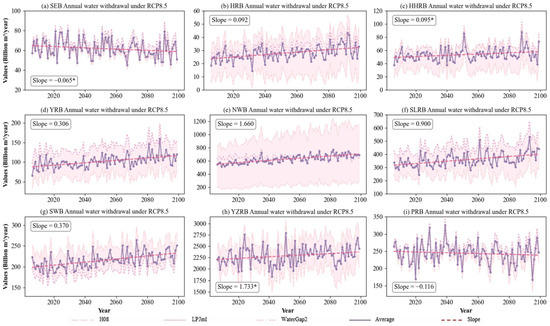
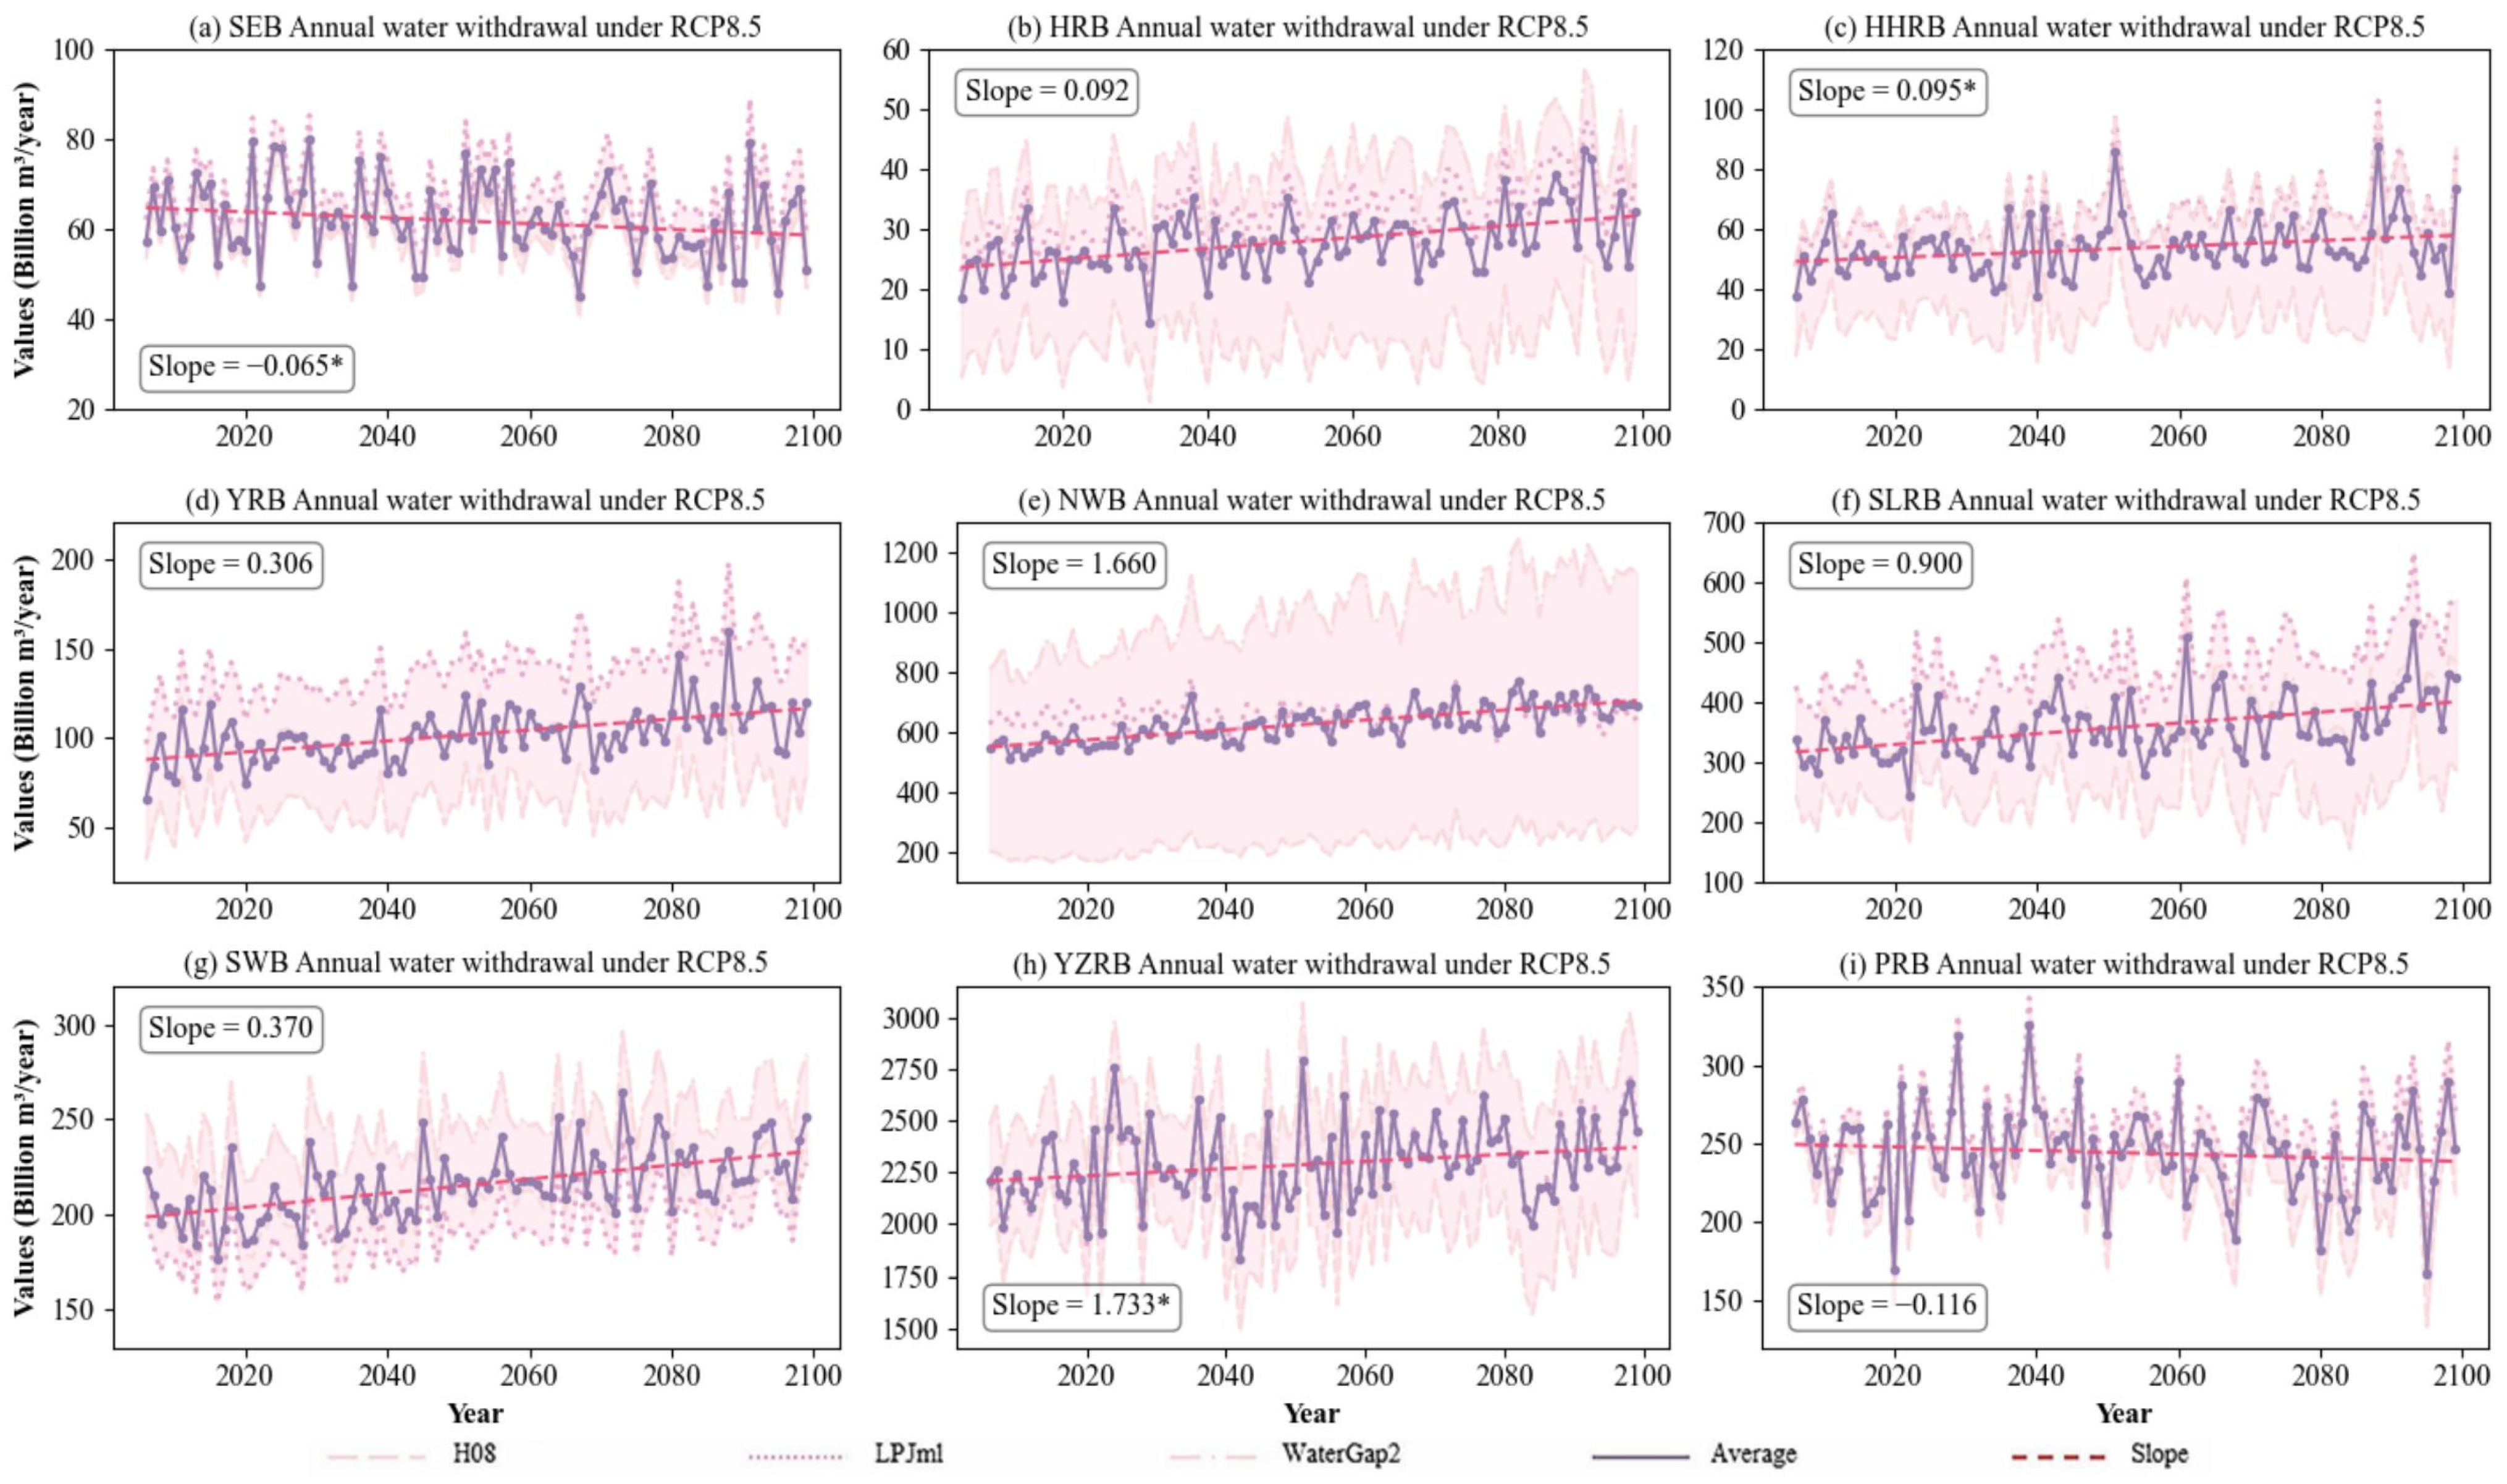
Under different climate change scenarios, the nine major river basins in China exhibit markedly different trends in annual water withdrawals. As shown in Figure 10, under low-emission scenarios most basins display increasing trends, but the growth rates are relatively small. For example, withdrawals in the SEB and HRB remain nearly stable, with slopes of −0.009 and 0.011, respectively. In contrast, the YRB and NWB show significant increases, with slopes of 0.126 and 0.518, both statistically significant, indicating stronger future water demand pressures. Under high-emission scenarios, growth in annual withdrawals becomes more pronounced, particularly in the YRB, NWB, SLRB, and YZRB (refer to Figure 11), suggesting that climate change combined with economic growth could lead to severe water scarcity in these regions.
Figure 10.
The water withdrawal of the nine major river basins under the RCP2.6 scenario, the slope is calculated using the Theil-Sen median estimator. (* denotes statistically significant results (p < 0.05)).
Figure 11.
The water withdrawal of the nine major river basins under the RCP8.5 scenario, the slope is calculated using the Theil-Sen median estimator. (* denotes statistically significant results (p < 0.05)).
The WSDSI results further highlight spatial disparities in water supply-demand pressures. In the HRB and HHRB, WSDSI values rise sharply under high-emission scenarios, reflecting intensifying imbalances (e.g., in SSP3-RCP8.5, WSDSI reaches 1.6 in the HHRB and nearly 1.5 in the HRB by 2050). The YRB also records high WSDSI values under certain scenarios, suggesting growing supply-demand pressures that warrant close monitoring. By contrast, the SEB and PRB maintain relatively low WSDSI values across all scenarios, indicating balanced supply-demand conditions and strong adaptive capacity to climate and socioeconomic changes.
Overall, WSDSI dynamics are jointly driven by climate change, demographic and economic growth, and management policies. The period 2040–2069 emerges as a critical stage of heightened water stress, especially under high-emission scenarios, when imbalances intensify and shortages become more severe. The high WSDSI values in the HRB and HHRB point to the need for stronger conservation measures and technological interventions, whereas the SEB and SLRB show greater stability and potential for improvement under low-emission pathways. Coordinating water use with ecological protection will therefore be a key scientific and policy challenge for achieving sustainable water resource management. It should be noted that this study does not conduct a separate grid- or station-scale evaluation of individual meteorological variables against ground observations. Instead, it relies on the comprehensive evaluation of climate forcing and hydrological models within the ISIMIP Phase 2 framework, complemented by basin-scale consistency checks using observed water use statistics and GRACE/GRACE-FO satellite data. This strategy is consistent with previous large-scale, multi-model climate impact assessments and avoids redundancy while ensuring robustness. Although finer-resolution datasets may better capture local hydrological heterogeneity, they are beyond the scope of the present basin-scale, long-term assessment. Future work will explore the integration of higher-resolution hydrological and land-use datasets to support sub-basin and local water management applications.
5.2. Identification and Assessment of Regional Water Conflicts
In identifying and assessing regional water conflicts, the Water Conflict Index (WCI) provides a quantitative tool to pinpoint basins with pronounced supply-demand imbalances and potential risks. Across all scenarios, the YRB and HRB consistently exhibit high WCI values, marking them as potential high-risk areas. Under high-emission scenarios (e.g., RCP8.5) and resource-intensive socioeconomic pathways (e.g., SSP3 and SSP5), conflict risks rise significantly. These elevated risks are primarily driven by the relative scarcity of water resources combined with rapidly increasing agricultural and industrial demand. Temporally, WCI peaks between 2040 and 2069 and declines somewhat after 2070, but risks remain considerable. This trajectory reflects the combined impacts of climate-induced supply fluctuations and rising demand from population and economic growth, with the YRB and HRB experiencing the most severe mid-century tensions. The heterogeneity in WCI across basins highlights the need for context-specific management strategies: stricter regulation, conservation measures, and ecological protection in high-risk basins, and resource reallocation or management adjustments in low-risk basins such as the SWB and SLRB.
Integrating SHRI and WSDSI further clarifies the drivers of conflict risk. In the YRB and HRB, low SHRI values coupled with high WSDSI values indicate that limited supply and rising demand jointly exacerbate water scarcity, with risks amplified under climate-induced supply variability. In contrast, in the SWB and SLRB, both indicators remain low, suggesting a balanced supply-demand relationship and limited conflict risk. Basin-specific analysis reveals distinct patterns: in the NWB and YRB, high SHRI variability with relatively stable WSDSI suggests supply-side instability as the dominant risk factor, particularly during droughts or extreme climate events. Conversely, in the HRB and HHRB, sharply rising WSDSI with relatively stable SHRI indicates that demand growth is the primary driver of conflict, as water use in agriculture and industry exceeds the basin’s carrying capacity.
Accordingly, differentiated management strategies are required. In supply-driven conflict regions (e.g., NWB and YRB), enhancing water allocation and inter-basin transfers can improve supply reliability. In demand-driven conflict regions (e.g., HRB and HHRB), water-saving practices, efficient technologies, and optimized industrial structures are essential to reduce demand pressure. To address uncertainties associated with climate change, long-term strategies must strengthen basin resilience. These include improving monitoring and early warning systems, optimizing resource allocation, and developing emergency response mechanisms to enable rapid adjustment when supply-demand imbalances intensify, thereby mitigating water conflict risks.
This study focuses on multi-scenario water supply–demand imbalance assessment using standardized ISIMIP runoff and agricultural water use simulations driven by bias-corrected climate forcing. While climate-driven vegetation and land-surface feedbacks are represented internally by the adopted models (especially LPJmL), we do not conduct an additional independent experiment to explicitly prescribe future cropland expansion or contraction. Explicit land-use change scenarios may further modify evapotranspiration, infiltration, and runoff generation, and incorporating such scenarios will be an important extension in future work.
5.3. Evaluation of Water Allocation Equity and Improvement Strategies
The main issues of water resource allocation inequity can be examined from three dimensions: regional, demand, and temporal. Regionally, disparities constitute a core challenge. The YRB and NWB exhibit low SHRI values, indicating limited supply. Owing to scarce precipitation and low runoff, natural water availability in these regions is far below that of the southeastern coastal areas. Population growth and economic expansion further exacerbate the fragility of water security. In contrast, the YZRB and PRB possess abundant resources, but the absence of effective coordination mechanisms leads to uneven allocation, aggravating water stress in the NWB and YRB and undermining national equity.
From the demand perspective, imbalances are equally pronounced. The HRB and HHRB are densely populated and economically developed, with a concentration of water-intensive industries, resulting in high WSDSI values and severe demand pressure. Large volumes of water are consumed for irrigation and industrial production, while insufficient conservation practices lead to waste. In these regions, domestic and ecological water use is often marginalized, particularly during times of scarcity when agricultural and industrial demands are prioritized.
Temporal fluctuations also contribute significantly to inequities. Between 2040 and 2069, the YRB and NWB experience severe supply-demand variability, with marked seasonal and interannual changes driven by climate variability. The increasing frequency of extreme events heightens uncertainty in supply, complicating management, and placing additional stress on balancing supply and demand.
To address these issues, three strategies are proposed. First, inter-basin water transfers should be strengthened to alleviate regional disparities. For the YRB and NWB, especially during drought periods, projects such as the South-to-North and West-to-East water diversion schemes can secure supply. Establishing inter-regional sharing mechanisms would further promote equitable allocation. Second, optimizing water use structures and implementing differentiated water pricing can reduce demand pressures in high-use regions. In the HRB and HHRB, tiered pricing policies should raise costs for water-intensive sectors while maintaining affordable prices for domestic consumption. Governments should also incentivize industrial transformation toward low-consumption, eco-friendly sectors, easing pressure from agriculture and industry. Third, enhancing real-time monitoring and early warning systems can mitigate temporal imbalances. By leveraging remote sensing, IoT, and smart meters, basin-level platforms can provide dynamic data on runoff, groundwater, and consumption, enabling evidence-based regulation. Complementary drought and flood warning systems should be established to anticipate extreme events and activate emergency allocation mechanisms, ensuring priority for domestic and ecological use. Together, these measures can ease inter-regional and inter-sectoral tensions, improving both equity and sustainability in water resource allocation.
This study primarily addresses water security from a quantitative perspective, focusing on water supply–demand imbalance and hydrological variability under future climate and socioeconomic scenarios. Water quality is not explicitly modeled as a dynamic variable in the current framework. At large basin and long-term scales, water quantity is often the dominant constraint on water availability; however, we acknowledge that water quality degradation may further reduce effective usable water, particularly in regions with intensive agricultural and industrial activities. Incorporating water quality indicators and water pollution processes into multi-scenario assessments would provide a more comprehensive evaluation of future water security and is an important direction for future research.
6. Conclusions
This study systematically assessed the future water supply-demand patterns, conflict risks, and allocation equity across China’s nine major river basins under multiple climate change and socioeconomic scenarios. By integrating hydrological and socioeconomic modeling, it quantified the spatial and temporal dynamics of water availability and demand, and provided a comprehensive framework for evaluating water security under different development pathways. The analysis highlights the interplay between natural variability and human drivers, demonstrating the importance of scenario-based approaches in long-term water resource planning.
The results reveal pronounced differences across scenarios and basins. Under high-emission pathways, the YRB, HRB, and NWB face severe pressures due to rapidly increasing agricultural and industrial demand, while low-emission scenarios highlight the mitigating potential of climate policies and adaptation measures. The WCI, constructed from WSDSI and SHRI, effectively quantifies regional risks, showing that the YRB and HRB experience peak conflict between 2040 and 2069, whereas the NWB and SLRB exhibit significant deterioration in hydrological variability. These findings underscore the growing risks of shortages and conflicts under high-demand and high-emission futures.
Water allocation inequity is another critical challenge, driven by both supply-side disparities and demand-side imbalances. The YRB and NWB suffer from chronic supply deficits, while the YZRB and PRB, though resource-abundant, lack effective redistribution mechanisms. At the same time, densely populated and industrialized basins such as the HRB and HHRB are characterized by excessive demand, leading to competition among agricultural, industrial, domestic, and ecological water uses. These structural imbalances exacerbate regional inequities and pose obstacles to achieving nationwide water security and sustainability.
In conclusion, this study provides a quantitative basis and policy insights for managing water resources in China under diverse climate and socioeconomic trajectories. It highlights the need to strengthen inter-basin transfers and sharing mechanisms, optimize water use structures and pricing policies, and improve monitoring and early-warning systems. While uncertainties in data and model limitations remain, future research should incorporate higher-resolution datasets and explore multi-sectoral feedbacks to refine risk management strategies. These efforts are essential for ensuring long-term water security and promoting sustainable development across China’s major river basins.
Supplementary Materials
The following supporting information can be downloaded at: https://www.mdpi.com/article/10.3390/w18020169/s1, Text S1. Introduction to the Selection of SSP–RCP Combinations. Text S2. Description of the Calculation Method for . Table S1. The effect of technological changes on water use intensities in the industrial sector. Table S2. Applied annual efficiency change rates for industrial water withdrawal intensity. Table S3. Scenarios for the change of domestic water withdrawal intensity.
Author Contributions
R.J.: Formal analysis, Writing—original draft, Writing—review & editing. Y.G.: Formal analysis, Methodology, Visualization, Writing—review & editing. H.Q.: Conceptualization, Writing—review & editing. J.Z.: Resources, Writing—review & editing. J.L.: Data curation, Writing—review & editing. C.W.: Data curation, Writing—review & editing. All authors have read and agreed to the published version of the manuscript.
Funding
This research was funded by the National Key Research and Development Program of China (No. 2023YFC3209103), National Natural Science Foundation of China (U2240216) and the numerical calculations in this paper have been performed on the supercomputing system in the Supercomputing Center of Wuhan University.
Data Availability Statement
The raw data supporting the conclusions of this article will be made available by the authors on request.
Conflicts of Interest
Author Yingwei Ge was employed by the company Changjiang Survey, Planning, Design and Research Co., Ltd. The remaining authors declare that the research was conducted in the absence of any commercial or financial relationships that could be construed as a potential conflict of interest.
Abbreviations
The following abbreviations are used in this manuscript:
| TWS | Terrestrial water storage |
| TWSA | Terrestrial Water Storage Anomaly |
| GRACE | Gravity Recovery and Climate Experiment |
| GRACE-FO | GRACE-Follow On |
| CSR | Center for Space Research |
| JPL | Jet Propulsion Laboratory |
| GFZ | German Research Centre for Geosciences |
| SEB | Southeast Basin |
| SWB | Southwest Basin |
| HRB | Haihe River Basin |
| YZRB | Yangtze River Basin |
| HHRB | Huaihe River Basin |
| YRB | Yellow River Basin |
| NWB | Northwest Basin |
| SLRB | Songhua–Liao River Basin |
| PRB | Pearl River Basin |
| GHMs | Global Hydrological Models |
| ISIMIP | Inter-Sectoral Impact Model Intercomparison Project |
| GDP | Gross Domestic Product |
| LSM | Land Surface Model |
| LPJmL | Lund–Potsdam–Jena Managed Land |
| GCMs | Global Climate Models |
| GFDL | Geophysical Fluid Dynamics Laboratory |
| IPSL | Institute Pierre-Simon Laplace |
| RCP | Representative Concentration Pathway |
| SSPs | Shared Socioeconomic Pathways |
| CDF | Cumulative Distribution Function |
| PPF | Percent Point Function |
| WSDSI | Water Stress Index |
| SHRI | Standardized Hydrological Runoff Index |
| WCI | Water Conflict Index |
References
- Jones, E.R.; Bierkens, M.F.; van Vliet, M.T. Current and future global water scarcity intensifies when accounting for surface water quality. Nat. Clim. Change 2024, 14, 629–635. [Google Scholar] [CrossRef] [Scilit]
- Kuang, X.; Liu, J.; Scanlon, B.R.; Jiao, J.J.; Jasechko, S.; Lancia, M.; Biskaborn, B.K.; Wada, Y.; Li, H.; Zeng, Z. The changing nature of groundwater in the global water cycle. Science 2024, 383, eadf0630. [Google Scholar] [CrossRef] [Scilit]
- He, C.; Liu, Z.; Wu, J.; Pan, X.; Fang, Z.; Li, J.; Bryan, B.A. Future global urban water scarcity and potential solutions. Nat. Commun. 2021, 12, 4667. [Google Scholar] [CrossRef] [Scilit]
- Xu, N.; Lu, H.; Li, W.; Gong, P. Natural lakes dominate global water storage variability. Sci. Bull. 2024, 69, 1016–1019. [Google Scholar] [CrossRef] [Scilit] [PubMed]
- Lu, J.; Jia, L.; Zhou, J.; Jiang, M.; Zhong, Y.; Menenti, M. Quantification and assessment of global terrestrial water storage deficit caused by drought using GRACE satellite data. IEEE J. Sel. Top. Appl. Earth Obs. Remote Sens. 2022, 15, 5001–5012. [Google Scholar] [CrossRef] [Scilit]
- Yao, T.; Bolch, T.; Chen, D.; Gao, J.; Immerzeel, W.; Piao, S.; Su, F.; Thompson, L.; Wada, Y.; Wang, L. The imbalance of the Asian water tower. Nat. Rev. Earth Environ. 2022, 3, 618–632. [Google Scholar] [CrossRef] [Scilit]
- Ji, R.; Wang, C.; Cui, A.; Jia, M.; Liao, S.; Wang, W.; Chen, N. Assessing terrestrial water storage dynamics and multiple factors driving forces in China from 2005 to 2020. J. Environ. Manag. 2024, 370, 122464. [Google Scholar] [CrossRef] [Scilit] [PubMed]
- Liu, J.; Jiang, L.; Zhang, X.; Druce, D.; Kittel, C.M.; Tøttrup, C.; Bauer-Gottwein, P. Impacts of water resources management on land water storage in the North China Plain: Insights from multi-mission earth observations. J. Hydrol. 2021, 603, 126933. [Google Scholar] [CrossRef] [Scilit]
- Dai, M.; Zhou, H.; Ma, W.; Tang, L.; Xu, S.; Luo, Z. Tracking shallow and deep groundwater storage changes in North China Plain with improved fusion method and hybrid spectral analysis approach. J. Hydrol. 2024, 633, 131001. [Google Scholar] [CrossRef] [Scilit]
- Li, X.; Long, D.; Scanlon, B.R.; Mann, M.E.; Li, X.; Tian, F.; Sun, Z.; Wang, G. Climate change threatens terrestrial water storage over the Tibetan Plateau. Nat. Clim. Change 2022, 12, 801–807. [Google Scholar] [CrossRef] [Scilit]
- Qi, W.; Feng, L.; Yang, H.; Zhu, X.; Liu, Y.; Liu, J. Weakening flood, intensifying hydrological drought severity and decreasing drought probability in Northeast China. J. Hydrol. Reg. Stud. 2021, 38, 100941. [Google Scholar] [CrossRef] [Scilit]
- Deng, S.; Liu, Y.; Zhang, W. A comprehensive evaluation of GRACE-like terrestrial water storage (TWS) reconstruction products at an interannual scale during 1981–2019. Water Resour. Res. 2023, 59, e2022WR034381. [Google Scholar] [CrossRef] [Scilit]
- Li, M.; Yang, X.; Wang, K.; Di, C.; Xiang, W.; Zhang, J. Exploring China’s water scarcity incorporating surface water quality and multiple existing solutions. Environ. Res. 2024, 246, 118191. [Google Scholar] [CrossRef] [Scilit]
- Wu, C.; Gao, P.; Xu, R.; Mu, X.; Sun, W. Influence of landscape pattern changes on water conservation capacity: A case study in an arid/semiarid region of China. Ecol. Indic. 2024, 163, 112082. [Google Scholar] [CrossRef] [Scilit]
- Zhang, Z.; Shan, Y.; Zhao, D.; Tillotson, M.R.; Cai, B.; Li, X.; Zheng, H.; Zhao, C.; Guan, D.; Liu, J. City level water withdrawal and scarcity accounts of China. Sci. Data 2024, 11, 449. [Google Scholar] [CrossRef] [Scilit] [PubMed]
- Yang, S.; Zhong, Y.; Wu, Y.; Yang, K.; An, Q.; Bai, H.; Liu, S. Quantifying long-term drought in China’s exorheic basins using a novel daily GRACE reconstructed TWSA index. J. Hydrol. 2025, 655, 132919. [Google Scholar] [CrossRef] [Scilit]
- Gupta, P.K.; Dubey, A.K.; Pradhan, R.; Chander, S.; Singh, N.; Jha, V.B.; Gujrati, A.; Wadhwa, C.; Desai, N.M. Assessment of the 2022 Floods in Lower Indus Basin Using Suite of Satellite Sensors and Hydrological Modelling. J. Indian Soc. Remote Sens. 2025, 53, 1943–1964. [Google Scholar] [CrossRef] [Scilit]
- Jaramillo, F.; Papa, F.; Wang, J.; Wdowinski, S.; Destouni, G.; Famiglietti, J. A special collection on hydrogeodesy in a new era of satellites for better understanding and management of water resources. Water Resour. Res. 2025, 61, e2025WR040585. [Google Scholar] [CrossRef] [Scilit]
- Touseef, M.; Chen, L.; Chen, H.; Gabriel, H.F.; Yang, W.; Mubeen, A. Enhancing streamflow modeling by integrating GRACE data and shared Socio-Economic pathways (SSPs) with SWAT in Hongshui river basin, China. Remote Sens. 2023, 15, 2642. [Google Scholar] [CrossRef] [Scilit]
- Budamala, V.; Roy, T.; Bhowmik, R.D. A robust skill verification of hindcast decadal experiments on streamflow regimes using CMIP6 data. J. Hydrol. 2025, 650, 132525. [Google Scholar] [CrossRef] [Scilit]
- Guo, B.; Ge, Y.; Xiao, X.; Wang, C.; Gong, J.; Li, D. Full-automatic high-precision scene 3D reconstruction method with water-area intelligent complementation and mesh optimization for UAV images. Int. J. Digit. Earth 2024, 17, 2317441. [Google Scholar] [CrossRef] [Scilit]
- Zhou, Q.; Huang, J.; Hu, Z.; Yin, G. Spatial-temporal changes to GRACE-derived terrestrial water storage in response to climate change in arid Northwest China. Hydrol. Sci. J. 2022, 67, 535–549. [Google Scholar] [CrossRef] [Scilit]
- Zhang, G.; Wu, Y.; Li, H.; Yin, X.; Chervan, A.; Liu, S.; Qiu, L.; Zhao, F.; Sun, P.; Wang, W. Assessment framework of water conservation based on analytical modeling of ecohydrological processes. J. Hydrol. 2024, 630, 130646. [Google Scholar] [CrossRef] [Scilit]
- Gyawali, B.; Ahmed, M.; Murgulet, D.; Wiese, D.N. Filling temporal gaps within and between GRACE and GRACE-FO terrestrial water storage records: An innovative approach. Remote Sens. 2022, 14, 1565. [Google Scholar] [CrossRef] [Scilit]
- Wei, W.; Wang, J.; Wang, X.; Song, Y.; Sherif, M.; Wang, X.; Dewan, A.; Ram, O.Y.; Yan, P.; Liu, T. Assessing the stability of terrestrial water storage to drought based on CMIP6 forcing scenarios. J. Hydrol. 2024, 645, 132232. [Google Scholar] [CrossRef] [Scilit]
- Liu, K.; Li, X.; Wang, S.; Lu, S.; Bo, Y.; Zhou, G. Quantifying past and future terrestrial water storage scarcity across China through midcentury. Earth’s Future 2025, 13, e2025EF006071. [Google Scholar] [CrossRef] [Scilit]
- Song, Z.; Xia, J.; Wang, G.; She, D.; Hu, C.; Piao, S. Climate change rather than vegetation greening dominates runoff change in China. J. Hydrol. 2023, 620, 129519. [Google Scholar] [CrossRef] [Scilit]
- Liao, S.; Wang, C.; Ji, R.; Zhang, X.; Wang, Z.; Wang, W.; Chen, N. Balancing flood control and economic development in flood detention areas of the Yangtze River Basin. ISPRS Int. J. Geo-Inf. 2024, 13, 122. [Google Scholar] [CrossRef] [Scilit]
- Ji, R.; Wang, C.; Wang, W.; Liao, S.; Chen, N. Spatiotemporal evolution of carbon balance based on the enhanced two-step floating catchment area (E2SFCA) method in the Yangtze River Economic Belt, China. Environ. Dev. Sustain. 2024, 26, 8979–9004. [Google Scholar] [CrossRef] [Scilit]
- Huang, J.; Zhang, Y.; Bing, H.; Peng, J.; Dong, F.; Gao, J.; Arhonditsis, G.B. Characterizing the river water quality in China: Recent progress and on-going challenges. Water Res. 2021, 201, 117309. [Google Scholar] [CrossRef] [Scilit] [PubMed]
- Wang, M.; Janssen, A.B.; Bazin, J.; Strokal, M.; Ma, L.; Kroeze, C. Accounting for interactions between Sustainable Development Goals is essential for water pollution control in China. Nat. Commun. 2022, 13, 730. [Google Scholar] [CrossRef] [Scilit]
- Tang, J.; Song, P.; Hu, X.; Chen, C.; Wei, B.; Zhao, S. Coupled effects of land use and climate change on water supply in SSP–RCP scenarios: A case study of the Ganjiang river Basin, China. Ecol. Indic. 2023, 154, 110745. [Google Scholar] [CrossRef] [Scilit]
- Cui, A.; Wang, C.; Huang, S.; Ji, R.; Jia, M.; Zhang, X.; Wang, W.; Chen, N. Satellite-based assessment reveals hydrological and ecological transformations from China’s South-to-North Water Diversion Project. Geo-Spat. Inf. Sci. 2025, 1–27. [Google Scholar] [CrossRef] [Scilit]
- Ji, R.; Wang, C.; Wang, P.; Wang, W.; Chen, N. Quantitative analysis of spatiotemporal disparity of urban water use efficiency and its driving factors in the Yangtze River Economic Belt, China. J. Hydrol. Reg. Stud. 2024, 51, 101647. [Google Scholar] [CrossRef] [Scilit]
- Ji, R.; Wang, C.; Cui, A.; Wang, W.; Chen, N. Separating climate and human induced terrestrial water storage anomalies with GRACE data and hydrological models. Int. J. Digit. Earth 2025, 18, 2557516. [Google Scholar] [CrossRef] [Scilit]
- Breil, M.; Laube, N.; Pinto, J.G.; Schädler, G. The impact of soil initialization on regional decadal climate predictions in Europe. Clim. Res. 2019, 77, 139–154. [Google Scholar] [CrossRef] [Scilit]
- Karan, K.; Singh, D.; Singh, P.K.; Bharati, B.; Singh, T.P.; Berndtsson, R. Implications of future climate change on crop and irrigation water requirements in a semi-arid river basin using CMIP6 GCMs. J. Arid. Land 2022, 14, 1234–1257. [Google Scholar] [CrossRef] [Scilit]
- Andrade, C.W.; Montenegro, S.M.; Montenegro, A.A.; Lima, J.R.d.S.; Srinivasan, R.; Jones, C.A. Climate change impact assessment on water resources under RCP scenarios: A case study in Mundaú River Basin, Northeastern Brazil. Int. J. Climatol. 2021, 41, E1045–E1061. [Google Scholar] [CrossRef] [Scilit]
- Duarte, H.F.; Kim, J.B.; Sun, G.; McNulty, S.G.; Xiao, J. Climate and vegetation change impacts on future conterminous United States water yield. J. Hydrol. 2024, 639, 131472. [Google Scholar] [CrossRef] [Scilit]
- Seka, A.M.; Guo, H.; Zhang, J.; Han, J.; Bayable, E.; Ayele, G.T.; Workneh, H.T.; Bayouli, O.T.; Muhirwa, F.; Reda, K.W. Evaluating the future total water storage change and hydrological drought under climate change over lake basins, East Africa. J. Clean. Prod. 2024, 447, 141552. [Google Scholar] [CrossRef] [Scilit]
- Hordofa, A.T.; Leta, O.T.; Alamirew, T.; Chukalla, A.D. Climate change impacts on blue and green water of Meki River Sub-Basin. Water Resour. Manag. 2023, 37, 2835–2851. [Google Scholar] [CrossRef] [Scilit]
- Wang, Z.; Xu, D.; Peng, D.; Zhang, X. Future climate change would intensify the water resources supply-demand pressure of afforestation in inner Mongolia, China. J. Clean. Prod. 2023, 407, 137145. [Google Scholar] [CrossRef] [Scilit]
- Jiang, Q.; Ouyang, X.; Wang, Z.; Wu, Y.; Guo, W. System dynamics simulation and scenario optimization of China’s water footprint under different SSP-RCP scenarios. J. Hydrol. 2023, 622, 129671. [Google Scholar] [CrossRef] [Scilit]
- Kong, Y.; He, W.; Yuan, L.; Zhang, Z.; Gao, X.; Zhao, Y.e.; Degefu, D.M. Decoupling economic growth from water consumption in the Yangtze River Economic Belt, China. Ecol. Indic. 2021, 123, 107344. [Google Scholar] [CrossRef] [Scilit]
- Rodell, M.; Reager, J.T. Water cycle science enabled by the GRACE and GRACE-FO satellite missions. Nat. Water 2023, 1, 47–59. [Google Scholar] [CrossRef] [Scilit]
- Eicker, A.; Schawohl, L.; Middendorf, K.; Bagge, M.; Jensen, L.; Dobslaw, H. Influence of GIA uncertainty on climate model evaluation with GRACE/GRACE-FO satellite gravimetry data. J. Geophys. Res. Solid Earth 2024, 129, e2023JB027769. [Google Scholar] [CrossRef] [Scilit]
- Khorrami, B.; Ali, S.; Gündüz, O. Investigating the local-scale fluctuations of groundwater storage by using downscaled GRACE/GRACE-FO JPL mascon product based on machine learning (ML) algorithm. Water Resour. Manag. 2023, 37, 3439–3456. [Google Scholar] [CrossRef] [Scilit]
- Li, X.; Zhong, B.; Li, J.; Wang, H. Investigating terrestrial water storage changes and their driving factors in the southwest river basin of China using geodetic data. IEEE Trans. Geosci. Remote Sens. 2023, 61, 101457. [Google Scholar]
- Xiang, L.; Wang, H.; Steffen, H.; Jiang, L.; Shen, Q.; Jia, L.; Su, Z.; Wang, W.; Deng, F.; Qiao, B. Two decades of terrestrial water storage changes in the tibetan plateau and its surroundings revealed through GRACE/GRACE-FO. Remote Sens. 2023, 15, 3505. [Google Scholar] [CrossRef] [Scilit]
- Wada, Y.; Flörke, M.; Hanasaki, N.; Eisner, S.; Fischer, G.; Tramberend, S.; Satoh, Y.; Van Vliet, M.; Yillia, P.; Ringler, C. Modeling global water use for the 21st century: The Water Futures and Solutions (WFaS) initiative and its approaches. Geosci. Model Dev. 2016, 9, 175–222. [Google Scholar] [CrossRef] [Scilit]
- Satoh, Y.; Kahil, T.; Byers, E.; Burek, P.; Fischer, G.; Tramberend, S.; Greve, P.; Flörke, M.; Eisner, S.; Hanasaki, N. Multi-model and multi-scenario assessments of Asian water futures: The Water Futures and Solutions (WFaS) initiative. Earth’s Future 2017, 5, 823–852. [Google Scholar] [CrossRef] [Scilit]
- Hanasaki, N.; Fujimori, S.; Yamamoto, T.; Yoshikawa, S.; Masaki, Y.; Hijioka, Y.; Kainuma, M.; Kanamori, Y.; Masui, T.; Takahashi, K. A global water scarcity assessment under Shared Socio-economic Pathways—Part 2: Water availability and scarcity. Hydrol. Earth Syst. Sci. 2013, 17, 2393–2413. [Google Scholar] [CrossRef] [Scilit]
- Hanasaki, N.; Fujimori, S.; Yamamoto, T.; Yoshikawa, S.; Masaki, Y.; Hijioka, Y.; Kainuma, M.; Kanamori, Y.; Masui, T.; Takahashi, K. A global water scarcity assessment under Shared Socio-economic Pathways—Part 1: Water use. Hydrol. Earth Syst. Sci. 2013, 17, 2375–2391. [Google Scholar] [CrossRef] [Scilit]
- Uddin, M.G.; Nash, S.; Rahman, A.; Olbert, A.I. A comprehensive method for improvement of water quality index (WQI) models for coastal water quality assessment. Water Res. 2022, 219, 118532. [Google Scholar] [CrossRef] [Scilit] [PubMed]
- Zhang, K.; Li, X.; Zheng, D.; Zhang, L.; Zhu, G. Estimation of global irrigation water use by the integration of multiple satellite observations. Water Resour. Res. 2022, 58, e2021WR030031. [Google Scholar] [CrossRef] [Scilit]

Disclaimer/Publisher’s Note: The statements, opinions and data contained in all publications are solely those of the individual author(s) and contributor(s) and not of MDPI and/or the editor(s). MDPI and/or the editor(s) disclaim responsibility for any injury to people or property resulting from any ideas, methods, instructions or products referred to in the content. |
© 2026 by the authors. Licensee MDPI, Basel, Switzerland. This article is an open access article distributed under the terms and conditions of the Creative Commons Attribution (CC BY) license.