


Abstract
This study evaluates whether existing long-term monitoring data are sufficient to distinguish natural background concentrations from anthropogenic influences on chemical river water quality in Lake Sevan basin. A comprehensive dataset covering physicochemical parameters, nutrients, and trace metals was analyzed for nine major tributaries with different geological settings and land-use characteristics. Multivariate statistical analysis was applied to identify baseline conditions and deviations attributable to human activities. The results indicate that water chemistry is primarily controlled by lithology and hydrological regime, particularly in minimally impacted headwater regions. In contrast, elevated concentrations of nutrients (e.g., nitrate and phosphate) and selected trace elements were associated with agricultural runoff, urban discharge, and localized industrial inputs. Spatial patterns reveal clear gradients of increasing anthropogenic impact downstream and in densely populated sub-basins. The study also demonstrates that, while the current monitoring network is suitable for assessing the overall chemical status of rivers, it is less effective in defining natural background levels and quantifying individual pollution sources due to limited upstream reference conditions. Overall, this approach provides a scientific basis for improved water quality management and policy implementation in the Lake Sevan basin. The findings highlight the importance of integrating long-term monitoring data with statistical tools to support sustainable watershed management in vulnerable catchments.
1. Introduction
Monitoring of chemical water quality is at least a nationally well-established part of environmental policy and river management, often following international guidelines (e.g., EU Water Framework Directive). The goal of the monitoring is to provide data allowing for the evaluation of the chemical water quality in comparison with defined thresholds or references [1]. Basic understanding of the characteristics of the monitored water bodies and the development of detailed water management measures are usually not the goal and often hardly possible based exclusively on regular monitoring data [2]. The available budgets for the monitoring are usually limited, and the spatial and temporal resolution of the monitoring are often not high enough to answer basic and/or detailed questions regarding ecosystem functioning and management options.
However, monitoring results are valuable data containing considerable information, particularly when covering larger catchment areas and being collected over longer time periods. Long-term data sets collected over many years became an important component in research, regardless of whether the data were collected within scientific research projects or by monitoring of state authorities [3,4,5]. Even in the latter case, they reflect the characteristics of the rivers and their catchments and the major factors typically influencing chemical water quality (natural background, human impacts) at least to some extent [6]. Good understanding of both the natural background and the anthropogenic influence is needed for successful water quality management.
“Natural background” means, in the given context, the chemical water quality resulting from the combined effect of climate, hydrological conditions, geology, soil, and vegetation without considerable human impacts [7]. Such conditions can be found in upstream sections of rivers where settlements, and human land use, or other human activities are (almost completely) missing. Studies by Meybeck [8,9] used this approach to identify the typical composition of river water originating from particular rock types. Long-distance atmospheric transport processes and atmospheric deposition can reach considerably beyond strong human contamination sources as known, e.g., from research on atmospheric deposition [10,11,12]. However, if strong sources are missing and the present rock shows high rates of chemical weathering, the effects of atmospheric deposition from human sources can be considered very small [8,9,13].
In our study, we use monitoring data collected by the Hydrometeorology and Monitoring Center SNCO of the Ministry of Environment of the Republic of Armenia (Armhydromet), the Armenian authority responsible for all kinds of environmental monitoring, for the nine major rivers draining into Lake Sevan for the period 2010–2024 (15 years). Lake Sevan is one of the largest (ca. 1250 km2) high-altitude (1900 m a.s.l.) fresh water lakes in Eurasia and the largest fresh water resource in the Caucasus region [14]. These tributaries represent the primary pathways of nutrient and pollutant inputs to Lake Sevan, and their assessment is therefore essential for understanding and managing the ecological status of the lake. The research questions of our study were as follows:
Can existing monitoring data be used to characterize and quantify the natural background concentrations and human impacts on chemical water quality of rivers and to which extent does this work for the rivers draining into Lake Sevan?
What are the requirements for filling identified gaps and can their implementation be part of standard monitoring?
Data preprocessing was implemented to identify and replace outliers in chemical concentration measurements prior to subsequent analyses to improve the robustness and comparability of the dataset. To investigate the sampling site patterns, hierarchical clustering approaches were applied both within sampling sites, to examine relationships among chemical parameters, and across sampling sites, to identify groups of sites with similar hydrochemical characteristics.
2. Materials and Methods
2.1. Study Area and Sampling
The study area includes basins of the main rivers flowing into Lake Sevan—Argichi, Dzknaget, Gavaraget, Karchaghbyur, Martuni, Masrik (with its Sotk tributary), Shoghvag, Tsakkar, and Vardenis. Lake Sevan basin is located in the eastern part of Armenia and is surrounded by mountain structures on all sides: to the northeast—by the Areguni and Sevan folded-block ridges; to the east—by the East Sevan Ridge; and to the west and south—by the Gegham and Vardenis volcanic massifs (Figure 1).
Figure 1.
Lake Sevan (Armenia), its natural tributaries and their river basins, location of the sampling sites, mountain ranges bordering the natural catchment of Lake Sevan and major tectonic faults.
River sources reflect the basin’s geomorphological structure. The Gavaraget, Shoghvag, and Tsakkar rivers originate from the Geghama Massif, while the Argichi, Martuni, Vardenis, and Karchaghbyur rivers rise from the Vardenis Massif. The Dzknaget River originates from the Pambak mountain range and the Masrik River mainly from the East Sevan Range.
Hydrological regimes vary across the basin and are controlled by altitude, geology, and groundwater–surface water interactions. Rivers draining the eastern slopes of the Gegham and part of the northern slopes of the Vardenis mountain ranges, such as Gavaraget, Tsakkar, Shoghvag, Karchaghbyur, and the middle and lower reaches of the Argichi, receive substantial groundwater input, while snowmelt and rainfall dominate in the upper reaches. The Masrik River, particularly in its middle and lower segments, is fed by groundwater accumulated in the alluvial–proluvial sediments of the Masrik Plain. In contrast, the Dzknaget River exhibits a predominantly snowmelt–rainfall-fed regime with limited groundwater input [15,16].
The Lake Sevan basin is characterized by complex geological and hydrogeological conditions, which exert a strong influence on river chemistry and flow regimes (Appendix A). Four main hydrogeological units are distinguished: (i) Quaternary alluvial–lacustrine deposits (Q1-4), consisting of unconsolidated gravels, sands, clays, and loams, occur mainly around river valleys and the lake plains and form shallow, porous aquifers. (ii) Pliocene-quaternary volcanic rocks (N2-Q), including basalts, andesites, dacites, and tuffs, dominating the surrounding highlands and hosting extensive fractured aquifers that constitute the main groundwater reservoirs and recharge zones of the basin. (iii) Upper Cretaceous sedimentary carbonate rocks (K2) represented by limestones and marls, occurring locally in the northern and northeastern parts of the basin and supporting limited fracture or karst aquifers. (iv) The Mesozoic-Cenozoic crystalline basement comprising low-permeability formations that act primarily as aquicludes or runoff boundaries.
Mineral and thermal waters are locally observed in tuffaceous Meso-Cenozoic layers. Overall, the most productive aquifers are the volcanic rocks and Quaternary alluvial deposits, which together form the principal groundwater reservoirs. Less permeable formations often serve as confining layers or highland runoff zones [16].
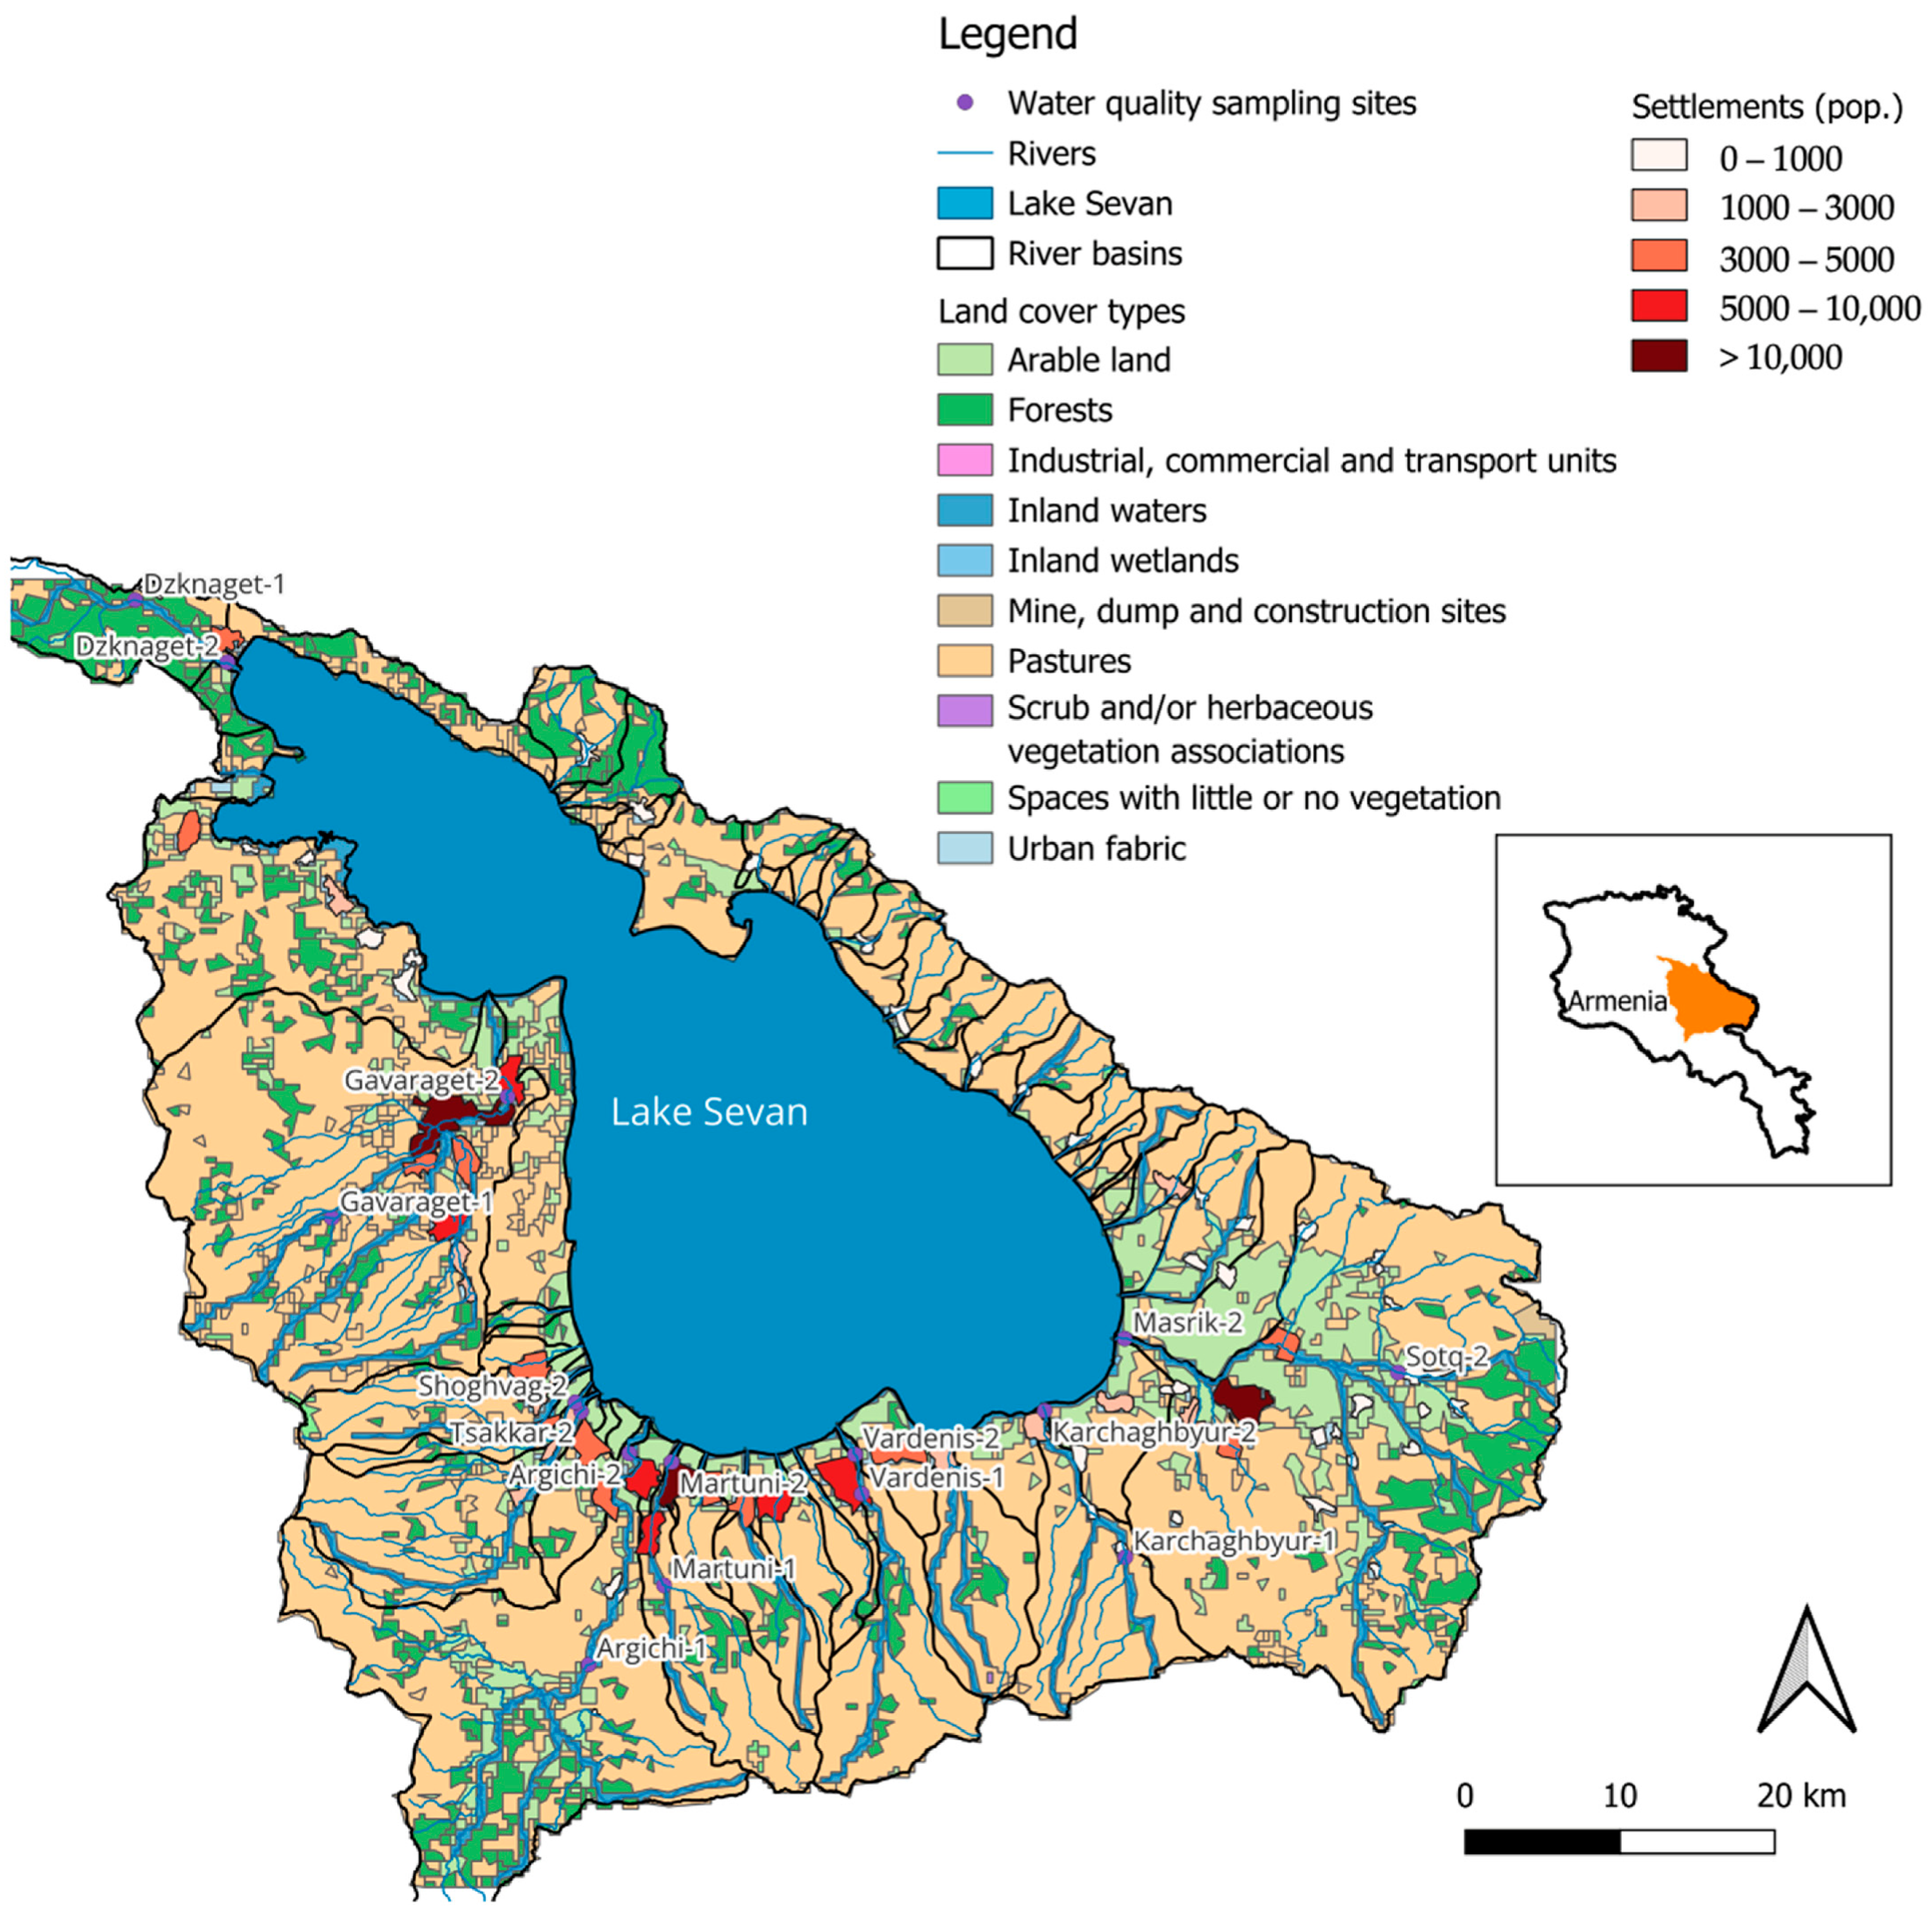
The catchment area of Lake Sevan is rich in mineralizations, i.e., natural enrichments of minerals and metal ores. Only part of them have been the subject of mining. However, these mineralizations are natural sources of diverse chemical elements. Figure A2 gives an overview of the location of the diverse mineralizations reported in [17,18]. Table A1 lists these mineralizations and describes their composition. Figure A3 provides an overview of the land use in the catchment of Lake Sevan and its natural tributaries. While the upper parts of the catchments are almost completely covered by natural grassland, to some extend used for grazing livestock, considerable portions of the lower parts of the catchments are used as arable land (for details see Appendix C). Forest is present only marginally [19]. Settlements are generally located along the downstream stretches of the rivers. Approximately 250,000 inhabitants are living in the catchment of Lake Sevan [20].
Chemical water quality data were obtained for 16 sampling sites (SSs) located along the 9 major tributary rivers flowing into Lake Sevan: Argichi, Dzknaget, Gavaraget, Masrik (with its Sotk tributary), Karchaghbyur, Martuni, Vardenis, Tsakkar, and Shoghvag (Figure 1, Table 1). The names of the SSs consist of the name of the river and a ‘1’ for an upstream position of the SS or a ‘2’ for a downstream position of the SS (usually close to the inflow into Lake Sevan). The upstream SSs were chosen upstream of settlements and arable land as far as possible. The only exception is the Sotk River, a tributary of Masrik River. The Sotk gold mine is located in the catchment of Sotk River and has a strong influence on the chemical water quality (see Section 3). Therefore, we used the name of the tributary in this case and the ‘2’ to indicate that the SS is located downstream of the gold mine and close to the inflow of the Sotk River into the Masrik River. Despite this naming, SS Sotk-2 is located upstream of SS Masrik-2 and, thus, comparisons between both SSs were performed, as for the other upstream and downstream SSs.
Table 1.
Sampling sites and number of observations (catchment areas are for the entire catchment of the river).
Sampling frequency varied among SSs over the observed period. The upstream SSs were sampled mainly from April to October, while the downstream SSs were usually sampled up to ten times per year. In the remaining months, sampling could not be carried out because of limited access due to snow and ice. The dataset covers the period 2010–2024 and includes a comprehensive set of hydrochemical parameters, grouped as follows:
- ○
- Major anions: bicarbonate (HCO3−), sulfate (SO42−), chloride (Cl−);
- ○
- Major cations: sodium (Na+), magnesium (Mg2+), potassium (K+), calcium (Ca2+);
- ○
- Nutrients: nitrate (NO3−), nitrite (NO2−), ammonium (NH4+), dissolved phosphate (PO43−), total phosphorus (TP);
- ○
- Silicate (SiO2);
- ○
- Trace elements: Al, As, B, Ba, Cr, Cu, Fe, Mn, Mo, Ni, V, Zn;
- ○
- Oxygen and oxygen demand: dissolved oxygen (DO), biological oxygen 5-day demand (BOD5), chemical oxygen demand (COD).
Table 1 summarizes the number of observations available for each sampling site, providing an overview of data density and temporal coverage across the basin.
2.2. Sample Treatment and Chemical Analyses
In the Lake Sevan basin, chemical water quality monitoring is conducted within the national monitoring network operated by the Hydrometeorology and Monitoring Center (Armhydromet).
Sampling of inflowing rivers follows internationally recognized procedures in line with ISO 5667 series (water quality sampling) [21,22]. All analyses were performed in accredited laboratory of Armhydromet using internationally standardized methods.
High-purity reagents and certified reference standards were employed throughout all determinations, and deionized water (resistivity ≥ 18 MΩ·cm) was used for sample preparation, reagent dilution, and instrument calibration.
Detection limits, analytical precision, and accuracy were controlled through routine quality assurance procedures, including the analysis of blanks, duplicates, and certified reference materials. The analytical procedures applied are summarized below.
2.2.1. Dissolved Oxygen (DO)
Dissolved oxygen was measured using an electrochemical (membrane electrode) method in accordance with ISO 5814 [23] using a YSI ProDSS multiparameter instrument (YSI Inc., Yellow Springs, OH, USA)․
2.2.2. Biochemical Oxygen Demand (BOD5)
BOD5 was determined according to ISO 5815-1:2019 [24]. Samples were incubated for 5 days, after which dissolved oxygen was measured. BOD5 was calculated as the difference between initial and final dissolved oxygen concentrations.
2.2.3. Chemical Oxygen Demand (COD)
COD was determined according to ISO 15705:2002 [25]. The method is based on the oxidation of organic matter by potassium dichromate in the presence of sulfuric acid. Silver sulfate was used as a catalyst, and the excess dichromate was determined titrimetrically using Mohr’s salt with phenylanthranilic acid as an indicator.
2.2.4. Ammonium (NH4+)
Ammonium was determined spectrophotometrically using Nessler’s reagent according to GOST 33045 (Method A) [26]. The method is based on the reaction of ammonium ions with Nessler’s reagent in an alkaline medium, forming a yellow-brown-colored complex. Absorbance was measured at the appropriate wavelength using a SPECORD 250 PLUS spectrophotometer (Analytik Jena GmbH, Jena, Germany), and concentrations were calculated using calibration curves prepared from standard solutions. Samples were filtered prior to analysis when suspended matter was present.
2.2.5. Nitrite (NO2−)
Nitrite was determined spectrophotometrically using the Griess reaction (GOST 33045, Method B) [27]. Nitrite reacts with sulfanilic acid to form a diazonium compound, which subsequently couples with α-naphthylamine to produce a pink azo dye. Absorbance was measured at the appropriate wavelength using a SPECORD 250 PLUS spectrophotometer (Analytik Jena GmbH, Jena, Germany), and concentrations were quantified using external calibration. Samples were filtered using red-band filter paper prior to analysis.
2.2.6. Dissolved Phosphate (PO43−)
Orthophosphate was determined spectrophotometrically using the ammonium molybdate method according to ISO 6878:2004 [28]. In acidic medium, orthophosphate reacts with ammonium molybdate to form phosphomolybdic acid, which is subsequently reduced by ascorbic acid to a blue-colored complex. The absorbance of the complex was measured using a SPECORD 250 PLUS spectrophotometer (Analytik Jena GmbH, Jena, Germany) and concentrations were quantified by external calibration using standard solutions. Samples were filtered using red-band filter paper prior to analysis.
2.2.7. Silicon (SiO2)
Silicon was determined spectrophotometrically according to RD 52.24.433 [29]. The method is based on the reaction of silicic acid with ammonium molybdate in an acidic medium to form a yellow molybdosilicic heteropoly acid. The absorbance maximum of the formed complex was measured at 410 nm using a SPECORD 250 PLUS spectrophotometer (Analytik Jena GmbH, Jena, Germany). Samples were filtered using red-band filter paper prior to analysis.
2.2.8. Alkalinity (HCO3−)
Alkalinity (bicarbonate) was determined by acid–base titration according to ISO 9963-1 [30]. The method involves the addition of excess hydrochloric acid (to pH ≈ 3), removal of the generated carbon dioxide, and back-titration with a standard borax solution in the presence of a mixed indicator (methyl red and methylene blue).
2.2.9. Nitrate (NO3−), Chloride (Cl−), and Sulfate (SO42−)
These anions were determined by ion chromatography using 940 Professional IC Vario chromatograph (Metrohm AG, Herisau, Switzerland) according to ISO 10304-1 [31] using an anion-exchange column with suppressed conductivity detection. Quantification was performed using calibration standards.
2.2.10. Ca, Mg, Na, K, Fe, Mn, Cu, Zn, Ni, Cr, Al, As, B, Ba, Mo, V, P
These elements were determined using inductively coupled plasma mass spectrometry (ICP-MS) with an ELAN 9000 ICP-MS system (PerkinElmer Inc., Waltham, MA, USA) according to ISO 17294-2 [32]. Samples were introduced into an argon plasma, where elements were ionized and subsequently detected based on their mass-to-charge ratio. Quantification was carried out using multi-element calibration standards with appropriate correction for potential interferences. The results represent total concentrations (e.g., TP) since the samples were not filtered.
2.3. Data Preparation and Evaluation
Outliers were identified separately for each monitoring station–chemical combination using an interquartile range (IQR) approach, where observations falling outside the interval Q1 − 3*IQR and Q3 + 3*IQR were classified as outliers and temporarily replaced with missing values. The resulting detected outlier observations were subsequently imputed using spline interpolation along the temporal sequence within each station–chemical group [33]. Data preparation and all statistical analyses were performed using the R programming language (version 4.4.2).
The concentrations of the investigated trace elements were assessed based on the maximum geogenic background concentrations derived from global river studies as reference values.
The basic idea of the adapted geo-accumulation index (Igeo) introduced by Müller [34] was applied. This classification concept assumes that a doubling of element concentrations in sediments corresponds to a deterioration by one quality class:
where cn is the measured element concentration and bn is the maximum background concentration reported in the literature. As the highest available background values were already used, the correction factor of 1.5 was omitted in the calculations presented in this study.
Igeo = log2 (cn/1.5 bn)
A consequence of this approach is that negative index values may occur when the literature-derived background concentration exceeds the concentration measured in the monitoring program. Such negative values indicate that the actual background concentration at the respective sampling site is lower than the highest background concentration reported in the literature. Since the primary objective of the index is to identify spatial patterns of contamination rather than to determine site-specific background concentrations, these negative values do not affect the interpretation of the results.
In this way, the exceedance of the maximum background concentration was classified into seven classes: (I) non, (I–II) non to moderate, (II) moderate, (II–III) moderate to strong, (III) strong, (III–IV) strong to extreme, (IV) extreme (can reflect >100-fold exceedance).
The upper limit of the typical concentration ranges of trace elements in natural river water as reported by Gaillardet et al. [13] was used as bn.
The concentrations of major ions were evaluated by comparison to typical concentrations reported for river water originating from particular rock types as provided by Meybeck [9]. Additionally, the concentration ratios were evaluated using the Piper diagram [35] and the approach of Gaillardet et al. [36]. In Armenia, natural background concentrations have been assessed and used to develop a national, chemical water quality classification system. This framework is directly relevant for the present study, as it supports the identification of baseline conditions and the differentiation between natural and anthropogenic impacts [37].
The evaluation of data for COD via comparison required in some cases the transformation of concentrations given as dissolved organic carbon (DOC) into COD. Theoretically, this could be performed by assuming a general composition of organic matter as CH2O as known from glucose (C6H12O6), resulting in a ratio of 2.6 for COD:DOC. This is, e.g., recommended by Volcke et al. [38] for wastewater. The use of this ratio is further supported by the data presented by Gilbert et al. [39] and Badr [40].
For the multivariate statistical analysis, chemical concentration data at each sampling site were standardized using z-score normalization and subjected to hierarchical cluster analysis based on squared Euclidean distance and Ward’s method to identify groups of chemicals exhibiting similar temporal variation patterns [41]. The clustering structure was visualized using dendrograms (see Figure S2), while pairwise Spearman correlation coefficients between chemical parameters (see Figure S3) were calculated and presented as heatmaps to evaluate the strength and direction of inter-chemical relationships within each SS. Spearman correlation was selected instead of Pearson correlation because hydrochemical datasets commonly violate the assumptions of normality (see Figure S1) and linearity required for Pearson’s coefficient. Concentration data are often skewed, influenced by episodic events, and characterized by outliers related to dilution, mobilization, and other factors. Under such conditions, rank-based correlation provides a more robust measure of association because it is less sensitive to extreme values and is suitable for monotonic relationships that may be non-linear. Therefore, Spearman correlation was considered more appropriate for characterizing inter-parameter associations in this water-quality dataset. Statistical significance of Spearman correlation coefficients was evaluated using two-sided t test [42], and the resulting p-values were adjusted for multiple comparisons using the Benjamini–Hochberg false discovery rate procedure [43] (see Figure S4).
In the subsequent stage, SSs themselves were clustered with the same hierarchical clustering approach according to the median values of all chemical parameters across the study period.
3. Results
3.1. Basic Patterns in the Monitoring Data
Figure 2 presents the results of the cluster analysis of all data according to the sampling sites. The first cluster included all upstream SSs as well as the SS Karchaghbyur-2, which was the only downstream SS. All remaining downstream SSs were grouped in the second cluster. Furthermore, the variability among the SSs within the second cluster was, in several cases, larger than between the SSs of the first cluster. SS Sotk-2 appeared as the most separated SS, followed by SS Gavaraget-2, both belonging to the second cluster. These two SSs showed the highest median values for 9 and 7 of the 28 analyzed chemical water quality parameters, respectively (Tables S1–S3). Within the first cluster, the SS Argichi-1 was the most separate (Figure 2).
Figure 2.
Cluster analysis of all data according to SSs.
A similar pattern is visible in Figure S1 and from a comparison of the median values (Tables S1–S3). In most cases (146 out of 196), the median values of the concentrations at the downstream SSs were higher than those at the upstream SSs. The main exceptions to this pattern occurred for the SSs Sotk-2 and Masrik-2 as well as the water constituents iron, aluminum, and manganese.
3.2. Comparison with Typical Concentrations in Natural River Water
3.2.1. Major Ions and SiO2
Table S1 summarizes the descriptive statistics of the concentrations of major ions and presents typical median concentrations of river water dominated by peridotite, volcanic rock, sandstone, shale, or sedimentary carbonate rock as described by Meybeck [9]. The median concentrations of the major ions were higher than those for volcanic rock, peridotite, sandstone, and shale according to Meybeck [9] at almost all SSs. The typical concentration medians for sedimentary carbonate rock were exceeded for Na+, K+, and Cl− for all SSs. For several SSs, the median concentrations of Mg2+ and SO42− were similar to the typical values for sedimentary carbonate rock according to Meybeck [9]. However, there were also several cases of exceedance. The median concentrations of Ca2+ and HCO3− were generally lower than the typical values for sedimentary carbonate rock according to Meybeck [9], except for a small exceedance at SS Sotk-2. The median values for SiO2 of all SSs were in a similar range compared to the typical median values reported by Meybeck [9] for volcanic rock.
Figure 3 compares the ionic ratios found in this study with typical ionic ratios of waters dominated by chemical weathering of evaporite, silicate, and carbonate rock according to Gaillardet et al. [36]. All data were located between the typical ranges for silicate and carbonate rock. SS Sotk-2 was again a bit separated and closest to carbonate rock.
Figure 3.
Comparison of the median values of ionic ratios for all SSs with typical ionic ratios of waters dominated by chemical weathering of evaporite, silicate, and carbonate rock according to Gaillardet et al. [36].
As typical for fresh water, Ca2+, Mg2+, and HCO3− were the dominant major ions in the river water (Figure 4). In many cases, there were only small differences between upstream and downstream SSs regarding the ratios of the ions. Considerable differences were found between SSs Gavaraget-1 and Gavaraget-2 for both cations and anions (higher portion of Mg2+ and Cl− at SS Gavaraget-2), SSs Karchaghbyur-1 and Karchaghbyur-2 for cations (higher portion of Mg2+, Na+, and K+ at SS Karchaghbyur-1), and SSs Martuni-1, and Martuni-2 for anions (higher portion of SO42− at SS Martuni-2) (Figure 4).
Figure 4.
Piper diagram. The number of the SS (1 or 2) was added only for cases where there were considerable differences between upstream and downstream SSs.
3.2.2. Trace Elements
Table S2 presents the descriptive statistics of the concentrations of the investigated trace elements Al, As, B, Ba, Cr, Cu, Fe, Mn, Mo, Ni, V, and Zn. As indicated by comparison with typical concentrations in natural waters (according to Gaillardet et al. [13]) and the applied evaluation method adapted from Müller [34], the concentrations of trace elements were within ranges typical for natural waters in most cases. If the typical ranges were exceeded, this applied mostly only to the uppermost 10% of the collected data or less. Considerable exceptions were: As, Cu, and Ni at SS Sotk-2, As at SS Masrik-2, and B at SSs Shoghvag-2, Tsakkar-2, and Gavaraget-2. In addition, the concentrations of V were elevated almost everywhere.
3.2.3. Oxygen and Oxygen Demand and Phosphorus and Nitrogen Compounds
Table S3 provides the descriptive statistics of the concentrations of dissolved oxygen (DO), the biological oxygen 5-day demand (BOD5), the chemical oxygen demand (COD), dissolved phosphate (PO43−), total phosphorus (TP), ammonium (NH4+), nitrite (NO2−), and nitrate (NO3−). The DO concentrations were almost always in the range of saturation, i.e., in equilibrium with the atmosphere. The BOD5 was relatively low and considerably lower than the measured oxygen concentrations. The median values of the COD were mostly in the range of 12 to 15 mgO2/L, except for the SSs Dzknaget-2 and Gavaraget-2, where values reached 20 mgO2/L.
The medians of the concentrations of NH4+ mainly ranged between ca. 100 and 200 µg/L. The concentrations of NO2− were roughly one order of magnitude smaller. Median values of the concentrations of NO3− were in the range of ca. 100 to 200 µg/L for most upstream SSs, while 1 mg/L was often exceeded at the downstream SSs.
On average, 75% of TP was present as PO43−. The upstream TP concentrations (medians 30–80 µg/L) were always lower than the downstream concentrations (medians 90–250 µg/L).
3.3. Cluster Analysis for Concentrations of Water Constituents at Each Sampling Site
The results of the cluster analysis for the concentrations of the water constituents at each single SS are shown in Figure S2. Some of the water constituents clustered closely together very often: DO and BOD5 in thirteen cases, As and V in ten cases, Cu and Ni in nine cases, and Al and Fe in six cases. For the latter three pairs, there were additionally always three cases where they clustered very close to each other. However, in one case, DO and BOD5 were in different clusters while this occurred for Al and Fe in three cases.
The major cations clustered near to each other only in two cases. However, they were located in the same cluster in almost all cases except one (Argichi-1). The major anions behaved differently: They were in the same cluster in nine cases and in different clusters in the remaining seven cases.
The clustering of the nitrogen-containing compounds (NH4+, NO2−, NO3−) was similar to that of the major anions. In eight cases, they belonged to the same cluster, and in the other eight cases they belonged to different clusters. PO43− and TP behaved more similar to the major cations: In only two cases they belonged to different clusters, and in the remaining twelve cases they were in the same cluster, even close to each other in four cases.
3.4. Relationship Between Concentrations of Water Constituents
Figure S3 presents the correlation matrices for the concentrations of all analyzed water constituents separated for each SS. There were more correlations (positive coefficients, shades of red in Figure S3) than anti-correlations (negative coefficients, shades of blue in Figure S3). The adjusted p-values of Spearman correlations are presented in Figure S4. As shown in that figure, several coefficients in the range < −0.3 and >0.3 remained statistically significant after adjustment. However, coefficients of this magnitude indicate weak monotonic associations and were therefore not interpreted as substantively meaningful. To avoid over-interpreting weak but statistically detectable relationships, interpretation was based on both adjusted significance and effect size, and correlations between −0.5 and 0.5 were conservatively treated as weak. Under this criterion, 87.5% of all coefficients ranged between −0.5 and 0.5, indicating only weak or missing (anti-)correlations. Coefficients > 0.6 occurred much more often (725 times) than coefficients < −0.6 (35 times) and −0.9 was not found while 0.9 was found 30 times.
The heatmaps suggested the separation of the water constituents into three groups: (i) the major ions (except SO42−) together with phosphate (both PO43− and TP), As, B, Mo, and V, which were correlated in most cases to some extent, containing most of the occurring coefficients of 0.8 and 0.9. (ii) DO, BOD5, COD, NH4+, Al, Cr, Cu, Fe, Mn, Ni, and Zn, which were correlated relatively often, but less often and less strongly than the first group. (iii) SO42−, NO3−, NO2−, SiO2, and Ba, which did not show any consistent tendency. Anti-correlations occurred most often between members of the first group and of the second group.
4. Discussion
4.1. Concentration Levels and Local Aspects
4.1.1. Major Ions
The concentrations of the major ions were generally higher than expected for silicate rock according to Meybeck [9] while they were lower than expected for carbonate rock according to Meybeck [9]. The data presented in Meybeck [9] were based mainly on investigations in remote, mountainous, small catchments in France which are characterized by single rock types [8,9]. Potential influences of long-distance atmospheric transport of major ions from marine sources were subtracted by Meybeck [9] from the concentrations analyzed in the river water. This is the main reason why Meybeck [8,9] reported 0 mg/L for Cl− for most rock types. However, the concentrations of the other major ions were also reduced by Meybeck [8,9] to some extent. In our study, such subtraction was not performed since there are no data for the long-distance marine influence on atmospheric deposition in Armenia. Furthermore, Meybeck [8,9] did not perform long-term monitoring but only a few samplings. This may have meant that he did not cover the full variability of the concentrations with his sampling strategy. Finally, already, Meybeck [9] has discussed the question how far his catchments in France could be considered comprehensively representative on the global scale. E.g., the rock in his catchments in France was exposed to weathering already for a relatively long time, while younger rock in other locations might have been exposed to leaching of major ions to a lesser extent, i.e., the younger rock may allow for higher concentrations in the local river water. Therefore, Meybeck [9] concluded that considerable local deviations have to be expected and that his data rather represent a guiding order of magnitude than something analogous to precise thresholds. This was confirmed by other studies connecting chemical water quality in rivers with the lithology of their catchments [44,45]. Despite these considerations, Meybeck [9] was used as a reference since it is still the most comprehensive available reference for major ions in river water.
For all rivers, the downstream SSs showed higher concentrations of major ions than the upstream SSs. This is interpreted to have both natural and anthropogenic reasons. Agricultural land use is known to intensify the chemical weathering of rock-borne minerals in the soil [46]. In addition, some fertilizers contain major ions, particularly potassium fertilizers, which often are simply potassium chloride (KCl). Wastewater is also a known source for major ions, particularly SO42− and Cl− [38]. Natural processes causing increasing concentrations from upstream to downstream SSs include the following: (i) The longer the transport distance of broken rock from its origin in the highest parts of the mountains, the more the rock is crushed and the smaller the average grain size becomes. This is accompanied by an increasing size of the surface of the mineral particles where chemical weathering can take place (i.e., the release of major ions and other elements constituting the particles into water). (ii) In the most upstream parts of streams and their catchments, the steepness of the area often causes very fast flow, and thus, there is very little time for water–rock interactions, not allowing a chemical equilibrium to be reached, as is often reported for high-mountain headwater streams [45,46]. In the more downstream sections of the rivers, the flow is often considerably slower, widely comparable to lowland rivers, thus providing more time for water–rock interactions and eventually for chemical equilibrium to be reached [44,45,46]. Additionally, the downstream parts of the river catchments provide thicker aquifers, allowing for larger contributions of groundwater, which is also typically in chemical equilibrium with the minerals present in soil and rock. Which of the two aspects applied more for the rivers investigated in this study could not be quantified based on the available monitoring data, and very likely differed between the rivers, e.g., because of the known differences between the contributions of groundwater to the river water [16].
In addition to the general upstream–downstream differences, there were two further striking patterns: (i) SS Sotk-2 showed the highest concentrations for Ca2+, Mg2+, SO42− and HCO3− and (ii) elevated concentrations of Cl−, HCO3−, Na+ and K+ at SSs Shoghvag-2 and Tsakkar-2 (Figure S1). The SS Sotk-2 is strongly influenced by the gold mine operating upstream of it and the related gold deposit (Figure A2, Table A1). This gold deposit is known and has been used already for thousands of years [47]. The Sotk gold deposit is a poly-metallic gold–mercury mineralization [17,48] rich in sulfide and also containing tellurides, as is known for such deposits [49]. Due to mining, the sulfide is oxidized, forming acidic mine water [50,51]. The present carbonate rock neutralizes the acidity very close to its formation, meaning that acid mine drainage is not a big problem for the Sotk gold mine. However, as a result of the neutralization, Ca2+, Mg2+ and HCO3− are mobilized, and the sulfide oxidation produces SO42−.
The elevated concentrations of Cl−, HCO3−, Na+ and K+ at SSs Shoghvag-2 and Tsakkar-2 were interpreted as local geological features. The reason was that the B concentrations were considerably elevated in parallel compared to all other SSs (Figure S1, Table S2). Furthermore, we even hypothesize that the southern tributaries of the Gavaraget River may also be influenced by the same local geological conditions, contributing to the similarly elevated concentrations at SS Gavaraget-2. Avagyan et al. [52] reported considerable tectonic activity in that area. This could allow for pathways of deep circulating waters influenced by deeper geological formations with geochemical compositions different from the young volcanic rock forming the land surface.
The distribution of the SSs in the Piper diagram (Figure 4) and their positions between silicate and carbonate rock in Figure 3 fit very well to the findings discussed above and the known geological conditions. The catchment of most of the investigated rivers (Argichi, Gavaraget, Karchaghbyur, Martuni, Shoghvag, Tsakkar, Vardenis) is dominated by young volcanic rock. In the catchments of the remaining rivers (Dzknaget, Masrik and its tributary Sotk), carbonate rock is also present. The special conditions at SS Sotk-2 (elevated contribution of SO42− to the anions and of Ca2+ and Mg2+ to the cations) are also visible, as well as the ones found at SSs Shoghvag-2 and Tsakkar-2 (elevated contributions of Cl− to the anions and of Na+ and K+ to the cations).
Most of the correlations that involved major ions, had higher correlation coefficients (0.7 or higher) and were significant for the major cations (Figures S3 and S4). This was interpreted as an indication of both joint sources (mainly present rock and soil) and similar geochemical behavior. According to Gaillardet et al. [13], the geochemical mobility of the major cations is similar to and different from that of many trace elements. Only K+ is usually considerably less mobile than Na+, Mg2+ and Ca2+. However, this did not influence the correlations between the major cations.
4.1.2. Oxygen and Oxygen Demand
The concentration of dissolved oxygen in river water depends on the water temperature, the air pressure, the consumption rate and the rate of oxygen supply via exchange with the atmosphere and via photosynthesis of benthic organisms. The investigated rivers are usually fast flowing and shallow. Only the channel-like lower stretches of the Masrik Rive differ from that a bit. This allows for rapid equilibration with the atmosphere and good light conditions for benthic phototrophs. In combination with the relatively small BOD5, concentrations close to oxygen saturation were to be expected.
The COD generally consists of the biological degradable component which is represented by the BOD5 and a second component which is degradable only very slowly and called refractory or persistent. Under natural conditions, the second component mainly consists of humic substances leached from soil by groundwater recharge and interflow. The concentration of humic substances in river water depends on the soil conditions and, thus, in turn also on the dominating vegetation and land use [53]. For the upstream parts of the river catchments, grassland dominates, while arable land is also relevant for the downstream parts (Figure A3). The COD concentrations of rivers draining grassland vary very much [54,55,56]. The COD concentrations at the upstream SSs were relatively high compared to the literature, although even higher concentrations could be found in the literature for grassland [57]. The reasons for that could not be identified within this study.
Both BOD5 and COD had higher concentrations at the downstream SSs (Figure S1, Table S3). Since both municipal wastewater and agriculture are well known as sources of BOD5 and COD [58], the higher downstream concentrations were interpreted as the result of human impacts. The slightly higher concentrations of DO at the downstream SSs were interpreted as being most likely the result of photosynthetic activity of phytobenthos, mainly macrophytes, based on the higher nutrient concentrations there compared to the upstream SSs. This is supported by the abundant occurrence of macrophytes in the downstream parts of the rivers (Figure S5).
DO showed significant correlations with other chemical water quality parameters only exceptionally (Figures S3 and S4). This was interpreted as an indication of differing sources and differing biogeochemical behavior. While major ions and trace mainly originate from the present rock and the mineral components of the soil and behaves widely conservative regarding biological activities (mainly assimilation and decay), the organic matter represented by BOD5 and COD originates from the vegetation and is subject to microbial decay. As mentioned above, the interaction with the atmosphere is essential for DO while is hardly relevant for most of the other investigated water constituents.
4.1.3. Nutrients
The concentrations of nutrients were generally higher at the downstream SSs compared to the upstream SSs. This was interpreted as both the result of agriculture and wastewater. Both are known as sources of nitrogen and phosphorus compounds [38,59,60,61], and the land use patterns of the river catchments (Figure A3) also support this interpretation.
For the SS Sotk-2, the mining activity has to be considered as a further source of NO3− and NH4+. Explosives are known to cause elevated concentrations of NO3− and NH4+ [62,63].
Compared to concentrations found in rivers in the EU [61], the concentrations in the rivers flowing into Lake Sevan are not high. For NO3− and PO43−, all maxima remained within the chemical state “good” according to the EU Water Framework Directive, while for TP, the maxima slightly exceeded the related threshold at the SSs Martuni-2 and Vardenis-2. For NH4+, the maxima at the stations Vardenis-2 and Sotk-2 fell into the categories “poor” and “moderate”, respectively. However, the median values of all stations fell into the category “high” (Table S3; [61]).
4.1.4. Trace Elements
The discussion of the observed concentrations of trace elements was focused on concentrations exceeding the typical natural range according to Gaillardet et al. [13] at least moderately for the Q3-value (As, B, Cu, Mn, Ni, V, Zn). The spatial patterns and known geological and land use conditions were used for interpretation.
As, B, Cu, V and Zn showed slightly elevated (no to moderate exceedance) concentrations at many SSs and not only at downstream SSs. This was interpreted as evidence for a considerable contribution of natural sources. As and V are known to occur in elevated concentrations in the presence of volcanic rock and volcanic ashes [64,65,66]. This supports the interpretation that the present rock was a major source for As and V.
B is described in the literature to be often associated with deep circulating waters, igneous rock and sea spray [67,68,69]. Among the SSs, Shoghvag-2 and Tsakkar-2 had particularly elevated concentrations, while Gavaraget-2 and Sotk-2 showed elevated concentrations to a lesser extent. For these SSs, the concentrations of some major ions were considerably elevated too, as discussed above. Considering Avagyan et al. [52], the elevated concentrations at SSs Shoghvag-2, and Tsakkar-2 and Gavaraget-2 were interpreted as the result of the local influence of deep circulating water. For SS Sotk-2, the elevation of the concentrations compared to all other SSs is rather small and no particular source is known. Given the heterogeneity of the geological conditions in the catchment of the Masrik River and its tributaries, the documentation of B mineralizations in the catchment of one of the tributaries (Figure A2, Table A1) cannot be taken as a relevant explanation for the concentrations observed at SS Sotk-2. A more likely explanation is the generally increased rate of chemical weathering in the Sotk gold mine and its waste rock dumps due to the obviously occurring sulfide oxidation (see discussion on major ions).
B can also originate from anthropogenic use. Since the SSs with the highest B concentrations are all located downstream and, except for SS Sotk-2, downstream of settlements and arable land, use of B in agriculture and detergents and thus wastewater as two known anthropogenic uses of B [70] have to be considered as potential sources. However, it is very unlikely that these sources are much stronger in the catchments of SSs Shoghvag-2 and Tsakkar-2 than in the catchments of all other rivers. The same applies for the other known major anthropogenic sources of B: mining for B ores, production of glass and ceramics, chemical industry, and combustion of coal and fossil fuels [70,71]. All such activities are not known particularly for the catchments of the rivers Shoghvag and Tsakkar [20]. Therefore, the above discussed geogenic origin of the elevated B concentrations is the most likely interpretation of the collected data.
Elevated concentrations of Cu and Zn are often interpreted as the influence of human activities since both metals have been used for many purposes already for centuries [72,73,74]. Very likely, this also can be applied to the downstream SSs of the investigated rivers, since all have settlements in their catchments (Figure A3). For the upstream SSs, such interpretation was not applicable because of widely missing human activities in the catchments of the upstream SSs. The only exception from that is SS Sotk-2 with the Sotk gold mine in its catchment. Therefore, the slightly elevated concentrations of Cu and Zn were interpreted as natural background, probably due to the occurrence of volcanic ash in the catchment of all rivers [52,75].
For a number of trace elements (As, Ba, Cr, Cu, Ni), the highest concentrations (both regarding maxima and medians) were observed at SS Sotk-2. Al, Fe and to some extent also Mn showed elevated concentrations too. This was interpreted as the influence of both the documented mineralization of the catchment of the Sotk River (Figure A2, Table A1) and the Sotk gold mine. The multi-metal and sulphidic character of the mineralization [48] allows for this interpretation. Although no acidification of the river water was observed, the high SO42− concentrations were clear indications of sulfide oxidation, which is generally accompanied by the formation of acidity. This acidity was obviously neutralized in the case of the Sotk gold mine. However, the neutralization by the present minerals of the mineralization itself and the surrounding rock, including limestone, mobilized both major ions and trace elements. This sequence of biogeochemical reactions is well known from many mine sites and natural outcrops of sulfide mineralizations [50,76].
The strongest correlations between trace elements (and also with other water constituents) were found for As, B and V. The correlation coefficients often were 0.7 or higher between these elements and also for the correlations to the major cations (Figure S3) and the correlations were also significant (Figure S4). This was interpreted as further evidence that these elements originated from the rock and soil and were not predominantly the result of anthropogenic contamination. The relatively high mobility of B and As in the water cycle [13] probably contributed to the correlation with the major cations.
4.2. Differences Between Upstream and Downstream SSs
The differences between upstream and downstream SSs were clearly visible from Figure 2 and also in many detailed comparisons along the single rivers (Figure S1, Tables S1–S3; see also discussion above). Together with the land use patterns, this suggests that the results from downstream SSs demonstrated the anthropogenic influence and the related contamination as a consequence of wastewater inflows and agriculture. The widely missing treatment of wastewater [20] probably contributed to the dimension of the wastewater influence and its visibility in the monitoring results of the downstream SSs. The exceptions from this basic pattern represented by SS Karchaghbyur-2, which belonged to the cluster of the upstream SSs, were interpreted as the result of the special land use patterns in the catchment of this SS: there was only very little arable land in the catchment, and the settlements are relatively small (Figure S3, [20]) and probably rather influence the direct inflow into Lake Sevan than the water in the Karchaghbyur River.
The pattern within the cluster of the downstream SSs reflects to a wide extent what has been discussed already in Section 4.1.1. Shoghvag-2 and Tsakkar-2 clustered close to each other. The same applied, separated but on a similar level, for Martuni-2, Argichi-2 and Vardenis-2, which all are similar both regarding geological conditions and land use. The relatively close similarity of Masrik-2 was not expected because of the suspected influence of the Sotk gold mine and the occurrence of limestone in the catchment. It seems that the influence of the agricultural land use and the settlements was stronger. The bigger dissimilarity of the Dzknaget-2 was interpreted as a result of the different geological conditions and the likely influence of the intense traffic on a road close and parallel to the Dzknaget River and the drainage from the related road tunnel just upstream of Dzknaget-1 (which will be discussed in more detail below). Why SS Gavaraget-2 was separated could not be fully clarified. The geological conditions of its catchment and the land use patterns are not very different from those of SSs Martuni-2, Argichi-2 and Vardenis-2. One option is, as discussed above already, that the most southern tributary of the Gavaraget River was similar to the rivers Shoghvag and Tsakkar and had a relatively strong influence on the chemical water quality at SS Gavaraget-2. In contrast, the clear separation of SS Sotk-2 could be explained easily by the influence of the Sotk gold mine.
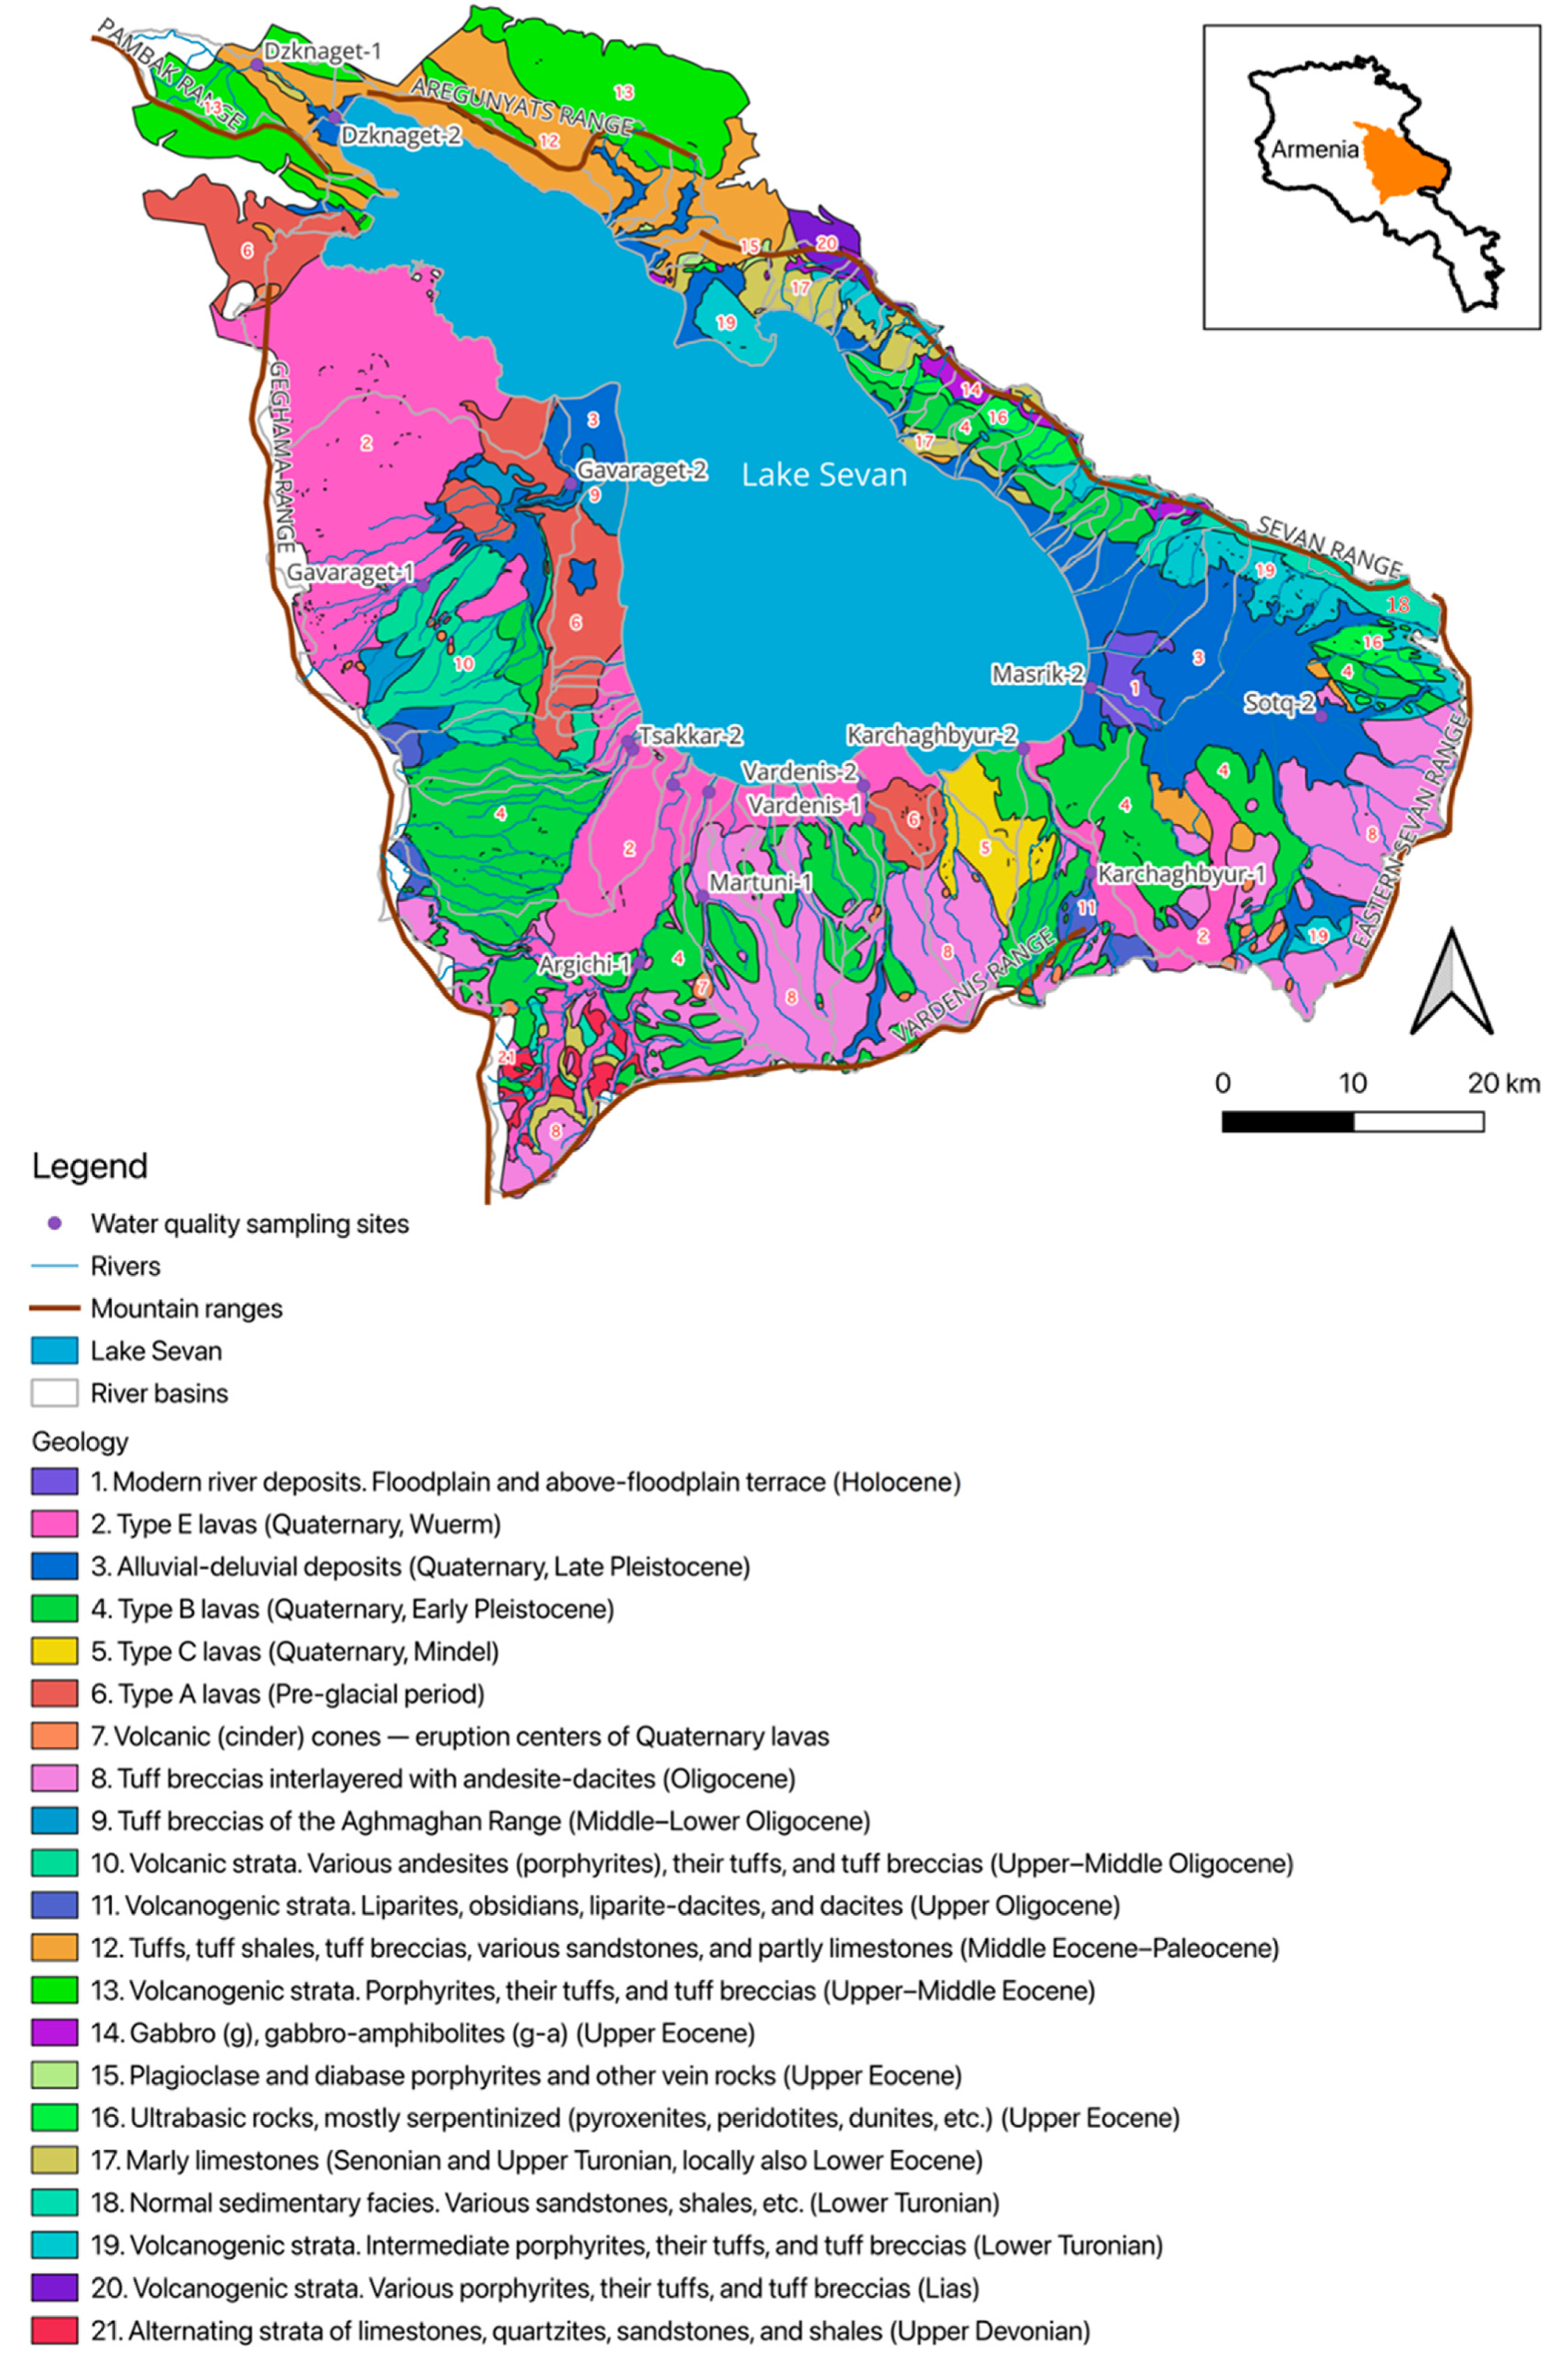
The patterns within the cluster of the upstream SSs followed to a wide extent the geographical locations of the catchments and the differences in the geological conditions. The catchments of Martuni-1, Vardenis-1 and Karchaghbyur river are neighboring each other and are all underlain by young volcanic rock (Figure A1). Why SS Gavaraget-1 was separated could not be clarified. There are no known differences in the geological conditions, and no strong human influence is known (Figure A1 and Figure A3). SS Argichi-1 was separated probably due to the location of arable land upstream of it (Figure A3).
The catchment of SS Dzknaget-1 belongs to the Pambak mountain range and contains limestone, which is missing in the catchments of all other upstream SSs except SS Sotk-2. Furthermore, parallel to the Dzknaget River, a road is running upward to a tunnel across the Pambak mountain range. This road is one of the main connections of the northern part of Armenia with Yerevan, the capital of Armenia. Consequently, this road experiences heavy traffic. Additionally, SS Dzknaget-1 is located very close to the entrance of the road tunnel, meaning in turn that the runoff from the tunnel probably enters the river close to the SS. Runoff of roads and road tunnels was reported to contain elevated concentrations of many water constituents, including trace elements [77,78,79,80]. Tunnels act also like drains in mountains [81,82]. This can sometimes even result in draining waters which were separated from interaction with fresh meteoric water for very long times as, e.g., observed during the construction of the St. Gotthard tunnel connecting Switzerland and Italy [83,84].
In summary, although the results showed many differences between upstream and downstream SSs, the separation into natural background and anthropogenic influence remained weak to some extent. Two of the upstream SSs (Argichi-1, Dzknaget-1—if considering also the mining impacted SS Sotk-2 as an upstream SS, even three) had to be suspected to be influenced by human activities more than suitable for characterizing the natural background. It also remained unclear if there were relevant natural differences between the upstream and downstream river sections due to different slope steepness of the catchment, differences in soil characteristics and thickness, different accumulation of sediments and weathering products, etc., as discussed by Stallard [45]. For several rivers, only one out of diverse tributaries was sampled, and for rivers Masrik, Shoghvag and Tsakkar, even no sampling site existed which was upstream of intense human activities. Therefore, the characterization of the natural background remained incomplete based on the available monitoring data. The anthropogenic influence on the chemical water quality of the monitored rivers was very likely covered completely by the available monitoring data. Although this is very helpful for the quantification of the overall load of chemicals into Lake Sevan, it could not be used to identify and design detailed management measures for improving the water quality. The human influence was covered only integrally and could not clearly be allocated to particular sources like sewer outflows or single agricultural areas and the agricultural practice there.
4.3. Limitations of the Study
The presented study has several limitations which influenced the success of the study to a different extent. Options to overcome unintended limitations are discussed in Section 4.4.
The study period comprised 15 years. Given the basic monthly sampling frequency, theoretically, the results from 180 samples should have been available for each SS. Table 1 provides an overview how many data sets were available per SS, while Table S4 presents the distribution of the collected data over the months for each SS. The winter months are underrepresented in the data set, and the upstream SSs have generally more data gaps than the downstream SSs. The reason for that is the problematic accessibility of the upstream SSs in winter due to thick snow coverage on the access paths of the SSs. These data gaps limit the representativeness of the data set. Although seasonality and flow rate were not considered intentionally (see below), the consequences of the data gaps can be characterized as limited. The typical flow patterns of the rivers in the catchment of Lakes Sevan consist of a spring flood due to snow melt, usually occurring between March and mid-July, and prevailing base-flow conditions for the rest of the year [16]. The higher the location of an SS, the later the spring flood starts and ends. The north-eastern aspects of the Geghama Mountain Range are areas with the latest onset of snow melt, represented by SS Gavaraget-1.
Some of the rivers do not yet have any upstream SS without influences of human activities. This limits the representativeness of the data intended to represent the natural background.
The study neither analyzed the temporal variability of the chemical water quality nor considered the influence of the flow rates of the rivers on the chemical water quality, although both aspects are often included in studies on river water quality [85,86]. This was an intended limitation. The purpose of the study was to test if the available monitoring data could be used to identify and quantify the natural background and the human impacts. Since long-term data were used, the typical temporal variations of chemical water quality due to seasonality and variable flow conditions, including floods and base-flow conditions, were adequately covered by the data. Both the typical ranges and the typical average conditions can be characterized in that way, basically allowing for reaching the goals of the study. Including aspects of seasonality and influences of the flow rate made the study much more complicated and potentially caused additional uncertainty of the data interpretation, particularly for upstream SSs with limited data availability. Based on the results of this study, more detailed data analyses considering temporal variability and flow rate will be conducted.
Not only the present rock but also the local soil and its geochemical conditions influence the chemical water quality of rivers [36,45]. Currently, detailed data on the geochemical soil composition in the catchment of Lake Sevan are not yet available. However, such investigations are underway and related publications are expected in near future. A first set of results focusing on radio nuclides was already published recently [87].
Using biological monitoring for the characterization of river water quality is a common approach [88,89]. It has a long tradition of more than 100 years and is still mainly based on regular investigations of the composition and abundance of benthic invertebrates, phytobenthos and fish in case of rivers [85]. Monitoring pathogens also belongs to biological monitoring [85]. The particular value of biological monitoring is the integration over time since the organisms are exposed to the river water and all its chemical constituents over the entire time of their live in the river. Considerable changes in the chemical water quality are often indicated by changes in the composition and abundance of the organisms present in the rivers, even when monthly chemical sampling does not indicate such changes as occasional inflow of toxic waste water. However, regular biological monitoring is not yet implemented for all rivers in Armenia. Therefore, data from biological monitoring are not available for the rivers flowing into Lake Sevan, and thus could not be considered in the current study. Once such data have been collected, future studies can use them for further improvement of the characterization of the natural background and the human impacts.
4.4. Potential Approaches for Detailed Characterization of Natural Background and Human Impacts
The basic approach of using SSs upstream of all human activities for the characterization of the natural background and to determine human influences by comparing results from more downstream SSs with the upstream reference conditions is well established [90,91,92,93]. Meybeck [8] also used catchments far upstream for the identification of natural water qualities typical for particular rock types. However, normal monitoring programs are usually not designed for such purposes [1,93]. The results from the tributaries of Lake Sevan confirmed this limitation, as discussed above.
For the detailed characterization of the natural background, a complete spatial coverage would be required, i.e., a considerably higher spatial resolution. In order to identify naturally caused changes along the upstream–downstream river courses, more than one SS upstream of known human influences would be helpful. Occurring gradients would indicate such natural changes (e.g., due to changes in sediment grain size and hydrogeological conditions and increasing accumulation of river sediments, including secondary mineral phases produced by chemical weathering of the primary bedrock). For trace elements, geochemical surveys of river sediments could provide guidance for the optimal placement of the proposed additional upstream SSs since sediments accumulate trace elements and integrate their occurrence and concentrations over time [94,95,96,97]. To some extent, detailed geochemical soil mapping can provide comparable information if available [87,98]. Water samples generally reflect only the conditions at the time of sampling and need to be repeated regularly for a couple of years in order to compensate for seasonal and interannual variability. Using the information from sediment or soil surveys could help avoiding an unnecessary high number of additional upstream SSs and limiting the related effort and costs. Once the natural background is characterized, only selected upstream SSs would be needed for long-term monitoring. Their purpose would be to document long-term regional trends, e.g., caused by climate change.
The detailed identification and characterization of anthropogenic influences could follow a similar strategy. A considerably higher spatial resolution would be required as well. If particular sources are known, like wastewater discharges of industry or municipalities, it might be a better strategy to monitor the wastewater directly and not (only) the receiving rivers and streams. However, comparisons of upstream and downstream SSs for single river sections would also allow for the quantification of the influence of non-point sources like agricultural land use.
Since all additional sampling and monitoring activities discussed above require additional effort and cause additional costs, a prioritization should be made beginning with the most pressing needs of water quality improvements. In recent years, Lake Sevan experienced repeatedly algal blooms [99,100,101,102,103]. Consequently, identifying the most efficient locations for the implementation of wastewater treatment systems would be an obvious goal with high priority. Further obvious goals would be the check of the adequate position of the SSs Argichi-1 and Dzknaget-1 and the implementation of additional upstream SSs in the catchments of the rivers Gavaraget and Masrik. Both have several tributaries, and there are even no SSs in the catchment of rivers Masrik, Shoghvag and Tsakkar, which are not obviously influenced by mining or other human activities.
5. Conclusions
This study assessed whether the existing river monitoring network is sufficient to characterize natural background chemical water quality and detect human impacts in the tributaries of Lake Sevan.
The results show that the current monitoring program is suitable for determining the overall chemical state of the rivers and detecting the main anthropogenic pressures. The monitoring data clearly differentiate catchments influenced by agriculture, settlements and mining from those where water chemistry is mainly controlled by natural geological conditions. However, the current monitoring network is less suitable for defining natural background concentrations and quantifying the contribution of individual pollution sources. The main reason is that many monitoring stations are located in the lower reaches of the river, where natural and anthropogenic impacts overlap, while several catchments lack undisturbed upstream reference points.
An important conclusion is that not all high concentrations should be automatically interpreted as pollution. The exceptionally high concentrations observed in the Shoghvag, Tsakkar and partly Gavaraget catchments are more consistently explained by specific geological and tectonic conditions than by human activities. This highlights the need to interpret monitoring data in the geological context of each catchment and highlights the limitations of applying general concentration thresholds without taking into account local background conditions. The identified limitations can be addressed by improving the spatial design of the monitoring network.
Additional upstream reference stations, monitoring of important tributaries and targeted surveys downstream of the upstream would significantly improve the characterization of natural background conditions and allow for a better assessment of human impact. Geochemical information from river sediments and, where available, soils can help select representative monitoring sites and reduce the need for a large number of additional sampling sites. These improvements can be incorporated into the existing monitoring program without changing its overall design and therefore represent realistic future monitoring measures.
The proposed approach is not limited to the Lake Sevan basin. The combination of periodic monitoring data and targeted spatial analyses is a practical way to separate natural hydrogeochemical variability from anthropogenic influences and to prioritize improvements to monitoring networks. This approach may also be applicable to other mountain river basins where complex geology and multiple human pressures complicate the interpretation of periodic monitoring data.
To improve the monitoring network, the implementation of additional upstream reference stations and an increased spatial resolution are recommended, as these measures would allow a clearer differentiation between natural and anthropogenic influences. Geochemical information from river sediments can support the optimal placement of monitoring sites and help reduce the need for a large number of additional sampling locations. In cases where pollution sources are known, direct monitoring of effluents should be considered alongside river monitoring. These improvements should be implemented in a stepwise manner, prioritizing catchments with the most pressing water quality issues.
Supplementary Materials
The following supporting information can be downloaded at: https://zenodo.org/records/21819306 (accessed on 06 August 2026). Figure S1: Box Plots of all collected data comparing the concentrations of each analyzed water constituent for all SSs; Figure S2: Cluster analyses of water constituents for each SS; Figure S3: Correlation matrices for the concentrations of the water constituents for each SS; Figure S4: Statistical significance test of Spearmen correlations; Figure S5: Photos of Martuni River and Gavaraget River; Table S1: Descriptive statistics for major ions and comparison with literature data; Table S2: Descriptive statistics for trace elements and comparison with literature data; Table S3: Descriptive statistics for oxygen, oxygen demand and nutrients; Table S4: Number of samplings per station and months.
Author Contributions
Conceptualization, V.M., H.M. and M.S.; methodology, M.S., V.M., W.v.T. and G.S.; software, V.M. and H.M.; formal analysis, all authors; investigation, all authors; data curation, A.Z.; writing—original draft preparation, M.S., V.M., G.S., W.v.T. and A.A.; writing-all team; visualization, A.A., V.M., H.M. and M.S.; project administration, H.M.; funding acquisition, H.M. All authors have read and agreed to the published version of the manuscript.
Funding
This research was funded by the H. Hovnanian Family Foundation under Grant No. 2025.Q3-05.
Data Availability Statement
Restrictions apply to the availability of the data, which were used under permission from the data provider and are therefore not publicly available. Requests for access should be directed to Hydrometeorology and Monitoring Center, Ministry of Environment of the Republic of Armenia.
Acknowledgments
Conflicts of Interest
The authors declare no conflicts of interest.
Abbreviations
The following abbreviations are used in this manuscript:
| Armhydromet | Hydrometeorology and Monitoring Center |
| BOD5 | Biological oxygen 5 days demand |
| COD | Chemical oxygen demand |
| DO | Dissolved oxygen |
| DOC | Dissolved organic carbon |
| GOST | Armenian State standard |
| ICP-MS | Inductively coupled plasma mass spectrometry |
| ISO | International Organization for Standardization |
| RD | Reference Document |
| SNCO | State non-commercial organization |
| SS | Sampling site |
| TP | Total phosphorus |
Appendix A. Geological Map
Figure A1.
Geological map of the natural catchment area of Lake Sevan.
Appendix B. Map of Mineralization
Figure A2.
Map of mineralization in the natural catchment area of Lake Sevan [17,18,104].
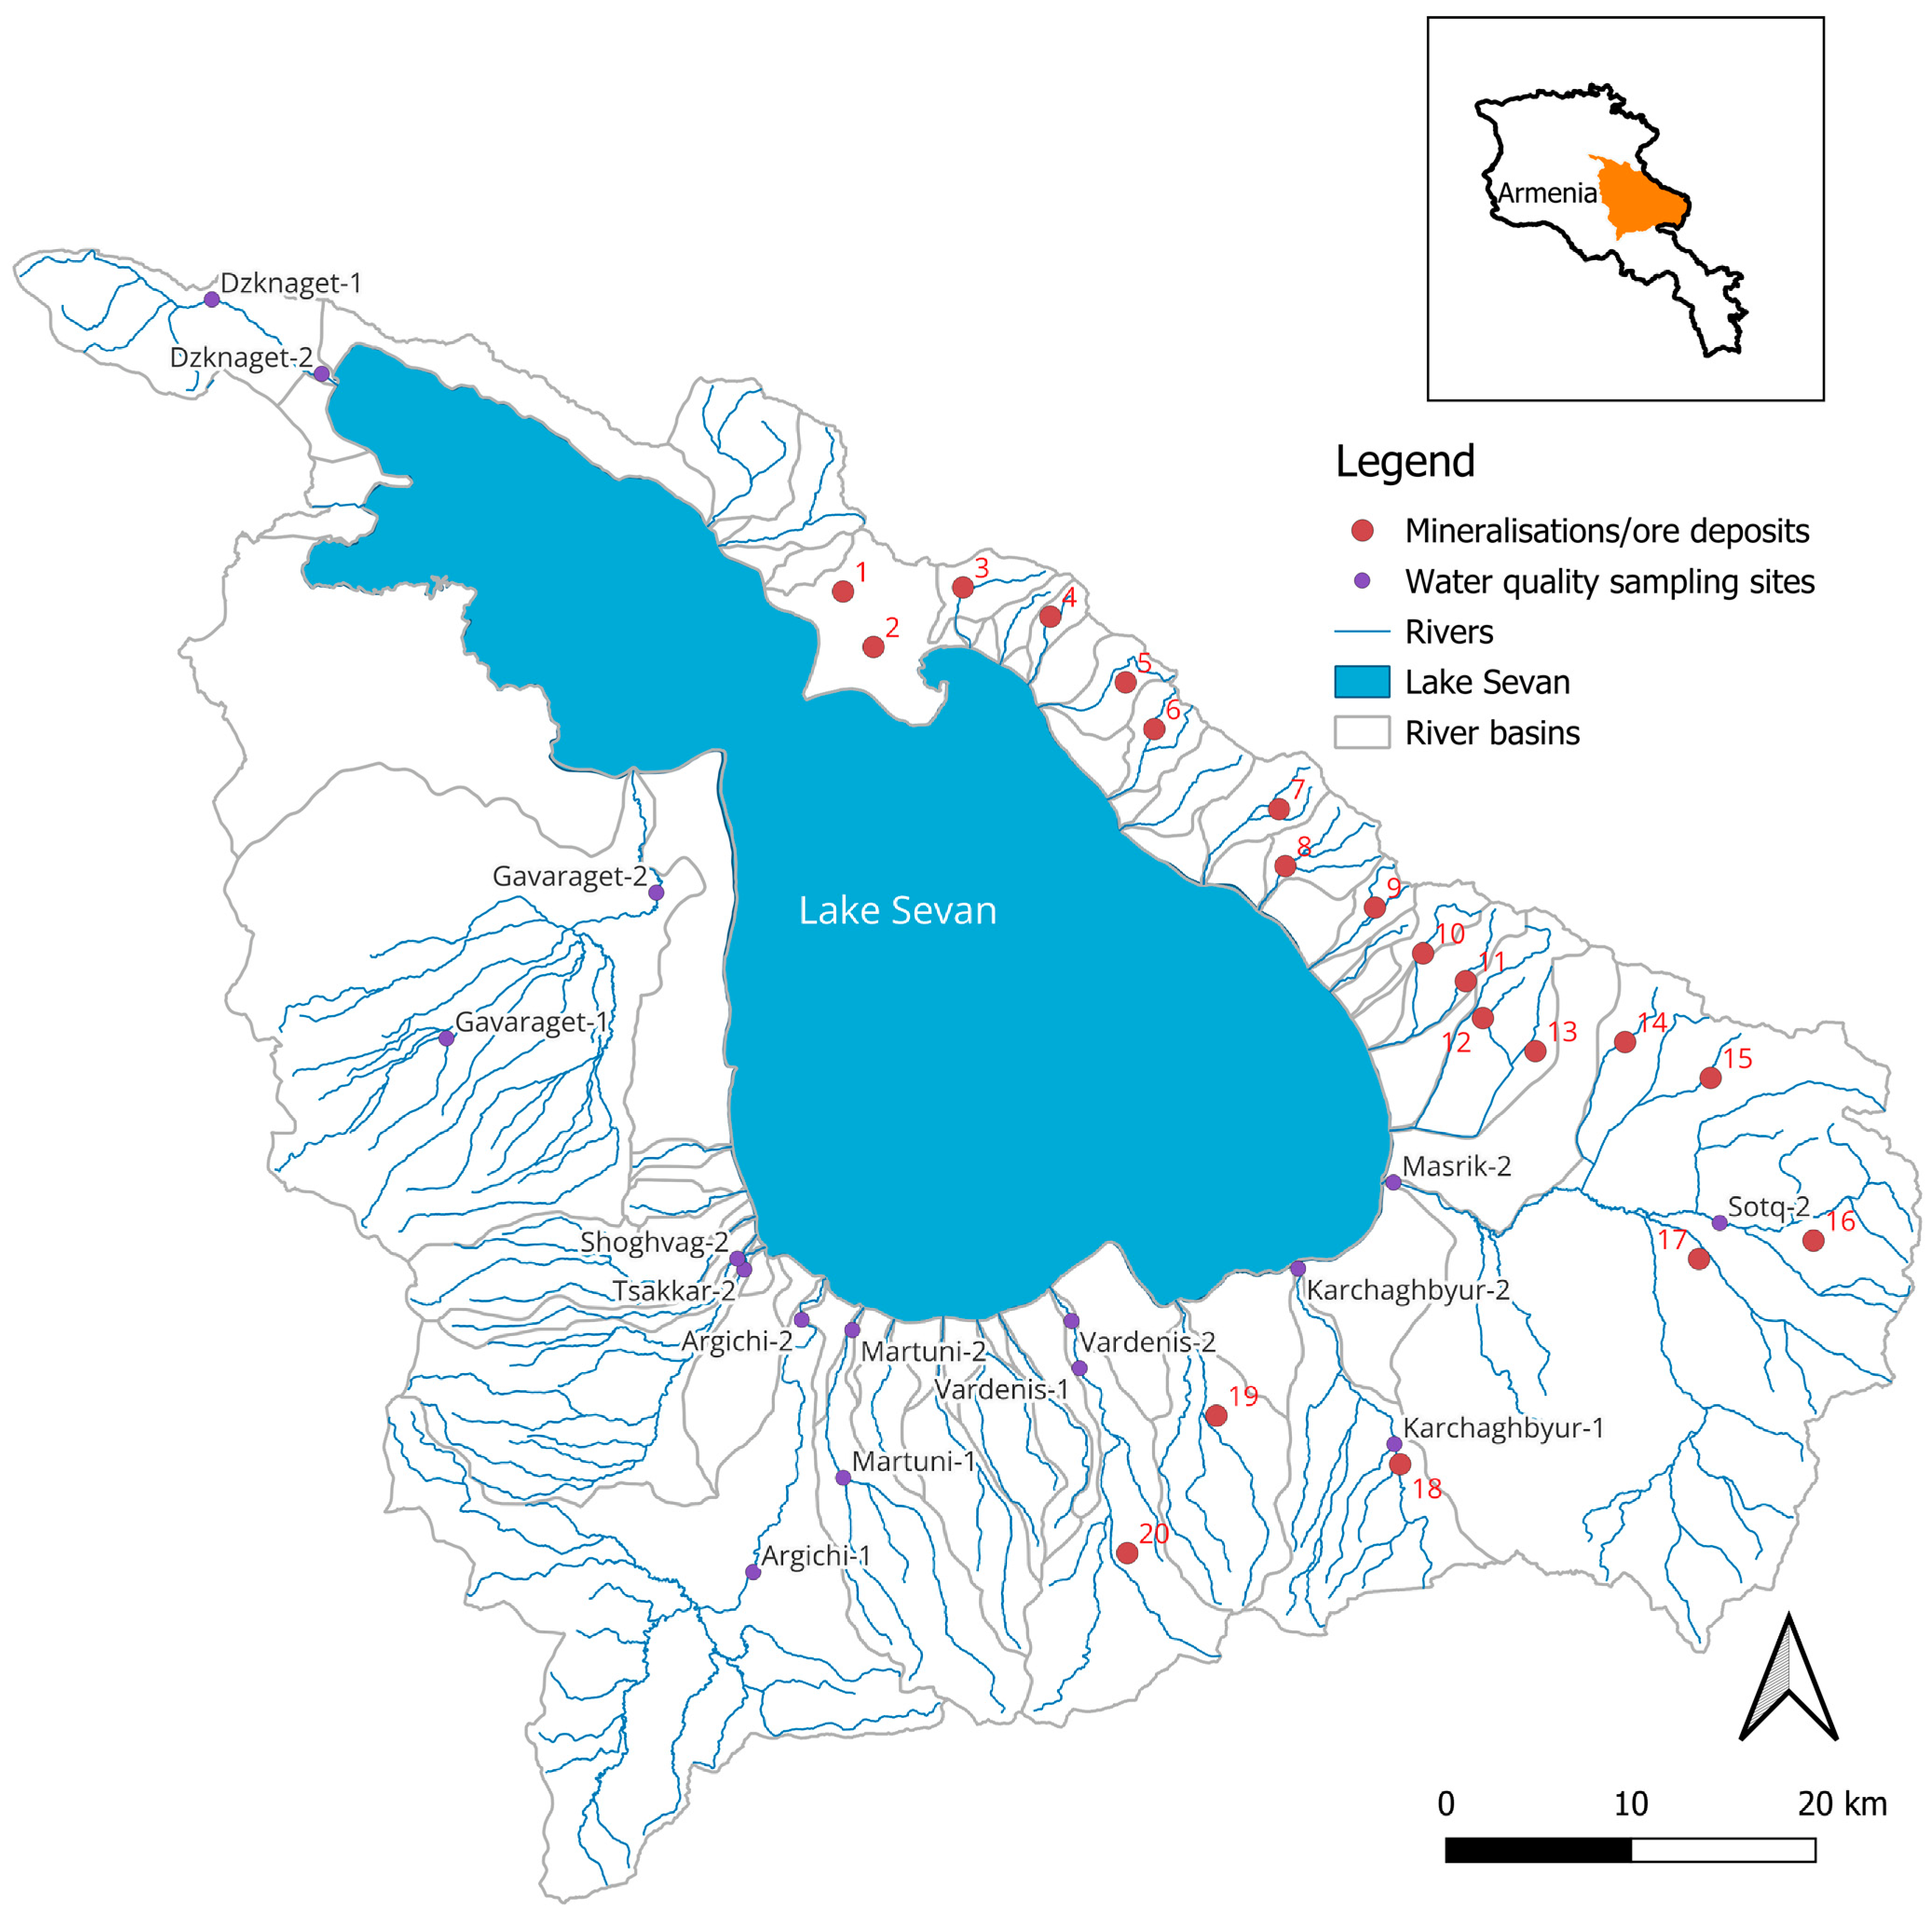
Table A1.
List of mineralization in the natural catchment of Lake Sevan [17,18,104].
Appendix C. Map of Land Use
Figure A3.
Map of the land use in the natural catchment area of Lake Sevan (Data source: GlobeLand30 free global land cover dataset (30 m resolution), CORINE Land Cover nomenclature https://www.un-spider.org/links-and-resources/data-sources/land-cover-map-globeland-30-ngcc) (accessed on 2 June 2026).
Data on agricultural land use in Gegharkunik Marz for 2024 [105]:
- Livestock: cattle 72,000 (including 31,900 cows), pigs 10,100, sheep and goats 102,500, horses 1600
- Crops: grain & leguminous 19,200 ha (2.14 t/ha); potatoes 5691 ha (20.67 t/ha); vegetables 940 ha (18.7 t/ha); fruits and berries 1385 ha (5.85 t/ha)
References
- Arle, J.; Mohaupt, V.; Kirst, I. Monitoring of Surface Waters in Germany under the Water Framework Directive—A Review of Approaches, Methods and Results. Water 2016, 8, 217. [Google Scholar] [CrossRef] [Scilit]
- Kaushal, S.S.; Mon, A.E.; Grant, S.B.; Mayer, P.M.; Porter, A.J.; Sekellick, A.J.; Chase, J.H.; Bhide, S.V.; Jastram, J.D.; Newcomer-Johnson, T.A.; et al. Watershed Continuum Monitoring Approach: Combining multiple water quality patterns along stream and river flowpaths to track sources, pathways, and processing of pollutants. Ecol. Eng. 2026, 229, 107971. [Google Scholar] [CrossRef] [Scilit]
- Mănoiu, V.-M.; Crăciun, A.-I. Danube river water quality trends: A qualitative review based on the open access web of science database. Ecohydrol. Hydrobiol. 2021, 21, 613–628. [Google Scholar] [CrossRef] [Scilit]
- Wolfram, J.; Stehle, S.; Bub, S.; Petschick, L.L.; Schulz, R. Water quality and ecological risks in European surface waters—Monitoring improves while water quality decreases. Environ. Int. 2021, 152, 106479. [Google Scholar] [CrossRef] [Scilit] [PubMed]
- Costa, D.; Liu, J.; Palma, P. Multidecadal water quality trends across 15 European river basins along a Mediterranean climate gradient. Sci. Total Environ. 2025, 998, 180230. [Google Scholar] [CrossRef] [Scilit] [PubMed]
- Lovett, G.M.; Burns, D.A.; Driscoll, C.T.; Jenkins, J.C.; Mitchel, M.J.; Rustad, L.; Shanley, J.B.; Likens, G.E.; Haeuber, R. Who needs environmental monitoring? Front. Ecol. Environ. 2007, 5, 253–260. [Google Scholar] [CrossRef] [Scilit]
- Reimann, C.; Garrett, R.G. Geochemical background-concept and reality. Sci. Total Environ. 2005, 350, 12–27. [Google Scholar] [CrossRef] [Scilit] [PubMed]
- Meybeck, M. Composition chimique des ruisseaux non pollués en France. Sci. Géologiques Bull. Mém. 1986, 39, 3–77. [Google Scholar] [CrossRef] [Scilit]
- Meybeck, M. Global chemical weathering of surficial rocks estimated from river dissolved loads. Am. J. Sci. 1987, 287, 401–428. [Google Scholar] [CrossRef] [Scilit]
- Gunn, J.; Keller, W.; Negusanti, J.; Potvin, R.; Beckett, P.; Winterhalder, K. Ecosystem recovery after emission reductions: Sudbury, Canada. Water Air Soil Pollut. 1995, 85, 1783–1788. [Google Scholar] [CrossRef] [Scilit]
- Irwin, J.G.; Williams, M.L. Acid rain: Chemistry and transport. Environ. Pollut. 1988, 50, 29–59. [Google Scholar] [CrossRef] [Scilit] [PubMed]
- Reimann, C.; Banks, D.; de Caritat, P. Impacts of airborne contamination on regional soil and water quality: The Kola Peninsula, Russia. Environ. Sci. Technol. 2000, 34, 2727–2732. [Google Scholar] [CrossRef] [Scilit]
- Gaillardet, J.; Viers, J.; Dupré, B. Trace Elements in River Waters. In Surface and Ground Water, Weathering, and Soil; Vol. 5 Treatise on Geochemistry, 1st ed.; Ji, D., Ed.; Elsevier: Amsterdam, The Netherlands, 2005; pp. 225–272. [Google Scholar] [CrossRef] [Scilit]
- Wilkinson, I.P. Lake Sevan: Evolution, Biotic Variability and Ecological Degradation. In Large Asian Lakes in a Changing World: Natural State and Human Impact; Mischke, S., Ed.; Springer: Cham, Switzerland, 2020; pp. 35–63. [Google Scholar] [CrossRef] [Scilit]
- EUWI+. Development of a National Methodology for an Assessment of the Available Groundwater Resources in Mountainous Regions and the Implementation of this Methodology in the Hrazdan and Sevan River Basin Districts. Final Report. 2021. Available online: https://www.euwipluseast.eu/en/component/k2/item/1693-armenia-study-on-groundwater-resources-eng?fromsearch=1 (accessed on 20 May 2026).
- EUWI+. Delineation and Characterisation of Groundwater Bodies and the Design of a Groundwater Monitoring Network in the Hrazdan and Lake Sevan River Basin Districts in Armenia. EUWI-EAST-AM-06; Final Report. 2018. Available online: https://www.euwipluseast.eu/en/component/k2/item/1370-armenia-hrazdan-sevan-groundwater-delineation-report-2018-eng?fromsearch=1 (accessed on 20 May 2026).
- Arsenyan, G.M.; Aslanyan, A.T.; Gulyan, E.K.; Magakyan, I.G.; Mkratshyan, K.A.; Katshatryan, N.S. (Eds.) Geology of the USSR; Armenian SSR, Vol. XLIII: Useful Minerals; Nedra: Moscow, Russia, 1975. (In Russian) [Google Scholar]
- Kaplanyan, P.M.; Galstyan, H.R.; Grigoryan, L.A.; Karapetyan, A.I.; Shahinyan, H.V.; Eksouzyan, T.H. Geochemistry of Natural Water of Lake Sevan Basin; “GITUTYUN” Publishing House of the NAS RA: Yerevan, Armenia, 1997. (In Russian) [Google Scholar]
- Sayadyan, H.Y.; Ghulijanyan, A.H.; Sargsyan, V.P. Establishing agroforestry for the adaptation to climate change in the Lake Sevan basin. Proc. Yerevan State Univ.—Geogr. 2025, 59, 522–530. [Google Scholar] [CrossRef] [Scilit]
- EUWI+. Draft River Basin Management Plan for Sevan River Basin District in Armenia. Version 3, 2020. Available online: https://euwipluseast.eu/en/component/k2/item/1269-armenia-sevan-river-basin-management-plan-2020-arm?fromsearch=1 (accessed on 20 May 2026).
- ISO 5667-6:2014; Water Quality–Sampling Part 6: Guidance on sampling of rivers and streams. International Organization for Standardization (ISO): Geneva, Switzerland, 2014.
- ISO 5667-3:2024; Water Quality–Sampling Part 3: Preservation and handling of water samples. International Organization for Standardization (ISO): Geneva, Switzerland, 2024.
- ISO 5814:2012; Water Quality–Determination of Dissolved Oxygen—Electrochemical Probe Method. International Organization for Standardization (ISO): Geneva, Switzerland, 2012.
- ISO 5815-1:2019; Water Quality—Determination of Biochemical Oxygen Demand After n Days (BODn)—Part 1: Dilution and Seeding Method with Allylthiourea Addition. International Organization for Standardization (ISO): Geneva, Switzerland, 2019.
- ISO 15705:2002; Water Quality—Determination of the Chemical Oxygen Demand Index (ST-COD)-Small-Scale Sealed-Tube Method. International Organization for Standardization (ISO): Geneva, Switzerland, 2002.
- GOST 33045:2014; Water Quality—Determination of Ammonium Nitrogen, Method A. Interstate Council for Standardization, Metrology and Certification (CIS): Minsk, Belarus, 2014.
- GOST 33045:2014; Water Quality—Determination of Nitrite, Method B. Interstate Council for Standardization, Metrology and Certification (CIS): Minsk, Belarus, 2014.
- ISO 6878:2004; Water Quality—Determination of Phosphorus—Ammonium Molybdate Spectrometric Method. International Organization for Standardization (ISO): Geneva, Switzerland, 2004.
- Federal Service for Hydrometeorology and Environmental Monitoring (Roshydromet). Mass Concentration of Silicon in Waters. Measurement Procedure by the Photometric Method Using the Yellow Form of Molybdosilicic Acid; Guidance Document; Federal Service for Hydrometeorology and Environmental Monitoring (Roshydromet): Rostov-on-Don, Russia, 2018; (In Russian). Available online: https://meganorm.ru/Data2/1/4293732/4293732924.pdf (accessed on 23 May 2026).
- ISO 9963-1:1994; Water Quality—Determination of Alkalinity—Part 1: Determination of Total and Composite Alkalinity. International Organization for Standardization (ISO): Geneva, Switzerland, 1994.
- ISO 10304-1:2007; Water Quality—Determination of Dissolved Anions by Liquid Chromatography of Ions—Part 1: Determination of Bromide, Chloride, Fluoride, Nitrate, Nitrite, Phosphate and Sulfate. International Organization for Standardization (ISO): Geneva, Switzerland, 2007.
- ISO 17294-2:2023; Water Quality—Application of Inductively Coupled Plasma Mass Spectrometry (ICP-MS)—Part 2: Determination of Selected Elements Including Uranium Isotopes. International Organization for Standardization (ISO): Geneva, Switzerland, 2023.
- de Boor, C. A Practical Guide to Splines, Revised ed.; Applied Mathematical Sciences; Springer: New York, NY, USA, 2001; Volume 27. [Google Scholar]
- Müller, G. Schwermetalle in den Sedimenten des Rheins—Veränderungen seit 1971. Umschau 1979, 79, 778–783. [Google Scholar]
- Piper, A.M. A graphic procedure in the geochemical interpretation of water analyses. Eos Trans. Am. Geophys. Union 1944, 25, 914–928. [Google Scholar] [CrossRef] [Scilit]
- Gaillardet, J.; Dupré, B.; Louvat, P.; Allègre, C.J. Global silicate weathering and CO2 consumption rates deduced from the chemistry of large rivers. Chem. Geol. 1999, 159, 3–30. [Google Scholar] [CrossRef] [Scilit]
- Hovhannisyan, A.; Shahnazaryan, G. Determination of Background Concentrations of Hydrochemical Parameters and Water Quality Assessment in the Akhuryan River Basin (Armenia). Phys. Chem. Earth Parts A/B/C 2016, 94, 2–9. [Google Scholar] [CrossRef] [Scilit]
- Volcke, E.I.P.; Solon, K.; Comeau, Y.; Henze, M. Wastewater characteristics. In Biological Wastewater Treatment: Principles, Modelling and Design, 2nd ed.; Chen, G., van Loosdrecht, M.C.M., Ekama, G.A., Brdjanovic, D., Eds.; IWA Publishing: London, UK, 2020; pp. 77–110. [Google Scholar] [CrossRef] [Scilit] [PubMed]
- Gilbert, E. Biodegradability of ozonation products as a function of COD and DOC elimination by the example of humic acids. Water Res. 1988, 22, 123–126. [Google Scholar] [CrossRef] [Scilit]
- Badr, E.-S.A. Spatio-temporal variability of dissolved organic nitrogen (DON), carbon (DOC), and nutrients in the Nile River, Egypt. Environ. Monit. Assess. 2016, 188, 580. [Google Scholar] [CrossRef] [Scilit] [PubMed]
- Kaufman, L.; Rousseeuw, P.J. Finding Groups in Data: An Introduction to Cluster Analysis; Wiley Series in Probability and Statistics; John Wiley & Sons: New York, NY, USA, 1990. [Google Scholar] [CrossRef] [Scilit]
- Zar, J.H. Spearman Rank Correlation. In Encyclopedia of Biostatistics; Armitage, P., Colton, T., Eds.; John Wiley & Sons, Ltd.: Chichester, UK, 2005. [Google Scholar] [CrossRef] [Scilit]
- Benjamini, Y.; Hochberg, Y. Controlling the False Discovery Rate: A Practical and Powerful Approach to Multiple Testing. J. R. Stat. Soc. Ser. B (Methodol.) 1995, 57, 289–300. [Google Scholar] [CrossRef] [Scilit]
- Bluth, G.J.S.; Kump, L.R. Lithologic and climatologic controls of river chemistry. Geochim. Cosmochim. Acta 1994, 58, 2341–2359. [Google Scholar] [CrossRef] [Scilit]
- Akhtar, N.; Syakir Ishak, M.I.; Bhawani, S.A.; Umar, K. Various Natural and Anthropogenic Factors Responsible for Water Quality Degradation: A Review. Water 2021, 13, 2660. [Google Scholar] [CrossRef] [Scilit]
- Stallard, R.F. Relating chemical and physical erosion. Rev. Mineral. Geochem. 1995, 31, 543–564. [Google Scholar] [CrossRef] [Scilit]
- Kunze, R.; Meliksetian, K.; Lockhoff, N.; Bobokhyan, A.; Wolf, D.; Davtyan, R.; Simonyan, H. Prehistoric gold from Lake Sevan Basin? New research on Armenian gold deposits and objects. J. Archaeol. Sci. Rep. 2023, 52, 104267. [Google Scholar] [CrossRef] [Scilit]
- Kozerenko, S.V. Hydrothermal System of the Zod Gold Sulfide Deposit, Armenia: Ore Sources and Formation Conditions. Geochem. Int. 2004, 42, 180–190. [Google Scholar] [CrossRef] [Scilit][Green Version]
- Borisenko, A.S.; Naumov, E.A.; Obolensky, A.A. Types of gold-mercury deposits and their formation conditions. Russ. Geol. Geophys. 2006, 47, 342–354. [Google Scholar]
- Nordstrom, D.K. Mine waters: Acidic to circumneutral. Elements 2011, 7, 393–398. [Google Scholar] [CrossRef] [Scilit]
- Nordstrom, D.K. Hydrogeochemical processes governing the origin, transport and fate of major and trace elements from mine wastes and mineralized rock to surface waters. Appl. Geochem. 2011, 26, 1777–1791. [Google Scholar] [CrossRef] [Scilit]
- Avagyan, A.; Sahakyan, L.; Meliksetian, K.; Karakhanyan, A.; Lavrushin, V.; Atalyan, T.; Hovakimyan, H.; Avagyan, S.; Tozalakyan, P.; Shalaeva, E.; et al. New evidences of Holocene tectonic and volcanic activity of the western part of Lake Sevan (Armenia). Geol. Q. 2020, 64, 288–303. [Google Scholar] [CrossRef] [Scilit]
- Shi, K.; Woolway, R.I.; Guan, Q.; Zhang, W.; Mi, C.; Zhang, Y.; Zhi, W.; Wang, J.; Xu, H.; Zhou, Y.; et al. Deoxygenation in inland freshwater systems. Nat. Rev. Earth Environ. 2026, 7, 427–446. [Google Scholar] [CrossRef] [Scilit]
- Mulholland, P.J.; Watts, J.A. Transport of organic carbon to the oceans by rivers of North America: A synthesis of existing data. Tellus 1982, 34, 176–186. [Google Scholar] [CrossRef] [Scilit]
- Aitkenhead, J.A.; McDowell, W.H. Soil C:N ratio as a predictor of annual riverine DOC flux at local and global scales. Glob. Biogeochem. Cycles 2000, 14, 127–138. [Google Scholar] [CrossRef] [Scilit]
- Lee, B.S.; Lajtha, K.; Jones, J.A.; White, A.E. Fluorescent DOC Characteristics Are Related to Streamflow and Pasture Cover in Streams of a Mixed Landscape. Biogeochemistry 2018, 140, 317–340. [Google Scholar] [CrossRef] [Scilit]
- Chai, S.; Zhang, X.; Xie, F.; Zhou, X.; Lü, C. Catchment-driven trend of dissolved organic matter characteristics in the Hailar River, China. Appl. Geochem. 2024, 175, 106162. [Google Scholar] [CrossRef] [Scilit]
- Graeber, D.; Gelbrecht, J.; Pusch, M.T.; Anlanger, C.; von Schiller, D. Agriculture has changed the amount and composition of dissolved organic matter in Central European headwater streams. Sci. Total Environ. 2012, 438, 435–446. [Google Scholar] [CrossRef] [Scilit] [PubMed]
- Carey, R.O.; Migliaccio, K.W. Contribution of Wastewater Treatment Plant Effluents to Nutrient Dynamics in Aquatic Systems: A Review. Environ. Manag. 2009, 44, 205–217. [Google Scholar] [CrossRef] [Scilit] [PubMed]
- Nie, J.; Feng, H.; Witherell, B.B.; Alebus, M.; Mahajan, M.D.; Zhang, W.; Yu, L. Causes, Assessment, and Treatment of Nutrient (N and P) Pollution in Rivers, Estuaries, and Coastal Waters. Curr. Pollut. Rep. 2018, 4, 154–161. [Google Scholar] [CrossRef] [Scilit]
- Madjar, R.M.; Vasile Scăeteanu, G.; Sandu, M.A. Nutrient Water Pollution from Unsustainable Patterns of Agricultural Systems, Effects and Measures of Integrated Farming. Water 2024, 16, 3146. [Google Scholar] [CrossRef] [Scilit]
- Hendry, M.J.; Wassenaar, L.I.; Barbour, S.L.; Schabert, M.S.; Birkhame, T.K.; Fedec, T.; Schmeling, E.E. Assessing the fate of explosives derived nitrate in mine waste rock dumps using the stable isotopes of oxygen and nitrogen. Sci. Total Environ. 2018, 640–641, 127–137. [Google Scholar] [CrossRef] [Scilit] [PubMed]
- McCullough, C.D. The Importance of Nitrate Dynamics in Mine Pit Lakes of Drier Regions. Mine Water Environ. 2024, 43, 231–254. [Google Scholar] [CrossRef] [Scilit]
- Barral-Fraga, L.; Barral, M.T.; MacNeill, K.L.; Diego Martiñá-Prieto, D.; Morin, S.; Rodríguez-Castro, M.C.; Tuulaikhuu, B.-A.; Guasch, H. Biotic and Abiotic Factors Influencing Arsenic Biogeochemistry and Toxicity in Fluvial Ecosystems: A Review. Int. J. Environ. Res. Public Health 2020, 17, 2331. [Google Scholar] [CrossRef] [Scilit] [PubMed]
- Gustafsson, J.P. Vanadium geochemistry in the biogeosphere—Speciation, solid-solution interactions, and ecotoxicity. Appl. Geochem. 2019, 102, 1–25. [Google Scholar] [CrossRef] [Scilit]
- Smedley, P.L.; Kinniburgh, D.G. A review of the source, behaviour and distribution of arsenic in natural waters. Appl. Geochem. 2002, 17, 517–568. [Google Scholar] [CrossRef] [Scilit]
- Wyness, A.J.; Parkman, R.H.; Neal, C. A summary of boron surface water quality data throughout the European Union. Sci. Total Environ. 2003, 314–316, 255–269. [Google Scholar] [CrossRef] [Scilit] [PubMed]
- Palmucci, W.; Rusi, S. Boron-rich groundwater in Central Eastern Italy: A hydrogeochemical and statistical approach to define origin and distribution. Environ. Earth Sci. 2014, 72, 5139–5157. [Google Scholar] [CrossRef] [Scilit]
- Schlesinger, W.H.; Vengosh, A. Global boron cycle in the Anthropocene. Glob. Biogeochem. Cycles 2016, 30, 219–230. [Google Scholar] [CrossRef] [Scilit]
- Kot, F.E. Boron sources, speciation and its potential impact on health. Rev. Environ. Sci. Biotechnol. 2009, 8, 3–28. [Google Scholar] [CrossRef] [Scilit]
- Kot, F.S. Boron in the environment. In Boron Separation Processes; Kabay, N., Bryjak, M., Hilal, N., Eds.; Elsevier: Amsterdam, The Netherlands, 2015; pp. 1–33. [Google Scholar]
- Amuda, O.S.; Alade, A.O.; Hung, Y.-T.; Wang, L.K.; Wang, M.-H.S. Toxicity, Sources, and Control of Copper (Cu), Zinc (Zn), Molybdenum (Mo), Silver (Ag), and Rare Earth Elements in the Environment. In Handbook of Advanced Industrial and Hazardous Wastes Management; Wang, L.K., Wang, M.-H.S., Hung, Y.-T., Shammas, N.K., Chen, J.P., Eds.; CRC Press: Boca Raton, FL, USA, 2017; pp. 1–25. [Google Scholar] [CrossRef] [Scilit]
- Sean Comber, S.; Deviller, G.; Wilson, I.; Peters, A.; Merrington, G.; Borrelli, P.; Baken, S. Sources of copper into the European aquatic environment. Integr. Environ. Assess. Manag. 2022, 19, 1031–1047. [Google Scholar] [CrossRef] [Scilit] [PubMed]
- Ding, Z.; Han, G.; Qu, R.; Liu, J.; Wang, P. Review on Zinc Isotopes in River Systems: Distribution and Application. Water 2024, 16, 87. [Google Scholar] [CrossRef] [Scilit]
- Kobayashi, S.; Shoji, S. Distribution of copper and zinc in volcanic ashes. Soil Sci. Plant Nutr. 1976, 22, 401–408. [Google Scholar] [CrossRef] [Scilit][Green Version]
- Zhang, H.; Yu, J.; Zhou, S. Spatial Distribution of As, Cr, Pb, Cd, Cu, and Zn in the Water and Sediment of a River Impacted by Gold Mining. Mine Water Environ. 2014, 33, 206–216. [Google Scholar] [CrossRef] [Scilit]
- Meland, S.; Borgstrøm, R.; Heier, L.S.; Rosseland, B.O.; Lindholm, O.; Salbu, B. Chemical and ecological effects of contaminated tunnel wash water runoff to a small Norwegian stream. Sci. Total Environ. 2010, 408, 4107–4117. [Google Scholar] [CrossRef] [Scilit] [PubMed]
- Hwang, H.-M.; Fiala, M.J.; Park, D.; Wade, T.L. Review of pollutants in urban road dust and stormwater runoff: Part 1. Heavy metals released from vehicles. Int. J. Urban Sci. 2016, 20, 334–360. [Google Scholar] [CrossRef] [Scilit]
- Rocha Vogel, A.; Kolberg, Y.; Schmidt, M.; Kahlert, H.; von Tümpling, W. Potential deterioration of chemical water quality due to trace metal adsorption onto tire and road wear particles—Environmentally representative experiments. Environ. Pollut. 2024, 359, 124571. [Google Scholar] [CrossRef] [Scilit] [PubMed]
- Lin, Y.; Helmreich, B.; Ho, Y.-W.; Fang, J.K.-H.; Luo, C.; Wang, Y. Multi-contaminants in road runoff of a compact city: Characteristics, interactions, and ecological risks. Water Res. 2026, 292, 125260. [Google Scholar] [CrossRef] [Scilit] [PubMed]
- Peng, C.; Liu, Y.; Chen, H.; Yuan, O.; Chen, O.; Mei, S.; Wu, Z. Analysis of Hydrogeochemical Characteristics of Tunnel Groundwater Based on Multivariate Statistical Technology. Geofluids 2021, 2021, 4867942. [Google Scholar] [CrossRef] [Scilit]
- de Miguel-García, E.; Gómez-González, J.F.; Cruz, J.L. Determining groundwater quality based on volcanic terrain: A case study from the Island of Tenerife, Spain. J. Afr. Earth Sci. 2023, 207, 105059. [Google Scholar] [CrossRef] [Scilit]
- Bucher, K.; Stober, I.; Seelig, U. Water deep inside the mountains: Unique water samples from the Gotthard rail base tunnel, Switzerland. Chem. Geol. 2012, 334, 240–253. [Google Scholar] [CrossRef] [Scilit]
- Stober, I.; Giovanoli, F.; Wiebe, V.; Bucher, K. Deep hydrochemical section through the Central Alps: Evolution of deep water in the continental upper crust and solute acquisition during water–rock-interaction along the Sedrun section of the Gotthard Base Tunnel. Swiss J. Geosci. 2022, 115, 9. [Google Scholar] [CrossRef] [Scilit]
- Speir, S.L.; Rose, L.A.; Blaszczak, J.R.; Kincaid, D.W.; Fazekas, H.M.; Webster, A.J.; Wolford, M.A.; Shogren, A.J.; Wymore, A.S. Catchment concentration–discharge relationships across temporal scales: A review. WIREs Water 2024, 11, e1702. [Google Scholar] [CrossRef] [Scilit]
- Schreiber, S.G.; Schreiber, S.; Tanna, R.N.; Roberts, D.R.; Arciszewski, T.J. Statistical tools for water quality assessment and monitoring in river ecosystems—A scoping review and recommendations for data analysis. Water Qual. Res. J. 2022, 57, 40. [Google Scholar] [CrossRef] [Scilit]
- Movsisyan, N.; Nikolov, J.; Hovhannisyan, S.; Sargsyan, K.; Kostanyan, M.; Pyuskyulyan, K.; Belyaeva, O. Integration of geostatistical and hot spot analysis to identify drivers of radionuclide spatial heterogeneity in the high-mountain lake basin topsoil. Environ. Pollut. 2026, 405, 128492. [Google Scholar] [CrossRef] [Scilit] [PubMed]
- Birk, S.; Bonne, W.; Borja, A.; Brucet, S.; Courrat, A.; Poikane, S.; Solimini, A.; van de Bund, W.; Zampoukas, N.; Hering, D. Three hundred ways to assess Europe’s surface waters: An almost complete overview of biological methods to implement the Water Framework Directive. Ecol. Indic. 2012, 18, 31–41. [Google Scholar] [CrossRef] [Scilit]
- Smith, A.J.; Duffy, B.T.; Onion, A.; Heitzman, D.L.; Lojpersberger, J.L.; Mosher, E.A.; Novak, M.A. Long-term trends in biological indicators and water quality in rivers and streams of New York State (1972–2012). River Res. Appl. 2018, 34, 442–450. [Google Scholar] [CrossRef] [Scilit]
- Runnells, D.D.; Shepherd, T.A.; Angino, E.E. Metals in water. Determining natural background concentrations in mineralized areas. Environ. Sci. Technol. 1992, 26, 2316–2323. [Google Scholar] [CrossRef] [Scilit]
- Schneider, P.; Nilius, U.; Gottschalk, N.; Süß, A.; Schaffrath, M.; Ralf Löser, R.; Lange, T. Determination of the Geogenic Metal Background in Surface Water: Benchmarking Methodology for the Rivers of Saxony-Anhalt, Germany. Water 2017, 9, 75. [Google Scholar] [CrossRef] [Scilit]
- Erina, O.; Tereshina, M.; Shinkareva, G.; Sokolov, D.; Lychagin, M. Natural background and transformation of water quality in the Moskva River. IOP Conf. Ser. Earth Environ. Sci. 2021, 834, 012055. [Google Scholar] [CrossRef] [Scilit]
- Wynants, M.; Hallberg, L.; Prischl, L.-A.; Livsey, J.; Bieroza, M. Trends and purposes of European river monitoring and restoration. Environ. Sci. Policy 2025, 170, 104130. [Google Scholar] [CrossRef] [Scilit]
- Tessier, A.; Campbell, P.G.C.; Bisson, M. Particulate trace metal speciation in stream sediments and relationships -with grain size: Implications for geochemical exploration. J. Geochem. Explor. 1982, 16, 77–104. [Google Scholar] [CrossRef] [Scilit]
- Doherty, M.E.; Arndt, K.; Chang, Z.; Kelly, K.; Lavin, O. Stream sediment geochemistry in mineral exploration: A review of fine-fraction, clay-fraction, bulk leach gold, heavy mineral concentrate and indicator mineral chemistry. Geochem. Explor. Environ. Anal. 2023, 23, geochem 2022-039. [Google Scholar] [CrossRef] [Scilit]
- Vicq, R.; Leite, M.G.P.; Leão, L.P.; Nallini Júnior, H.A.; Valente, T. Geochemical Mapping and Reference Values of Potentially Toxic Elements in a Contaminated Mining Region: Upper Velhas River Basin Stream Sediments, Iron Quadrangle, Brazil. Minerals 2023, 13, 1545. [Google Scholar] [CrossRef] [Scilit]
- Afahnwie, N.A.; Embui, V.F.; Yiika, L.P.; Djibril, K.N.G.; Kehding, F.B. Preliminary stream sediment geochemical exploration for base metals and other elements in terms of source apportionment and contamination status of Manjo and environs, Cameroon. Discov. Chem. 2025, 2, 93. [Google Scholar] [CrossRef] [Scilit]
- Smith, D.B.; de Caritat, P.; Reimann, C. Introduction to the thematic collection: A review of continental-scale geochemical mapping projects in Australia, Europe, and the conterminous United States. Geochem. Explor. Environ. Anal. 2023, 23, geochem2022-067. [Google Scholar] [CrossRef] [Scilit]
- Gevorgyan, G.; Rinke, K.; Schultze, M.; Mamyan, A.; Kuzmin, A.; Belykh, O.; Sorokovikova, E.; Hayrapetyan, A.; Hovsepyan, A.; Khachikyan, T.; et al. First report about toxic cyanobacterial bloom occurrence in Lake Sevan, Armenia. Int. Rev. Hydrobiol. 2020, 105, 131–142. [Google Scholar] [CrossRef] [Scilit]
- Hambaryan, L.R.; Stepanyan, L.G.; Mikaelyan, M.V.; Gyurjyan, Q.G. The bloom and toxicity of cyanobacteria in Lake Sevan. Proc. YSU B Chem. Biol. Sci. 2020, 54, 168–176. [Google Scholar] [CrossRef] [Scilit]
- Sakharova, E.G.; Krylov, A.V.; Sabitova, R.Z.; Tsvetkov, A.I.; Gambaryan, L.R.; Mamyan, A.S.; Gabrielyan, B.K.; Hayrapetyan, A.H.; Khachikyan, T.G. Horizontal and Vertical Distribution of Phytoplankton in the Alpine Lake Sevan (Armenia) during the Summer Cyanoprokaryota bloom. Contemp. Probl. Ecol. 2020, 13, 60–70. [Google Scholar] [CrossRef] [Scilit]
- Asatryan, V.; Stepanyan, L.; Hovsepyan, A.; Khachikyan, T.; Mamyan, A.; Hambaryan, L. The dynamics of phytoplankton seasonal development and its horizontal distribution in Lake Sevan (Armenia). Environ. Monit. Assess. 2022, 194, 757. [Google Scholar] [CrossRef] [Scilit] [PubMed]
- Asmaryan, S.; Khlghatyan, A.; Hovsepyan, A.; Muradyan, V.; Avetisyan, R.; Gevorgyan, G.; Hayrapetyan, A.; Eissa, M.M.A.A.; Bernert, H.; Schultze, M.; et al. Satellite-Based Detection of Algal Blooms in Large Alpine Lake Sevan: Can Satellite Data Overcome the Unavoidable Limitations in Field Observations? Remote Sens. 2024, 16, 3734. [Google Scholar] [CrossRef] [Scilit]
- Republican Geological Fund of the Republic of Armenia. Available online: https://www.geo-fund.am/en (accessed on 28 July 2026).
- ARMSTAT. Marz Gegharkunik of Ra in Figuers in Figures 2025. 2026. Available online: https://armstat.am/en/?nid=1013 (accessed on 28 July 2026).
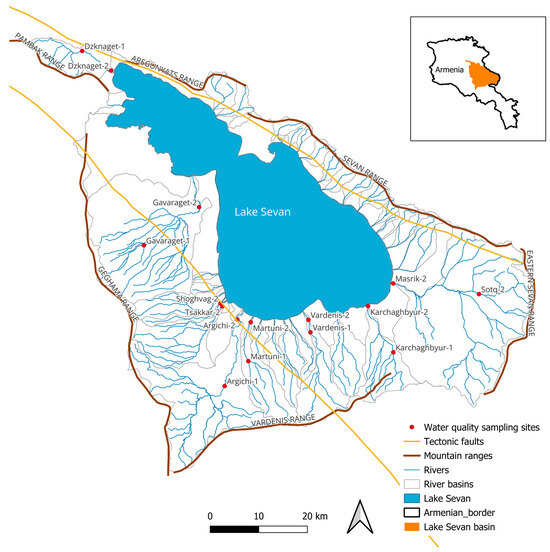
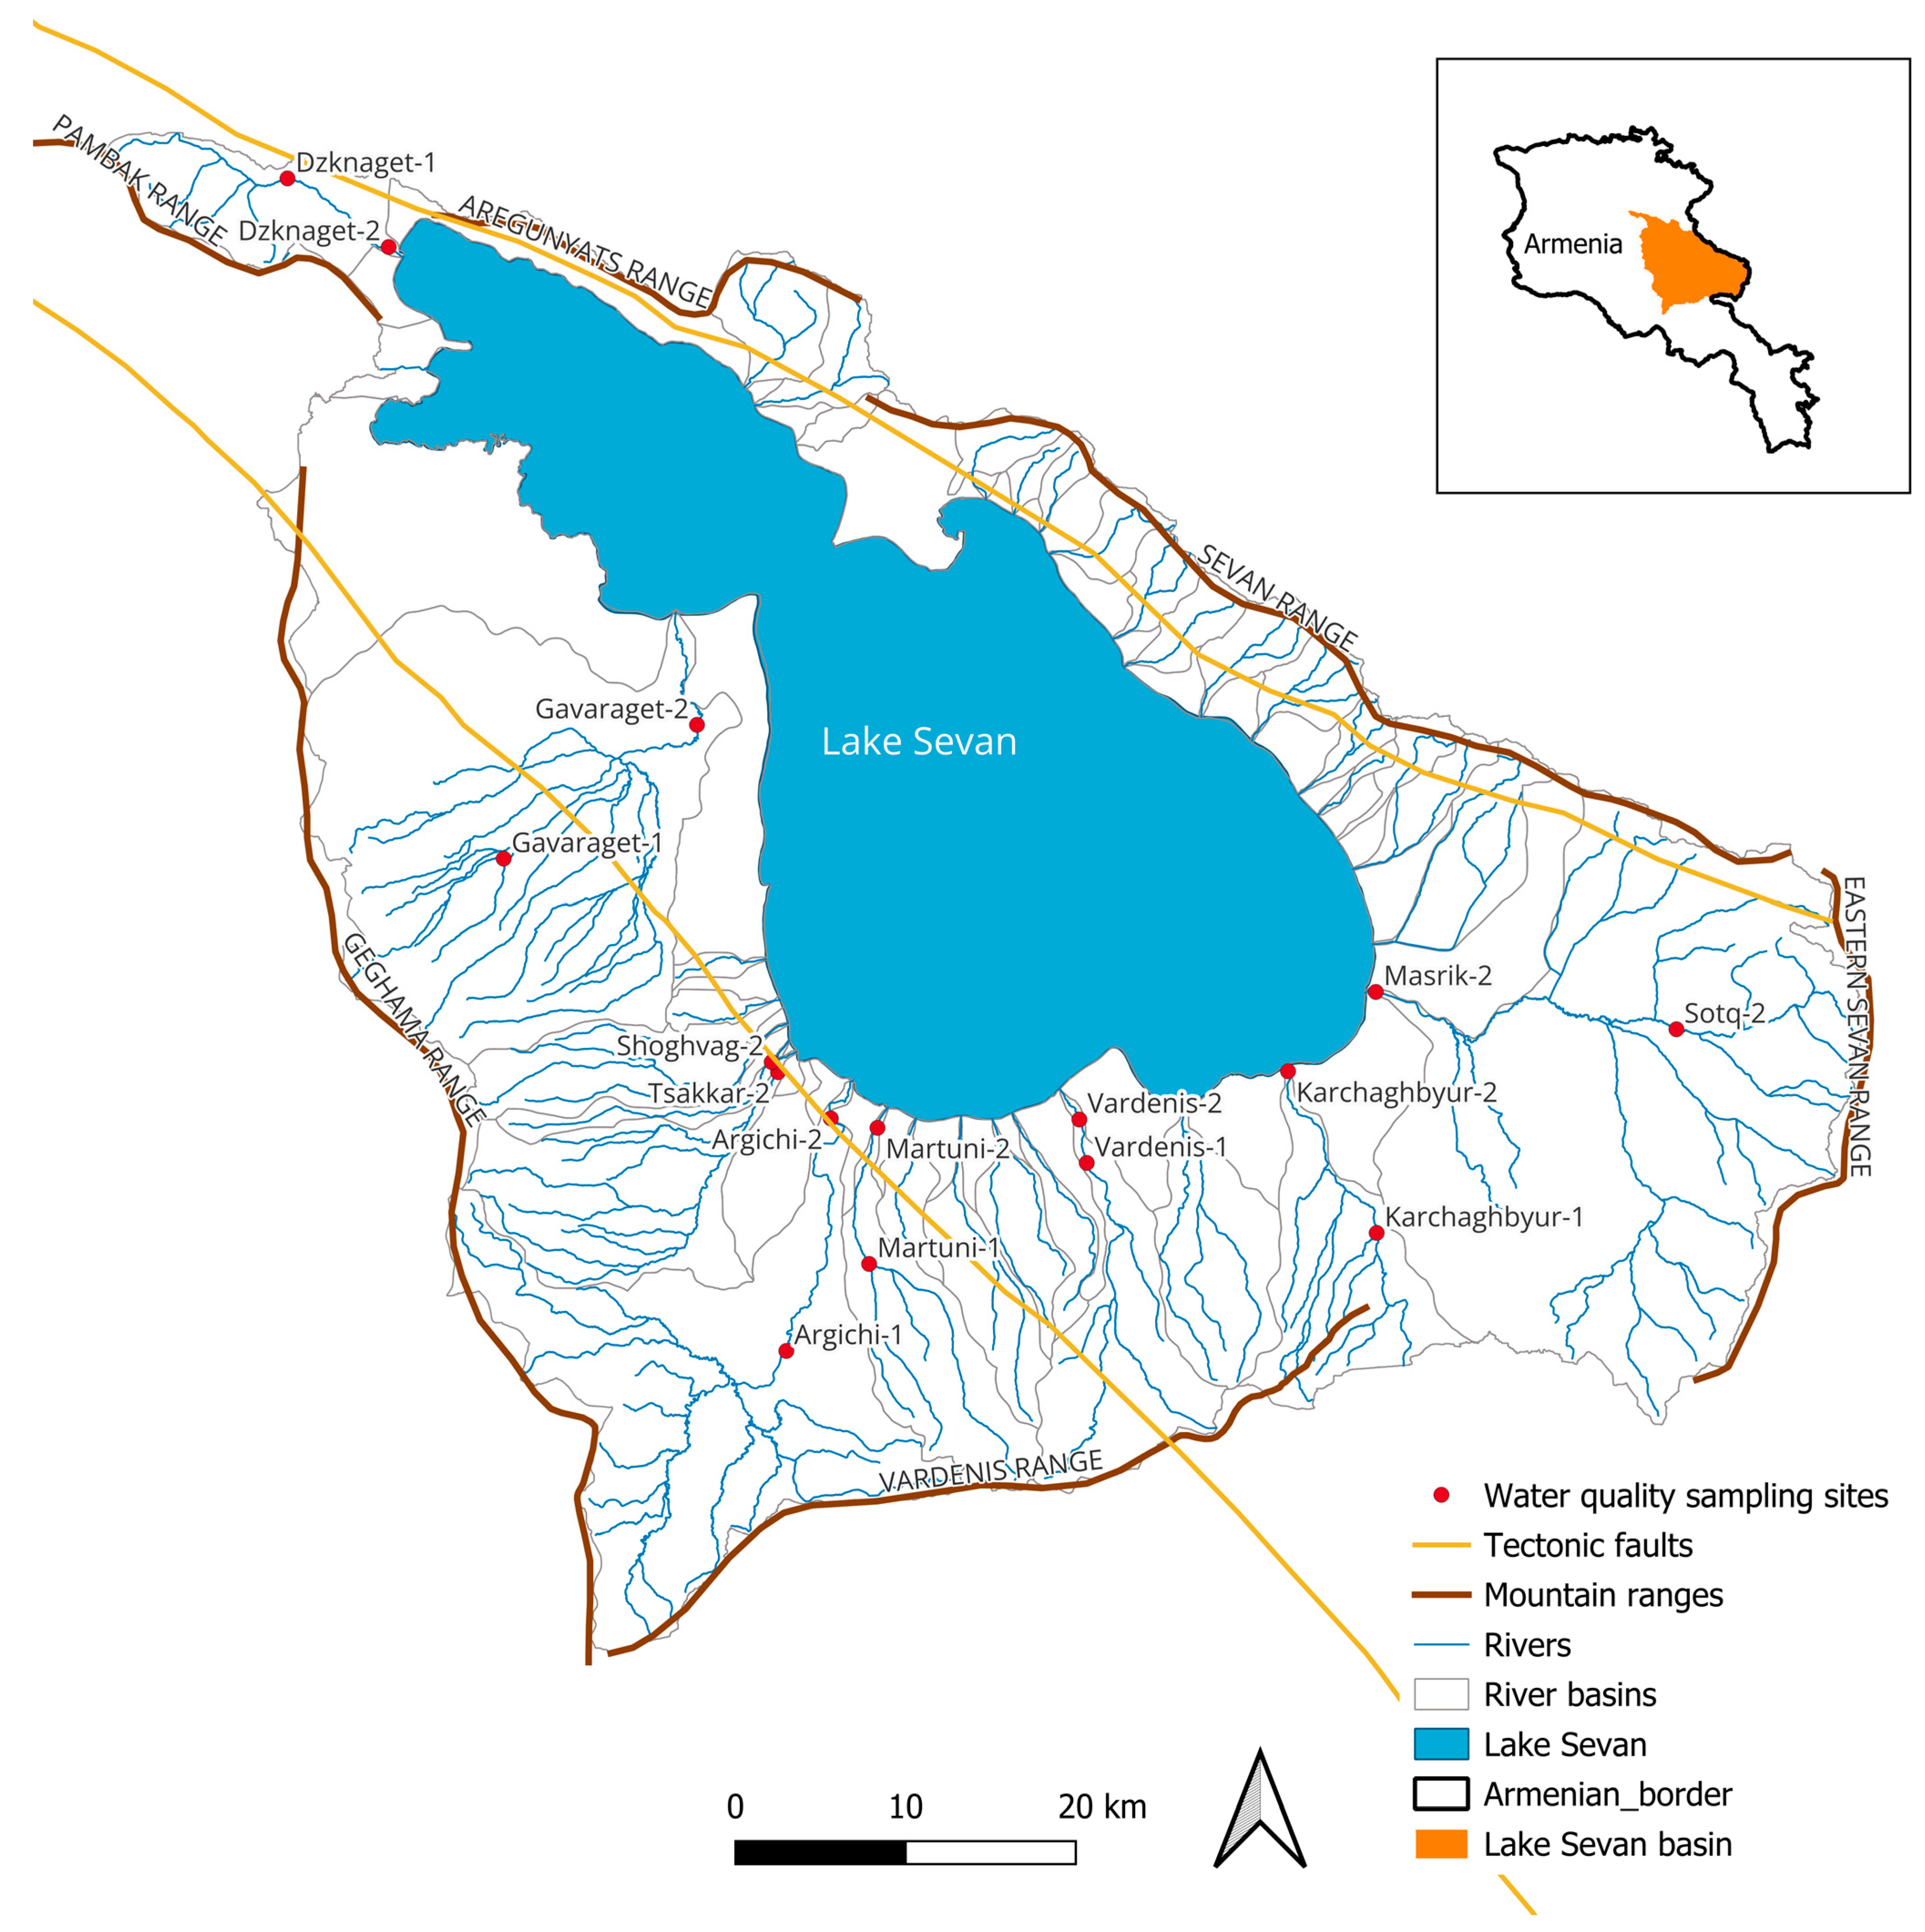
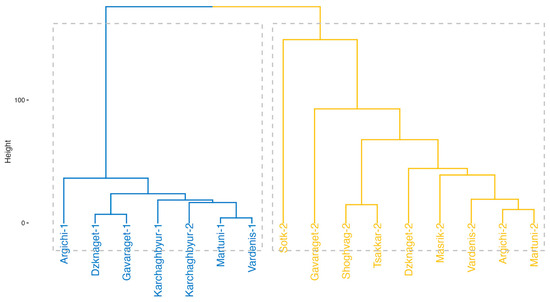
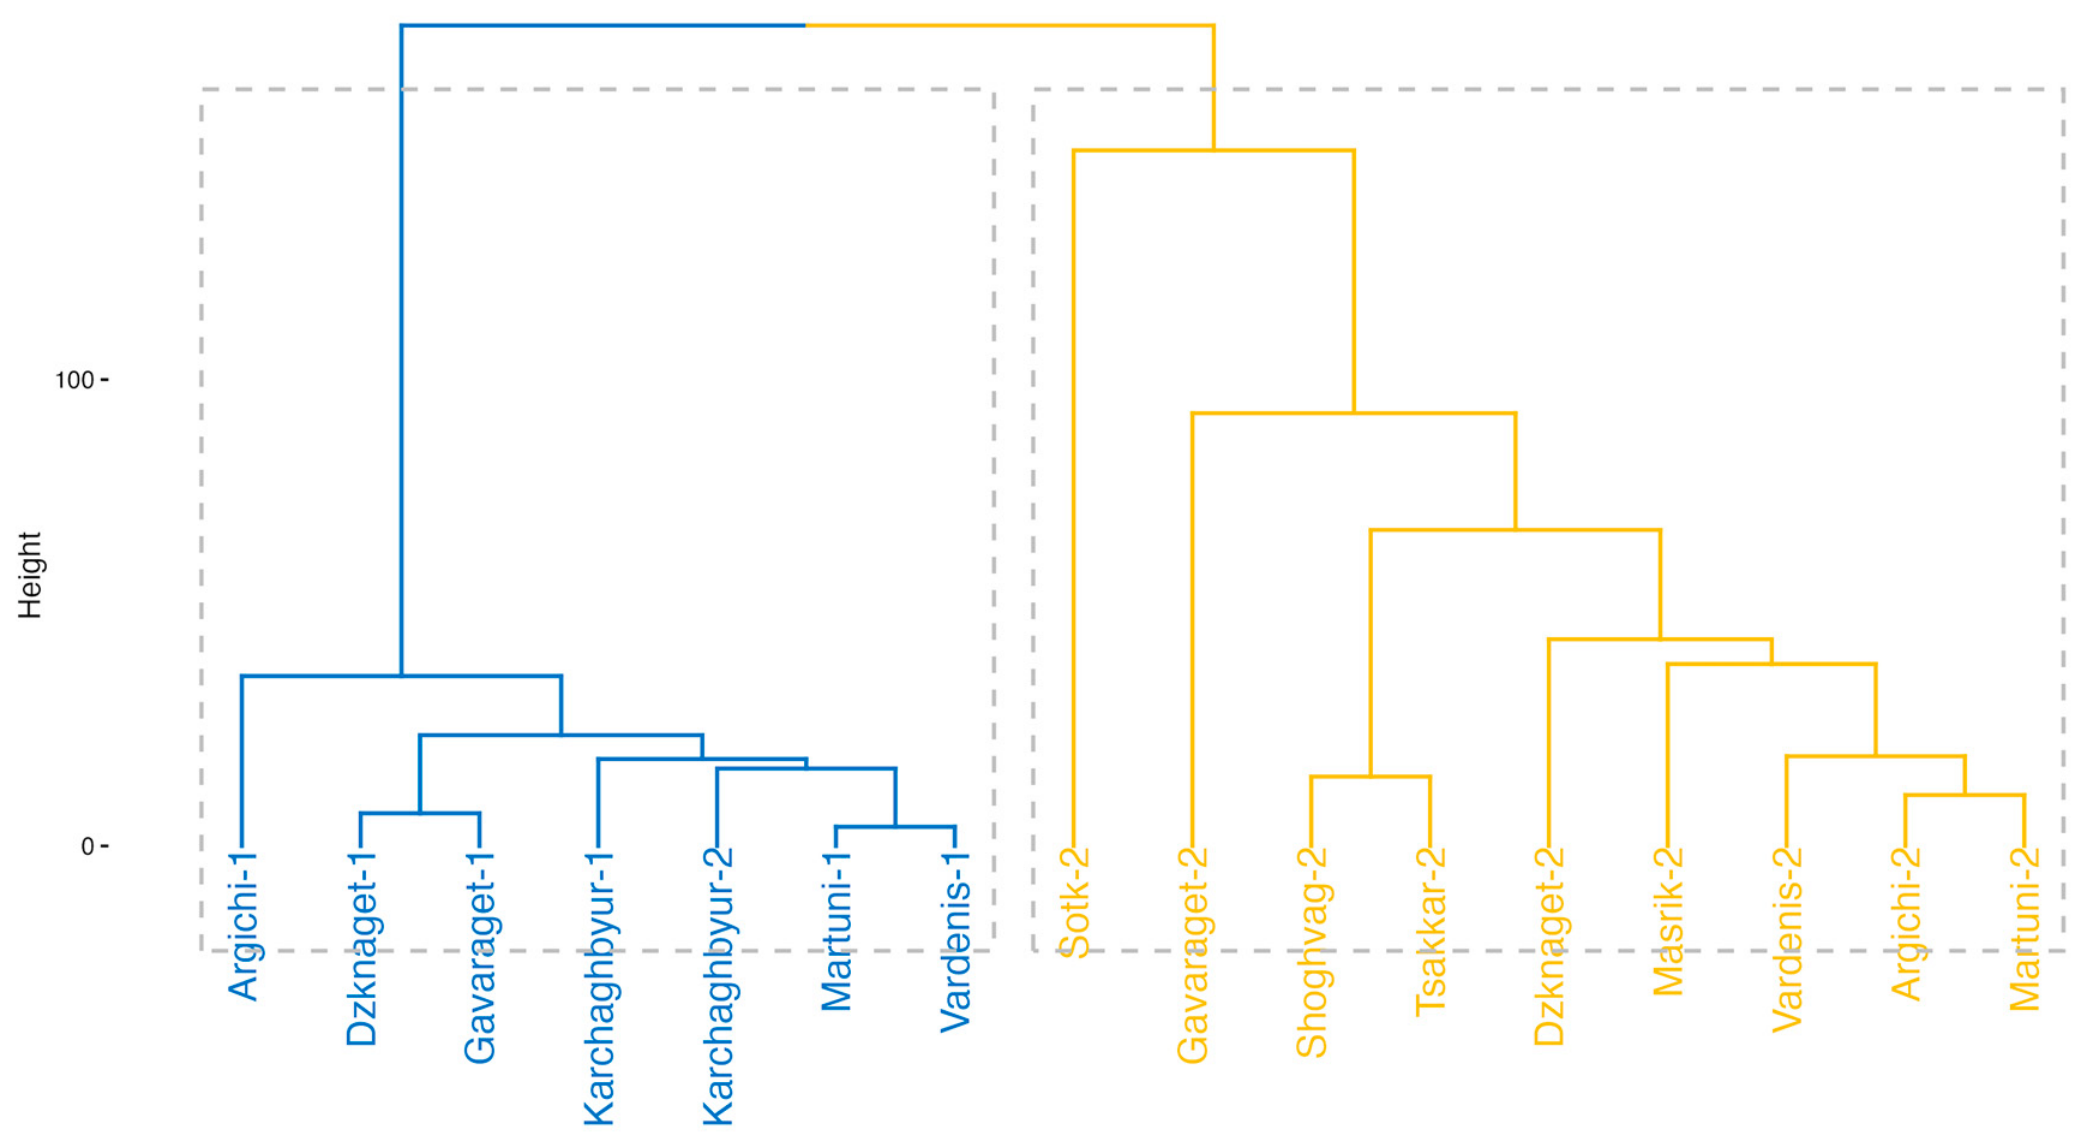
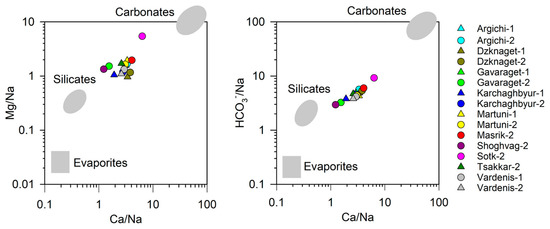
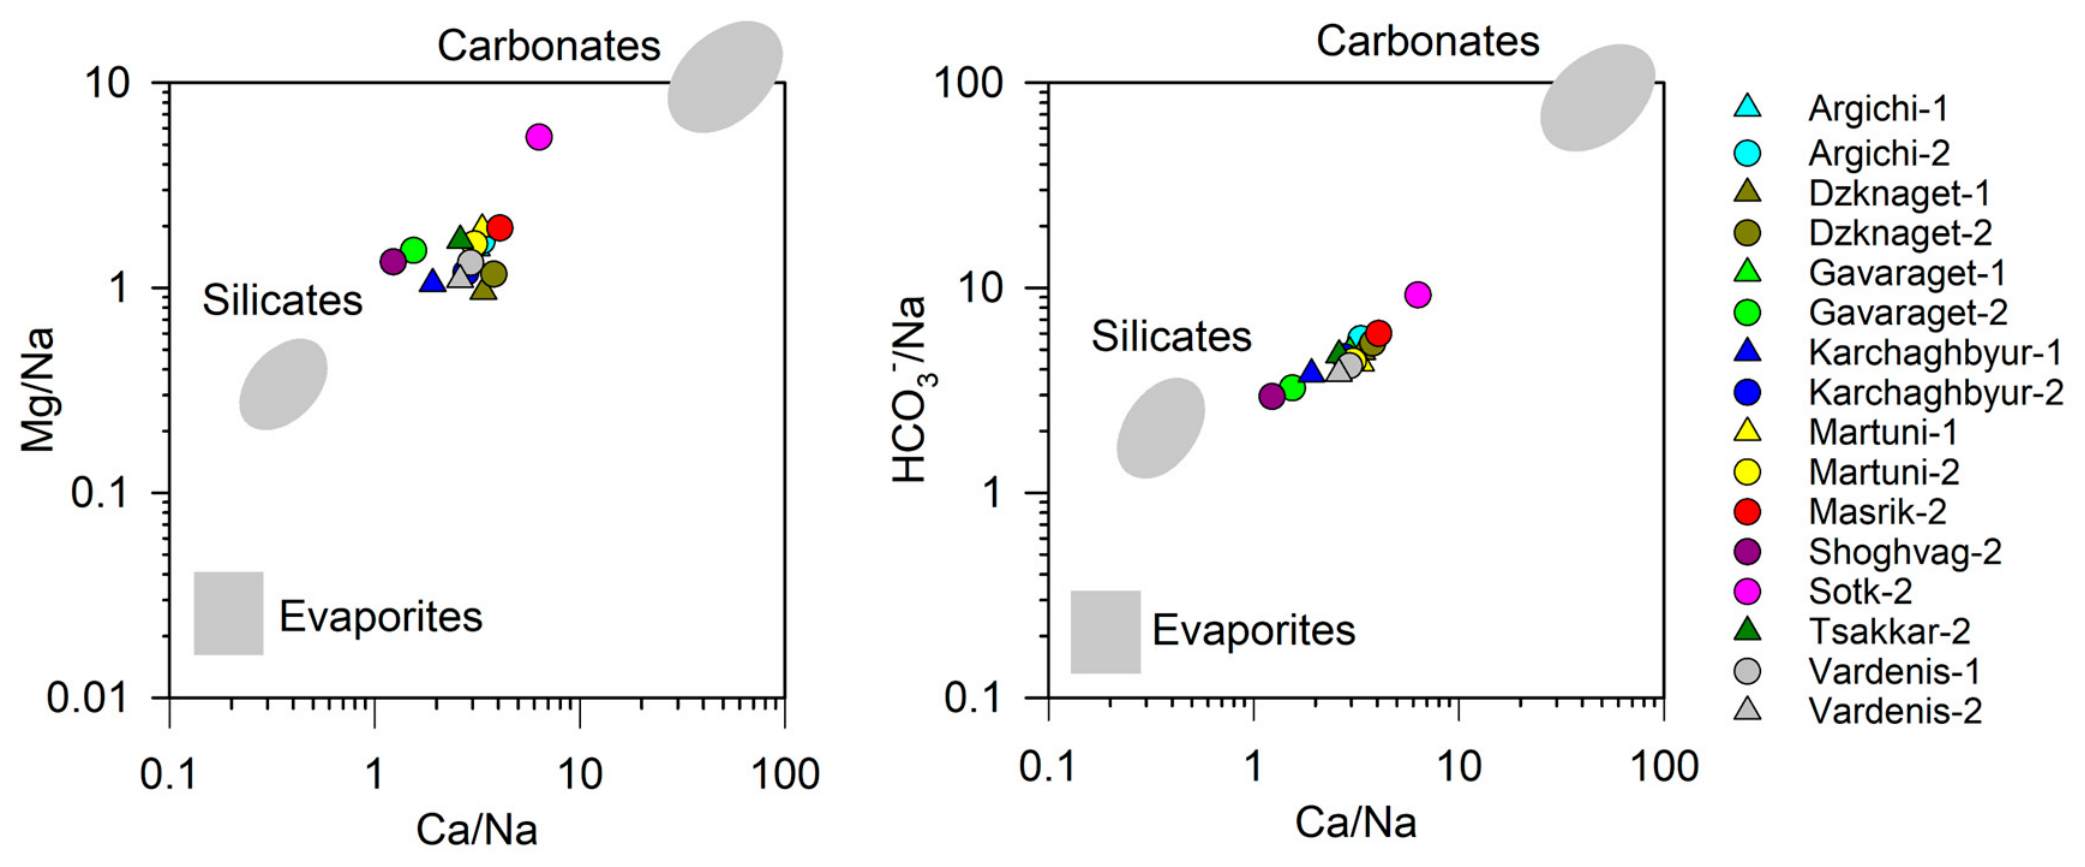
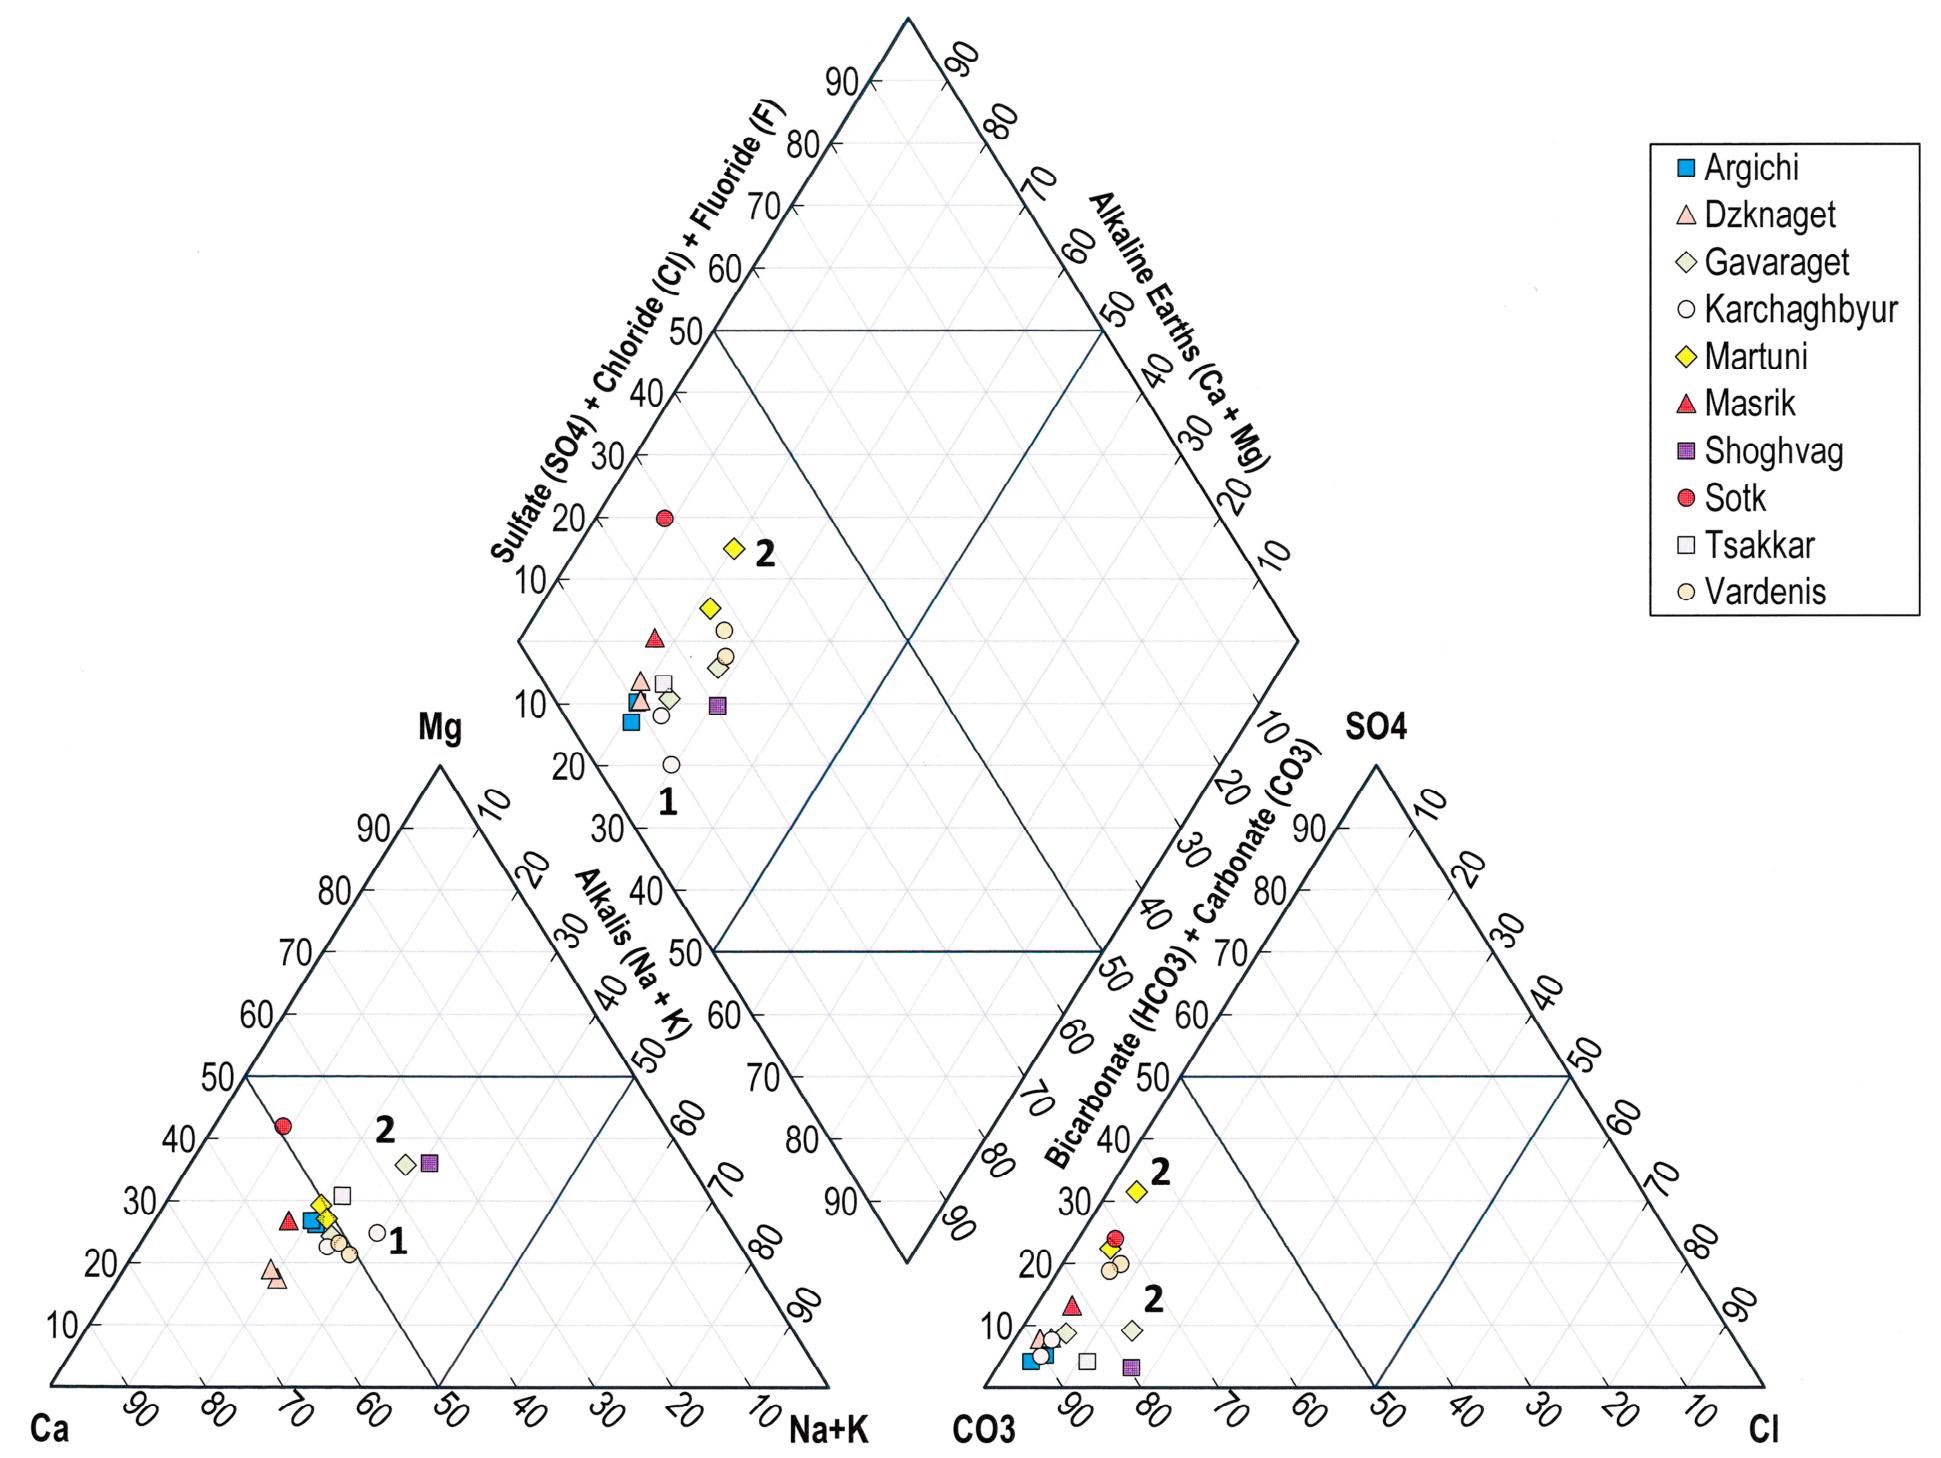

Disclaimer/Publisher’s Note: The statements, opinions and data contained in all publications are solely those of the individual author(s) and contributor(s) and not of MDPI and/or the editor(s). MDPI and/or the editor(s) disclaim responsibility for any injury to people or property resulting from any ideas, methods, instructions or products referred to in the content. |
© 2026 by the authors. Licensee MDPI, Basel, Switzerland. This article is an open access article distributed under the terms and conditions of the Creative Commons Attribution (CC BY) license.