


Abstract
Hydroclimatic whiplash, characterized by rapid transitions between wet and dry conditions, poses a growing challenge for water resource management and ecosystem stability. However, the spatial and statistical characteristics of wet–dry transitions across the contiguous United States are not fully understood. This study analyzed Palmer Drought Severity Index (PDSI) and Palmer Hydrological Drought Index (PHDI) records from 344 NOAA climate divisions spanning 1895–2024. Whiplash was defined as a transition between severe drought and severe wetness within 12-month rolling windows. Statistical descriptors including lag-1 autocorrelation, variance, and skewness were evaluated for whiplash and non-whiplash windows to assess differences between them. Whiplash hotspots were identified in Texas, Southern California, northern Colorado, western New Mexico, and parts of the Midwest, with PDSI detecting higher whiplash frequency than PHDI. This difference reflects PDSI’s greater short-term sensitivity to near-surface soil moisture compared to PHDI’s longer-term hydrological persistence. Whiplash windows showed elevated variance and autocorrelation relative to baseline conditions across both indices. These findings demonstrate that hydroclimatic whiplash is strongly dependent on index selection and threshold definition, and that elevated variance and autocorrelation may serve as statistical indicators of transition periods with important implications for drought monitoring and climate adaptation planning.
1. Introduction
Hydroclimatic variability is expected to intensify under continued climate change, leading to increasingly unstable transitions between wet and dry conditions across many regions of the world [1]. Of particular concern are rapid shifts between hydroclimatic extremes, often referred to as “precipitation (or hydrologic) whiplash”, where wet and dry states occur adjacent to each other [2]. These transitions have been shown to increase in both frequency and intensity in projected climate scenarios. Estimates suggest increases of 25–60% in frequency and 30–100% in intensity by the end of the 21st century, particularly in semi-arid regions such as western North America [3]. These rapid changes in extremes pose significant challenges for water resource management, agriculture, and ecosystem stability as they reduce the time available for adaptation and recovery [4,5]. Despite growing recognition of their importance, droughts and floods have traditionally been studied as independent phenomena rather than as an interconnected component of hydroclimatic systems. Differences in threshold classification criteria can alter characterization and the detection of transitions [6]. Studies have indicated that Mediterranean regions of the world experienced water whiplash in 35% of the years [2]. In the United States, heightened occurrence of hydrologic extremes and whiplash events in the post-2015 period have been shown for all Western U.S. basins [1]. This research highlights the need for consistent methodologies when analyzing hydroclimatic whiplash, particularly when comparing results across datasets and regions, and the need to develop methods for predicting abrupt shifts [7,8].
Long-term hydroclimatic variability has been analyzed using drought indices, most notably the Palmer Drought Severity Index (PDSI) and the Palmer Hydrological Drought Index (PHDI) [9,10]. Although derived from a common water balance framework, these indices capture different aspects of drought behavior. The PDSI is generally characterized as a meteorological drought index that is more responsive to short-term moisture changes, whereas the PHDI reflects longer-term hydrological conditions and exhibits greater persistence [11]. These differences are further emphasized by their response times, with PDSI reacting more rapidly to changing conditions and PHDI representing more gradual, sustained hydrological processes [12]. Long-term analysis indicates that drought variability across the contiguous United States has increased over the past century, with more fluctuations in moisture conditions that complicate prediction and water resource planning [13]. The choice of drought index can substantially influence the detection and interpretation of hydroclimatic extremes and transitions.
PDSI and PHDI were selected for this study for several reasons. First, both indices share a common water balance framework developed by Palmer, allowing direct comparison of short-term meteorological drought conditions (PDSI) against longer-term hydrological persistence (PHDI) within a consistent methodological structure [11,12]. Second, the NOAA climate division records provide continuous monthly PDSI and PHDI data spanning 1895–2024, offering one of the longest standardized hydroclimatic records available for the contiguous United States [14]. Third, both indices have been widely applied in prior studies of long-term drought variability and hydroclimatic trends across the United States, providing a well-established methodological foundation for this analysis [9,10]. The paired use of PDSI and PHDI further allows this study to evaluate how index sensitivity influences whiplash detection, an important methodological consideration highlighted by recent literature [6].
There is increasing interest in understanding the statistical behavior of hydroclimatic systems as they approach abrupt transitions. In complex systems theory, rapid shifts between states are often associated with critical transitions or “tipping points,” which can act as early warning signals prior to the transition [15]. One such signal is “critical slowing down,” in which a system’s recovery from perturbations becomes progressively slower as it approaches a threshold, leading to increased temporal autocorrelation [16]. In addition to autocorrelation, increases in variance have also been identified as indicators of declining system stability, while changes in skewness may reflect evolving asymmetry in system behavior [17]. These statistical indicators have been observed in both climate and hydrological systems, where rising autocorrelation and variance have been linked to large-scale hydroclimatic shifts [15].
Recent work has begun to apply this theoretical framework to drought and food systems, using long-term observational and remotely sensed datasets to identify early-warning signals of hydroclimatic change [18]. Changes in statistical properties such as autocorrelation, variance, and skewness have been used as indicators of emerging drought conditions and the associated impacts on food security and ecosystem stability [19,20]. However, relatively little work has examined whether these statistical indicators are systematically associated with hydroclimatic whiplash events, especially across large spatial domains such as the contiguous United States and over extended observational records.
The study presented here investigates hydroclimatic whiplash across the contiguous United States using long-term monthly PDSI and PHDI records from NOAA climate divisions. Whiplash events are identified by rapid transitions between wet and dry conditions using PDSI and PHDI records. In addition, the study evaluates the relationship between whiplash occurrence and key statistical indicators, including lag-1 autocorrelation, variance, and skewness, to assess whether these metrics exhibit systematic changes during transition periods. Comparisons between PDSI and PHDI are used to evaluate how differences in index sensitivity and persistence influence the detection of whiplash events. Together, these analyses aim to improve understanding of how hydroclimatic variability, statistical system behavior, and rapid wet–dry transitions are linked across spatial and temporal scales.
2. Data and Methods
2.1. Data Sources
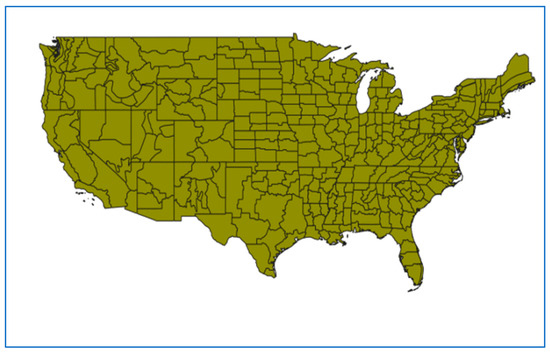
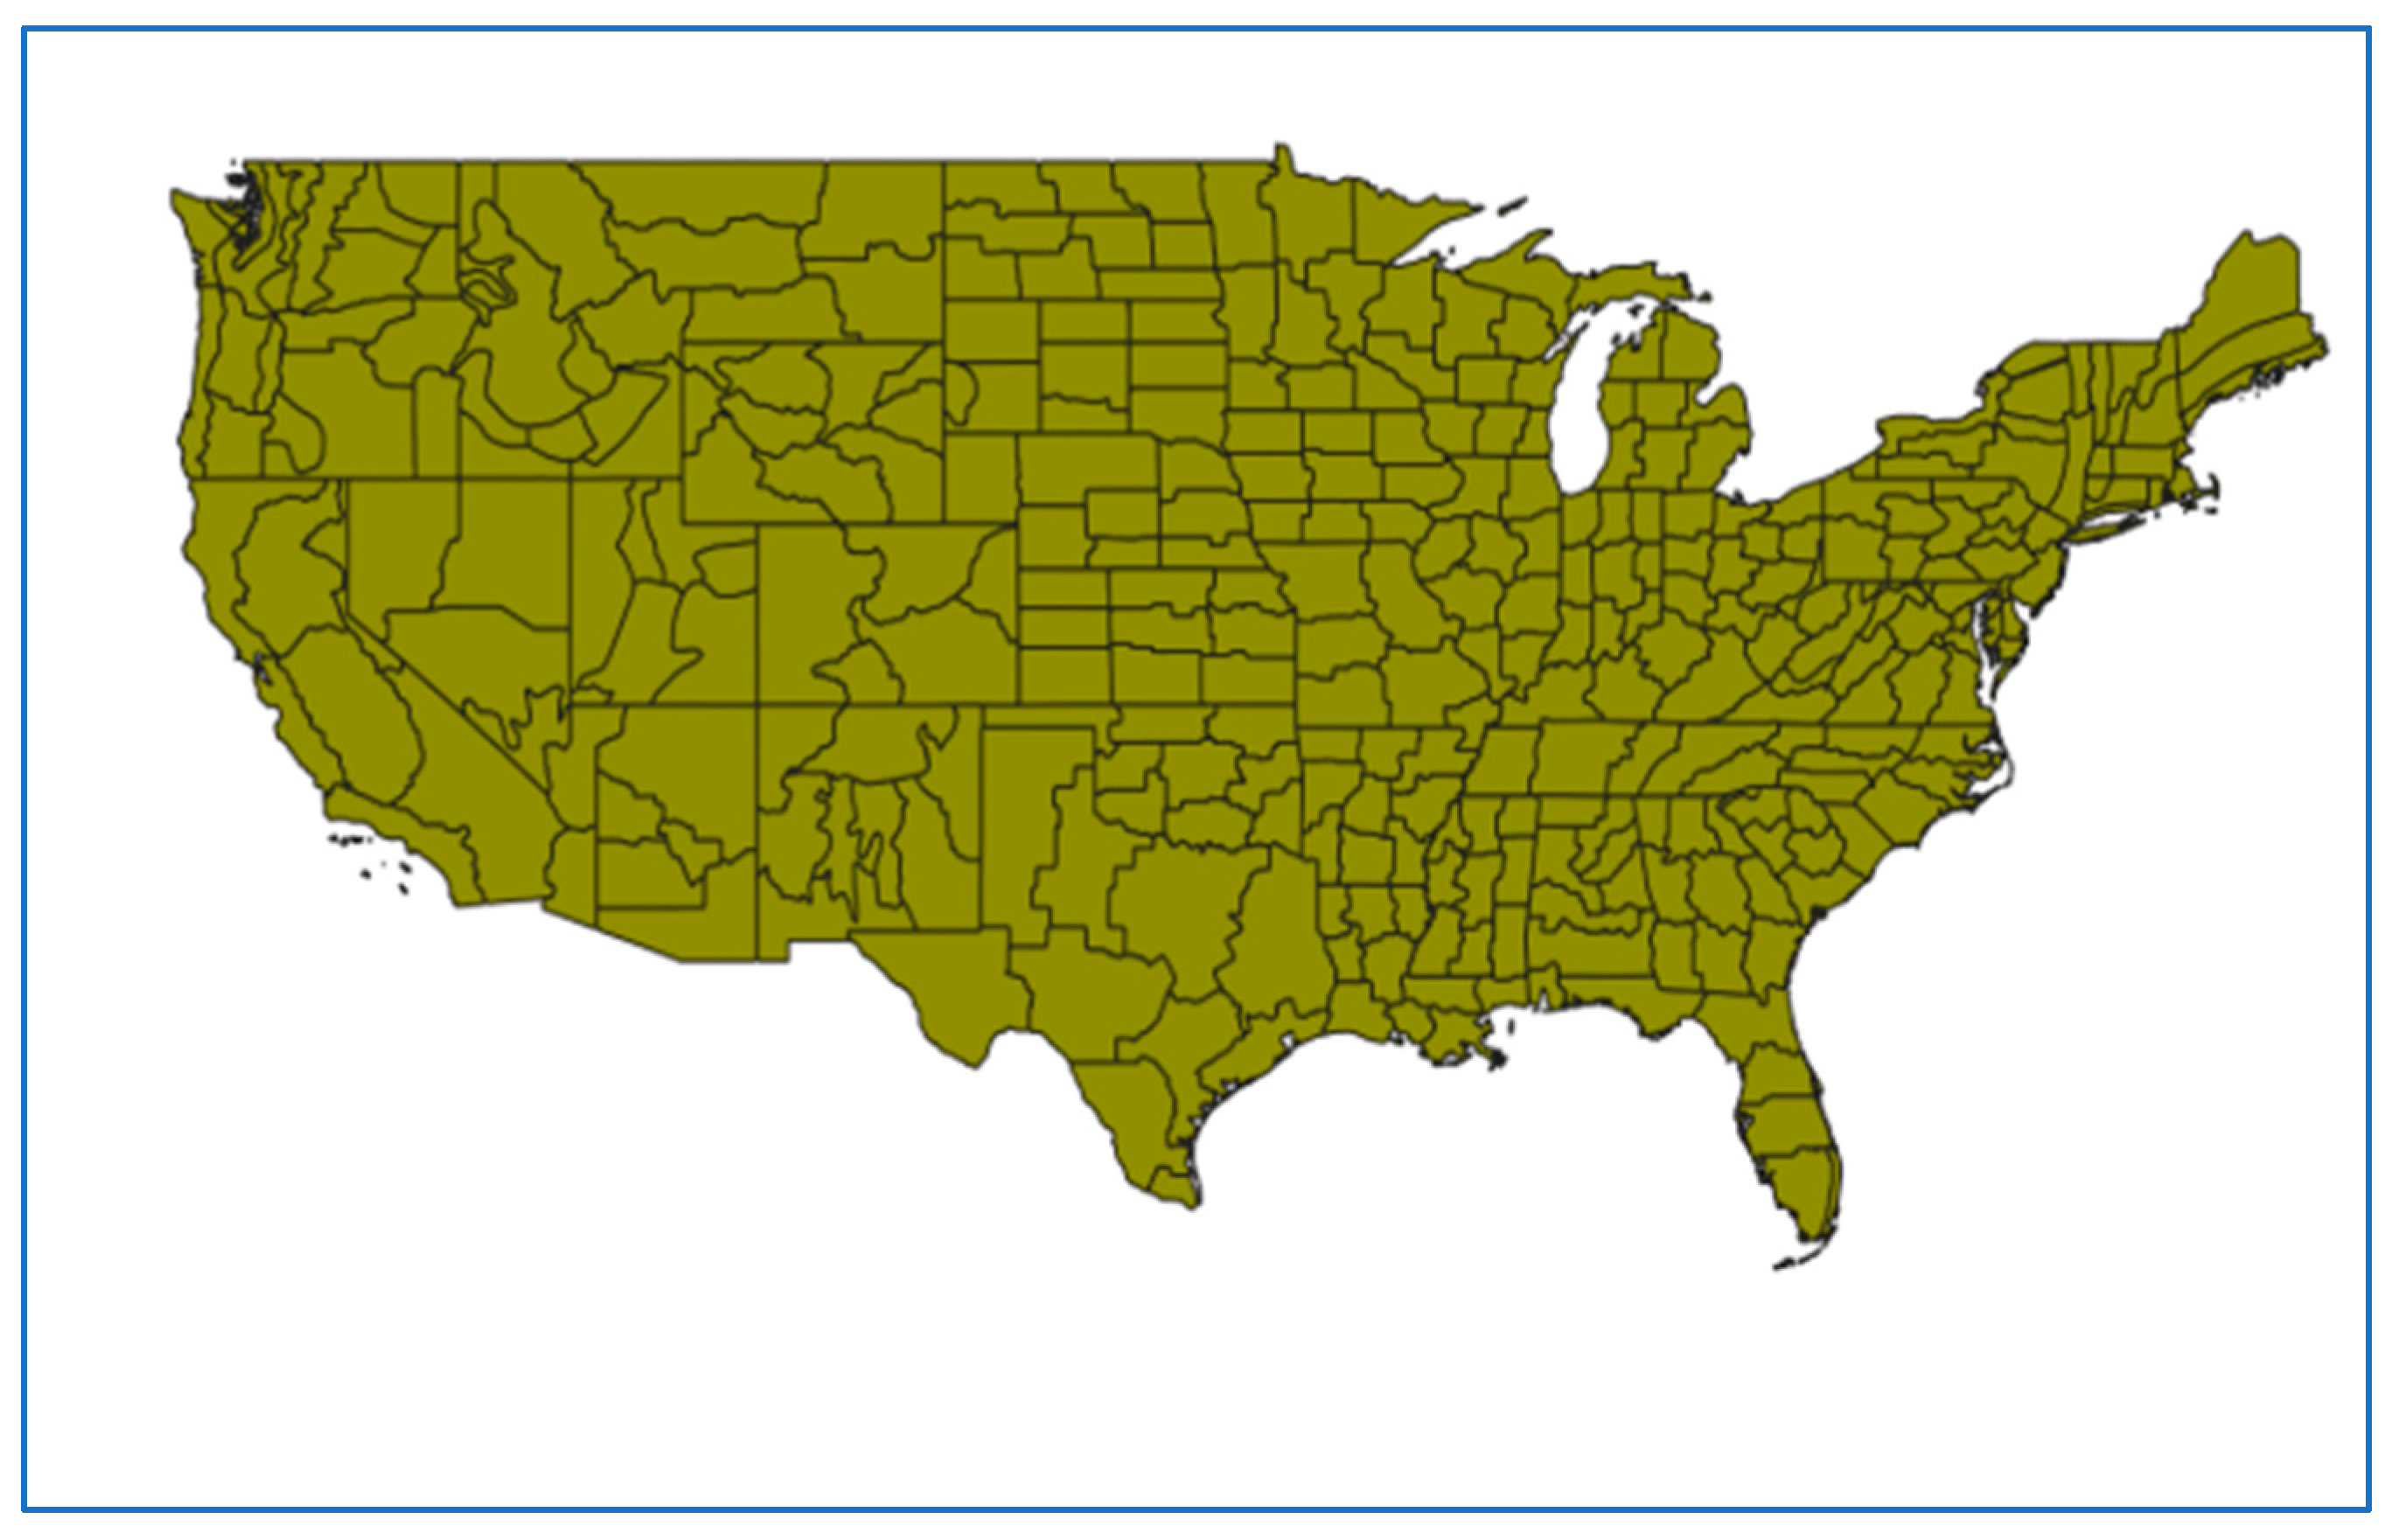
The contiguous United States encompasses a diverse range of climate regimes, producing highly variable precipitation and moisture patterns that make the region particularly susceptible to recurring drought and flood extremes. Droughts have historically caused substantial economic, agricultural, and ecological impacts across the country, with long-term analysis indicating that drought variability has increased over the past century [9]. Recent studies have further documented escalating hydrological extremes across U.S. basins, with significant consequences for water management and vulnerable communities [1,7,21]. This spatial heterogeneity motivates the division-level analysis of the 344 NOAA climate divisions shown in Figure 1.
Figure 1.
Map of the 344 NOAA climate divisions across the contiguous United States used as the spatial unit of analysis in this study. Each division represents a subdivision of a U.S. state defined by relatively homogeneous climate characteristics.
The 344 NOAA climate divisions span the contiguous United States between approximately 25° N–49° N latitude and 67° W–125° W longitude, covering a total land area of approximately 7.8 million km2. Each climate division represents a subdivision of a U.S. state defined by relatively homogeneous climate characteristics, with the number of divisions per state ranging from 1 to 10. Table 1 summarizes the geographic characteristics of the climate division dataset used in this study.
Table 1.
Geographic and temporal characteristics of the NOAA climate division dataset used in this study. Climate divisions represent subdivisions of U.S. states defined by relatively homogeneous climate characteristics, as maintained by the NOAA Physical Sciences Laboratory, Boulder, CO, USA.
Monthly hydroclimatic variability was characterized using the Palmer Drought Severity Index (PDSI) and the Palmer Hydrological Drought Index (PHDI) obtained from NOAA climate division records [14]. The dataset comprises 344 climate divisions across the contiguous United States spanning 1895–2024 (130 years) [14]. These indices provide standardized measures of drought and hydrologic conditions at the climate division scale, with PDSI emphasizing near-surface moisture balance and PHDI representing longer-term hydrological persistence. Previous studies have used PDSI and PHDI to evaluate long-term trends in drought and hydrologic cycles [9,10].
The spatial unit of analysis was the NOAA climate division, identified by a two-digit state FIPS code and a two-digit climate division code. Monthly values for each climate division were used with a rolling-window whiplash analysis (see Section 2.3), with records spanning 1895–2024. Records with invalid dates and missing values were removed and converted to NaN.
2.2. Seasonal Assignment and Index Categorization
Each monthly observation was assigned to a climatological season: Winter (December–February); Spring (March–May); Summer (June–August); or Fall (September–November). These seasonal labels were retained to describe the timing of detected whiplash transitions. In addition, monthly PHDI and PDSI values were categorized into drought and wetness states using Palmer-style thresholds, as summarized in Table 2.
Table 2.
Classification of hydroclimatic conditions based on PDSI and PHDI value ranges. Categories represent increasing severity of wetness and drought, with corresponding terminology differences between the PDSI and PHDI classification schemes [14,22].
2.3. Definition of Hydroclimatic Whiplash
A hydroclimatic whiplash event was defined as an abrupt transition between opposing hydroclimatic extremes within a limited time span, evaluated within fixed 12-month rolling windows at the climate division scale (2). Whiplash detection was implemented separately for the PHDI and PDSI time series. The PHDI (PDSI) rolling-window definition (numeric thresholds) for severe-or-worse drought and wetness were defined from monthly PHDI (PDSI) values using indicator functions:
where It is the PHDI (PDSI) value in month t. A whiplash was identified within a given 12-month window if there exist months tj and tk within the same window such that tj < tk and the following:
In the PHDI (PDSI) pipeline, whiplash detection used the categorical states computed from the PDSI mapping above. A qualifying transition was defined as an ordered pair of months (tj < tk) in which one month was classified as “Severe Drought” or “Extreme Drought” (equivalently, PDSI < −3) and the other month was classified as “Very Moist” or “Extremely Moist” (equivalently, PDSI > 3), in either direction.
Both the numeric threshold and category-based definitions apply equivalent criteria, a transition between index values exceeding ±3.00, and produce identical whiplash detection outcomes. The two formulations are presented together for clarity, with the numeric form (Equations (1) and (2)) providing mathematical precision and the categorical form providing interpretive context consistent with Table 2.
2.4. Whiplash Detection Within Rolling Windows
Within each valid 12-month window, the detection algorithm examined ordered month pairs (j,k) with j < k. In the PHDI pipeline, the search was terminated after the first qualifying drought-to-wet or wet-to-drought transition was identified within that window, yielding at most one recorded transition per window while still assigning a binary classification at the window level. In the PDSI pipeline, qualifying transitions were detected using the category-based extremes described above. The detection routine can identify multiple qualifying transitions within the same 12-month window (i.e., multiple distinct start months may yield qualifying end months). When multiple transitions occurred, each detected transition was recorded, potentially producing multiple transition records associated with the same rolling-window label.
For window-level classification, a binary indicator was assigned for each valid rolling window:
2.5. Statistical Characterization
For each valid rolling window, regardless of whiplash classification, three statistical descriptors (Lag-1 autocorrelation, variance, and skewness) were computed from the monthly index values within that window [23]. Previous work has shown these as possible indicators of shifts in systems related to food security [19]. Lag-1 autocorrelation was calculated to quantify short-term persistence:
computed within the window using a one-month lag. Variance was computed to capture intra-window variability:
and skewness was computed to describe distributional asymmetry:
These metrics were computed directly on the window’s monthly PHDI and PDSI values and retained for both whiplash and non-whiplash windows. The 12-month rolling windows advanced by one month at a time (step size = 1 month), resulting in overlapping windows across the full 1895–2024 record for each climate division. Statistical descriptors (lag-1 autocorrelation, variance, and skewness) were computed independently for each window from the 12 monthly values contained within it. Because adjacent windows share 11 of 12 months, successive window statistics are not independent, which introduces serial dependence in the window-level time series. This overlap was not corrected for in the paired t-tests, and results should be interpreted accordingly. Future work could address this through block bootstrapping or by sampling non-overlapping windows for significance testing.
2.6. Division-Level Comparison of Whiplash and Non-Whiplash Window Statistics
To compare the statistical characteristics of whiplash and non-whiplash windows across datasets, the whiplash rate was calculated as the mean of the binary whiplash indicator across all valid windows. Mean autocorrelation, variance, and skewness were then computed separately for whiplash windows (Whiplash = 1) and non-whiplash windows (Whiplash = 0), producing division-level summaries for each metric. These summaries were used to generate smoothed density distributions comparing PDSI and PHDI whiplash rates, as well as whiplash versus non-whiplash distributions for autocorrelation, variance, and skewness within each dataset. Density curves were estimated from histogram-based densities and smoothed using a moving-average kernel. Spatial patterns were visualized using choropleth maps at the climate division level, in which each division was shaded according to its aggregate statistical value. No spatial interpolation was applied between divisions; all mapped values represent direct division-level means. Density distributions were estimated using histogram-based densities with a moving-average smoothing kernel of width k = 5, applied to reduce noise in the distribution curves while preserving the overall shape. Division-level summary statistics were computed independently for each climate division before being aggregated into the national-level distributions.
Statistical differences were evaluated using paired t-tests at the climate division level. Specifically, paired tests were used to compare PDSI versus PHDI whiplash rates for matched climate divisions, and within each dataset, paired tests were used to compare whiplash-window versus non-whiplash-window mean autocorrelation, variance, and skewness across divisions.
To verify the robustness of paired t-test results given the skewed distributions, Wilcoxon signed-rank tests [24] were performed as non-parametric alternatives for all metric comparisons. Results from both tests are reported.
Generative artificial intelligence was used to assist in identifying appropriate statistical methods, reviewing the manuscript, and confirming the main findings.
3. Results
3.1. PHDI vs. PDSI Whiplash
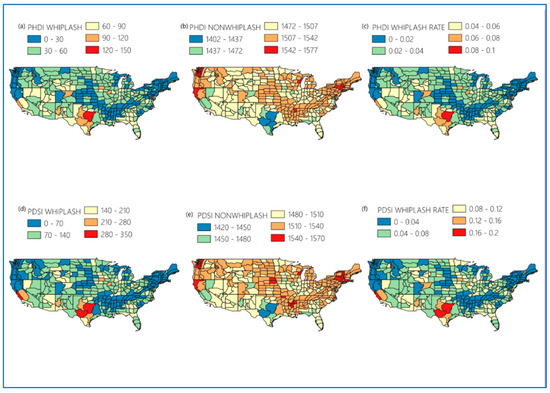
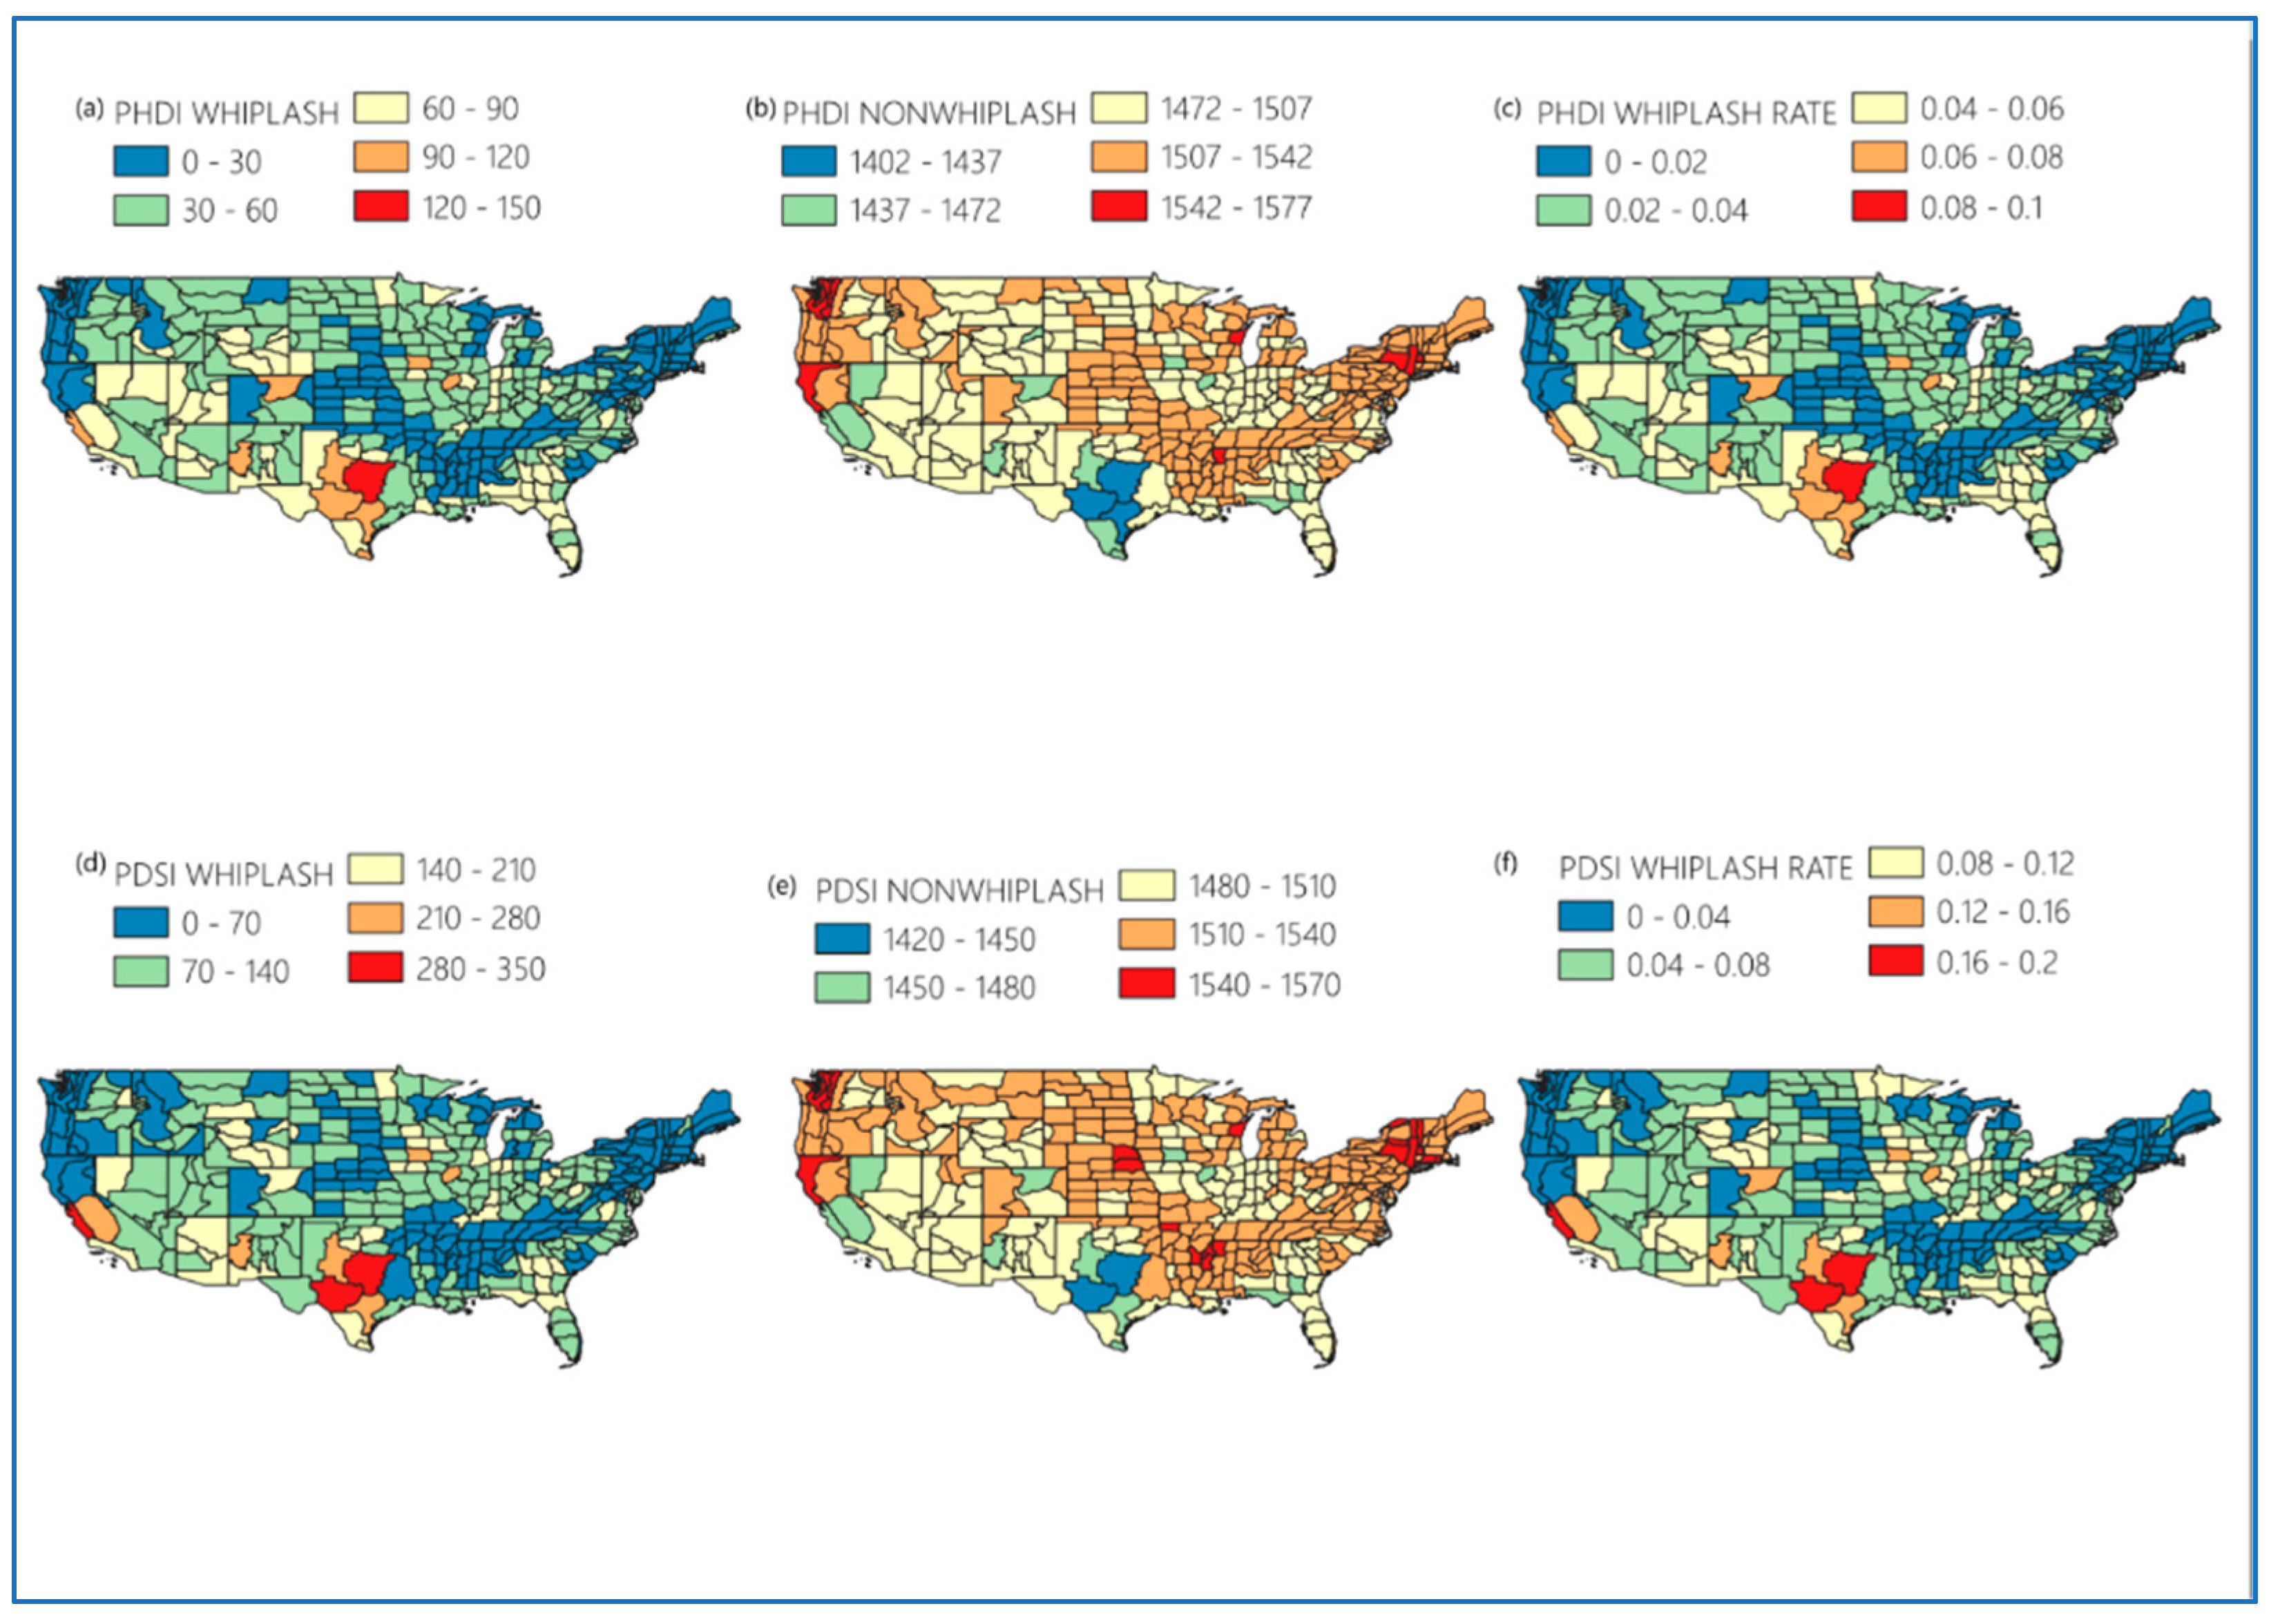
Figure 2 shows the whiplash frequency, non-whiplash, and whiplash rate maps. There are consistent spatial patterns across both PHDI and PDSI indices, but differences in magnitude. Both the PDSI and PHDI identify Texas as a hotspot for whiplash events, with PHDI showing approximately 90–150 events and PDSI showing 280–350 events during the time period 1895–2024. Other regions -with high numbers of whiplash events include Southern California, northern Colorado, western New Mexico, and portions of the Midwest (Illinois and Iowa) [4,25,26]. PDSI has higher frequencies (210–280 events) compared to PHDI (90–120 events). The differences between PDSI and PHDI might reflect PDSI’s short-term sensitivity to rapid moisture variability compared to PHDI’s longer-term hydrologic persistence. The concentration of whiplash activity in Texas likely reflects its exposure to competing moisture sources, including Gulf of Mexico moisture intrusions and continental dry air masses, which together produce rapid alternations between wet and dry conditions [27,28,29]. Similarly, high whiplash rates in Southern California are consistent with the region’s Mediterranean climate regime, characterized by pronounced seasonal precipitation variability and sensitivity to El Niño–Southern Oscillation (ENSO) teleconnections [1,7,30,31].
Figure 2.
Spatial distribution of hydroclimatic whiplash characteristics across the contiguous United States based on PHDI and PDSI. The top row shows PHDI-based maps of (a) whiplash event frequency, (b) non-whiplash event frequency, and (c) whiplash rate. The bottom row shows the corresponding PDSI-based maps of (d) whiplash event frequency, (e) non-whiplash event frequency, and (f) whiplash rate.
The non-whiplash maps in Figure 2 have an opposite relationship with whiplash patterns. Regions showing low whiplash activity (i.e., higher non-whiplash events for both PHDI and PDSI). The whiplash rate maps in Figure 2 are like the whiplash frequency maps, where high values are in the regions of Texas, Southern California, Colorado, New Mexico, Illinois, and Iowa for PDSI (≈0.12–0.20) and PHDI (≈0.06–0.10). This consistency across both metrics indicates similar regional hydroclimatic variability. The systematically higher whiplash counts produced by PDSI relative to PHDI reflect the fundamental difference in their temporal integration scales. PDSI responds rapidly to short-term moisture anomalies, making it more sensitive to within-year fluctuations that can cross both drought and wetness thresholds within a 12-month window. PHDI’s stronger hydrological memory dampens these short-term signals, requiring more sustained extremes before threshold crossings occur [11,12].
3.2. Spatial PHDI vs. PDSI Autocorrelation, Variance and Skewness
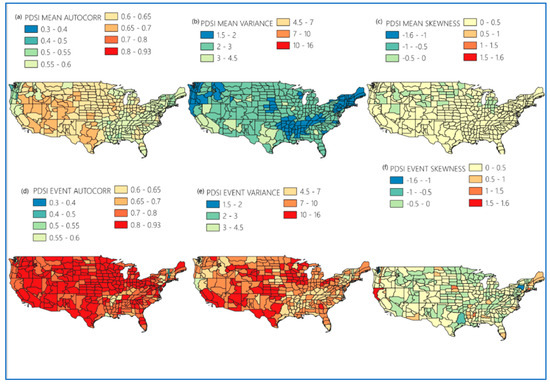
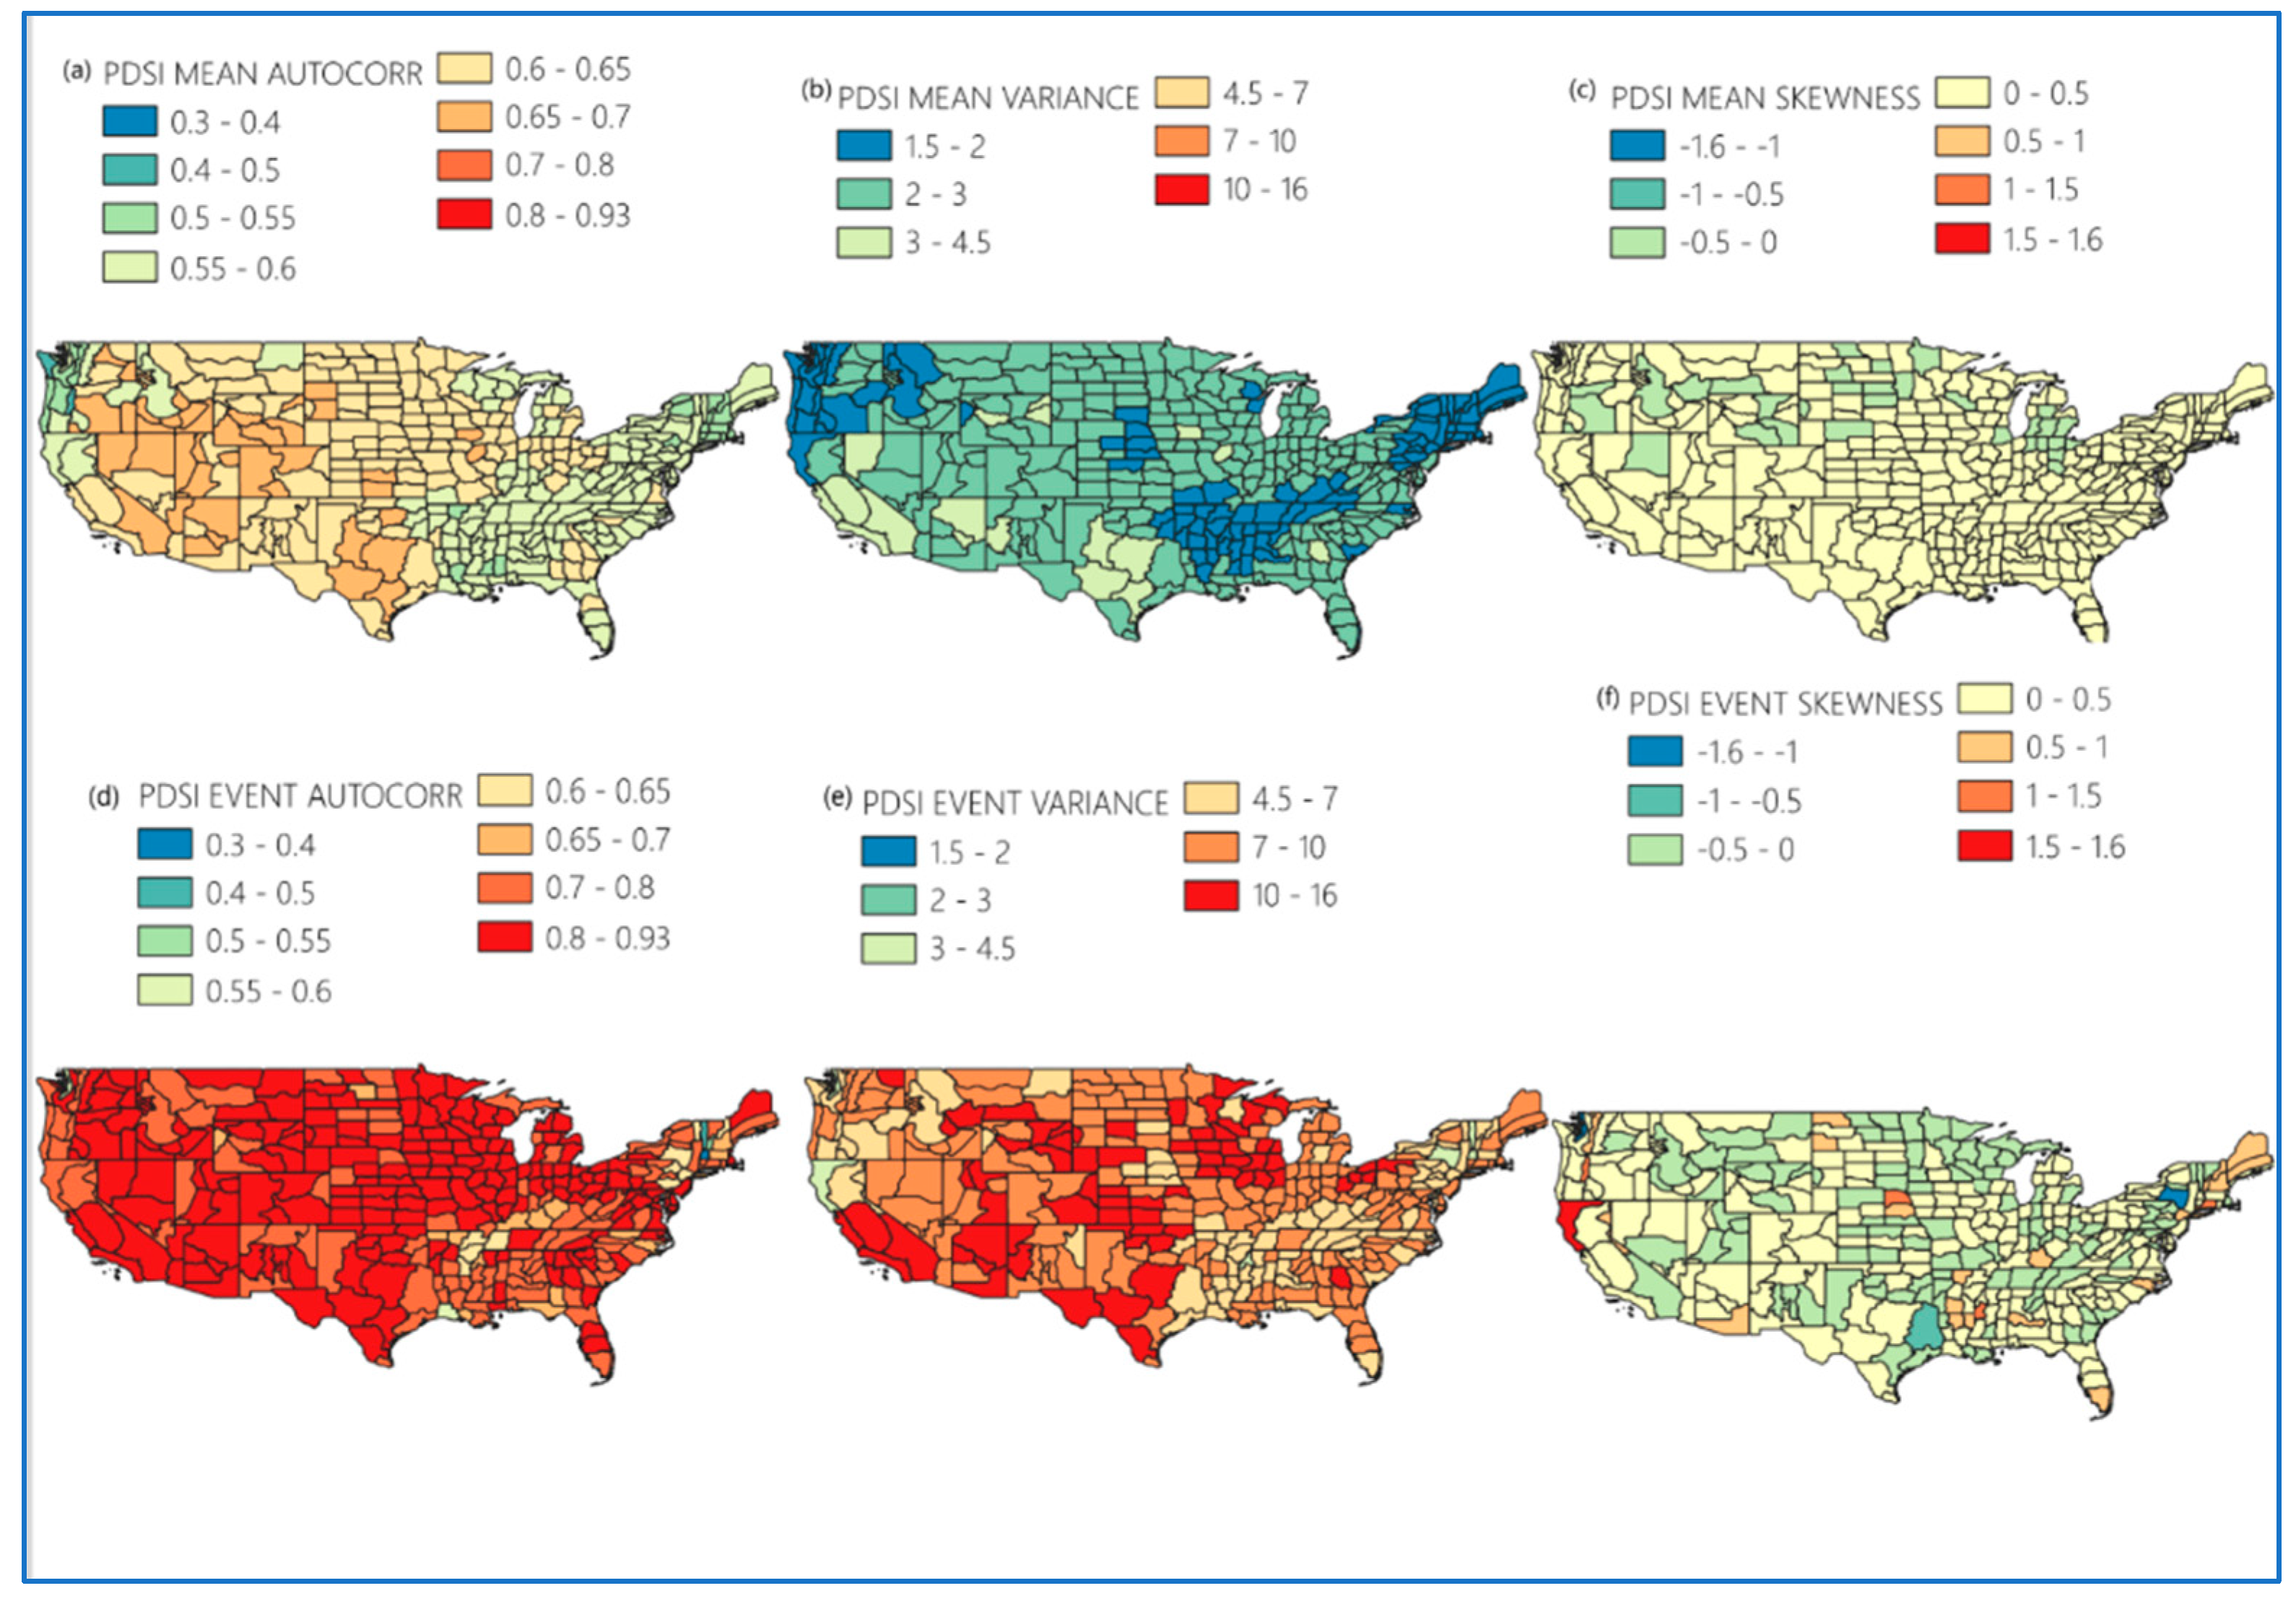
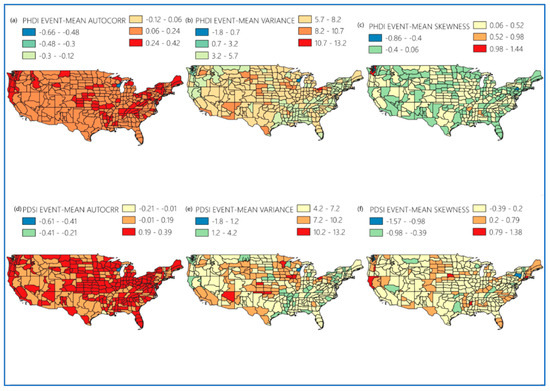
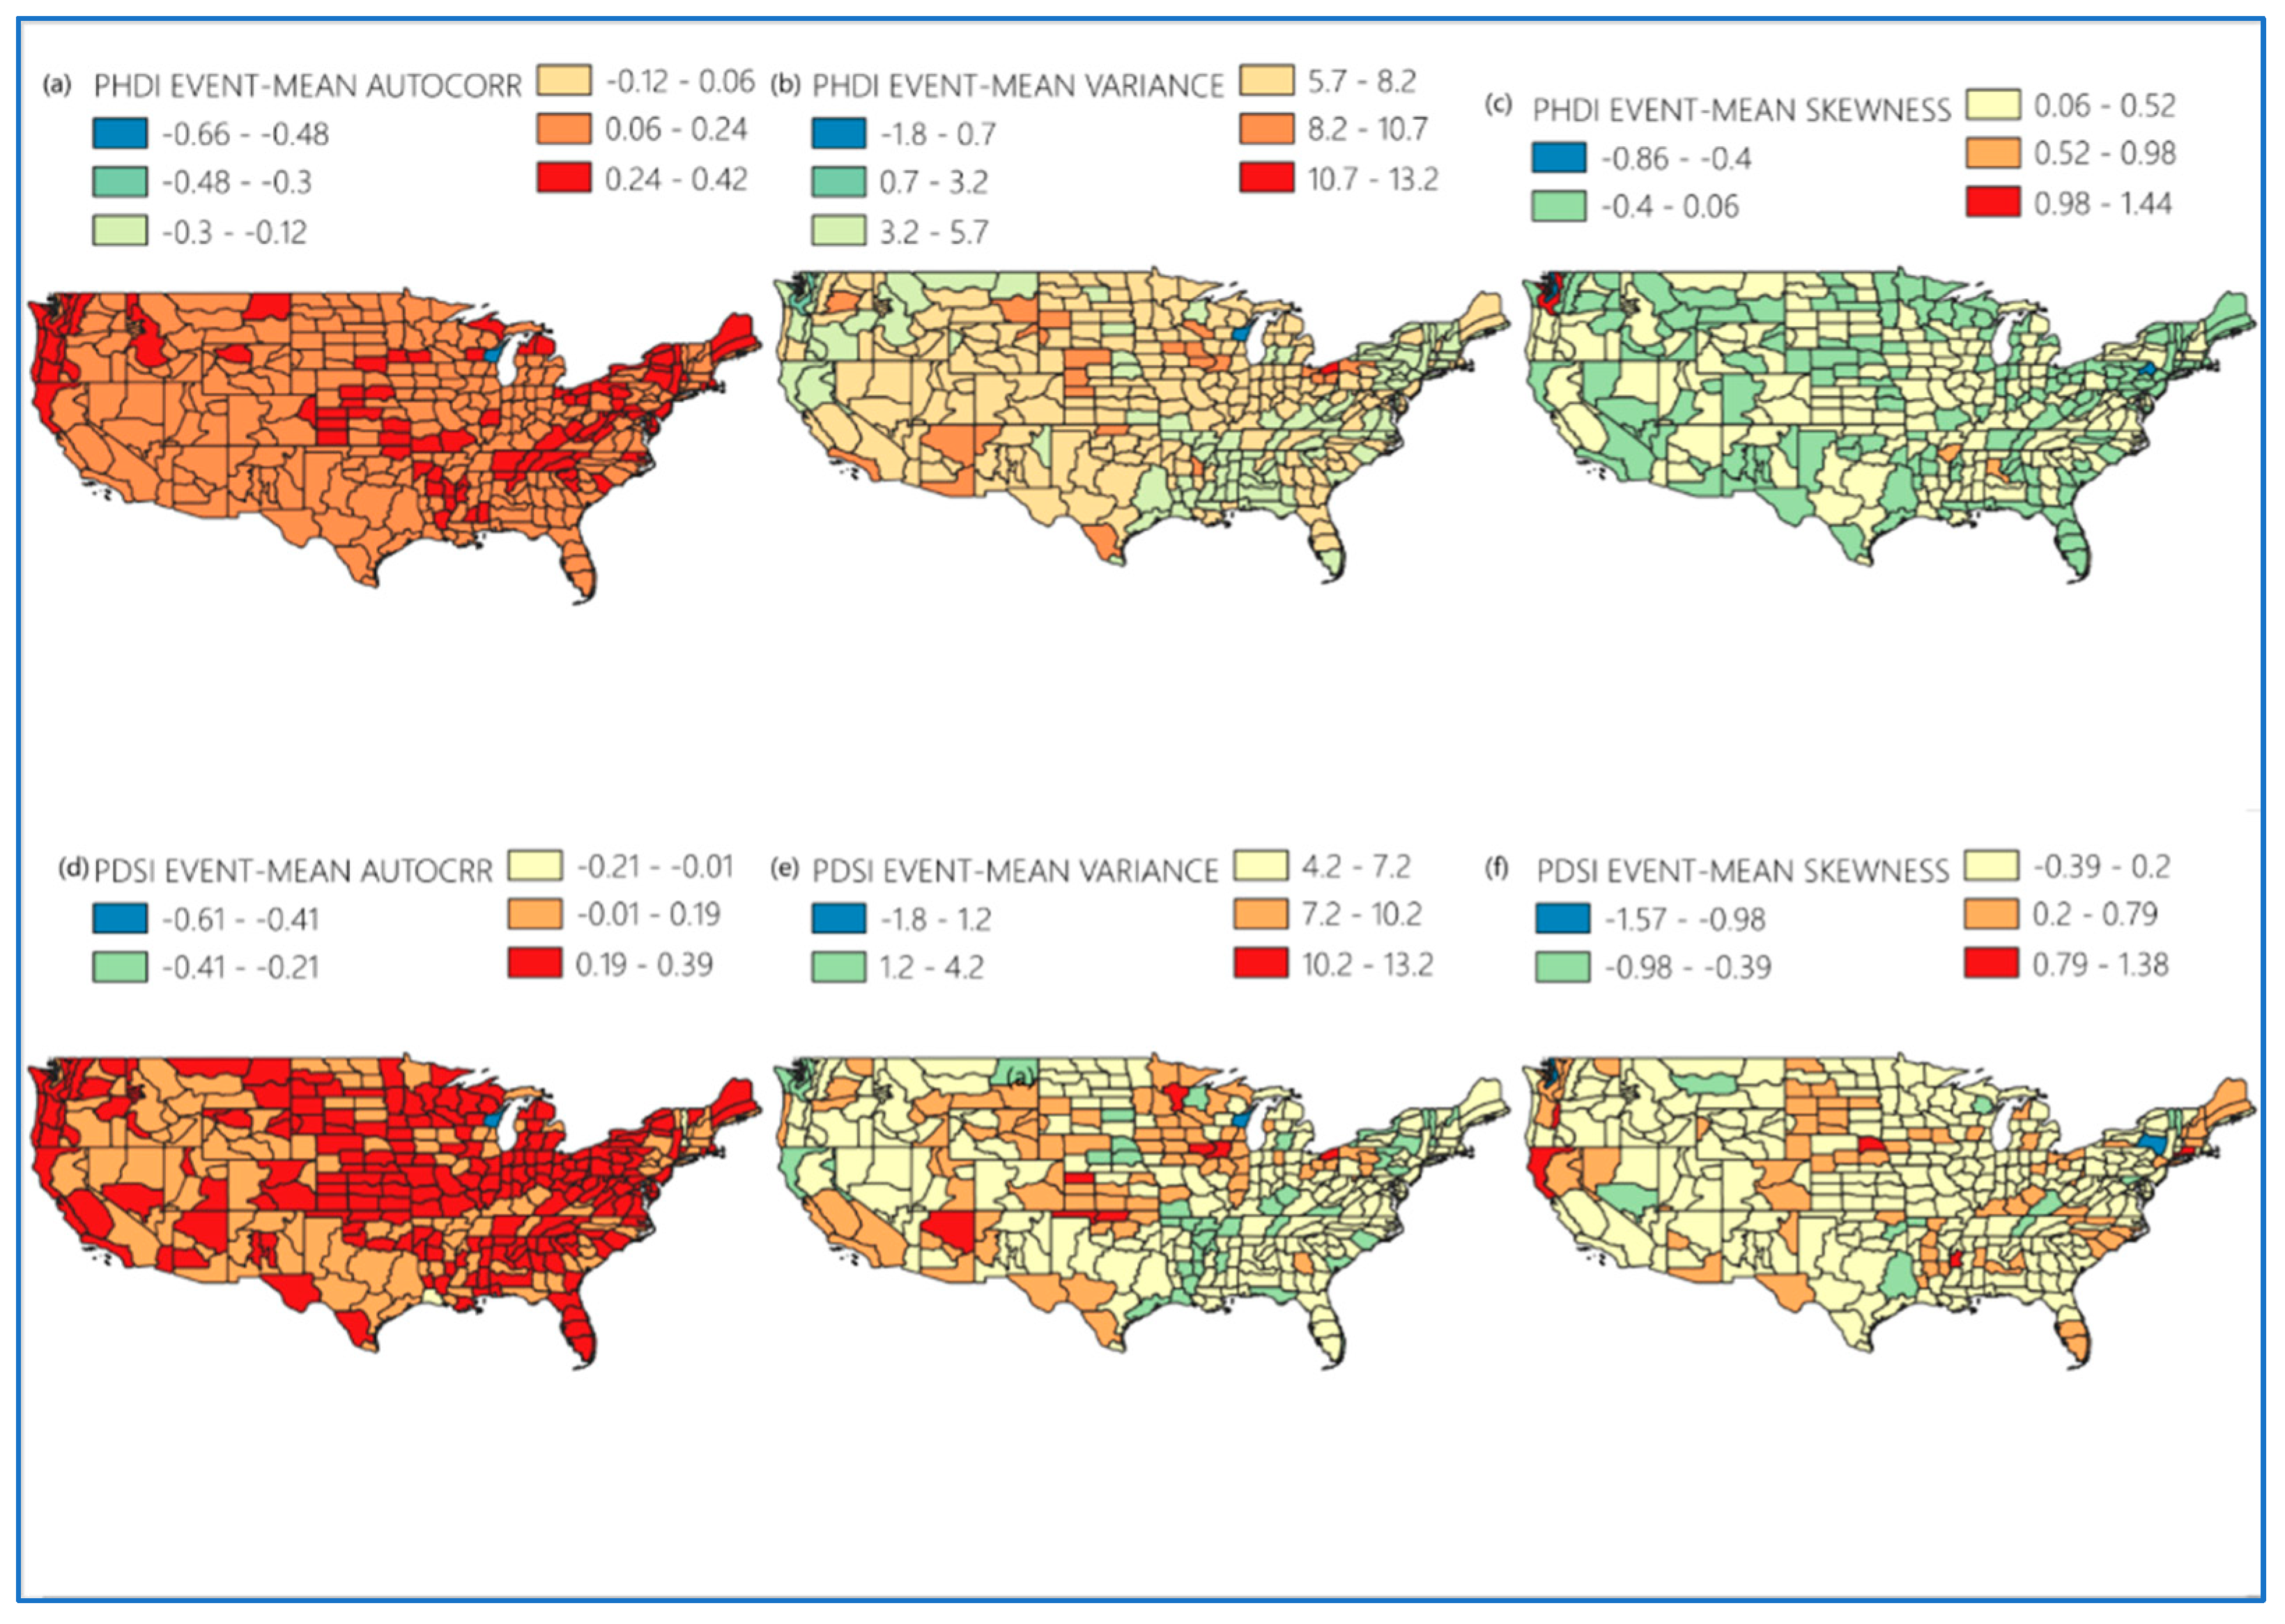
To evaluate the potential of using statistical characteristics for predicting hydrologic whiplash, autocorrelation, variance, and skewness are evaluated for PDSI and PHDI (Figure 3 and Figure 4). For PDSI, for the autocorrelation under mean conditions, there is moderate persistence (0.4–0.7) with higher values in the central and western U.S. (0.6–0.7) and slightly lower values in the southeast (0.55–0.6). During whiplash events, autocorrelation is substantially higher (0.8–0.93) across most of the country, with localized exceptions in Vermont (0.3–0.55). This contrast indicates that whiplash events are not random and instead reflect structured transitions between wet and dry periods. The elevated autocorrelation observed during whiplash windows is consistent with the concept of critical slowing down in complex systems, whereby a system approaching a state transition exhibits increased temporal persistence as it becomes less able to recover quickly from perturbations [13,15,16]. The elevated variance during whiplash periods similarly reflects the amplified hydroclimatic swings that characterize transitions between persistent wet and dry states [10,32,33].
Figure 3.
Spatial distribution of statistical characteristics for PDSI-based drought metrics across the contiguous United States. The top row shows baseline (a) mean autocorrelation, (b) mean variance, and (c) mean skewness. The bottom row shows whiplash event-based (d) autocorrelation, (e) variance, and (f) skewness. Color gradients represent the magnitude of each statistical metric, with warmer colors indicating higher values.
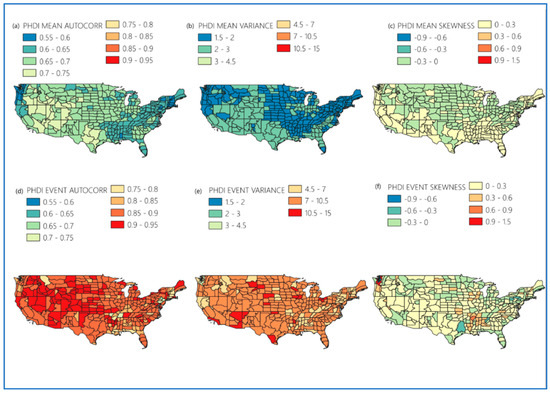
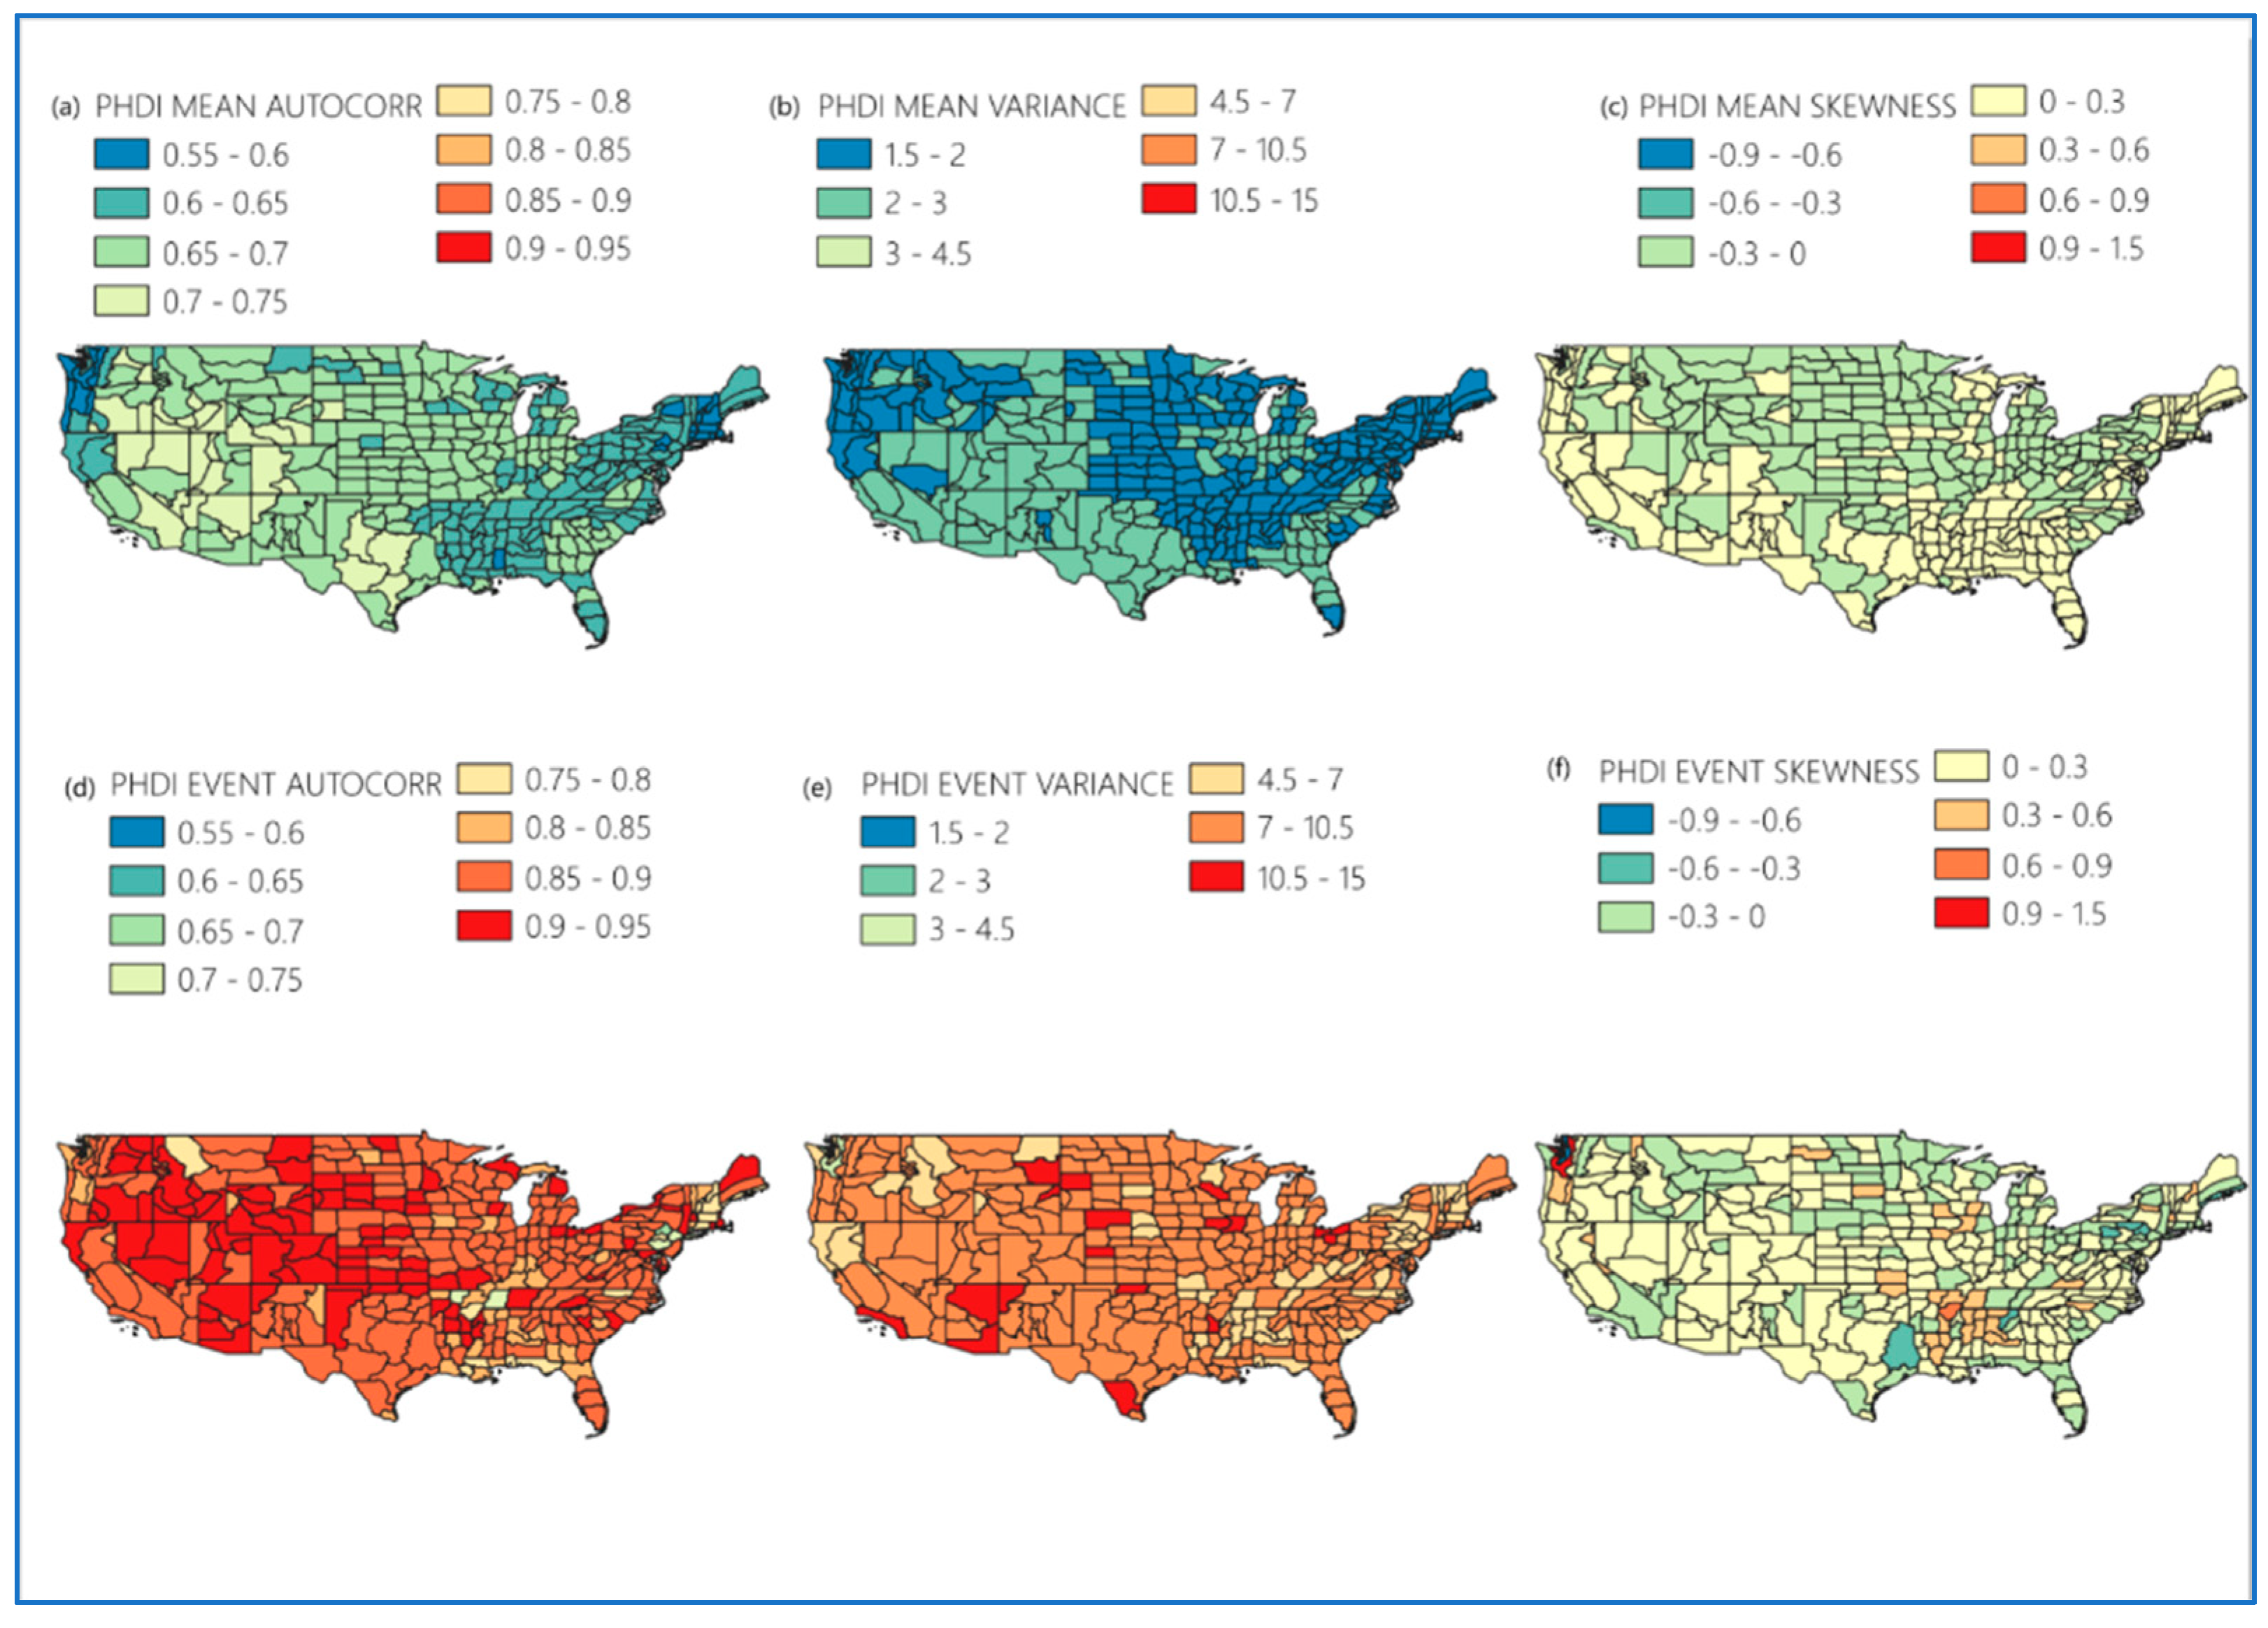
Figure 4.
Spatial distribution of statistical characteristics for PHDI-based drought metrics across the contiguous United States. The top row shows baseline (a) mean autocorrelation, (b) mean variance, and (c) mean skewness. The bottom row shows whiplash event-based (d) autocorrelation, (e) variance, and (f) skewness. Color gradients represent the magnitude of each statistical metric, with warmer colors indicating higher values.
The spatial differences in statistical characteristics between mean and event conditions shown in Figure 3 and Figure 4 are statistically significant across climate divisions. Paired t-tests and Wilcoxon signed-rank tests conducted at the division level confirm significant differences between whiplash and non-whiplash windows for autocorrelation, variance, and skewness under both indices (all p < 0.01), as reported in detail in Section 3.3. The spatial maps reflect systematic and statistically verified differences rather than random variation.
For variance, under mean conditions it is relatively stable (1.5–4.5), while during whiplash events the variance is higher (4.5–16) across most of the U.S, with only portions of California and New York being smaller. This suggests that whiplash periods are characterized by higher hydroclimatic instability and larger deviations from normal conditions. For skewness, there is the smallest difference between mean and event states, with both largely falling within the −0.5–+0.5 range. However, event skewness exhibits greater spread, with outliers in northern California (1.5–1.6) and parts of the eastern U.S., which suggests that whiplash events can introduce extreme wet or dry conditions in certain regions.
For PHDI data (Figure 4), the autocorrelation shows higher (0.80–0.95) values during whiplash events compared to mean conditions (0.55–0.75), reflecting a strong temporal structure during whiplash periods. This suggests that whiplash events represent a buildup and rapid transition between persistent wet and dry states rather than random fluctuations. For variance, mean conditions are stable and spatially uniform (1.5–1.3), while event variance increased (4.5–15), with most regions falling in the 7–10.5 range. This contrast highlights that whiplash events are periods of higher hydroclimatic variability involving more extreme shifts between wet and dry regimes. Finally, the skewness shows the greatest change in spatial variability between mean and event states. Mean skewness is narrow (−0.3–0.3), with northern regions slightly negative and southern regions slightly positive. Event skewness retains a similar broad pattern with notable pockets of high positive (0.9–1.5) and negative (−0.9–−0.6) skewness isolated to the Pacific Northwest and South.
Figure 5 presents a summary of both PHDI and PDSI differences between the whiplash events and overall mean statistical characteristics of autocorrelation, variance, and skewness. Like the findings from Figure 2 and Figure 3, autocorrelation shows the strongest differences, followed by variance and skewness having the least differences. The large changes in autocorrelation could represent a precursor in the systems that indicates the persistence of wet and dry states, and the variance differences may indicate an amplified hydroclimatic variability involving more extreme swings between wet and dry regimes.
Figure 5.
Spatial distribution of whiplash event-minus-mean statistical differences across the contiguous United States. The top row shows PHDI-based differences in (a) autocorrelation, (b) variance, and (c) skewness. The bottom row shows PDSI-based differences in (d) autocorrelation, (e) variance, and (f) skewness. All values represent whiplash event-based metrics minus long-term mean values.
3.3. Distributions of PHDI vs. PDSI Autocorrelation, Variance and Skewness
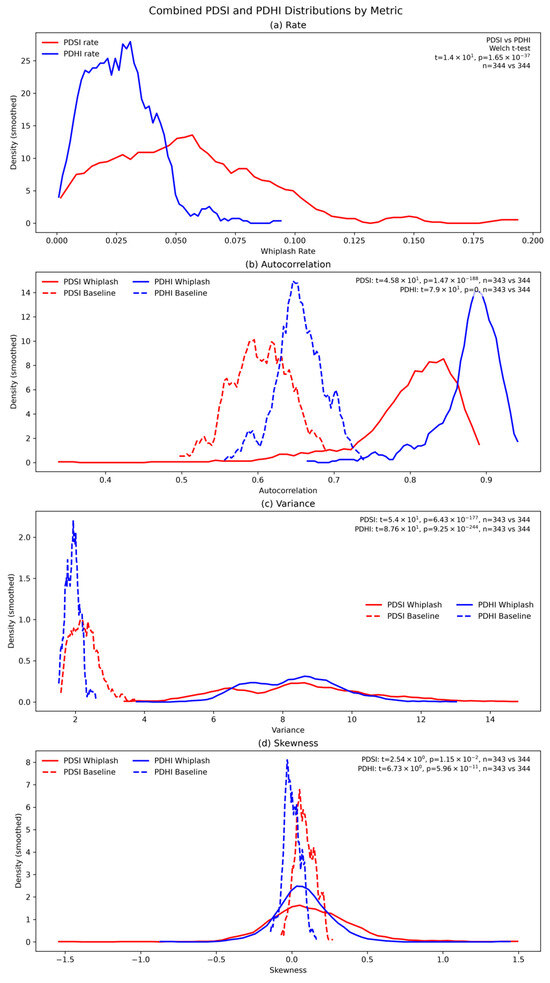
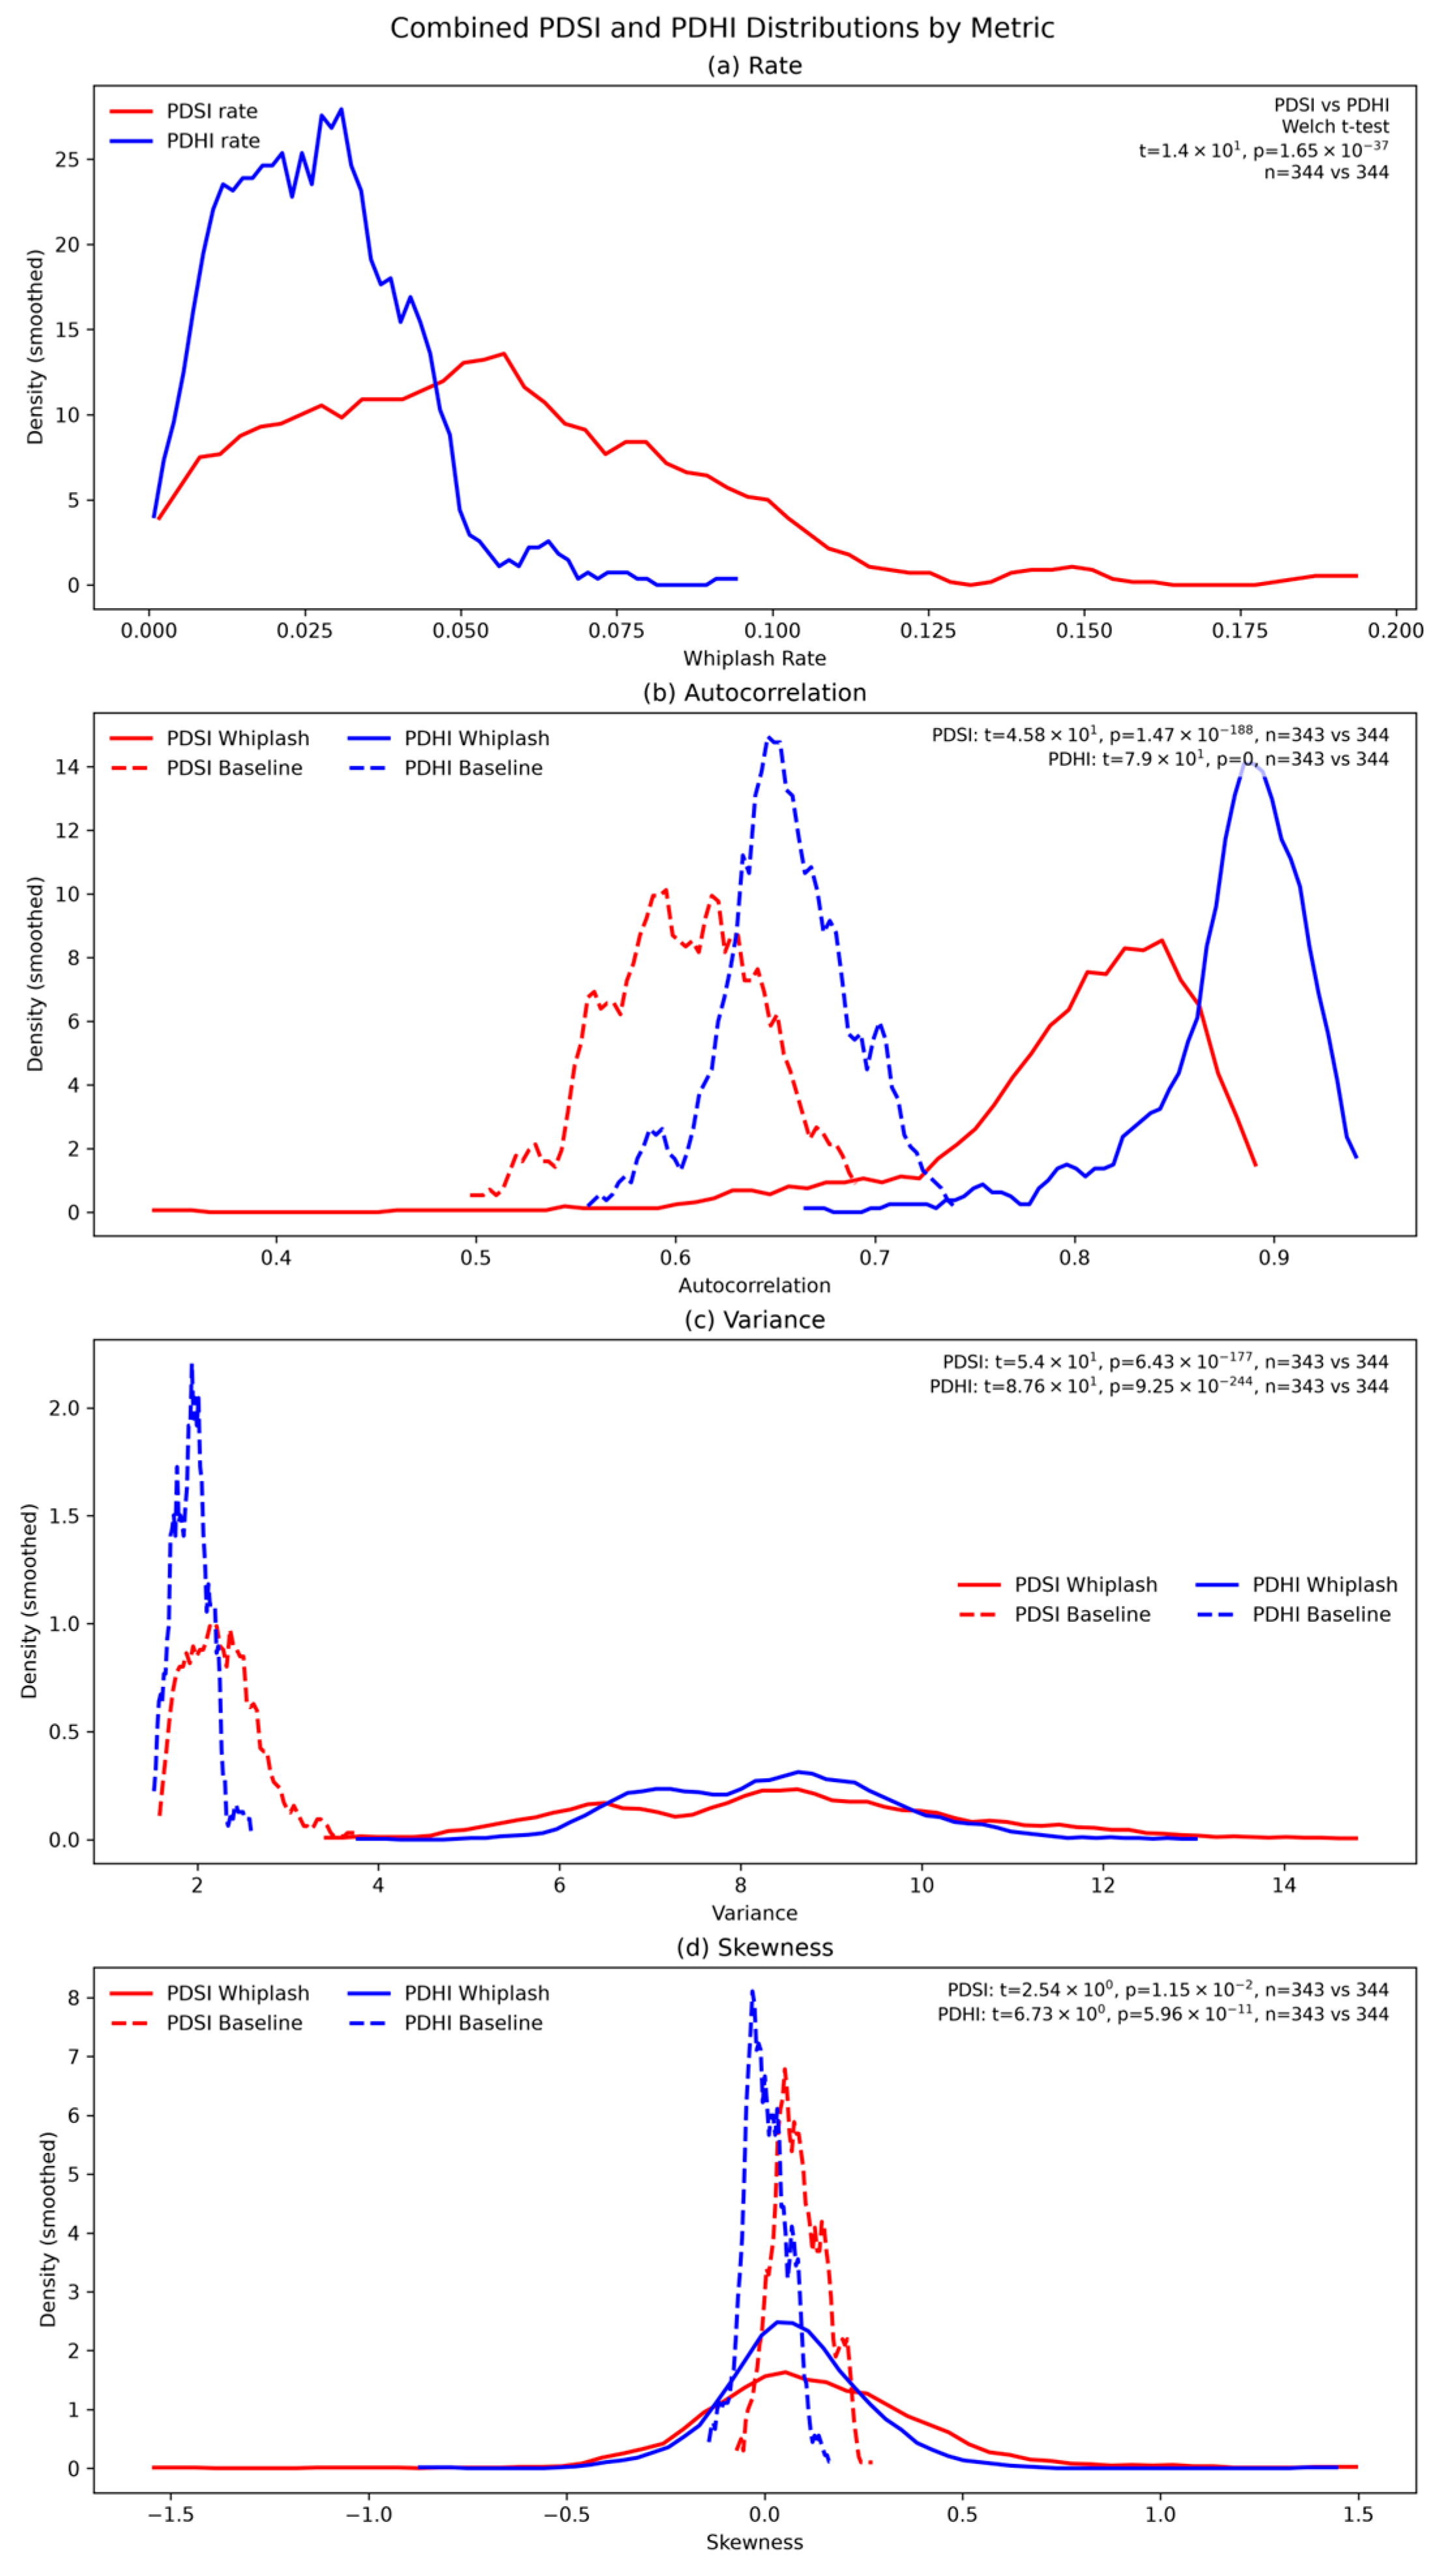
Figure 6 presents the overall distributions of whiplash rates, autocorrelation, variance, and skewness for PDSI and PHDI in the United States. These distributions show shifts in distributions during whiplash events in comparison to the overall mean. For whiplash rates (Figure 6a), PHDI is tightly concentrated at lower values (0.01–0.05), while PDSI is broader and shifted higher (peaking near 0.05–0.06, extending to ~0.18), reflecting PDSI’s greater sensitivity to short-term moisture fluctuations. Both a paired t-test (t = 24.5, p = 3.36 × 10−77) and a Wilcoxon signed-rank test (W = 338, p = 2.32 × 10−56) confirm this significant difference in PDSI and PHDI across 344 climate divisions, and both indices show clear shifts toward higher rates during whiplash periods compared to the overall mean.
Figure 6.
Distribution of whiplash and baseline statistical metrics for PDSI and PHDI across the contiguous United States. The panels show kernel density distributions for whiplash rate (a), autocorrelation (b), variance (c), and skewness (d), comparing PDSI (red) and PHDI (blue) under both whiplash (solid lines) and baseline (dashed lines) conditions. The horizontal axis represents the value of each metric, while the vertical axis shows the smoothed density. Paired t-test and Wilcoxon signed-rank test results are reported.
For autocorrelation (Figure 6b), both indices show higher values during whiplash events than baseline, indicating that rapid transitions occur within strongly persistent hydroclimatic regimes. PHDI whiplash values are tightly concentrated at higher autocorrelation (0.86–0.92) compared to PDSI (0.78–0.88), consistent with PHDI’s stronger hydrologic memory. Baseline values are substantially lower for both indices. Paired t-tests and Wilcoxon signed-rank tests confirm highly significant differences between whiplash and baseline conditions (PDSI: t = 60.6, p = 5.9 × 10−185, W = 127, p = 1.72 × 10−57; PHDI: t = 108, p = 1.9 × 10−266, W = 0, p = 5.65 × 10−58).
For variance (Figure 6c), both indices show higher values during whiplash (PDSI: ~5–14; PHDI: ~6–11) compared to narrow baseline distributions (PDSI: ~2–3.5; PHDI: ~1.8–2.2), confirming that whiplash periods involve significantly amplified hydroclimatic variability. PDSI exhibits a slightly wider spread and longer right tail. Both tests confirm extremely significant differences between whiplash and baseline conditions (PDSI: t = 60.2, p = 3.8 × 10−184, W = 0, p = 5.65 × 10−58; PHDI: t = 93.1, p = 4.63 × 10−245, W = 0, p = 5.65 × 10−58).
For skewness (Figure 6d), both indices show modest positive and negative skew during whiplash periods with broader distributions compared to near-zero baseline values, indicating that whiplash events introduce greater asymmetry into hydroclimatic distributions. PDSI shows a slightly wider and more positively skewed whiplash distribution than PHDI. Statistical differences are significant for both indices under both tests (PDSI: t = 2.83, p = 0.00497, W = 2.43 × 10⁴, p = 0.00499; PHDI: t = 7.29, p = 2.21 × 10⁻¹², W = 1.53 × 10⁴, p = 9.47 × 10⁻¹⁵), though the effect is smaller than for autocorrelation and variance. The agreement between parametric and non-parametric tests across all metrics confirms that findings are robust to the assumption of normality.
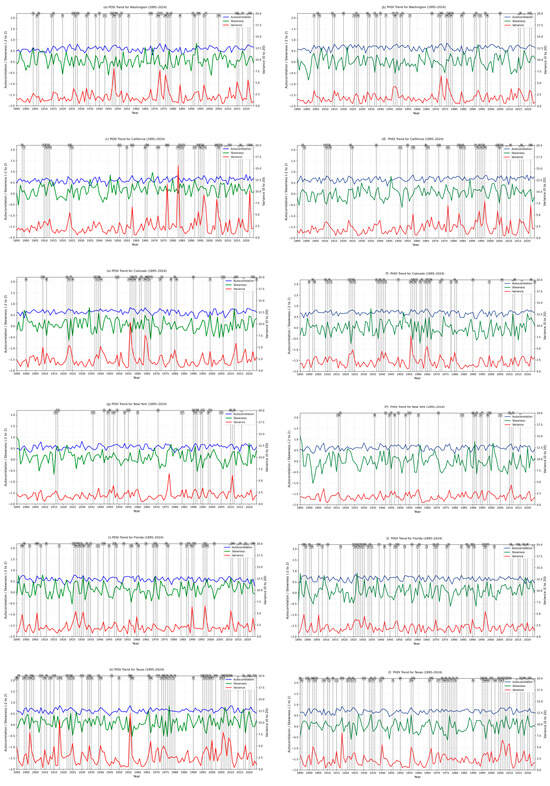
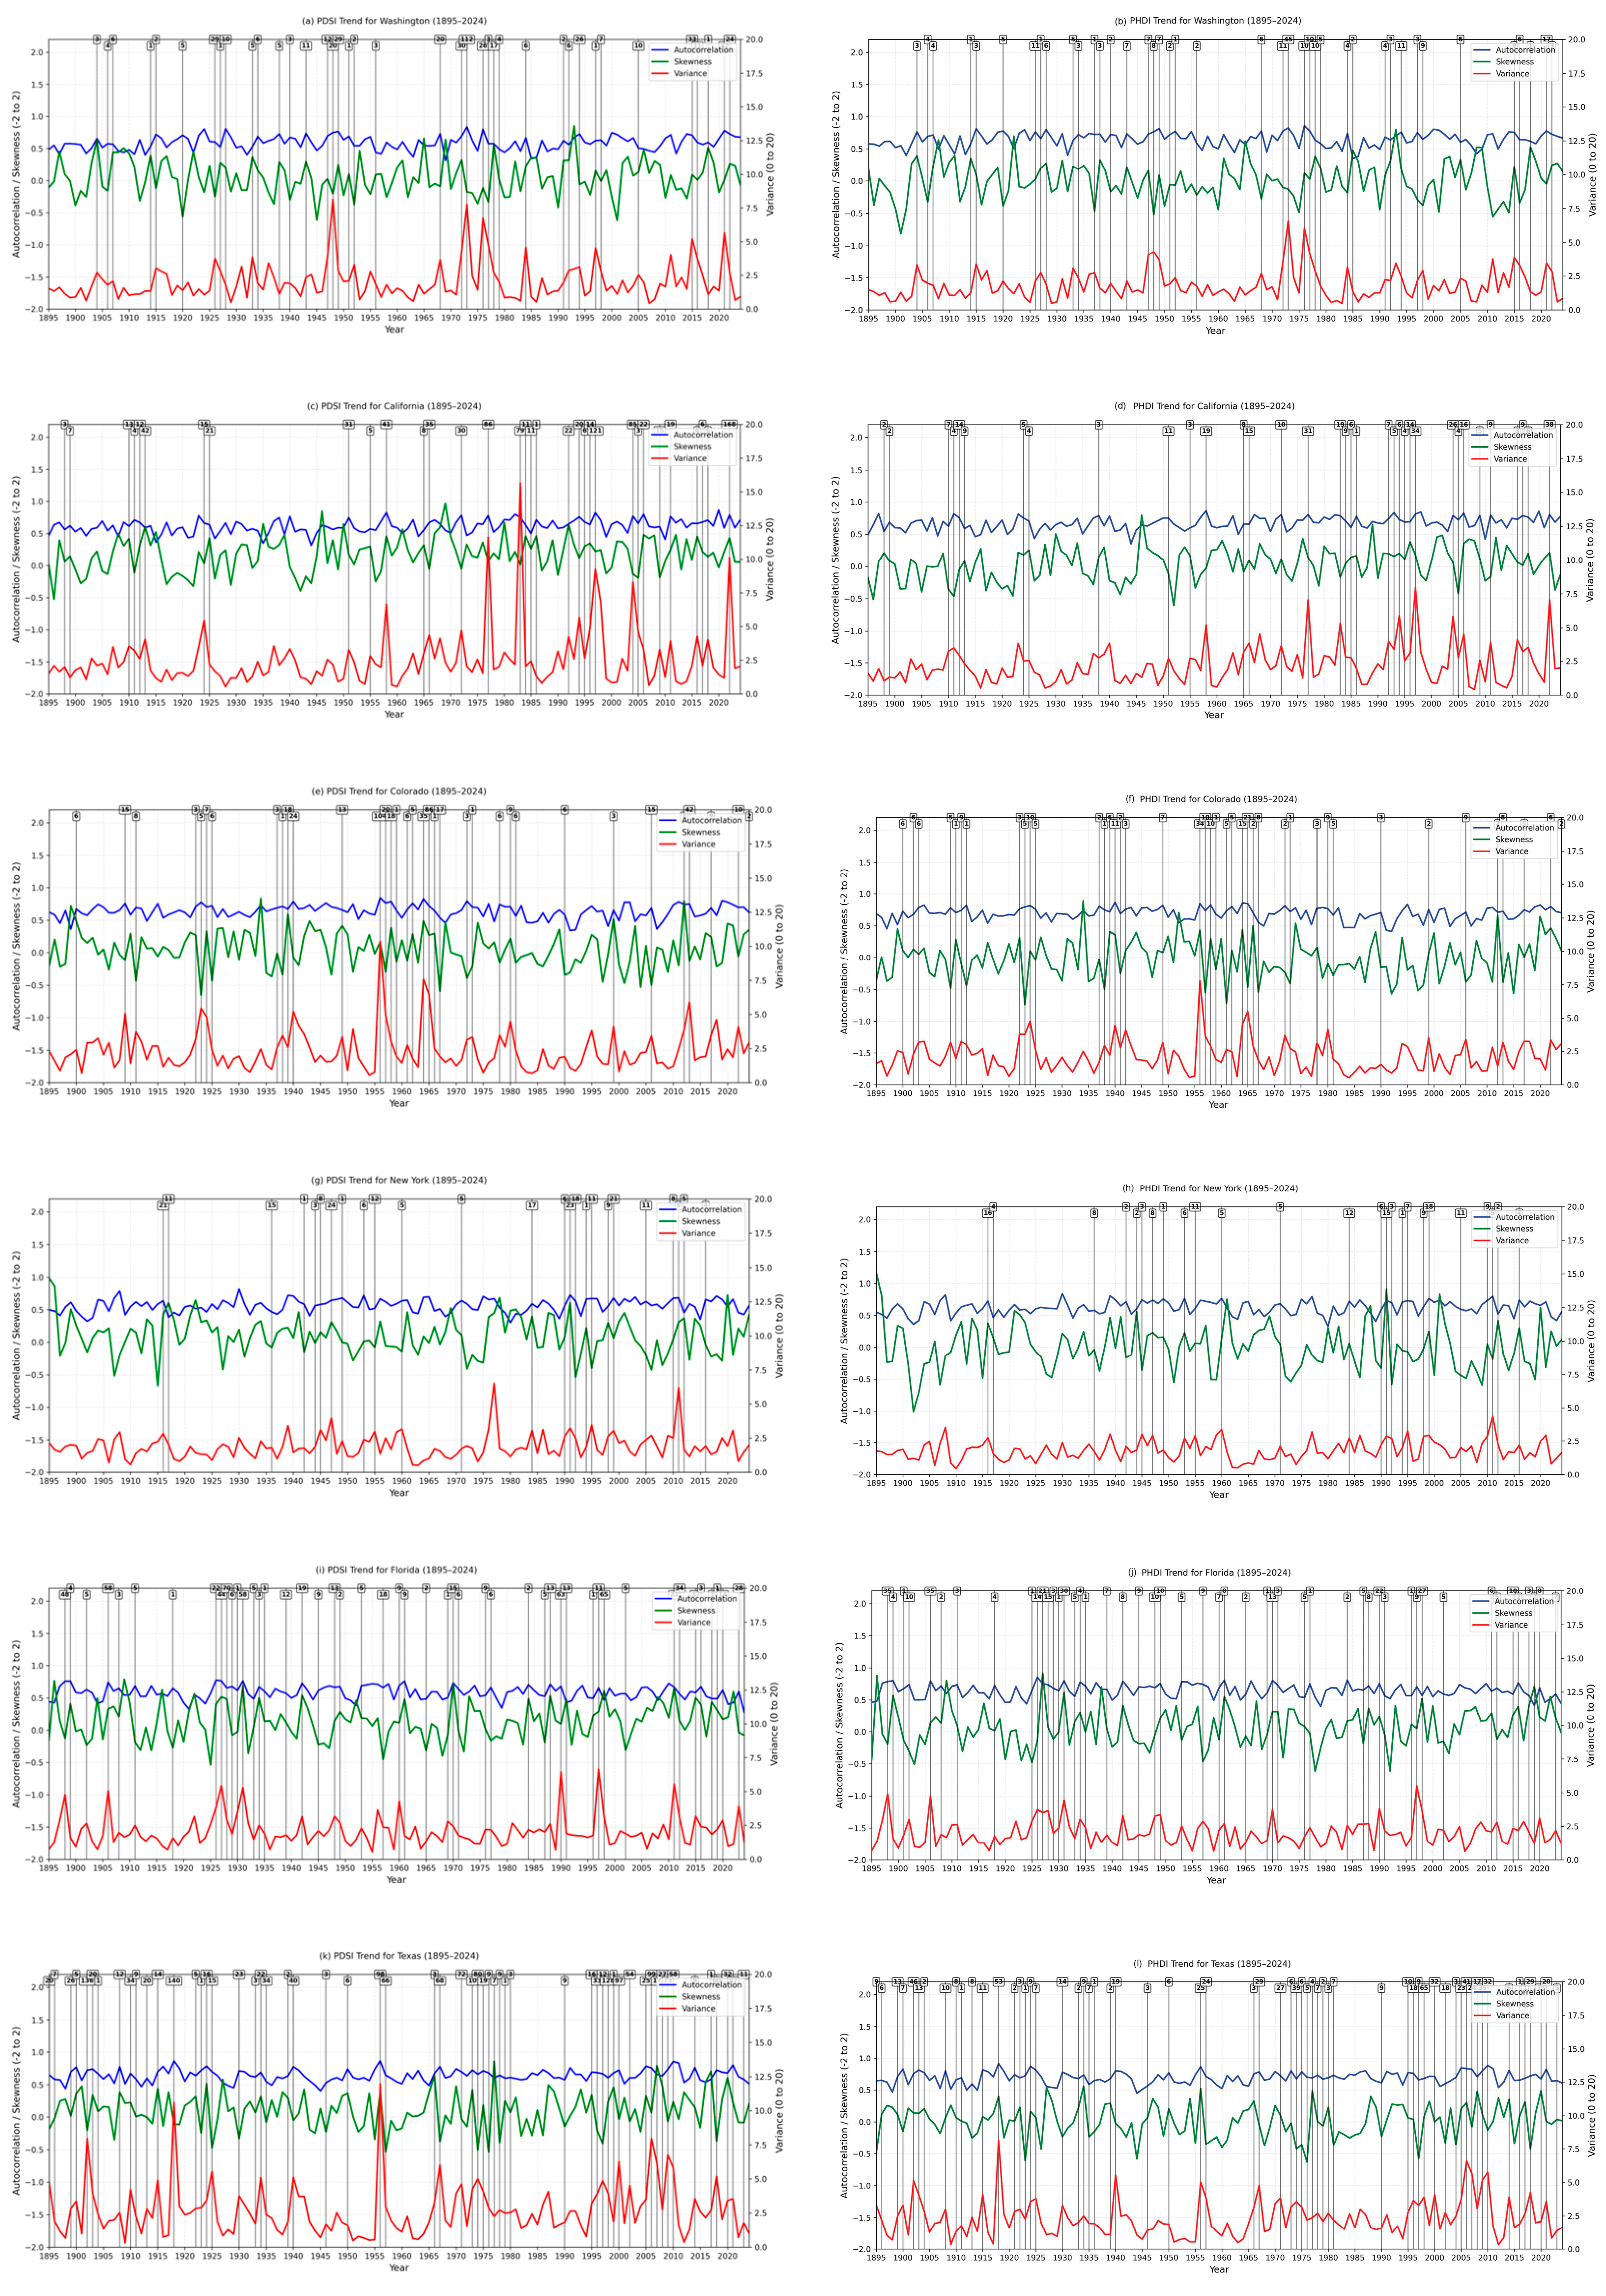
Figure 7 provides the specific statistical measures of autocorrelation, variance, and skewness over time for select states of Washington, California, Colorado, New York, Florida, and Texas from 1895 to 2024. Across all states, autocorrelation remains relatively stable throughout the record (≈0.4–0.8), indicating consistent temporal persistence regardless of event activity. Skewness fluctuations around zero (≈−0.5 to 0.5) with no consistent trends suggest only brief localized asymmetry. In contrast, variance consistently shows distinct spikes that closely align with clusters of whiplash events, making it the primary statistical indicator of whiplash activity across all regions.
Figure 7.
Time series of PDSI- and PHDI-based statistical metrics for (a,b) Washington, (c,d) California, (e,f) Colorado, (g,h) New York, (i,j) Florida, and (k,l) Texas from 1895 to 2024. For each state, autocorrelation (blue), skewness (green), and variance (red) are shown over time, with autocorrelation and skewness plotted on the left axis and variance on the right axis. Black vertical lines indicate years in which whiplash events occurred, and the numbers above each line represent the number of whiplash events identified for that year.
Regional patterns exist among the states, with Texas showing the most frequent and intense variance spikes, particularly from the 1970s onward, while California shows pronounced spikes from the mid-20th century through to recent decades. Colorado and Washington exhibit more episodic spikes concentrated in the mid-20th century, and New York and Florida display more moderate and intermittent variance increases, reflecting relatively stable hydroclimatic systems. There is consistency between PDSI and PHDI temporal patterns across all six states that further supports the robustness of the finding that whiplash events are associated with periods of elevated hydroclimatic variability regardless of index choice [34,35].
4. Discussion
Hydroclimatic whiplash across the contiguous United States shows hotspots in Texas, Southern California, northern Colorado, western New Mexico, and parts of the Midwest. This suggests that whiplash is not uniformly distributed and reflects regional hydroclimatic variability influenced by precipitation regimes and soil moisture dynamics as represented in the indices used in this study [1]. A noteworthy result is that PDSI produces higher whiplash frequency and rate than PHDI. This difference is consistent with the behavior of the PDSI, which responds more rapidly to short-term moisture anomalies. The PHDI reflects longer-term hydrological persistence [10,11,12].
The spatial patterns of whiplash hotspots identified in this study are broadly consistent with findings from recent literature. Li et al. (2025) documented escalating hydrological extremes across all Western U.S. basins post-2015 [1], consistent with the high whiplash rates identified here in Southern California, northern Colorado, and western New Mexico. Similarly, Maharjan et al. (2025) projected future intensification of hydrological extremes across the contiguous United States [21], suggesting that the hotspot regions identified in this study may experience further increases in whiplash frequency under continued warming. The concentration of whiplash activity in Texas aligns with Swain et al. (2025), who identified the south-central United States as a region of particularly high hydroclimate volatility [7]. In terms of methodology, Anderson et al. (2025) highlighted that threshold selection substantially influences drought-to-flood transition detection [6], which is consistent with our finding that PDSI and PHDI produce systematically different whiplash counts due to their differing sensitivity and persistence characteristics. Madrigal et al. (2024) found that Mediterranean regions experienced whiplash in approximately 35% of years [2], a rate notably higher than the division-level rates identified here (PDSI: 0.05–0.18; PHDI: 0.01–0.10), which likely reflects both regional climate differences and methodological differences in whiplash definition and index selection.
Statistically (i.e., using autocorrelation, variance, and skewness), whiplash results differ from baseline conditions. For both indices, whiplash periods are associated with higher variance and increased lag-1 autocorrelation. Elevated variance indicates amplified hydroclimatic fluctuations during the transition period, while increased autocorrelation suggests stronger temporal persistence within these events. These findings align with descriptions of complex systems where increases in variance and autocorrelation may signal reduced system stability or proximity to abrupt transitions [15,16,17].
State-level time series reinforce these relationships and are seen across representative states, like Texas and California, as periods of frequency whiplash that consistently align with higher variance while autocorrelation remains relatively stable. This suggests that whiplash events are primarily associated with increases in variability rather than systematic shifts in persistence. Regions with the most frequent events, particularly Texas and California, also exhibit the largest variance shifts, indicating more intense hydroclimatic instability [7].
There are several limitations to this research. The rolling 12-month window captures transitions occurring within annual timescales but does not evaluate consecutive month-to-month transitions. In addition, results depend on fixed threshold definitions (±3.00), which can influence event counts and spatial patterns [4]. Finally, the climate division scale may smooth localized extremes that limit the ability to resolve finer-scale processes sometimes shown in gridded data [36,37].
5. Conclusions
This study analyzed hydroclimatic whiplash across the contiguous United States using monthly PDSI and PHDI records from NOAA climate divisions spanning 1895–2024. Whiplash was defined as a transition between severe or worse drought and severe or worse wetness within 12-month rolling windows. The results show that whiplash activity is spatially uneven, with hotspots concentrated in Texas, Southern California, northern Colorado, western New Mexico, and parts of Illinois and Iowa.
PDSI produced higher whiplash counts and rates than PHDI, which demonstrated that the choice of drought index affects whiplash detection. This difference likely reflects the greater short-term sensitivity of PDSI compared with the stronger hydrologic persistence represented by PHDI. Whiplash windows were also statistically different from non-whiplash or baseline windows for both indices. Whiplash periods generally showed higher autocorrelation and variance, with variance displaying strong increases during event periods. These findings suggest that whiplash events are associated with periods of amplified hydroclimatic variability and, in some cases, stronger temporal persistence.
The hydroclimatic whiplash hotspots identified in this study, particularly in Texas, Southern California, and the broader western United States, align with regions projected to experience the greatest increases in precipitation whiplash frequency and intensity under continued climate change. Chen et al. (2022) projected increases of 25–60% in whiplash frequency and 30–100% in intensity by the end of the 21st century in semi-arid regions such as western North America [3], suggesting that the patterns documented here may represent an early signal of an accelerating trend. Maharjan et al. (2025) further projected that future intensification of hydrological extremes will increase community vulnerability across the contiguous United States [21], underscoring the urgency of developing robust monitoring and early warning systems for wet–dry transitions. The statistical indicators identified in this study, particularly elevated variance and autocorrelation during the observed whiplash windows, may therefore serve as useful tools for tracking the emergence of climate change-driven hydroclimatic instability over time.
These findings highlight the need for consistent whiplash definitions and multi-index comparisons when assessing drought–flood transition risk. Improved understanding of these transitions is important for water resource planning, agricultural management, and climate adaptation, particularly in regions where rapid shifts between wet and dry conditions are increasing [21,38,39].
Author Contributions
Conceptualization, J.L. and T.C.P.; methodology, J.L. and T.C.P.; software, J.L. and T.C.P.; formal analysis, J.L.; investigation, J.L.; resources, T.C.P.; data curation, J.L.; writing—original draft preparation, J.L. and T.C.P.; writing—review and editing, J.L. and T.C.P.; visualization, J.L.; supervision, T.C.P.; project administration, T.C.P. All authors have read and agreed to the published version of the manuscript.
Funding
This research received external funding from the United States Army Corps of Engineering grant # W912HZ25C0013.
Data Availability Statement
The original data presented in the study are openly available at the National Oceanic and Atmospheric Administration (NOAA) Physical Sciences Laboratory database. (https://psl.noaa.gov/data/usclimdivs/, accessed on 1 June 2025).
Acknowledgments
During the preparation of this study, the authors used Claude 4.5 and NotebookLM Workspace Edition for the purposes of identification of appropriate methods to use in the data analysis and to confirm main highlights from research results (accessed on 1 June 2026). The authors have reviewed and edited the output and take full responsibility for the content of this publication.
Conflicts of Interest
The authors declare no conflicts of interest.
References
- Li, W.; Maharjan, S.; Fisher, J.B.; Piechota, T.; El-Askary, H. Escalating Hydrological Extremes and Whiplashes in the Western U.S.: Challenges for Water Management and Frontline Communities. Earths Future 2025, 13, e2024EF005447. [Google Scholar] [CrossRef] [Scilit]
- Madrigal, C.; Bedri, R.; Piechota, T.; Li, W.; Tootle, G.; El-Askary, H. Water Whiplash in Mediterranean Regions of the World. Water 2024, 16, 450. [Google Scholar] [CrossRef] [Scilit]
- Chen, D.; Norris, J.; Thackeray, C.; Hall, A. Increasing Precipitation Whiplash in Climate Change Hotspots. Environ. Res. Lett. 2022, 17, 124011. [Google Scholar] [CrossRef] [Scilit]
- Loecke, T.D.; Burgin, A.J.; Riveros-Iregui, D.A.; Ward, A.S.; Thomas, S.A.; Davis, C.A.; Clair, M.A.S. Weather Whiplash in Agricultural Regions Drives Deterioration of Water Quality. Biogeochemistry 2017, 133, 7–15. [Google Scholar] [CrossRef] [Scilit]
- Mullens, E.; Engström, J. Drought to Flood to Drought: A Review of Definitions of Precipitation Whiplash Events, What Causes Them and Their Impacts Over the Continental United States. Int. J. Climatol. 2025, 45, e8850. [Google Scholar] [CrossRef] [Scilit]
- Anderson, B.J.; Muñoz-Castro, E.; Tallaksen, L.M.; Matano, A.; Götte, J.; Armitage, R.; Magee, E.; Brunner, M.I. What Is a Drought-to-Flood Transition? Pitfalls and Recommendations for Defining Consecutive Hydrological Extreme Events. Hydrol. Earth Syst. Sci. 2025, 29, 6069–6092. [Google Scholar] [CrossRef] [Scilit]
- Swain, D.L.; Prein, A.F.; Abatzoglou, J.T.; Albano, C.M.; Brunner, M.; Diffenbaugh, N.S.; Singh, D.; Skinner, C.B.; Touma, D. Hydroclimate Volatility on a Warming Earth. Nat. Rev. Earth Environ. 2025, 6, 35–50. [Google Scholar] [CrossRef] [Scilit]
- Kudzin, M.H.; Mrozińska, Z.; Sikora, M.; Żyłła, R. Ecohydrological Pathways of Water Quality Under Climate Change: Nature-Based Solutions for Pollutant Flux Regulation. Water 2026, 18, 347. [Google Scholar] [CrossRef] [Scilit]
- Ficklin, D.L.; Maxwell, J.T.; Letsinger, S.L.; Gholizadeh, H. A Climatic Deconstruction of Recent Drought Trends in the United States. Environ. Res. Lett. 2015, 10, 044009. [Google Scholar] [CrossRef] [Scilit]
- Dai, A. Characteristics and Trends in Various Forms of the Palmer Drought Severity Index during 1900–2008. J. Geophys. Res. Atmos. 2011, 116, D12115. [Google Scholar] [CrossRef] [Scilit]
- Heim, R.R. A Review of Twentieth-Century Drought Indices Used in the United States. Bull. Am. Meteorol. Soc. 2002, 83, 1149–1166. [Google Scholar] [CrossRef] [Scilit]
- Weber, L.; Kkemdirim, L. Palmer’s Drought Indices Revisited. Geogr. Ann. Ser. Phys. Geogr. 1998, 80, 153–172. [Google Scholar] [CrossRef] [Scilit]
- Rayne, S.; Forest, K. Evidence for Increasingly Variable Palmer Drought Severity Index in the United States since 1895. Sci. Total Environ. 2016, 544, 792–796. [Google Scholar] [CrossRef] [Scilit] [PubMed]
- Guttman, N.B. A Sensitivity Analysis of the Palmer Hydrologic Drought Index. J. Am. Water Resour. Assoc. 1991, 27, 797–807. [Google Scholar] [CrossRef] [Scilit]
- Yang, X.; Wang, Z.-H.; Wang, C. Critical Transitions in the Hydrological System: Early-Warning Signals and Network Analysis. Hydrol. Earth Syst. Sci. 2022, 26, 1845–1856. [Google Scholar] [CrossRef] [Scilit]
- Dakos, V.; Scheffer, M.; van Nes, E.H.; Brovkin, V.; Petoukhov, V.; Held, H. Slowing down as an Early Warning Signal for Abrupt Climate Change. Proc. Natl. Acad. Sci. USA 2008, 105, 14308–14312. [Google Scholar] [CrossRef] [Scilit] [PubMed]
- Lenton, T.M. Early Warning of Climate Tipping Points. Nat. Clim. Change 2011, 1, 201–209. [Google Scholar] [CrossRef] [Scilit]
- Krishnamurthy, P.K.R.; Fisher, J.B.; Choularton, R.J.; Kareiva, P.M. Anticipating drought-related food security changes. Nat. Sustain. 2022, 5, 412–420. [Google Scholar] [CrossRef] [Scilit]
- Krishnamurthy, R.P.K.; Fisher, J.B.; Schimel, D.S.; Kareiva, P.M. Applying Tipping Point Theory to Remote Sensing Science to Improve Early Warning Drought Signals for Food Security. Earths Future 2020, 8, e2019EF001456. [Google Scholar] [CrossRef] [Scilit]
- Liang, C.; Zhu, Y.; Lü, H.; Huang, Y.; Xiao, R.; Ding, Y.; Yao, Y.; Li, Y.; Li, Y.; Pei, K.; et al. Drought-Flood Abrupt Alternation in the Huaibei Plain and Its Impacts on Crops. Agric. Water Manag. 2026, 326, 110233. [Google Scholar] [CrossRef] [Scilit]
- Maharjan, S.; Li, W.; Bolten, J.D.; El-Askary, H. The Future Intensification of Hydrological Extremes and Whiplashes in the Contiguous United States Increase Community Vulnerability. Commun. Earth Environ. 2025, 6, 668. [Google Scholar] [CrossRef] [Scilit]
- Palmer, W.C. Meteorological Drought; US Department of Commerce, Weather Bureau: Washington, DC, USA, 1965; Volume 30.
- Sheskin, D.J. Handbook of Parametric and Nonparametric Statistical Procedures; Chapman and Hall/CRC: Boca Raton, FL, USA, 2003. [Google Scholar]
- Wilcoxon, F. Individual Comparisons by Ranking Methods. Biom. Bull. 1945, 1, 80–83. [Google Scholar] [CrossRef] [Scilit]
- O’Donnell, M.; Dee, S.; Doss-Gollin, J.; Muñoz, S.E. Hydrologic whiplash in the Mississippi River basin: Mechanisms and projections. Geophys. Res. Lett. 2026, 53, e2026GL122807. [Google Scholar] [CrossRef] [Scilit]
- Zhou, W.; Leung, L.R.; Lu, J. Seasonally Dependent Future Changes in the U.S. Midwest Hydroclimate and Extremes. J. Clim. 2022, 35, 17–27. [Google Scholar] [CrossRef] [Scilit]
- Swain, D.L.; Wing, O.E.; Bates, P.D.; Done, J.M.; Johnson, K.A.; Cameron, D.R. Increased flood exposure due to climate change and population growth in the United States. Earth’s Future 2020, 8, e2020EF001778. [Google Scholar] [CrossRef] [Scilit]
- Sánchez-Murillo, R.; Birkel, C.; Gimeno, L.; Mejía-González, M.A.; Herrera, D.A.; Kirchheim, R.; Gastmans, D. Rapid Drought-to-Flood Weather Whiplash Amplifies Climate Change Governance Failure. Nat. Water 2026, 4, 1–4. [Google Scholar] [CrossRef] [Scilit]
- Yoon, J.-H.; Wang, S.-Y.S.; Lo, M.-H.; Wu, W.-Y. Concurrent Increases in Wet and Dry Extremes Projected in Texas and Combined Effects on Groundwater. Environ. Res. Lett. 2018, 13, 054002. [Google Scholar] [CrossRef] [Scilit]
- Swain, D.L.; Langenbrunner, B.; Neelin, J.D.; Hall, A. Increasing Precipitation Volatility in Twenty-First-Century California. Nat. Clim. Change 2018, 8, 427–433. [Google Scholar] [CrossRef] [Scilit]
- Stuecker, M.F.; Zhao, S.; Timmermann, A.; Ghosh, R.; Semmler, T.; Lee, S.-S.; Moon, J.-Y.; Jin, F.-F.; Jung, T. Global Climate Mode Resonance Due to Rapidly Intensifying El Niño-Southern Oscillation. Nat. Commun. 2025, 16, 9013. [Google Scholar] [CrossRef] [Scilit] [PubMed]
- Lenton, T.M.; Livina, V.N.; Dakos, V.; Van Nes, E.H.; Scheffer, M. Early Warning of Climate Tipping Points from Critical Slowing down: Comparing Methods to Improve Robustness. Philos. Trans. A Math. Phys. Eng. Sci. 2012, 370, 1185–1204. [Google Scholar] [CrossRef] [Scilit] [PubMed]
- Poveda, G. Critical slowing down reveals hydrologic resilience loss across Amazon sub-basins. Water Resour. Res. 2026, 62, e2025WR040039. [Google Scholar]
- Dakos, V.; Boulton, C.A.; Buxton, J.E.; Abrams, J.F.; Arellano-Nava, B.; Armstrong McKay, D.I.; Bathiany, S.; Blaschke, L.; Boers, N.; Dylewsky, D.; et al. Tipping Point Detection and Early Warnings in Climate, Ecological, and Human Systems. Earth Syst. Dyn. 2024, 15, 1117–1135. [Google Scholar] [CrossRef] [Scilit]
- Carpenter, S.R.; Brock, W.A. Rising Variance: A Leading Indicator of Ecological Transition. Ecol. Lett. 2006, 9, 311–318. [Google Scholar] [CrossRef] [Scilit] [PubMed]
- Spade, D.; de Beurs, K.; Shafer, M. Major Over- and Underestimation of Drought Found in NOAA’s Climate Divisional SPI Dataset. J. Appl. Meteorol. Climatol. 2020, 59, 1469–1480. [Google Scholar] [CrossRef] [Scilit]
- Mardian, J. The Role of Spatial Scale in Drought Monitoring and Early Warning Systems: A Review. Environ. Rev. 2022, 30, 438–459. [Google Scholar] [CrossRef] [Scilit]
- Hammond, J.; Anderson, B.; Simeone, C.; Brunner, M.; Muñoz-Castro, E.; Archfield, S.; Magee, E.; Armitage, R. Hydrological Whiplash: Highlighting the Need for Better Understanding and Quantification of Sub-Seasonal Hydrological Extreme Transitions. Hydrol. Process. 2025, 39, e70113. [Google Scholar] [CrossRef] [Scilit]
- Facincani Dourado, G.; Rheinheimer, D.E.; Abaztoglou, J.T.; Viers, J.H. Stress Testing California’s Hydroclimatic Whiplash: Potential Challenges, Trade-Offs and Adaptations in Water Management and Hydropower Generation. Water Resour. Res. 2024, 60, e2023WR035966. [Google Scholar] [CrossRef] [Scilit]

Disclaimer/Publisher’s Note: The statements, opinions and data contained in all publications are solely those of the individual author(s) and contributor(s) and not of MDPI and/or the editor(s). MDPI and/or the editor(s) disclaim responsibility for any injury to people or property resulting from any ideas, methods, instructions or products referred to in the content. |
© 2026 by the authors. Licensee MDPI, Basel, Switzerland. This article is an open access article distributed under the terms and conditions of the Creative Commons Attribution (CC BY) license.