


Abstract
Local scour and vortex-induced vibrations around cylindrical structures in curved channels pose significant risks to the safety and stability of critical hydraulic infrastructure, such as bridge piers. To address these engineering challenges and elucidate the underlying flow mechanisms, this study conducts numerical simulations of flow past two side-by-side circular cylinders of equal diameter in a curved channel under subcritical conditions at Re = 3900, using the Realizable kε turbulence model. Spectral Proper Orthogonal Decomposition (SPOD) is introduced to quantitatively characterize the energy distribution and dominant coherent structures. Taking the spacing ratio L/D and the placement angle α as key design parameters, the flow field characteristics, modal energy distribution, and coherent structure evolution are systematically investigated for two side-by-side cylinders in three-dimensional straight and curved channels. The numerical results show that, in the straight channel, as L/D increases from 2 to 4, the flow field evolves from strong coupled interference to weak interaction. The vortex shedding frequency structure evolves from a single dominant frequency to a multi-frequency distribution with rich harmonic components, indicating a transition in wake dynamics from energy concentration to multimodal dispersion, accompanied by a significant improvement in flow stability. Under curved channel conditions, the results reveal an asymmetric flow field caused by pronounced energy concentration on the inner side of the channel. SPOD analysis further indicates that as the placement angle α increases from 30° to 90°, the modal energy distribution changes from concentrated to dispersed, the frequency spectrum broadens with enhanced harmonic components, and flow instability gradually intensifies. Overall, the spacing ratio L/D mainly governs the wake-interference pattern, whereas the placement angle α regulates the frequency structure and energy distribution. Among all the cases investigated, relatively favorable flow stability is achieved at L/D = 4 and α = 30°. The SPOD-derived modal energy distributions show that the streamwise fluctuation length of the dominant-mode energy is approximately 0.25 m at α = 30°, compared with 0.5 m at α = 90°, with the energy bandwidth nearly doubling. The combined CFD-SPOD approach effectively captures energy evolution and coherent structure characteristics of complex flows across spatial, temporal, and spectral dimensions. This enables a shift from conventional flow-field description to frequency-based mechanism analysis and provides a theoretical basis for structural layout optimization and scour protection in hydraulic engineering.
1. Introduction
Flow around curved channels is commonly encountered in engineering applications, including bridges, buildings, and hydraulic structures. In particular, when piers, pile foundations or other cylindrical structures are installed in curved sections [1], the combined effects of inertia and centrifugal forces easily give rise to asymmetric flow distributions, complex vortex shedding and wake interactions. These flow phenomena may significantly increase the risk of structural vibration and local scour, thereby compromising the safety and stability of engineering structures [2]. In hydraulic systems such as natural rivers, sluices and spillways, flow in curved sections [3] often induces strong vortical motions and localized high-velocity regions, which can further aggravate structural erosion and even trigger flow-induced resonance [4]. Therefore, clarifying the flow structures and their evolution in multi-cylinder configurations within curved channels is of considerable importance for optimizing engineering design and ensuring safe operation.
In recent years, extensive numerical studies have been conducted on flow around cylindrical structures, with particular emphasis on multi-cylinder interactions, turbulence modeling, and the underlying flow mechanisms. Tong [5] investigated flow patterns around multiple cylinders with different arrangements, spacing ratios, and diameter ratios. Lin [6] examined the flow characteristics and interference effects of two-dimensional side-by-side cylinders at various spacing ratios and identified both in-phase and anti-phase synchronized wake modes. Yokoi [7] experimentally studied side-by-side cylinders with unequal diameters and revealed how the mean vortex-shedding frequency varies with the spacing ratio. Yu and Neville [8,9] numerically investigated the flow around three-dimensional side-by-side cylinders with unequal diameters and characterized the vortex-shedding behavior in their wakes. Fezai [10] numerically examined the flow around square cylinders arranged in an equilateral triangular configuration, analyzing the effects of cylinder size, Reynolds number, and arrangement on aerodynamic forces. Qi [11] investigated the gap-flow characteristics between two circular cylinders near a wall and analyzed the turbulent structures in the wake region. Taken together, these studies suggest that the spacing ratio plays an important role in determining the turbulent flow characteristics near the cylinder walls and in the evolution of vortex structures.
For side-by-side dual-cylinder configurations, extensive research has been conducted on numerical methods and turbulence models. Sadasivan [12] numerically investigated flow around side-by-side cylinders and vortex-induced vibrations, demonstrating that their approach can accurately capture narrow-wake patterns and revealing the significant effects of spacing ratio on wake dynamics and vibration responses. Chen [13] performed three-dimensional direct numerical simulations (DNS) of two side-by-side circular cylinders at intermediate spacing ratios. Their results showed that the incoming flow velocity substantially alters the flow regime and highlighted the role of three-dimensional vortex interactions in governing wake coherence and evolution. Pang [14] developed a numerical model for flow around two cylinders based on the Lagrangian vortex method and showed that the model can accurately identify both wide- and narrow-wake modes. Simone Martini [15] employed the Unsteady Reynolds-Averaged Navier–Stokes (URANS) approach to conduct two- and three-dimensional simulations at a subcritical Reynolds number (Re). The results indicated that flow three-dimensionality becomes more pronounced in the transition regions between different wake branches. Palkin [16] systematically evaluated the performance of the URANS approach coupled with the Reynolds Stress Model (RSM) for predicting subcritical flow around a circular cylinder. Their results showed that the method can accurately capture the mean flow field for Re values ranging from 3 × 10³ to 1.4 × 10⁴, with predictions in good agreement with large eddy simulation (LES) results and experimental measurements. Kim [17] developed a neural-network-based subgrid-scale model for large eddy simulation and demonstrated that it can accurately capture the key turbulent features of flow past a circular cylinder at Re = 3900, while maintaining good robustness under varying conditions. Zeng [18] investigated flow past dual circular cylinders at a subcritical Reynolds number using large eddy simulation, showing that an increase in spacing ratio leads to distinct wake regimes and a vortex-shedding phase lag that increases approximately linearly with spacing.
In addition to studies on multi-cylinder flows, several researchers have investigated the fundamental mechanisms of curved-channel flow. Numerical simulations were conducted in Ref. [19] to examine the effects of bend geometry on the hydraulic characteristics of curved open-channel flumes. Chang [20] performed two-dimensional flow-field predictions for near-wall single, tandem, and side-by-side cylinders, focusing on the effects of gap ratio and spacing ratio on the physical characteristics of the near-wall flow field. Verma and Ahmad [21] investigated flow around bridge piers in curved channels and showed that the coupling between channel curvature and pier diameter has a significant influence on flow structures.
Despite extensive research on side-by-side cylinder flows, most existing studies have been conducted under idealized straight-channel conditions. While these works have thoroughly investigated the effects of spacing ratio, wake patterns, lift/drag characteristics, and vortex shedding behaviors [5,6,7,8,9,10,11,12,13,14,15,16,17,18], they are inherently limited in scope. They do not account for the complex coupling effects of channel curvature, centrifugal force, and secondary flow, and their findings cannot be directly applied to the more realistic and complex environments of curved channels.
In contrast, studies on flows in curved channels have primarily focused on macroscopic hydraulic characteristics, such as velocity distribution, sediment transport, and turbulent kinetic energy [19,20,21,22,23]. For example, previous work has examined the influence of bend geometry on flow behavior and the interactions between bend curvature and bridge piers. However, these studies lack an in-depth analysis of three-dimensional vortex evolution, wake interactions, and coherent structures around side-by-side cylinders. The specific effects of bend geometry on vortex dynamics and wake coherence remain poorly understood.
Furthermore, previous studies, whether in straight or curved channels, have relied heavily on traditional analysis methods, such as vorticity contours, velocity fields, and lift/drag coefficients. These methods provide only qualitative descriptions of flow evolution and cannot quantitatively characterize the coupled spatial–temporal–spectral energy evolution mechanisms of complex turbulent wakes.
In light of the above issues, there is an urgent need for flow-field analysis methods to move beyond conventional descriptions based on spatiotemporal structures toward quantitative characterization based on frequency–energy coupling. Existing data-driven modal decomposition methods, such as proper orthogonal decomposition (POD) and dynamic mode decomposition (DMD), have been widely used for low-dimensional flow-field representation and coherent-structure identification [24,25]; however, they remain limited in their ability to simultaneously characterize frequency features and coherent structures. Spectral Proper Orthogonal Decomposition (SPOD) performs frequency-domain decomposition of time-resolved snapshot data to extract spatially coherent flow structures at specific frequencies, thereby effectively overcoming the limitations of POD and DMD. For example, Sieber [26,27] applied SPOD to swirling combustor flows using high-speed PIV data, successfully decoupling coherent structures in space and time and revealing the associated thermal-dissipation fluctuations and low-frequency modal characteristics. In multi-cylinder systems, modal decomposition has commonly been used to analyze the aerodynamic performance of dual cylinders and their responses to variations in spacing ratio. Nevertheless, these approaches remain relatively limited and cannot fully characterize the complex turbulent structures in cylinder wakes. Therefore, applying SPOD to analyze the flow field around dual cylinders in a curved channel can help reveal, at a fundamental level, the energy distribution and evolution mechanisms of the dominant modes in complex curved-channel flow.
In summary, research on side-by-side dual cylinders in curved channels remains limited. The flow mechanisms governing dual-cylinder flow in curved channels, particularly the effects of cylinder spacing ratio, arrangement angle, and channel curvature, are still not fully understood. Therefore, this study employs the URANS model to perform numerical simulations of side-by-side dual cylinders in a three-dimensional curved channel. In addition, SPOD is used to investigate the characteristics and evolution mechanisms of the wake flow structures, with the aim of providing a reference for drag-reduction studies in hydraulic engineering. The specific research framework of this paper is organized as follows. Section 2 presents the fundamental methodology for the numerical simulations. Section 3 performs a grid-independence verification based on a straight-channel single-cylinder model to determine an appropriate grid resolution. Section 4 uses the straight-channel dual-cylinder configuration as a reference and focuses on the flow-field characteristics of dual cylinders in a curved channel under different operating conditions. Furthermore, SPOD is applied to conduct an in-depth spectral analysis of instantaneous flow-field snapshots, with the aim of revealing the energy distribution and modal evolution mechanisms. Finally, based on the analysis results, the relatively favorable configuration of dual cylinders in the curved channel is identified, and the main conclusions are presented.
2. Mathematical Model
2.1. k–ε Model for Navier–Stokes Equation
For an incompressible fluid without heat transfer, the energy equation is neglected, and the flow is governed by the continuity and momentum equations:
Here, i, j = 1, 2, 3 denote the three directions in the Cartesian coordinate system; where ui and uj are the velocity components in the i and j directions; P is the fluid pressure; υ is the kinematic viscosity; υt is turbulent kinematic viscosity; ρ is the fluid density; and fi represents external forces.
For flow problems in hydraulic engineering, the flow characteristics are primarily dominated by large-scale separation and wake diffusion, with relatively weak dependence on near-wall fine-scale structures. The k–ε model offers a good balance between computational efficiency and physical fidelity. Therefore, three typical k–ε models were selected for comparison in this study.
The Standard k–ε model [28] is the earliest proposed k–ε turbulence model, with its governing equations expressed as follows. The transport equation for the turbulent kinetic energy k is given as
The transport equation for the turbulent dissipation rate ε is given by
where the turbulent kinematic viscosity is expressed as , Pk denotes the production of turbulent kinetic energy due to mean velocity gradients; σk and σε are the turbulent Prandtl numbers for k and ε, respectively; C1ε and C2ε are model constants controlling the production and dissipation terms in the ε equation; Cμ is an empirical constant for the turbulent viscosity; and ε is the turbulent dissipation rate.
The RNG k–ε model, proposed by Yakhot and Orszag [29], is expressed by the following equations:
Additional items
Here, Rε is an additional term specific to the RNG model, used to correct the dissipation rate under high strain rates; η is a dimensionless parameter defined as the ratio of the turbulent time scale k/ε to the mean flow time scale 1/S; S is the magnitude of the mean strain rate tensor; and η0 is a characteristic transition parameter, treated as a constant.
The realizable k–ε model [30] is a widely used variant of the k–ε turbulence model, offering broader applicability than the RNG k–ε model. The transport equations for the turbulent kinetic energy k and the turbulent dissipation rate ε are given as
Here, Cμ is treated as a variable coefficient, which is expressed as
In the above expression, A0 and AS are model constants, with A0 = 4.04 typically, and AS determined by the ratio of strain rate to rotation rate; S is the magnitude of the mean strain rate tensor; C1 is a variable coefficient, and C2 is a constant.
Numerical simulations of flow around square cylinders conducted by Zhang [31] indicated that both the RNG k–ε and Realizable k–ε models outperform the Standard k–ε model in prediction accuracy, with the Realizable k–ε model exhibiting better stability under complex flow conditions. Further studies by Yan [32] confirmed that the Realizable k–ε model is the only RANS-based model capable of effectively capturing secondary flows along the outer bank, a feature that is central to LESs. Moreover, its results are highly consistent with those obtained from LES. Therefore, the present study conducts numerical validation using both the RNG k–ε and Realizable k–ε models.
URANS and LES differ in resolving turbulent scales: LES captures large-scale eddies and small-scale high-frequency structures, while URANS accurately reproduces dominant vortex shedding and low-order SPOD modes but dissipates small-scale fluctuations. Although URANS slightly underpredicts higher-order modal energy, it reliably represents the main wake dynamics, modal energy distribution, and primary vortex shedding frequency, making it sufficient for the present SPOD analysis.
2.2. SPOD Model
The above CFD simulation with the Realizable k–ε model can resolve the instantaneous flow field evolution, but cannot quantitatively characterize the energy frequency distribution or identify dominant coherent structures. To address this limitation, the SPOD method is introduced for multi-dimensional wake flow analysis.
Unsteady flow separation around a circular cylinder is a particularly representative phenomenon. CFD simulations can effectively capture the evolution of flow-field structures; however, they are generally unable to quantitatively characterize the energy contributions of the fundamental frequency and its harmonics, or to identify the dominant frequency-related features in the wake. Among widely used data-driven modal decomposition methods, SPOD provides well-defined frequency information, making it particularly suitable for analyzing frequency-dominated flow structures [33]. Therefore, SPOD is introduced in this study to conduct a detailed analysis of the computed flow-field results, with the aim of achieving frequency-resolved statistical characterization and identifying regions of high energy concentration.
The SPOD method first decomposes the velocity vector u(x, t) into a mean component (x,t) and a fluctuating component u’(x,t). The fluctuating velocity u’(x,t) is further expressed as a sum of spatial modes Φi(x) multiplied by their corresponding temporal coefficients ai:
Here, Φi(x) represents the spatial modes, ai is their corresponding temporal coefficients.
The correlation matrix R is defined as
And ⟨,⟩ denotes the inner product. The correlation matrix R has dimensions N × N, N represents the number of collected flow field snapshot samples.
To enhance diagonal coherence of the correlation matrix R, a simple low-pass filter is applied along the diagonal of the correlation matrix. The elements of the filtered correlation matrix S can be expressed as
Here, g denotes the coefficient vector of the filter. Based on the filtered correlation matrix S, the temporal coefficients and modal energies λi can be obtained through eigenvalue decomposition, which satisfy the following relationship:
The temporal coefficients ai are orthogonal and proportional to the energy of the corresponding mode
Here, (,) denotes the scalar product, and δij is the Kronecker delta. The spatial modes are finally obtained by
where Φi(x) describes the spatial distribution of the i-th mode and can be visualized using isosurfaces to reveal the corresponding flow structures. The temporal coefficient ai(tj) characterizes the temporal evolution of the i-th mode, and typically exhibits a single-frequency oscillatory behavior.
3. Numerical Simulations of Three-Dimensional Flow Around a Single Cylinder
Considering that grid resolution and turbulence-model selection have a significant influence on the flow-field structure and dynamic response of flow around dual cylinders, this section first presents validation calculations for three-dimensional flow around a single cylinder. The relevant hydraulic parameters and characteristic scales are listed in Table 1.
Table 1.
Hydraulic parameters and characteristic scale indicators.
3.1. Computational Model
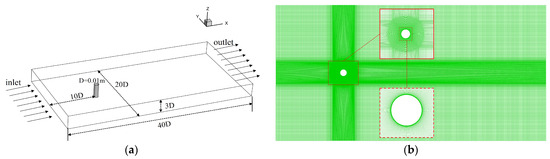
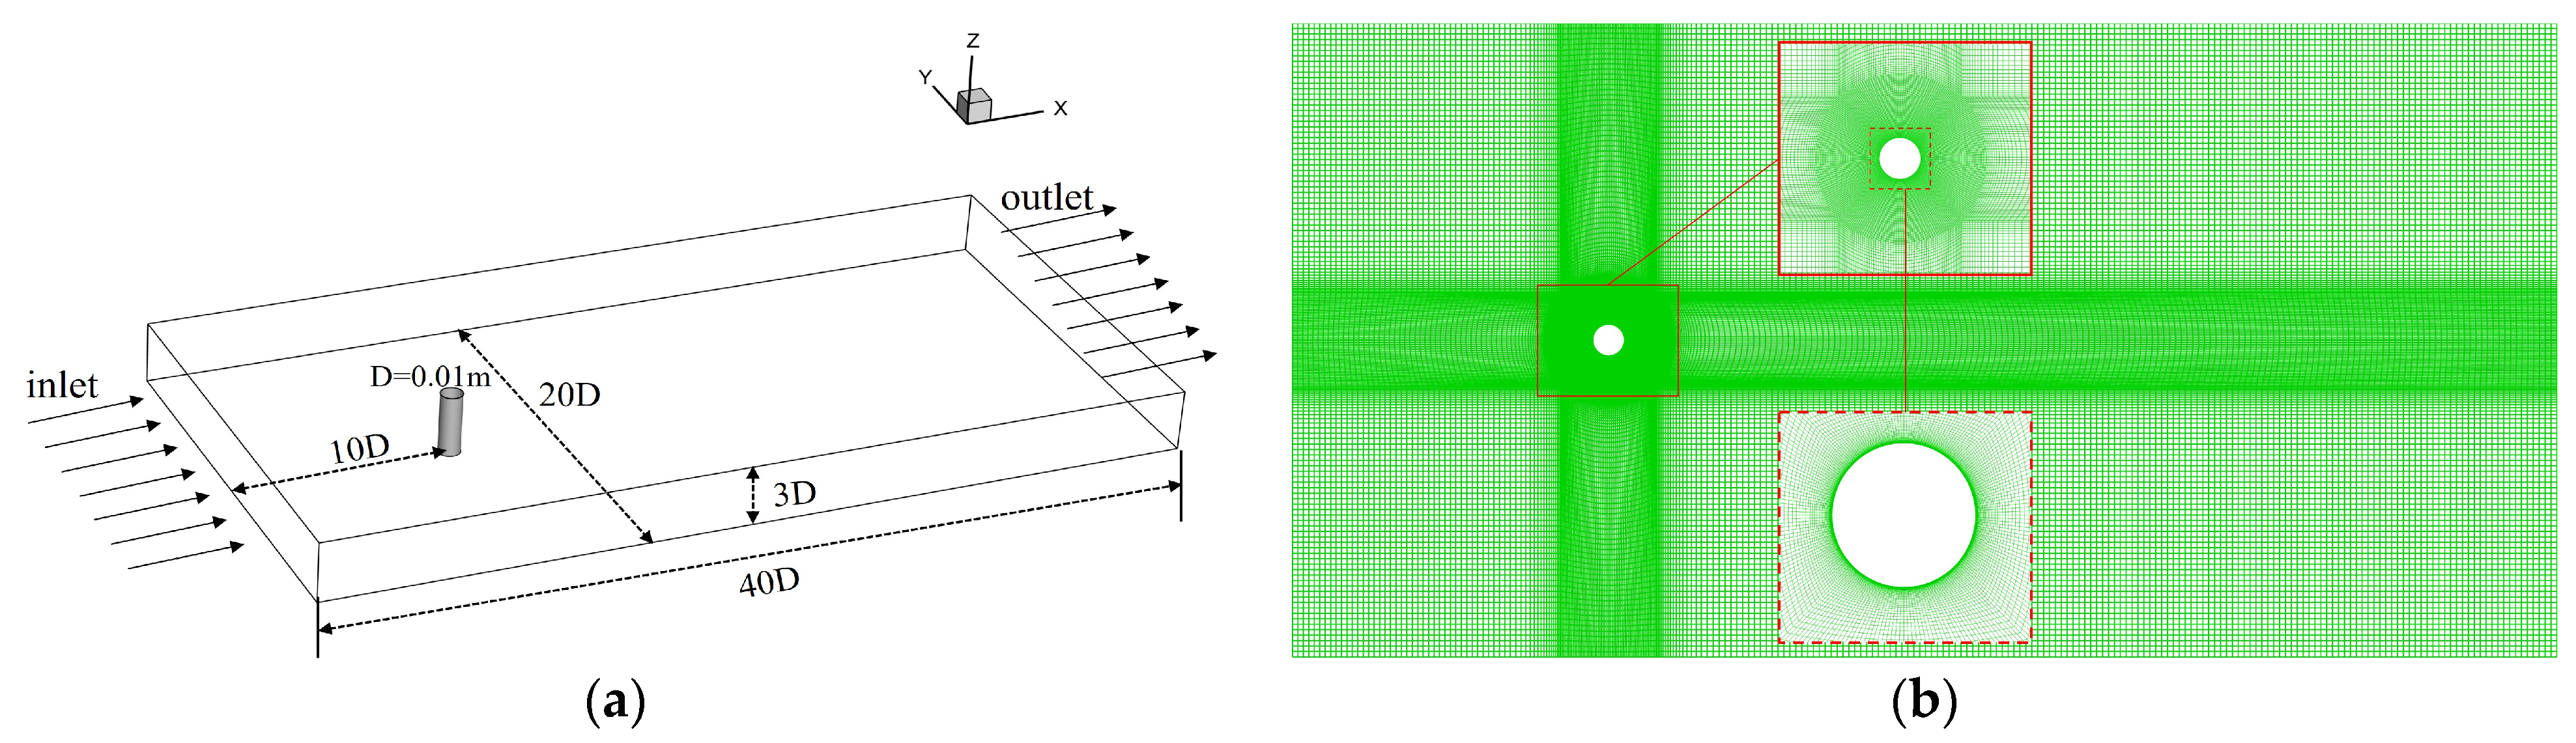
As shown in Figure 1, the computational domain is defined in a Cartesian coordinate system, with the origin located at the center of the cylinder. The incoming flow is aligned with the positive X-axis. Taking the cylinder diameter D = 0.01 m as the characteristic length, the domain dimensions are 40D, 20D and 3D in the streamwise, transverse and spanwise directions, respectively. The cylinder is positioned 10D downstream of the inlet and 30D upstream of the outlet. A velocity inlet boundary condition with U = 0.39 m/s is prescribed at the inlet, while a pressure-outlet boundary condition is applied at the outlet. Symmetry boundaries are imposed on the side and top boundaries, and no-slip wall conditions are applied to the cylinder surface and the bottom wall. The computational domain is discretized using a structured mesh, with the first near-wall layer adjacent to the cylinder set to a height of 3.2 × 10⁻⁵ m, followed by progressive refinement in the wall-normal direction. The numerical solutions are obtained using the SIMPLE algorithm, with second-order accuracy adopted for both spatial and temporal discretization.
Figure 1.
The computational model and mesh distribution: (a) physical model; (b) mesh distribution in the X-Y plane.
3.2. Grid Independence Verification
First, the key physical parameters used for flow field analysis are presented, including the Strouhal number St, which characterizes flow unsteadiness and vortex shedding frequency, as well as the lift coefficient CL and drag coefficient CD, which quantify variations in the lift and drag forces acting on the cylinder. Their expressions are given as follows:
Here, f denotes the vortex shedding frequency, FL is the resultant force acting on the cylinder in the direction perpendicular to the incoming flow, and FD is the resultant force acting on the cylinder in the streamwise direction.
To validate the reliability of the numerical method, a grid-independence study was conducted using four systematically refined meshes. The Realizable k–ε model [31] was primarily employed, and its results were compared with those obtained using the RNG k–ε model. Table 2 presents the calculated drag coefficients and Strouhal numbers for different meshes and turbulence models. The results indicate that Case 3 with 3.22 million cells and Case 4 with 4.21 million cells using the Realizable k–ε model [8] show good agreement with experimental data [34] and previous studies, demonstrating that grid independence has essentially been achieved. Considering both computational accuracy and efficiency, the Realizable k–ε model with the mesh of 3.22 million cells was selected for subsequent simulations, and the results are also in good agreement with those obtained from LES.
Table 2.
Comparative analysis of three-dimensional single cylinder.
To ensure the reliability of the numerical results, a grid independence study was performed for the dual-cylinder configuration in the U-bend channel at L/D = 2 using three progressively refined meshes with 2.10 million, 3.06 million, and 3.93 million cells under identical flow conditions with the Realizable k–ε turbulence model. As shown in Table 3, the variations in the main flow quantities decrease with mesh refinement, indicating that grid independence is essentially achieved. It is worth noting that the 3.06 million-cell mesh used in this study is of the same order of magnitude as the reference mesh in Table 2 (approximately 3.22 million cells), ensuring consistency and comparability across different cases. When the mesh is further refined from 3.06 million to 3.93 million cells, the variations in CD1 and CD2 are within 1.5% and 0.6%, respectively, while the Strouhal number remains unchanged (St = 0.22), confirming that the dominant vortex shedding frequency is well resolved. Considering both numerical accuracy and computational cost, the mesh with approximately 3.06 million cells is adopted for all subsequent simulations.
Table 3.
Grid Independence Study for the Dual Cylinders in a U-Bend (L/D = 2).
4. Numerical Simulations for Side-by-Side Two Cylinders in Three-Dimensional Curved Channel
4.1. Physical Model
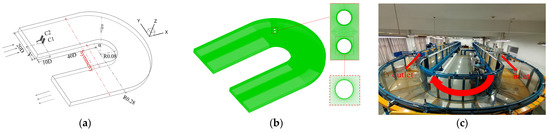
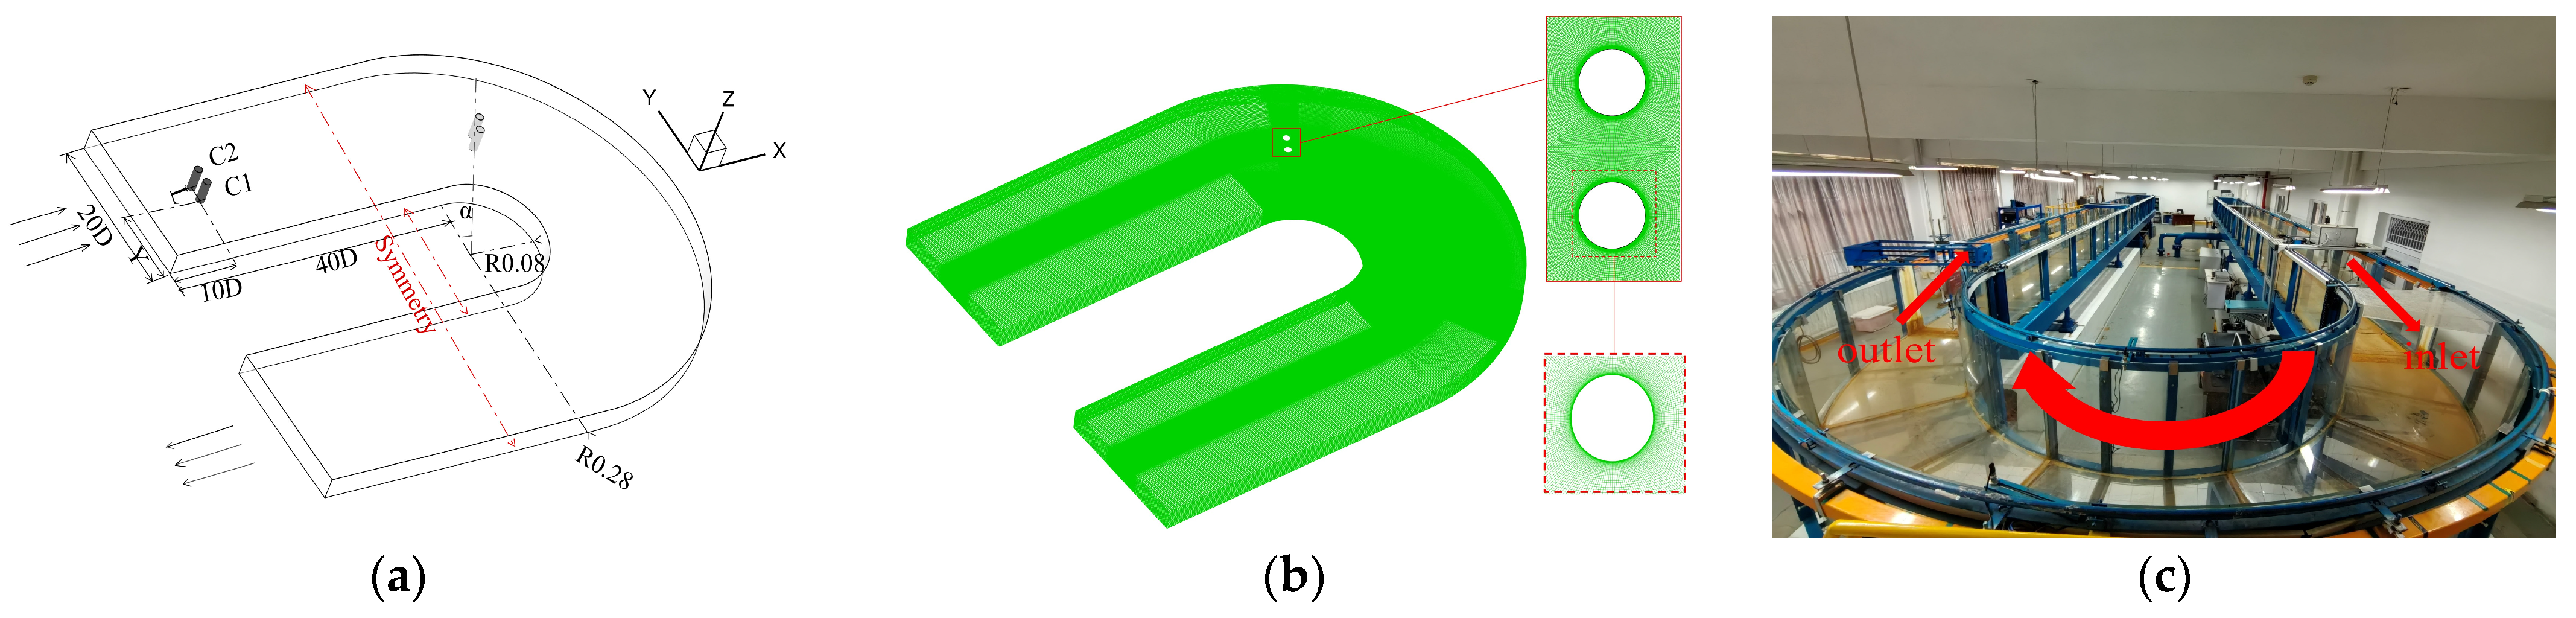
This section focuses on the flow field characteristics of two parallel circular cylinders within a U-shaped bend. As shown in Figure 2, the physical model is based on the high-precision U-shaped flume in the Hydraulics Laboratory at North Minzu University and serves as a scaled-down representation of actual river-channel conditions. The dimensions of the upstream and downstream sections are the same as those of the straight channel case described in Section 2.1. The inner and outer radius of the bend are 16D and 56D, respectively. Two cylinders are placed within the bend. Their diameter is D = 0.01 m, and their height is 3D. The centers of the cylinders are symmetrically distributed about the origin along the Y-axis. The incoming flow has a velocity of U = 0.39 m/s and enters the domain along the positive X-axis. To analyze the effect of the bend, side-by-side cylinders in a straight channel were introduced as a comparative case. Both configurations used the same boundary conditions and mesh approach. The outlet was set as a pressure outlet. Symmetry boundaries were applied to the side walls and top surface. No-slip wall conditions were enforced at the bottom wall and cylinder surfaces. The SIMPLE algorithm was used for pressure–velocity coupling, and second-order accuracy was adopted for both spatial and temporal discretization. In Figure 2a, L denotes the center-to-center distance between the two cylinders, while C1 and C2 represent the downstream and upstream cylinders, respectively.
Figure 2.
Dimensions and mesh of the three-dimensional cylinders in the curved channel: (a) the physical model; (b) mesh distribution; (c) high-precision U-shaped flume in the laboratory.
4.2. Three-Dimensional Side-by-Side Cylinders in a Straight Channel
Previous studies by Tong [5] and Yu [8] investigated side-by-side cylinders with L/D ratios from 0.5 to 2.5. Their results showed that a critical spacing ratio of L/D = 2 induces strong flow interference, which may lead to flow oscillations and potential vibration risks. For hydraulic engineering, a spacing of L/D = 2 is often too narrow. However, the common spacing of L/D = 3 still shows strong gap flow. Therefore, this study considers three spacing configurations, L/D = 2, 3, and 4, covering the transition from strong to weak interaction and thereby effectively capturing the main interference effects. As shown in Figure 2a, two cylinders with D = 0.01 m are placed at the entrance of the straight channel section, with their centers located 10D downstream of the inlet boundary. Three cases with different spacing ratios were designed as shown in Table 4. The SPOD method is used to analyze the modal structures and energy distribution of the flow field for each case.
Table 4.
Simulated working conditions in straight path.
4.3. Flow Characteristics of Three-Dimensional Side-by-Side Cylinders in a Straight Channel and SPOD Analysis
4.3.1. Analysis of Flow Field Variation
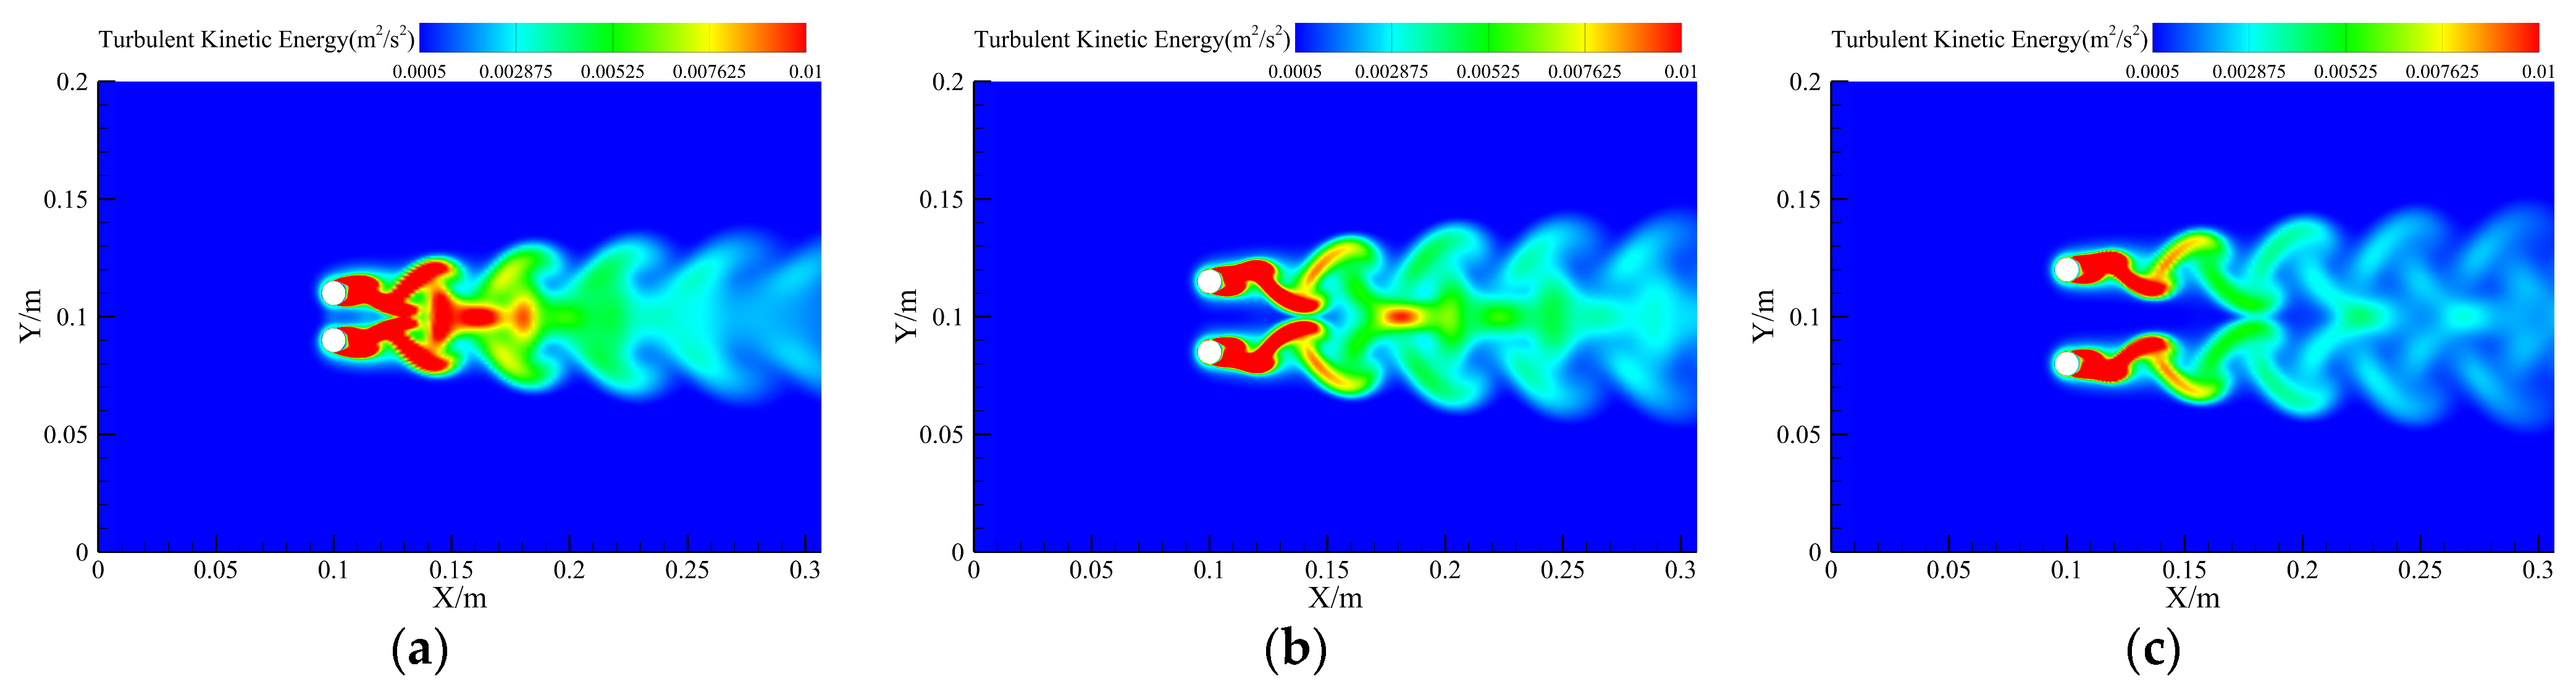
Figure 3 shows the turbulent kinetic energy distribution on the z = 1/2H plane at t = 4 s. For L/D = 2, regions of high turbulent kinetic energy are mainly concentrated in the gap between the two cylinders and in the near-wake region (X/m = 0.15–0.2), indicating strong flow interference and intense turbulence generation. As the spacing increases to L/D = 3, the turbulent kinetic energy in the gap region decreases significantly, with localized accumulation observed only around X/m = 0.2. These features indicate that wake interference is weakened, although cylinder–cylinder interaction remains present. Regions of high turbulent kinetic energy are mainly confined to the near wake of each cylinder, while the downstream wake exhibits a relatively clear and symmetric vortex-shedding pattern. Overall, as the spacing ratio increases, the wakes of the two cylinders gradually transition from strongly coupled interference to a quasi-independent state, leading to a significant reduction in turbulent kinetic energy interactions.
Figure 3.
Contours of turbulent kinetic energy on the z = 1/2 H plane for different spacing ratios: (a) L/D = 2; (b) L/D = 3; (c) L/D = 4.
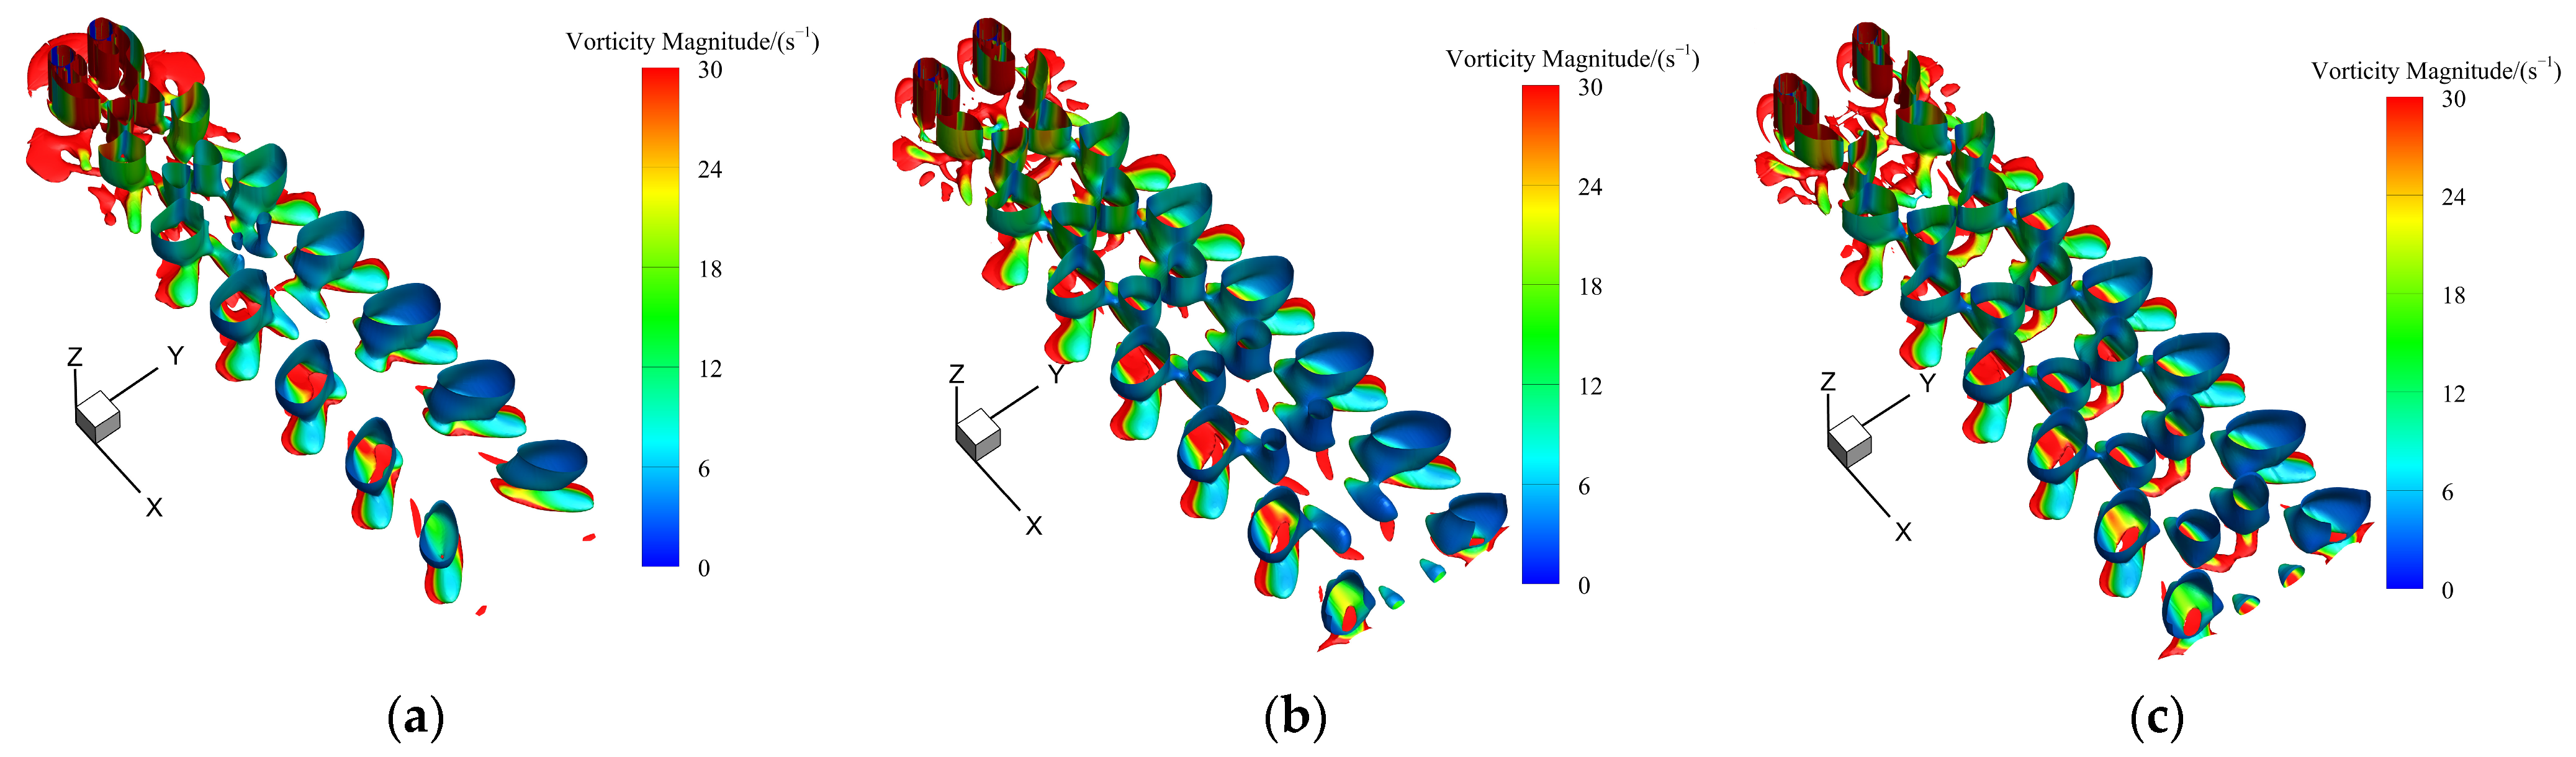
To clearly identify changes in the wake vortex structures, Figure 4 presents the three-dimensional wake vortices identified using the Q-criterion ((Q = 2)) for different spacing ratios. For L/D = 2, the wake vortex structures exhibit pronounced merging and deformation. As the spacing increases from L/D = 3 to L/D = 4, the flow evolves from a state with relatively weak vortex-structure mixing into a typical double-row vortex-street pattern in the cylinder wake, gradually developing a fully symmetric and distinctly periodic spatial configuration. Overall, with increasing spacing ratio, the wake vortex structures evolve from a strongly coupled state to a quasi-independent state, which is consistent with the observations in Figure 3.
Figure 4.
Wake vortex structures of side-by-side cylinders in a straight channel: (a) L/D = 2; (b) L/D = 3; (c) L/D = 4.
4.3.2. Modal Energy
In this section, SPOD is employed to analyze the energy distribution in the cylinder wake, with the aim of identifying the dominant frequency structures and their coherent features. After the flow field reached statistical steady state, 500 instantaneous flow-field snapshots were sampled over a time span of 5 s. Frequency-domain constraints were applied using the filtering scale Nf [33] to accurately extract the dominant modes.
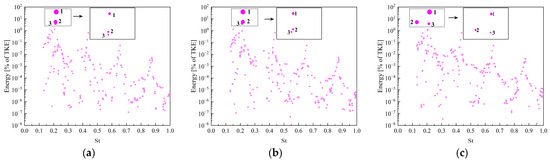
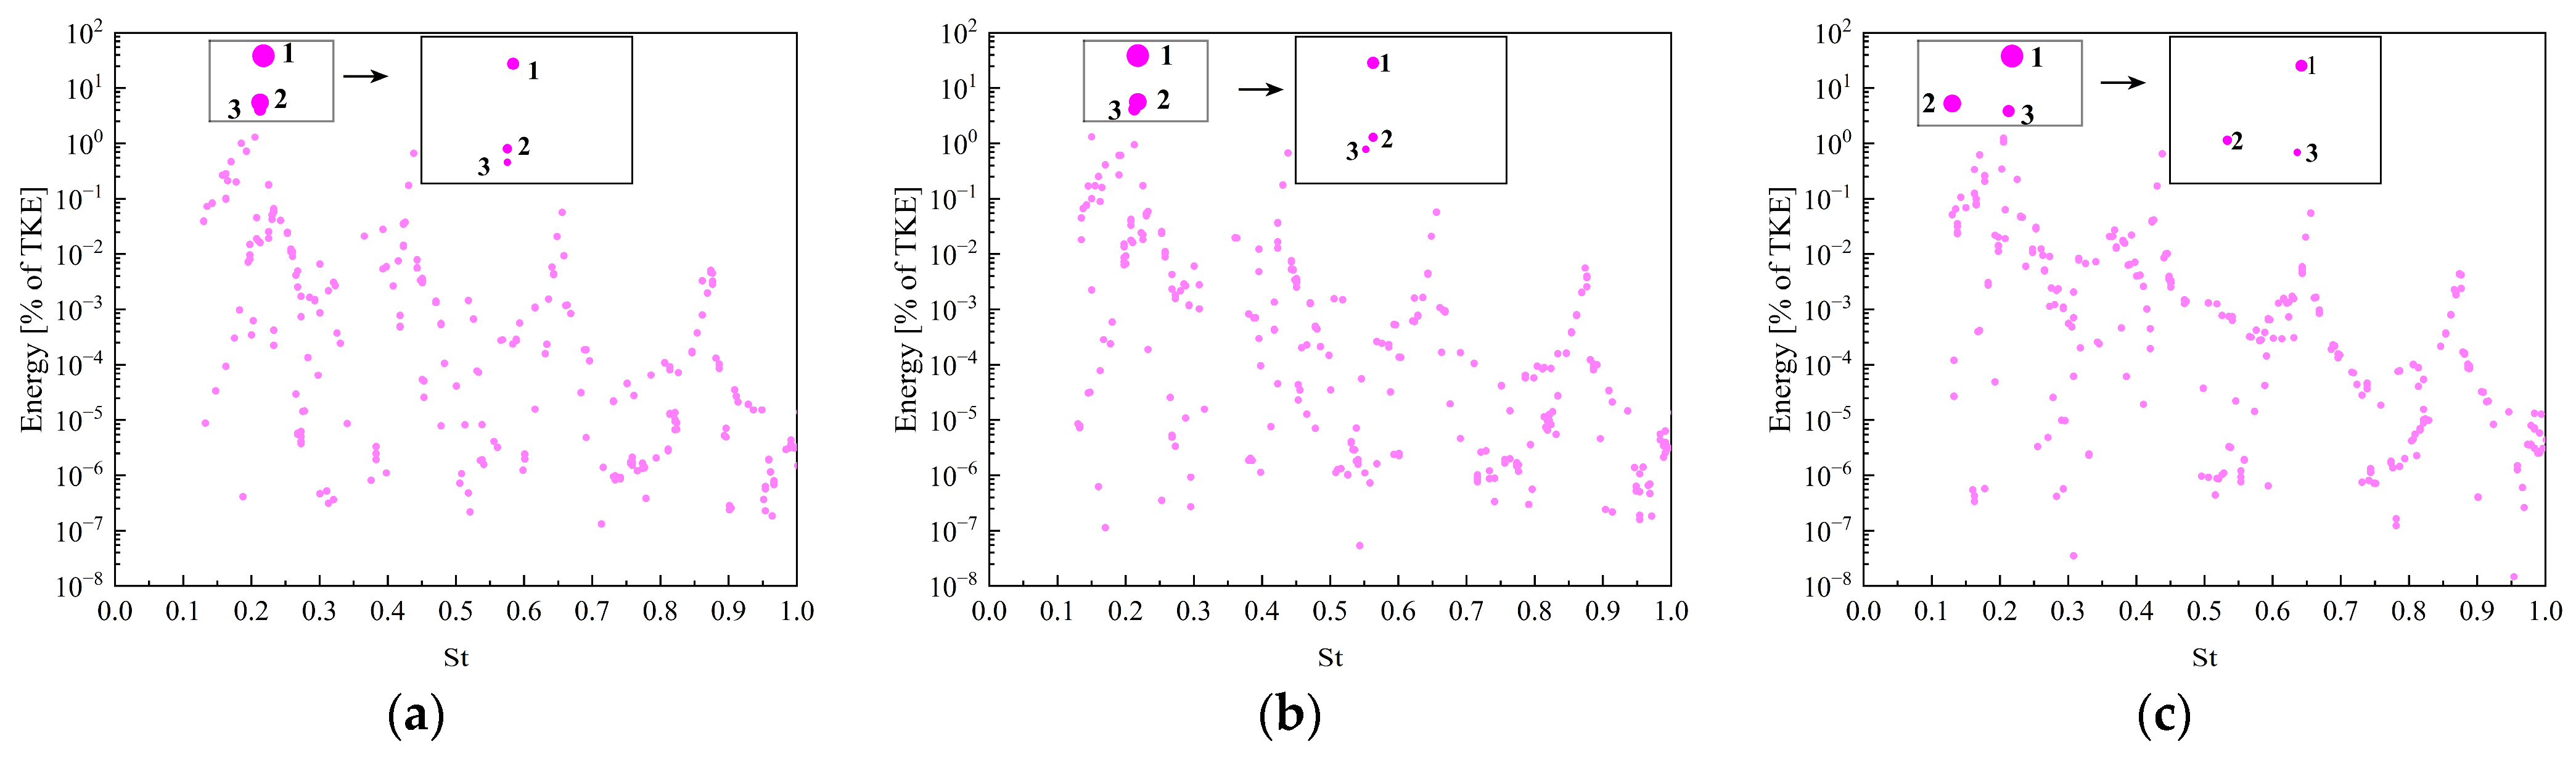
To assess the effect of the filter width, the L/D = 2 case was taken as a representative case, and comparisons were made for Nf = 10, 20 and 40. Figure 5 shows the modal energy distributions obtained using different filtering scales, where point size and color denote modal energy intensity, with the maximum corresponding to the first dominant mode. The results indicate that for all three filtering scales, the modal energy is mainly concentrated around St = 0.22, and the first pair of modes consistently dominates, with its energy share largely unaffected by changes in Nf. In contrast, the second and third pairs of modes are more sensitive to the filtering scale. Moreover, the results in Figure 5 show that although Nf = 10 can capture the main structures, it provides insufficient suppression of high-frequency noise. At Nf = 40, significant fluctuations appear in the high-frequency region, likely due to distortion of the energy distribution caused by excessive filtering. By comparison, the modal distribution is most stable when Nf = 20.
Figure 5.
Modal energy distributions for different filter widths at a spacing ratio of L/D = 2: (a) Nf = 10; (b) Nf = 20; (c) Nf = 40.
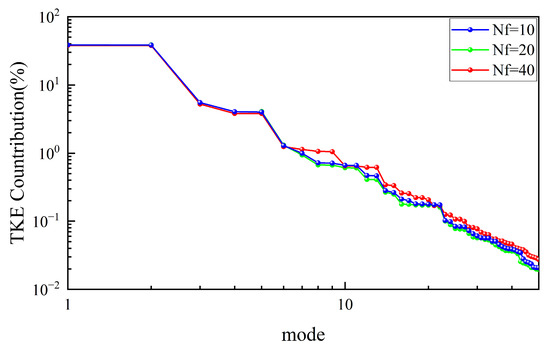
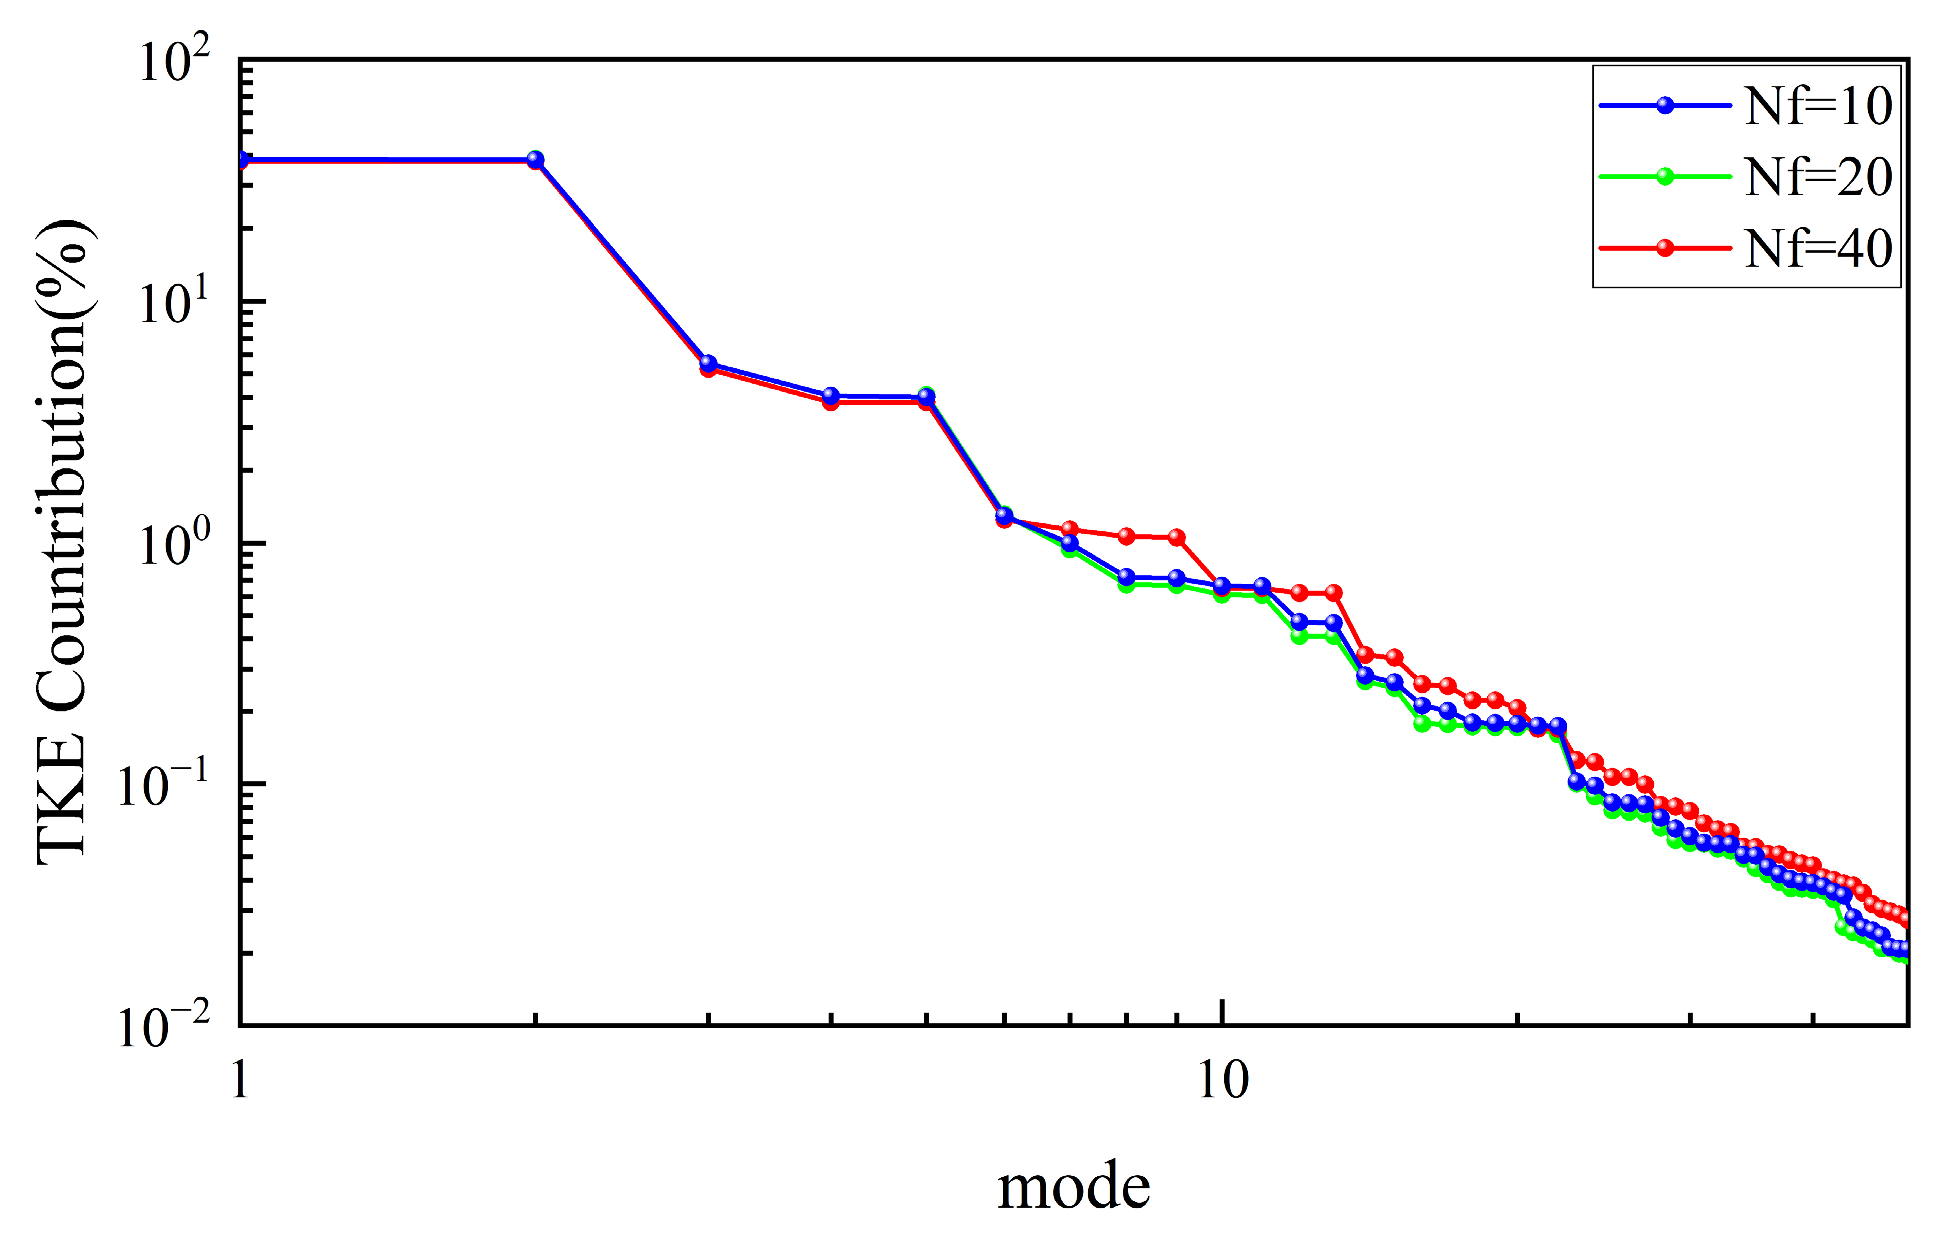
To further assess the effect of the filtering scale, Figure 6 presents the energy distributions of the first 50 SPOD modes under three filter widths considered above. The numerical results indicate that, for all filtering scales, the energy of the first pair of modes is significantly higher than that of the remaining modes, while the energy of the second and subsequent modes decays rapidly. This indicates that the flow-field energy is primarily concentrated in the low-order modes. Considering both computational efficiency and modal stability, a filter width of Nf = 20 was selected for subsequent calculations.
Figure 6.
Energy fractions of the first 50 SPOD modes for different filter widths.
Table 5 further presents the vortex shedding Strouhal numbers of the side-by-side cylinders obtained using different computational models. The results of this study are consistent with those of Kim [36], who conducted experiments on equal-diameter side-by-side cylinders at Re = 3300, and Yu [8], who obtained results for equal-diameter side-by-side cylinders at Re = 3900 using RANS models. It should be noted that both Re = 3300 and Re = 3900 fall within the subcritical regime. Within this Reynolds-number range, the flow characteristics are highly similar, making the comparison appropriate.
Table 5.
Results of St-number comparison analysis for side-by-side cylinders with L/D = 2.
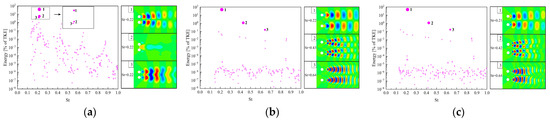
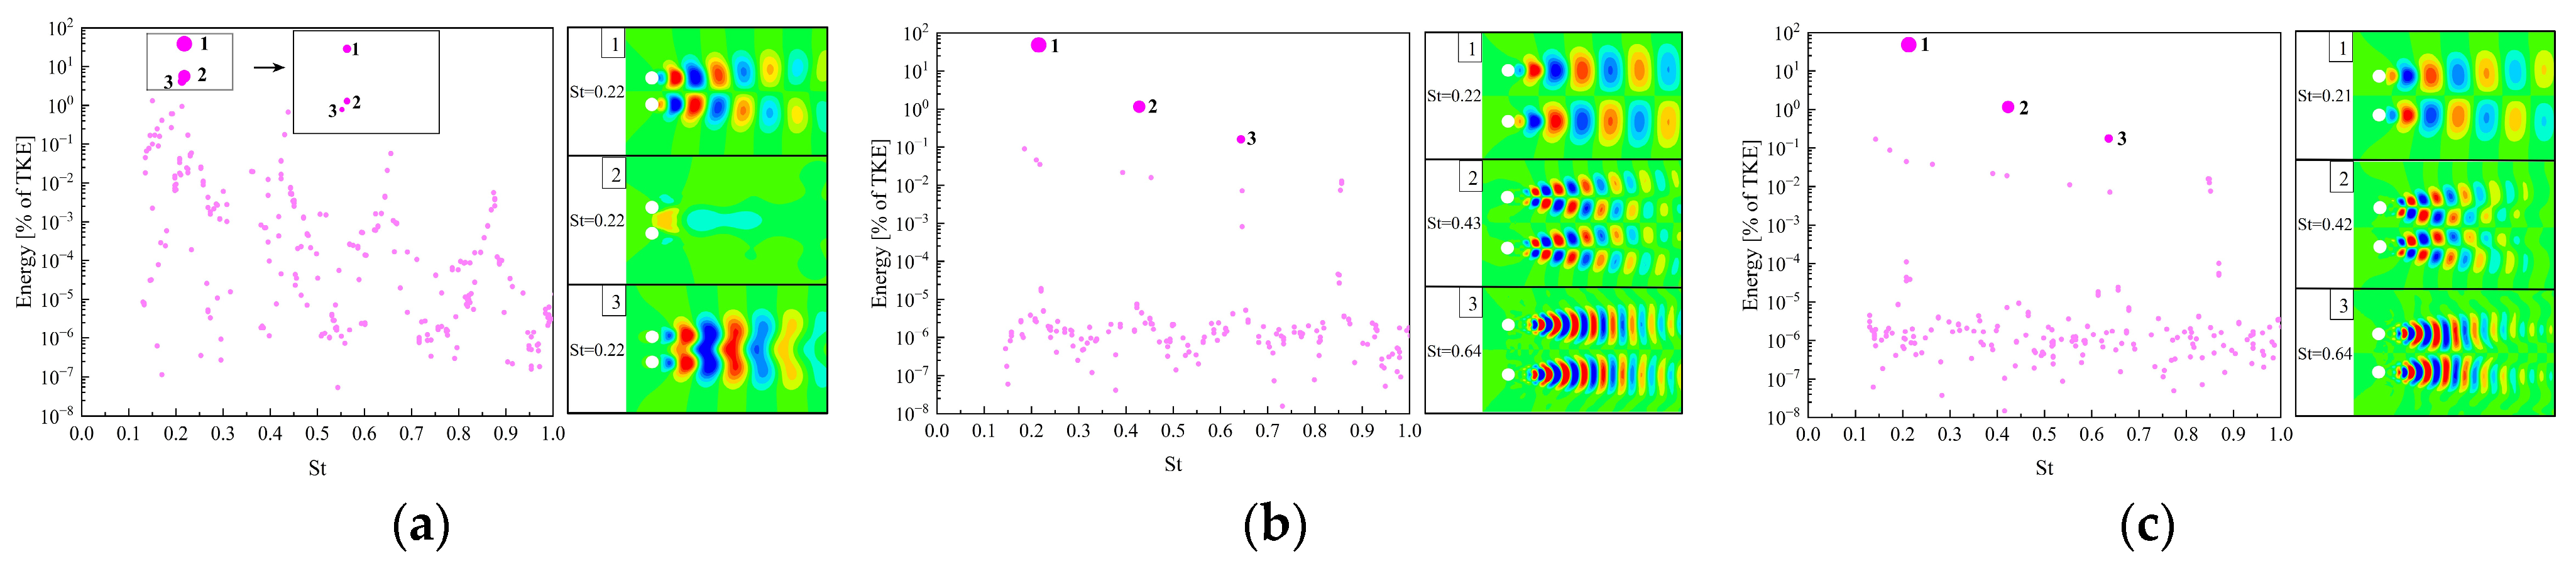
Figure 7 shows the SPOD modal energy distributions and the coherent structures of the lateral velocity (V/U = ±0.0002) on the z = 1/2H plane for cylinder flows at different spacing ratios with Nf = 20. In the fundamental mode 1, all cases exhibit a typical Kármán vortex street structure, with Strouhal numbers concentrated around 0.21–0.22, indicating that the dominant vortex-shedding mechanism remains essentially the same across different spacing ratios. The effect of spacing becomes increasingly evident in mode 2. As L/D increases, the wake gradually transitions from a strongly interacting gap-flow regime to a well-defined second-harmonic flow structure, leading to the formation of independently evolving wake vortices. In mode 3, a regular third-harmonic structure appears only at larger spacing. These results indicate that, with increasing L/D, the flow between the cylinders gradually evolves from strong coupling to weak coupling, accompanied by the clear development of higher-order harmonic structures.
Figure 7.
Modal energy and lateral velocity isosurfaces for different spacing ratios: (a) L/D = 2; (b) L/D = 3; (c) L/D = 4.
For L/D = 2, strong gap-flow interaction leads to concentrated low-order modal energy and suppresses the development of higher-order structures, indicating strong wake coupling. As the spacing ratio increases, vortex shedding evolves more independently, allowing higher-order harmonic structures to appear, reflecting a transition to more organized multi-scale wake dynamics.
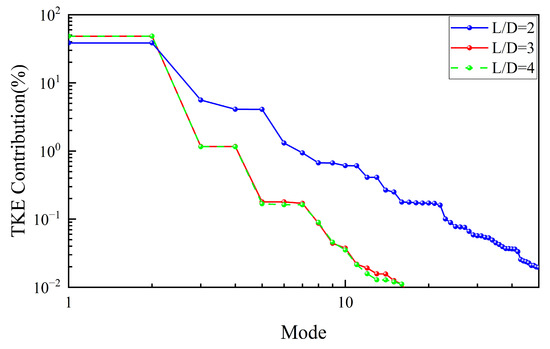
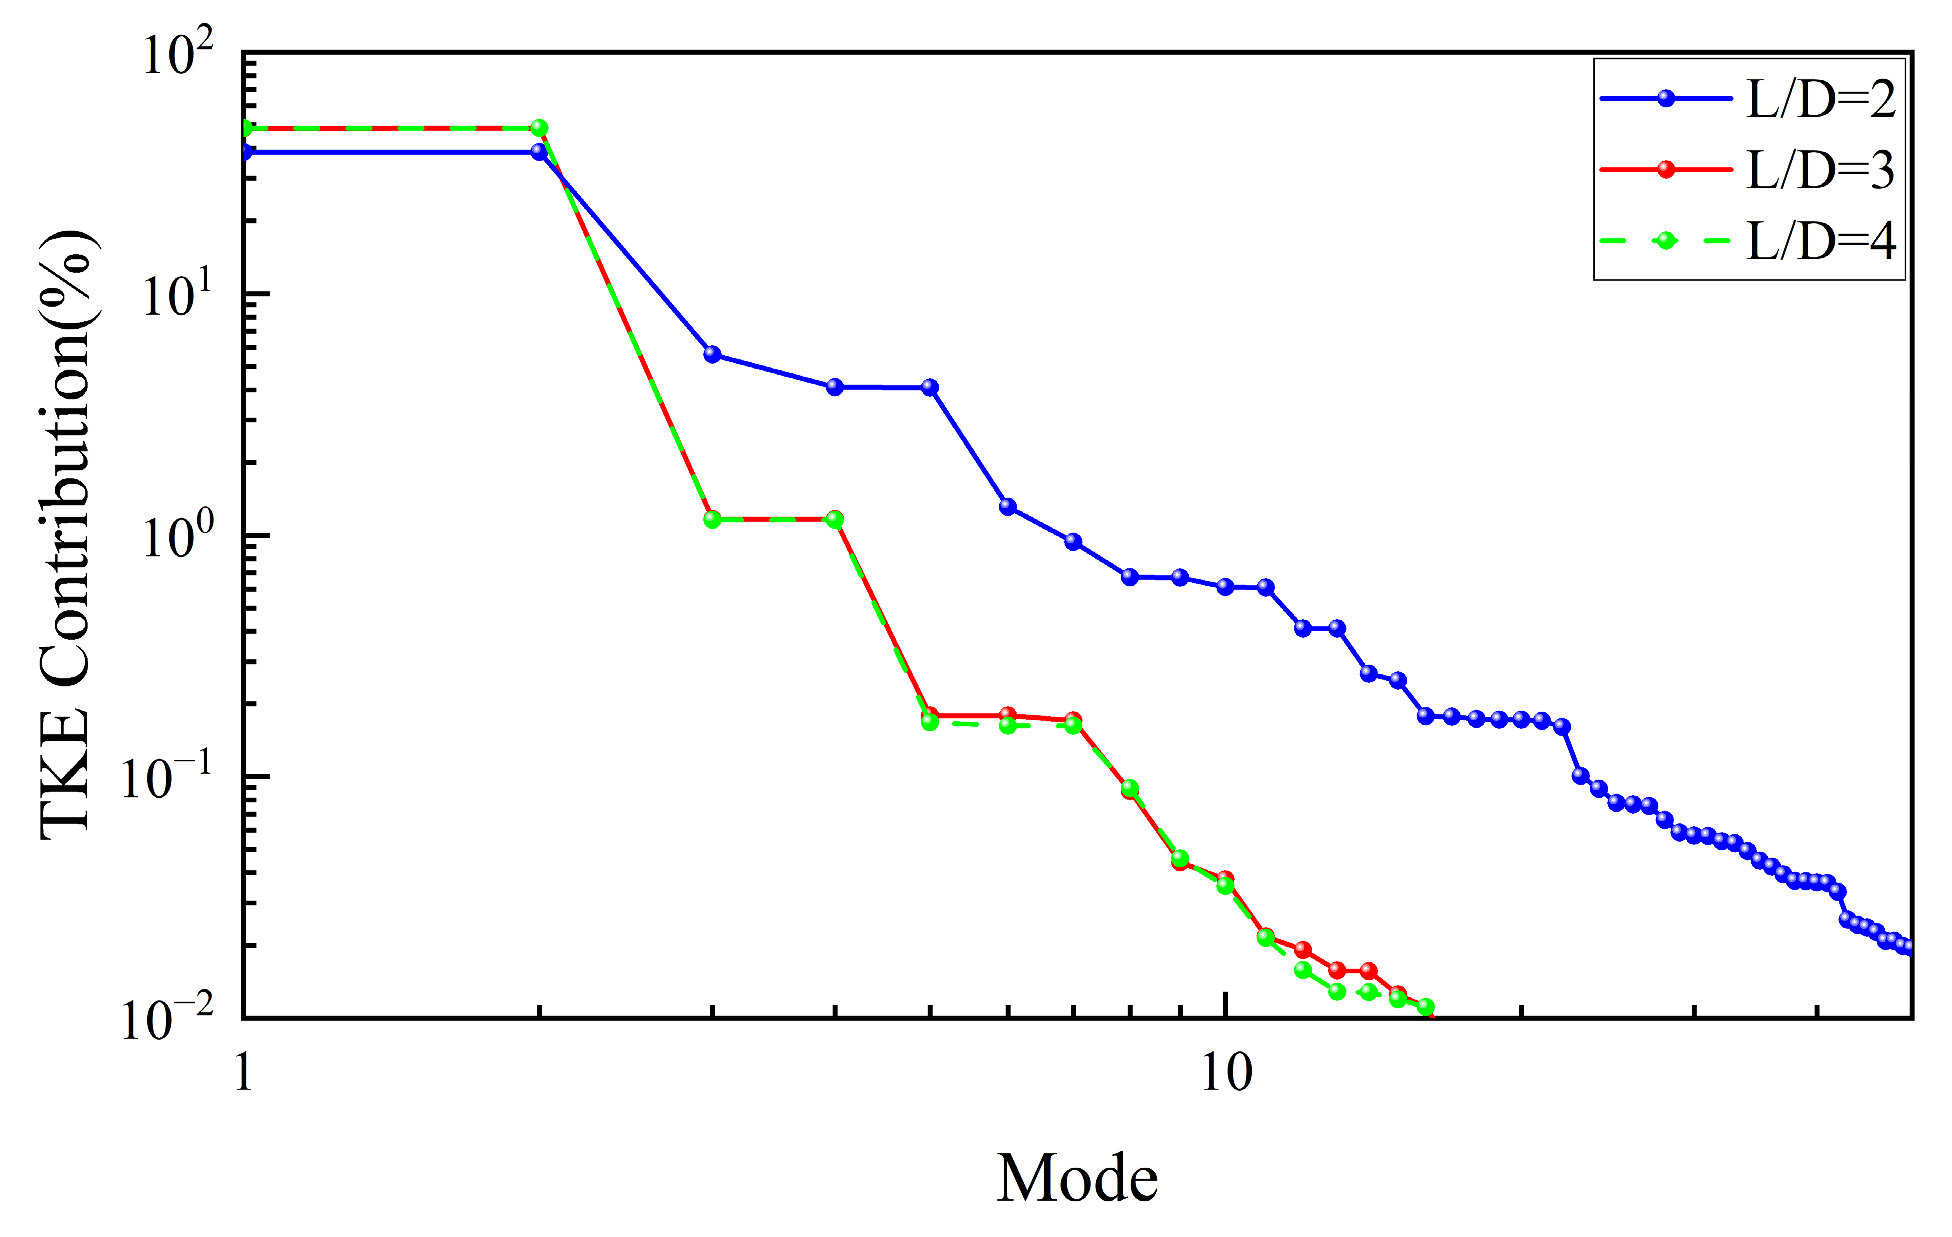
Figure 8 further presents the energy fractions of the first 50 SPOD modes for different spacing ratios. The results show that the first-mode energy remains comparable in magnitude and accounts for a relatively large proportion for L/D = 3 and 4, whereas L/D = 2 exhibits higher energy fractions in the remaining modes. This difference may be attributed to the distribution of the wake vortex structures. In addition, the modal energy fractions for L/D = 3 and 4 are almost identical, which is consistent with the spatial distribution of the velocity isosurfaces shown in Figure 7 and further indicates that the flow-field difference between L/D = 3 and 4 is relatively small.
Figure 8.
Energy fractions of the first 50 SPOD modes for different spacing ratios.
The higher energy in the higher-order modes for L/D = 2 indicates enhanced wake instability due to strong cylinder interaction, while for L/D = 3 and 4, rapid decay of higher-order modal energy shows that the wake is dominated by stable large-scale coherent structures.
4.4. Three-Dimensional Flow Around Side-by-Side Cylinders in a Curved Channel
Unlike the straight-channel case, the three-dimensional flow in a U-shaped curved channel is influenced by both centrifugal forces and lateral pressure gradients, which tend to induce pronounced secondary flow structures and promote the formation of a complex three-dimensional vortex system. Therefore, this section focuses on the flow around side-by-side cylinders in a curved channel under Re = 3900. Based on hydraulic experiment results [19] and typical engineering arrangements, α = 30°, 60° and 90° were selected as representative installation angles, where α = 30° and 60° correspond to inclined arrangements, while α = 90° represents the common baseline configuration. Considering the minor differences observed between L/D = 3 and L/D = 4 in the straight-channel cases, only L/D = 2 and L/D = 4 are selected for comparison, corresponding to center-to-center distances of 2D and 4D, respectively. Therefore, the spacing ratio L/D and the installation angle α are treated as the primary control parameters, resulting in a total of six representative cases.
These parameter combinations not only represent typical hydraulic engineering layouts, but also allow a systematic evaluation of the effects of spacing ratio and installation angle on wake stability, coherent structure evolution, and energy distribution characteristics. From an engineering perspective, comparing compact arrangements (L/D = 2) and relatively sparse arrangements (L/D = 4), together with different installation angles, helps to identify cylinder configurations that can effectively suppress wake interference, reduce flow instability, and improve hydraulic conveyance performance in curved-channel environments.
4.4.1. Analysis of Flow Field Results
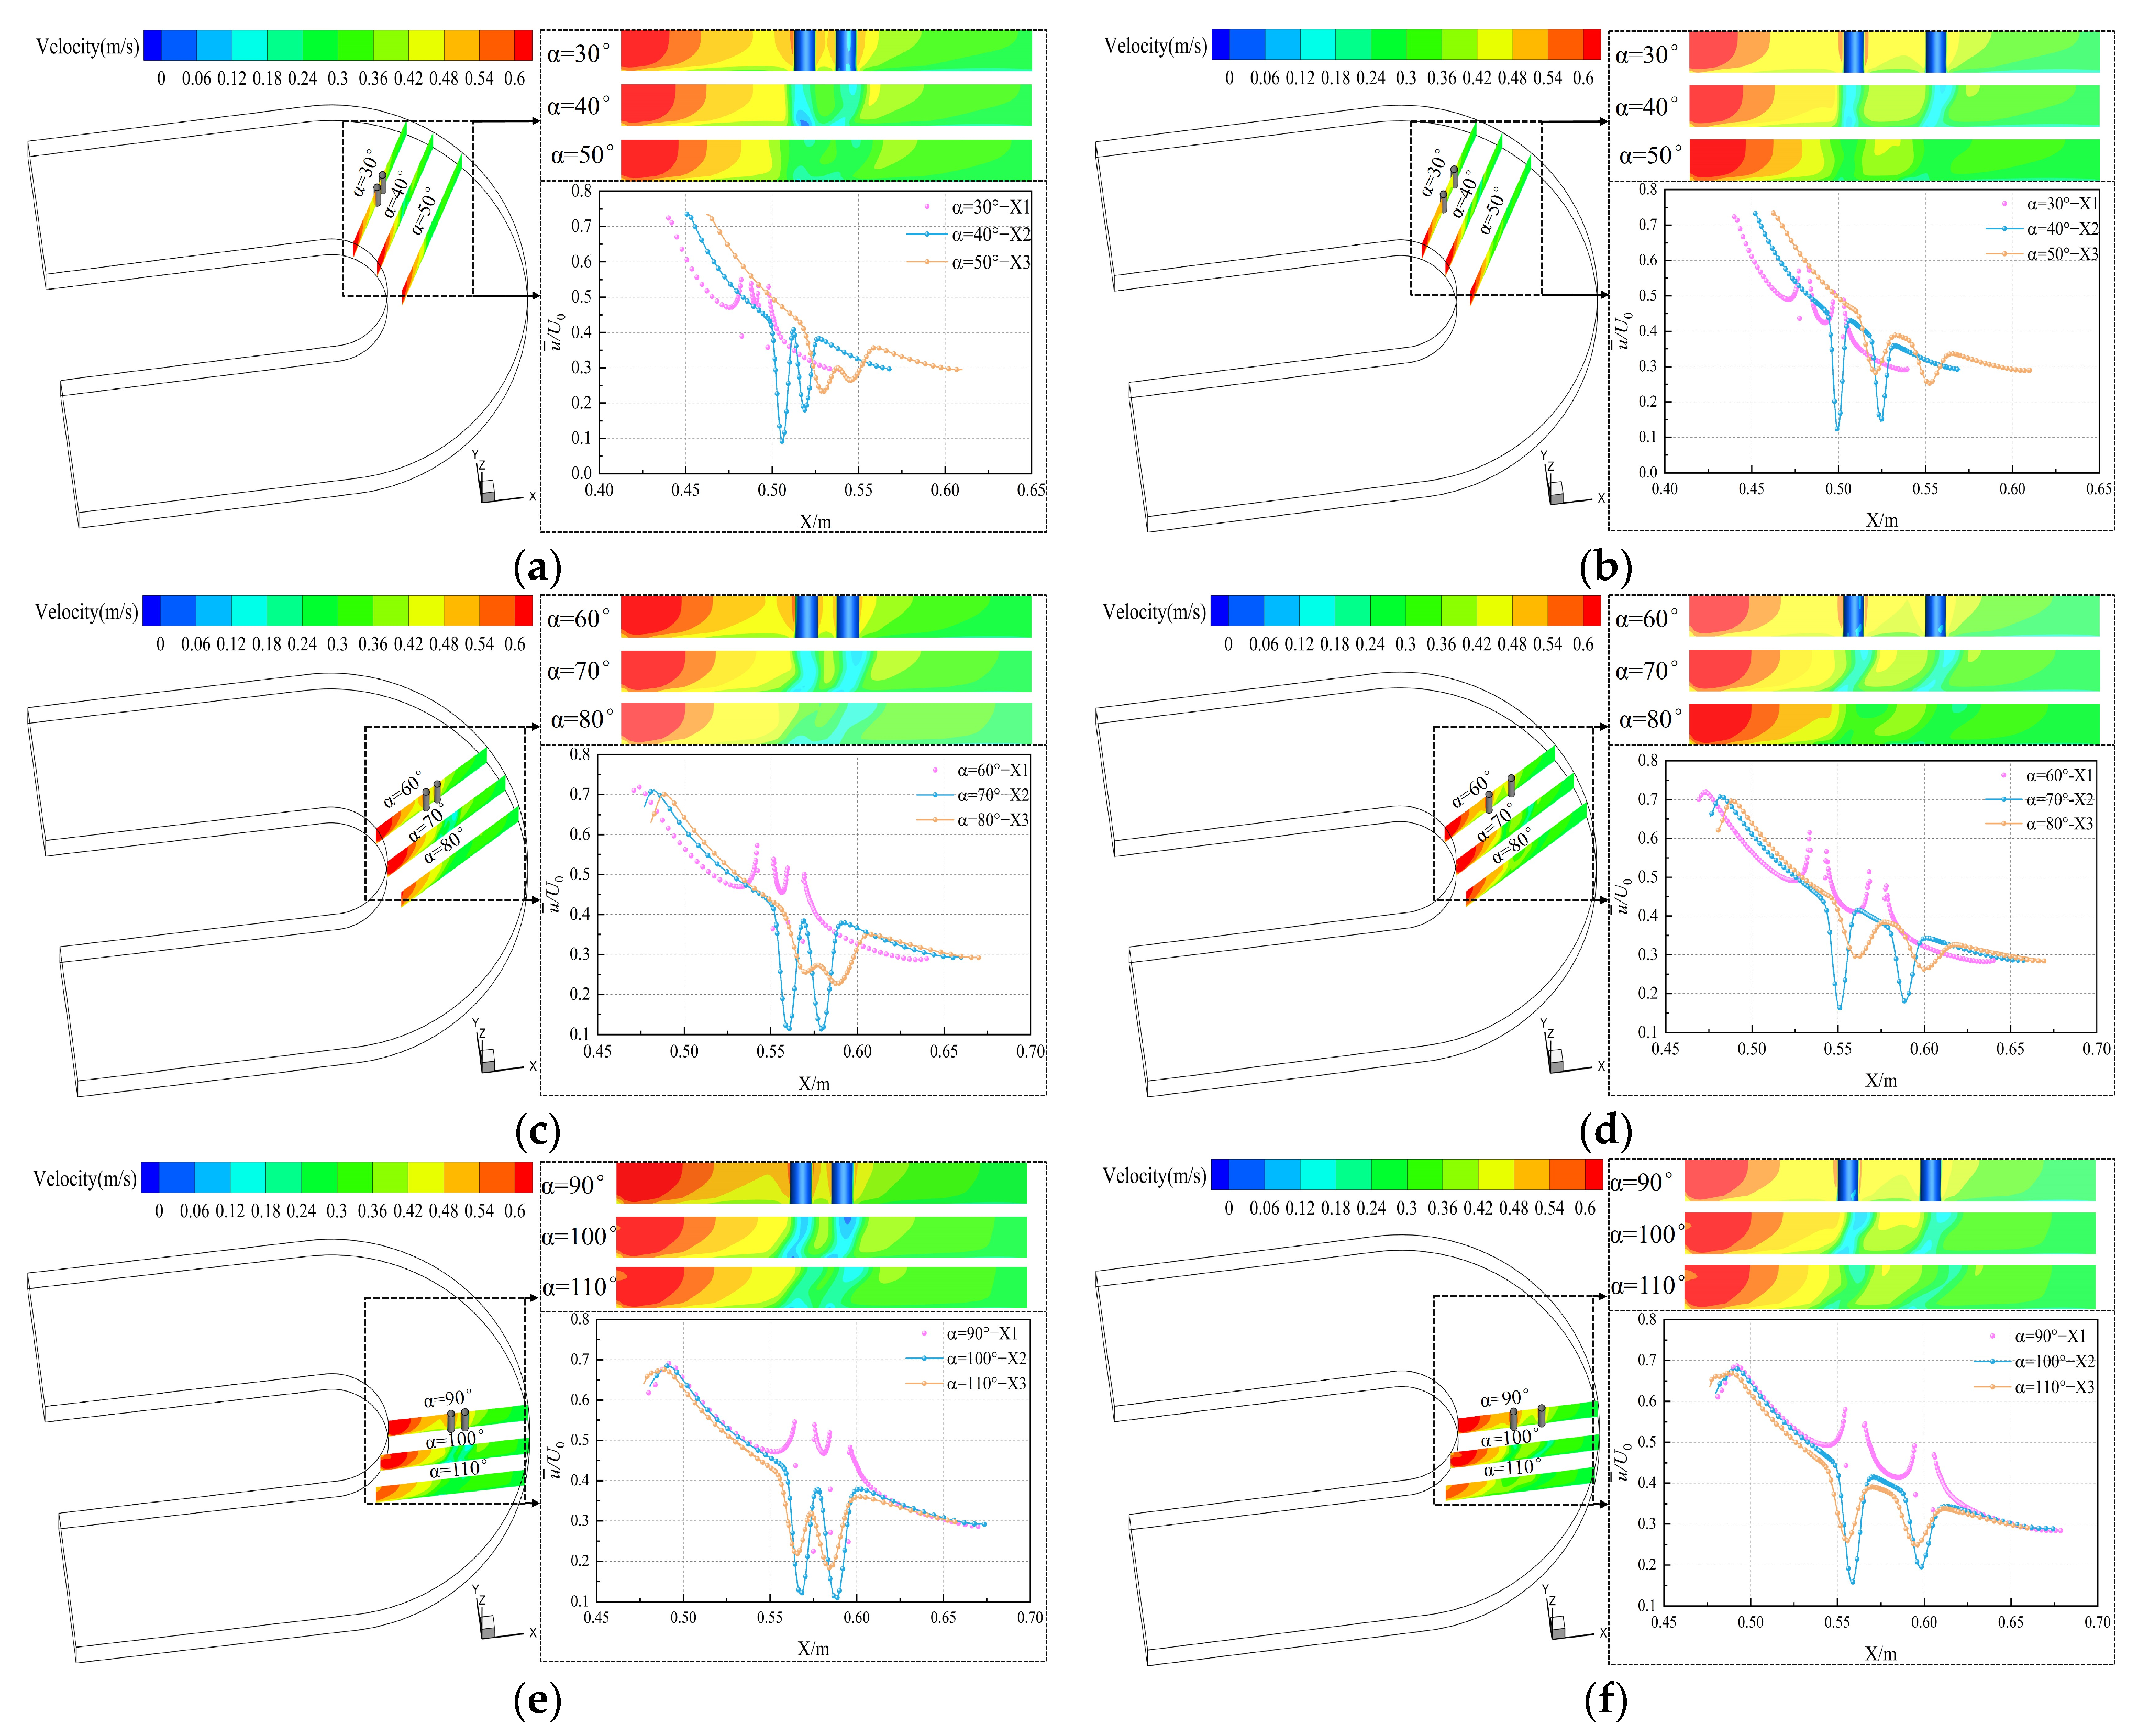
Figure 9 shows the time-averaged velocity distributions along the lateral characteristic lines at a tangential height of Z = 0.015 m intersecting three cross-sections X1, X2 and X3, together with the velocity contours on each cross-section. For each cross-section, the installation angles were taken as reference directions and varied at intervals of 10°. The velocity contours on the X1 cross-section indicate that the flow fluctuations between the cylinders are significantly stronger for L/D = 2 than for L/D = 4. The X2 and X3 cross-section contours show that the wake recirculation zones expand with increasing installation angle for both spacing ratios, with more pronounced recirculation observed for L/D = 2. Further analysis using the time-averaged velocity contours reveals that, as the arrangement angle increases, the wake flow gradually changes from a relatively smooth velocity development at α = 30° to a pronounced deflection toward the outer side of the bend at α = 90°, as observed in the X1–X3 cross-sections. Concurrently, the velocity characteristic lines exhibit more distinct local fluctuations, indicating enhanced flow non-uniformity. Analysis of the cross-sections and time-averaged velocity indicates that the wake interference is weakest and the flow structure is most stable for L/D = 4 at α = 30°. This behavior is associated with the weaker centrifugal lateral pressure gradient and reduced secondary-flow velocity difference at α = 30°, which suppress wake deflection and alleviate flow asymmetry in the curved channel. As a result, the interaction between the wakes of the two cylinders becomes weaker, leading to improved flow stability.
Figure 9.
Cross-sections and time-averaged velocity distributions: (a) L/D = 2, α = 30°; (b) L/D = 4, α = 30°; (c) L/D = 2, α = 60°; (d) L/D = 4, α = 60°; (e) L/D = 2, α = 90°; (f) L/D = 4, α = 90°.
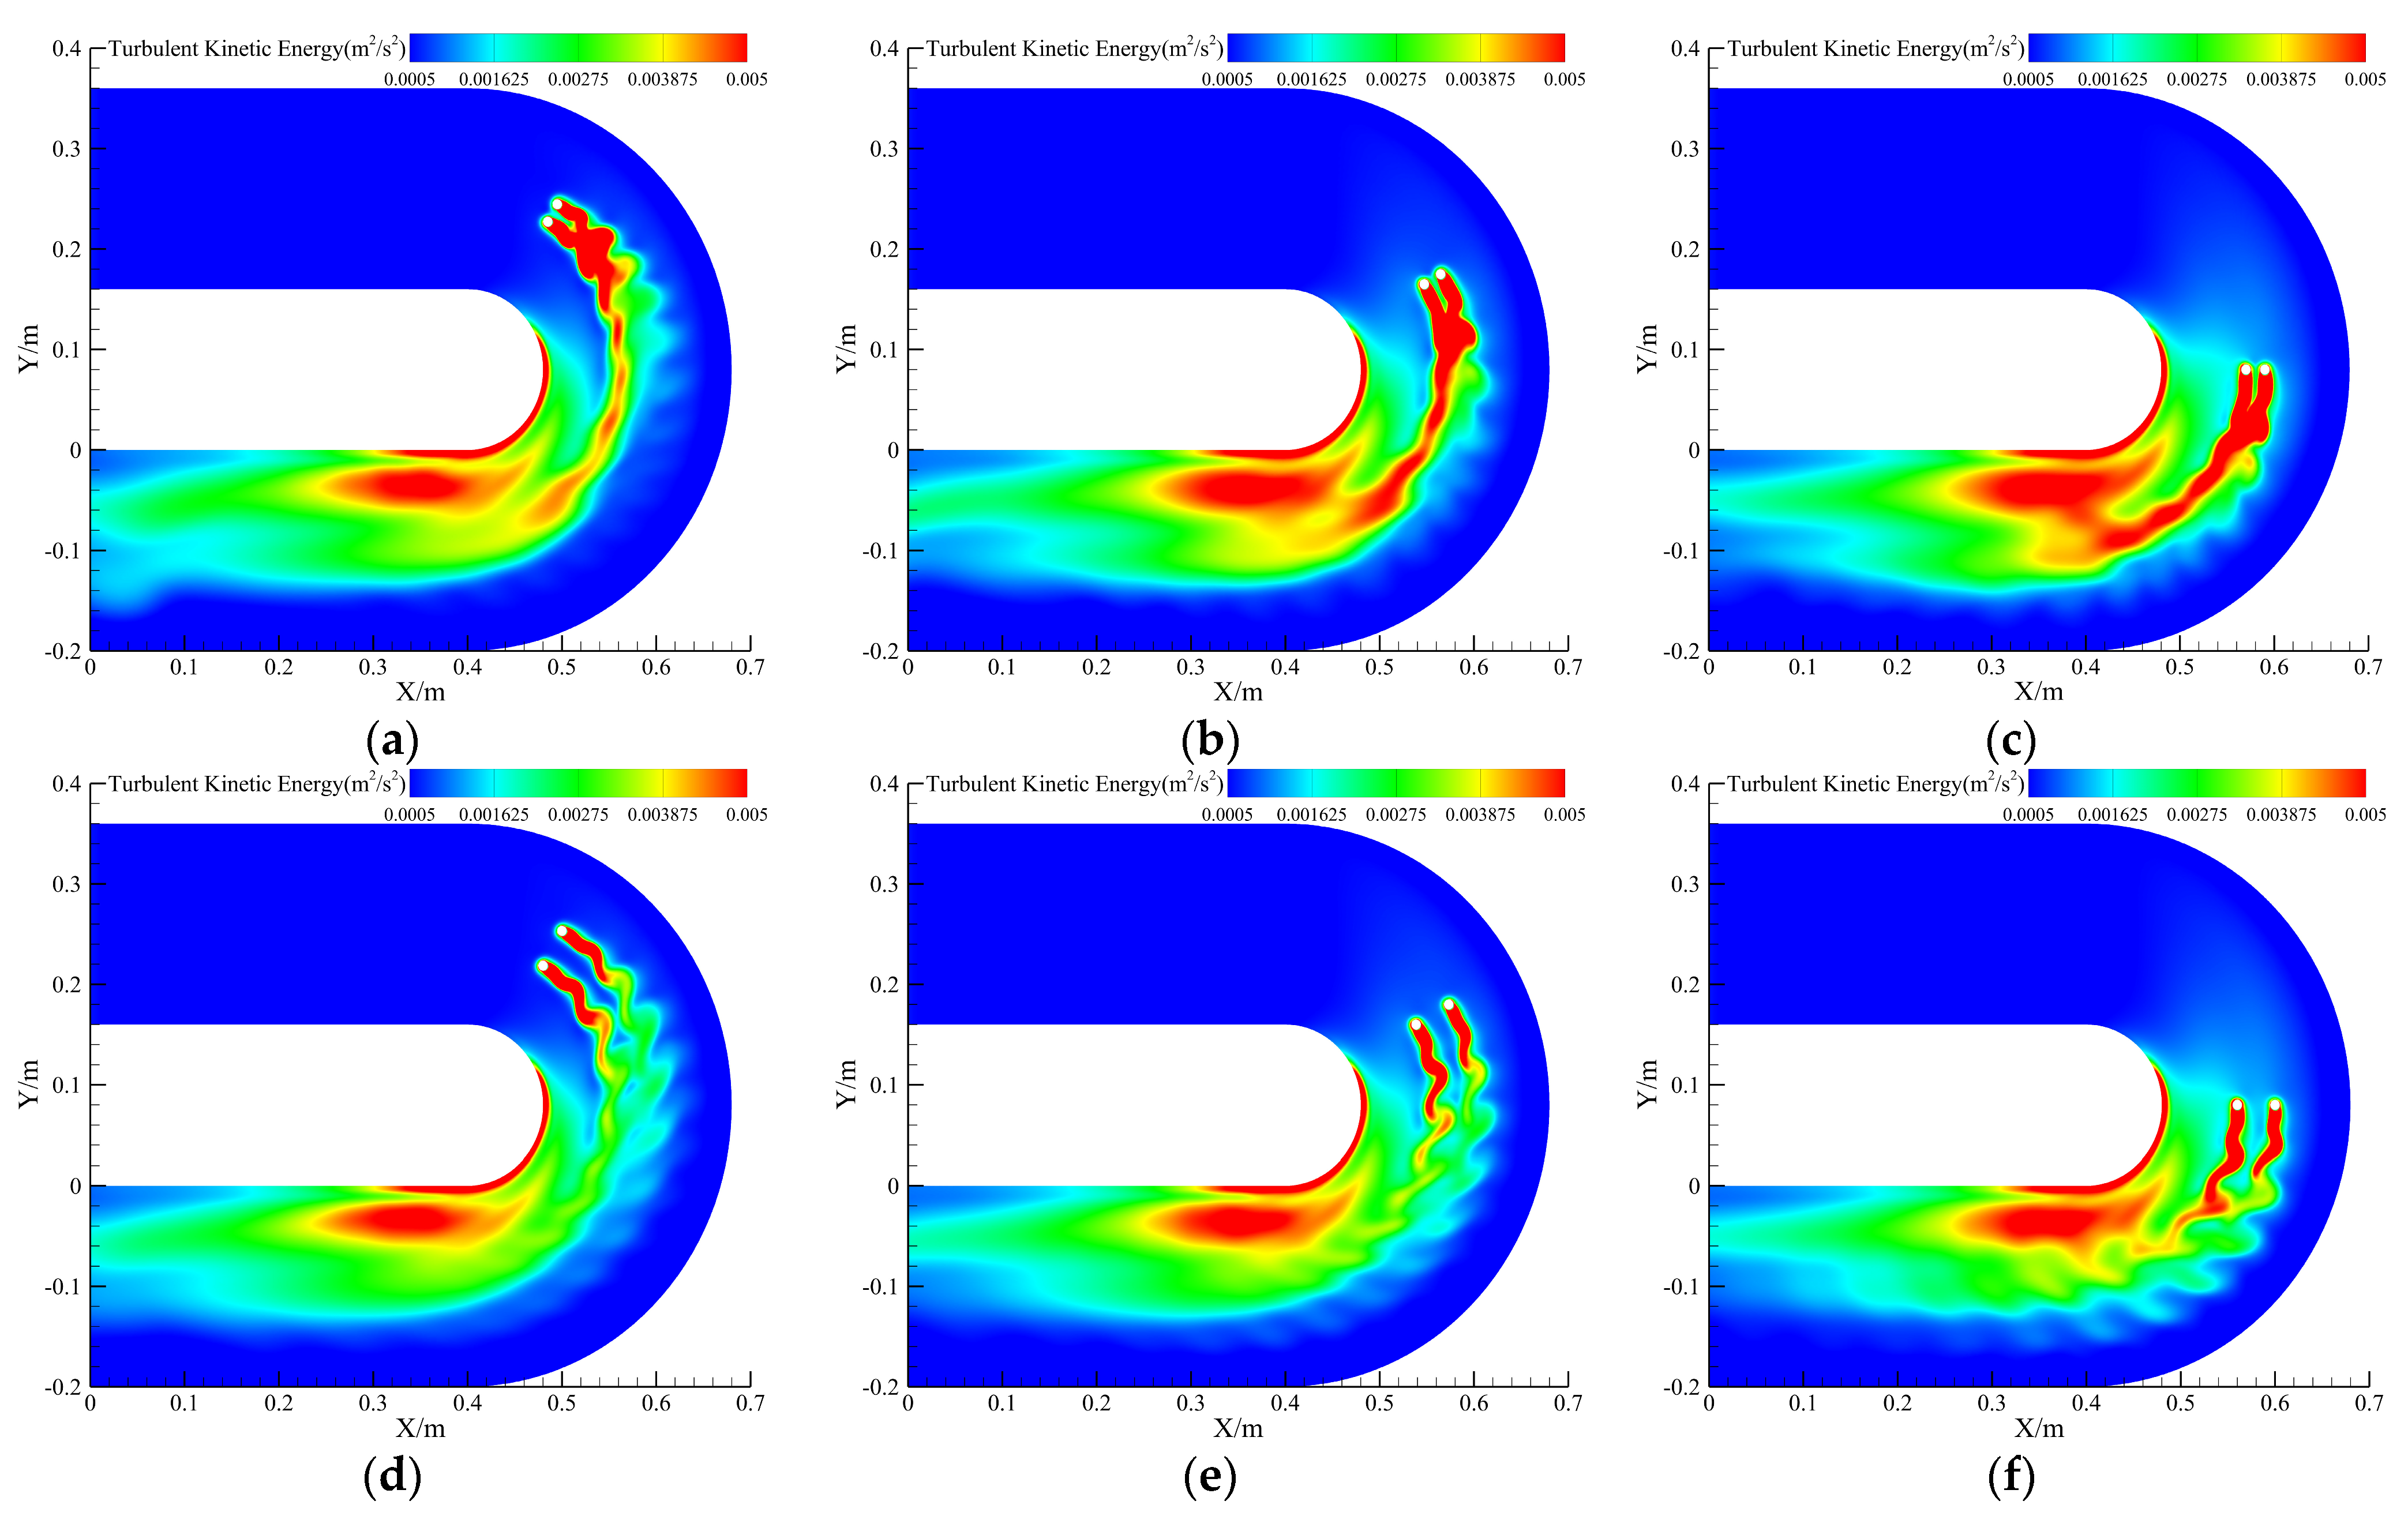
To analyze the characteristics of vortex structures and turbulent kinetic energy (TKE) distribution, Figure 10 presents the TKE contours under different operating conditions at t = 4 s. The results show that, for L/D = 2 with an arrangement angle of α = 30°, the secondary flow effect is relatively weak, and the wake energy distribution is comparatively uniform. For L/D = 4, the degree of energy concentration on the inner side is generally reduced. Among them, the energy concentration is least pronounced in the α = 30° case, and the energy magnitude in the same region is significantly lower than that in the L/D = 2 condition. Overall, an increase in the arrangement angle promotes energy concentration on the inner side of the bend, and this effect is more pronounced at smaller spacing ratios, indicating that the interference between the cylinders plays a dominant role in the energy distribution. The concentration of TKE on the inner side of the bend is mainly attributed to the centrifugal-induced lateral pressure gradient and the velocity difference generated by secondary flow. These effects continuously drive the wake structures toward the inner bend, resulting in asymmetric energy accumulation and enhanced local flow instability.
Figure 10.
Instantaneous TKE distribution on the spanwise section at Z = 1/2H: (a) L/D = 2, α = 30°; (b) L/D = 2, α = 60°; (c) L/D = 2, α = 90°; (d) L/D = 4, α = 30°; (e) L/D = 4, α = 60°; (f) L/D = 4, α = 90°.
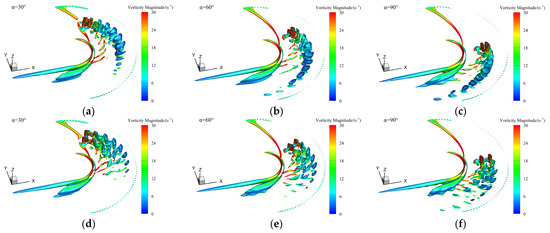
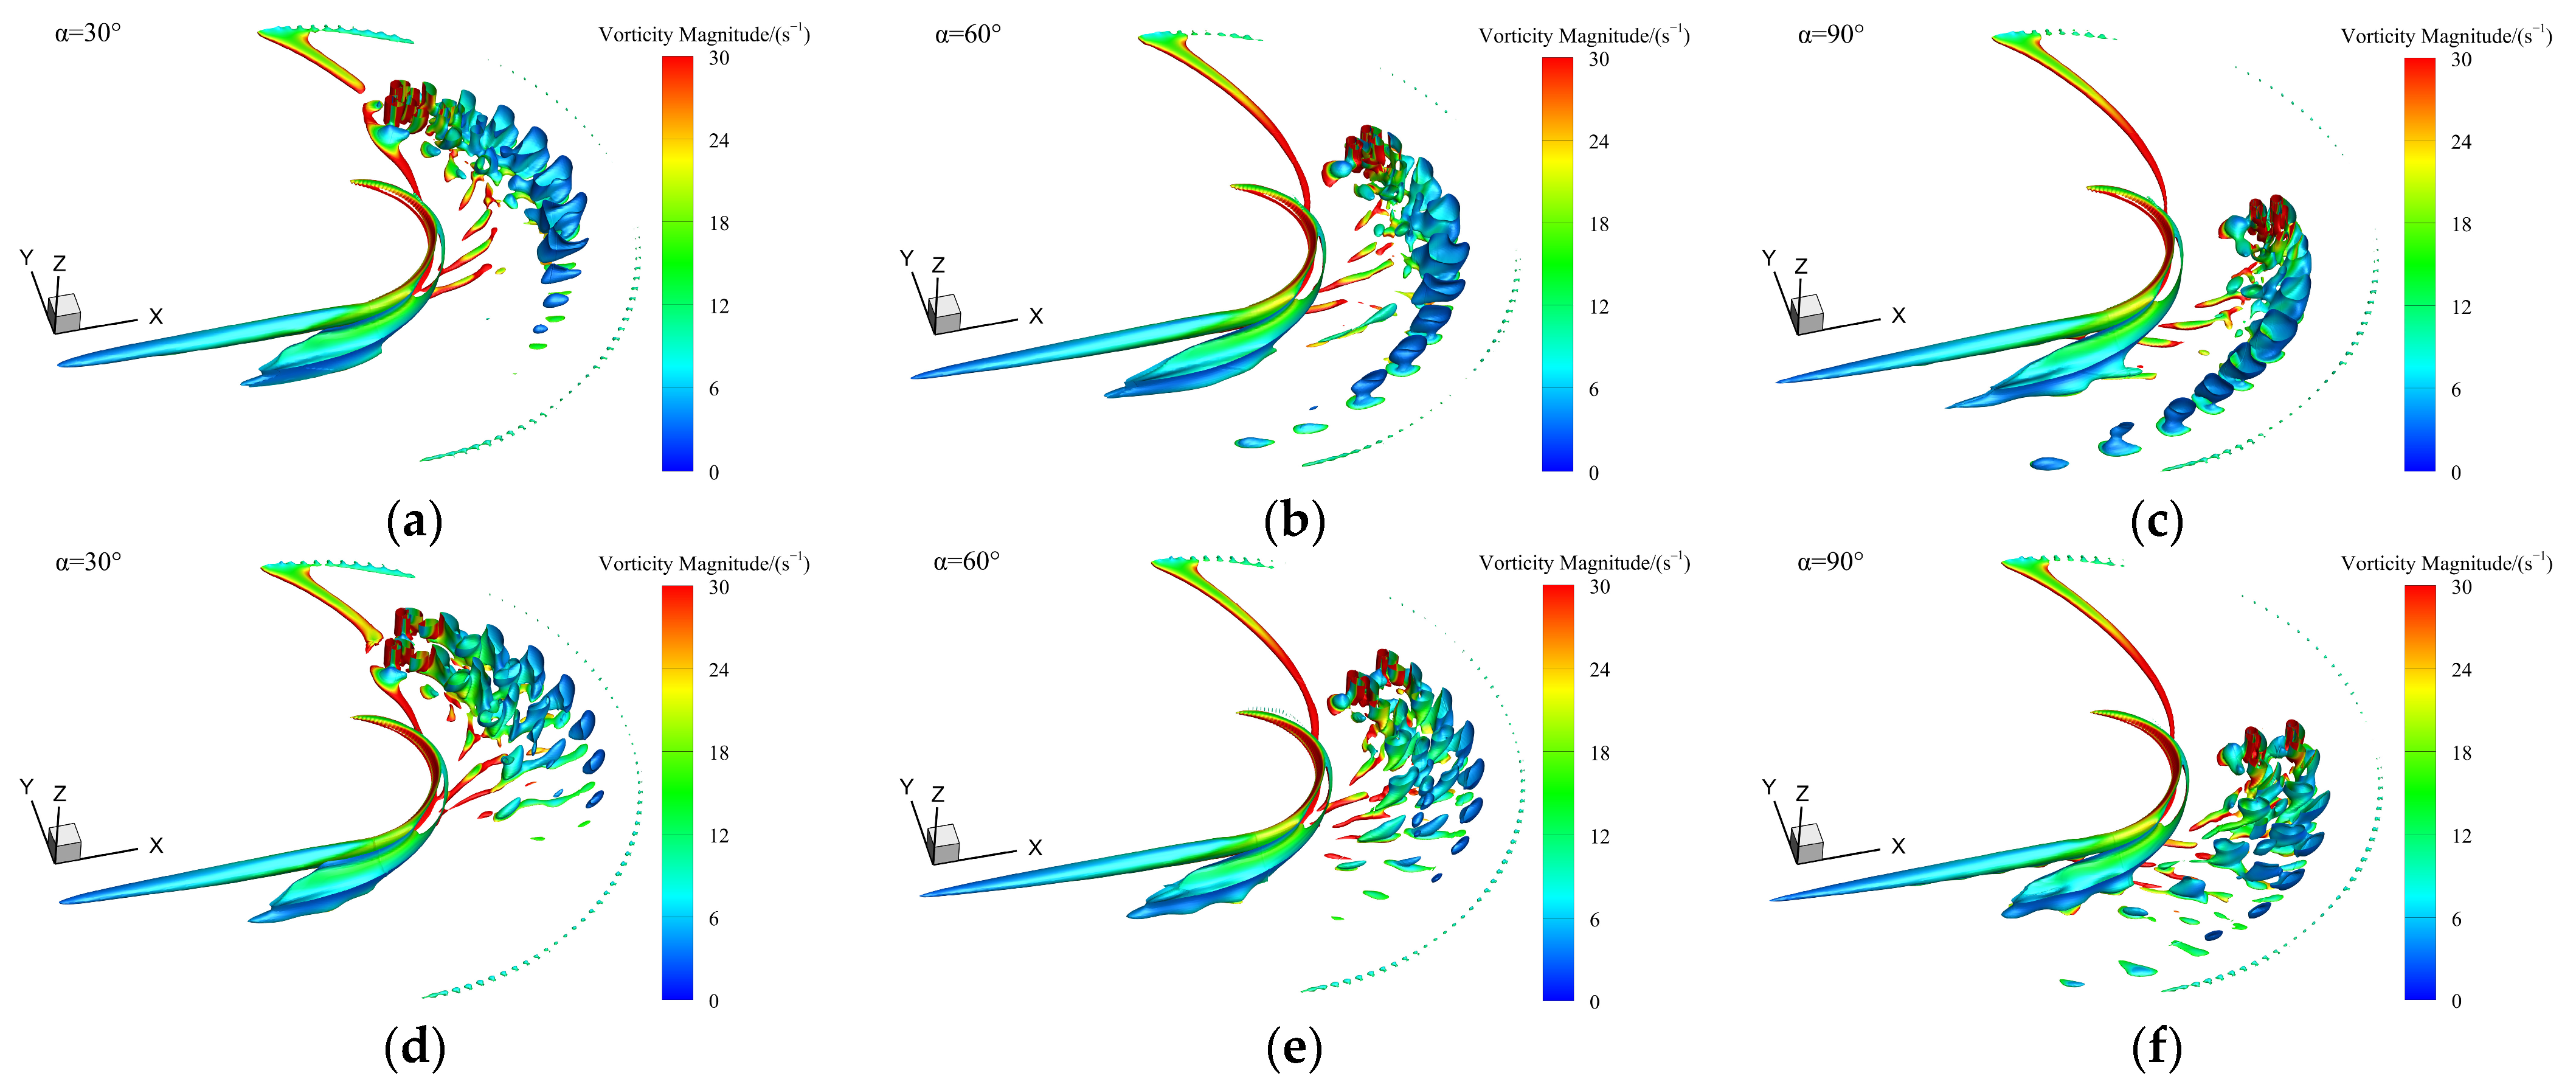
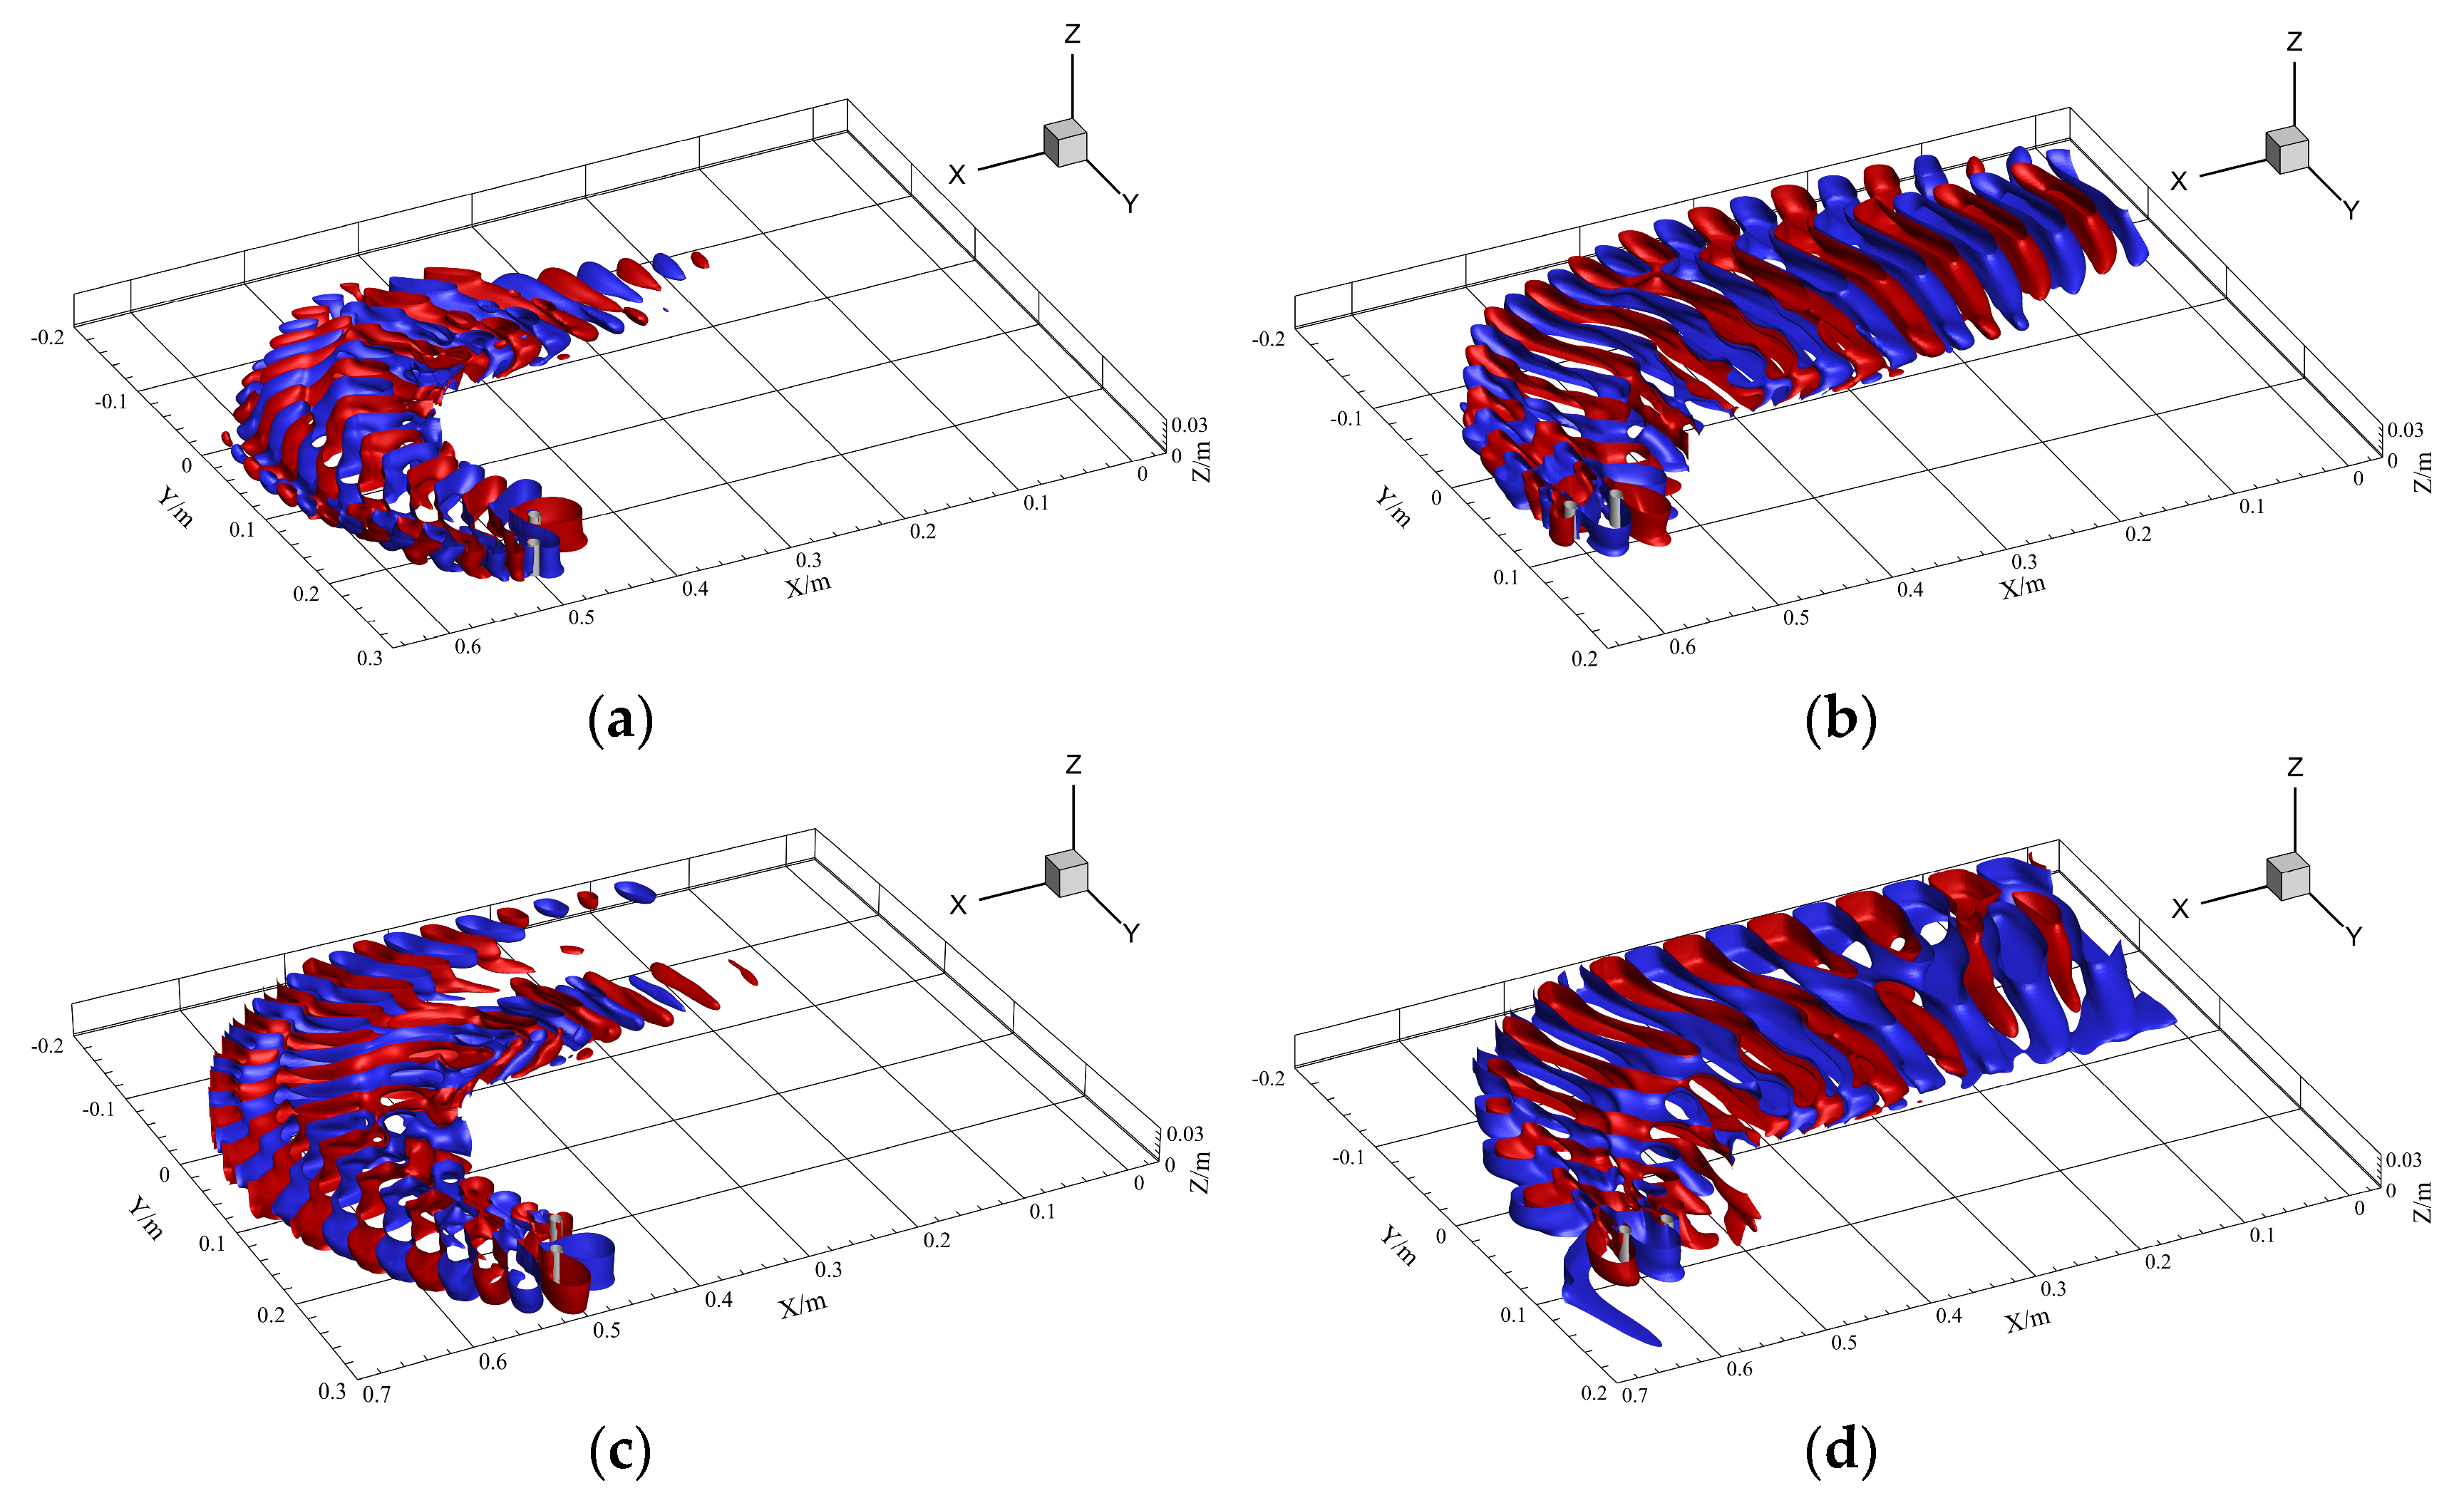
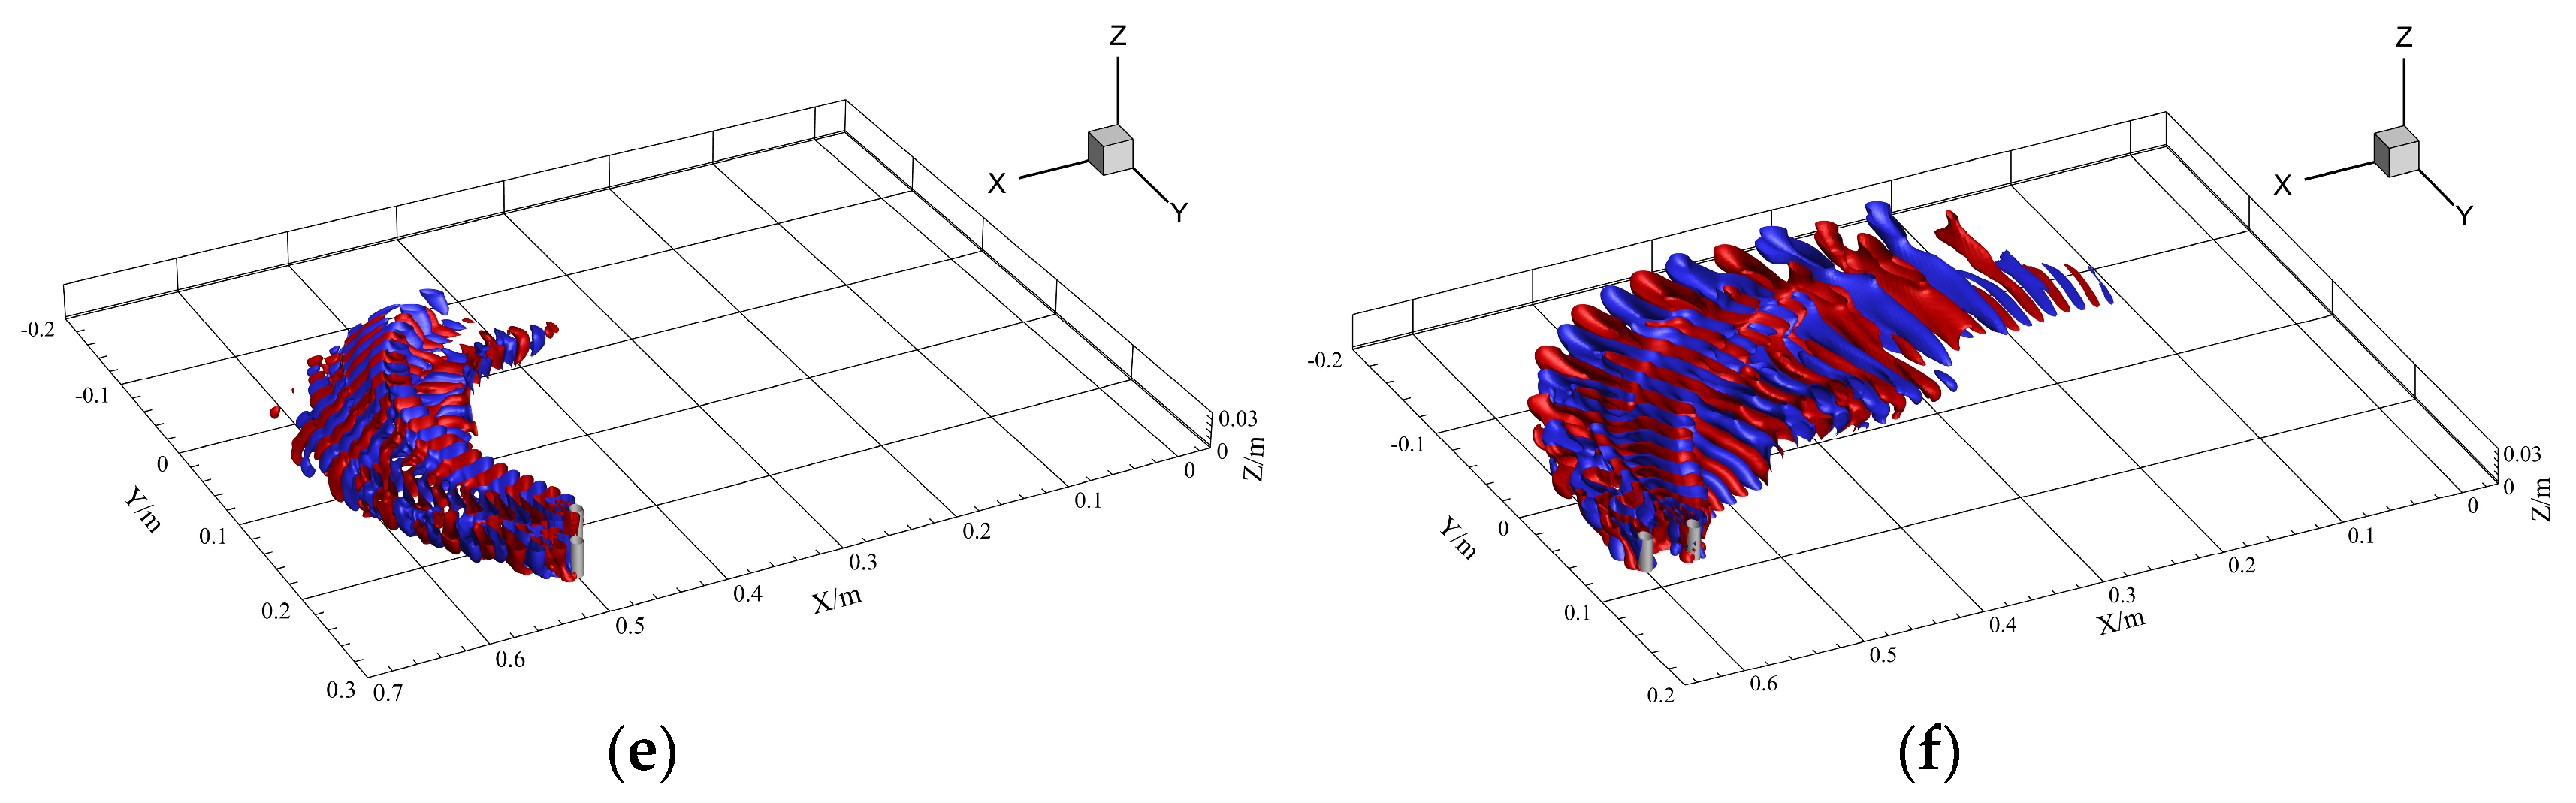
To reveal the spatial distribution of the wake flow at different placement angles, Figure 11 presents the vortex structure distribution on the isosurface of the Q-criterion with Q = 2. At α = 30°, the difference between the inner and outer vortex structures is significant. As the spacing ratio increases, the effects of the gap flow and secondary flow weaken, the vortex street structure becomes clearer and the vortex scales are relatively dispersed. When the placement angle increases to α = 60° and α = 90°, the scale of the vortices shed from the wake region gradually becomes larger under both spacing ratio conditions. Moreover, influenced by the curvature effect, the wake vortex structures shift toward the inner side of the bend. At α = 90°, the intensified gap-flow switching and shear-layer interaction enhance the breakdown of large-scale vortices into smaller structures, leading to stronger high-frequency fluctuations and increased wake instability. This effect becomes more pronounced at smaller spacing ratios due to stronger wake coupling between the two cylinders. Overall, as the placement angle increases, the wake structure gradually evolves from distinctly asymmetric to a concentration toward the inner side, a trend that is consistent with the turbulent kinetic energy distribution shown in Figure 10.
Figure 11.
Three-dimensional wake vortex structures of dual cylinders in a curved channel: (a) L/D = 2, α = 30°; (b) L/D = 2, α = 60°; (c) L/D = 2, α = 90°; (d) L/D = 4, α = 30°; (e) L/D = 4, α = 60°; (f) L/D = 4, α = 90°.
However, the above results are insufficient to characterize the spatiotemporal coherent distribution of vortex structures and the optimal statistical features of the flow field. Therefore, the following section introduces statistical analysis methods, including the SPOD method, to further examine the dominant frequencies and modal energies of the flow field.
Gaussian kernel density estimation (KDE) is first applied to obtain the probabilistic distribution of turbulent velocity. The bandwidth is selected using Scott’s rule, and the bandwidth matrix is constructed based on the sample covariance matrix. The corresponding formulation is given as follows:
Here, H denotes the bandwidth matrix, n is the number of samples, d represents the data dimensionality, and cov denotes the covariance matrix of the data. For one-dimensional data, d = 1 is used, and cov reduces to the variance; thus, the above formula can be simplified as
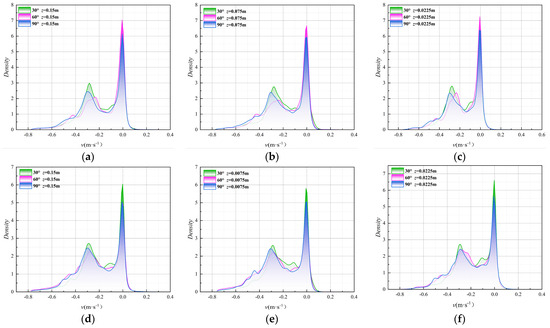
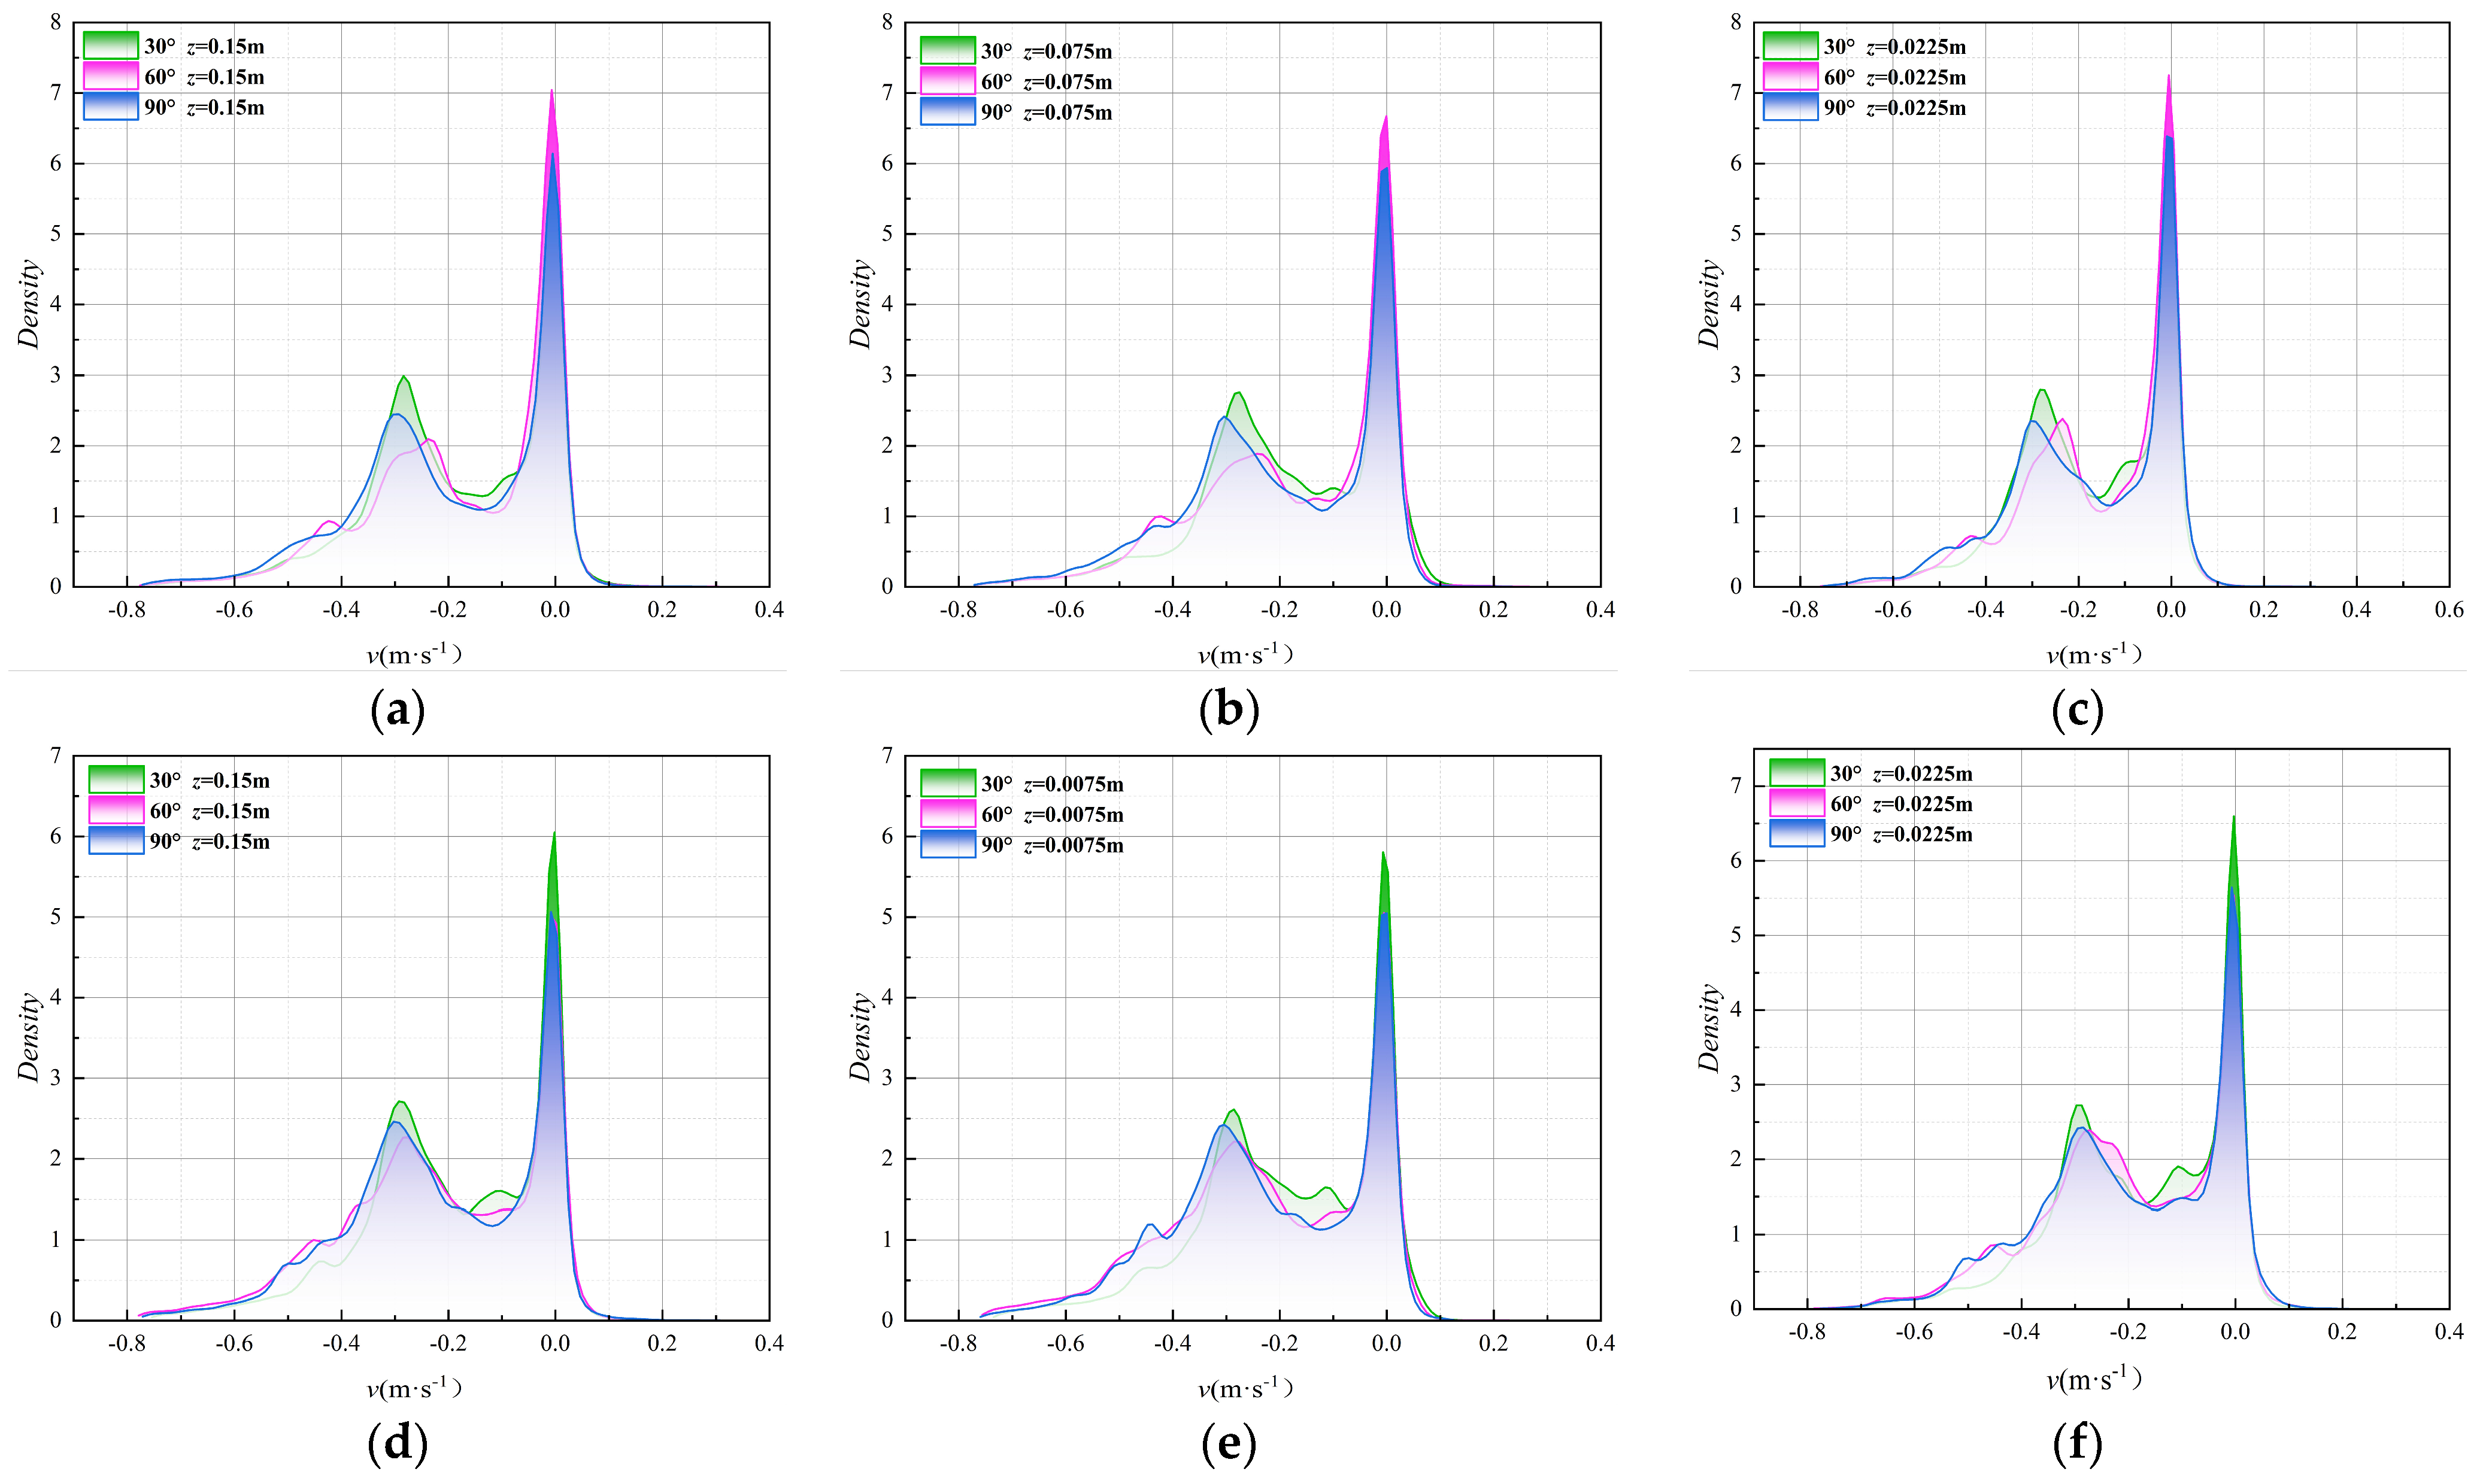
Figure 12 shows the Gaussian kernel density distribution of the vertical mean velocity for L/D = 2 and L/D = 4. The results show that the velocity amplitude ranges from approximately −0.8 m/s to 0.4 m/s, with most data concentrated near zero, and the overall velocity distribution exhibits a distinctly skewed characteristic. Meanwhile, the wider distribution in the negative range indicates that the recirculation zone dominates. The peak probability density gradually increases with water depth and is most pronounced at the cross-section of z = 0.0225 m, indicating that the transverse velocity in this region is more concentrated and exhibits weaker fluctuations. Furthermore, comparing the six cases reveals that the maximum peak occurs at α = 60° for L/D = 2 and at α = 30° for L/D = 4, indicating that the velocity fluctuation amplitude is minimized and the flow is likely the most stable under these conditions.
Figure 12.
Probability density distributions of time-averaged spanwise velocity along y-direction at different water depth planes: (a) L/D = 2, α = 30°; (b) L/D = 2, α = 60°; (c) L/D = 2, α = 90°; (d) L/D = 4, α = 30°; (e) L/D = 4, α = 60°; (f) L/D = 4, α = 90°.
4.4.2. SPOD Modal Energy Analysis of Dual Cylinders in a Curved Channel
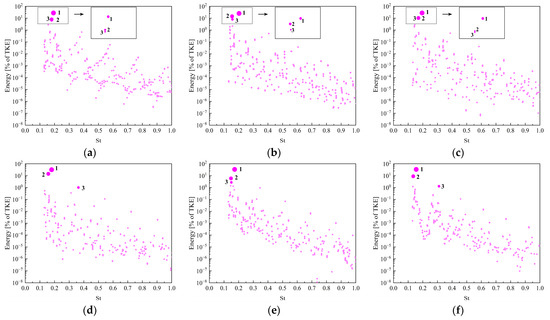
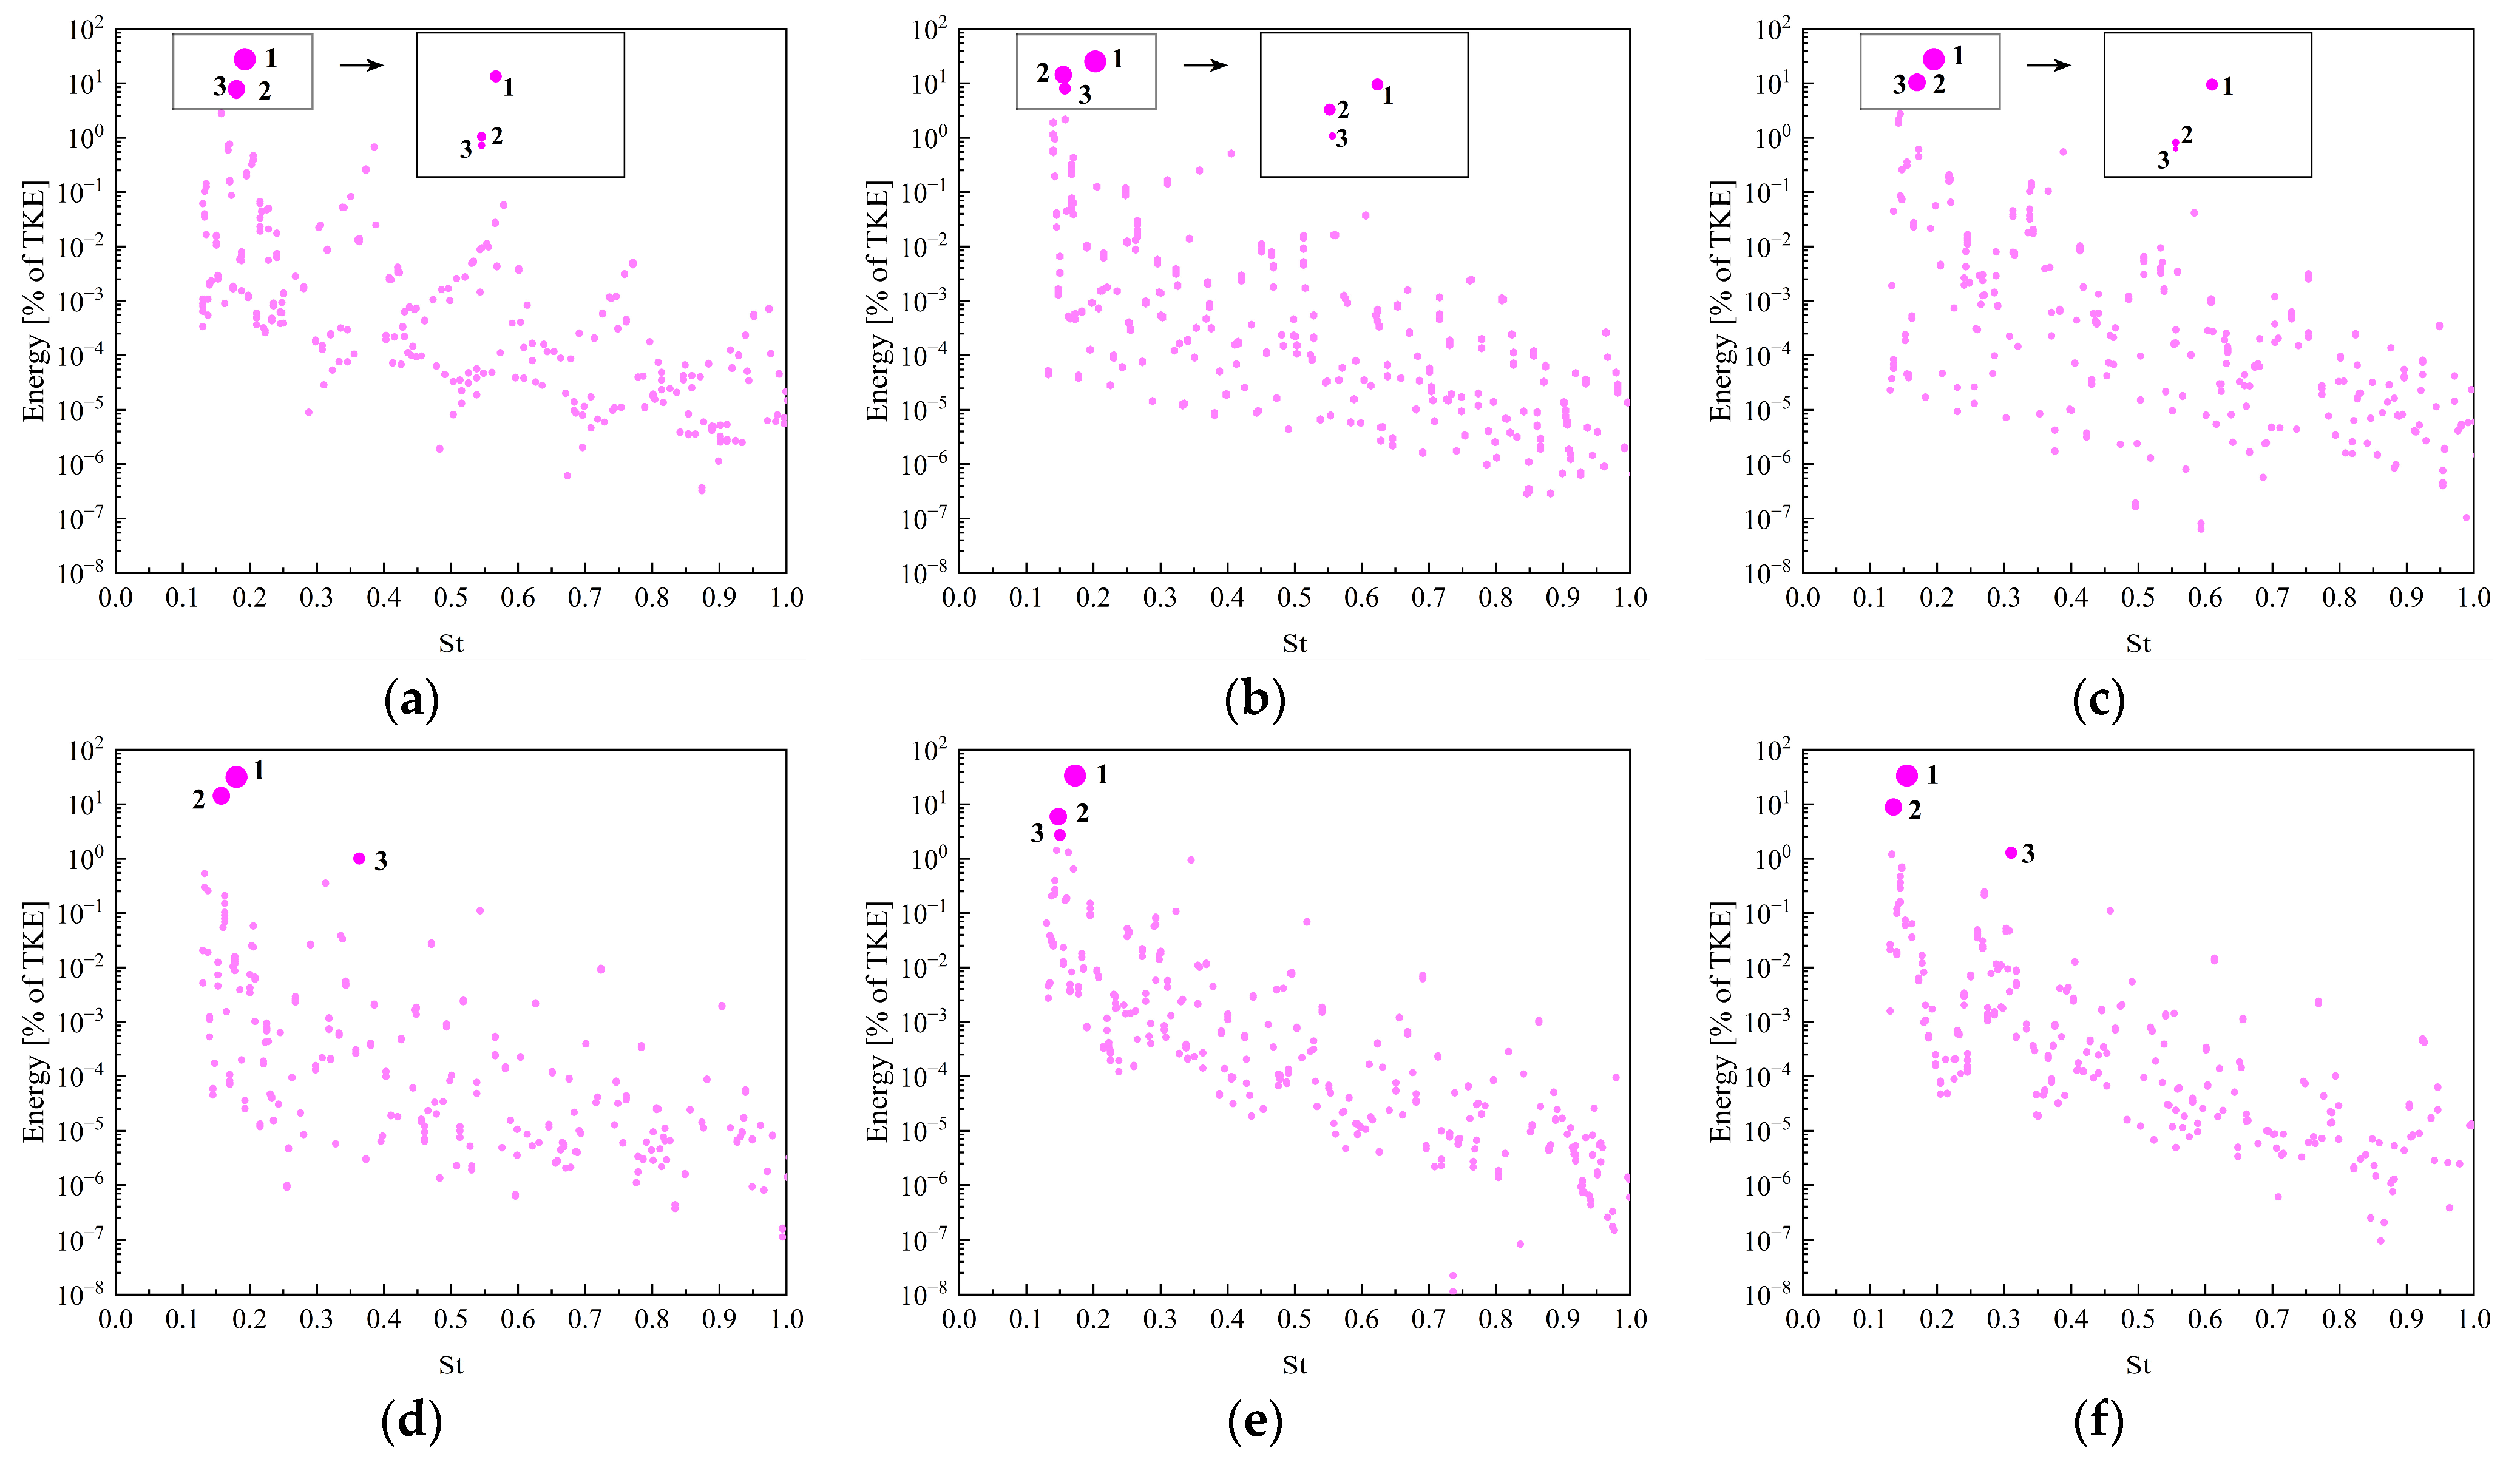
Next, the SPOD method is employed to perform statistical analysis on the full flow field data of two dual circular cylinders in a three-dimensional curved channel. In this section, based on a filtering scale of Nf = 20, the first three pairs of dominant modes with significant energy content are extracted. The spatiotemporal coherent structures under spacing ratios of L/D = 2 and 4 with placement angles of α = 30°, 60°, and 90° are investigated to identify the comparatively favorable configuration.
Figure 13 shows the modal energy distribution; it demonstrates that the modal energy for the L/D = 2 case is mainly concentrated near St = 0.2, which is consistent with the energy concentration phenomenon caused by a narrow spacing shown in Figure 10. In contrast, for the L/D = 4 case, the first three pairs of modes at different placement angles do not exhibit a complete energy concentration phenomenon. Energy concentration occurs at α = 60°, while higher-order harmonic peaks appear at α = 90°, which may be due to spurious harmonics induced by large fluctuations in energy concentration.
Figure 13.
Modal energy distributions of dual cylinders at different placement angles in a curved channel: (a) L/D = 2, α = 30°; (b) L/D = 2, α = 60°; (c) L/D = 2, α = 90°; (d) L/D = 4, α = 30°; (e) L/D = 4, α = 60°; (f) L/D = 4, α = 90°.
The concentrated modal energy around the dominant frequency for L/D = 2 indicates that the wake dynamics are governed by a strongly coupled vortex shedding process. The narrow gap enhances the interaction between the two shear layers, leading to synchronized large-scale coherent structures and intensified wake instability. This behavior is consistent with the concentrated TKE and merged vortex structures observed in Figure 10 and Figure 11.
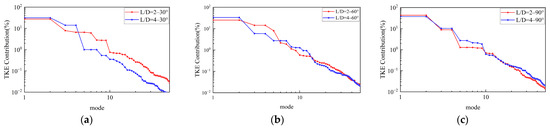
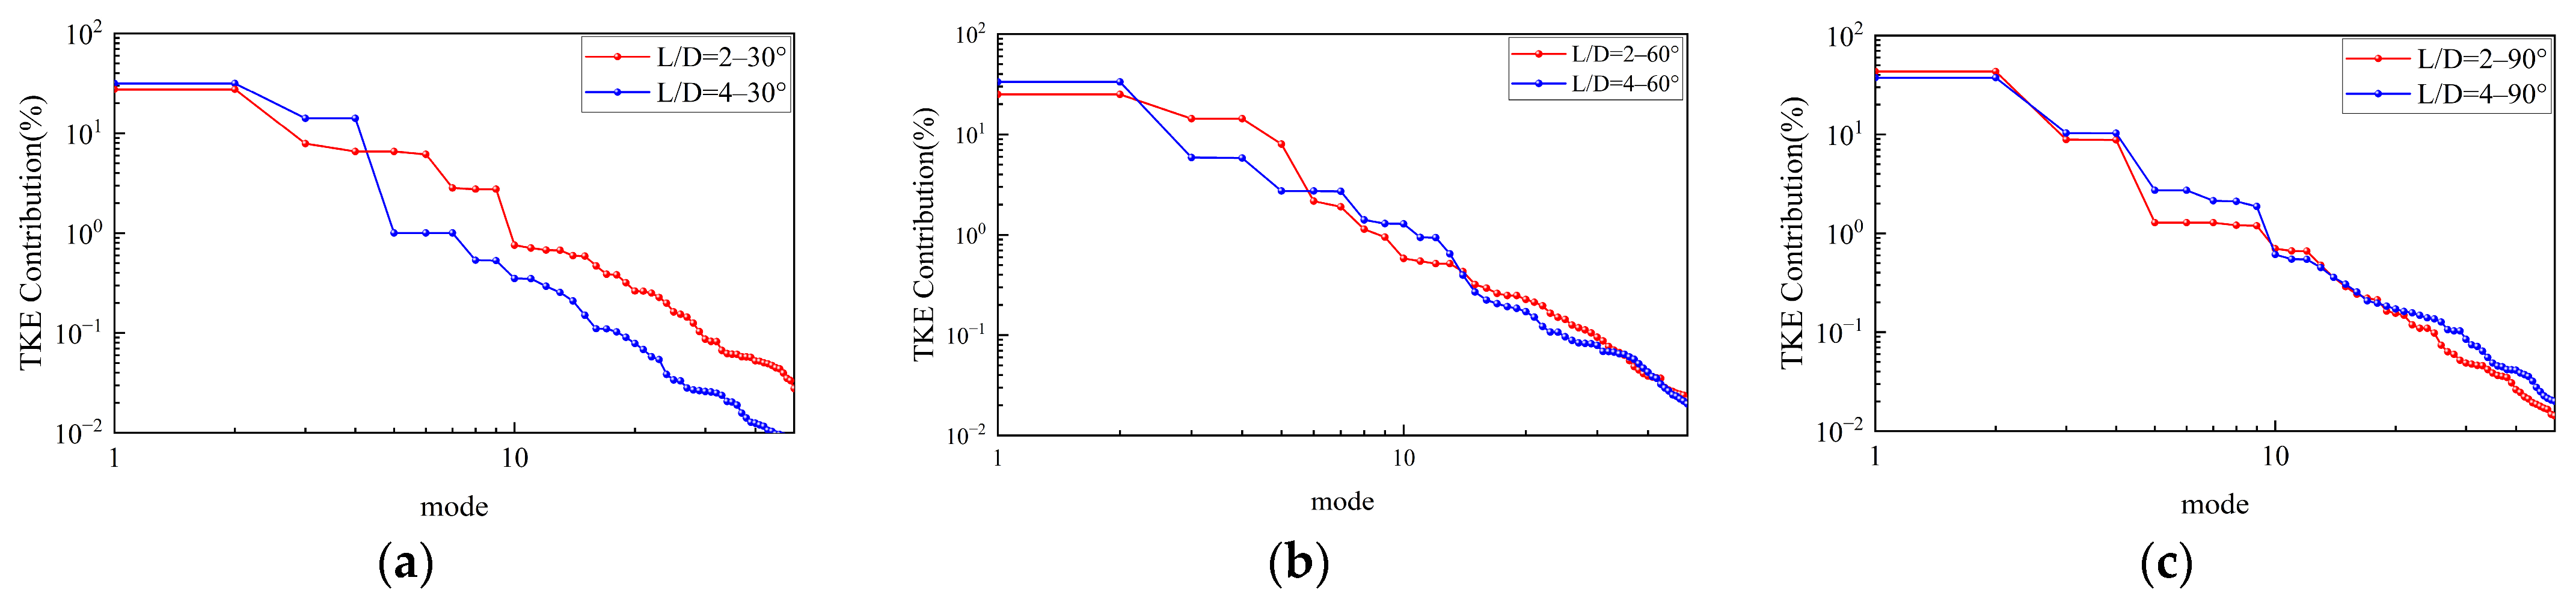
Figure 14a–c show the distributions of the energy fractions for the first 50 SPOD modes at different placement angles. In all cases, the first pair of modes dominates, followed by a rapid decay in modal energy, indicating that the flow field energy is primarily concentrated in the low-order modes. At α = 30° and 60°, the energy fraction of the first pair of modes for L/D = 4 is higher than that for L/D = 2, and the subsequent modes decay more rapidly. This indicates that the placement angle and larger spacing lead to a weakening of wake interference. As the placement angle increases to α = 90°, the energy fraction of the first pair of modes for L/D = 2 is slightly higher than that for L/D = 4, and their energy decay curves are nearly coincident, indicating that the flow field energy distributions tend to be consistent. The rapid decay of higher-order modal energy indicates that the flow fluctuations are primarily controlled by the dominant large-scale coherent structure, while small-scale disturbances are effectively suppressed. This behavior reflects improved wake stability and weaker vortex interaction.
Figure 14.
Energy fractions of the first 50 SPOD modes for side-by-side cylinders at different installation angles: (a) α = 30°; (b) α = 60°; (c) α = 90°.
4.4.3. SPOD Modal Coefficient Analysis of Dual Cylinders in a Curved Channel
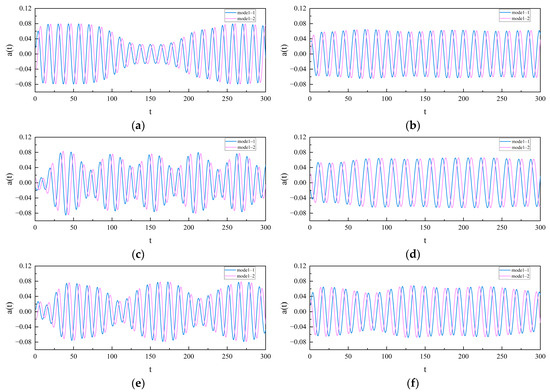
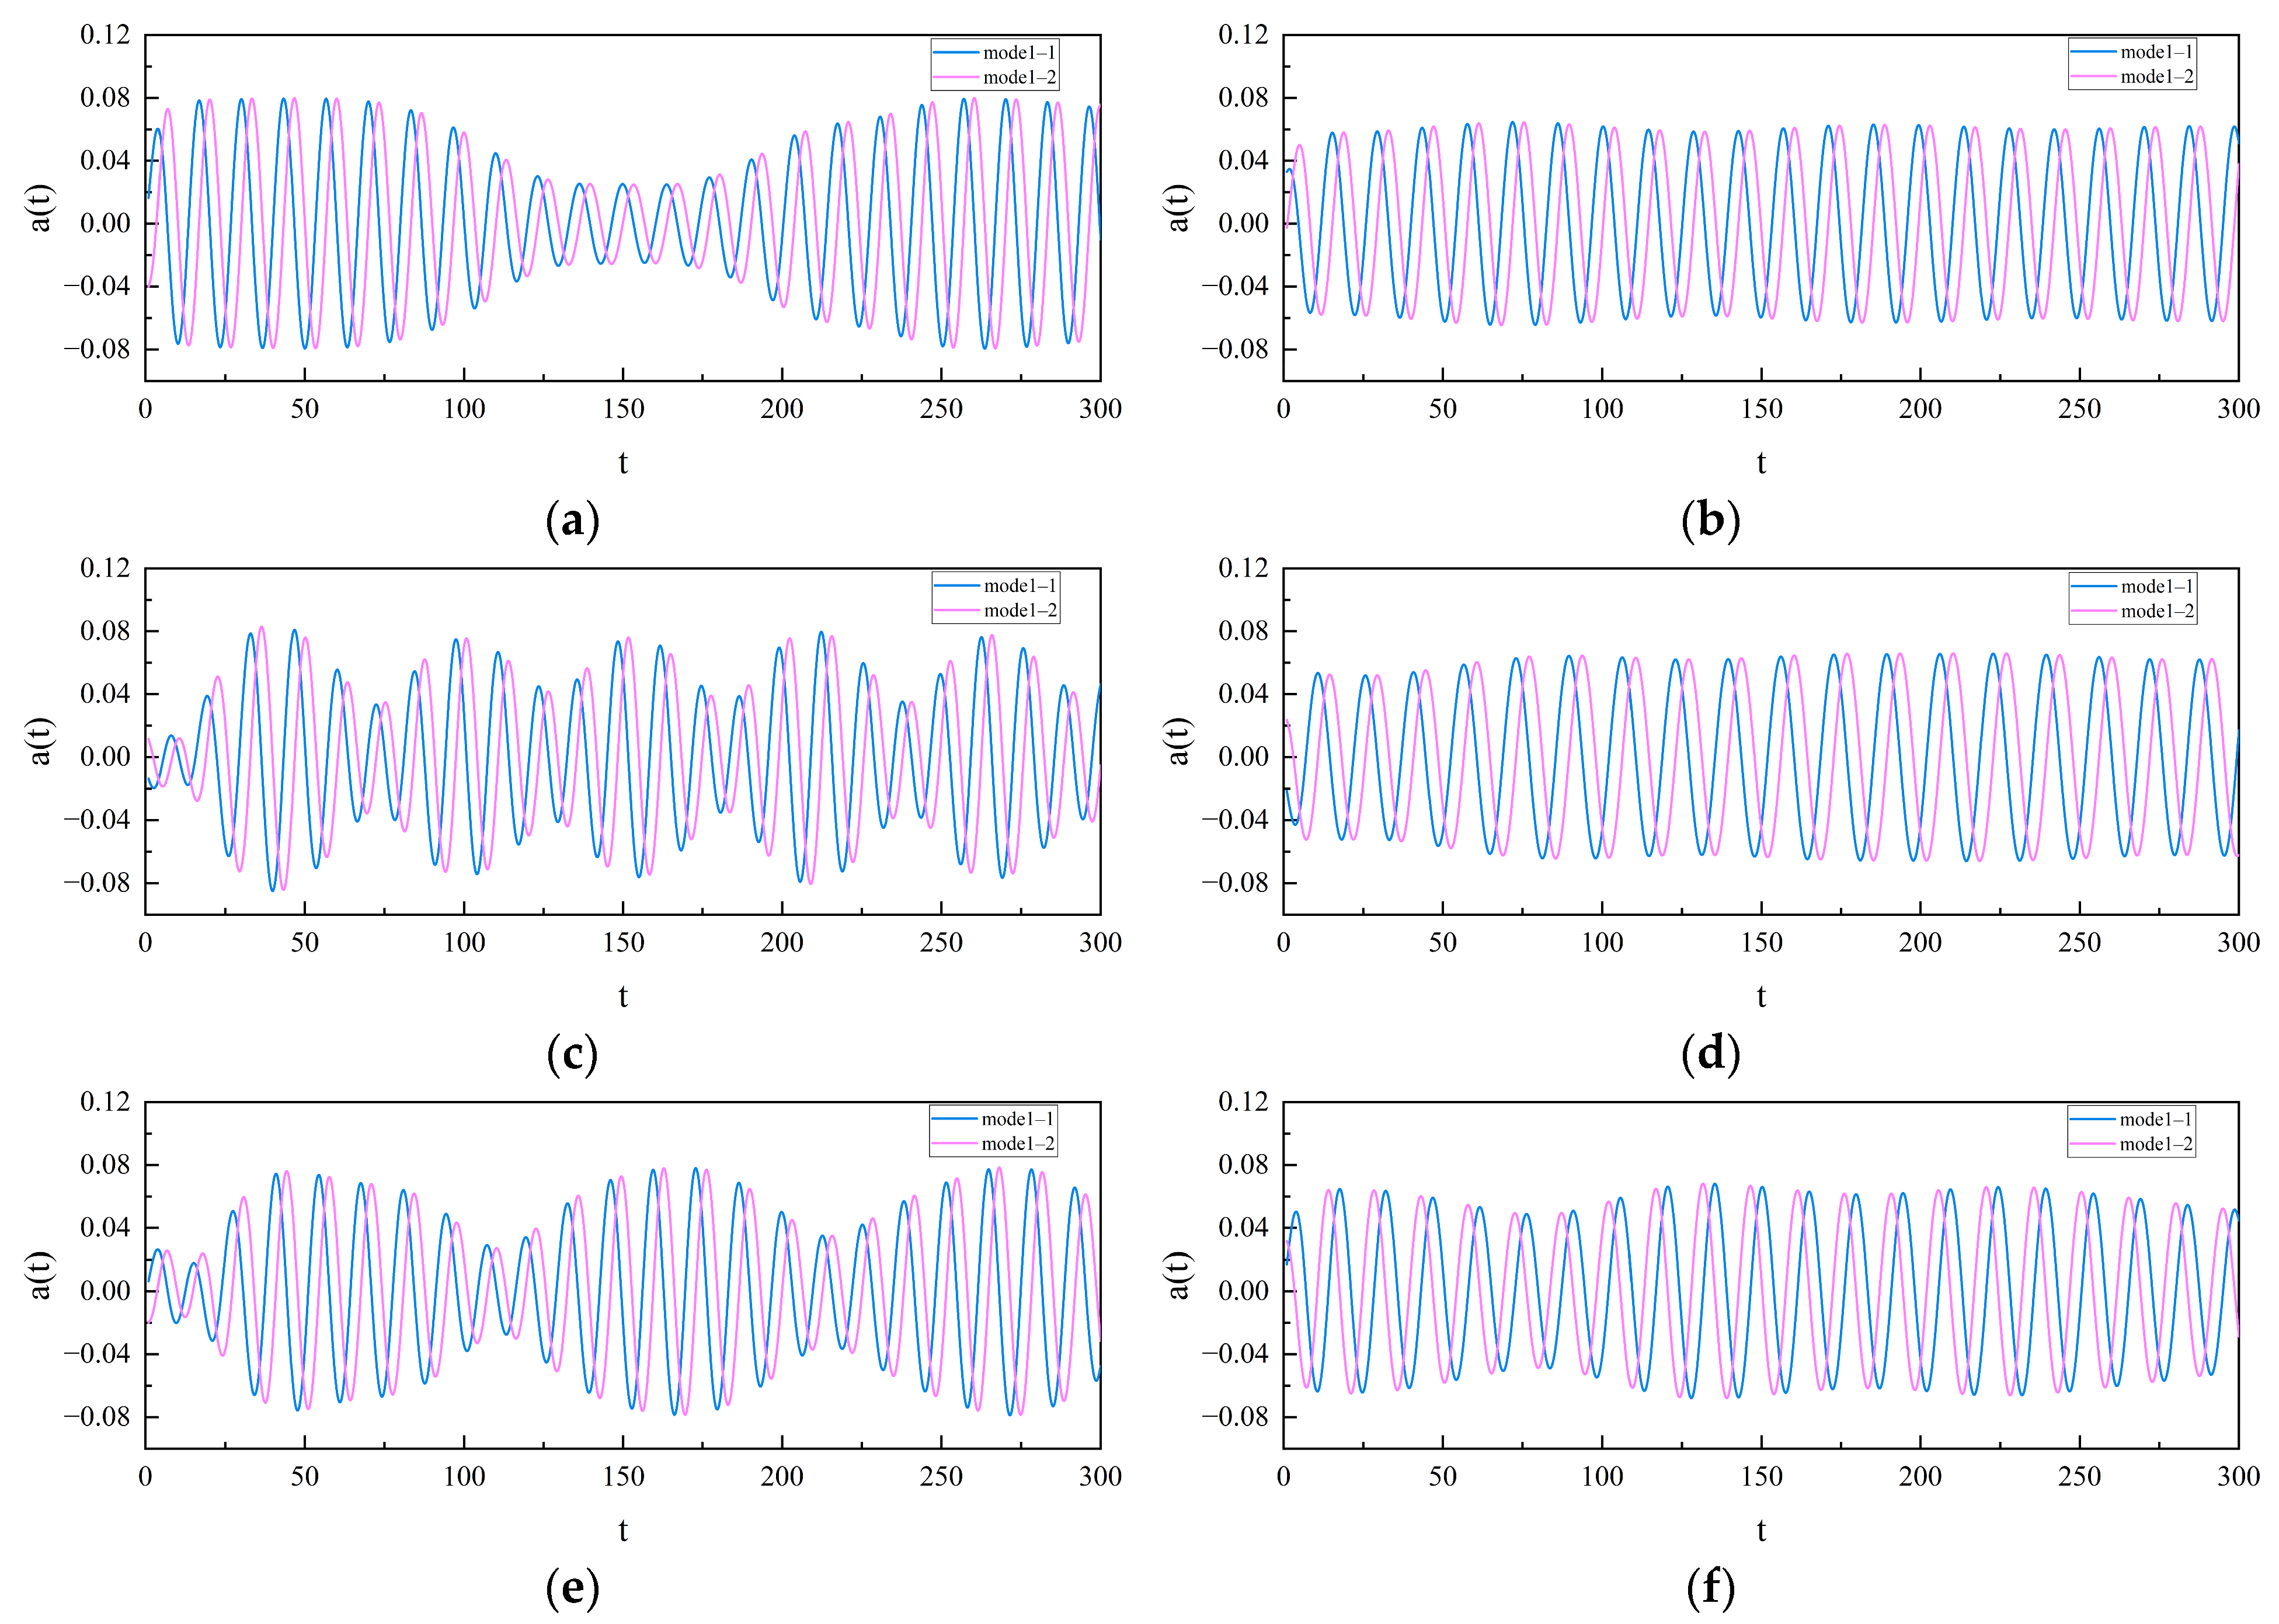
A total of 300 successive three-dimensional instantaneous snapshots are selected for analysis after the flow field reaches a statistically steady state. Figure 15 illustrates the temporal evolution characteristics of the coefficients of the first pair of modes for different flow fields. Figure 15 shows that all operating conditions exhibit approximately periodic oscillations, although notable differences in stability are observed. For L/D = 4, the modal coefficients a(t) exhibit relatively regular periodic oscillations with a nearly constant amplitude. In contrast, the amplitude is clearly modulated over time for L/D = 2, displaying non-stationary oscillation characteristics, which are most pronounced at α = 60°. The results indicate that L/D is the dominant factor influencing a(t). A small spacing ratio induces amplitude modulation and enhanced instability, while an increase in the placement angle further amplifies this effect.
Figure 15.
Time-Domain Analysis for the First Pair of Modes: (a) L/D = 2, α = 30°; (b) L/D = 4, α = 30°; (c) L/D = 2, α = 60°; (d) L/D = 4, α = 60°; (e) L/D = 2, α = 90°; (f) L/D = 4, α = 90°.
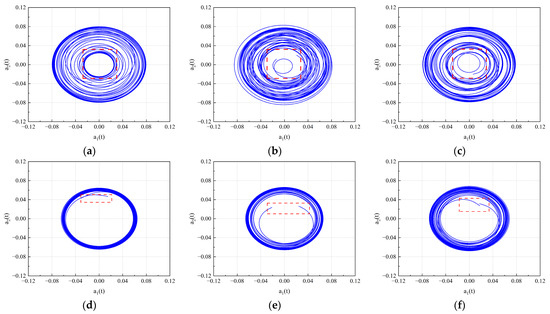
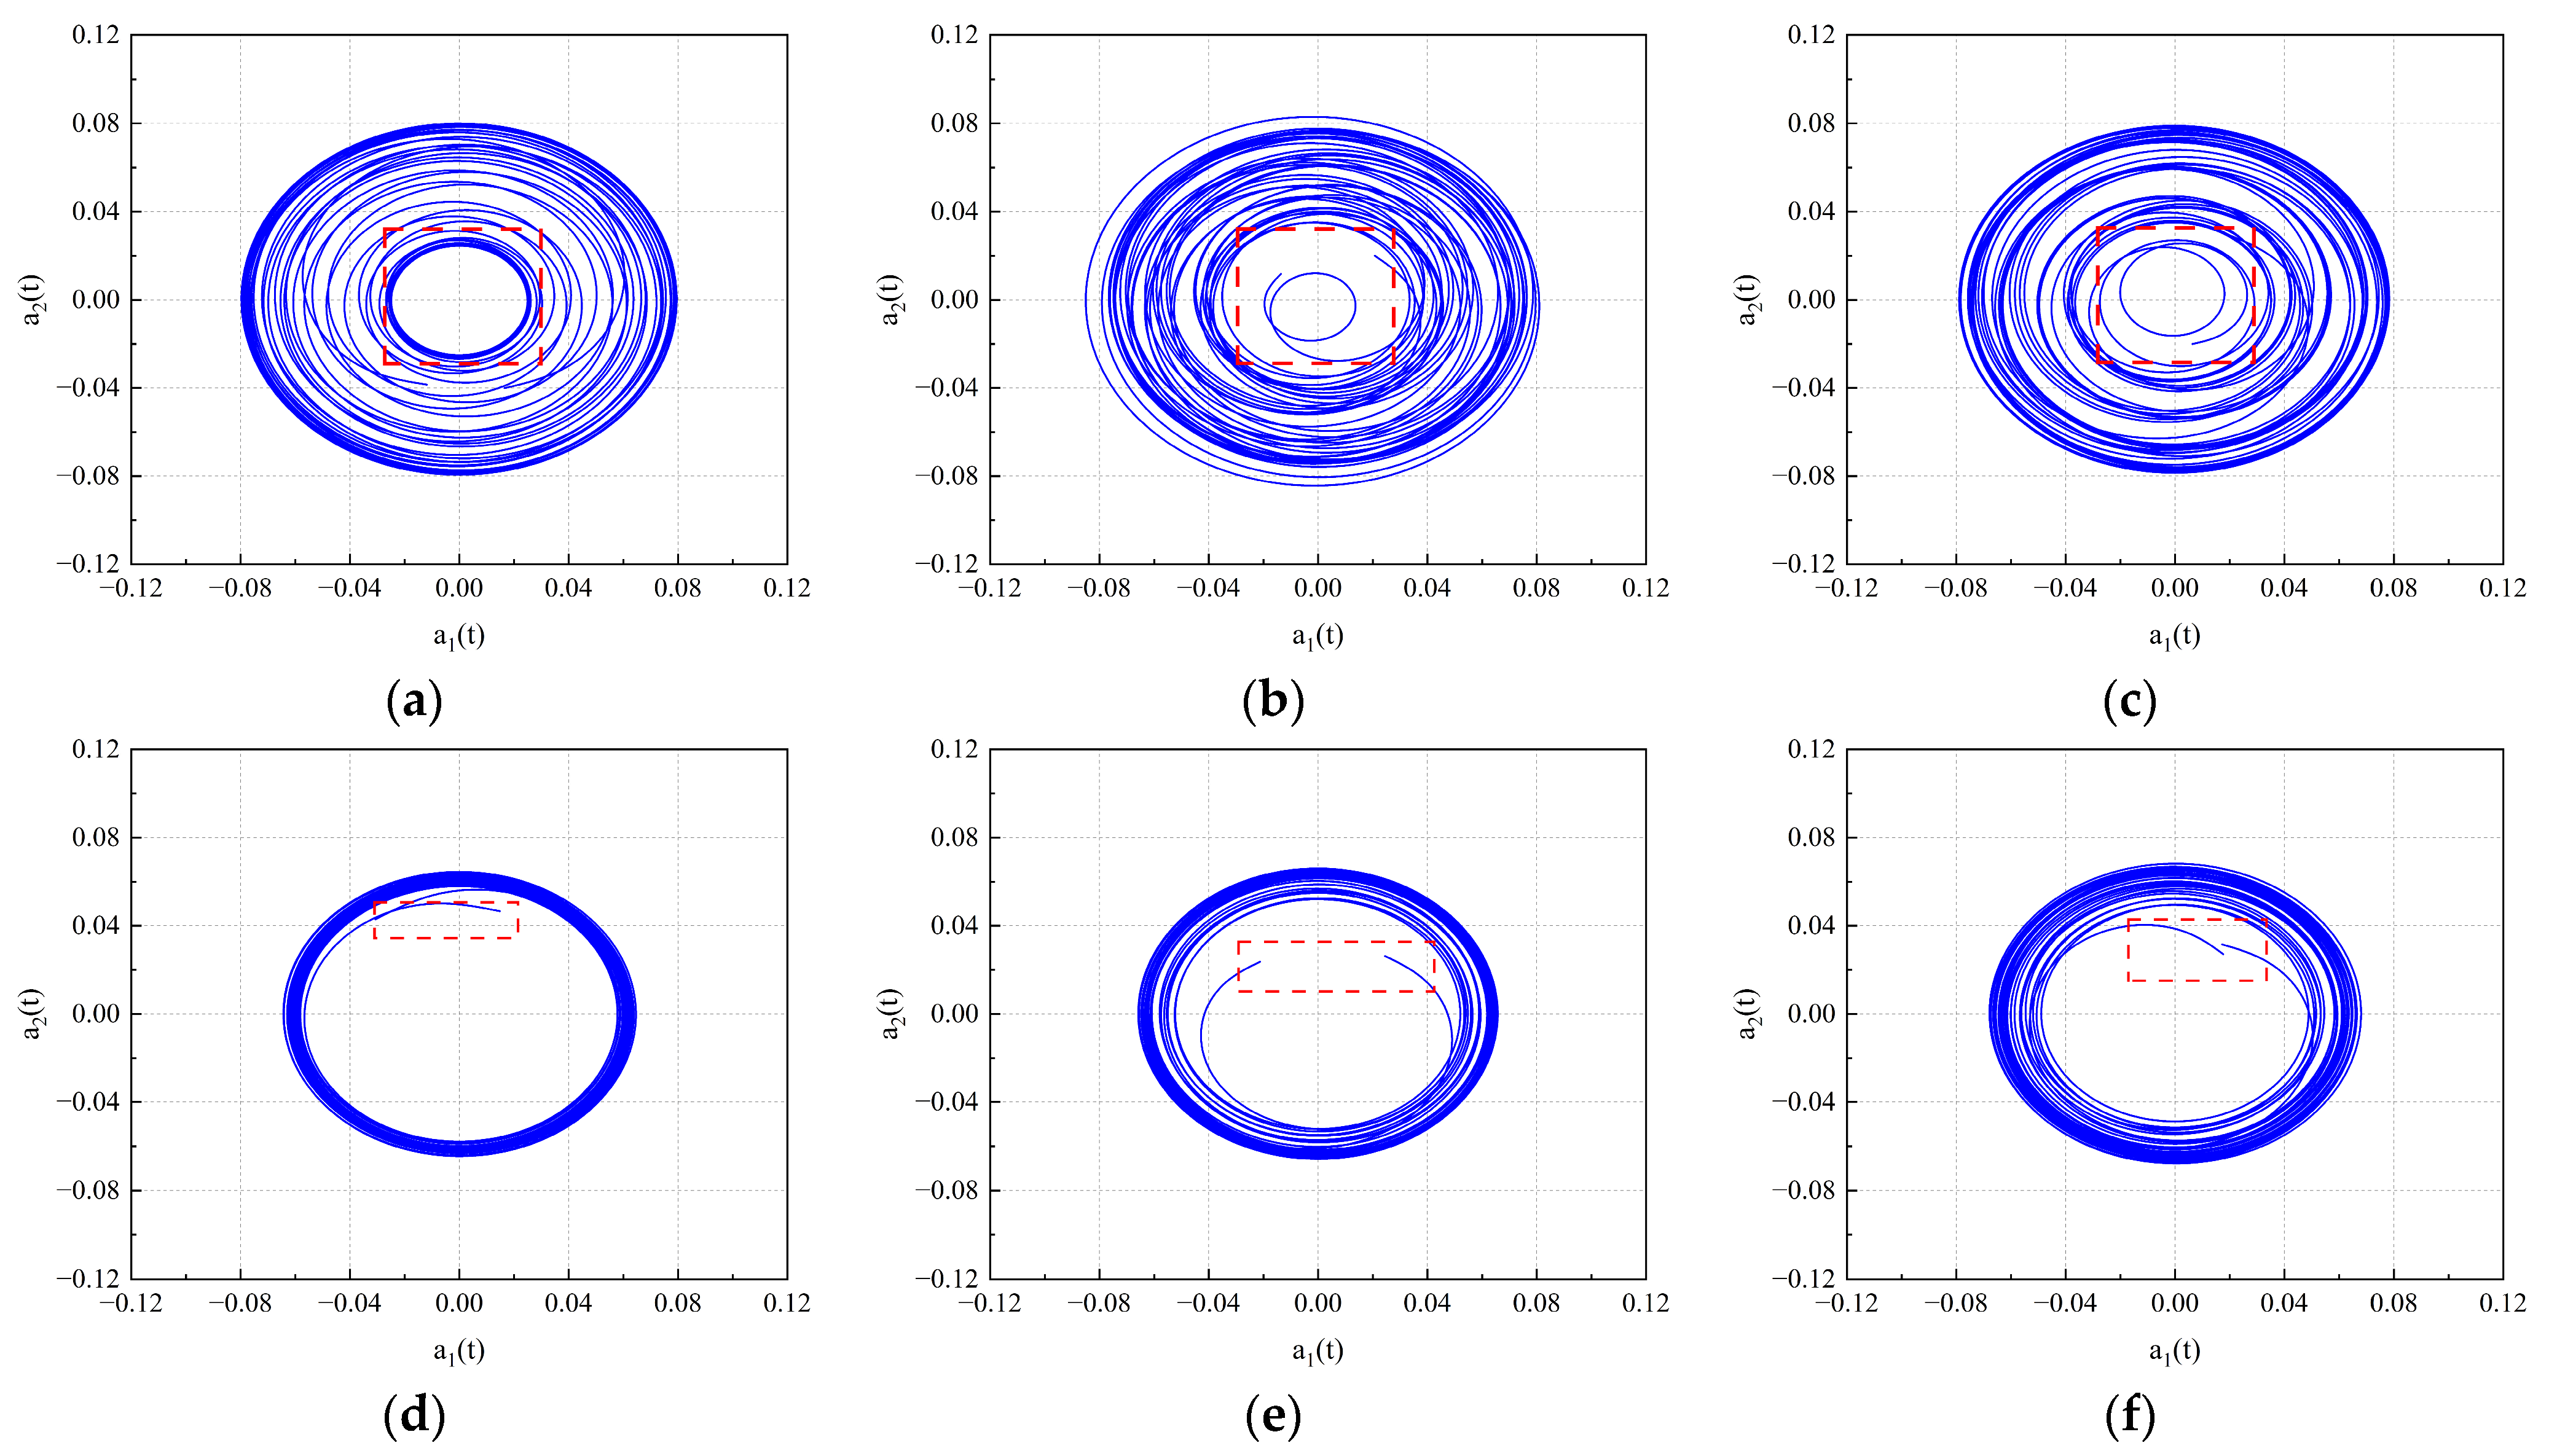
Based on the above results, the phase space trajectories of the coefficients for the first pair of modes are constructed, as shown in Figure 16. The results indicate that, at L/D = 2, the phase trajectory exhibits a significantly broadened and multilayered nested configuration, suggesting that amplitude modulation and interactions among multiscale flow structures cause the flow field to deviate from a stable periodic oscillatory state. Among them, the phase trajectory at α = 60° shows the greatest divergence, which corresponds to the strongest instability. At L/D = 4, each operating condition yields a single closed orbit, showing that the phase coupling between the modes remains relatively stable and the flow field is governed by a dominant frequency. Among them, the case of α = 30° yields the most convergent trajectory, which corresponds to the greatest stability.
Figure 16.
Phase-space analysis for the First Pair of Modes: (a) L/D = 2, α = 30°; (b) L/D = 2, α = 60°; (c) L/D = 2, α = 90°; (d) L/D = 4, α = 30°; (e) L/D = 4, α = 60°; (f) L/D = 4, α = 90°.
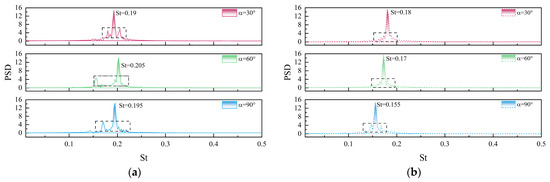
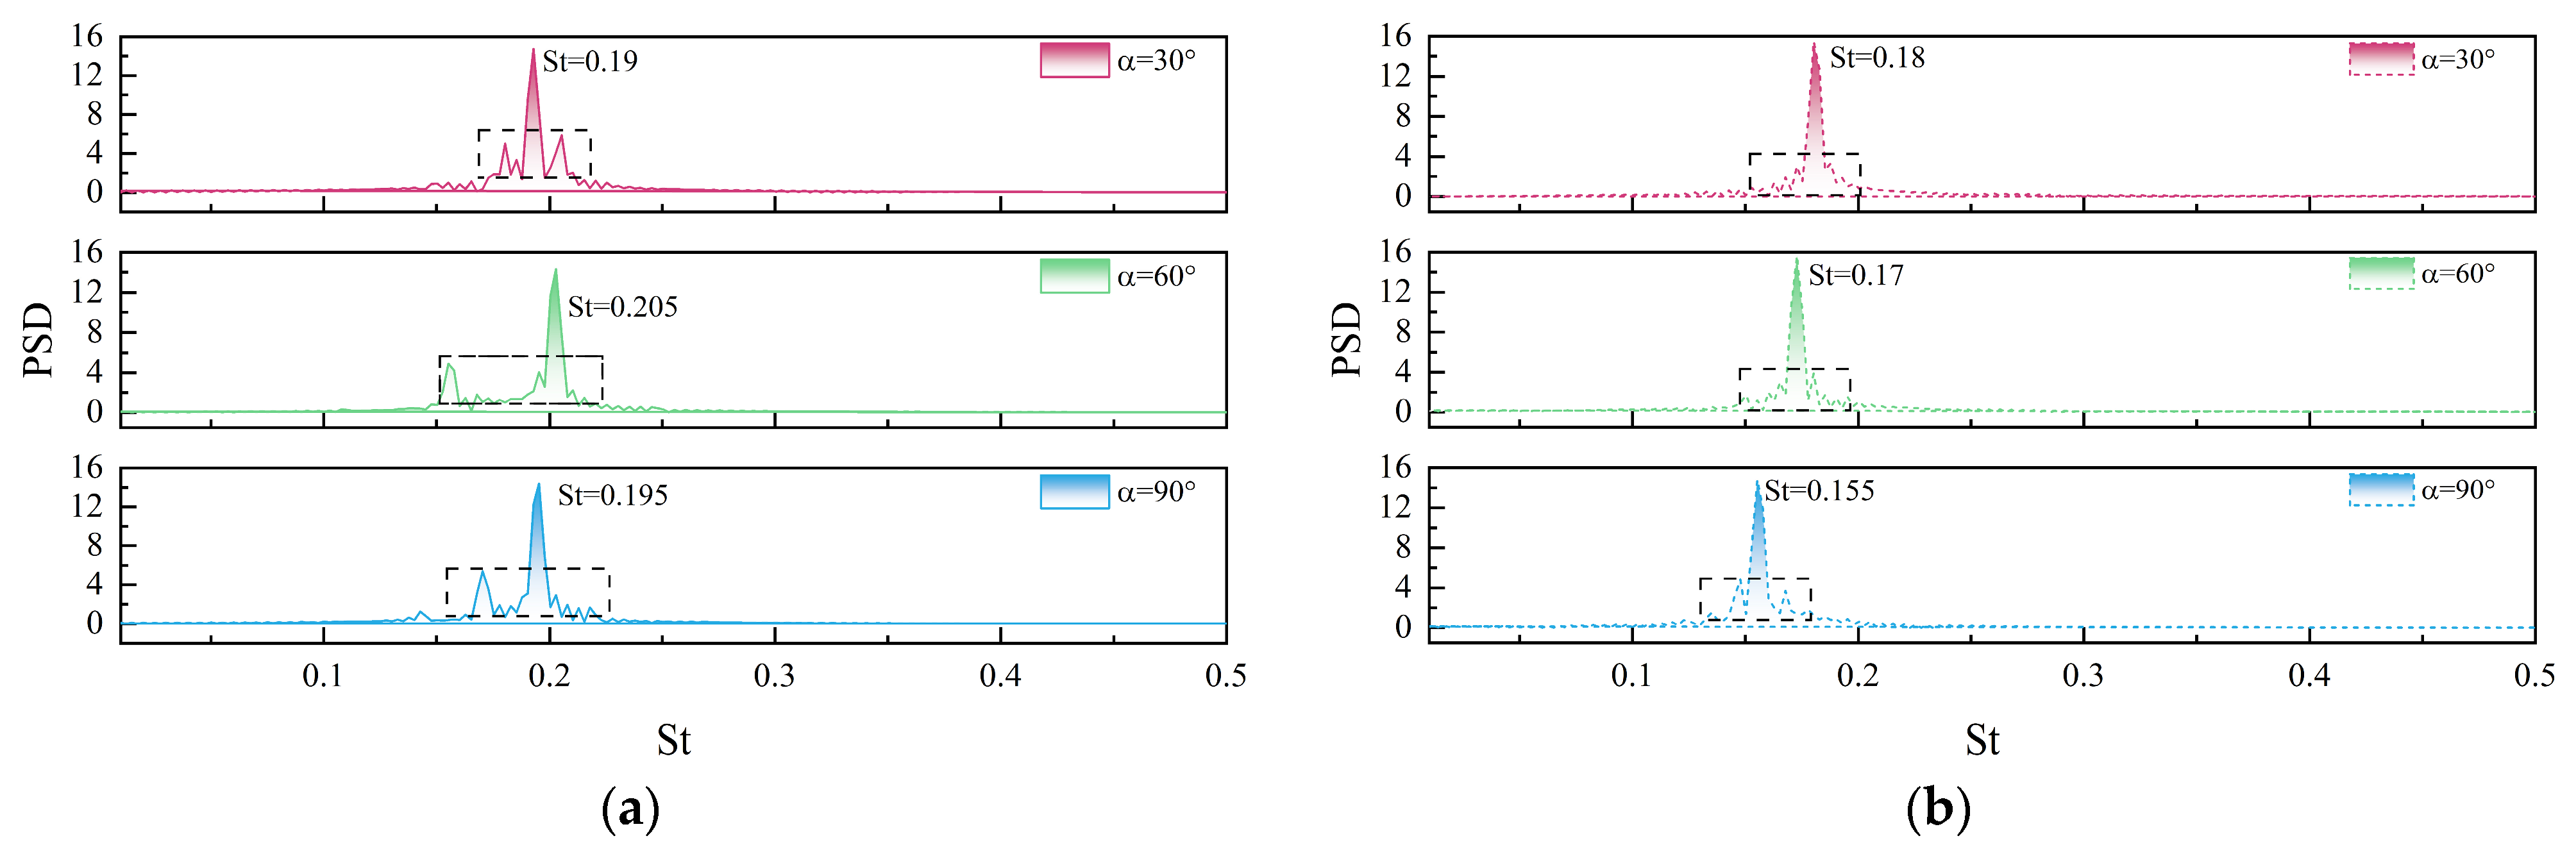
Next, Figure 17 shows the variation in the power spectral density (PSD) of the first mode pair coefficients with the placement angle α. The results indicate that, at L/D = 2, the Strouhal number St corresponding to the dominant frequency does not exhibit a clear linear dependence on α. Additionally, the harmonic components become more pronounced as α increases, suggesting that the frequency structure of the flow field grows increasingly complex. Particularly at α = 90°, the high-frequency components in the PSD are significantly enhanced, reflecting strong flow interference. For L/D = 4, the dominant frequency exhibits a progressively decreasing trend as the placement angle increases. Meanwhile, the frequency spectrum at this condition is relatively concentrated, with weaker harmonic components, and the energy distribution near the dominant frequency is most stable at α = 30°. For L/D = 2, mode coefficients, phase-space trajectories, and PSD show strong oscillations and high-frequency activity, indicating coupled, unstable wake dynamics. For L/D = 4, regular oscillations, compact trajectories, and dominant-frequency PSD reflect stable, coherent vortex shedding, linking SPOD modal behavior directly to wake stability.
Figure 17.
Power spectral density of the first mode pair: (a) L/D = 2; (b) L/D = 4.
4.4.4. SPOD Coherent Structure Analysis of Dual Cylinders in a Curved Channel
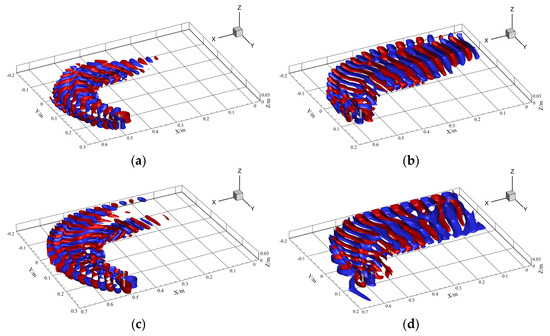
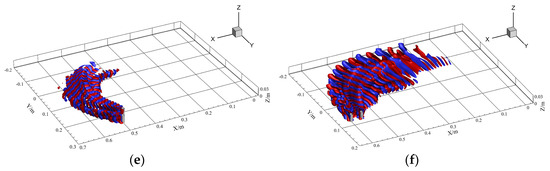
Based on the spectral features shown in Figure 17, two cases with L/D = 4 and α = 30° and α = 90° are selected to analyze the spatial structures of the first three dominant components, named mode1-1, mode2-1 and mode3-1. Figure 18 shows the spatial mode structures obtained using the SPOD method. For mode1-1, the spatial structure of the dominant mode is consistent with the vortex-shedding characteristics at the fundamental frequency. At α = 30°, the modal structure is mainly concentrated on the inner side of the channel, where the vortices are almost completely dissipated by X/m = 0.22. In contrast, at α = 90°, an increased number of vortex bands and larger vortex scales are observed, with the vortices persisting over a significantly longer distance. In the higher-order mode, mode3-1, distinct harmonic characteristics are observed. At α = 30°, the energy of the shed vortices is essentially dissipated by X/m = 0.45, while at α = 90°, it is not fully dissipated until X/m = 1.0, which is likely caused by local small-scale vortices at high frequencies. The results for the different modal orders consistently confirm that the flow-field structure at α = 30° is more stable than that at α = 90°. This finding is consistent with the spectral analysis and further demonstrates the significant influence of the placement angle on the coherent structures of the flow field.
Figure 18.
SPOD mode velocity iso-surfaces for side-by-side cylinders in the U-shaped curved channel with L/D = 4 at different installation angles. (Left): α = 30°; (Right): α = 90°. (a) mode1-1; St = 0.18; (b) mode1-1; St = 0.155; (c) mode2-1; St = 0.15; (d) mode2-1; St = 0.13; (e) mode3-1; St = 0.36; (f) mode3-1; St = 0.31.
Furthermore, from an engineering application perspective, the configuration with L/D = 4 and α = 30° can be regarded as a relatively favorable arrangement. Under this condition, the vortex structures dissipate more rapidly and the high-frequency fluctuations are significantly weakened, indicating reduced wake unsteadiness and lower coherent energy persistence. Such flow characteristics are generally associated with weaker flow-induced vibration, reduced hydrodynamic force fluctuations, and mitigation of local scouring intensity around hydraulic structures. In contrast, the α = 90° configuration exhibits stronger large-scale vortices and longer downstream energy persistence, which may increase structural vibration risks and enhance bed shear stress fluctuations. Therefore, the L/D = 4 and α = 30° arrangement demonstrates better overall hydraulic stability and engineering adaptability within the present investigated conditions.
5. Conclusions
This paper comprehensively investigates the numerical simulation and flow mechanisms of flow past two side-by-side circular cylinders in a three-dimensional curved channel under subcritical conditions at Re = 3900, using the Realizable k–ε turbulence model combined with the SPOD method. The main conclusions are as follows:
- (1)
- Grid independence verification using four grids with different resolutions for flow past a single circular cylinder at Re = 3900 demonstrates that the results from a 3.22-million-element grid agree well with the experimental and numerical data reported by Norberg and Yu. This confirms that the selected grid resolution and turbulence model can accurately capture the vortex-shedding characteristics of a circular cylinder at subcritical Reynolds numbers. Consequently, applying the same grid resolution to the numerical simulation of flow past dual circular cylinders provides sufficient reliability and accuracy.
- (2)
- The spatio-temporal results of the flow field around two side-by-side circular cylinders in a three-dimensional straight channel reveal that the mutual interference between the vortex structures of the two cylinders gradually dissipates as the cylinder spacing ratio L/D increases. The cylinder wakes evolve from a strongly coupled interference pattern to quasi-independent structures with weak interaction. At L/D = 2, pronounced wake-vortex merging is observed, and the flow field is unstable. In contrast, at L/D = 4, wake symmetry is enhanced, and the flow structure becomes more stable. SPOD analysis indicates that, as L/D increases, the spectral energy distribution of the flow field transitions from a single dominant frequency to a multi-frequency harmonic structure. Under large spacing conditions, the energy is concentrated in low-order dominant modes, and the flow stability is correspondingly improved.
- (3)
- The spatio-temporal results for flow around two side-by-side circular cylinders in a three-dimensional curved channel indicate that the energy concentration on the inner side of the curved channel increases with the placement angle for both L/D = 2 and L/D = 4. However, the CFD method alone cannot quantitatively characterize the evolution of the spectral energy distribution. By employing the SPOD algorithm, the gradual energy concentration with increasing placement angle is accurately captured. The flow field stability at L/D = 4 is found to be better than that at L/D = 2. A comparison of three placement angles under L/D = 4 shows that energy is always concentrated on the inner side of the curved channel. At α = 30°, the vortex structure has the smallest energy fluctuation range and the fastest energy dissipation, corresponding to the highest flow efficiency. This study demonstrates that the combined CFD-SPOD approach enables a comprehensive analysis of cylindrical structures and bridge pier arrangements in river flows, facilitating the evaluation and identification of hydrodynamically favorable configurations.
- (4)
- Despite the insights gained, it is important to acknowledge the limitations of the present study and to outline directions for future work. The current investigation is conducted at a subcritical Reynolds number (Re = 3900), where the Realizable k–ε turbulence model shows acceptable performance; however, its ability to resolve complex three-dimensional unsteady vortex dynamics may become limited as the flow transitions to transcritical and supercritical regimes. In this context, higher-fidelity numerical approaches, such as Large Eddy Simulation (LES) or Detached Eddy Simulation (DES), are recommended for future studies to improve the resolution of coherent structures and enhance the predictive capability of the CFD–SPOD framework. In addition, the present work is limited to a single channel curvature radius, whereas variations in curvature are expected to significantly affect centrifugal pressure gradients, secondary flow intensity, wake interaction mechanisms, and spectral energy distributions. Therefore, future research should systematically examine the effects of different curvature radii, inflow conditions, and cylinder configurations to further improve the generality and engineering applicability of the proposed methodology.
Author Contributions
F.W. contributed to model selection, research protocol determination, and manuscript writing. S.R. contributed to model calculation and manuscript writing. Y.Z. conducted model comparison and analysis. Q.W. and X.Q. assisted with figure generation for some results. All authors have read and agreed to the published version of the manuscript.
Funding
This research was supported by the Ningxia Higher Education Scientific Research Program (No NYG2024068), Natural Science Foundation of China (No 12462023) and High-Level Talent Project of North Minzu University (No 2025BG253).
Data Availability Statement
The original contributions presented in this study are included in the article. Further inquiries can be directed to the corresponding author.
Conflicts of Interest
The authors declare no conflicts of interest.
Abbreviations
The following abbreviations are used in this manuscript:
| LES | Large-Eddy Simulation |
| SPOD | Spectral Proper Orthogonal Decomposition |
| Re | Reynolds |
| L/D | Spacing ratio |
| URANS | Unsteady Reynolds-Averaged Navier–Stokes URANS |
| St | Strouhal |
| PSD | Power Spectral Density |
| TKE | Turbulent Kinetic Energy |
| RSM | Reynolds Stress Model |
| POD | Proper Orthogonal Decomposition |
| DMD | Dynamic Mode Decomposition |
References
- Yang, Y.; Li, J.; Zou, W.; Chen, B. Numerical investigation of flow and scour around complex bridge piers in wind–wave–current conditions. J. Mar. Sci. Eng. 2023, 12, 23. [Google Scholar] [CrossRef] [Scilit]
- Al-Jubouri, M.; Ray, R.P.; Abbas, E.H. Advanced numerical simulation of scour around bridge piers: Effects of pier geometry and debris on scour depth. J. Mar. Sci. Eng. 2024, 12, 1637. [Google Scholar] [CrossRef] [Scilit]
- Wang, M.; Avital, E.; Korakianitis, T.; Williams, J.; Ai, K. A numerical study on the influence of curvature ratio and vegetation density on a partially vegetated U-bend channel flow. Adv. Water Resour. 2021, 148, 103843. [Google Scholar] [CrossRef] [Scilit]
- Li, X.; Li, R.; Hu, Y.; Han, Z.; Liu, X.; Chang, Y. Condition assessment of corroded spanning subsea pipelines under vortex-induced vibration. Ocean Eng. 2025, 333, 121531. [Google Scholar] [CrossRef] [Scilit]
- Tong, X.J. Numerical Simulation of Flow Characteristics around a Cylinder at Low Reynolds Number Based on Fluent. Master’s Thesis, Yangzhou University, Yangzhou, China, 2021. (In Chinese) [Google Scholar] [CrossRef]
- Ren, C.; Liu, Z.; Cheng, L.; Tong, F.; Xiong, C. Three-dimensional wake transitions of steady flow past two side-by-side cylinders. J. Fluid Mech. 2023, 972, A17. [Google Scholar] [CrossRef] [Scilit]
- Yokoi, Y.; Hirao, K. Vortex shedding from a pair of in-line forced oscillating parallel arranged circular cylinders (in the case of equal diameter). J. Fluid Sci. Technol. 2009, 4, 401–414. [Google Scholar] [CrossRef] [Scilit]
- Yu, D.Y.; Cui, X.N.; Tang, P. Hydrodynamic characteristics of flow around two side-by-side circular cylinders. J. Ocean Univ. China 2015, 45, 107–113. (In Chinese) [Google Scholar] [CrossRef]
- Neville, L. Stokes flow around two unequal cylinders: A complex variable approach. Phys. Rev. Fluids 2025, 10, 064102. [Google Scholar] [CrossRef] [Scilit]
- Fezai, S.; Oueslati, F.; Ben-Beya, B. Computational analysis of the influence of the dimensions of three square cylinders arranged in equilateral triangular arrangement on the behavior of flow and aerodynamic forces. Int. J. Fluid Mech. Res. 2023, 50, 33–52. [Google Scholar] [CrossRef] [Scilit]
- Qi, L.M. Experimental Study on Wake Characteristics and Vortex Structure Evolution Characteristics of Near-Wall Side-by-Side Two Cylinders. Master’s Thesis, Shanghai University of Applied Sciences, Shanghai, China, 2023. (In Chinese) [Google Scholar] [CrossRef]
- Sadasivan, S.; Litak, G.; Furquan, M.; John, B.; Gęca, M.J. Computational investigation of vortex-induced oscillation of two side-by-side cylinders at high Reynolds numbers. Eur. J. Mech. B Fluids 2025, 110, 1–18. [Google Scholar] [CrossRef] [Scilit]
- Chen, W.; Ji, C.; Xu, D.; Alam, M. Three-dimensional direct numerical simulations of two interfering side-by-side circular cylinders at intermediate spacing ratios. Appl. Ocean Res. 2022, 123, 103162. [Google Scholar] [CrossRef] [Scilit]
- Pang, J.H.; Zong, Z.; Zhou, L.; Zou, L. Identification of wide and narrow wakes in flow around two side-by-side circular cylinders. China Ship Res. 2016, 11, 37–42. (In Chinese) [Google Scholar] [CrossRef]
- Martini, S.; Morgut, M.; Pigazzini, R. Numerical VIV analysis of a single elastically-mounted cylinder: Comparison between 2D and 3D URANS simulations. J. Fluids Struct. 2021, 104, 103303. [Google Scholar] [CrossRef] [Scilit]
- Palkin, E.; Mullyadzhanov, R.; Hadžiabdić, M.; Hanjalić, K. Scrutinizing URANS in shedding flows: The case of cylinder in cross-flow in the subcritical regime. Flow Turbul. Combust. 2016, 97, 1017–1046. [Google Scholar] [CrossRef] [Scilit]
- Kim, M.; Park, J.; Choi, H. Large eddy simulation of flow over a circular cylinder with a neural-network-based subgrid-scale model. J. Fluid Mech. 2024, 984, A6. [Google Scholar] [CrossRef] [Scilit]
- Zeng, C.; Qiu, F.; Zhou, J.; Hu, Y.; Wang, L. Large eddy simulation of flow around two side-by-side circular cylinders at Reynolds number 3900. Phys. Fluids 2023, 35, 035102. [Google Scholar] [CrossRef] [Scilit]
- Ma, M.; Li, G.D.; Ning, J. Experimental study on U-shaped bend circulation with small width-depth ratio. Water Resour. Hydropower Eng. 2017, 48, 52–56. (In Chinese) [Google Scholar] [CrossRef]
- Chang, X.; Yin, P.; Xin, J.; Shi, F.; Wan, L. Wake structures and hydrodynamic characteristics of flows around two near-wall cylinders in tandem and parallel arrangements. J. Mar. Sci. Eng. 2024, 12, 832. [Google Scholar] [CrossRef] [Scilit]
- Verma, P.; Ahmad, Z. Scour around circular bridge pier located in curved channels. ISH J. Hydraul. Eng. 2025, 31, 1000–1016. [Google Scholar] [CrossRef] [Scilit]
- Pan, Y.; Liu, X.; Yang, K. Effects of discharge on the velocity distribution and riverbed evolution in a meandering channel. J. Hydrol. 2022, 607, 127539. [Google Scholar] [CrossRef] [Scilit]
- Akbar, Z.; Murtaza, N.; Pasha, G.A.; Iqbal, S.; Ghumman, A.R.; Abbas, F.M. Predicting scour depth in a meandering channel with spur dike: A comparative analysis of machine learning techniques. Phys. Fluids 2025, 37, 045158. [Google Scholar] [CrossRef] [Scilit]
- Bai, H.L.; Alam, M.M.; Gao, N.; Lin, Y.F. The near wake of sinusoidal wavy cylinders: Three-dimensional POD analyses. Int. J. Heat Fluid Flow 2019, 75, 256–277. [Google Scholar] [CrossRef] [Scilit]
- Sakai, M.; Sunada, Y.; Imamura, T.; Rinoie, K. Experimental and numerical studies on flow behind a circular cylinder based on POD and DMD. Trans. Jpn. Soc. Aeronaut. Space Sci. 2015, 58, 100–107. [Google Scholar] [CrossRef] [Scilit]
- Sieber, M.; Paschereit, O.; Oberleithner, K. Spectral proper orthogonal decomposition. J. Fluid Mech. 2016, 792, 798–828. [Google Scholar] [CrossRef] [Scilit]
- Sieber, M.; Paschereit, C.O.; Oberleithner, K. Advanced identification of coherent structures in swirl-stabilized combustors. J. Eng. Gas Turbines Power 2016, 139, 021503. [Google Scholar] [CrossRef] [Scilit]
- Launder, B.E.; Spalding, D.B. Lectures in Mathematical Models of Turbulence; Academic Press: London, UK, 1972. [Google Scholar]
- Yakhot, V.; Orszag, S.A. Renormalization group analysis of turbulence. I. Basic theory. J. Sci. Comput. 1986, 1, 3–51. [Google Scholar] [CrossRef] [Scilit]
- Shih, T.H.; Liou, W.W.; Shabbir, A.; Yang, Z.; Zhu, J. A new k-ε eddy viscosity model for high Reynolds number turbulent flows. Comput. Fluids 1995, 24, 227–238. [Google Scholar] [CrossRef] [Scilit]
- Zhang, X.X.; Zhang, Z.T.; Zhang, W.F.; Cheng, Z.Q. Comparison of five eddy viscosity turbulence models in numerical simulation of flow over a two-dimensional square cylinder. Acta Aerodyn. Sin. 2018, 36, 339–349. (In Chinese) [Google Scholar] [CrossRef]
- Yan, X.; Rennie, C.D.; Mohammadian, A. A three-dimensional numerical study of flow characteristics in strongly curved channel bends with different side slopes. Environ. Fluid Mech. 2020, 20, 1491–1510. [Google Scholar] [CrossRef] [Scilit]
- Schmidt, O.; Towne, A.; Rigas, G.; Colonius, T.; Brès, G.A. Spectral analysis of jet turbulence. J. Fluid Mech. 2018, 855, 953–982. [Google Scholar] [CrossRef] [Scilit]
- Norberg, C. Effect of Reynolds Number and a Low-Intensity Freestream Turbulence on the Flow Around a Circular Cylinder; Publ. No. 87/2; Department of Applied Thermosciences and Fluid Mechanics, Chalmers University of Technology: Gothenburg, Sweden, 1987. [Google Scholar]
- Wornom, S.; Ouvrard, H.; Salvetti, M.V.; Koobus, B.; Dervieux, A. Variational multiscale large-eddy simulations of the flow past a circular cylinder: Reynolds number effects. Comput. Fluids 2011, 47, 44–50. [Google Scholar] [CrossRef] [Scilit]
- Kim, H.J.; Durbin, P.A. Investigation of the flow between a pair of circular cylinders in the flop regime. J. Fluid Mech. 1988, 196, 431–448. [Google Scholar] [CrossRef] [Scilit]

Disclaimer/Publisher’s Note: The statements, opinions and data contained in all publications are solely those of the individual author(s) and contributor(s) and not of MDPI and/or the editor(s). MDPI and/or the editor(s) disclaim responsibility for any injury to people or property resulting from any ideas, methods, instructions or products referred to in the content. |
© 2026 by the authors. Licensee MDPI, Basel, Switzerland. This article is an open access article distributed under the terms and conditions of the Creative Commons Attribution (CC BY) license.