Article

Effects of Channel Modification and Precipitation on Fish Habitat in a Small Watershed: A Case Study of Gaoliao Creek in Taiwan

1
Hydrotech Research Institute, National Taiwan University, Taipei 10617, Taiwan
2
Hualien Branch, Agency of Rural Development and Soil and Water Conservation, Ministry of Agriculture, Hualien 970018, Taiwan
*
Authors to whom correspondence should be addressed.
Water 2026, 18(12), 1400; https://doi.org/10.3390/w18121400
Submission received: 21 April 2026 / Revised: 31 May 2026 / Accepted: 5 June 2026 / Published: 8 June 2026

Highlights

Channel modification altered hydraulic conditions, shifting the system from a deep, slow-flowing regime to a shallower, faster-flowing channel, which reduced Fr-based hydraulic habitat availability under baseflow conditions but increased HSI/CHSI-based habitat suitability due to improved substrate composition. Rainfall events exerted stronger and more dynamic controls on Fr-based hydraulic habitat availability and HSI/CHSI-based habitat suitability than channel modification, high-lighting the high sensitivity of small watersheds to short-duration extreme precipitation and the importance of maintaining habitat heterogeneity to balance flood conveyance and ecological resilience in engineered river systems.
What are the main findings?
  • Channel modification shifted the river from a deep, slow-flowing system to a shallower, faster-flowing regime.
  • Fr-based hydraulic habitat availability decreased after modification despite increased wetted area.
  • HSI/CHSI-based habitat suitability increased due to more favorable substrate composition.
  • Rainfall events had stronger effects on habitat dynamics than channel modification.
What are the implications of the main findings?
  • Fr alone is insufficient to represent habitat quality without substrate information.
  • River engineering involves trade-offs between flood conveyance and habitat condition.
  • Small watersheds respond rapidly to extreme rainfall, showing high habitat variability.
  • Habitat heterogeneity is essential for ecological resilience in engineered rivers.

Abstract

This study developed a novel framework integrating UAV-derived orthophotography, deep learning-based substrate classification, two-dimensional hydraulic modeling, Froude number (Fr) analysis, and multispecies habitat suitability assessment to evaluate the effects of channel modification and precipitation on fish habitats in Gaoliao Creek, eastern Taiwan. Habitat changes under baseflow and rainfall-induced high-flow conditions were quantified using Fr-based hydraulic habitat availability and Habitat Suitability Index (HSI)- and Combined Habitat Suitability Index (CHSI)-based habitat suitability. Channel modification transformed the channel from a deep and slow-flowing system into a shallower and faster-flowing environment. Under baseflow conditions, the proportion of available habitat meeting the adopted hydraulic criteria decreased from 81.6% to 73.9%, whereas the CHSI-derived proportion of weighted usable area (PUA) increased from 0.300 to 0.323 due to favorable substrate composition. During rainfall events, habitat availability and suitability declined markedly during peak flows and recovered as discharge receded. Compared with the pre-engineering channel, the modified channel exhibited greater sensitivity to short-term hydrological fluctuations but effectively prevented overbank flooding during the selected extreme rainfall event. These findings highlight the trade-off between flood-control benefits and ecological resilience and emphasize the importance of maintaining habitat heterogeneity in river management. Because the analyses were based on a single typhoon-related rainfall event and lacked direct biological validation, the results should be interpreted as event-specific predictions requiring further verification.

1. Introduction

Rivers serve as critical habitats for fish to complete essential life functions, including foraging, growth, predator avoidance, and reproduction [1,2]. Consequently, the quality of riverine habitats directly influences fish diversity and the dynamics of fish populations [3]. At the regional scale, river systems are highly susceptible to impacts from dams, check dams, sluice gates and channel modification, which alter hydrological characteristics and the physical structure of river channels, thereby affecting the suitability and availability of fish habitats. Specifically, such channel modification may reduce habitat connectivity, decrease channel heterogeneity, fragment habitats, and modify substrate and flow conditions suitable for spawning or foraging, ultimately affecting fish foraging efficiency, growth rates, survival, migratory behavior, and reproduction [4,5,6,7]. At the global scale, flow extremes induced by climate change further threaten the stability and equilibrium of river systems. The increasing frequency of extreme rainfall events leads to higher flood frequency and intensity, pronounced fluctuations in water levels, accelerated riverbed erosion and sedimentation, reduced channel heterogeneity, and habitat fragmentation. Simultaneously, prolonged low-flow periods resulting from extreme drought events cause shallower water depths, elevated water temperatures, and deteriorated water quality [8,9,10]. Such events cumulatively affect the structural integrity and functional dynamics of riverine ecosystems.
In the past, the U.S. Fish and Wildlife Service (USFWS) developed the Instream Flow Incremental Methodology (IFIM) as an integrated tool to assess the ecological effects of varying flow scenarios on stream habitat, with the Physical Habitat Simulation System (PHABSIM) serving as a core component for quantifying depth and velocity distributions across flows and integrating these with habitat suitability indices to estimate weighted usable area (WUA) for target species [11,12,13,14]. PHABSIM provides a clear linkage between flow variations, physical habitat conditions, and fish habitat availability, while requiring relatively manageable data inputs, which has led to its widespread application in instream flow assessment and evaluation of river engineering impacts [15,16,17,18,19]. However, traditional PHABSIM is largely based on one-dimensional, steady-state hydraulic assumptions, making it difficult to capture habitat dynamics associated with short-term floods or rapid flow fluctuations. With advances in computational power and data resolution, recent studies have progressively extended PHABSIM to two- or three-dimensional hydraulic–habitat models, integrating GIS and high-resolution topographic data to improve the representation of spatial heterogeneity and habitat dynamics [20,21,22,23,24].
Hydrological conditions within a watershed are inherently dynamic and strongly influenced by precipitation. During fair weather, streamflow is typically maintained by a relatively stable baseflow. However, precipitation associated with typhoons, monsoons, and other rainfall events can substantially alter runoff dynamics within the watershed, potentially leading to corresponding changes in aquatic habitats. In particular, intense rainfall events may generate peak flows that adversely affect fish habitats and their occupancy. The Gaoliao Creek is a small watershed in eastern Taiwan, situated between the Xiuguluan River and the Coastal Mountain Range. Its rainfall characteristics are strongly influenced by topography and the monsoon climate. Statistical records indicate that in 2025 there were 128 rainy days, accounting for approximately 35% of the year. Therefore, the ecological effects of rainfall on the Gaoliao Creek watershed warrant considerable attention, particularly regarding the dynamic changes in fish habitat conditions. The objective of this study was to investigate dynamic changes in fish habitat conditions in the Gaoliao Creek before and after channel modification under different hydrological conditions (baseflow and short-term high-flow events).
This study investigated how channel modification and intense precipitation alter hydraulic conditions and fish habitat availability and suitability in Gaoliao Creek. By integrating rainfall–runoff simulation, two-dimensional hydraulic modeling, and Fr-based habitat classification, we quantified changes in habitat availability before and after channel modification under both baseflow and short-duration high-flow conditions. Moreover, in addition to the rainfall–runoff and hydraulic simulations, the incorporation of deep learning-based substrate classification and HSI calculations enables a more comprehensive evaluation of habitat suitability for two fish species, Onychostoma barbatulum and Rhinogobius candidianus, before and after channel modification under both baseflow and short-duration high-flow conditions. Furthermore, this study explores the applicability of the CHSI as a suitable assessment framework for river systems lacking indicator species.

2. Materials and Methods

2.1. Determination of Baseflow

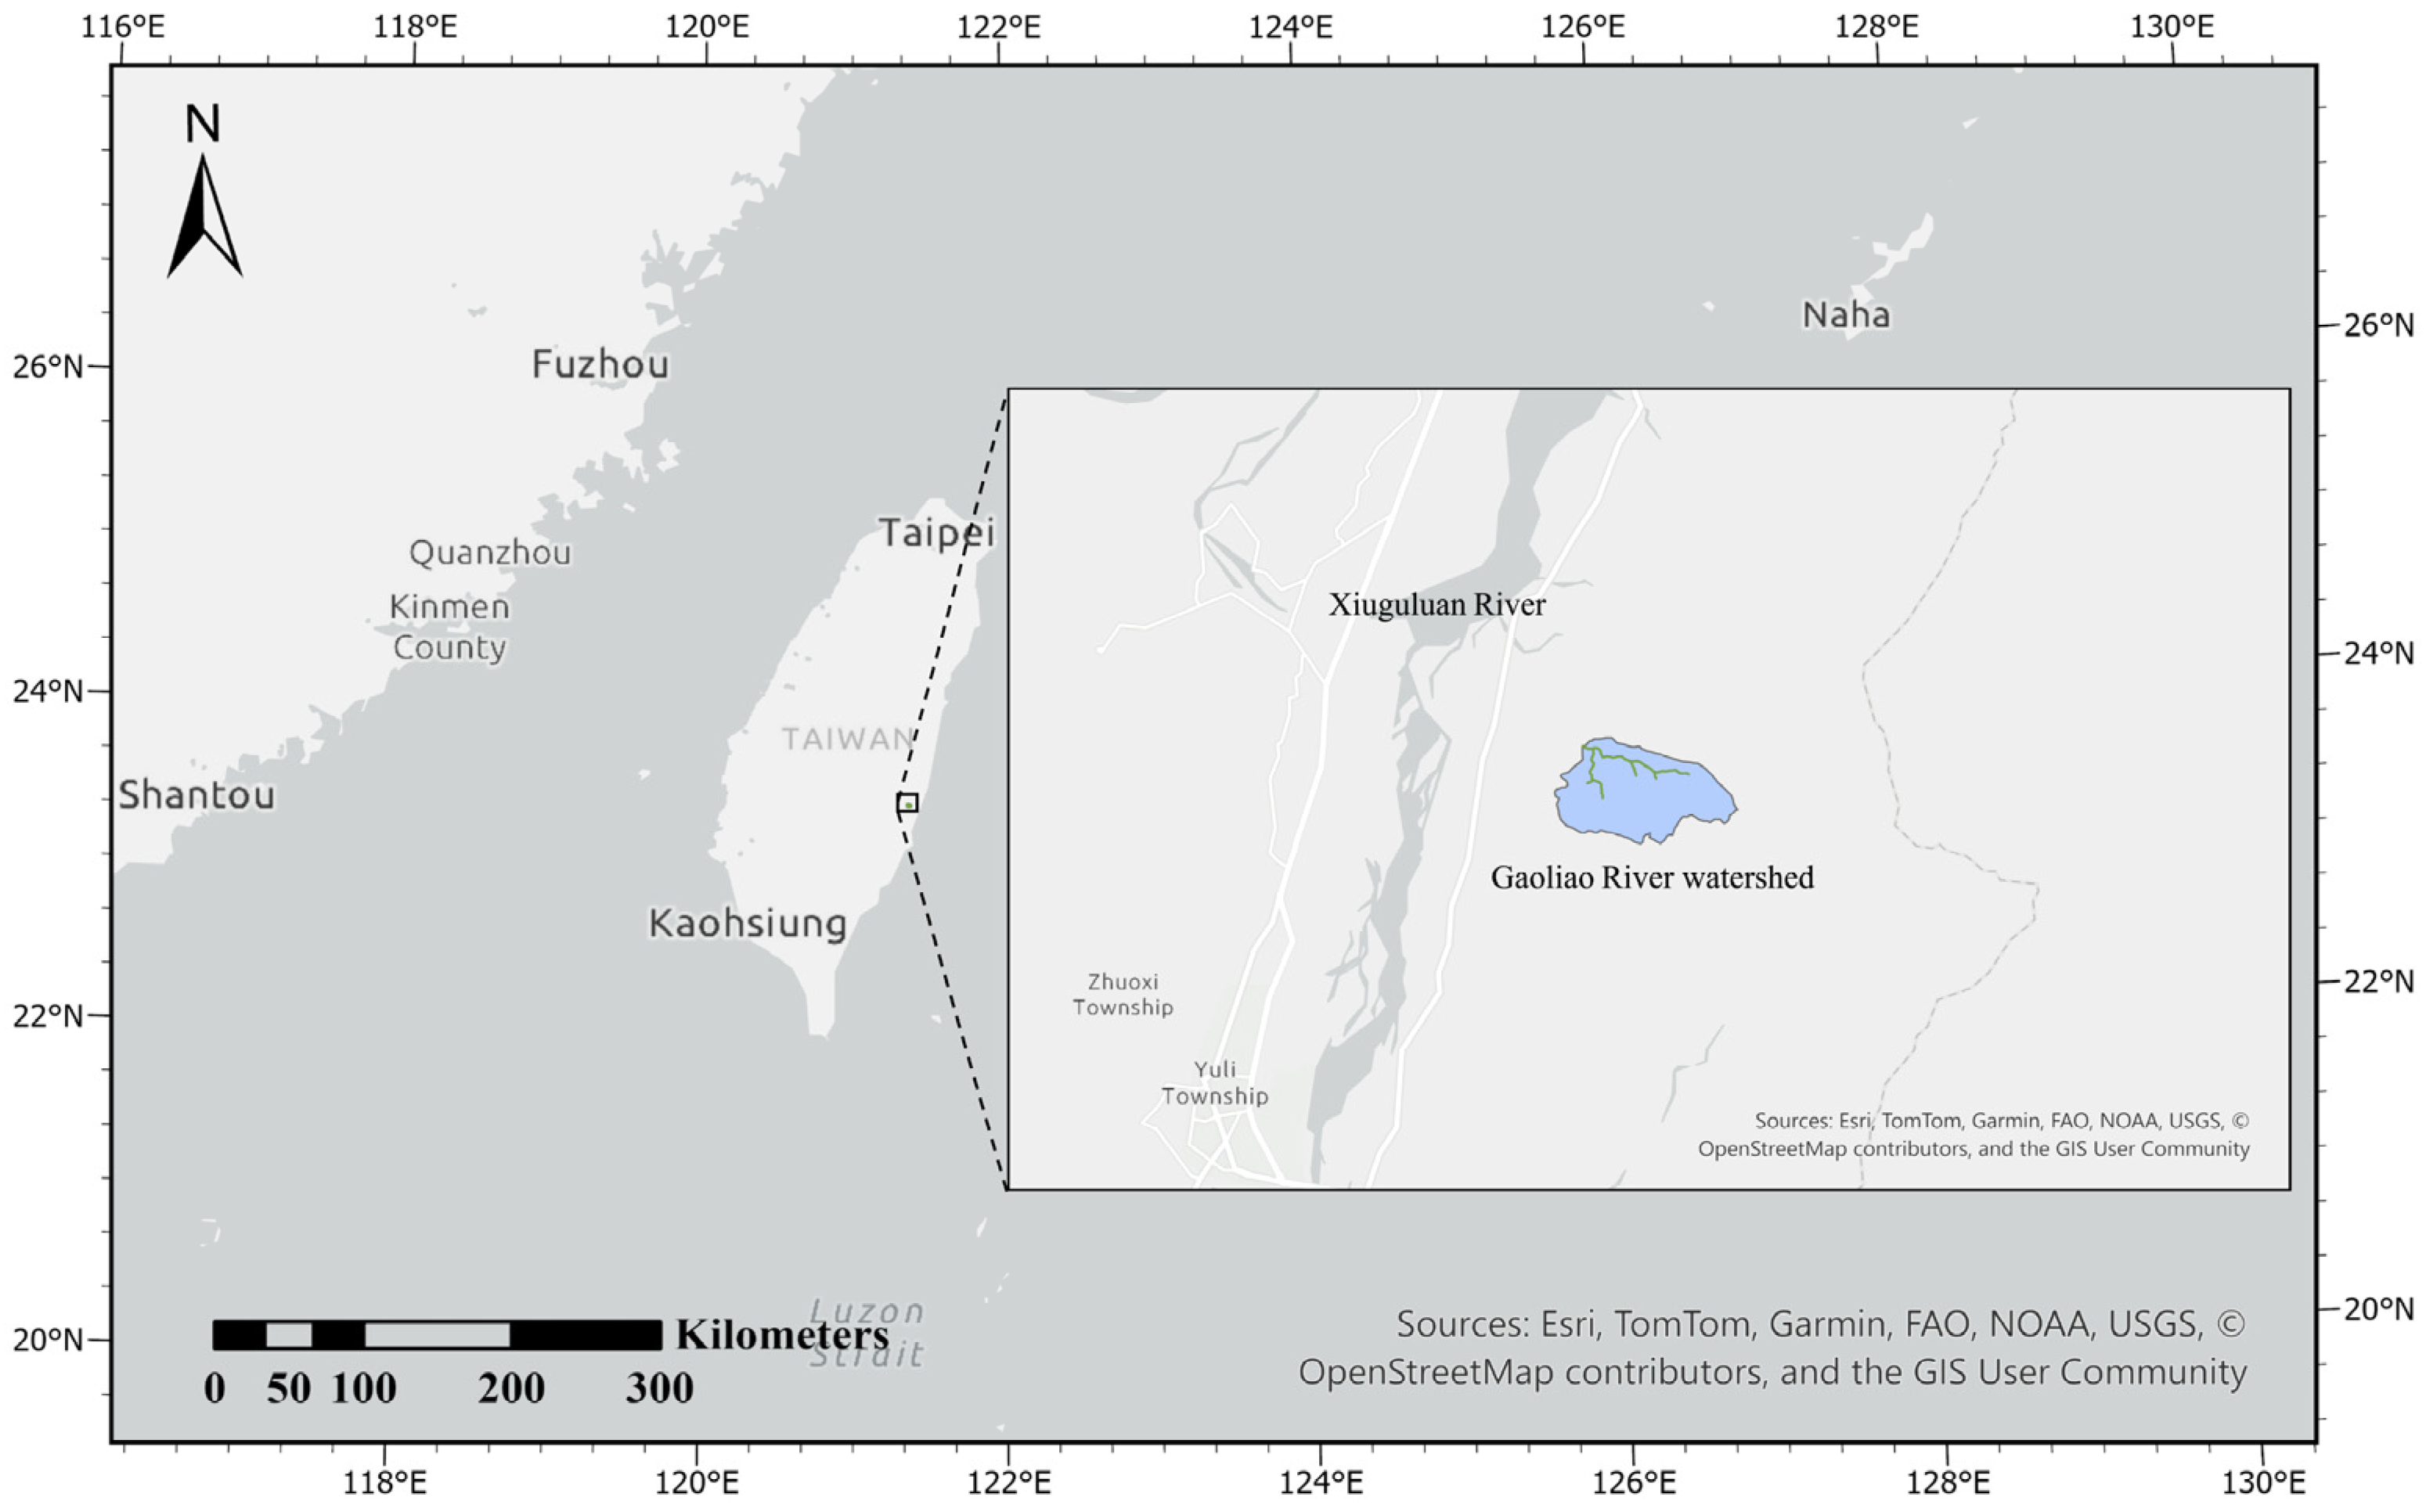
The study site was located within the engineered reach in the Gaoliao Creek watershed (Figure 1). Under dry-weather conditions, river discharge was expected to fluctuate within a relatively narrow range, which was therefore considered representative of baseflow conditions. Accordingly, field surveys were conducted during clear-weather periods to measure flow velocity and water depth along cross-sectional transects at 1 m intervals within the engineered channel. River discharge was subsequently calculated using the velocity–area method in accordance with the discharge measurement protocol issued by the Ministry of Environment, Taiwan (W022.51C; Water Discharge Measurement Method–Current Meter Method, 2004) [25] and the United States Geological Survey Techniques and Methods, Book 3, Chapter A8 (Measurement of Discharge by the Conventional Current-Meter Method) [26]. According to the monitoring project for eastern Taiwan aquatic systems, two field surveys, including fish and discharge measurements, were conducted annually by our research team. Survey dates were 13 July and 27 September 2023, and 4 June and 14 August 2024. The mean of these estimated discharge values was adopted as the representative baseflow for subsequent hydraulic simulations.

2.2. Selection of the Representative Precipitation Day

Selecting the representative precipitation event is challenging. To address this, a rainfall fingerprint map (Dataset S1) constructed from hourly data at the Gaoliao meteorological station (station code: C1T990) was used to assist in identifying representative precipitation events for 2025. Based on the rainfall fingerprint map, the events on 23–24 September 2025 showed a more pronounced color signature, indicating a significant precipitation event. During this period, Typhoon Ragasa affected eastern Taiwan triggering the failure of a landslide-dammed lake in the upstream mountainous region of the Mataian Stream (a tributary of the Hualien River) within the Guangfu area. This event was documented on Eos, the science news platform of the American Geophysical Union, by author Dave Petley. Given that Gaoliao Creek and Mataian Stream are separated by only ~50 km, the excessive precipitation on 23–24 September 2025 likely generated runoff conditions that would induce fish to seek refuge rather than maintain normal habitat use. Therefore, the rainfalls on 23 and 24 September 2025 were selected as the two representative precipitation events for the Gaoliao Creek watershed.

2.3. Hydraulic Simulation of Flow Velocity and Water Depth

The HEC-RAS 2D model (version 6.3, U.S. Army Corps of Engineers Hydrologic Engineering Center) was applied for rainfall–runoff simulation at the watershed scale and hydraulic simulation at the river-reach scale. For the watershed-scale rainfall–runoff modeling, the watershed boundary and river network were delineated using a 5 m resolution digital elevation model (DEM) provided by government agencies and imported into the RasMapper module of HEC-RAS 2D. For high-resolution hydraulic simulations, unmanned aerial vehicle (UAV)-derived digital surface models (DSMs) with a 0.3 m spatial resolution were used to represent pre- and post-engineering topographies, which were generated from surveys conducted on 17 February 2023 and 20 August 2025, respectively, within the TWD97 TM Taiwan coordinate system. Within the geometry setup, 1 m square mesh cells were applied to the river channel and floodplain areas, whereas 2 m square mesh cells were used for the remaining watershed area. Additional local refinements were applied to the two-dimensional (2D) flow area mesh where necessary. The simulation time step was set at 1 s. The downstream boundary condition was specified as the normal depth, derived from a channel slope of 0.05. Due to the lack of available data, initial losses were set to zero. Regarding numerical stability criteria, the maximum and minimum Courant numbers were set to 1.0 and 0.1, respectively.
The Gaoliao Creek watershed is small (224 ha) and lacks permanent gauging stations; furthermore, field measurements of velocity and depth during extreme precipitation events are unfeasible due to safety constraints. Therefore, rainfall–runoff processes were simulated using hourly precipitation data from the two representative events on 23 and 24 September 2025 as model inputs, assuming spatially uniform rainfall across the watershed. The model produced 24 h discharge hydrographs (at hourly intervals) for 23 and 24 September 2025, at the watershed outlet, which concurrently serves as the upstream boundary of the engineered channel. Hydraulic simulations under both pre- and post-engineering conditions incorporated baseflow and runoff-derived discharge. The baseflow, as estimated in this study, served as the constant upstream boundary condition. To define the total upstream inflow, the runoff components derived from the simulated 24 h hydrographs were then superimposed onto this baseflow.
Surface roughness and infiltration were integrated into the rainfall–runoff and hydraulic simulations. Manning’s n values were assigned by classifying land cover from UAV orthophotos within ArcGIS Pro (Version 2025; Esri, Redlands, CA, USA). The study area was classified into river channels/non-vegetated floodplains and forest/vegetated zones, with Manning’s n values set to 0.05 and 0.12, respectively, drawing on calibration experiences from similar stream environments. For the spatial representation of infiltration within the watershed, the Soil Conservation Service (SCS) infiltration method in the HEC-RAS 2D MapLayers module was applied. SCS Curve Number (CN) values were derived from the intersection of soil type and land-use datasets [27]. In 2020, the Taiwan Water Resources Agency provided a reference table comprising four soil types and 21 land use categories for Curve Number determination. In this study, spatial datasets from the Agricultural Research Institute [28] and the National Land Surveying and Mapping Center [29] were used for watershed GIS overlay and infiltration parameterization.

2.4. Froude Number (Fr)

Previous studies have suggested that the Fr, which integrates flow velocity and water depth, provides an objective physical metric for distinguishing riverine habitat types such as pools, runs, and riffles [30]. Because fish exhibit distinct preferences for specific habitat types or possess limited tolerance ranges for hydraulic conditions, quantified Fr values were considered an appropriate proxy to assess the extent of available fish habitats. In this study, Fr was calculated from the simulated velocity and depth to estimate available fish habitat within the engineered reach of the Gaoliao Creek and to compare habitat dynamics before and after channel modification under baseflow and rainfall-induced flow conditions. The analytical framework followed the approach proposed by Chen, et al. [31], with a stricter criterion adopted whereby available habitat classification required simultaneous satisfaction of allowable hydraulic conditions for two common species in Gaoliao Creek, O. barbatulum and R. candidianus. The Fr was calculated as:
F r = V g D
where V is flow velocity (m s−1), D is water depth (m), and g is gravitational acceleration (9.81 m s−2).
Habitat suitability curves for velocity and depth were derived from data reported by the Taiwan Endemic Species Research Institute [32]. Because suitability under high-velocity and deep-water conditions was not specified, velocity suitability was linearly extrapolated to zero using species-specific maximum swimming speeds as upper bounds. Depth suitability was similarly reduced to zero at 1.8–2.0 m due to reduced light penetration at greater depths. The resulting suitability curves are provided in Table S1. Extremely high flow velocities, deep water, and excessively shallow depths were considered unavailable for fish habitation. In addition, near-static flow conditions were excluded based on observed habitat preferences of the two species. In this study, species-specific upper and lower limits of velocity and depth for O. barbatulum and R. candidianus were used to derive corresponding Fr thresholds (Table 1). The minimum depth was set at 0.04 m, while the minimum velocity was defined as the measurement precision limit of the electromagnetic current meter (0.01 m s−1). The minimum Fr was calculated using the combination of minimum velocity (Vmin) and maximum depth (Dmax), whereas the maximum Fr was obtained from maximum velocity (Vmax) and minimum depth (Dmin). Following the classification approach of Gillenwater, et al. [33], the study reach was divided into available and unavailable habitat zones. Habitat grid cells with Fr between 0.002 and 2.39 were classified as available, whereas values outside this range were considered unavailable. Furthermore, habitat availability was contingent upon cell-specific velocity and depth remaining within their respective operational thresholds (0.01–1.5 m/s for velocity and 0.04–1.8 m for depth). Cells with values outside these ranges were bypassed in the calculation and classified as unavailable, thereby reducing the risk of ecological misinterpretation in predicting fish habitat use. Spatial visualization and habitat statistics were generated using ArcGIS Pro. The proportion of available habitat was subsequently calculated to quantify the potential extent of fish distribution within the study reach.

2.5. Deep Learning-Assisted Riverbed Substrate Classification

Riverbed substrate is a key factor influencing fish habitat use, but its spatial classification remains challenging. A previous report by the Taiwan Endemic Species Research Institute [30] categorized substrates into six classes: sand, gravel, pebble, cobble, small boulder (25.6–51.2 cm), and large boulder (>51.2 cm). However, in this study, substrate mapping was conducted using UAV-derived orthophotos with a spatial resolution of 0.3 m. At this resolution, distinguishing among the conventional six substrate classes was often difficult. Therefore, previous substrate categories were simplified into three groups: sand (sand and gravel), cobble (pebble and cobble), and boulder (small and large boulders). In addition, riparian vegetation and water were included, resulting in a total of five groups. Because UAV orthophotos contain only visible RGB bands, spectral similarity among dry gravel, wet gravel, coarse sand, and artificial concrete structures limited reliable classification based solely on color information. To address this limitation, deep learning-based substrate classification in ArcGIS Pro was utilized to improve riverbed characterization.
Training samples were first manually annotated to develop the deep learning classification model. For the sand class, representative substrate patches were delineated using polygon features to capture homogeneous areas, rather than outlining individual particles. Similar polygon-based annotation was applied to vegetation and water classes. In contrast, cobbles and boulders, owing to their larger size, were individually digitized to improve class separability during model training. After model training, the trained network was applied using the “Classify Pixels Using Deep Learning” tool in ArcGIS Pro. The five output classes—sand, cobble, boulder, vegetation, and water—were assigned numeric codes of 1 to 5, respectively. The “Classify Pixels Using Deep Learning” tool was implemented using a U-Net architecture based on convolutional neural networks (CNNs) to perform pixel-level classification. This approach enables semantic segmentation by assigning each pixel to a specific class, rather than classifying entire image patches. Consequently, the model learns discriminative spectral and textural features associated with different substrate and land-cover types. The CNN-based framework provides strong feature extraction capability, particularly for capturing object boundaries and morphological characteristics of riverbed substrates. In addition, when training datasets include multiple survey reaches, the trained model can achieve improved transferability across different river environments. However, the preparation of labeled training samples requires substantial manual effort and time.
Additionally, considering the spatial characteristics of the orthophotos, the substrate classification model in this study did not merely rely on pixel-based counting. Instead, an area-weighting concept was introduced, where each pixel was assigned an area weight of 0.09 m2 to reconstruct the actual training area for the five aforementioned categories. For model validation, an independent validation dataset was prepared. By applying the same area-weighting and category-mapping procedures, a confusion matrix based on actual areas was constructed to illustrate the areal distribution of true positives (TP), false positives (FP), false negatives (FN), and true negatives (TN). Furthermore, the precision, recall, and F1-score were calculated for each category. The confusion matrix results were presented in Figure S1, while the precision, recall, and F1-scores were detailed in Table S2. To complement these quantitative evaluation metrics, a series of visual comparisons was conducted by cross-checking the ground truth (manually labeled data) against the model-predicted labels across multiple reaches, which demonstrated general consistency. Specifically, two representative locations were extracted for detailed comparison (Table S3). Location #1 captured a riverbed boulder zone, where the model successfully identified both boulders and water bodies. Location #2 featured a vegetated riparian zone, in which sand, cobbles, vegetation, and water bodies were accurately differentiated. Overall, the model demonstrated robust reliability in riverbed substrate classification, though the identification of cobbles warrants further improvement in future studies.
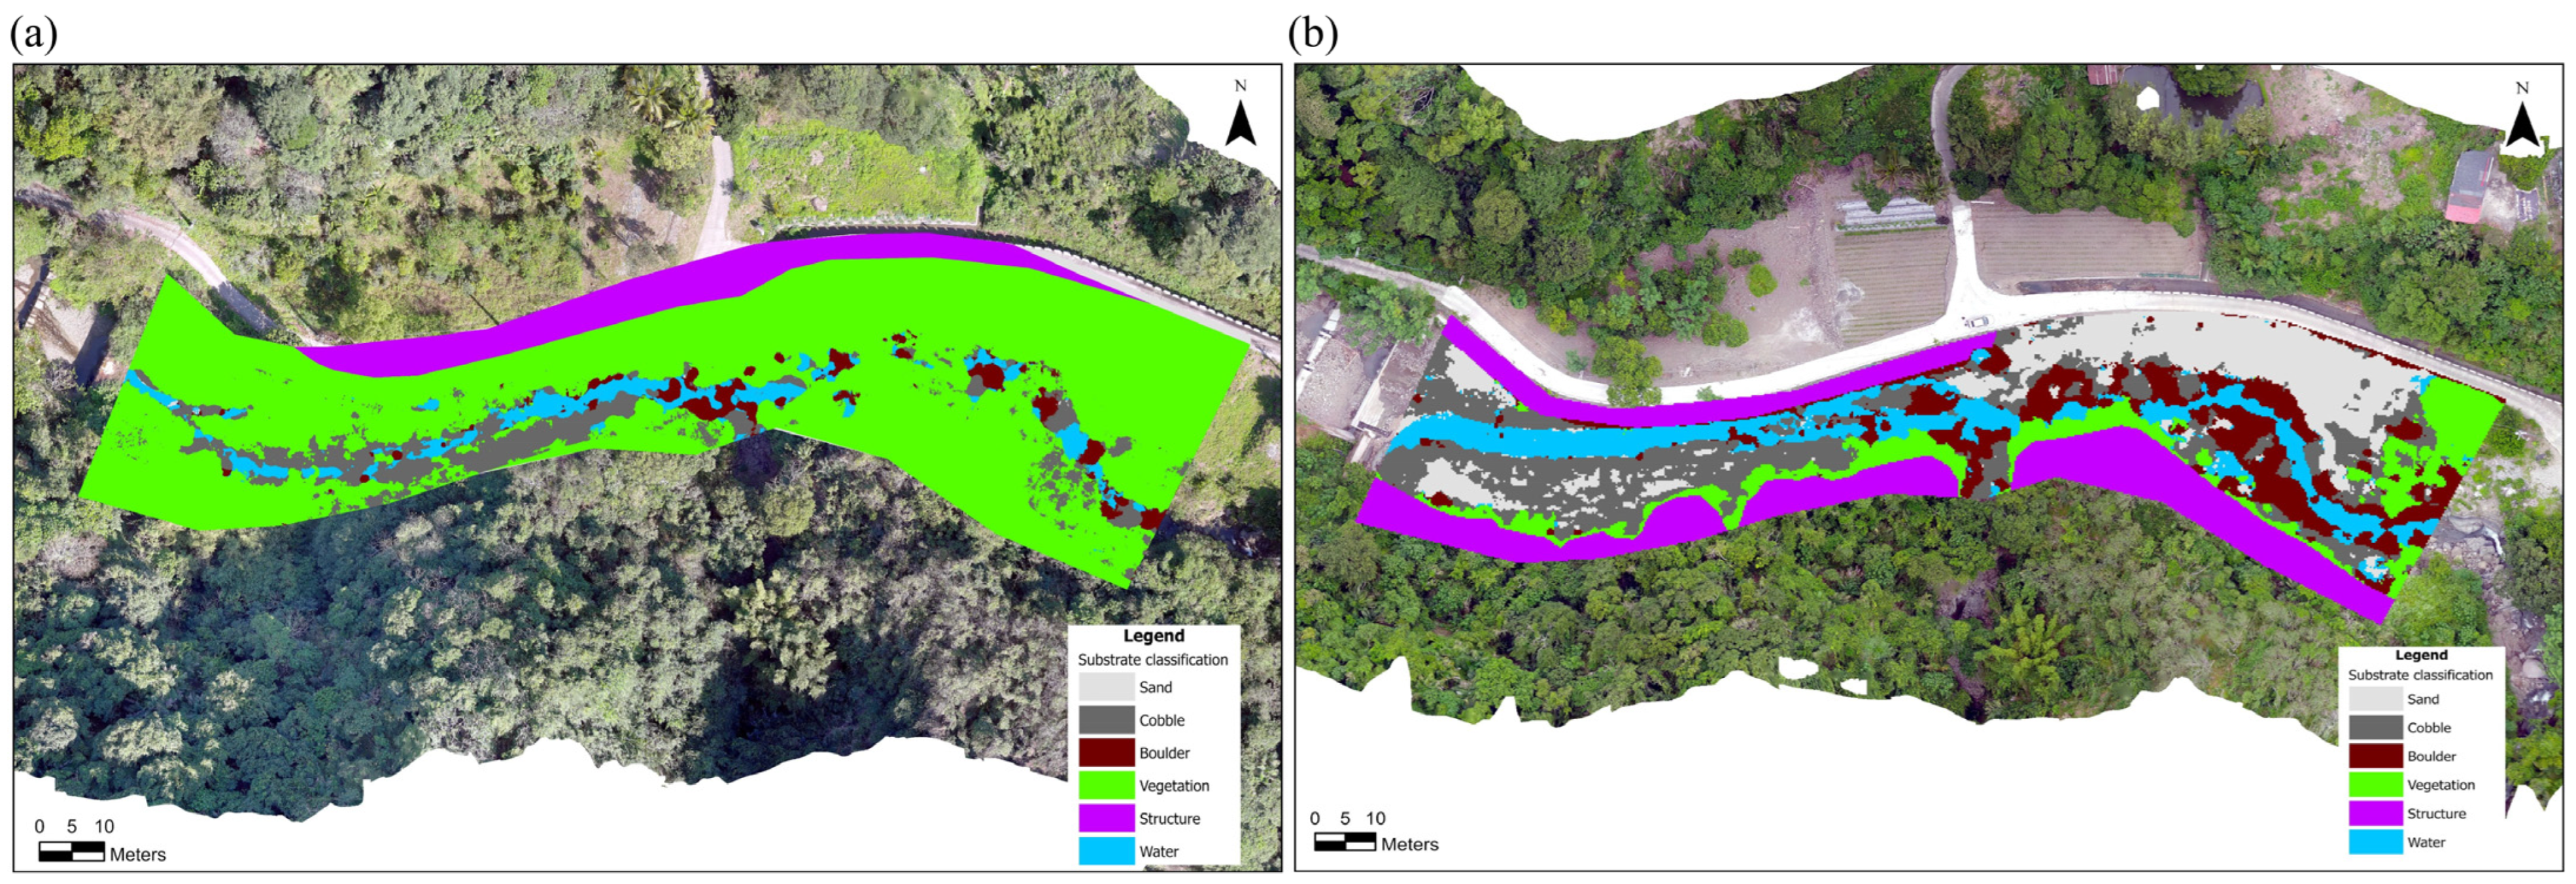
Areas considered unsuitable for fish habitats, including artificial structures, agricultural lands, and roads, were manually delineated as polygon features. These areas were designated as Category 6 (“Structure”) within the vector attribute table. Because substrate suitability in these zones was assumed to be zero, they were excluded from subsequent calculations of WUA. The resulting structure mask was merged with the deep learning-derived substrate classification raster using the Mosaic to New Raster tool in ArcGIS Pro to generate an integrated substrate map (Figure 2) for habitat suitability analysis. This raster was then spatially extracted to the computational nodes of the HEC-RAS 2D model, allowing each simulation point to be assigned a substrate classification code and corresponding species-specific suitability value. Substrate suitability curves for O. barbatulum and R. candidianus were adapted from the report of Taiwan Endemic Species Research Institute [30], with the original six substrate classes consolidated into three groups: sand, cobble, and boulder (Table S4). Riparian vegetated areas may serve as temporary fish refugia during high flows; thus, substrate suitability was set to 0.8. For water bodies, substrate suitability was assigned the highest suitability value, 1.0.

2.6. Habitat Suitability Index (HSI)

This study calculated and evaluated HSI values for O. barbatulum and R. candidianus. Representative pre- and post-engineering channel topographies were derived from UAV-based DSMs acquired on 17 February 2023 and 20 August 2025, respectively. Flow velocity and water depth were derived from simulations using baseflow and the hourly discharge hydrograph for 23 and 24 September 2025. Species-specific suitability values for velocity, depth, and substrate were then integrated to estimate HSI for both species before and after channel modification, as well as during baseflow and rainfall scenarios. HSI value was calculated as the geometric mean of depth suitability (Sd), velocity suitability (Sv), and substrate suitability (Ss). The equation is as follows:
H S I = S d S v S s 3
where Sv denotes velocity suitability, Sd denotes depth suitability, and Ss denotes substrate suitability for each species.
HSI values ranged from 0 to 1, where 0 indicates completely unsuitable conditions and 1 indicates optimal suitability. Different fish species exhibit distinct preferences for water depth, flow velocity, and substrate type. The depth-, velocity-, and substrate-specific suitability curves used for calculating HSI values for O. barbatulum and R. candidianus are summarized in Tables S1 and S4. For substrate suitability, a value of 0 denotes areas classified as terrestrial zones or locations considered unsuitable for fish habitation. All habitat suitability calculations, including WUA and PUA, and the production of visualized outputs were performed in ArcGIS Pro by utilizing ArcPy scripts to automate the workflow.

2.7. Combined Habitat Suitability Index (CHSI)

When no indicator fish species occur within a surveyed reach, evaluating habitat suitability based on a single species may not adequately represent overall ecological conditions. Moreover, from a management perspective, a simplified indicator that can reliably reflect habitat status is desirable. Following the HSI framework developed by the U.S. Fish and Wildlife Service and the concept of CHSI proposed by previous studies [34,35], this study integrated species-specific suitability into the CHSI to facilitate quantitative assessment:
C H S I = i = 1 n w i H S I i
where n is the number of species, wi is the weighting factor (with i = 1 n w i = 1.0 ), and HSIi represents the habitat suitability of each species.
In this study, CHSI was calculated by integrating the HSI values of O. barbatulum and R. candidianus, each assigned an equal weight of 0.5. These weights may be refined in future studies as more robust weighting approaches become available.

3. Results

3.1. Estimation of Baseflow

A total of four baseflow measurements were conducted in the engineered channel of Gaoliao Creek on 13 July 2023, 27 September 2023, 4 June 2024, and 14 August 2024, yielding discharge estimates of 0.065, 0.10, 0.13, and 0.26 m3/s, respectively. In addition, an automatic water level logger installed upstream recorded water levels at 10 min intervals on 13 July 2023. The corresponding mean discharge derived from these records was 0.063 m3/s, which closely agreed with the field estimate (0.065 m3/s), supporting the reliability of the current-meter method. Prior to the first survey, no rainfall occurred for 14 consecutive days. Before the second survey, there were six consecutive dry days. Prior to the third survey, cumulative rainfall over the preceding 7 days was 22 mm and was considered to have a negligible influence on discharge conditions. In contrast, cumulative rainfall reached 127.5 mm before the fourth survey, substantially affecting discharge; thus, the estimated discharge of 0.26 m3/s was excluded. In light of the limited antecedent rainfall prior to the first three surveys and the range of discharge estimates obtained under comparable dry-weather conditions, the mean discharge (0.10 m3/s) was adopted as a representative estimate of ecological baseflow. This value was subsequently used as the baseflow input for hydraulic simulations.

3.2. Rainfall–Runoff, Flow Velocity, and Water Depth Simulations

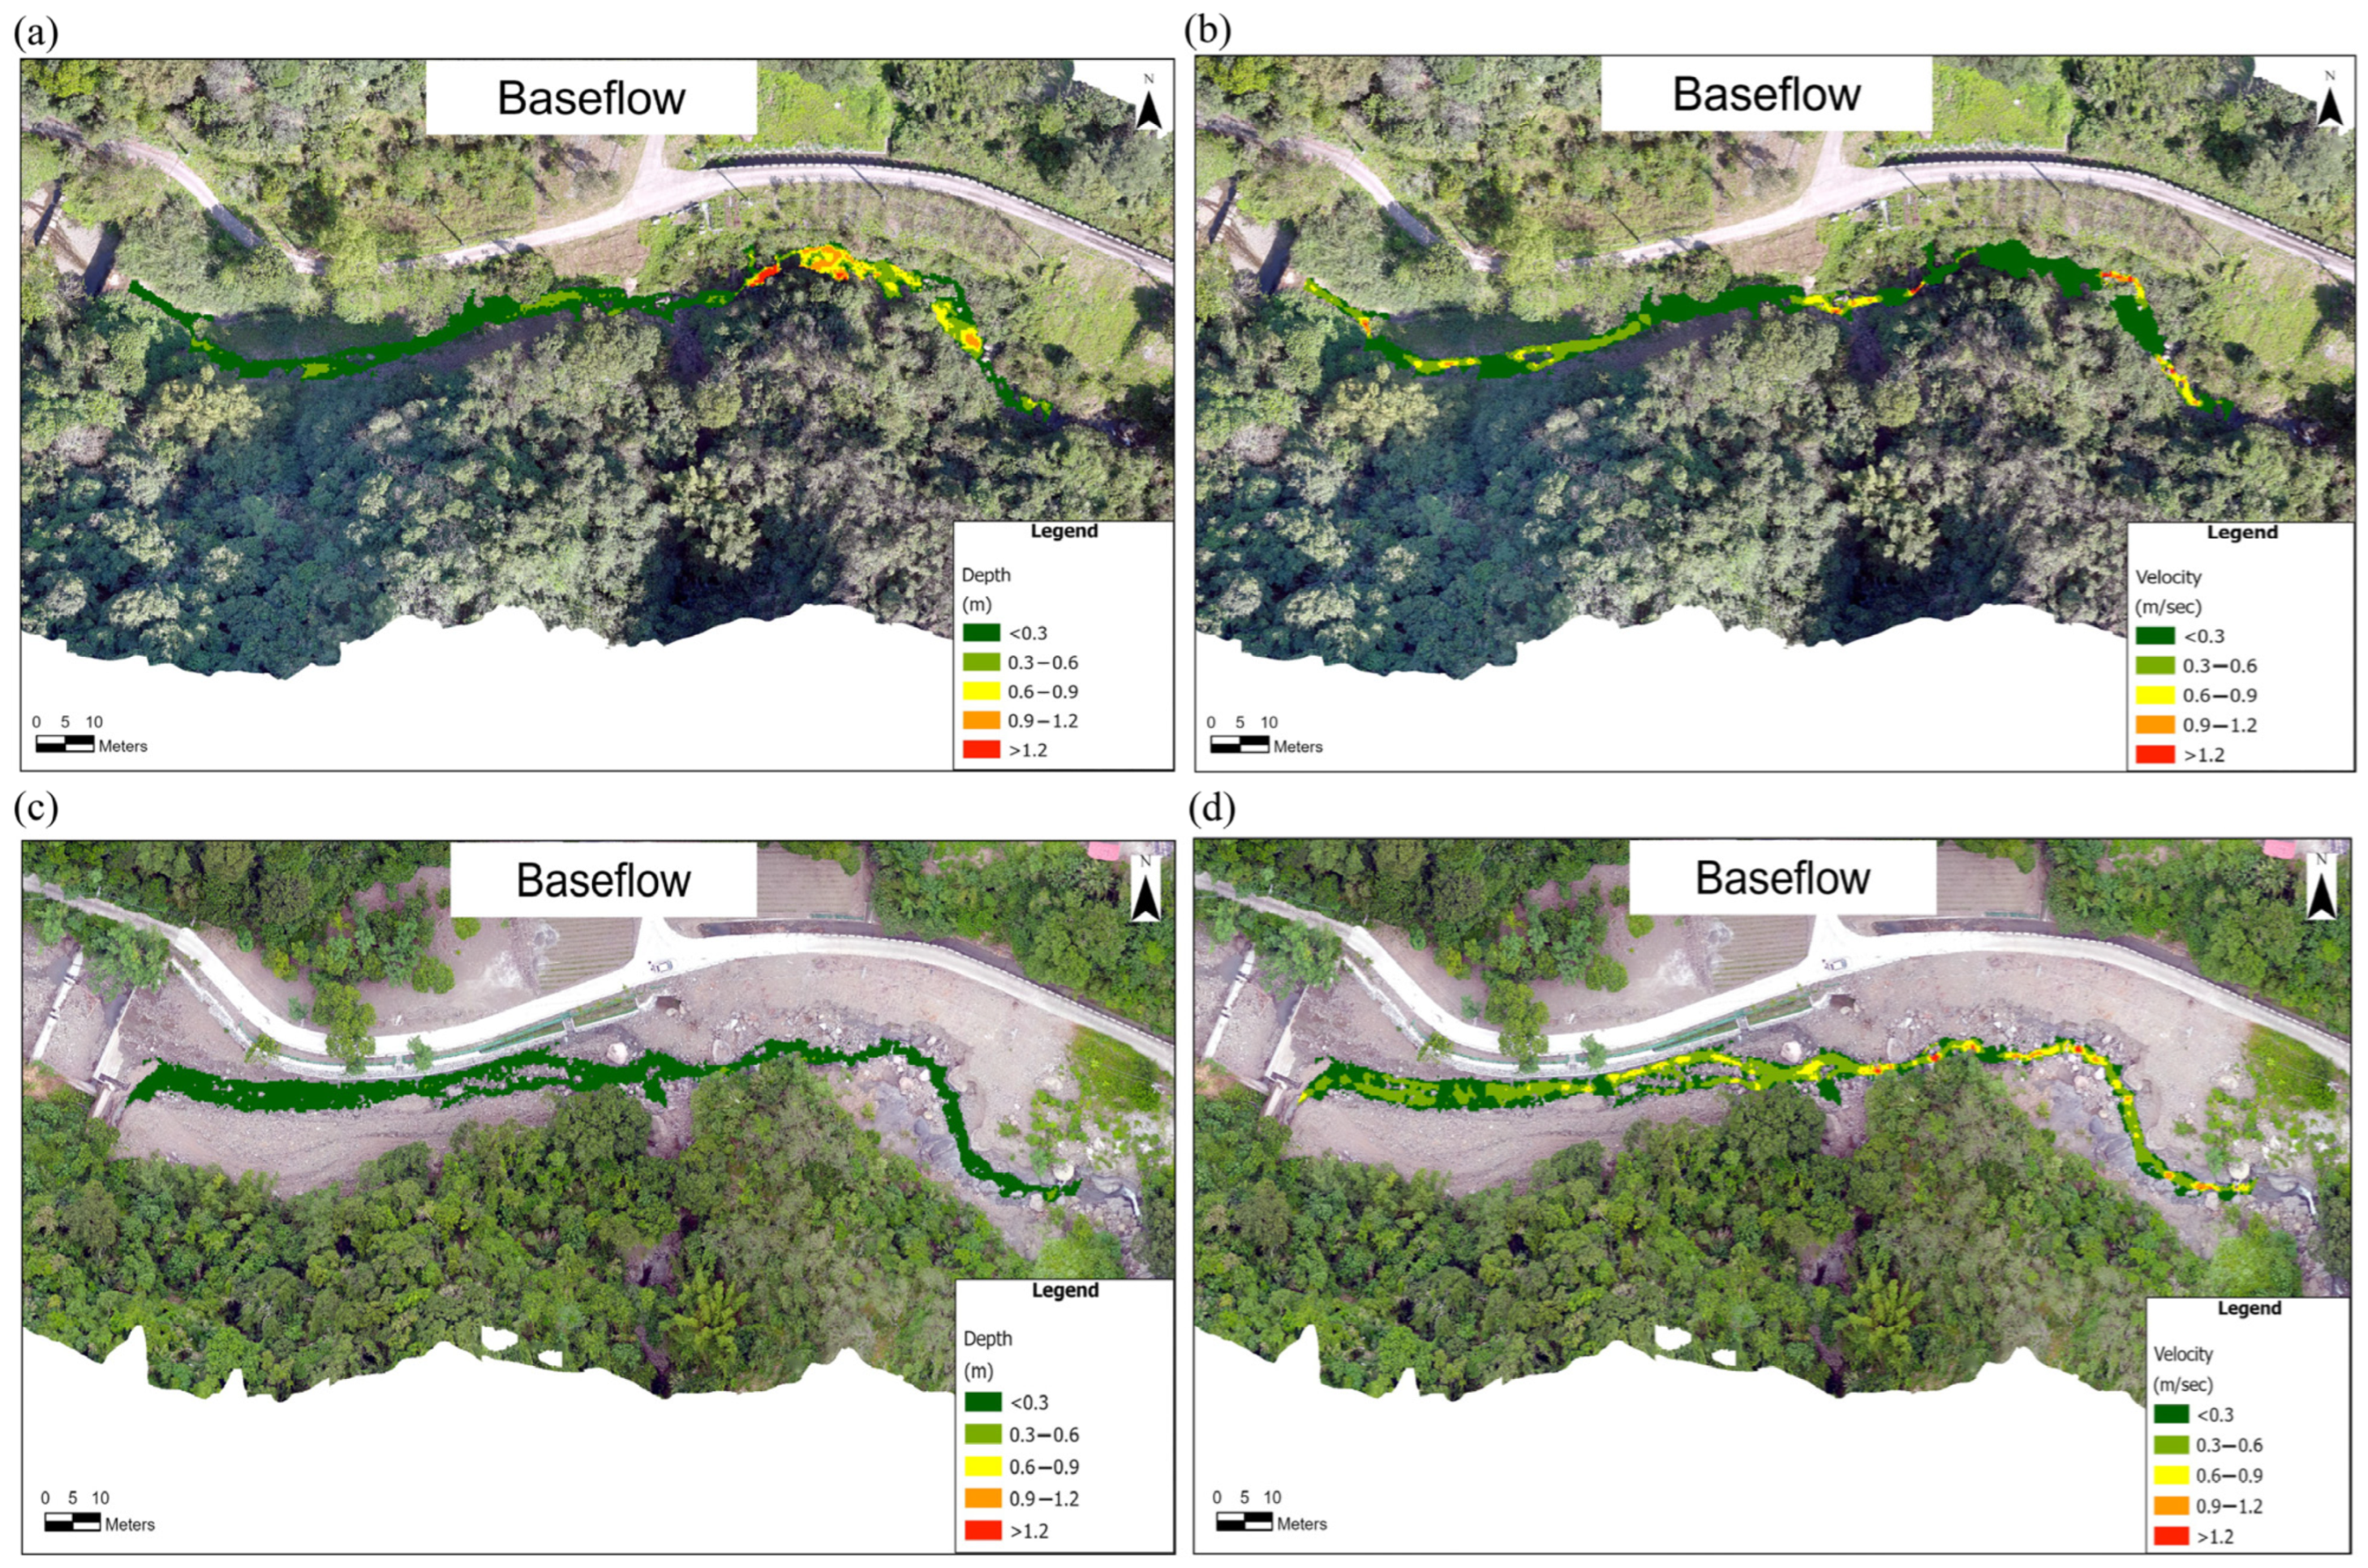
The observed hourly precipitation hydrographs of 23 and 24 September 2025 (Figure S2) were respectively used as an input boundary condition to simulate rainfall–runoff processes within the Gaoliao Creek watershed. These simulations generated two 24 h discharge hydrographs at the upstream boundary of the engineered reach (Figure S2). To improve the realism of the hydraulic simulations, spatially distributed roughness and infiltration parameters were incorporated. The watershed-scale distributions of roughness and CN values were presented in Figure S3. Subsequently, hydraulic simulations were performed to estimate flow velocity and water depth in the pre- and post-engineering Gaoliao Creek channels, using the baseflow and the 24 h discharge hydrographs from 23 and 24 September 2025 as input scenarios. The simulated spatial distributions of velocity and depth included baseline under baseflow conditions in the pre- and post-engineering channels (Figure 3) and dynamic responses during two precipitation events (Figures S4 and S5). Under baseflow conditions, many locations in the upstream of the pre-engineering channel exhibited water depths exceeding 0.6 m, whereas more than 90% of the post-engineering channel had depths < 0.3 m (Figure 3). In terms of flow velocity, most areas in the pre-engineering channel showed values < 0.3 m/s, with velocities exceeding 0.3 m/s only at some channel narrowings and boulder interfaces. After channel modification, velocities across most of the channel increased to approximately 0.3–0.9 m/s (Figure 3). These simulated flow velocity and water depth datasets were subsequently used as the foundation for evaluating the Fr, HSI, and CHSI.

3.3. Fr-Based Hydraulic Habitat Availability

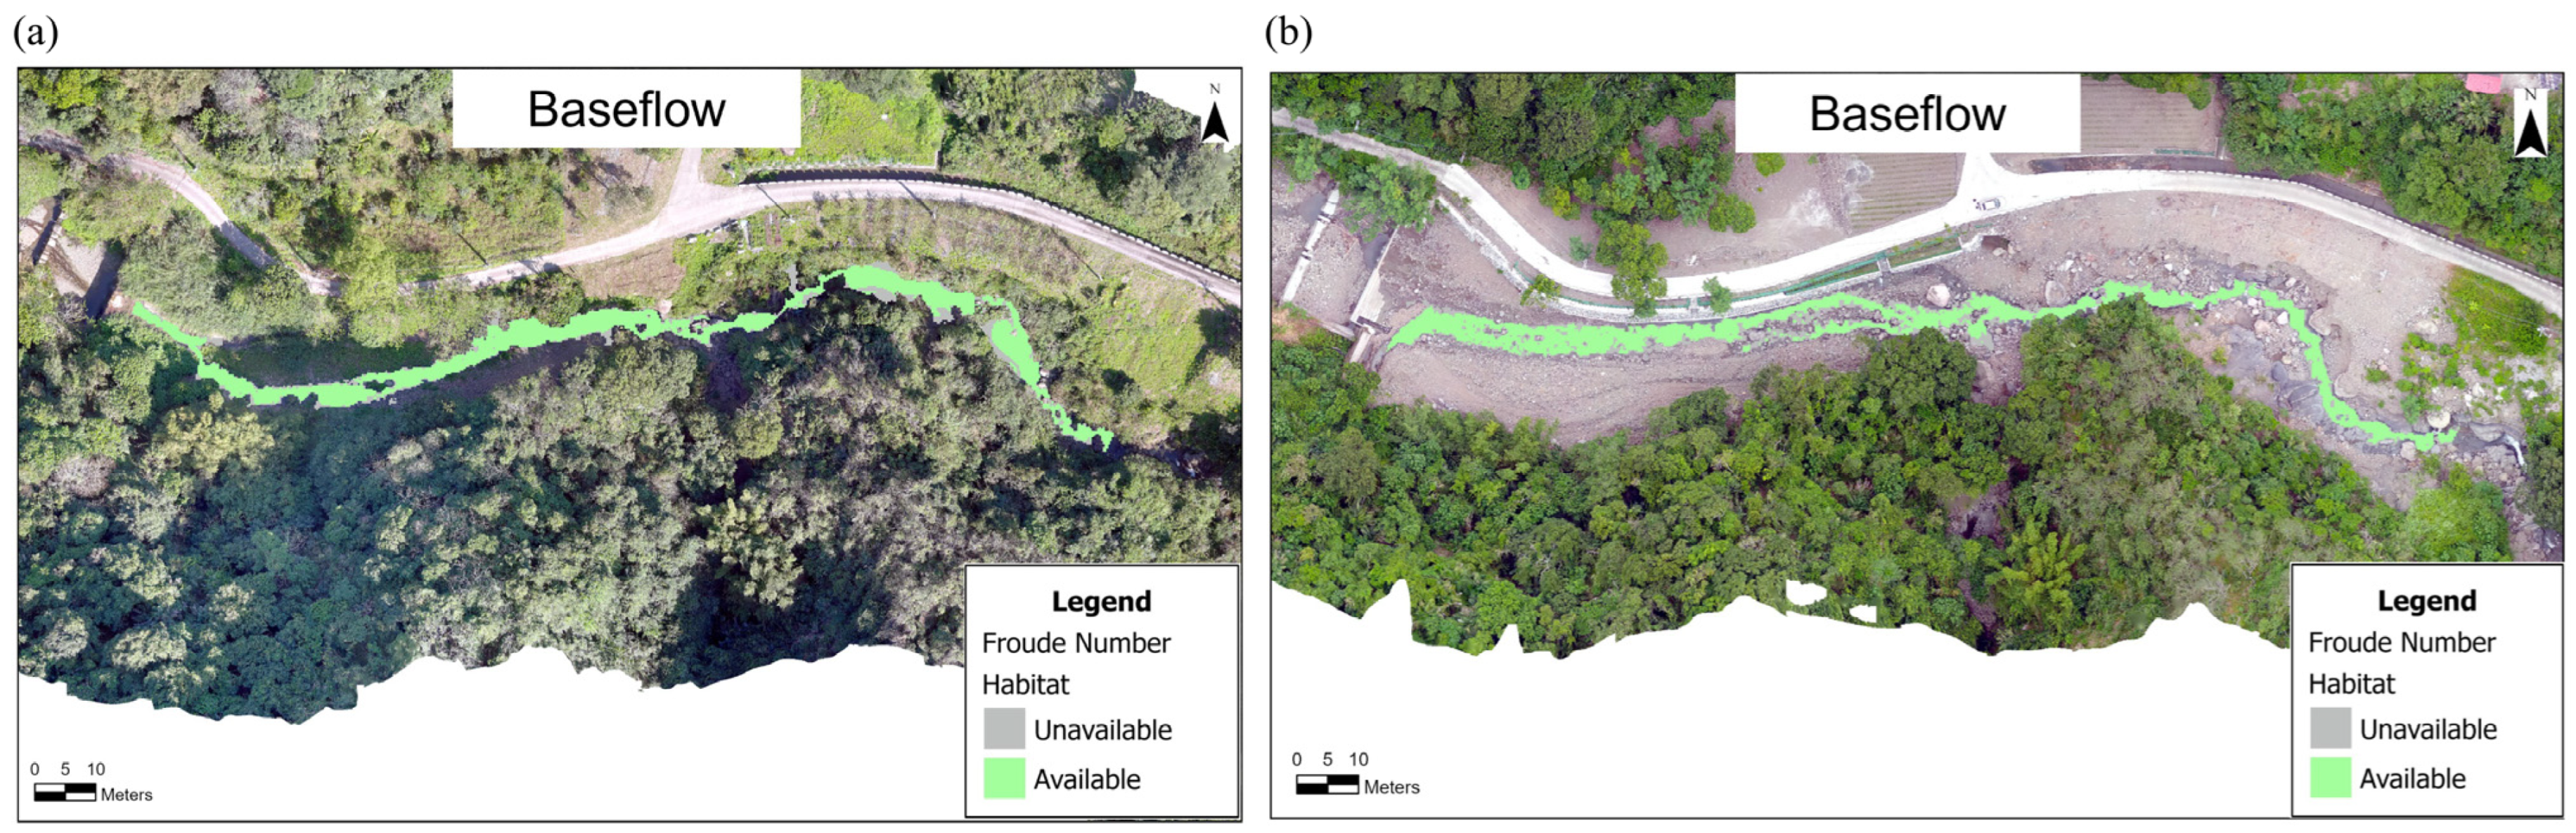
In this study, Fr was used to distinguish available and unavailable habitats for O. barbatulum and R. candidianus. Under baseflow conditions, the spatial distributions of available and unavailable habitats in the pre- and post-engineering channels are shown in Figure 4. Prior to channel modification, available habitat accounted for 81.6% of the total wetted area (Figure 4a; Figure S7b, 01:00), whereas this proportion decreased to 73.9% after channel modification (Figure 4b; Figure S7d, 01:00). Although the total wetted area increased following channel modification, the extent of available habitats did not increase proportionally, resulting in a slight decline in habitat availability. For the two precipitation events, the respective 24 h temporal variations in the spatial distribution of available and unavailable habitats within the pre- and post-engineering channels are presented in Figure S6, with the corresponding proportions of available habitats shown in Figure S7. Overall, during these two precipitation events, the proportion of available habitat in both the pre- and post-engineering channels initially increased slightly with discharge. However, when the discharge exceeded a threshold of 2 m3/s, a marked decline in available habitat was observed, with the reduction becoming more pronounced as the discharge intensified, particularly during the peak flows induced by the 23 September rainfall. As the discharge subsequently receded, the habitat availability began to recover, though the recovery patterns differed between the two events. After 16:00 on 24 September, due to the cessation of rainfall and reduction in surface runoff, the proportion of available habitat increased and stabilized at a level comparable to that under baseflow conditions. Conversely, owing to the persistent rainfall and high discharge that sustained after 16:00 on 23 September, the proportion of available habitat failed to recover to its baseline level.

3.4. Assessment of HSI

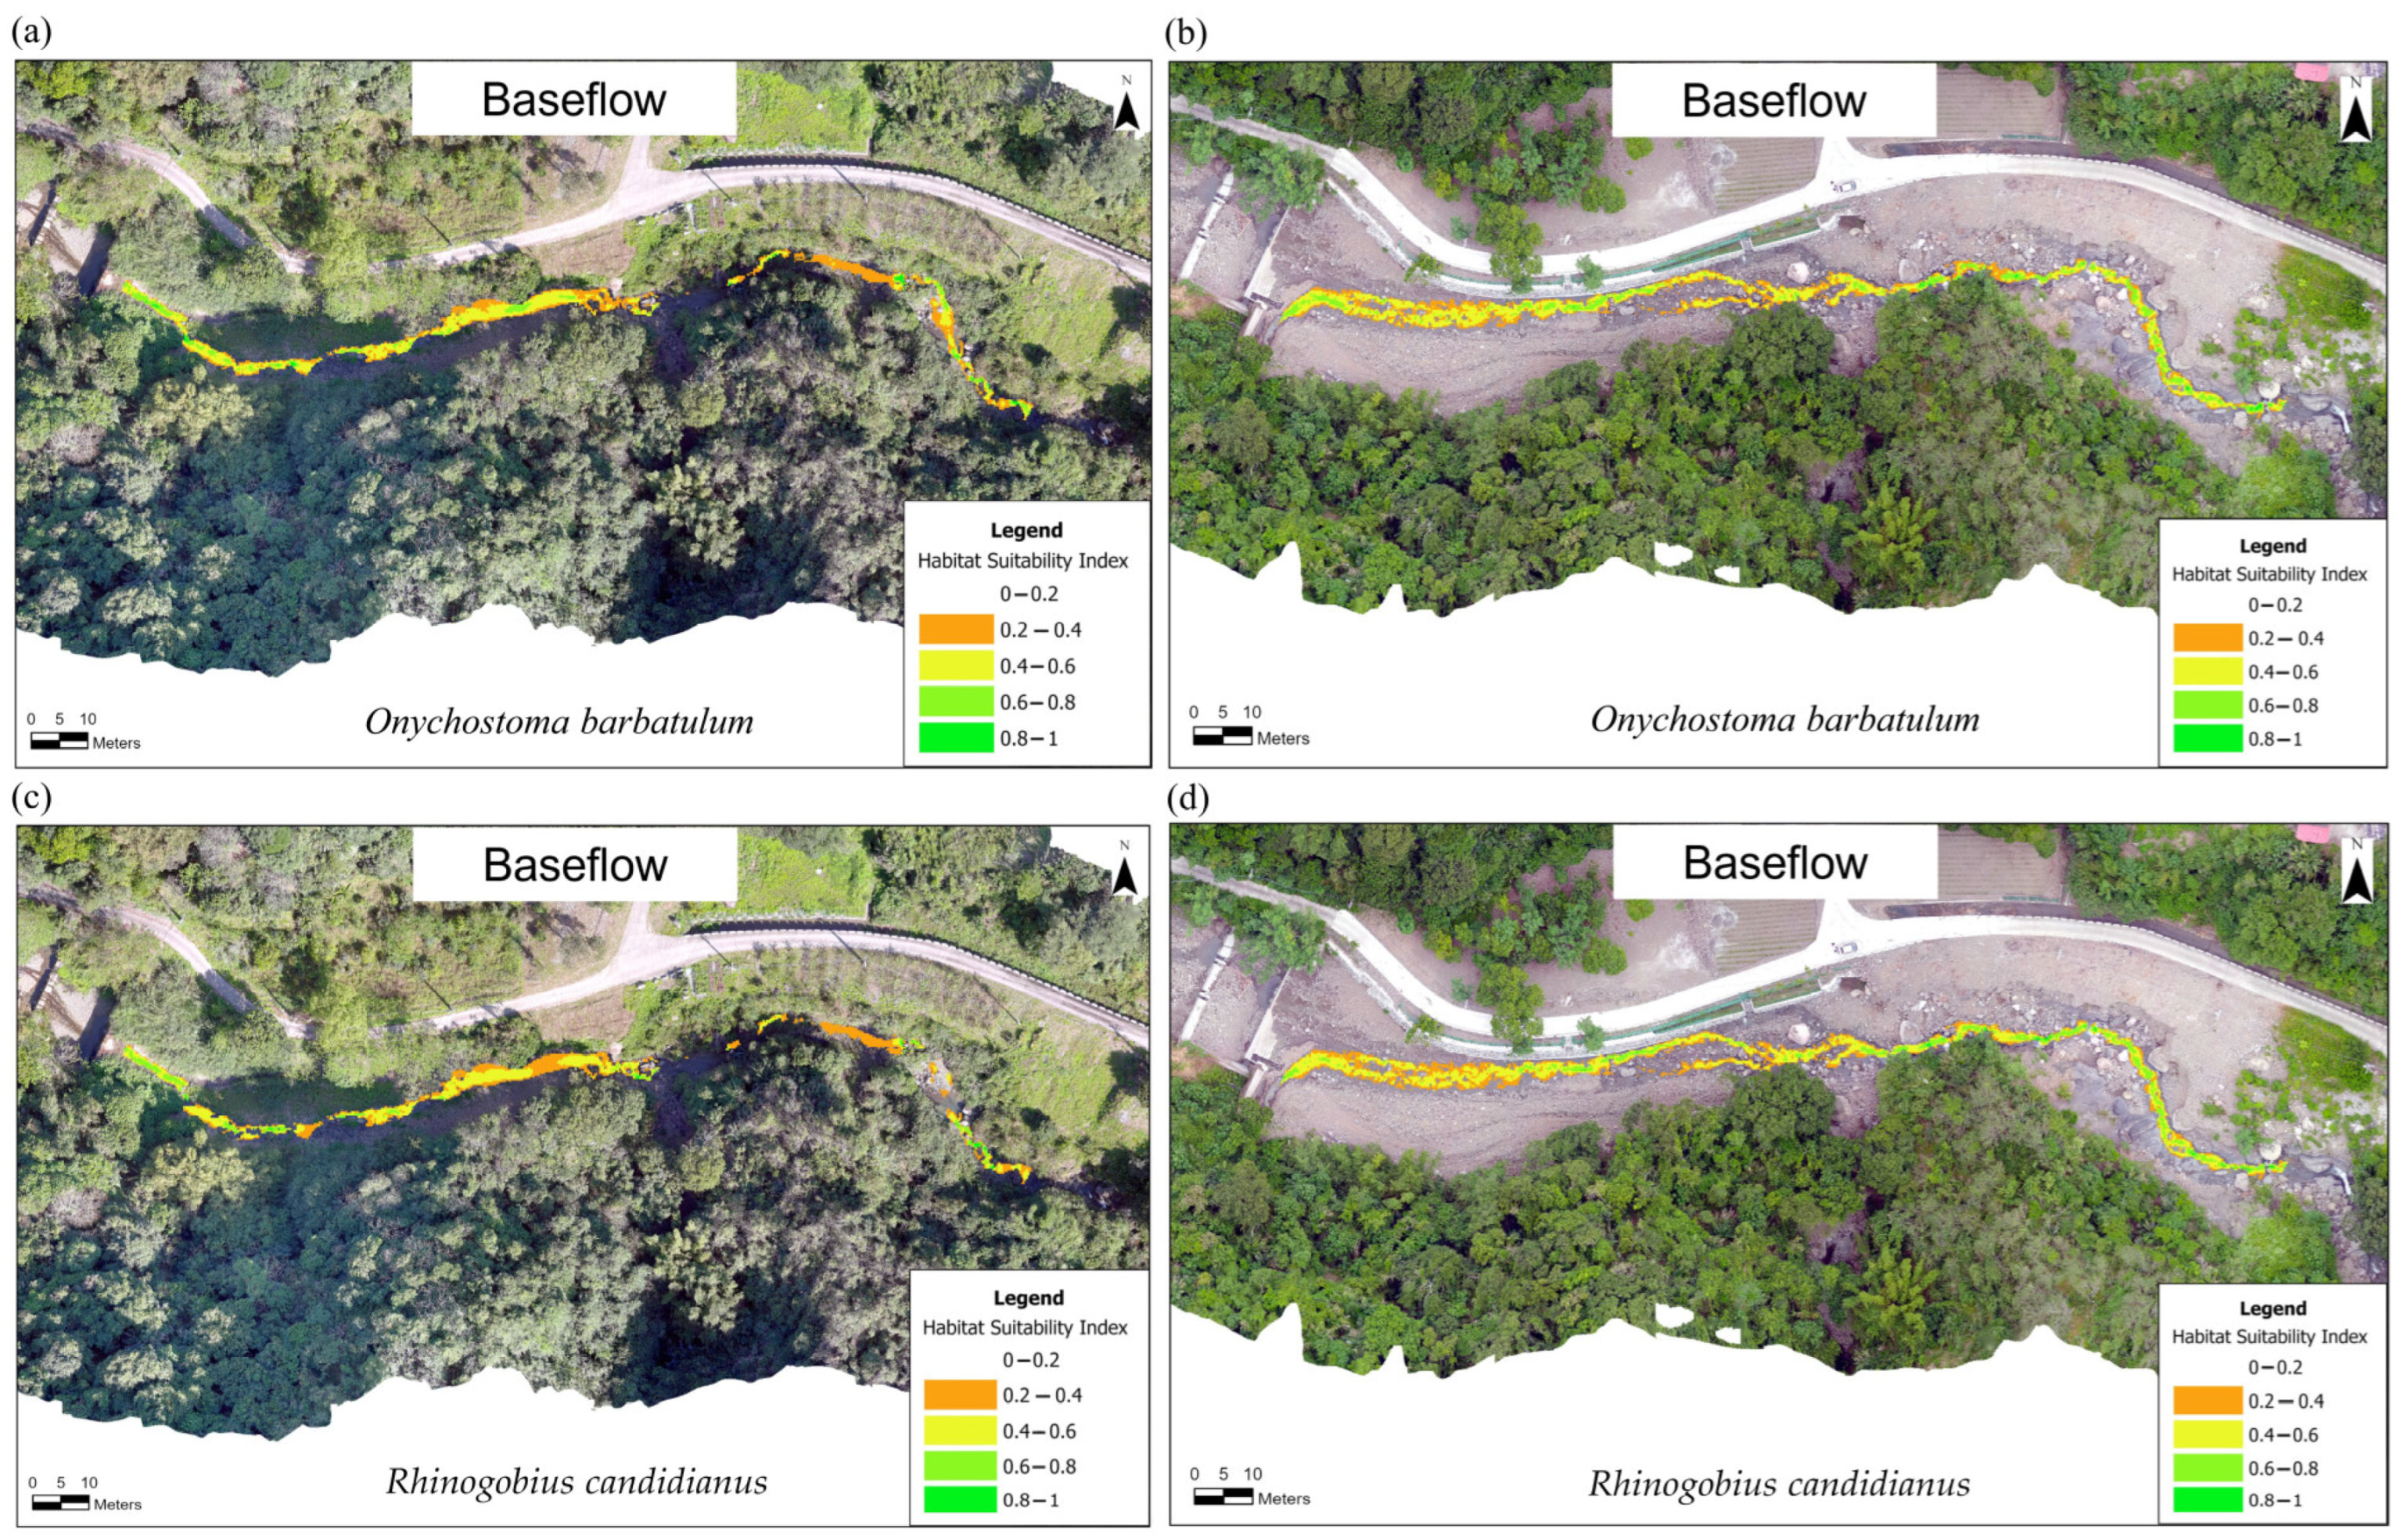
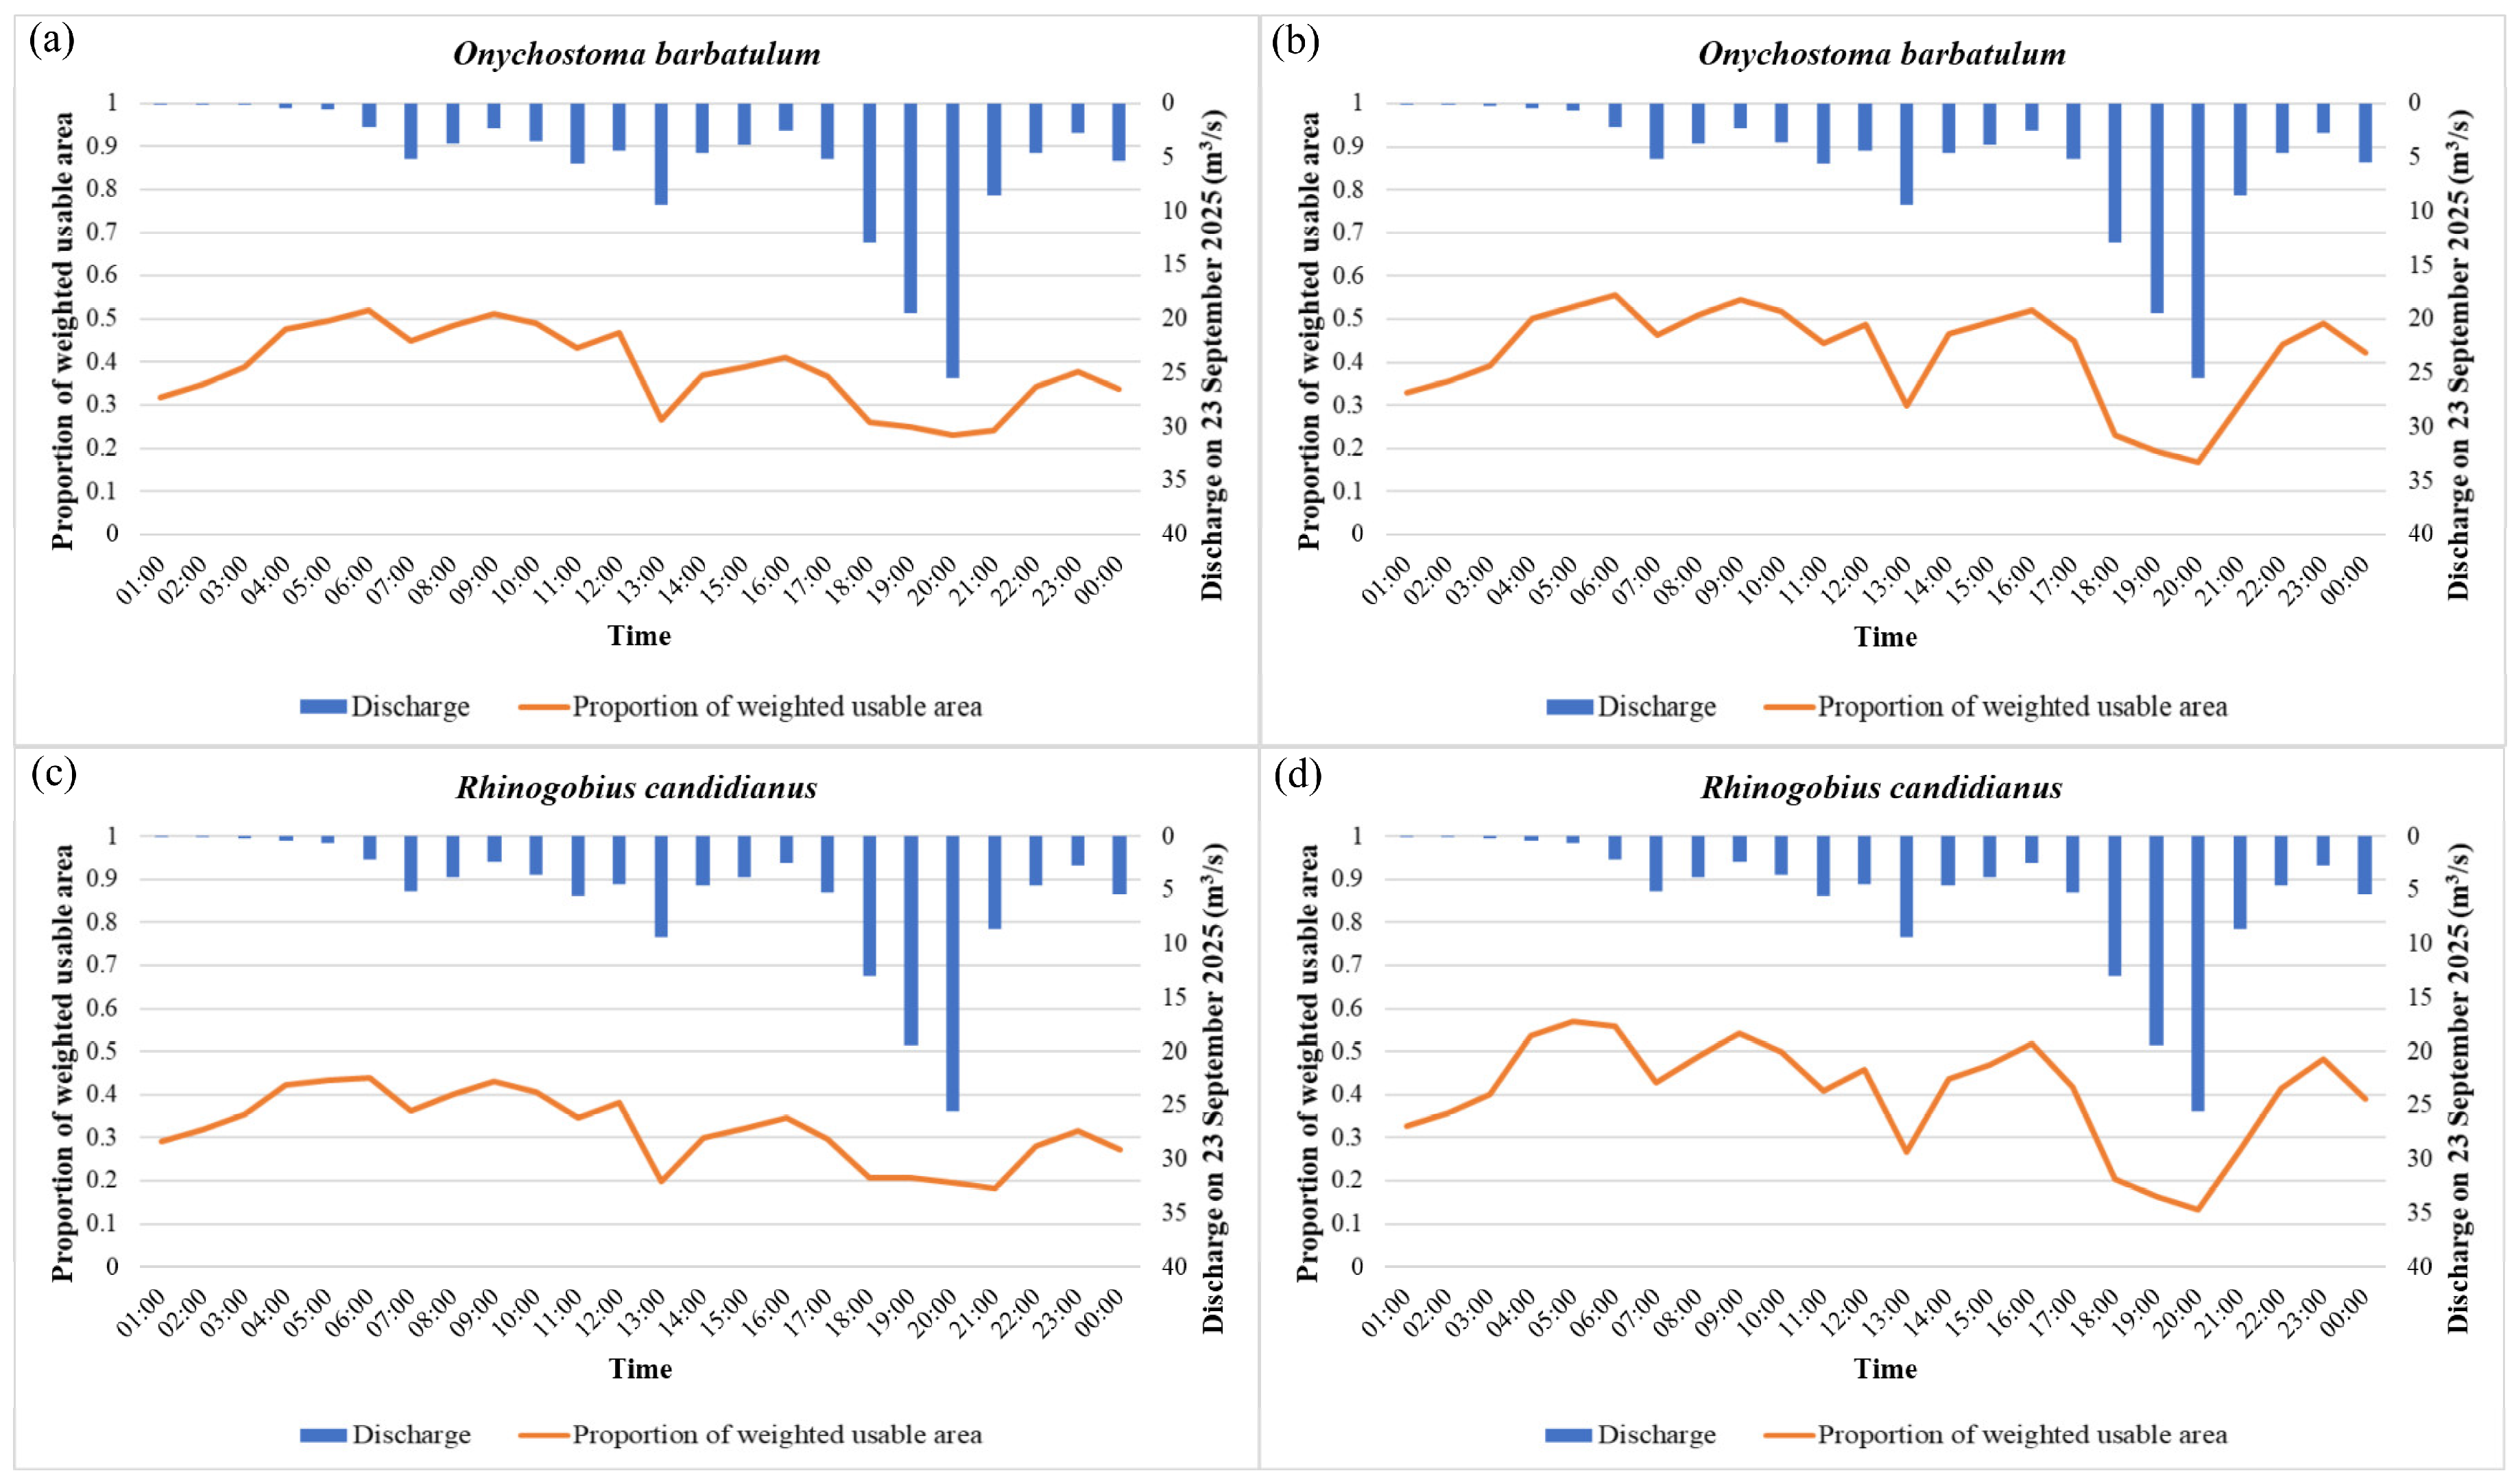
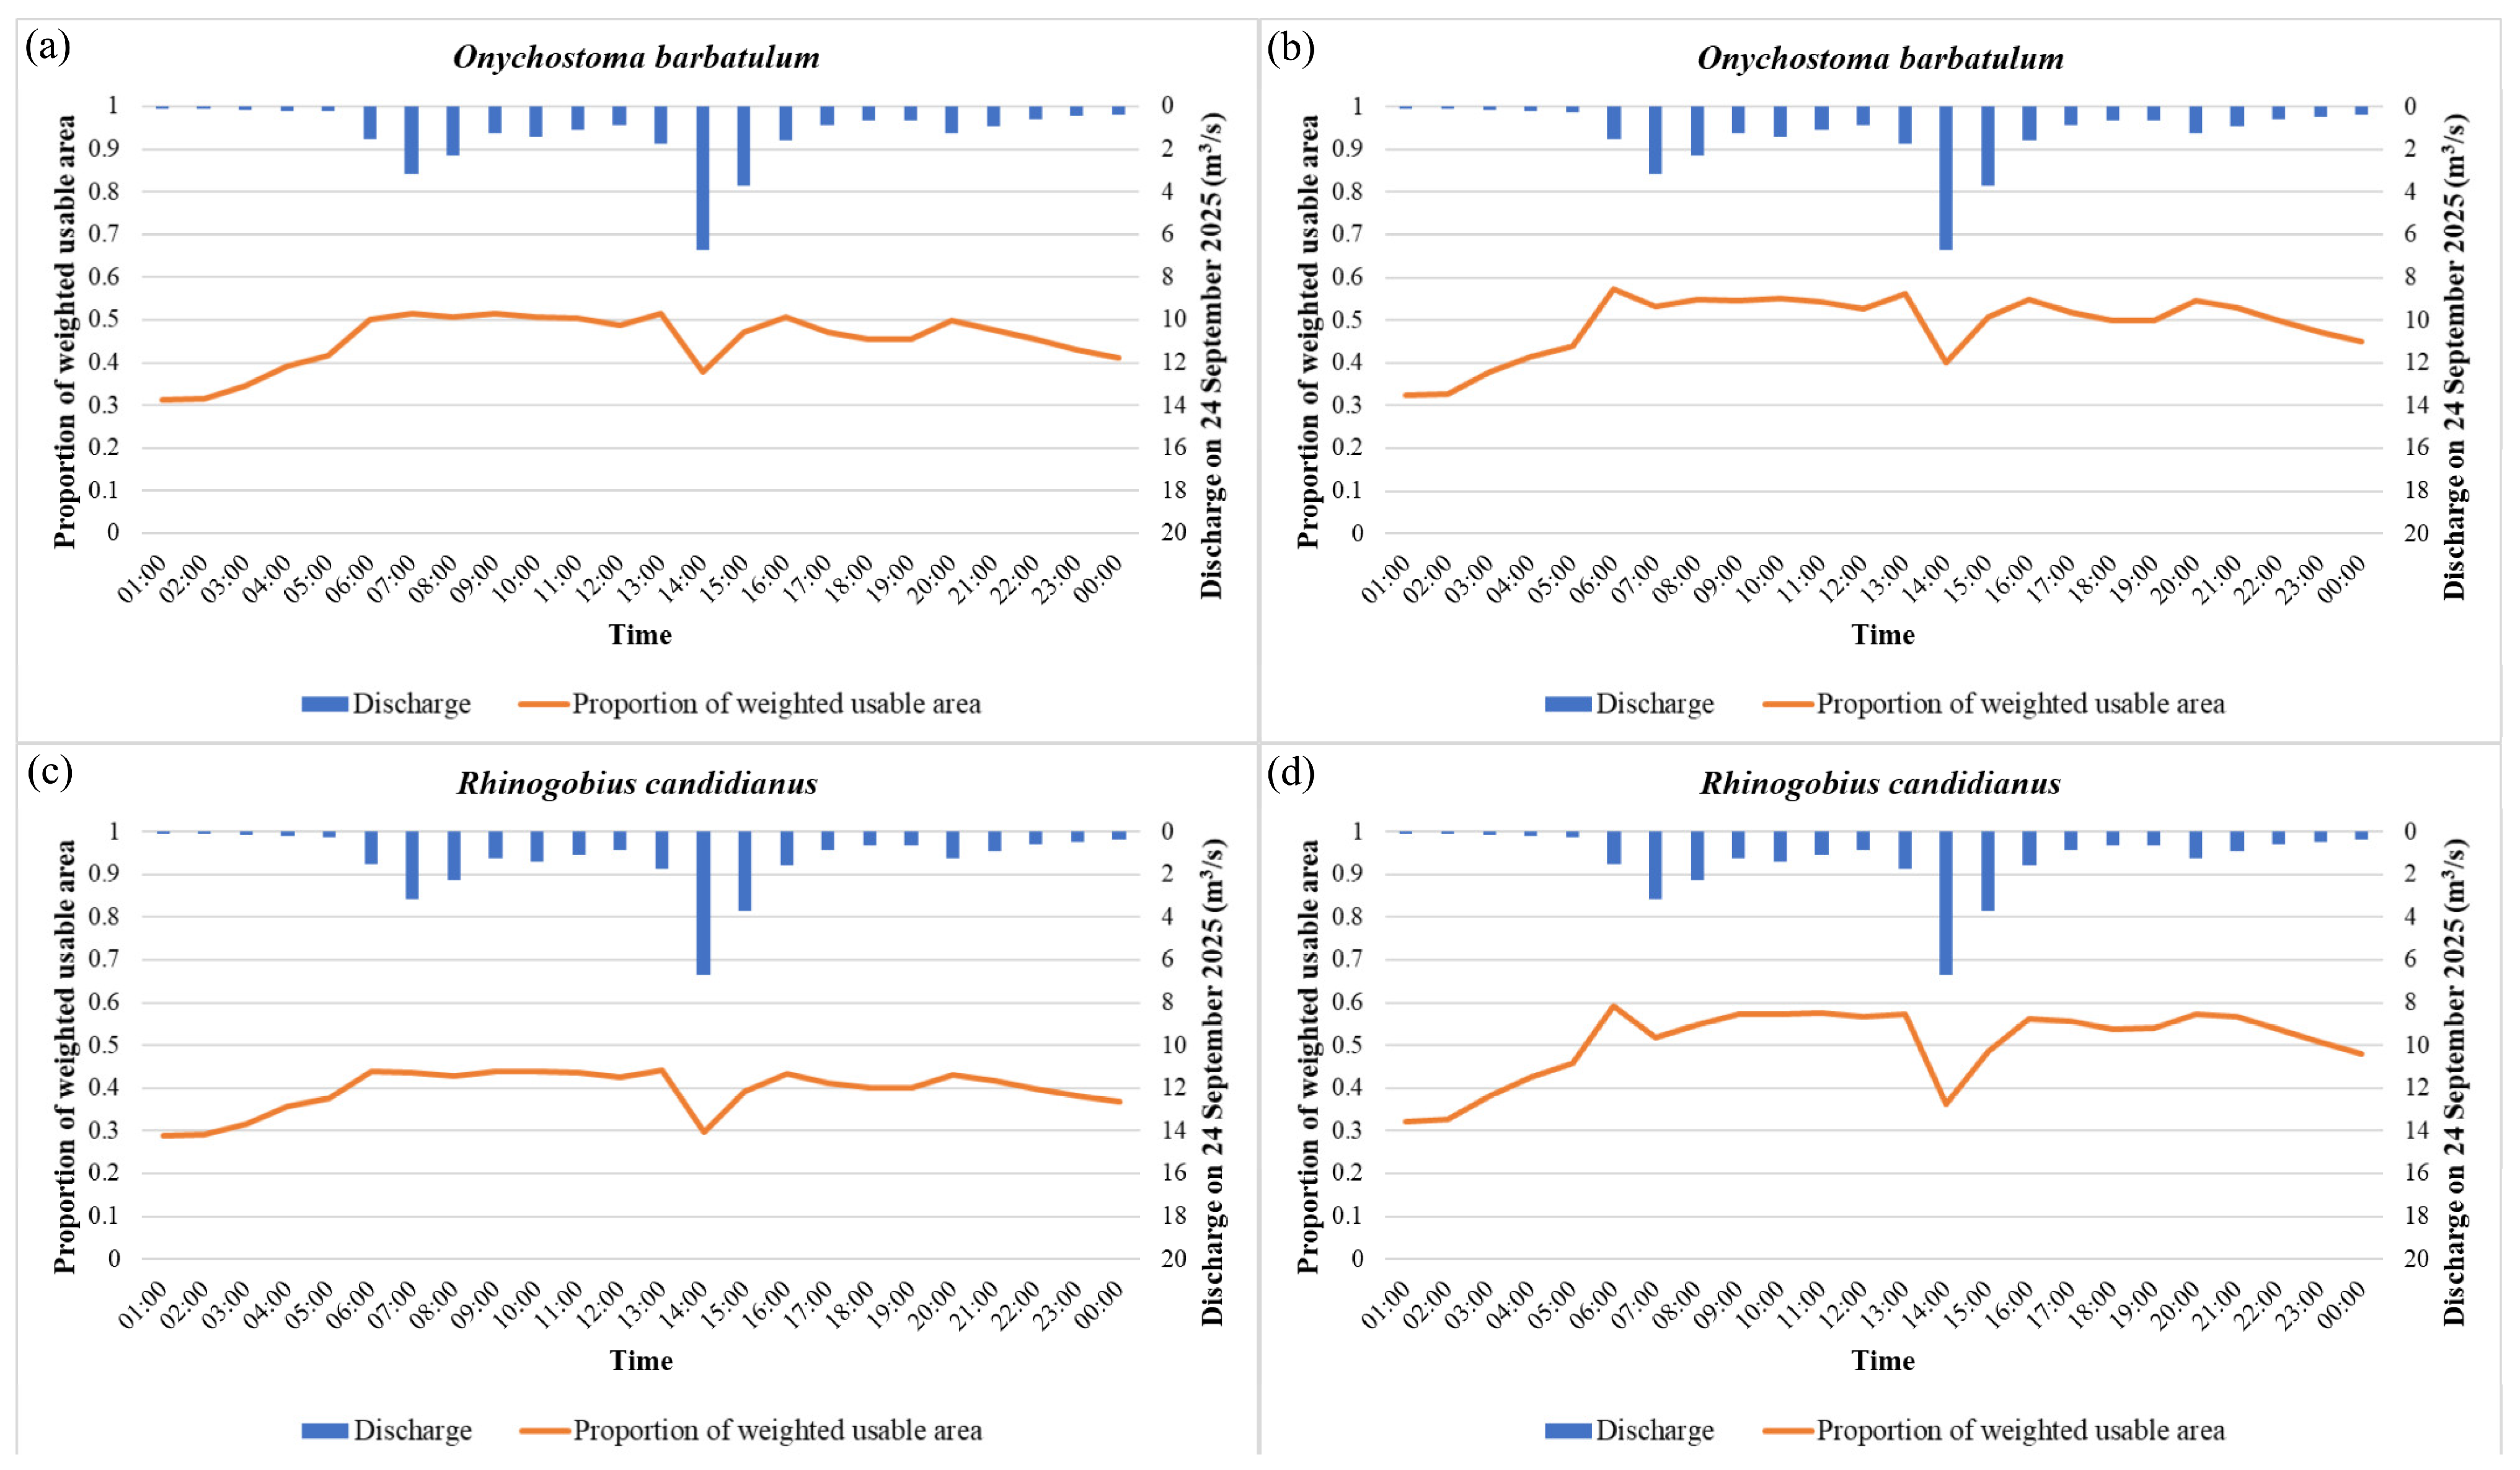
HSI was applied to examine the potential impacts of channel modification and precipitation on the habitat suitability of two common fish species, O. barbatulum and R. candidianus, in the Gaoliao Creek reach. Under baseflow conditions, the spatial distributions of HSI for O. barbatulum and R. candidianus before and after channel modification are shown in Figure 5. During the precipitation events on 23 and 24 September 2025, the respective 24 h temporal variations in HSI distribution for O. barbatulum and R. candidianus in the pre- and post-engineering channels were recorded and are presented in Figures S8 and S9. Subsequently, the wetted area, WUA, and PUA within the pre-engineering channel are summarized in Tables S5 and S6 for O. barbatulum, and in Tables S7 and S8 for R. candidianus. Moreover, the wetted area, WUA, and PUA within the post-engineering channel are summarized in Tables S9 and S10 for O. barbatulum, and in Tables S11 and S12 for R. candidianus. In addition, Figure 6 and Figure 7 illustrate the 24 h dynamics of HSI-derived PUA in the pre- and post-engineering channels for O. barbatulum and R. candidianus recorded during the precipitation events on 23 and 24 September, respectively.
Under baseflow conditions, the pre-engineering channel exhibited a wetted area of 552.15 m2, yielding a WUA of 172.29 m2 (PUA = 0.312) for O. barbatulum and 158.82 m2 (PUA = 0.288) for R. candidianus. In comparison, the post-engineering channel had a larger wetted area of 608.31 m2, with the WUA and PUA increasing to 196.96 m2 and 0.324 for O. barbatulum, and 195.44 m2 and 0.321 for R. candidianus, respectively. During the precipitation events on 23 and 24 September 2025, HSI-derived PUA for both O. barbatulum and R. candidianus in both pre- and post-engineering channels initially increased with discharge. However, once the discharge exceeded a specific threshold (approximately 5 m3/s), the PUA began to decline, with higher peak flows inducing more pronounced reductions, followed by a recovery as the discharge receded, thereby exhibiting a dynamic temporal pattern. Furthermore, the data indicated that the post-engineering channel was more sensitive to runoff variations than the pre-engineering channel. Upon the arrival of peak flows, the habitat quality in the modified channel degraded more rapidly and dropped to lower baseline values than in the original channel, suggesting that hydraulic conditions—particularly flow velocity—became more adverse during flood peaks due to the channel modification.

3.5. Assessment of CHSI

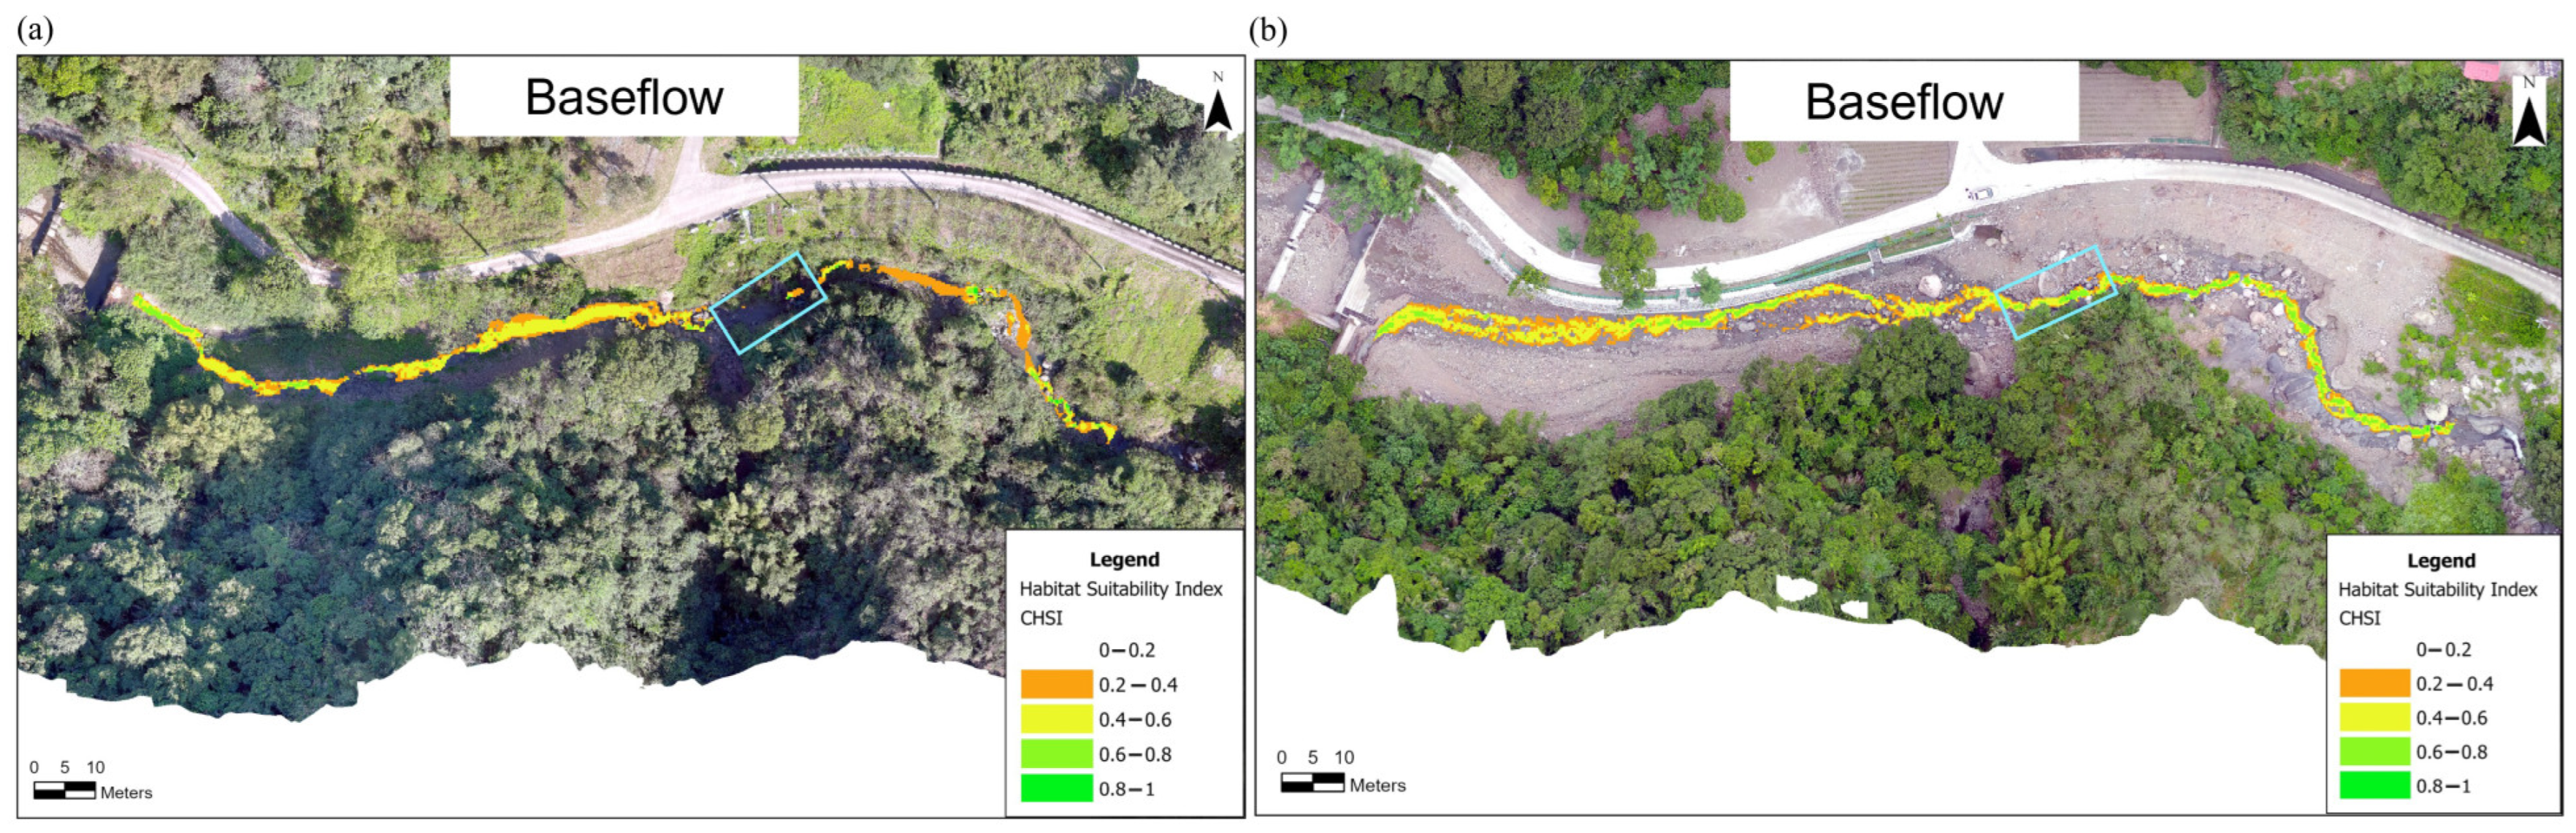
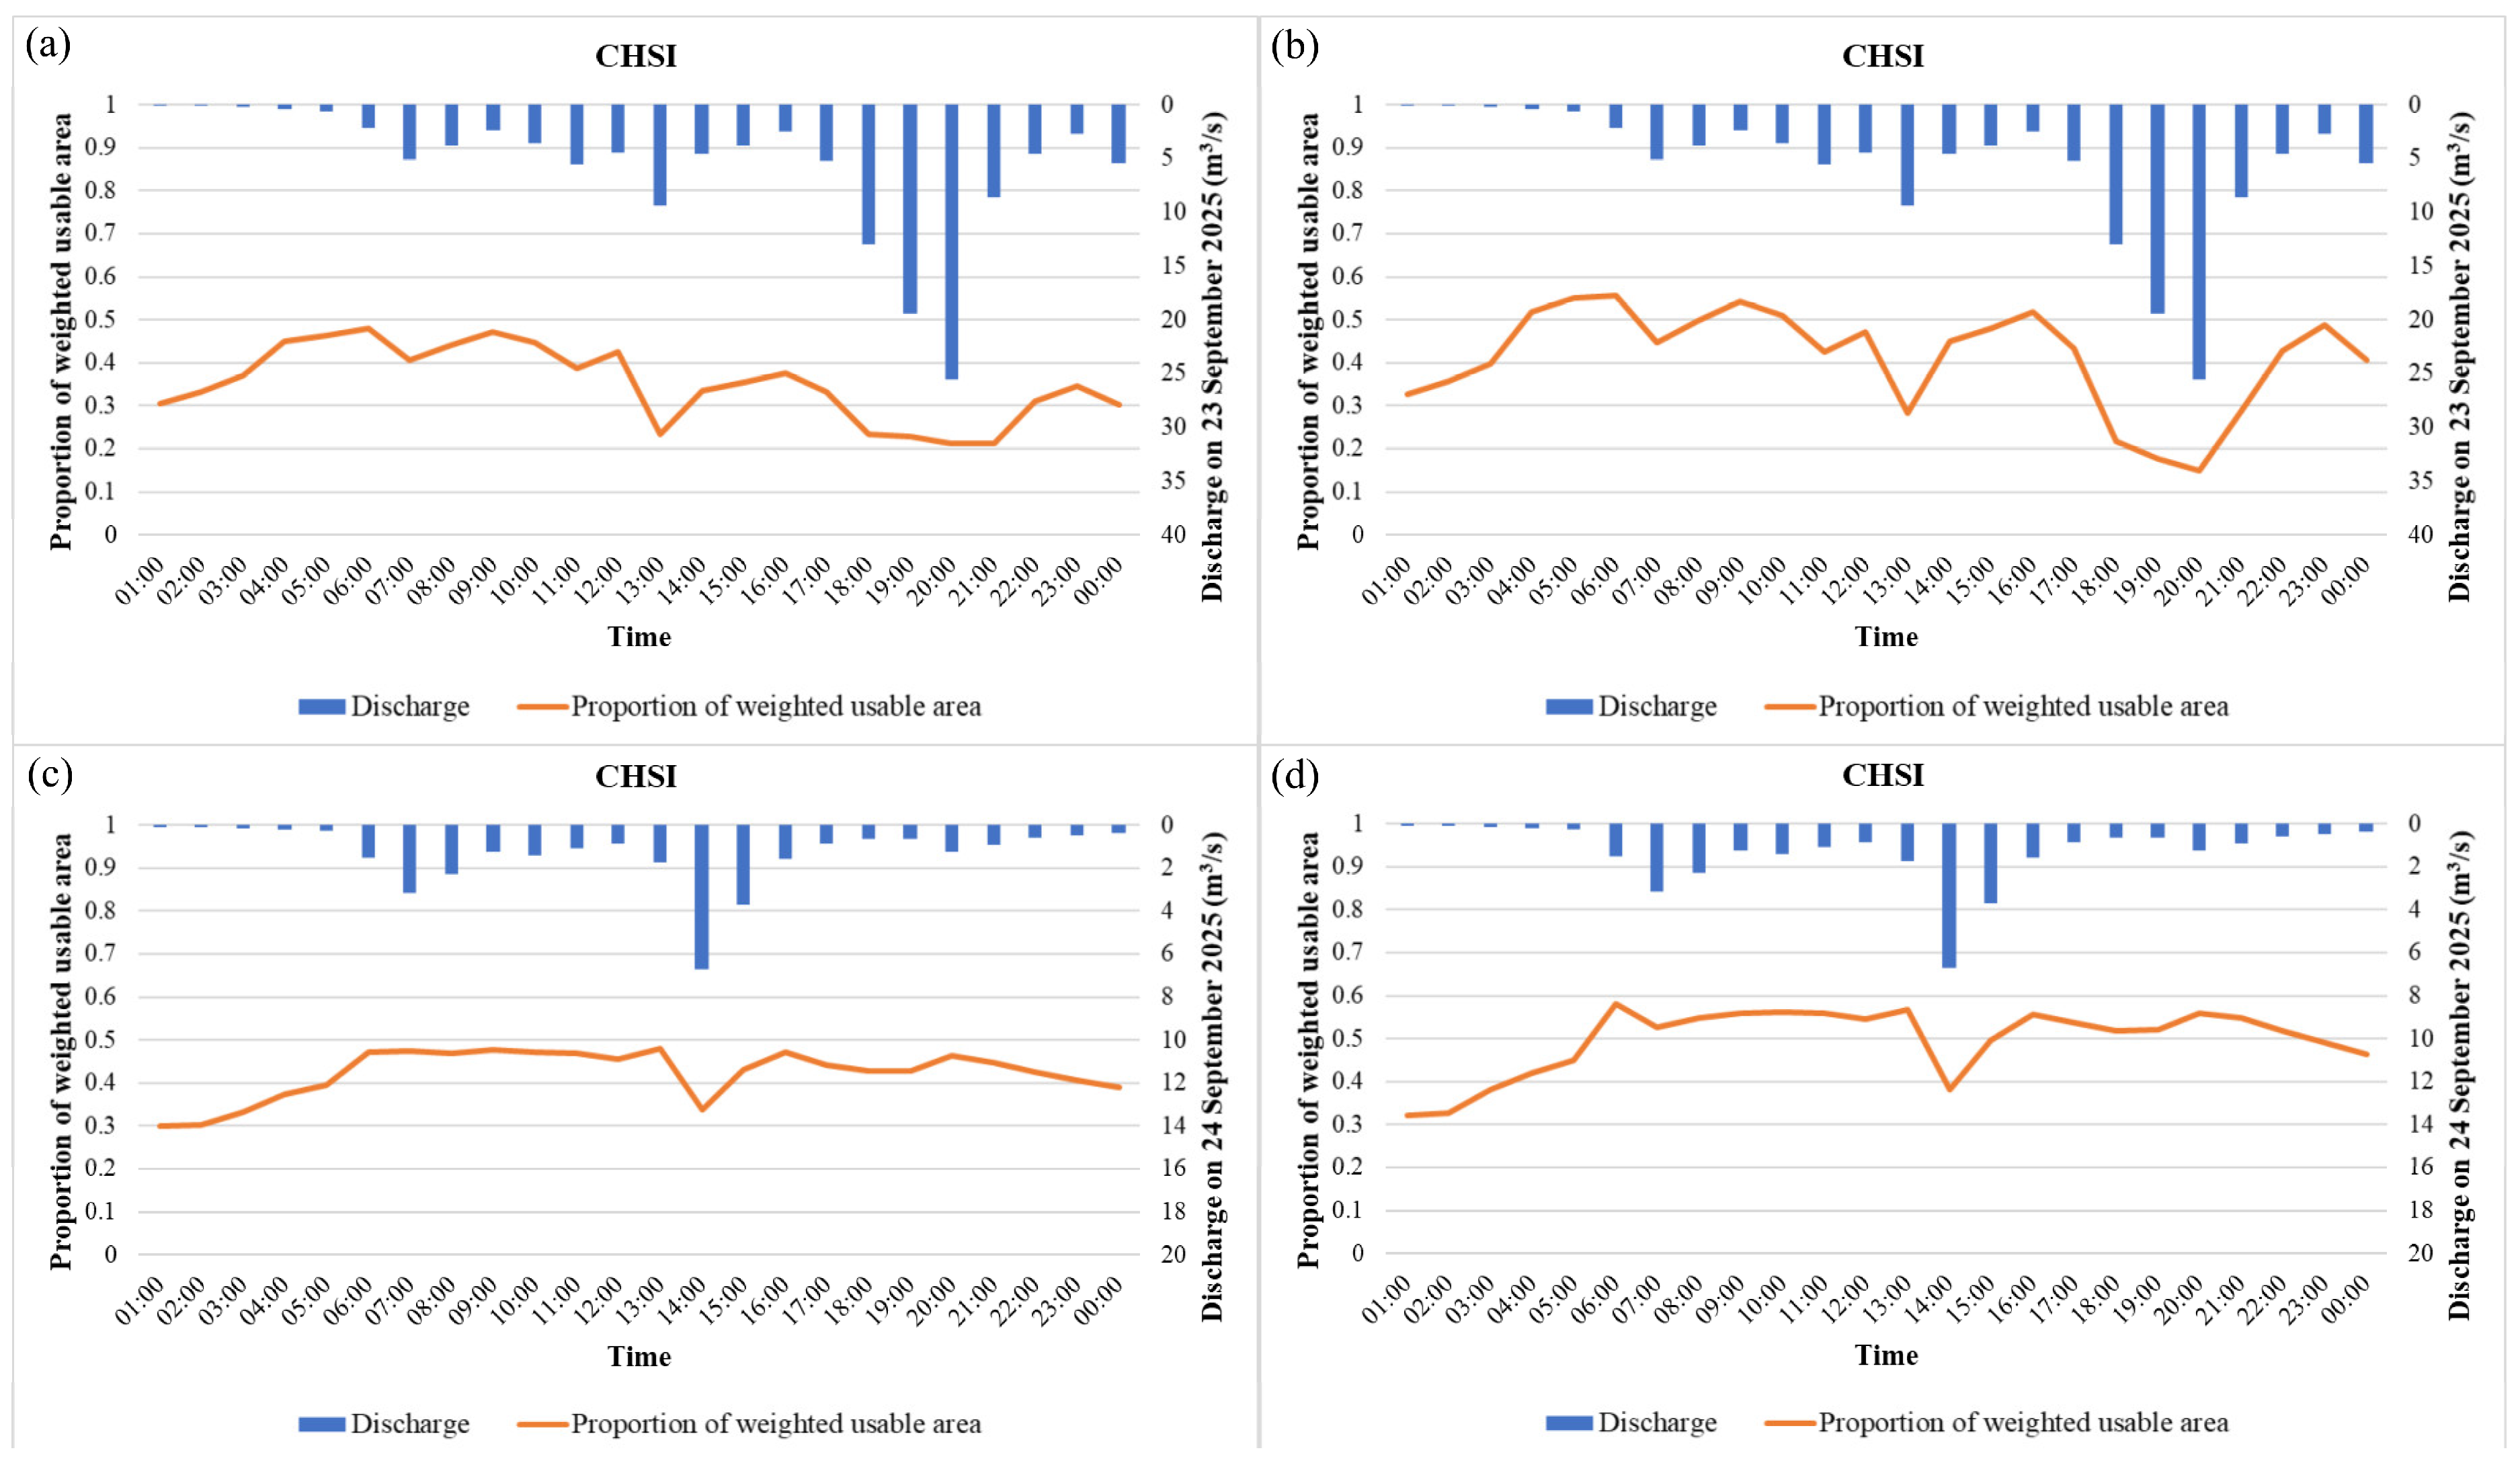
To better represent ecological conditions and simplify habitat metrics, the CHSI approach was adopted. Under baseflow conditions, CHSI distributions in the pre- and post-engineering channel are shown in Figure 8, while the 24 h temporal variations in CHSI distributions during the precipitation events on 23 and 24 September 2025 are presented in Figure S10. Subsequently, the wetted area, WUA, and PUA derived from CHSI within the pre-engineering channel are summarized in Tables S13 and S14 for the 23 and 24 September precipitation events, respectively, while the corresponding values within the post-engineering channel are presented in Tables S15 and S16, respectively. Under baseflow conditions, the pre-engineering channel had a wetted area of 552.15 m2, yielding a WUA of 165.56 m2 (PUA = 0.300), whereas the post-engineering channel showed a wetted area of 608.31 m2, yielding a WUA of 196.20 m2 (PUA = 0.323). In addition, Figure 9 illustrates the 24 h dynamics of CHSI-derived PUA in the pre- and post-engineering channels during the precipitation events on 23 and 24 September. Overall, under the precipitation events on 23 and 24 September 2025, the 24 h temporal dynamics of the CHSI-derived PUA in both pre- and post-engineering channels were highly consistent with those derived from the species-specific HSI. Furthermore, the results indicated that, compared with the pre-engineering channel, habitat suitability for fish in the post-engineering channel exhibited greater sensitivity to rapid hydrologic variations. Under the same extreme rainfall or peak-discharge conditions, the modified channel exhibited lower habitat suitability than the original channel.

4. Discussion

This study integrated hydrodynamic modeling, Fr analysis, and habitat suitability assessment to investigate the effects of channel modification and rainfall events on fish habitats in a small watershed. Simulation results indicated that channel modification substantially altered the spatial distribution of flow velocity and water depth. Under baseflow conditions, the pre-engineering channel was characterized by extensive areas with depths exceeding 0.6 m and velocities below 0.3 m/s, while only limited patches exhibited velocities greater than 0.6 m/s. According to the ecological engineering guidelines of the Forestry and Nature Conservation Agency, habitats with depths > 0.3 m and velocities < 0.3 m/s in Taiwanese streams are classified as pools. Field surveys conducted prior to channel modification confirmed the presence of numerous pool habitats, particularly in the upstream section of the study reach. These pools were likely formed by accumulations of large boulders, which obstruct flow and reduce velocity. In contrast, locally accelerated flows occurred within narrow interstices between boulders or along steeper channel gradients, where flow constriction and elevation differences increased flow velocities [36,37]. This pattern is consistent with the small high-velocity patches identified in the simulations.
In addition to abundant boulder accumulations, dense riparian vegetation was observed along both sides of the upstream channel prior to engineering, potentially constricting the effective flow conveyance. The hydrodynamic simulations in this study were based on a UAV-derived DSM; however, such DSMs are susceptible to vegetation occlusion. In areas with dense canopy cover, ground elevation may be inaccurately represented, increasing uncertainty in terrain interpretation [38,39]. During analysis, several upstream sections with high canopy cover were found to have poorly resolved channel topography, which slightly affected the simulated flow extent. For example, the model occasionally predicted flow blockage in locations where water can in fact pass under natural conditions. To address this issue, minor manual corrections were applied to the pre-engineering DSM to ensure hydraulic connectivity. In contrast, the downstream reach was more open, with fewer boulders and less canopy cover, and thus required no such adjustments. Light Detection and Ranging (LiDAR), with its active sensing capability and multiple-return features, can partially penetrate vegetation and provide more accurate bare-earth elevations, offering a viable solution to this limitation [38,39]. However, the high costs associated with LiDAR equipment and data acquisition exceeded the scope of this study. Future work will seek additional resources to incorporate LiDAR-derived high-resolution DSM or digital elevation models (DEM) to improve terrain representation and habitat assessment accuracy.
Following channel modification, most big boulders originally within the channel were relocated to the channel margins to improve flow conveyance and reduce bank erosion. As a result, the post-engineering channel became relatively smoother and wider, with a slightly increased longitudinal bed slope. Hydrodynamic simulations under baseflow conditions indicated that more than 90% of the channel exhibited water depths < 0.3 m, with flow velocities predominantly ranging from 0.3 to 0.9 m/s. Compared to pre-engineering conditions, the channel became shallower and faster. These results are consistent with the expected geomorphic and hydraulic responses to channel modification: the removal of boulder obstructions, improved flow continuity, and increased slope collectively contribute to reduced water depth and increased velocity. Overall, channel modification substantially altered the hydraulic characteristics, shifting the system from a “deep and slow” to a “shallow and fast” regime. Notably, this hydraulic transition likely accelerated the drainage capacity during extreme high-flow conditions, thereby mitigating flood risks in the surrounding area. This was partially demonstrated by the hydraulic simulations of the extreme precipitation event (typhoon-induced) on 23 September 2025. In the pre-engineering channel scenario, upon the arrival of the flood peak after 13:00, the river stage exceeded the bankfull capacity, inundating the adjacent roadways and agricultural fields to the right. Conversely, under identical rainfall–runoff conditions, simulations of the post-engineering channel showed that the active channel contained the floodwaters without any overbank flooding into the adjacent infrastructure. These findings suggest that the modified channel significantly improves the flood conveyance during the selected extreme rainfall event.
Previous studies have commonly used the Fr to classify hydraulic habitat types (e.g., pool, run, riffle) [30,40,41]. However, its application to quantify the spatial distribution and area of available and unavailable fish habitats remains limited. Therefore, this study applied the Fr as a classification criterion to quantify habitat availability in terms of area, representing a novel and practical approach. Under baseflow conditions, the Fr analysis showed that the proportion of available habitat decreased from 81.6% before channel modification to 73.9% after modification, indicating a moderate negative effect of the channel modification on available habitat. Notably, although the total wetted area increased after modification, this expansion did not necessarily translate into available hydraulic conditions for either O. barbatulum or R. candidianus. Consequently, the proportion of available habitat declined despite the expansion of wetted area, indicating a “habitat dilution” effect. As mentioned in the above paragraph, the channel modification substantially altered the hydraulic characteristics, shifting the system from a “deep and slow” to a “shallow and fast” regime. When conditions of high velocity and shallow depth occur, the calculated Fr values are likely to exceed the upper threshold of 2.39 established in this study, thereby classifying these habitat areas as unavailable. Furthermore, if the flow velocity within a habitat exceeds the critical threshold of 1.5 m/s, the habitat is likewise designated as unavailable. These two compounding factors are likely the primary drivers underlying the observed decline in the proportion of available habitat within the post-engineering channel.
Regarding the assessment of habitat suitability, relying exclusively on hydraulic parameters such as flow velocity and water depth may be insufficient for a comprehensive evaluation. This insufficiency arises because habitats screened as suitable based on hydraulics do not necessarily accommodate the majority of fish species, while areas classified as unsuitable might still be utilized by certain species. To address this limitation and depart from conventional practices, this study integrates substrate as a critical factor within the HSI and CHSI analytical frameworks for a more holistic assessment. The results of the species-specific HSI and CHSI models indicated that under baseflow conditions, the PUA values for both individual and combined indices in the post-engineering channel increased compared to those in the pre-engineering channel, with a particularly pronounced increase for R. candidianus. This finding implies that the post-engineering channel environment is relatively favorable for O. barbatulum and R. candidianus, exerting no adverse impacts on their overall habitat quality. UAV aerial imagery of the modified channel revealed a high prevalence of sand, cobbles, and small boulders, accompanied by a reduction in large boulders. Crucially, as sand and cobbles represent highly suitable substrates for both O. barbatulum and R. candidianus (Table S4), this physical composition conferred a beneficial effect on their habitat quality.
In addition to channel modification, rainfall events also have a significant impact on fish habitat quality and environmental changes. According to the results of Fr, HSI, and CHSI in this study, short-duration intense precipitation events generate high flows that impose more pronounced and dynamic effects on HSI/CHSI-based habitat suitability and Fr-based hydraulic habitat availability. Regardless of pre- or post-engineering channels, rapid increases in discharge consistently lead to a significant decline in Fr-derived proportion of available habitat and HSI/CHSI-derived PUA, indicating rapid habitat degradation under high-flow conditions. This finding is in line with previous studies showing that extreme flow regimes reduce habitat stability and limit opportunities for aquatic organisms [9,42]. Analysis of the 24 h hydrograph further reveals the strong temporal dynamics of habitat suitability. During peak flow, excessively high velocities and increased water depth in the channel markedly reduce habitat suitability, whereas habitat conditions gradually recover as discharge recedes. This “short-term disturbance–rapid recovery” pattern highlights the high sensitivity of small watersheds to strong rainfall events. Under such dynamic conditions, fish may respond behaviorally to cope with habitat fluctuations.
According to the 24 h variations in Fr-based hydraulic habitat availability and HSI/CHSI-based habitat suitability across different rainfall events (Figures S6–S10), habitat degradation in the mid-channel occurred most rapidly during peak flow. In contrast, habitat quality remained superior near the riverbanks and adjacent to riparian vegetation. Therefore, the banks and riparian vegetation may serve as optimal refugia for fish during peak flow events. Furthermore, the 24 h variation plots of HSI/CHSI-derived PUA under rainfall events reveal that upon the arrival of peak flow, habitat suitability in the post-engineering channel is more sensitive to high-flow events than in the pre-engineering channel, leading to more drastic habitat alterations induced by short-term hydrological disturbances. A previous study showed that channel modification often reduces habitat heterogeneity and simplifies flow regimes [6], thereby reducing the channel’s buffering capacity against short-term hydrological disturbances. Specifically, the UAV orthomosaics captured before and after channel modification clearly reveal a reduction in habitat heterogeneity following the modification, characterized by a substantial loss of riparian vegetation, big boulders, and pool habitats. Furthermore, the hydraulic simulation data indicate that the flow field within the post-engineering channel exhibits a trend toward simplification. These factors likely underlie the heightened sensitivity of the post-engineering channel to short-term hydrological disturbances. Therefore, future river management efforts should not only prevent flooding and create suitable fish habitats, but also consider the hydrological buffering capacity of the modified river. For instance, retaining more riparian vegetation and large boulders can enhance habitat heterogeneity, thereby mitigating the potential impacts of floods on habitat morphology and conditions.
To further clarify the geomorphic evolution of the studied reach before, during, and after channel modification, UAV aerial surveys were conducted on 17 February 2023 (pre-engineering), 7 May 2024 and 14 August 2024 (during engineering), and 20 August 2025 (post-engineering). During the modification period, no major natural disturbances, such as earthquakes or extreme rainfall events, occurred in the study area. Furthermore, no significant rainfall was recorded within the seven days prior to each UAV survey, suggesting that short-term precipitation had limited influence on channel geomorphology. Consequently, changes in channel morphology were primarily attributed to engineering activities, while natural channel evolution was considered negligible. In addition, to assess whether the Manning roughness coefficient influences simulated flow velocity and water depth, an uncertainty analysis was performed by conducting hydraulic simulations for the post-engineering channel during the precipitation event on 24 September 2025 using Manning’s n values of 0.03, 0.05, and 0.07. Subsequently, the Fr-derived proportion of available habitat and the CHSI-derived PUA were calculated. The numerical comparison indicated that variations in the Manning coefficient had no significant effect on either the Fr-derived proportion of available habitat or the CHSI-derived PUA (Figure S11), demonstrating low model sensitivity to roughness uncertainty.
Regarding substrate suitability, riparian vegetation classified as “Vegetation” was excluded from habitat suitability calculations when located outside the wetted areas (i.e., where no simulated water depth or flow velocity was generated by HEC-RAS 2D). Conversely, when vegetation patches occurred within wetted areas, they were incorporated into the assessment with a suitability value of 0.8. Aquatic or partially inundated riparian vegetation within wetted zones can provide favorable conditions for fish by offering shelter and refuge; therefore, vegetation was included as a substrate category in this study. An additional uncertainty analysis was conducted to evaluate the sensitivity of CHSI results to vegetation suitability values. Suitability values of 0.6, 0.8, and 1.0 were assigned to the “Vegetation” category for CHSI-derived PUA calculations in the post-engineering channel during the precipitation event on 24 September 2025. The results showed that the CHSI-derived PUA outputs had low sensitivity to variations in vegetation suitability (Figure S12), indicating that the influence of this parameter on the model was limited.
However, several methodological aspects of this study could be further enhanced and refined in future research. In terms of deep learning-based substrate classification, a U-Net model was applied to classify riverbed substrates, enabling substrate information to be incorporated into HSI calculations and overcoming the limitation of conventional PHABSIM approaches that primarily consider only depth and velocity. Nevertheless, certain challenges in deep learning-based substrate classification remain to be addressed. For instance, the identification accuracy for each substrate category could be further improved, and a robust method for recognizing underwater substrates is still needed. Because the current approach cannot yet differentiate substrates beneath the water surface, these areas were temporarily classified under a general “Water” substrate category and assigned a suitability value of 1.0. This assignment was based on the ecological perspective that fish may potentially inhabit any wetted area; therefore, a uniform suitability value of 1.0 was applied to the “Water” category in this study. In addition, the habitat suitability curves for O. barbatulum and R. candidianus were linearly extrapolated under high-velocity and deep-water conditions, introducing additional uncertainty. Future studies could incorporate more field fish surveys or environmental DNA (eDNA) data to refine and validate these species-specific habitat suitability curves.
Finally, the allocation of species weights in the CHSI is also a critical issue. Fish surveys conducted by our research team in May 2023, September 2023, June 2025, and August 2025 indicated that the abundance ratio between the cyprinid species O. barbatulum and gobiid species was approximately 64:36. If this abundance ratio were directly used as the weighting basis for CHSI, the resulting habitat suitability assessment might become overly biased toward O. barbatulum, potentially compromising the representativeness of multispecies habitat conditions. Furthermore, the HSI results indicated that the PUA for both species was similar in both the pre- and post-engineering channels. Considering the potential sampling bias inherent in field fish surveys and the currently limited sample size, an equal weighting scheme (50:50) was adopted in this study. Future research utilizing more extensive survey data or improved weighting approaches—such as incorporating additional environmental or biological factors—could further refine the CHSI weighting schemes.

5. Conclusions

Overall, channel modification substantially altered hydraulic conditions, transforming the system from a deep, slow-flowing regime into a shallower and faster-flowing environment. Under baseflow conditions, Fr-derived proportion of available habitat decreased from 81.6% to 73.9%, indicating a reduction in hydraulically available areas. However, HSI/CHSI-based habitat suitability increased after modification, mainly driven by changes in substrate composition, particularly the increased prevalence of sand and cobble substrates favorable to the target species. Rainfall events had a stronger influence on habitat dynamics than channel modification, with both Fr-based hydraulic habitat availability and HSI/CHSI-based habitat suitability showing rapid declines during peak flows and subsequent recovery, highlighting the high sensitivity of this small watershed to short-duration extreme precipitation. In addition, the post-engineering channel exhibited greater hydrological responsiveness, suggesting reduced habitat heterogeneity and buffering capacity. Despite these ecological changes, the modified channel effectively maintained flood conveyance capacity and prevented overbank flooding during the selected extreme rainfall event. Overall, these findings highlight a clear trade-off between flood mitigation and habitat quality, emphasizing the importance of maintaining habitat heterogeneity to enhance ecological resilience in engineered river systems.

Supplementary Materials

The following supporting information can be downloaded at https://doi.org/10.5281/zenodo.19674107 (accessed on 4 June 2026).

Author Contributions

Conceptualization, T.-J.H.; methodology, T.-J.H. and H.-Y.H.; software, T.-J.H.; validation, T.-J.H., H.-Y.H., C.-R.C., S.-H.W. and C.-H.Y.; formal analysis, T.-J.H. and H.-Y.H.; investigation, T.-J.H., C.-R.C., S.-H.W. and C.-H.Y.; resources, C.-R.C., S.-H.W. and C.-H.Y.; data curation, T.-J.H. and H.-Y.H.; writing—original draft preparation, T.-J.H. and H.-Y.H.; writing—review and editing, T.-J.H., H.-Y.H., C.-R.C., S.-H.W. and C.-H.Y.; visualization, T.-J.H. and H.-Y.H.; supervision, T.-J.H., C.-R.C., S.-H.W. and C.-H.Y.; project administration, T.-J.H., C.-R.C., S.-H.W. and C.-H.Y.; funding acquisition, T.-J.H. All authors have read and agreed to the published version of the manuscript.

Funding

This research was funded by the Hualien Branch, Agency of Rural Development and Soil and Water Conservation, Ministry of Agriculture, Taiwan (Grant No. 114-64-01-002) and National Taiwan University.

Data Availability Statement

The original contributions presented in this study are included in the article. Further inquiries can be directed to the corresponding authors.

Acknowledgments

The authors sincerely thank Chun-Yang Lee, a student in the Department of Geography at National Taiwan University, for his valuable assistance and contributions to the development and implementation of the deep learning-based substrate classification.

Conflicts of Interest

The authors declare no conflicts of interest.

Abbreviations

The following abbreviations are used in this manuscript:
CHSICombined Habitat Suitability Index
HSIHabitat Suitability Index
DEMDigital Elevation Models
DSMDigital Surface Model
FrFroude Number
LiDARLight Detection and Ranging
PHABSIMPhysical Habitat Simulation System
PUA Proportion of Weighted Usable Area
UAVUnmanned Aerial Vehicle
WUAWeighted Usable Area

References

  1. Dey, C.J.; Rego, A.; Bradford, M.J.; Clarke, K.D.; McKercher, K.; Mochnacz, N.J.; de Paiva, A.; Ponader, K.; Robichaud, L.; Winegardner, A.K.; et al. Research priorities for the management of freshwater fish habitat in Canada. Can. J. Fish. Aquat. Sci. 2021, 78, 1744–1754. [Google Scholar] [CrossRef]
  2. Moyle, P.B.; Cech, J.J. Fishes: An Introduction to Ichthyology, 5th ed.; Pearson Prentice Hall: Upper Saddle River, NJ, USA, 2004; p. 726. [Google Scholar]
  3. Stoffers, T.; Buijse, A.D.; Geerling, G.W.; Jans, L.H.; Schoor, M.M.; Poos, J.J.; Verreth, J.A.J.; Nagelkerke, L.A.J. Freshwater fish biodiversity restoration in floodplain rivers requires connectivity and habitat heterogeneity at multiple spatial scales. Sci. Total Environ. 2022, 838, 156509. [Google Scholar] [CrossRef]
  4. Arantes, C.C.; Fitzgerald, D.B.; Hoeinghaus, D.J.; Winemiller, K.O. Impacts of hydroelectric dams on fishes and fisheries in tropical rivers through the lens of functional traits. Curr. Opin. Environ. Sustain. 2019, 37, 28–40. [Google Scholar] [CrossRef]
  5. Brooker, M.P. The Ecological Effects of Channelization. Geogr. J. 1985, 151, 63–69. [Google Scholar] [CrossRef]
  6. Hohensinner, S.; Hauer, C.; Muhar, S. River Morphology, Channelization, and Habitat Restoration. In Riverine Ecosystem Management; Schmutz, S., Sendzimir, J., Eds.; Aquatic Ecology Series; Springer: Cham, Switzerland, 2018; Volume 8, pp. 41–65. [Google Scholar]
  7. Sun, J.R.; Baldan, D.; Lucas, M.C.; Wang, J.; Rodeles, A.A.; Galib, S.M.; Tao, J.; Li, M.B.; He, D.M.; Ding, C.Z. Widespread and strong impacts of river fragmentation by anthropogenic barriers on fishes in the Mekong River Basin. Commun. Earth Environ. 2025, 6, 534. [Google Scholar] [CrossRef]
  8. Huang, J.S.; Borchardt, D.; Rode, M. Changes in water quality and ecosystem processes at extreme summer low flow of 2018 with high-frequency sensors. Hydrol. Earth Syst. Sci. 2025, 29, 5835–5849. [Google Scholar] [CrossRef]
  9. Palmer, M.A.; Lettenmaier, D.P.; Poff, N.L.; Postel, S.L.; Richter, B.; Warner, R. Climate Change and River Ecosystems: Protection and Adaptation Options. Environ. Manag. 2009, 44, 1053–1068. [Google Scholar] [CrossRef] [PubMed]
  10. Sabater, S.; Freixa, A.; Jiménez, L.; López-Doval, J.; Pace, G.; Pascoal, C.; Perujo, N.; Craven, D.; González-Trujillo, J.D. Extreme weather events threaten biodiversity and functions of river ecosystems: Evidence from a meta-analysis. Biol. Rev. 2023, 98, 450–461. [Google Scholar] [CrossRef] [PubMed]
  11. Armour, C.L.; Taylor, J.G. Evaluation of the Instream Flow Incremental Methodology by U.S. Fish and Wildlife Service Field Users. Fisheries 1991, 16, 36–43. [Google Scholar] [CrossRef]
  12. FWS/OBS-86/7; Development and Evaluation of Habitat Suitability Criteria for Use in the Instream Flow Incremental Methodology. USDI Fish and Wildlife Service: Washington, DC, USA, 1986; p. 235.
  13. USGS/BRD-1998-0004; Stream Habitat Analysis Using the Instream Flow Incremental Methodology. U.S. Geological Survey: Fort Collins, CO, USA, 1998; p. 131.
  14. Milhous, R.T.; Updike, M.A. Physical Habitat Simulation System Reference Manual: Version II; U.S. Fish and Wildlife Service: Washington, DC, USA, 1989; Volume 89. [Google Scholar]
  15. Elliott, C.R.N.; Dunbar, M.J.; Gowing, I.; Acreman, M.C. A habitat assessment approach to the management of groundwater dominated rivers. Hydrol. Process. 1999, 13, 459–475. [Google Scholar] [CrossRef]
  16. Hatfield, T.; Bruce, J. Predicting Salmonid Habitat–Flow Relationships for Streams from Western North America. N. Am. J. Fish. Manag. 2000, 20, 1005–1015. [Google Scholar]
  17. Souchon, Y.; Capra, H. Aquatic habitat modelling: Biological validations of IFIM/Phabsim methodology and new perspectives. Hydroécologie Appliquée 2004, 14, 9–25. [Google Scholar] [CrossRef][Green Version]
  18. Van Winkle, W.; Jager, H.I.; Railsback, S.F.; Holcomb, B.D.; Studley, T.K.; Baldrige, J.E. Individual-based model of sympatric populations of brown and rainbow trout for instream flow assessment: Model description and calibration. Ecol. Model. 1998, 110, 175–207. [Google Scholar] [CrossRef]
  19. Wilding, T.K.; Bledsoe, B.; Poff, N.L.; Sanderson, J. Predicting Habitat Response to Flow Using Generalized Habitat Models for Trout in Rocky Mountain Streams. River Res. Appl. 2014, 30, 805–824. [Google Scholar] [CrossRef]
  20. Benjankar, R.; Tonina, D.; McKean, J. One-dimensional and two-dimensional hydrodynamic modeling derived flow properties: Impacts on aquatic habitat quality predictions. Earth Surf. Process. Landf. 2015, 40, 340–356. [Google Scholar] [CrossRef]
  21. Im, D.; Kang, H. Two-dimensional physical habitat modeling of effects of habitat structures on urban stream restoration. Water Sci. Eng. 2011, 4, 386–395. [Google Scholar] [CrossRef]
  22. Railsback, S.F. Why It Is Time to Put PHABSIM Out to Pasture. Fisheries 2016, 41, 720–725. [Google Scholar] [CrossRef]
  23. Yi, Y.J.; Cheng, X.; Wieprecht, S.; Tang, C.H. Comparison of habitat suitability models using different habitat suitability evaluation methods. Ecol. Eng. 2014, 71, 335–345. [Google Scholar] [CrossRef]
  24. Yang, L.; Hou, J.M.; Cheng, L.; Wang, P.; Pan, Z.P.; Wang, T.; Ma, Y.Y.; Gao, X.J.; Sun, J.X.; Liu, N. Application of Habitat Suitability Model Coupling with High-precision Hydrodynamic Processes. Ecol. Model. 2021, 462, 109792. [Google Scholar] [CrossRef]
  25. Water Discharge Measurement Method—Current Meter Method; W022.51C; Ministry of Environment: Taipei, Taiwan, 2004.
  26. Measurement of Discharge by the Conventional Current-Meter Method; Book 3, Chapter A8; The U.S. Geological Survey: Reston, VA, USA, 2010.
  27. Feldman, A.D. Hydrologic Modeling System HEC-HMS Technical Reference Manual; Hydrologic Engineering Center (HEC): Davis, CA, USA, 2000. [Google Scholar]
  28. Agricultural Research Institute. TSSURGO Soil Database. 2016. Available online: https://tssurgo.tari.gov.tw/Tssurgo/Map (accessed on 6 June 2023).
  29. National Land Surveying and Mapping Center (NLSC). Spatial Dataset Retrieved from the NGIS Web Map Service (Historical Version, Replaced by Updated WHGIS Platform). Ministry of the Interior, Taiwan. 2022. Available online: https://nsp.tcd.gov.tw/ngis/ (accessed on 6 June 2023).
  30. Jowett, I.G. A Method for Objectively Identifying Pool, Run, and Riffle Habitats from Physical Measurements. N. Z. J. Mar. Freshw. Res. 1993, 27, 241–248. [Google Scholar] [CrossRef]
  31. Chen, S.-Y.; Chen, J.D.; Liang, C.-C.; Hu, T.-J.; Chung, C.-K. Quantitative Methodology for Stream Habitat Assessment. J. Chin. Soil Water Conserv. 2022, 53, 190–201. [Google Scholar] [CrossRef]
  32. Endemic Species Research Institute, Council of Agriculture. A Study of River Native Fish Habitat Suitability Curves and Establishment of Database; MOEAWRA1080315; Water Resources Agency, Ministry of Economic Affairs: Taichung, Taiwan, 2019. [Google Scholar]
  33. Gillenwater, D.; Granata, T.; Zika, U. GIS-based modeling of spawning habitat suitability for walleye in the Sandusky River, Ohio, and implications for dam removal and river restoration. Ecol. Eng. 2006, 28, 311–323. [Google Scholar] [CrossRef]
  34. Huang, Y.Z.; Wang, X.G.; Li, H.Z.; Chen, F.Z.; Chen, K.X.; Wang, Z.; Wang, B. Research on a Multi-Species Combined Habitat Suitability Assessment Method for Various Fish Species. Sustainability 2023, 15, 14801. [Google Scholar] [CrossRef]
  35. Ban, X.; Qi, T.; Wang, H.Z.; Du, H.; Diplas, P.; Xiao, F.; Du, Y.; Gao, W.J.; Guo, W.X.; Shi, X.; et al. Comprehensive Environmental Flows Assessment for Multi-Guilds in the Riparian Habitats of the Yangtze River. Water Resour. Res. 2022, 58, e2021WR030408. [Google Scholar] [CrossRef]
  36. Harrison, L.R.; Keller, E.A. Modeling forced pool-riffle hydraulics in a boulder-bed stream, southern California. Geomorphology 2007, 83, 232–248. [Google Scholar] [CrossRef]
  37. Gu, J.Y.; Liu, H.X.; Lu, Y.J.; Huang, T.J.; Tan, Y.N.; Zhu, M.C. Interplay of flow and bed morphology caused by pool-riffle sequence formation without upstream sediment supply in gravel-bed rivers. Catena 2023, 228, 107104. [Google Scholar] [CrossRef]
  38. Wallace, L.; Lucieer, A.; Malenovsky, Z.; Turner, D.; Vopenka, P. Assessment of Forest Structure Using Two UAV Techniques: A Comparison of Airborne Laser Scanning and Structure from Motion (SfM) Point Clouds. Forests 2016, 7, 62. [Google Scholar] [CrossRef]
  39. Iglhaut, J.; Cabo, C.; Puliti, S.; Piermattei, L.; O’Connor, J.; Rosette, J. Structure from Motion Photogrammetry in Forestry: A Review. Curr. For. Rep. 2019, 5, 155–168. [Google Scholar] [CrossRef]
  40. Wadeson, R.A. A geomorphological approach to the identification and classification of instream flow environments. S. Afr. J. Aquat. Sci. 1994, 20, 38–61. [Google Scholar] [CrossRef]
  41. Kemp, J.L.; Harper, D.M.; Crosa, G.A. The habitat-scale ecohydraulics of rivers. Ecol. Eng. 2000, 16, 17–29. [Google Scholar] [CrossRef]
  42. Palmer, M.A.; Menninger, H.L.; Bernhardt, E. River restoration, habitat heterogeneity and biodiversity: A failure of theory or practice? Freshw. Biol. 2010, 55, 205–222. [Google Scholar] [CrossRef]
Figure 1. Geographical location of the Gaoliao Creek watershed.
Water 18 01400 g001
Figure 2. Substrate classification maps of the pre- and post-engineering channels of the Gaoliao Creek derived from deep learning: (a) pre-engineering channel; (b) post-engineering channel.
Water 18 01400 g002
Figure 3. Spatial distributions of water depth and flow velocity in the pre- and post-engineering channels under baseflow conditions. (a) Water depth distribution in the pre-engineering channel; (b) flow velocity distribution in the pre-engineering channel; (c) water depth distribution in the post-engineering channel; (d) flow velocity distribution in the post-engineering channel.
Water 18 01400 g003
Figure 4. Spatial distribution of Fr-based available habitat in the pre- and post-engineering channels under baseflow conditions. (a) The pre-engineering channel; (b) the post-engineering channel.
Water 18 01400 g004
Figure 5. Spatial distribution of HSI values for Onychostoma barbatulum and Rhinogobius candidianus in the pre- and post-engineering channels under baseflow conditions. (a) HSI for O. barbatulum in the pre-engineering channel; (b) HSI for O. barbatulum in the post-engineering channel; (c) HSI for R. candidianus in the pre-engineering channel; (d) HSI for R. candidianus in the post-engineering channel.
Water 18 01400 g005
Figure 6. Twenty-four-hour dynamics of HSI-derived proportion of weighted usable area (PUA) for Onychostoma barbatulum and Rhinogobius candidianus in the pre- and post-engineering channels during the precipitation event on 23 September 2025. (a) HSI-derived PUA for O. barbatulum in the pre-engineering channel; (b) HSI-derived PUA for O. barbatulum in the post-engineering channel; (c) HSI-derived PUA for R. candidianus in the pre-engineering channel; (d) HSI-derived PUA for R. candidianus in the post-engineering channel.
Water 18 01400 g006
Figure 7. Twenty-four-hour dynamics of HSI-derived proportion of weighted usable area (PUA) for Onychostoma barbatulum and Rhinogobius candidianus in the pre- and post-engineering channels during the precipitation event on 24 September 2025. (a) HSI-derived PUA for O. barbatulum in the pre-engineering channel; (b) HSI-derived PUA for O. barbatulum in the post-engineering channel; (c) HSI-derived PUA for R. candidianus in the pre-engineering channel; (d) HSI-derived PUA for R. candidianus in the post-engineering channel.
Water 18 01400 g007
Figure 8. Spatial distribution of CHSI values in the pre- and post-engineering channels under baseflow conditions. (a) CHSI in the pre-engineering channel; (b) CHSI in the post-engineering channel. The area highlighted by the light blue box indicated a section where large boulders were piled prior to channel modification.
Water 18 01400 g008
Figure 9. Twenty-four-hour dynamics of CHSI-derived proportion of weighted usable area (PUA) in the pre- and post-engineering channels during two precipitation events. (a) CHSI-derived PUA in the pre-engineering channel during the precipitation event on 23 September 2025; (b) CHSI-derived PUA in the post-engineering channel during the precipitation event on 23 September 2025; (c) CHSI-derived PUA in the pre-engineering channel during the precipitation event on 24 September 2025; (d) CHSI-derived PUA in the post-engineering channel during the precipitation event on 24 September 2025.
Water 18 01400 g009
Table 1. Upper and lower thresholds of flow velocity and water depth, and Froude number selection criteria for Onychostoma barbatulum and Rhinogobius candidianus.
SpeciesV_min
(m/s)
V_max
(m/s)
D_min
(m)
D_max
(m)
Fr_minFr_max
Onychostoma barbatulum0.011.80.041.80.0022.87
Rhinogobius candidianus0.011.50.042.00.0022.39
Disclaimer/Publisher’s Note: The statements, opinions and data contained in all publications are solely those of the individual author(s) and contributor(s) and not of MDPI and/or the editor(s). MDPI and/or the editor(s) disclaim responsibility for any injury to people or property resulting from any ideas, methods, instructions or products referred to in the content.