


Abstract
This study aimed to establish an assessment system for rural water-cycle soundness across standard watersheds in Korea and to determine priorities for project implementation. As climate change, water-quality deterioration, and population aging in rural areas intensify, the need for an integrated approach to rural water management has become increasingly important. The study was structured into five sectors: water use, water safety, water environment, carbon neutrality, and water-friendly amenity. Sector-specific indicators were selected, and normality assessment, standardization, and factor analysis were conducted to verify indicator suitability. Weights were estimated using principal component analysis (PCA) to enhance the objectivity of the evaluation. A total of 825 standard watersheds were assessed, and sectoral indices were integrated to derive a rural water-cycle soundness index, which was subsequently classified into five grades. Based on the overall grades and sector-specific results, the priority of each standard watershed for implementing rural water-cycle projects was determined. The proposed framework provides a scientific basis for identifying vulnerable rural areas from a water-cycle perspective and supports policy responses. It may also contribute to future rural water management policies and disaster response strategies.
1. Introduction
In rural areas of Korea, the importance and necessity of rural water-cycle management are growing as environmental, socioeconomic, and policy issues become increasingly complex. From an environmental perspective, abandoned small weirs and hydraulic structures in rivers and reservoirs interrupt the longitudinal connectivity of the river, causing water-quality deterioration and a decline in aquatic ecosystem health. Under such conditions, the continuous lowering of groundwater tables and the increasing occurrence of intermittent river flow further adversely affect the overall rural ecosystem.
In particular, water-related disasters caused by climate change, including droughts, heat waves, localized heavy rainfall, and floods, are increasing in both frequency and intensity. These changes threaten not only a reduction in agricultural productivity but also the livelihoods of rural residents. From a socioeconomic perspective, structural challenges in rural Korea—such as population aging, depopulation, and declining agricultural income—are interacting with water management problems in a compounding manner. According to the Statistics Korea Agricultural Survey, the proportion of farm households headed by farmers aged 65 or older reached 46.8% in 2021, which underscores the severity of demographic aging in rural agricultural communities [1]. From a policy perspective, integrated approaches to rural water-cycle issues remain difficult because of unclear institutional role-sharing among central government ministries, fragmented policy implementation, and insufficient water-related statistics [2].
Against this backdrop, the Ministry of Environment of Korea warned in the National Water Management Master Plan (2020) that the country may face a water shortage of approximately 260 million m3 by around 2030 [3]. This projected shortage represents not only a quantitative deficit in available water but also a serious threat to the broader ecological environment of rural areas [3,4]. At the same time, urbanization in Korea is expected to reduce agricultural water use in the long term, whereas total water demand continues to rise across multiple sectors [3,5]. Accordingly, the establishment of an efficient and sustainable water-cycle management system is urgently needed [3,4,5].
To respond effectively to these conditions, a comprehensive strategic framework for rural water management that incorporates climatic and environmental change is required. As a scientific basis for such a framework, it is necessary to secure systematic baseline statistics on rural water issues and strengthen indicator development and quantitative assessment programs [4,6].
At present, the application of water-cycle systems for rural water has largely been limited to regions where droughts or natural disasters have already occurred or where such risks are considered high. Water used for agricultural activities should be managed more efficiently, and a range of technologies and systems should be adopted to alleviate water scarcity [5,7].
To address these challenges, previous studies have proposed approaches aimed at minimizing water shortages, including pump-storage systems, in which water is pumped from rivers and other water sources into agricultural reservoirs for later use, and return-flow reuse systems, in which water supplied to farmland from agricultural reservoirs and other sources is collected from drainage canals and reused [8,9,10].
In addition, rainwater storage, groundwater use, and artificial recharge techniques have been proposed in Korea [11]. However, despite these proposals, studies on the development of rural water-cycle soundness indicators capable of identifying regions vulnerable to agricultural water shortages in advance and enabling proactive drought response remain insufficient in Korea.
Accordingly, this study investigated and analyzed domestic and international cases of comparable indicators, including the water welfare indicators proposed by K-water [12], the water satisfaction index developed by the Korea Institute of Civil Engineering and Building Technology [13], and the water-quality soundness indicators employed by the Special Countermeasure Region Water Quality Conservation Policy Council for the Paldang Area [14].
Based on this comparative review, the scope of this study is to derive rural water-cycle soundness indicators for Korea’s standard watersheds by classifying them into the sectors of agricultural water use, aquatic ecology, carbon neutrality, and water-friendly amenity. Furthermore, this study seeks to classify the rural water-cycle soundness of each standard watershed into grades based on sector-specific evaluation indicators.
A standard watershed in Korea is the minimum spatial unit defined within the national watershed system, and a total of 825 standard watersheds exist nationwide.
By grading these standard watersheds, this study aims to prioritize those with high vulnerability for the implementation of rural water-cycle projects. The findings are expected to serve as a scientific basis for agricultural water management in Korea and contribute to more systematic and rational disaster response and sound rural water-cycle project planning. Accordingly, this study aims to (1) develop and apply a multi-sector, indicator-based framework for assessing rural water-cycle soundness at the standard-watershed scale across Korea; (2) derive objective indicator weights for a composite rural water-cycle soundness (RWS) index using principal component analysis; and (3) identify standard watersheds exhibiting the greatest water-cycle vulnerability and establish a systematic basis for prioritizing these watersheds for rural water management project implementation.
2. Definitions
Water management in Korea is governed by the Framework Act on Water Management (enacted in 2018), which established an integrated governance structure across multiple ministries. Under this framework, the Ministry of Environment of Korea (currently reorganized as the Ministry of Climate and Environment) oversees water quantity and quality management for rivers and drinking water, while the Ministry of Agriculture, Food and Rural Affairs and its affiliated agency, the Korea Rural Community Corporation (KRC), are responsible for agricultural water supply and rural infrastructure. The National Water Management Master Plan, established under this Act, sets the overarching policy direction for water management at the national scale.
Although the Framework Act on Water Management has established the institutional basis for water management in Korea, no shared understanding yet exists regarding the definition, direction, scope, responsibilities, and future vision of the water cycle concept. In particular, legal statutes and local ordinances define the water cycle in two ways: as the natural water cycle alone or as encompassing both the natural and anthropogenic water cycle.
Under the National Water Management Master Plan, the spatial scope of the water cycle covers the entire territory of the Republic of Korea.
The definition of the spatial aspect is the process by which rainwater flows in the form of surface water and groundwater to reach the sea, and rain causes all spaces, such as forests, rural areas, urban areas, rivers, estuaries, coastal zones, and islands, to become part of the water cycle.
To date, water-cycle management in Korea has been pursued mainly through rainwater storage and infiltration projects intended to reduce direct runoff, and their policy effects have therefore been quite limited. In other words, water-cycle policy should move beyond an urban focus on reducing impervious surfaces and nonpoint pollution sources and toward watershed-scale water management goals that encompass the broader water management system.
Under Korean law, the rural water cycle is defined as a system in which precipitation in rural areas becomes surface water and groundwater, flows into or is stored in rivers, lakes, wetlands, and the sea, evaporates, and then circulates again as precipitation.
More broadly, rural water-cycle management may be redefined as the integrated management of all water-related components so that the functions of water required for ecosystem maintenance, agriculture, settlement, and other human activities can be sustained in a sound manner. In short, it refers to the water cycle excluding urban areas.
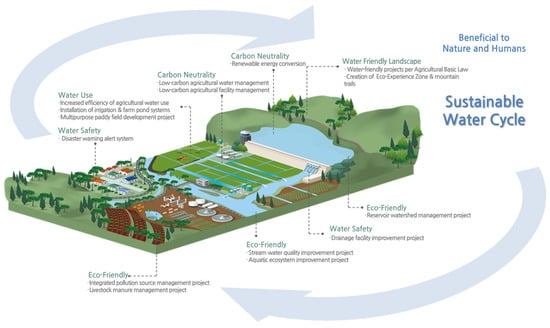
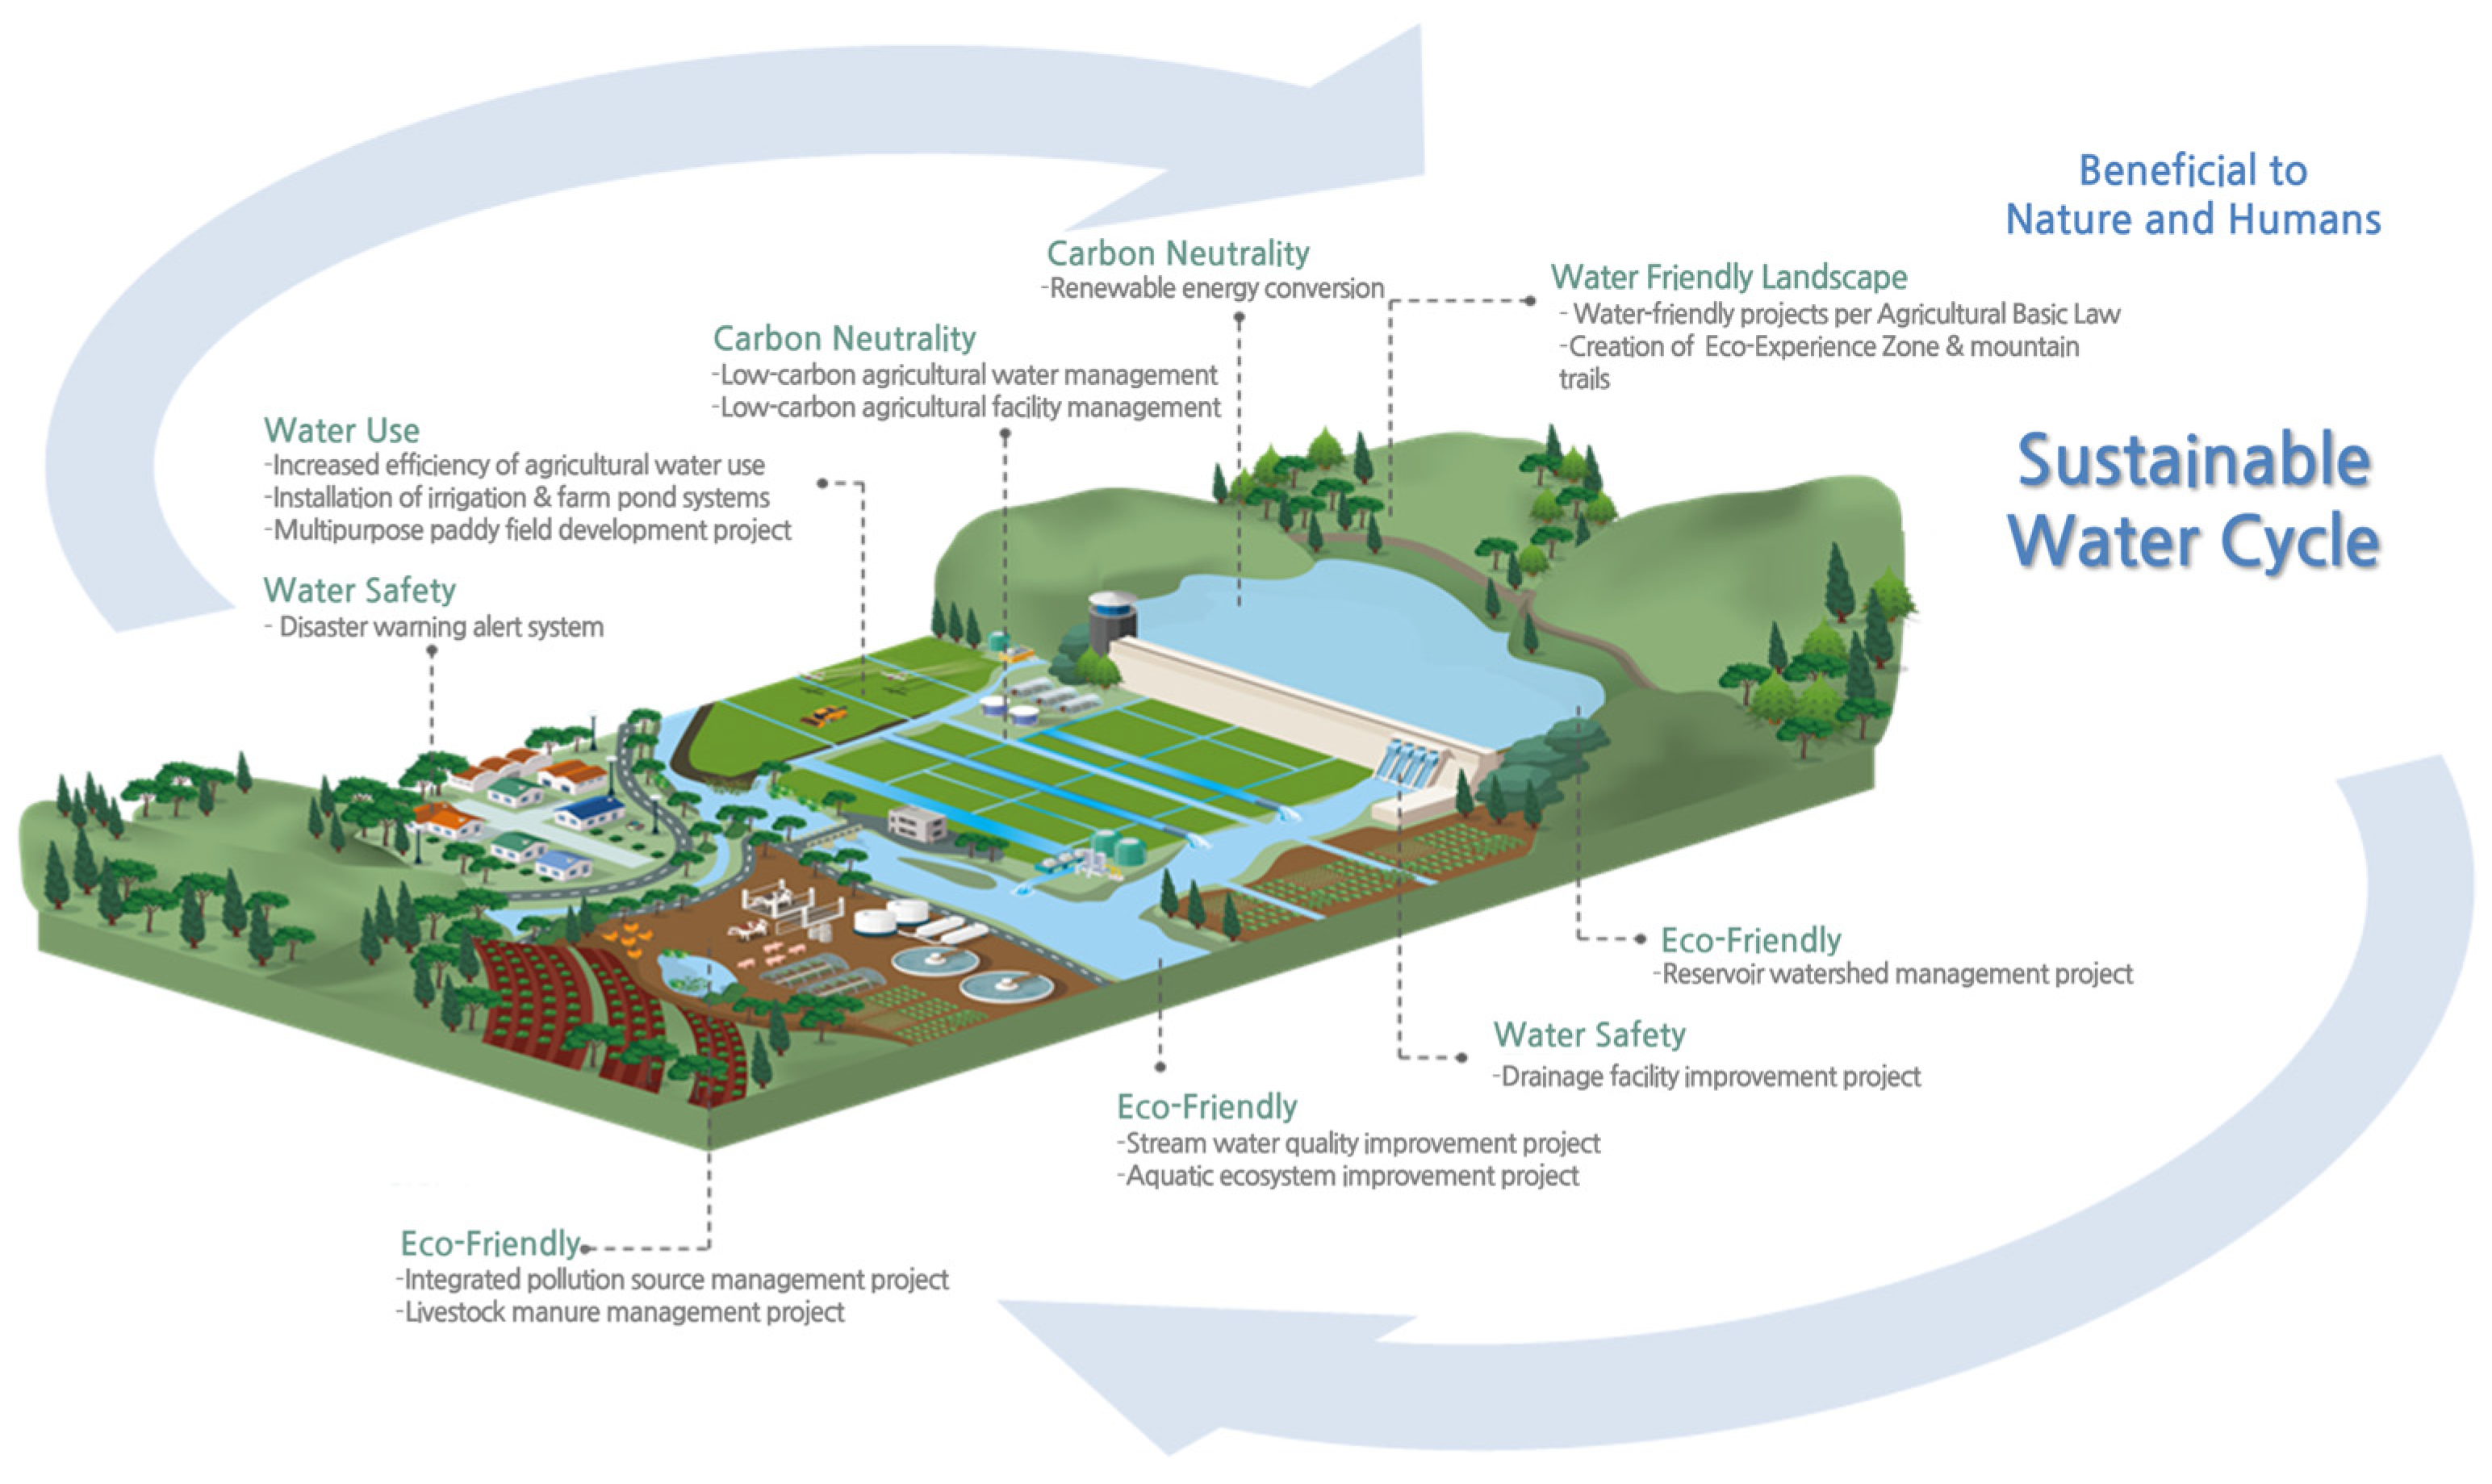
The conceptual diagram of the rural water cycle is shown in Figure 1.
Figure 1.
Conceptual diagram of the rural water cycle.
3. Materials and Methods
3.1. Theoretical Background and Weighting Method
Because the importance of each indicator differs, rural water-cycle assessment requires an indicator-weighting process. Before assigning weights, it is necessary to determine whether the data are appropriate for factor analysis. In this study, the Kaiser–Meyer–Olkin (KMO) measure of sampling adequacy and Bartlett’s test of sphericity were applied to assess the suitability of the data for factor analysis [15,16,17].
After the suitability test, communality should be examined to determine the explanatory power of variables associated with the extracted factors [16]. Methods for estimating weights include the Analytic Hierarchy Process (AHP) and principal component analysis (PCA) [18]. Because the AHP reflects expert judgment and, therefore, contains a subjective component [19], this study adopted PCA as a relatively objective mathematical approach for weight estimation.
PCA is an analytical technique used to reduce the dimensionality of multiple interrelated variables. In essence, PCA reduces data dimensionality by summarizing the information shared among correlated variables into a smaller number of principal components [20,21].
3.2. Assessment Framework and Indicator Methods
3.2.1. Establishment of Assessment Framework
For the analysis of the assessment framework applicable to rural water-cycle management, the sectoral indicators and unit of analysis were determined according to the following criteria.
The evaluation sectors were selected through a comprehensive review of major improvement projects in rural areas—such as agricultural production infrastructure improvement, rural living environment improvement, and marginal farmland improvement projects—as well as other projects related to the rural water cycle. Sector-specific evaluation indicators were selected by considering development conditions in the target regions, the distribution of hydraulic facilities, and the water-related problems and characteristics of rural watersheds.
The spatial unit for rural water-cycle analysis was defined as the standard watershed, reflecting the hydrological flow paths of the rural water cycle, including rural areas, topography, and anthropogenic infrastructure, as well as existing legal and institutional management zones related to agricultural and rural water use.
Accordingly, this study quantitatively evaluates the soundness of the rural water cycle (hereafter referred to as rural water-cycle soundness) for each of the 825 standard watersheds in Korea by assigning indicator-based scores for each evaluation sector.
3.2.2. Indicator Estimation Methods
Because rural water-cycle issues became an important policy concern in Korea in 2022, this study was conducted for a rural water-cycle soundness assessment using statistical analysis for all 825 standard watersheds in that year using the selected sector-specific indicators.
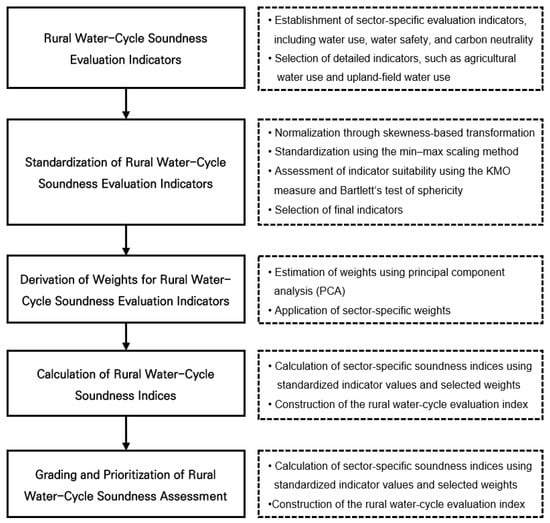
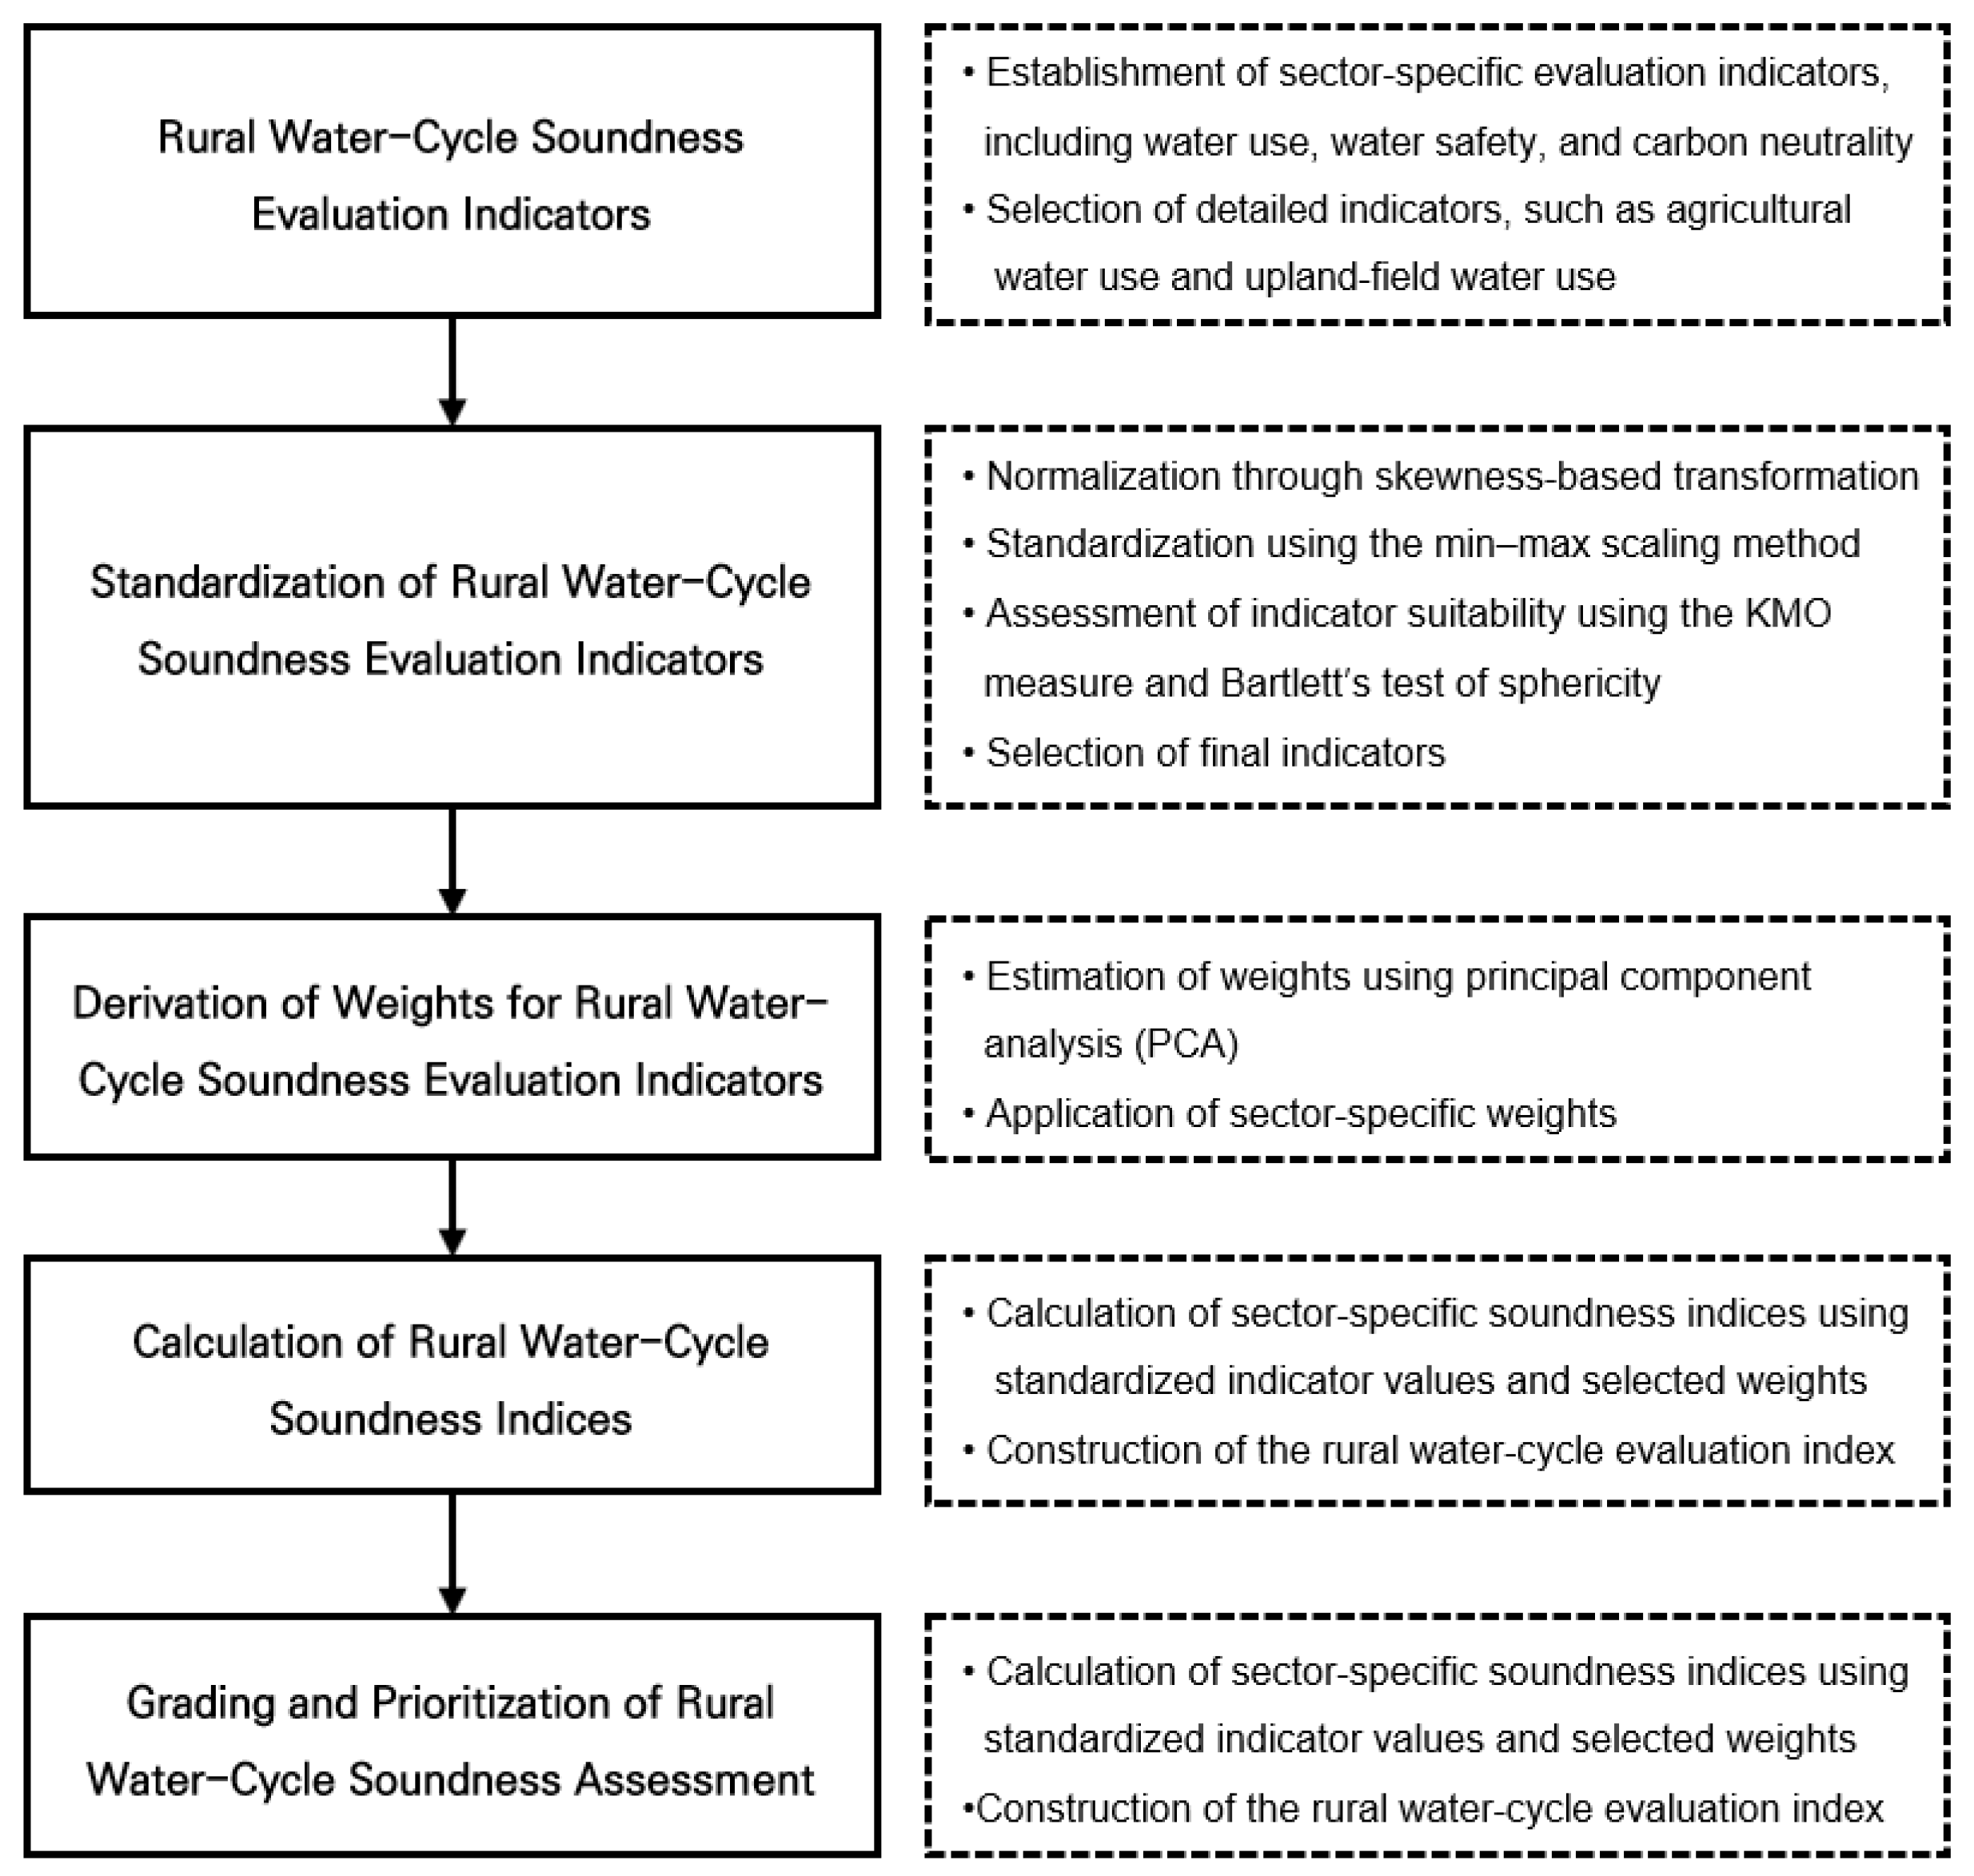
The overall research procedure for evaluating rural water-cycle soundness based on a standard watershed in Korea is as follows:
Based on statistical data published by Korean government agencies, including the Han River Flood Control Office, the evaluation sectors were classified into water use, water safety, water environment, carbon neutrality, and water-friendly amenity.
The indicators for each sector were defined as follows: water use (agricultural water use and supply reliability), water safety (upland-field water use, flood damage cost, and water-use safety ratio), water environment (water-quality target attainment and aquatic ecology), carbon neutrality (urban forest-to-paddy field area ratio and electricity supply), and water-friendly amenity (full water surface area and beneficiary area). The collected indicator data were normalized, and the normalized values were subsequently standardized. Factor analysis was then conducted using IBM SPSS Statisticd 28.0 (IBM Corp., Armonk, NY, USA) to test indicator suitability, and indicator weights were estimated using principal component analysis (PCA). Sector-specific rural water-cycle soundness indices were calculated by applying the standardized indicator values and the estimated weights. Then, rural water-cycle soundness was graded for each sector, and the grading results were used to identify priority candidate sites for rural water-cycle projects in Korea.
The overall research procedure is shown in Figure 2.
Figure 2.
Study flowchart.
4. Results
4.1. Evaluation of the Applicability of the Rural Water Cycle
4.1.1. Indicator Selection
In the water-use sector, agricultural water use and supply reliability were selected as indicators to evaluate the establishment of a systematic irrigation system based on efficient water supply and utilization in rural areas.
In the water-safety sector, upland agricultural water use, flood damage cost, and the water supply safety ratio were selected as indicators to assess the water supply and flood control capacities of drainage facilities, as well as their safety, under increasing flood risk associated with climate change.
In the water environment sector, indicators applicable at the standard-watershed level were selected by distinguishing between water-quality and aquatic-ecology components in order to maintain a sound aquatic ecosystem and preserve water quality appropriate for its intended use.
Water-quality components refer to the characteristics of water-quality distribution in each region based on measured water-quality values from actual monitoring stations. Therefore, total phosphorus (T-P) and total nitrogen (T-N) were selected as representative indicators in this study.
However, although T-N and T-P are widely used as representative nutrient-based indicators, they have limitations in capturing the overall chemical characteristics of water quality. In particular, important parameters such as dissolved organic carbon (DOC), chemical oxygen demand (COD), biochemical oxygen demand (BOD), and electrical conductivity are not explicitly considered in this study due to limitations in the availability of nationally standardized datasets. Therefore, the water environment sector in this study should be interpreted as focusing primarily on nutrient-related water quality, and future studies should incorporate a broader range of chemical indicators to improve the comprehensiveness of the assessment.
For the aquatic-ecology component, BMI (Benthic Macroinvertebrate Index) and FAI (Fish Assessment Index), which are aquatic ecological indices from the river biological monitoring network operated by the National Institute of Environmental Research in Korea, were selected as representative indicators.
Although the BMI and FAI are widely used indicators for assessing aquatic ecosystem health, they primarily reflect biological responses to environmental conditions rather than directly measuring toxic substances or specific pollutants. In particular, the presence of agricultural chemicals, pesticides, and other toxic substances, as well as the distinction between biodegradable and non-biodegradable compounds, is not explicitly captured in the current framework. Recent studies have highlighted toxicity assessment and biodegradation analysis as important approaches for evaluating contaminant impacts on aquatic systems [22,23]. Therefore, while these indices provide an integrated ecological assessment, they may not fully represent specific sources of pollution or toxicity in rural water systems.
In the carbon-neutrality sector, the urban forest area and paddy field area ratio, as well as electricity use, which is the primary energy source generating carbon emissions, were selected as indicators in relation to forest development projects in reclaimed lands or around reservoirs in Korea.
In the water-friendly amenity sector, the full water surface area and beneficiary area were selected as indicators at the standard watershed scale, considering that rural landscapes in Korea vary with the extent of water-related spaces.
4.1.2. Indicator Calculation Method
Agricultural water use was extracted by standard watersheds using the values presented in the annual river basin survey published by the Han River Flood Control Center [24].
The supply reliability rate is the ratio of the area of water-safety paddies divided by the area of rice paddies, and was extracted by standard watersheds based on the values presented by cities and counties in Korea.
Upland-field water-use data were extracted for each standard watershed using values reported in the River Basin Survey published by the Han River Flood Control Office.
Flood damage cost was extracted for each standard watershed based on the damage costs reported by the city and county in the Disaster Annual Report published by the Ministry of the Interior and Safety [25].
In this study, Equation (1) was used to derive the water supply reliability at the standard watershed scale. This formula was adapted from the water shortage assessment methodology established by the Ministry of Environment of Korea [3], in which annual water shortage is defined as the difference between demand and available supply under normal hydrological conditions.
For the water-quality sector, indicators were calculated for each standard watershed using the annual average values of water-quality data observed at representative monitoring stations in each basin. The Ministry of Environment annually evaluates and publishes the rate of achievement of target criteria at representative monitoring stations in each basin.
In this study, the monthly average water quality for each river was used to determine and evaluate whether the target water quality had been achieved for each standard watershed.
An example of target water-quality criteria by basin in Korea is shown in Table 1.
Table 1.
Example of target water-quality criteria by basin.
The aquatic-ecology sector was evaluated based on the Results of the Aquatic Ecosystem Health Survey and Assessment published by the Ministry of Environment of Korea [26].
The evaluation method for the aquatic ecology sector can be summarized from the method presented by the Ministry of Environment as follows.
The main survey items for benthic macroinvertebrates (Benthic Macroinvertebrate Index, BMI) include the number of taxa and individuals observed, dominant species, dominance, diversity, richness, and evenness, and based on these, the Benthic Macroinvertebrate Index and biological grade are calculated. The evaluation procedure is as follows.
- Evaluation using benthic macroinvertebrates includes calculation of the number of taxa and individuals observed, dominant species and dominance rate, community index, and Korean saprobic index for each survey section.
- The number of individuals observed, community index, and Korean saprobic index are calculated using the number of individuals obtained at each section converted to individuals per unit area (individuals/m2).
- The Benthic Macroinvertebrate Index (BMI) is calculated using Equation (2) by applying the organic pollution evaluation values and indicator weights of each observed taxon [24].
For fish, the survey includes the number of species and individuals and the abundance of native species, riffle–benthic species, sensitive species, tolerant species, insectivorous species, omnivorous species, and abnormal individuals. These are integrated using eight metrics.
The urban forest/paddy field area ratio was extracted based on a standard watershed using statistical data published by the Korea Forest Service and the Ministry of Agriculture, Food and Rural Affairs [27]. Electricity supply was derived for each standard watershed using statistical data from Statistics Korea (KOSTAT) [28], while the full water surface area and beneficiary area of reservoirs within each standard watershed were calculated using statistical data published by the Ministry of the Interior and Safety (MOIS) in Korea [28].
4.1.3. Normalization and Standardization
Normality Assessment of Indicators
The distribution of the raw data was assessed through statistical analysis. Variables exhibiting normal distributions were standardized directly, whereas skewed variables were allowed to show normality through log transformation.
Normality was evaluated using skewness. When the skewness value was greater than or equal to 1, the natural logarithm was applied; when it was less than or equal to −1, the common logarithm was applied [15].
Changes in skewness following the normality assessment are shown in Table 2, Table 3, Table 4, Table 5 and Table 6.
Table 2.
Changes in skewness according to the normality review in the water-use sector.
Table 3.
Changes in skewness according to the normality review in the water-safety sector.
Table 4.
Changes in skewness according to the normality review in the water environment sector.
Table 5.
Changes in skewness according to the normality review in the carbon-neutrality sector.
Table 6.
Changes in skewness according to the normality review in the water-friendly amenity sector.
The skewness of supply reliability in the water-use sector remained greater than 1 even after transformation, indicating that satisfactory normality was not achieved. In the water-safety sector, upland-field water use, flood damage cost, and the water supply safety ratio exhibited substantial skewness, and although log transformation was applied, flood damage cost and the water supply safety ratio still showed skewness values of less than −1, indicating that sufficient normality was not attained. In the water environment sector, BMI and FAI were close to a normal distribution and were therefore used in their original form, whereas T-N and T-P showed high skewness and remained below −1 even after log transformation, suggesting limited improvement in normality. In the carbon neutrality sector, both the urban forest-to-paddy field area ratio and electricity supply exhibited substantial skewness, and electricity supply remained below −1 after transformation, indicating that adequate normality was not secured. In the water-friendly amenity sector, both full water surface area and beneficiary area also showed substantial skewness and were therefore log-transformed.
These results suggest that supply reliability in the water-use sector, flood damage cost and the water supply safety ratio in the water-safety sector, T-N and T-P in the water environment sector, and electricity supply in the carbon neutrality sector were relatively highly skewed. However, because excessive transformation of raw data may distort the environmental, social, and physical characteristics unique to Korea, the original data were ultimately used in the final analysis.
Indicator Standardization
Methods for standardizing indicators include Z-score transformation, rescaling, min–max scaling, ranking, and the cumulative distribution function (CDF). In this study, the min–max standardization method was applied to normalize indicator values to a range between 0 and 1.
The min–max normalization was calculated as follows:
where x is the original indicator value, and are the minimum and maximum values observed across all 825 standard watersheds, and is the normalized value ranging from 0 to 1.
The sector-specific rural water-cycle soundness index was then computed as the weighted sum of normalized indicator values, with weights derived from PCA as described in Section 3.1.
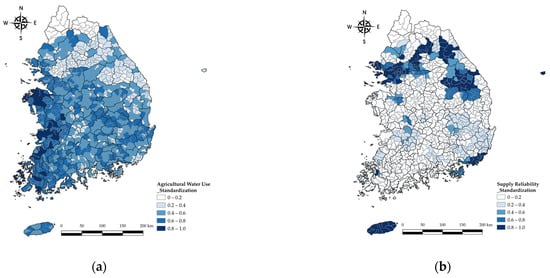
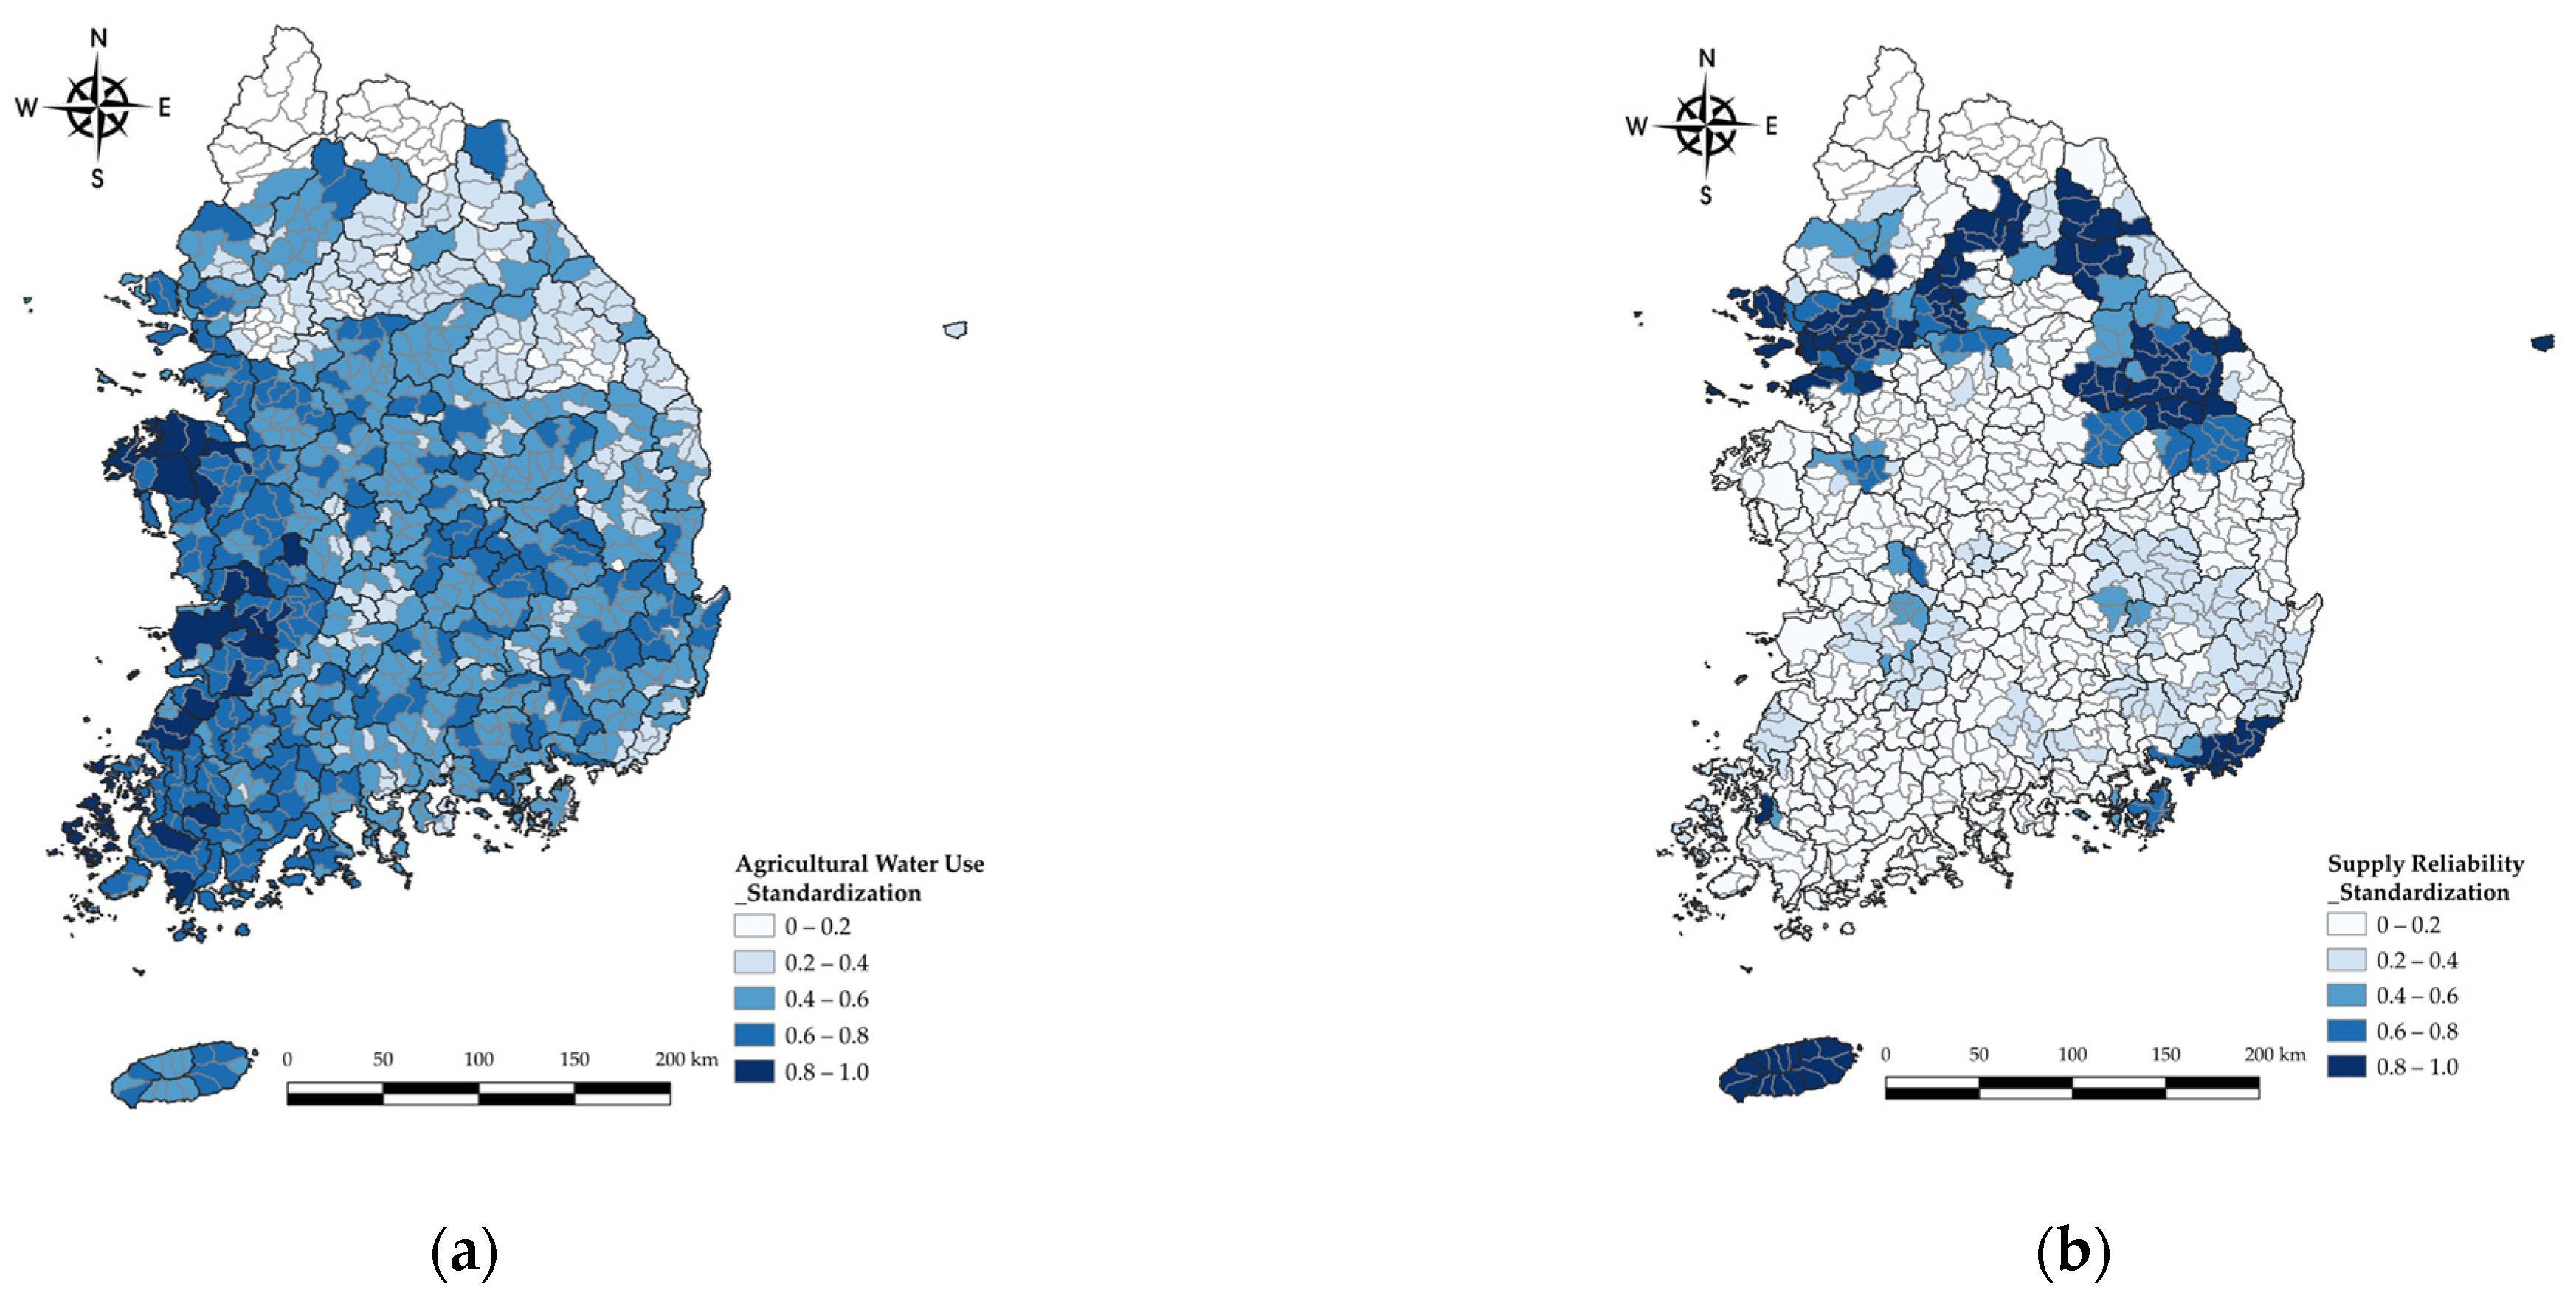
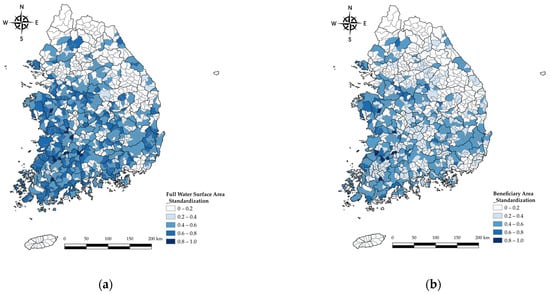
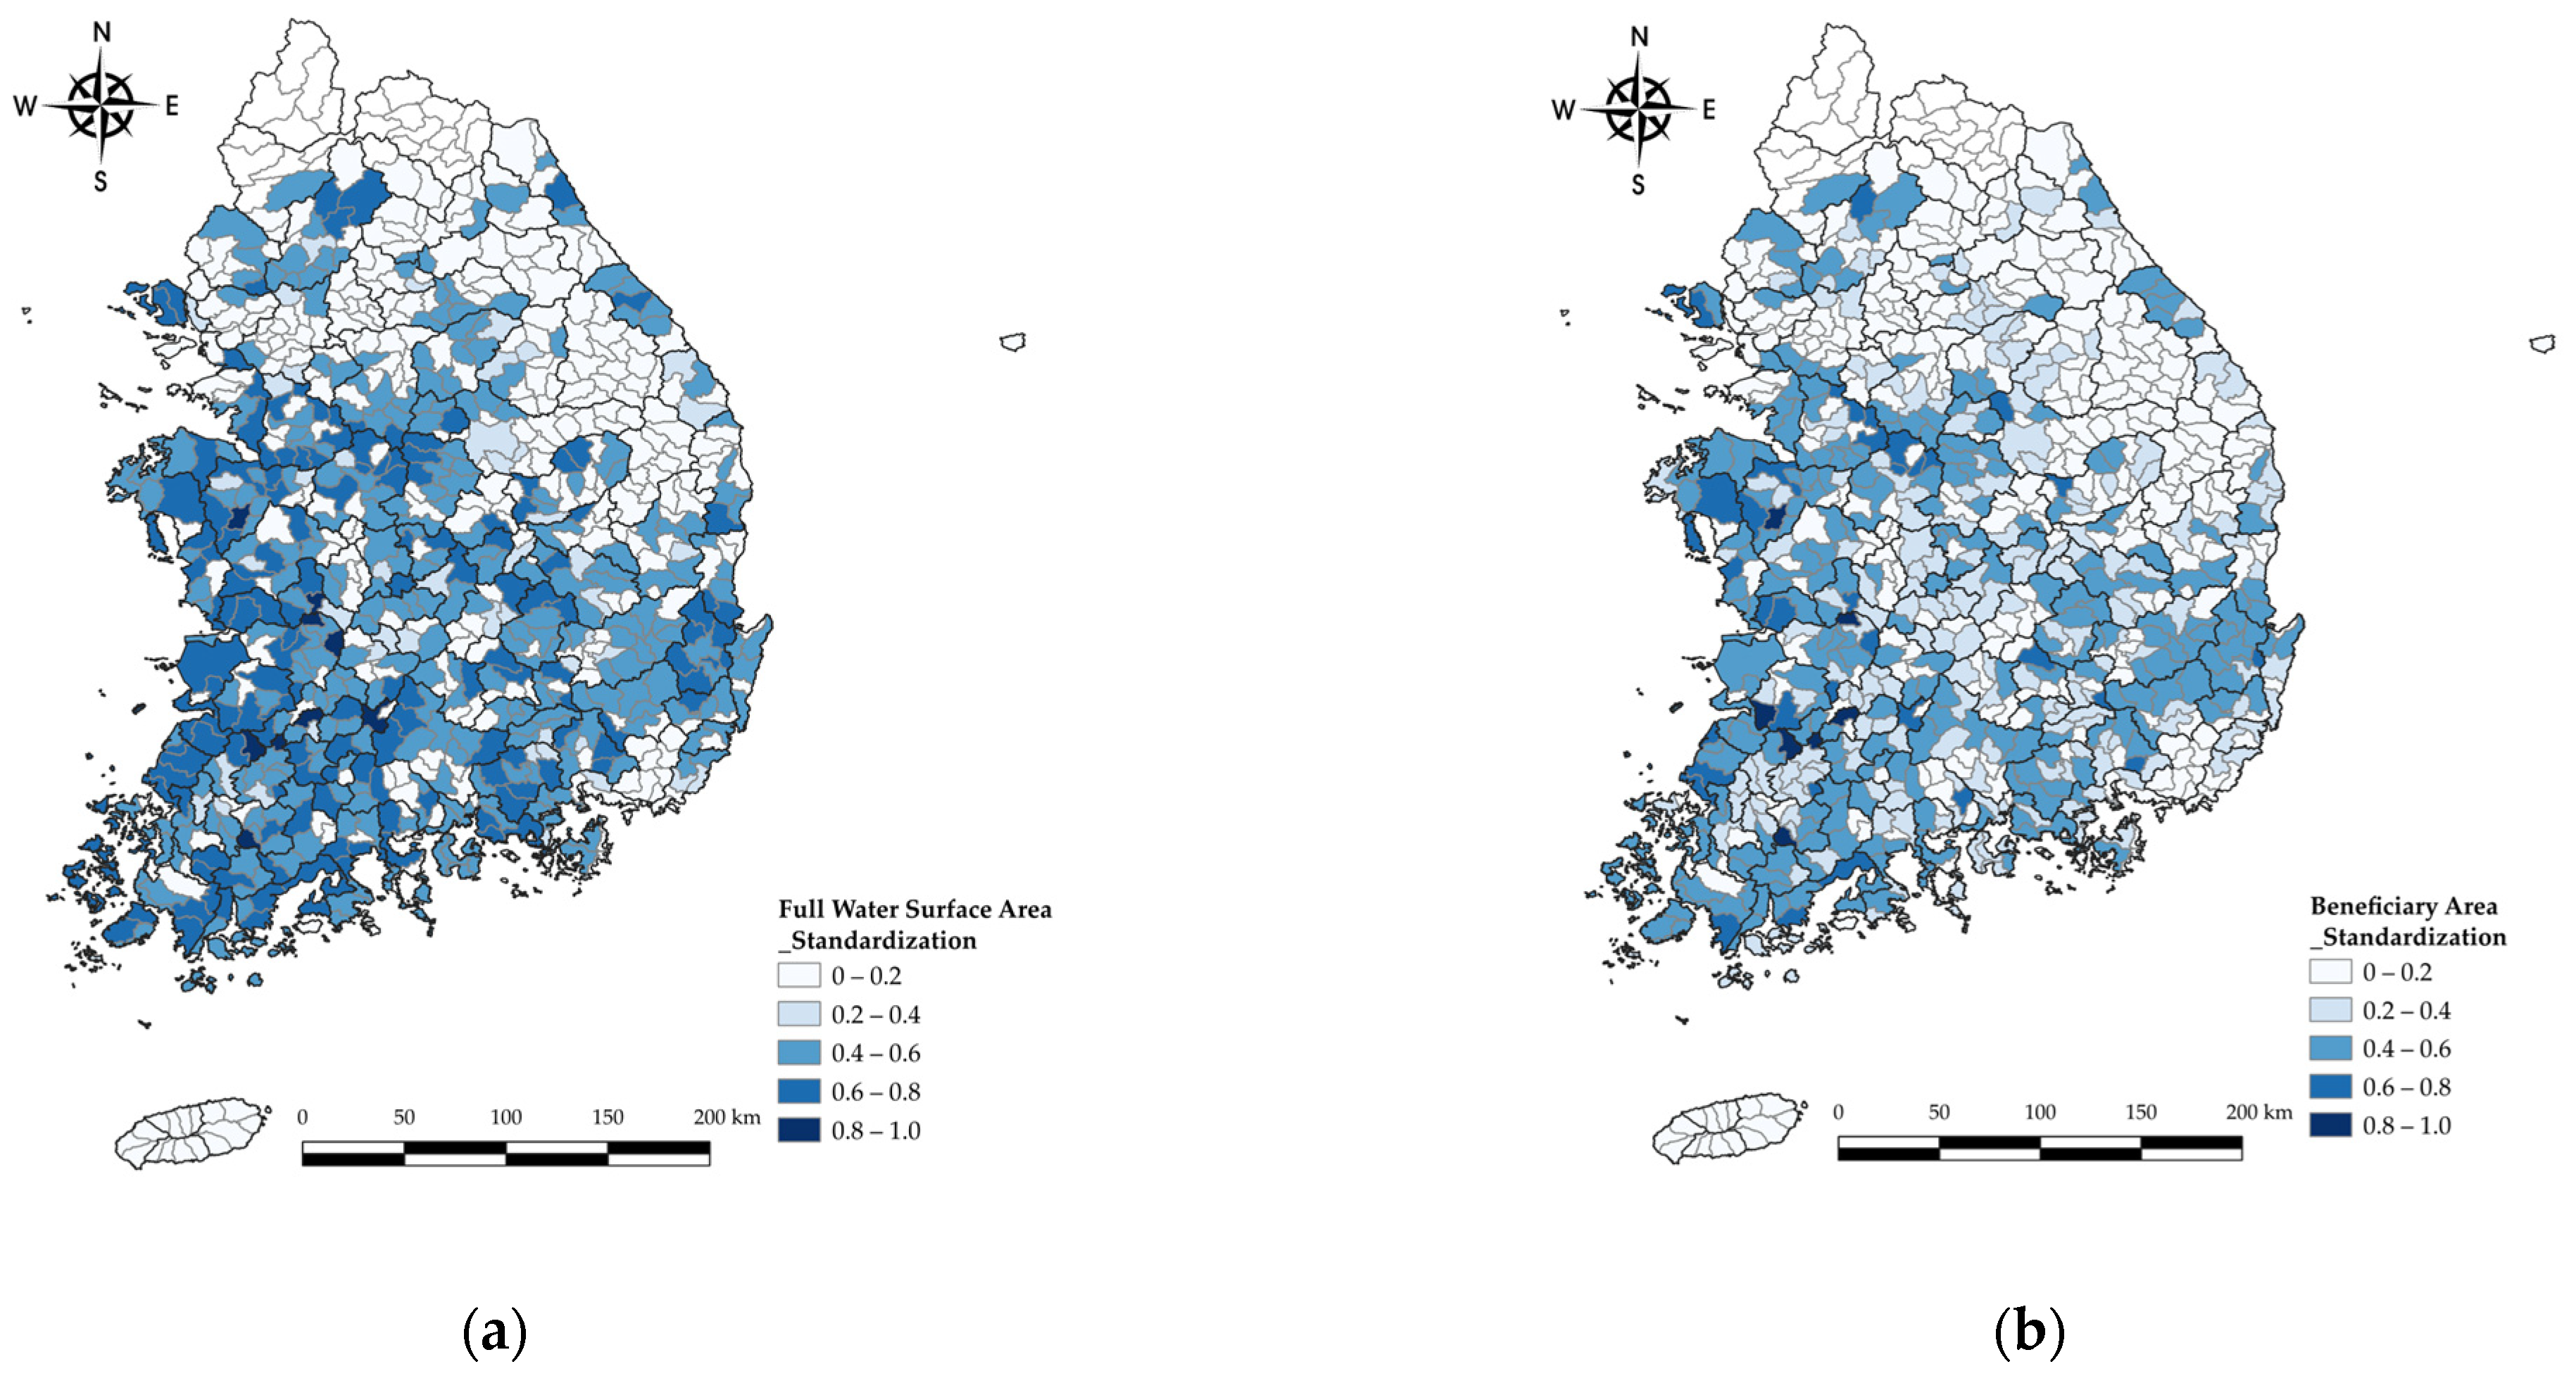
Examples of the standardized results for indicators are shown in Figure 3 and Figure 4, using the water-use sector and the water-friendly amenity sector; results for the remaining sectors follow the same procedure.
Figure 3.
Standardized distribution of the water-use sector by standard watershed. (a) Agricultural water use; (b) supply reliability.
Figure 4.
Standardized distribution of the water-friendly amenity sector by standard watershed. (a) Full water surface area; (b) beneficiary area.
4.2. Estimation of Weights
4.2.1. Suitability of the Indicators
To examine the suitability of the indicators selected for the water-use, water-safety, water environment, carbon-neutrality, and water-friendly amenity sectors, it is first necessary to determine whether the data to be tested are appropriate for factor analysis.
The suitability of the data for factor analysis was assessed using the KMO (Kaiser–Meyer–Olkin) measure of sampling adequacy and Bartlett’s test of sphericity. In general, factor analysis is considered appropriate when the KMO value exceeds 0.5 and the p-value of Bartlett’s test is less than 0.1. A lower KMO value indicates poorer adequacy of the selected variables for factor analysis [29,30,31].
The detailed criteria for the KMO measure are shown in Table 7.
Table 7.
Detailed criteria for the KMO measure.
The results of the KMO (Kaiser–Meyer–Olkin) measure of sampling adequacy and Bartlett’s test of sphericity are shown in Table 8.
Table 8.
Suitability test for factor analysis.
The suitability review showed a KMO value of 0.671, and Bartlett’s test of sphericity yielded p < 0.001, indicating that the data were suitable for factor analysis.
After the suitability test, communality should be examined to determine the explanatory power of the variables with respect to the extracted factors.
If the communality value is less than 0.5, the variable is considered to have low communality and is therefore excluded; the extracted communality values are shown in Table 9.
Table 9.
Extracted communality values.
As a result of the communality review, all indicators except for flood damage satisfy the criteria, so it can be judged that they are suitable for factor analysis.
Flood damage is a variable that should be excluded with a communality value of less than 0.5, but it was judged to be an important factor in the water-safety sector, so it was included in this study.
The factor extraction method applied in factor analysis is the principal component analysis method. As an extraction method for determining the number of factors, only factors with an Eigenvalue greater than 1 based on the cumulative rate of variance were extracted and analyzed.
Assuming that there is no correlation between factors, factor rotation was analyzed by selecting the varimax method among the right-angle rotation methods, and the total variance is shown in Table 10.
Table 10.
Total variance explained.
Analysis of the cumulative proportion of variance for the indicators used to evaluate rural water-cycle soundness showed that four principal components explained 72.178% of the total variance.
4.2.2. Selection of the Indicators
The reference value of the rotated component matrix representing the correlation between the indicator and the factor component is ±0.4 or more, as shown in Table 11.
Table 11.
Rotated component matrix.
Examining the characteristics of the principal components, Component 1 was found to explain supply reliability, the water-use safety ratio, the urban forest/paddy field area ratio, full water surface area, and beneficiary area. Component 2 was found to explain agricultural water use, upland-field water use, T-N, and T-P. Component 3 was found to explain flood damage cost and electricity supply, and Component 4 was found to explain BMI and FAI.
In this study, components up to Component 4, each containing two or more indicators and together explaining 72.178% of the total variance, were selected as the final evaluation indicators for rural water-cycle soundness assessment.
4.2.3. Weight Estimation Results
Following indicator standardization and final indicator selection, weights must be applied in evaluating rural water-cycle soundness because the influence of factors among sector-specific indicators should be considered.
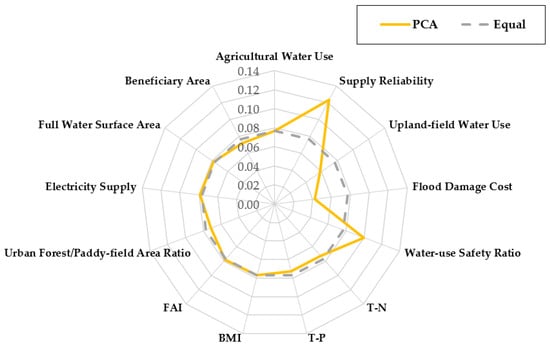
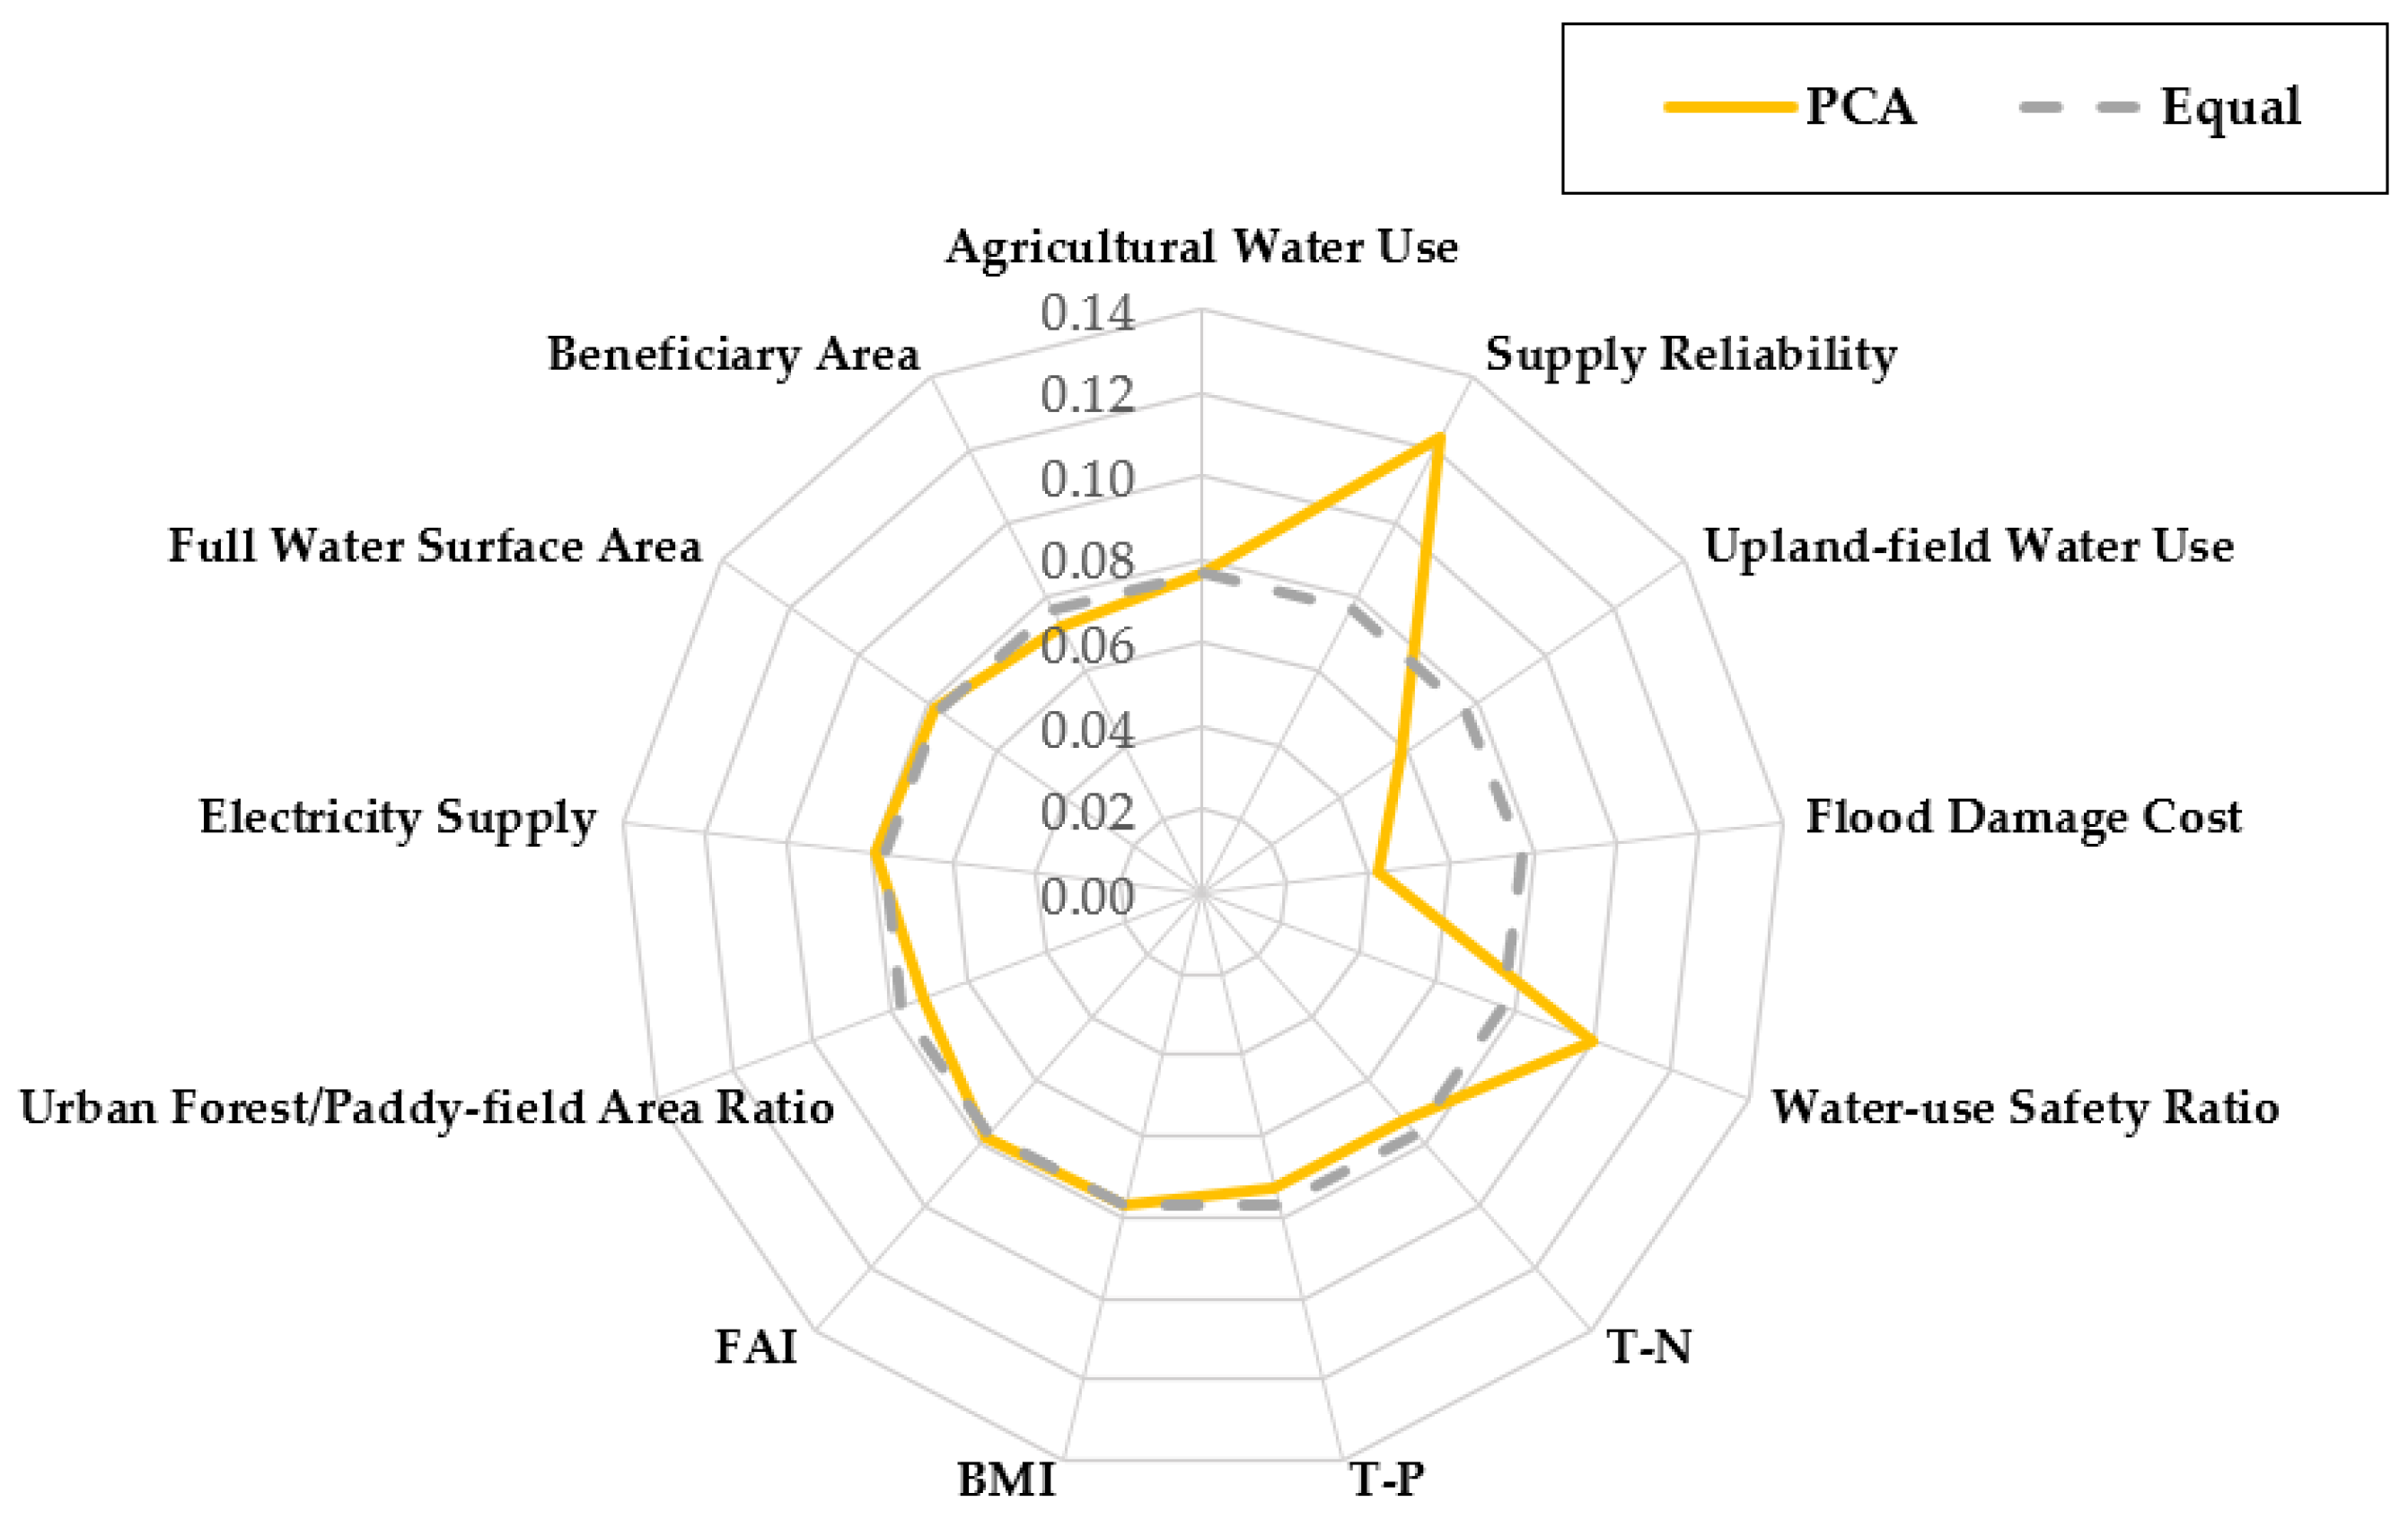
In this study, weights were estimated using the principal component analysis (PCA) method, and the results are shown in Figure 5 and Table 12.
Figure 5.
Weight estimation.
Table 12.
Results of PCA weight estimation.
Examining the detailed indicator weights estimated using the principal component method, supply reliability had the highest weight at 0.1231, followed by the water-use safety ratio at 0.1002.
In the water-safety sector, flood damage cost (0.0424) and upland-field water use (0.0574) showed relatively low weights.
The weight of each sector was determined qualitatively by an expert group related to this study on the basis of the weights derived from the principal component analysis (PCA) method.
4.2.4. Index Calculation and Grade Assessment
The calculation for the assessment of rural water-cycle soundness is expressed by Equation (4).
where x’i denotes the standardized indicator value, and wi denotes the weight assigned to each indicator.
Each sector-specific index was analyzed and evaluated, and an overall grade for rural water-cycle soundness assessment was derived through index grading.
4.2.5. Index Calculation Results
Rural water-cycle soundness indices were calculated for each standard watershed, and a sample for the Geum River basin is shown in Table 13.
Table 13.
Example of average sector-specific rural water-cycle soundness indices for the Geum River Basin.
To enhance the interpretability of the results, comparative analysis was conducted across standard watersheds, enabling the identification of relative differences in sectoral indices and overall rural water-cycle soundness.
Given the large number of standard watersheds (n = 825), representative case studies, such as the Geum River basin, were selected to present detailed results, while the overall dataset is summarized using index values and grading results.
Examining the results of the sector-specific index calculations for each standard watershed in the water-use sector, Cheonmi Stream (0.0837), Gujwa-eup (0.0805), and the Sihwa Seawall (0.0826) showed high indices, indicating better conditions than other standard watersheds.
In contrast, Gongji Stream (0.0003), the Andong Dam regulating reservoir (0.0004), and Palmi Stream (0.0004) showed low indices, indicating poorer conditions than other standard watersheds.
In the water-safety sector, Baekjeon-ri Stream (0.0602), Jincheon Stream (0.0596), and the lower Sincheon reach (0.0526) showed high indices, indicating better conditions than other standard watersheds, whereas the upper Jijang Stream (0.0004), Wando-gun (0.0006), and Ulleungdo (0.0126) showed low indices, indicating poorer conditions than other standard watersheds.
In the water environment sector, the Gapyeong Water Level Gauge (0.0634), Daejeon Stream (0.0631), and Ssangyong Stream (0.0593) showed high indices, indicating better conditions than other standard watersheds, whereas the Yeongam Seawall, Seokgyo Stream, and Seungchon Weir showed low indices of 0.000008, indicating poorer conditions than other standard watersheds.
In the carbon-neutrality sector, Baekjeon-ri Stream (0.0708), the upper Hantan River (0.0486), and Sacheon (0.0419) showed high indices, indicating better conditions than other standard watersheds, whereas Cheonggye Stream (0.0003), the upper Anyang Stream (0.0006), and the lower Sincheon reach (0.0037) showed low indices, indicating poorer conditions than other standard watersheds.
In the water-friendly amenity sector, the downstream areas of Seomjin River Dam (0.0749), Jangseong Dam (0.0667), and Yedang Dam (0.0647) showed high indices, indicating better conditions than other standard watersheds, whereas the confluence of Haman Stream (0.0004), the lower Naeseong Stream (0.0057), and the Daecheong Dam regulating reservoir (0.0061) showed low indices, indicating poorer conditions than other standard watersheds.
4.3. Grade Evaluation
The integrated grade reflecting the sector-specific grades is referred to above as rural water-cycle soundness (RWS).
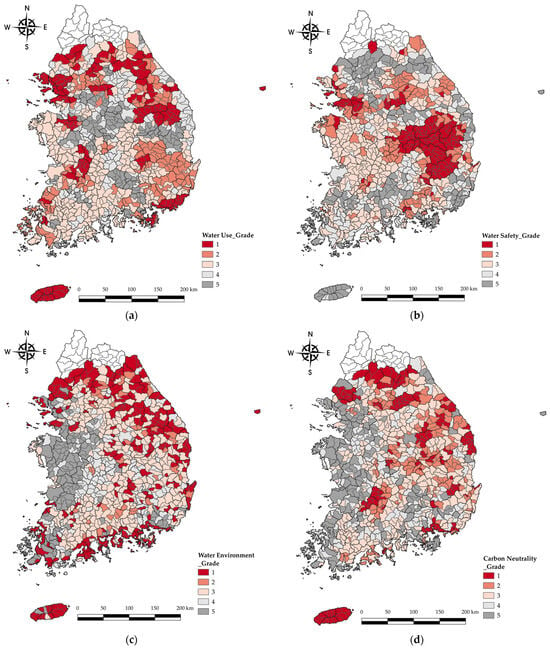
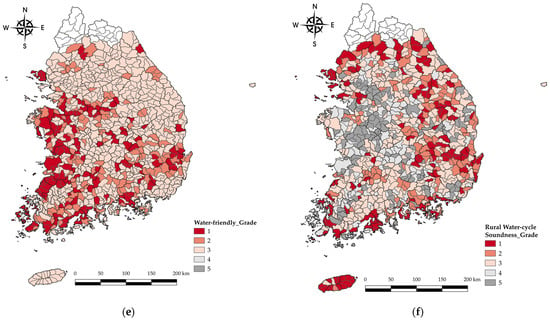
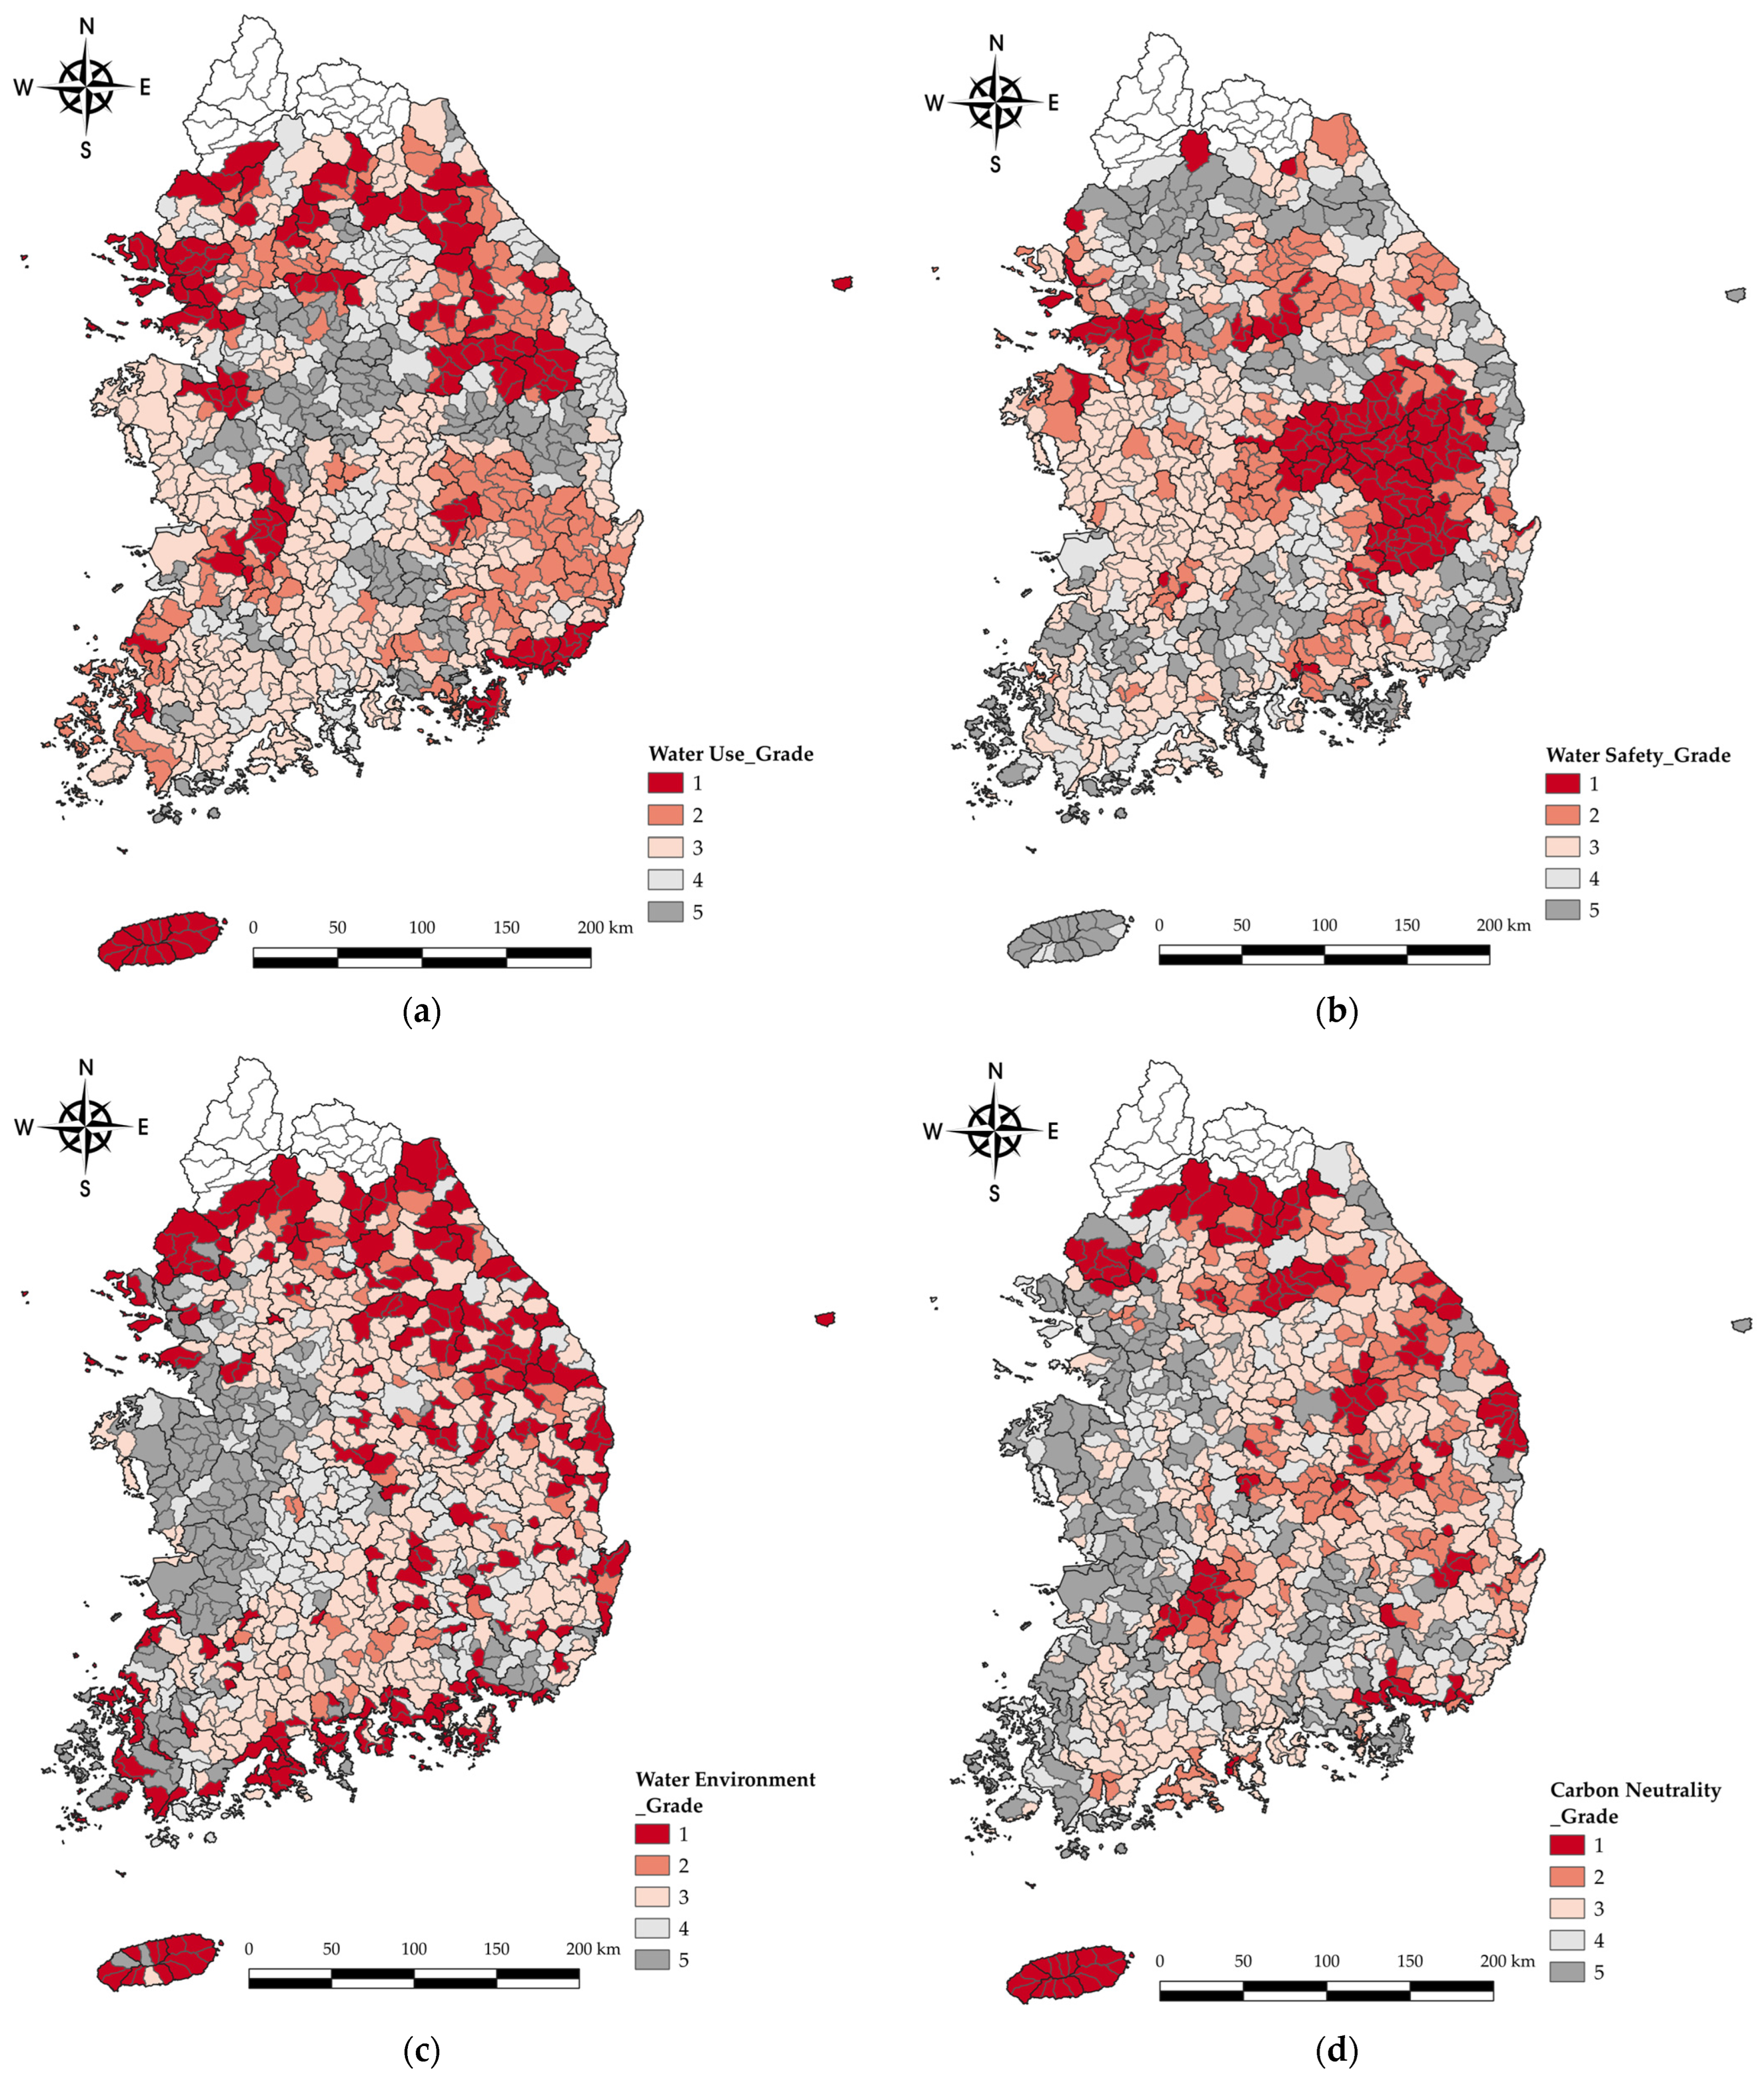
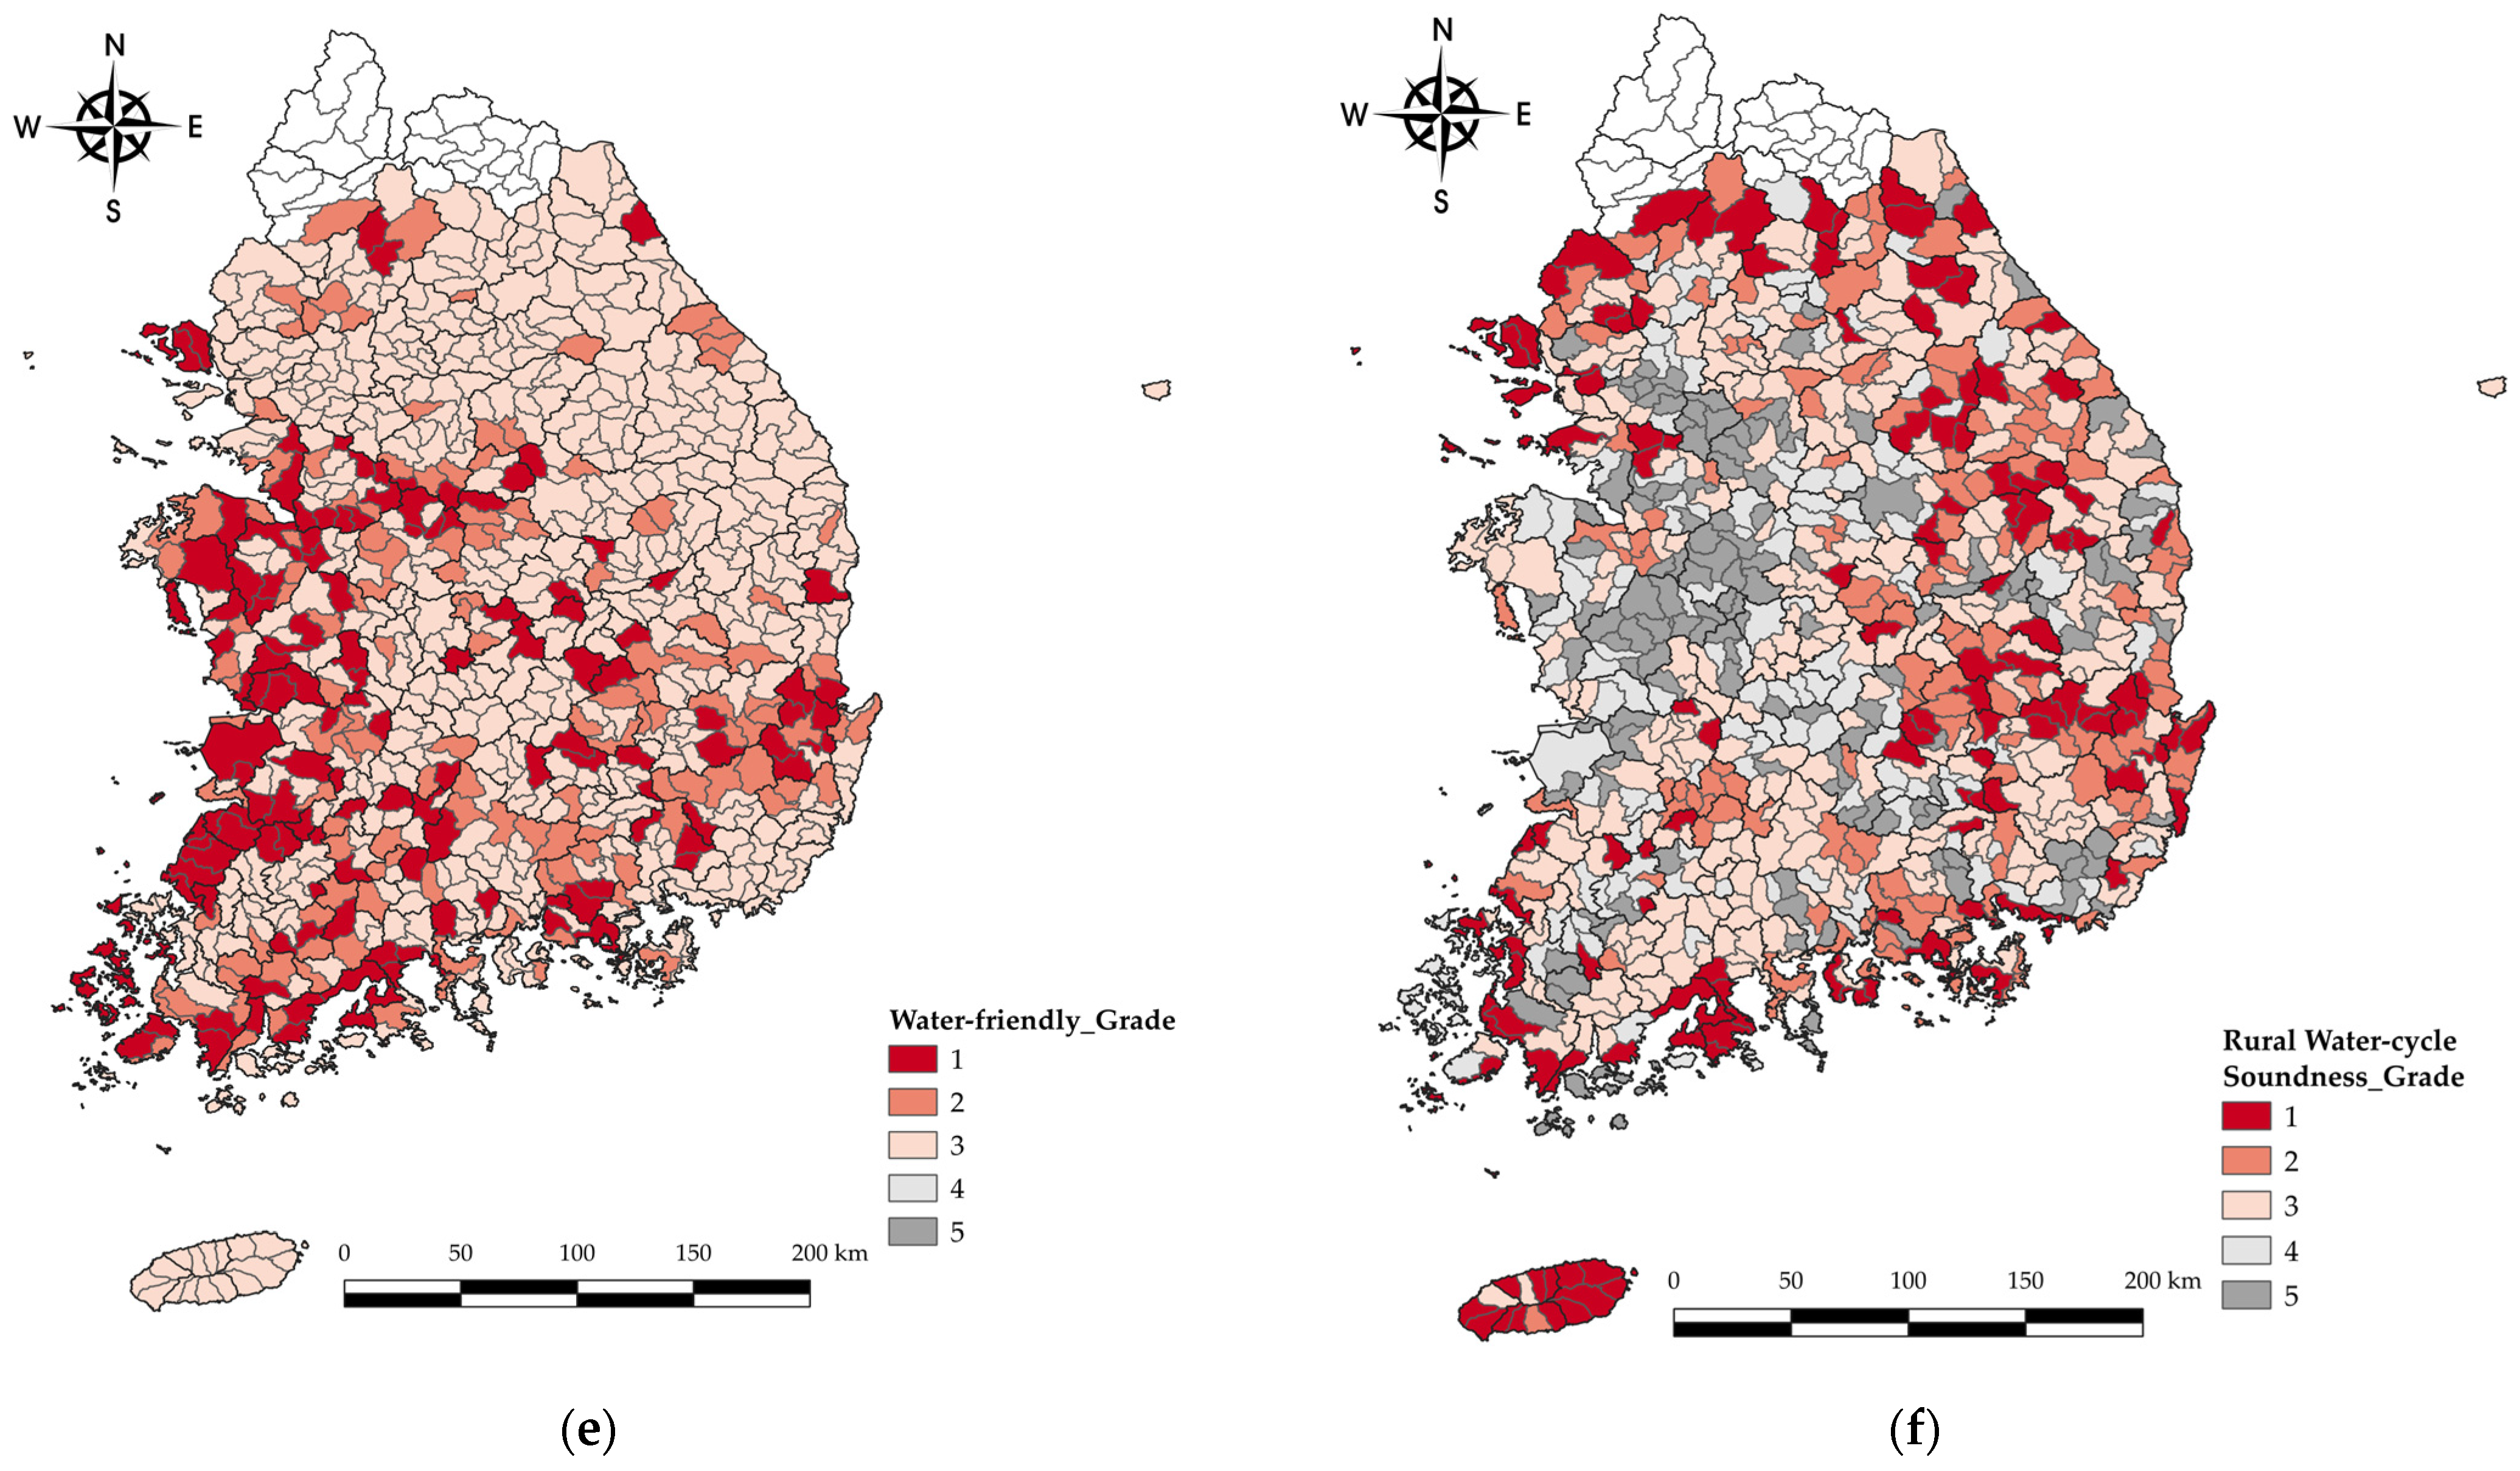
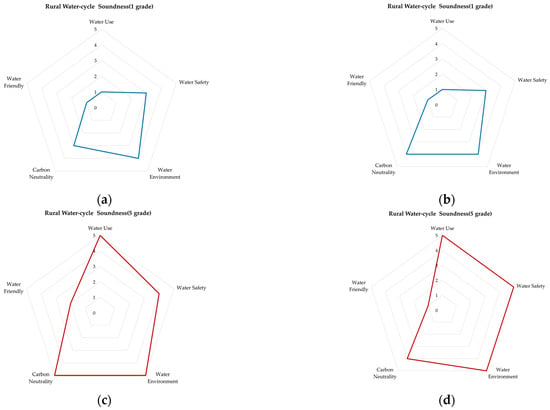
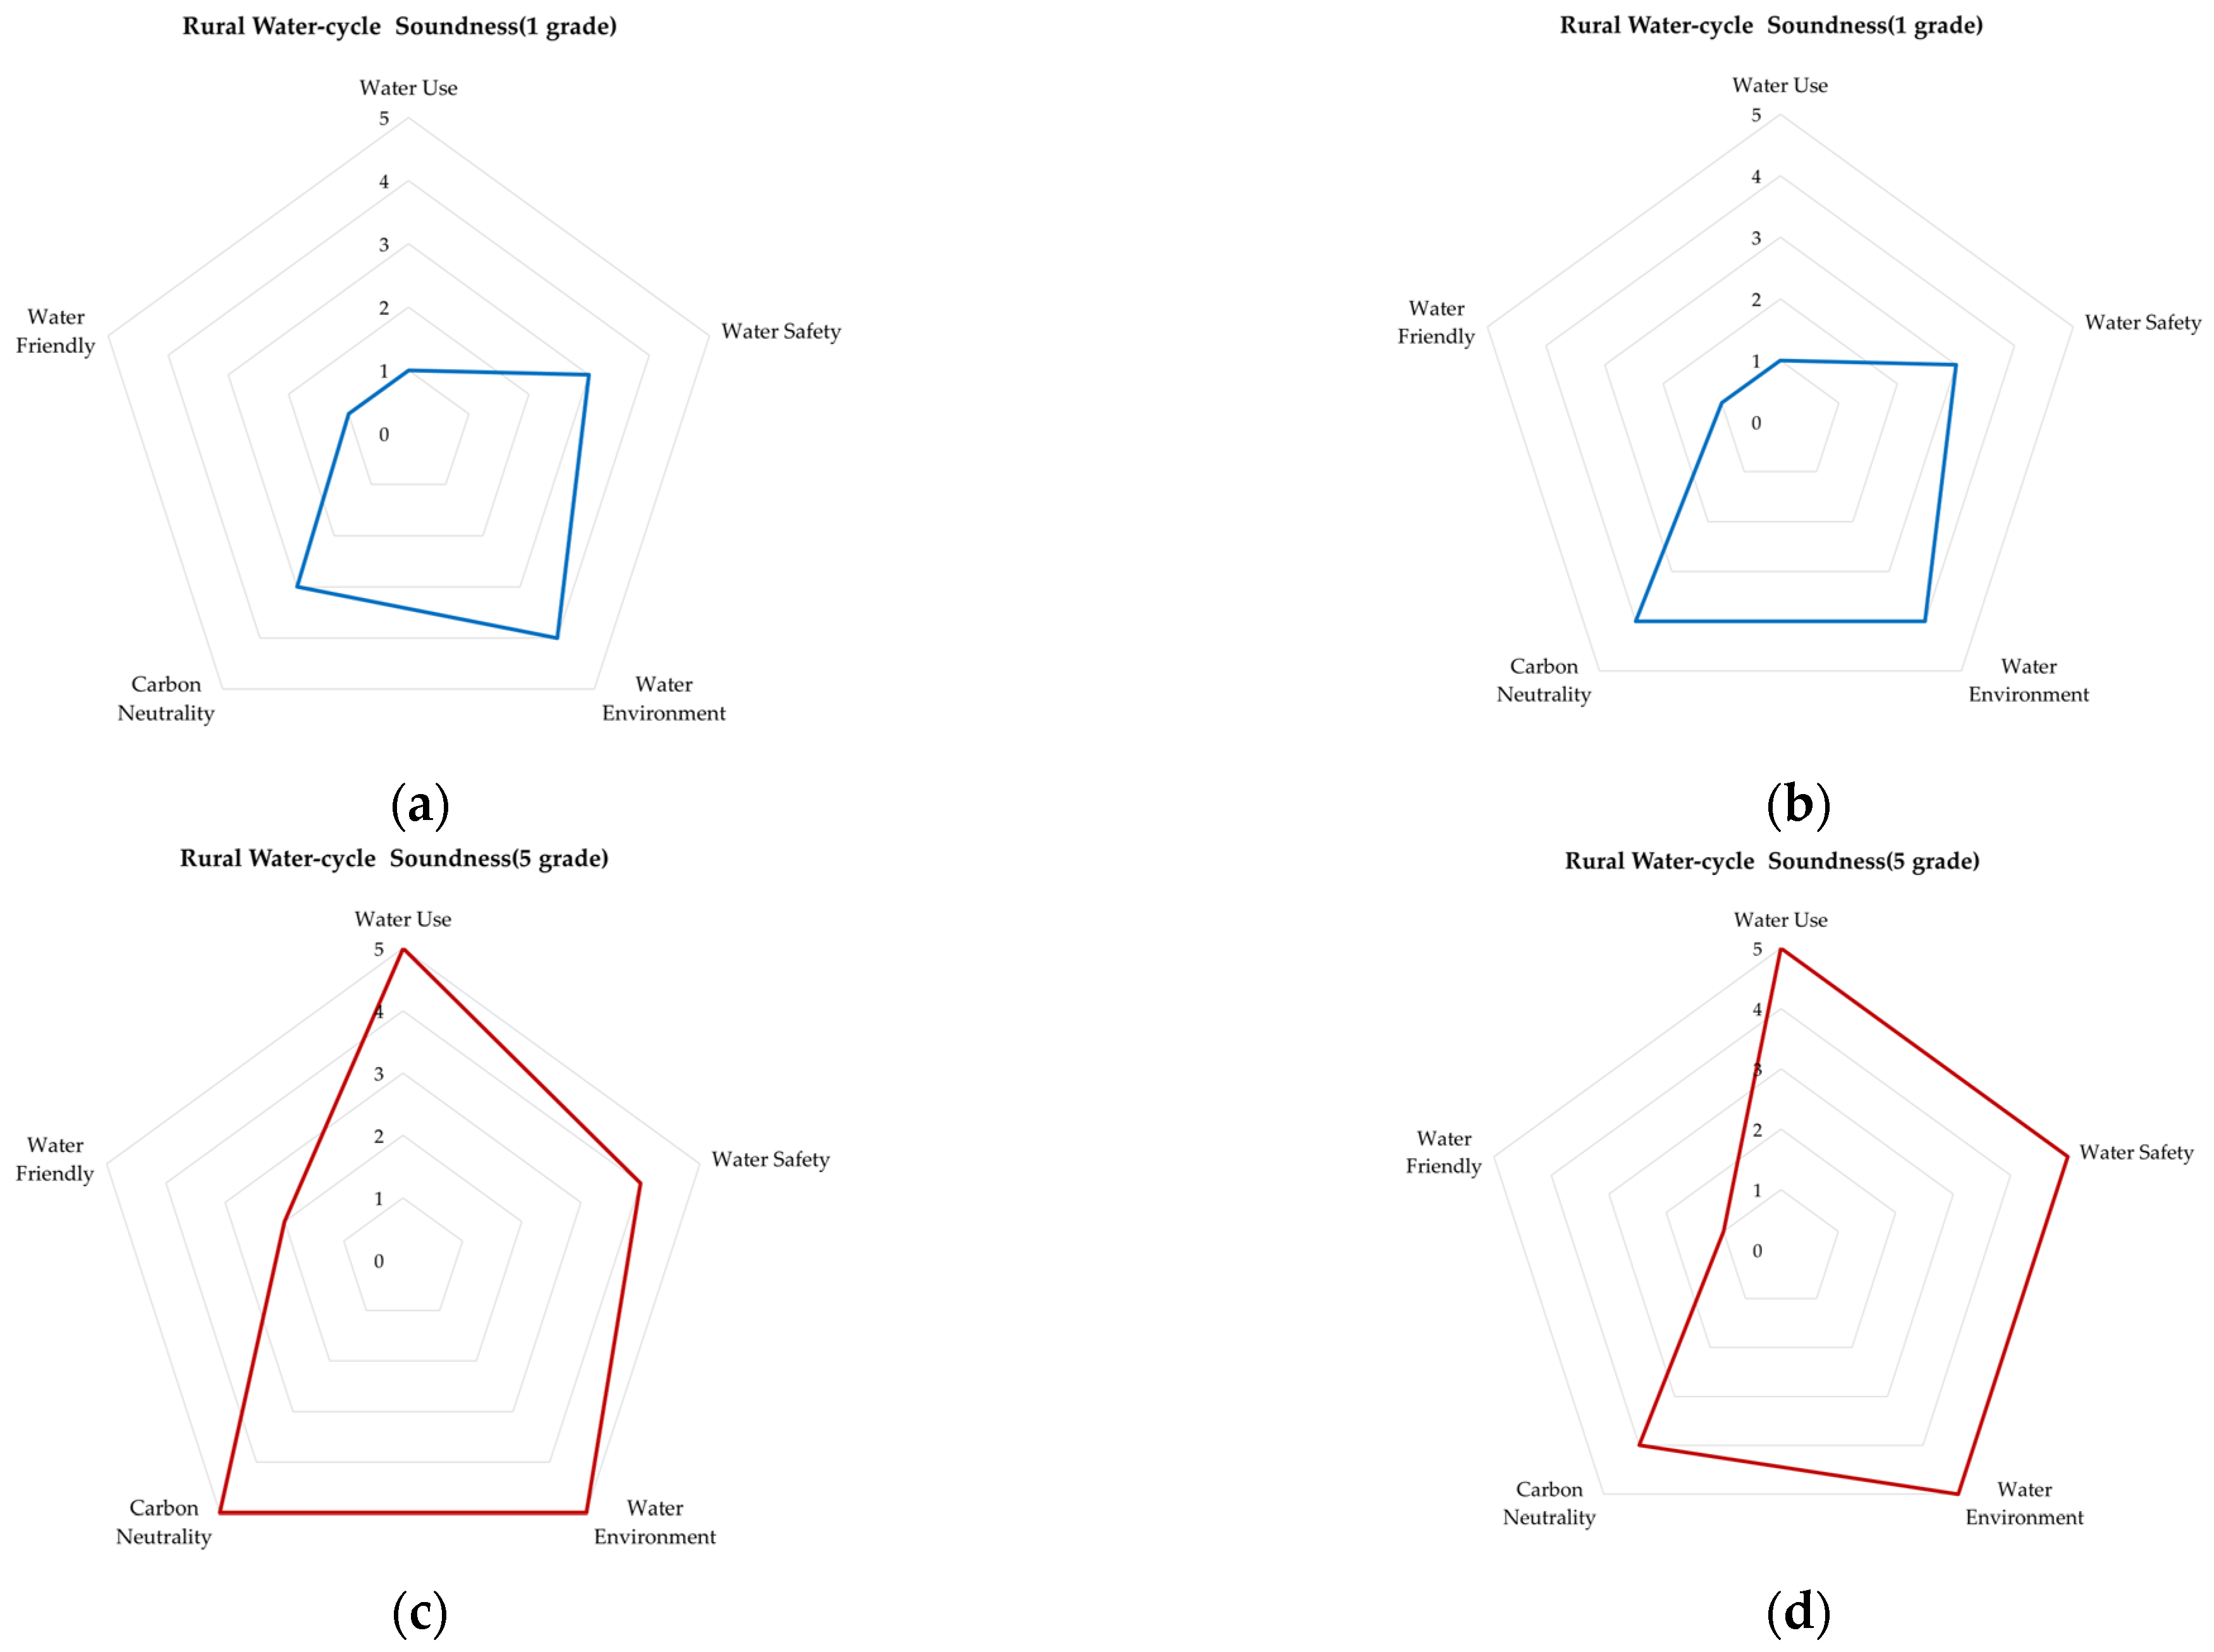
The distribution of grades for sector-specific and rural water-cycle soundness is shown in Figure 6, and as examples, Figure 7 presents the two standard watersheds with the highest and the two with the lowest rural water-cycle soundness grades in the Geum River basin.
Figure 6.
Distribution of grades for sector-specific and rural water-cycle soundness. (a) Water use; (b) water safety; (c) water environment; (d) carbon neutrality; (e) water-friendly amenity; (f) rural water-cycle soundness.
Figure 7.
Standard watersheds with the highest and lowest rural water-cycle soundness in the Geum River basin. (a) Gyeongcheon Dam; (b) Daea Dam; (c) lower Byeongcheon Stream; (d) Jusang Stream.
The spatial distribution of grades presented in Figure 6 and Figure 7 provides a comparative overview of regional disparities, allowing intuitive identification of areas with relatively high and low water-cycle soundness.
As a sample, the evaluation results for sectoral grades and rural water-cycle soundness grades by standard watershed in the Geum River basin are shown in Table 14.
Table 14.
Priority ranking of candidate sites for Rural Water-Cycle Projects.
4.4. Derivation of Priorities by Standard Watershed
Based on the results of the five sectors and the rural water-cycle soundness grades for each standard watershed in Korea, candidate standard watersheds for project implementation were selected and prioritized according to the following conditions.
First, standard watersheds with a rural water-cycle soundness (RWS) grade of 5 were extracted. As a result, a total of 133 standard watersheds were selected.
Second, among the 133 selected standard watersheds, those with higher sums of the grades across the five sectors were designated as priority standard watersheds for project implementation, as shown in Table 14.
5. Discussion
This study proposed a comprehensive framework for assessing rural water-cycle soundness across Korea’s 825 standard watersheds, integrating five sectors—water use, water safety, water environment, carbon neutrality, and water-friendly amenity—into a single composite index. The methodological choice to employ principal component analysis (PCA) for weight estimation, rather than the Analytic Hierarchy Process (AHP), was deliberate: while AHP is widely adopted in similar index-based studies [18,19], it inherently reflects the subjective judgment of expert panels, which can introduce inconsistency across research contexts. By contrast, PCA derives weights from the underlying data structure, thereby offering a more replicable and objective basis for indicator weighting [20,21]. The KMO value of 0.671 and a statistically significant Bartlett’s test result (p < 0.001) confirmed that the indicator dataset was suitable for factor analysis, and four principal components collectively explained 72.2% of the total variance. These results are consistent with those reported in analogous water-quality soundness assessments for agricultural reservoirs [16], suggesting that PCA-based weight estimation is a robust methodological choice for multi-sector water evaluation in Korean rural contexts. The relatively high weights assigned to supply reliability (0.1231) and the water-use safety ratio (0.1002) reflect the central policy concern of ensuring stable agricultural water supply in the face of increasing climate variability, corroborating earlier findings from national water welfare assessments [12].
Recent studies have emphasized the importance of incorporating toxicity assessments and biodegradability analysis into water-quality evaluation frameworks, highlighting the need for more comprehensive indicator systems beyond conventional nutrient-based approaches.
The spatial distribution of sector-specific indices revealed distinct regional patterns that reflect underlying hydrological and land-use conditions. In the water-use sector, watersheds exhibiting high indices—such as Cheonmi Stream and Gujwa-eup—are generally characterized by well-developed irrigation infrastructure and high paddy field water-supply reliability, whereas low-index watersheds such as Gongji Stream and Palmi Stream tend to be located in areas with limited reservoir capacity or fragmented water-supply networks. In the water environment sector, the strong performance of watersheds such as Gapyeong Water Level Gauge and Daejeon Stream aligns with relatively low agricultural land intensity and better riparian management in those sub-basins, which is consistent with prior findings linking land-use composition to water-quality outcomes in Korean river basins [14]. In contrast, the near-zero water environment indices of the Yeongam Seawall and Seungchon Weir are attributable to hydrological disconnection and reduced flow velocity associated with weir and seawall structures, which impede self-purification capacity and suppress aquatic biological communities—a pattern documented in river connectivity restoration studies [2]. In the carbon-neutrality sector, the pronounced variation between high-index watersheds (e.g., Baekjeon-ri Stream and upper Hantan River) and low-index ones (e.g., Cheonggye Stream and upper Anyang Stream) reflects the marked difference between forested upland areas and peri-urban or industrialized watersheds in terms of forest cover and electricity consumption patterns. These spatial contrasts underscore the utility of a watershed-scale assessment framework in identifying regionally differentiated vulnerabilities that aggregated national statistics would obscure.
The prioritization scheme, which identified 133 standard watersheds with an overall RWS grade of 5 and ranked them by the sum of sector-specific grades, provides a transparent and operationally tractable basis for sequencing rural water-cycle project investments. The top-ranked watersheds—including Ipobo, upper Bokha Stream, and middle Bokha Stream—all received the maximum grade of 5 in at least four out of five sectors, indicating compound vulnerability that cuts across multiple dimensions of the water cycle. This multi-sector compounding effect is particularly important from a policy standpoint: watersheds that score poorly in only one sector may be addressed through targeted sector-specific interventions, whereas watersheds exhibiting severe deficiencies across multiple sectors require more integrated, cross-sectoral programs. The proposed grading and ranking method thus offers a structured decision-support tool for prioritizing project implementation under constrained budgets, complementing earlier prioritization frameworks developed for drought-vulnerable island areas [17] and water-quality management zones [14]. Furthermore, the alignment between sectoral vulnerability patterns and known land-use and infrastructure characteristics of the ranked watersheds lends credibility to the indicator framework and supports its use as a basis for medium- to long-term rural water management planning.
Several methodological limitations of this study should be acknowledged. First, despite the application of log transformation to reduce skewness, several indicators—including supply reliability in the water-use sector, flood damage cost and the water-use safety ratio in the water-safety sector, and T-N and T-P in the water environment sector—did not fully satisfy normality criteria. Although the final analysis retained untransformed values to preserve the original environmental and physical characteristics of the data, this decision introduces potential sensitivity in the PCA results and may affect the stability of the derived weights. Second, flood damage cost exhibited a communality value of 0.288, which falls below the conventional threshold of 0.5 for inclusion in factor analysis. While this indicator was retained on grounds of substantive policy relevance, its low communality indicates limited shared variance with other indicators and suggests that it may not be well represented by the extracted principal components. Future work should explore alternative indicators of flood risk, such as flood-inundation area or infrastructure damage indices, that may exhibit stronger statistical coherence within the factor structure. Third, the assessment is based on cross-sectional data for a single reference year (2022) and therefore does not capture temporal variability in rural water-cycle conditions. Given that indicator values for sectors such as water safety and carbon neutrality can fluctuate considerably across years in response to climate events and policy changes, longitudinal assessments or scenario-based approaches would strengthen the robustness and policy utility of the framework. Finally, the sector weights used in the final composite index were determined qualitatively by an expert group rather than derived analytically, which introduces a degree of subjectivity into the overall scoring. Sensitivity analysis of the composite index with respect to alternative weight configurations would help quantify the influence of this subjective element on the resulting watershed rankings.
6. Conclusions
This study developed and applied a comprehensive assessment framework for rural water-cycle soundness across Korea’s 825 standard watersheds, integrating five sectors—water use, water safety, water environment, carbon neutrality, and water-friendly amenity—into a single composite index. Sector-specific indicators were selected through a review of domestic and international precedents, and their suitability was confirmed through KMO sampling adequacy testing (KMO = 0.671) and Bartlett’s test of sphericity (p < 0.001). Indicator weights were estimated using principal component analysis (PCA), and four principal components collectively explained 72.2% of the total variance. Supply reliability (weight: 0.1231) and the water-use safety ratio (0.1002) received the highest weights, reflecting the central importance of stable agricultural water supply in rural water management. Rural water-cycle soundness (RWS) indices were computed for all 825 standard watersheds and classified into five grades. A total of 133 watersheds received the lowest RWS grade (grade 5), indicating compound vulnerability across multiple sectors, and were identified as priority candidates for rural water-cycle project implementation.
Several limitations of this study should be acknowledged. The assessment relies on cross-sectional data for a single reference year (2022) and does not capture temporal variability in rural water-cycle conditions driven by climate events or policy changes. Some indicators—including flood damage cost, T-N, and T-P—did not fully satisfy normality criteria even after log transformation, which may introduce sensitivity into the PCA-derived weights. The communality of flood damage cost (0.288) fell below the conventional threshold for factor analysis inclusion; although retained on grounds of policy relevance, this represents a statistical limitation. Additionally, the sector-level weights in the composite index were determined qualitatively by an expert group, introducing a degree of subjectivity into the overall scoring. Future studies should address these limitations by incorporating multi-year time-series data, exploring alternative indicators with stronger statistical properties, and conducting sensitivity analyses of the composite index with respect to alternative weight configurations.
The RWS framework provides a replicable, data-driven basis for identifying water-cycle-vulnerable rural watersheds and sequencing project investments in a transparent and objective manner. For the 133 priority watersheds identified, rural water-cycle projects should reinforce the public-value foundations of existing agricultural infrastructure programs and, over the medium to long term, support the development of regionally tailored revitalization plans through coordinated action among central government ministries and local governments. An integrated monitoring system spanning pre-project preparation through post-project operation should be established across all five sectors to evaluate whether project outcomes correspond to the vulnerabilities identified by the RWS assessment. The framework is also transferable to other data-rich national contexts and can be adapted to incorporate additional sectors as relevant data become available. It is anticipated that the findings will contribute to climate-adaptive rural water management policies and support more systematic disaster response planning in Korea.
The proposed rural water-cycle soundness framework can serve as a scientific decision-support tool for identifying vulnerable areas and establishing priorities for rural water management projects. In particular, it provides a practical basis for policy development, climate change adaptation, and disaster risk management by enabling evidence-based planning at the watershed scale.
Author Contributions
Conceptualization, S.M.; methodology, S.M. and D.K.; software, D.K. and S.L.; validation, S.M. and S.L.; formal analysis, D.K.; investigation, S.L. and Y.P.; resources, S.M. and Y.P.; data curation, D.K. and S.L.; writing—original draft preparation, D.K. and S.L.; writing—review and editing, S.M. and S.L.; visualization, D.K. and S.L.; supervision, S.M.; project administration, S.M.; funding acquisition, S.M. All authors have read and agreed to the published version of the manuscript.
Funding
This work was supported by funding for the academic research program of Chungbuk National University in 2025.
Data Availability Statement
The data presented in this study are available upon request from the corresponding author due to institutional and data-sharing restrictions.
Acknowledgments
The authors acknowledge the financial support from Chungbuk National University for the 2025 academic research program.
Conflicts of Interest
Author Youngho Park was employed by the Korea Water Resources Corporation (K-water). The remaining authors declare that the research was conducted in the absence of any commercial or financial relationships that could be construed as potential conflicts of interest.
References
- Statistics Korea. 2021 Census on Agriculture, Forestry and Fisheries; Statistics Korea: Daejeon, Republic of Korea, 2022. Available online: https://kostat.go.kr (accessed on 1 January 2025).
- Korea Rural Community Corporation. Business Report of the Integrated Water Management Task Force; Korea Rural Community Corporation: Naju-si, Republic of Korea, 2022.
- Ministry of Environment. National Water Management Master Plan; Ministry of Environment: Sejong, Republic of Korea, 2020.
- Choi, I.C.; Shin, H.J.; Nguyen, T.T.; Tenhunen, J. Water policy reforms in South Korea: A historical review and ongoing challenges for sustainable water governance and management. Water 2017, 9, 717. [Google Scholar] [CrossRef] [Scilit]
- OECD. Enhancing Water Use Efficiency in Korea; OECD Publishing: Paris, France, 2017. [Google Scholar]
- Danish Ministry of Higher Education and Science. A Smart Water Nation? Water Technology and Sustainable Development in South Korea; University of Copenhagen: Copenhagen, Denmark, 2018.
- Kim, H.Y.; Shin, C.; Park, Y.; Moon, J. Water Resources Management in the Republic of Korea: Korea’s Challenge to Flood and Drought with Multipurpose Dam and Multiregional Water Supply Systems; Inter-American Development Bank: Washington, DC, USA, 2018; Available online: https://publications.iadb.org/ (accessed on 27 May 2026).
- Bang, N.-K.; Nam, W.-H.; Shin, J.-H.; Kim, H.-J.; Kang, K.-U.; Baek, S.-C.; Lee, K.-Y. Water balance analysis of pumped-storage reservoir during non-irrigation period for recurrent irrigation water management. J. Korean Soc. Agric. Eng. 2020, 62, 1–12. [Google Scholar] [CrossRef]
- An, H.; Kang, H.; Nam, W.; Lee, K. Estimation of irrigation return flow from paddy fields based on the reservoir storage rate. Korean J. Agric. Sci. 2020, 47, 19–28. [Google Scholar] [CrossRef] [Scilit]
- Lee, T.; Kim, S.; Park, J. Assessment of agricultural return flow impacts on stream flow using the water balance method. J. Agric. Life Environ. Sci. 2024, 36, 45–58. [Google Scholar]
- Maeng, S.J. Development of Smart Agricultural Water Reuse System Technology for Water Scarcity Response; Korea Agency for Infrastructure Technology Advancement: Anyang, Republic of Korea, 2024.
- K-Water. Establishment of a National Strategy for Enhancing Water Welfare; Korea Water Resources Association: Daejeon, Republic of Korea, 2014.
- Korea Institute of Civil Engineering and Building Technology. Expansion of Detailed Indicators for Water Resources Assessment; Korea Institute of Civil Engineering and Building Technology: Goyang, Republic of Korea, 2010.
- The Policy Council for the PALDANG Watershed. Establishment of an Integrated Water Quantity and Quality Assessment Framework for the Paldang Watershed Under National Integrated Water Management; The Policy Council for the PALDANG Watershed: Yangpyeong, Republic of Korea, 2019.
- Hair, J.F.; Black, W.C.; Babin, B.J.; Anderson, R.E. Multivariate Data Analysis, 7th ed.; Pearson: Harlow, UK, 2010. [Google Scholar]
- Lee, S.W.; Kim, D.Y.; Maeng, S.J.; Hong, E.B.; Park, H.K. Integrated Soundness Assessment of Agricultural Reservoirs Based on Water Quantity and Quality. Water 2023, 15, 2131. [Google Scholar] [CrossRef] [Scilit]
- Shim, I.; Kim, H.; Hong, B.; An, J.; Hwang, T. Drought vulnerability assessment and cluster analysis of island areas taking Korean island areas at eup (town) and myeon (subcounty) levels as study targets. Water 2021, 13, 3657. [Google Scholar] [CrossRef] [Scilit]
- Saaty, T.L. Decision Making with the Analytic Hierarchy Process. Int. J. Serv. Sci. 2008, 1, 83–98. [Google Scholar] [CrossRef] [Scilit]
- Zhao, B.; Liu, Q.; Zhu, J. Risk assessment and zonation of roof water inrush based on the analytic hierarchy process, principal component analysis, and improved game theory (AHP–PCA–IGT) method. Sustainability 2023, 15, 11375. [Google Scholar] [CrossRef] [Scilit]
- Sutadian, A.D.; Muttil, N.; Yilmaz, A.G.; Perera, B.J.C. Using the Analytic Hierarchy Process to Identify Parameter Weights for Developing a Water Quality Index. Ecol. Indic. 2017, 75, 233–242. [Google Scholar] [CrossRef] [Scilit]
- Jolliffe, I.T.; Cadima, J. Principal Component Analysis: A Review and Recent Developments. Philos. Trans. R. Soc. A 2016, 374, 20150202. [Google Scholar] [CrossRef] [Scilit] [PubMed]
- Strotmann, U.; Durand, M.; Thouand, G.; Eberlein, C.; Heipieper, H.J.; Gartiser, S.; Pagga, U. Microbiological toxicity tests using standardized ISO/OECD methods—Current state and outlook. Appl. Microbiol. Biotechnol. 2024, 108, 454. [Google Scholar] [CrossRef] [Scilit] [PubMed]
- Strotmann, U.; Heipieper, H.J.; Eberlein, C.; Mayer, P.; Birch, H.; Gartiser, S.; Pagga, U.; Daturpalli, S.; Battagliarin, G.; McDonough, K.; et al. Testing the biodegradability of difficult compounds: A future challenge for the OECD/ISO standardization. Appl. Microbiol. Biotechnol. 2026, 110, 122. [Google Scholar] [CrossRef] [Scilit] [PubMed]
- Han River Flood Control Office. River Basin Survey; Han River Flood Control Office: Seoul, Republic of Korea, 2021.
- Ministry of the Interior and Safety. Disaster Annual Report; Ministry of the Interior and Safety: Sejong, Republic of Korea, 2021.
- Ministry of Environment. Results of the Aquatic Ecosystem Health Survey and Assessment; Ministry of Environment: Sejong, Republic of Korea, 2022.
- Korea Forest Service. National Urban Forest Statistics; Korea Forest Service: Daejeon, Republic of Korea, 2022.
- Statistics Korea (KOSTAT). Statistical Data on Electricity Supply; Statistics Korea: Daejeon, Republic of Korea, 2022.
- Kaiser, H.F. An Index of Factorial Simplicity. Psychometrika 1974, 39, 31–36. [Google Scholar] [CrossRef] [Scilit]
- Kang, H.C. A guide on the use of factor analysis in the assessment of construct validity. J. Korean Acad. Nurs. 2013, 43, 587–594. [Google Scholar] [CrossRef] [Scilit] [PubMed]
- Park, J.E. Evaluation of Climate Change Resilience Using Simulation Techniques. Ph.D. Thesis, Inha University, Incheon, Republic of Korea, 2017. [Google Scholar]

Disclaimer/Publisher’s Note: The statements, opinions and data contained in all publications are solely those of the individual author(s) and contributor(s) and not of MDPI and/or the editor(s). MDPI and/or the editor(s) disclaim responsibility for any injury to people or property resulting from any ideas, methods, instructions or products referred to in the content. |
© 2026 by the authors. Licensee MDPI, Basel, Switzerland. This article is an open access article distributed under the terms and conditions of the Creative Commons Attribution (CC BY) license.