


Abstract
Glaciers play a crucial role in shaping global hydrology and biogeochemical cycles, yet their climate-forced dynamic impact on chemical denudation and solute yields remain poorly understood. This study compiled data on 40 well-documented cationic denudation rates (CDR) from glaciers across Northwest America, the Svalbard/Arctic Canada, Iceland, Greenland, Europe, China-Tibet, Antarctica, and the Himalayas, revealing substantial spatial variability. CDRs ranged from 46 to 4160 meq m−2 yr−1. Northwest American and Himalayan glaciers exhibited the highest CDRs, with the Himalayan denudation rate exceeding the global average by more than fourfold. The exceptionally high mean chemical weathering intensity (CWI) of 801 meq m−3 from the Himalayan glaciers indicate a wide range of geochemical and climatic conditions within the region, while Northwest American and Greenland glaciers show comparatively lower mean intensities (273 and 247 meq m−3, respectively) suggesting a consistent geochemical regime. Northwest American glaciers had the highest specific discharge rates, while Svalbard/Arctic Canada glaciers had the lowest, reflecting regional disparities influenced by climatic and geological factors. A Bonferroni post hoc test highlighted significant differences in specific discharge between Northwest American glaciers and two other basins, emphasizing their distinct hydrological behavior. Predictive modeling revealed a statistically significant but weak relationship between CDR and specific discharge (R2 = 57%), suggesting that much of the variability in CDR cannot be explained by specific discharge alone. A regression coefficient of 382 meq m−2 yr−1 indicates that CDR increases with glacier discharge, although basin-specific analyses showed minimal variation in this relationship across regions. Svalbard/Arctic Canada, Antarctic, Greenlandic, Icelandic, and European Alpine glaciers displayed lower CDRs, which varied depending on underlying lithology, with higher rates observed in carbonate and basaltic terrains compared to other lithologies. We hypothesize that glacier retreat enhances the downward progression of the weathering reaction front, increasing CDR, particularly in rapidly retreating glaciers.
1. Introduction
Glaciers are important erosive agents on Earth, excavating valleys and transforming landscapes. Understanding glacial denudation dynamics is crucial, as glaciers shape global hydrological systems, regulate Earth’s climate, and play a key role in biogeochemical dynamics and nutrient and metal export to adjacent aquatic environments. Glaciers are an ideal natural laboratory for examining low-temperature geochemistry and the factors regulating glacial biogeochemistry, including the role of microorganisms in accelerating chemical weathering rates in glacial environments [1]. Due to the continued increase in Earth’s surface temperature, glaciers worldwide are retreating rapidly [2,3,4,5], which consequently causes dramatic hydrological changes and has a direct effect on cationic denudation rates (CDR). Understanding CDRs of glacierized basins are crucial to understanding global biogeochemical cycles, glacier hydrology, and global carbon cycles and comparing continental erosion rates across the globe. Cations released through chemical weathering supply tremendous amounts of dissolved loads of ionic species as well as carbon and nutrients, which provide ecological support downstream and maintain a long-term balance of atmospheric CO2 [6]. Integration of climatic and geological factors is important to gain further insights into CDRs as natural chemical weathering processes help to balance the long-term Earth’s climate and, in combination with physical weathering processes, cause heterogenous erosion of glacial landscapes. However, the impacts of climatic and geological factors on CDRs may be limited by complex interactions and lithological compositions.
The number of studies of glacial biogeochemical processes varies a lot between glacierized regions around the world. Glacial biogeochemistry is well studied in the Svalbard/Arctic Canada region in comparison to other glaciers of the world [1,7]. In contrast, glacial biogeochemistry in regions such as the Southern Alps of New Zealand, Russian Arctic glaciers, glaciers in Central Asia, the Canadian High Arctic, or in South America remain understudied. An important tool to quantify the mobilization of rock-derived ions in glacial rivers is the measurement of sea-salt-corrected cationic denudation rates (CDR). However, there are surprisingly few reports of CDRs from glacierized basins, hampering a regional scale understanding of the chemical component of rock weathering beneath glaciers. Sea-salt correction is a process to separate the marine contributed ions. The contribution of sea-salt derived ions to surface waters can be estimated using the molar ratios of elements found in seawater as documented by various studies earlier from different terrains [8,9,10]. Chloride concentration can be used as a reference species to correct the contribution of sea-salt in surface waters for marine-derived Na, K, Mg, Ca and SO4 to estimate the non-sea salt or weathered concentration from chemical weathering.
The current scarcity of CDR data is due to the logistical and costly challenges of working near glacier systems. Hydrometric stations, which are used for annual discharge measurements in glacial rivers, are often damaged or destroyed by glacial lake outburst floods (GLOFs) or inundation events induced by intense snowmelt, ice melt, or heavy rainfall. Furthermore, conducting comprehensive meltwater sampling throughout the ablation season requires significant logistics and long-term labor in the field.
However, a few compilations of CDRs are available [7,11,12,13,14], showing a wide variability in reported glacier CDR values that may arise from differences in lithology, glacier area, basal thermal regimes, precipitation levels, discharge measurement methods, sampling duration, sampling proximity to glaciers, and sea-salt correction techniques. CDR reported without sea-salt correction is also a cause for variability as mentioned above. Understanding the relative contribution of these factors is essential for accurately assessing the geochemical dynamics of glacier basins on regional and global scales.
Hodson et al. (2000) [7] identified specific annual discharge as a primary control on CDR, with lithology playing a secondary role. For instance, carbonate and basaltic lithologies exhibit distinct weathering behaviors. Yde et al. (2008) [15] and Stachnik et al. (2016) [16] documented microbially mediated sulfide oxidation coupled with dolomite dissolution as a dominant geochemical process in Svalbard glaciers. Similar processes were observed in the Dokriani Glacier in India and Langtang Lirung Glacier in Nepal within the Himalayas, where pyrite oxidation coupled with carbonate dissolution governs meltwater chemistry [5,10,17,18]. Also, Torres et al. (2017) [19] and Li et al. (2022) [20] reported that chemical weathering beneath glaciers is more intense than in non-glacial basins, underscoring the unique dynamics of glacierized basins. However, despite these and many other studies providing detailed insights into specific chemical weathering processes in glacial basins, there is a need for an updated evaluation focusing on available measurements of CDR.
The objective of this study is to compile data on CDRs from glacier basins worldwide and evaluate the factors influencing CDRs. This synthesis aims to improve our understanding of the variability of global glacial geochemical denudation, with a particular focus on the factors regulating CDRs. The study seeks to address knowledge gaps and contributes to predicting the impacts of glacier retreat on hydrological and geochemical processes, ultimately leading to an increase in CDRs in glacierized basins.
2. Synthesis and Analysis of CDRs Across Global Glacier Basins
2.1. Synthesis of CDR Across Global Glacier Basins
Cationic denudation rates from 50 sites of 40 glacier basins with specific discharge from selected glacier basins worldwide are summarized in Table 1. We separate the data into regions to gain a better overview of the variations in CDR within the region and among other different regions to understand the impacts of possible regulating factors on CDR. In this context, it is important to emphasize that the mean CDR value for a given region is not representative of all glaciers within the region because the currently available dataset is very limited. The addition of one or a few new estimates of CDR would likely have a significant effect on the mean CDR values.
The region “Northwest America” refers to glaciers in the U.S. states of Washington and Alaska and in British Columbia, Canada. The region “Svalbard/Arctic Canada” combines High Arctic glaciers in Svalbard with a single High Arctic glacier located on Baffin Island in Arctic Canada, well knowing that the climate in the two areas differ. We have decided to have the two Low Arctic Greenlandic glaciers in a separate category, but here it is important to keep in mind that Kuannersuit Glacier is a peripheral glacier located on an island, whereas Watson River drains a sector of the Greenland Ice Sheet. The region “Alpine glaciers in Europe” only includes glaciers in Central Europe, as there is currently no data on CDR available from Scandinavian or other European glacierized areas. In Central Asia, we distinguish between “Alpine glaciers in China-Tibet” and “Himalayan glaciers” due to the differences in climate between the monsoon-affected glaciers in the Himalaya mountain range and the glaciers located at a significant distance away from the Himalaya. For “Antarctic glaciers”, CDR is only available for one glacier located on the South Orkney Islands.
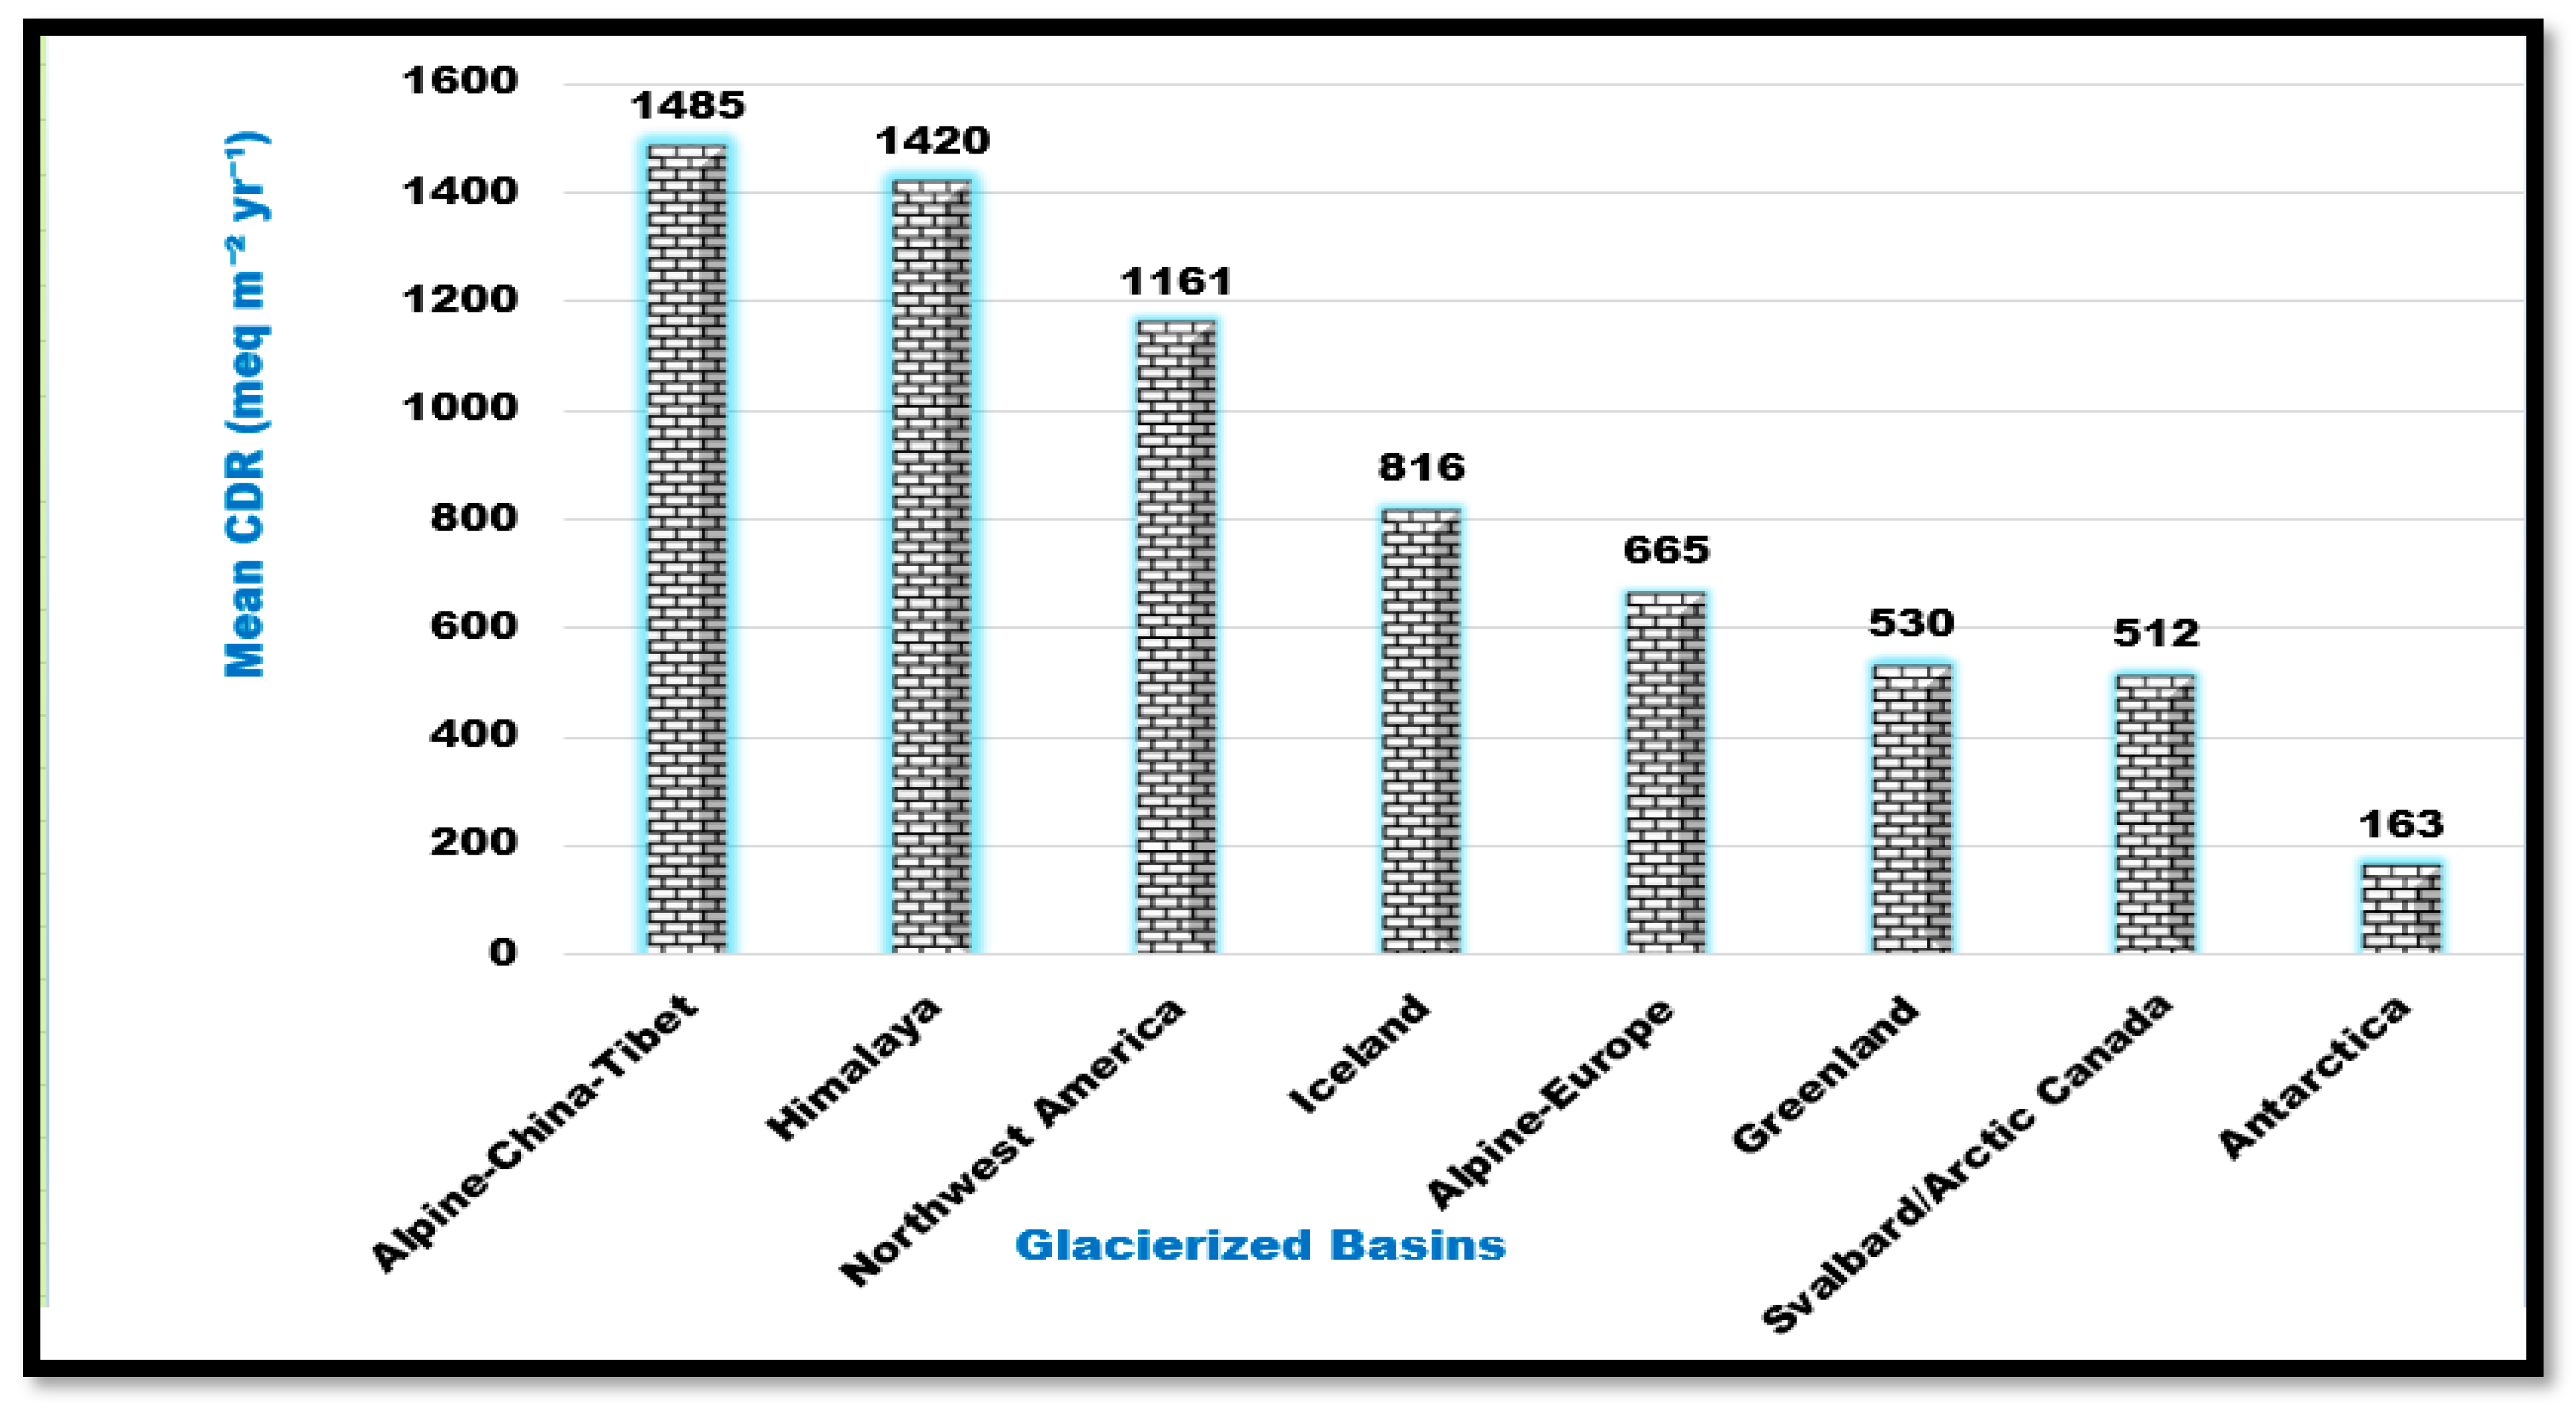
Northwest America glaciers: CDR values range from 676 to 1650 meq m−2 yr−1, with a mean of 1161 meq m−2 yr−1 [11,21,22,23]. Svalbard/Arctic Canada glaciers: CDR ranges from 94 to 790 meq m−2 yr−1, with a mean of 512 meq m−2 yr−1 [7,11,12,15,16,24,25]. Icelandic glaciers: CDR ranges from 630 to 1100 meq m−2 yr−1, with a mean of 816 meq m−2 yr−1 [26]. Greenlandic glaciers: CDR values range from 46 to 860 meq m−2 yr−1, with a mean of 530 meq m−2 yr−1 [27,28]. Alpine glaciers in Europe: CDR ranges from 478 to 1010 meq m−2 yr−1, with a mean of 665 meq m−2 yr−1 [29,30,31,32]. Alpine glaciers in China-Tibet: Three studies report CDR values ranging from 189 to 3108 meq m−2 yr−1, with a mean of 1485 meq m−2 yr−1 [14,33,34]. Himalayan glaciers: CDR values range from 462 to 4160 meq m−2 yr−1, with a mean of 1420 meq m−2 yr−1 [10,18,35,36,37,38]. Antarctic glaciers: Only one reported CDR value exists, 163 meq m−2 yr−1, from Tuva Glacier [12].
Low-elevation sites in Nepal Himalaya, such as Trishuli at Betrawati (640 m asl) and Narayani at Narayanghat (169 m asl), report much higher CDR values (1639 to 4032 meq m−2 yr−1) as documented by Bhatt et al. 2018 [10]. These values are excluded from statistical analysis because discharge was measured far from the glacier region. However, these data are included in Table 1 for the stake of completeness as the water originates from glacier meltwater. The CDR at low-elevation sites is significantly higher than that at high elevations (4032 vs. 746 meq m−2 yr−1) [10,18].
Global Average CDR: A global average CDR of 390 meq m−2 yr−1 is included for reference [39].
Table 1.
Compilation of cationic denudation rates (CDR) of glacierized basins of the world.
2.2. Descriptive Statistics of Global Glaciers for CDR
The summary of descriptive statistics of CDR across glaciers in different regions worldwide is presented in Table 2. Key statistics include the sample size (n), mean CDR, standard deviation (SD), 95% confidence intervals (CI) for the mean (Lower B, Upper B), and the observed minimum and maximum CDR values for each region. The data reveals considerable regional variability, with Himalayan glaciers exhibiting the highest mean CDR and Svalbard/Arctic Canada glaciers the lowest. The overall glacier mean CDR is 835 meq m−2 yr−1 with a wide range of values across all glaciers.
Table 2.
Regional estimations of CDR (in meq m−2 yr−1).
2.2.1. ANOVA Test for H01: Equality of Average CDR Across Seven Global Glacierized Regions
An ANOVA was conducted to test the null hypothesis (H01) that the average CDRs are equal across the six glacierized basins. The test yielded Fisher’s F-statistic of 2.305 with degrees of freedom (df) of 6 and 41, and a p-value of 0.052. This result indicates that H01 cannot be rejected, confirming that the average CDRs do not significantly differ among the seven basins. Note that Antarctica was excluded from the analysis as it only has a single data point.
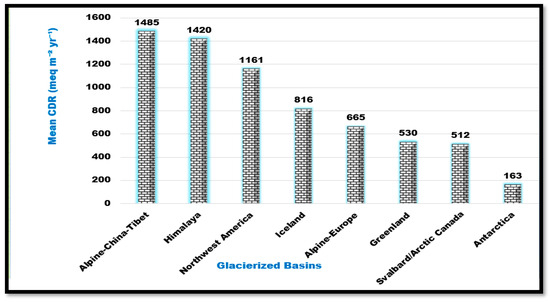
The mean regional CDRs of glacierized regions arranged in decreasing order of magnitude are shown as in Figure 1.
Figure 1.
Mean regional cationic denudation rates (CDR) ordered by magnitude.
2.2.2. Trends in Cationic Denudation Rate
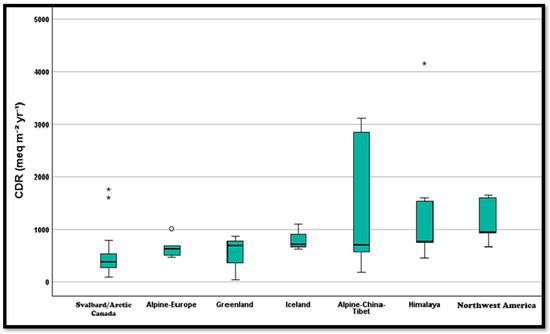
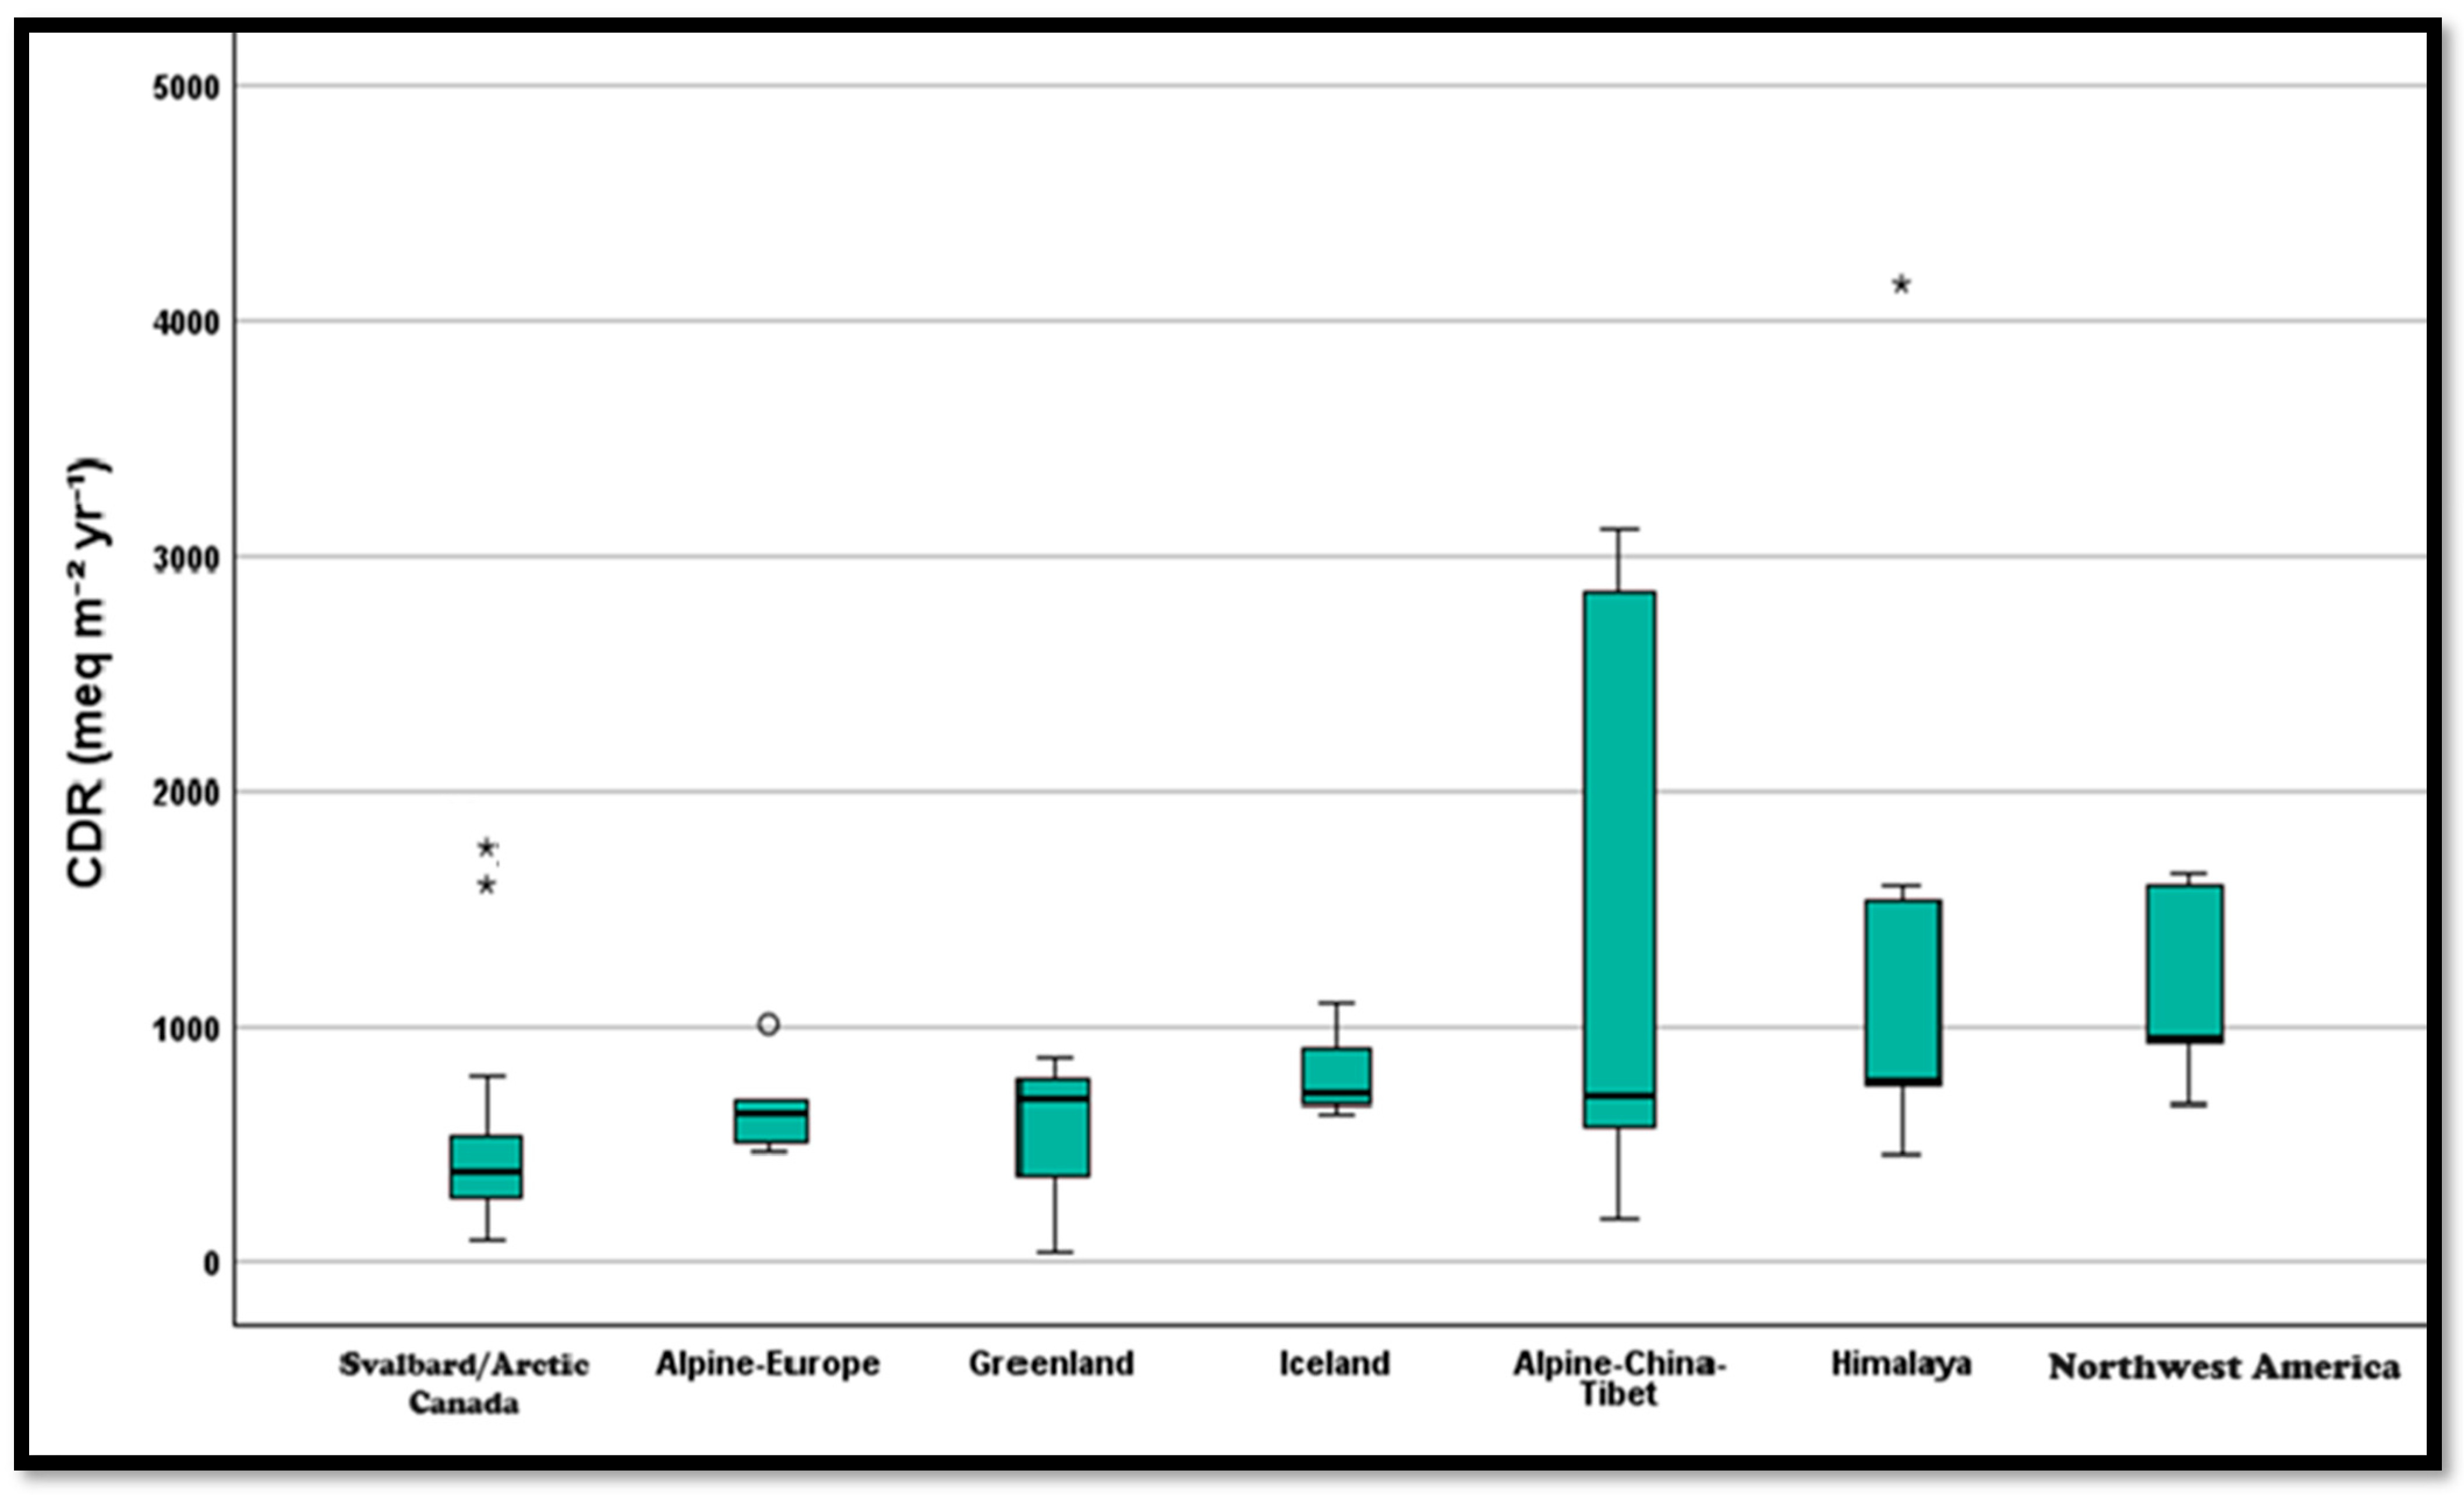
Figure 2 shows the strong regional variations in CDR among the different glacierized regions. Northwest America glaciers display the highest median CDR with a relatively narrower range and no visible outliers, implying more consistency in CDR values. The Himalayan basin exhibits the 2nd highest median CDR, with a wider range and a notable outlier, indicating substantial variability in its cationic denudation rates. The Alpine-China-Tibet basin shows a markedly higher CDR median, with an extremely wide range, suggesting substantial variability in its cationic denudation rates. Iceland basins have moderate CDR median value within a compact range, reflecting more uniform rates. Greenland glaciers present a narrow CDR range, indicating highly uniform rates, with their median positioned among the lower values. The Alpine-Europe glaciers show slightly lower variability, with a median and range comparable to those of the Iceland glaciers. The Svalbard/Arctic Canada glaciers exhibit the lowest median CDR, with minimal variability but two outliers observed. This plot underscores the considerable regional differences in CDR, with the Northwest America and Svalbard/Arctic Canada basins representing the extremes of the spectrum.
Figure 2.
Box plot of CDRs of the glacierized basins. NB: O = Outlier, * = Extreme outlier.
2.3. Descriptive Statistics of Discharge for Glaciers
Discharge of glacier basins refers to the bulk volume of water released from glaciers, typically measured over a specified area and time. It represents the contribution of glacier meltwater to rivers, lakes, fjords, or oceans, and is an important component of the hydrological cycle. The unit, m yr−1, indicates the average depth of water, measured in meters, which is exported from the glacier per year, normalized over the basin’s area.
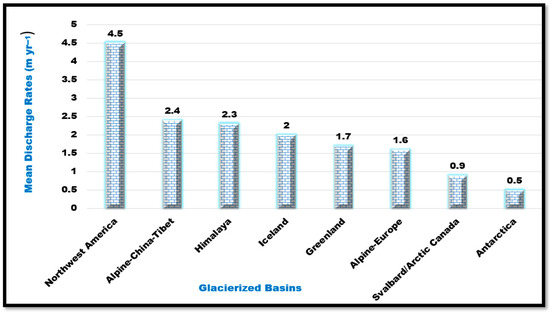
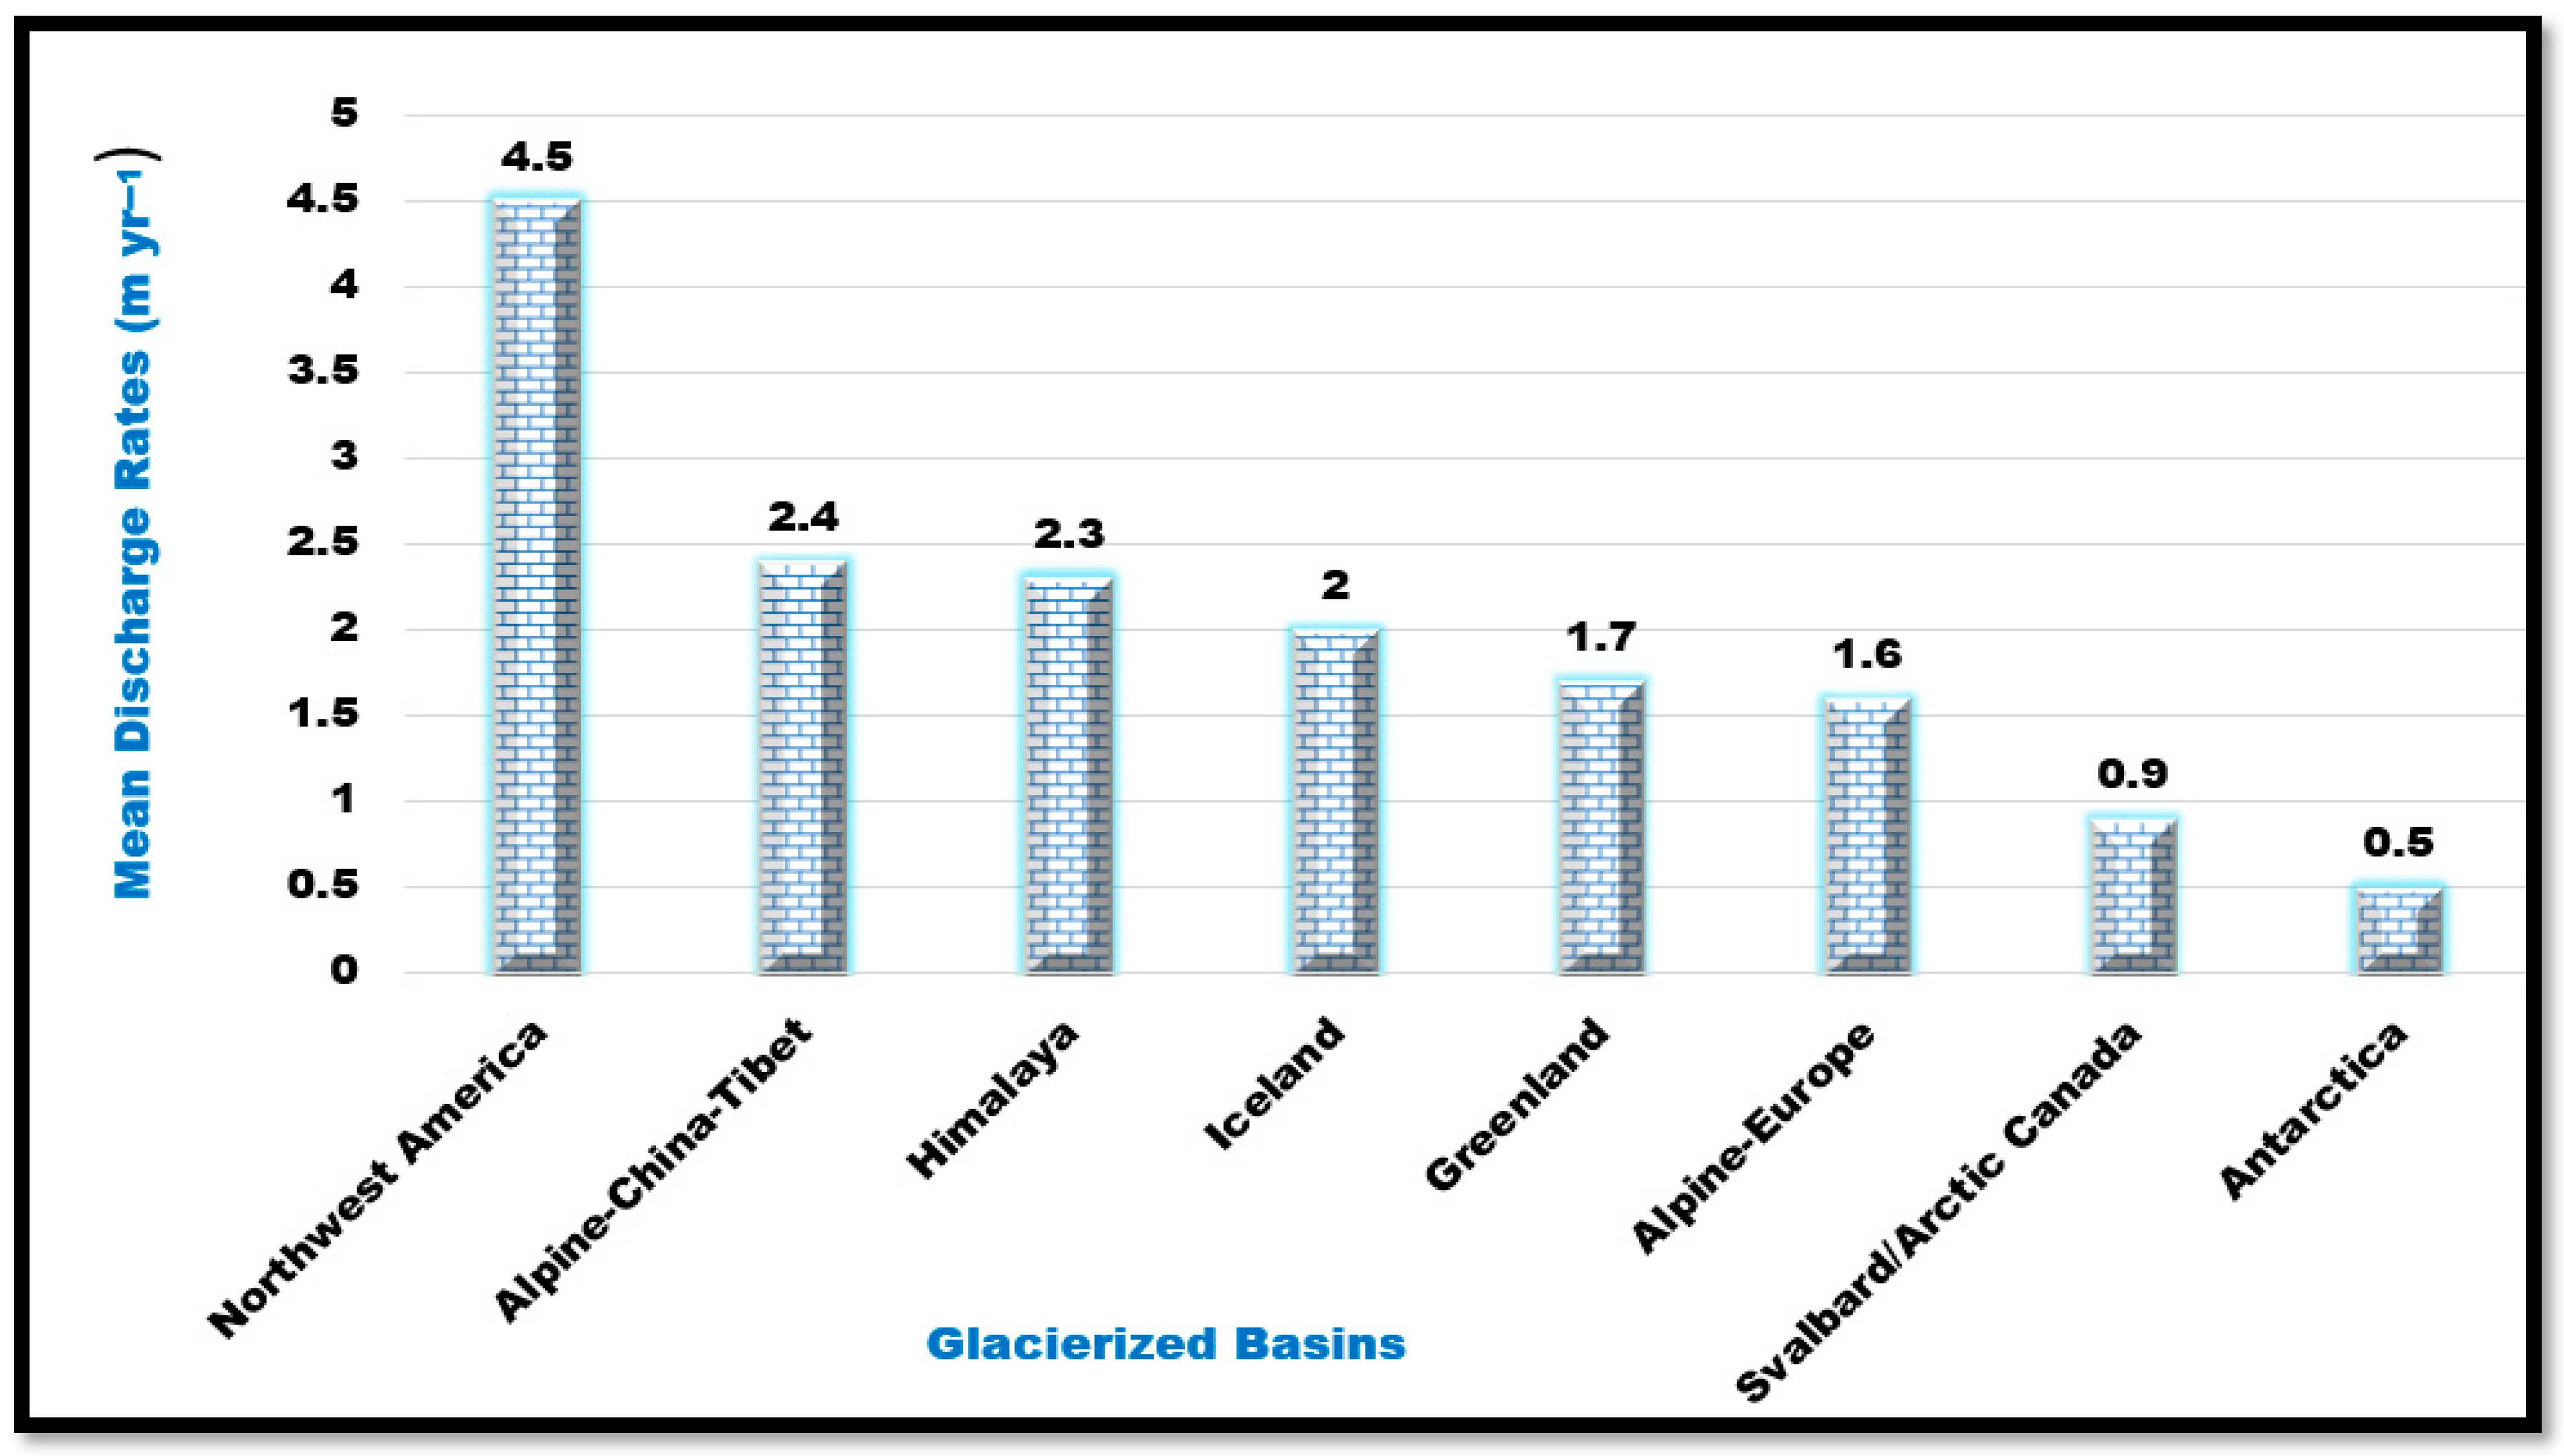
Table 3 presents summary statistics and 95% confidence intervals for the average discharge rates (m yr−1) across global glacierized basins. Northwest American glaciers exhibit the highest mean discharge (4.45 m yr−1) with a broad range (3.28–7.68 m yr−1). Svalbard/Arctic Canada glaciers have the lowest mean (0.92 m yr−1) among multi-sample regions, with relatively low variability. Iceland, Greenland, Alpine-Europe, Alpine-China-Tibet, and the Himalaya show moderate discharge means ranging from 1.59 to 2.41 m yr−1, though Greenland and Himalaya display higher variability. The newly included Alpine-China-Tibet region has a mean of 2.41 m yr−1, with a wide confidence interval (0.04–4.78). Antarctica, represented by a single observation, shows the lowest discharge (0.53 m yr−1). Overall, the global mean discharge is 1.80 m yr−1, spanning from 0.30 to 7.68 m yr−1.
Table 3.
Estimations of global glaciers for discharge rates (m yr−1).
2.3.1. ANOVA Test for H02: Equality of Average Discharge or Runoff Across Seven Global Glacierized Regions
An ANOVA was conducted to test the null hypothesis (H02) that the average discharges are equal across the six glacierized basins. The test yielded Fisher’s F-statistic of 5.955 with degrees of freedom (df) of 6 and 41, and a p-value < 0.001. This result indicates that H02 can be rejected, confirming that the average discharge significantly differs among the seven basins. Note that Antarctica was excluded from the analysis as it only has a single data point.
Bonferroni post hoc test results: After rejecting the null hypothesis (H02) that the average discharge rates are equal across the six regions, we performed a Bonferroni post hoc test to identify specific pairs of regions with significantly different average discharge values. The Bonferroni post hoc test results in Table 4 reveal significant differences in mean discharge values (m yr−1) between several regions.
Table 4.
The results of the Bonferroni post hoc test for H02. The asterisk (*) indicates significant difference in the means.
Table 4 summarizes the results of Bonferroni-adjusted pairwise comparisons of average discharge rates among glacierized regions. The only statistically significant difference (p-value < 0.05) is observed between glaciers in Northwest America and Alpine-Europe, with Northwest America showing a significantly higher mean discharge (mean difference = 2.86 m yr−1, p-value = 0.015). Although Northwest American glaciers also have higher mean specific discharges compared to other regions, these differences are not statistically significant after adjustment. No other pairwise comparisons yielded significant differences, suggesting a substantial overlap in average discharge rates among the remaining regions.
Mean discharge from glacierized basins decreases in magnitude, with Northwest America has the highest whereas Antarctica has the lowest discharge (Figure 3).
Figure 3.
Regional mean discharges of glaciers ordered by magnitude.
2.3.2. Variations in Discharge of Glaciers
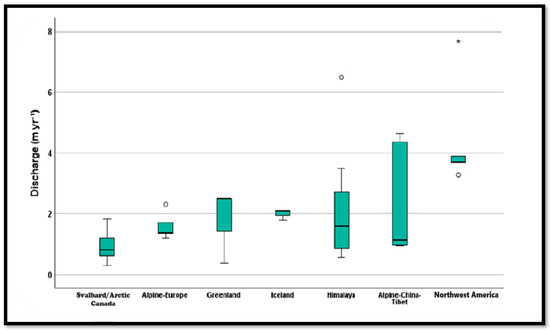
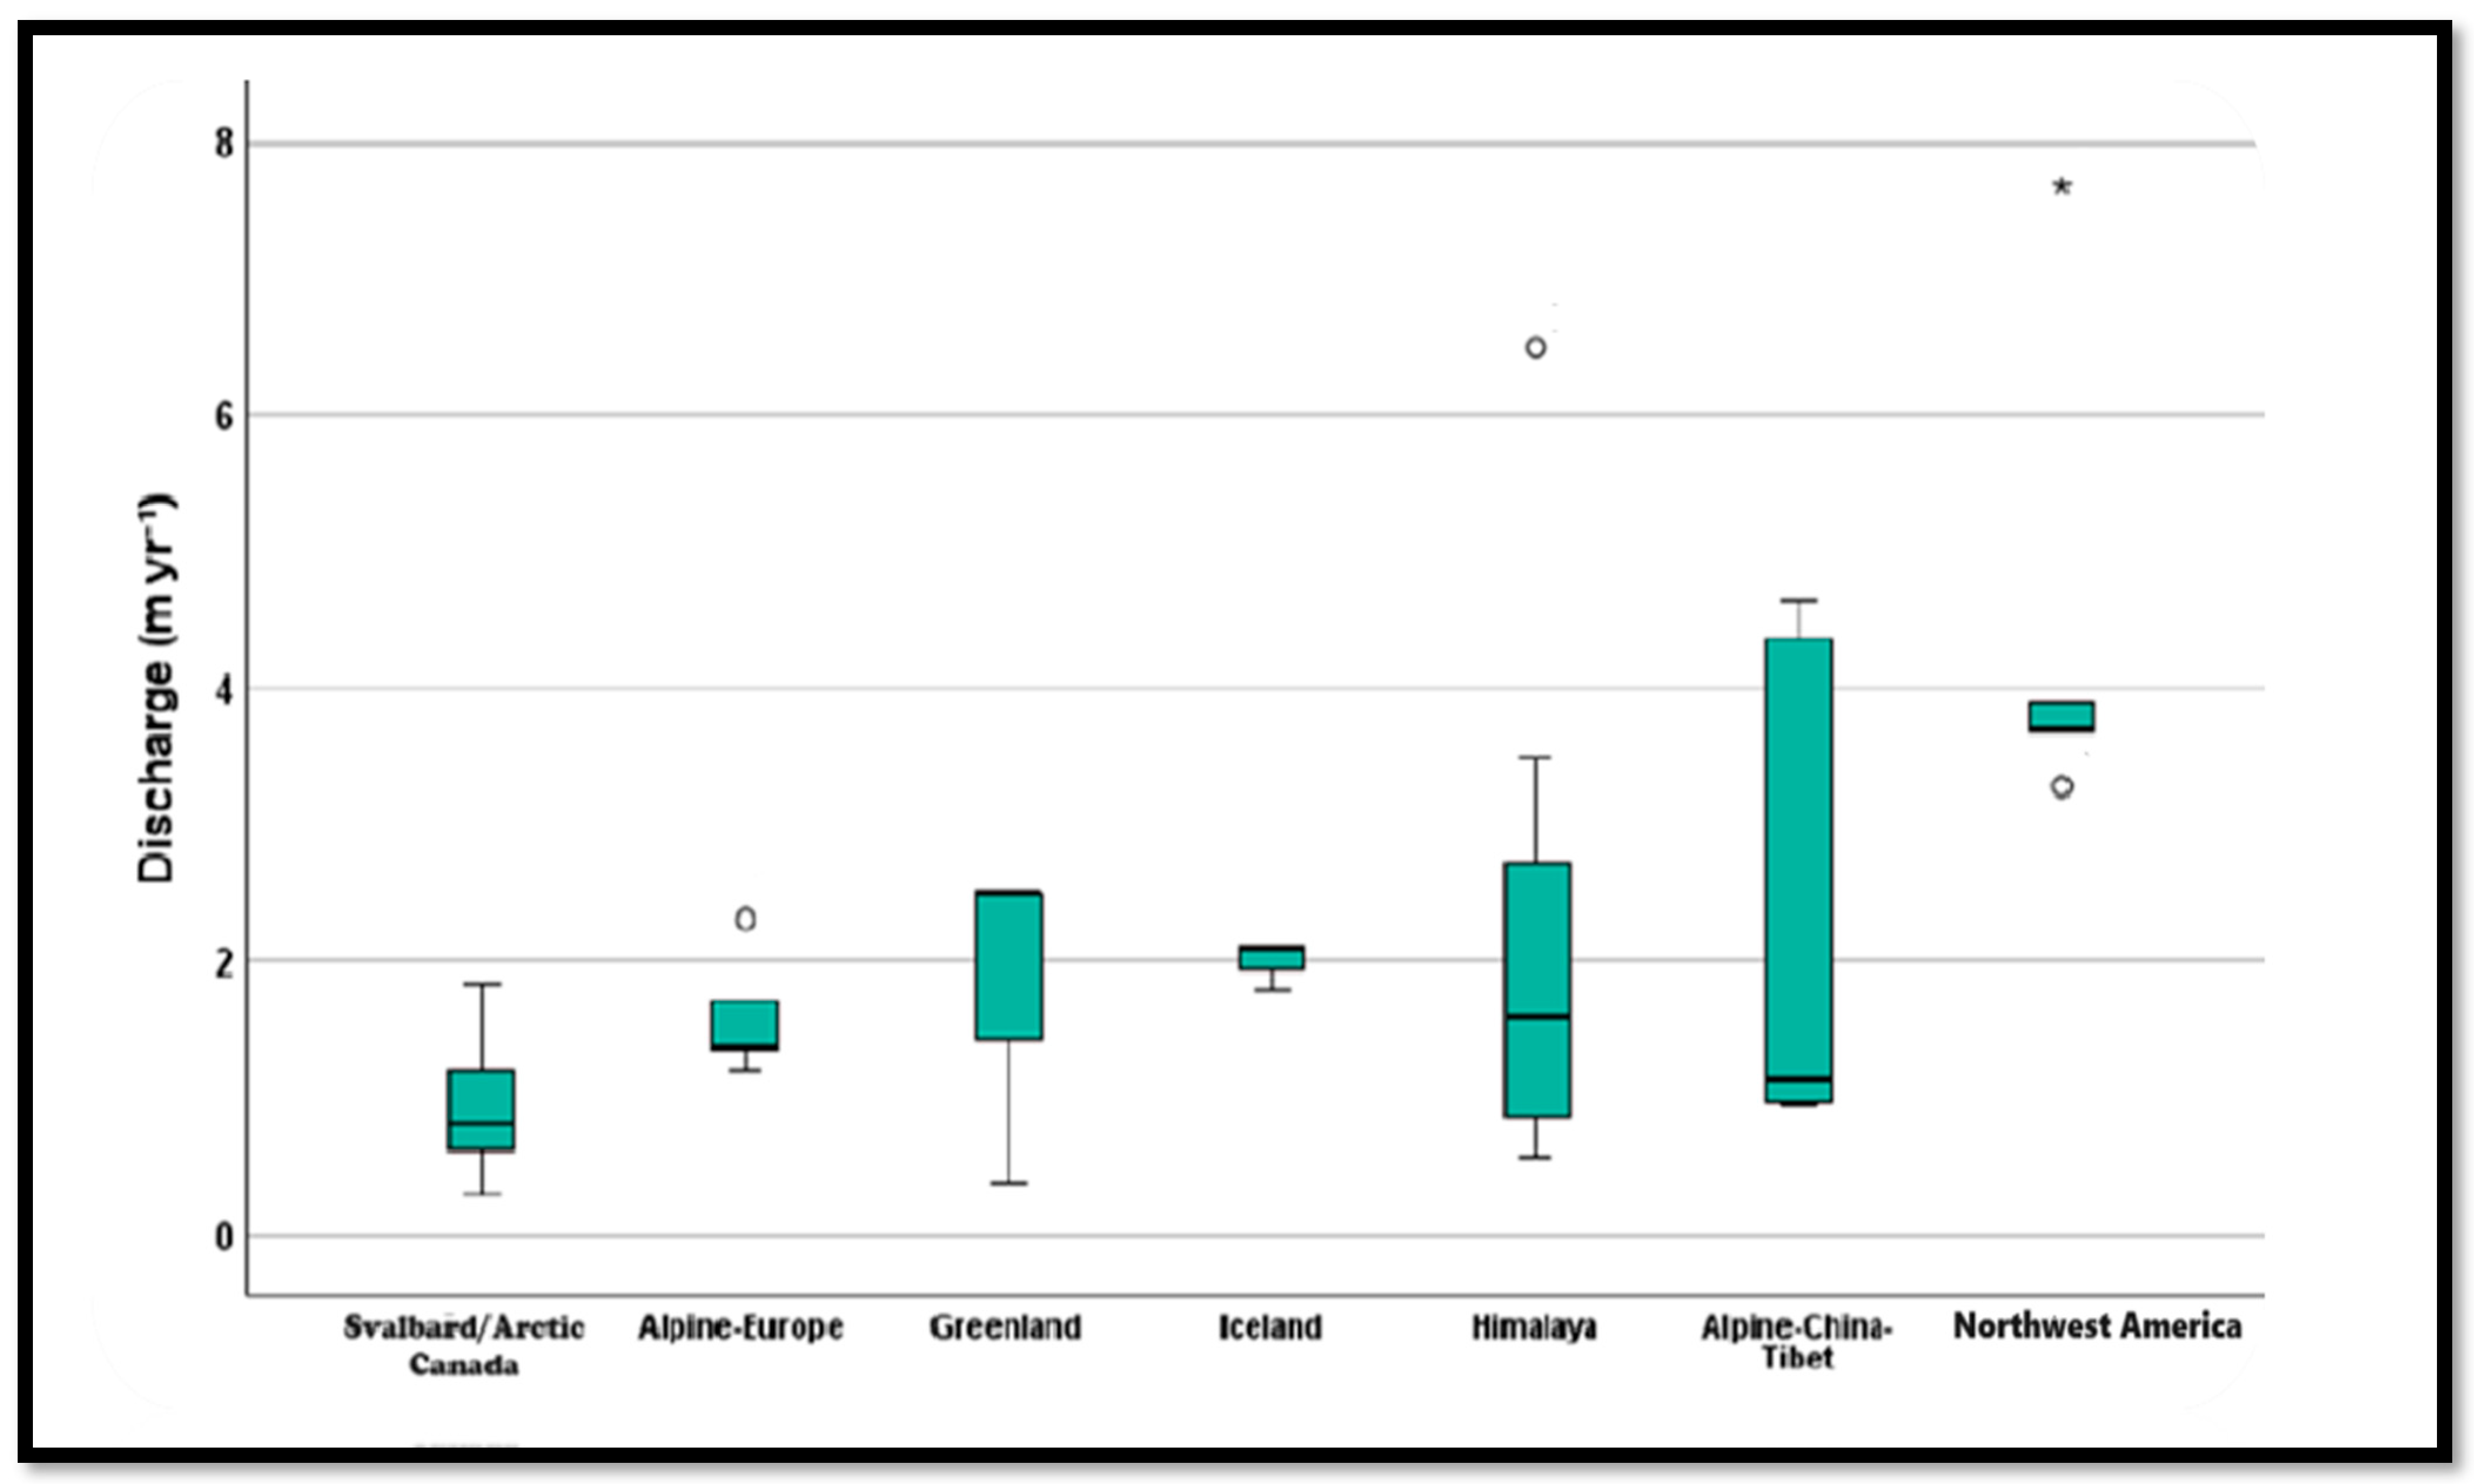
Figure 4 illustrates the variation in discharge rates across glacierized regions globally. Northwest American glaciers display the highest median discharge and the smallest range of variability among all glacier basins. Outliers are evident, with one extreme value significantly above the upper whisker, highlighting a potential anomaly or unique glacier behavior. Alpine-China-Tibet glaciers stand out with the highest variability—evidenced by a wide interquartile range (IQR). Himalayan glaciers show moderate discharge with notable variability and a wide IQR, indicating diverse meltwater contributions across this region. The upper whisker extends substantially, capturing a wider spread of discharge values.
Figure 4.
Box plots of global glaciers for discharge rates. NB: O = Outlier, * = Extreme outlier.
Icelandic glaciers demonstrate the most consistent discharge rates, with both a narrow IQR and minimal deviation from the median. Greenlandic glaciers display moderately higher discharge levels with greater spread and a lower whisker extending close to zero, suggesting substantial variability across the region. Alpine-European glaciers also show low median discharge with limited variability, aside from one mild outlier. Finally, Svalbard/Arctic Canada glaciers exhibit low median discharge with a compact IQR, indicating consistent and low variability. Overall, the figure highlights regional contrasts in glacier melt behavior, with Icelandic and Svalbard/Arctic Canada glaciers exhibiting the most stable discharge, while Alpine-China-Tibet and Himalayan glaciers show considerable variability. The presence of outliers in Northwest America, Himalayan, and Alpine-Europe regions suggest potential localized factors affecting melt intensity, meriting further investigation.
2.4. Descriptive Statistics of Chemical Weathering Intensity (CWI)
We present the Chemical Weathering Intensity (CWI) = CDR/Specific Discharge from global glaciers in Table 5. The CWI of glacier basins refers to the amount of chemical weathering products (such as ions released from mineral dissolution) exported per unit volume of meltwater. It quantifies the intensity of chemical weathering relative to water flux, offering insights into geochemical processes occurring within glacial environments. The unit, meq m−3, indicates the concentration of weathering-derived solutes in meltwater per unit volume.
Table 5.
Estimations of global glaciers for CWI (meq m−3).
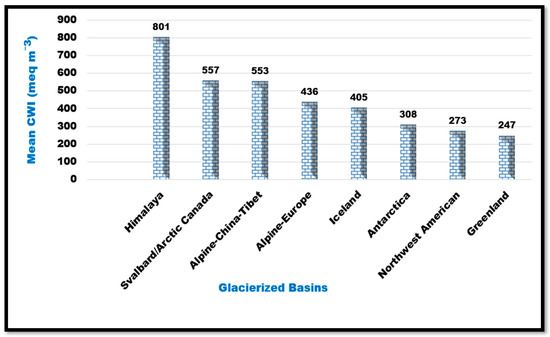
Table 5 summarizes the CWI across glacierized regions of the world, highlighting substantial geographic variability in mean values and dispersion. Among the 50 CWI values from 40 glaciers analyzed, the Himalaya exhibits the highest mean CWI (801 meq m−3), with wide variability (SD = 419), reflecting diverse hydrochemical and climatic conditions within the region. In contrast, Northwest America and Greenlandic glaciers show comparatively lower mean intensities (273 and 247 meq m−3, respectively), with narrower confidence intervals, suggesting more consistent geochemical regimes. The Svalbard/Arctic Canada and Alpine-China-Tibet glaciers display relatively high means (557 and 553 meq m−3, respectively) with moderate to high variability, while Iceland and Alpine-Europe fall within mid-range values. Notably, the data from Antarctica is limited to a single observation, precluding statistical inference. Overall, the global mean CWI across all sampled glaciers is 517 meq m−3, with a 95% confidence interval ranging from 435 to 599 meq m−3. These findings underscore the complex interplay of climatic, lithological, and hydrological factors that influence chemical weathering processes across glacierized environments.
2.4.1. ANOVA Test for H03: Equality of Average CWI Across Regions
An ANOVA was conducted to test the null hypothesis (H03) that the average CWI are equal across the seven regions. The test yielded Fisher’s F-statistic of 3.051 with degrees of freedom (df) of 6 and 41 and a p-value of 0.015. This result indicates that H03 can be rejected, confirming that the average CWI significantly differs among the seven basins. Note that Antarctica was excluded from the analysis as it only has a single data point.
Multiple Comparisons: Bonferroni Post Hoc Test Results: After rejecting the null hypothesis (H03) that the average CWI rates are equal across the seven glacierized basins, we performed a Bonferroni post hoc test to identify specific pairs of basins with significantly different average CWI values. The Bonferroni post hoc test results in Table 6 reveal significant differences in mean CWI values (meq m−3) between several glacier basin pairs. Specifically:
Table 6.
The results of the Bonferroni post hoc test results for H03.
Table 6 presents the results of Bonferroni post hoc comparisons of mean CWI among glacier regions. While most pairwise differences are not statistically significant (p-value > 0.05), a significant difference is observed between the Himalaya and Northwest American glaciers (mean difference = 527 meq m−3, p-value = 0.021), indicating substantially higher weathering intensity in the Himalaya. All other regional comparisons yielded non-significant results, suggesting that, despite observable differences in means, variability within regions limits the detection of statistically significant differences across most pairs. When mean CWI of glacierized basins are arranged in decreasing order of magnitude, the Himalaya shows the highest mean CWI of 801 meq m−3, while the Greenland exhibits the lowest, with a mean CWI of 247 meq m−3 (Figure 5).
Figure 5.
Regional mean CWI ordered by magnitude.
2.4.2. Variations in CWI
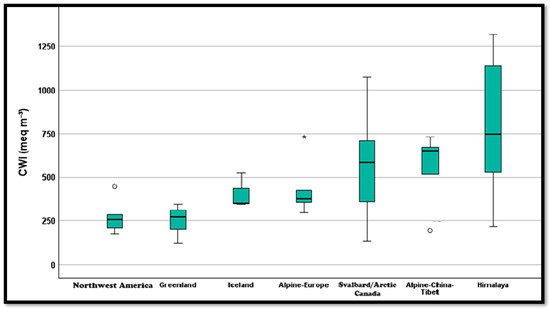
Figure 6 illustrates the distribution of CWI across seven glacierized regions. The Himalaya region exhibits the highest median CWI and the widest range, indicating both intense and variable chemical weathering activity. In contrast, Greenland shows the lowest median CWI values (247 meq m−3) (Figure 5). The Svalbard/Arctic Canada and Alpine-China-Tibet regions display moderate to high median values, but the Svalbard/Arctic Canada shows the greatest spread and variability, as evidenced by its wide box and extended whiskers. Outliers are present in several regions, including the Northwest America, Alpine-Europe, and Alpine-China-Tibet, highlighting localized deviations from regional trends. Overall, the plot reveals significant regional variability in CWI, with the Himalaya standing out as a hotspot of intense chemical weathering among the regions.
Figure 6.
Box plots of regional CWI. NB: O = Outlier, * = Extreme outlier.
3. Predictive Modeling of CDR over Glacier Specific Discharge
To analyze the relationship between CDR and glacier specific discharge, we tested the null hypothesis H04: There is no regression relationship between CDR and glacier specific discharge.
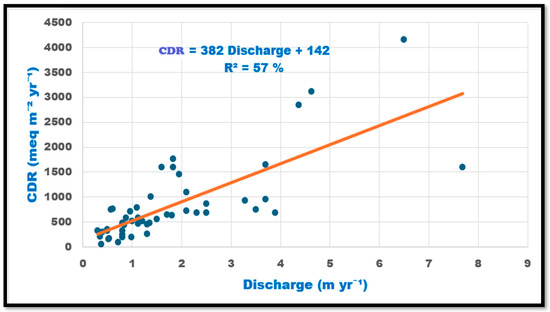
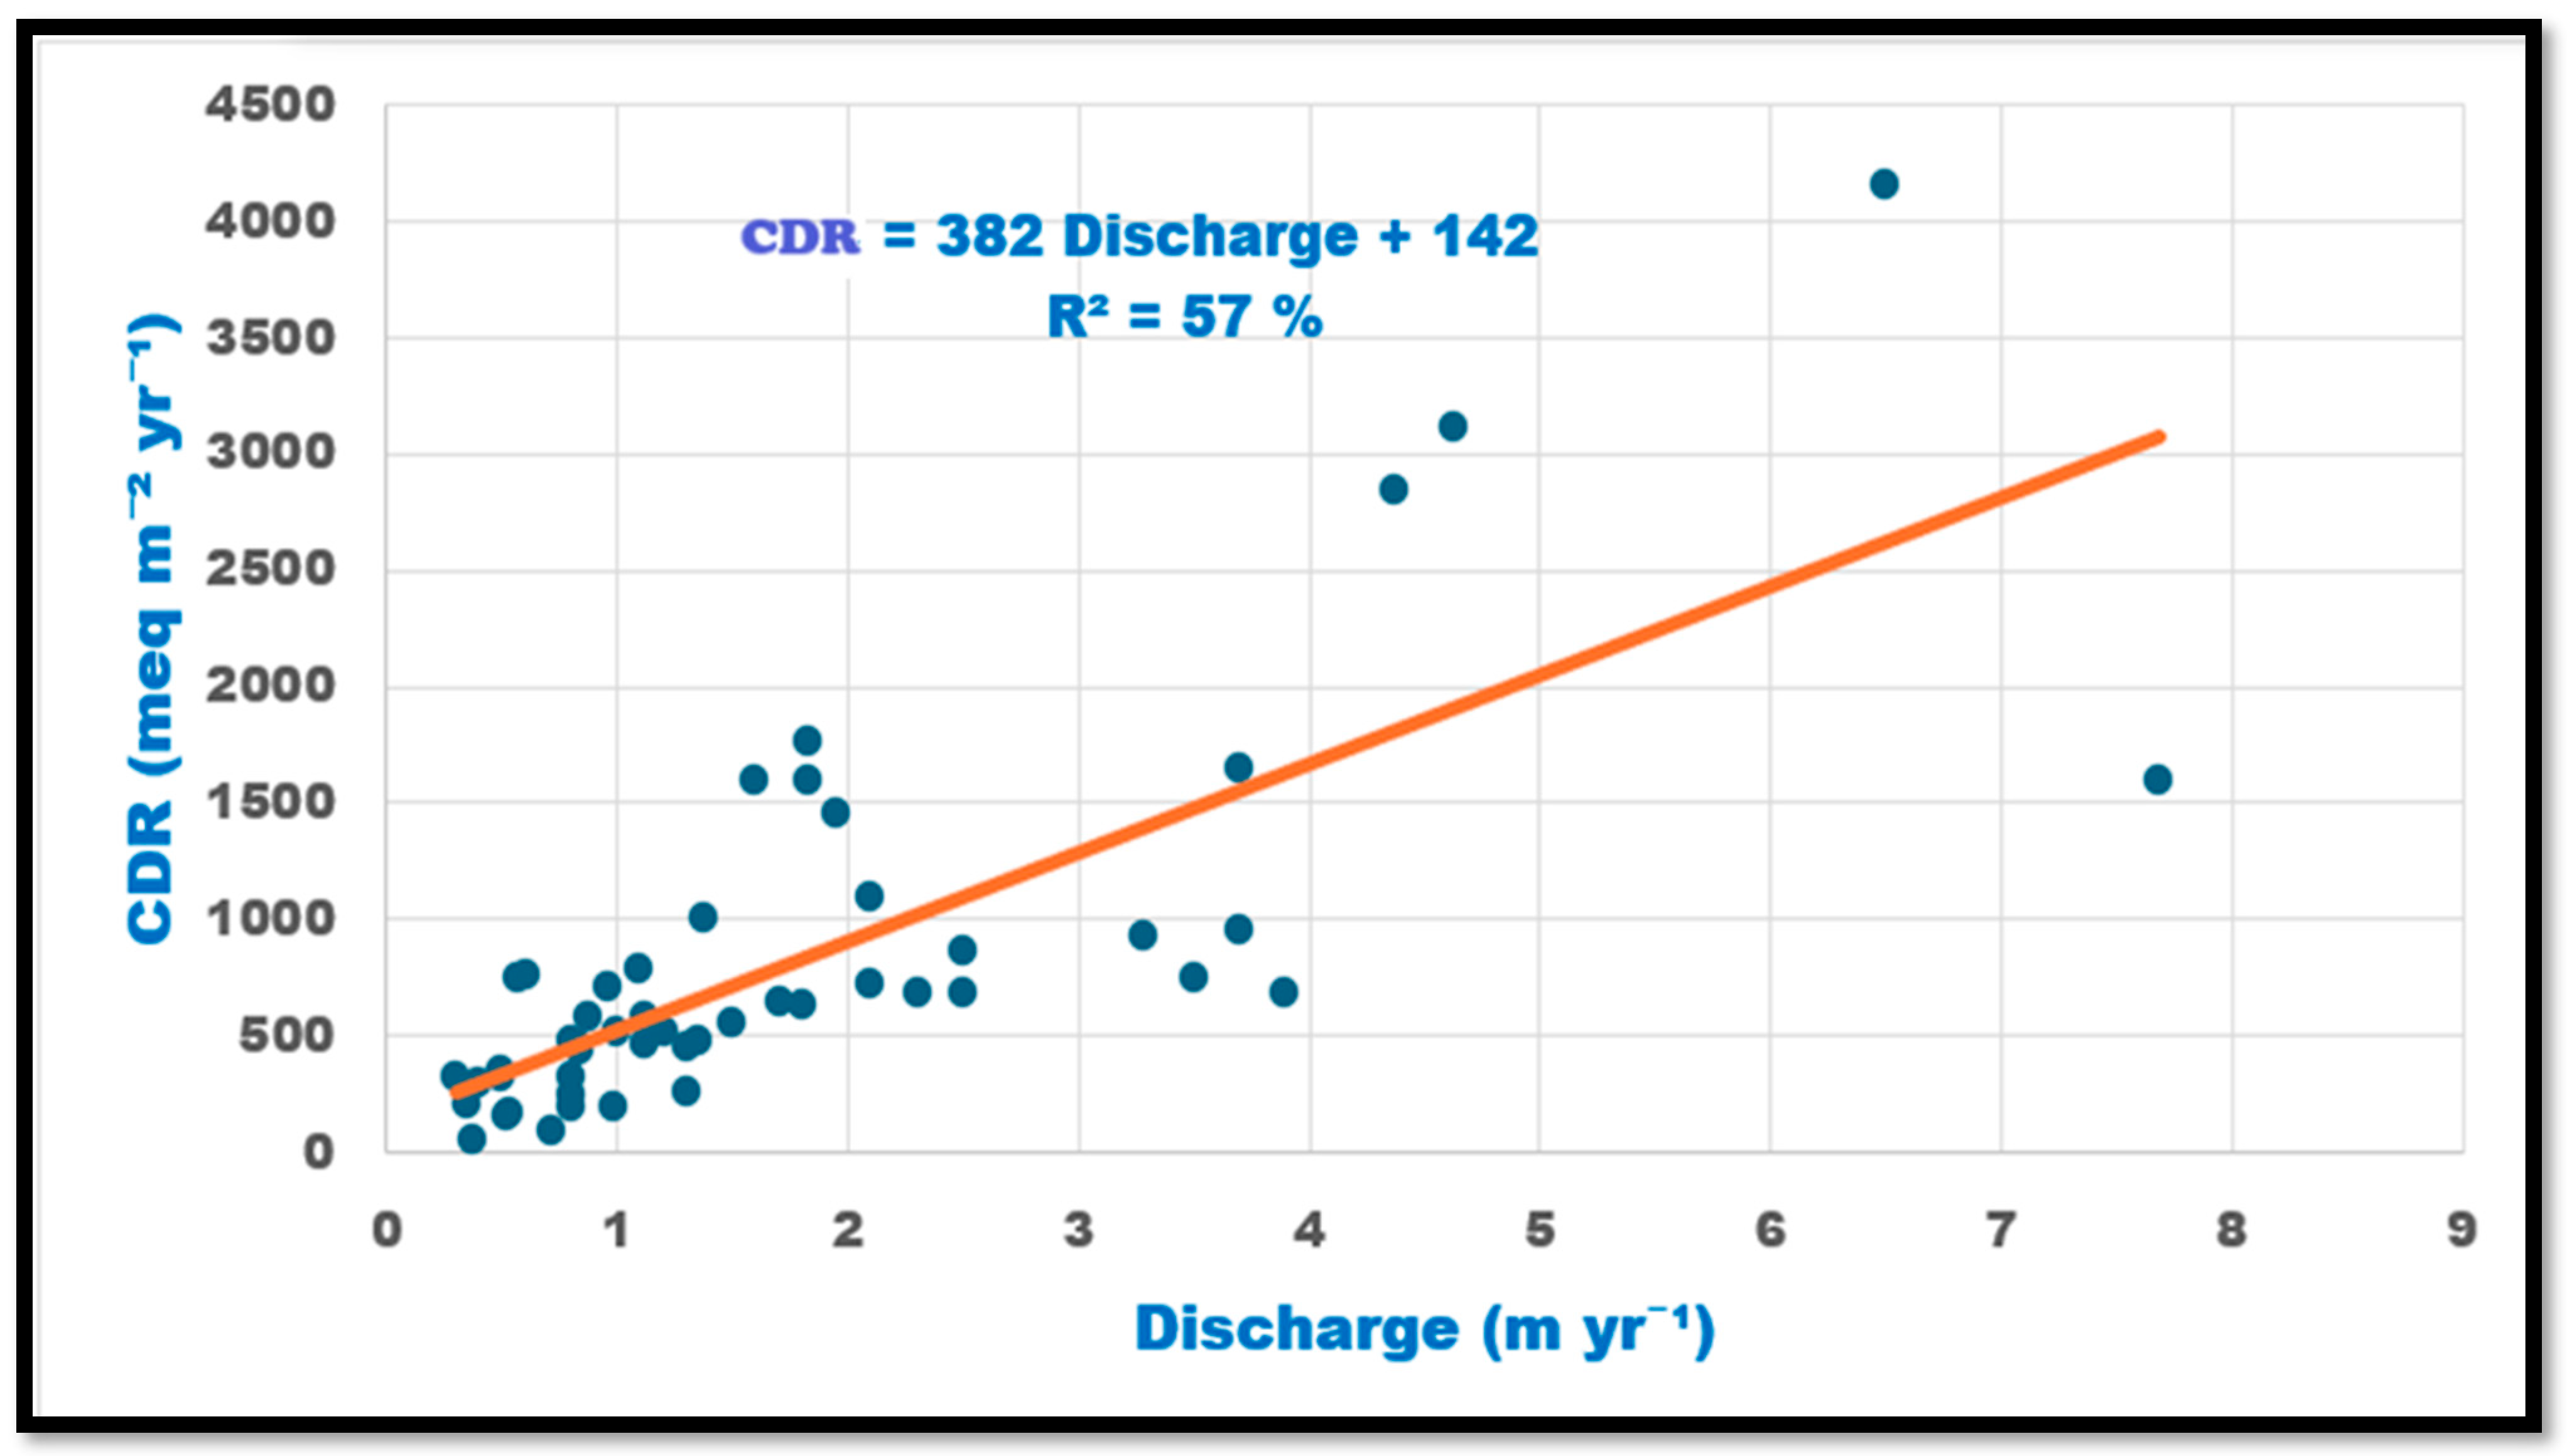
Statistical Analysis: The ANOVA results revealed a significant regression model, with Fisher’s statistic F = 21.5, degrees of freedom (1, 42), and p-value < 0.001. This led to the rejection of H04, confirming that CDR is significantly associated with glacier specific discharge. Despite the statistical significance, the model’s R2 value was only 57%, indicating that a substantial 43% of the variation in CDR remains unexplained by specific discharge. This limitation reduces the model’s predictive utility. Regression coefficient of 382 suggests that for every 1 m yr−1 increase in discharge, the CDR increases by 382 meq m−2 yr−1 (Figure 7). A separate regression analysis was conducted for each region. However, the results were almost consistent across all regions, indicating a similar relationship between CDR and specific discharge regardless of location. This analysis highlights a significant but modest predictive relationship, warranting further investigation into additional factors influencing CDR variability.
Figure 7.
The relationship between CDR and glacier specific discharge.
4. Summary of Research Findings
This study investigated the variations and interrelationships among three key variables associated with global glaciers: CDR, specific discharge, and the predictive modeling of CDR based on discharge. Through statistical analyses, including descriptive statistics, comparative tests, and regression modeling, the research provided valuable insights into the dynamics of regional glacial weathering systems. The findings are summarized below, categorized by each type of analysis.
4.1. Variations in CDR
The analysis of the sparsely available CDR across global glacierized basins revealed significant variability in chemical weathering rates on a regional scale. Himalayan glaciers exhibited the highest mean CDR values, indicating a potentially greater contribution to chemical denudation processes in this region (Figure 2). In contrast, Svalbard/Arctic Canada and Antarctic glaciers showed markedly lower CDR values, suggesting limited chemical weathering activity in these colder regions. Statistical tests confirmed significant differences in CDR values among various glacier basins worldwide. The Bonferroni post hoc test identified notable contrasts, particularly between Himalayan and Northwest American glaciers and those in the Svalbard/Arctic Canada, Iceland, and Alpine regions. These findings highlight the diverse environmental and climatic conditions influencing CDR across global glaciers. Overall, the variations in CDR suggest that region-specific factors such as climatic conditions (primarily temperature and precipitation) and discharge, glacier dynamics, and the geochemical characteristics of the underlying bedrock play critical roles in determining chemical weathering regime.
4.2. Variations in Glacier Discharge
Discharge displayed significant variations across glacier basins. Northwest American glaciers exhibited the highest discharge rates, while Svalbard/Arctic Canada glaciers had the lowest. Other regions, including Alpine, Iceland, and Himalayan glaciers, showed moderate discharge values. These variations underscore the diverse contributions of glacier meltwater, shaped by factors such as temperature, precipitation, and glacier size. Boxplot analysis revealed substantial variability within certain basins, such as Greenland, where discharge values spanned a wide range (Figure 4). Conversely, basins like the Iceland glaciers demonstrated relatively narrow discharge ranges, indicating more uniform meltwater behavior. Statistical tests further validated significant differences in discharge between Northwest American glaciers and other basins, reflecting trends observed in CDR values.
4.3. Predictive Modeling of CDR Based on Specific Discharge
To investigate the relationship between CDR and specific discharge, a regression analysis was conducted. The null hypothesis (H02): There is no regression relationship between CDR and specific discharge was tested using ANOVA. The results indicated a statistically significant relationship and consequently, the null hypothesis was rejected, confirming that specific discharge plays a role in predicting CDR. However, the regression model explained only 57% of the variability in CDR, leaving a substantial portion unexplained.
While specific discharge is a significant predictor of CDR, additional factors such as temperature, bedrock composition, and hydrological processes likely contribute to the unexplained variance. The regression coefficient of 382 suggests that for every 1 m yr−1 increase in discharge, the CDR increases by 382 meq m−2 yr−1, reinforcing the positive association between these variables which supports the previous finding of Hodson et al. (2000) [7] in glacierized basins and other largest river basins of the world [10]. A separate regression analysis conducted for individual glacier basins yielded consistent results, indicating that the relationship between specific discharge and CDR is robust across different geographic regions. However, the low values for these basin-specific models highlight the need for further investigation into region-specific factors influencing CDR.
4.4. Integrating of Findings
The combined analysis of CDR, specific discharge, and their predictive relationship highlights a significant but modest association, warranting further investigation into additional factors such as glacier dynamics, climate, and lithology that may influence CDR variability. Significant regional variations in both CDR and discharge underscore the influence of local environmental and climatic conditions on glacier behavior. The observed correlation between discharge and CDR, while statistically significant, emphasizes the complexity of chemical weathering processes in glacier systems, as a large portion of the variability remains unexplained by discharge alone. These findings have important implications for understanding the role of glaciers in global biogeochemical cycles. High CDR in the Himalaya glaciers could be due to exposure of fresh reactive minerals surfaces due to intense tectonic activities in the region and high glacier retreat rate which enhances the downward movement of reaction front and hence accelerate the weathering rates. High CDR and discharge values in Northwest American glaciers, for example, suggest these systems may contribute disproportionately to chemical weathering rates and nutrient fluxes into downstream ecosystems. Conversely, the low values observed in Svalbard/Arctic Canada and Antarctic glaciers highlight the reduced weathering potential in polar regions. The Himalayan glacier shows the highest mean CWI among the documented glacier systems in the world suggesting high extent of chemical weathering.
In summary, this review and analysis of CDR in glacierized basins highlights the dynamic interplay between glacier discharge and chemical weathering processes. While the study provides valuable insights, it also points to the need for further research to uncover additional factors influencing CDR and to improve the predictive capabilities of regression models. By integrating discharge with other environmental variables, future studies can enhance our understanding of the complex mechanisms driving chemical denudation in glacier systems.
5. Future Research
Several avenues remain open for future exploration to deepen our understanding and address the limitations of the current study. Below are some key directions for future research.
5.1. Enhanced Data Collection and Granularity
To improve the robustness and applicability of predictive models, future research should focus on gathering more extensive and high-resolution datasets for both CDR and discharge. Despite glacial hydrochemistry research that has been conducted for several decades, available data on CDR is surprisingly sparse. A key issue is the logistics and funding involved in establishing hydrometric stations and maintaining long-term discharge measurement series in highly dynamic rivers close to glacier portals. Incorporating additional basins, particularly those currently underrepresented (e.g., glaciers from Antarctica, the Canadian High Arctic, Russian Arctic, central Asia, the south Alps of New Zealand, and South America), could yield a more comprehensive global perspective. Longitudinal data capturing seasonal and interannual variability in CDR and discharge would also enhance the precision of modeling efforts.
5.2. Integration of Climate and Geological Factors
While this study primarily examined the relationship between discharge and CDR, future research could incorporate climatic variables (e.g., temperature, precipitation, and glacier mass balance) and geological characteristics (e.g., rock type, sediment load) to explore their influence on chemical denudation. Including such factors could help explain the unexplained variance observed in the current predictive models and provide a more holistic understanding of the drivers of CDR in glacierized basins.
5.3. Basin-Specific Modeling
Although this study suggests that the relationship between discharge and CDR is relatively consistent across glacierized basins, future research could explore basin-specific characteristics that may enhance predictive models. Local environmental factors such as hydrology, anthropogenic impacts, and nutrient fluxes could create unique patterns not fully captured by a generalized model. Developing regionally tailored models could offer more precise insights for specific basins.
5.4. Impacts of Climate Change
The ongoing effects of climate change on glaciers and hydrological systems represent a critical area for future exploration. Researchers could investigate how changing glacier size and melt rates influence both discharge and CDR over time. Modeling future scenarios under different climate trajectories would provide valuable insights for anticipating and mitigating the impacts of global warming on water quality and availability. The step of coupling among glacier discharge modelling, CDR and solute export is still missing.
5.5. Broader Environmental Impacts
Future studies could examine the downstream effects of CDR on ecosystems, such as nutrient cycling and aquatic biodiversity. Understanding how variations in CDR affect riverine and coastal ecosystems could have important implications for environmental management and conservation effort. Additionally, exploring the role of CDR in carbon sequestration and its potential feedback loops within the global carbon cycle could contribute to broader climate research.
5.6. Comparative Studies
Finally, comparative studies between glacierized basins and non-glacierized regions could highlight the unique contributions of glaciers to global chemical denudation processes. Such comparisons would help contextualize the findings of this study within a broader environmental framework and elucidate the distinct roles glaciers play in Earth’s biogeochemical cycles.
In conclusion, while this research has provided a foundational understanding of the relationship between discharge and CDR in glacierized basins, these suggested avenues for future research can build upon this foundation to address existing gaps, enhance predictive models, and offer actionable insights for environmental management and climate adaptation strategies.
Author Contributions
M.P.B., Conceptualization, funding acquisition, coordination, writing—original draft, and writing—reviewing and editing; G.B.M., data analysis—statistical tests, model running, and writing—reviewing and editing; J.C.Y., methodology, resources, and writing—reviewing and editing. All authors have read and agreed to the published version of the manuscript.
Funding
M.P.B. acknowledges the research fellowship from the Cluster of Excellence ‘CliSAP’ (EXC177) at Klima Campus, University of Hamburg, funded by the German Science Foundation (DFG), and is supported in part by the Grant-in-Aid for Scientific Research (no. 06041051) from the Ministry of Education, Science, Sports and Culture, Japan for a separate project to carry out research in the Himalayas.
Data Availability Statement
The original contributions presented in this study are included in the article. Further inquiries can be directed to the corresponding author.
Acknowledgments
The authors would like to thank Tom Jäppinen and Mineko Yamamoto for their laboratory assistance and acknowledge Quinga Tamang, Mingma Tamang, Deepak Bhatt, Gyanendra Pant, Gyan Shrestha, Bibek Karki, Sushil Karki, Suraj Poudyal, and other field campaign members for their invaluable support during sampling in the Himalayas. We also thank the Department of Hydrology and Meteorology (DHM), Government of Nepal, for providing hydrology data. The authors are grateful to the editorial office for their proficient handling of the manuscript, and to the editors and anonymous reviewers for their valuable suggestions and insightful comments which significantly improved the paper.
Conflicts of Interest
The authors declare no conflicts of interest.
References
- Hodson, A.J.; Yde, J.C. The geochemistry of glacier meltwaters. In Treatise on Geomorphology, 2nd ed.; Elsevier: Amsterdam, The Netherlands, 2022; Volume 4, pp. 290–304. [Google Scholar]
- Dyurgerov, M.; Meier, M.F. Mass balance of mountain and sub-polar glaciers: A new global assessment for 1961–1990. Arct. Alp. Res. 1997, 29, 379–391. [Google Scholar] [CrossRef] [Scilit]
- Bolch, T.; Kulkarni, A.; Kaab, A.; Huggel, C.; Paul, F.; Cogley, J.G.; Frey, H.; Kargel, J.S.; Fujita, K.; Scheel, M.; et al. The state and fate of Himalayan glaciers. Science 2012, 336, 310–314. [Google Scholar] [CrossRef] [Scilit]
- Zemp, M.; Frey, H.; Gärtner-Roer, I.; Nussbaumer, S.U.; Hoelzle, M.; Paul, F.; Haeberli, W.; Denzinger, F.; Ahlstrøm, A.P.; Anderson, B.; et al. Historically unprecedented global glacier decline in early 21st century. J. Glaciol. 2015, 61, 745–761. [Google Scholar] [CrossRef] [Scilit]
- Bhatt, M.P.; Takeuchi, N.; Acevedo, M.F. Chemistry of supraglacial ponds in the debris covered area of Lirung Glacier in Central Nepal Himalayas. Aquat. Geochem. 2016, 22, 35–64. [Google Scholar] [CrossRef] [Scilit]
- Anderson, S.P.; Blum, J.; Brantley, S.L.; Chadwick, O.; Chorover, J.; Derry, L.A.; Drever, J.I.; Hering, J.G.; Kirchner, J.W.; Kump, L.R.; et al. Proposed initiative would study earth’s weathering engine. AGU Eos Trans. 2004, 85, 265–269. [Google Scholar] [CrossRef] [Scilit]
- Hodson, A.J.; Tranter, M.; Vatne, G. Contemporary rates of chemical denudation and atmospheric CO2 sequestration in glacier basins: An Arctic perspective. Earth Surf. Process. Landf. 2000, 25, 1447–1471. [Google Scholar] [CrossRef] [Scilit]
- McDowell, W.H.; Sanchez, C.G.; Asbury, C.E.; Ramos Perez, C.R. Influence of sea salt aerosols and long-range transport on precipitation chemistry at El Verde, Puerto Rico. Atmos. Environ. 1990, 24, 2813–2821. [Google Scholar] [CrossRef] [Scilit]
- Millot, R.; Gaillardet, J.; Dupre, B.; Allegre, C.J. The global control of silicate weathering rates and the coupling with physical erosion: New insights from rivers of the Canadian Shield. Earth Planet. Sci. Lett. 2002, 196, 83–98. [Google Scholar] [CrossRef] [Scilit]
- Bhatt, M.P.; Hartmann, J.; Acevedo, M.F. Seasonal variations of biogeochemical matter export along Langtang-Narayani River System in Central Nepal Himalaya. Geochem. Cosmochim. Acta 2018, 238, 208–234. [Google Scholar] [CrossRef] [Scilit]
- Anderson, S.; Drever, J.; Humphrey, N. Chemical weathering in glacial environments. Geology 1997, 25, 399–402. [Google Scholar] [CrossRef] [Scilit]
- Hodson, A.; Heaton, T.; Langford, H.; Newsham, K. Chemical weathering and solute export by meltwater in a maritime Antarctic glacier basin. Biogeochemistry 2010, 98, 9–27. [Google Scholar] [CrossRef] [Scilit]
- Krawczyk, W.E.; Lefauconnier, B.; Pettersson, L.-E. Chemical denudation rates in Bayelva catchment, Svalbard in the fall of 2000. Phys. Chem. Earth 2003, 28, 1261–1275. [Google Scholar] [CrossRef] [Scilit]
- Li, X.; Ding, Y.; Liu, Q.; Zhang, Y.; Han, T.; Jing, Z.; Li, Q.; Liu, S. Intense chemical weathering at glacial meltwater-dominated Hailuogou Basin in the Southeast Tibetan Plateau. Water 2019, 11, 1209. [Google Scholar] [CrossRef] [Scilit]
- Yde, J.C.; Riger-Kusk, M.; Christiansen, H.H.; Knudsen, N.T.; Humlum, O. Hydrochemical characteristics of bulk meltwater from an entire ablation season, Longyearbreen, Svalbard. J. Glaciol. 2008, 54, 259–272. [Google Scholar] [CrossRef] [Scilit]
- Stachnik, L.; Majchrowska, E.; Yde, J.C.; Nawrot, A.P.; Cichala-Kamrowska, K.; Ignatiuk Piechota, A. Chemical denudation and the role of sulfide oxidation at Werenskioldbreen, Svalbard. J. Hydrol. 2016, 538, 177–193. [Google Scholar] [CrossRef] [Scilit]
- Hasnain, S.I.; Thayyen, R. Controls on the major-ion chemistry of the Dokriani Glacier meltwaters, Ganga basin, Garhwal Himalaya, India. J. Glaciol. 1999, 45, 87–92. [Google Scholar] [CrossRef]
- Bhatt, M.P.; Masuzawa, T.; Yamamoto, M.; Sakai, A.; Fujita, K. Seasonal Changes in Dissolved Chemical Composition and Flux of Melt Water Draining from Lirung Glacier in the Nepal Himalayas; International Association of Hydrological Sciences: Seattle, WA, USA, 2000; Volume 264, pp. 277–288. [Google Scholar]
- Torres, M.A.; Baronas, J.J.; Clark, K.E.; Feakins, S.J.; West, A.J. Mixing as a driver of temporal variations in river chemistry: 1. Insights from conservative tracers in the Andes-Amazon transition. Water Resour. Res. 2017, 53, 3102–3119. [Google Scholar] [CrossRef] [Scilit]
- Li, X.; Wang, N.; Ding, Y.; Hawkings, J.R.; Yde, J.C.; Raiswell, R.; Liu, J.; Zhang, S.; Kang, S.; Wang, R.; et al. Globally elevated chemical weathering rates beneath glaciers. Nat. Commun. 2022, 13, 407. [Google Scholar] [CrossRef] [Scilit]
- Reynolds, R.C.; Johnson, N.M. Chemical weathering in the temperate glacial environment of the Northen Cascade Mountains. Geochim. Cosmochim. Acta 1972, 36, 537–554. [Google Scholar] [CrossRef] [Scilit]
- Eyles, N.; Sasseville, D.R.; Slatt, R.M.; Rogerson, R.J. Geochemical denudation rates and solute transport mechanisms. Can. J. Earth Sci. 1982, 19, 1570–1581. [Google Scholar] [CrossRef] [Scilit]
- Axtmann, E.; Stallard, R. Chemical weathering in the South Cascade Glacier basin, comparison of subglacial and extra-glacial weathering. In Proceedings of Biogeochemistry of Seasonally Snow-Covered Catchments; Tonnessen, K., William, M.W., Tranter, M., Eds.; IAHS: Boulder, CO, USA, 1995; Volume 228, pp. 431–439. [Google Scholar]
- Hodgkins, R.; Tranter, M.; Dowdeswell, J.A. Solute Provenance, transport, and denudation in a high Arctic glacierized catchment. Hydrol. Process. 1998, 11, 1813–1832. [Google Scholar] [CrossRef]
- Wadham, J.L.; Cooper, R.J.; Tranter, M.; Hodgkins, R. Enhancement of glacial solute fluxes in the proglacial zone of a polythermal glacier. J. Glaciol. 2001, 47, 378–386. [Google Scholar] [CrossRef] [Scilit]
- Gislason, S.R.; Arnorsson, S.; Armannsson, H. Chemical weathering of basalt in Southwest Iceland: Effects of runoff, age of rocks and vegetative/glacial cover. Am. J. Sci. 1996, 96, 837–907. [Google Scholar] [CrossRef] [Scilit]
- Yde, J.C.; Knudsen, N.T.; Nielsen, O.B. Glacier hydrochemistry, solute provenance, and chemical denudation at a surge-type glacier in Kuannersuit Kuussuat, Disko Island, West Greenland. J. Hydrol. 2005, 300, 172–187. [Google Scholar] [CrossRef] [Scilit]
- Yde, J.C.; Knudsen, N.T.; Hasholt, B.; Mikkelsen, A.B. Meltwater chemistry and solute export from a Greenland Ice Sheet catchment, Watson River, West Greenland. J. Hydrol. 2014, 519, 2165–2179. [Google Scholar] [CrossRef] [Scilit]
- Collins, D.N. Solute yield from a glacierized high mountain basin. In Dissolved Loads of Rivers and Surface Water Quantity/Quality Relationships; Webb, B.W., Ed.; International Association of Hydrological Sciences: Hamburg, Germany, 1983; Volume 141, pp. 41–50. [Google Scholar]
- Metcalf, R.C. The cationic denudation rate of an alpine glacier catchment: Gornergletscher, Switzerland. Z. Für Gletscherkunde Glazialgeol. 1986, 22, 19–32. [Google Scholar]
- Souchez, R.A.; Lemmens, M.M. Solutes. In Glacio-Fluvial Sediment Transfer: An Alpine Perspective; Gurnell, A.M., Clark, M.J., Eds.; John Wiley: New York, NY, USA, 1987; pp. 285–303. [Google Scholar]
- Sharp, M.; Tranter, M.; Brown, G.H.; Skidmore, M. Rates of chemical denudation and CO2 drawdown in a glacier-covered alpine catchment. Geology 1995, 23, 61–64. [Google Scholar]
- Feng, F.; Zhongqin, L.I.; Jin, S.; Dong, Z.; Wang, F. Hydrochemical characteristics and solute dynamics of meltwater runoff of Urumqi Glacier No. 1, Eastern Tianshan, Northwest China. J. Mt. Sci. 2012, 9, 472–482. [Google Scholar] [CrossRef] [Scilit]
- Li, X.; He, X.; Kang, S.; Mika, S.; Ding, Y.; Han, T.; Wu, Q.; Yu, Z. Corrigendum to: Diurnal dynamics of minor and trace elements in stream water draining Dongkemadi Glacier on the Tibetan Plateau and its environmental implications. J. Hydrol. 2017, 541, 1104–1118. [Google Scholar]
- Hasnain, S.I.; Subramanian, V.; Dhanpal, K. Chemical characteristics and suspended sediment load of meltwaters from a Himalayan glacier in India. J. Hydrol. 1989, 106, 99–108. [Google Scholar] [CrossRef] [Scilit]
- Collins, D.N.; Lowe, A.T.; Boult, S. Solute fluxes in meltwaters draining from glacierized high mountain basins. In Proceedings of the Fourth International Symposium on the Geochemistry of the Earth’s Surface, Ilkley, UK, 22–28 July 1996; Bottrell, S.H., Ed.; University of Leeds: Leeds, UK, 1996; pp. 728–732. [Google Scholar]
- Hasnain, S.I.; Thayyen, R.J. Variation of discharge and solute concentration in the meltwater of Dokriani glacier, Garhwal Himalaya, India. J. Geol. Soc. India 1996, 47, 89–93. [Google Scholar] [CrossRef] [Scilit]
- Hodson, A.; Porter, P.; Lowe, A.; Mumford, P. Chemical denudation and silicate weathering in Himalayan glacier basin: Batura Glacier, Pakistan. J. Hydrol. 2002, 262, 193–208. [Google Scholar] [CrossRef] [Scilit]
- Livingston, D.A. Chemical Composition of Rivers and Lakes: Professional Paper 440-G; United States Geological Survey: Washington, DC, USA, 1963; 64p.

Disclaimer/Publisher’s Note: The statements, opinions and data contained in all publications are solely those of the individual author(s) and contributor(s) and not of MDPI and/or the editor(s). MDPI and/or the editor(s) disclaim responsibility for any injury to people or property resulting from any ideas, methods, instructions or products referred to in the content. |
© 2025 by the authors. Licensee MDPI, Basel, Switzerland. This article is an open access article distributed under the terms and conditions of the Creative Commons Attribution (CC BY) license (https://creativecommons.org/licenses/by/4.0/).