Abstract
To elucidate the hydrochemical characteristics and evolution mechanisms of shallow groundwater in the alluvial–coastal transitional zone of the Tangshan Plain, 76 groundwater samples were collected in July 2022. An integrated approach combining Piper and Gibbs diagrams, ionic ratio analysis, multivariate statistical methods (including Pearson correlation, hierarchical cluster analysis, and principal component analysis), and PHREEQC inverse modeling was employed to identify hydrochemical facies, dominant controlling factors, and geochemical reaction pathways. Results show that groundwater in the upstream alluvial plain is predominantly of the HCO3–Ca type with low mineralization, primarily controlled by carbonate weathering, water–rock interaction, and natural recharge. In contrast, groundwater in the downstream coastal plain is characterized by high-mineralized Cl–Na type water, mainly influenced by seawater intrusion, evaporation concentration, and dissolution of evaporite minerals. The spatial distribution of groundwater follows a pattern of “freshwater in the north and inland, saline water in the south and coastal,” reflecting the transitional nature from freshwater to saline water. Ionic ratio analysis reveals a concurrent increase in Na+, Cl−, and SO42− in the coastal zone, indicating coupled processes of saline water mixing and cation exchange. Statistical analysis identifies mineralization processes, carbonate weathering, redox conditions, and anthropogenic inputs as the main controlling factors. PHREEQC simulations demonstrate that groundwater in the alluvial zone evolves along the flow path through CO2 degassing, dolomite precipitation, and sulfate mineral dissolution, whereas in the coastal zone, continuous dissolution of halite and gypsum leads to the formation of high-mineralized Na–Cl water. This study establishes a geochemical evolution framework from recharge to discharge zones in a typical alluvial–coastal transitional setting, providing theoretical guidance for salinization boundary identification and groundwater management.
1. Introduction
Tangshan City is located at the northeastern margin of the North China Plain and represents a typical convergence zone between alluvial and coastal plains [1]. The shallow groundwater in this region has long served as a vital source for agricultural irrigation, industrial production, and urban water supply. However, with increasing population, industrial agglomeration, and changes in agricultural practices, the groundwater system is under mounting pressure from overexploitation, declining water tables, and deteriorating water quality [2,3,4]. According to the Geological Environment Monitoring Report of Tangshan City, Hebei Province (2016–2020), groundwater withdrawal has consistently exceeded recharge, resulting in the formation of localized groundwater depression cones, ground subsidence, and earth fissures [5]. Therefore, elucidating the hydrochemical characteristics and evolution mechanisms of groundwater is crucial for achieving sustainable groundwater management and effective pollution prevention in the region.
Methodologically, the integration of hydrogeochemistry and statistical analysis provides powerful tools for groundwater studies. Traditional approaches such as Piper diagrams, Gibbs plots, and ionic ratio analysis are commonly employed to identify hydrochemical types and dominant controlling mechanisms [6,7,8], while descriptive statistical analysis facilitates the characterization of data features and the elimination of outliers [9]. Multivariate statistical techniques, including principal component analysis (PCA), factor analysis (FA), and hierarchical cluster analysis (HCA), have been widely applied to identify key controlling factors, delineate water quality zones, and apportion pollutants [10,11,12]. These methods have proven effective in applications such as analyzing the causes of reservoir pollution, disentangling the coupled effects of geological settings and anthropogenic activities, distinguishing heavy metal contamination, and tracing nitrate sources [13,14,15,16,17,18]. In addition, FA is frequently used to identify major regional pollutants, estimate site-specific contributions, and quantify the intensity of human impacts [19,20,21].
Internationally, Trabelsi et al. investigated an irrigated area in northeastern Tunisia, integrating PCA, HCA, and geochemical modeling to identify the combined effects of water–rock interactions and agricultural activities [22]. Similarly, Mudzielwana et al. employed Gibbs diagrams and ionic ratio analysis in the Giyani region of Limpopo Province, South Africa, and revealed that water–rock interactions exert a dominant influence on arsenic-bearing groundwater [23]. At the same time, PHREEQC, a geochemical modeling tool based on the principles of mass conservation and chemical equilibrium, enables the quantitative reconstruction of reaction pathways such as mineral dissolution and precipitation, cation exchange, and CO2 degassing [24,25]. Previous studies have demonstrated that, when coupled with GIS and statistical approaches, PHREEQC is highly effective in identifying groundwater salinization mechanisms, simulating nitrate contamination pathways, and delineating salinization boundaries [8,26,27]. This model has been extensively applied to hydrochemical evolution studies in diverse regions, including the karst aquifers of the Yucatán Peninsula [28], the Pampa de Pocho aquifer in Argentina [27], Guanabara Bay in Brazil [29], and the Maputo region in Mozambique [30], and is widely recognized as a critical tool for understanding groundwater evolution and salinization risks. Such research further underscores that identifying hydrochemical evolution mechanisms—whether in groundwater or surface water—is of universal importance for environmental risk management and water resource protection.
In China, related studies have primarily focused on regions with strong anthropogenic influence, including the North China Plain [31,32,33], Northeast China Plain [34,35,36], Yangtze River Delta [37], Yellow River Delta [38,39], Pearl River Delta [40], and Hexi Corridor [41]. These studies have generally revealed a hydrochemical evolution trend from Ca–Mg-type to Na-type groundwater, and identified agricultural fertilization, seawater intrusion, and carbonate weathering as the primary driving mechanisms [42,43]. However, most of the existing research has concentrated on individual geomorphic units. In transitional zones between alluvial fans and coastal deposits, a systematic and quantitative understanding of groundwater chemical differentiation across geomorphic units and its coupled evolution along flow paths remains lacking, which constrains the scientific advancement of regional groundwater quality management. Against this backdrop, this study focuses on a typical alluvial–coastal transitional zone in Tangshan City. A total of 76 shallow groundwater samples were collected, and an integrated approach—combining hydrochemical diagrams, ionic ratio analysis, multivariate statistical methods (Pearson correlation analysis, PCA, and HCA), and PHREEQC inverse modeling—was employed to systematically identify groundwater hydrochemical types, dominant controlling factors, and evolution mechanisms. Furthermore, a conceptual framework of groundwater evolution was developed to provide theoretical support and technical guidance for groundwater protection, salinization risk control, and water quality improvement in the region.
2. Study Area
The plain area of Tangshan City is located in eastern Hebei Province, forming a typical transitional zone between an alluvial fan and a coastal sedimentary plain, with a total area of approximately 8341 km2. The terrain gradually declines from north to south. The northern part consists of an inclined alluvial plain with an elevation of 4–50 m, characterized by coarse-grained sediments and high permeability, which are favorable for groundwater recharge. In contrast, the southern part is a flat coastal plain with an elevation of 2–4 m, where saline–alkali land is widespread and significantly affected by seawater intrusion and tidal influence. The region experiences a warm temperate, semi-humid monsoonal climate, with an average annual precipitation of 565.91 mm and a high annual evaporation of 1578.71 mm, indicating a substantial water deficit. Precipitation is concentrated from June to September and serves as the main period of groundwater recharge.
The aquifer system is dominated by Quaternary unconsolidated porous media, with increasing sediment thickness from north to south, reaching up to 500 m in the coastal zone. The aquifer media are composed of multilayered and heterogeneous materials, including medium to fine sand, gravel, pebble conglomerate, and silty clay. Based on hydraulic connectivity and burial depth, the aquifer system can be divided into four groups (I–IV). The shallowest, the first aquifer group (Group I), is the focus of this study, with burial depths ranging from 10 to 60 m and widespread spatial distribution. The representative hydrogeological cross-section of the study area is shown in Figure 1, illustrating the multilayered aquifer structure and hydrogeological zoning controlled by geomorphological units.
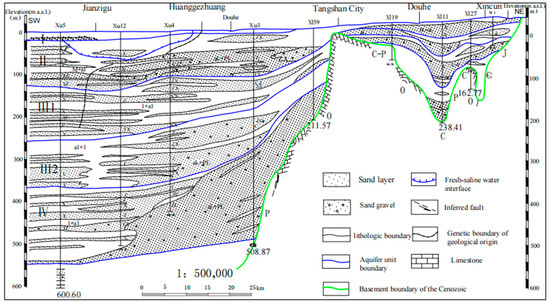
Figure 1.
Geological cross-section of the study area. The vertical axis is referenced to mean sea level (m a.s.l.).
Groundwater in the alluvial zone is predominantly characterized by HCO3−–Ca-type freshwater, whereas the coastal zone is significantly influenced by evaporation concentration and seawater intrusion, resulting in the evolution of Cl−–Na-type high-mineralized water. The primary sources of groundwater recharge include precipitation infiltration, lateral seepage from surface water, and runoff from the northern bedrock area. Discharge occurs mainly through anthropogenic pumping, while in the coastal zone, evaporation and cross-flow also contribute. The alluvial zone exhibits strong hydraulic connectivity, whereas in the coastal zone, the development of aquitards and hydraulic head differences tend to facilitate the formation of vertical pollution pathways. The combination of geomorphological structure, hydrogeological conditions, and water quality heterogeneity provides a typical natural setting for studying the hydrochemical evolution of groundwater (Figure 2).
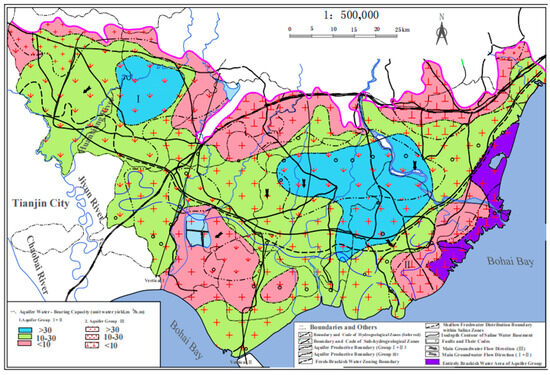
Figure 2.
Integrated hydrogeological map of the study area.
3. Materials and Methods
3.1. Sampling Design and Groundwater Sample Collection
In July 2022, a total of 76 shallow groundwater samples were collected from the plain area of Tangshan City, covering two distinct geomorphological units: the alluvial plain (44 samples) and the coastal plain (32 samples) (Figure 3). The sampling sites were selected based on regional hydrogeological conditions, aquifer structure, and land use characteristics, with priority given to typical recharge zones, runoff pathways, and discharge areas. According to previous studies [44,45,46] and considering the differences in geomorphological units, the sampling depth was set to ≤30 m in the alluvial plain and ≤60 m in the coastal plain to ensure that all collected samples represented the hydrochemical characteristics of the first aquifer group.
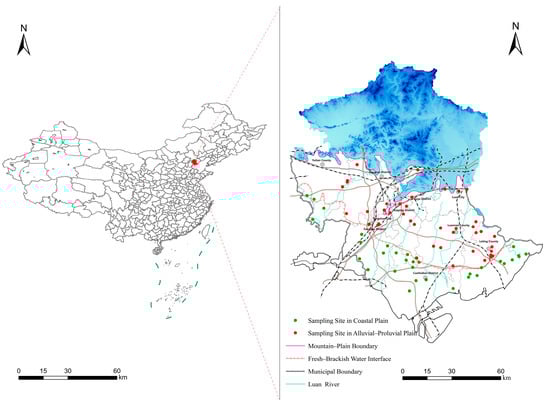
Figure 3.
Location map of the study area and distribution of groundwater sampling sites.
The sampling procedure followed the Technical Specification for Groundwater Environmental Monitoring (2020) [47]. Water was pumped from each well for approximately 30 min until stabilization before sampling. Field parameters, including pH, electrical conductivity (EC), total dissolved solids (TDS), and redox potential (Eh), were measured in situ. Samples were preserved under refrigeration and transported to the laboratory within 24 h. Analyses of major ions and physicochemical parameters were conducted at the Hebei Institute of Geological Environment Monitoring in accordance with national standard methods. Chloride (Cl−), sulfate (SO42−), and nitrate (NO3−) concentrations were determined by ion chromatography (ICS-1100, Thermo Fisher, Sunnyvale, CA, USA). Calcium (Ca2+), magnesium (Mg2+), sodium (Na+), and potassium (K+) were analyzed using inductively coupled plasma–optical emission spectrometry (ICP-OES, Optima 8300, PerkinElmer, Waltham, MA, USA). Bicarbonate (HCO3−) and carbonate (CO32−) were measured by acid–base titration. Additional field parameters, including pH, EC, and dissolved oxygen (DO), were determined using a portable multiparameter instrument (HQ40d, Hach, Company, Loveland, CO, USA). Analytical quality assurance was ensured through the use of parallel samples, blanks, and ionic balance error checks, with overall errors controlled within ±3%.
3.2. Data Analysis Methods
To comprehensively identify the hydrochemical characteristics, dominant controlling factors, and evolutionary mechanisms of shallow groundwater in the study area, a multidimensional analytical framework was established by integrating graphical interpretation, multivariate statistical analysis, and hydrogeochemical modeling techniques. The applied methods are briefly described as follows:
(1) Spatial Interpolation Analysis Using ArcGIS
To reveal the spatial distribution characteristics of major hydrochemical parameters, inverse distance weighting (IDW) interpolation was applied to the concentration data of major ions based on the ArcGIS 10.8 platform. IDW is a deterministic interpolation method based on the assumption of spatial autocorrelation [48,49], which assumes that points closer to each other are more similar, and thus, the value of a known sample has greater influence on nearby unsampled locations. The basic expression of the method is as follows:
where Z(x) is the estimated value at the unknown location x, Zi is the measured value at the i-th known sampling point, and Wi is the weight assigned to that sampling point. The weight is calculated as follows:
where di represents the Euclidean distance between the i-th sampling point and the estimation location, and p is the power parameter that controls the rate at which the weight decreases with distance. In this study, the default value of p = 2 was adopted to balance local sensitivity and overall spatial smoothness.
The inverse distance weighting (IDW) method generates continuous spatial distribution maps, providing an intuitive representation of the spatial variability of hydrochemical parameters and offering spatial data support for water quality assessment and pollution source identification. In this study, a total of 76 sampling sites were distributed across the alluvial–coastal transitional zone, with relatively uniform spacing, thereby meeting the applicability requirements of the IDW approach. In contrast, although kriging can incorporate spatial stochasticity through semivariogram models, its predictive performance becomes highly sensitive to model specification when the number of sampling sites is limited or unevenly distributed, often leading to considerable uncertainty. For this reason, the IDW method was adopted in this study to ensure both robustness and interpretability of the interpolation results.
(2) Descriptive Statistical Analysis
Descriptive statistical analysis was conducted using Excel and SPSS Statistic 22.0 (IBM Corp., Armonk, NY, USA) to evaluate the major physicochemical parameters of groundwater samples. Statistical indicators including maximum, minimum, mean, standard deviation, and coefficient of variation were extracted to reveal the central tendency and dispersion of each parameter, identify potential outliers, and provide a data foundation for subsequent statistical analysis and modeling.
(3) Graphical Hydrochemical Analysis
To identify groundwater hydrochemical types and their formation mechanisms, Piper trilinear diagrams and Gibbs plots were employed for graphical analysis of the water samples. The Piper diagram is used to determine the dominant ionic composition of groundwater and to classify its hydrochemical facies. The Gibbs plot, by analyzing the relationship between total dissolved solids (TDS) and specific ionic ratios, helps to distinguish the primary mechanisms controlling groundwater chemistry, such as rock weathering, evaporation concentration, and atmospheric precipitation.
(4) Ionic Ratio Analysis
Typical ionic ratios, such as Na+/Cl−, Ca2+/Mg2+, HCO3−/Cl−, (Ca2+ + Mg2+)/(HCO3− + SO42−), were selected and interpreted in conjunction with the regional hydrogeological context to infer potential geochemical processes in groundwater, including carbonate dissolution, sulfate reduction, cation exchange, evaporation concentration, and seawater intrusion. These ratios serve as auxiliary indicators for identifying hydrochemical evolution mechanisms [50,51].
(5) Correlation Analysis
To examine the linear relationships among hydrochemical parameters, Pearson’s correlation coefficient (r) was employed in this study. The correlation coefficient is calculated using the following formula:
where xi and yi represent the values of two variables for the i-th sample,
and
are the respective means of the variables, and n is the total number of samples. The Pearson correlation coefficient r ranges from –1 to 1. A positive value of r (i.e., r > 0) indicates a positive linear relationship, where an increase in one variable corresponds to an increase in the other. A negative value (i.e., r < 0) indicates a negative linear relationship, where one variable increases while the other decreases. When r = 0, it suggests no linear correlation between the two variables. The statistical significance of the correlations was evaluated using a two-tailed t-test with a significance level of p < 0.05.
This analysis helps reveal the covariation patterns among hydrochemical parameters in groundwater, providing a theoretical basis for principal component extraction and pollution source identification [52].
(6) Hierarchical Cluster Analysis (HCA)
To classify the clustering structure among groundwater samples and differentiate water quality types, hierarchical cluster analysis (HCA) was performed on water quality data standardized using the Z-score method. Ward’s minimum variance method was adopted as the clustering algorithm [53,54], and the clustering criterion is defined by the following expression:
where A and B are the two clusters to be merged, ∣A∣ and ∣B∣ represent the number of samples in each cluster, and XAi and XBi denote the centroids of clusters A and B, respectively. By constructing a dendrogram, groundwater samples can be effectively grouped based on similarity, which—when integrated with their geographic locations and hydrochemical characteristics—enables further classification of water quality types and delineation of potential contamination zones.
(7) Principal Component Analysis (PCA)
Principal component analysis (PCA) is a dimensionality reduction technique that transforms multiple original variables into a set of mutually orthogonal new variables (principal components), thereby reducing the dimensionality while retaining as much of the original information as possible [55]. In this study, PCA was employed to extract the dominant factors controlling groundwater hydrochemical variations and to identify potential pollution sources.
Before performing PCA, suitability tests were conducted, including: ① Kaiser–Meyer–Olkin (KMO) test: a KMO value greater than 0.5 indicates that the data is suitable for PCA; ② Bartlett’s sphericity test: if p < 0.05, the correlation matrix is significant. The main analysis steps are as follows:
- (1)
- Data standardization: Due to significant differences in the units and magnitudes of various hydrochemical parameters, directly analyzing the raw data could lead to larger variables dominating the results. To eliminate the effects of differing dimensions and units, all data were standardized using the following formula:
- (2)
- Construction of the correlation matrix. Principal component analysis can be conducted based on either a covariance matrix or a correlation matrix. Considering that the units and magnitudes of groundwater parameters vary significantly, this study adopted a correlation matrix—rather than a covariance matrix—after data standardization to ensure balanced contributions from all variables in the analysis. This approach effectively eliminates the influence of scale differences on PCA results and is more suitable for the structure of the current dataset. The correlation coefficient is calculated using the following formula:
- (3)
- Eigenvalue decomposition. The correlation matrix R was subjected to eigenvalue decomposition to obtain the eigenvalues λj and their corresponding eigenvectors ej:
The principal component PCj can be expressed as a linear combination of the original variables:
where eji is the coefficient of the eigenvector corresponding to the j-th principal component, and p is the total number of variables.
- (4)
- Determination of the number of principal components. The number of principal components to retain was determined based on the cumulative variance contribution rate, calculated using the following formula:
A cumulative contribution rate of over 80% was used as the threshold for retaining principal components, supplemented by scree plot analysis to determine whether components with eigenvalues greater than 1 should be included.
By analyzing the principal component loading matrix, the geochemical significance of each principal component can be interpreted, allowing identification of dominant controlling factors and potential pollution sources. This, in turn, facilitates understanding of the relationships among different water quality parameters and the hydrochemical evolution of groundwater. The integration of PCA, factor analysis (FA), and hierarchical cluster analysis (HCA) provides a complementary multivariate framework—PCA for extracting dominant factors, FA for source apportionment, and HCA for sample classification—thereby establishing a comprehensive approach for hydrochemical characterization from factor identification to source interpretation and spatial delineation.
(8) Hydrogeochemical Modeling (PHREEQC)
To quantitatively identify geochemical reaction pathways occurring during groundwater flow, inverse modeling was performed using PHREEQC version 3.0. This method is based on the principles of mass conservation and chemical equilibrium. By comparing the concentration changes of chemical constituents between initial and final water samples, the model can reconstruct potential geochemical processes such as mineral dissolution or precipitation, cation exchange, and gas-phase equilibria [56]. The mass balance equation is given as follows:
where ni,j represents the stoichiometric coefficient of the j-th reaction for the i-th ion, Δmj is the molar transfer quantity of the j-th reaction (in moles), and Ci,final and Ci,initial denote the concentrations of the i-th ion in the final and initial water samples, respectively.
The modeling procedure includes: selection of initial and final water samples; specification of potential reactants such as calcite, gypsum, dolomite, gas phases (e.g., CO2), and cation exchange components; execution of the simulation; and selection of the solution with the minimum mass balance residual. The modeling results are used to identify the dominant geochemical processes and their intensities, thereby providing a quantitative basis for constructing the regional hydrochemical evolution model.
4. Results and Discussion
4.1. Hydrochemical Characteristics and Origin Identification
4.1.1. Hydrochemical Characteristics
To understand the basic water quality status and ionic composition of shallow groundwater in the study area, 76 groundwater samples collected in 2022 were statistically analyzed. The hydrochemical indicators of the alluvial plain and coastal plain zones were summarized separately, as shown in Table 1 and Table 2.

Table 1.
Statistical summary of groundwater hydrochemical parameters in the alluvial plain.
Table 2.
Statistical summary of groundwater hydrochemical parameters in the coastal plain.
The pH values in both zones ranged from neutral to slightly alkaline. In the alluvial plain, pH ranged from 7.00 to 8.50, while in the coastal plain, it ranged from 6.90 to 8.60. The majority of samples met the Class III quality standard. Significant differences were observed in total dissolved solids (TDS) and total hardness (TH) between the two zones. In the alluvial plain, the mean TDS was 715.54 mg/L and TH was 511.86 mg/L, whereas in the coastal plain, the average TDS increased to 5781.20 mg/L and TH reached 1449.98 mg/L. The exceedance rates for TDS and TH in the coastal zone were 75.00% and 34.38%, respectively. With respect to ion concentration rankings, the anion sequence in the alluvial plain was HCO3− > SO42− > Cl− > NO3− > NO2−, and the cation sequence was Ca2+ > Mg2+ > Na+ > K+ > NH4+. In contrast, the coastal plain exhibited an anion sequence of Cl− > SO42− > HCO3− > NO3− > NO2−, and a cation sequence of Na+ > Mg2+ > Ca2+ > K+ > NH4+. Regarding pollution-sensitive indicators, the exceedance rates for NO3−, NH4+, and Mn in the alluvial zone were 31.82%, 11.36%, and 54.55%, respectively. In the coastal zone, the exceedance rates for NO3−, Mn, F−, and Mg2+ were 21.88%, 46.88%, 31.25%, and 68.75%, respectively.
These results reveal distinct differences in physicochemical properties, hardness levels, TDS concentrations, and major ion composition between the two geomorphological units, providing a foundation for subsequent analyses of spatial distribution patterns and hydrochemical origins.
4.1.2. Spatial Trends of Hydrochemical Facies and Indicators
To identify the spatial variability of groundwater quality and its potential driving factors, six representative hydrochemical parameters—pH, total dissolved solids (TDS), total hardness (TH), Cl−, NO3−, and SO42−—were selected for spatial interpolation using the inverse distance weighting (IDW) method in ArcGIS 10.8 (Figure 4a–f).
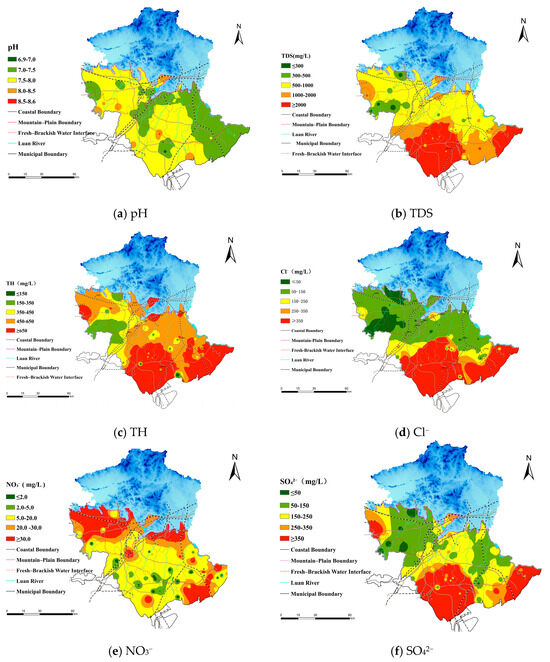
Figure 4.
Spatial distribution maps of representative hydrochemical parameters.
The pH values across the study area range from 6.90 to 8.60, indicating neutral to slightly alkaline conditions. Central-western and southeastern areas are mostly within the 7.0–7.5 range, while the northern and northwestern zones tend to be slightly higher, with isolated values exceeding 8.0. In contrast, pH values along the Luan River and in the southwestern portion are locally lower, suggesting slightly acidic conditions. Overall pH variation is limited, but localized anomalies warrant further attention.
TDS exhibits a clear increasing trend from north to south and from inland toward the coastal zone. Most samples in the northern region are below 300 mg/L, indicating freshwater. Values in the central zone generally range from 300 to 1000 mg/L, while TDS increases sharply in the coastal plain, where some samples exceed 2000 mg/L, forming a high-mineralization enrichment zone. This spatial pattern indicates that, along the groundwater flow path, low-mineralized water controlled by carbonate weathering gradually evolves into high-mineralized water dominated by evaporation and saline water mixing.
The spatial distribution of TH closely mirrors that of TDS. TH values in the northern part are generally below 150 mg/L, increase to 150–450 mg/L in the central region, and reach their highest levels in the coastal zone. Many coastal samples exceed 450 mg/L, indicating a typical very hard water signature. The increase in hardness is primarily attributed to the enrichment of Ca2+ and Mg2+, indicating the combined influence of gypsum/halite dissolution and saline water intrusion in the coastal zone.
Cl− concentrations generally increase from the northwest to the southeast. In the northern part of the study area, values are typically below 50 mg/L, whereas concentrations gradually rise toward the coastal zone, with some sites exceeding 350 mg/L and forming a distinct Cl− enrichment belt. This trend is consistent with the characteristics of Na+–Cl−-type water, further confirming the influence of seawater intrusion and evaporite dissolution.
NO3− exhibits pronounced spatial variability. In the central and southern parts of the study area, concentrations are generally below 5 mg/L, indicating good water quality. In contrast, values increase to 5–20 mg/L in some eastern and northern areas. A high-value zone exceeding 30 mg/L is observed in the densely populated northeastern region, suggesting that agricultural fertilization and domestic sewage leakage are the primary pollution sources.
SO42− concentrations remain relatively stable (50–150 mg/L) in the northern and central parts of the study area but increase locally in the eastern and southwestern regions, reaching the highest levels in the coastal zone, where some samples exceed 350 mg/L. The anomalous enrichment of SO42− may result from the combined effects of sulfate mineral dissolution, industrial effluents, and saline water mixing. Its spatial distribution closely mirrors that of Cl− and TDS, indicating similar enrichment mechanisms.
In summary, the spatial distribution of typical groundwater indicators reflects not only the differences among geomorphic units (alluvial–coastal transition), hydrodynamic conditions, and water–rock interactions, but also the combined impacts of anthropogenic activities (agricultural fertilization and industrial discharge) and seawater intrusion. These findings are consistent with the conclusions drawn from the Piper and Gibbs diagrams as well as ionic ratio analysis, providing a solid basis for subsequent identification of dominant controlling mechanisms and groundwater pollution risk assessment.
4.1.3. Ionic Ratios and Controlling Mechanisms
The Piper diagram reveals that groundwater in the alluvial plain is primarily of the Ca2+–Mg2+–HCO3− and Ca2+–Mg2+–SO42− types. Most samples are concentrated in the lower left corner of the cation triangle and the upper left corner of the anion triangle, indicating favorable recharge conditions, carbonate-dominated lithology, and a relatively low degree of chemical evolution. A subset of samples shows elevated SO42− concentrations, which may be related to the dissolution of sulfate minerals or oxidation of sulfides. In contrast, samples from the coastal plain are mainly located in the Na+–Cl− field, indicating high mineralization levels and reflecting the dominant influence of seawater mixing, evaporation concentration, and dissolution of evaporite minerals (Figure 5).
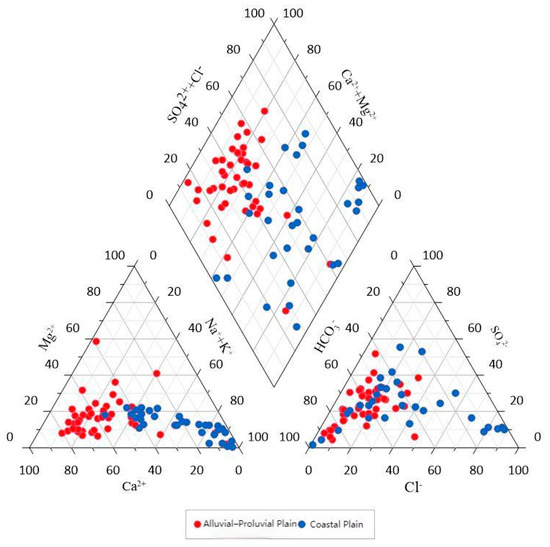
Figure 5.
Piper trilinear diagram of groundwater in the study area.
To further elucidate the sources, migration pathways, and evolution of major ions in groundwater [57], four representative ionic ratio indicators were introduced (Figure 6).
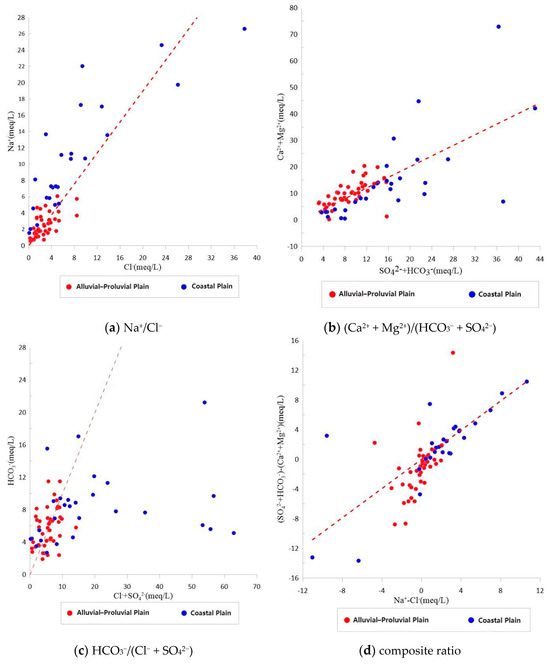
Figure 6.
Diagnostic ionic ratio plots for interpreting groundwater geochemical processes.
The Na+/Cl− ratio is primarily used to identify seawater mixing and cation exchange processes. Most groundwater samples in the study area plot close to the Na+/Cl− = 1 line, indicating a high degree of source consistency between the two ions. In the alluvial plain, most samples fall below the 1:1 line, suggesting slight Na+ depletion, which may result from Na+–Ca2+ exchange adsorption. In contrast, most samples in the coastal plain plot above the 1:1 line, showing Na+ enrichment, which indicates the significant influence of seawater intrusion or salt mineral dissolution. This classification logic is consistent with the findings of Selvakuma et al., who identified the Na+/Cl− ratio as a key indicator for distinguishing between evaporite dissolution and seawater mixing in coastal aquifers of southern India [58].
The (Ca2+ + Mg2+)/(HCO3− + SO42−) ratio reflects the dissolution status of carbonate and sulfate minerals. Most samples are distributed near the 1:1 line, suggesting an overall electrochemical balance between cations and anions. In the alluvial plain, the ratio is dominated by samples with low concentrations, indicating carbonate dissolution as the primary control. In the coastal zone, elevated ratios suggest enhanced external SO42− input, potentially influenced by industrial discharge or sulfide oxidation. A similar contribution of external SO42− has been verified in coastal aquifers of central Ghana [59].
The HCO3−/(Cl− + SO42−) ratio is indicative of the mixing degree between freshwater and saline water. In the alluvial plain, higher HCO3− concentrations result in ratios predominantly greater than 1, implying recharge dominated by atmospheric precipitation and carbonate weathering. In contrast, the coastal samples exhibit ratios mostly below 1, indicating Cl− and SO42− enrichment, which serves as a sensitive indicator of evaporation concentration and saline water intrusion. This trend is consistent with the observations of Shin et al. [60] in the Korean archipelago and Seddique et al. [61] in the southeastern coastal basin of Bangladesh, who demonstrated that the HCO3−/(Cl− + SO42−) ratio is an effective indicator for distinguishing freshwater recharge zones from salinized mixing zones.
The composite ratio [(SO42− + HCO3−) – (Ca2+ + Mg2+)]/(Na+ – Cl−) integrates the net ionic gain and loss processes and can be used to identify cation exchange and water–rock interaction mechanisms [62]. Most samples in the alluvial zone show relatively stable values, indicating carbonate mineral control. In the coastal zone, however, the ratio varies significantly, reflecting the combined effects of evaporation, cation exchange, and seawater mixing, suggesting that groundwater chemistry in this zone is governed by multiple coupled processes. This discrimination method has also been validated in studies of the Patagonian region of Argentina, where cation exchange, water–rock interactions, and dedolomitization were found to jointly govern the chemical evolution of groundwater [63].
The Gibbs diagram further confirms the differences in controlling mechanisms (Figure 7). Groundwater samples from the alluvial plain are mainly clustered within the “rock weathering dominance” zone, indicating that the hydrochemical composition is primarily governed by carbonate dissolution. In contrast, samples from the coastal zone fall within the “evaporation dominance” and “seawater influence” zones, reflecting that the high degree of mineralization is mainly attributable to evaporation concentration and saline water mixing [64].
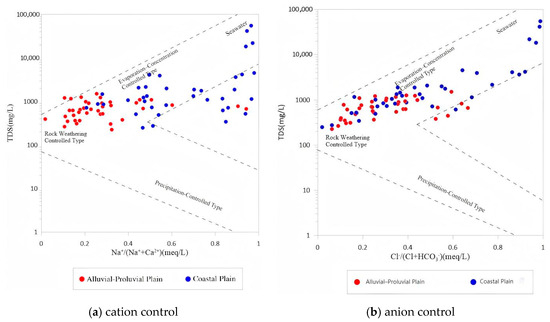
Figure 7.
Gibbs diagrams of groundwater in the study area.
In summary, the groundwater in the study area exhibits clear spatial differentiation in hydrochemical types. Along the flow path, the water evolves from HCO3−–Ca-type freshwater to Cl−–Na-type high-mineralized water. The controlling mechanisms shift from rock weathering to a multi-process coupling system dominated by evaporation concentration, seawater mixing, and cation exchange. This provides a quantitative foundation for subsequent groundwater evolution modeling and pollution mechanism analysis.
4.1.4. Groundwater Quality Classification and Pollution Identification
According to the Groundwater Quality Standard of China (GB/T 14848—2017) [65] and based on the concentrations of major hydrochemical constituents (excluding pH), the groundwater quality in the study area was classified into five categories: Classes I–II represent high-quality water with low solute concentrations and are suitable for various uses; Class III represents moderate-quality water, suitable for drinking water sources and agricultural or industrial use; Class IV represents poor-quality water, suitable for agricultural and some industrial use and can be used as drinking water after treatment; and Class V represents very poor-quality water with high solute concentrations, which is not suitable for drinking. A total of 76 shallow groundwater samples from the study area were classified into these quality categories (Figure 8). The results show that groundwater quality varies significantly across the region, exhibiting an overall pattern of better quality in the north and poorer quality in the south, with a gradual transition from fresh to mineralized water.
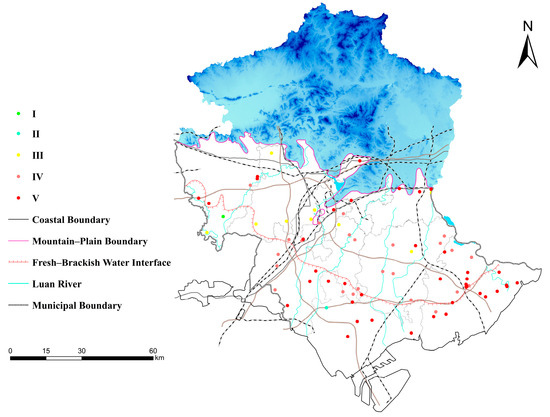
Figure 8.
Spatial distribution of groundwater quality grades.
In the alluvial plain, only 20.45% of samples met Class II or better standards, while Class IV and V samples accounted for 40.91% and 38.64%, respectively. The main parameters exceeding the standards were nitrate (NO3−), manganese (Mn), and total hardness (TH), reflecting the combined effects of agricultural fertilization, domestic sewage infiltration, and carbonate rock weathering. Groundwater quality in the coastal plain was even more severely degraded, with Class V samples accounting for 71.88% and high-quality water comprising less than 10%. The dominant pollutants were total dissolved solids (TDS), chloride (Cl−), sodium (Na+), and sulfate (SO42−), indicating long-term influence from seawater intrusion, evaporation concentration, and high-salinity geological background [66].
In terms of spatial distribution, Class V water samples are mainly concentrated in low-lying coastal areas and discharge zones, while Class IV samples are widely distributed in transitional zones and agriculturally intensive areas. In contrast, Class II–III waters are primarily found in fan apexes and northern recharge zones. This distribution pattern corroborates the evolutionary pathway of groundwater from recharge areas to discharge zones and from freshwater to highly mineralized water, while also highlighting regional differences shaped by the superposition of natural evolution and anthropogenic activities. Accordingly, areas with concentrated Class V samples should be designated as priority groundwater pollution prevention and monitoring zones, Class IV waters require enhanced control of agricultural non-point source pollution, and high-quality Class II–III waters should be preserved as critical groundwater protection zones. These zoning results not only provide diagnostic evidence for subsequent pollution source apportionment but also offer a scientific basis for optimizing monitoring well networks and formulating zoned management strategies.
4.2. Multivariate Statistical Identification of Groundwater Evolution Processes
4.2.1. Correlation Analysis and Hierarchical Clustering
To identify the intrinsic relationships among hydrochemical components and their spatial distribution patterns, Pearson correlation analysis and hierarchical cluster analysis (HCA) were performed separately for groundwater samples from the alluvial plain and the coastal plain.
In the alluvial plain, TDS showed a strong positive correlation with total hardness (TH) (r = 0.97), and also exhibited significant positive correlations with Ca2+, Mg2+, and HCO3−, suggesting that groundwater mineralization and hardness in this region are primarily controlled by carbonate rock weathering and dissolution [67]. Cl− was moderately correlated with Na+ and SO42− (r ≈ 0.7), indicating possible influence from halite or evaporite mineral dissolution [68]. pH was negatively correlated with TDS and TH, reflecting the buffering effect of CO2 degassing or dynamic acid–base regulation (Figure 9a). NO3− showed no significant correlation with Mn or NH4+, implying an independent origin, possibly related to agricultural activities or domestic sewage leakage [69].
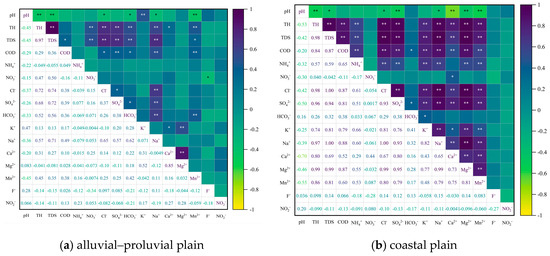
Figure 9.
Pearson correlation heatmaps of major ions in different geomorphological zones. * indicates significance at the 0.05 level; ** indicates significance at the 0.01 level. The color gradient reflects the strength and direction of correlation, with darker shades indicating stronger positive or negative relationships.
In the coastal plain, the correlations among hydrochemical components are generally stronger. The correlation coefficients between TDS and TH, Cl−, Na+, and SO42− all exceed 0.95, indicating that groundwater chemistry in this area is jointly dominated by seawater mixing, evaporite mineral dissolution, and evaporation [70,71,72]. HCO3− shows relatively weak correlations with other parameters, suggesting that the carbonate system does not play a dominant role in this region (Figure 9b). pH is generally negatively correlated with the major cations, reflecting that the groundwater acid–base buffering capacity is influenced by disturbances from high mineralization.
The clustering results divided the alluvial plain samples into three groups. Group A represents the dominant cluster, characterized by low TDS and major ion concentrations, indicating recently recharged freshwater. Group B samples exhibit moderate ion concentrations, possibly reflecting intermediate evolution stages. Group C consists of isolated samples with significantly elevated TDS and TH, mainly distributed in densely populated or hydrologically confined areas, suggesting potential local concentration or pollution effects (Figure 10a).
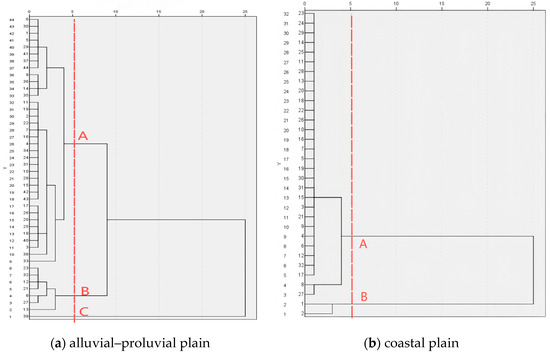
Figure 10.
Hierarchical cluster dendrograms of groundwater samples.
Cluster analysis divided the coastal plain groundwater samples into two groups. Group A, accounting for the majority of samples, exhibited moderate mineralization and relatively homogeneous composition. Group B was characterized by significant enrichment of Na+, Cl−, and SO42−, representing typical high-mineralized water bodies. These samples were primarily distributed in nearshore discharge zones and saline–freshwater interface areas (Figure 10b).
These results indicate that the spatial heterogeneity of groundwater is not only reflected in differences in hydrochemical types, but also in the combined influence of multiple geochemical processes operating within the geomorphological transition zone. The observed correlation structures and clustering patterns provide a theoretical foundation and spatial framework for subsequent identification of dominant controlling factors and PHREEQC-based geochemical modeling.
4.2.2. Principal Component Analysis of Dominant Factors
To extract the dominant factors controlling groundwater chemistry, principal component analysis was performed separately for samples from the alluvial–proluvial plain and the coastal plain. The Kaiser–Meyer–Olkin (KMO) test and Bartlett’s test of sphericity confirmed the suitability of both datasets for dimensionality reduction. The first two to three principal components explained most of the total variance, suggesting that regional groundwater chemistry is largely governed by a limited number of controlling factors.
Alluvial–proluvial plain: The KMO value was 0.506 and the Bartlett’s test result was significant (p < 0.001), indicating that the data were appropriate for PCA. Based on the criterion of eigenvalues greater than 1, six principal components were extracted (Table 3 and Figure 11), cumulatively explaining 80.41% of the total variance. The first three components accounted for 57% of the total.
Table 3.
Principal component analysis results of groundwater in the alluvial–proluvial plain.
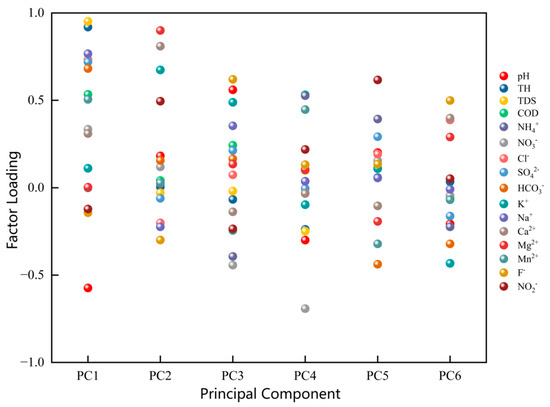
Figure 11.
Principal component loading matrix of groundwater in the alluvial–proluvial plain.
PC1 (31.16%) had high loadings for TDS, TH, Cl−, Na+, and SO42−, indicating that the primary control was mineralization, driven by evaporation concentration and evaporite mineral dissolution [73,74]. PC2 (15.16%) was dominated by Ca2+ and Mg2+, reflecting carbonate mineral dissolution processes [75]. PC3 (10.66%) showed strong loadings for pH, K+, and F−, suggesting localized redox conditions and the dissolution of specific minerals such as feldspar and fluorite. PC4 to PC6 were associated with pollution-sensitive indicators such as COD, NH4+, NO3−, Mn, and NO2−, indicating slight pollution at certain sites in the alluvial plain, possibly influenced by organic inputs and agricultural activities [76].
Coastal plain: The KMO value was 0.745, and Bartlett’s test of sphericity was significant (p < 0.001), indicating that the dataset was suitable for PCA. Based on the eigenvalue > 1 criterion, four principal components were extracted (Table 4 and Figure 12), cumulatively explaining 84.94% of the total variance. The first two components alone accounted for nearly 70%. PC1 (57.98%) had high loadings for TDS, TH, Cl−, Na+, SO42−, Ca2+, Mg2+, and Mn, suggesting that the elevated mineralization was jointly controlled by multiple processes, including seawater intrusion, evaporite dissolution, and evaporation concentration [77,78]. PC2 (11.42%) was dominated by pH and F−, indicating carbonate buffering and weathering of fluorine-bearing minerals [76]. PC3 (8.28%) was associated with NH4+ and NO2−, suggesting incomplete nitrification or sewage input under locally reducing conditions. PC4 (7.26%) was primarily loaded on NO3−, representing agricultural pollution under oxidizing conditions [79].
Table 4.
Principal component analysis results of groundwater in the Coastal plain.
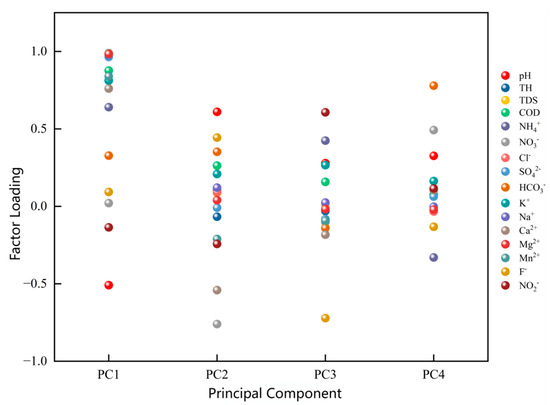
Figure 12.
Principal component loading matrix of groundwater in the coastal plain.
The PCA results for both geomorphological zones indicate that groundwater in the alluvial–proluvial plain is primarily influenced by natural processes with limited pollution, whereas the coastal plain shows evident anthropogenic disturbances and multi-process coupling. These findings are consistent with the observed correlation structures and clustering patterns, and provide a theoretical foundation for defining mineral reaction pathways in subsequent PHREEQC simulations
4.3. Inverse Hydrogeochemical Modeling with PHREEQC
To quantitatively analyze the geochemical evolution of groundwater along its flow path, two representative hydrogeological cross-sections were selected for inverse modeling using PHREEQC. The first section, spanning wells No. 27 to No. 48 in the alluvial–proluvial plain, represents a typical freshwater recharge–runoff system. The second section, from wells No. 66 to No. 65 in the coastal plain, characterizes a salinized discharge system (Figure 13). Based on saturation index analysis and inverse geochemical modeling, the dominant geochemical reactions, evolutionary trends, and their controlling mechanisms were identified. These results form the basis for constructing the regional hydrogeochemical evolution pathways.
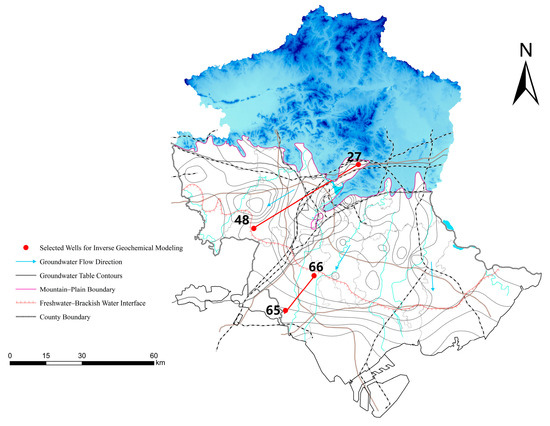
Figure 13.
Locations of selected wells and flow paths for inverse geochemical modeling.
4.3.1. Saturation Index Analysis of Mineral Reaction Trends
Along the alluvial–proluvial flow path, carbonate minerals such as calcite and dolomite are generally in a supersaturated state, with their saturation indices gradually decreasing along the flow direction. This suggests a prominent precipitation process of carbonates driven by CO2 degassing, which is accompanied by an increase in groundwater pH [80]. Oxide minerals such as Fe(OH)3 and goethite also exhibit supersaturation, indicating that Fe3+ is prone to form colloidal precipitates under neutral to slightly alkaline conditions. Gibbsite shifts from supersaturation to undersaturation along the path, reflecting an increased risk of aluminum mobilization. In contrast, evaporite minerals such as gypsum and halite remain undersaturated throughout the section, suggesting that they serve as continuous sources of Cl− and SO42−. These processes contribute significantly to the increase in groundwater mineralization [80,81] (Table 5).
Table 5.
Variation in saturation indices (SI) of typical minerals along the alluvial–proluvial plain flow path.
Although carbonate minerals are also supersaturated along the coastal flow path, the variations in their saturation indices (SI) are relatively small, indicating that their precipitation potential is suppressed under highly mineralized conditions. In contrast, evaporite minerals such as halite and gypsum remain consistently undersaturated, suggesting that the weathering and dissolution of saline minerals are the primary drivers of groundwater mineralization in this zone [82]. Gaseous phases such as CO2 (g) and H2S (g) also exhibit persistent undersaturation, indicating that the system remains relatively open. Although some degassing may occur, significant reducing reactions have not yet become dominant [83] (Table 6).
Table 6.
Variation in saturation indices (SI) of typical minerals along the Coastal plain flow path.
4.3.2. Inverse Modeling—Identification of Dominant Geochemical Pathways
To further elucidate the major geochemical processes along groundwater flow paths in different geomorphological zones, inverse modeling was conducted using PHREEQC. The reaction pathways and controlling mechanisms in two representative sections—from the alluvial–proluvial plain and the coastal plain—were identified and compared. While both flow paths involve typical water–rock interactions, they differ significantly in dominant reaction types, intensities, and evolutionary trends.
In the alluvial–proluvial flow path (Wells 27–48) (Table 7), CO2 (g) exhibited a strong degassing trend, with a molar transfer amount of –2.366 × 10³ mol·L−1. This drove an increase in groundwater pH and promoted the precipitation of dolomite (CaMg(CO3)2) at –2.52 × 10³ mol·L−1. This reaction was the dominant control on Ca2+ and Mg2+ concentrations, indicating that carbonate equilibrium in this zone is primarily regulated by atmospheric CO2 dynamics [84,85]. In addition, gypsum (CaSO4·2H2O) showed continuous dissolution (+2.17 × 10³ mol·L−1), serving as the main source of SO42− and indicating that the groundwater system, while undergoing carbonate precipitation, is also influenced by evaporite input [86]. Although halite (NaCl) remained undersaturated with relatively low dissolution (–0.90 × 10³ mol·L−1), it still contributed to the accumulation of Na+ and Cl− [87]. Notably, the significant dissolution of glauconite (Mn3Ca2(SiO4)2) (–1.80 × 10³ mol·L−1) suggests the potential mobilization and enrichment of trace metals such as Al and Mn along the flow path. This highlights the risk of heavy metal release from argillaceous strata at the margin of the alluvial fan [85].
Table 7.
Inverse geochemical modeling results of groundwater–mineral reactions along the 27–48 flow path in the alluvial–proluvial plain.
In contrast, the coastal plain flow path (Wells 66–65) exhibited distinct hydrogeochemical evolution characteristics (Table 8). Although CO2 (g) and H2O (g) were still modeled as degassing components, their molar transfer amounts were only –0.014 mol·L−1 and –0.25 mol·L−1, respectively, indicating a significant weakening of CO2 outgassing and its limited influence on the carbonate system. Correspondingly, the dissolution of dolomite and aragonite was weak, with transfer amounts of –0.015 mol·L−1 and –0.005 mol·L−1, respectively, suggesting that carbonate mineral reactivity is markedly suppressed under high-TDS conditions [88]. In contrast, halite showed a notable dissolution amount of +0.014 mol·L−1, acting as the main control factor for the rapid enrichment of Na+ and Cl− along this flow segment. This is consistent with the spatial distribution of Cl−–Na+-type water identified earlier [89,90]. No formation of FeS or other reductive mineral phases was observed in the simulation, indicating that the coastal groundwater system remains within an oxidizing to neutral environment and has not yet entered a strongly reducing geochemical stage [91].
Table 8.
Inverse geochemical modeling results of groundwater–mineral reactions along the 66–65 flow path in the coastal plain.
In addition, the comparison of Table 7 and Table 8 further reveals the rate-limiting characteristics of salinization processes. Halite dissolution is a rapid reaction that leads to short-term enrichment of Na+ and Cl−, thereby accelerating salinization in coastal zones. In contrast, gypsum dissolution proceeds more slowly but continuously supplies SO42−, acting as the rate-limiting step that controls the long-term salinization trend. Carbonate precipitation and CO2 degassing mainly function as secondary processes that regulate hardness and pH, with limited influence on the overall salinization rate. In summary, the alluvial–proluvial flow path is characterized by a reaction chain of “CO2 degassing–dolomite precipitation–evaporite dissolution,” where rapid halite dissolution determines short-term salinization rates and slower gypsum dissolution governs long-term trends. By contrast, the coastal plain is dominated by continuous halite dissolution, with carbonate reactivity largely suppressed, forming a highly saline system prone to rapid salinization. These differences highlight the coupled roles of “fast–slow reactions” in controlling groundwater salinization rates across different geomorphic units and indicate that groundwater evolution is jointly regulated by lithology, recharge conditions, and hydrodynamic regimes. The PHREEQC modeling results are consistent with the preceding hydrochemical diagrams and multivariate statistical analyses, collectively confirming the scientific validity and reliability of the inferred groundwater evolutionary pathways in the study area.
4.3.3. Conceptual Model of Groundwater Evolution
The groundwater evolution in the study area exhibits a typical geomorphology–geochemistry coupling pattern. Along the flow path from the alluvial plain to the coastal plain, groundwater progressively evolves from freshwater to highly mineralized water, driven by distinct mechanisms summarized as follows:
In the alluvial plain, groundwater is recharged by atmospheric precipitation and lateral inflow from northern bedrock runoff, under relatively strong hydrodynamic conditions. The hydrochemical type is predominantly HCO3−–Ca, with overall low TDS. Multiple diagnostic methods indicate that groundwater chemistry in this zone is primarily controlled by carbonate weathering and water–rock interactions, with a minor contribution from cation exchange. PHREEQC modeling further reveals that the evolution process is dominated by CO2 degassing and dolomite precipitation, while the slow dissolution of gypsum provides a long-term source of SO42−, and continuous halite dissolution contributes to Na+ and Cl− accumulation. Overall, the alluvial plain represents an open, oxidizing, and weakly mineralized system dominated by natural processes.
In the coastal plain, the terrain is flat with a low hydraulic gradient, and groundwater recharge is significantly reduced. Evaporation and anthropogenic extraction constitute the primary discharge mechanisms. The hydrochemical type shifts to Cl−–Na, accompanied by a pronounced increase in TDS. Both statistical and spatial interpolation analyses indicate that groundwater chemistry is jointly influenced by evaporation concentration and seawater mixing, with evaporite mineral dissolution playing a dominant role. PHREEQC simulations confirm that carbonate reactivity is weak, whereas rapid halite dissolution is the key mechanism driving the enrichment of Na+ and Cl−. This zone is characterized as a relatively closed, saline system, with salinization occurring at a much faster rate than in the alluvial zone.
In summary, the groundwater evolution model of the study area can be generalized as follows: along the flow path, groundwater evolves from HCO3−–Ca-type freshwater to Cl−–Na-type highly mineralized water. The controlling mechanisms transition from an open, weakly mineralized system dominated by carbonate reactions in the alluvial zone to a closed, highly saline system in the coastal zone, primarily driven by evaporation concentration and evaporite dissolution. This evolutionary process is jointly regulated by natural processes and anthropogenic disturbances. The findings not only enhance the understanding of groundwater evolution in geomorphic transition zones but also provide theoretical support and decision-making references for identifying salinization boundaries, controlling pollution, and improving groundwater resource management.
4.4. Groundwater Management Implications
The results of this study demonstrate that groundwater quality in the alluvial–coastal transitional zone of the Tangshan Plain exhibits significant spatial and process-based differentiation, reflecting the superimposed effects of natural evolution and anthropogenic disturbances. Based on these findings, the following management implications are proposed:
- (1)
- Priority Monitoring Zones: In low-lying coastal areas, TDS, Cl−, Na+, and SO42− are markedly enriched, forming salinization hotspots. PHREEQC simulations indicate that halite and gypsum dissolution are the dominant mechanisms driving mineralization. These areas should be designated as priority monitoring zones, where real-time monitoring of electrical conductivity and salinity should be implemented, alongside strict regulation of irrigation and domestic water quality.
- (2)
- Pollution Control Zones: In the transitional alluvial–coastal zone, Class IV groundwater exhibits elevated exceedance rates of NO3− and Mn. PCA results suggest that agricultural fertilization, sewage leakage, and organic inputs are the major sources. These areas should be designated as pollution control zones, with measures such as precision fertilization, improved wastewater treatment, and controlled groundwater abstraction to mitigate non-point source pollution pressure.
- (3)
- High-Quality Groundwater Protection Zones: In the alluvial fan apex and northern recharge areas, groundwater is predominantly HCO3−–Ca-type freshwater of high quality, primarily controlled by natural carbonate weathering. These zones should be designated as groundwater protection areas, with strict restrictions on intensive groundwater extraction and high-risk land use.
- (4)
- Salinization Boundary Early Warning: Along the groundwater flow path, hydrochemical types evolve from HCO3−–Ca to Cl−–Na, with both Gibbs diagrams and PHREEQC simulations revealing a transition from “carbonate control” to “evaporation concentration/evaporite dissolution.” Monitoring transects should be established in the freshwater–saline water transition belt, with emphasis on tracking electrical conductivity and the Na+/Cl− ratio to dynamically identify seawater intrusion boundaries.
- (5)
- Trace Element Risk Management: PHREEQC simulations indicate that glauconite and other Mn- and Al-bearing minerals dissolve along the alluvial fan margins, suggesting a risk of trace element mobilization. Long-term monitoring of trace metals and nitrogen species is recommended to prevent environmental and health hazards. Recent studies in tropical natural wetlands have also confirmed that the spatial–seasonal distribution of trace metals is jointly regulated by DOC, salinity, and pH, underscoring the universal necessity of mechanism-based identification and sustained monitoring [90].
In summary, this study proposes a zoning management framework of “priority monitoring zones—pollution control zones—resource protection zones,” while emphasizing salinization early warning and trace element risk assessment in transitional areas. This framework provides a scientific basis for optimizing regional monitoring networks and developing targeted groundwater protection strategies.
5. Conclusions
Based on 76 shallow groundwater samples collected from the typical alluvial–proluvial to coastal geomorphological transition zone in the Tangshan Plain, this study systematically identified the hydrochemical characteristics, controlling factors, and evolutionary mechanisms of groundwater along flow paths. A combination of hydrochemical diagram analysis, ion ratio interpretation, multivariate statistical methods (Pearson correlation analysis, principal component analysis, and hierarchical clustering), and PHREEQC inverse modeling was applied. The main conclusions are as follows:
- (1)
- The hydrochemical types of groundwater exhibit clear geomorphological differentiation. Groundwater in the alluvial–proluvial plain is dominated by the HCO3−–Ca type with low TDS, mainly controlled by natural recharge and carbonate weathering. In contrast, the coastal plain is characterized by Cl−–Na-type high-mineralized water with elevated TDS, primarily influenced by seawater intrusion, evaporation concentration, and evaporite dissolution.
- (2)
- The spatial distribution of key hydrochemical parameters (TDS, Cl−, Na+, SO42−, NO3−) follows a pattern of “fresh in the north, saline in the south; better quality in the fanhead than in the coastal area.” Ion ratio analysis reveals that the alluvial zone is mainly affected by carbonate reactions and cation exchange, while the coastal zone shows evidence of evaporite dissolution and mixed water influences, forming a transition belt from freshwater to saline water.
- (3)
- Multivariate statistical analyses indicate that groundwater chemistry is controlled by multiple interacting factors, including enhanced mineralization, carbonate weathering, evaporation, redox conditions, and anthropogenic inputs. Natural geochemical processes dominate in the alluvial plain, though some areas also show signs of nitrate pollution. In the coastal plain, hydrochemical evolution is governed by a combination of natural processes and human activities.
- (4)
- PHREEQC inverse modeling quantitatively identified key geochemical reactions along representative flow paths. In the alluvial path, CO2 degassing drives dolomite precipitation and gypsum dissolution, forming an oxidizing open system regulated by carbonate buffering. In the coastal path, continuous halite dissolution dominates, while CO2 degassing and carbonate reactions become subdued, reflecting a high-TDS, closed-system water body.
- (5)
- This study developed an integrated analytical framework combining hydrochemical diagrams, statistical recognition, and inverse modeling. It effectively revealed the transformation of groundwater types, spatial distribution of controlling mechanisms, and evolutionary trends. The results provide theoretical support and methodological guidance for identifying transition zones of saline groundwater, understanding the succession of dominant hydrogeochemical processes, and informing regional salinization risk assessment, pollution zoning, and sustainable groundwater management.
Author Contributions
Conceptualization, S.W., M.W. and S.L.; Methodology, S.W., M.W., S.L. and G.P.; Software, S.L., G.P., Y.Y. and J.Z.; Validation, M.D., Y.Y. and L.F.; Formal analysis, S.W., S.L. and G.P.; Investigation, S.W., S.L., G.P. and J.Z.; Resources, Q.S. and G.P.; Data curation, G.P. and S.L.; Writing—original draft preparation, S.W.; Writing—review and editing, M.W., S.L. and Q.S.; Visualization, S.L., Y.Y. and J.Z.; Supervision, M.W.; Project administration, M.W. and Q.S.; Funding acquisition, M.W., Q.S. and S.W. M.W. supervised the overall research design and manuscript development. Q.S. provided critical data support and regional datasets. All authors have read and agreed to the published version of the manuscript.
Funding
This research was supported by the Special Fund of the Hebei Key Laboratory of Geological Resources and Environmental Monitoring and Protection (Grant No. JCYKT202306), the National Groundwater Monitoring Project (Hebei Province Part) (Grant No. XM2024067), and the Basic Water Resources Survey Project of Hebei Province (Grant No. 13000024P006CA410464R).
Data Availability Statement
The data presented in this study are available on request from the corresponding author. The data are not publicly available since the research is still on-going.
Conflicts of Interest
The authors declare no conflicts of interest.
References
- Hebei Hydrogeological and Engineering Geological Team, Hebei Geological Bureau. Hydrogeological Investigation Report on Irrigation Water Supply in the Eastern Hebei Plain; Hebei Hydrogeological and Engineering Geological Team, Hebei Geological Bureau: Shijiazhuang, China, 1983. (In Chinese)
- Wang, D.C.; Zhang, R.Q.; Shi, Y.H. Fundamentals of Hydrogeology; Geological Publishing House: Beijing, China, 1995; pp. 1–5. (In Chinese)
- Dolan, F.; Lamontagne, J.; Link, R.; Hejazi, M.; Reed, P.; Edmonds, J. Evaluating the economic impact of water scarcity in a changing world. Nat. Commun. 2021, 12, 1915. [Google Scholar] [CrossRef]
- Jia, W.; Yin, L.; Zhang, M.; Zhang, X.; Zhang, J.; Tang, X.; Dong, J. Quantification of groundwater recharge and evapotranspiration along a semi-arid wetland transect using diurnal water table fluctuations. J. Arid Land 2021, 13, 455–469. [Google Scholar] [CrossRef]
- Hebei Institute of Geological Environment Monitoring. Geological Environment Monitoring Report of Tangshan City, Hebei Province; Hebei Institute of Geological Environment Monitoring: Tangshan, China, 2022. (In Chinese) [Google Scholar]
- Wen, S.; Wen, M.; Liang, S.; Pang, G.; Fan, J.; Dong, M.; Wang, Y.; Zhang, J.; Ye, Y. Spatial Distribution and Mechanisms of Groundwater Hardness in the Plain Area of Tangshan City, China. Water 2024, 16, 3627. [Google Scholar] [CrossRef]
- Gibbs, R.J. Mechanisms Controlling World Water Chemistry. Science 1970, 170, 1088–1090. [Google Scholar] [CrossRef]
- Sunkari, E.D.; Abu, M.; Zango, M.S. Geochemical Evolution and Tracing of Groundwater Salinization Using Different Ionic Ratios, Multivariate Statistical and Geochemical Modeling Approaches in a Typical Semi-Arid Basin. J. Contam. Hydrol. 2021, 236, 103742. [Google Scholar] [CrossRef]
- Çelik Güney, M.; Kayaalp, G.-T. A Comparative Evaluation of the Outlier Detection Methods. Black Sea J. Eng. Sci. 2024, 7, 155–159. [Google Scholar] [CrossRef]
- El-Rawy, M.; Fathi, H.; Abdalla, F.; Alshehri, F.; Eldeeb, H. An Integrated Principal Component and Hierarchical Cluster Analysis Approach for Groundwater Quality Assessment in Jazan, Saudi Arabia. Water 2023, 15, 1466. [Google Scholar] [CrossRef]
- Li, Q.; Zhang, H.; Guo, S.; Fu, K.; Liao, L.; Xu, Y.; Cheng, S. Groundwater pollution source apportionment using principal component analysis in a multiple land-use area in southwestern China. Environ. Sci. Pollut. Res. 2020, 27, 9000–9011. [Google Scholar] [CrossRef] [PubMed]
- Chen, T.; Zhang, H.; Sun, C.; Li, H.; Gao, Y. Multivariate statistical approaches to identify the major factors governing groundwater quality. Appl. Water Sci. 2018, 8, 215. [Google Scholar] [CrossRef]
- Liu, Z.; Ding, C.; Chao, J. Source apportionment of pollutants in Changtan Reservoir, Zhejiang Province, using an absolute principal component score–multiple linear regression (APCS–MLR) model. J. Ecol. Rural Environ. 2023, 39, 530–539. (In Chinese) [Google Scholar]
- Fentahun, A.; Mechal, A.; Karuppannan, S. Hydrochemistry and quality appraisal of groundwater in Birr River Catchment, Central Blue Nile River Basin, using multivariate techniques and water quality indices. Environ. Monit. Assess. 2023, 195, 655. [Google Scholar] [CrossRef]
- Samadi, J. Modelling hydrogeological parameters to assess groundwater pollution and vulnerability in Kashan aquifer: Novel calibration-validation of multivariate statistical methods and human health risk considerations. Environ. Res. 2022, 211, 113028. [Google Scholar] [CrossRef]
- Saliba, Y.; Bărbulescu, A. Assessing pollution with heavy metals and its impact on population health. Toxics 2025, 13, 52. [Google Scholar] [CrossRef]
- Guo, X.; Zuo, R.; Shan, D.; Cao, Y.; Wang, J.; Teng, Y.; Fu, Q.; Zheng, B. Source apportionment of pollution in groundwater source area using factor analysis and positive matrix factorization methods. Hum. Ecol. Risk Assess. 2017, 23, 1417–1436. [Google Scholar] [CrossRef]
- Zhang, H.; Du, X.Y.; Gao, F.; Zeng, Z.; Cheng, S.Q.; Xu, Y. Groundwater pollution source apportionment using combined PMF model and stable isotope analysis. Environ. Sci. 2022, 43, 4054–4063. (In Chinese) [Google Scholar]
- Zuo, R.; Wei, B.; Wang, J.; Wang, J.S.; Teng, Y.G.; Yang, Y.F.; Dai, N. Identification of pollution sources in groundwater source areas based on multivariate statistical analysis. Hydrogeol. Eng. Geol. 2012, 39, 17–21. (In Chinese) [Google Scholar]
- Ma, R.; Shi, J. Assessing groundwater pollution using fuzzy factor analysis method: A case study of Luoyang city in Henan province. Diqiu Xuebao (Acta Geosci. Sin.) 2011, 32, 611–622. (In Chinese) [Google Scholar]
- Zuo, R.; Chen, X.; Wang, B.; Shan, D.; Yang, J.; Li, X.; Wang, J.; Teng, Y. Pollution risk evaluation of regional groundwater based on sources apportionment of pollution. Water Sci. Technol. Water Supply 2018, 18, 1294–1307. [Google Scholar] [CrossRef]
- Trabelsi, R.; Zouari, K. Coupled geochemical modeling and multivariate statistical analysis approach for the assessment of groundwater quality in irrigated areas: A study from north eastern of Tunisia. Groundw. Sustain. Dev. 2019, 8, 197–206. [Google Scholar] [CrossRef]
- Mudzielwana, R.; Gitari, M.; Akinyemi, S.; Talabi, A.; Ndungu, P. Hydrogeochemical characteristics of arsenic-rich groundwater in Greater Giyani Municipality, Limpopo Province, South Africa. Groundw. Sustain. Dev. 2020, 10, 100336. [Google Scholar] [CrossRef]
- Poetra, R.P.; Adji, T.N.; Santosa, L.W.; Khakhim, N. Hydrogeochemical conditions in groundwater systems with various geomorphological units in Kulonprogo Regency, Java Island, Indonesia. Aquat. Geochem. 2020, 26, 421–454. [Google Scholar] [CrossRef]
- Tziritis, E.; Sachsamanoglou, E.; Güler, C. Evaluating spatiotemporal groundwater quality changes in the Rhodope coastal aquifer system (NE Greece) employing a GIS-assisted hybrid approach of multivariate statistics and inverse geochemical modeling. Sci. Total Environ. 2024, 947, 174676. [Google Scholar] [CrossRef]
- Rao, N.S.; Dinakar, A.; Sun, L. Estimation of groundwater pollution levels and specific ionic sources in the groundwater using a comprehensive approach of geochemical ratios, pollution index of groundwater, unmix model and land use/land cover—A case study. J. Contam. Hydrol. 2022, 248, 103990. [Google Scholar] [CrossRef]
- Quinodoz, F.B.; Cabrera, A.; Blarasin, M.; Matteoda, E.; Pascuini, M.; Prámparo, S.; Boumaiza, L.; Matiatos, I.; Schroeter, G.; Lutri, V. Chemical and isotopic tracers combined with mixing models for tracking nitrate contamination in the Pampa de Pocho aquifer, Argentina. Environ. Res. 2024, 259, 119571. [Google Scholar] [CrossRef] [PubMed]
- Narvaez-Montoya, C.; Mondragón Bonilla, R.; Goldscheider, N.; Mahlknecht, J. Groundwater salinization patterns in the Yucatán Peninsula reveal contamination and vulnerability of the karst aquifer. Commun. Earth Environ. 2025, 6, 256. [Google Scholar] [CrossRef]
- Gomes, O.; Marques, E.; Kütter, V.; Aires, J.; Travi, Y.; Silva-Filho, E. Origin of salinity and hydrogeochemical features of porous aquifers from northeastern Guanabara Bay, Rio de Janeiro, SE-Brazil. J. Hydrol. Reg. Stud. 2019, 25, 100601. [Google Scholar] [CrossRef]
- Nogueira, G.; Stigter, T.; Zhou, Y.; Mussá, F.; Juízo, D. Understanding Groundwater Salinization Mechanisms to secure Freshwater Resources in the Water-Scarce City of Maputo, Mozambique. Sci. Total Environ. 2019, 661, 723–736. [Google Scholar] [CrossRef]
- Xing, L. Hydrochemical Characteristics and Hydrogeochemical Processes of Groundwater Along a Typical Profile in the North China Plain. Master’s Thesis, China University of Geosciences (Beijing), Beijing, China, 2012. (In Chinese). [Google Scholar]
- Wang, H.; Guo, X.; Zhang, Q.; Li, B. Hydrochemical characteristics, evolution, and genesis of groundwater in the Hutuo River Basin. Environ. Chem. 2021, 40, 3838–3845. (In Chinese) [Google Scholar]
- Guo, X.; Wang, H.; Shi, J.; Wang, W. Hydrochemical variation characteristics and evolution model of the groundwater system in Baiyangdian Wetland. Acta Geol. Sin. 2022, 96, 656–672. (In Chinese) [Google Scholar]
- Long, W. Study on Hydrochemical Characteristics and Evolution of Shallow Groundwater in Tongliao Area. Master’s Thesis, China University of Geosciences (Beijing), Beijing, China, 2010. (In Chinese). [Google Scholar]
- Lou, Z.; Jin, A.; Zhu, R.; Cai, X.; Gao, R. Vertical zonation and planar differentiation of groundwater hydrochemical fields in oilfields of the Songliao Basin. Chin. J. Geol. 2006, 41, 392–403. (In Chinese) [Google Scholar]
- Wu, X.; An, Y.; Wei, S.; Yin, D.; Cui, H.; Wang, X.; Wang, Q. Hydrochemical characteristics and evolution of shallow groundwater in the Dingxin Valley of the lower Heihe River. Arid Zone Resour. Environ. 2021, 35, 103–109. (In Chinese) [Google Scholar]
- Chen, M.; Wu, Y.; Gao, D.; Chang, M. Hydrochemical evolution and controlling factors of shallow groundwater in the plain area of Guanghan City. J. Jilin Univ. (Earth Sci. Ed.) 2016, 46, 831–843. (In Chinese) [Google Scholar]
- Sun, Y.; Wang, W.; Duan, L.; Zhang, C.; Wang, Y. Formation and evolutionary mechanisms of shallow groundwater geochemistry in the Guanzhong Basin. Hydrogeol. Eng. Geol. 2014, 41, 29–35. (In Chinese) [Google Scholar]
- Cao, J.; Xu, X.; Yu, H.; Huang, C. Hydrochemical characteristics and evolution of shallow groundwater in the Yellow River Delta. Mar. Sci. 2014, 38, 78–85. (In Chinese) [Google Scholar]
- Zhao, X.; Chen, J.; Tang, C.; Zeng, S.; Lu, G. Hydrochemical characteristics and evolution of groundwater in small catchments of the Pearl River Delta. Ecol. Environ. 2007, 16, 1620–1626. (In Chinese) [Google Scholar]
- Wang, S.; Liu, H.; Yu, Y.; Zhao, W.; Yang, Q.; Liu, J. Evaluation of groundwater sustainability in the arid Hexi Corridor of Northwestern China, using GRACE, GLDAS and measured groundwater data products. Sci. Total Environ. 2020, 705, 135829. [Google Scholar] [CrossRef] [PubMed]
- Yang, Y. Groundwater Quality Assessment and Hydrogeochemical Evolution Modeling in the Xianyang Section of the Weihe River Basin. Master’s Thesis, Chang’an University, Xi’an, China, 2023. (In Chinese). [Google Scholar]
- Fu, X.; Sun, Y.; Su, J.; Zheng, M.; Xi, B.; Qian, G. Source apportionment of nitrate in groundwater based on hydrochemistry and dual isotopes of nitrogen and oxygen. Chin. Environ. Sci. 2019, 39, 3951–3958. (In Chinese) [Google Scholar]
- Zhang, Z.; Fei, Y.; Guo, C.; Qian, Y.; Li, Y. Regional groundwater pollution assessment in the North China Plain. J. Jilin Univ. (Earth Sci. Ed.) 2012, 42, 1456–1461. (In Chinese) [Google Scholar]
- Liu, Y.; Lu, C.; Ma, R. Source identification and analysis of iron ions in groundwater of the Eastern Hebei Plain. Geol. Surv. Res. 2019, 42, 134–142. (In Chinese) [Google Scholar]
- Ma, F.; Wei, A.; Deng, Q.; Zhao, H. Hydrochemical characteristics and the suitability of groundwater in the coastal region of Tangshan, China. J. Earth Sci. 2014, 25, 1067–1075. [Google Scholar] [CrossRef]
- Ministry of Ecology and Environment of the People’s Republic of China. Technical Specification for Groundwater Environmental Monitoring; Ministry of Ecology and Environment of the People’s Republic of China: Beijing, China, 2020. (In Chinese)
- Liu, H.; Chen, S.; Hou, M.; He, L. Improved inverse distance weighting method application considering spatial autocorrelation in 3D geological modeling. Earth Sci. Inform. 2020, 13, 619–632. [Google Scholar] [CrossRef]
- Kim, J.; Han, J.; Park, K.; Seok, S. Improved IDW interpolation application using 3D search neighborhoods: Borehole data-based seismic liquefaction hazard assessment and mapping. Appl. Sci. 2022, 12, 11652. [Google Scholar] [CrossRef]
- Zhang, H.; Xu, G.; Chen, X.; Mabaire, A. Hydrogeochemical evolution of multilayer aquifers in a massive coalfield. Environ. Earth Sci. 2019, 78, 675. [Google Scholar] [CrossRef]
- Lalumbe, L.; Kanyerere, T. Characterisation of hydro-geochemical processes influencing groundwater quality in rural areas: A case study of Soutpansberg Region, Limpopo Province, South Africa. Water 2022, 14, 1972. [Google Scholar] [CrossRef]
- Rezaei, A.; Hassani, H.; Jabbari, N. Evaluation of groundwater quality and assessment of pollution indices for heavy metals in North of Isfahan Province, Iran. Sustain. Water Resour. Manag. 2019, 5, 491–512. [Google Scholar] [CrossRef]
- Bu, J.; Liu, W.; Pan, Z.; Ling, K. Comparative study of hydrochemical classification based on different hierarchical cluster analysis methods. Int. J. Environ. Res. Public Health 2020, 17, 9515. [Google Scholar] [CrossRef]
- Das, C.R.; Das, S.; Panda, S. Groundwater quality monitoring by correlation, regression and hierarchical clustering analyses using WQI and PAST tools. Groundw. Sustain. Dev. 2022, 16, 100708. [Google Scholar] [CrossRef]
- Abdi, H.; Williams, L.J. Principal component analysis. Wiley Interdiscip. Rev. Comput. Stat. 2010, 2, 433–459. [Google Scholar] [CrossRef]
- Salhi, N.; Douaoui, A.; Trolard, F.; Bourrié, G. Specific interaction theory versus Pitzer’s model in groundwaters and brines for checking equilibria/non-equilibria with calcite, gypsum, and halite: Application to predict the evolution of solutions concentrated by evaporation in irrigated areas. Environ. Earth Sci. 2019, 78, 196. [Google Scholar] [CrossRef]
- Vasu, D.; Singh, S.K.; Tiwary, P.; Sahu, N.; Ray, S.K.; Butte, P.; Duraisami, V.P. Influence of geochemical processes on hydrochemistry and irrigation suitability of groundwater in part of semi-arid Deccan Plateau, India. Appl. Water Sci. 2017, 7, 3803–3815. [Google Scholar] [CrossRef]
- Selvakumar, S.; Chandrasekar, N.; Srinivas, Y.; Selvam, S.; Kaliraj, S.; Magesh, N.; Venkatramanan, S. Hydrogeochemical processes controlling the groundwater salinity in the coastal aquifers of Southern Tamil Nadu, India. Mar. Pollut. Bull. 2021, 174, 113264. [Google Scholar] [CrossRef] [PubMed]
- Asare, A.; Appiah-Adjei, E.; Ali, B.; Owusu-Nimo, F. Assessment of seawater intrusion using ionic ratios: The case of coastal communities along the Central Region of Ghana. Environ. Earth Sci. 2021, 80, 566. [Google Scholar] [CrossRef]
- Shin, K.; Koh, D.; Jung, H.; Lee, J. The hydrogeochemical characteristics of groundwater subjected to seawater intrusion in the Archipelago, Korea. Water 2020, 12, 1542. [Google Scholar] [CrossRef]
- Seddique, A.; Masuda, H.; Anma, R.; Bhattacharya, P.; Yokoo, Y.; Shimizu, Y. Hydrogeochemical and isotopic signatures for the identification of seawater intrusion in the paleobeach aquifer of Cox’s Bazar city and its surrounding area, south-east Bangladesh. Groundw. Sustain. Dev. 2019, 9, 100215. [Google Scholar] [CrossRef]
- Chen, Q.; Abu-Al-Saud, M.O.; Ayirala, S.C.; AlYousef, A.A. Propagation of mineral dissolution waves driven by cation exchange in low salinity waterflooding. Fuel 2022, 328, 125350. [Google Scholar] [CrossRef]
- Baumann, G.; Vital, M.; Glok-Galli, M.; Grondona, S.; Massone, H.; Martinez, D. Hydrogeochemical modeling and dedolomitization processes in the Patagonian Boulders and Patagonia Formation in the eastern Patagonia, Argentina. Environ. Earth Sci. 2019, 78, 405. [Google Scholar] [CrossRef]
- Telahigue, F.; Souid, F.; Agoubi, B.; Chahlaoui, A.; Kharroubi, A. Hydrogeochemical and isotopic evidence of groundwater salinization in a coastal aquifer: A case study in Jerba Island, southeastern Tunisia. Phys. Chem. Earth 2020, 120, 102886. [Google Scholar] [CrossRef]
- GB/T 14848—2017; Groundwater Quality Standard. Standards Press of China: Beijing, China, 2017.
- Xaza, A.; Mapoma, H.; Abiye, T.; Clarke, S.; Kanyerere, T. Investigating seawater intrusion in Republic of South Africa’s Heuningnes, Cape Agulhas using hydrogeochemistry and seawater fraction techniques. Water 2023, 15, 12141. [Google Scholar] [CrossRef]
- Nguyen, G.; Huynh, N. Seasonal variations in groundwater quality under different impacts using statistical approaches. Civ. Eng. J. 2023, 9, 537–551. [Google Scholar] [CrossRef]
- Mahaqi, A. Groundwater quality for drinking and agricultural purposes, Saleh Abad (NE Iran): Geochemical and statistical approaches. Carbonates Evaporites 2021, 36, 7. [Google Scholar] [CrossRef]
- Mukate, S.; Panaskar, D.; Wagh, V.; Baker, S. Understanding the influence of industrial and agricultural land uses on groundwater quality in semiarid region of Solapur, India. Environ. Dev. Sustain. 2019, 22, 3207–3238. [Google Scholar] [CrossRef]
- Balasubramanian, M.; Sridhar, S.; Ayyamperumal, R.; Karuppannan, S.; Gopalakrishnan, G.; Chakraborty, M.; Huang, X. Isotopic signatures, hydrochemical and multivariate statistical analysis of seawater intrusion in the coastal aquifers of Chennai and Tiruvallur District, Tamil Nadu, India. Mar. Pollut. Bull. 2021, 174, 113232. [Google Scholar] [CrossRef]
- Rajendiran, T.; Sabarathinam, C.; Chandrasekar, T.; Panda, B.; Mathivanan, M.; Nagappan, G.; Natesan, D.; Ghai, M.; Singh, D.; Alagappan, R. Geochemical variations due to salinization in groundwater along the southeast coast of India. SN Appl. Sci. 2021, 3, 396. [Google Scholar] [CrossRef]
- Hasan, S.; Salem, Z.; Sefelnasr, A. Assessment of hydrogeochemical characteristics and seawater intrusion in coastal aquifers by integrating statistical and graphical techniques: Quaternary aquifer, West Nile Delta, Egypt. Water 2023, 15, 1803. [Google Scholar] [CrossRef]
- Sarma, R.; Singh, S. Assessment of groundwater quality and human health risks of nitrate and fluoride contamination in a rapidly urbanizing region of India. Environ. Sci. Pollut. Res. 2023, 30, 55437–55454. [Google Scholar] [CrossRef] [PubMed]
- Xu, D.; Li, P.; Chen, X.; Yang, S.; Zhang, P.; Guo, F. Major ion hydrogeochemistry and health risk of groundwater nitrate in selected rural areas of the Guanzhong Basin, China. Hum. Ecol. Risk Assess. 2023, 29, 701–727. [Google Scholar] [CrossRef]
- Cellone, F.; Carol, E.; Pugliese, I.; Córdoba, J.; Butler, L.; Lamarche, L. Nitrate pollution in dairy farms and its impact on groundwater quality in a sector of the Pampas plain, Argentina. Environ. Earth Sci. 2020, 79, 356. [Google Scholar] [CrossRef]
- Adelana, S.; Heaven, M.; Dresel, P.; Giri, K.; Holmberg, M.; Croatto, G.; Webb, J. Controls on species distribution and biogeochemical cycling in nitrate-contaminated groundwater and surface water, southeastern Australia. Sci. Total Environ. 2020, 726, 138426. [Google Scholar] [CrossRef]
- Abba, S.; Egbueri, J.; Benaafi, M.; Usman, J.; Usman, A.; Aljundi, I. Fluoride and nitrate enrichment in coastal aquifers of the Eastern Province, Saudi Arabia: The influencing factors, toxicity, and human health risks. Chemosphere 2023, 322, 139083. [Google Scholar] [CrossRef]
- Krishan, G.; Bhagwat, A.; Sejwal, P.; Yadav, B.; Kansal, M.; Bradley, A.; Singh, S.; Kumar, M.; Sharma, L.; Muste, M. Assessment of groundwater salinity using principal component analysis (PCA): A case study from Mewat (Nuh), Haryana, India. Environ. Monit. Assess. 2022, 195, 923. [Google Scholar] [CrossRef] [PubMed]
- Alsabti, B.; Sabarathinam, C.; Svv, D. Identification of high nitrate concentration in shallow groundwater of an arid region: A case study of South Kuwait’s Bay. Environ. Monit. Assess. 2022, 195, 781. [Google Scholar] [CrossRef]
- Lu, C.; Cheng, W.; Yin, H.; Li, S.; Zhang, Y.; Dong, F.; Cheng, Y.; Zhang, X. Study on inverse geochemical modeling of hydrochemical characteristics and genesis of groundwater system in coal mine area—A case study of Longwanggou Coal Mine in Ordos Basin. Environ. Sci. Pollut. Res. 2024, 31, 16583–16600. [Google Scholar] [CrossRef]
- Okofo, L.; Bedu-Addo, K.; Martienssen, M. Characterization of groundwater in the ‘Tamnean’ Plutonic Suite aquifers using hydrogeochemical and multivariate statistical evidence: A study in the Garu-Tempane District, Upper East Region of Ghana. Appl. Water Sci. 2022, 12, 63. [Google Scholar] [CrossRef]
- Rajendiran, T.; Sabarathinam, C.; Chandrasekar, T.; Keesari, T.; Senapathi, V.; Sivaraman, P.; Viswanathan, P.; Nagappan, G. Influence of variations in rainfall pattern on the hydrogeochemistry of coastal groundwater—An outcome of periodic observation. Environ. Sci. Pollut. Res. 2019, 26, 29173–29190. [Google Scholar] [CrossRef] [PubMed]
- Gori, F.; Paternoster, M.; Barbieri, M.; Buttitta, D.; Caracausi, A.; Parente, F.; Sulli, A.; Petitta, M. Hydrogeochemical multi-component approach to assess fluids upwelling and mixing in shallow carbonate-evaporitic aquifers (Contursi area, southern Apennines, Italy). J. Hydrol. 2023, 620, 129258. [Google Scholar] [CrossRef]
- Lu, S.; Chen, J.; Zheng, X.; Liang, Y.; Jia, Z.; Li, X. Hydrogeochemical characteristics of karst groundwater in Jinci spring area, north China. Carbonates Evaporites 2020, 35, 10. [Google Scholar] [CrossRef]
- Zilberbrand, M.; Gimburg, A.; Doroshev, A.; Mirlas, V.; Anker, Y. Chemical evolution of runoff in Eastern Mediterranean mountainous karstic terrains. J. Hydrol. 2021, 598, 127388. [Google Scholar] [CrossRef]
- Roy, A.; Keesari, T.; Mohokar, H.; Pant, D.; Sinha, U.; Mendhekar, G. Geochemical evolution of groundwater in hard-rock aquifers of South India using statistical and modelling techniques. Hydrol. Sci. J. 2020, 65, 951–968. [Google Scholar] [CrossRef]
- Jang, E.; Wiese, B.; Pilz, P.; Fischer, S.; Schmidt-Hattenberger, C. Geochemical modeling of CO2 injection and gypsum precipitation at the Ketzin CO2 storage site. Environ. Earth Sci. 2022, 81, 398. [Google Scholar] [CrossRef]
- Reghais, A.; Drouiche, A.; Zahi, F.; Debieche, T. Hydrogeochemical evaluation of the Terminal Complex aquifer system in an arid area: A case study from the Biskra region, north-east Algeria. Environ. Earth Sci. 2023, 82, 471. [Google Scholar] [CrossRef]
- Abdelshafy, M.; Saber, M.; Abdelhaleem, A.; Abdelrazek, S.; Seleem, E. Hydrogeochemical processes and evaluation of groundwater aquifer at Sohag city, Egypt. Sci. Afr. 2019, 6, e00196. [Google Scholar] [CrossRef]
- Qian, K.; Sun, H.; Li, J.; Xie, X. Strontium isotopes as tracers for water–rock interactions of groundwater to delineate iodine enrichment in aquifer of Datong Basin, northern China. Appl. Geochem. 2023, 152, 105783. [Google Scholar] [CrossRef]
- Alkhadher, S.A.A.; Suratman, S.; Mohd Sallan, M.I.B. An evaluation of spatial and seasonal distributions of dissolved trace metals in the water of the natural wetlands. J. Environ. Manag. 2023, 345, 118464. [Google Scholar] [CrossRef] [PubMed]


Disclaimer/Publisher’s Note: The statements, opinions and data contained in all publications are solely those of the individual author(s) and contributor(s) and not of MDPI and/or the editor(s). MDPI and/or the editor(s) disclaim responsibility for any injury to people or property resulting from any ideas, methods, instructions or products referred to in the content. |
© 2025 by the authors. Licensee MDPI, Basel, Switzerland. This article is an open access article distributed under the terms and conditions of the Creative Commons Attribution (CC BY) license (https://creativecommons.org/licenses/by/4.0/).