


Abstract
Asthma and seasonal allergic rhinitis are common conditions affecting health, wellbeing, and work place productivity. Current pollen monitoring requires experienced technicians and has a lag of at least 24 h, which limits usefulness for patient management. We evaluated agreement of daily pollen concentrations from an automated real-time sampler, the Swisens Poleno Jupiter, with a traditional Hirst-type trap using technician counting over a single monitoring season in England. We used regression models to assess the impact of weather covariates on differences. Total pollen showed a strong correlation (r = 0.74) but moderate Intraclass Correlation (ICC = 0.52) between devices, due to concentrations (total and taxa level) being higher for the manual than the automated sampler. For individual pollen taxa, strong correlation and good agreement was observed for Pinus, Alnus and Fraxinus throughout the monitoring period. Strong correlation but low/moderate agreement was observed for Poaceae (grass), Betula, Quercus and Taxus/Cupressus. No correlation or agreement was observed for Corylus and Platanus. Temperature explained most of the variability between samplers. We conclude that daily total pollen can be tracked using an automated Poleno, as can grass within its flowering season, but Poleno recognition algorithms developed for mainland Europe need further refinements for UK species. Improving agreement in quantification is of particular importance given that current allergenic thresholds are based on manual readings.
1. Introduction
The prevalence of seasonal allergic rhinitis (hay fever) has increased significantly since the 1990s [1]. It is estimated that 10–30% of adults and over 40% of children are affected by allergic rhinitis [2], which can have a significant impact on health, quality of life, and work place productivity. We have previously shown that evolving climate patterns have led to longer seasons for bioaerosols and, for some species, higher peaks [3]. As climate patterns evolve, airborne allergens pose a potential increasing burden on public health. Together, these factors lead to a substantial financial burden both in terms of healthcare costs and workplace implications due to absenteeism or reduced work place productivity [4]. Accurate, timely reports on pollen levels would aid allergy management, allowing sufferers to take preventative measures when pollen levels are high and track specific pollens to help determine which types of pollen are causing symptoms. There is also a need for good-quality pollen data at a high enough temporal resolution to enable accurate forecasts.
Pollen monitoring has traditionally been based on manual technology involving a Hirst-type trap and light microscopy [5,6]. However, this methodology is time-consuming and requires experienced technicians. In addition, data are only available at low temporal resolution—usually daily averages with a delay of at least 24 h and up to 7 days from the time of pollen release. New technologies have opened up the possibility of automated pollen monitoring with hourly as opposed to daily concentration data in real time. Several devices, using either image recognition, such as the BAA500 (Helmut Hund GmbH, Wetzlar, Germany) and Pollen Sense APS400 (Pollen Sense, Provo, UT, USA) or optical particle measurement, including the Swisens Poleno Jupiter and Mars (Swisens AG, Emmen, Switzerland), Plair Rapid-E (Plair, Geneva, Switzerland), OPC (Alphasense, Essex, UK) and KH-3000 (Yamatronics, Yokosuka City, Japan), are now commercially available [7]. All of these devices provide real-time information at higher temporal resolution than is possible using the traditional Hirst trap and with less manual intervention. However, these devices are still relatively new and, in general, identify a smaller range of taxa than the traditional manual method with no standardisation available. The effects of differing climate conditions and pollution levels on pollen identification have also not been fully tested. In this study, we focus on the Swisens Poleno Jupiter and compare it to the traditional Hirst method.
The Poleno Jupiter uses high-resolution, image-based holographs alongside machine learning algorithms to identify pollen [8]. A number of publications have compared automatic sampling with the manual Hirst method for total pollen [9] or selected pollen species [10,11]. However, to date, no study has completed a comparison including early spring tree pollens and late summer pollens. Additionally, there are no comparisons from the UK, which experiences variable weather driven by Atlantic systems not experienced by continental Europe. As such, we aimed to compare the performance of the Swisens Poleno Jupiter with the traditional Hirst-style trap over the longest period to date, in an outdoor setting at the University of Leicester, UK, which has many years’ experience in pollen microscopy and supplies pollen data to the UK Meteorological Office for use in pollen forecasting.
2. Materials and Methods
2.1. Location
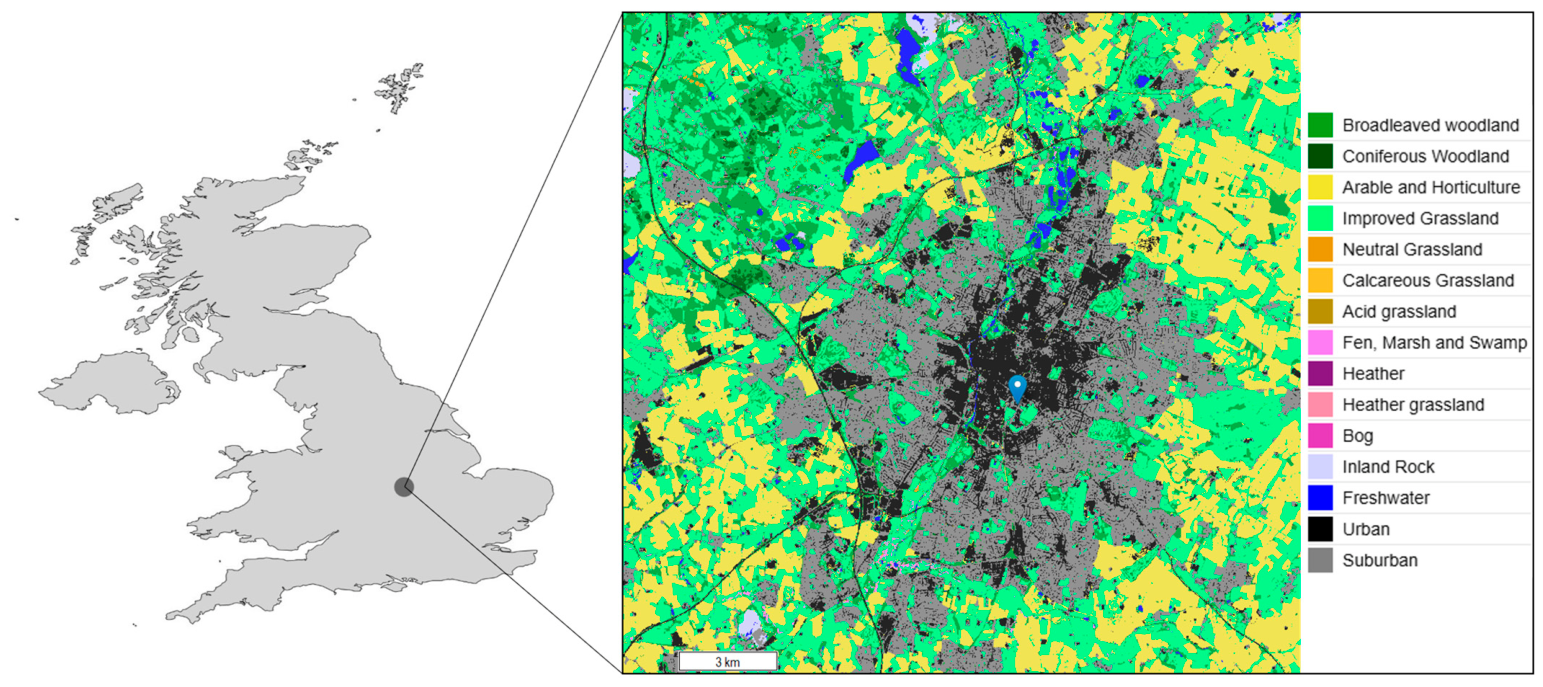
This campaign was carried out in the city of Leicester, in the East Midlands of England, UK (Figure 1), from 1 February to 30 September 2024. This region has a temperate, oceanic climate, characterised by mild winters, moderate summers and no dry season [12]. Leicester is an industrial city with a population of approximately 368,600 in 2021 [13] and is located about 90 km from the coast. The city is predominantly surrounded by agricultural land [14]. Both instruments were situated within 5.5 m of each other, 22 m above ground level (81 m above sea level, height at base of building) on the roof of the George Davis Centre building (52°37′32.5″ N, 1°07′23.6″ W) on the University of Leicester campus. This area of the city is characteristically urban, approximately 1 km south of the city centre and next to 69 acres of open parkland, with tree-lined avenues and 30 acres of cemetery, with mature trees and wildflower areas (Figure 1).
Figure 1.
Location of the pollen measurement site and main land uses in the surrounding area (UK CEH Environmental Information Data Centre).
2.2. Instruments
2.2.1. Hirst-Type Trap
A 7-day recording volumetric spore (Hirst-type) trap (Burkard Manufacturing Co., Ltd., Rickmansworth, UK) was used to sample the air according to British Aerobiology Federation guidelines [5,15]. Air is drawn into the device at a nominal 10 L/min and particles impact onto a thin film of petroleum jelly, mounted on a glass slide or rotating drum that moves past the sampling orifice at 2 mm/h. Sampling was continuous for 24 h or 7 days before the trapping surface needed to be changed. Pollen particles were identified and counted by light microscopy (Eclipse Ci, Nikon, Tokyo, Japan or Axioscope A1, Carl Zeiss, Oberkochen, Germany) at 200× magnification along 12 equidistant transverses, representing 12% (Nikon microscope, Tokyo, Japan) or 15.5% (Zeiss microscope, Oberkochen, Germany) of the total surface area of the slide. This is above the recommended minimum of 10% proposed by the European standard EN16868:2020. Pollen counts for each taxon identified from the 12 transverses were summed and a correction factor (derived from the area counted and volume of air sampled) applied to give an estimation of the pollen concentration per cubic metre of air per 24 h (pollen grains/m3). Total daily pollen was obtained by summing all individual taxa concentrations plus concentrations for those particles recognised as pollen but assigned to an “other pollen” category, as their morphology was not sufficiently identifiable to assign to an individual named taxa with certainty or they belonged to a taxon not routinely counted by this group.
2.2.2. Swisens Poleno Jupiter
Automated pollen monitoring was carried out using the Swisens Poleno Jupiter (Swisens AG, Emmen, Switzerland). The Poleno Jupiter is an airflow cytometer that continuously samples air at 40 L/min and collects the morphological and fluorescence properties of the particles it detects. When a particle is detected, two holographic images are taken, followed by fluorescence measurements using three different wavelengths of light (280 nm, 365 nm, 405 nm) [11]. The supervised machine learning algorithm, or classifier, developed by Swisens AG (the MCH Model 2022), was used to identify whether particles were pollen and the pollen type. Identification is based on using machine learning to compare the particle’s properties with those from extensive training datasets [16,17]. The current “MCH Model 2022” classifier that we used does not use the fluorescence data. Total daily pollen was obtained by summing the concentrations of all trained individual taxa available.
2.3. Weather Data
Temperature (maximum and minimum), precipitation, wind speed and direction were provided by Leicester City Council air quality group. The meteorological station was located 5 km from the trap site. Hourly data was averaged to provide daily weather data or summed in the case of precipitation to give total daily precipitation. Particulate matter of 2.5 μm or less (PM2.5) data was obtained from the Leicester University site for the Automatic Urban and Rural Network (AURN (LECU)) site (GB1026A, UKA00573) located approximately 550 m from the pollen trap site.
2.4. Statistical Analyses
Agreement between daily pollen concentrations measured by the Hirst and Poleno devices was assessed using the Intraclass Correlation Coefficient (ICC). A two-way random-effects model for absolute agreement of single measurements (ICC(2,1)) was used because both devices measured the same daily observations and absolute agreement between measurements was of primary interest. Unlike Pearson’s correlation coefficient, which quantifies the strength of the linear relationship between two variables, the ICC assesses the extent to which measurements from the two devices are both correlated and in agreement. The ICC is calculated from mean squares obtained through analysis of variance, which provide estimates of variance components based on the variability among measurements [18]. Higher ICC values indicate greater agreement between measurements. An ICC value close to 1 indicates good agreement between the two devices, 0.75–0.5 indicates moderate agreement, and a low ICC value close to 0 suggests poor agreement between the two devices. Pearson correlation coefficients were additionally calculated to quantify the strength of the linear relationship between measurements obtained from the two samplers. Paired t-tests were used to assess potential systematic differences in daily concentrations between the Hirst and Poleno devices, with p < 0.05 considered statistically significant.
The 2024 pollen seasons were defined for each taxon and sensor using the percentage method [19], where the season is defined as the period encompassing 95% of the annual pollen data. The start date was marked as the day on which 2.5% of the annual pollen total had accumulated, and the end date as the day on which 97.5% had been reached.
To evaluate the effect of potential environmental covariates, we fitted Generalised Least Squares (GLS) models with an autoregressive correlation structure of order 1 (AR(1)) to account for temporal autocorrelation in the daily time series. Two sets of models were constructed: (a) to evaluate the effect of potential confounding variables on the difference between the Hirst and Poleno sensors; and (b) to evaluate the association between potential confounders and the pollen concentration for each taxon, for each sensor independently. Covariates included daily average temperature, wind speed, wind direction, binary rainfall and mean PM2.5 concentration. All data analyses were conducted using R versions 4.2.3 and 4.5.1 (R Core Team, 2025). Analyses were performed within the RStudio (version 2026.1.0.392) integrated development environment (Posit Team, 2026).
3. Results
3.1. Device Reliability
For the duration of the campaign from 1 February to 30 September 2024, both the Hirst and Poleno Jupiter devices proved to be highly reliable with no missing data.
3.2. Total Pollen
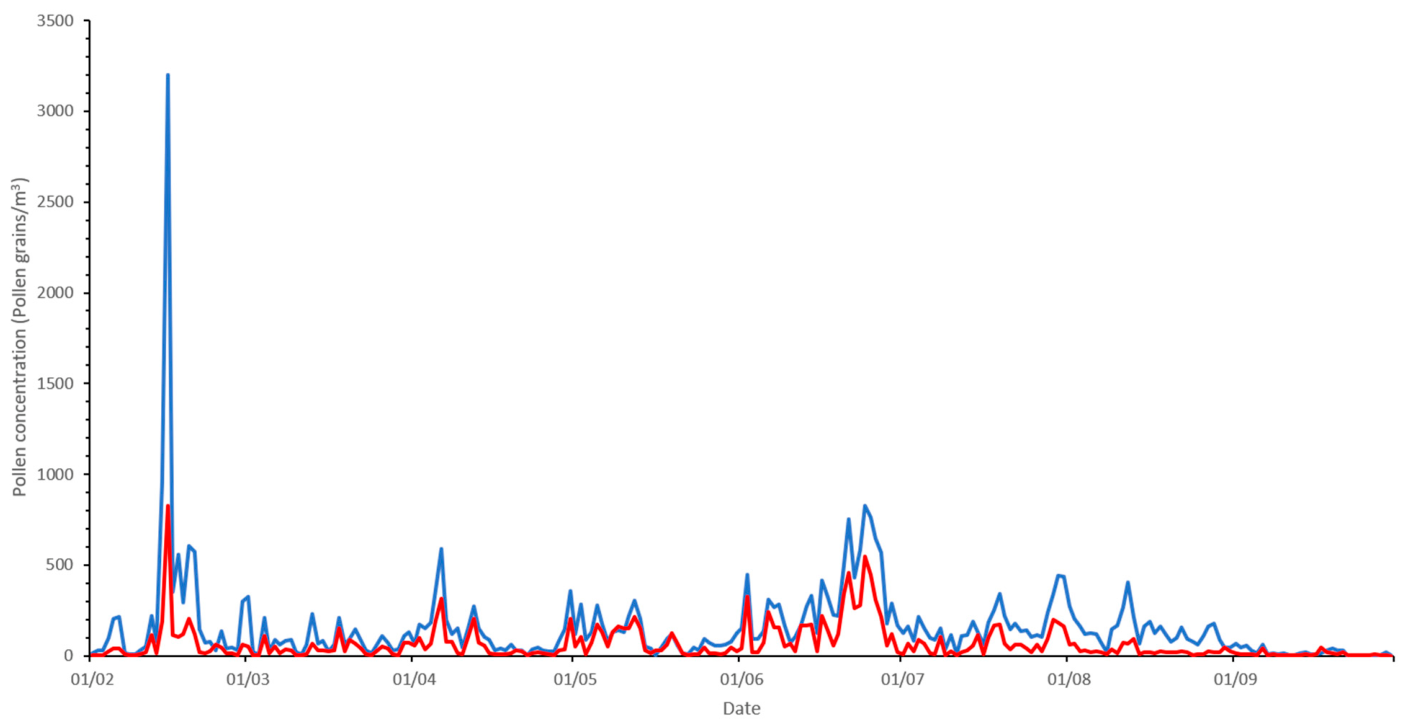
The time series for total pollen (Figure 2) demonstrated good temporal agreement between the two devices, which was shown by a Pearson correlation of r = 0.74, suggesting good tracking of fluctuations. However, values for daily pollen concentrations were consistently much higher for the manual observations than those for the automated sampler, with a significant p-value (p = 0.005, Table 1) for the difference, using a paired t-test and an ICC = 0.52 (Table 1), indicating moderate agreement. The total cumulative pollen concentration from February to September was 2.4 times greater for the manual Hirst trap (38,136 pollen grains/m3) compared to the automated Poleno (15,818 pollen grains/m3), which was driven by under-identification of most tree pollens (Supplementary Table S1).
Figure 2.
Time series for daily (24 h) total pollen concentrations across the 2024 campaign (1 February–30 September). Concentrations determined using the Hirst-style trap are shown in blue, while those determined by Poleno Jupiter are shown in red.
Table 1.
Statistical comparison (Intraclass Correlation Coefficient (ICC), paired t-test and Pearson correlation coefficient) of the Hirst and Poleno instruments across the main pollen taxa identified by both the Hirst style trap and Poleno Jupiter during the 2024 campaign.
3.3. Individual Pollen Taxa
Nine taxa identified by both devices were included in the statistical analysis and the agreement is summarised in Table 2. Weed and other pollens were only identified by Hirst sampling and not by the Poleno.
Table 2.
Pollen genera identified by the Hirst-style trap (Hirst) and/or the Poleno Jupiter MCH Model 2022 classifier (Poleno) (X indicates the pollen genera identified by that device) and the level of agreement between the two devices on the timing of those genera across the campaign (ICC; Good = 1–0.76, Moderate = 0.75–0.5, Poor < 0.5, r; Strong > 0.7).
3.3.1. Poaceae (Grass)
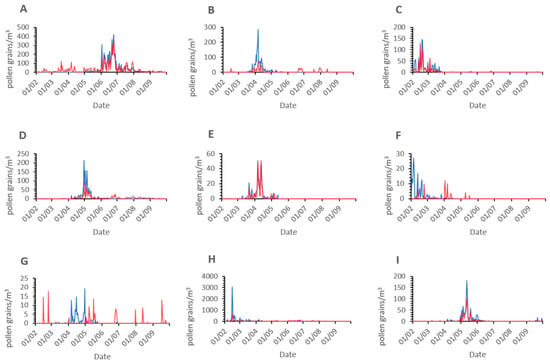
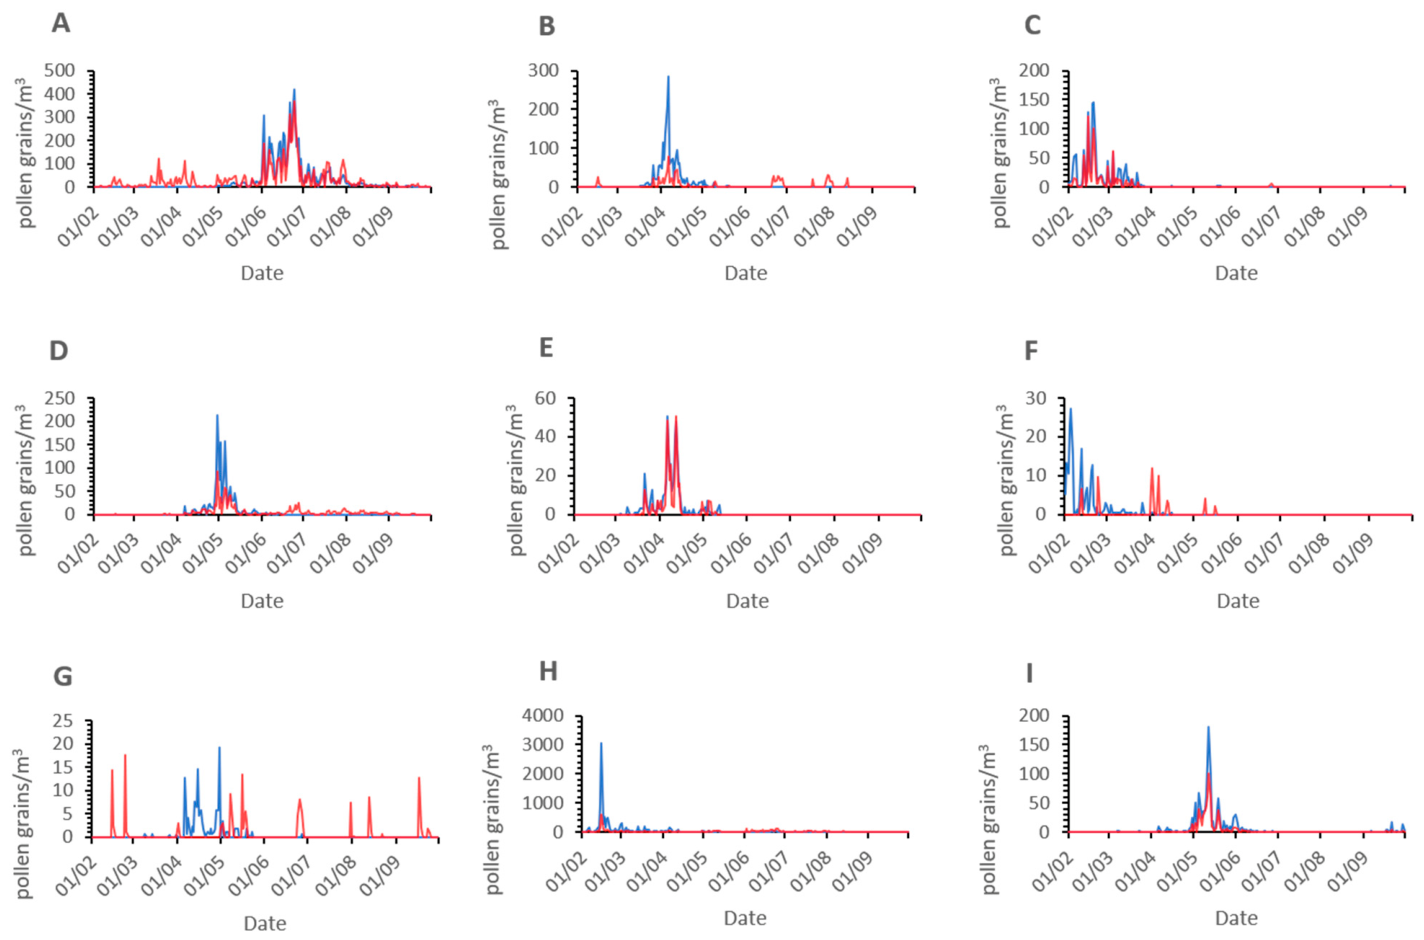
Poaceae pollen showed one of the greatest agreements between the two devices with an ICC = 0.88 and no significant difference in daily concentrations between devices (Table 1, p > 0.05) or timing (Pearson r = 0.90). Total pollen concentrations for the duration of the campaign were also very similar between the two devices (Supplementary Data Table S1). However, the timeseries for the Poleno (Figure 3A) showed considerable levels of false positives for Poaceae early in the year. These false positives reached concentrations above the threshold of 50 pollen grains/m3, considered to be high pollen levels [21]. The apparent Poleno peaks for Poaceae outside its flowering season in the UK coincided with Alnus and Taxus/Cupressus peaks in February and early March, Betula towards the end of March and April, and Quercus in May, as identified by microscopy.
Figure 3.
Time series for daily (24 h) pollen concentrations across the 2024 season (1 February–30 September) for (A) Poaceae, (B) Betula, (C) Alnus, (D) Quercus, (E) Fraxinus, (F) Corylus, (G) Platanus, (H) Taxus/Cupressus and (I) Pinus. Concentrations determined using the Hirst-style trap are shown in blue, while those determined by Poleno Jupiter are shown in red.
3.3.2. Tree Pollens with Good Agreement Between Devices
Alnus, Fraxinus and Pinus pollens (Figure 3C,E,I) showed close agreement between the two devices (ICC values; Alnus = 0.86, Fraxinus = 0.94 and Pinus = 0.83), with no false positive peaks outside the flowering season in the UK for any of these taxa. However, lower total pollen concentrations recorded by the Poleno compared to the Hirst trap (Supplementary Data Table S1), alongside the results of the paired t-test, show significant differences between the sampling methods (p < 0.005, Table 1), suggesting a systematic difference in the concentration of Alnus, Fraxinus and Pinus pollen peaks between the two devices.
3.3.3. Tree Pollens with Agreement Between the Devices Only During the Main Flowering Season
The timeseries for Betula, Quercus and Taxus/Cupressus (Figure 3B,D,H) showed close agreement on the timings of peaks between the two devices during the main flowering season for each taxon in the UK (Pearson’s r values; Betula = 0.72, Quercus = 0.89 and Taxus/Cupressus = 0.91). However, outside the main flowering season, the Poleno recorded false positive peaks, particularly later in the year (Figure 3B,D,H). The false positives are reflected in the low to moderate Intraclass Correlation Coefficients observed for these taxa (ICC values; Betula = 0.42, Quercus = 0.63 and Taxus/Cupressus = 0.36, Table 1).
The Poleno consistently reported lower concentrations over the campaign for Betula, Quercus and Taxus/Cupressus than the Hirst trap. These differences in concentration between the two devices reached significance in the paired t-test (p-values; Betula = 0.004, Quercus = 0.041 and Taxus/Cupressus = 0.044, Table 1), indicating a systematic bias in concentration determination between the two devices.
3.3.4. Tree Pollens with Poor Agreement Between Devices
Very little overlap was observed between the presence of Corylus and Platanus pollens observed by the two samplers (Figure 3F,G), with peaks being observed by the Hirst trap and not the Poleno and vice versa both within and outside the main flowering season in the UK. This was reflected by very low Intraclass Correlation Coefficients observed for both taxa (ICC values; Corylus = 0.05 and Platanus = −0.05). As shown for the previous tree pollens in this study, the pollen concentration for Corylus across the duration of this campaign showed a significant difference between the two devices (p = 0.014) and was greater for the Hirst compared to the Poleno (Supplementary Data Table S1). Although total Platanus concentrations for the two devices were very similar (Supplementary Data Table S1), the lack of agreement in the timing of detection of this pollen between devices (Pearson’s r = −0.05) raises uncertainty. The amount of Platanus pollen in the Leicester area was particularly low in 2024, which may have impacted on the accuracy of the data.
3.4. Season Characteristics
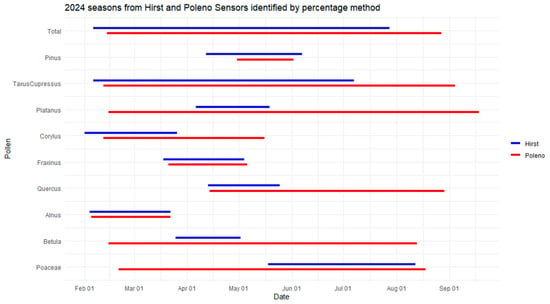
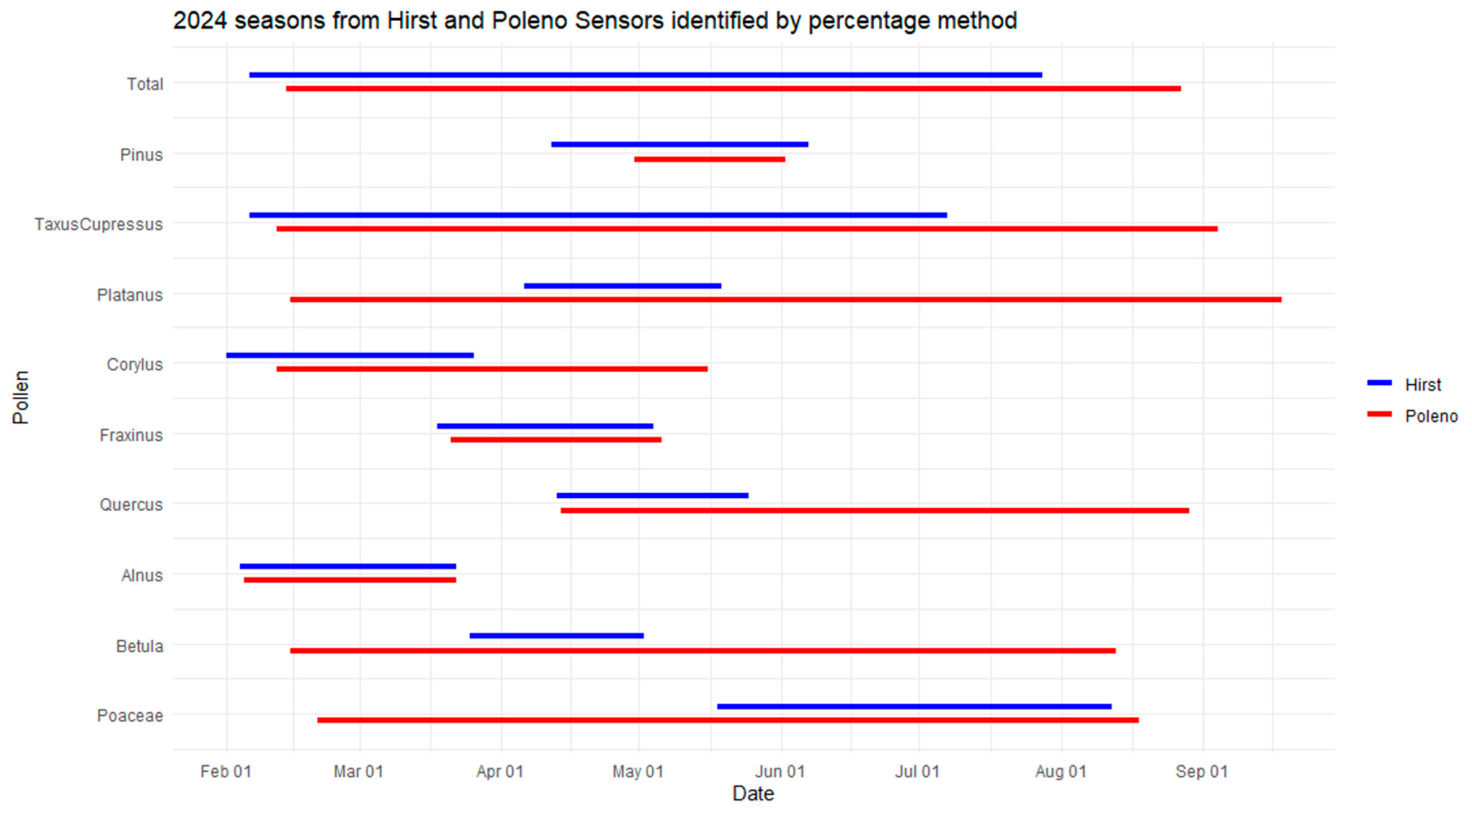
With the exception of Alnus and Fraxinus and season start for Quercus, there was little agreement between the Hirst and Poleno devices in the determination of the start, end and duration of season for individual taxa, using the 95% method [19] (Figure 4). In general, the data from the Poleno resulted in a later estimate of the start date for pollens, excluding Betula and Poaceae, which showed an earlier start. As a result of false positives, the Poleno also extended the end of the season, suggesting a later finish and a much longer overall season duration. For Alnus and Fraxinus, the two devices were in close agreement (within a few days) for the start, end and duration of their seasons. Similarly, the data from the two devices showed a comparable start to the season for Quercus; however, the Poleno data predicted a much later end to the season than the Hirst data due to false positives identified by the Poleno.
Figure 4.
Season duration for the main pollen taxa identified by both the Hirst-style trap and Poleno Jupiter during 2024. Season duration was determined by the 95% method using data from the Hirst trap (blue) and Poleno Jupiter (red).
3.5. Impact of Weather and Particulates
Both devices were in close agreement that temperature had the greatest influence on pollen levels, having a significant positive correlation with Betula, Quercus, Fraxinus, Pinus and Poaceae concentrations (Supplementary Data Table S2). Neither device indicated any correlation between PM2.5 and pollen levels.
When comparing the differences in pollen levels between the two devices (Table 3), temperature again was the most influential factor, showing a significant effect on the difference in pollen concentration measured by each device for Betula, Quercus, Taxus/Cupressus, Pinus and Poaceae. Rainfall had a significant effect on the difference in Poaceae concentration, while wind speed and direction had a significant effect on the difference in Alnus concentration measured by the two devices. PM2.5 levels showed a significant effect for the difference in levels of Quercus between the two devices, suggesting that air pollution may influence the ability of the Poleno to identify this taxon. No significant impact of PM2.5 was observed for the differences between the two samplers for any other taxa.
Table 3.
GLS regression analysis to model the differences between the Hirst-type trap and Poleno Jupiter as a function of meteorological variables and PM2.5 for each pollen taxa. Variables with a statistically significant effect (p < 0.05) on the difference between the two devices are highlighted in yellow. Rainfall (yes/no), average windspeed (m/s), average temperature (deg. C), average wind direction (deg.), mean PM2.5 (µg/m3).
4. Discussion
A comparison of the total pollen concentrations measured by the Poleno Jupiter automated pollen monitoring device with a Hirst trap and microscopy showed moderate agreement for variability and good agreement on the timing of total pollen across a year. Similarly, good agreement on timing was seen for grass and six of the eight tree pollens studied, within their respective flowering seasons. There was less consistency in agreement outside flowering seasons, with the Poleno registering, in some cases, substantial false positives. There was also a substantial underestimation of pollen concentrations by the automated device, which was 2.4-fold less for total pollen across the monitoring period, driven by differences in tree pollens. Weed pollens were not monitored at all by the automated device.
4.1. Differences in Concentrations
Underestimates in pollen concentrations by the Poleno could partially be due to the differences in defining total pollen between the two devices [11]. Some highly abundant tree pollens such as Salix (Willow), as well as weed pollens, including Urtica (Nettle), were included in the Hirst total but were not recognised by the Poleno’s “MCH Model 2022” classifier and therefore not included in the calculation of total pollen for the Poleno. However, individual taxa concentrations for most tree pollens, but not Poaceae, were consistently underestimated by the Poleno compared to the Hirst trap, with the level of underestimation varying by species. This suggests fundamental differences in the efficiency of the two devices in capturing pollen, the accuracy of pollen identification, and/or the determination of pollen concentration derived from initial sampling. The Hirst-style trap is the most widely used method for determining pollen concentration [22] and standards have been established to ensure comparability across networks [5,6]. As such, the Hirst-style trap is considered the standard with which all automated devices are compared. However, the Hirst trap is not without its limitations, including air flow variability between traps, shifting or loss of pollen during slide preparation, sampling error (particularly at low pollen concentrations, and if less than the recommended minimum of 10% of the slide is counted) and human error in identification and counting of pollen grains. Together, these drawbacks have been estimated to yield a general measurement error of 16 to 98% for daily averages, with greater errors for higher temporal resolutions [7,20,23]. Despite these limitations, a scaling factor is incorporated into the Poleno classifier algorithm in an attempt to achieve comparable pollen concentrations between the Poleno and Hirst devices [24]. This scaling factor varies between pollen taxa and has recently been shown to be region-specific [25]. The scaling factor used in the “MCH Model 2022” classifier used in this study was developed in Switzerland, and the consistent underestimation of pollen concentration by the Poleno compared to the Hirst trap suggests that this will need to be optimised for quantifying pollen concentrations in the UK.
4.2. Pollen Species Identification
The Hirst trap is reliant upon the skill and experience of the technicians carrying out the counting, which introduces an element of inter- and intra-observer variability. The Poleno uses a computer algorithm (or classifier) to identify individual pollen taxa so reducing the counting and identification variability when the same algorithm is used and, in the case of the Poleno, it is trained on pollen sourced in Switzerland. However, there remains a degree of uncertainty over the accuracy of the identification, particularly in regions at some distance from the source of the original training datasets [26]. Our UK study found the Poleno to show greatest agreement with the Hirst trap for the timing, if not the concentration, of Alnus, Fraxinus and Pinus, with little evidence of false positives outside the flowering season for these taxa. Studies in Finland [10] and Germany [11] reported that the Poleno gave false positives for Fraxinus before and after the flowering season, while a Finnish study [10] found significant confusion by the Poleno in distinguishing Alnus, Betula and Corylus. We also found good agreement between the two devices for Taxus/Cupressus, Betula, Quercus and Poaceae on timing but not concentration within the main flowering season. However, outside the flowering season for these taxa, the Poleno detected what could only be false positives, as concentrations reported by the Poleno were too great to have been missed by the Hirst system. Taxus/Cupressus peaks in the summer months coincided with high Poaceae days, while Betula and Quercus peaks in the summer coincided with high Urtica (Supplementary Data Figure S1) and Poaceae days and the Betula peak early in the year with high Taxus/Cupressus. Although these genera are morphologically different according to light microscopy, distinguishing features, such as number of pores and internal structures, may be lost to holography, leading to confusion in their classification by the Poleno. Early peaks of Poaceae observed by the Poleno in March and April exceeded public health thresholds (50 pollen grains/m3) [21], highlighting the potential for misleading public alerts.
4.3. Misclassification of Pollen Types
Significant disagreement was found between the Poleno and Hirst trap in identifying Corylus (Hazel) and Platanus (Plane) pollens, with little overlap in the time series for either pollen between the two devices. We hypothesised that the underrepresentation of Corylus by the Poleno may be related to algorithm set-up. To reduce out-of-season detections, the Poleno’s classifier applies a threshold mechanism: a pollen type is only included in concentration data if its detection exceeds a set threshold over the preceding 48 h [26]. The season was already underway before the monitoring campaign began in 2024 and, as early Corylus events occurred prior to the campaign start, the threshold was not triggered, possibly resulting in missed early-season concentrations. However, Hirst and Poleno data from the start of the 2025 season (Supplementary Data Figure S2), where monitoring was initiated before the beginning of the Corylus season, would indicate that this is not the complete answer, as early peaks in Corylus pollen were still missed by the Poleno. Much of the Corylus pollen identified by the Poleno appeared to be false positives and occurred when the Poleno registered a high water value or when Betula pollen levels were high (April). This was in contrast with a study in Finland [10] which, although observing confusion between Alnus, Betula and Corylus during the Betula pollen season, found that Corylus was correctly identified earlier in the year when there was no Betula present. These observations underscore the need for further validation of automated systems, particularly in regions different from those in which the classifier was developed. The misidentification of pollen types leading to false positives by the Poleno would also impact the season characteristics, elongating season estimates compared to those derived from the Hirst data and local phenological information.
4.4. Factors Affecting Differences Between Poleno and Hirst Detection—Meteorology and Air Pollution
Both devices were in agreement that temperature had a significant effect on pollen levels, as has been shown in other studies [27,28]. Temperature was also the factor with the greatest influence on the differences in pollen concentration between the Poleno and Hirst-style trap. As suggested by González-Alonso et al. [29], these effects may be due to the false positive classifications occurring outside the main flowering season. In such cases, atypical temperatures during off-season periods may create apparent correlations between temperature and device discrepancies. Interestingly, the difference in Quercus concentration between the two devices was also correlated with PM2.5 levels, suggesting that identification of this pollen by the Poleno was affected by particulate pollution, an observation also made by González-Alonso et al. [29].
5. Conclusions
The rapid development of automated pollen monitoring devices means that the real-time reporting of pollen levels for public information and forecasting is becoming a viable possibility. However, discrepancies between the automated Poleno Jupiter and traditional monitoring using microscopy suggest careful evaluation is needed before the adoption of automated concentrations in pollen forecasts and clinical practice, with issues identified here for tree pollens and a lack of information on weed pollens. Our results and the differences between studies in different countries highlight the need for ongoing development of the classification algorithms that are country- and/or region-specific. In particular, algorithms for automated systems may need adjusting for better comparability in quantification with manual readings, given that the allergenic thresholds of clinical relevance are based on concentrations from manual readings.
Supplementary Materials
The following supporting information can be downloaded at https://www.mdpi.com/article/10.3390/atmos17070705/s1: Table S1. Total pollen concentration for the campaign (1 February–30 September) for each of the main pollen taxa identified by both the Hirst-style trap and Poleno Jupiter during 2024; Figure S1. Time series for daily (24 h) pollen concentrations across the 2024 campaign (1 February–30 September) for Urtica (Nettle) pollen; Table S2. GLS regression analysis to model the effects of meteorological variables and PM2.5 on each pollen taxa. Variables with a statistically significant effect (p < 0.05) on pollen concentration are highlighted in yellow. Rainfall (yes/no), average windspeed (m/s), average temperature (deg. C), average wind direction (deg.), mean PM2.5 (µg/m3); Figure S2. Time series for daily (24 h) pollen concentrations from the 2025 campaign (1 January–1 May) for Corylus (Hazel) pollen. Concentrations determined using the Hirst-style trap are shown in blue, while those determined by the Poleno Jupiter are shown in red.
Author Contributions
Conceptualization, A.L.H.; methodology, L.C., F.A.S., J.S. and K.E.; formal analysis, K.E. and F.A.S.; data curation, J.S. and F.A.S.; writing—original draft preparation, F.A.S.; writing—review and editing, F.A.S., K.E., J.S., L.C. and A.L.H.; supervision, L.C. and A.L.H.; funding acquisition, A.L.H. All authors have read and agreed to the published version of the manuscript.
Funding
This research was funded by the National Institute for Health and Care Research (NIHR) Leicester Biomedical Research Centre (BRC), grant number NIHR203327. We also acknowledge funding from the NIHR Health Protection Research Unit (HPRU) in Chemical Threats and Hazards, a partnership among the UK Health Security Agency (UKHSA), the Health and Safety Executive (HSE), and the University of Leicester, grant number NIHR207293. The views expressed are those of the author(s) and not necessarily those of the NIHR, the Department of Health and Social Care, UKHSA, or HSE.
Institutional Review Board Statement
Not applicable.
Informed Consent Statement
Not applicable.
Data Availability Statement
Dataset available on request from the authors.
Acknowledgments
The authors would like to thank Leicester City Council air quality group for meteorological data.
Conflicts of Interest
The authors declare no conflicts of interest.
Abbreviations
The following abbreviations are used in this manuscript:
| AR(1) | Autoregressive correlation structure of order 1 |
| ICC | Intraclass Correlation Coefficient |
| PM2.5 | Particulate matter of 2.5 μm or less |
References
- Nur Husna, S.M.; Tan, H.-T.T.; Md Shukri, N.; Mohd Ashari, N.S.; Wong, K.K. Allergic Rhinitis: A Clinical and Pathophysiological Overview. Front. Med. 2022, 9, 874114. [Google Scholar] [CrossRef] [Scilit]
- Pawankar, R.; Canonica, G.W.; Holgate, S.T.; Lockey, R.F.; Blaiss, M.S. WAO white book on allergy. World Allergy Organ. 2011, 3, 156–157. [Google Scholar]
- Lam, H.C.Y.; Anees-Hill, S.; Satchwell, J.; Symon, F.; Macintyre, H.; Pashley, C.H.; Marczylo, E.L.; Douglas, P.; Aldridge, S.; Hansell, A. Association between ambient temperature and common allergenic pollen and fungal spores: A 52-year analysis in central England, United Kingdom. Sci. Total Environ. 2024, 906, 167607. [Google Scholar] [CrossRef] [Scilit] [PubMed]
- Cardell, L.-O.; Olsson, P.; Andersson, M.; Welin, K.-O.; Svensson, J.; Tennvall, G.R.; Hellgren, J. TOTALL: High cost of allergic rhinitis—A national Swedish population-based questionnaire study. npj Prim. Care Respir. Med. 2016, 26, 15082. [Google Scholar] [CrossRef] [Scilit] [PubMed]
- Caulton, E.; Lacey, M.; Federation, B.A.; Pollen, N.; Bureau, H. Airborne Pollens and Spores: A Guide to Trapping and Counting; British Aerobiology Federation: Worcester, UK, 1995. [Google Scholar]
- Galán, C.; Smith, M.; Thibaudon, M.; Frenguelli, G.; Oteros, J.; Gehrig, R.; Berger, U.; Clot, B.; Brandao, R.; Group, E.Q.W. Pollen monitoring: Minimum requirements and reproducibility of analysis. Aerobiologia 2014, 30, 385–395. [Google Scholar] [CrossRef] [Scilit]
- Buters, J.; Clot, B.; Galán, C.; Gehrig, R.; Gilge, S.; Hentges, F.; O’Connor, D.; Sikoparija, B.; Skjoth, C.; Tummon, F.; et al. Automatic detection of airborne pollen: An overview. Aerobiologia 2024, 40, 13–37. [Google Scholar] [CrossRef] [Scilit]
- Farooq, Q.; Oteros, J.; Galán, C. Advancing in the pollen frontier: A comprehensive evaluation and meta-analysis of automatic pollen monitoring systems. Aerobiologia 2025, 41, 527–546. [Google Scholar] [CrossRef] [Scilit]
- Tummon, F.; Adamov, S.; Clot, B.; Crouzy, B.; Gysel-Beer, M.; Kawashima, S.; Lieberherr, G.; Manzano, J.; Markey, E.; Moallemi, A.; et al. A first evaluation of multiple automatic pollen monitors run in parallel. Aerobiologia 2024, 40, 93–108. [Google Scholar] [CrossRef] [Scilit]
- Sofiev, M.; Sofieva, S.; Palamarchuk, J.; Šaulienė, I.; Kadantsev, E.; Atanasova, N.; Fatahi, Y.; Kouznetsov, R.; Kuula, J.; Noreikaite, A.; et al. Bioaerosols in the atmosphere at two sites in Northern Europe in spring 2021: Outline of an experimental campaign. Environ. Res. 2022, 214, 113798. [Google Scholar] [CrossRef] [Scilit] [PubMed]
- Maya-Manzano, J.M.; Tummon, F.; Abt, R.; Allan, N.; Bunderson, L.; Clot, B.; Crouzy, B.; Daunys, G.; Erb, S.; Gonzalez-Alonso, M.; et al. Towards European automatic bioaerosol monitoring: Comparison of 9 automatic pollen observational instruments with classic Hirst-type traps. Sci. Total Environ. 2023, 866, 161220. [Google Scholar] [CrossRef] [Scilit] [PubMed]
- Beck, H.E.; Zimmermann, N.E.; McVicar, T.R.; Vergopolan, N.; Berg, A.; Wood, E.F. Present and future Köppen-Geiger climate classification maps at 1-km resolution. Sci. Data 2018, 5, 180214. [Google Scholar] [CrossRef] [Scilit] [PubMed]
- Office for National Statistics. Population and household estimates, England and Wales: Census 2021. Available online: https://www.ons.gov.uk/peoplepopulationandcommunity/populationandmigration/populationestimates/datasets/populationandhouseholdestimatesenglandandwalescensus2021 (accessed on 28 June 2022).
- Pashley, C.H.; Fairs, A.; Edwards, R.E.; Bailey, J.P.; Corden, J.M.; Wardlaw, A.J. Reproducibility between counts of airborne allergenic pollen from two cities in the East Midlands, UK. Aerobiologia 2009, 25, 249–263. [Google Scholar] [CrossRef] [Scilit]
- Lacey, M.; West, J. The Air Spora: A Manual for Catching and Identifying Airborne Biological Particles; Springer: Dordrecht, The Netherlands, 2006. [Google Scholar]
- Sauvageat, E.; Zeder, Y.; Auderset, K.; Calpini, B.; Clot, B.; Crouzy, B.; Konzelmann, T.; Lieberherr, G.; Tummon, F.; Vasilatou, K. Real-time pollen monitoring using digital holography. Atmos. Meas. Tech. 2020, 13, 1539–1550. [Google Scholar] [CrossRef] [Scilit]
- Erb, S.; Graf, E.; Zeder, Y.; Lionetti, S.; Berne, A.; Clot, B.; Lieberherr, G.; Tummon, F.; Wullschleger, P.; Crouzy, B. Real-time pollen identification using holographic imaging and fluorescence measurements. Atmos. Meas. Tech. 2024, 17, 441–451. [Google Scholar] [CrossRef] [Scilit]
- Koo, T.K.; Li, M.Y. A Guideline of Selecting and Reporting Intraclass Correlation Coefficients for Reliability Research. J. Chiropr. Med. 2016, 15, 155–163. [Google Scholar] [CrossRef] [Scilit] [PubMed]
- Adams-Groom, B.; Skjoth, C.A.; Selby, K.; Pashley, C.; Satchwell, J.; Head, K.; Ramsay, G. Regional calendars and seasonal statistics for the United Kingdom’s main pollen allergens. Allergy 2020, 75, 1492–1494. [Google Scholar] [CrossRef] [Scilit] [PubMed]
- Adamov, S.; Lemonis, N.; Clot, B.; Crouzy, B.; Gehrig, R.; Graber, M.-J.; Sallin, C.; Tummon, F. On the measurement uncertainty of Hirst-type volumetric pollen and spore samplers. Aerobiologia 2024, 40, 77–91. [Google Scholar] [CrossRef] [Scilit]
- Smith, M.; Emberlin, J. Constructing a 7-day ahead forecast model for grass pollen at north London, United Kingdom. Clin. Exp. Allergy 2005, 35, 1400–1406. [Google Scholar] [CrossRef] [Scilit] [PubMed]
- Buters, J.T.M.; Antunes, C.; Galveias, A.; Bergmann, K.C.; Thibaudon, M.; Galán, C.; Schmidt-Weber, C.; Oteros, J. Pollen and spore monitoring in the world. Clin. Transl. Allergy 2018, 8, 9. [Google Scholar] [CrossRef] [Scilit] [PubMed]
- Tummon, F.; Adams-Groom, B.; Antunes, C.M.; Bruffaerts, N.; Buters, J.; Cariñanos, P.; Celenk, S.; Choël, M.; Clot, B.; Cristofori, A.; et al. The role of automatic pollen and fungal spore monitoring across major end-user domains. Aerobiologia 2024, 40, 57–75. [Google Scholar] [CrossRef] [Scilit]
- Meurville, M.P.; Clot, B.; Erb, S.; Lbadaoui-Darvas, M.; Tummon, F.; Lieberherr, G.D.; Crouzy, B. A methodological framework for evaluating real-time bioaerosol classification algorithms. Atmos. Meas. Tech. 2026, 19, 3427–3444. [Google Scholar] [CrossRef] [Scilit]
- Horender, S.; Lieberherr, G.; Crouzy, B.; Marsteen, L.; Bäcklund, A.; Ramfjord, H.; Ochsenkuehn, M.; Ravani, F.; Kambolis, A.; Vasilatou, K. Scaling number concentration measurements from bioaerosol monitors using Hirst-type samplers. Aerobiologia 2026, 42, 17. [Google Scholar] [CrossRef] [Scilit]
- Crouzy, B.; Lieberherr, G.; Tummon, F.; Clot, B. False positives: Handling them operationally for automatic pollen monitoring. Aerobiologia 2022, 38, 429–432. [Google Scholar] [CrossRef] [Scilit]
- Cristofolini, F.; Cristofori, A.; Corradini, S.; Gottardini, E. The impact of temperature on increased airborne pollen and earlier onset of the pollen season in Trentino, Northern Italy. Reg. Environ. Change 2024, 24, 60. [Google Scholar] [CrossRef] [Scilit]
- Adams-Groom, B.; Selby, K.; Derrett, S.; Frisk, C.A.; Pashley, C.H.; Satchwell, J.; King, D.; McKenzie, G.; Neilson, R. Pollen season trends as markers of climate change impact: Betula, Quercus and Poaceae. Sci. Total Environ. 2022, 831, 154882. [Google Scholar] [CrossRef] [Scilit] [PubMed]
- González-Alonso, M.; Oteros, J.; Widmann, M.; Maya-Manzano, J.M.; Skjøth, C.; Grewling, L.; O’Connor, D.; Sofiev, M.; Tummon, F.; Crouzy, B.; et al. Influence of meteorological variables and air pollutants on measurements from automatic pollen sampling devices. Sci. Total Environ. 2024, 931, 172913. [Google Scholar] [CrossRef] [Scilit] [PubMed]

Disclaimer/Publisher’s Note: The statements, opinions and data contained in all publications are solely those of the individual author(s) and contributor(s) and not of MDPI and/or the editor(s). MDPI and/or the editor(s) disclaim responsibility for any injury to people or property resulting from any ideas, methods, instructions or products referred to in the content. |
© 2026 by the authors. Licensee MDPI, Basel, Switzerland. This article is an open access article distributed under the terms and conditions of the Creative Commons Attribution (CC BY) license.