1. Introduction
In recent years, the growing demand for fine-scale meteorological information across multiple sectors has made local-scale temperature forecasting an essential foundation for agriculture, tourism management, energy dispatching, and public safety. Agricultural production, for example, relies on field-level temperature forecasts to guide sowing schedules, frost prevention, and moisture regulation, as microclimatic conditions often deviate substantially from regional averages [
1]. In emergency management, extreme temperature events such as cold waves and heatwaves can severely threaten human safety and disrupt social operations, thereby requiring short-term, high-accuracy temperature predictions [
2]. The need for ultra-local refined temperature forecasts is particularly prominent in high-elevation scenic areas with complex terrain, where strong topographic relief and heterogeneous surface conditions induce significant horizontal temperature gradients [
3].
Although numerical weather prediction models have made notable advances in spatial resolution and data assimilation, providing a solid basis for refined forecasting [
4], substantial gaps remain in accurately representing near-surface temperature variability over complex mountainous regions. Influenced by terrain shielding, radiative contrasts, wind-field structures, and heterogeneous land-surface conditions, many sub-kilometer-scale physical processes cannot be explicitly resolved by the models, resulting in cumulative systematic biases [
5]. In the mountainous areas of southern China, forecasts produced by models with horizontal resolutions of 3 km still commonly exhibit warm or cold biases and struggle to capture detailed features such as valley cold-air pooling and slope-dependent temperature gradients [
3]. Consequently, raw numerical weather prediction outputs are insufficient for meeting the requirements of ultra-local forecasting services, making targeted bias-correction strategies indispensable.
Traditional statistical post-processing techniques—such as Model Output Statistics [
6], Kalman filtering [
7], and ensemble averaging approaches [
8]—have been widely applied in operational forecasting to improve model outputs through historical error statistics. However, because these methods generally rely on linear assumptions, they struggle to characterize the nonlinear structure of error fields in regions with complex terrain [
9] and tend to perform less effectively under extreme temperature conditions [
10]. In recent years, artificial intelligence (AI) techniques, including random forests, support vector machines, and deep learning, have shown remarkable potential in temperature bias correction. These methods can automatically learn sophisticated relationships between forecast errors and factors such as topography, radiation, and air-mass characteristics, achieving higher accuracy in predicting extreme temperatures [
11,
12]. Nevertheless, in mountainous areas where observations are sparse and elevation varies sharply, challenges such as limited training samples, insufficient representativeness of features, and constrained model generalization remain substantial [
13].
To more effectively utilize numerical model element-based forecast products, the Zhejiang Meteorological Observatory has conducted comprehensive analyses of model forecast errors and developed corresponding correction strategies using observational data from township-level weather stations across Zhejiang Province. Based on these efforts, a dynamic multi-model integration workflow has been established. This workflow accounts for the consistency among different forecast variables and incorporates high-resolution data from the European Center for Medium-Range Weather Forecasts, the Japan Meteorological Agency, and the National Centers for Environmental Prediction. By applying error statistics across forecast lead times, the system dynamically adjusts the weights of individual models within the integrated product and performs fine-scale corrections on forecast variables using recent error characteristics. The resulting enhanced objective forecast product—Zhejiang Operational Consensus Forecasts (ZJOCF)—features a spatial resolution of 2.5 km and provides hourly predictions of key meteorological variables. It has now become a fundamental data source for regional operational forecasting in Zhejiang Province.
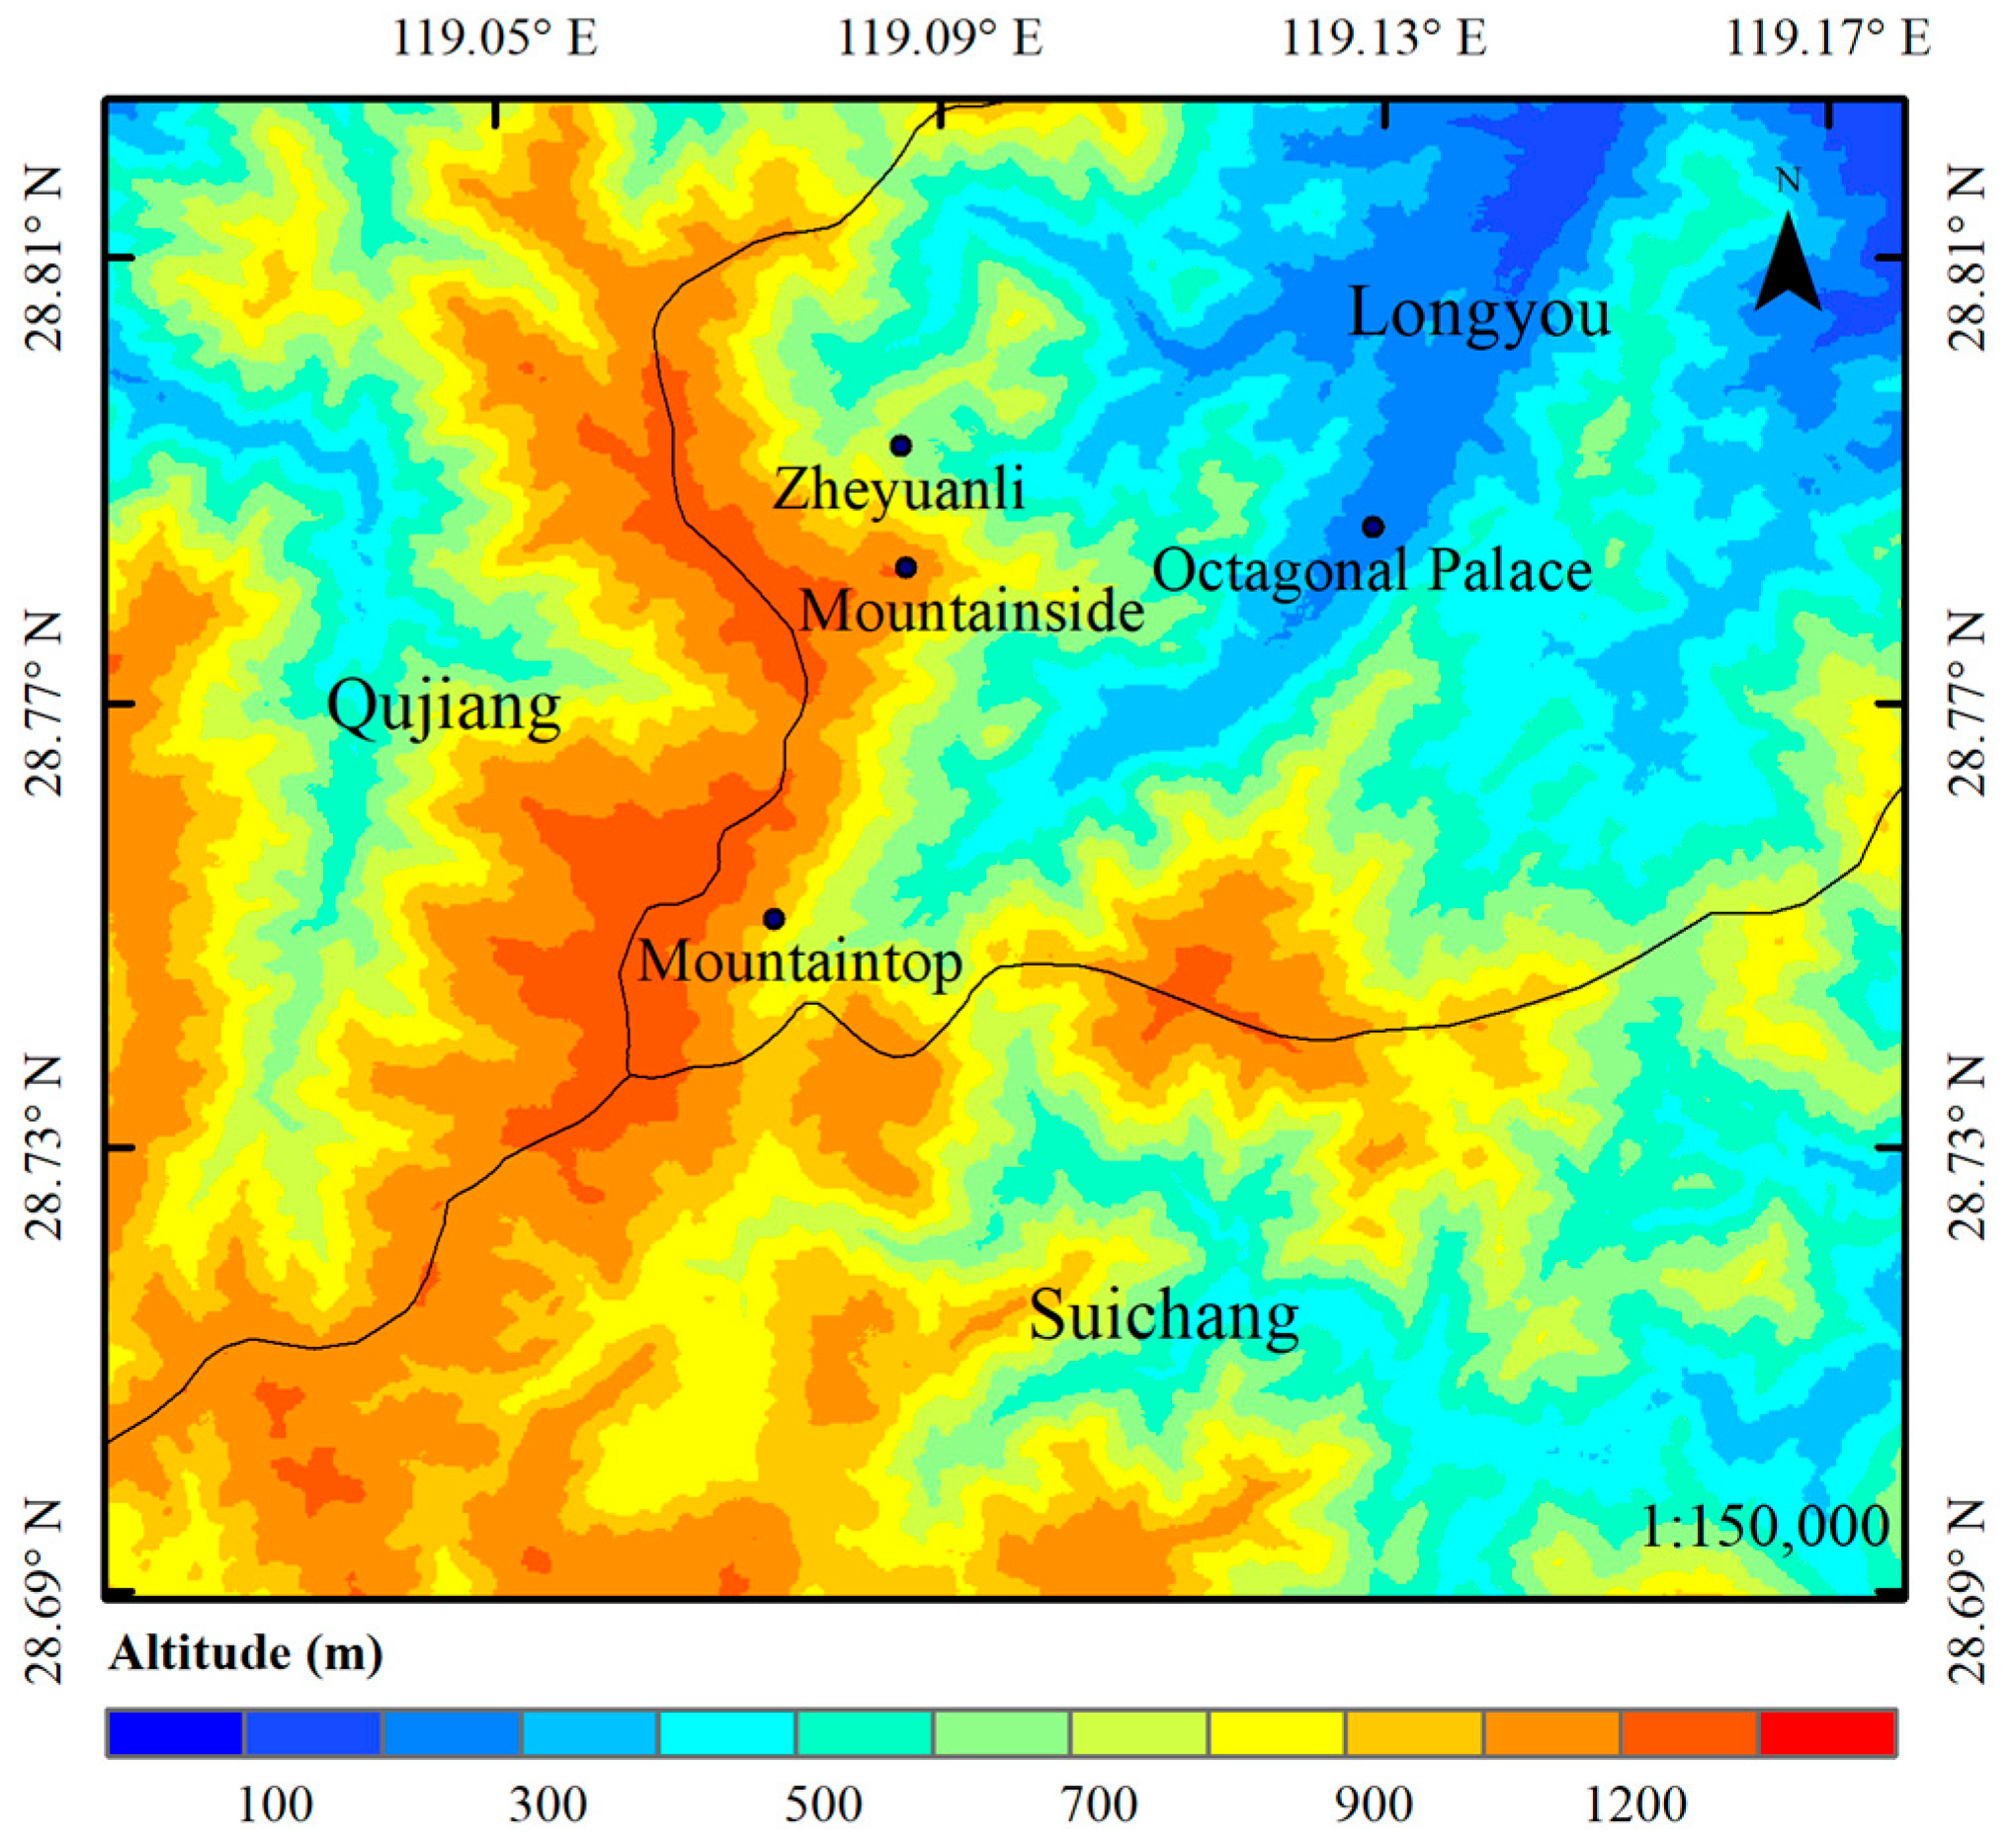
Liuchun Lake area, the study area considered in this paper, is situated in the high-elevation mountainous region of western Zhejiang, where steep terrain and highly variable microclimates lead to pronounced vertical temperature gradients driven by thermal circulations, localized subsidence, and valley cold-air pooling. With the rapid development of tourism in this area, the need for short-term, fine-scale forecasts of key meteorological variables—particularly temperature—has become increasingly urgent. However, under such complex topographic influences, the current ZJOCF model still exhibits marked systematic biases in the Liuchun Lake area, especially during nighttime radiative cooling and early-morning cold-air accumulation, which limits its effectiveness in real-time operational applications.
From a post-processing perspective, grid-based correction methods can preserve the spatial structure of forecast fields but depend heavily on dense observations, resulting in higher implementation costs and reduced timeliness. In contrast, station-based correction treats individual observation stations as the basic units, offering a simpler structure and higher operational efficiency, making it more suitable for mountainous regions where rapid response is essential [
14]. Therefore, applying station-level corrections to ZJOCF temperature forecasts is of considerable practical significance and operational value for the Liuchun Lake area and other mountainous areas with similar complexity.
This study utilizes observational data from four weather stations distributed at different elevations in the Liuchun Lake area—Bajiaodian, Octagonal Palace, Liuchun Lake Mid-slope, and the Mountaintop station. We first conduct a systematic analysis of ZJOCF temperature forecast biases under complex terrain conditions and examine how elevation and local climate factors influence these errors. On this basis, we develop a machine-learning-based station-level correction model to improve the accuracy and stability of ZJOCF temperature forecasts in mountainous environments. Although the verification is conducted for the Liuchun Lake area, the main error characteristics identified in this study are closely related to general forecasting difficulties over complex terrain, including strong elevation dependence, local thermal contrasts, and terrain-induced microclimatic effects. By comparing forecast performance before and after correction, we assess the practical effectiveness of AI-based correction methods in complex mountainous regions and provide a feasible technical pathway and practical reference for refined meteorological services in Liuchun Lake and similar scenic areas.
3. Results
3.1. Accuracy Characteristics and Correction Performance of ZJOCF Temperature Forecasts Under Different Elevation Backgrounds
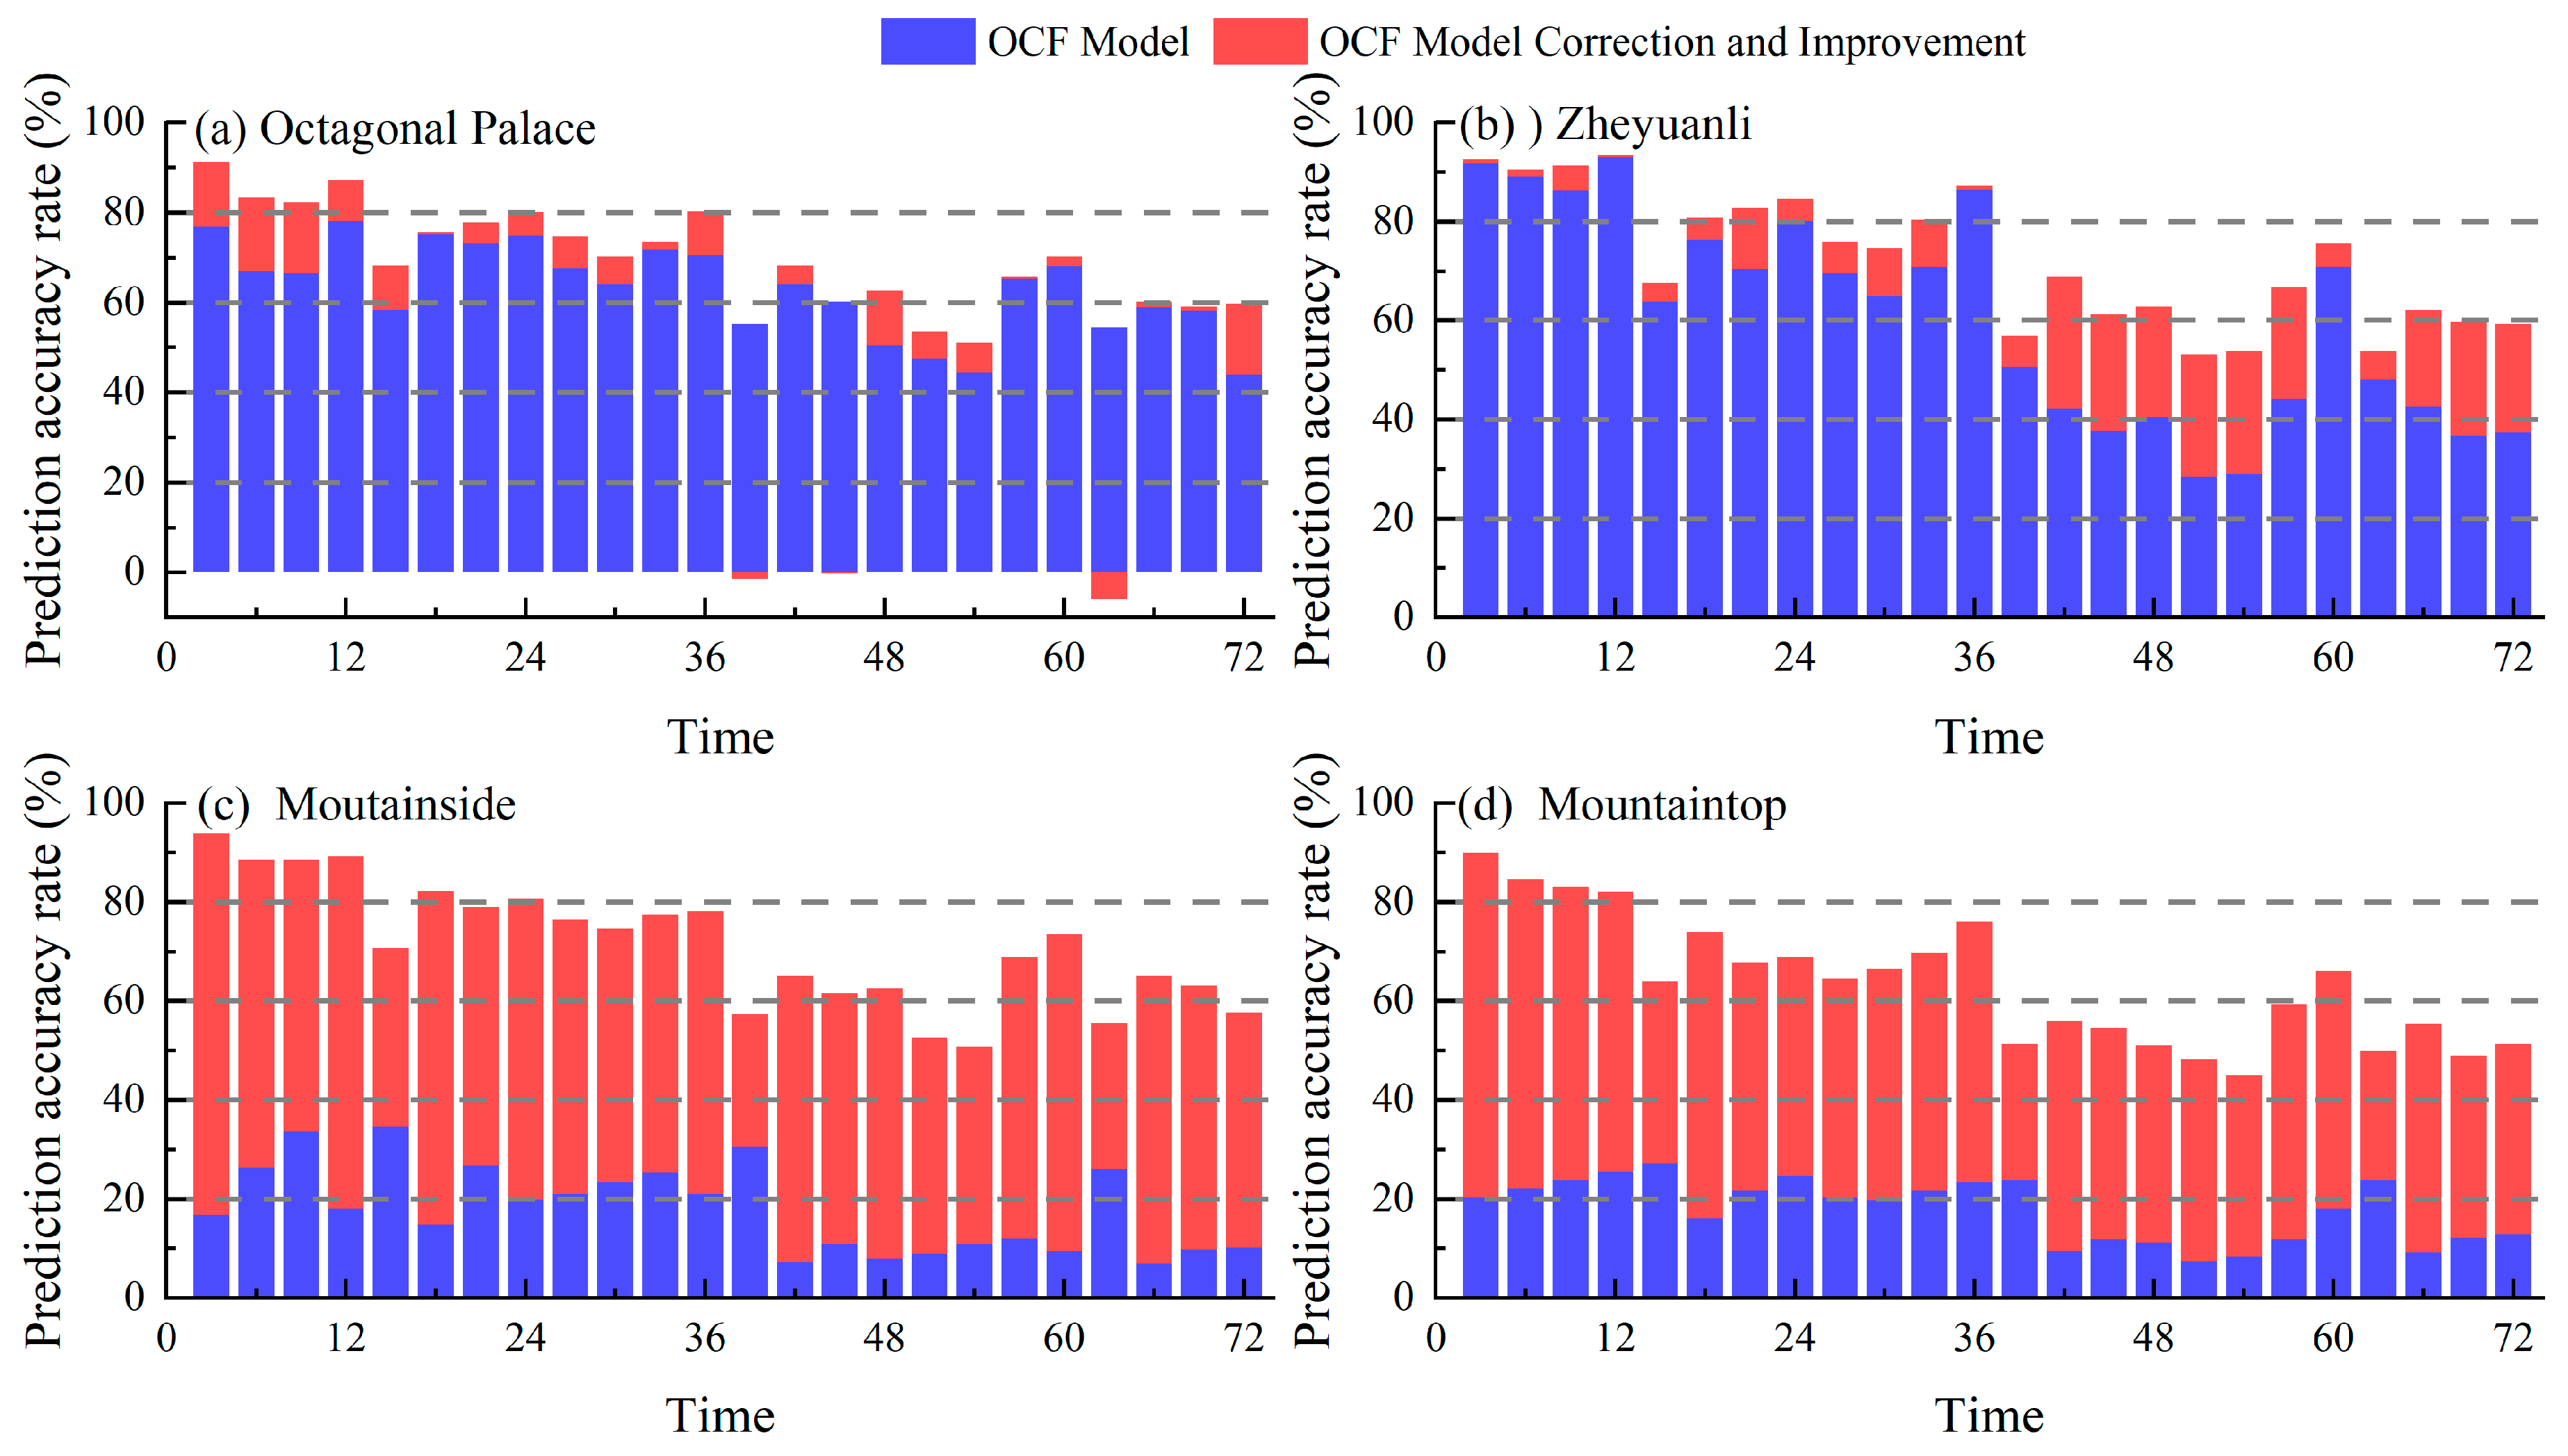
To systematically assess the effectiveness of the correction method, the forecasts before and after correction were evaluated from four aspects: forecast accuracy, MAE, error-distribution characteristics, and extreme-error control. This section first examines the accuracy dimension by comparing the 72 h hourly temperature-forecast performance at four stations: Bajiaodian (273 m), Octagonal Palace (608 m), Mountainside (903 m), and Mountaintop (1327 m) (
Figure 2). The results indicate that the raw forecast accuracy decreases markedly with increasing elevation, accompanied by substantially enhanced temporal fluctuations. The low-elevation stations, Bajiaodian and Octagonal Palace, exhibit relatively stable performance, with pre-correction accuracies of 63% and 60.5%, respectively. However, noticeable instability remains in the mid-to-late forecast periods—for example, the accuracy at Bajiaodian decreases to 55.1% at the 39th hour, while Octagonal Palace reaches a minimum of only 28.4% at the 51st hour. After correction, the accuracies at both stations increase significantly to approximately 69–70%, with markedly smoother temporal curves and prolonged periods of high accuracy.
In contrast, improvement at the high-elevation stations is even more pronounced. Before correction, the forecast accuracies at the Mountainside and summit stations are only about 18% and 17.8%, respectively, with the strongest fluctuations occurring during the 24–48 h period, where values remain below 20% for most hours. After correction, accuracy at the mid-slope station increases to 71.3%, and that at the summit station rises to 40.8%. Notably, the mid-slope station exhibits an improvement exceeding 50 percentage points, highlighting the strong capability of the correction method in mitigating systematic biases in high-altitude regions. Additionally, all four stations show substantial improvements in temporal consistency after correction—particularly Bajiaodian and Octagonal Palace, which maintain accuracies above 60% almost throughout the full 72 h period—demonstrating a marked enhancement in forecast stability and practical usability.
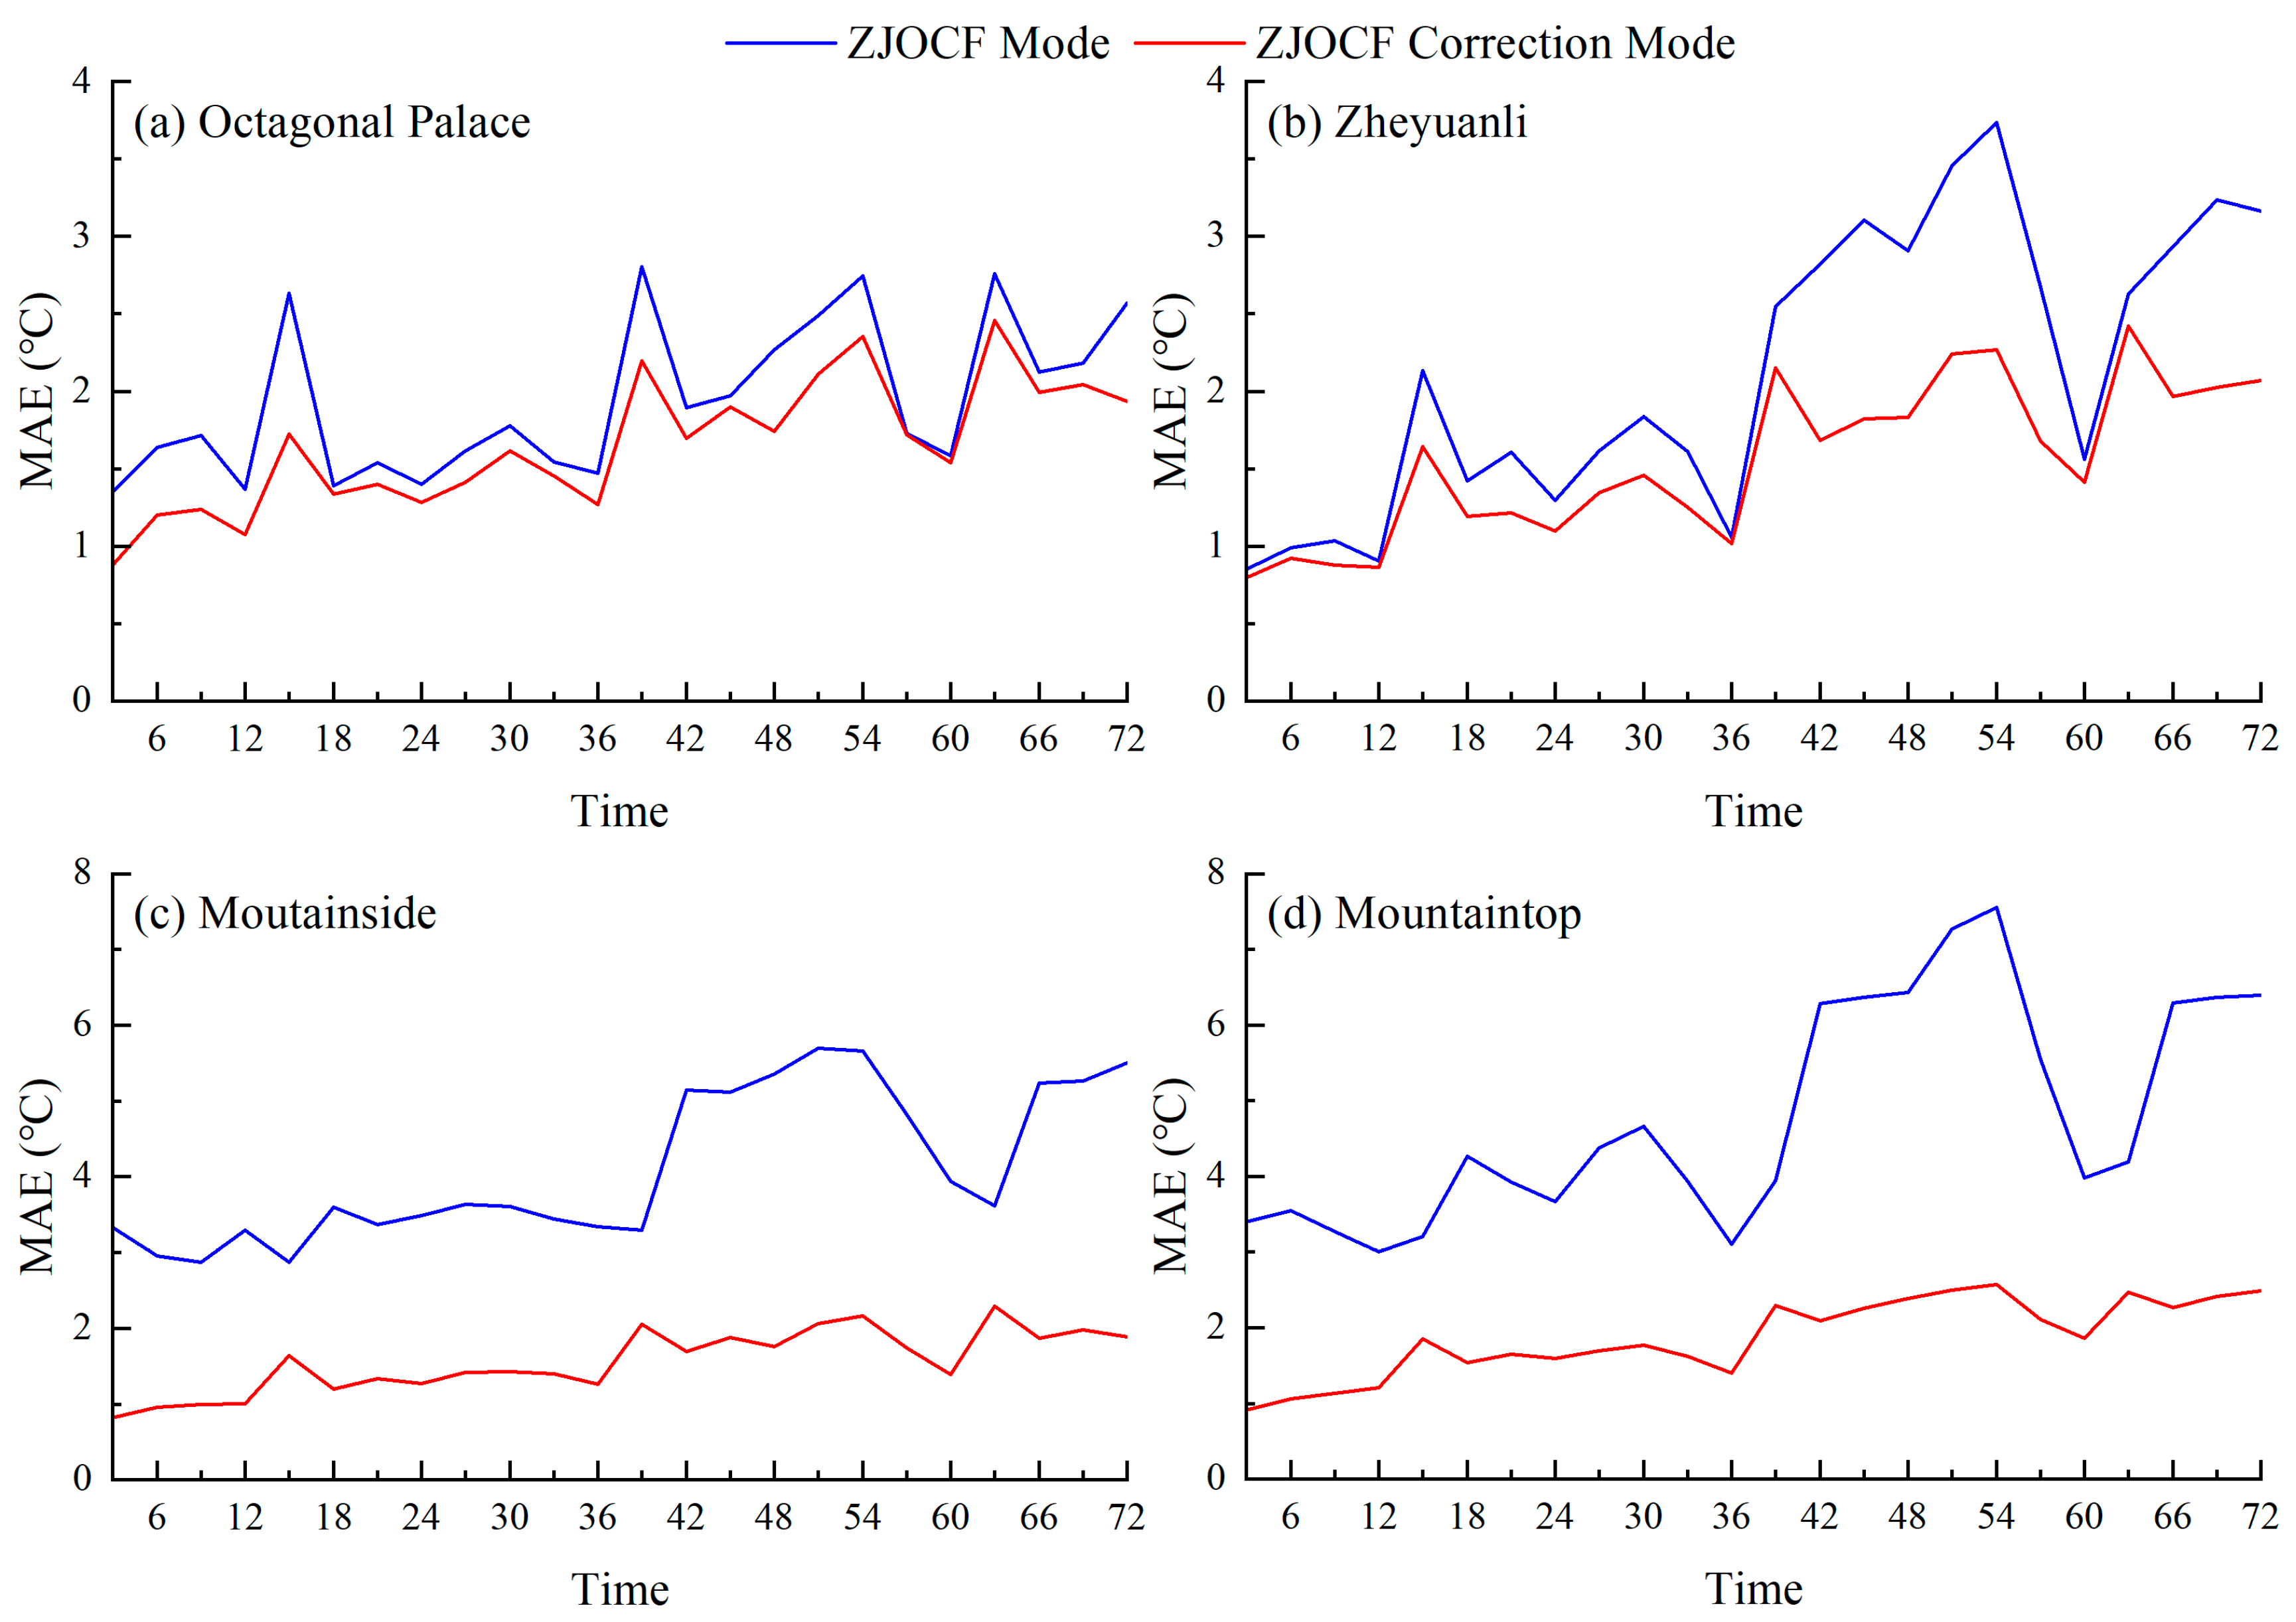
Further analysis of the MAE (
Figure 3) shows that the original temperature errors increase markedly with elevation and exhibit pronounced discontinuities. Before correction, the average MAE at Bajiaodian and Octagonal Palace is approximately 1.9 °C and 2.3 °C, respectively, with certain periods reaching 2.8–3.7 °C. In contrast, errors at the mid-slope and summit stations are substantially larger, with peak values of 5.69 °C and 7.55 °C. After correction, errors at all four stations converge significantly: the MAE at Bajiaodian and Octagonal Palace decreases to ≤1.7 °C with notably reduced fluctuations; the mid-slope station maintains values below 2 °C for most hours, and the summit station’s peaks are reduced to within 2.57 °C. The average reduction in error exceeds 60% in high-elevation areas, demonstrating the strong capability of the correction method in mitigating structural biases induced by complex terrain.
Overall, under complex topographic conditions, the original ZJOCF temperature forecasts display a typical pattern characterized by higher accuracy at low elevations, substantial warm biases at high elevations, and pronounced temporal fluctuations. The correction method significantly enhances overall forecast accuracy, temporal stability, and error control at high altitudes, thereby providing an effective technical approach for mountain microclimate operational forecasting.
3.2. Structural Characteristics of Temperature Forecast Errors and Evaluation of Extreme-Error Control Capability
To further examine the error-structure characteristics of the ZJOCF model under complex terrain conditions, this study evaluates changes before and after correction from three perspectives—error-interval distribution, worst-case forecast scenarios, and the number of extreme-error samples (
Figure 4,
Figure 5 and
Figure 6). Together with the accuracy and MAE analyses, these diagnostics form an integrated evaluation framework for assessing the effectiveness of the correction method in improving forecast reliability, error concentration, and robustness under complex terrain conditions.
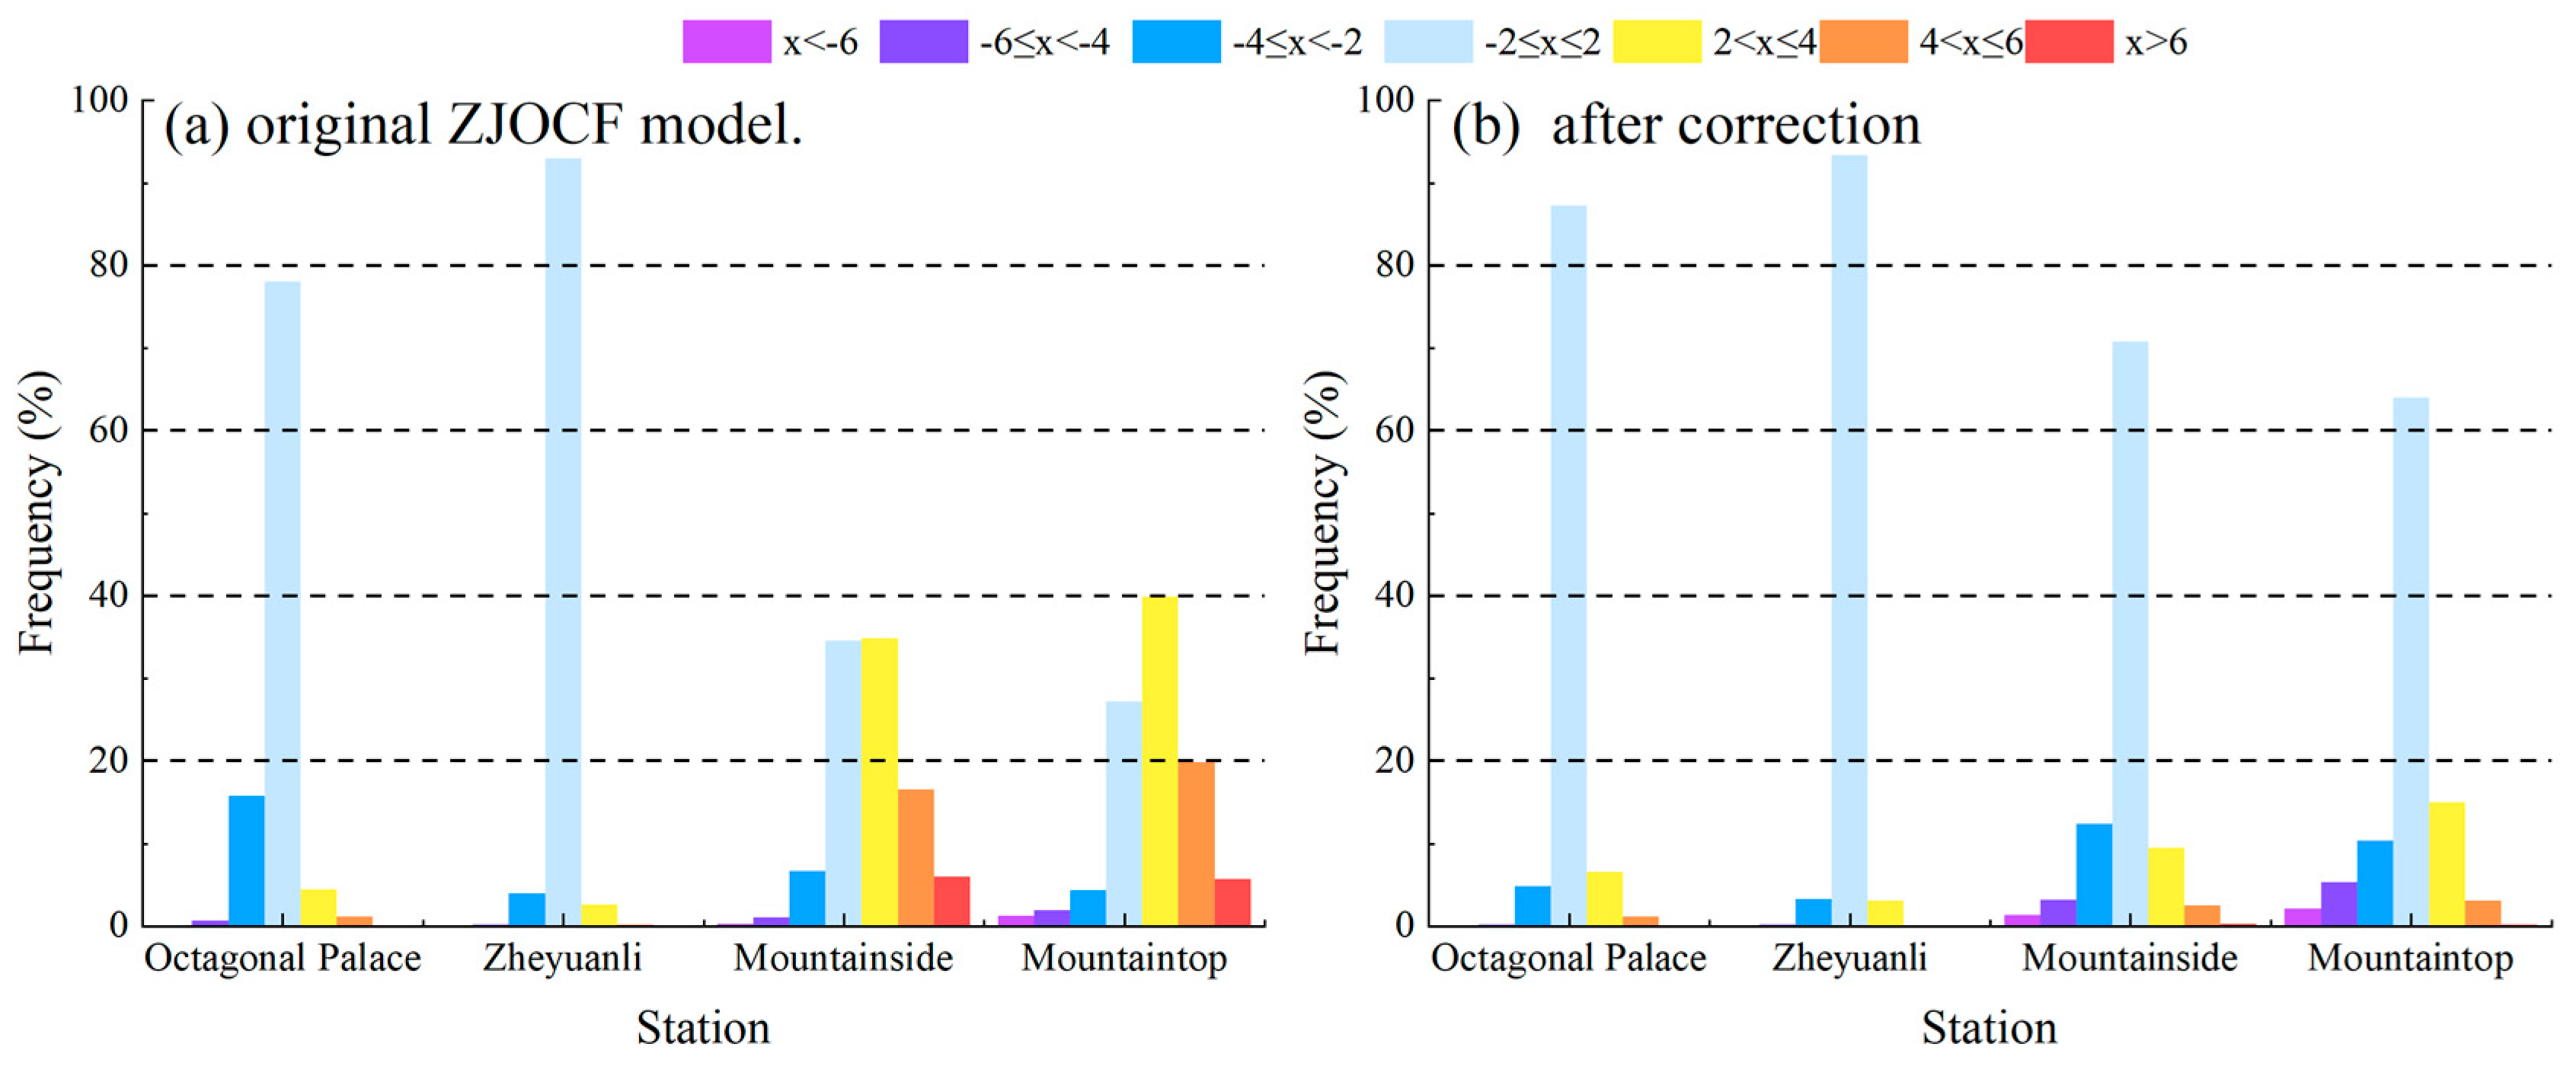
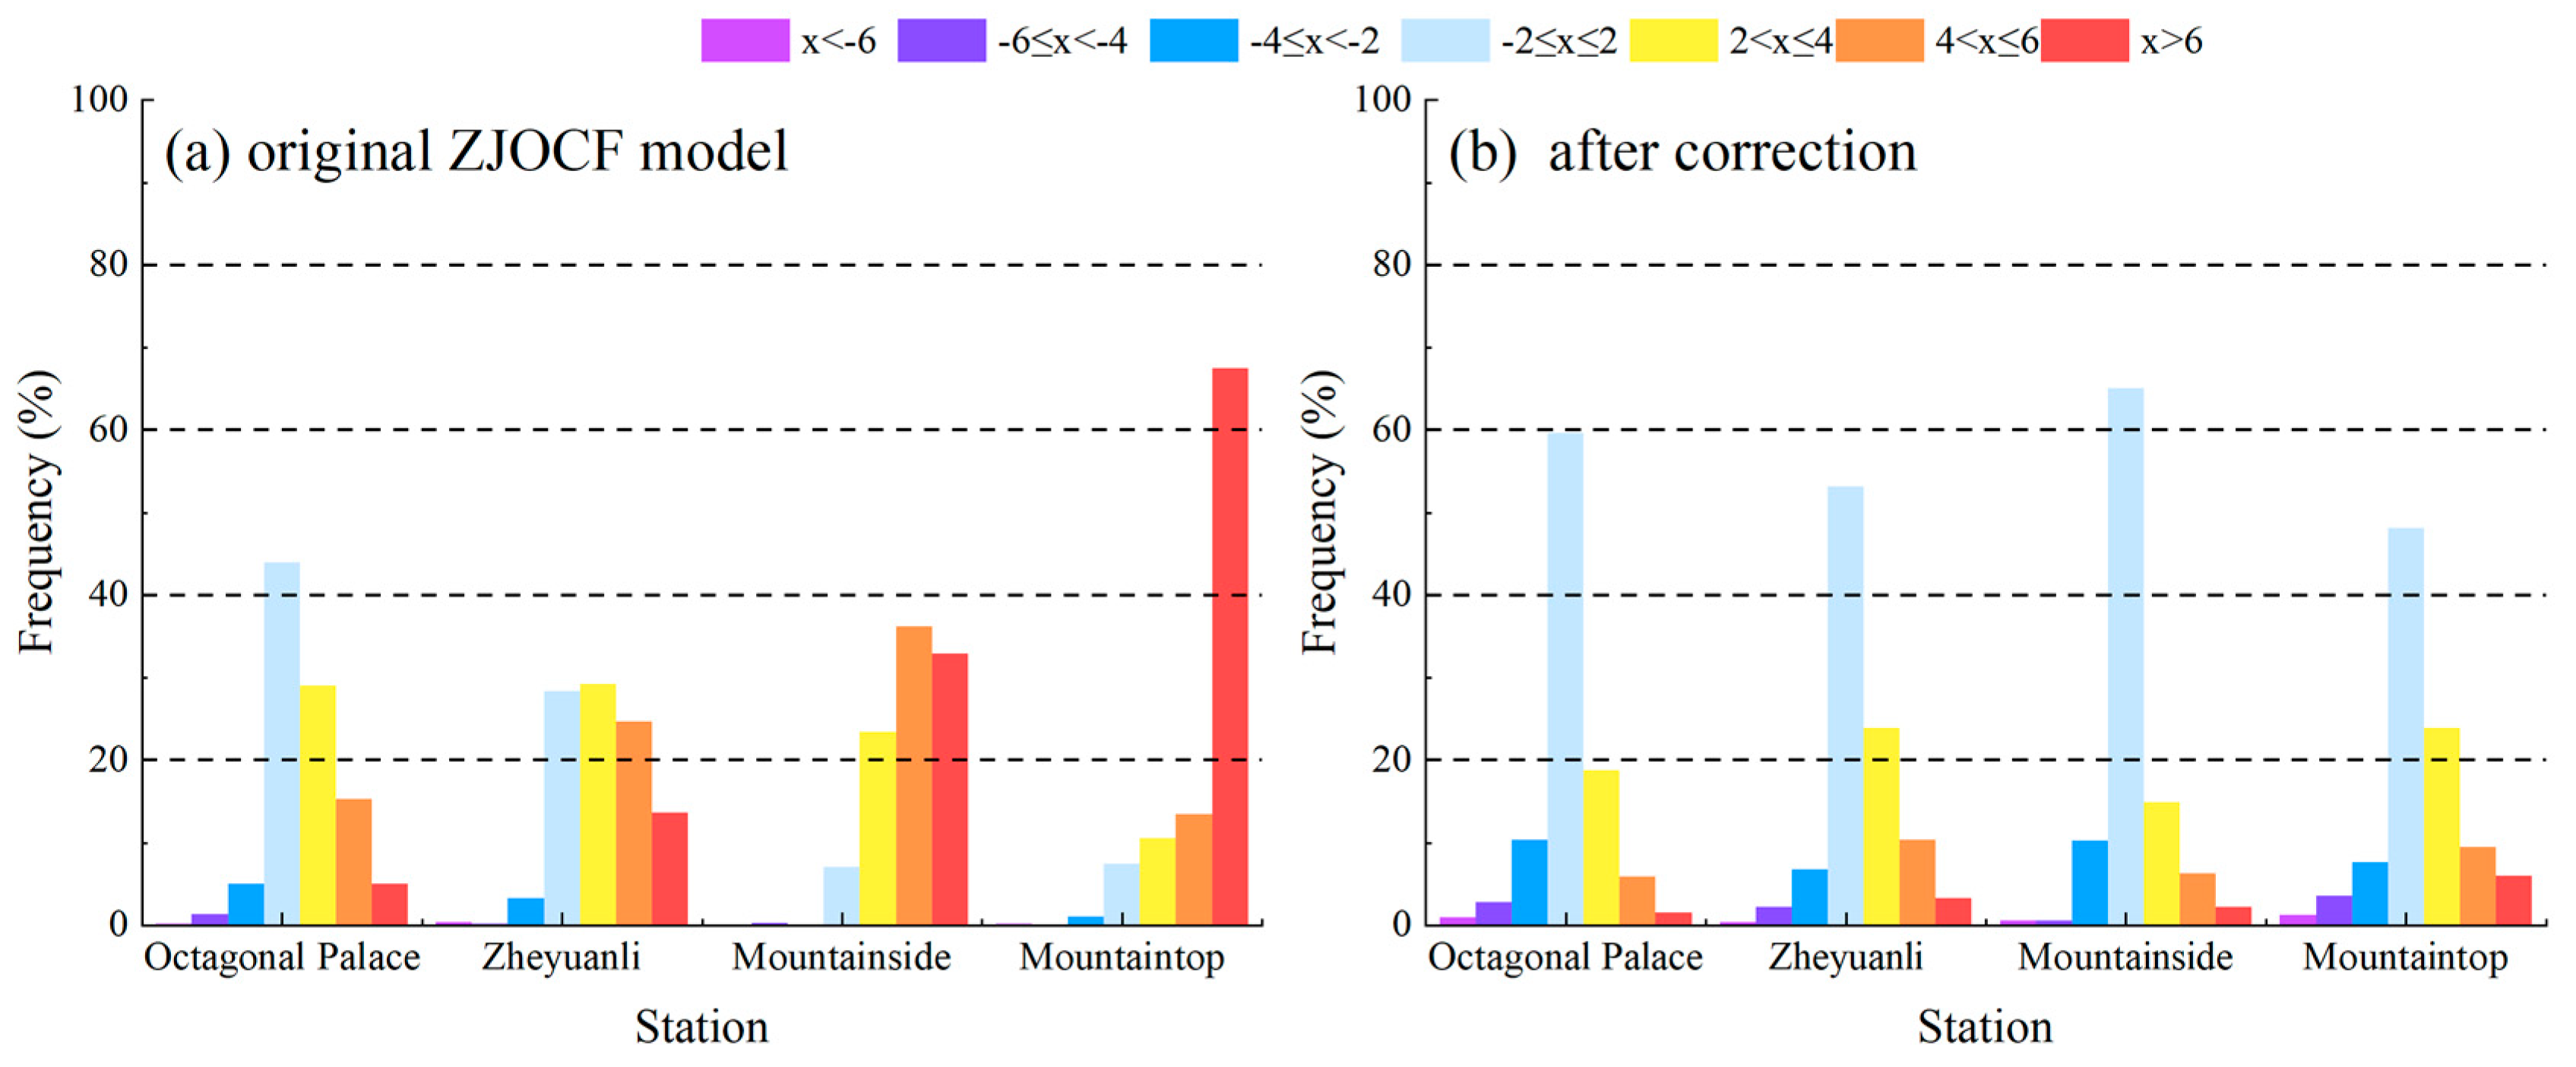
From the perspective of error-interval distribution (
Figure 4), the comparison focuses on whether the correction method can reduce systematic bias and increase the concentration of forecast errors within the core interval. This diagnostic is particularly useful for identifying structural shifts in the error distribution that cannot be fully captured by scalar metrics such as MAE alone. Errors at the Bajiaodian and Octagonal Palace stations are mainly concentrated within the −2 °C to 2 °C range, although cold-biased accumulation is still observed; for instance, 15% of Bajiaodian samples fall within the −4 °C to −2 °C range. The high-elevation stations display even stronger warm deviations: approximately 35% and 40% of the mid-slope and summit samples, respectively, fall within the 2 °C to 4 °C interval, with some extending into the 4 °C to 6 °C range. This pattern highlights the systematic warm bias inherent in the raw model over regions with significant vertical terrain gradients. After correction, error distributions across all four stations converge substantially, with more than 95% of samples clustered within the −2 °C to 2 °C core interval. Notably, the summit station achieves complete convergence, indicating a remarkable improvement in structural bias within high-altitude areas.
The analysis of the worst forecast scenarios (
Figure 5) is intended to assess the robustness of the correction method under unfavorable conditions, which is particularly important for operational forecasting in complex mountainous terrain. Under the raw model, the lowest-accuracy periods correspond to highly dispersed error distributions. This is particularly evident at the Mountaintop station, where the proportion of large errors exceeding 6 °C reaches 67.5%, indicating severely limited forecast reliability under extreme conditions. After correction, extreme errors shrink substantially: the proportion of >6 °C samples at the summit station decreases to 6%, and at the mid-slope station, the proportion of samples within the 4 °C to 6 °C interval decreases from 36.2% to 6.3%. Meanwhile, the concentration of errors within the −2 °C to 2 °C interval increases markedly, and all four stations exhibit a clear shift toward a unimodal distribution.
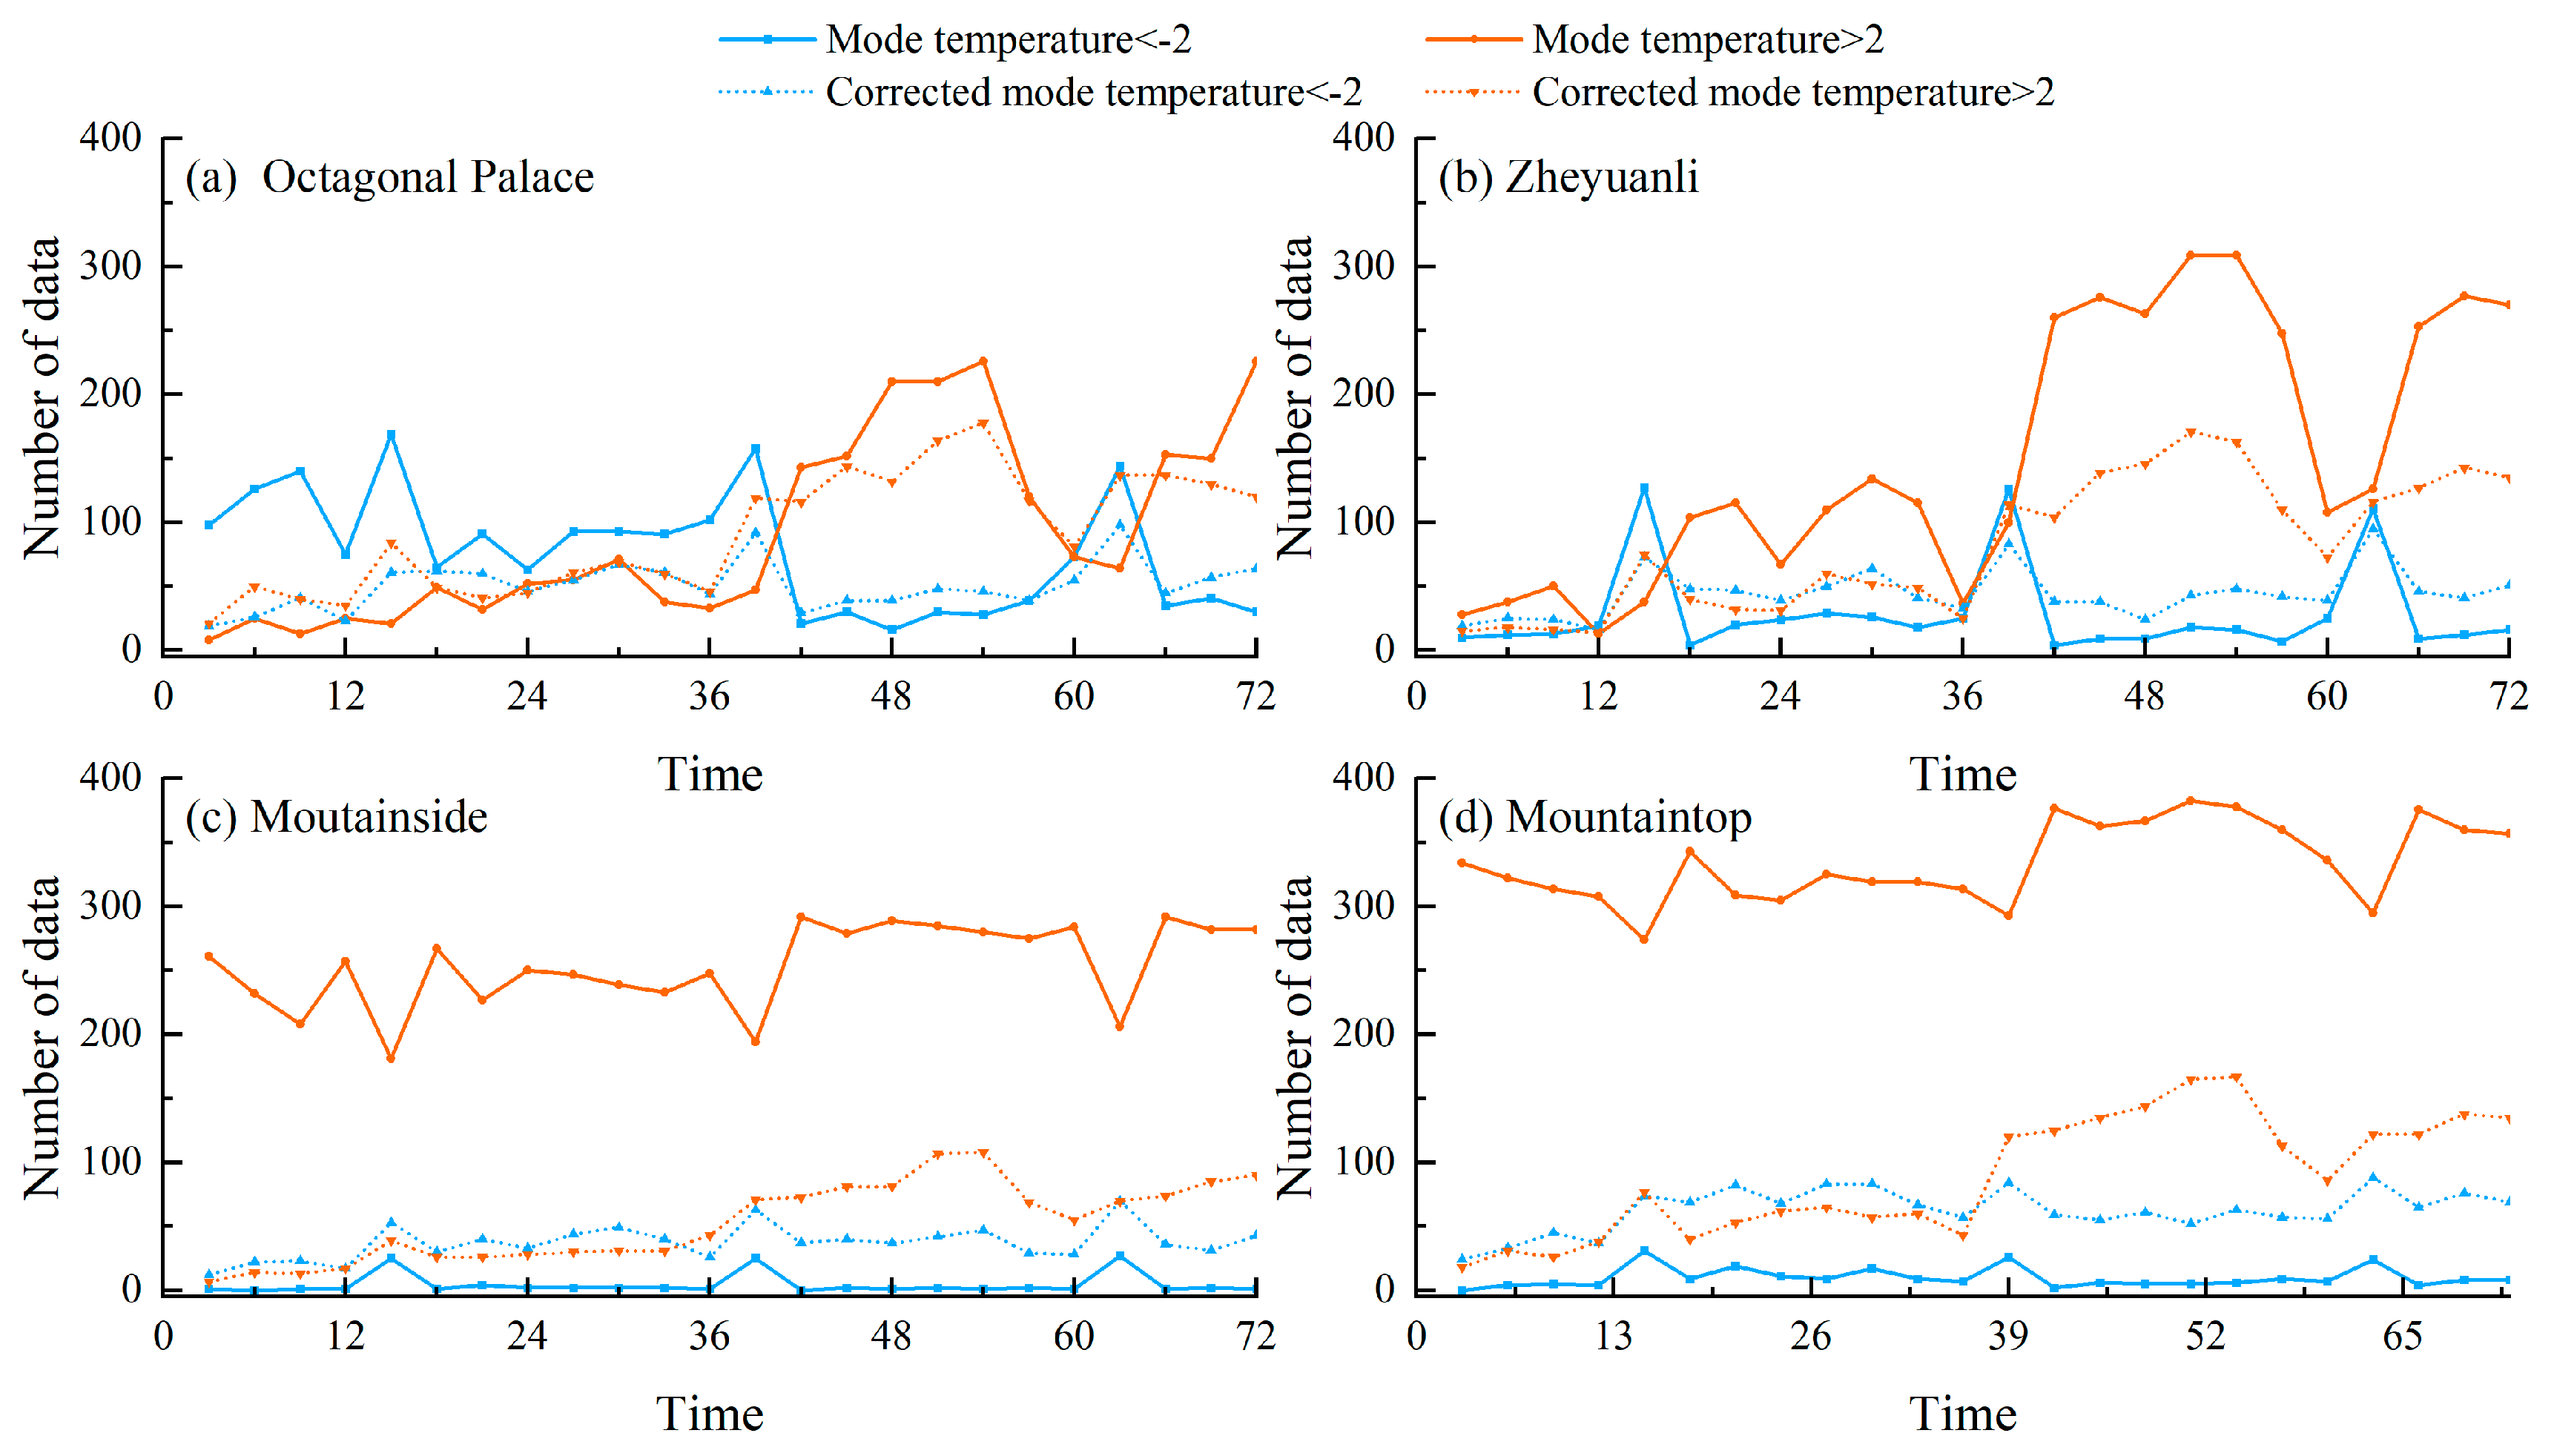
The number of extreme-error samples (|error| > 2 °C) was further examined to quantify the correction effect on operationally high-risk forecasts and to determine whether the reduction in large errors was achieved without introducing new systematic deviations (
Figure 6). The raw forecasts exhibit a typical warm-bias pattern, with frequent peaks of large errors occurring during the 3–30 h period at both the mid-slope and summit stations. After correction, the number of >2 °C samples decreases by 40–60% across all stations. For example, at the summit station, the count at the 51st hour decreases from 383 to 165, and no notable cold bias is introduced. This indicates that the correction method effectively reduces systematic warm errors without imposing new systematic deviations.
In summary, the correction method substantially improves the error-structure characteristics of the original ZJOCF, transforming the error distribution from a dispersed, multi-peaked pattern to a more concentrated, unimodal form. It also significantly suppresses the frequency of extreme errors, with particularly strong performance in high-elevation, complex-terrain regions. These results demonstrate that the correction strategy can markedly enhance model stability and operational applicability, providing reliable support for meteorological forecasting of temperature in mountainous areas.
3.3. Comparison of Temperature-Error Distribution Shapes Before and After Correction
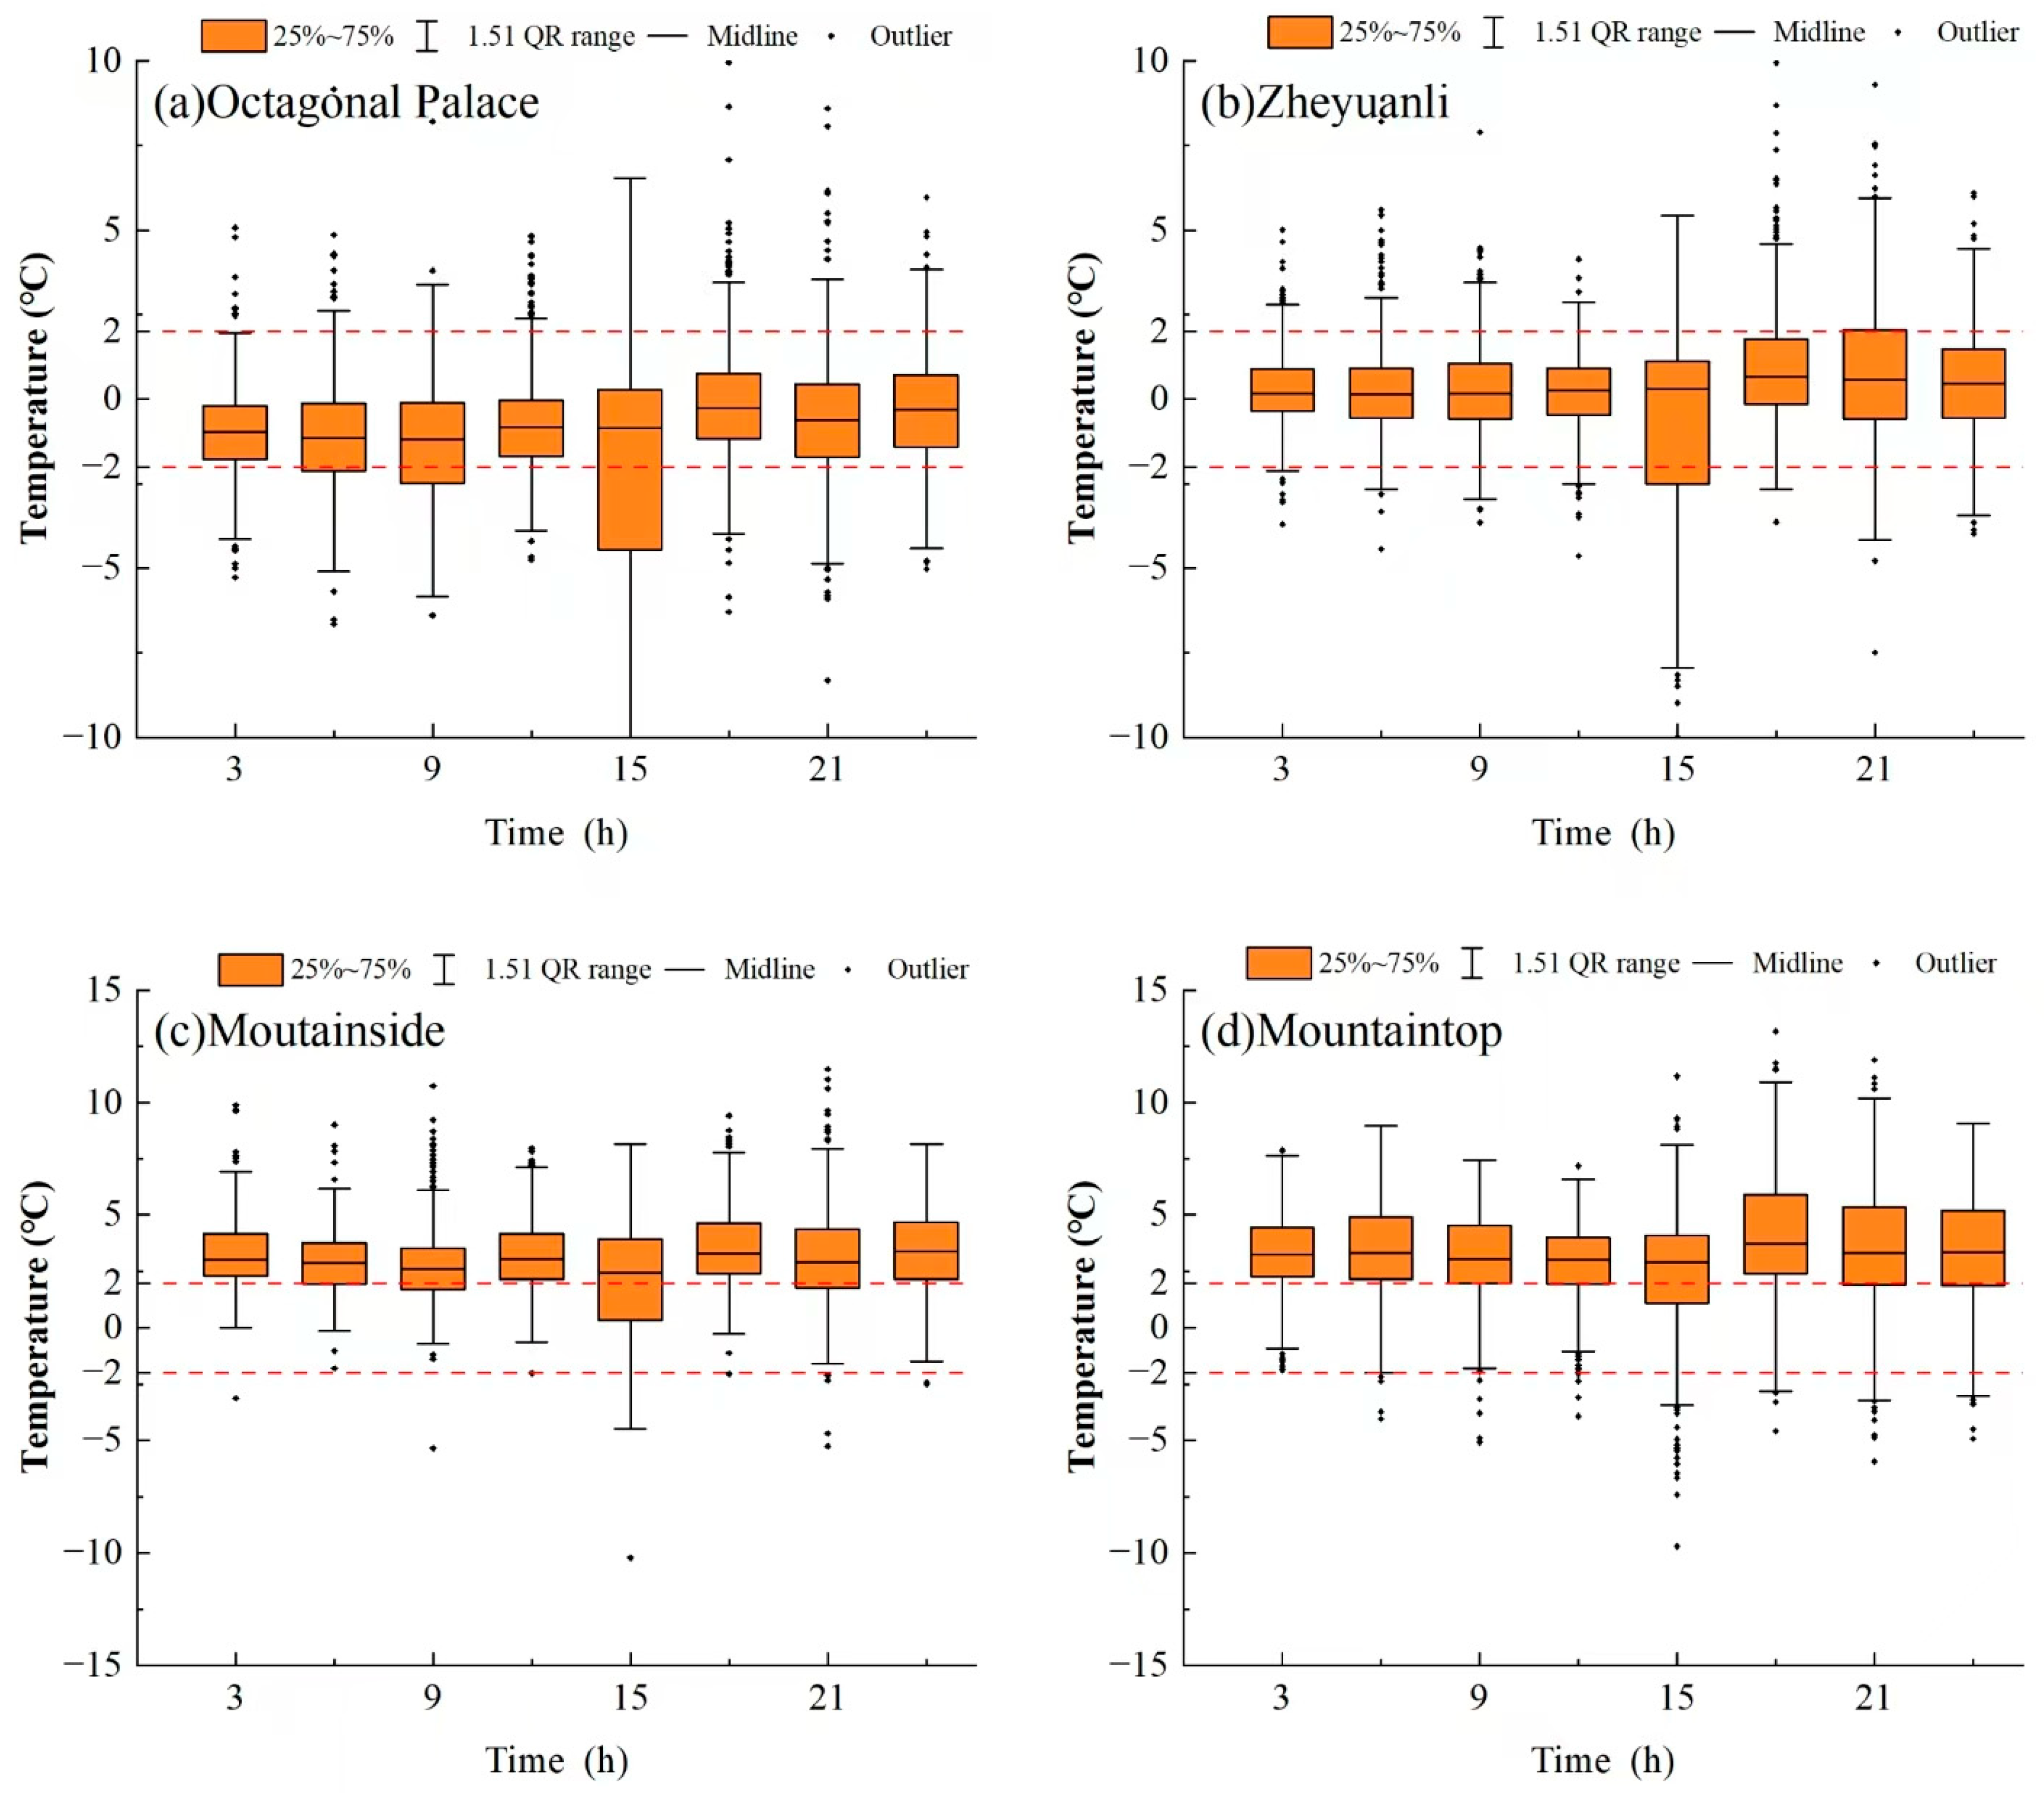
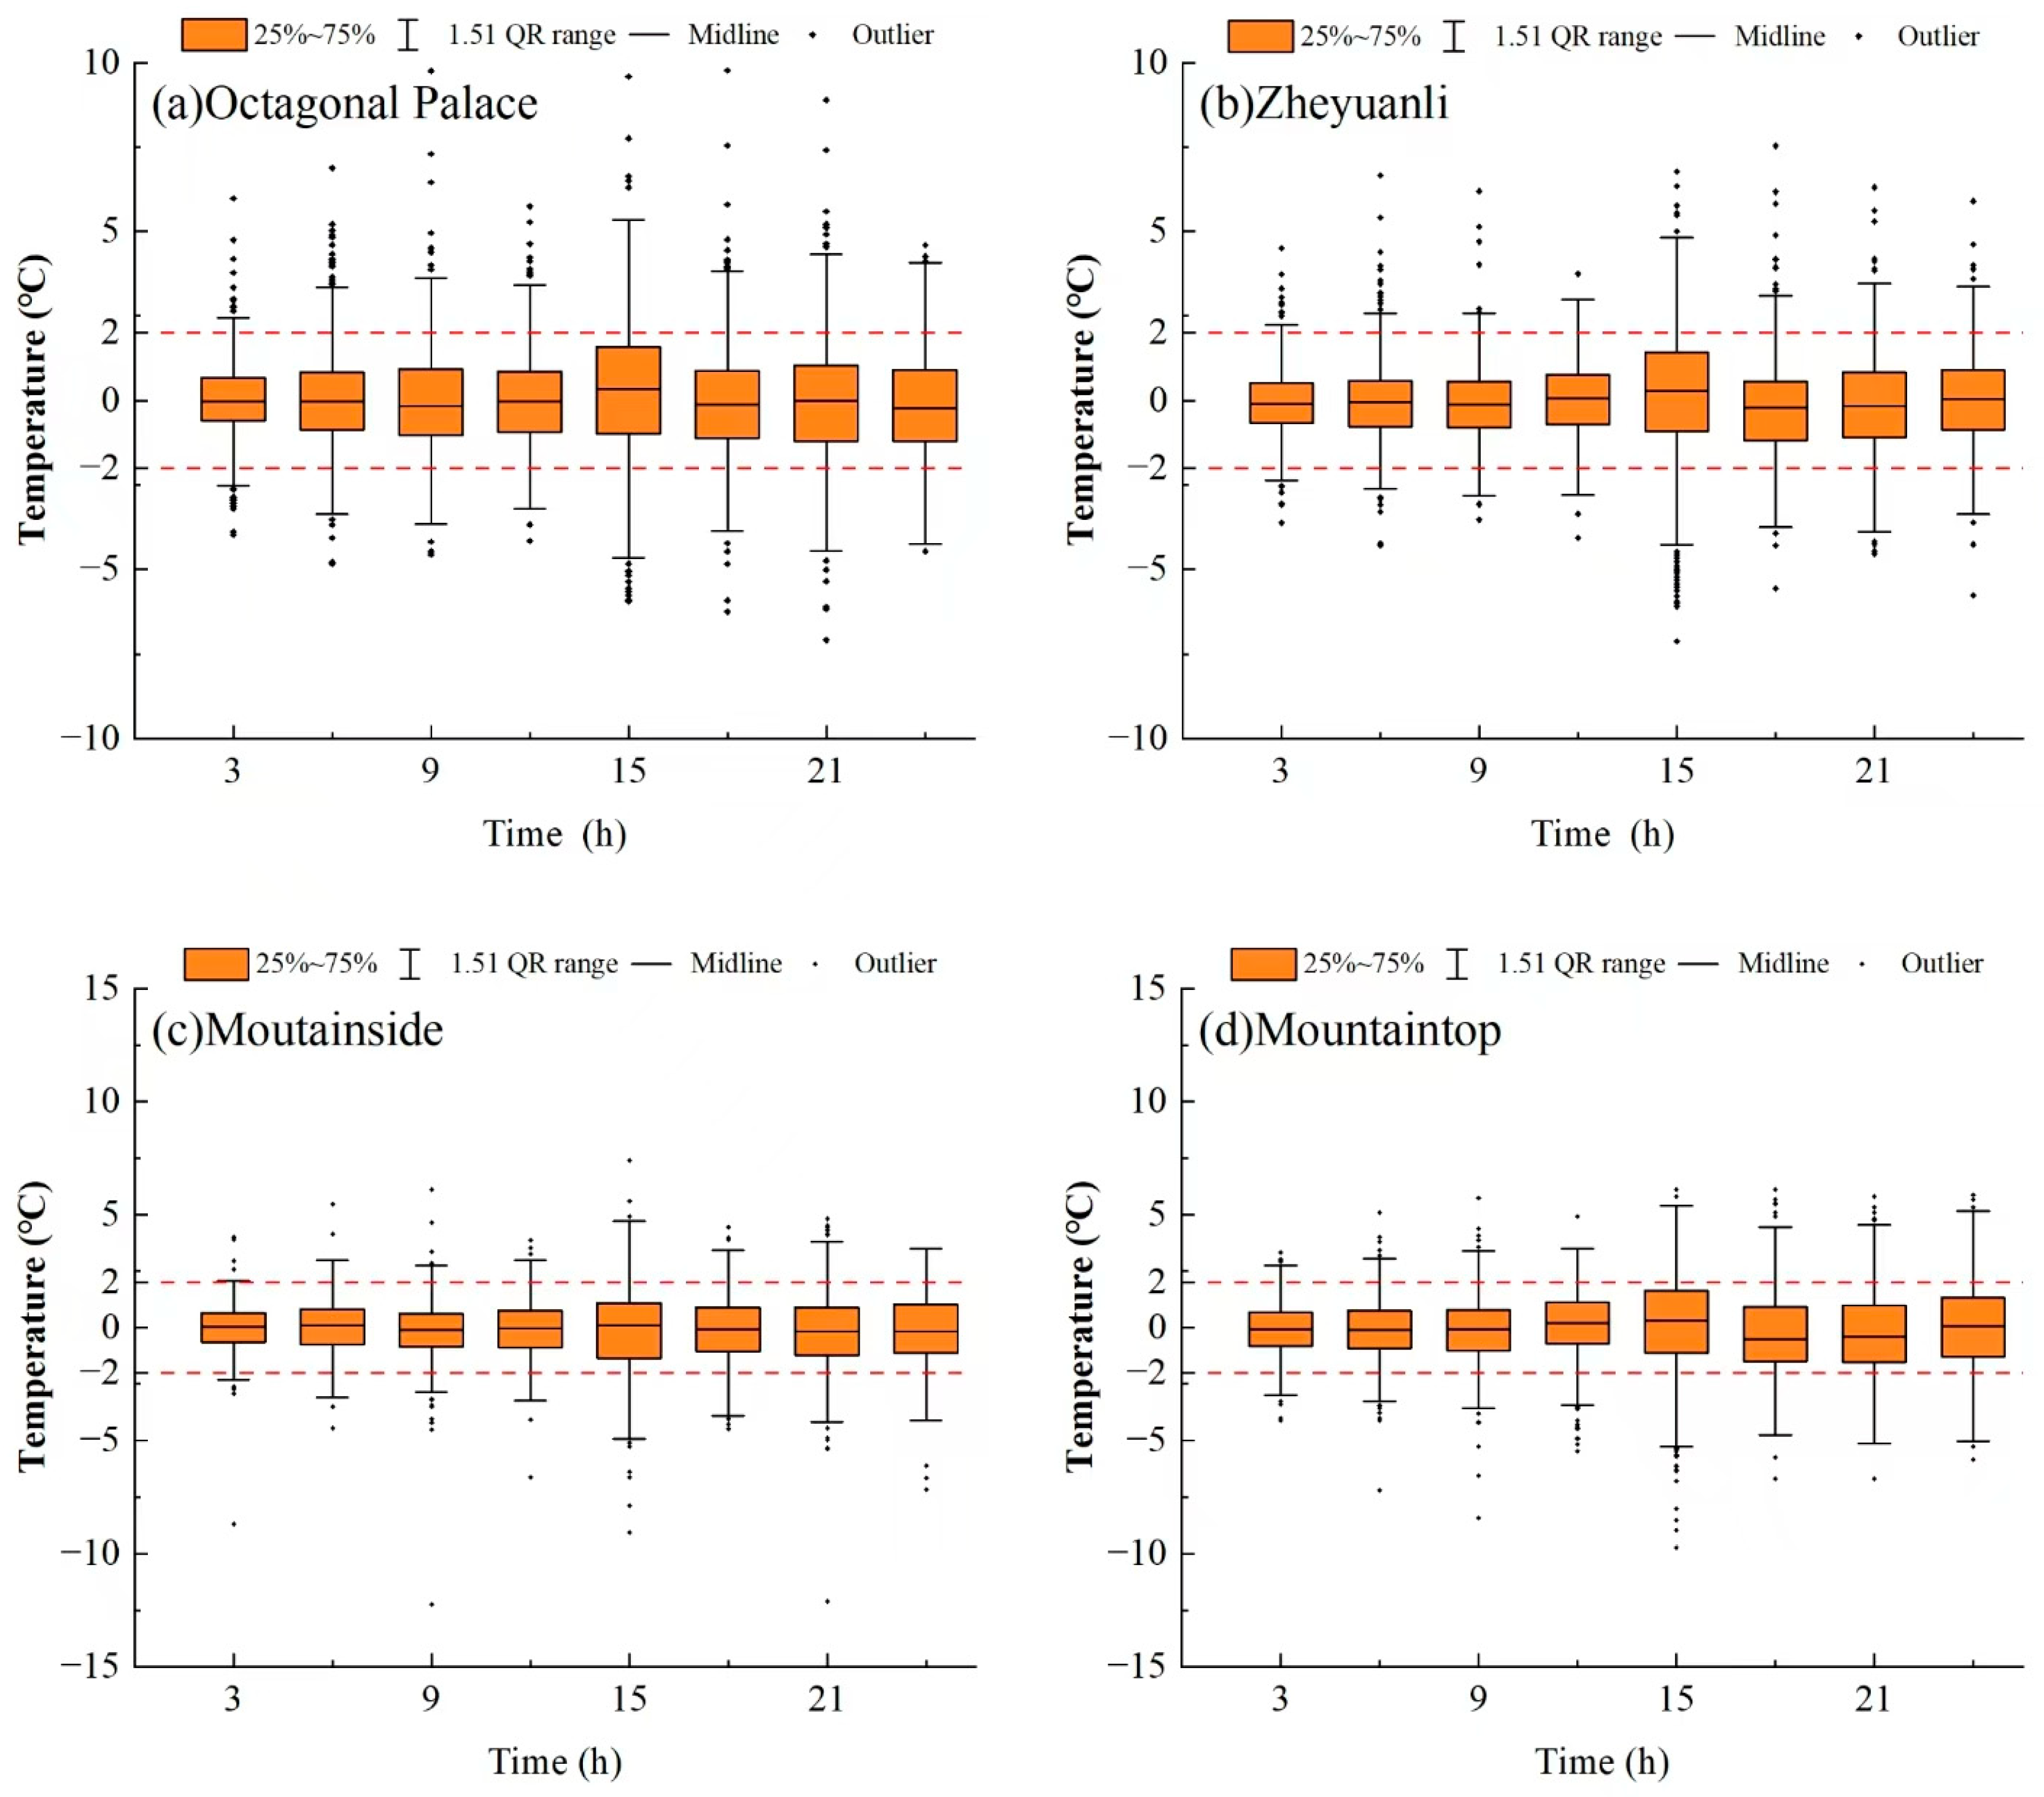
To more intuitively demonstrate the structural changes in the ZJOCF model’s error distribution before and after correction, this study uses the 24 h forecast lead time as an example and compares the error boxplot structures at the four stations (
Figure 7 and
Figure 8). This analysis serves as a complementary diagnostic to the preceding accuracy-, MAE-, and frequency-based evaluations by highlighting changes in central tendency, dispersion, asymmetry, and outlier behavior.
The results show that before correction, substantial spatial differences and systematic biases exist across stations at different elevations. At Bajiaodian, the median errors are consistently negative (−1.20 °C to −0.30 °C), indicating a stable cold bias. Some time periods also exhibit pronounced dispersion, with interquartile ranges exceeding 10 °C, suggesting strong variability in the errors. At the Octagonal Palace, the errors are generally close to zero, although occasional large deviations still occur, implying that the raw model retains instability under certain local conditions. In contrast, the high-altitude stations show considerably poorer performance. Both the mid-slope and summit stations exhibit significantly positive median errors (2.60 °C to 3.73 °C), with wide box ranges and upper quartiles reaching 7–11 °C. The number of outliers is markedly higher, revealing a persistent warm bias in complex terrain settings.
After correction, the error-distribution shapes improve substantially, with systematic biases effectively suppressed and error concentration greatly enhanced. The median errors at all four stations converge to the range of −0.4 °C to 0.5 °C, indicating a strong debiasing effect. Box sizes shrink markedly, with upper and lower quartiles constrained within the [−2 °C, 5 °C] interval, and the number of extreme outliers decreases significantly—by more than 50% at the mid-slope and summit stations. Importantly, error dispersion at the high-elevation sites is greatly reduced, and the systematic warm bias is eliminated, demonstrating the ability of the correction method to adapt effectively to terrain-sensitive error characteristics.
Overall, the combined use of accuracy, MAE, error-distribution diagnostics, extreme-error statistics, and boxplot analysis provides a coherent and systematic evaluation of the correction effect. Across these complementary perspectives, the corrected forecasts consistently show improved accuracy, reduced dispersion, fewer extreme errors, and enhanced stability, particularly at the high-elevation stations.
4. Conclusions and Discussion
This study investigated the elevation-dependent error characteristics of ZJOCF temperature forecasts in the Liuchun Lake area and evaluated a station-level machine-learning correction method under complex terrain conditions. The main conclusions are as follows.
- (1)
Raw ZJOCF temperature forecasts show clear terrain-dependent deficiencies. Forecast skill decreases with elevation, while high-altitude stations exhibit systematic warm bias, stronger temporal variability, and more frequent extreme errors, indicating substantial limitations of the model in complex mountainous environments.
- (2)
The station-level machine-learning correction significantly improves forecast performance. After correction, forecast accuracy increases, MAE decreases, error distributions become more concentrated, and extreme-error samples are greatly reduced, without introducing new systematic bias. The corrected forecasts are also more stable across lead times and show clear operational value for short-term mountainous temperature forecasting.
- (3)
Overall, station-level correction provides a practical and efficient approach for refining temperature forecasts in complex terrain. Although this study is based on the Liuchun Lake area, the results are relevant to other mountainous regions affected by strong elevation gradients and terrain-induced microclimates.
The results of this study are consistent with the current understanding of temperature forecasting over complex terrain. The deterioration of raw ZJOCF forecast skill with increasing elevation, together with the warm bias and stronger temporal variability at high-altitude stations, agrees with mountain-meteorology theory and with previous studies showing that temperature forecasts tend to perform poorly under strong cooling conditions and in topographically complex environments [
16]. In mountainous areas, cold-air pooling, slope-valley circulations, and stable boundary layers can generate strong sub-grid thermal contrasts that are difficult for gridded operational forecasts to resolve. In this sense, the Liuchun Lake area should be regarded not as an isolated case, but as a representative example of temperature-forecast challenges in complex terrain.
The post-correction results are also consistent with the broader literature on statistical post-processing. The increase in forecast accuracy, reduction in MAE, and suppression of extreme errors indicate that the station-level machine-learning model successfully learned part of the systematic mismatch between gridded model output and local observations, which is a central objective of forecast post-processing [
17]. Similar station-based machine-learning correction studies have reported clear improvements in temperature forecasts in both regional applications and recent complex-terrain settings [
18]. At the same time, this study is based on only four stations within one mountainous area, so the broader transferability of the correction relationships still requires validation in other regions. Even so, the present results demonstrate that station-level correction is a practical and operationally efficient pathway for refined temperature forecasting in mountainous areas with similar topographic complexity.