Article

Numerical Weather Prediction of Hurricane Florence (2018) and Potential Climate Impacts Through Thermodynamic and Moisture Modification


1
Department of Physics, North Carolina A&T State University, Greensboro, NC 27411, USA
2
Applied Science & Technology Ph.D. Program, North Carolina A&T State University, Greensboro, NC 27411, USA
3
Department of Mathematics, North Carolina A&T State University, Greensboro, NC 27411, USA
*
Author to whom correspondence should be addressed.
Atmosphere 2026, 17(5), 438; https://doi.org/10.3390/atmos17050438
Submission received: 27 February 2026 / Revised: 13 April 2026 / Accepted: 23 April 2026 / Published: 25 April 2026
(This article belongs to the Section Meteorology)

Abstract

Hurricane Florence (2018) proved to be a damaging tropical cyclone that formed off the coast of the Cabo Verde Islands. On 12 UTC 14 September 2018, Florence made landfall as a weakened category 1 Hurricane in Wrightsville Beach, NC. In the midst of landfall, Florence’s ground speed stalled considerably to near zero. Because of this stall, Florence continued to accumulate feet of rain along the coastline, and the inundation of seawater became extreme. Due to the impacts of Florence, the Weather Research and Forecasting Model (WRF-ARW) was used to simulate the tropical cyclone and provide insight into the thermodynamics and dynamics that played a significant role at the time of landfall. After the control case, several sensitivity experiments were conducted. The historical sensitivity experiments utilize the thermodynamic and moisture fields of ERA5 reanalysis data from 1968 and 1998, respectively, to modify the thermodynamic and moisture fields in the initial conditions of the WRF–ARW control case. In addition, to study the potential future climate impacts of Florence, the NCAR CESM Global Bias-Corrected CMIP5 Output to Support WRF/MPAS Research dataset was utilized. The same approach was taken as the historical versions of Florence for sensitivity experiments for future climate, i.e., thermodynamic and moisture fields for both 2038 and 2068 under the RCP6.0 and RCP8.5 climate scenarios, respectively. Results suggest a corresponding intensity shift with minor track deflections. Based on these modifications, synoptic and mesoscale dynamics will be studied to provide insight into how Florence-like hurricanes may change based on certain climate scenarios.

1. Introduction

The effects of tropical cyclones (TCs) can be felt in the United States (U.S.) as they make landfall along its coasts [1]. Each year, typically billions of dollars in damage result from these natural disasters, ranging from inundation of seawater due to the storm surge to the high winds associated with TC circulation. In recent years, TC activity has been on the rise in the Atlantic basin. Specifically, more and more intense TCs have formed from African Easterly Waves (AEWs) exiting the western coast of Africa [2]. Hurricane Florence (2018) gives a prime example of this existing pattern.
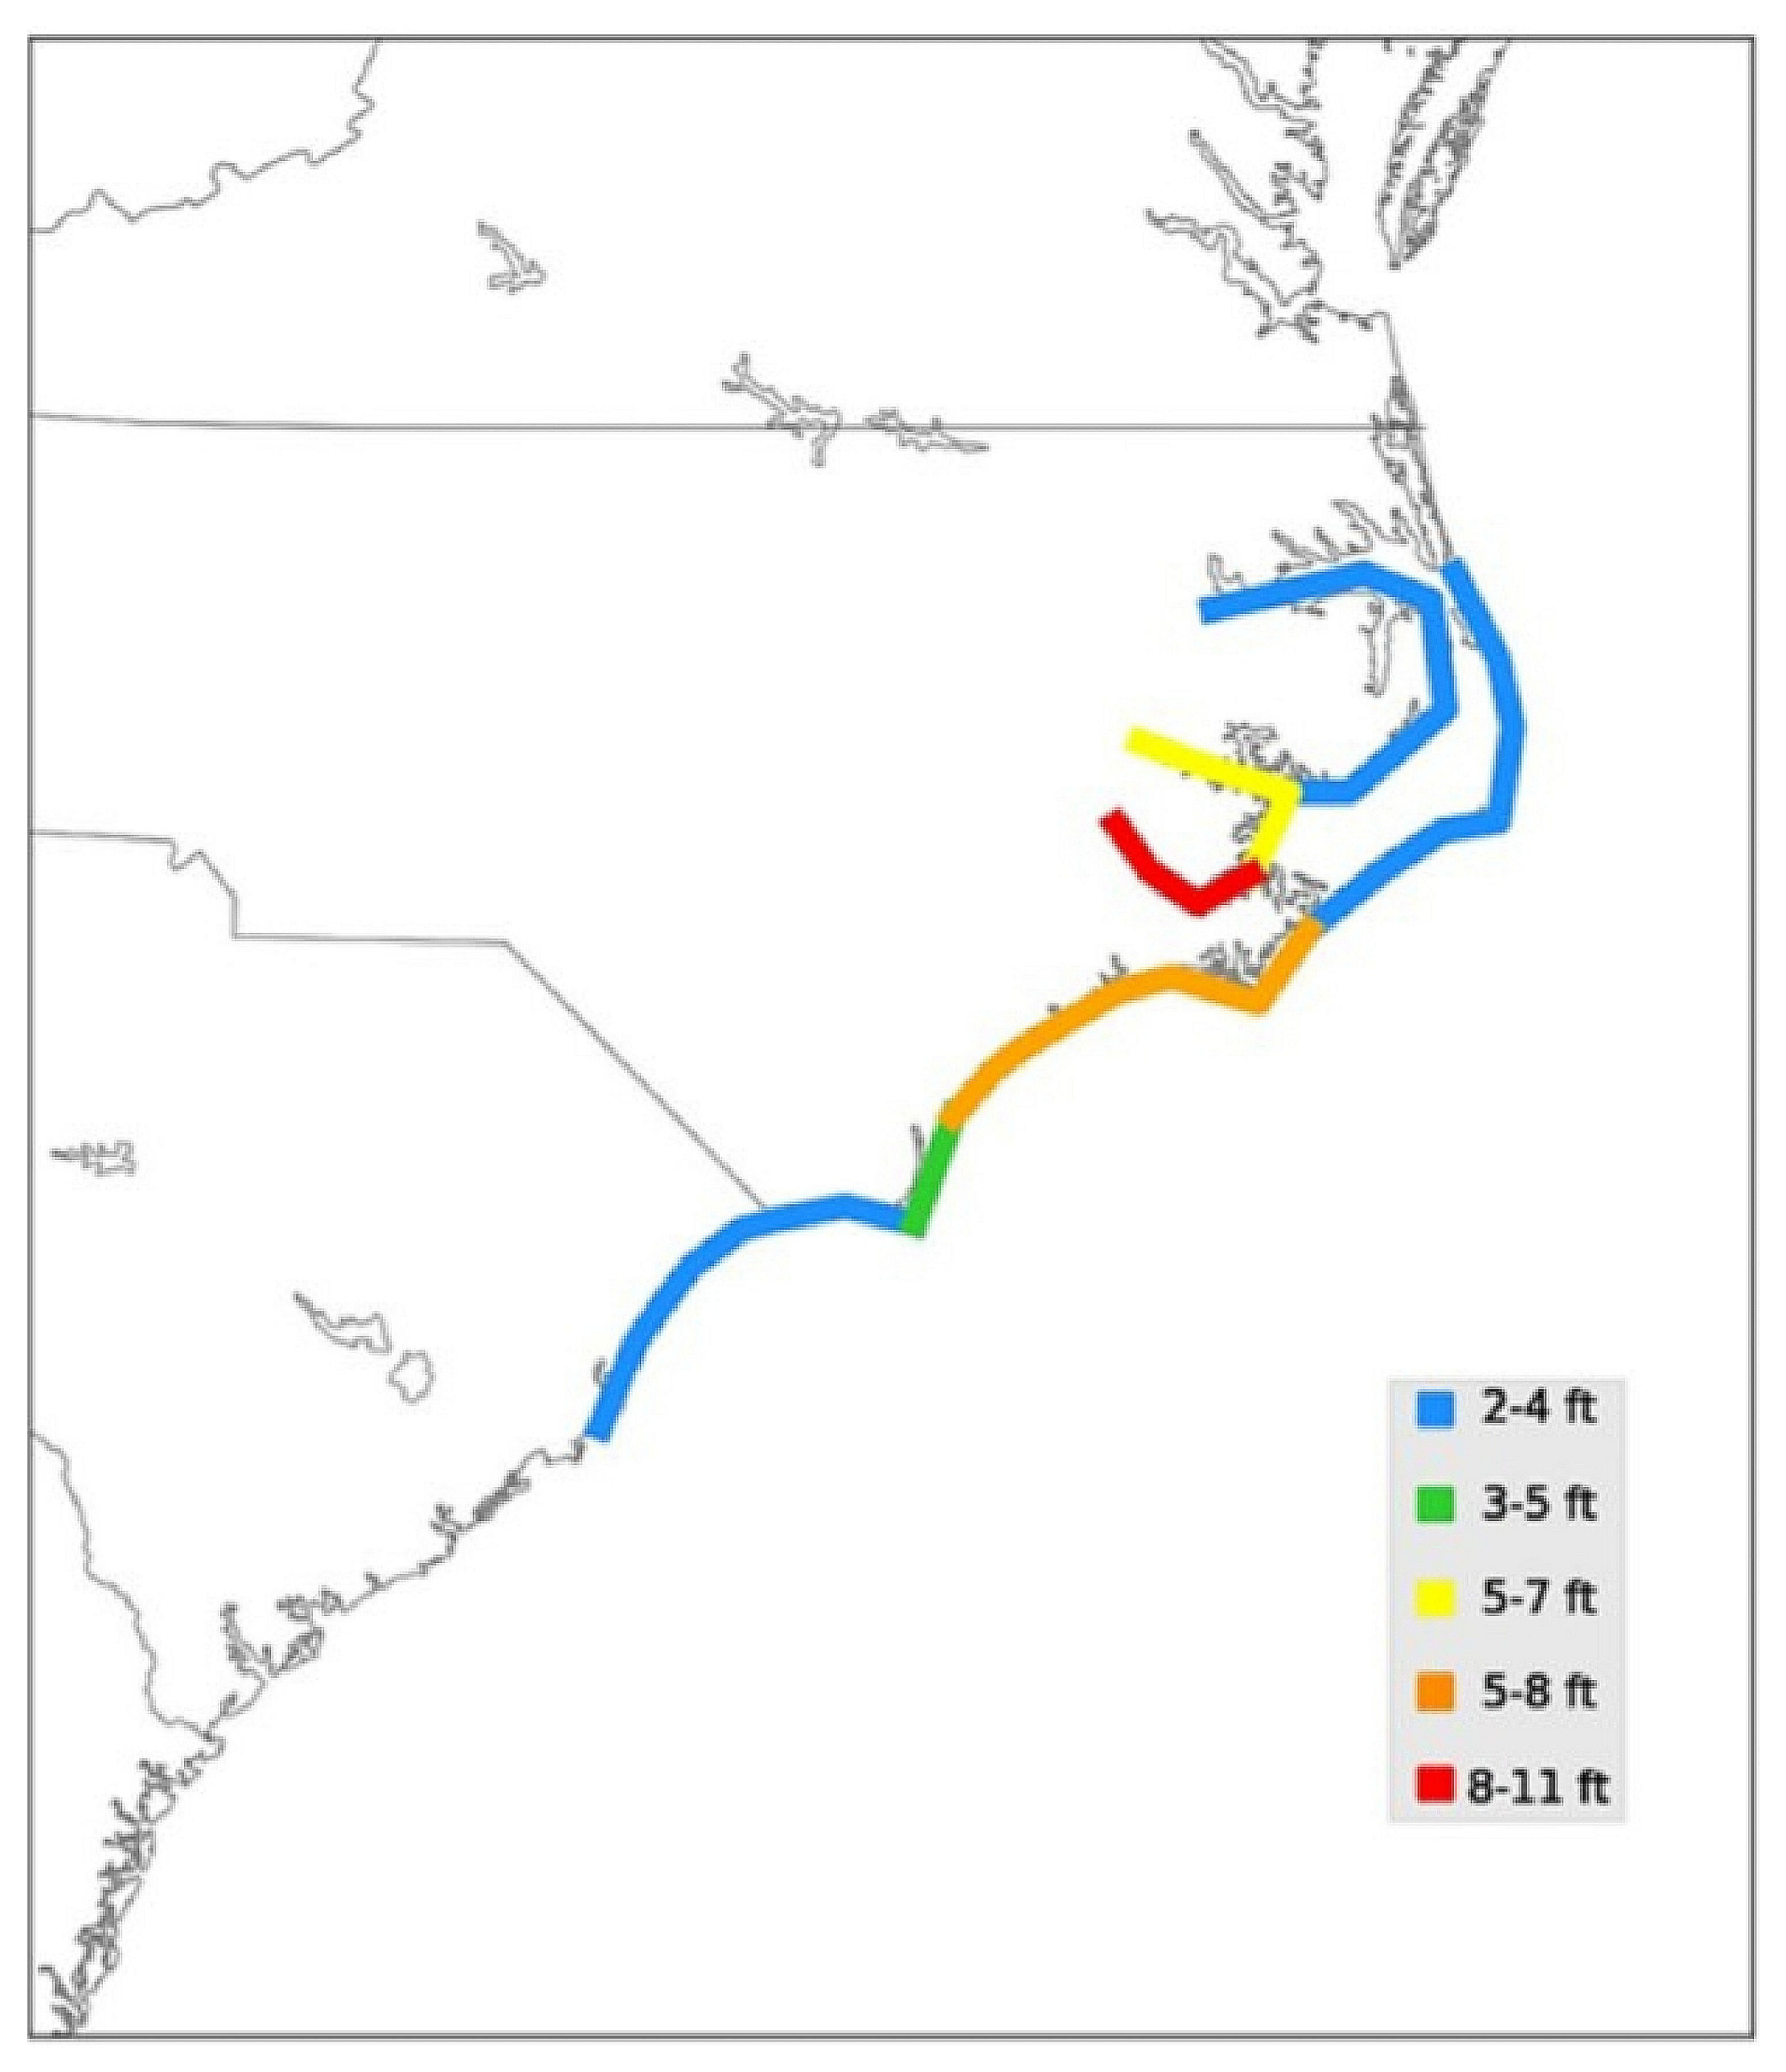
On 31 August 2018, a tropical disturbance formed near the Cabo Verde Islands off the western coast of Africa and was later named Florence (2018) by the National Hurricane Center (NHC). Florence continued propagating westward towards the U.S. as it strengthened to a category 4 hurricane. The eastern seaboard, specifically North Carolina (NC), began experiencing the effects of Hurricane Florence early on the morning of 13 September. However, official landfall did not occur until the morning of 14 September. Florence made landfall as a weakened category 1 hurricane with sustained winds of 80 knots (~41 ms−1) near Wrightsville Beach, NC [3]. The inundation of seawater, coupled with the abundance of accumulated rainfall, produced widespread flooding. Additionally, Hurricane Florence (2018) interacted with a stalled, yet weak, frontal system sweeping the eastern U.S., leading to over 30 inches (762 mm) of rainfall from 15 to 17 September [4]. Due to the well-defined structure of Hurricane Florence (2018) leading up to landfall, the warm, moist core was intact, which maintained the notable convection surrounding the eyewall [5,6]. It was estimated that Hurricane Florence (2018) caused ~$24 billion in damage to the Carolinas alone, with a total of 52 fatalities. However, the devastating legacy of Florence will be recorded as the life-threatening storm surge of approximately 8–11 feet (~2.4–3.4 m) above normally dry ground, as seen in Figure 1.
Broader patterns are emerging that likely indicate a warming trend in the Earth’s atmosphere [7,8,9]. As a result, TCs are likely to become more intense as more favorable conditions are more frequent over the tropical Atlantic basin, in particular. As discussed in Emanuel [10], increasing ocean temperatures, which lead to more available heat and moisture, provide prime conditions for the rapid intensification of AEWs into TCs. Furthermore, slower translation speeds of TCs would increase rainfall and thus enhance the negative impacts as those storm systems make landfall.
This study aims to investigate how thermodynamic and moisture modifications associated with past and future climate conditions influence the evolution, intensity, and precipitation of Hurricane Florence (2018), a slow-moving TC characterized by extreme rainfall and near-stationary behavior near landfall. Unlike many previous pseudo-global warming (PGW) studies that focus primarily on future projections and combined environmental changes, this work systematically separates thermodynamic and moisture effects through controlled sensitivity experiments. In addition, both historical (1968 and 1998) and future (2038 and 2068, under representative concentration pathways 6.0 and 8.5) scenarios are considered, providing a broader perspective on climate variability and change. By analyzing how these modifications interact with synoptic-scale features such as a quasi-stationary frontal boundary, this study provides new insight into the physical mechanisms governing rainfall distribution, storm intensity, and propagation speed in Florence-like tropical cyclones under varying climate conditions. Therefore, we hypothesize that, if Hurricane Florence (2018) were to occur under different past and future climate backgrounds, warmer climate states would produce greater storm intensity during Florence’s final approach to landfall and higher post-landfall rainfall totals. We further hypothesize that these enhanced rainfall totals would contribute to broader inland flooding, whereas cooler climate states would produce a weaker and less impactful version of Florence.

2. Literature Review

2.1. Atlantic Basin Tropical Cyclone Climatology

With a changing climate, potential hurricane impacts on the U.S. become an important topic. When discussing climate, the variables considered are primarily (1) precipitation and (2) temperature. According to Allen and Ingram [11], one way to increase precipitation in the future climate would be to increase the widespread atmospheric water vapor content. From numerical studies, e.g., [12], heavier rainfall was observed in simulations due to an increase in water vapor content. This was further validated in [13,14]. Therefore, the precipitation variable would be a sensitive variable to diagnose the impact of a future warming climate. In addition to precipitation, thermodynamic changes in future climate scenarios need to be considered as well.
Landsea [15] explored and isolated instances of major hurricanes (category 3 or higher) within the available best track record at the time—1886 through 1988. Further examination revealed a distinct intraseasonal and interannual spread for significant hurricanes in the Atlantic basin. Within the months of August–October, approximately 95% of all category 3 or higher hurricanes occurred with a climatological maximum in September. When comparing stronger TCs to weaker ones, the range of weaker TC systems is broader, which likely indicates the prime time within the Atlantic basin of environmentally favorable conditions for intensification: primarily higher sea surface temperatures (SST) and low vertical wind shear.
Goldenberg et al. [16] furthered Landsea’s work and studied the uptick in Atlantic hurricane activity from 1995 to 2000 with a comparison to the previous 24 years of activity, 1971–1994. It was concluded from their study that a multidecadal climate signal surfaced during this period. This signal came in the form of warmer SSTs compared to average along the main development region (MDR), along with low vertical wind shear. Overall, seasonal conditions favored the formation of more TC systems both in number and intensity. The 1995–2000 period produced approximately double the amount of TCs and 2.5 times the number of major hurricanes, along with five times the amount of Caribbean-based hurricanes. Again, warmer SSTs of the northern Atlantic, along with weaker vertical wind shear over the MDR, provided the pathway for such activity to arise.
Emanuel [10] explored TCs over a 30-year time frame and found increasing intensity to be a major part of the increasing trend of TC impacts. As a result, the Power Dissipation Index (PDI) was created as a metric for how destructive TCs would be by blending the intensity of a TC with its duration and overall seasonal frequency [10]. It was then found that the PDI drastically increased during the operational weather satellite era, when better observations could be attained than in the past. Nevertheless, in this upward trend, increased destructiveness of TCs derived from the PDI was found due to more long-lived and powerful systems. For the PDI, a strong correlation, again, ties to SSTs in the Atlantic, which is consistent with theory, i.e., warmer oceans could form more powerful TCs. Concurrently, Webster et al. [17] found that between 1970 and 2004, a noticeable uptick in category 4 and category 5 TCs was found globally. As a result, the conversation on TC intensity and energy, rather than TC frequency, was consistent with Emanuel’s findings.
Based on previous research and identifying the rise in TC activity in the Atlantic basin, Kossin and Vimont [18] formed a process-based framework for understanding Atlantic hurricane variability. A well-known predictor for hurricane activity is SSTs in the MDR, as previously discussed. However, they recognized a coupling mechanism between the atmosphere and ocean. The Atlantic Meridional Mode (AMM) was first coined by Servain [19] and identified key patterns in the SST gradient. With a positive phase of the AMM, a northern shift of the Intertropical Convergence Zone (ITCZ) can be found. This can enhance the development of TCs in the North Atlantic due to warmer SSTs and weaker wind shear. Therefore, seasonal TC activity in the Atlantic can be strongly correlated to the AMM, as the AMM can be easily identified through SST analysis. By implementing AMM analysis in the seasonal predictability of TCs in the Atlantic, a more general explanation of TC development can be given rather than a pure thermodynamic argument. A community shift from a single predictor of TC activity to a more coupled mode and process-based framework was given.
Knutson and coauthors released a series of articles revisiting the state of TCs in a warming climate, as well as their detection and projected response to anthropogenic warming. Knutson et al. [20] provided an intensive review of observed changes, detection and projection of TCs within a warming climate, addressing some of the underlying uncertainties. Because of limited historical records, differing views of the number of TCs exist. However, based on theory and future scenario-based numerical modeling studies, stronger and more robust TCs were found to form rather than an increased number of TCs. Therefore, Knutson et al. [20] argued not to necessarily expect more TCs, but rather stronger and wetter TCs. Furthermore, in Knutson et al. [21], it was found that low confidence existed in detecting human influences on TCs, whether that be intensity or frequency, by applying and discussing false positive (Type-I) and missed signal (Type-II) errors. Rather, it was suggested that uncertainty came from strong natural variability and historical record inconsistencies. However, in Knutson et al. [22], numerical modeling was employed based on the Coupled Model Intercomparison Project (CMIP) to explore potential future climate impacts of a +2 degree C warming scenario globally for the late 21st century. It was found that an increase of up to 10% in average lifetime and intensity could be expected from TCs, as well as a drastic increase in their intensity, while the total number of TCs did not increase. Furthermore, rain rates within 100 km of developed TCs increased significantly, by ~14%, under this future climate scenario. From their study, the baseline was formed with which other case studies could be validated.

2.2. Future Projections of Tropical Cyclone Intensity

Lackmann [23] explored the potential thermodynamic effects on climate-based scenarios for TCs by running numerical simulations of Hurricane Sandy (2012) to show different scenarios of what a Sandy-like hurricane could look like under different climate regimes, i.e., before 1900 and after 2100. Lackmann advanced prior PGW work based on Mallard et al. [24] and directly applied the PGW method to a well-known and impactful U.S. hurricane landfall. In Lackmann’s study, the PGW approach of modifying thermodynamic fields was used in numerical simulations of Hurricane Sandy (2012) to depict how the surrounding environment may be affected without modifying the flow fields or the intensity of Sandy. Results indicate that with climate perturbations, in the initial and boundary conditions, under warmer thermodynamic conditions (after 2100), the intensity of simulated Sandy increases with a lower central pressure and stronger winds surrounding the eyewall when compared to the control simulation. However, the simulated version of Sandy prior to 1900 indicates the opposite, i.e., weaker intensity. Similarly, more precipitation is present in the future climate scenario, because warmer air masses can hold more moisture, and less in the past version of Sandy. Additionally, the steering flow pattern, as well as overall track, was not altered significantly, implying that thermodynamic modifications would be more considerable in the climate signal.
Risser and Wehner [25] followed Lackmann’s approach by linking the human-induced aspect of climate change to precipitation with Hurricane Harvey (2017). In their approach, the thermodynamics were modified in their numerical simulations of Harvey to subtract the human-induced warming influences while keeping the synoptic dynamics surrounding Harvey intact. Two metrics were quantified with their findings: (1) the increase in precipitation and (2) the ratio by which human-induced warming influenced precipitation. It was found that over the Houston, Texas, region, a 24% surplus of precipitation fell in the factual simulation compared to the simulation where human-induced warming was removed. Furthermore, the likelihood of observing extreme precipitation accumulation was increased by approximately a factor of 4 relative to the no human warming results.
Gutmann et al. [26] followed suit from Lackmann as well, and employed a convection-permitting PGW modeling approach to explore the effects of PGW on tropical cyclones in the Atlantic basin, specifically for 21st-century warming trends, using the National Center for Atmospheric Research (NCAR) Community Earth System Model (CESM) Global Bias-Corrected Coupled Model Intercomparison Project Phase 5 (CMIP5) Output to support the Weather Research and Forecasting Model (WRF) and Model for Prediction Across Scales (MPAS) Research: Representative Concentration Pathway 8.5 dataset. In their study, additional meteorological fields were considered besides the thermodynamic (exclusively temperature) fields, i.e., humidity, winds, and pressure. This approach permitted large-scale adjustments of dynamical fields while allowing for the synoptic structures of the TCs to remain intact. From their best-simulated TCs, 22 were kept and showed statistically significant shifts in minimum central pressure (decreased), wind speed (increased), propagation speed (decreased) and precipitation (increased). More importantly, from the reduction in propagation speed, due to a large-scale pattern change, more precipitation was able to accumulate, which aligns with the warmer thermodynamic theory of air masses being able to hold more moisture. Furthermore, with the wind speed and minimum pressure of the TCs becoming more pronounced, the results support the broader literature findings of stronger TCs rather than more TC events [26].
Then, in Liu et al. [27], a study was conducted on Hurricane Irene (2011) to determine how a hurricane going under extratropical transition may respond to a projected climate change scenario. Again, CMIP5 RCP8.5 was used to perturb the initial conditions for thermodynamic fields. It was found that storm-integrated rainfall inherently increased by 32% in the future climate scenario when compared to the control, which exceeded the Clausius–Clapeyron scaling, given a three-degree-Kelvin warming near the surface. By altering only the thermodynamics, an increase in moisture and a strengthened circulation of the TC resulted. Therefore, inherent dynamical effects also exist. In the extratropical transition phase, the spatial spread of precipitation changed. In the future climate scenario, an increase in rainfall surrounding the inner core was found, whereas in the extratropical transition phase, the maximum rainfall shifted to the outer bands. From their consideration of an extratropical transition of Hurricane Irene (2011), additional explanations of the potential spread and change in precipitation patterns may be provided, which adds to the Gutmann et al. and Lackmann arguments.
In the following sections, an exploration of potential climate impacts associated with thermodynamic and moisture profiles will be shown in association with Hurricane Florence (2018). These approximate global warming modifications will loosely act as a representation of how TCs similar to Florence may change during a warming climate.

3. Numerical Model Description and Experimental Design

3.1. WRF-ARW Domain Configuration

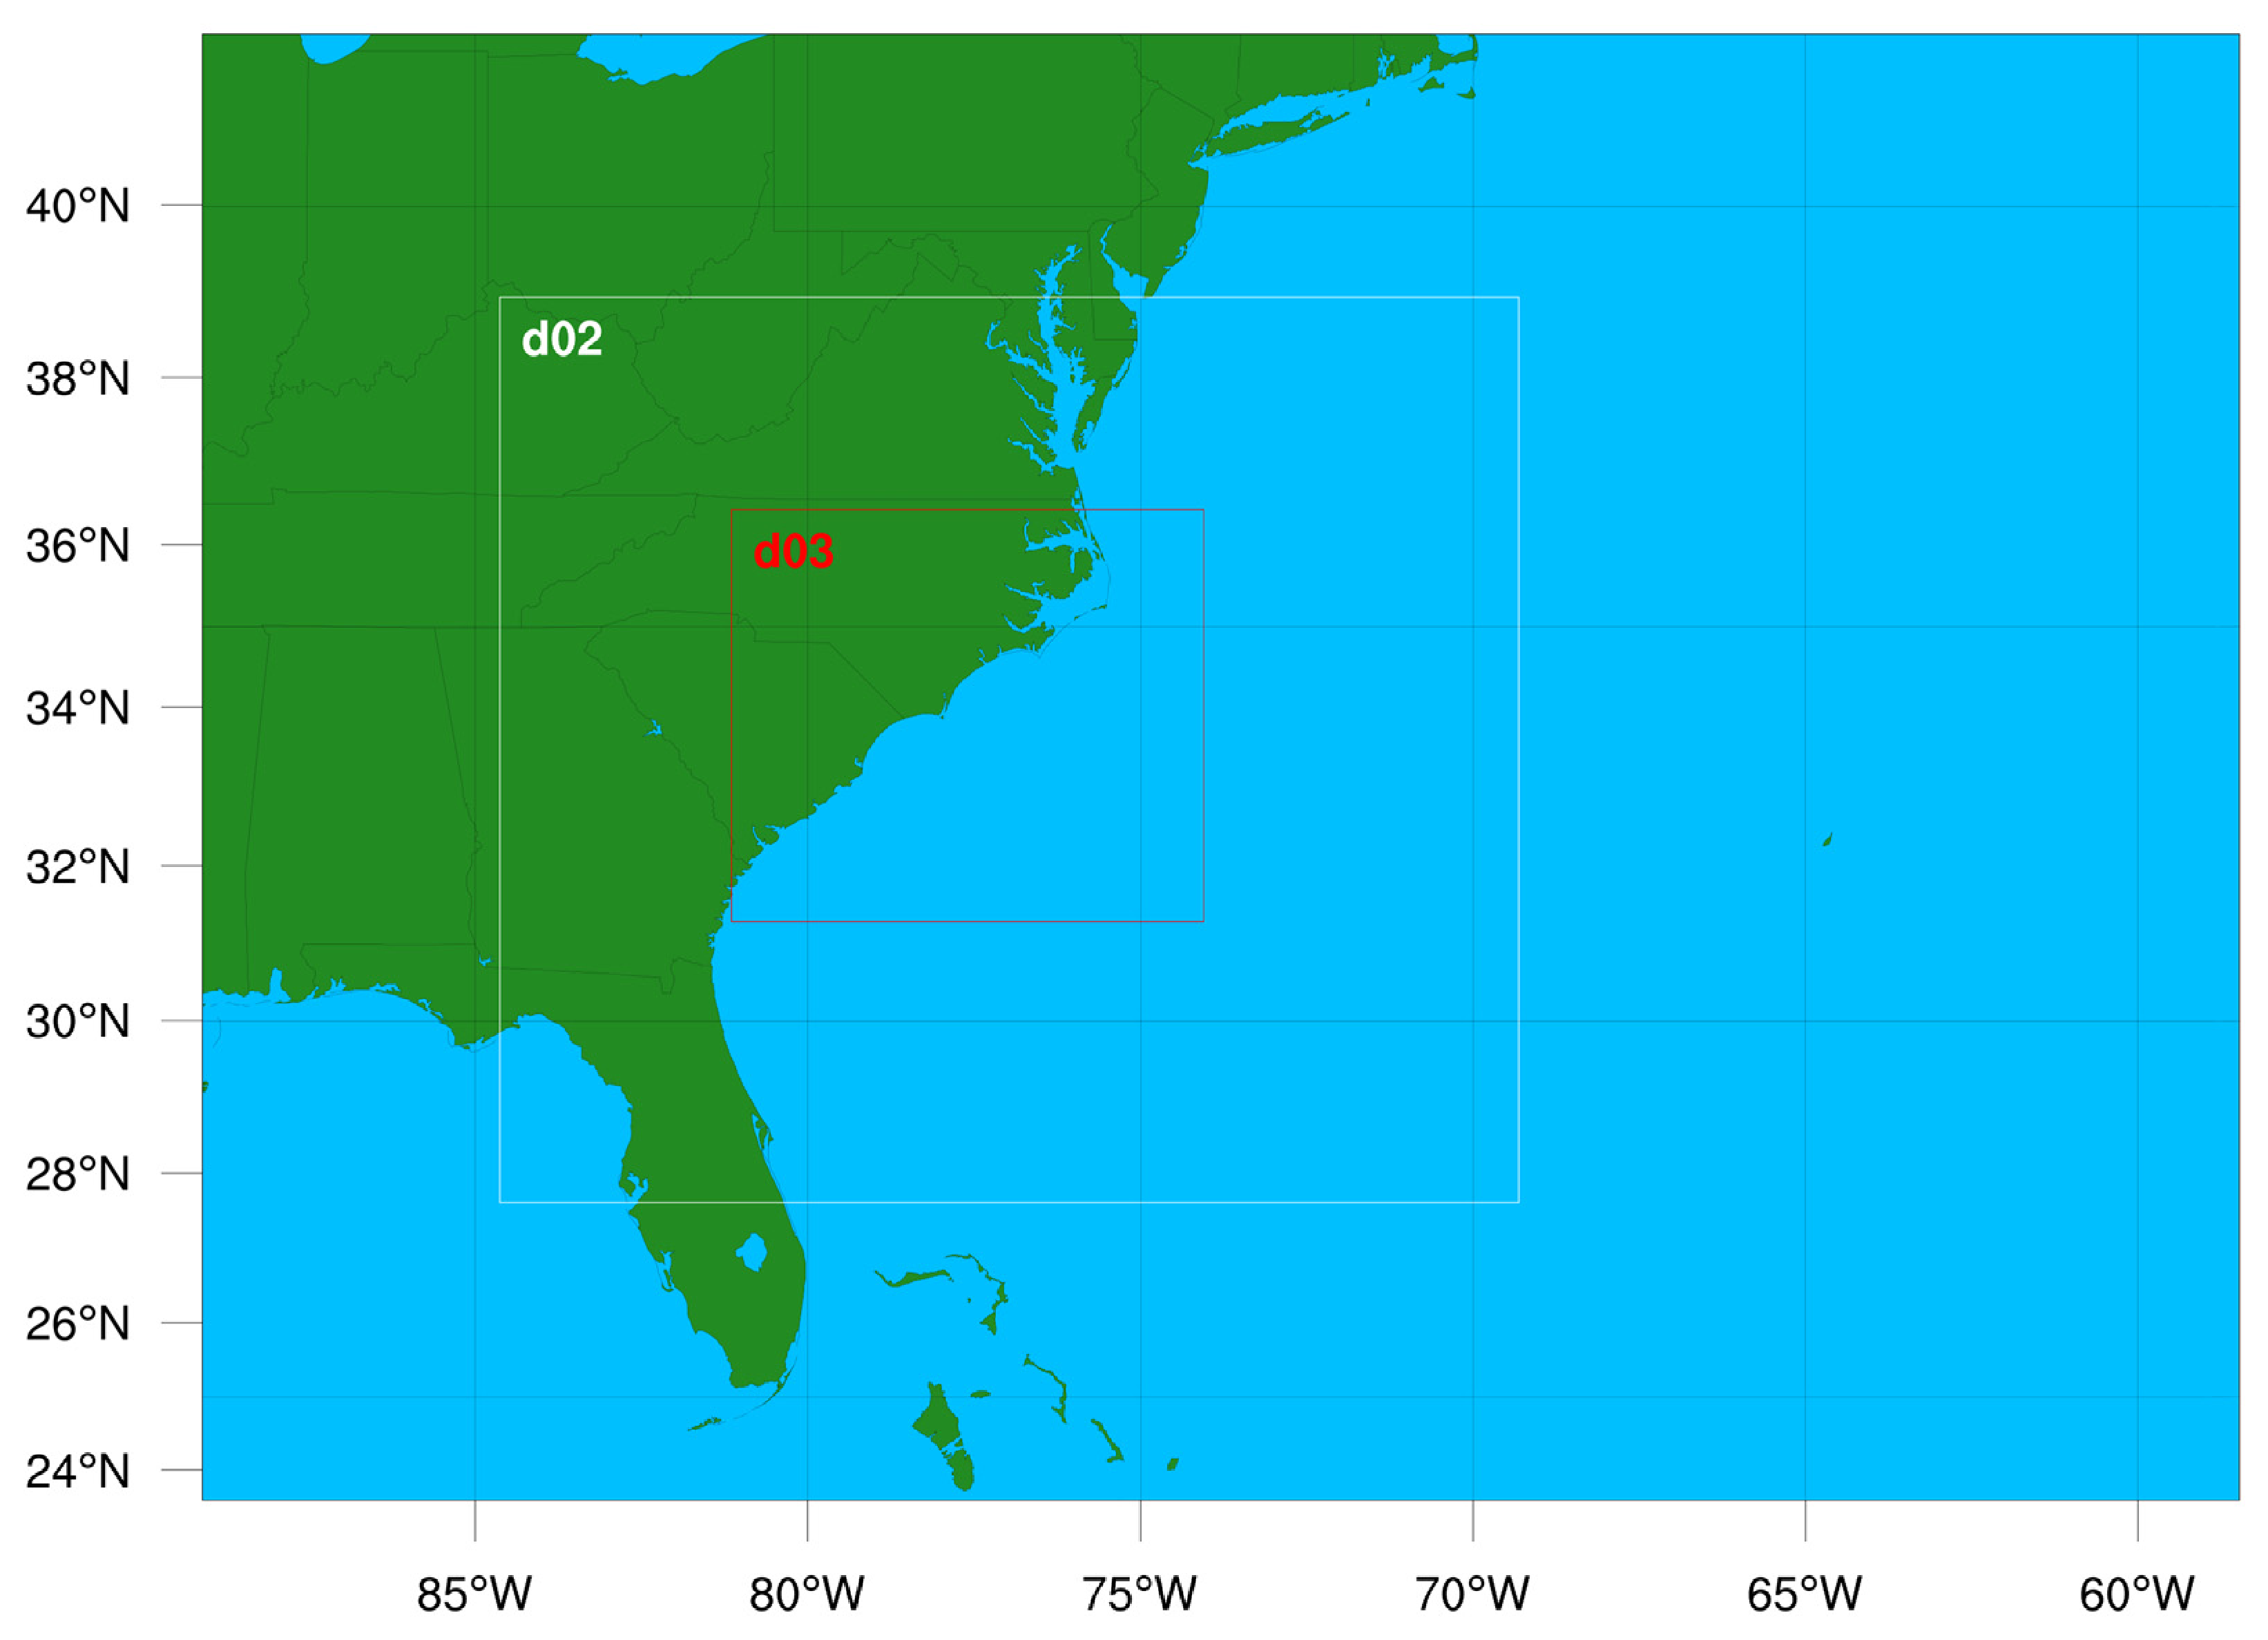
The Weather Research and Forecasting Model, specifically the Advanced Research WRF core (WRF–ARW), version 4.4.2, is employed for numerical simulations, and the domain configuration for this study is shown in Figure 2 below. With the domain configuration shown, the control case (CTRL) was attained. D01 was used to identify the synoptic-scale environment, which covers a significant portion of the eastern seaboard and Hurricane Florence’s final approach to the NC coast, specifically corresponding to the NHC best track data from 12 UTC 10 September through the remaining life cycle of Hurricane Florence, 00 UTC 17 September. D02 allowed a transition from a coarser resolution to a finer resolution, shown in d03 for refined mesoscale analysis over Wrightsville Beach, NC. D02 and d03 were initialized for the following time frames, respectively, 00 UTC 12 September–00 UTC 17 September, and 12 UTC 12 September–00 UTC 16 September. Additionally, a time step of 20 s was used with a parent grid ratio of 4 for both domains 2 (d02) and 3 (d03), along with 49 vertical levels. Also, USGS terrain data was used to satisfy the static geographical data requirement. Finally, the following parameterizations and schemes were used while running WRF–ARW simulations: Microphysics—WSM 6-class graupel scheme; Longwave Radiation—rrtmg longwave scheme; Shortwave Radiation—rrtmg shortwave scheme; Surface Layer Physics—original MM5 scheme; Land Surface Physics—Unified Noah Land Surface Model; Planetary Boundary Layer Physics—YSU scheme; and Cumulus Physics (d01 only)—a newer Tiedtke scheme. For detailed descriptions of each scheme used and their references, refer to the WRF–ARW user manual [28].

3.2. ECMWF ERA5 Dataset

In addition to the domain configuration above, the European Centre for Medium Range Weather Forecasts (ECMWF) ERA5 dataset was employed to drive the CTRL simulation in WRF–ARW. ERA5 offers 137 hybrid sigma/pressure levels, with the top level reaching 0.01 hPa, along with 37 interpolated pressure levels, 16 potential temperature levels, and one vorticity level. In terms of resolution, ERA5 has a parent resolution of ~31 km × ~31 km (0.25° × 0.25°). With this high resolution, interpolation down to d01 of 16 km provides substantial accuracy in defining the initial state. Both the atmospheric surface and pressure level data can be downloaded from the Climate Data Store [29].

3.3. CMIP5 Dataset 2038 and 2068

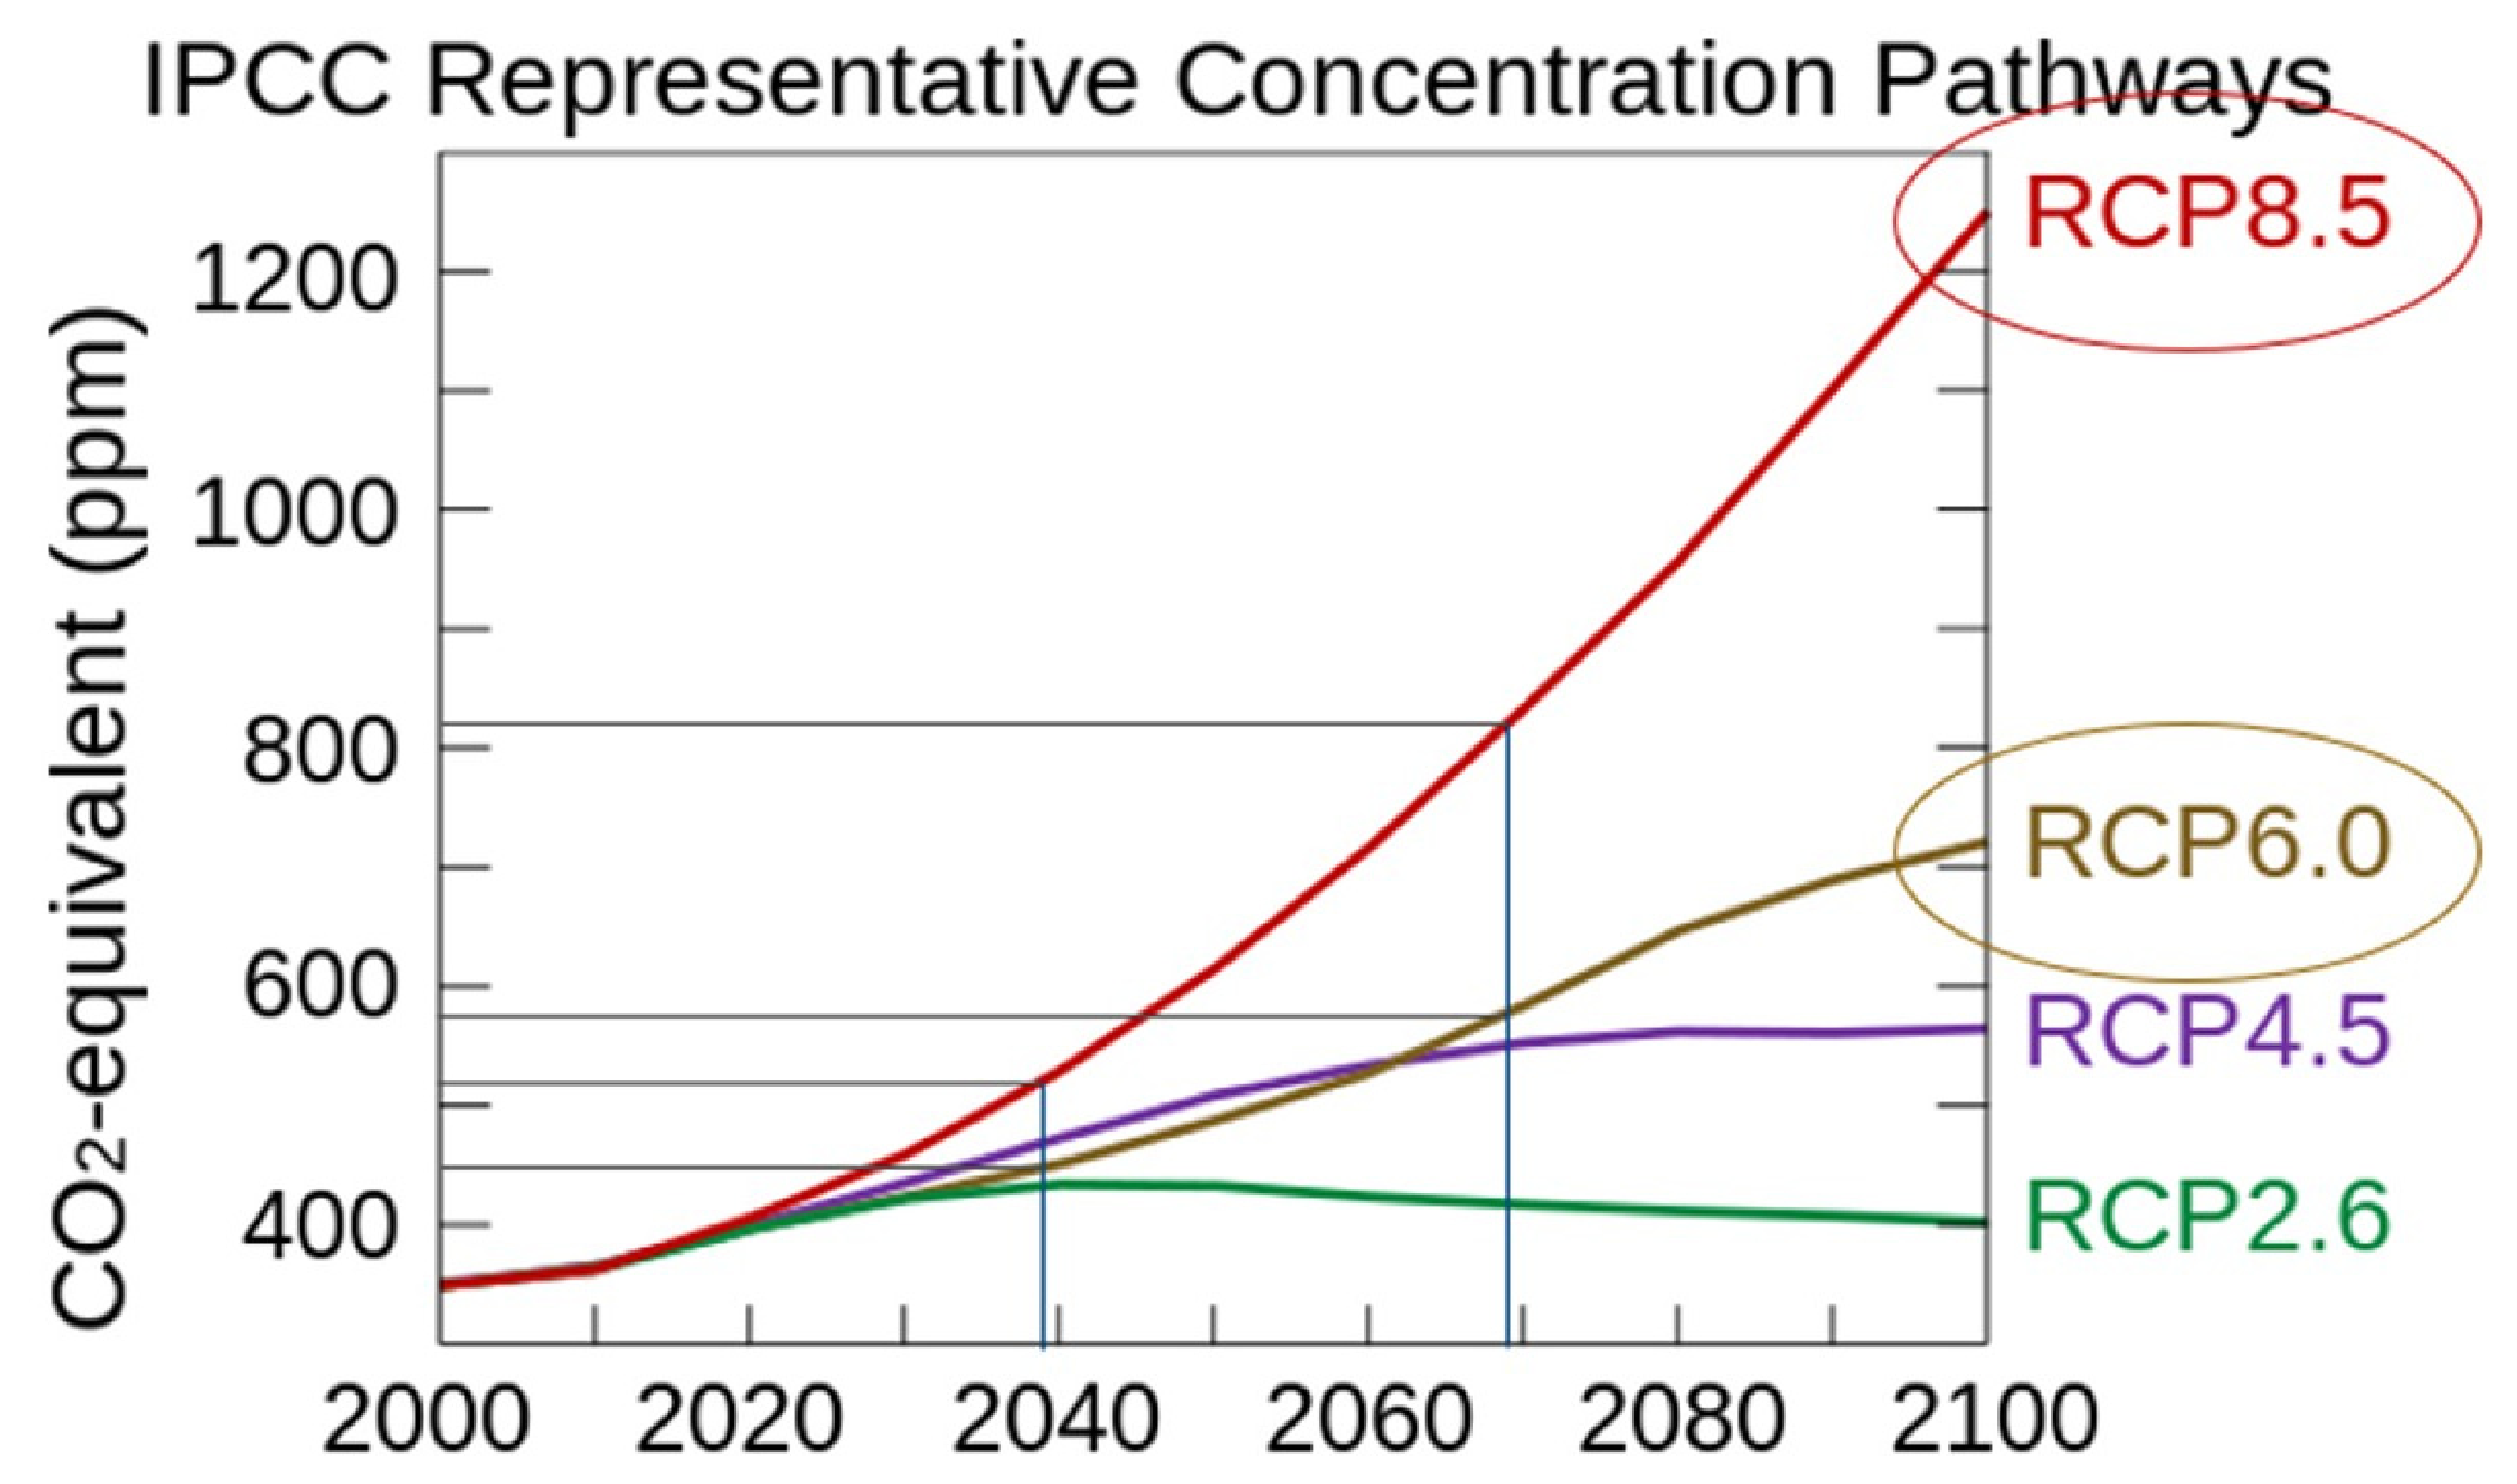
Climate modeling of Hurricane Florence is possible by taking advantage of the CMIP5 dataset, which supported the Intergovernmental Panel on Climate Change Fifth Assessment Report. The specific dataset utilized is the NCAR CESM Global Bias-Corrected CMIP5 Output to Support WRF/MPAS Research [30]. Within this dataset, all atmospheric variables are present to drive the WRF–ARW model at six-hour intervals spanning from 2006 to 2100. In addition to the availability of the data, the data offers three concomitant Representative Concentration Pathway (RCP) future scenarios. Namely, those scenarios are RCP2.6, RCP4.5, RCP6.0, and RCP8.5. The scenarios of higher interest in this research are RCP6.0, which bases the future climate on CO2 concentrations of approximately 440 ppm for 2038 and 590 ppm for 2068. For RCP8.5, the CO2 concentration for 2038 is approximately 510 ppm and 810 ppm for 2068, as can be inferred from Figure 3 below.

3.4. Climate Experiments and Projection Implementation

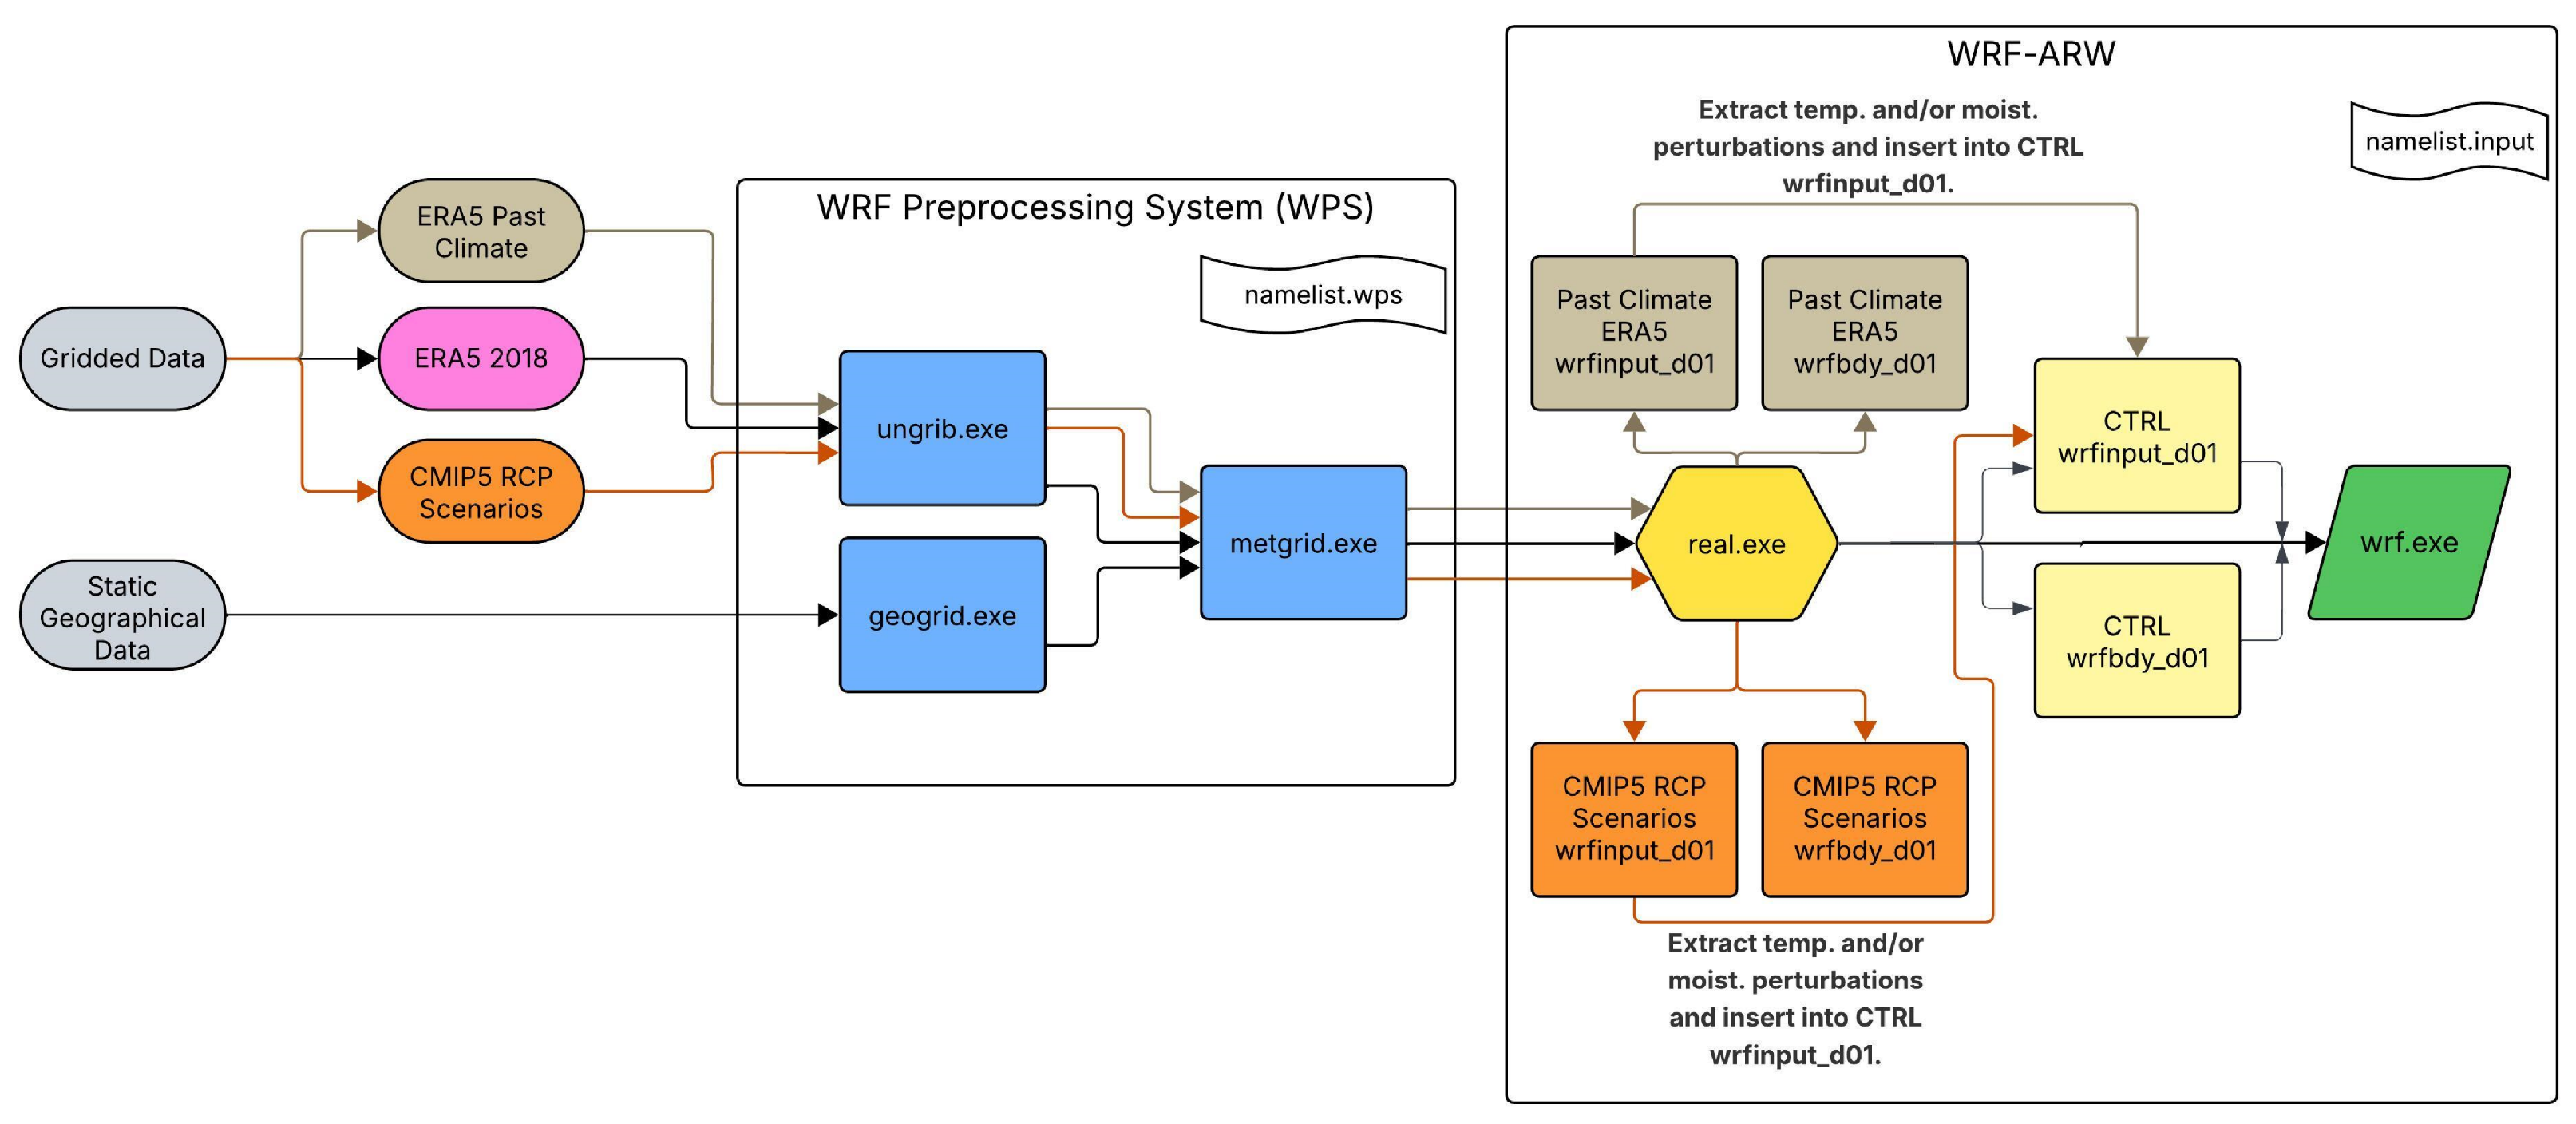
In this study, as mentioned above, the CTRL case was obtained and used as the base for all experiments. Four experiments were conducted on Hurricane Florence, two for the past climate and two for the future climate. With all experiments, the 2018 ERA5 reanalysis dataset was modified to fit past thermodynamic and moisture fields prior to model execution while updating the boundary conditions and keeping the same flow fields. The first gives a depiction of the behavior of Florence if it were to have occurred in 1968, which is fifty years in the past. The second is for a scenario if Florence were to have occurred in 1998, which is 20 years prior to the actual landfall. The future versions of Florence, experiments three and four, stem from 20 years in the future and 50 years in the future, given the RCP6.0 and RCP8.5 scenarios. By modifying the thermodynamics and moisture variables, the sensitivity experiments loosely give either past or future representations of Hurricane Florence (2018). Figure 4 shows the workflow pipeline implemented for this study. Note that in order to pass through both the WRF Preprocessing System (WPS) and real.exe in WRF–ARW, all essential variables are needed, as are the requirements for a standard WRF–ARW simulation. Table 1 shows the adjusted variables in the model experiments.

4. Observational and Simulated Analyses

4.1. Observational Analyses

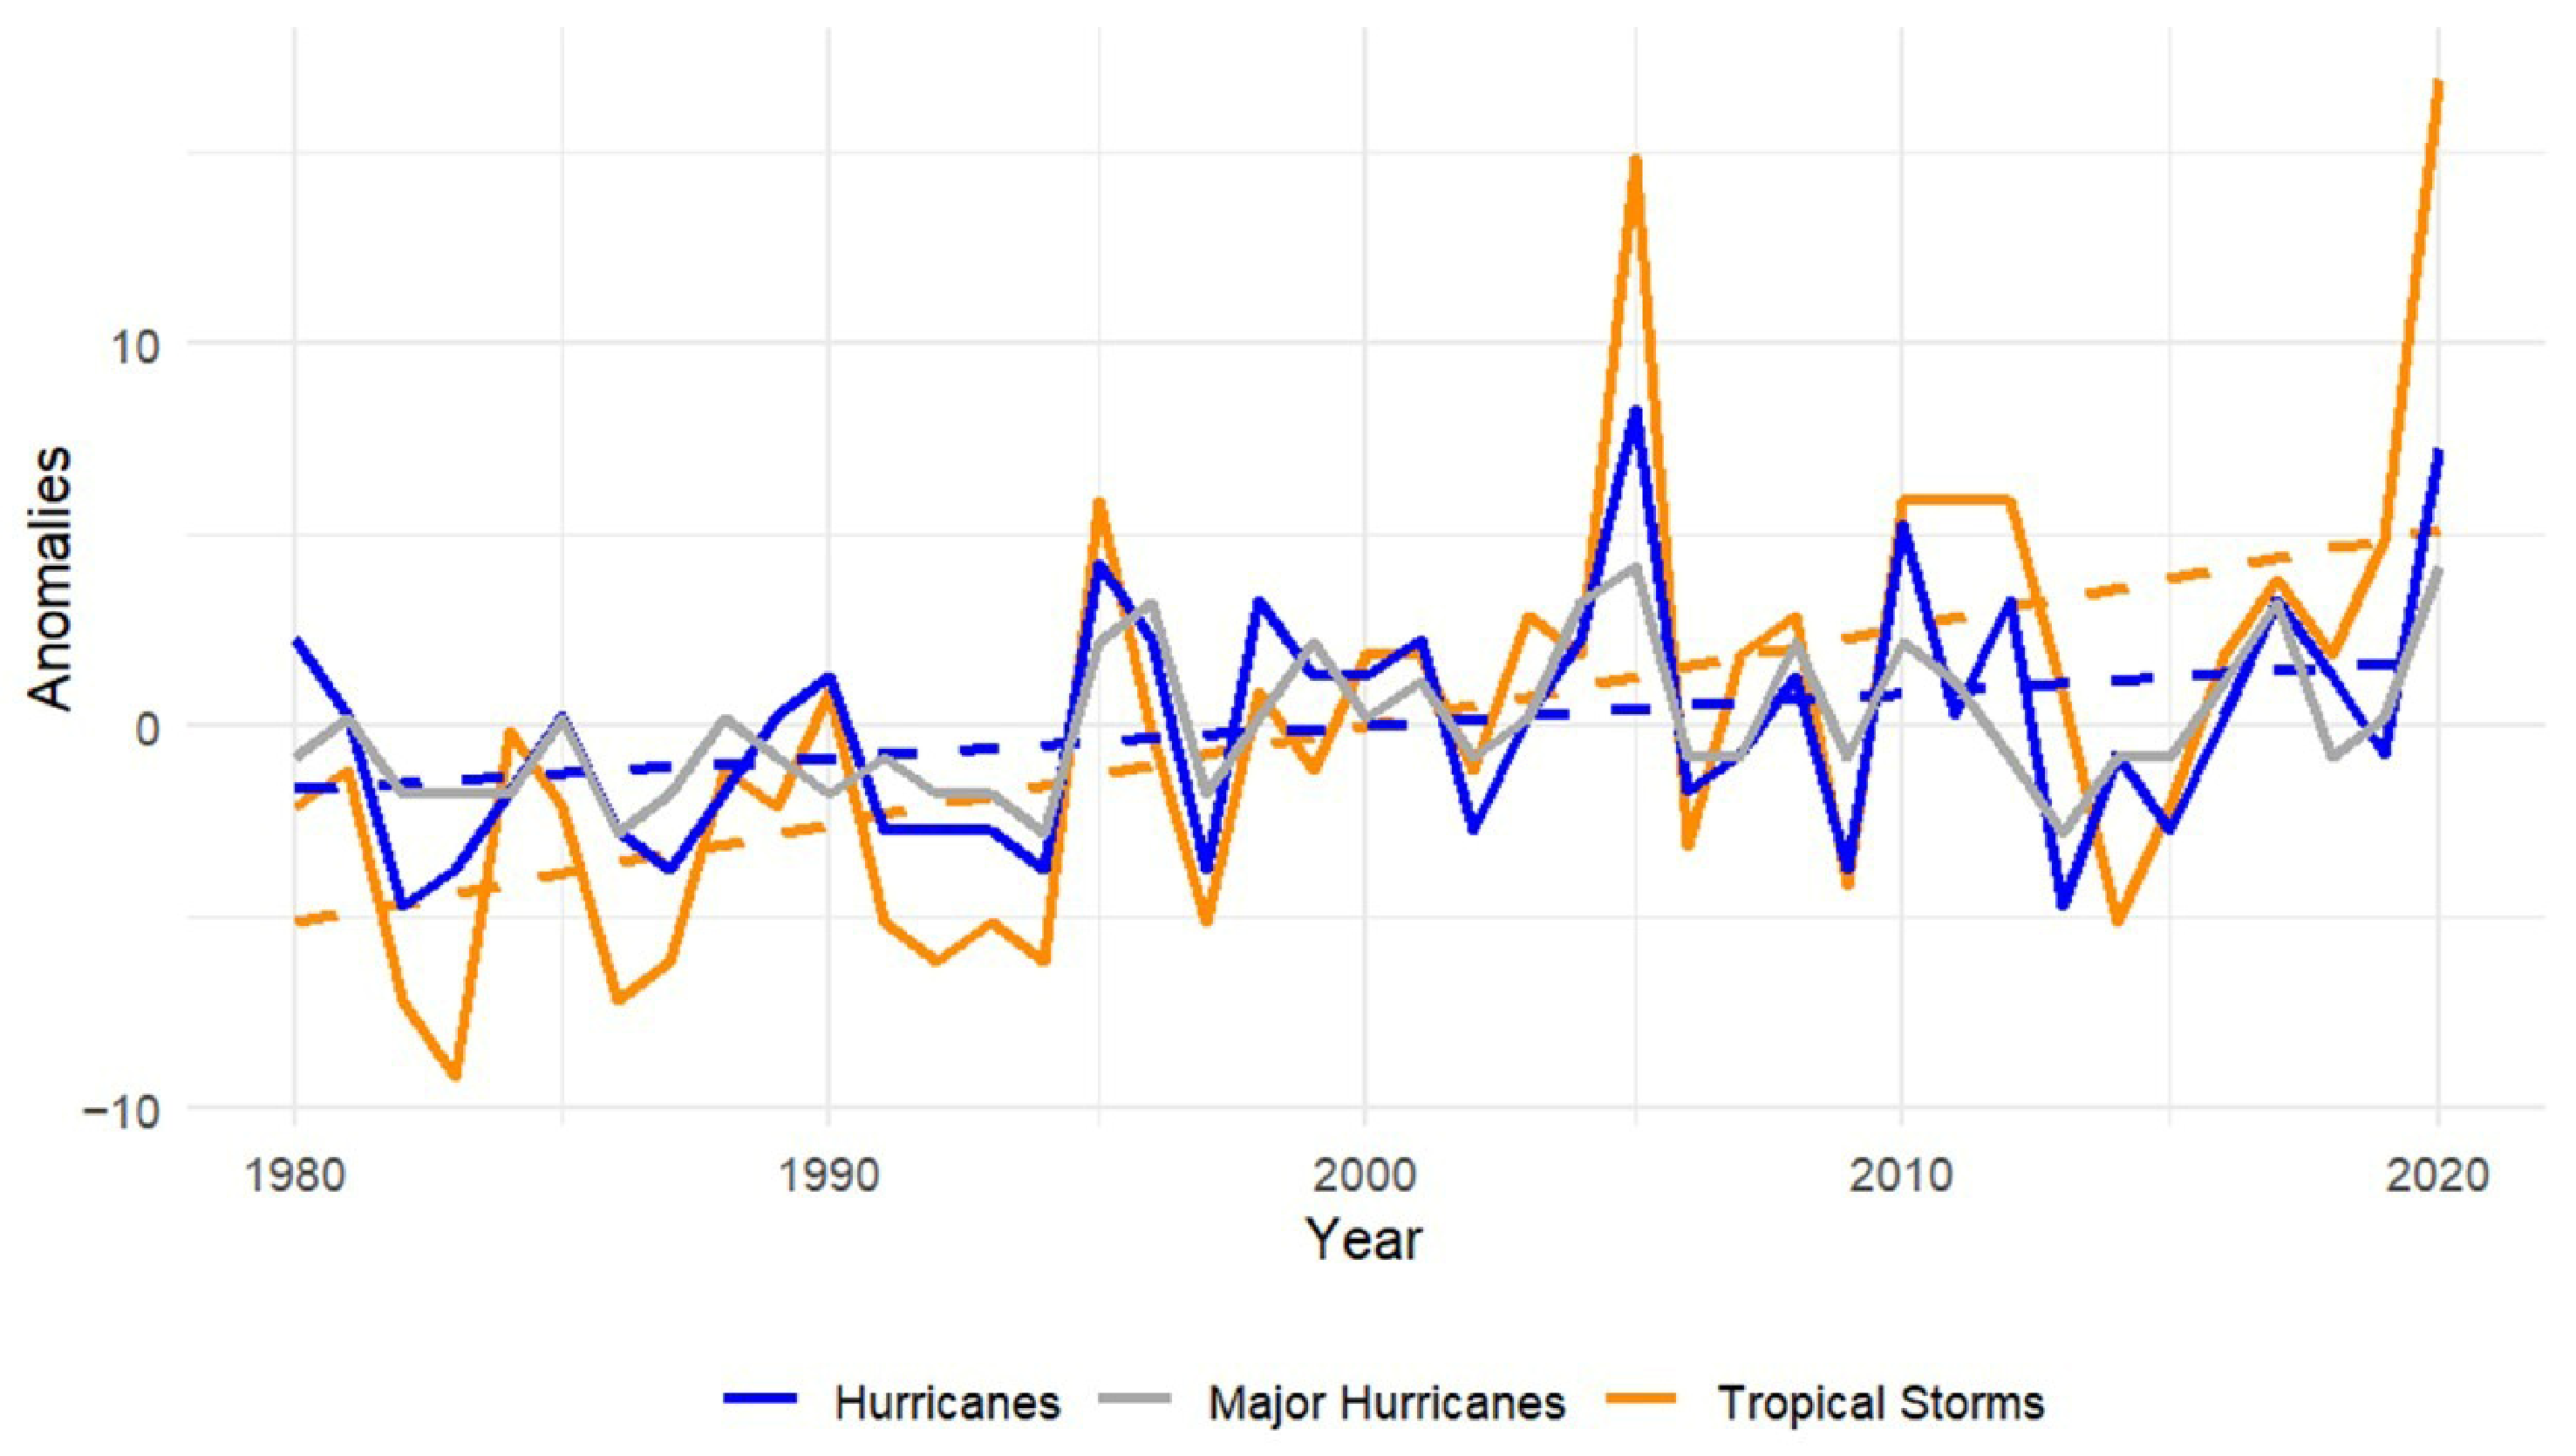
Using Hurricane Database 2 (HURDAT2) data [32,33], individual TC yearly analyses were compiled from 1980 to 2020 to indicate the climatology anomalies of TC numbers in the Atlantic Basin. This analysis covers tropical storm status, hurricane (categories 1–2) status, as well as major hurricane (categories 3–5) status systems, shown in Figure 5 below. Additionally, trend lines are superimposed for tropical storms and hurricanes. Notice the positive trend for both tropical storm status systems, as well as hurricane status systems. This positive trend suggests a recent rise in TC frequency. However, the positive trends are likely exaggerated due to the outlier years of 2005 and 2020. However, evidence suggests that without the outlier years, a positive trend in TC activity still exists but is drastically less noticeable. This analysis corroborates recent evidence that a noticeable upward tick in TC frequency is less certain than that of more intense TCs in a future climate [34].
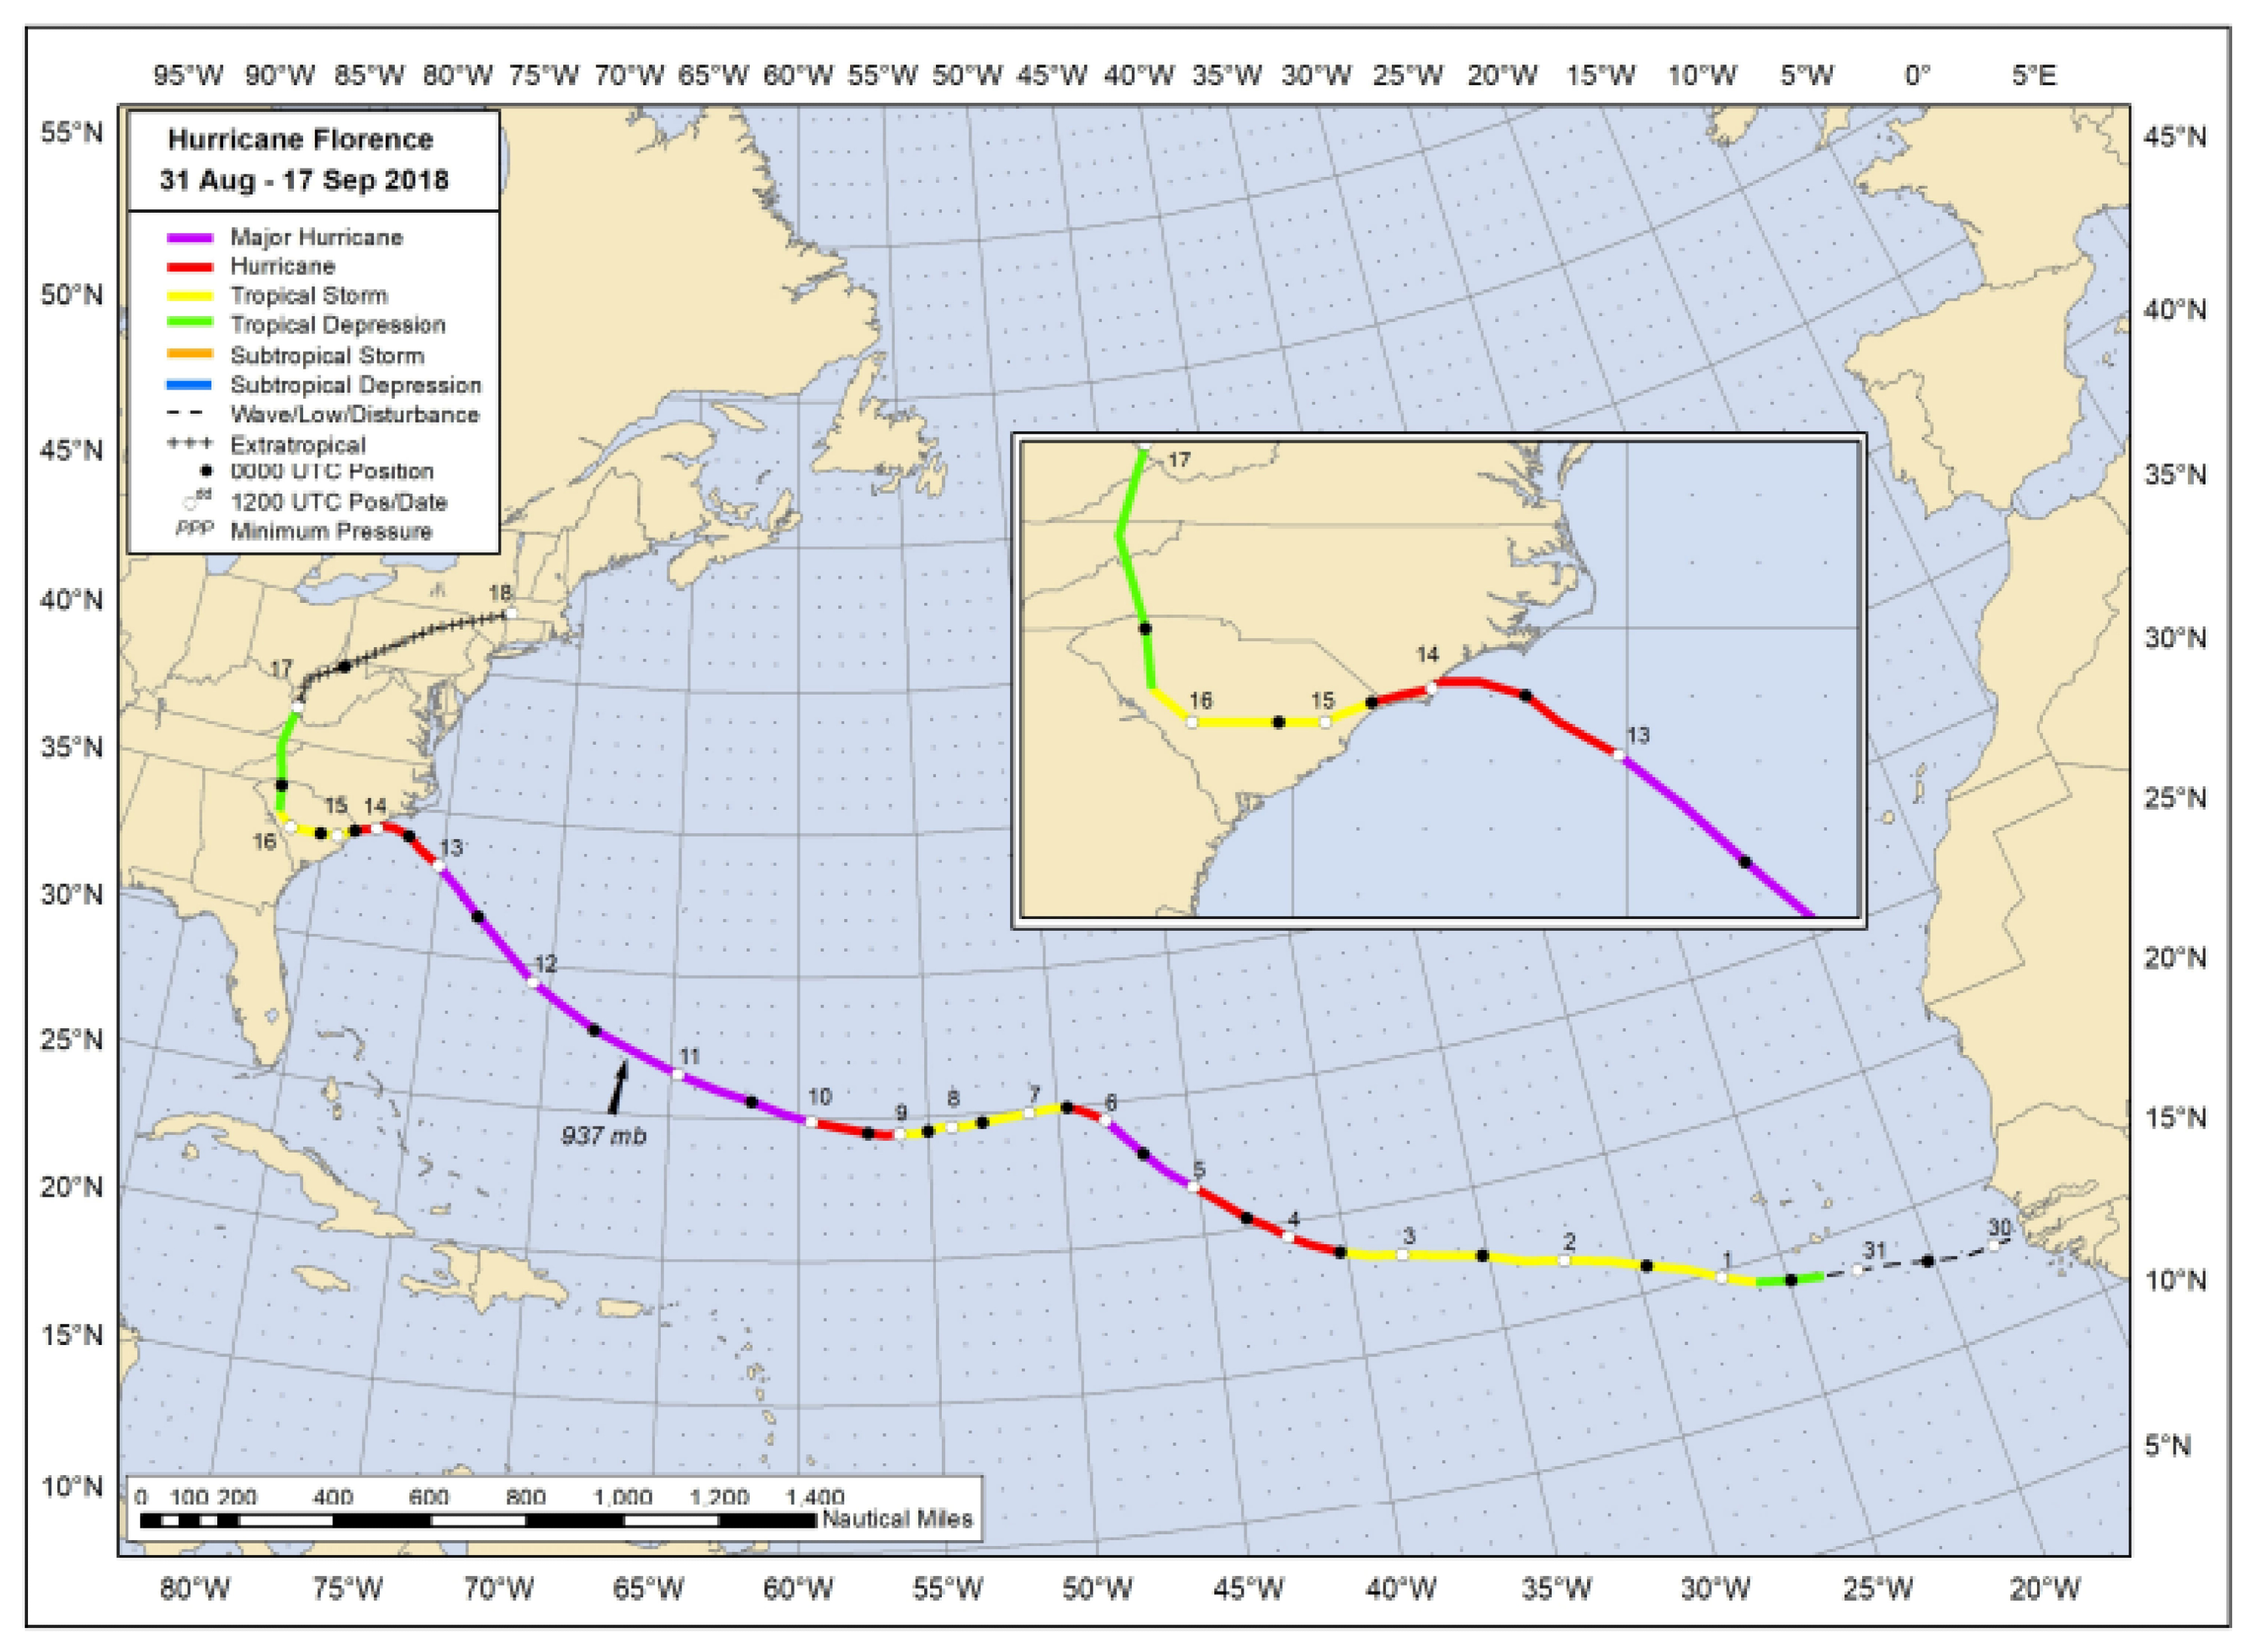
Figure 6 shows the official track of Hurricane Florence along with the corresponding intensity. Specifically, on 10 September, Florence (2018) re-intensified back to major hurricane status as it continued its west–northwest propagation towards Wrightsville Beach, NC. This re-intensification stemmed from warm SSTs and weak vertical wind shear, leading to a favorable environment for enhanced TC maintenance to occur. Additionally, near the time of landfall, as previously mentioned, Florence (2018) stalled near the coast as it began interacting with a quasi-stationary frontal system parallel to the eastern seaboard stemming from the dissipation of the mid-level steering flow between two ridges of high pressure. After the mid-level steering pattern dissipated, westward motion slowed to less than 5 knots (2.57 ms−1). From this stall and interaction between the frontal system, Florence caused significant rainfall.
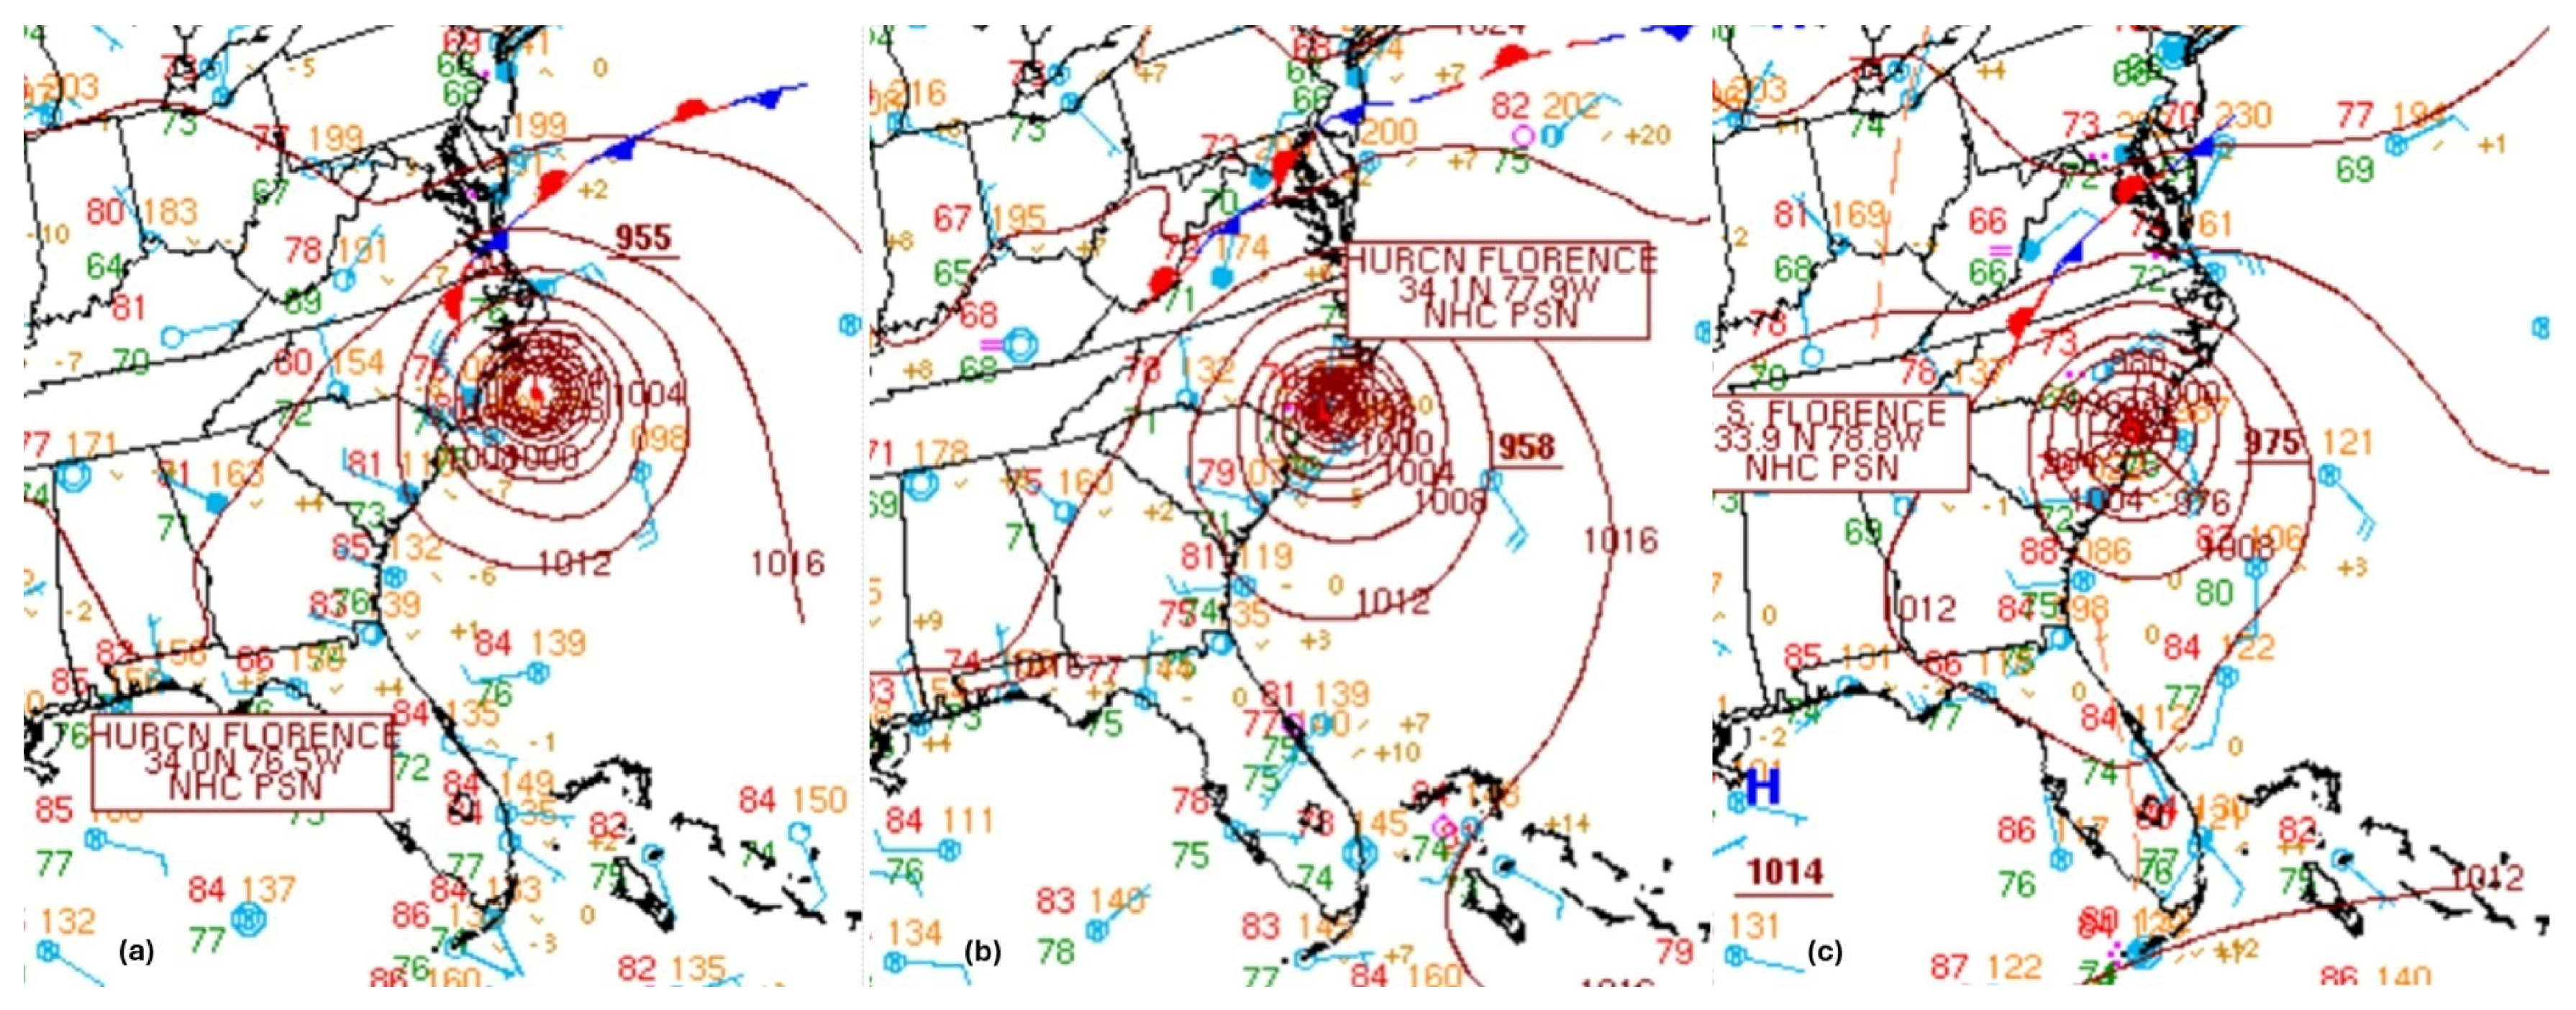
Figure 7 shows the surface analysis charts at 00 UTC 14 September and 12 UTC 14 September 2018. Prior to landfall, as shown in Figure 7a, the stationary front becomes evident and begins wrapping around quadrants I (NW) and II (NE) of Florence, with an extension into the Atlantic. As this quasi-stationary front is in place, an air mass boundary is set up, which acts as a blocking mechanism for continued perpendicular landfall along the NC coastline. However, by 12 UTC 14 September (Figure 7b), as Florence makes landfall, the stationary front pulls poleward slightly and meanders along the Appalachian Mountain Range (AMR). From this steering effect of the quasi-stationary front, Florence (2018) is directed equatorward slowly, causing major inland flooding from an abundance of rainfall. By 00 UTC 15 September, as shown in Figure 7c, Florence (2018) has moved equatorward with its center being in South Carolina (SC), at this point still with the front poleward over the AMR. With the continued effect of the quasi-stationary front, Florence’s forward-moving speed is negligible.
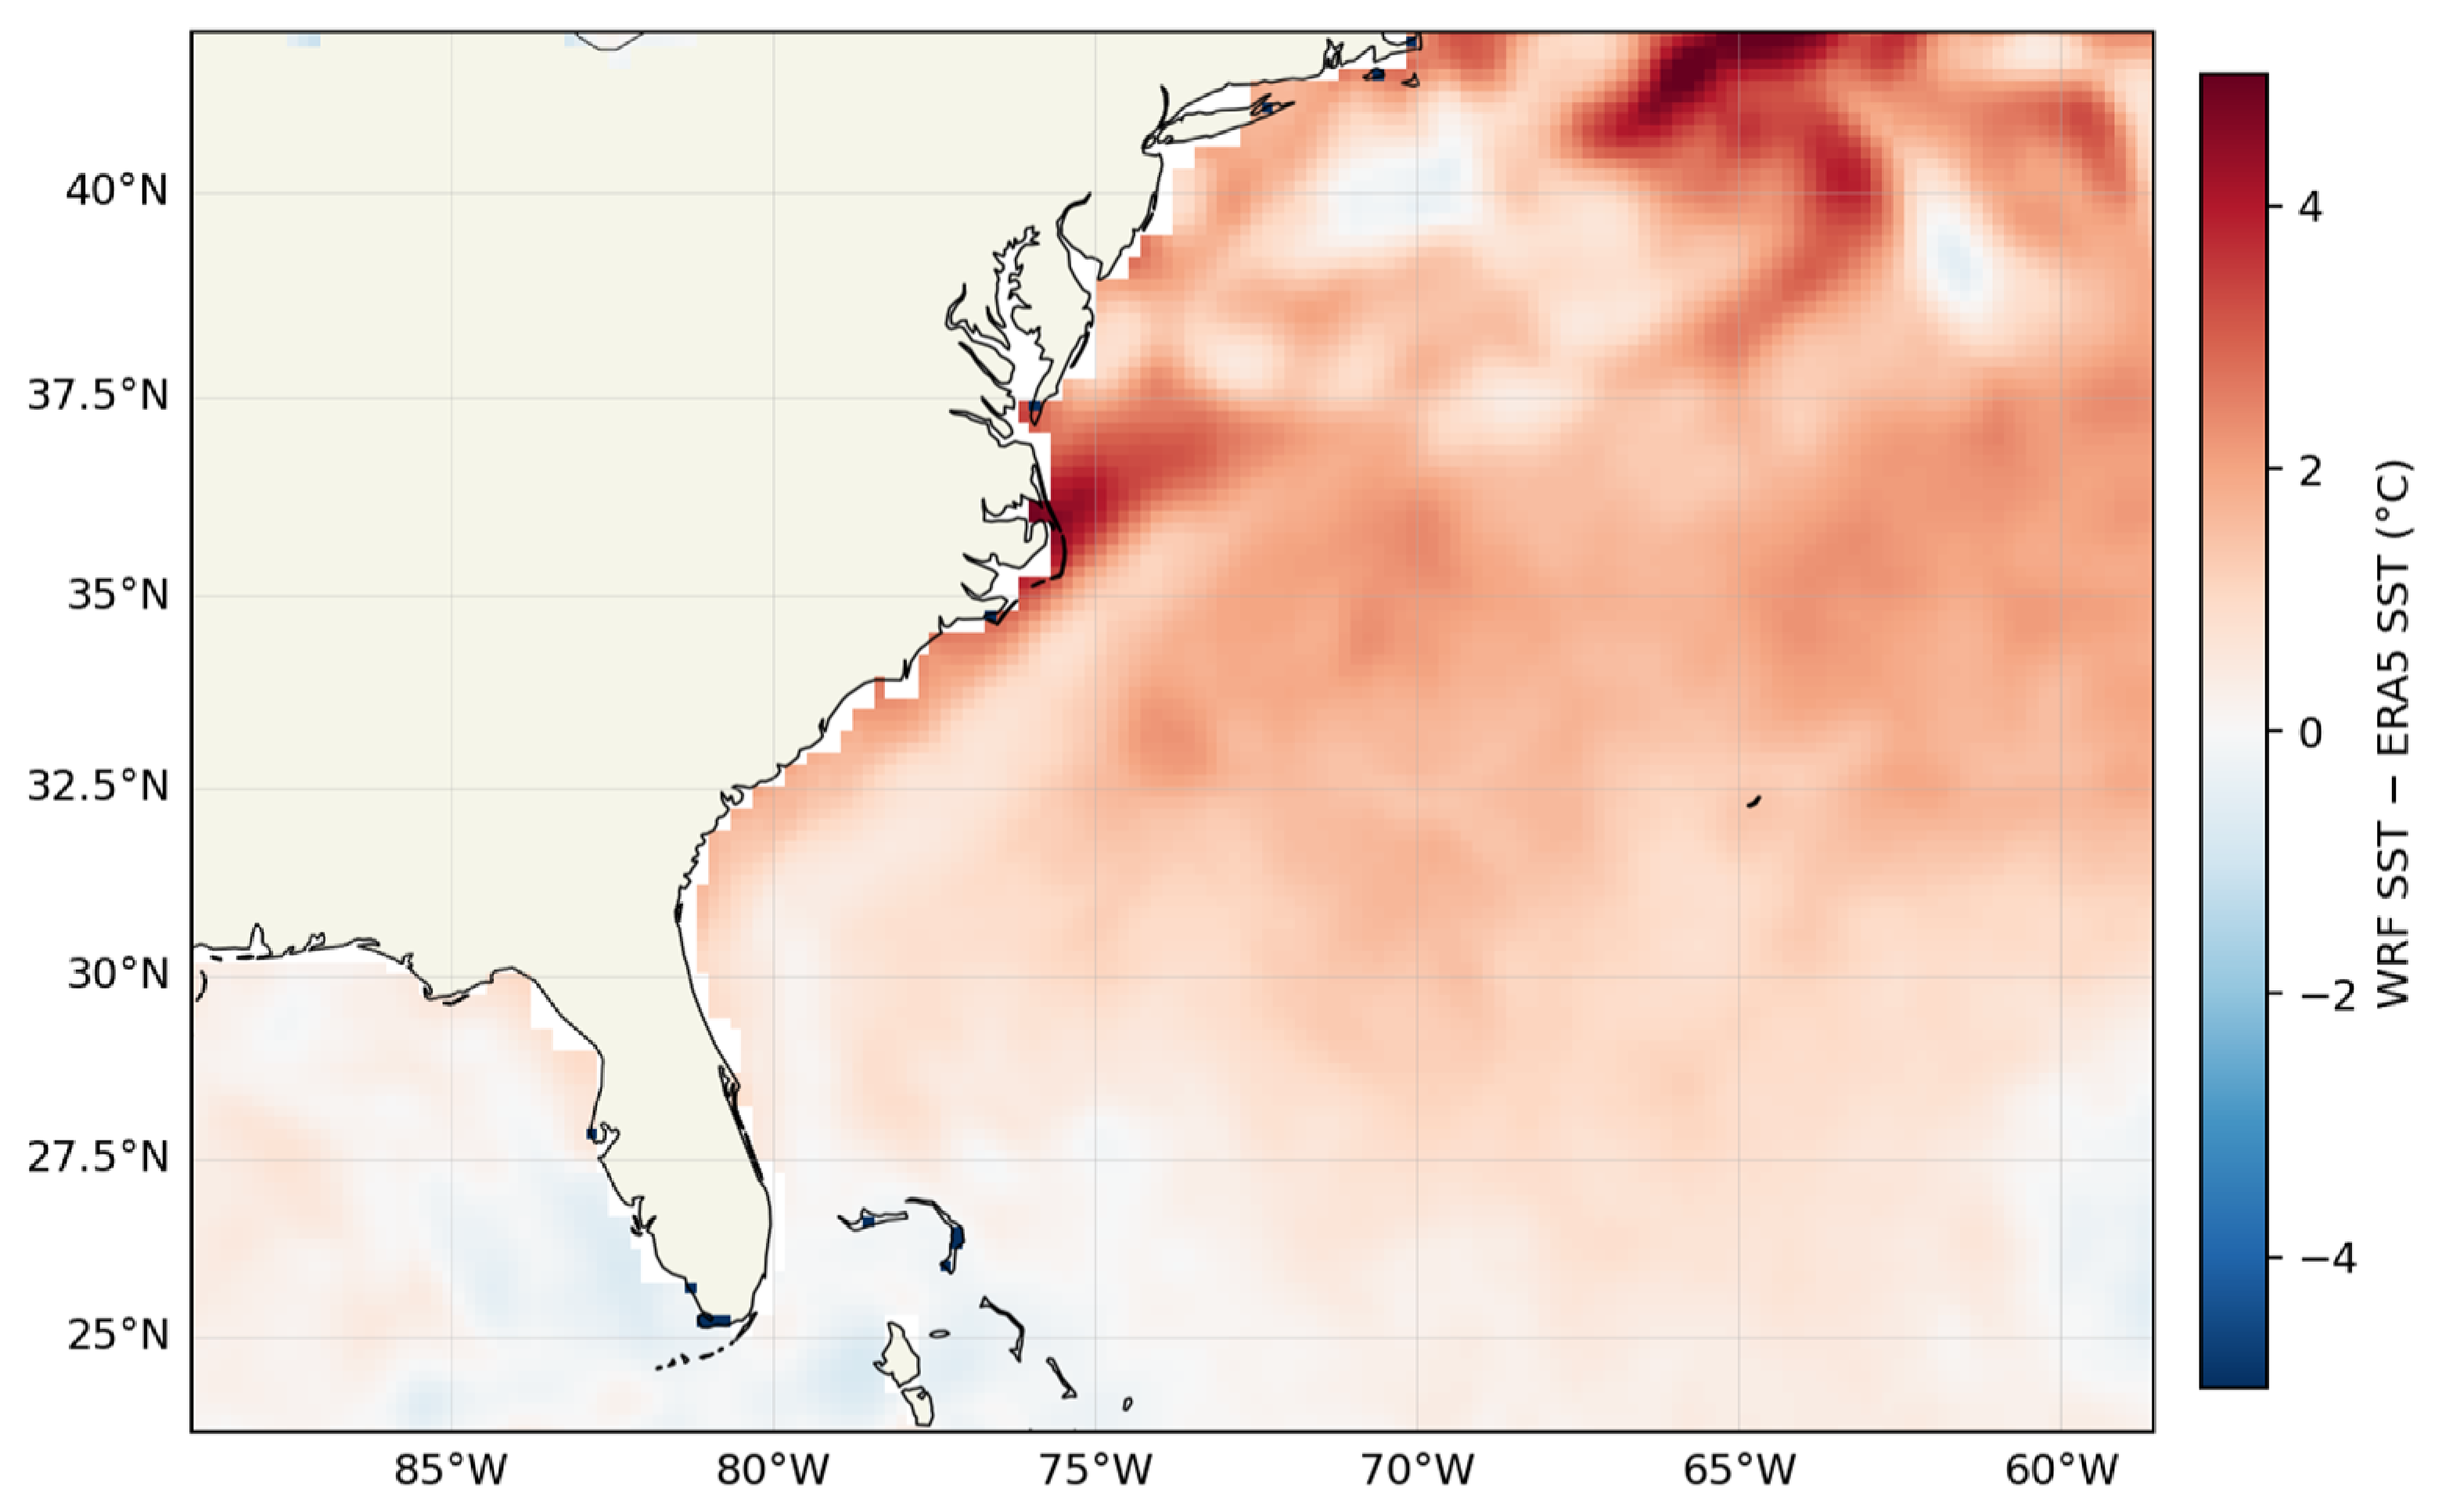
Regarding SST analysis, ERA5 reanalysis data for the month of September was gathered for 1990–2018 and averaged together to show the SST climatology along the eastern seaboard. By subtracting the SST of the CTRL simulation from that of climatology, a drastic and noticeable increase in SST can be seen, as shown in Figure 8. Along the Outer Banks of NC, consistent with the majority of the Atlantic Ocean poleward of 30° N, anomalously warm ocean temperatures exist, upwards of 2–4 degrees C. Specifically, along the North Carolina coast and off the coast of Maine, the SST is approximately four degrees above average. When Florence (2018) passes over the warm waters west–southwest of Bermuda, intensification is likely due to this favorable environment.
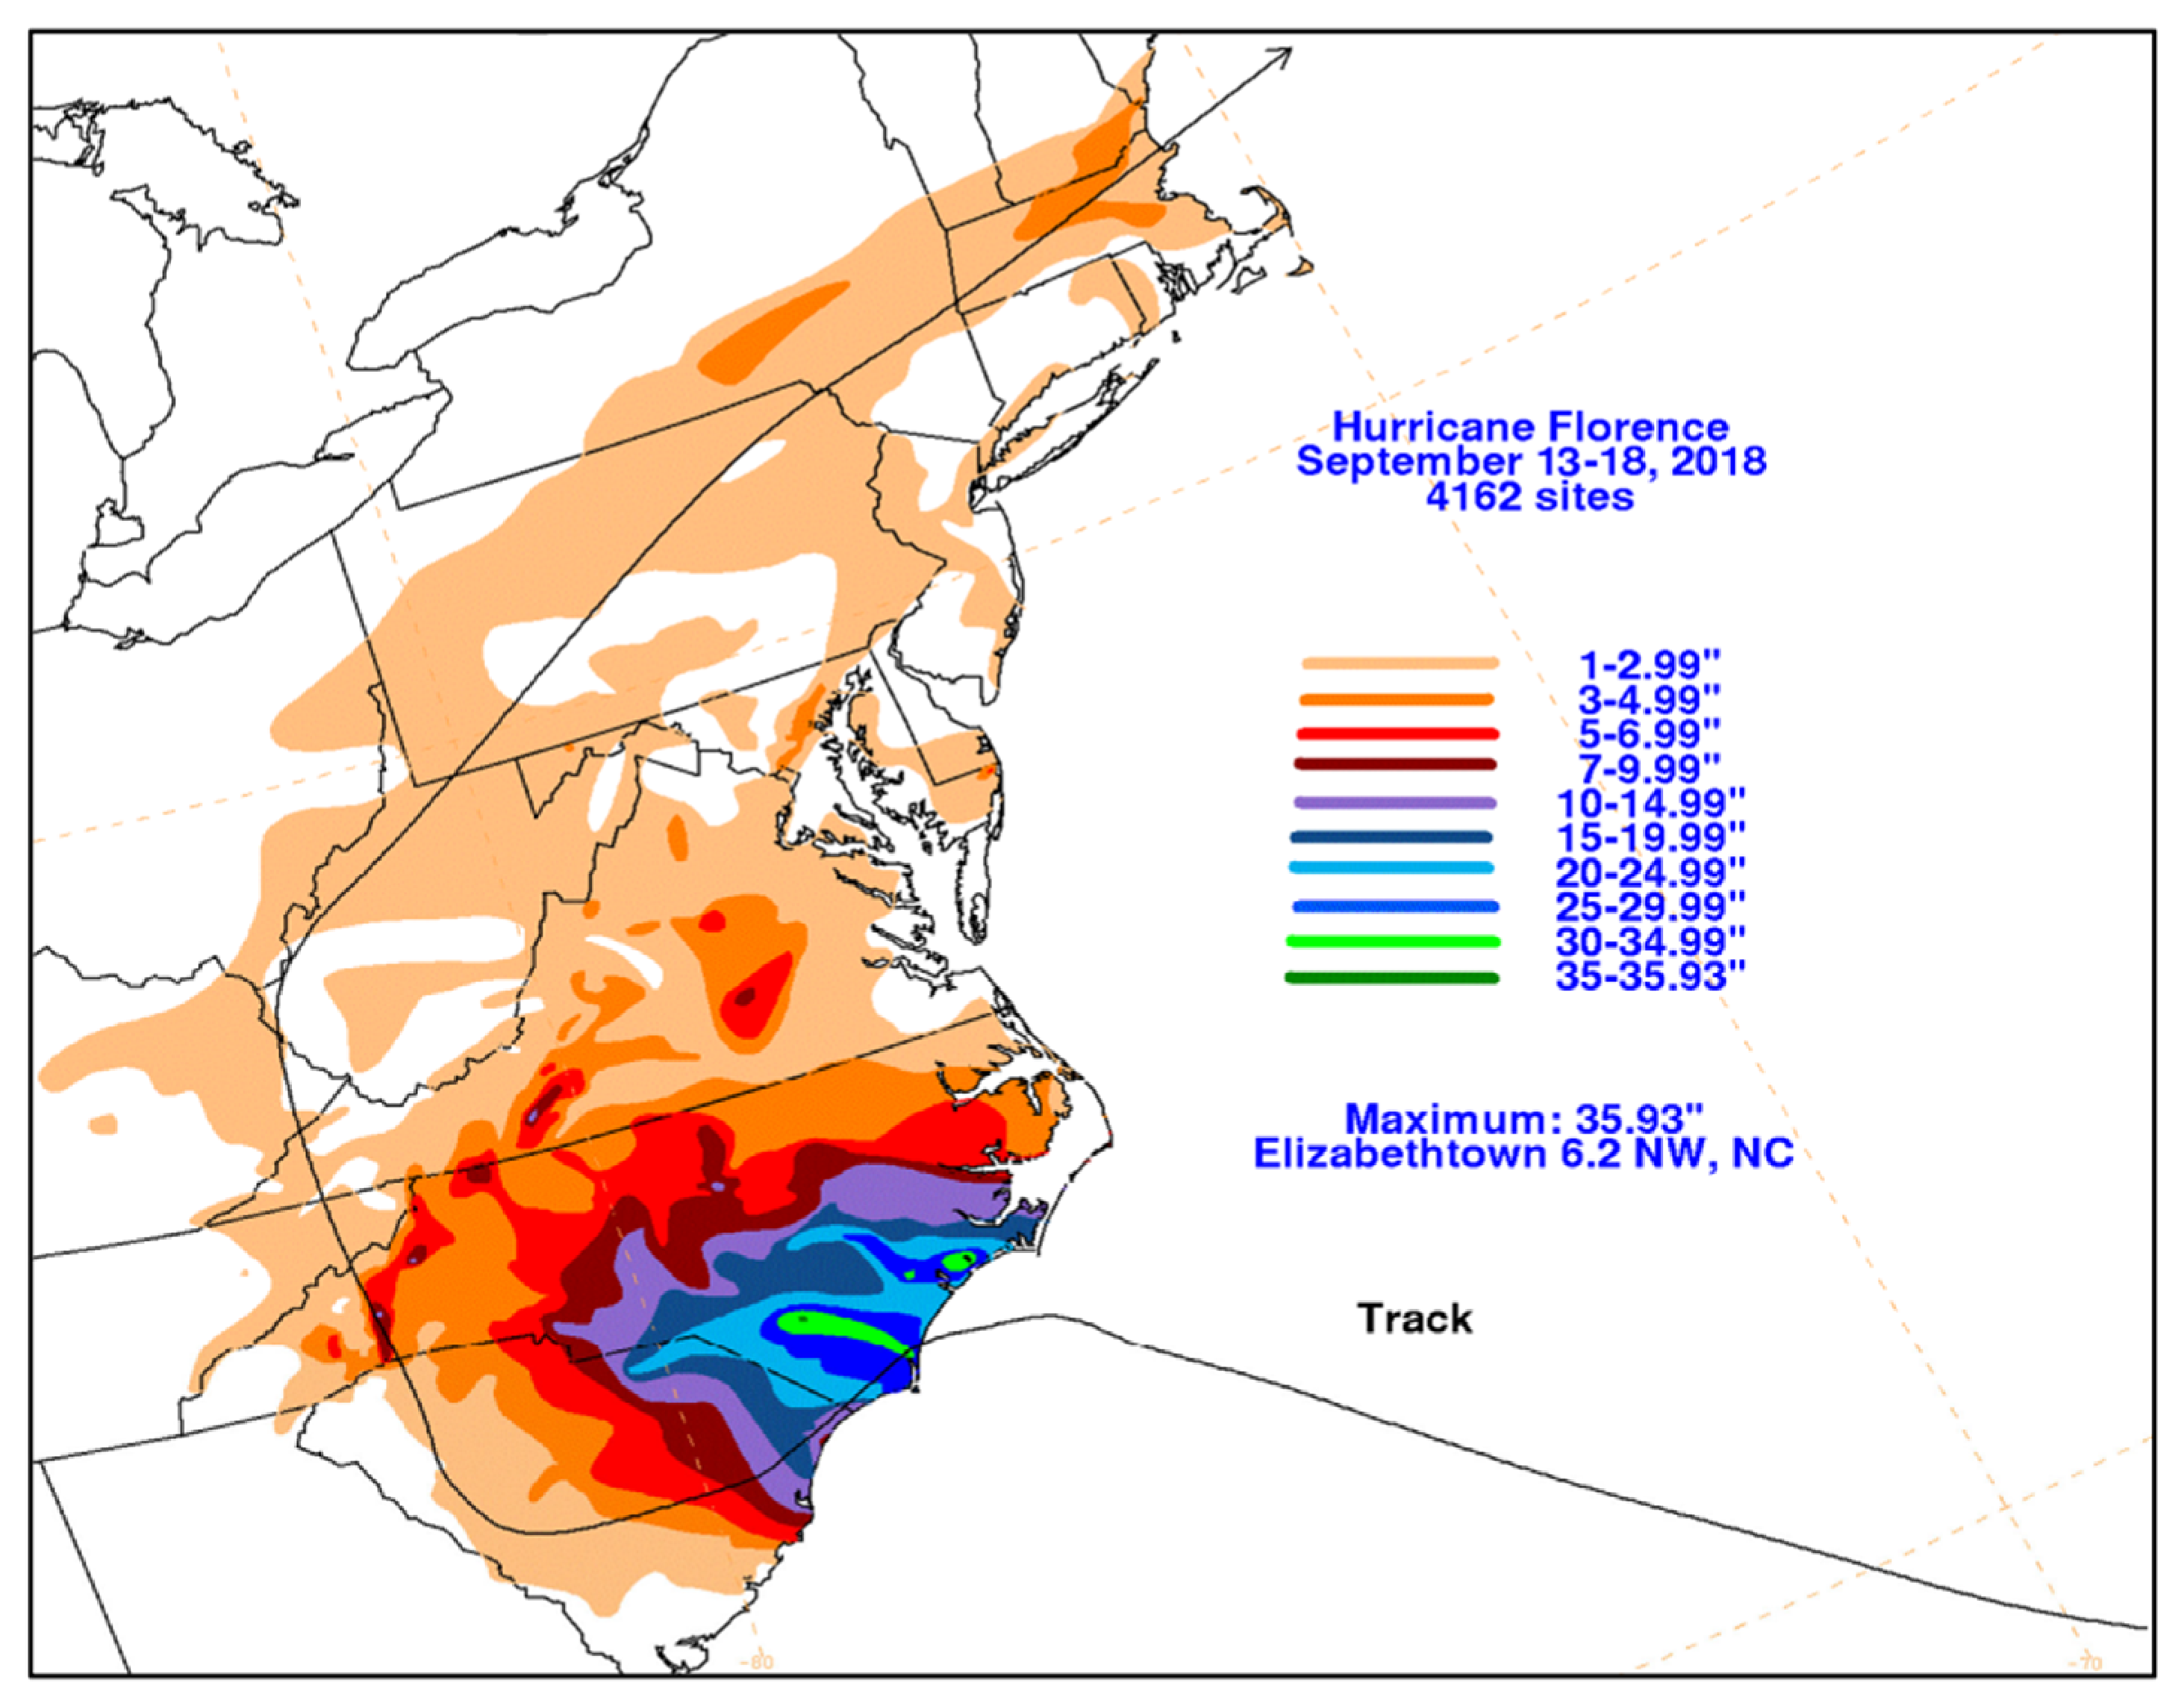
From Figure 9, it is evident how significant the accumulated rainfall from Florence (2018) was. Near Wrightsville Beach, NC, a narrow yet substantial swath of rainfall exceeding 30 inches (762 mm) fell, extending well inland; the maximum fell in Elizabethtown, NC, with 35.93 inches (912.62 mm) accumulated within the five-day period of 13–18 September 2018. A secondary swath of rainfall near 30 inches (762 mm) fell just to the north of the landfall location, likely attributed to the onshore push of significant outer bands of Florence. Furthermore, due to the overall stalling of the TC after landfall, approximately half of NC received at least five inches (127 mm) of rain (Figure 9).

4.2. Simulated Analyses

4.2.1. CTRL Simulation Analysis

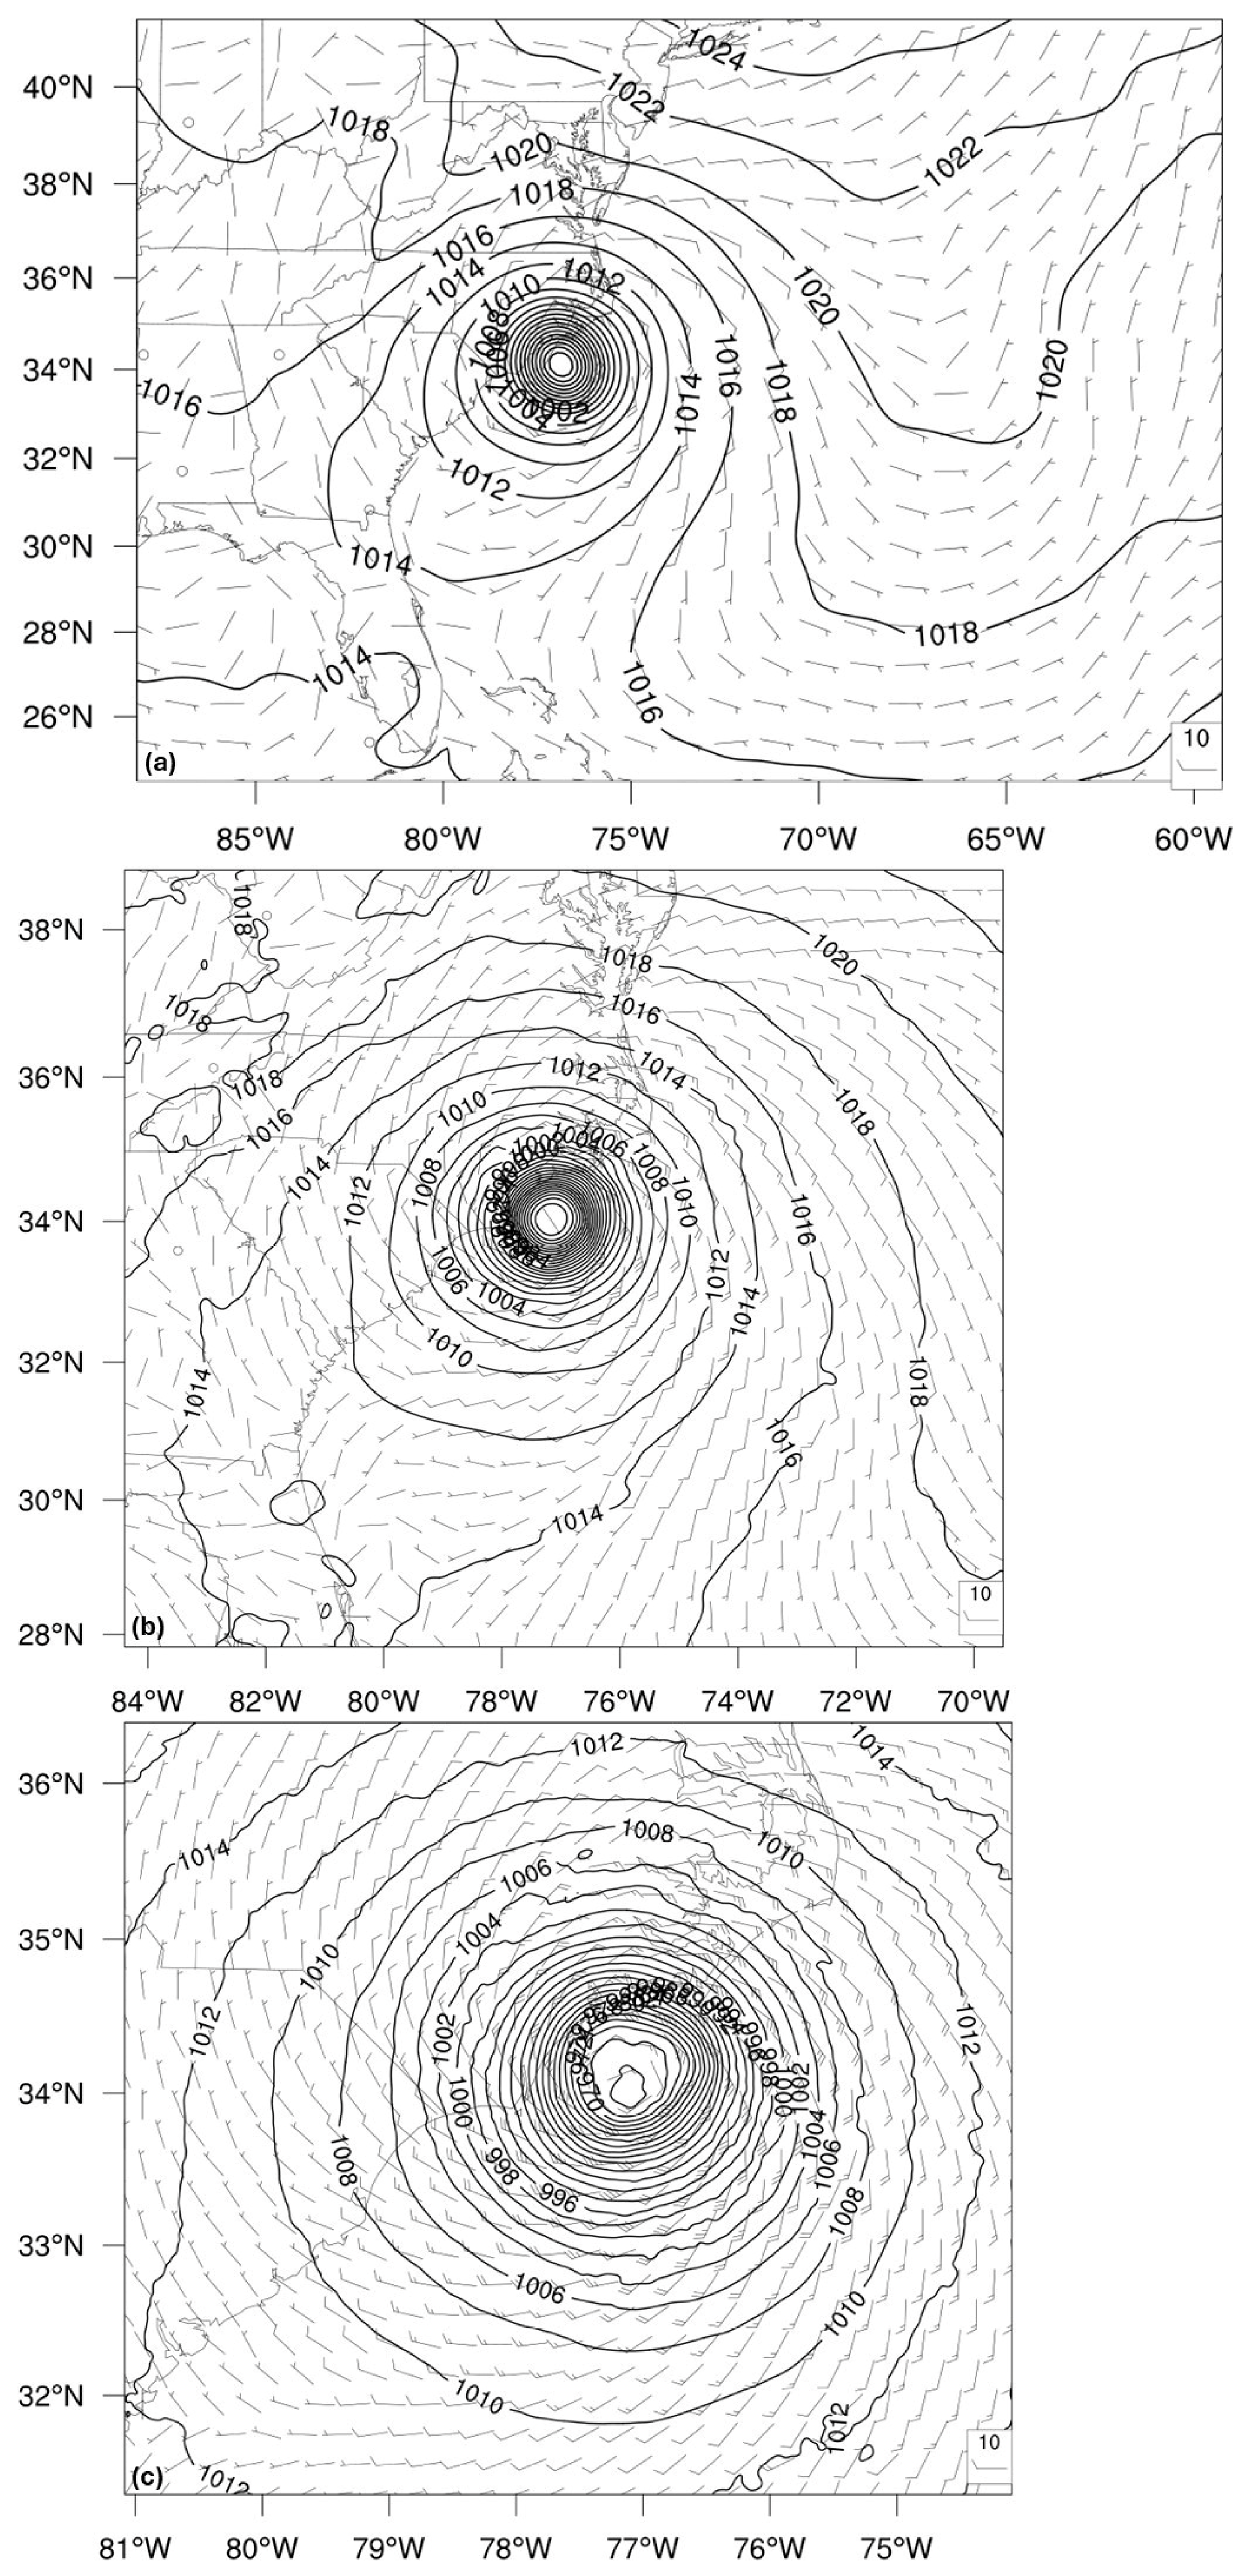
Figure 10a presents the minimum sea level pressure (MSLP) in hPa and wind barbs in ms−1 prior to landfall from the CTRL simulation. Florence (2018) approaches as a weakened category 1 hurricane, with wind speeds around 38 ms−1, and interacts with the stationary frontal system, as observed. This frontal system is shown over the AMR with the perturbation in the isobars. As a result, Florence begins moving equatorward after landfall. However, by implementing the nests shown in Figure 10b,c, the TC intensifies due to increased domain resolution. With d02, the minimum SLP drops from 980 hPa to 964 hPa, and the wind speed increases from ~38 ms−1 to ~47 ms−1. Further intensification is evident in d03, as shown in Figure 10c. This intensification represents the effects of the localized environment surrounding Florence. It is worth noting that with finer resolution, Florence’s simulated intensity is misrepresented, specifically with higher wind speeds compared to the observed.
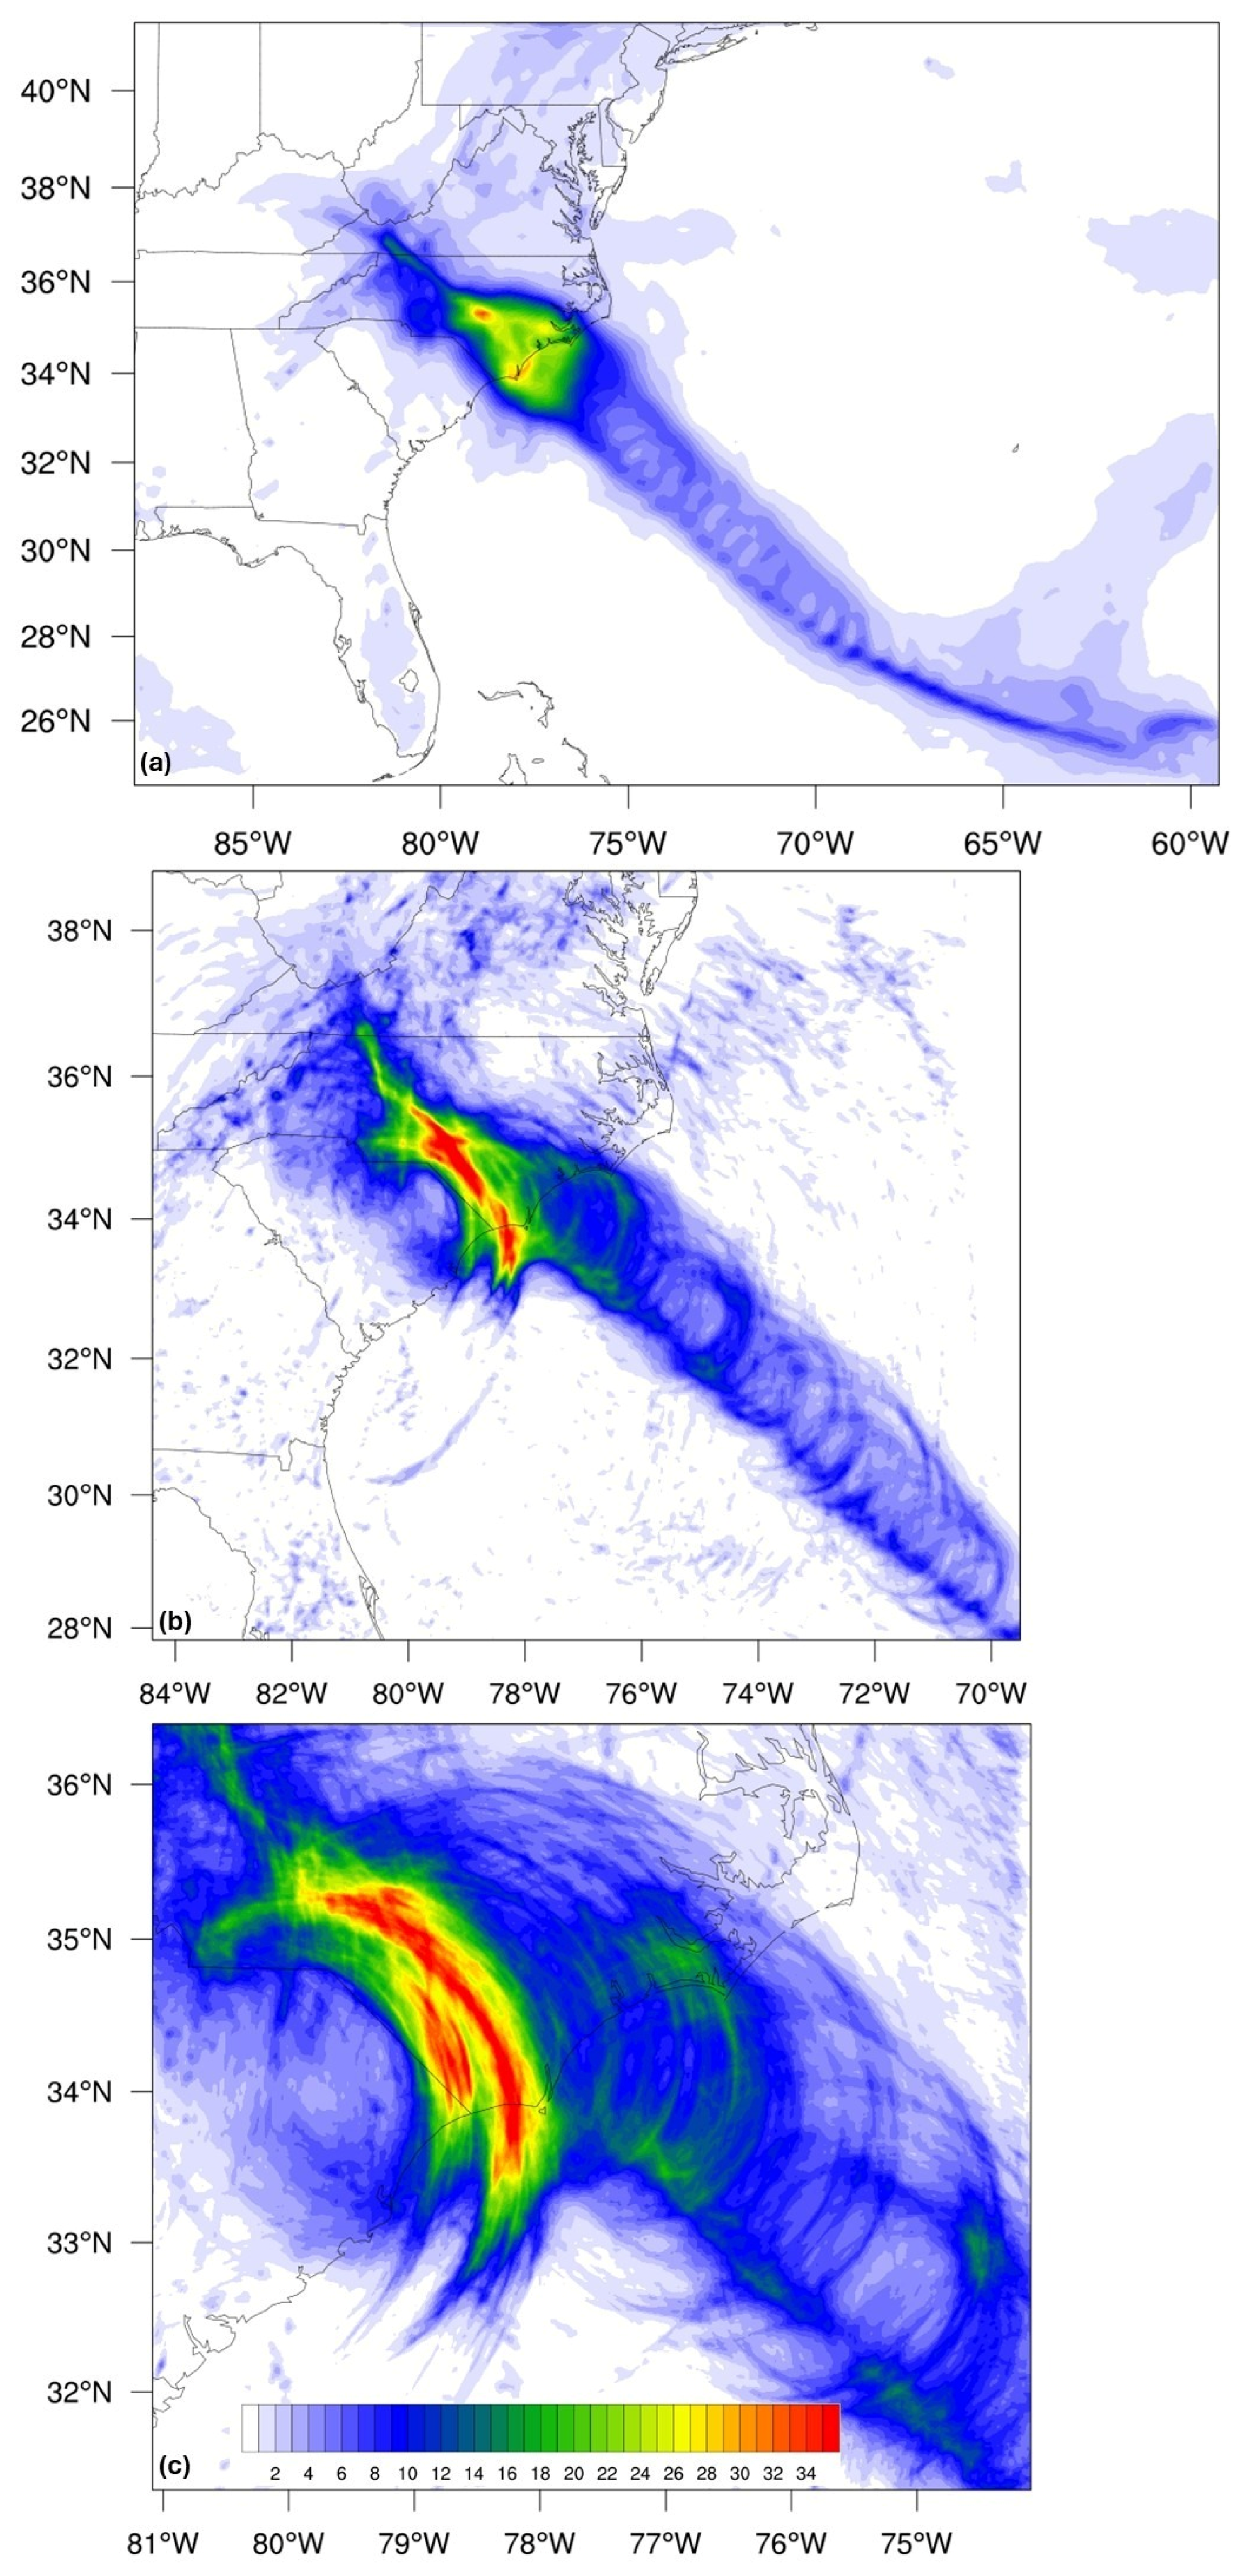
In Figure 11, accumulated precipitation is shown for all three domains from the CTRL simulation. As evidenced in Figure 11a, the outer domain captures Florence’s final approach to Wrightsville Beach, NC, with the bulk of precipitation occurring after landfall. This again indicates a drop in propagation speed at the time of landfall. Along Wrightsville Beach, NC, lies an area, similar to the observed, where approximately 28–30 inches (~711–762 mm) of precipitation fell. However, in the d02 and d03 simulation in Figure 11b,c, rainfall is overamplified compared to the observed values, but with the correct spread. Therefore, d01 will primarily be used for further analysis due to its comparable wind speeds and precipitation to the observed.

4.2.2. Thermodynamic Modification

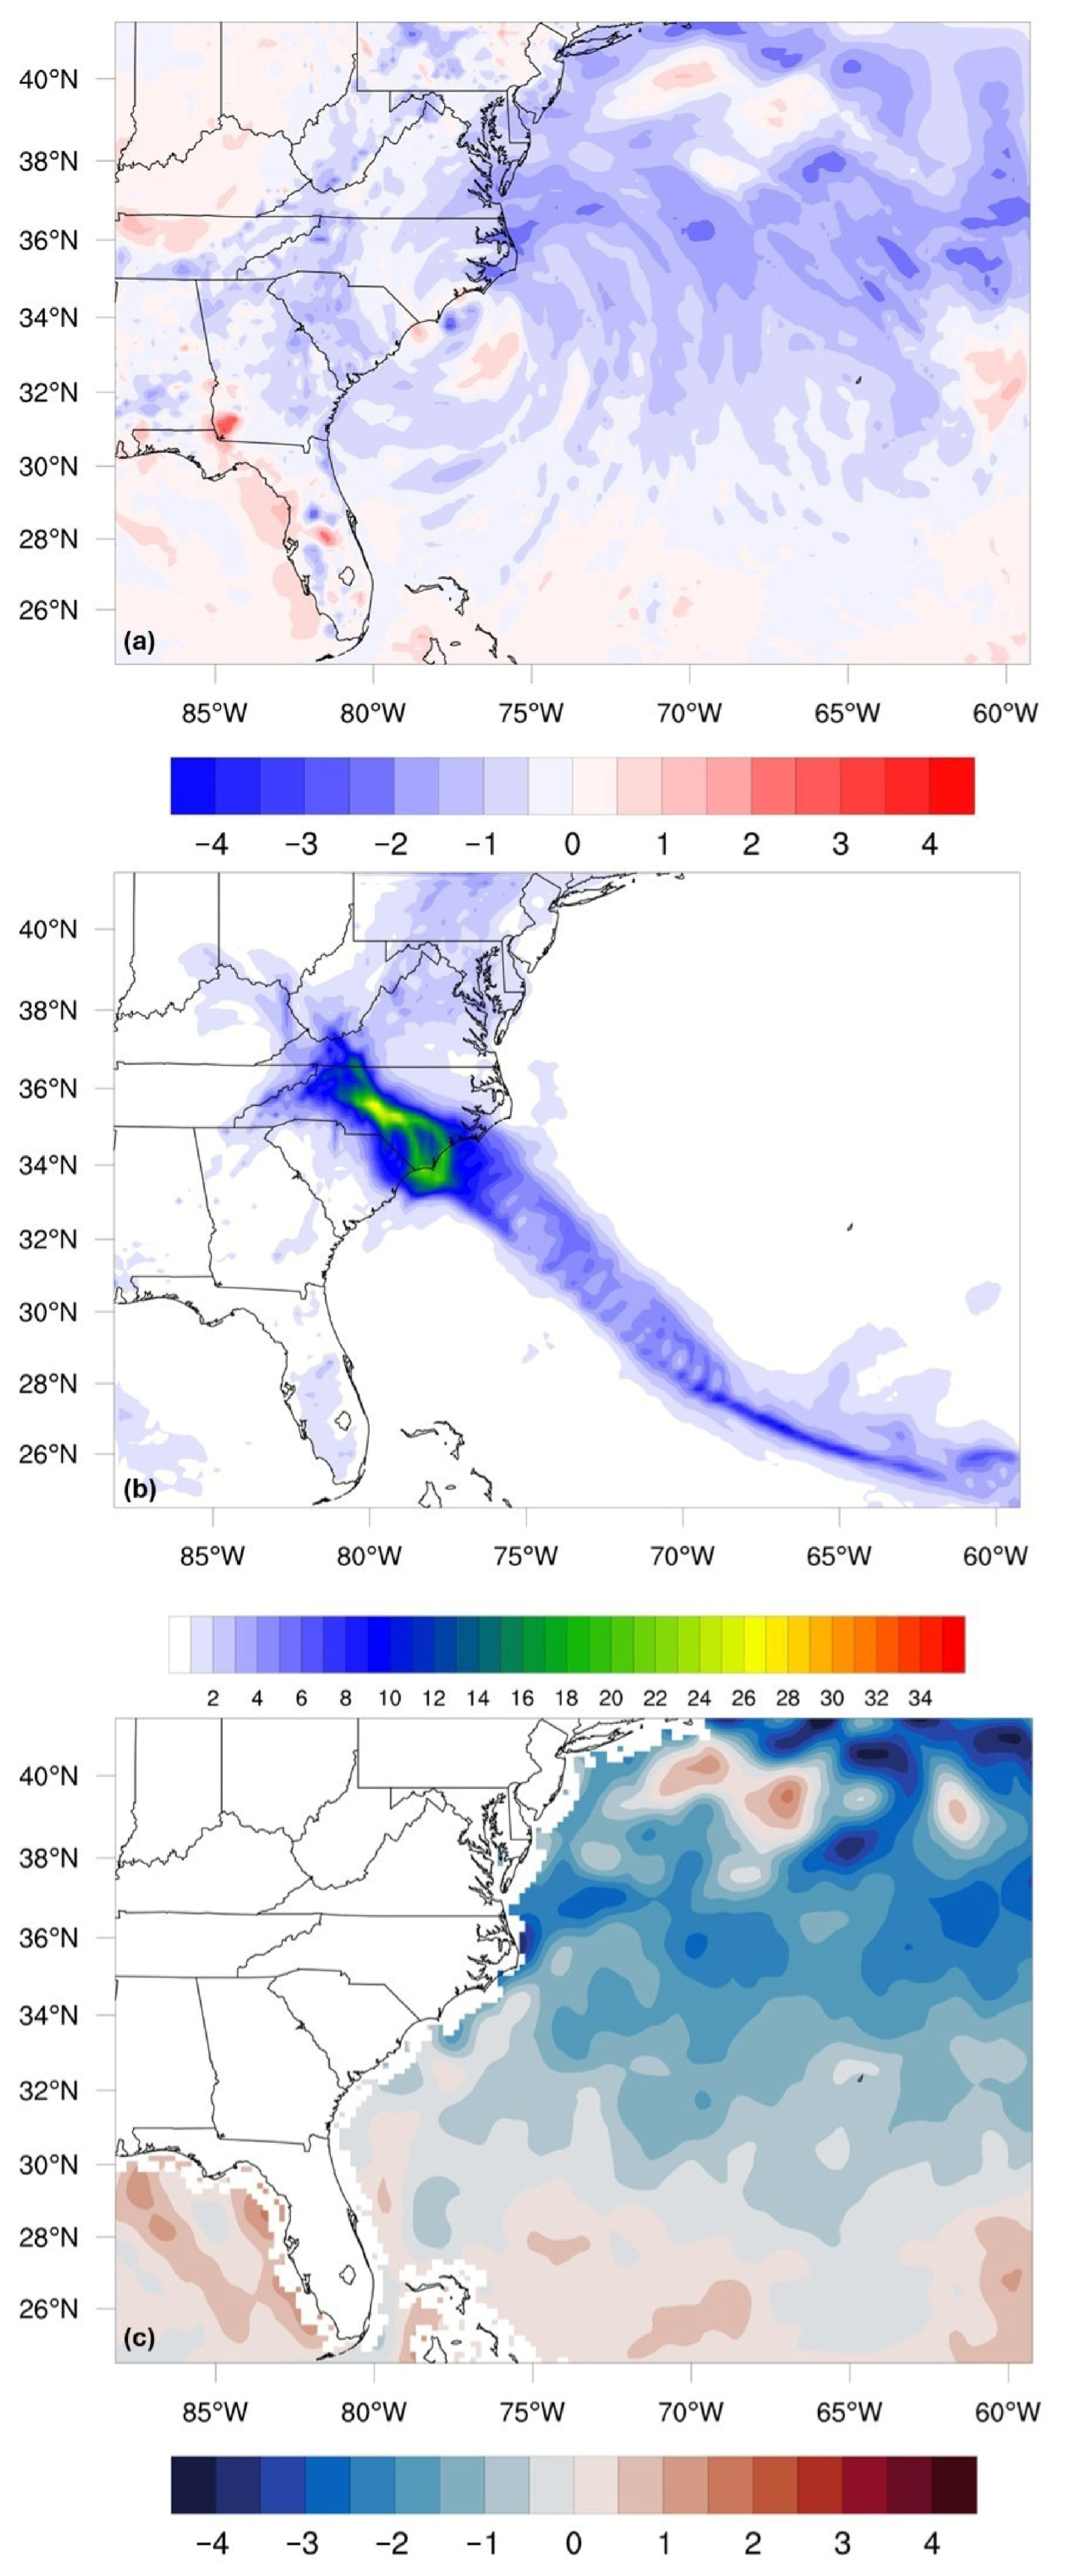
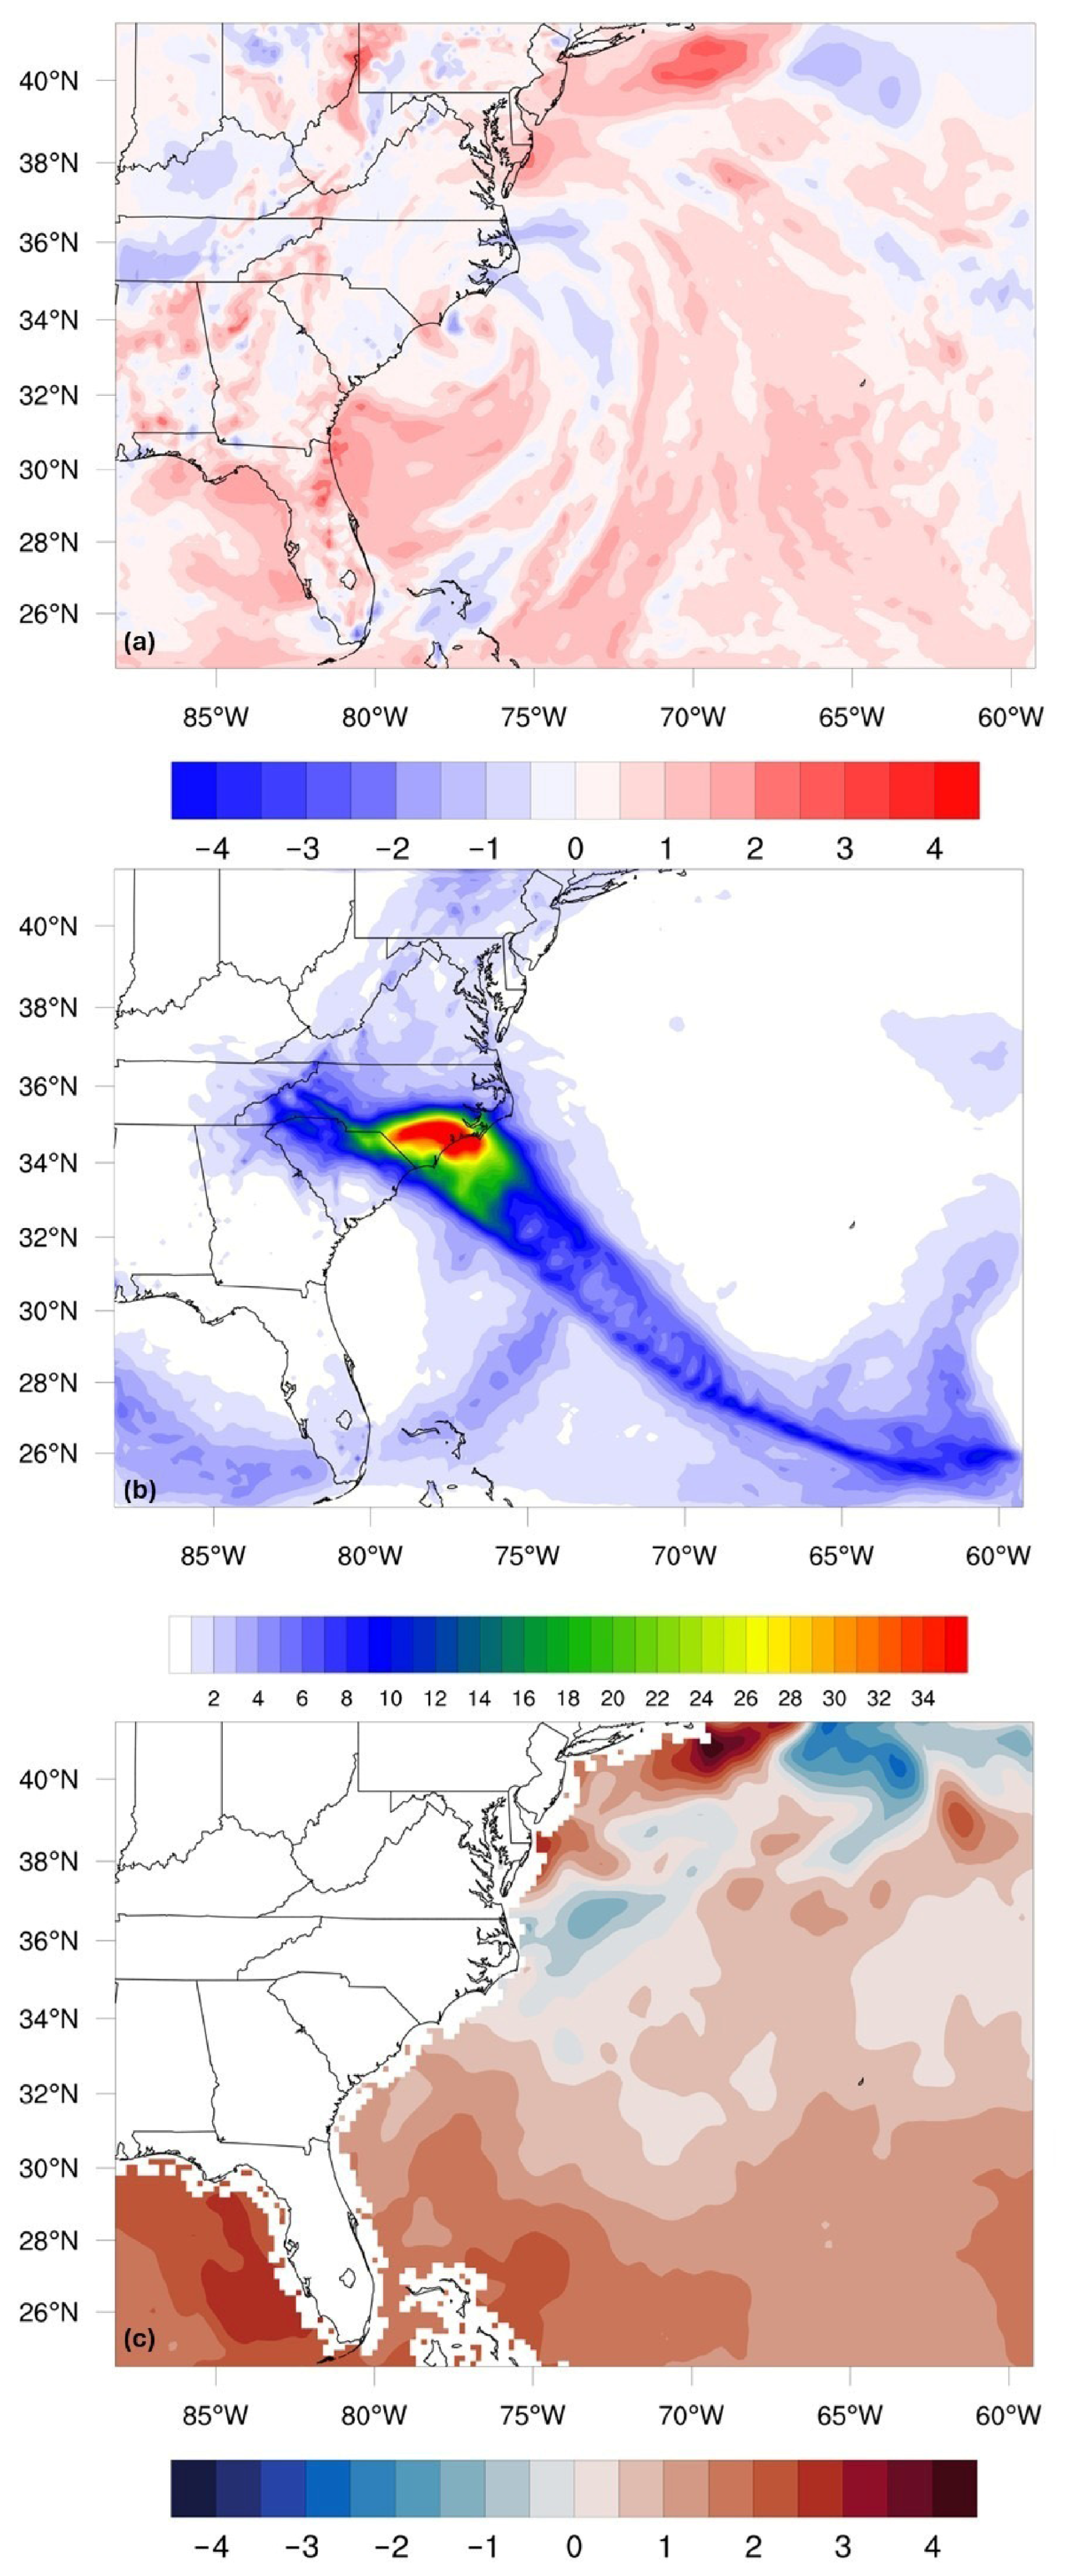
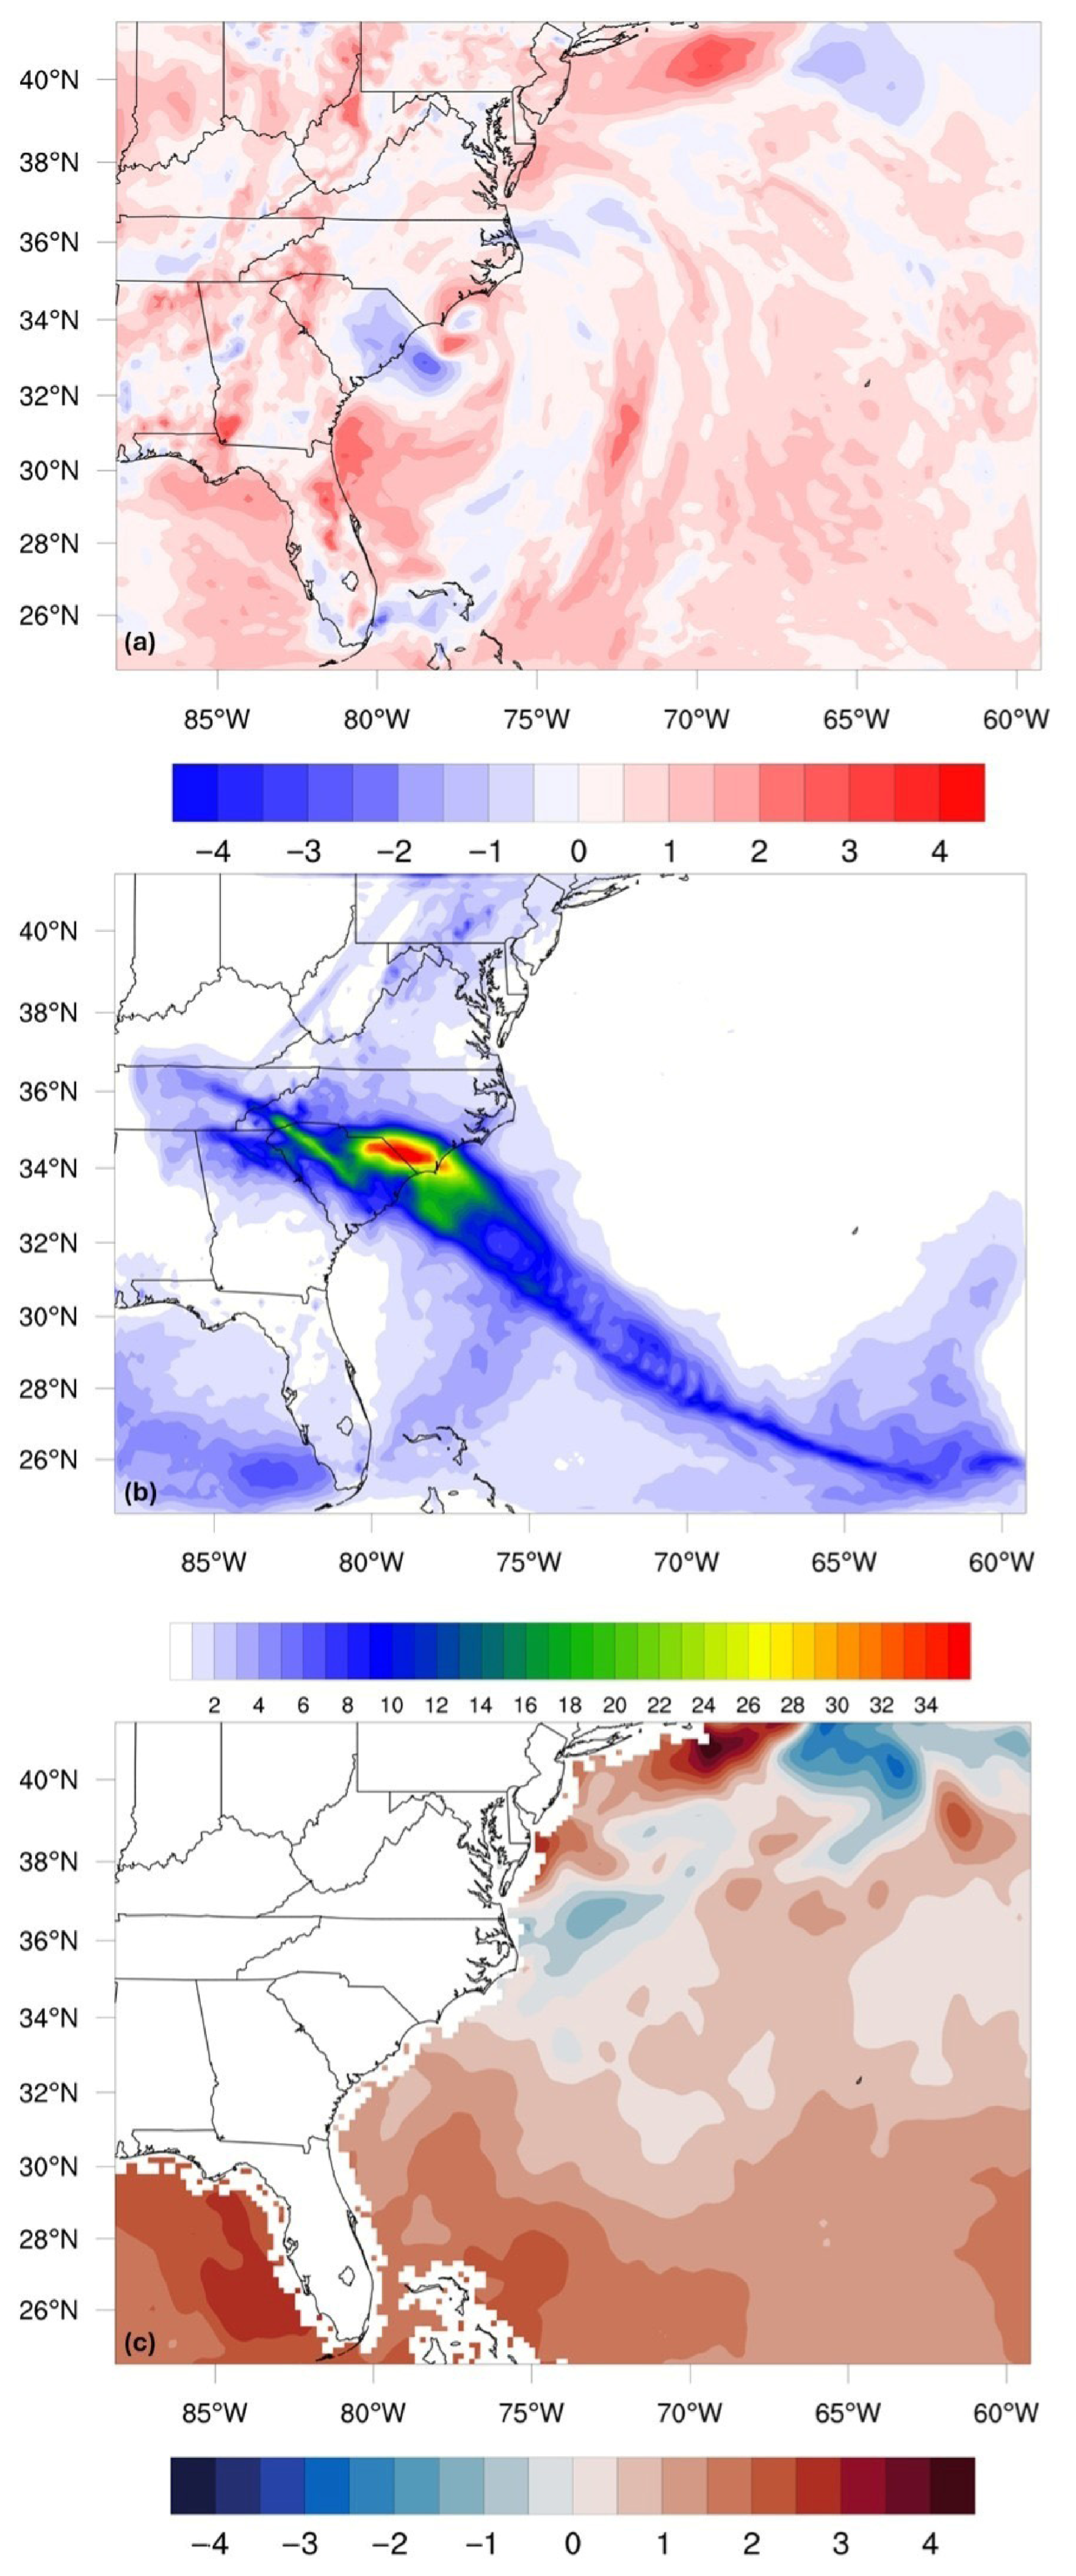
For the first experiment, thermodynamic profiles were modified in the CTRL simulation based on the 1968 profiles for the same time period, 12 UTC 10 September to 00 UTC 17 September. In Figure 12a, the two-meter air temperature difference is given for 00 UTC 14 September. Minor cooling can be seen over land from eastern Georgia (GA) poleward through Pennsylvania (PA). Poleward of 30° N latitude, a moderate one-to-three-degree cooling can be seen mainly over the Atlantic. For this representation of Florence, noticeable cooling of the inner eyewall is found. The moderate cooling over the Atlantic is directly attributed to much cooler SSTs in the same region, above 30° N latitude, as seen in Figure 12c. Therefore, due to the cooler temperatures of both the SSTs and above the surface, less precipitation falls during landfall, as seen in Figure 12b, along the coast of NC. However, with the TC coming inland, it is propagating faster, as will be shown in the track and intensity. Furthermore, the rainfall that is available falls well inland instead of at the coast, as the TC interacts with a weakened stalled frontal system.
Next, a future climate projection of Florence is given based on the thermodynamic profiles of the CESM CMIP5 RCP8.5 scenario for 2068. Similar to Figure 12, the same fields are shown in Figure 13: surface temperature differences, accumulated precipitation and SST differences. However, in this climate scenario, moderate warming takes place over much of the domain (both land and ocean). Prior to Florence’s landfall, 00 UTC 14 September shows one-to-two-degree warming of the two-meter air temperature within the inner eyewall of Florence, likely indicating favorable conditions for a more intense version of the TC, as shown in Figure 13a. In Figure 13c, near-surface temperature warming is likely due to increased surface sensible heat flux warming of the SSTs. Equatorward of 32° N latitude, moderate warming has taken place, with some areas surrounding Florida and the Bahamas showing nearly two-degree-warmer temperatures or more. As a result of the considerable warming of the atmosphere and SSTs induced by an increased CO2 content, the TC produced more than the observed rainfall along southeastern NC and the coast, with a maximum of nearly 50 inches (1270 mm), as shown in Figure 13b. Therefore, in this scenario, the intensity of the TC would likely be more than the CTRL, and the projected rainfall would increase by ~67%.

4.2.3. Moisture Modification

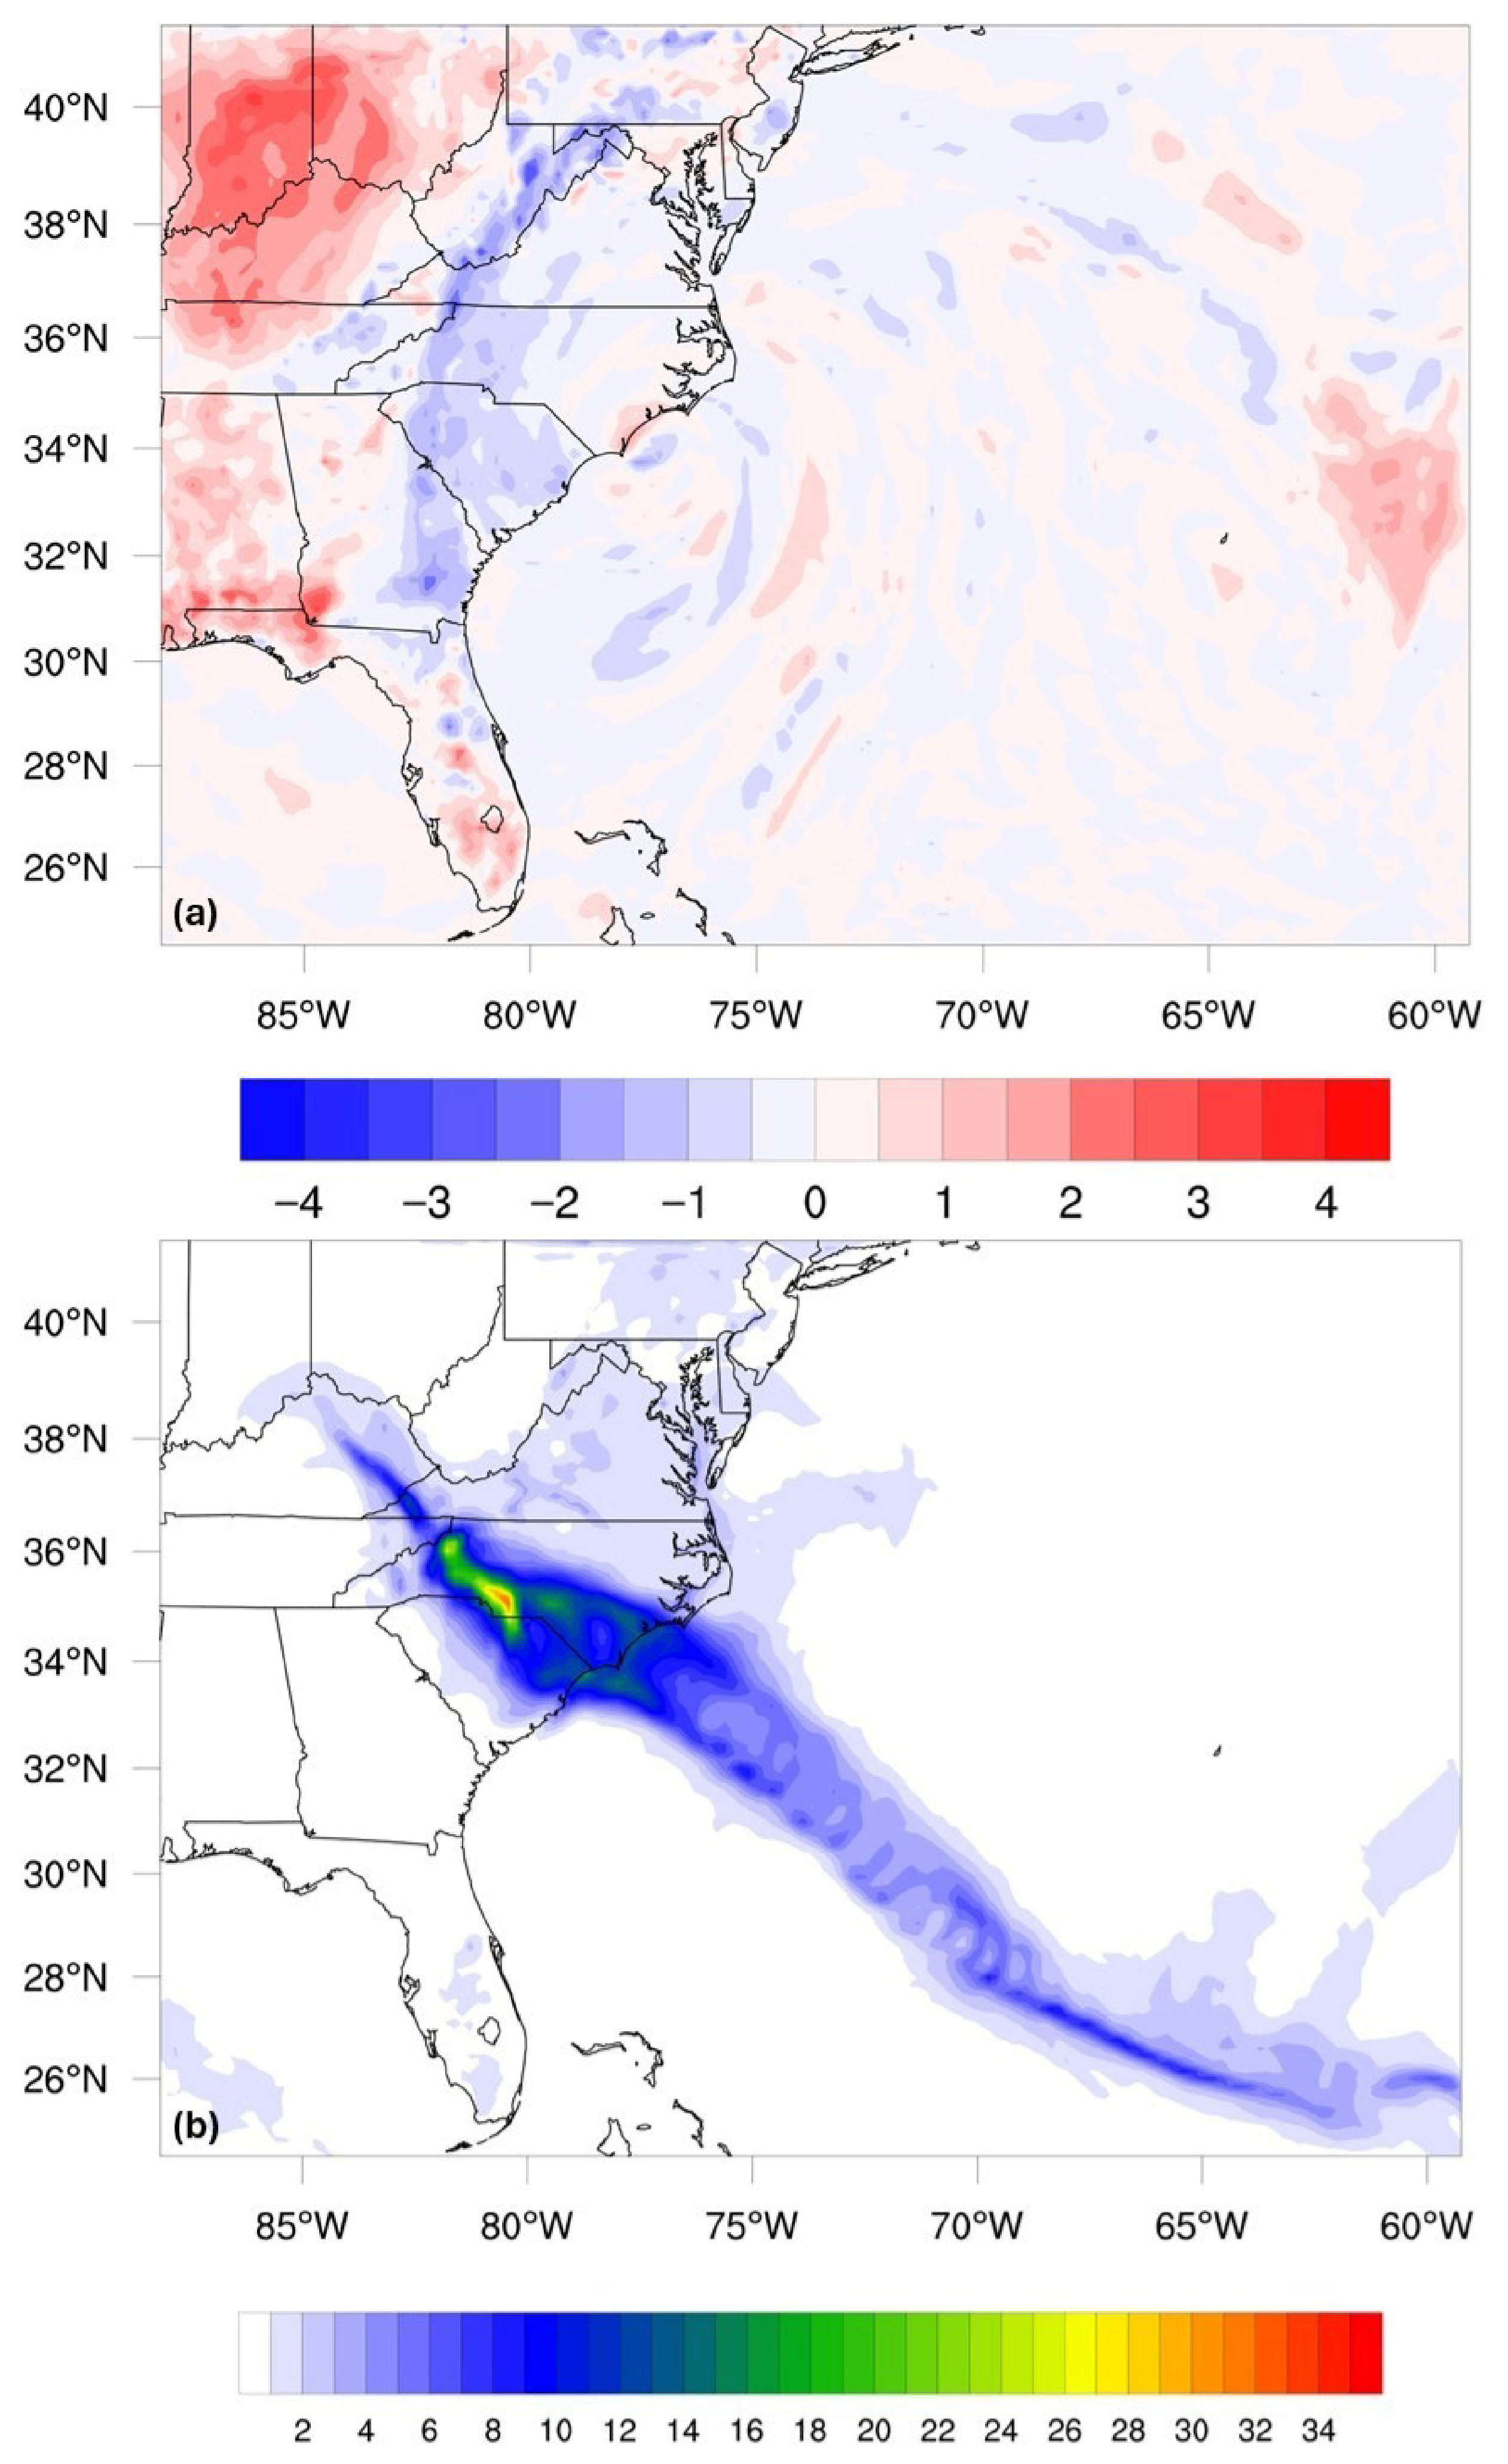
In Figure 14, the 1968 climate representation of Florence is given under the moisture conditions of 1968, based on ERA5. However, note that in the moisture-modification figures, SST differences are not given because there are no changes from the CTRL. It is noticeably clear that moisture modification alone does not lead to drastic temperature variations over the Atlantic. However, more variation is shown over land in Figure 14a. By modifying the moisture variables, the stationary front has become more apparent due to the strong contrasting temperature gradient over the AMR. As a result of the frontal system becoming stronger, it is plausible that more precipitation will fall in conjunction with the front. This is evident in Figure 14b. However, this TC is considerably weaker than the CTRL and only accumulates ~14 inches (~356 mm) of rainfall along the NC coast compared to nearly 30 inches (762 mm) in the CTRL.
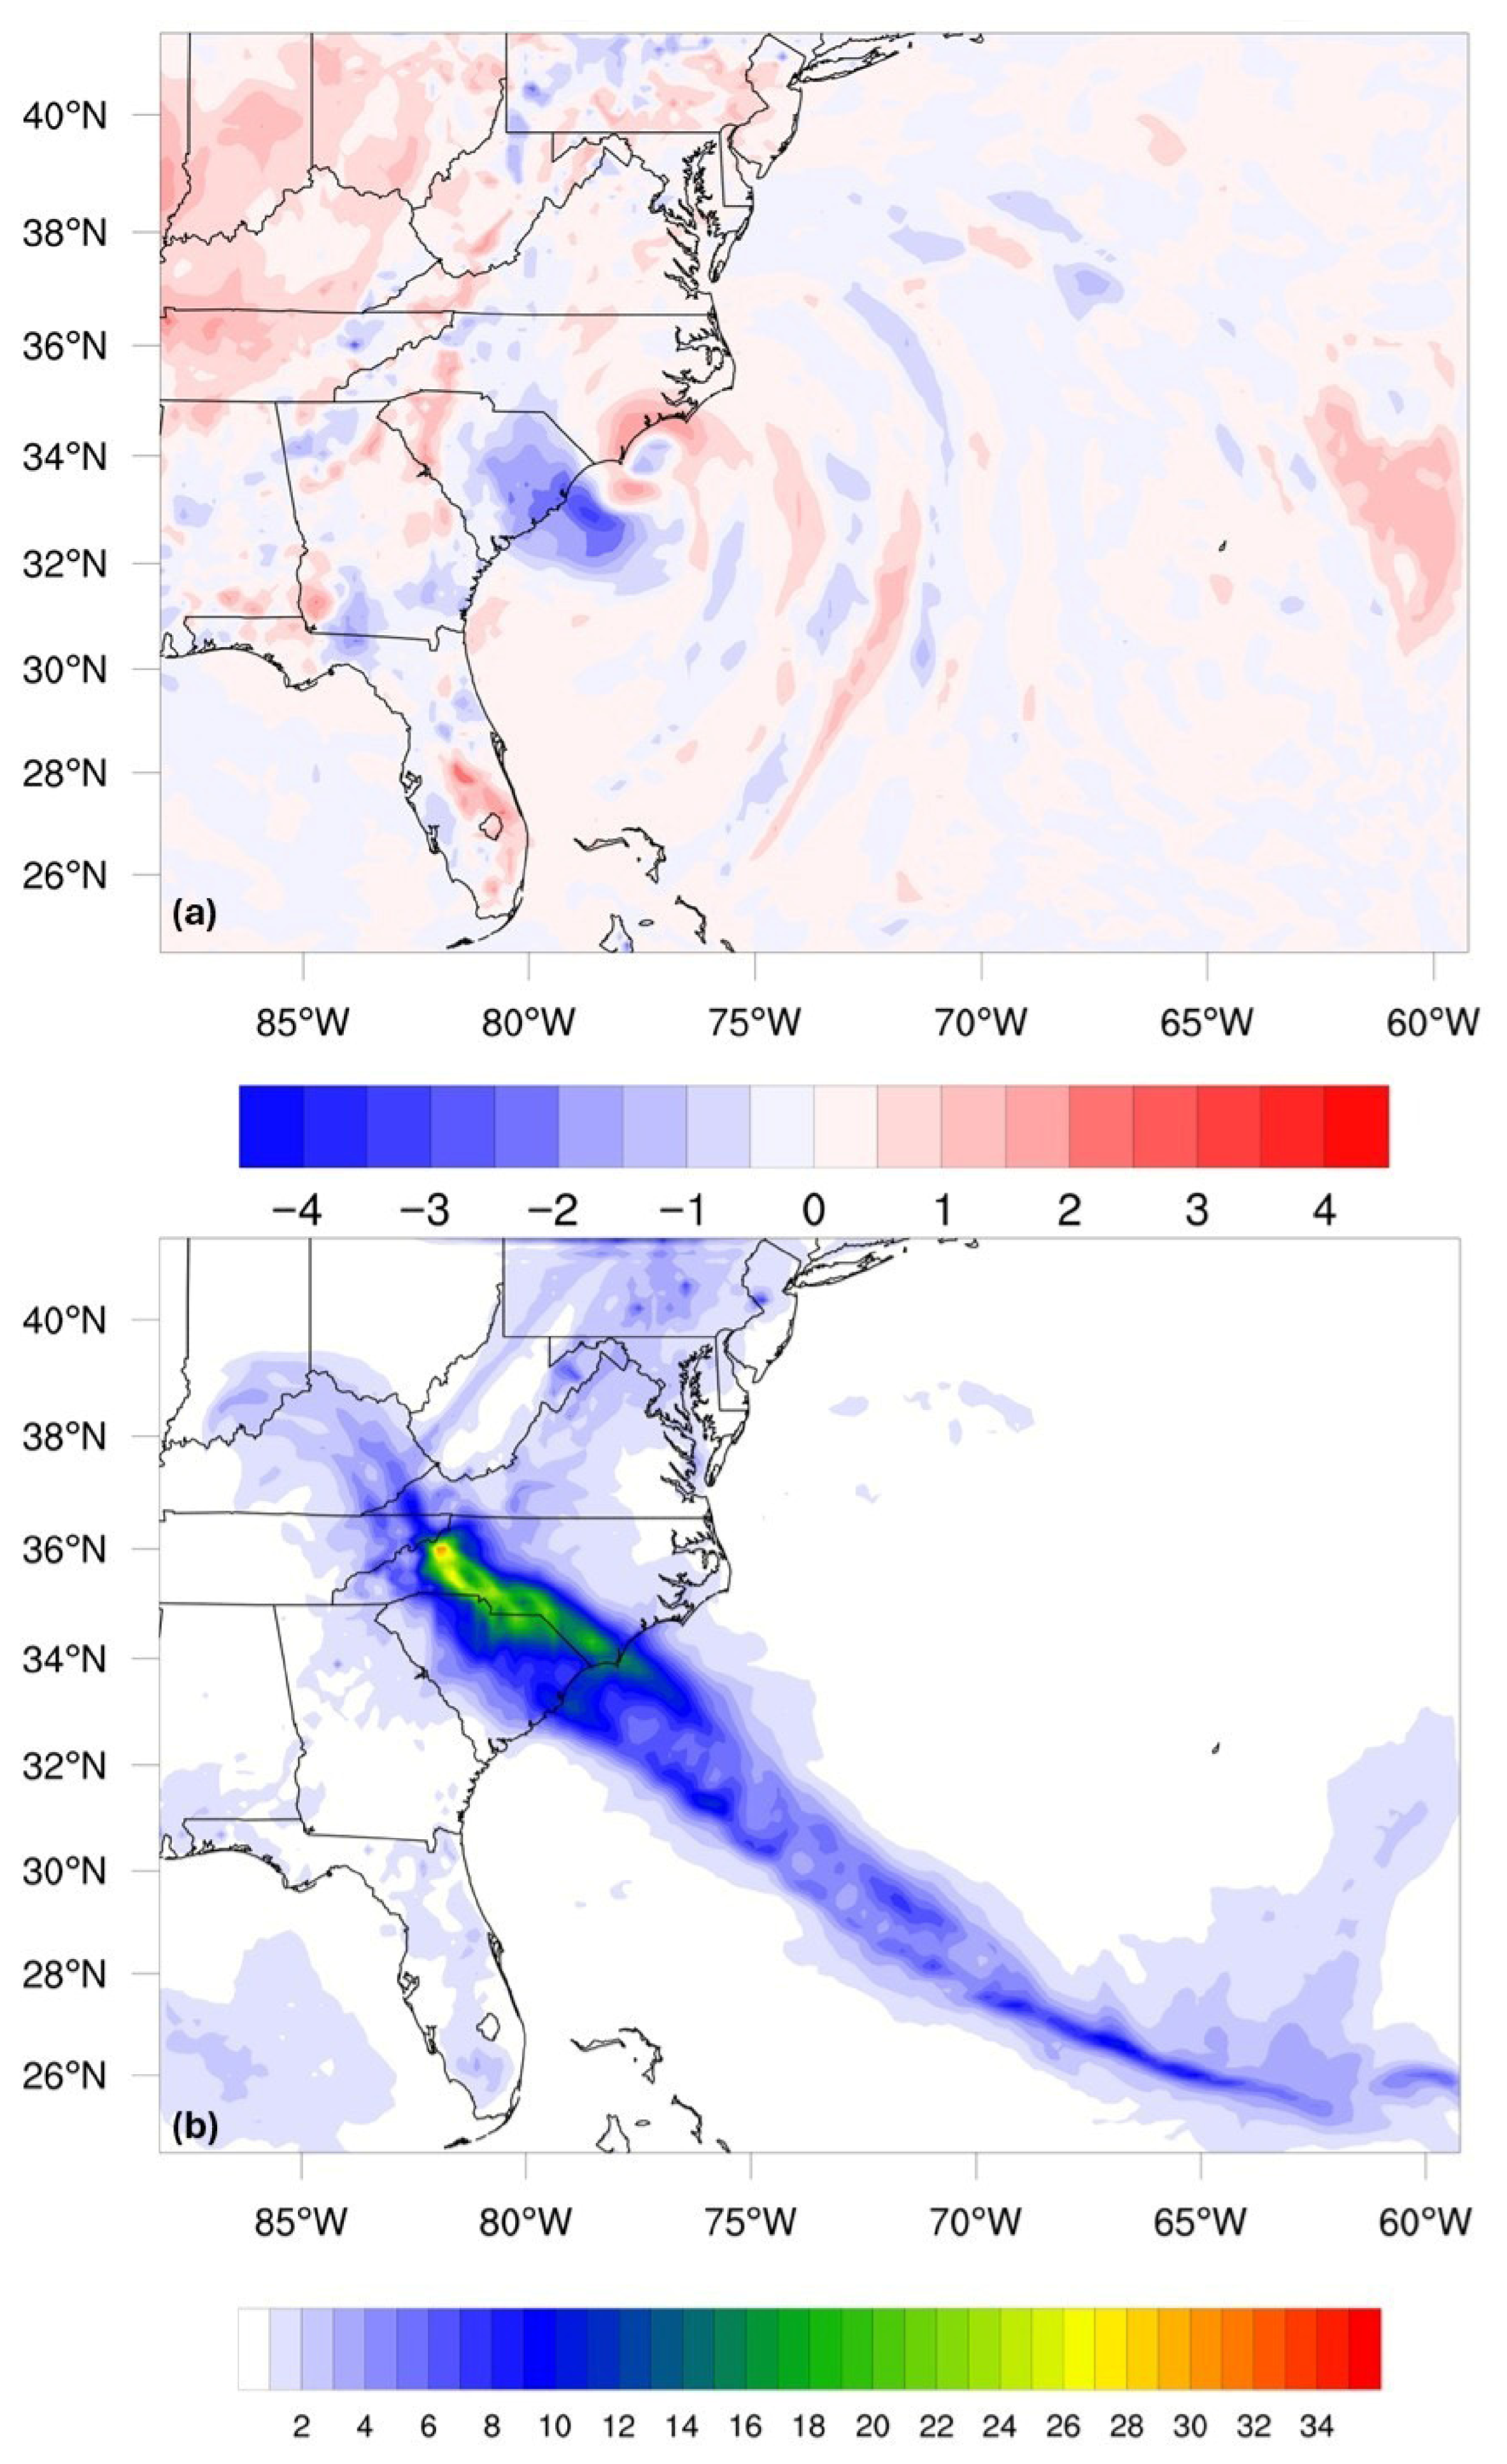
From the moisture modification of the CTRL based on the future climate projection, RCP8.5 2068, a representation of the future version of Florence is given in Figure 15. Prior to landfall on 00 UTC 14 September, the eye of Florence is considerably cooler than that of the CTRL (~1–2 degrees), while the eye wall and outer bands are warmer (~1–2 degrees). However, an area of cooler surface temperatures is seen off the coast of SC, giving a clear boundary controlling the path of the TC. Additionally, the stationary front appears to be unchanged in location and relative intensity, as seen in Figure 15a. In Figure 15b, the majority of precipitation still occurs well inland over the AMR due to the faster translation speed of the TC remnants. In this scenario, less rainfall is observed over the landfall region while more rainfall is observed over the AMR, likely due to orographic lifting of air parcels impacting the AMR.
While moisture availability is a necessary condition for precipitation, it is not sufficient to enhance rainfall without corresponding increases in thermodynamic instability and surface energy fluxes. In the thermodynamic modification experiments, increased SST and near-surface temperature enhance surface enthalpy fluxes and convective available potential energy (CAPE), leading to stronger convection and increased latent heat release, which intensifies the storm and increases precipitation. In contrast, moisture-only modifications primarily redistribute water vapor without significantly enhancing instability or vertical motion. Consequently, precipitation is more strongly controlled by storm dynamics, including propagation speed, frontal interaction, and orographic lifting, which can lead to reduced rainfall accumulation in coastal regions despite adequate moisture availability.

4.2.4. Thermodynamic and Moisture Modification

The prior experiments implemented the modifications of thermodynamic profiles and moisture profiles for past and future climate scenarios separately. In this section, thermodynamic and moisture profiles are both modified for each scenario in WRF–ARW, and the results are shown.
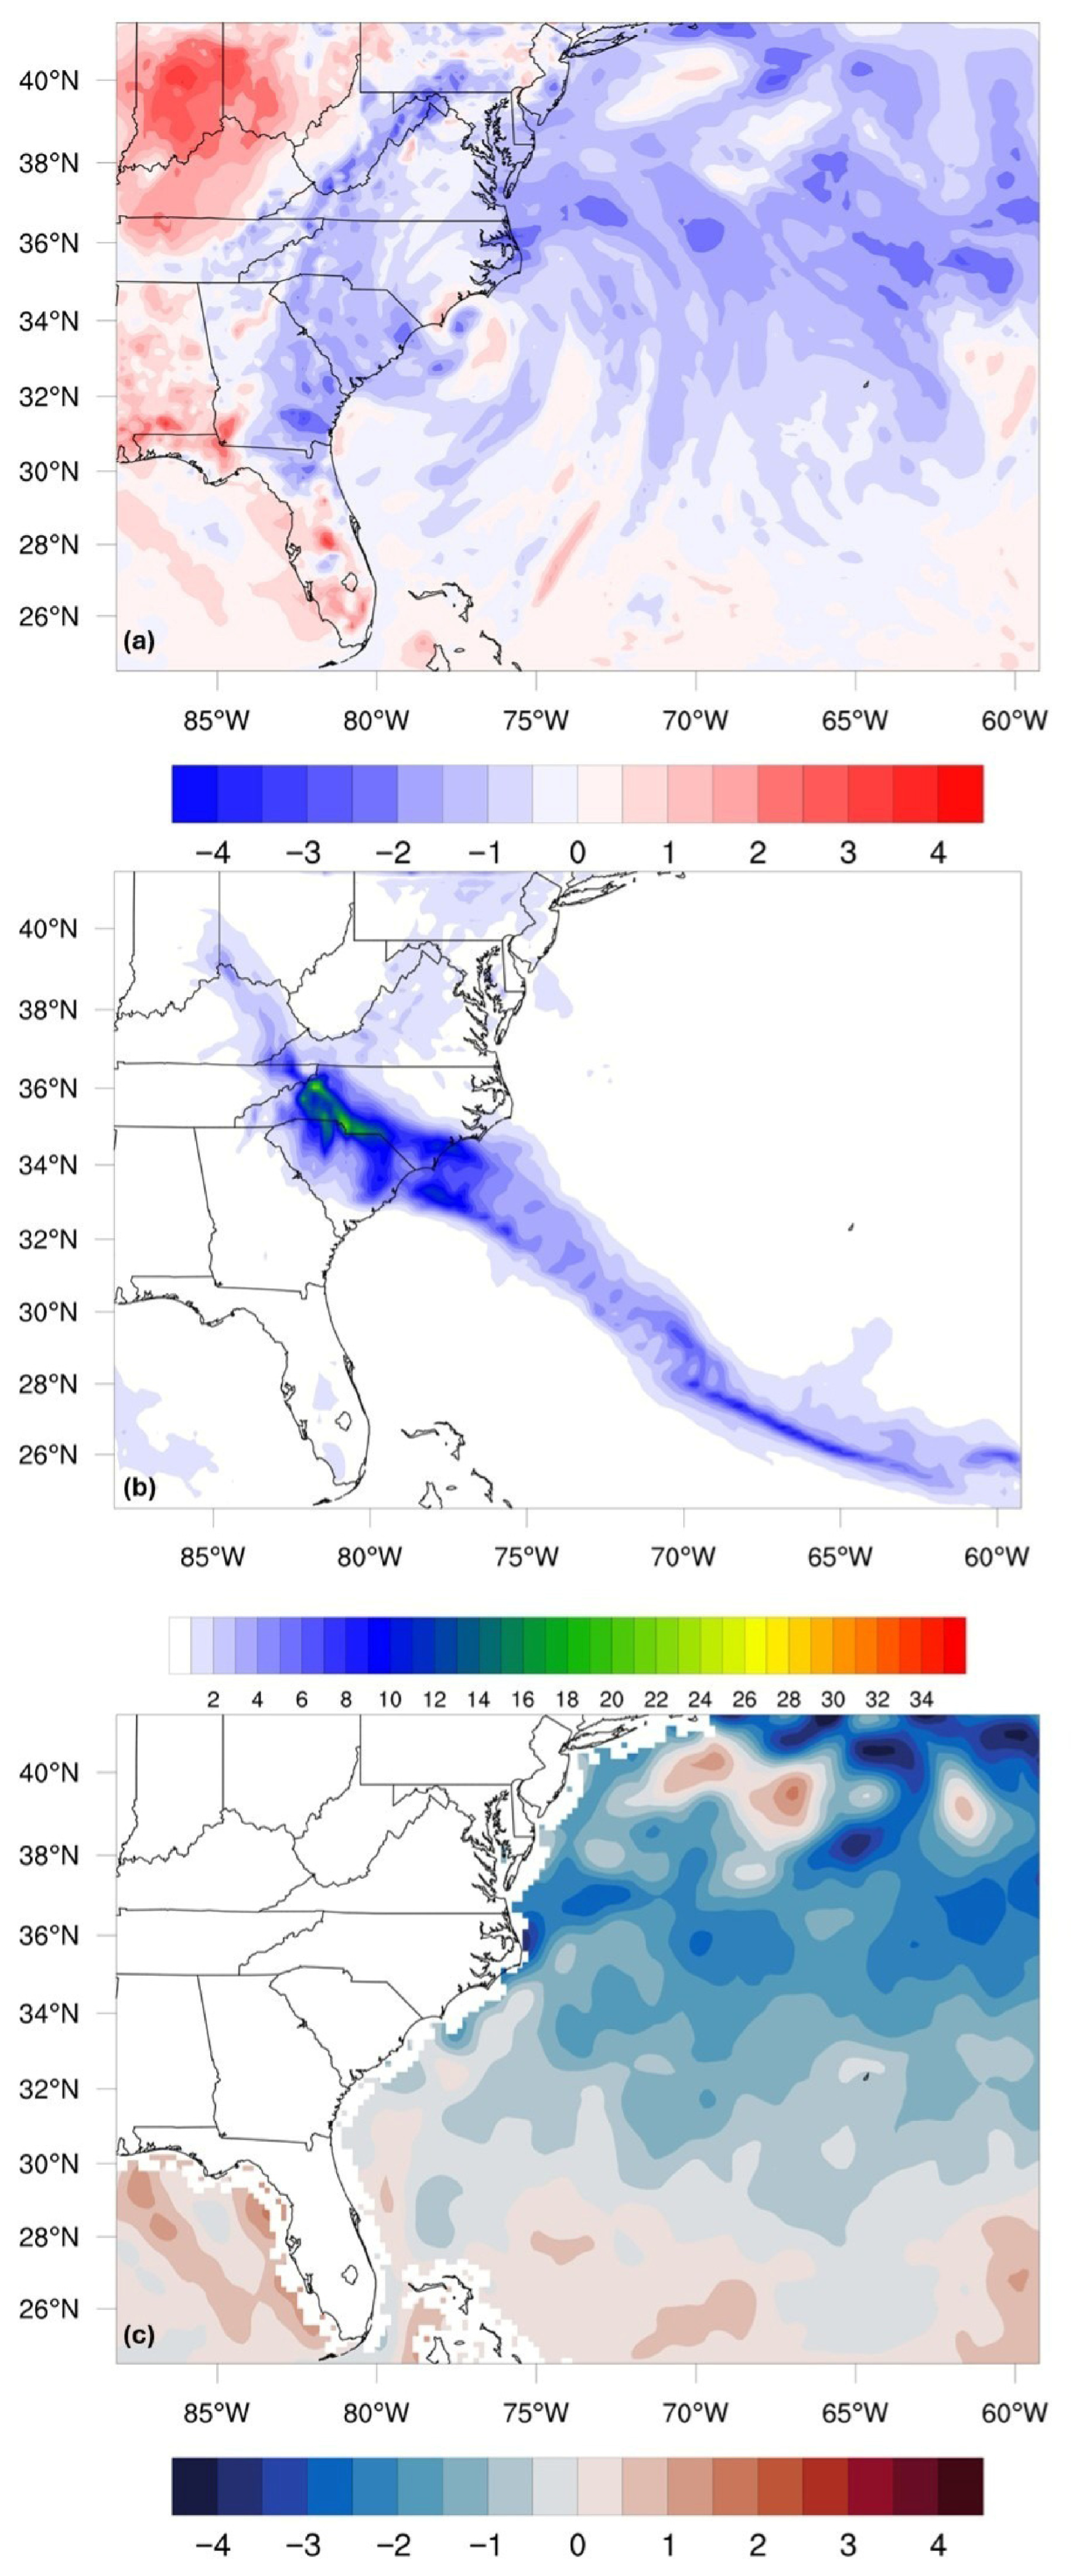
Figure 16 demonstrates the effects of both thermodynamic and moisture modifications on Florence based on the ERA5 reanalysis data profiles from 1968. In Figure 16a, a carryover of a stronger temperature gradient over land is seen, particularly over the AMR, while considerable cooling is present over much of the domain east of 83° W and 30° N. With the combined effects of both thermodynamic and moisture modifications, this version of Florence is even weaker than the previous experiments due to significantly cooler air temperatures over both land and ocean (Figure 16a) and cooler SSTs (Figure 16c). However, due to the combined effects of the stalled front, stronger temperature gradient over land, and orography of the AMR, significant rainfall accumulates well inland rather than at the coast (Figure 16b).
For the future climate projection of Florence, with respect to both thermodynamic and moisture modifications, it still appears to be stronger than the CTRL but weaker than the thermodynamic modification alone, when compared to Figure 13. However, surface temperature is overall warmer than the CTRL but cooler than the CTRL in the eye of the TC, as seen in Figure 17a. In Figure 17c, SSTs are still significantly warm, but rainfall is less than in Figure 13b, as seen in Figure 17b. This likely indicates the moisture modification negatively affected the TC and therefore produced less rainfall than thermodynamically modifying the CTRL alone. However, considerable rainfall still exists and is constrained to the NC coastline, as seen in Figure 17b. With the relatively warmer environment in place, and the combined effects of the future moisture fields, a more intense TC still exists compared to the CTRL.

4.2.5. Track, Intensity, and Statistical Analyses

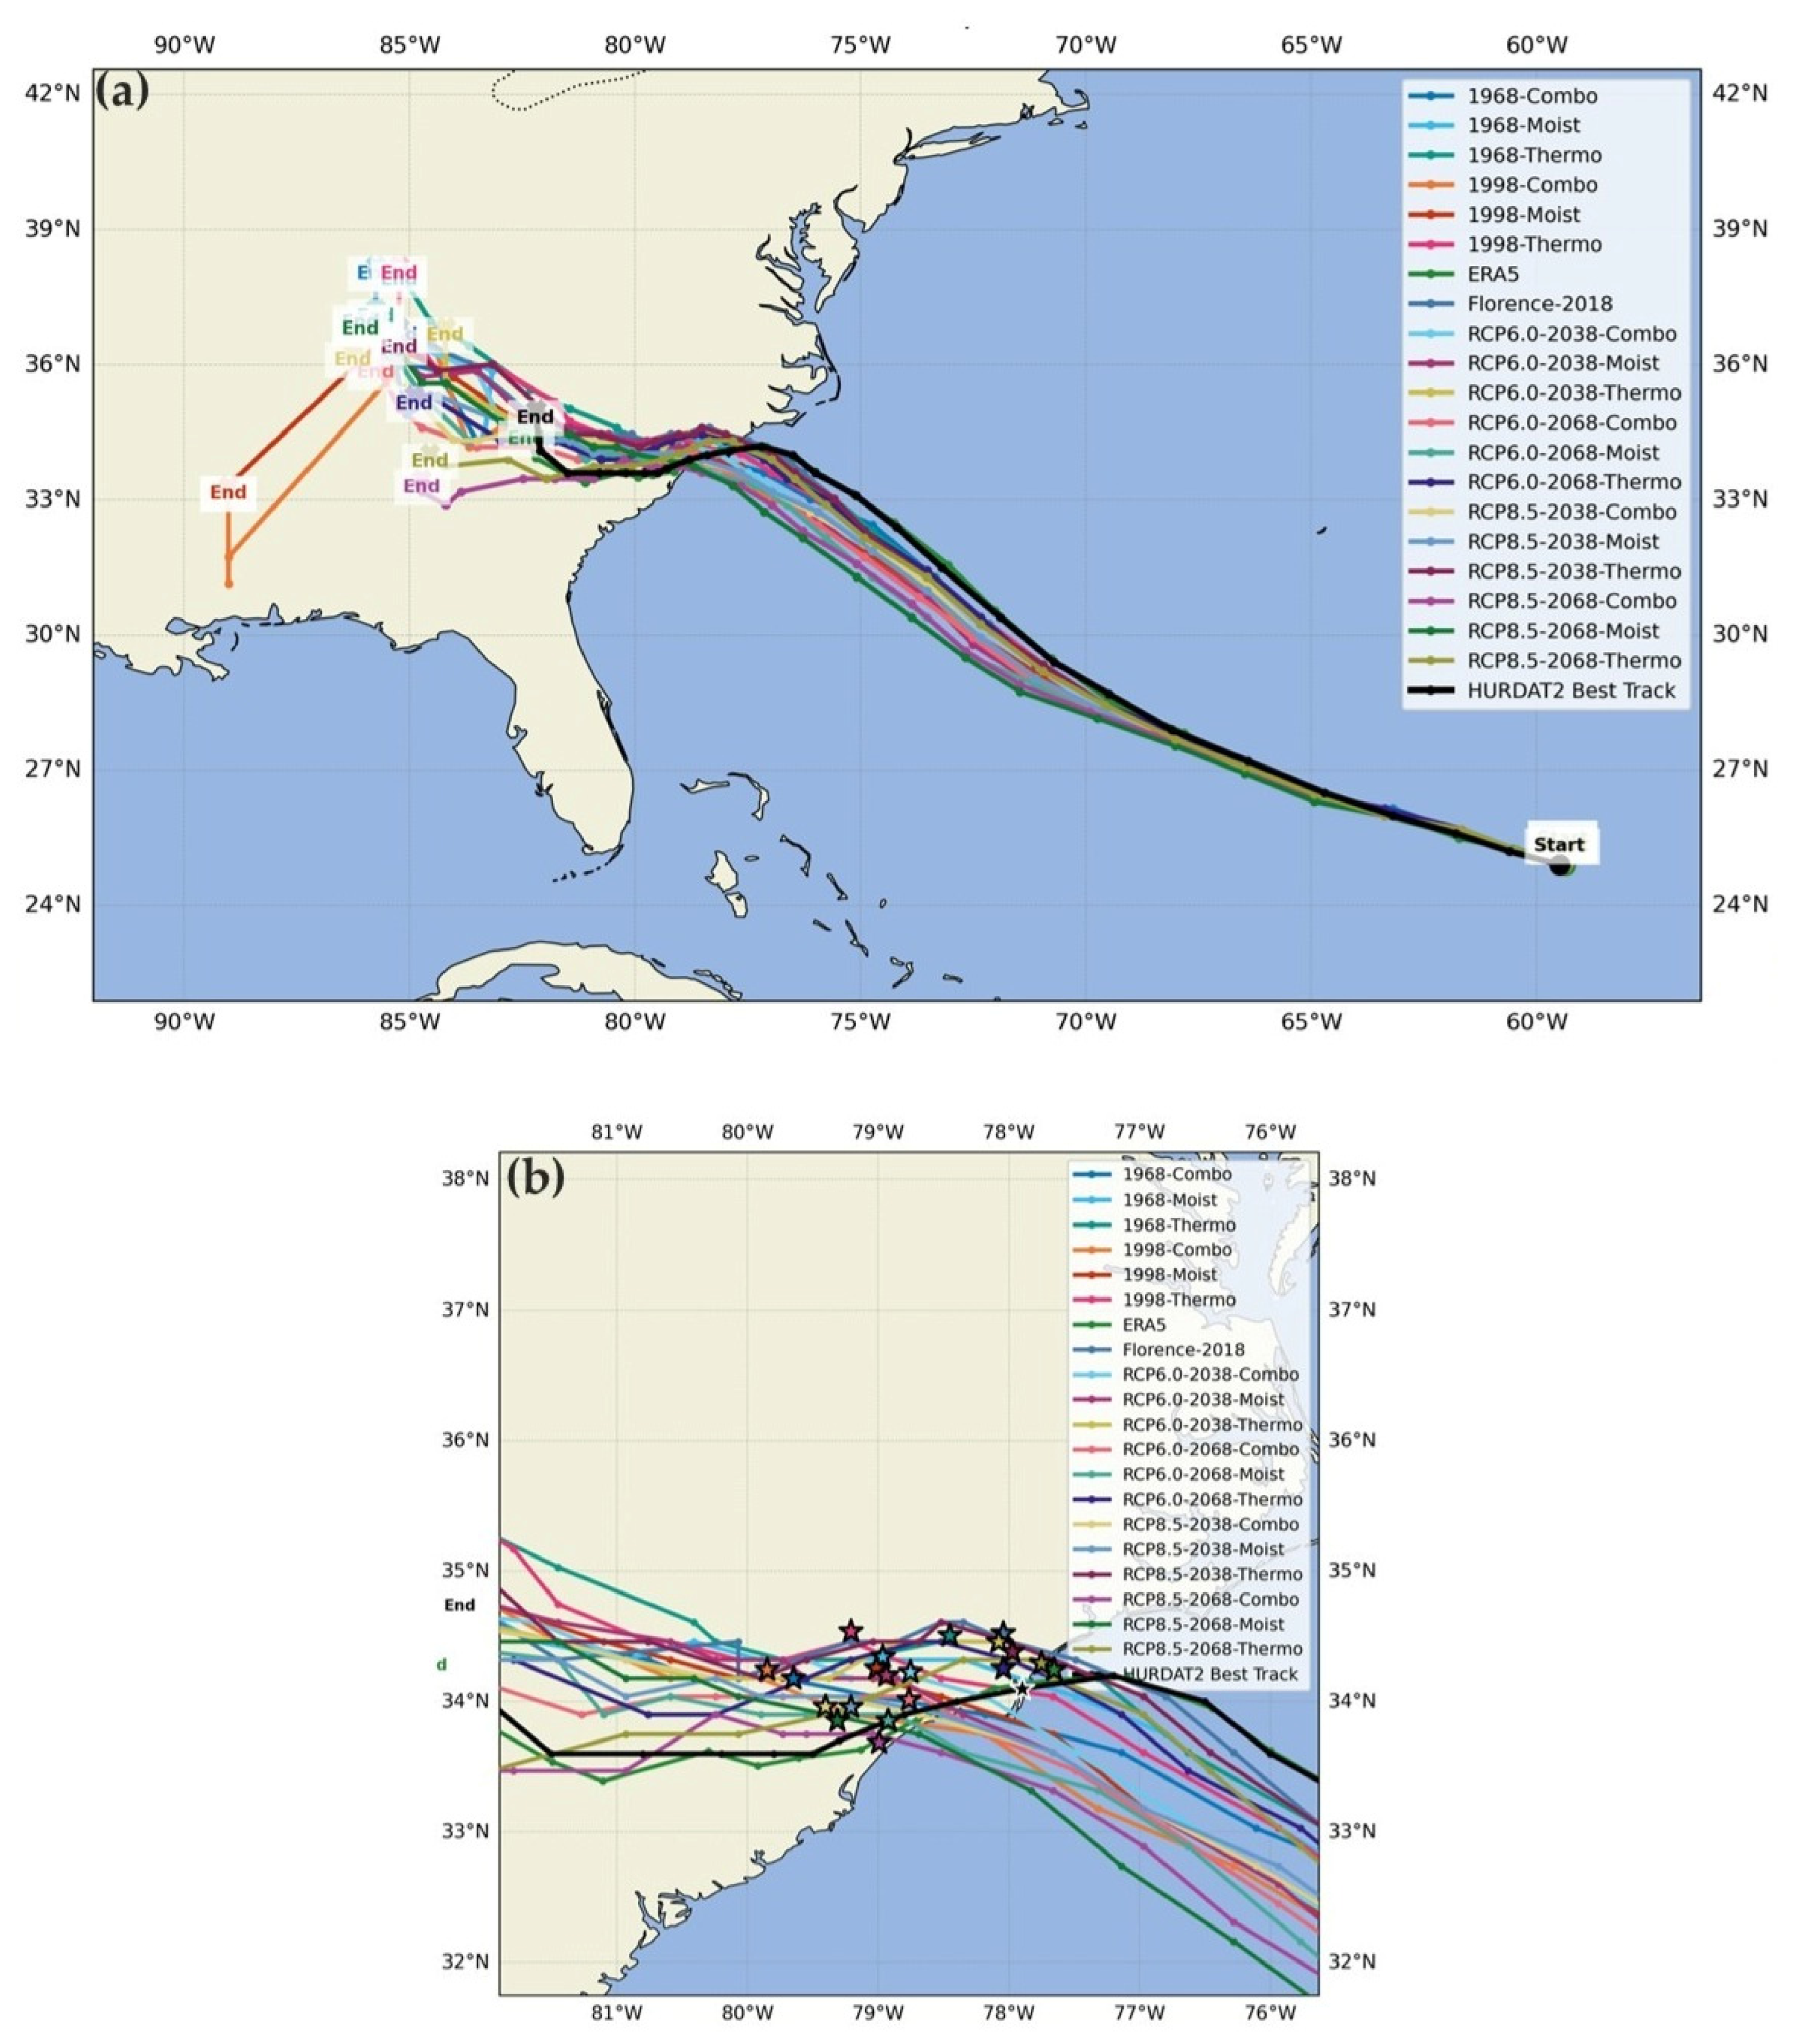
From the initialization of WRF–ARW on 12 UTC 10 September for all simulations, it is evident that for the first 36 h of the simulations, Florence followed the observed path closely, based on the HURDAT2 analysis (black) and ERA5 reanalysis data (green, under HURDAT2), as shown in Figure 18a. After the first 36 h, an equatorward bias is present in all simulated tracks, with the largest bias being associated with the WRF RCP8.5 Moist case. An equatorward bias for all sensitivity experiments is likely carried over from the CTRL simulation. As a result, the equatorward propagation of Florence is not well captured in the simulated results but shows more of a straight-line representation of landfall. In Figure 18b, a zoomed-in region surrounding the landfall location is shown. For the HURDAT2 analysis (black), it is overlayed last, and the black-filled star gives the official landfall time: 12 UTC 14 September 2018. In the ERA5 reanalysis data, it closely follows the HURDAT2 analysis with a similar track location at the official time of landfall (under the HURDAT2 star). For the CTRL experiment, the simulated TC propagated slightly slower than the observed but made landfall at approximately the same time as the observed, just slightly northeast. However, for most sensitivity studies, the simulated propagation speed was faster than the observed, as shown by the inland stars representing the official landfall time rather than the simulated landfall time. Perhaps more importantly, though, across all simulated Florence cases, the track changed only marginally, and the landfall region remained broadly similar, consistent with prior PGW studies [22,23,24,26,27].
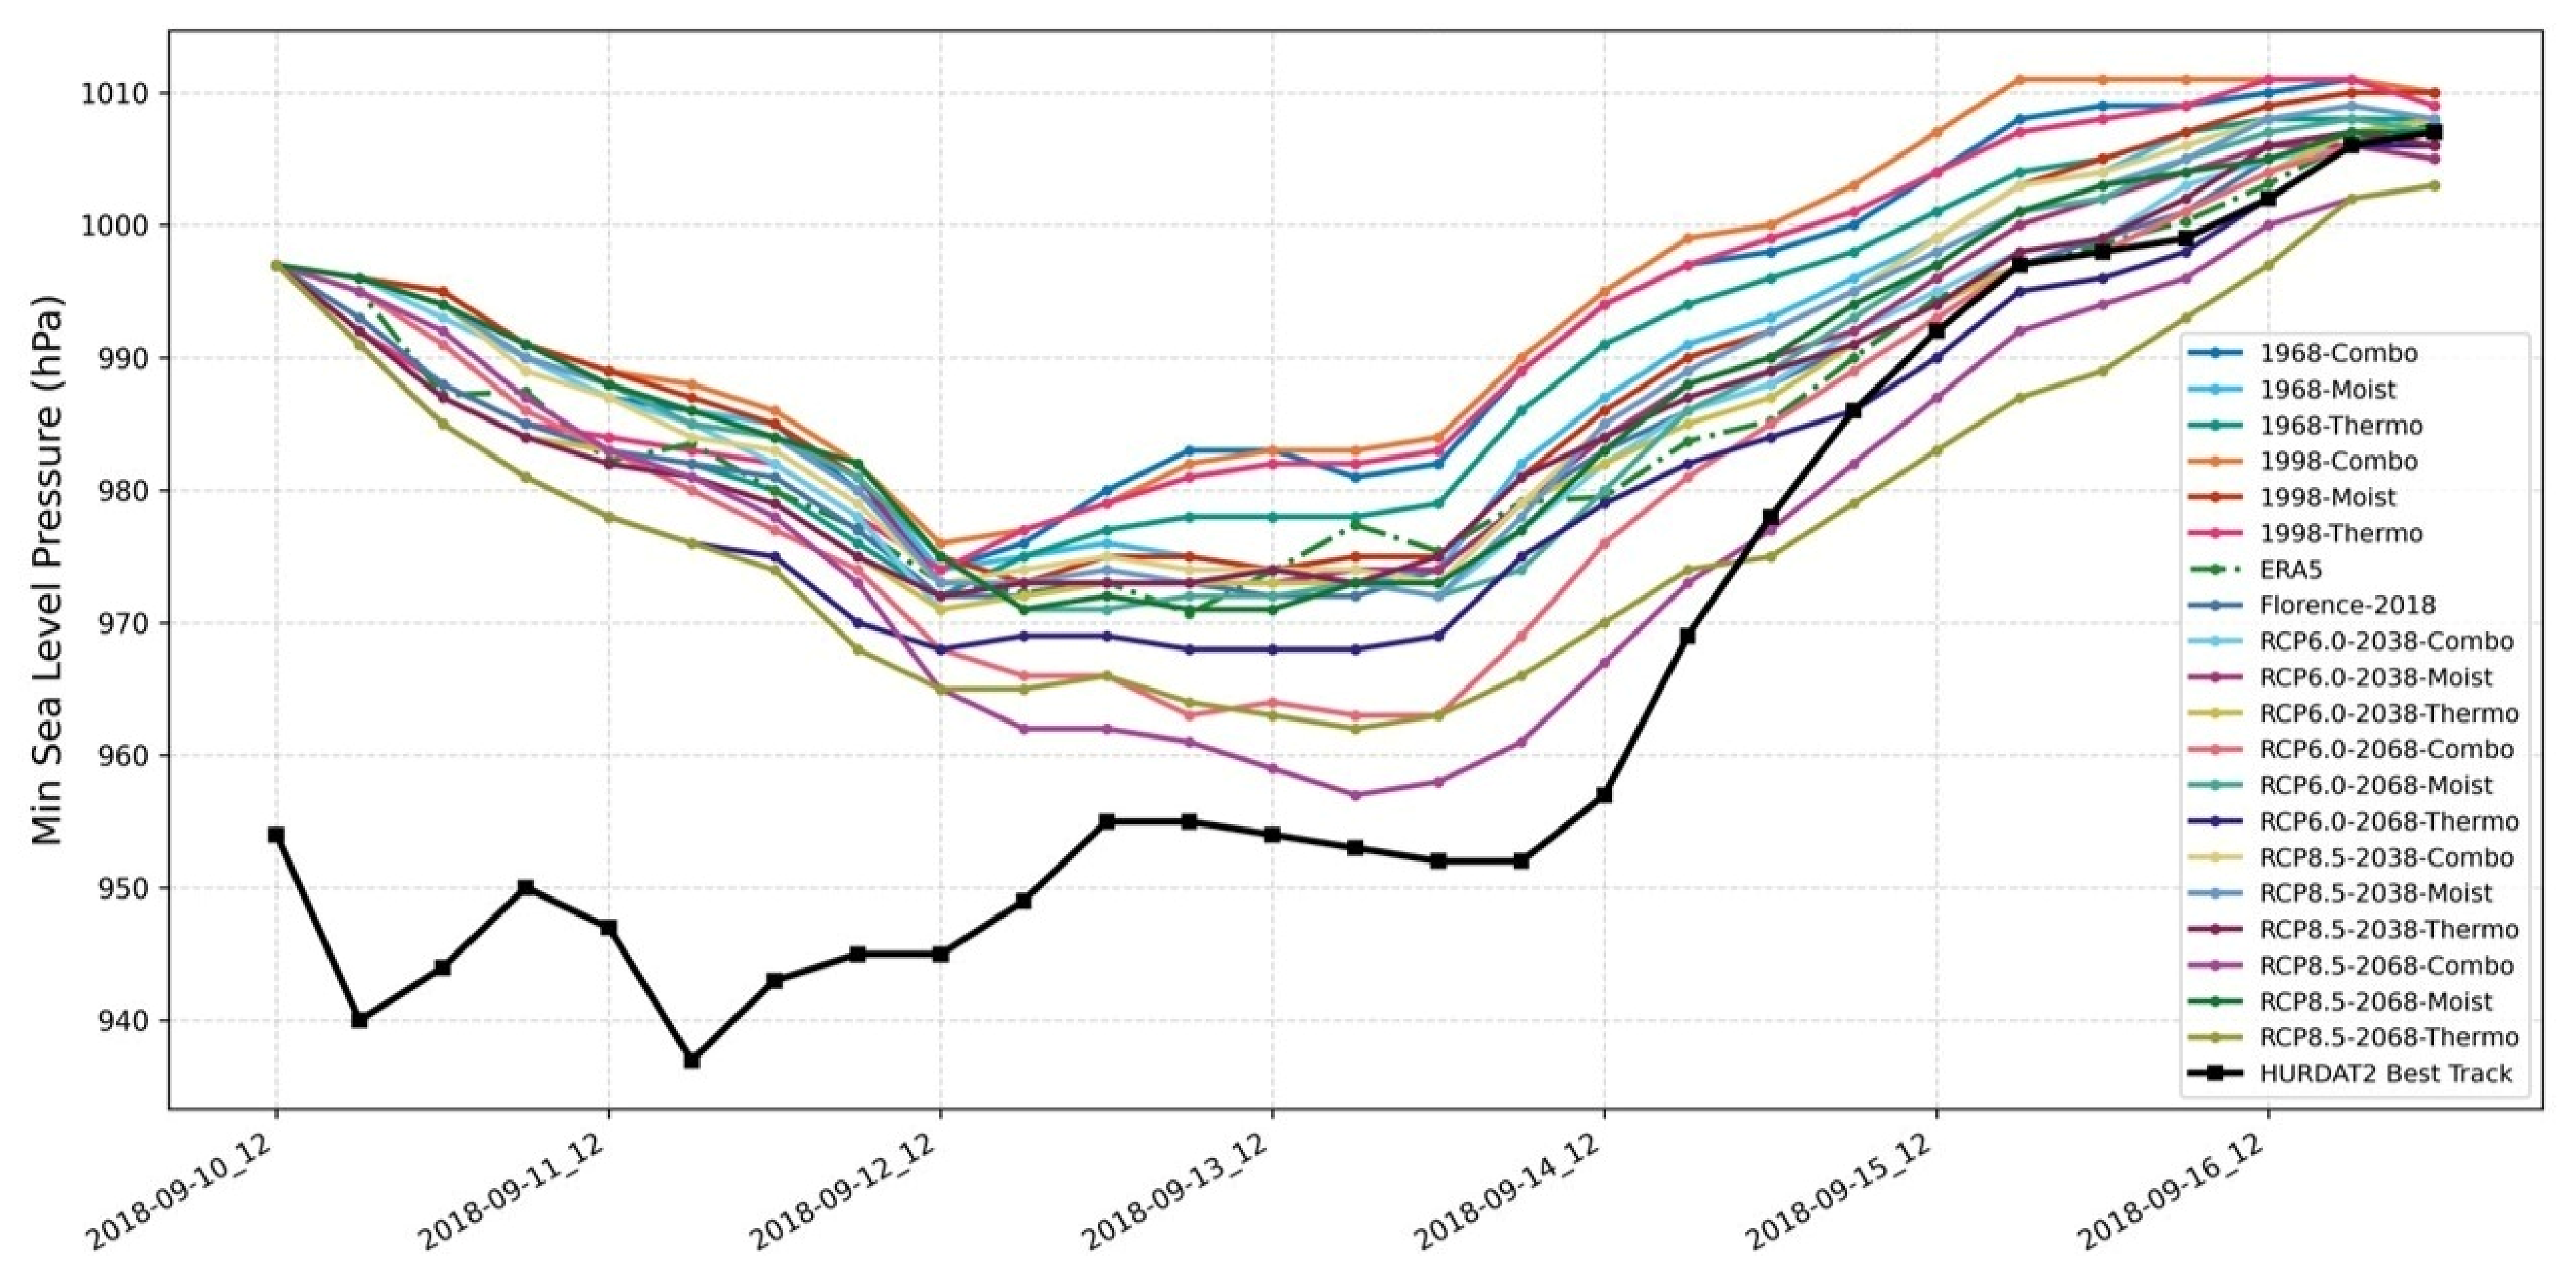
Figure 19 shows all simulated and observed scenarios for the MSLP of the TC. The solid black line indicates the HURDAT2 analysis SLP, which shows considerably lower pressure than that of all simulated versions of Florence prior to 12 UTC 12 September. ERA5 reanalysis data (dot-dashed green) indicates a considerable issue in the representation of Florence (2018), therefore limiting the abilities of this study. Since the initial data (ERA5) severely underestimates Florence from the start of the simulation onwards, the simulated version of Florence in the CTRL does not fully achieve the observed intensity on its final approach toward land. This trend carries over into the sensitivity experiments as well. All simulations begin at the same intensity of SLP, ~998 hPa, rather than the observed value of ~955 hPa. Due to the limitations of ERA5, as it consistently underestimates the observed conditions of Florence (2018), most sensitivity experiments, including the CTRL, closely follow the pattern of ERA5 MSLP. Only the more extreme sensitivity experiments, like the RCP6.0 2068 Thermo, RCP6.0 2068 Combo, RCP8.5 2068 Thermo, and RCP8.5 2068 Combo simulations, approach the MSLP of the observed, especially during the TC’s approach to land (12 UTC 12 September–12 UTC 14 September). Therefore, simulated MSLP intensity is drastically limited by the initial data employed in WRF–ARW.
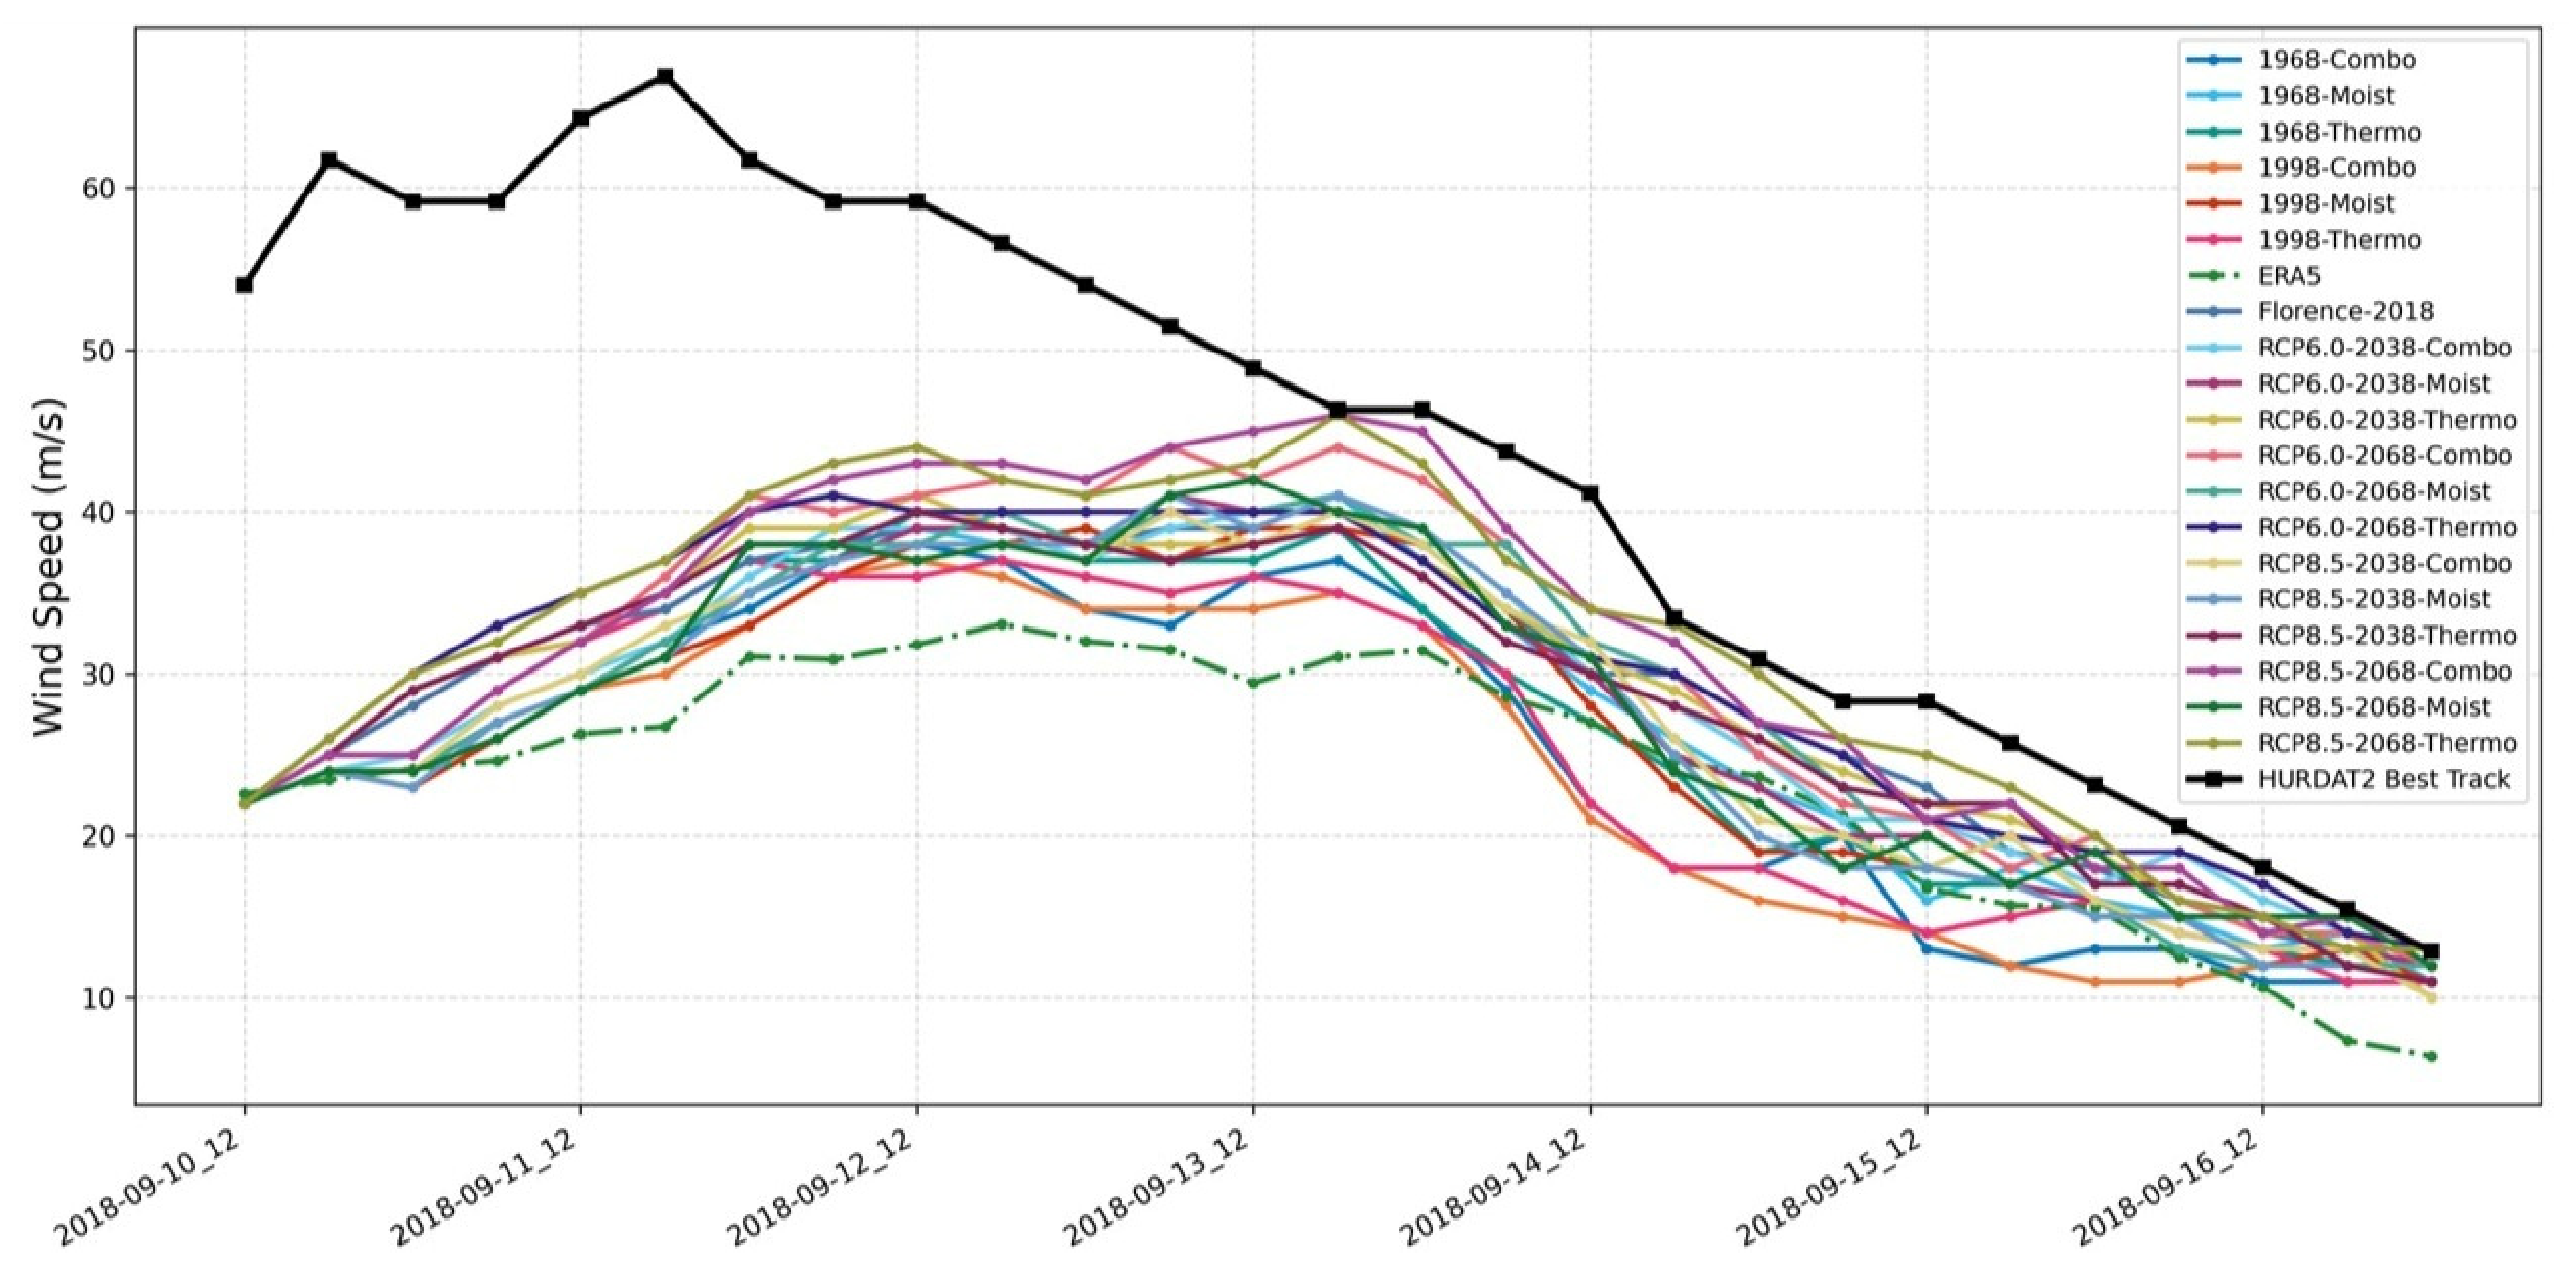
Concurrently, Figure 20 indicates the wind intensity at 10 m for all simulations and observed data. Similar to the MSLP intensity in Figure 19, ERA5 severely lacks wind velocity compared to HURDAT2 data. At the initialization time of the WRF–ARW simulations, ERA5 indicates a wind velocity of ~22 ms−1, while the observed was ~54 ms−1. Therefore, in ERA5, an inaccurate representation of Florence is already given. As a result, all simulations start by poorly representing the wind velocity. However, with time, WRF–ARW simulates a higher wind velocity that more closely represents the HURDAT2 data. The CTRL simulation increases wind velocity by as much as 10 ms−1 consistently when compared to ERA5. However, for future climate projections of Florence, because of the warmer environment, stronger wind velocities are present that surpass the CTRL simulation and ERA5 reanalysis. As the simulations approach the official time of landfall (which is the area of focus in this study), most experiments are in error by ~10 ms−1 when compared to the observed. After landfall, all simulations trend towards lower wind velocities, which is expected. However, comparing the CTRL to the future climate simulations, based on a warmer and potentially moister environment, a stronger version of the TC forms.
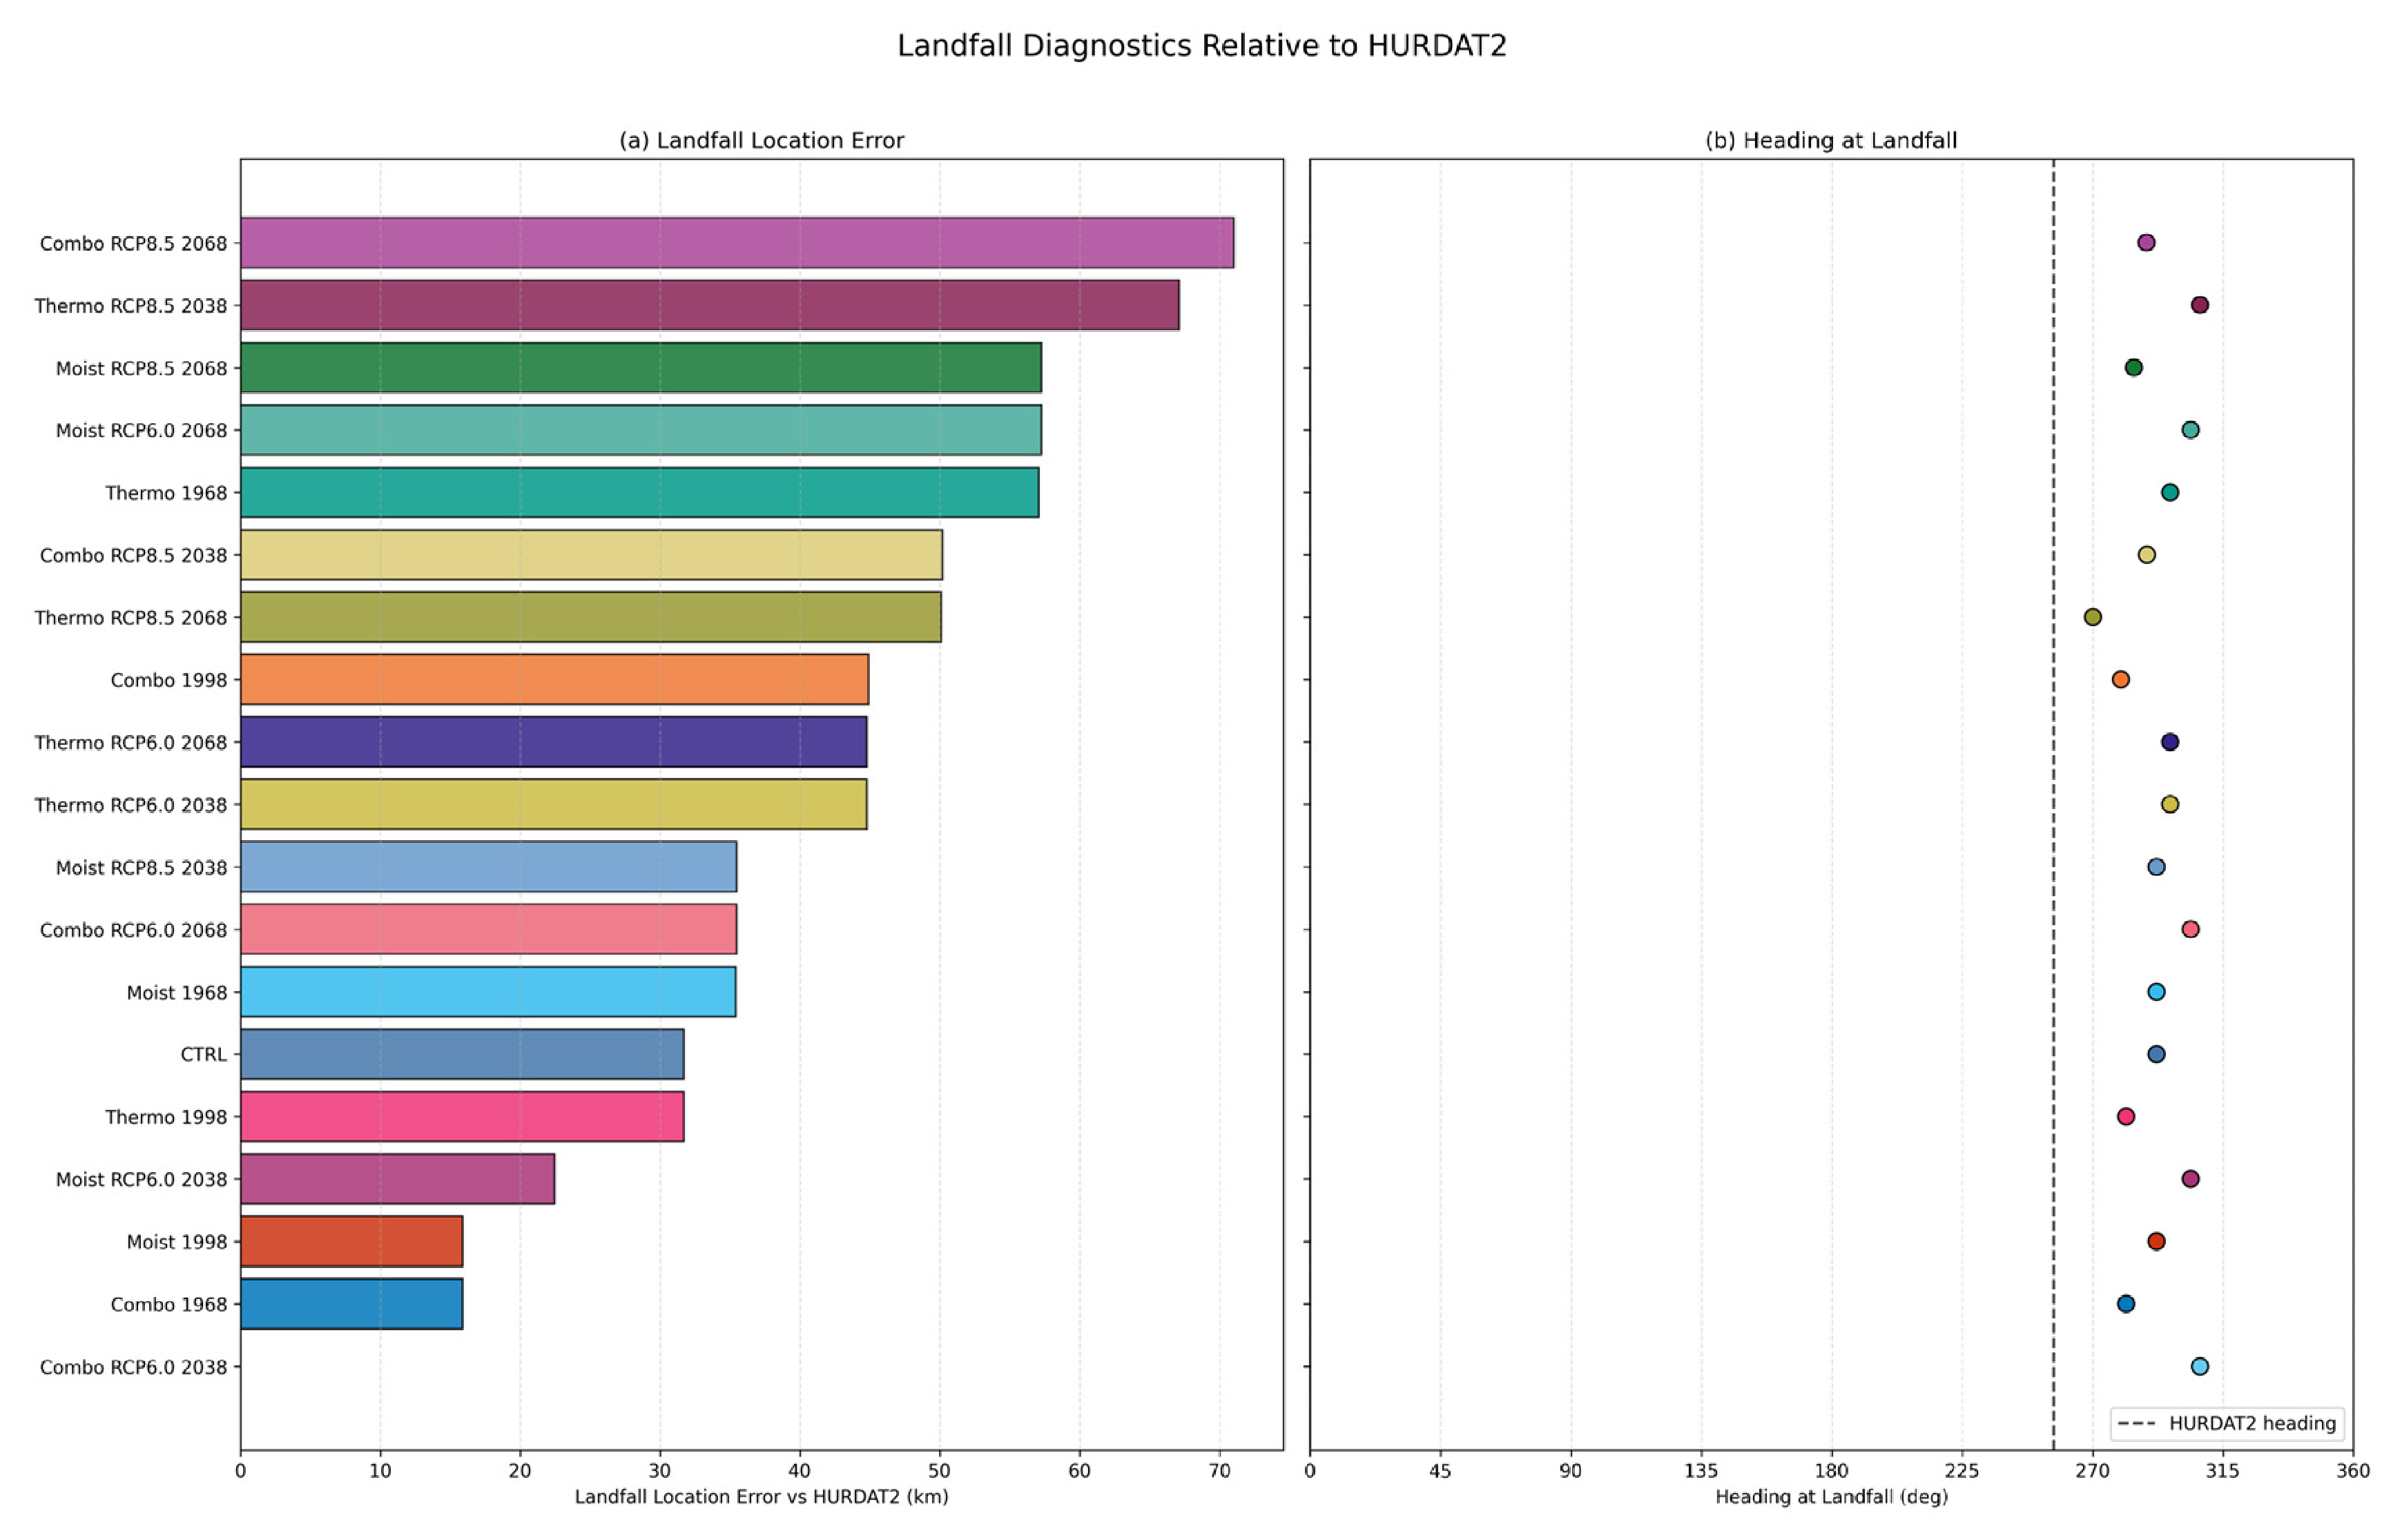
To quantitatively evaluate the performance of the CTRL simulation and provide a basis for the sensitivity experiments, statistical analyses are conducted by comparing the simulated results with HURDAT2 best-track data. In Figure 21a below, the landfall location error is given for each experiment, ordered from smallest to largest. Notice firstly that the CTRL experiment made landfall with an error of approximately 32 km, indicating good agreement with observations. Based on the CTRL simulation, where past climate thermodynamical and moisture-related states were implemented into the model, variations in the landfall position were degraded noticeably, where the Thermo 1968 experiment landfall position error increased to approximately 56 km, while the Combo 1968 and Moist 1998 cases were significantly closer to the observed landfall position (~15 km). For future climate experiments, overall, the landfall position varied more than in the past climate experiments, but the difference is still reasonable, as the greatest landfall location error came from the Combo RCP8.5 2068 experiment of ~71 km, which is roughly double that of the CTRL. However, the modulation of the Combo RCP6.0 2038 experiment yielded negligible error in landfall position. As a result, reasonable geographic confidence is given that the climatic modulation in the thermodynamic and moisture fields will only produce mild track deflections and that the model captures the large-scale track behavior of Hurricane Florence (2018) with reasonable accuracy. In Figure 21b, the heading at the position of landfall is given, with the dashed vertical line representing the heading of Florence (2018) in the HURDAT2 analysis. Consistently, resulting from the CTRL experiment, the headings of most simulated versions of Florence surround 296°, which translates to a west–northwest heading instead of a west–southwest heading, as in the observed. This discrepancy likely stems from the overarching push of a straight west–northwest track over the ocean without strictly recurving southward after landfall.
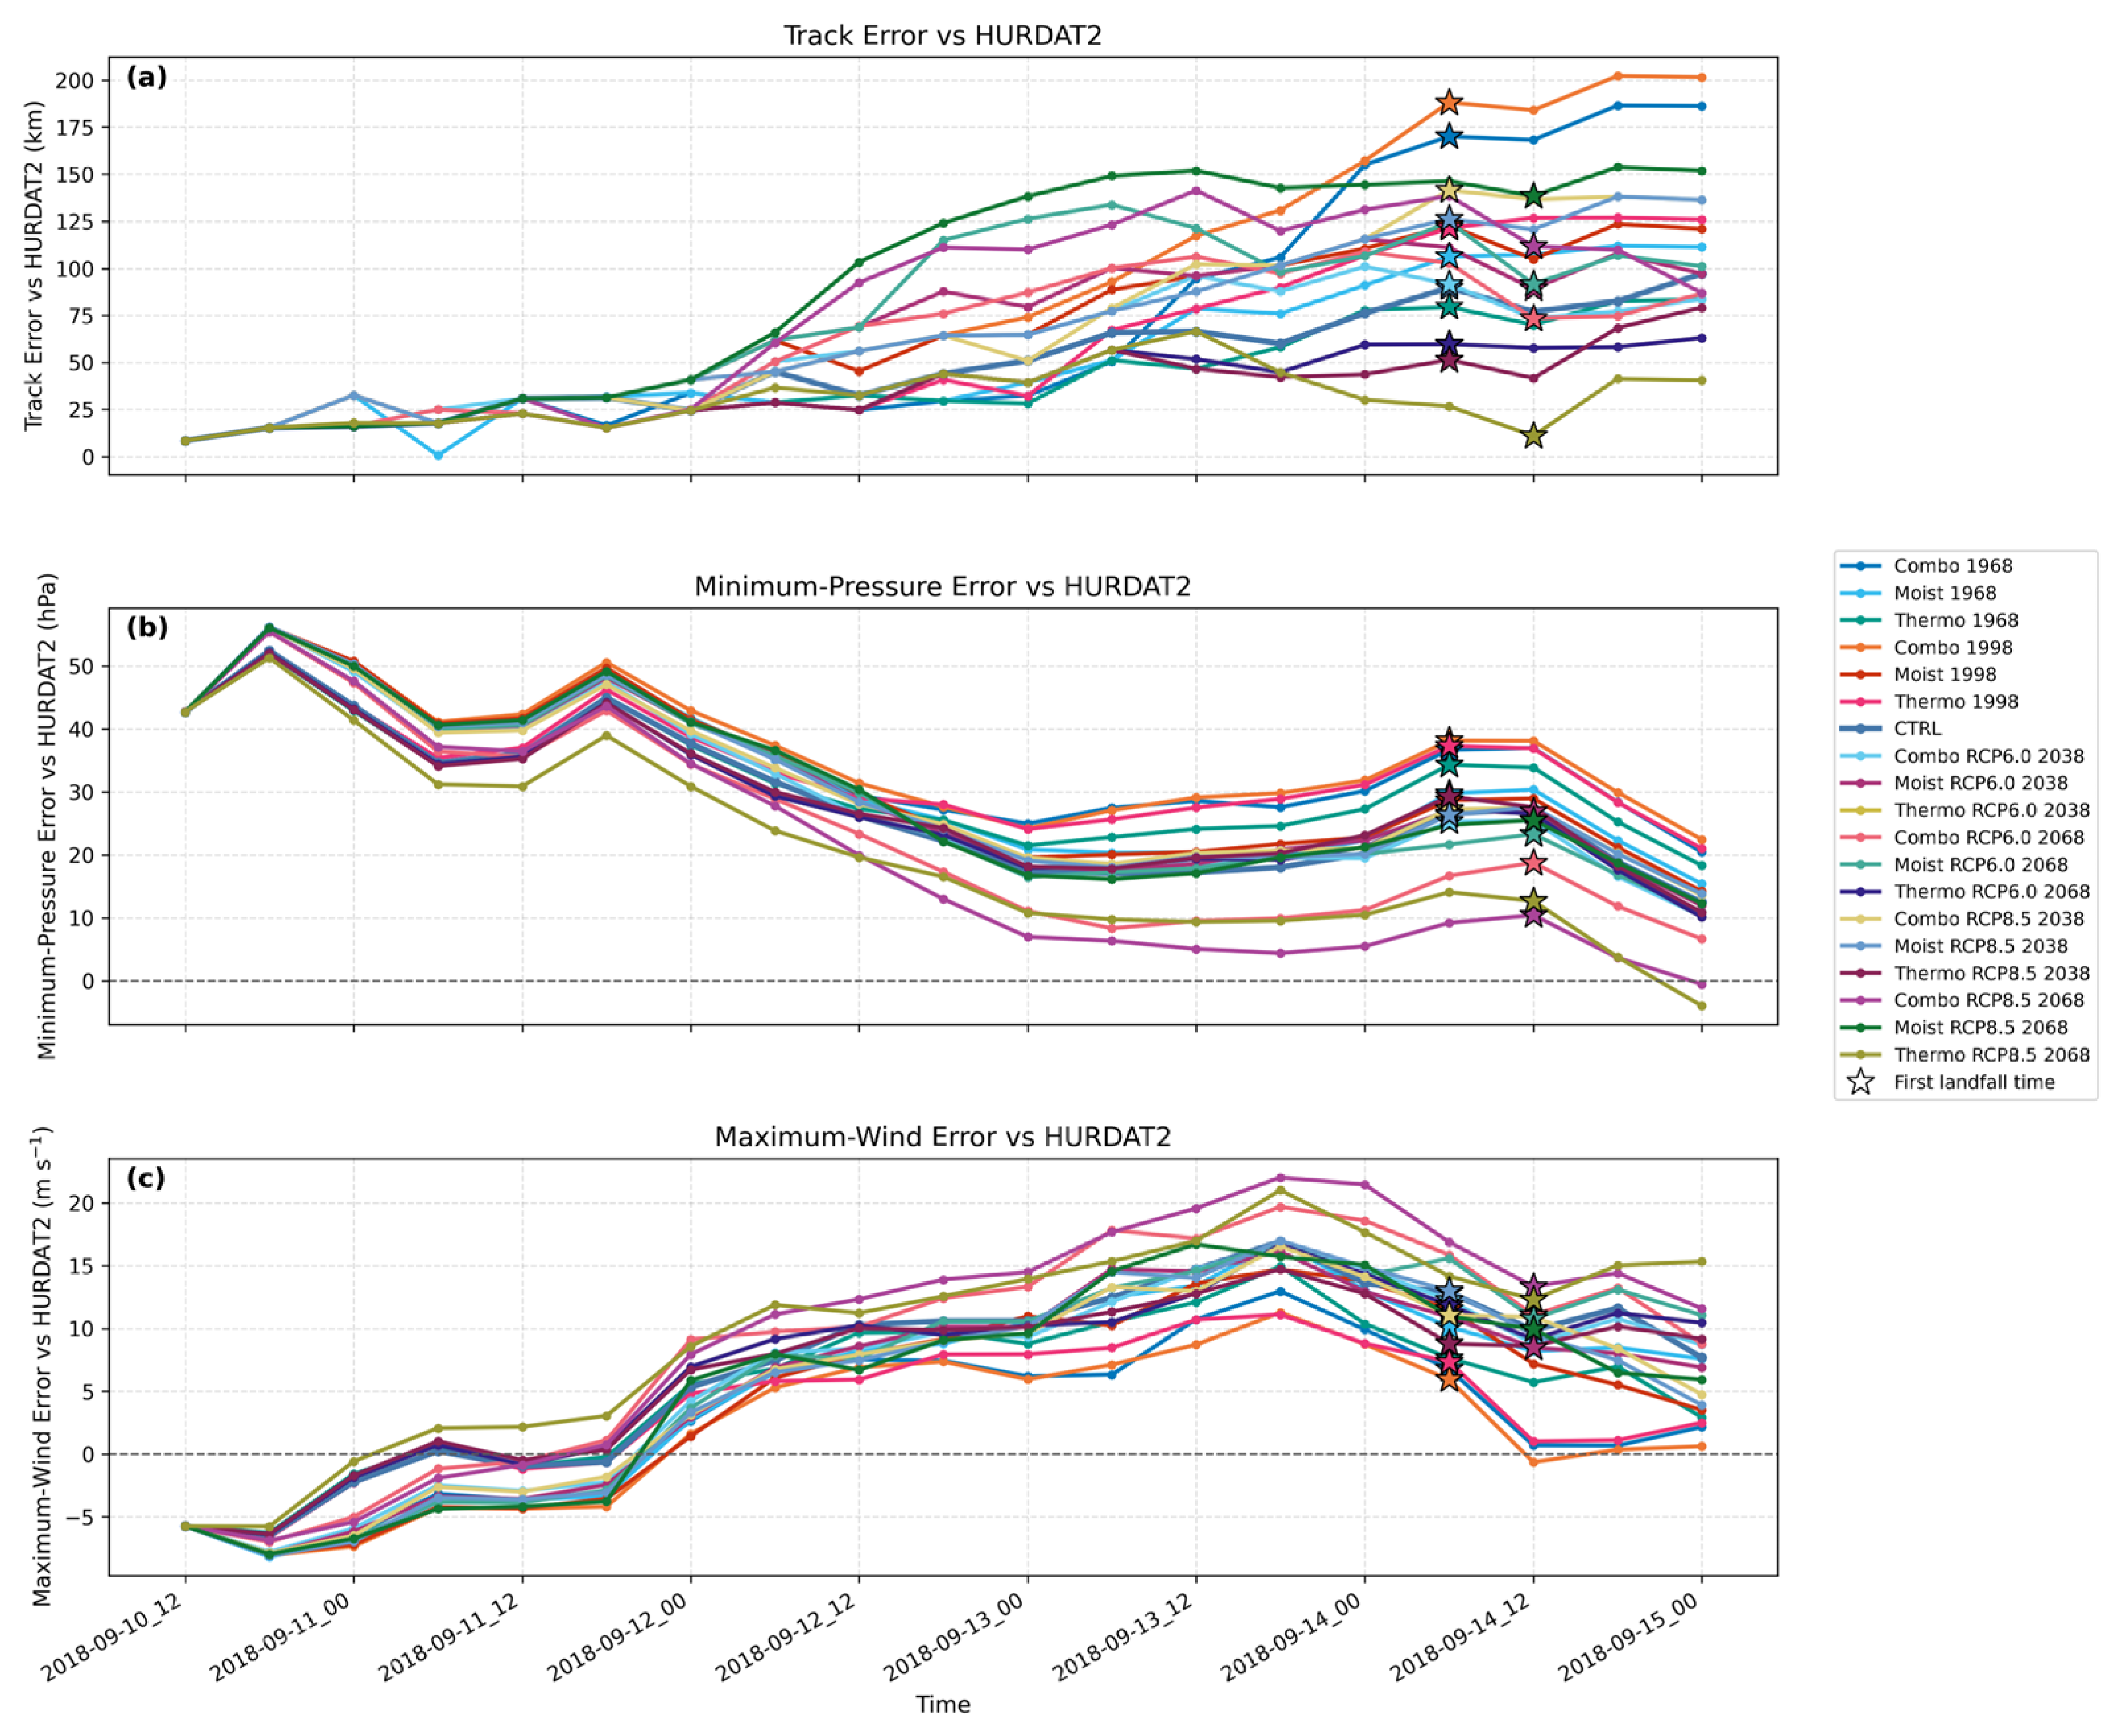
Figure 22 further quantifies model performance using track error (panel a), MSLP error (panel b), and maximum 10 m wind speed error (panel c). Initially, the track error, per the six-hourly timestep available in the HURDAT2 data, remains minimal during the initialization of the model simulations. However, as time marches on in the simulations (carried over by the CTRL), all experiments exhibit moderate track errors starting after 12 September 00 UTC. After this time, as seen in Figure 18, the track of Florence moderately shifts southward of the observed track. Figure 22a validates this. An important interpretation of the track error is that the simulated storms generally propagate faster than the observed Florence, indicated by the integrated stars in Figure 22, which represent the rounded-down/up time (based on the availability of HURDAT2) of the center of circulation first impinging on land. Furthermore, as previously mentioned, these errors are partly attributable to known limitations in the ERA5 representation of tropical cyclone intensity. As shown in Figure 22b, the MSLP error starts significantly high at the initialization time of the model simulations and never fully attains the minimum pressure of Florence. However, the stronger future climate scenarios of Florence more closely follow the HURDAT2 observed pressure after initialization. In Figure 22c, a similar explanation can be given for maximum wind error compared to HURDAT2, except that the simulated maximum 10 m winds reach within ~10 ms−1 of the observed in the CTRL simulation, providing additional confidence in the model’s ability to represent storm intensity.
Overall, these quantitative metrics demonstrate that the CTRL simulation reasonably captures the track, timing, and intensity of Hurricane Florence (2018), with errors comparable to those reported in previous WRF-based tropical cyclone studies. This provides a reliable baseline for assessing the impacts of thermodynamic and moisture modifications in the sensitivity experiments.

5. Discussion

The results of this study are broadly consistent with previous PGW investigations, which indicate that thermodynamic warming leads to increased TC intensity and precipitation. For example, Lackmann [23] and Gutmann et al. [26] demonstrated that increases in sea surface temperature and atmospheric temperature enhance surface enthalpy fluxes and atmospheric instability, resulting in stronger storms and increased rainfall. Similarly, the thermodynamic modification experiments in this study produce substantial increases in precipitation and storm intensity, supporting the dominant role of temperature-driven energy enhancement in tropical cyclone intensification.
In contrast, the moisture-only experiments reveal a more complex response that is less emphasized in prior studies. While increased atmospheric moisture is often associated with enhanced precipitation, e.g., [25], the results presented here indicate that moisture availability alone does not guarantee increased rainfall accumulation. Instead, precipitation is strongly modulated by storm dynamics, including propagation speed and interaction with synoptic-scale features such as stationary fronts. In particular, faster inland motion reduces residence time over coastal regions, limiting rainfall accumulation despite sufficient moisture content. This highlights the importance of distinguishing between moisture availability and moisture convergence in controlling precipitation.
Furthermore, the case of Hurricane Florence (2018), characterized by its unusually slow translation speed and interaction with a stationary frontal boundary, underscores the importance of large-scale environmental controls on rainfall distribution. The sensitivity of rainfall accumulation to storm motion identified in this study suggests that future projections of TC impacts should consider not only thermodynamic intensification but also potential changes in storm propagation and environmental steering flow. This is consistent with previous studies, e.g., [22], emphasizing that both thermodynamic and dynamical factors jointly determine future tropical cyclone impacts. These findings provide a process-based explanation for the differing impacts of thermodynamic and moisture changes, addressing a gap in previous PGW studies.

6. Conclusions

Hurricane Florence (2018) proved to be a very impactful TC, which made landfall along the NC coastline. As a result of its slow propagation speed after landfall, nearly stalling, torrential rainfall occurred upwards of 35 inches along the NC coastline and inland due to the collapse of the deep-layer steering flow and interactions of the quasi-stationary frontal system right after landfall. This loss of mid-level steering uniquely affected Florence, as there was essentially no meaningful background flow directing the circulation away from the NC coastline. Significant freshwater runoff and severe seawater inundation occurred, leading to catastrophic flooding in the region, with the most severe inundation of seawater coming from the strong and constant onshore easterly flow from Florence. The most severe storm surge was found along the Neuse River, Pamlico Sound and surrounding tributaries in NC. Florence was chosen for climate studies due in part to its significant impacts, as well as the synoptic-to-mesoscale dynamics in play surrounding landfall. At the time of landfall, SSTs in the Atlantic were climatologically warmer, especially along the NC coast. As a result of the slowed propagation speed, atmospheric instability was utilized, especially along the NC coast, to produce extensive rainfall accumulation. Past climate projections from the thermodynamic and moisture modifications indicate that Florence still would have formed but would have been considerably weaker in both intensity and potential rainfall, as can be seen compared to the CTRL simulation. Additional effects on the stationary front can also be seen in the temperature gradient changes along the AMR and extending poleward. As a result, more intense rainfall was projected to fall along the AMR due to the orographic lift and the conditional instability of the environment.
Future climate projections of Florence (2018) indicate a stronger and better organized TC in which minimum SLP and wind velocities approach the observed HURDAT2 data. Additionally, in the future climate projection driven solely by thermodynamic modification, rainfall approached nearly 67% more than the CTRL. However, modifying only moisture profiles does not necessarily increase precipitation in model simulations, as evident in the results. Primarily, a warmer climate given by higher concentrations of CO2 could represent stronger and more impactful TCs without necessarily modifying the track drastically. However, limitations do exist in this study due to the poor representation of Florence (2018) in the ERA5 reanalysis data profiles. Further analysis is needed to determine the overall effects of a warming climate.

Author Contributions

Conceptualization, J.T.W., Y.-L.L. and L.L.; methodology, J.T.W. and L.L.; software, J.T.W.; validation, J.T.W. and Y.-L.L.; formal analysis, J.T.W.; investigation, J.T.W.; data curation, J.T.W.; writing—original draft, J.T.W.; writing—review and editing, J.T.W., Y.-L.L. and L.L.; visualization, J.T.W.; supervision, Y.-L.L. and L.L.; project administration, L.L.; funding acquisition, L.L. All authors have read and agreed to the published version of the manuscript.

Funding

This research was partially funded by the Office of Naval Research, under grant N000142412351, and the NC A&T, UNC Chapel Hill Looking Forward Pilot Program by N.C. A&T and UNC Chapel Hill: Improving Prediction of Flooding Associated with Tropical Cyclones in Eastern North Carolina [NCAT-UNCCH Looking Forward].

Institutional Review Board Statement

Not applicable.

Informed Consent Statement

Not applicable.

Data Availability Statement

The numerical model results for this study are too large to archive. Instead, all information to replicate the results is provided. The NCAR/CISL environment used, namelists, and postprocessing scripts are available at the following GitHub page: https://github.com/jacksonwiles/Florence-2018-Climate-Impacts/ (accessed on 26 February 2026).

Conflicts of Interest

The authors declare no conflicts of interest.

References

  1. Larson, J.; Zhou, Y.; Higgins, R.W. Characteristics of Landfalling Tropical Cyclones in the United States and Mexico: Climatology and Interannual Variability. J. Clim. 2005, 18, 1247–1262. [Google Scholar] [CrossRef] [Scilit]
  2. Kim, D.; Lee, S.-K.; Lopez, H.; Foltz, G.R.; Wen, C.; West, R.; Dunion, J. Increase in Cape Verde Hurricanes during Atlantic Niño. Nat. Commun. 2023, 14, 3704. [Google Scholar] [CrossRef] [Scilit]
  3. Stewart, S.; Berg, R. National Hurricane Center Tropical Cyclone Report: Hurricane Florence (AL062018); National Hurricane Center: Miami, FL, USA, 2019.
  4. NWS; WFO; MHX. Hurricane Florence Review. Available online: https://storymaps.arcgis.com/stories/cf9065a5c0c04bf09287c0bed6d59114 (accessed on 3 June 2025).
  5. Tang, B.H.; Fang, J.; Bentley, A.; Kilroy, G.; Nakano, M.; Park, M.-S.; Rajasree, V.P.M.; Wang, Z.; Wing, A.A.; Wu, L. Recent Advances in Research on Tropical Cyclogenesis. Trop. Cyclone Res. Rev. 2020, 9, 87–105. [Google Scholar] [CrossRef] [Scilit]
  6. Wang, Z. What Is the Key Feature of Convection Leading up to Tropical Cyclone Formation? J. Atmos. Sci. 2018, 75, 1609–1629. [Google Scholar] [CrossRef] [Scilit]
  7. Masson-Delmotte, V.; Zhai, P.; Pirani, A.; Connors, S.L.; Péan, C.; Berger, S.; Caud, N.; Chen, Y.; Goldfarb, L.; Gomis, M.I.; et al. (Eds.) Climate Change 2021: The Physical Science Basis. Contribution of Working Group I to the Sixth Assessment Report of the Intergovernmental Panel on Climate Change; Cambridge University Press: Cambridge, UK; New York, NY, USA, 2021. [Google Scholar]
  8. World Meteorological Organization (WMO). State of the Global Climate 2024. Available online: https://library.wmo.int/records/item/69455-state-of-the-global-climate-2024 (accessed on 26 February 2026).
  9. BAMS State of the Climate. Available online: https://www.ncei.noaa.gov/bams-state-of-climate (accessed on 26 February 2026).
  10. Emanuel, K. Increasing Destructiveness of Tropical Cyclones over the Past 30 Years. Nature 2005, 436, 686–688. [Google Scholar] [CrossRef] [Scilit]
  11. Allen, M.R.; Ingram, W.J. Constraints on Future Changes in Climate and the Hydrologic Cycle. Nature 2002, 419, 224–232. [Google Scholar] [CrossRef] [Scilit]
  12. Knutson, T.; Landsea, C.; Emanuel, K. Tropical Cyclones and Climate Change: A Review. In Global Perspectives on Tropical Cyclones; World Scientific Series on Asia-Pacific Weather and Climate; World Scientific: Singapore, 2010; Volume 4, pp. 243–284. ISBN 978-981-4293-47-1. [Google Scholar]
  13. Trenberth, K.E.; Dai, A.; Rasmussen, R.M.; Parsons, D.B. The Changing Character of Precipitation. Bull. Am. Meteorol. Soc. 2003, 84, 1205–1218. [Google Scholar] [CrossRef] [Scilit]
  14. Pall, P.; Allen, M.R.; Stone, D.A. Testing the Clausius–Clapeyron Constraint on Changes in Extreme Precipitation under CO2 Warming. Clim. Dyn. 2007, 28, 351–363. [Google Scholar] [CrossRef] [Scilit]
  15. Landsea, C.W. A Climatology of Intense (or Major) Atlantic Hurricanes. Mon. Weather Rev. 1993, 121, 1703–1713. [Google Scholar] [CrossRef] [Scilit]
  16. Goldenberg, S.B.; Landsea, C.W.; Mestas-Nunez, A.M.; Gray, W.M. The Recent Increase in Atlantic Hurricane Activity: Causes and Implications. Science 2001, 293, 474–479. [Google Scholar] [CrossRef] [Scilit]
  17. Webster, P.J.; Holland, G.J.; Curry, J.A.; Chang, H.-R. Changes in Tropical Cyclone Number, Duration, and Intensity in a Warming Environment. Science 2005, 309, 1844–1846. [Google Scholar] [CrossRef] [Scilit]
  18. Kossin, J.P.; Vimont, D.J. A More General Framework for Understanding Atlantic Hurricane Variability and Trends. Bull. Am. Meteorol. Soc. 2007, 88, 1767–1782. [Google Scholar] [CrossRef] [Scilit]
  19. Servain, J. Simple Climatic Indices for the Tropical Atlantic Ocean and Some Applications. J. Geophys. Res. Oceans 1991, 96, 15137–15146. [Google Scholar] [CrossRef] [Scilit]
  20. Knutson, T.R.; McBride, J.L.; Chan, J.; Emanuel, K.; Holland, G.; Landsea, C.; Held, I.; Kossin, J.P.; Srivastava, A.K.; Sugi, M. Tropical Cyclones and Climate Change. Nat. Geosci. 2010, 3, 157–163. [Google Scholar] [CrossRef] [Scilit]
  21. Knutson, T.; Camargo, S.J.; Chan, J.C.L.; Emanuel, K.; Ho, C.-H.; Kossin, J.; Mohapatra, M.; Satoh, M.; Sugi, M.; Walsh, K.; et al. Tropical Cyclones and Climate Change Assessment: Part I: Detection and Attribution. Bull. Am. Meteorol. Soc. 2019, 100, 1987–2007. [Google Scholar] [CrossRef] [Scilit]
  22. Knutson, T.; Camargo, S.J.; Chan, J.C.L.; Emanuel, K.; Ho, C.-H.; Kossin, J.; Mohapatra, M.; Satoh, M.; Sugi, M.; Walsh, K.; et al. Tropical Cyclones and Climate Change Assessment: Part II: Projected Response to Anthropogenic Warming. Bull. Am. Meteorol. Soc. 2020, 101, E303–E322. [Google Scholar] [CrossRef] [Scilit]
  23. Lackmann, G.M. Hurricane Sandy before 1900 and after 2100. Bull. Am. Meteorol. Soc. 2015, 96, 547–560. [Google Scholar] [CrossRef] [Scilit]
  24. Mallard, M.S.; Lackmann, G.M.; Aiyyer, A.; Hill, K. Atlantic Hurricanes and Climate Change. Part I: Experimental Design and Isolation of Thermodynamic Effects. J. Clim. 2013, 26, 4876–4893. [Google Scholar] [CrossRef] [Scilit]
  25. Risser, M.D.; Wehner, M.F. Attributable Human-Induced Changes in the Likelihood and Magnitude of the Observed Extreme Precipitation during Hurricane Harvey. Geophys. Res. Lett. 2017, 44, 12457–12464. [Google Scholar] [CrossRef] [Scilit]
  26. Gutmann, E.D.; Rasmussen, R.M.; Liu, C.; Ikeda, K.; Bruyere, C.L.; Done, J.M.; Garrè, L.; Friis-Hansen, P.; Veldore, V. Changes in Hurricanes from a 13-Yr Convection-Permitting Pseudo–Global Warming Simulation. J. Clim. 2018, 31, 3643–3657. [Google Scholar] [CrossRef] [Scilit]
  27. Liu, M.; Yang, L.; Smith, J.A.; Vecchi, G.A. Response of Extreme Rainfall for Landfalling Tropical Cyclones Undergoing Extratropical Transition to Projected Climate Change: Hurricane Irene (2011). Earths Future 2020, 8, e2019EF001360. [Google Scholar] [CrossRef] [Scilit] [PubMed]
  28. Skamarock, A.W.; Klemp, A.J.; Dudhia, A.J.; Gill, A.D.O.; Liu, A.Z.; Berner, A.J.; Wang, A.W.; Powers, A.J.G.; Duda, A.M.G.; Barker, A.D.; et al. A Description of the Advanced Research WRF Model Version 4.1. In National Center for Atmospheric Research Technical Note; The SAO Astrophysics Data System: Cambridge, MA, USA, 2019. [Google Scholar]
  29. Copernicus Climate Change Service. Complete ERA5 Global Atmospheric Reanalysis. Copernicus Climate Change Service (C3S) Climate Data Store (CDS). 2023. Available online: https://cds.climate.copernicus.eu/datasets/reanalysis-era5-complete?tab=overview (accessed on 26 February 2026).
  30. Monaghan, A.J.; Steinhoff, D.F.; Bruyère, C.L.; Yates, D.N. NCAR CESM Global Bias-Corrected CMIP5 Output to Support WRF/MPAS Research; NSF National Center for Atmospheric Research: Boulder, CO, USA, 2014. [Google Scholar] [CrossRef] [Scilit]
  31. Representative Concentration Pathway. In Wikipedia; Wikimedia Foundation: San Francisco, CA, USA, 2025.
  32. NHC Data Archive. Available online: https://www.nhc.noaa.gov/data/ (accessed on 3 April 2026).
  33. Landsea, C.W.; Franklin, J.L. Atlantic Hurricane Database Uncertainty and Presentation of a New Database Format. Mon. Weather Rev. 2013, 141, 3576–3592. [Google Scholar] [CrossRef] [Scilit]
  34. Carstens, J.D.; Uejio, C.K.; Powell, E.; Jung, J.; Zonka, S. Tropical Cyclones and Climate Change: An Overview for the Public Health Community. Environ. Res. 2025, 285, 122149. [Google Scholar] [CrossRef] [Scilit]
  35. NOAA/NWS; WPC. WPC Surface Analysis Archive. Available online: https://www.wpc.ncep.noaa.gov/archives/web_pages/sfc/sfc_archive_maps.php?arcdate=09/15/2018&selmap=2018091500&maptype=namussfc (accessed on 8 October 2025).
Figure 1. NHC Hurricane Florence best estimate storm surge [3].
Atmosphere 17 00438 g001
Figure 2. WRF–ARW preprocessing system (WPS) version 4.4 domain configurations for d01, d02, and d03 implemented in running WRF–ARW version 4.4.2.
Atmosphere 17 00438 g002
Figure 3. CESM RCP future climate scenario CO2 concentrations [31].
Atmosphere 17 00438 g003
Figure 4. Flowchart depicting the CTRL framework and both past/future climate scenario simulations adhered to in this study.
Atmosphere 17 00438 g004
Figure 5. Tropical cyclone climatology anomalies (solid) and trend lines (dashed) for the Atlantic Basin. Results derived from HURDAT2 data [32,33].
Atmosphere 17 00438 g005
Figure 6. NHC official track and intensity of Hurricane Florence (2018) based on HURDAT2 analysis [3].
Atmosphere 17 00438 g006
Figure 7. NOAA WPC surface analysis charts for Hurricane Florence (2018) valid on (a) 00 UTC 14 September, (b) 12 UTC 14 September, and (c) 00 UTC 15 September 2018 [35].
Atmosphere 17 00438 g007
Figure 8. WRF–ARW CTRL case SST subtracted by ERA5 Climatology (from 1980 to 2018).
Atmosphere 17 00438 g008
Figure 9. Official track of Hurricane Florence (2018), as well as accumulated precipitation valid for 13–18 September 2018. Note, the maximum accumulated precipitation occurred in Elizabethtown, NC, with 35.93 inches of rainfall (912.62 mm) [3].
Atmosphere 17 00438 g009
Figure 10. WRF–ARW-simulated CTRL minimum sea level pressure (MSLP, hPa) and wind barbs (ms−1) valid for 00 UTC 14 September 2018, prior to landfall. MSLP and max wind velocity for panels (ac) are (980.1 hPa, 37.8 ms−1), (964 hPa, 46.8 ms−1), and (965.1 hPa, 51.4 ms−1), respectively.
Atmosphere 17 00438 g010
Figure 11. WRF–ARW-simulated CTRL accumulated precipitation (inches) valid from 12 UTC 10 September to 00 UTC 17 September (a), 00 UTC 12 September to 00 UTC 17 September (b), and 12 UTC 12 September to 00 UTC 16 September (c). Maximum rainfall for panels (ac) are 33.8 inches (~858 mm), 46.15 inches (~1172 mm), and 39.6 inches (~1006 mm), respectively.
Atmosphere 17 00438 g011
Figure 12. WRF–ARW-simulated past climate projection of Hurricane Florence (2018) based on thermodynamic profiles of September 1968. Panel (a) represents the two-meter temperature (degrees C) difference from the CTRL simulation. Panel (b) represents the accumulated precipitation (inches) from 12 UTC 10 September to 00 UTC 17 September 2018. Panel (c) represents the SST (degrees C) difference between the CTRL and 1968 profiles.
Atmosphere 17 00438 g012
Figure 13. WRF–ARW-simulated future climate projection of Hurricane Florence (2018) based on thermodynamic profiles of the RCP8.5 scenario for September 2068. Panel (a) represents the two-meter temperature (degrees C) difference from the CTRL simulation. Panel (b) represents the accumulated precipitation (inches) from 12 UTC 10 September to 00 UTC 17 September 2018. Panel (c) represents SST (degrees C) difference between the CTRL and 2068 profiles.
Atmosphere 17 00438 g013
Figure 14. WRF–ARW-simulated past climate projection of Hurricane Florence (2018) based on moisture profiles of September 1968. Panel (a) represents the two-meter temperature (degrees C) difference from the CTRL simulation. Panel (b) represents the accumulated precipitation (inches) from 12 UTC 10 September to 00 UTC 17 September 2018.
Atmosphere 17 00438 g014
Figure 15. WRF–ARW-simulated future climate projection of Hurricane Florence (2018) based on moisture profiles of the RCP8.5 scenario for September 2068. Panel (a) represents the two-meter temperature (degrees C) difference from the CTRL simulation. Panel (b) represents the accumulated precipitation (inches) from 12 UTC 10 September to 00 UTC 17 September 2018.
Atmosphere 17 00438 g015
Figure 16. WRF–ARW-simulated past climate projection of Hurricane Florence (2018) based on thermodynamic and moisture profiles of September 1968. Panel (a) represents the two-meter temperature (degrees C) difference from the CTRL simulation. Panel (b) represents the accumulated precipitation (inches) from 12 UTC 10 September to 00 UTC 17 September 2018. Panel (c) represents SST (degrees C) difference between the CTRL and 1968 profiles.
Atmosphere 17 00438 g016
Figure 17. WRF–ARW-simulated future climate projection of Hurricane Florence (2018) based on thermodynamic and moisture profiles of the RCP8.5 scenario for September 2068. Panel (a) represents the two-meter temperature (degrees C) difference from the CTRL simulation. Panel (b) represents the accumulated precipitation (inches) from 12 UTC 10 September to 00 UTC 17 September 2018. Panel (c) represents SST (degrees C) difference between the CTRL and 2068 profiles.
Atmosphere 17 00438 g017
Figure 18. WRF–ARW-simulated past and future climate track projections of Hurricane Florence (2018) based on all scenarios simulated: past thermodynamic and moisture profiles, future thermodynamic and moisture profiles and the inclusion of both thermodynamic and moisture profiles for 1968, 1998, 2038, and 2068. Additionally, the CTRL simulation is plotted alongside the ERA5 version of Florence (2018) and the HURDAT2 Best Track. Panel (a) shows the zoomed-out track from model initialization to the end of the respective simulations. Panel (b) shows the zoomed-in landfall region. The filled stars represent the official landfall time of 12 UTC 14 September.
Atmosphere 17 00438 g018
Figure 19. WRF–ARW-simulated past and future climate MSLP (hPa) projections of Hurricane Florence (2018) based on all scenarios simulated: past thermodynamic and moisture profiles, future thermodynamic and moisture profiles and the inclusion of both thermodynamic and moisture profiles for 1968, 1998, 2038, and 2068. Additionally, the CTRL simulation is plotted alongside the ERA5 version of Florence (2018) and the HURDAT2 Best Track.
Atmosphere 17 00438 g019
Figure 20. WRF–ARW-simulated past and future climate wind (ms−1) projections of Hurricane Florence (2018) based on all scenarios simulated: past thermodynamic and moisture profiles, future thermodynamic and moisture profiles and the inclusion of both thermodynamic and moisture profiles for 1968, 1998, 2038, and 2068. Additionally, the CTRL simulation is plotted alongside the ERA5 version of Florence (2018) and the HURDAT2 Best Track.
Atmosphere 17 00438 g020
Figure 21. Simulated landfall diagnostics to HURDAT2 data of Hurricane Florence (2018). Panel (a) landfall location error of all simulations of past and future climate scenarios (1968, 1998, RCP6.0 2038, RCP8.5 2038, RCP6.0 2068, and RCP8.5 2068). Panel (b) simulated TC headings at landfall for all past and future climate scenarios compared to the HURDAT2 observed heading of Florence (2018) in the vertical black dashed line.
Atmosphere 17 00438 g021
Figure 22. Statistical analysis of all past and future climate scenarios of Hurricane Florence (2018) (1968, 1998, RCP6.0 2038, RCP8.5 2038, RCP6.0 2068, and RCP8.5 2068). Panel (a) simulated track errors of all potential versions of Florence compared to HURDAT2 data. Units are in km. Panel (b) MSLP error of all potential versions of Florence compared to HURDAT2 data. Units are in hPa. Panel (c) maximum wind error of all potential versions of Florence compared to HURDAT2 data. For plotting purposes, the times considered are from the initialization of the model (12 UTC 10 September) to 00 UTC 15 September, which incorporates the landfall time.
Atmosphere 17 00438 g022
Table 1. Modified thermodynamic and moisture variables for sensitivity experiments based on ERA5 1968 and 1998 profiles, as well as NCAR CESM Global Bias-Corrected CMIP5 RCP6.0 and RCP8.5 future climate scenarios for 2038 and 2068.
Thermodynamic Variables
SSTSea Surface Temperature
T22 m Surface Temperature
TMNSoil Temperature at Lower Boundary
TSKSurface Skin Temperature
T3D Temperature
TSLBSoil Temperature
Moisture Variables
Q2Water Vapor Mixing Ratio at 2 m
QVAPOR3D Water Vapor Mixing Ratio
QCLOUDCloud Water Mixing Ratio
QRAINRainwater Mixing Ratio
QICEIce Mixing Ratio
QSNOWSnow Mixing Ratio
QGRAUPGraupel Mixing Ratio
SMOISSoil Moisture
SH2OSoil Liquid Water
SMCRELRelative Soil Moisture
SNOWSnow Water Equivalent
CANWATCanopy Water
Disclaimer/Publisher’s Note: The statements, opinions and data contained in all publications are solely those of the individual author(s) and contributor(s) and not of MDPI and/or the editor(s). MDPI and/or the editor(s) disclaim responsibility for any injury to people or property resulting from any ideas, methods, instructions or products referred to in the content.