


Abstract
Atmospheric aerosols influence the terrestrial carbon cycle through diverse radiative and biogeochemical effects, yet their net impact on vegetation productivity remains contentious and region-specific. To address this, we analyzed the spatiotemporal coupling between aerosol optical depth (AOD) and net primary productivity (NPP) over three African biomes (2013–2023), using multi-source datasets (MODIS, CERES, ERA5, CRU TS). We explicitly distinguished statistically significant relationships (p < 0.05) from non-significant ones when interpreting correlation patterns. Because AOD is an optical measure and does not provide aerosol composition, interpretations involving dust versus smoke are treated as qualitative and indirect. Through structural equation modeling (SEM), we identified two contrasting mechanistic pathways: in the humid Congo Basin rainforest, aerosols were associated with lower NPP via a cooling-mediated pathway (increased cloud albedo leading to reduced temperature and light availability), whereas in the arid savanna, they were associated with more substantial limitations on NPP via a warming-aggravated pathway (increased temperature and potentially coupled water stress). SEM fit was poor for the semi-arid South African plateau, underscoring the dominant role of water availability in strongly water-limited systems. This framework reconciles the paradox of dual aerosol effects by demonstrating that the net impact is dictated by regional climate context. Overall, our conclusions emphasize context-dependent associations rather than direct causal attribution from correlations alone. Our findings provide a process-based understanding that is critical for improving carbon cycle models and for formulating targeted climate adaptation strategies in Africa.
1. Introduction
Atmospheric aerosols are a critically important component of the atmosphere–land system, influencing terrestrial ecosystem carbon cycling through complex radiative and biogeochemical processes [1,2,3]. On the one hand, aerosols can suppress vegetation photosynthesis by directly scattering and absorbing solar radiation and by altering cloud microphysical properties and lifecycles (acting as cloud condensation nuclei), thereby reducing the photosynthetically active radiation (PAR) that reaches the surface [4,5,6,7]. On the other hand, aerosol deposition delivers nutrients such as nitrogen, phosphorus, and iron to ecosystems, and aerosols can enhance light distribution within plant canopies by increasing the fraction of diffuse radiation, thereby improving light-use efficiency and creating the “diffuse radiation fertilization effect” [8,9]. Aerosol optical depth (AOD), a key parameter quantifying total aerosol column content, provides an effective observational basis for studying aerosol–vegetation interactions [10,11]. The net effect of the dual roles of aerosols (suppression versus fertilization) ultimately manifests in vegetation NPP, defined as the net amount of carbon fixed by vegetation through photosynthesis after subtracting autotrophic respiration, a core indicator of ecosystem carbon sequestration capacity. Dynamic changes in NPP significantly influence the global carbon cycle and regional ecological security [12,13,14].
The African continent exhibits pronounced ecosystem gradients and is home to globally significant aerosol sources, including the vast Sahara Desert dust plume and major biomass-burning regions. This creates a distinctive mixed dust–smoke aerosol environment, making Africa an ideal natural laboratory for investigating AOD–NPP coupling. Previous studies have primarily focused on the spatiotemporal distribution of AOD over Africa and its climatic effects. For instance, Yang et al. [15] found an overall increase in AOD over Africa over the past 15 years, while Boiyo et al. [16] reported a significant rise in AOD over East Africa during the dry seasons. However, most prior research has treated aerosols primarily as climate-forcing agents and has not fully explored their role as direct ecological drivers [17,18,19,20,21]. Although Hari et al. [22] and Qiu et al. [23] examined the adverse effects of AOD on terrestrial and marine primary productivity, those analyses were mainly limited to statistical correlations. There remains a limited systematic investigation into the specific pathways and mechanisms through which AOD influences ecosystem carbon sinks. This gap is especially pronounced for Africa—a continent characterized by complex aerosol mixtures (dust and smoke) and diverse ecosystems—where the responses of different biomes to aerosol forcing remain poorly understood. Therefore, systematic research on AOD–NPP coupling in Africa’s ecosystems, particularly the quantitative elucidation of underlying pathways, is essential but underdeveloped.
To address these knowledge gaps, we used multi-source remote sensing data (2013–2023) to analyze the spatiotemporal dynamics of AOD and NPP across three representative African ecosystems. A key aspect of our approach (unlike previous correlation-focused studies) is the use of structural equation modeling (SEM) to move beyond pattern description and quantitatively resolve the causal pathways—including the relative importance of radiative vs. thermal mediators—through which AOD ultimately influences NPP. By doing so, we aim to provide a mechanistic, process-based understanding of aerosol–vegetation interactions. Such knowledge is crucial for enhancing the predictive capabilities of regional carbon cycle models and for informing ecosystem management under changing environmental conditions.
2. Study Area and Methods
2.1. Study Area
Africa, extending from ~37°21′ N to 34°51′ S, encompasses a rich diversity of ecosystems [24,25]. These range from equatorial rainforests and tropical savannas to subtropical deserts at the northern and southern extremes, forming one of the world’s most complete ecological gradients [25,26,27]. With an area of ~30.2 million km2, Africa is the world’s largest source of mineral dust and also a region of intense biomass burning activity [28,29,30,31,32]. Although Africa is characterized by a relatively low level of industrialization and consequently weak emissions of industrial anthropogenic aerosols (e.g., fossil-fuel-related pollution), biomass-burning aerosols associated with agricultural activities, land-use practices, and human-induced fires represent a major anthropogenic aerosol source in the region. Consequently, aerosol loading over Africa is primarily dominated by natural mineral dust and biomass-burning aerosols, making the continent an ideal natural laboratory for investigating aerosol–ecosystem interactions with comparatively limited interference from industrial pollution.
For this study, we divided the continent into three typical ecological regions (Figure 1) based on climate and vegetation characteristics: (A) the Congo Basin rainforest, (B) the tropical savanna belt, and (C) the South African plateau semi-desert. Given our focus on aerosol–ecosystem interactions, we restricted the regional analysis to areas with persistent vegetation cover. The Sahara Desert, dominated by barren surfaces with negligible NPP and higher retrieval uncertainty under bright-surface and heavy-dust conditions, was therefore excluded.
Figure 1.
Overview of the study area in Africa, highlighting the three focus regions (A, B, C) and their predominant vegetation types: A = Congo Basin rainforest, B = tropical savanna, C = South African plateau semi-desert.
We conducted analyses at two temporal scales—interannual and seasonal—to capture both long-term variability and intra-annual dynamics. To avoid ambiguity and repetition in later sections, all temporal windows are defined here and applied consistently throughout the manuscript. Seasons follow the standard climatological definition: March–May (MAM), June–August (JJA), September–November (SON), and December–February (DJF); DJF spans two calendar years (December of the previous year to February of the labeled year). Unless explicitly stated otherwise, any references to “spring/summer/autumn/winter” correspond exactly to MAM/JJA/SON/DJF as defined above. Descriptors such as “wet season” or “dry season” are used only as regional characterizations and are not treated as separate analytical windows; all quantitative seasonal results are based strictly on the month-based definitions above. For the interannual analysis, we constructed annual aggregates for each calendar year (January–December) by combining monthly values within the year (i.e., annual totals for accumulated variables and annual means for state variables, consistent with the variable units). For the seasonal analysis, we computed season-specific composites for each season (MAM, JJA, SON, DJF) using only the months in that season, without mixing months across seasons.
2.2. Data Sources and Processing
We employed a suite of satellite and reanalysis datasets from 2013 to 2023, with key dataset specifications summarized in Table 1. To ensure consistency, all spatial data were resampled to a standard 500 m resolution and aggregated into monthly and annual composites. We applied quality-control masks for each product to filter out unreliable pixels (i.e., obviously erroneous or outlier values), and excluded any remaining missing data. No additional gap-filling or smoothing was applied, so all analyses use only the quality-screened observed data.
Table 1.
Summary of datasets used in this study.
- Satellite Aerosol Data: We used the MODIS Terra/Aqua Level-3 AOD product (MOD08_M3), which combines the Dark Target and Deep Blue retrieval algorithms. This combined product has a reported root-mean-square error (RMSE) of ~0.13–0.17 against AERONET sun-photometer observations, indicating reasonably good accuracy for aerosol monitoring. Importantly, MODIS AOD is a total-column, integrated optical measure and does not uniquely determine aerosol composition or source; therefore, any aerosol-type interpretations in this study are indirect and should be considered qualitative and further tested using aerosol-type proxies in future work. More details of the MODIS aerosol algorithm and its validation can be found in Levy et al. (2018), Huang et al. (2019), and Kim et al. (2024) [33,34,35].
- Vegetation Productivity Data: NPP was obtained from the MODIS NPP product (MOD17A2H), which is based on a light-use efficiency model. This product has been validated across biomes and provides reliable estimates of terrestrial primary production. For instance, Running et al. (2004) demonstrated good performance of MODIS NPP when compared with ground measurements across diverse ecosystems [14].
- Radiation and Cloud Data: We derived surface PAR (photosynthetically active radiation) from the CERES (Clouds and the Earth’s Radiant Energy System) SYN1deg product. The CERES SYN1deg data are generated through radiative transfer modeling and exhibit a very small bias (<3 W·m−2) compared to ground observations [36]. We calculated cloud albedo (unitless fraction) from ERA5 reanalysis radiation fluxes using the standard formula (Equation (1)):where α is cloud albedo, rsut is the top-of-atmosphere reflected shortwave radiation, and rsdt is the top-of-atmosphere incoming shortwave radiation. This ratio gives an estimate of the fraction of sunlight reflected by clouds (and atmosphere) back to space. We note that ERA5 assimilates extensive observational datasets and has been shown to reliably capture cloud and radiation parameters, making it highly suitable for cloud–radiation studies.
- Climate and Land Cover Data: We obtained near-surface air temperature data, focusing on monthly maximum daily temperature (Tmax), from the CRU TS (Climatic Research Unit Time-Series) dataset v4.05 [37,38,39,40,41], which provides observation-based monthly climate fields on a 0.5° × 0.5° land grid [42]. We selected Tmax because it better represents upper-end thermal stress on vegetation productivity than mean temperature: high daytime temperatures can directly suppress canopy photosynthesis and are frequently associated with increased atmospheric dryness (higher VPD), which promotes stomatal closure and reduces carbon uptake [43]. Land cover information was derived from the MODIS Land Cover Type product (MCD12Q1), which enabled us to distinguish and mask different vegetation types, allowing us to focus our analysis on the target ecosystems in each region.
All datasets were co-registered and aligned to ensure a consistent spatial grid. Monthly values were aggregated to annual means for interannual trend analysis. Before analysis, we applied strict quality flags (e.g., retaining only high-quality MODIS retrievals) and removed obviously erroneous values. Any residual missing data (e.g., from cloud cover or retrieval gaps) were interpolated using surrounding pixels and time steps to produce gap-free time series suitable for analysis.
2.3. Analytical Methods
To systematically investigate the relationships and underlying mechanisms between AOD and NPP, we employed a combination of statistical analyses, including trend analysis, correlation analysis, linear regression, and SEM, as outlined below.
2.3.1. Trend Analysis
We quantified interannual trends in key variables (AOD, NPP, etc.) over 2013–2023 using ordinary least-squares linear regression. The trend slope (β1) was estimated using Equation (2):
where denotes time (year), is the annual mean of the variable of interest, and are the mean year and mean value, respectively. The sign and magnitude of β1 indicate the direction and rate of change. We assessed the statistical significance of trends using an F-test on the regression (p < 0.05).
2.3.2. Correlation and Regression Analysis
We evaluated the strength of linear relationships between variables (e.g., AOD vs. NPP, AOD vs. PAR) using Pearson’s correlation coefficient (r) (Equation (3)):
where and are the observed values (e.g., AOD and NPP), and and are their multi-year means. To test whether a correlation was significantly different from zero, we used a t-statistic (Equation (4)):
with n − 2 degrees of freedom. We considered correlations significant at p < 0.05 (|t| above the critical value). In addition, we performed simple linear regressions (Equation (5)) to characterize the functional relationship between AOD and NPP (or PAR) when needed:
where y is the dependent variable (e.g., NPP or PAR), x is the independent variable (AOD), a is the intercept, and b is the regression slope (coefficient). Regression results (slope b and R2) were reported, along with the corresponding significance levels.
2.3.3. Structural Equation Modeling (SEM)
To disentangle the complex direct and indirect pathways through which AOD influences NPP via radiative and climatic factors, we developed a structural equation model for each region (A, B, C). SEM is a multivariate statistical approach that simultaneously tests hypothesized causal relationships among multiple variables, making it well-suited for examining mediation effects in environmental systems. In our SEM design, AOD was treated as an exogenous (driver) variable. We included PAR, mean maximum temperature (Tmax), and cloud albedo as mediator variables that can carry the influence of AOD to NPP. NPP was set as the ultimate endogenous (response) variable. We calibrated the SEM for each region using the observed data (annual mean values) from multiple spatial samples. Combining data from several representative points over 11 years yielded N > 250 observations per region, ensuring robust parameter estimates. We obtained standardized path coefficients for each link (e.g., AOD → PAR, AOD → cloud albedo, cloud albedo → Tmax, Tmax → NPP, etc.). These path coefficients quantify the strength of direct and indirect effects. The overall model fit was evaluated using multiple indices, including the comparative fit index (CFI), the goodness-of-fit index (GFI), and the chi-square/degrees of freedom ratio (χ2/df). We considered CFI and GFI values greater than 0.9, along with χ2/df ratios of ~1–3, to indicate an acceptable fit. Where the initial model showed poor fit, we examined modification indices and theory to identify missing pathways (or missing variables) and made cautious adjustments. The final SEM results were then interpreted to infer the dominant pathways of AOD’s influence on NPP in each ecological region.
3. Results and Discussion
3.1. Spatiotemporal Patterns of NPP
3.1.1. Interannual Trends of NPP
Based on MODIS NPP data (2013–2023), Africa shows pronounced spatial heterogeneity in productivity (Figure 2). Regions of high annual NPP (generally > 1.0 kg C m−2 yr−1) are primarily located in the equatorial belt—notably the Congo Basin rainforest (Region A), the coastal areas of the Gulf of Guinea in West Africa, and parts of the humid East African highlands. Moderate NPP values (0.6–0.8 kg C m−2 yr−1) are widespread across the tropical savanna zone (Region B). In comparison, low NPP areas (<0.5 kg C m−2 yr−1) correspond to the hyper-arid Sahara Desert, the Sahel, and the drylands of southern Africa. This spatial pattern aligns closely with the distribution of precipitation across Africa, underscoring the fundamental role of moisture availability in controlling ecosystem productivity [44,45,46]. Previous studies also indicate that rainfall is the dominant driver of NPP gradients on the continent.
Figure 2.
Spatial distribution of annual mean NPP across Africa (2013–2023). For visualization, the color bar is fixed to 0–2.6 kg C m−2 for all annual NPP panels. Higher productivity (yellow–red) is concentrated near the equator (rainforests and moist savannas), while lower productivity (green) occurs in the Sahara, Sahel, and parts of southwestern Africa.
In terms of interannual variability, none of the three focus regions exhibited a significant long-term trend in NPP over 2013–2023 (the linear trends in Regions A, B, and C were all statistically insignificant at p > 0.05; see Figure 3 and Table A1). However, the variability differs depending on the metric used. The error bars in Figure 3 (±1 SD) represent the within-year spatial variability of NPP across all valid pixels within each region. This spatial dispersion is consistently the largest in the tropical savanna (Region B) throughout the study period (Table A1). In contrast, interannual variability, quantified by the year-to-year fluctuations in the regional mean NPP (blue circles) from 2013 to 2023, is most significant in the semi-arid South African plateau (Region C), followed by Region B, with Region A showing the smallest interannual variability (C > B > A based on the SD of annual means). Region A (the humid Congo Basin rainforest, including associated wetlands) remains the most stable system in terms of mean NPP levels and limited year-to-year fluctuations. Region C shows larger interannual swings at a lower mean NPP level, reflecting the overall lower productivity of semi-deserts. These differences suggest that the sensitivity of NPP to interannual climate anomalies varies by ecosystem: the savanna’s high variability likely reflects strong dependence on interannual rainfall variability (e.g., ENSO-driven wet vs. dry years), whereas the rainforest’s buffering capacity (ample and fairly consistent rainfall) yields more stable NPP. The semi-desert’s low NPP and moderate variability indicate chronic water limitation, with occasional growth pulses in unusually wet years. We acknowledge that these qualitative linkages (e.g., savanna NPP variability tied to rainfall) should be further quantified using climate data in future analyses [47,48].
Figure 3.
Interannual variation in NPP in the three ecological regions of Africa from 2013 to 2023: (A) Congo Basin rainforest (Region A), (B) tropical savanna (Region B), and (C) South African plateau semi-desert (Region C). Blue circles denote the mean values for each year, and error bars represent ± 1 SD (standard deviation) across all valid pixels within each region for that year. The red line indicates the linear trend; the associated p-value is shown, and “n.s.” denotes p ≥ 0.05.
3.1.2. Seasonal Dynamics of NPP
The seasonal dynamics of NPP reveal distinct patterns across latitudes and ecosystems (Figure 4). Overall, Africa exhibits a clear latitudinal zonation in seasonal productivity. A box-plot analysis (Figure 5, see also Table A2) shows that in Region A, the median NPP remains relatively high (≈0.3–0.5 kg C m−2 per season) and consistent across seasons. The interquartile ranges (“boxes”) are compact, indicating stable productivity with minimal seasonal fluctuation. This stability reflects the buffering effect of the evergreen rainforest under year-round humid warm conditions. Essentially, abundant rainfall and dense canopy cover result in a continuously productive system with reduced sensitivity to seasonal climate fluctuations [49,50].
Figure 4.
Seasonal spatial patterns of NPP in Africa (2013–2023). Panels show NPP (kg C m−2 per season) for MAM (March–May), JJA (June–August), SON (September–November), and DJF (December–February). For visualization, the color bar is fixed to 0–0.9 kg C m−2 for all seasonal NPP panels. The intensity and spatial extent of greenness fluctuate in response to the migration of the Intertropical Convergence Zone and regional rainy seasons.
Figure 5.
Seasonal NPP distribution (box plots) for the three study regions: (A) Congo Basin rainforest, (B) tropical savanna, and (C) South African plateau semi-desert. In each box plot, the box represents the interquartile range of seasonal NPP values (2013–2023), the line within the box indicates the median, and whiskers extend to the 5th and 95th percentiles. Region A exhibits consistently high and less variable NPP in all seasons, Region B shows a pronounced peak in JJA (and lowest in DJF), and Region C has a peak in the wet season (DJF-MAM) and low values in the dry season.
Region B (tropical savanna) exhibits a strong unimodal seasonal pattern in NPP. Production peaks in JJA (the main wet/growing season), declines in SON as rains taper off, remains moderate in the minor wet season of MAM, and reaches its lowest in DJF (dry season). Notably, some southern savanna areas (just south of the Congo rainforest) achieve particularly high NPP in MAM, likely due to ample soil moisture carryover from the rainy season combined with favorable light and temperature conditions [51,52,53]. Overall, the savanna’s seasonal NPP corresponds closely to the rainfall cycle–vegetation “greens up” and fixes carbon primarily when water is available (JJA), then senesces or slows during dry months.
Region C (semi-arid plateau) is likewise governed by water availability, with NPP significantly higher during the rainy season (approximately December to May for Southern Africa) and much lower during the dry season (Figure 4). The eastern coastal fringe of South Africa, however, maintains relatively higher NPP through most of the year, with the largest seasonal amplitude observed there. This coastal zone benefits from orographic rainfall and moisture from the Indian Ocean, coupled with milder temperatures, resulting in denser vegetation that can sustain productivity longer into the dry season [54,55,56]. Inland areas of Region C, by contrast, show a sharper drop in NPP once rains cease.
3.2. Spatiotemporal Patterns of AOD
3.2.1. Interannual Trends of AOD
Africa’s aerosol loading (as represented by AOD) also shows distinct spatial heterogeneity (Figure 6). The highest annual mean AOD values (>0.4) during 2013–2023 occurred over parts of the northern tropical zone, notably the Congo Basin region (Region A), extending northwest through the western Sahel, and along the northern Gulf of Guinea coast. Moderate AOD values (0.2–0.4) spread across the Sahel belt and much of the tropical savanna region (Region B). In contrast, Region C (southern semi-desert and most of South Africa) consistently had low AOD (<0.1). This spatial AOD pattern corresponds to known aerosol source areas: high AOD centers coincide with regions of intense biomass burning (e.g., Central Africa, West African fires) and major dust sources (the Sahel-Sahara interface), whereas areas with little biomass burning or dust transport (e.g., the wet equatorial forests and far south) have much lower aerosol loads [57,58,59].
Figure 6.
Spatial distribution of annual mean AOD across Africa (2013–2023). High-aerosol zones (red–orange) are observed in the Congo Basin and parts of the Sahel, corresponding to regions of biomass-burning smoke and dust outflow. Low-AOD areas (blue) cover the Southern African interior and the Atlantic coastal zones.
Analysis of interannual AOD variation (Figure 7; Table A3) reveals differing trends across the regions. Region C exhibited a slight increasing trend in AOD (+0.0013 per year), which was not statistically significant (p = 0.142). Regions A and B both showed decreasing AOD trends: Region A’s trend (−0.0068 per year) was moderately strong and statistically significant (p = 0.037), whereas Region B’s trend (−0.0018 per year) was weak and not significant (p = 0.407). The considerable decline in AOD in Region A (Congo Basin) is consistent with reported reductions in biomass-burning emissions in the region over the last decade [58,59]. In line with this, the Global Fire Emissions Database (GFED) [59,60] shows a downward trend in fire activity in the Congo Basin in recent years. While these co-occurring decreases suggest a potential linkage, the drivers of the AOD decline cannot be determined solely from correlation analysis, and factors such as changes in fire regimes and land-management practices after 2015 may have contributed. By contrast, the insignificant AOD trends in the savanna and southern regions suggest relatively stable aerosol emissions or compensating changes (e.g., possibly slight increases in dust vs. decreases in smoke). Overall, the interannual AOD changes indicate a notable improvement in air quality (lower AOD) in the Congo region, which may be attributed to human interventions [61,62,63], whereas no clear long-term trend is evident in the savanna and arid regions.
Figure 7.
Interannual AOD trends in the different ecological regions (2013–2023): (A) Congo Basin rainforest (Region A), (B) tropical savanna (Region B), and (C) South African plateau semi-desert (Region C). Blue circles denote the mean values for each year, and error bars represent ± 1 SD (standard deviation) across all valid pixels within each region for that year. The red line indicates the linear trend; the associated p-value is shown, where * denotes p < 0.05 and “n.s.” denotes p ≥ 0.05. AOD in Region A shows a significant declining trend (p < 0.05), suggestive of reduced biomass burning, whereas trends in Regions B and C are slight and not significant.
3.2.2. Seasonal Dynamics of AOD
AOD in Africa exhibits marked seasonal variations driven by meteorological cycles and human activities (Figure 8; Table A4 and Table A5). At the continental scale, mean AOD tends to be higher during boreal spring and summer (MAM and JJA) and lower during the late autumn and winter (SON and DJF). This is partly due to the timing of dust uplift (which peaks in the late spring/summer with intense surface heating and monsoon winds) and biomass burning (which in the northern hemisphere peaks in DJF but in the southern hemisphere peaks in JJA, creating a combined spring-summer maximum in the aggregated data).
Figure 8.
Seasonal spatial patterns of AOD in Africa (2013–2023). Panels correspond to MAM, JJA, SON, and DJF. High AOD in JJA is evident over Central Africa and the Sahel, whereas lower AOD prevails in SON/DJF, especially in the Southern Hemisphere.
Among the regions, Region A (Congo Basin) shows the largest seasonal AOD amplitude. AOD peaks sharply in JJA (mean seasonal AOD ~0.69, Figure 9), coinciding with the dry season and active burning period in Central Africa. This JJA AOD in Region A is significantly higher than the AOD in other seasons. During DJF (the short wet season in the southern Congo Basin), AOD drops to much lower levels. Region B (savanna) also has a pronounced JJA AOD peak (mean ~0.32), reflecting the burning season in the southern savannas and dust transport from the Sahara during the northern summer. In the eastern part of Region B and the Sahel, the lowest AOD values are observed in DJF, after the wet season has suppressed dust and fires. Region C (semi-desert) has the most moderate seasonal AOD changes: overall low AOD year-round with a slight rise in SON (mean ~0.11) when occasional dust events from the Kalahari or neighboring regions may occur. Interestingly, we note a distinct AOD “hotspot” forming along the northern boundary of Region C in SON, likely indicating incursions of transported dust from further north during that time. Taken together, these seasonal patterns underscore that aerosol levels in Africa are strongly modulated by seasonal climate (rainfall and wind patterns) and seasonal human activities (agricultural burning cycles).
Figure 9.
Seasonal AOD distribution for the three regions (2013–2023). Box plots (similar format to Figure 5) show the range of seasonal mean AOD in Region A (Congo Basin), Region B (savanna), and Region C (semi-desert). Region A has a notably high median AOD in JJA due to biomass burning, Region B shows a JJA peak and a DJF low, and Region C has generally low AOD with a slight SON rise.
3.3. Interannual Correlation Analysis
3.3.1. AOD–NPP Interannual Correlations
Examining the interannual correlations between AOD and NPP provides insight into how aerosols and vegetation productivity covary across Africa’s landscapes. Figure 10 shows the spatial distribution of Pearson correlation coefficients, and Figure 11 categorizes them by statistical significance (p < 0.05). Overall, the AOD–NPP relationship is highly heterogeneous, with both negative and positive correlations observed across regions and even changing sign over time in some areas.
Figure 10.
Spatial distribution of Pearson correlation coefficients between AOD and NPP (panels (a–c)) and between AOD and PAR (panels (d–f)) over Africa. Panels (a,d) correspond to 2013–2018, (b,e) to 2018–2023, and (c,f) to the full period 2013–2023. Blue hues indicate positive correlations and red hues indicate negative correlations. The statistical significance (p < 0.05) is presented in Figure 11 (for AOD-NPP) and Figure 12 (for AOD-PAR), where it is categorized. These maps illustrate how AOD–NPP correlations vary regionally and how some areas changed the sign or strength of their correlation between the first and second halves of the decade.
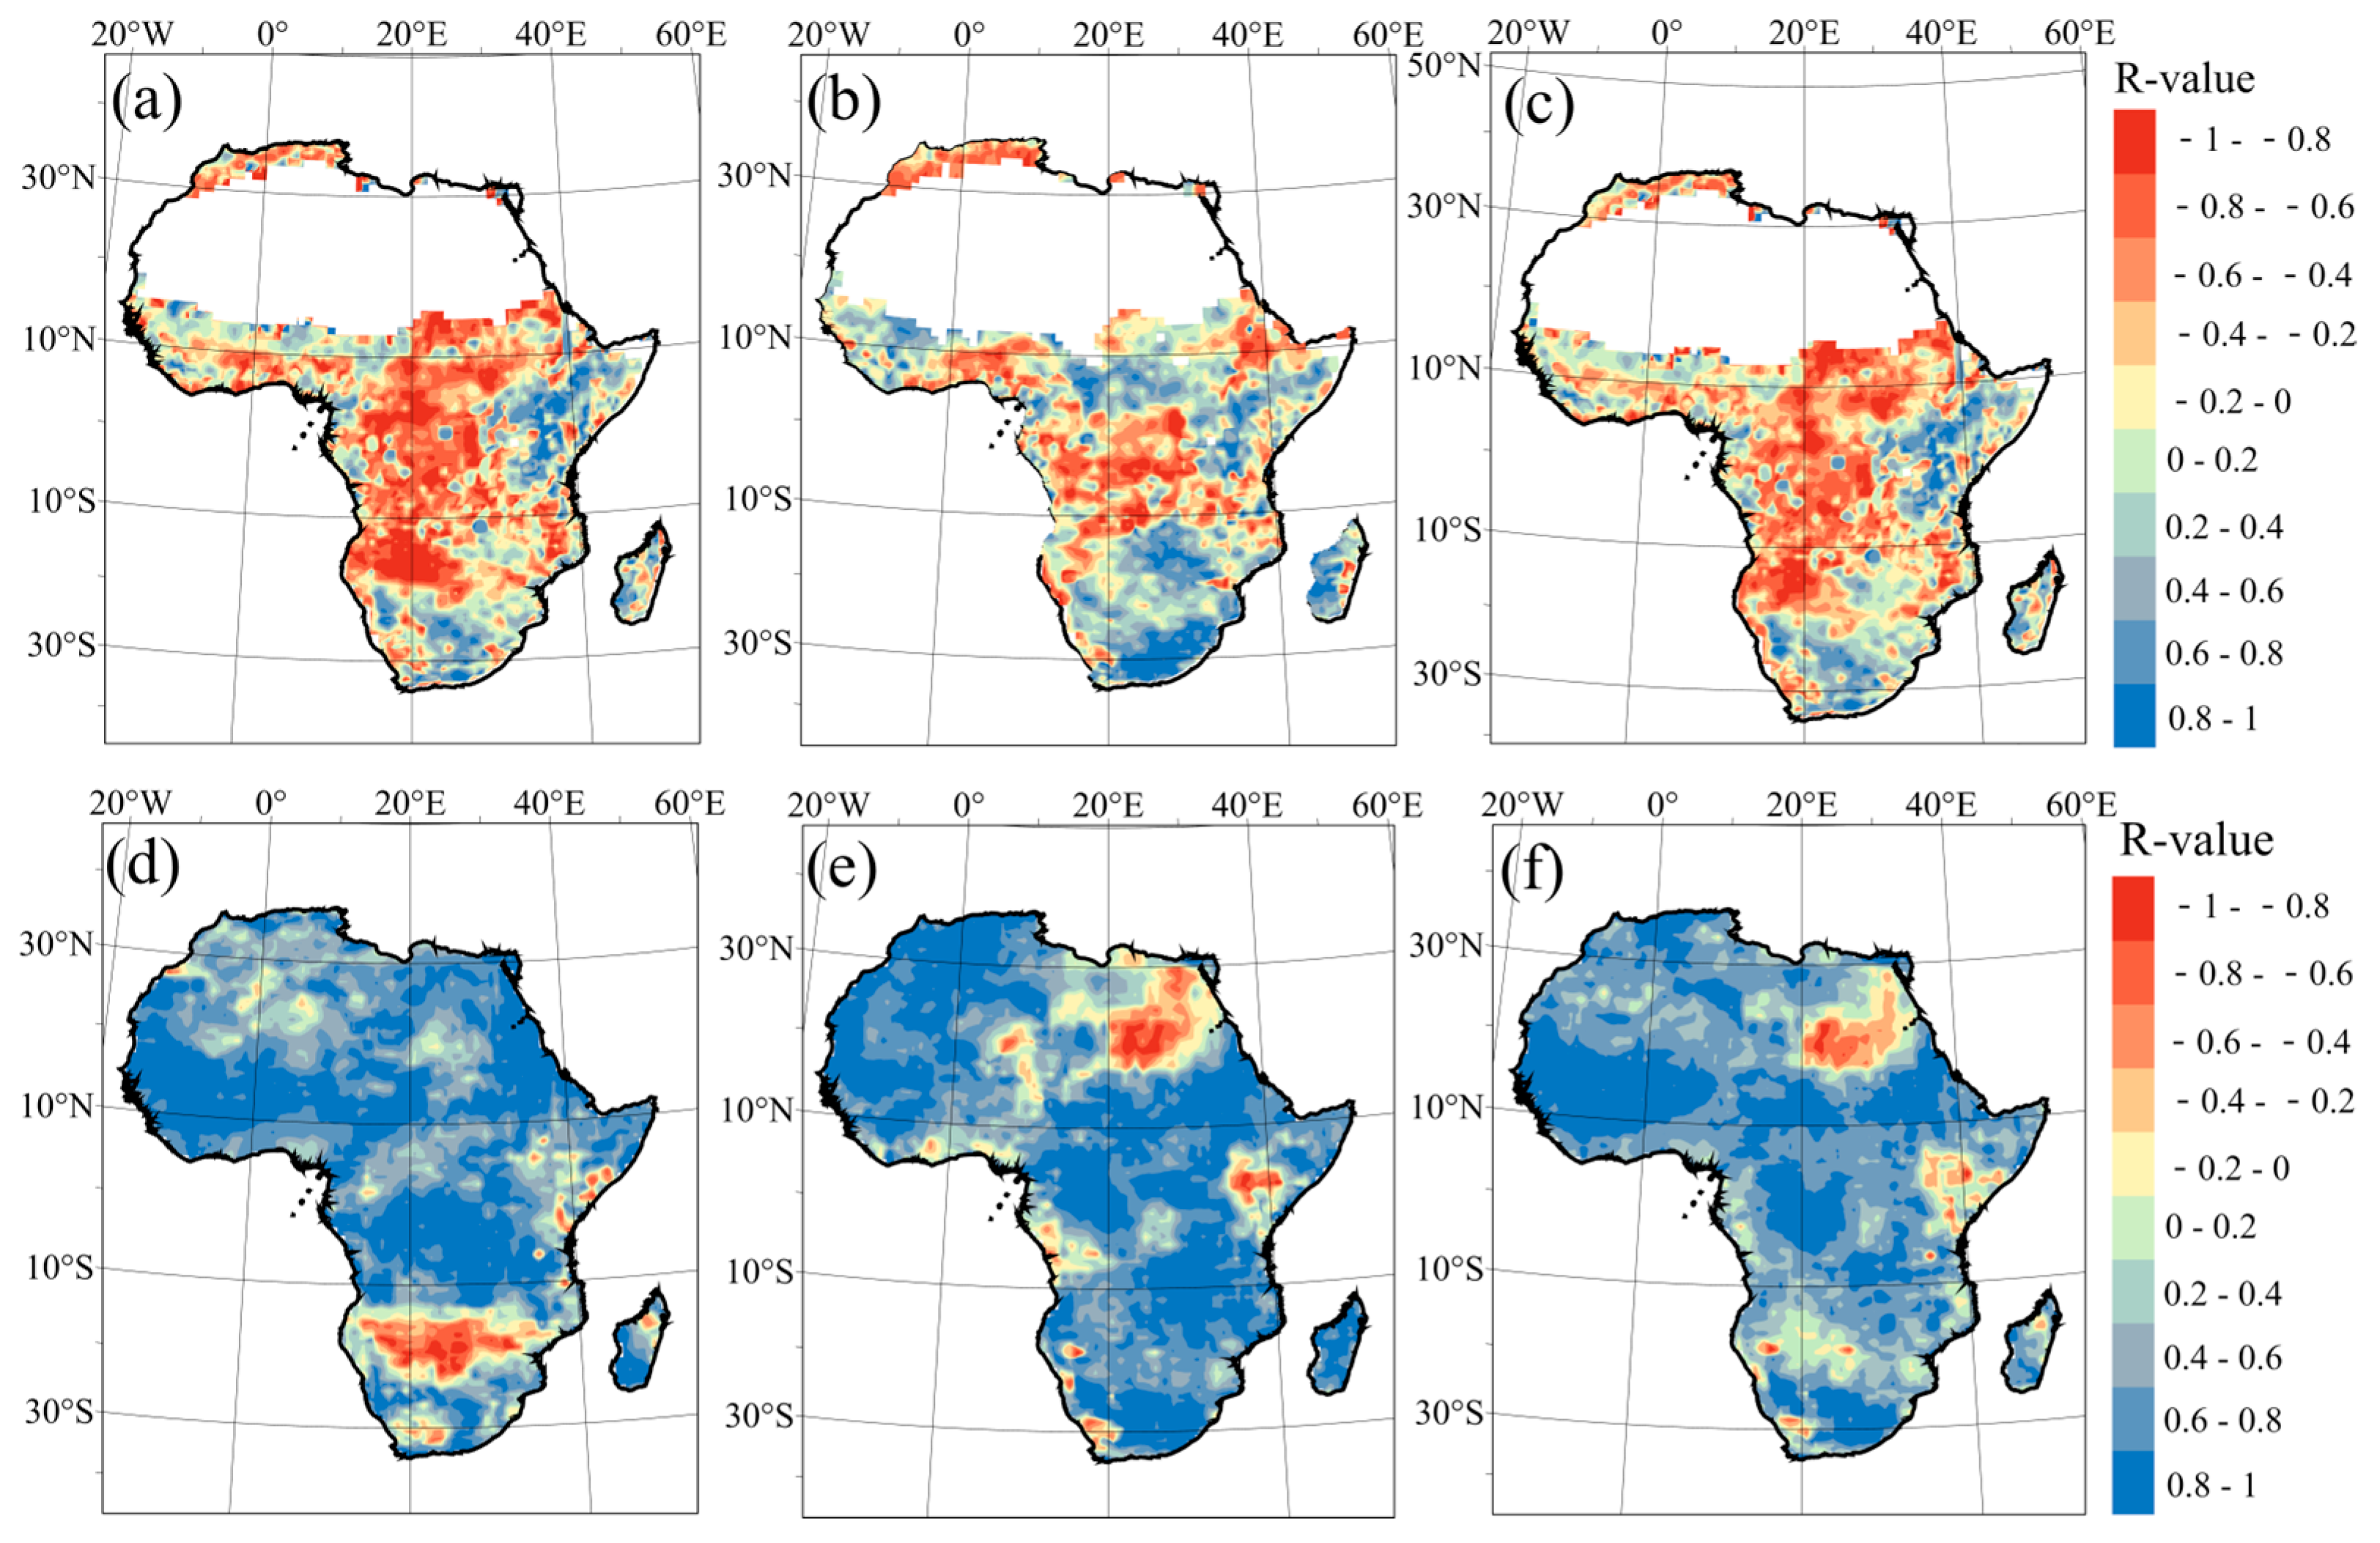
Figure 11.
Spatiotemporal distribution of AOD–NPP correlation categories across Africa, highlighting shifts between sub-periods. (a) 2013–2018, (b) 2018–2023, (c) 2013–2023. The categories are: N* = significant positive correlation; N = non-significant positive correlation; P* = significant negative correlation; P = non-significant negative correlation (significance at p < 0.05). The significance level was evaluated using a two-sided t-test.
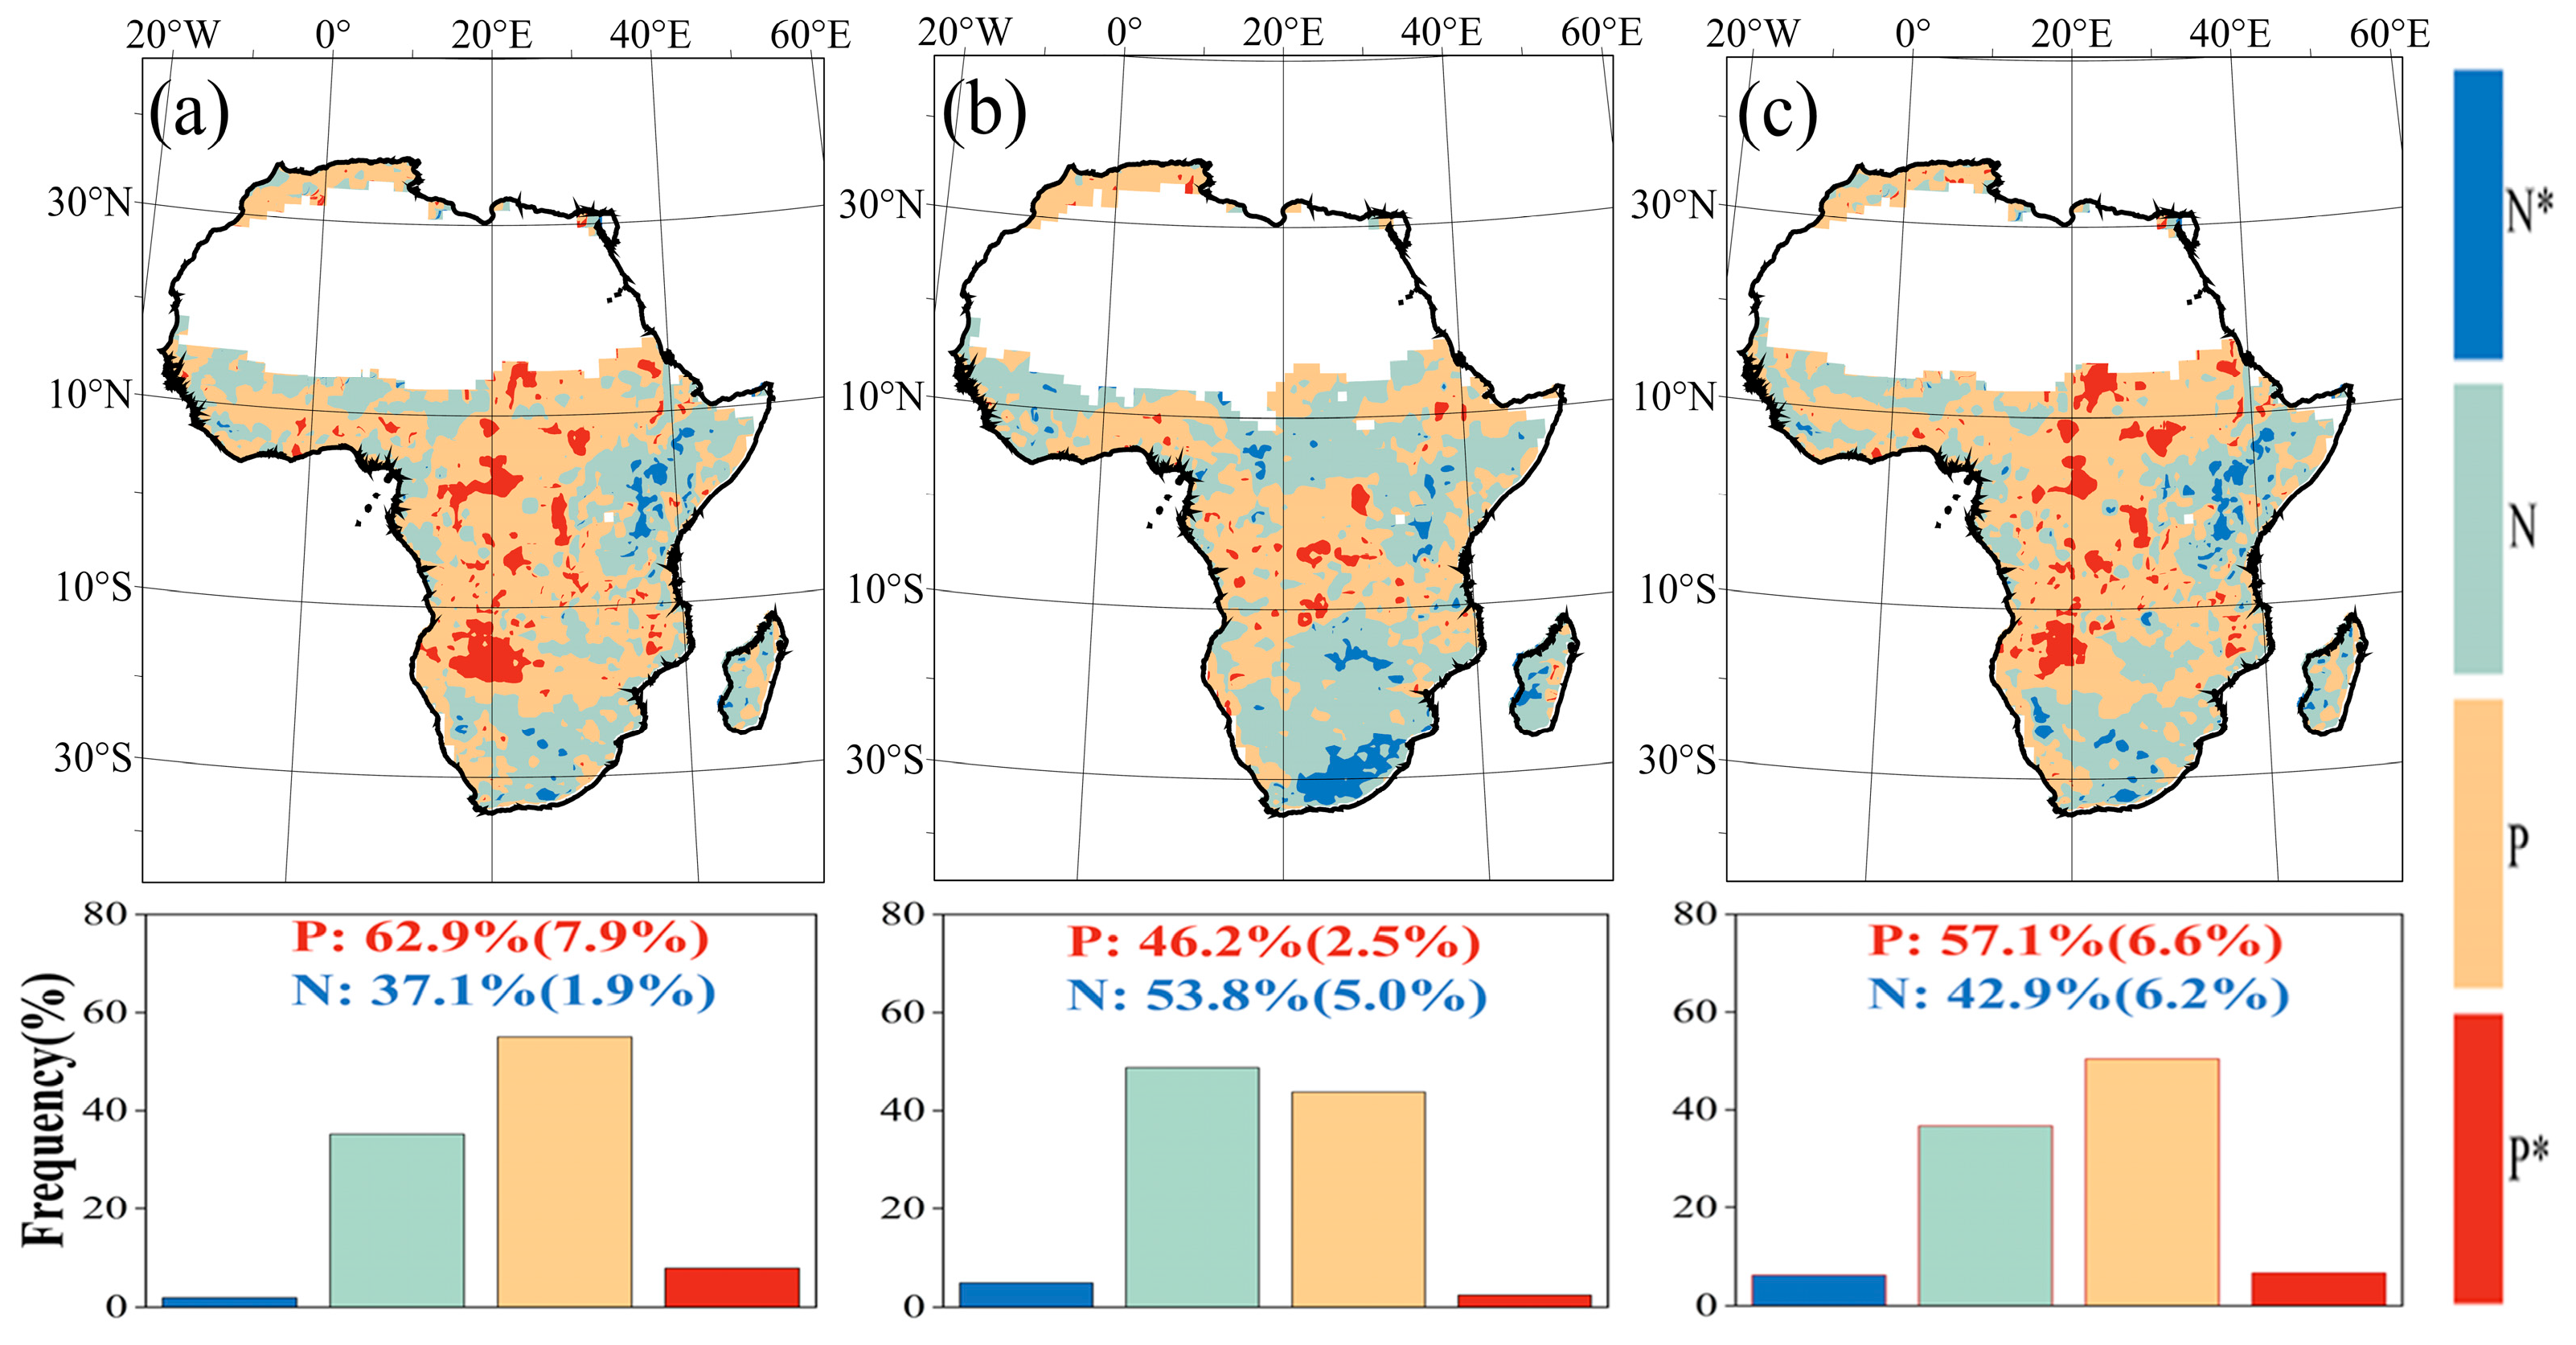
Figure 12.
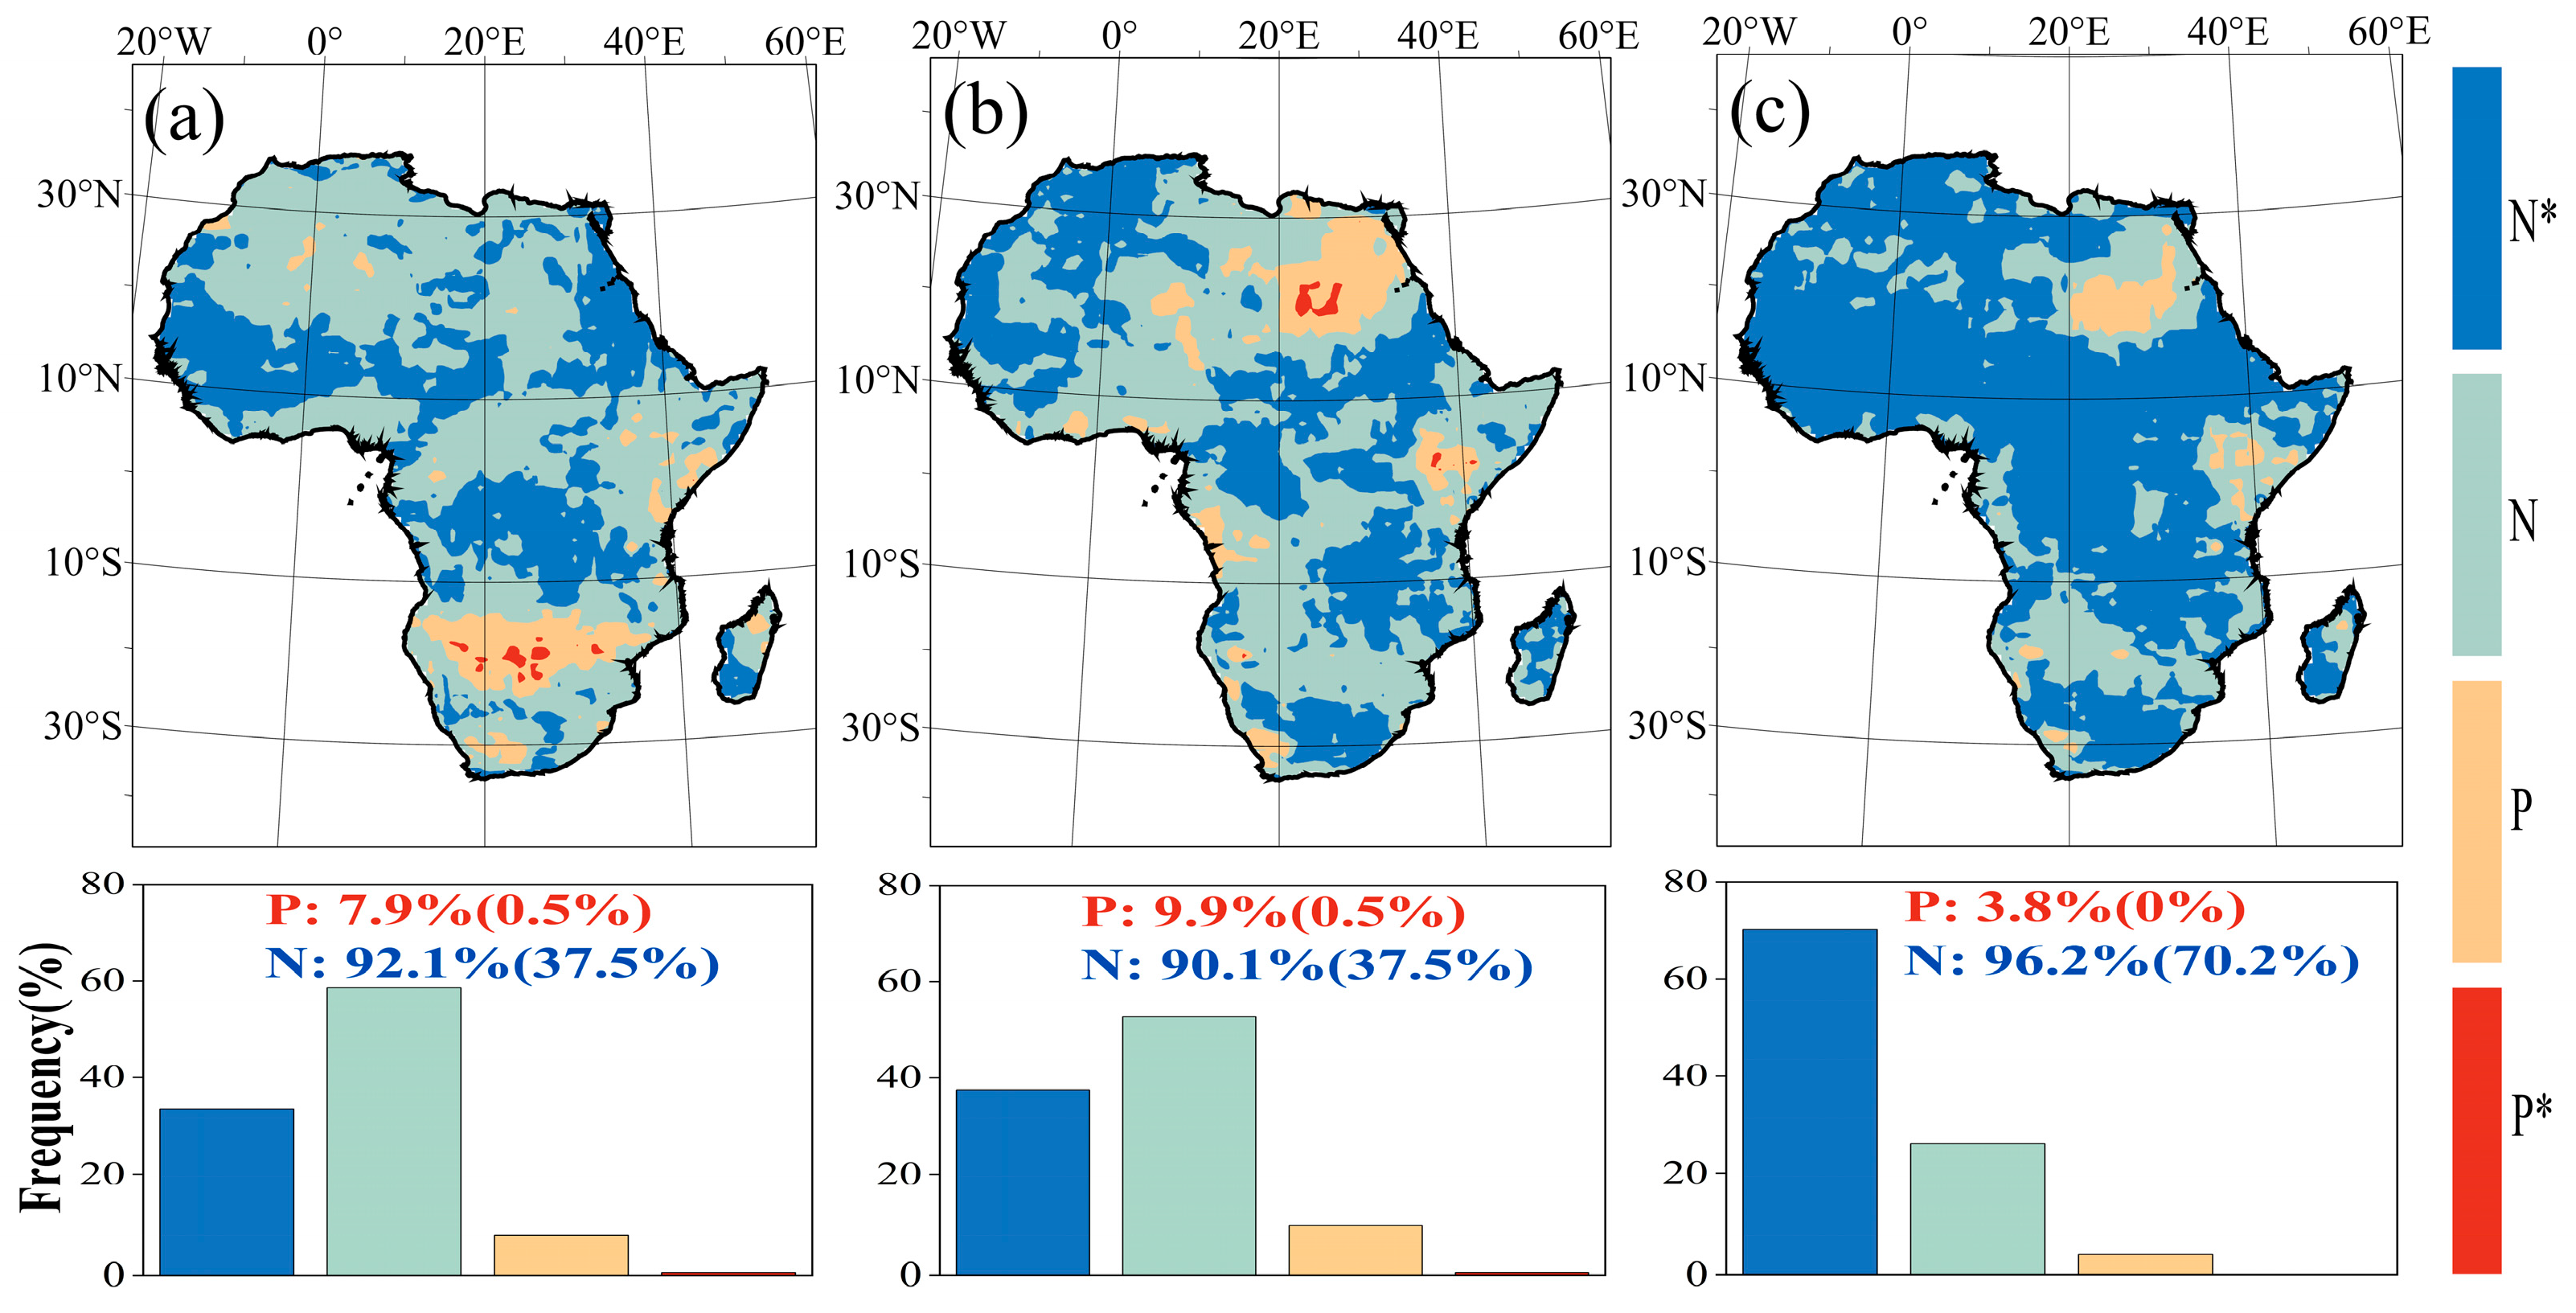
Spatiotemporal distribution of AOD–PAR correlation categories across Africa: (a) 2013–2018, (b) 2018–2023, (c) 2013–2023 (N*: significant positive correlation; N: non-significant positive correlation; P*: significant negative correlation; P: non-significant negative correlation; significance level p < 0.05). The significance level was evaluated using a two-sided t-test.
In the hyper-arid Sahara Desert and the driest parts of the Sahel, NPP is extremely low or essentially zero (no vegetation), so AOD–NPP correlations are not meaningful for most of that expanse. Moving to the slightly wetter Sahelian margins (e.g., the southern fringe of the Sahara), Figure 11 shows that persistent correlations in both sub-periods are predominantly non-significant and positive (category ‘N’). This indicates that the often hypothesized strong negative impact of dust aerosols on vegetation is not statistically evident in our large-scale, interannual analysis for this transitional zone. The weak positive association could reflect complex and offsetting effects, such as between dust’s potential to provide nutrient subsidies (leading to a weak positive signal) and its negative impacts through shading or leaf deposition (which would suppress the signal). Alternatively, it may simply underscore the lack of a stable, statistically robust relationship in this highly variable environment. As Figure 11 confirms, any statistically significant correlations (‘P*’ or ‘N*’) in the broader region are confined to only a few, very localized areas.
In the central Congo Basin rainforest (Region A), we also found extensive areas of negative AOD–NPP correlation (a mix of ‘P*’ (significant) and ‘P’ (non-significant) in Figure 11). This indicates that years with higher aerosol loading tend to coincide with years of lower NPP in the core rainforest. Interestingly, in parts of the Congo Basin, the AOD–NPP correlation appears to have flipped sign between the first half and second half of the study period: areas that were predominantly ‘P’ (non-significant negative) through 2018 became ‘N’ (non-significant positive) by 2018–2023 (Figure 11). One possible interpretation is a shift in aerosol composition or environmental conditions [64,65,66].
For instance, if there was increased input of dust aerosols into the rainforest in later years (as might happen during episodes of long-range Saharan dust transport or increased burning in surrounding savannas), those dust aerosols might introduce nutrient subsidies or alter the radiation regime differently than smoke, potentially leading to a less negative or even positive association with NPP. However, alternative explanations, such as coincident changes in climate drivers (e.g., precipitation patterns), cannot be ruled out solely on the basis of correlation analysis.
Southern Africa shows a striking land–sea contrast in AOD–NPP correlations. Along the southern African coast (especially the southeast coast), we observe predominantly positive AOD–NPP correlations, which are primarily classified as ‘N’ (non-significant positive) in Figure 11 and which have expanded in extent from 2013–2018 to 2018–2023. This means that in these coastal zones, the observed positive association between aerosols and NPP is not statistically robust over much of the area. These aerosols are likely a mix of maritime particles and smoke from coastal fires [67,68], and their non-significant positive correlation with NPP could hint at processes such as diffuse radiation fertilization or nutrient deposition [65,69,70]. However, the lack of significance precludes firm conclusions. In contrast, statistically significant positive correlations (‘N*’) are clearly observed over inland plateaus such as the Bié and Lunda Plateaus (Figure 11), suggesting a more robust aerosol-related enhancement of productivity in these elevated regions. The more arid inland areas of southern Africa (such as the Kalahari region) maintained stable negative AOD–NPP correlations across time (largely ‘P’ (non-significant negative) in Figure 11), creating a complex spatial pattern. The inland non-significant negative correlation may align with a picture of aerosols (dust/smoke) exacerbating water stress or shading light in already water-limited systems.
West Africa, in our analysis, showed largely negative AOD–NPP correlations (mostly ‘P’, non-significant in Figure 11), but with considerable spatial variability. Some sub-regions saw these correlations weaken or strengthen over time. This likely reflects the complex mix of aerosol sources and the variable climate conditions in West Africa. Given the lack of statistical significance, these patterns should be interpreted as suggestive rather than conclusive.
The East African highlands (e.g., the Ethiopia and Kenya highlands) generally exhibited positive AOD–NPP correlations, and the area classified as ‘N*’ (significant positive) expanded in the latter half of the study period (Figure 11a vs. Figure 11b). This region receives intermittent dust from Arabian/Sudanese sources and experiences biomass burning. The significant positive correlation in these ‘N*’ areas could be due to nutrient input from dust—an example of an “iron fertilization effect” that aids plant growth.
In summary, the spatial differentiation in interannual AOD–NPP correlations reveals the complexity of aerosol–ecosystem interactions [3,71,72]. Our analysis, guided by the significance categories in Figure 11, shows that statistically robust relationships (‘N*’, ‘P*’) are concentrated in specific regions (e.g., parts of the Congo Basin, East African highlands, and the Angolan/Bié Plateau), while large areas exhibit non-significant or unstable correlations. This underscores that the net effect of aerosols on vegetation is context-dependent, varying across Africa’s biomes. It is important to acknowledge two key limitations inherent in this correlative approach: First, correlation does not imply causation; the identified associations may be influenced by unmeasured confounding variables (e.g., coincident variations in precipitation, temperature extremes, or fire regimes) [73,74]. Second, the ecological interpretation of spatially fragmented or weak correlations is challenging. While they may hint at underlying processes, they do not provide conclusive evidence. The subsequent SEM analysis (Section 3.5) is employed to move beyond correlation and begin disentangling potential causal pathways within a multivariate framework, acknowledging these initial limitations.
3.3.2. AOD–PAR Interannual Correlations
To better understand the aerosol–radiation interactions underlying the NPP responses, we also analyzed correlations between AOD and surface PAR. These correlations (Figure 10d–f and Figure 12) also show significant spatial and temporal dynamics.
During 2013–2018, the AOD–PAR correlation pattern exhibited a clear spatial structure, with negative correlations predominating in the northern Sahara–Sahel belt (mostly ‘P’, non-significant negative, in Figure 12a), as well as in parts of East Africa and in localized areas in the south. However, significant negative correlations (‘P*’) were relatively few in the south. In contrast, significantly positive AOD–PAR correlations (‘N*’) were observed in the Congo Basin and West African coastal rainforests, as well as in parts of the North and East African coasts (Figure 12a). These significant positive correlations demonstrate a statistical association: higher aerosol loading corresponds to greater PAR at the surface in these regions.
Between 2018 and 2023, a notable shift occurred. Parts of southern Africa that previously exhibited non-significant negative (‘P’) AOD–PAR correlations showed a transition to positive correlations (some becoming ‘N*’ (significant) in Figure 12b). Conversely, some northern regions that were previously weakly negative became more strongly negative, with additional areas reaching statistical significance (‘P*’). East Africa experienced an expansion of areas with negative AOD–PAR correlations, some of which became significant (‘P*’) where they were not previously. These temporal shifts in correlation patterns highlight the non-stationary nature of aerosol-radiation relationships, likely influenced by interannual climate variability or changes in aerosol regimes [75,76].
Over the whole period 2013–2023, the prevailing pattern is that positive AOD–PAR relationships cover most of Africa (especially central and southern regions), with ‘N*’ (significant positives) in many areas (Figure 12c). In contrast, negative correlations are confined to parts of North Africa and a few spots in East and South Africa (mostly ‘P’, non-significant, in Figure 12c).
Mechanistically, the observed positive AOD–PAR correlations (‘N*’) are consistent with established pathways in the literature where aerosols can enhance surface PAR. This could occur via aerosol–cloud interactions (e.g., the semi-direct effect, where absorbing aerosols may reduce cloud cover) or through the scattering of sunlight, which increases the diffuse fraction of PAR, which is known to penetrate plant canopies more efficiently. Our results provide large-scale observational support for the net prevalence of such radiation-enhancing effects across much of Africa over the study decade. However, this correlation-based analysis has inherent limitations. It cannot disentangle the relative contributions of direct aerosol scattering versus indirect cloud-mediated effects to the observed PAR changes. Furthermore, while the correlations are statistically significant, they do not prove direct causation, as unaccounted synoptic-scale meteorology (e.g., prevailing circulation patterns that simultaneously influence both aerosol transport and cloudiness) could contribute to the co-variability. These complexities underscore the value of complementary process-based modeling (such as our SEM analysis) for attributing causality.
In summary, interannual AOD–PAR analyses reinforce the notion that aerosols in Africa can sometimes increase surface radiation (predominantly diffuse) and sometimes decrease it, depending on context. The significant, positive correlations (‘N*’) across many areas (Figure 12) provide observational evidence for a widespread statistical association consistent with aerosol-induced radiation enhancement at the ecosystem scale. These findings align with results from other regions, where moderate aerosol loading has been shown to enhance plant productivity through diffuse radiation fertilization. Understanding where and when this occurs in Africa is crucial for disentangling the dual pathways of aerosol effects.
3.4. Seasonal Correlation Analysis
3.4.1. Seasonal AOD–NPP Correlation
We further examined AOD–NPP relationships on a seasonal basis within each region (Figure 13, Figure 14 and Figure 15) to see how the coupling might differ between wet and dry seasons. The results show pronounced seasonal dependencies across ecological regions, reinforcing the idea that aerosol impacts on vegetation are context-specific.
Figure 13.
Seasonal correlations between AOD and ecosystem variables in Region A (Congo Basin rainforest). Top row (green): AOD–NPP; bottom row (orange): AOD–PAR. Open circles represent seasonal data points, solid lines show the fitted linear regression, and the shaded bands indicate the 95% confidence interval (CI). Each sub-panel (or data series) represents one season (MAM, JJA, SON, DJF), showing the relationship between AOD and NPP (green markers/line) and between AOD and PAR (orange markers/line). The correlation is notably negative in MAM, JJA, SON, and strongly positive in DJF for AOD–NPP, while AOD–PAR is positive in MAM/DJF and weaker in JJA/SON, reflecting seasonal context (wet vs. dry season dynamics).
Figure 14.
Seasonal correlations between AOD and NPP/PAR in Region B (tropical savanna). Top row (green): AOD–NPP; bottom row (orange): AOD–PAR. Open circles represent seasonal data points, solid lines show the fitted linear regression, and the shaded bands indicate the 95% confidence interval (CI). Only MAM shows a substantial negative correlation between AOD and NPP, whereas in the other seasons the relationship is weak. AOD–PAR correlations in Region B are generally positive (especially in SON and DJF when skies are clearer), aligning with the idea that aerosols increase diffuse radiation in the dry seasons.
Figure 15.
Seasonal correlations between AOD and NPP/PAR in Region C (South African semi-desert). Top row (green): AOD–NPP; bottom row (orange): AOD–PAR. Open circles represent seasonal data points, solid lines show the fitted linear regression, and the shaded bands indicate the 95% confidence interval (CI). A strong positive correlation between AOD and NPP occurs in MAM, whereas weak or slightly negative correlations occur in the other seasons. AOD–PAR correlations are relatively strong and positive in MAM and JJA (when cloud cover is low) and weaken considerably in DJF, indicating that aerosols tend to enhance radiation in the sunnier seasons.
In Region A (Congo Basin rainforest), we found consistently negative AOD–NPP correlations during the wet seasons of MAM, JJA, and SON. During these seasons, higher aerosol loads (primarily smoke from regional biomass burning and some dust) are associated with slight decreases in NPP. This makes sense, as during the wet season the rainforest is already energy-limited by frequent cloud cover; adding aerosols likely further reduces light or alters rainfall patterns, marginally suppressing photosynthesis. In contrast, during the dry season (DJF) in Region A, we observed a strong positive correlation between AOD and NPP (R2 ≈ 0.70 for the linear fit). This suggests that during DJF (a relatively sunnier period with lower rainfall), moderate increases in aerosol concentrations might actually enhance NPP. One hypothesis is that during the dry season, when sunlight is more abundant but soils begin to dry, a slight aerosol cooling or nutrient deposition could alleviate heat and nutrient stress, respectively, thereby benefiting plants. We stress that we did not measure nutrient fluxes in this study, so this interpretation is speculative and would need to be validated with future data on nutrient deposition or detailed ecosystem modeling. Thus, Region A exhibits a seasonal sign reversal—from negative in wet seasons to positive in the dry season—which suggests dual aerosol effects in the rainforest: a suppressive net impact when the system is already light-saturated and cloudy, versus a net beneficial effect when the system is moisture-limited or heat-stressed (during the dry season). However, this explanation is inferred based on previous studies and indirect evidence, as we did not include direct nutrient measurements in this analysis. Future research incorporating nutrient data or more detailed ecological modeling is needed to validate this mechanism. Essentially, aerosols in Congo can be detrimental when they further reduce light during the already cloudy months but can be beneficial when they slightly cool the environment or fertilize soils during the hot, less cloudy months.
Region B (tropical savanna) also shows seasonal variability in the AOD–NPP relationship, but the pattern is different. In the wet season (main growing season, roughly JJA in northern savannas and DJF–MAM in southern savannas), correlations between AOD and NPP tend to be weakly negative or neutral, implying that when water is not limiting, aerosol effects on productivity are minor or slightly detrimental (likely via light attenuation or mild heating). However, in the late dry season (e.g., SON in southern savannas), we observed that higher AOD was associated with lower NPP (significant negative correlations in some areas). This suggests that aerosol effects exacerbate stress when soil moisture is depleted: increased aerosol loading during an already dry, hot period can intensify surface heating and water stress (via the aerosol semi-direct effect, which reduces clouds and increases insolation). It is important to note that we did not include precipitation or soil moisture in our analysis; thus, some of the temperature-related negative correlations in the savanna may actually reflect covarying drought stress. We explicitly acknowledge this in our interpretation: the negative Tmax–NPP pathway identified by SEM in Region B likely captures moisture stress effects, not just temperature alone. Overall, in Region B, aerosols during the growing season do not help much (water drives productivity then), but in the dry season, they appear to add to plant stress.
In Region C (South African semi-arid plateau), seasonal correlations are generally weak and inconsistent. This region’s NPP is so water-limited that aerosols play a minimal role relative to rainfall timing and amount. During the rainy season (DJF–MAM), we observed a mix of weakly positive and negative AOD–NPP correlations, none of which were spatially extensive or strongly significant. In the dry season, similar weak patterns persisted. The absence of a clear signal here reinforces the idea that water availability is the overwhelmingly dominant control in Region C. The SEM for Region C already indicated a poor fit, essentially diagnosing that missing hydrological variables undermine any mechanistic interpretation of aerosols. Therefore, we treat any seasonal correlation in Region C as speculative at best. We have framed Region C’s results as an illustrative limitation: the lack of a robust AOD–NPP relationship across seasons highlights that, without water, aerosol impacts are marginal and complicated to detect amid the noise. In practice, including rainfall or soil moisture would be necessary to draw any meaningful conclusions for semi-arid systems like Region C.
3.4.2. Seasonal AOD–PAR Correlation
Across the three regions, AOD and PAR were positively correlated in most seasons, though the strength of the correlation varied. In Region A, AOD–PAR correlations were very high in the drier seasons (MAM and DJF, R2 > 0.90, meaning aerosols substantially increased surface PAR in those seasons, likely by reducing cloud cover) but weakened in JJA (R2 ~ 0.33) when heavy cloud and rainfall dominate. This aligns with the idea that, in the heart of the rainy season (JJA in the Congo, north of the equator), aerosols have a lower radiative impact due to the already prevalent clouds. In Region B, the strongest positive AOD–PAR correlations were observed in SON and DJF (R2 > 0.90), which are the dry seasons with minimal cloud cover, allowing aerosol scattering to play a significant role. In contrast, during the wet season (JJA for the southern savanna, MAM for the northern savanna), with increased cloud cover, the aerosol effect on radiation was significantly smaller. Region C exhibited relatively strong positive AOD–PAR correlations in MAM and JJA (R2 > 0.75), but by DJF, the correlation had dropped (R2 ~ 0.29). This makes sense, as DJF is the main rainy season in semi-arid southern Africa. More clouds mean aerosols have less influence on surface radiation, and vegetation is also active, which might receive enough radiation regardless.
In summary, a strong positive relationship exists between AOD and PAR across most regions and seasons, indicating that aerosols generally increase the amount of usable light at the surface (directly or indirectly) under typical conditions. However, the magnitude of this effect is highly contingent on cloud cover and season. It is strongest in seasons with clear skies (dry seasons) and weaker in cloudy, wet seasons. This seasonal pattern provides further evidence for the diffuse-radiation fertilization effect: during dry, clear periods, aerosols scatter sunlight and boost diffuse PAR (resulting in a strong positive correlation), whereas during cloudy periods, aerosol effects are mitigated by clouds.
3.5. Causal Pathways: Structural Equation Modeling Results
To validate and integrate the above findings, we used SEM to explicitly quantify the causal pathways by which aerosols influence NPP in each region (Figure 16). Because the SEM is fitted to observational remote-sensing and reanalysis products (with spatial/temporal aggregation), the estimated paths should be interpreted as conditional associations under an assumed model structure rather than definitive causal effects. SEM directionality is specified a priori based on physical reasoning (aerosols → radiative/cloud/thermal variables → productivity), and alternative causal structures cannot be fully excluded. Aggregation over time and space may also blur short-term dynamics and introduce scale-dependent relationships. We therefore interpret the SEM pathways as plausible, physically consistent linkages that complement the correlation analyses, while acknowledging these limitations. The SEM results reveal distinct dominant pathways in the different ecosystems, as well as the limitations of our models in the most arid region.
Figure 16.
Structural equation model (SEM) results illustrating the causal pathways through which aerosols (linking AOD) affect vegetation productivity (to NPP) in each region: (A) Congo Basin rainforest, (B) tropical savanna, and (C) South African plateau semi-desert. Solid arrows indicate significant paths (p < 0.05), with arrow thickness representing positive associations, and dashed arrows indicate negative associations; line thickness is proportional to the standardized path coefficient. Blue arrows denote positive effects, and red arrows denote negative effects. Numbers next to arrows denote negative effects. For Regions A and B, the dominant pathways are highlighted with standardized coefficients (all shown are significant at p < 0.05, except the thin gray arrow in A, which is non-significant). In Region A, aerosols are associated with reduced cloud albedo (darker clouds), leading to a cooling/cloud-mediated path (AOD → ↑Cloud Albedo → ↓Temperature → ↓ (lower Tmax) and, under wet/high-cloud conditions, lower NPP). In Region B, a warming/drying path (AOD → ↑Temperature → ↓NPP, aerosols are associated with a secondary AOD → ↑higher PAR → ↑NPP) but also higher Tmax, with the strong temperature-related water stress effect offsetting radiation gains (net neutral effect on NPP). The model fit index values in Region C indicate suboptimal model performance, reflecting the dominant role of unmodeled rainfall impacts. For details on the model fit index, please refer to the main text.
In Region A (Congo Basin rainforest), the SEM achieved a good fit (χ2/df = 1.255, p = 0.263; GFI = 0.998; CFI = 0.999), indicating the model structure captured the relationships well. The path analysis for Region A showed that AOD was significantly negatively associated with cloud albedo (path coefficient = −0.58). In other words, higher aerosol levels tended to be associated with slightly darker (less reflective) clouds or reduced cloud brightness in this system—potentially indicating aerosol absorption effects reducing cloud reflectivity. Increased cloud albedo (whiter clouds or more cloud cover) in turn reduced Tmax (path coefficient = −0.46), consistent with the expectation that more cloudiness cools the surface. Finally, Tmax had a strong negative effect on NPP (−0.44), meaning lower Tmax was associated with lower NPP in Region A. In this humid rainforest, lower Tmax likely reflects cloudier, lower-energy conditions, under which photosynthesis can be constrained by reduced available energy/light. Together, these paths are consistent with a cooling-related pathway in which higher AOD covaries with cloud–temperature conditions associated with lower NPP. There was also a weak positive AOD → PAR effect (path = +0.22), reflecting some diffuse radiation enhancement, but this was not enough to overcome the cooling/cloud effect. Overall, the net AOD–NPP association in Region A is negative in the SEM, primarily mediated by the temperature-related path. We interpret this as a conditional association rather than a proven causal effect. In essence, despite the intuition that reducing heat stress might help, it appears that in this ecosystem, light limitation is more critical, so aerosol-induced cooling (with cloudiness) actually hinders growth. We note that the “cooler temperature → lower NPP” link here should be viewed in context: it likely reflects coupled cloud–light conditions (lower light availability on cooler, cloudier days) rather than a direct physiological harm from cooling.
In Region B (tropical savanna), the SEM fit was acceptable (χ2/df = 5.118, p = 0.006; GFI = 0.991; CFI = 0.989). The pathways here differed markedly from Region A. AOD was positively associated with both Tmax (path = +0.46) and PAR (path = +0.53) in the savanna. This pattern is consistent with higher aerosol levels coinciding with warmer, brighter conditions, potentially through changes in atmospheric radiative effects and cloudiness, although the observational SEM does not establish causality. In turn, Tmax showed a strong negative association with NPP (path = −0.74), reflecting that hotter conditions intensify water stress and impair plant productivity (a critical factor in savannas). Meanwhile, increased PAR had a modest positive effect on NPP (+0.20). However, because precipitation and soil moisture (or related moisture-stress metrics such as VPD) are not explicitly included, the Tmax–NPP path may partly capture covarying moisture stress rather than a purely temperature-driven effect. When these influences are combined, the large negative temperature effect and the smaller positive radiation effect approximately cancel each other out. Thus, the overall net association between AOD and NPP in the savanna was near-neutral (the SEM shows essentially no significant net direct effect of AOD on NPP). This explains why our earlier analyses showed weak overall correlations in most seasons—aerosols in savannas simultaneously help (by increasing light) and hurt (by increasing heat) the vegetation. We can describe this as a radiation-enhancement vs. thermal-suppression trade-off, which, under average conditions in Region B, largely canceled out. Minor differences in certain seasons (like the late dry season) might tilt this balance toward suppression, as we saw in the seasonal analysis.
In Region C (South African plateau semi-desert), the SEM did not fit the data well (χ2/df = 58.124, p < 0.001). This suggests our model—which included only AOD, PAR, Tmax, cloud albedo→NPP—failed to capture the key drivers of NPP in this extremely water-limited system. Indeed, in semi-deserts, soil moisture and precipitation are the dominant determinants of NPP, and our SEM omitted those. The poor fit likely arises because NPP variability in this system is primarily controlled by hydrological constraints (precipitation and soil moisture), which are not included in the current SEM. In contrast, aerosol/radiation/temperature effects are secondary. Therefore, we treat the Region C SEM primarily as a diagnostic result highlighting missing dominant controls, rather than as evidence for aerosol-driven mechanisms. Additionally, the vegetation cover is sparse, making satellite NPP estimates noisy and the aerosol-NPP relationships more uncertain. The SEM’s failure in Region C underscores the need to incorporate hydrological variables (e.g., annual rainfall, soil moisture indices) to explain NPP dynamics in arid regions. It also highlights that aerosols are not the primary limiting factor there—water is. We suggest that future modeling for such regions should integrate indices like SPEI (Standardized Precipitation-Evapotranspiration Index) or actual precipitation and soil moisture data to properly account for water stress in the causal pathways. In our current model, any aerosol effect cannot be isolated because the unmeasured water availability factor confounds the NPP outcomes.
Limitations of SEM without hydrological controls: A key limitation is that precipitation and soil moisture are not explicitly included. In water-limited ecosystems, these hydrological variables can dominate NPP variability and confound temperature- or radiation-related pathways, particularly in Region B. The very poor fit in Region C further indicates that hydrological mediators are necessary for mechanistic attribution in extremely arid systems, and we therefore treat the Region C SEM primarily as a diagnostic result highlighting missing dominant controls.
The SEM results allow us to draw a conceptual synthesis in terms of plausible, context-dependent linkages: the fitted paths are consistent with a cooling/cloud-temperature-associated constraint on NPP in Region A, whereas Region B shows a trade-off between PAR-associated benefits and temperature/moisture-stress-associated limitations under the current model. Region C underscores that without explicit hydrological mediators, these pathways remain incomplete in extremely arid systems. These findings support the notion that the net ecological effect of aerosols is not an intrinsic constant but depends on the ecosystem context (energy-limited vs. water-limited).
Finally, the SEM results for Regions A and B help reconcile mixed findings in the literature by showing that the relative strength of radiative versus thermal (and likely moisture-related) constraints can differ across biomes. These results suggest that both suppression-like and compensatory patterns may emerge under different environmental contexts, although we emphasize that SEM based on observational data does not, by itself, prove causality. The balance among these pathways is determined by whether the ecosystem is energy- or water-limited. Our findings thus provide a process-based explanation for why previous correlation studies have sometimes reported contradictory aerosol–productivity relationships: they were likely observing different parts of this spectrum under different environmental conditions. Both effects are real, but one or the other predominates depending on local conditions.
A key point is that poor model performance in Region C highlights a future research need: incorporating hydrological drivers into aerosol–vegetation interaction frameworks, particularly in arid regions. Soil moisture (from missions like SMAP/SMOS) and evapotranspiration data could greatly improve models for semi-arid ecosystems by accounting for the dominant water limitation. Additionally, integrating aerosol composition and deposition data (e.g., dust nutrient content, aerosol optical properties) could refine our understanding of the positive pathways (such as nutrient fertilization) that our current model treats only implicitly. Including such variables might, for example, help capture the nutrient-mediated positive effects suggested by the correlation analysis in some regions.
4. Conclusions
In this study, we conducted a comprehensive analysis of multi-source remote sensing data for Africa (2013–2023) to investigate the coupling between aerosols and vegetation productivity. Our findings can be summarized as follows:
- Spatial Patterns: NPP shows a distinct latitudinal zonation, with persistently high values in equatorial rainforests and low values in arid zones, reflecting moisture availability as the primary limiting factor. AOD exhibits a corresponding “high-north, low-south” gradient: the highest aerosol loadings occur in North and Central Africa (due to Sahara/Sahel dust and tropical biomass burning), whereas the far south has much lower AOD. These spatial patterns align with known aerosol source regions and rainfall distribution, confirming that climate and source intensity drive the observed AOD–NPP geography.
- Temporal Trends: At the interannual scale, different regions exhibit distinct temporal patterns. In the tropical savanna (Region B), NPP exhibits strong year-to-year fluctuations, indicating high sensitivity to rainfall variability. In contrast, the Congo Basin rainforest (Region A) has very stable interannual NPP (buffered by consistently abundant rainfall) but shows a significant decreasing trend in AOD (p < 0.05), likely reflecting reduced biomass burning or other anthropogenic changes. These spatiotemporal dynamics (e.g., high NPP variability in savannas and declining aerosol in the Congo) illustrate how ecosystems and atmospheric conditions respond to regional environmental changes and policies.
- Correlation Characteristics: Aerosol–vegetation coupling varies spatially and can even reverse seasonally. We distinguish statistically significant correlations (p < 0.05; ‘N*’/‘P*’) from non-significant ones (‘N’/‘P’), and interpret the latter cautiously. Interannually, negative AOD–NPP correlations dominate in the central equatorial rainforest (higher aerosol levels associated with lower NPP), while positive correlations appear in some southern coastal and eastern highland areas (higher aerosol levels with higher NPP). Notably, the sign of the AOD–NPP relationship can flip with the seasons: for instance, in the Congo region it is negative during the wet season but positive in the dry season. This dual, context-dependent behavior of aerosol effects (both fertilization and suppression) underscores the need to consider season and region when assessing aerosol impacts.
- Mechanistic Pathways: SEM analysis shows that AOD influences NPP indirectly by altering light and thermal conditions, following two main pathways. In humid Congo forests, aerosols exert a cooling/cloud-mediated effect: higher AOD increases cloudiness and diffuse light, lowering surface temperature and—under already wet conditions—limiting photosynthesis due to reduced light. In arid savannas, aerosols have the opposite effect: increased AOD reduces cloud cover and adds atmospheric heating, raising surface temperature and exacerbating water stress, which in turn reduces NPP. These two pathways (cooling-driven limitation in rainforests vs. warming-driven limitation in savannas) explain regional differences and reconcile the seemingly contradictory aerosol impacts reported in previous studies: both processes occur, but which one dominates depends on the environmental context. Because SEM is fitted to observed covariances with a specified pathway structure, it supports mechanistic interpretation but, by itself, does not prove causality. Moreover, SEM fit was poor on the semi-arid South African plateau (Region C), indicating that explicit hydrological controls are required to robustly represent productivity drivers in strongly water-limited systems.
In conclusion, aerosol–vegetation interactions in Africa are not uniform but are governed by biome-specific mechanisms. Energy-limited rainforests experience a cooling-mediated aerosol effect that suppresses productivity, whereas water-limited savannas undergo a warming-mediated aerosol effect that exacerbates water stress and limits growth. This context-dependent framework reconciles conflicting findings by demonstrating that the net impact of aerosols on ecosystems depends on local climate conditions (e.g., humidity and light availability). Because AOD alone cannot resolve aerosol type, dust- versus smoke-related interpretations remain qualitative unless supported by additional proxy information. This perspective provides a process-based, predictive understanding of aerosol effects on ecosystem productivity.
Such a mechanistic understanding can be directly incorporated into dynamic vegetation and Earth system models to improve simulations of the carbon cycle under different aerosol scenarios. For example, models could adjust plant productivity in response to aerosol-induced changes in diffuse light and surface temperature, conditioned on the prevailing moisture regime. From a practical standpoint, our findings suggest region-specific management strategies: in the Congo, reducing aerosol pollution would increase the amount of sunlight available to plants, whereas in savannas, mitigating aerosol sources could alleviate heat stress on vegetation.
Finally, our results highlight the importance of including hydrological drivers in future aerosol–ecosystem studies, particularly for semi-arid regions. In such water-limited environments, soil moisture availability can override aerosol radiative effects as the primary control on productivity. Future research should combine satellite-derived soil moisture (e.g., SMAP/SMOS missions) and evapotranspiration data with aerosol observations and also consider aerosol chemical composition (dust vs. smoke nutrients) to develop a more comprehensive model of aerosol–vegetation interactions. By moving beyond simple correlations and identifying causal pathways, this work provides a scientific basis for more nuanced climate adaptation and ecosystem management strategies in Africa.
Author Contributions
B.S. conceived and designed the study; B.S. and M.B. developed the methodology; T.W. and J.C. performed the data processing and software analysis; Q.G. conducted validation; B.S. carried out formal analysis and investigation; B.S. and T.W. curated the data; B.S. wrote the original draft; M.B. contributed to writing—review and editing; B.S. prepared visualizations; D.L. supervised the project; B.S. acquired funding. All authors have read and agreed to the published version of the manuscript.
Funding
This research was funded by the Key Scientific Research Project of Higher Education Institutions in Henan Province (No. 26A420005), Henan Province Science and Technology R&D Projects (No. 262102321098), the Natural Science Foundation of Henan Province, China (No. 262300421764), the Nanyang Normal University Scientific Research Project (No. 2025ZX027), Nanyang Normal University National Natural Science Foundation Project (No. 2025PY023), Cultivation Fund Project and the Henan Provincial Science and Technology Research Project (No. 252102321105).
Institutional Review Board Statement
Not applicable.
Informed Consent Statement
Not applicable.
Data Availability Statement
The data presented in this study are available within the article and its Appendix A. MODIS AOD and NPP products were obtained from the NASA LAADS archive; CERES radiation data from the NASA CERES portal; ERA5 reanalysis from the ECMWF; and CRU TS climate data from the University of East Anglia’s CRU database.
Acknowledgments
The authors extend their sincere appreciation to NASA for providing the MODIS and CERES datasets and to the European Centre for Medium-Range Weather Forecasts (ECMWF) for the ERA5 reanalysis data. We are also grateful to the Climatic Research Unit for the CRU TS dataset. Special thanks go to the anonymous reviewers for their valuable comments, which greatly helped to improve the quality of this manuscript.
Conflicts of Interest
The authors declare no conflicts of interest.
Abbreviations
Following abbreviations are used in this manuscript (arranged in alphabetical order):
| AERONET | Aerosol robotic network |
| AOD | Aerosol optical depth |
| CERES | Clouds and the Earth’s Radiant Energy System |
| CFI | Comparative fit index |
| CRU TS | Climatic Research Unit Time Series |
| ECMWF | European Centre for Medium-Range Weather Forecasts |
| ERA5 | Fifth Generation ECMWF Atmospheric Reanalysis |
| GFED | Global Fire Emissions Database |
| GFI | Goodness-of-fit index |
| MODIS | Moderate Resolution Imaging Spectroradiometer |
| NPP | Net Primary Productivity |
| PAR | Photosynthetically Active Radiation |
| RMSE | Root mean square error |
| SEM | Structural equation modeling |
| SMAP | Soil Moisture Active Passive |
| SMOS | Soil Moisture and Ocean Salinity |
| SPEI | Standardized Precipitation Evapotranspiration Index |
| Tmax | Mean maximum temperature |
| UMD | University of Maryland |
| χ2/df | Chi-square to degrees of freedom ratio |
Appendix A
Table A1.
Interannual NPP Statistics in African (2013–2023) (Sub-regions: A: Congo Basin Rainforest, B: Tropical Savanna, C: South African Plateau Semi-Desert; Units: kg C/m2).
Table A2.
Seasonal Mean NPP Statistics in African (2013–2023) (Sub-regions: A: Congo Basin Rainforest, B: Tropical Savanna, C: South African Plateau Semi-Desert; Units: kg C/m2).
Table A3.
Interannual AOD Statistics in African (2013–2023) (Sub-regions: A: Congo Basin Rainforest, B: Tropical Savanna, C: South African Plateau Semi-Desert).
Table A4.
Seasonal and Annual Mean AOD Statistics in African (2013–2023) (Sub-regions: A: Congo Basin Rainforest, B: Tropical Savanna, C: South African Plateau Semi-Desert).
Table A5.
Interannual Values and Seasonal Means of AOD and NPP (2013–2023).
References
- Mahowald, N.M.; Scanza, R.; Brahney, J.; Goodale, C.L.; Hess, P.G.; Moore, J.K.; Neff, J.C. Aerosol Deposition Impacts on Land and Ocean Carbon Cycles. Curr. Clim. Change Rep. 2017, 3, 16–31. [Google Scholar] [CrossRef] [Scilit]
- Lee, H.; Muri, H.; Ekici, A.; Tjiputra, J.; Schwinger, J. The response of terrestrial ecosystem carbon cycling under different aerosol-based radiation management geoengineering. Earth Syst. Dyn. 2021, 12, 313–326. [Google Scholar] [CrossRef] [Scilit]
- Zhang, H.; Li, L.; Song, J.; Akhter, Z.H.; Zhang, J. Understanding aerosol–climate–ecosystem interactions and the implications for terrestrial carbon sink using the Community Earth System Model. Agric. For. Meteorol. 2023, 340, 109625. [Google Scholar] [CrossRef] [Scilit]
- Cohan, D.S.; Xu, J.; Greenwald, R.; Bergin, M.H.; Chameides, W.L. Impact of atmospheric aerosol light scattering and absorption on terrestrial net primary productivity. Glob. Biogeochem. Cycles 2002, 16, 1090. [Google Scholar] [CrossRef] [Scilit]
- Li, J.; Carlson, B.E.; Yung, Y.L.; Lv, D.; Hansen, J.; Penner, J.E.; Liao, H.; Ramaswamy, V.; Kahn, R.A.; Zhang, P.; et al. Scattering and absorbing aerosols in the climate system. Nat. Rev. Earth Environ. 2022, 3, 363–379. [Google Scholar] [CrossRef] [Scilit]
- Haywood, J.; Boucher, O. Estimates of the direct and indirect radiative forcing due to tropospheric aerosols: A review. Rev. Geophys. 2000, 38, 513–543. [Google Scholar] [CrossRef] [Scilit]
- Eidhammer, T.; Thompson, G. A Study of Aerosol Impacts on Clouds and Precipitation Development in a Large Winter Cyclone. J. Atmos. Sci. 2014, 71, 3636–3658. [Google Scholar]
- Kanakidou, M.; Myriokefalitakis, S.; Tsigaridis, K. Aerosols in atmospheric chemistry and biogeochemical cycles of nutrients. Environ. Res. Lett. 2018, 13, 063004. [Google Scholar] [CrossRef] [Scilit]
- Mercado, L.M.; Bellouin, N.; Sitch, S.; Boucher, O.; Huntingford, C.; Wild, M.; Cox, P.M. Impact of changes in diffuse radiation on the global land carbon sink. Nature 2009, 458, 1014–1017. [Google Scholar] [CrossRef] [Scilit]
- Remer, L.A.; Kaufman, Y.J.; Tanré, D.; Mattoo, S.; Chu, D.A.; Martins, J.V.; Li, R.-R.; Ichoku, C.; Levy, R.C.; Kleidman, R.G.; et al. The MODIS Aerosol Algorithm, Products, and Validation. J. Atmos. Sci. 2005, 62, 947–973. [Google Scholar] [CrossRef] [Scilit]
- Kaufman, Y.J.; Tanré, D.; Boucher, O. A satellite view of aerosols in the climate system. Nature 2002, 419, 215–223. [Google Scholar] [CrossRef] [Scilit]
- Hu, X.; Feng, H.; Tang, Y.; Wang, S.; Wang, S.; Wang, W.; Huang, J. Detection of the Contribution of Vegetation Change to Global Net Primary Productivity: A Satellite Perspective. Remote Sens. 2024, 16, 4692. [Google Scholar] [CrossRef] [Scilit]
- Cramer, W.; Kicklighter, D.W.; Bondeau, A.; Iii, B.M.; Churkina, G.; Nemry, B.; Ruimy, A.; Schloss, A.L.; The Participants of the Potsdam NpP Model Intercomparison. Comparing global models of terrestrial net primary productivity (NPP): Overview and key results. Glob. Change Biol. 1999, 5, 1–15. [Google Scholar] [CrossRef] [Scilit]
- Running, S.W.; Nemani, R.R.; Heinsch, F.A.; Zhao, M.S.; Reeves, M.; Hashimoto, H. A Continuous Satellite-Derived Measure of Global Terrestrial Primary Production. BioScience 2004, 54, 547–560. [Google Scholar] [CrossRef] [Scilit]
- Yang, L.; Luo, P.; Zhang, Z.; Song, Y.; Ren, K.; Zhang, C.; Awange, J.; Atkinson, P.M.; Meng, L. A spatio-temporal unmixing with heterogeneity model for the identification of remotely sensed MODIS aerosols: Exemplified by the case of Africa. Int. J. Appl. Earth Obs. Geoinf. 2024, 132, 104068. [Google Scholar] [CrossRef] [Scilit]
- Boiyo, R.; Kumar, K.R.; Zhao, T. Spatial variations and trends in AOD climatology over East Africa during 2002–2016: A comparative study using three satellite data sets. Int. J. Climatol. 2018, 38, e1221–e1240. [Google Scholar] [CrossRef] [Scilit]
- Keppel-Aleks, G.; Washenfelder, R.A. The effect of atmospheric sulfate reductions on diffuse radiation and photosynthesis in the United States during 1995–2013. Geophys. Res. Lett. 2016, 43, 9984–9993. [Google Scholar] [CrossRef] [Scilit]
- Rap, A.; Scott, C.E.; Reddington, C.L.; Mercado, L.; Ellis, R.J.; Garraway, S.; Evans, M.J.; Beerling, D.J.; MacKenzie, A.R.; Hewitt, C.N.; et al. Enhanced global primary production by biogenic aerosol via diffuse radiation fertilization. Nat. Geosci. 2018, 11, 640–644. [Google Scholar] [CrossRef] [Scilit]
- Zhou, H.; Yue, X.; Lei, Y.; Tian, C.; Zhu, J.; Ma, Y.; Cao, Y.; Yin, X.; Zhang, Z. Distinguishing the impacts of natural and anthropogenic aerosols on global gross primary productivity through diffuse fertilization effect. Atmos. Chem. Phys. 2022, 22, 693–709. [Google Scholar]
- Yu, H.; Chin, M.; Yuan, T.; Bian, H.; Remer, L.A.; Prospero, J.M.; Omar, A.; Winker, D.; Yang, Y.; Zhang, Y.; et al. The fertilizing role of African dust in the Amazon rainforest: A first multi-year assessment based on data from Cloud-Aerosol Lidar and Infrared Pathfinder Satellite Observations. Geophys. Res. Lett. 2015, 42, 1984–1991. [Google Scholar] [CrossRef] [Scilit]
- Barkley, A.E.; Prospero, J.M.; Mahowald, N.; Hamilton, D.S.; Popendorf, K.J.; Oehlert, A.M.; Pourmand, A.; Gatineau, A.; Panechou-Pulcherie, K.; Blackwelder, P.; et al. African biomass burning is a substantial source of phosphorus deposition to the Amazon, Tropical Atlantic Ocean, and Southern Ocean. Proc. Natl. Acad. Sci. USA 2019, 116, 16216–16221. [Google Scholar] [CrossRef] [Scilit] [PubMed]
- Hari, M.; Tyagi, B. India’s Greening Trend Seems to Slow Down. What Does Aerosol Have to Do with It? Land 2022, 11, 538. [Google Scholar] [CrossRef] [Scilit]
- Qiu, X.; Chang, L.; Chen, X. Spatiotemporal variability of aerosol-cloud interactions in Northwestern Pacific and impact on NPP. Atmos. Environ. 2025, 350, 121151. [Google Scholar] [CrossRef] [Scilit]
- deMenocal, P.B. African climate change and faunal evolution during the Pliocene–Pleistocene. Earth Planet. Sci. Lett. 2004, 220, 3–24. [Google Scholar] [CrossRef] [Scilit]
- Bucini, G.; Hanan, N.P. A continental-scale analysis of tree cover in African savannas. Glob. Ecol. Biogeogr. 2007, 16, 593–605. [Google Scholar]
- Greve, M.; Lykke, A.M.; Blach-Overgaard, A.; Svenning, J.-C. Environmental and anthropogenic determinants of vegetation distribution across Africa. Glob. Ecol. Biogeogr. 2011, 20, 661–674. [Google Scholar] [CrossRef] [Scilit]
- Olson, D.M.; Dinerstein, E.; Wikramanayake, E.D.; Burgess, N.D.; Powell, G.V.; Underwood, E.C.; D’amico, J.A.; Itoua, I.; Strand, H.E.; Morrison, J.C.; et al. Terrestrial Ecoregions of the World: A New Map of Life on Earth: A new global map of terrestrial ecoregions provides an innovative tool for conserving biodiversity. BioScience 2001, 51, 933–938. [Google Scholar] [CrossRef] [Scilit]
- Kim, D.; Chin, M.; Schuster, G.; Yu, H.; Takemura, T.; Tuccella, P.; Ginoux, P.; Liu, X.; Shi, Y.; Matsui, H.; et al. Where Dust Comes From: Global Assessment of Dust Source Attributions with AeroCom Models. J. Geophys. Res. Atmos. 2024, 129, e2022JD037846. [Google Scholar] [CrossRef] [Scilit]
- Harr, B.; Pu, B.; Jin, Q. The emission, transport, and impacts of the extreme Saharan dust storm of 2015. Atmos. Chem. Phys. 2024, 24, 8625–8651. [Google Scholar] [CrossRef] [Scilit]
- Lian, S.; Zhou, L.; Murphy, D.M.; Froyd, K.D.; Toon, O.B.; Yu, P. Global distribution of Asian, Middle Eastern, and North African dust simulated by CESM1/CARMA. Atmos. Chem. Phys. 2022, 22, 13659–13676. [Google Scholar]
- Ichoku, C. African Biomass Burning and Its Atmospheric Impacts. Annu. Rev. Earth Planet. Sci. 2020, 48, 431–460. [Google Scholar]
- Griffin, D.; Chen, J.; Anderson, K.; Makar, P.; McLinden, C.A.; Dammers, E.; Fogal, A. Biomass burning CO emissions: Exploring insights through TROPOMI-derived emissions and emission coefficients. Atmos. Chem. Phys. 2024, 24, 10159–10186. [Google Scholar] [CrossRef] [Scilit]
- Levy, R.C.; Mattoo, S.; Sawyer, V.; Shi, Y.; Colarco, P.R.; Lyapustin, A.I.; Wang, Y.; Remer, L.A. Exploring systematic offsets between aerosol products from the two MODIS sensors. Atmos. Meas. Tech. 2018, 11, 4073–4092. [Google Scholar] [CrossRef] [Scilit] [PubMed]
- Huang, Y.; Zhu, B.; Zhu, Z.; Zhang, T.; Gong, W.; Ji, Y.; Xia, X.; Wang, L.; Zhou, X.; Chen, D. Evaluation and Comparison of MODIS Collection 6.1 and Collection 6 Dark Target Aerosol Optical Depth over Mainland China Under Various Conditions Including Spatiotemporal Distribution, Haze Effects, and Underlying Surface. Earth Space Sci. 2019, 6, 2575–2592. [Google Scholar] [CrossRef] [Scilit]
- Kim, M.; Levy, R.C.; Remer, L.A.; Mattoo, S.; Gupta, P. Parameterizing spectral surface reflectance relationships for the Dark Target aerosol algorithm applied to a geostationary imager. Atmos. Meas. Tech. 2024, 17, 1913–1939. [Google Scholar] [CrossRef] [Scilit]
- Rutan, D.A.; Kato, S.; Doelling, D.R.; Rose, F.G.; Nguyen, L.T.; Caldwell, T.E.; Loeb, N.G. CERES Synoptic Product: Methodology and Validation of Surface Radiant Flux. J. Atmos. Ocean. Technol. 2015, 32, 1121–1143. [Google Scholar] [CrossRef] [Scilit]
- Vicente-Serrano, S.M.; Beguería, S.; López-Moreno, J.I. A Multiscalar Drought Index Sensitive to Global Warming: The Standardized Precipitation Evapotranspiration Index. J. Clim. 2010, 23, 1696–1718. [Google Scholar] [CrossRef] [Scilit]
- van der Schrier, G.; Barichivich, J.; Briffa, K.R.; Jones, P.D. A scPDSI-based global data set of dry and wet spells for 1901–2009. J. Geophys. Res. Atmos. 2013, 118, 4025–4048. [Google Scholar] [CrossRef] [Scilit]
- Yang, Y.; Guan, H.; Batelaan, O.; McVicar, T.R.; Long, D.; Piao, S.; Liang, W.; Liu, B.; Jin, Z.; Simmons, C.T. Contrasting responses of water use efficiency to drought across global terrestrial ecosystems. Sci. Rep. 2016, 6, 23284. [Google Scholar] [CrossRef] [Scilit]
- Collins, B.; Ramezani Etedali, H.; Tavakol, A.; Kaviani, A. Spatiotemporal variations of evapotranspiration and reference crop water requirement over 1957–2016 in Iran based on CRU TS gridded dataset. J. Arid Land 2021, 13, 858–878. [Google Scholar] [CrossRef] [Scilit]
- Ukkola, A.M.; Prentice, I.C. A worldwide analysis of trends in water-balance evapotranspiration. Hydrol. Earth Syst. Sci. 2013, 17, 4177–4187. [Google Scholar] [CrossRef] [Scilit]
- Huang, M.; Piao, S.; Ciais, P.; Penuelas, J.; Wang, X.; Keenan, T.F.; Peng, S.; Berry, J.A.; Wang, K.; Mao, J.; et al. Air temperature optima of vegetation productivity across global biomes. Nat. Ecol. Evol. 2019, 3, 772–779. [Google Scholar] [CrossRef] [Scilit]
- Harris, I.; Osborn, T.J.; Jones, P.; Lister, D. Version 4 of the CRU TS monthly high-resolution gridded multivariate climate dataset. Sci. Data 2020, 7, 109. [Google Scholar] [CrossRef] [Scilit]
- Fensholt, R.; Langanke, T.; Rasmussen, K.; Reenberg, A.; Prince, S.D.; Tucker, C.; Scholes, R.J.; Le, Q.B.; Bondeau, A.; Eastman, R.; et al. Greenness in semi-arid areas across the globe 1981–2007—An Earth Observing Satellite based analysis of trends and drivers. Remote Sens. Environ. 2012, 121, 144–158. [Google Scholar] [CrossRef] [Scilit]
- Bastin, J.-F.; Berrahmouni, N.; Grainger, A.; Maniatis, D.; Mollicone, D.; Moore, R.; Patriarca, C.; Picard, N.; Sparrow, B.; Abraham, E.M.; et al. The extent of forest in dryland biomes. Science 2017, 356, 635–638. [Google Scholar] [CrossRef] [Scilit] [PubMed]
- Devine, A.P.; McDonald, R.A.; Quaife, T.; Maclean, I.M.D. Determinants of woody encroachment and cover in African savannas. Oecologia 2017, 183, 939–951. [Google Scholar] [CrossRef] [Scilit]
- Wu, X.; Liu, H.; Li, X.; Piao, S.; Ciais, P.; Guo, W.; Yin, Y.; Poulter, B.; Peng, C.; Viovy, N.; et al. Higher temperature variability reduces temperature sensitivity of vegetation growth in the Northern Hemisphere. Geophys. Res. Lett. 2017, 44, 6173–6181. [Google Scholar] [CrossRef] [Scilit]
- Liu, W.; Mo, X.; Liu, S.; Lu, C. Impacts of climate change on grassland fractional vegetation cover variation on the Tibetan Plateau. Sci. Total Environ. 2024, 939, 173320. [Google Scholar] [CrossRef] [Scilit] [PubMed]
- Laurance, W.F.; Camargo, J.L.; Luizão, R.C.C.; Laurance, S.G.; Pimm, S.L.; Bruna, E.M.; Stouffer, P.C.; Williamson, G.B.; Benítez-Malvido, J.; Vasconcelos, H.L.; et al. The fate of Amazonian forest fragments: A 32-year investigation. Biol. Conserv. 2011, 144, 56–67. [Google Scholar] [CrossRef] [Scilit]
- Quesada, C.A.; Phillips, O.L.; Schwarz, M.; Czimczik, C.I.; Baker, T.R.; Patiño, S.; Fyllas, N.M.; Hodnett, M.G.; Herrera, R.; Almeida, S.; et al. Basin-wide variations in Amazon forest structure and function are mediated by both soils and climate. Biogeosciences 2012, 9, 2203–2246. [Google Scholar] [CrossRef] [Scilit]
- Burnett, M.W.; Quetin, G.R.; Konings, A.G. Data-driven estimates of evapotranspiration and its controls in the Congo Basin. Hydrol. Earth Syst. Sci. 2020, 24, 4189–4211. [Google Scholar] [CrossRef] [Scilit]
- Diem, J.E.; Hartter, J.; Salerno, J.; Sung, H.S.; Konecky, B.L.; Palace, M.W. Recent rainfall trends and the role of the Congo Westerlies in western Uganda. J. Geophys. Res. Atmos. 2019, 124, 10712–10729. [Google Scholar] [CrossRef] [Scilit]
- Nicholson, S.E.; Klotter, D.A.; Zhou, L.; Hua, W. Recent rainfall conditions in the Congo Basin. Environ. Res. Lett. 2022, 17, 054052. [Google Scholar] [CrossRef] [Scilit]
- Muñiz, C.; McQuaid, C.D.; Weidberg, N. Seasonality of primary productivity affects coastal species more than its magnitude. Sci. Total Environ. 2021, 757, 143740. [Google Scholar] [CrossRef] [Scilit]
- Wang, Q.; Liang, L.; Wang, S.; Wang, S.; Zhang, L.; Qiu, S.; Shi, Y.; Shi, J.; Sun, C. Insights into Spatiotemporal Variations in the NPP of Terrestrial Vegetation in Africa from 1981 to 2018. Remote Sens. 2023, 15, 2748. [Google Scholar] [CrossRef] [Scilit]
- Thavhana, M.P.; Hickler, T.; Urban, M.; Heckel, K.; Forrest, M. Dynamics and Drivers of Net Primary Production (NPP) in Southern Africa Based on Earth Observation and Modeling. In Sustainability of Southern African Ecosystems Under Global Change; Springer: Berlin/Heidelberg, Germany, 2024; pp. 759–786. [Google Scholar]
- Pinker, R.T.; Liu, H.; Osborne, S.R.; Akoshile, C. Radiative effects of aerosols in sub-Sahel Africa: Dust and biomass burning. J. Geophys. Res. Atmos. 2010, 115, D15205. [Google Scholar] [CrossRef] [Scilit]
- Flamant, C.; Chaboureau, J.P.; Gaetani, M.; Schepanski, K.; Formenti, P. The radiative impact of biomass burning aerosols on dust emissions over Namibia and long-range transport of smoke (AEROCLO-sA campaign). Atmos. Chem. Phys. 2024, 24, 4265–4288. [Google Scholar] [CrossRef] [Scilit]
- Tatro, T.; Zuidema, P. More biomass burning aerosol is being advected westward over the southern tropical Atlantic since 2003. Sci. Total Environ. 2025, 965, 178506. [Google Scholar] [CrossRef] [Scilit]
- Nguyen, H.M.; Wooster, M.J. Advances in estimating high spatio-temporal resolution pan-African biomass burning emissions using geostationary fire radiative power and MAIAC AOD data. Remote Sens. Environ. 2020, 248, 111971. [Google Scholar] [CrossRef] [Scilit]
- de Meij, A.; Pozzer, A.; Lelieveld, J. Trend analysis in aerosol optical depths and pollutant emission estimates between 2000 and 2009. Atmos. Environ. 2012, 51, 75–85. [Google Scholar] [CrossRef] [Scilit]
- Lin, J.; Nielsen, C.P.; Zhao, Y.; Lei, Y.; Liu, Y.; McElroy, M.B. Recent Changes in Particulate Air Pollution over China Observed from Space and the Ground: Effectiveness of Emission Control. Environ. Sci. Technol. 2010, 44, 7771–7776. [Google Scholar] [CrossRef] [Scilit]
- Chen, X.; Li, K.; Yang, T.; Yang, Z.; Wang, X.; Zhu, B.; Chen, L.; Yang, Y.; Wang, Z.; Liao, H. Trends and drivers of aerosol vertical distribution over China from 2013 to 2020: Insights from integrated observations and modeling. Sci. Total Environ. 2024, 917, 170485. [Google Scholar] [CrossRef] [Scilit] [PubMed]
- Gammoudi, N.; Kovács, J.; Gresina, F.; Varga, G. Combined use of HYSPLIT and MODIS AOD to study Saharan dust events over Europe. Aeolian Res. 2024, 67, 100003. [Google Scholar]
- Wang, X.; Wang, Q.; Prass, M.; Pöhlker, C.; Moran-Zuloaga, D.; Artaxo, P.; Gu, J.; Yang, N.; Yang, X.; Tao, J.; et al. The export of African mineral dust across the Atlantic and its impact over the Amazon Basin. Atmos. Chem. Phys. 2023, 23, 9993–10014. [Google Scholar] [CrossRef] [Scilit]
- Mona, L.; Amiridis, V.; Cuevas, E.; Gkikas, A.; Trippetta, S.; Vandenbussche, S.; Benedetti, A.; Dagsson-Waldhauserova, P.; Formenti, P.; Haefele, A.; et al. Observing Mineral Dust in Northern Africa, the Middle East, and Europe: Current Capabilities and Challenges. Bull. Am. Meteorol. Soc. 2023, 104, E2223–E2264. [Google Scholar] [CrossRef] [Scilit]
- Nyaga, J.M.; Cramer, M.D.; Neff, J.C. Atmospheric nutrient deposition to the west coast of South Africa. Atmos. Environ. 2013, 81, 625–632. [Google Scholar] [CrossRef] [Scilit]
- Klopper, D.; Formenti, P.; Namwoonde, A.; Cazaunau, M.; Chevaillier, S.; Feron, A.; Gaimoz, C.; Hease, P.; Lahmidi, F.; Mirande-Bret, C.; et al. Chemical composition and source apportionment of atmospheric aerosols on the Namibian coast. Atmos. Chem. Phys. 2020, 20, 15811–15833. [Google Scholar] [CrossRef] [Scilit]
- Desboeufs, K.; Formenti, P.; Torres-Sánchez, R.; Schepanski, K.; Chaboureau, J.-P.; Andersen, H.; Cermak, J.; Feuerstein, S.; Laurent, B.; Klopper, D.; et al. Fractional solubility of iron in mineral dust aerosols over coastal Namibia: A link to marine biogenic emissions? Atmos. Chem. Phys. 2024, 24, 1525–1541. [Google Scholar] [CrossRef] [Scilit]
- Rodríguez, S.; Prospero, J.M.; López-Darias, J.; García-Alvarez, M.-I.; Zuidema, P.; Nava, S.; Lucarelli, F.; Gaston, C.J.; Galindo, L.; Sosa, E. Tracking the changes of iron solubility and pollutant traces as African dust transits the Atlantic in Saharan outbreaks. Atmos. Environ. 2021, 246, 118092. [Google Scholar] [CrossRef] [Scilit]
- Carslaw, K.S.; Boucher, O.; Spracklen, D.V.; Mann, G.W.; Rae, J.G.L.; Woodward, S.; Kulmala, M. A review of natural aerosol interactions and feedbacks within the Earth system. Atmos. Chem. Phys. 2010, 10, 1701–1737. [Google Scholar] [CrossRef] [Scilit]
- Wang, B.; Wang, Z.; Wang, C.; Wang, X.; Jia, Z.; Liu, L. Elevated aerosol enhances plant water-use efficiency by increasing carbon uptake while reducing water loss. New Phytol. 2024, 243, 567–579. [Google Scholar] [CrossRef] [Scilit]
- Jiao, L.; Wang, X.; Cai, D.; Hua, T. Potential responses of vegetation to atmospheric aerosols in arid and semi-arid regions of Asia. J. Arid. Land. 2021, 13, 516–533. [Google Scholar] [CrossRef] [Scilit]
- Xue, W.; Zhang, J.; Deng, X.; Tian, Y. Responses of vegetation photosynthetic processes to aerosol-induced direct radiative effect in China. Atmos. Environ. 2024, 329, 120557. [Google Scholar] [CrossRef] [Scilit]
- Dagan, G.; Yeheskel, N.; Williams, A.I.L. Radiative forcing from aerosol–cloud interactions enhanced by large-scale circulation adjustments. Nat. Geosci. 2023, 16, 1092–1098. [Google Scholar] [CrossRef] [Scilit]
- Bellouin, N.; Baker, L.; Hodnebrog, Ø.; Olivié, D.; Cherian, R.; Macintosh, C.; Samset, B.; Esteve, A.; Aamaas, B.; Quaas, J.; et al. Regional and seasonal radiative forcing by perturbations to aerosol and ozone precursor emissions. Atmos. Chem. Phys. 2016, 16, 13885–13910. [Google Scholar] [CrossRef] [Scilit]
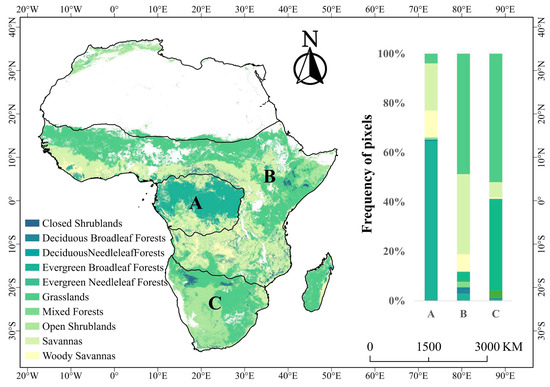
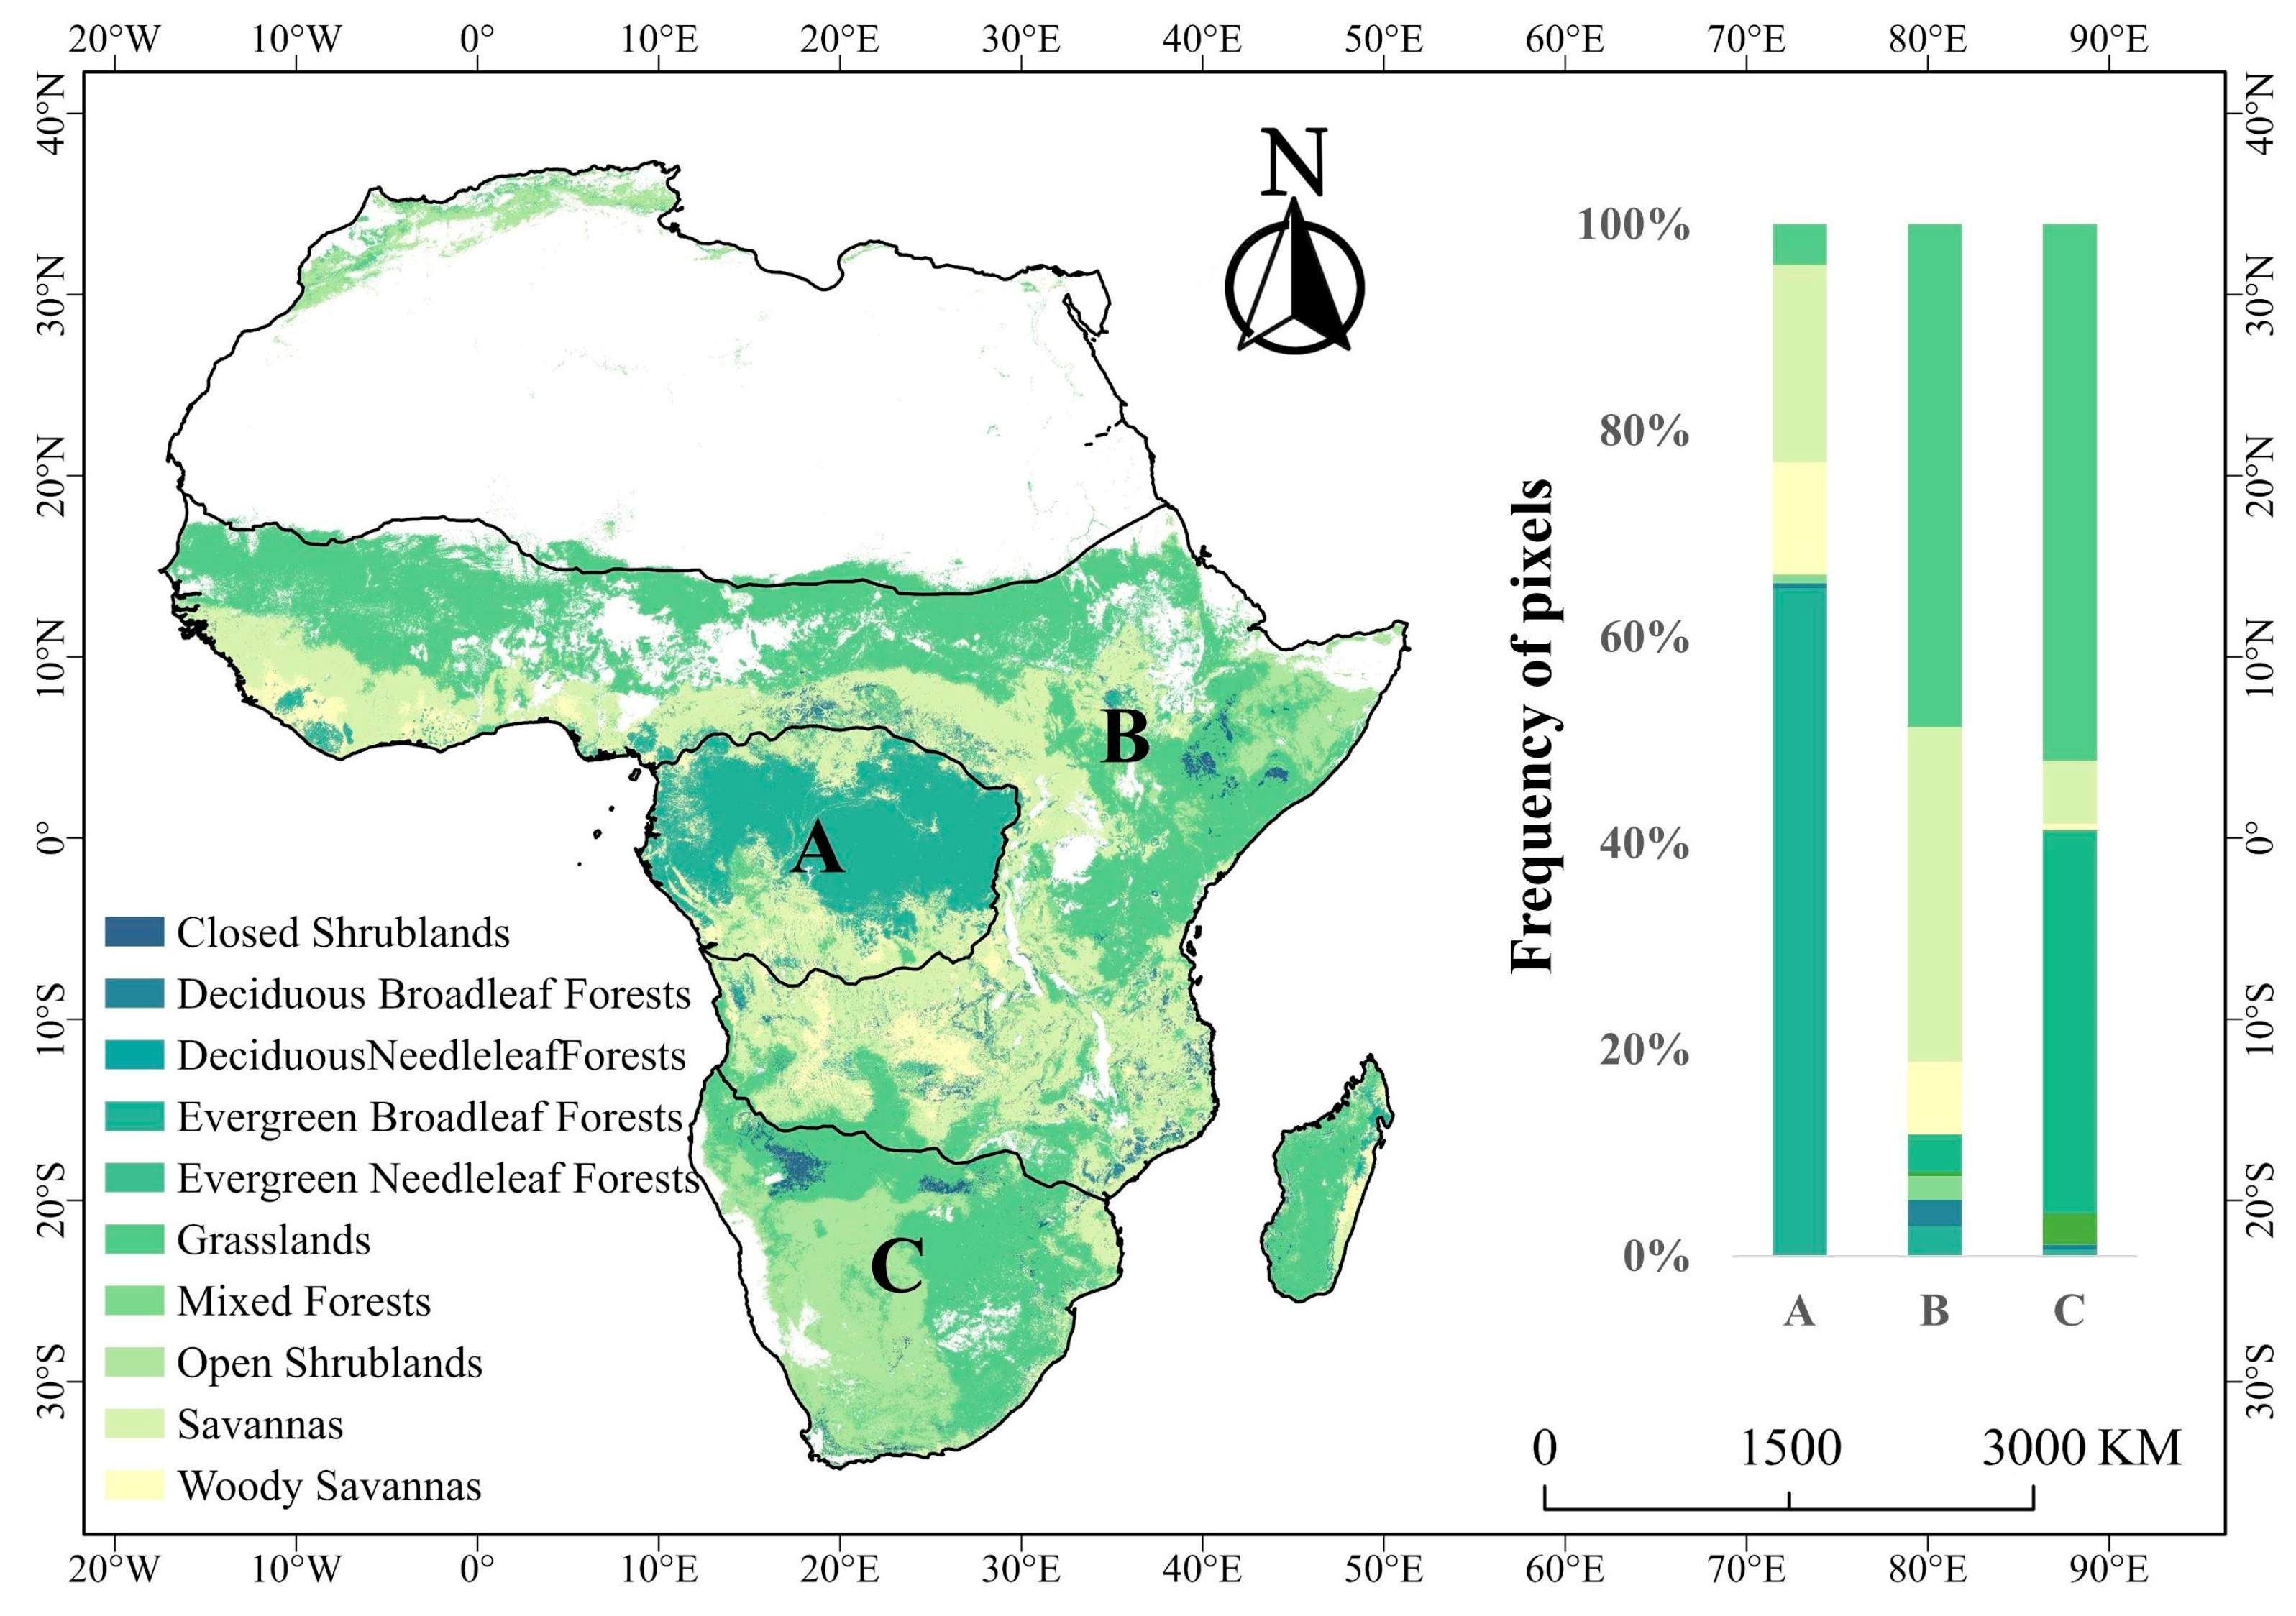
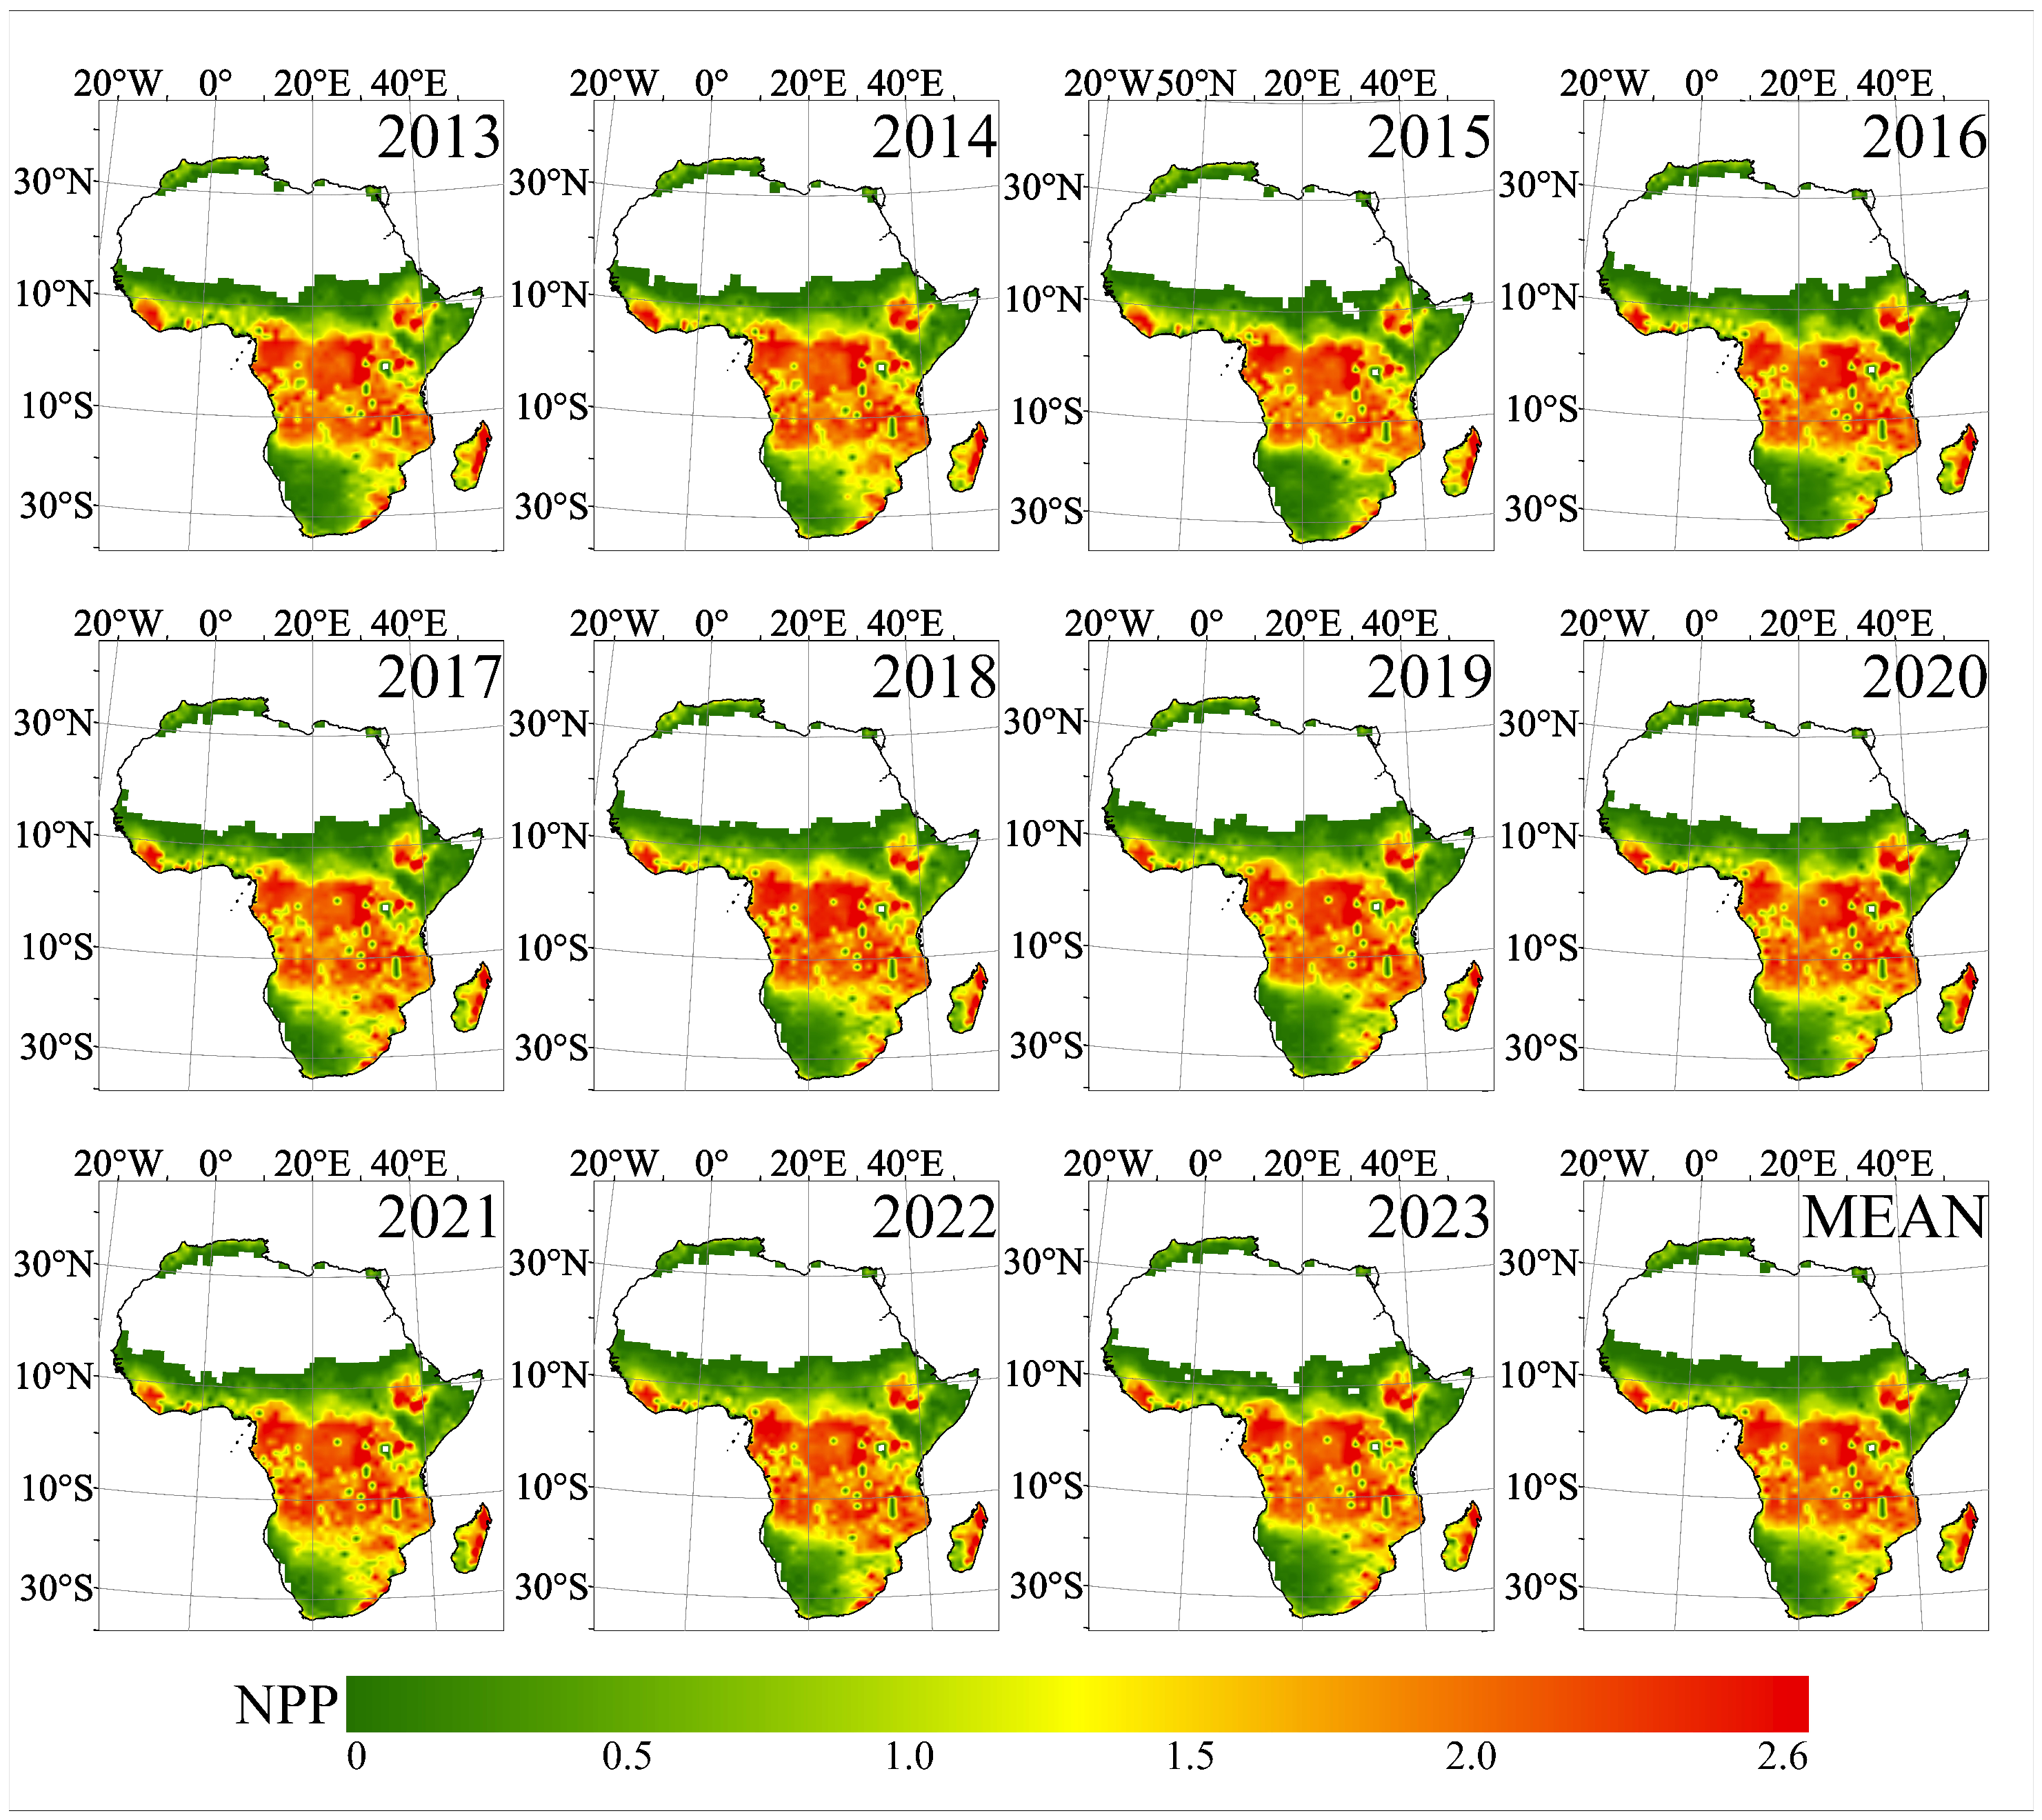
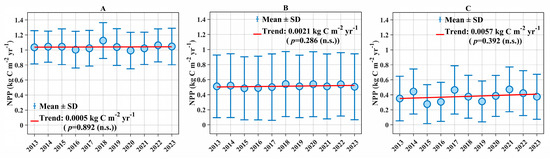
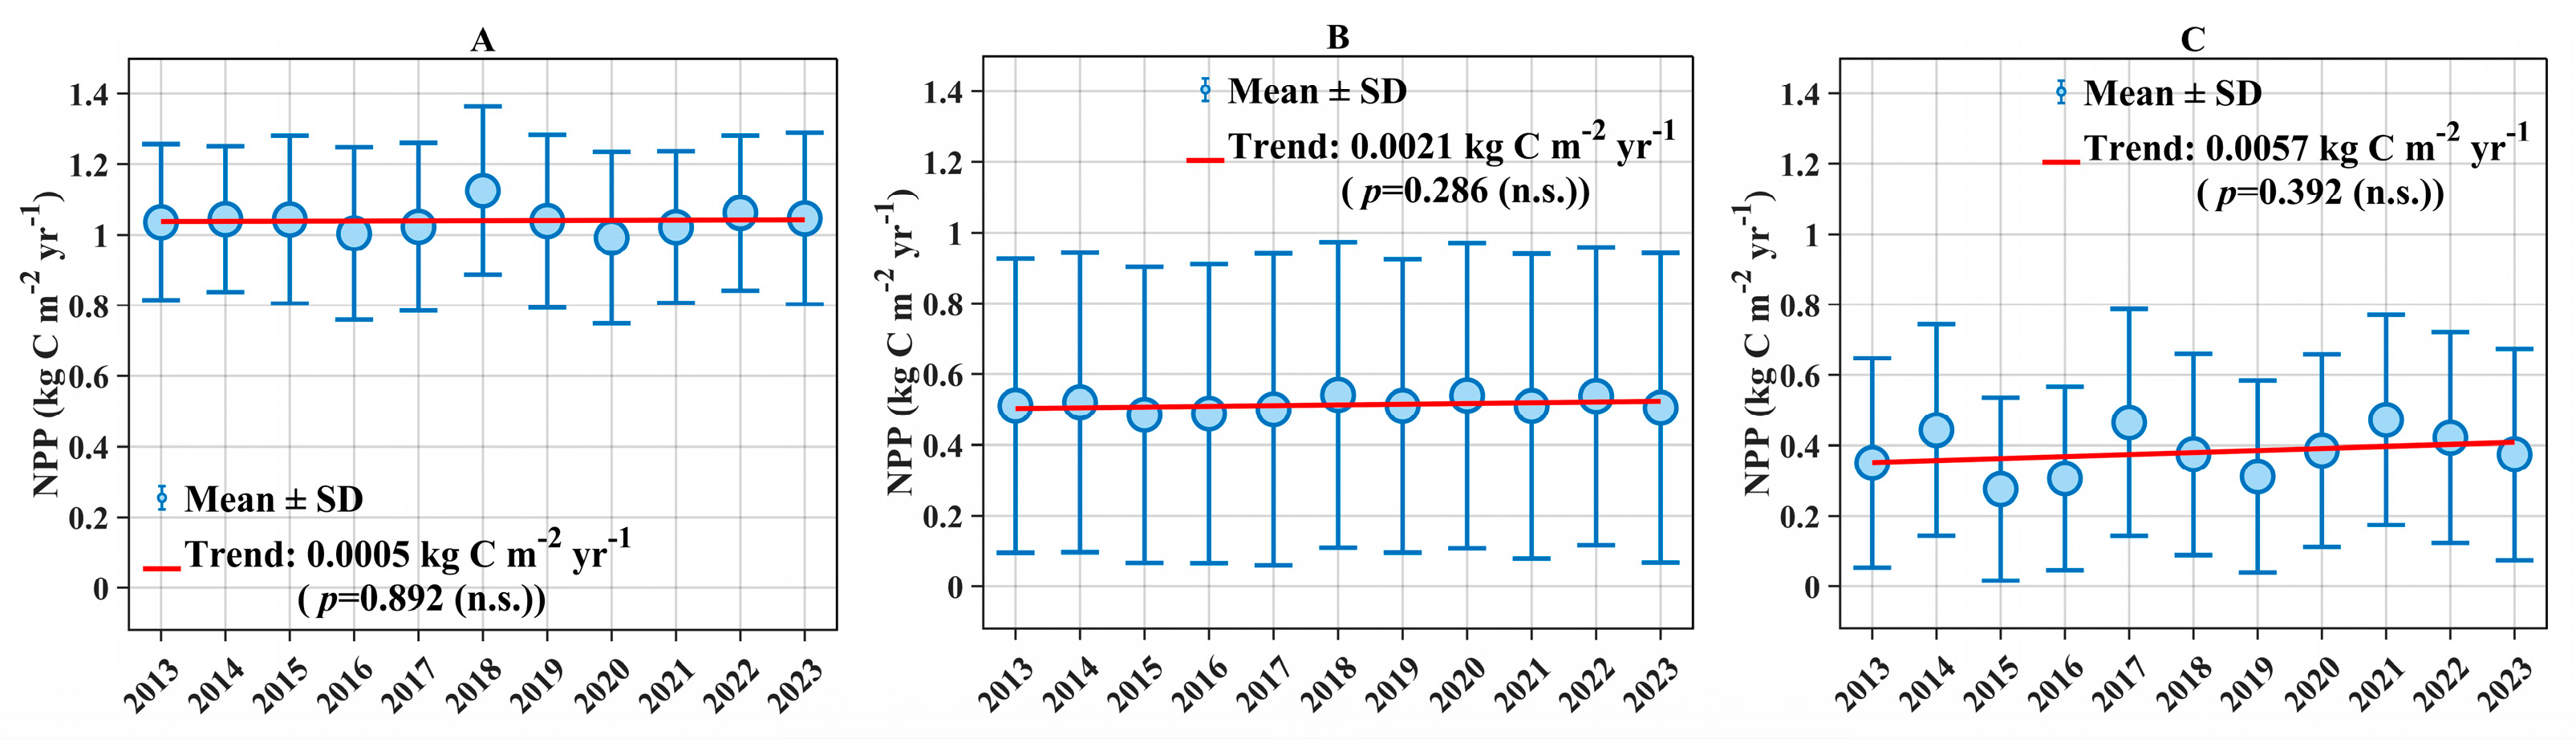
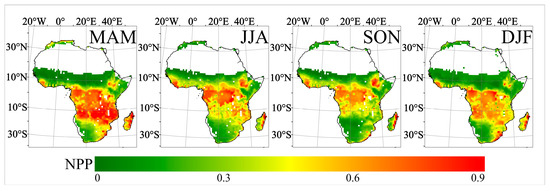
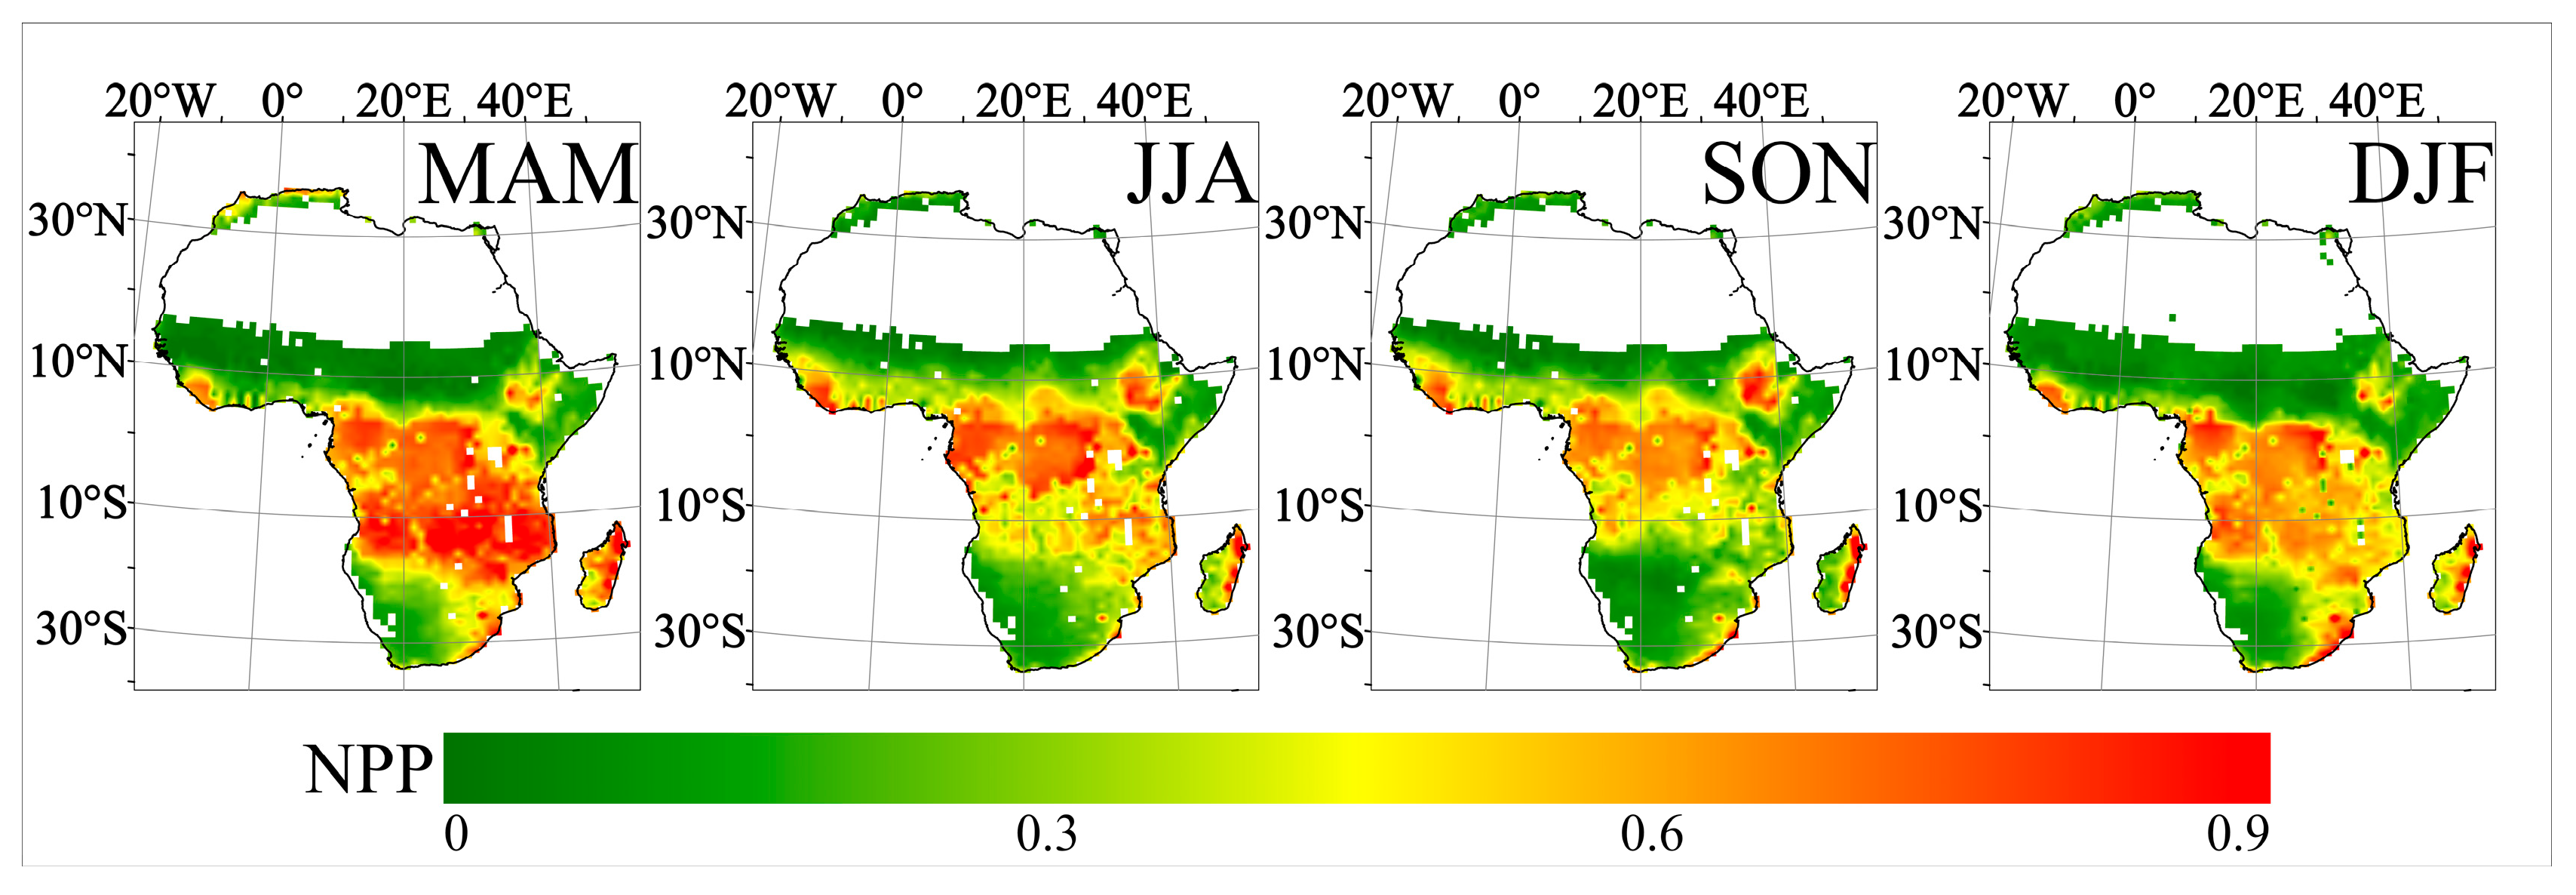
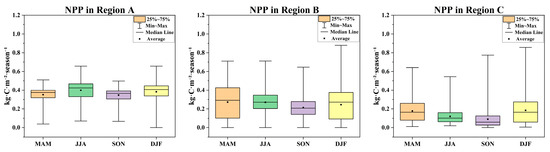
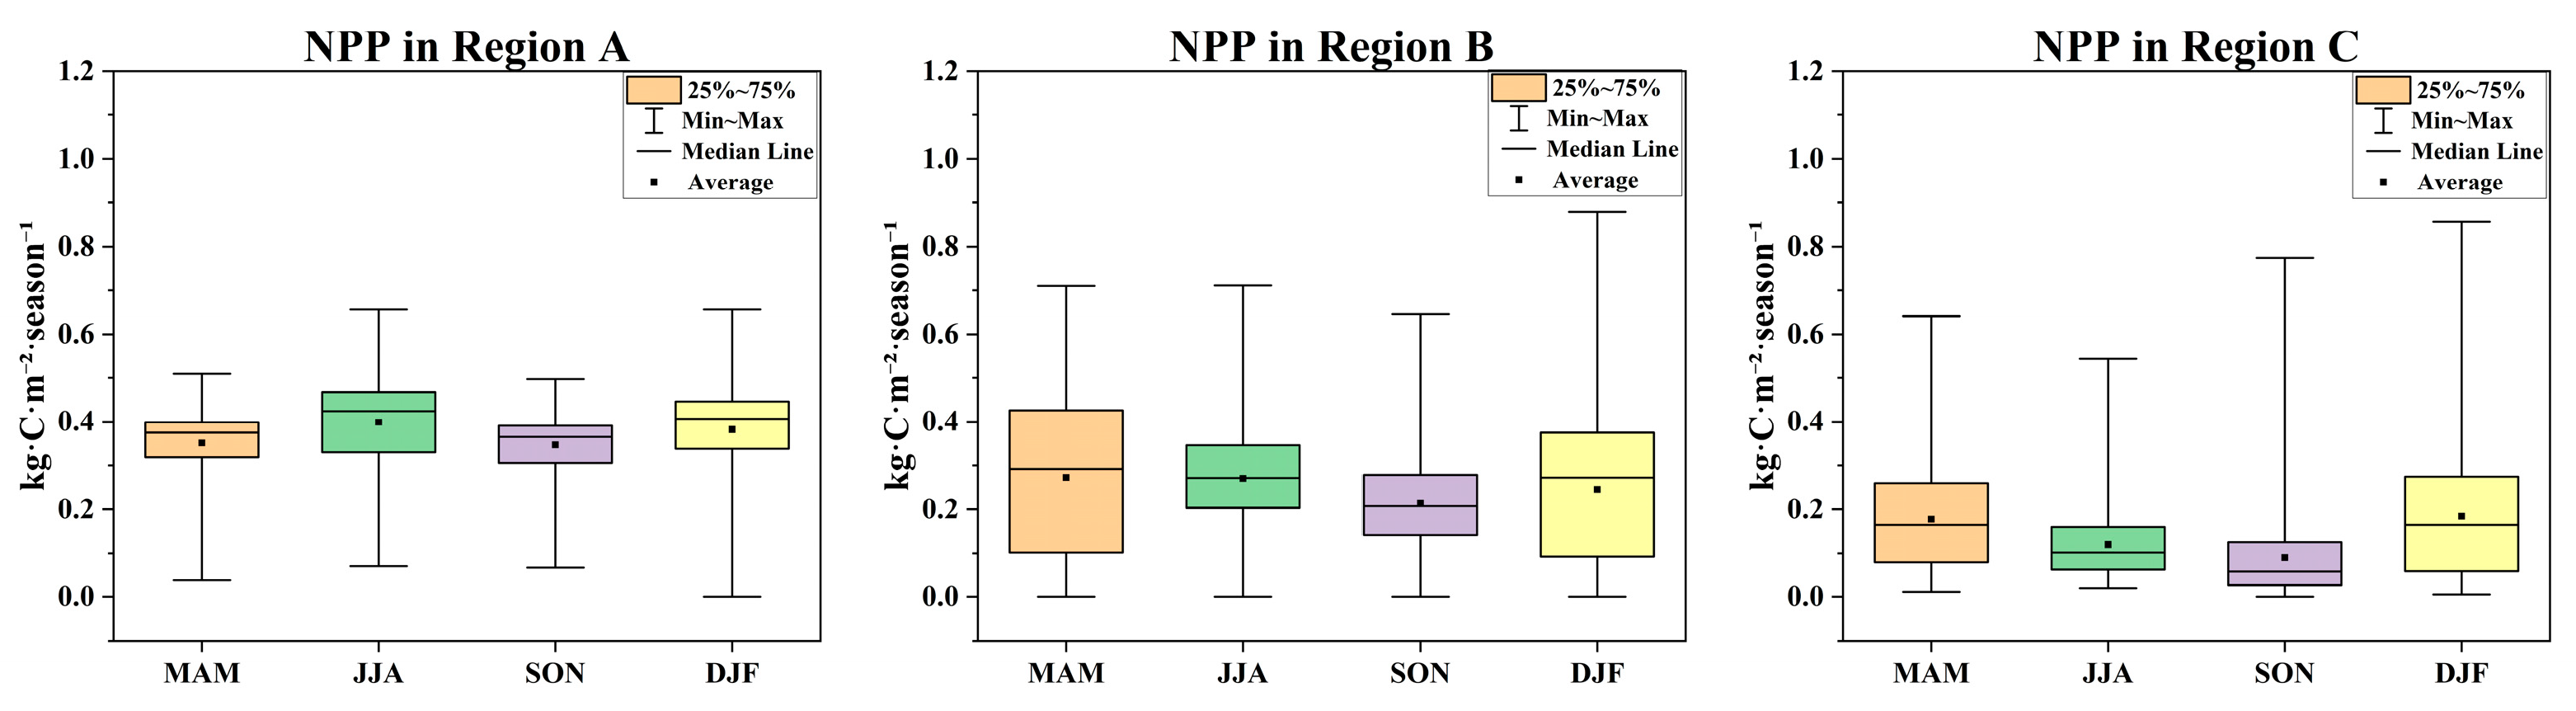
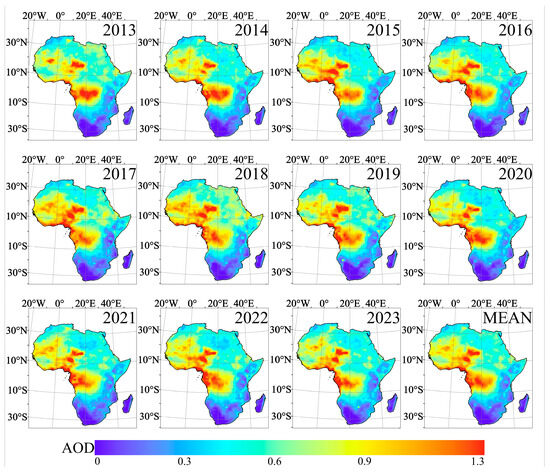
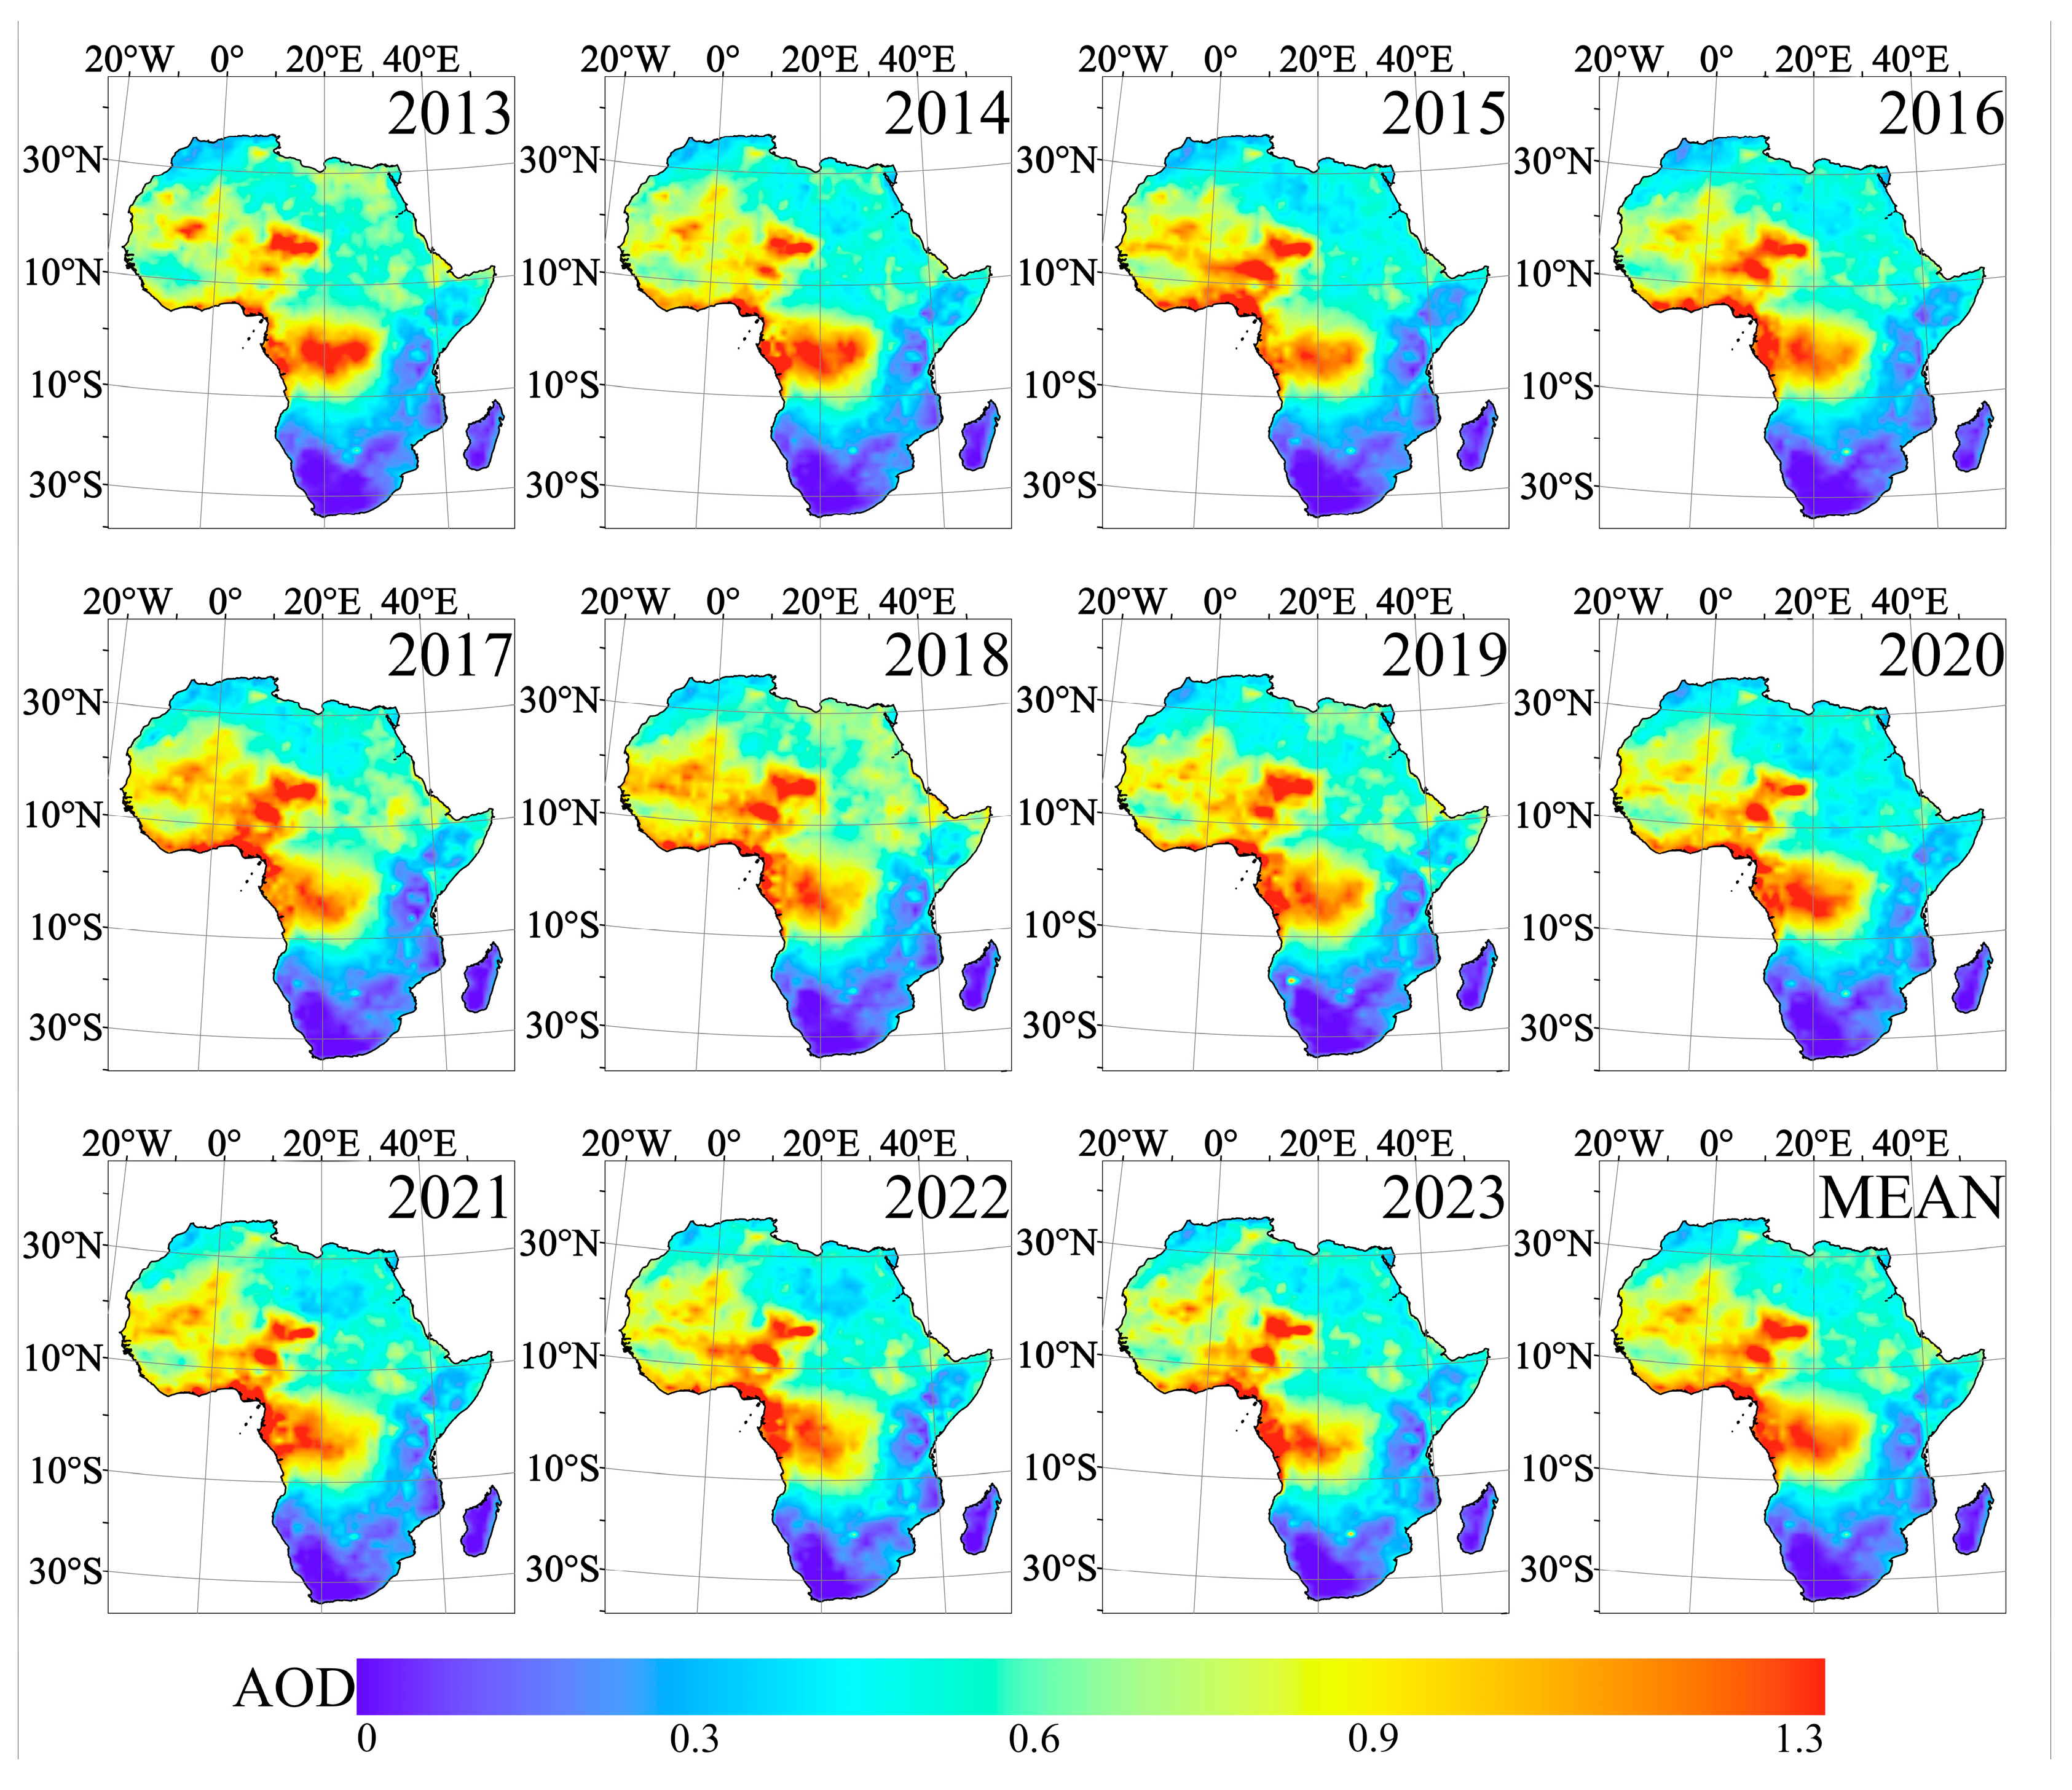
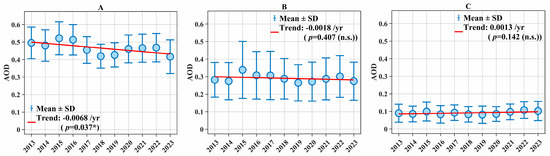
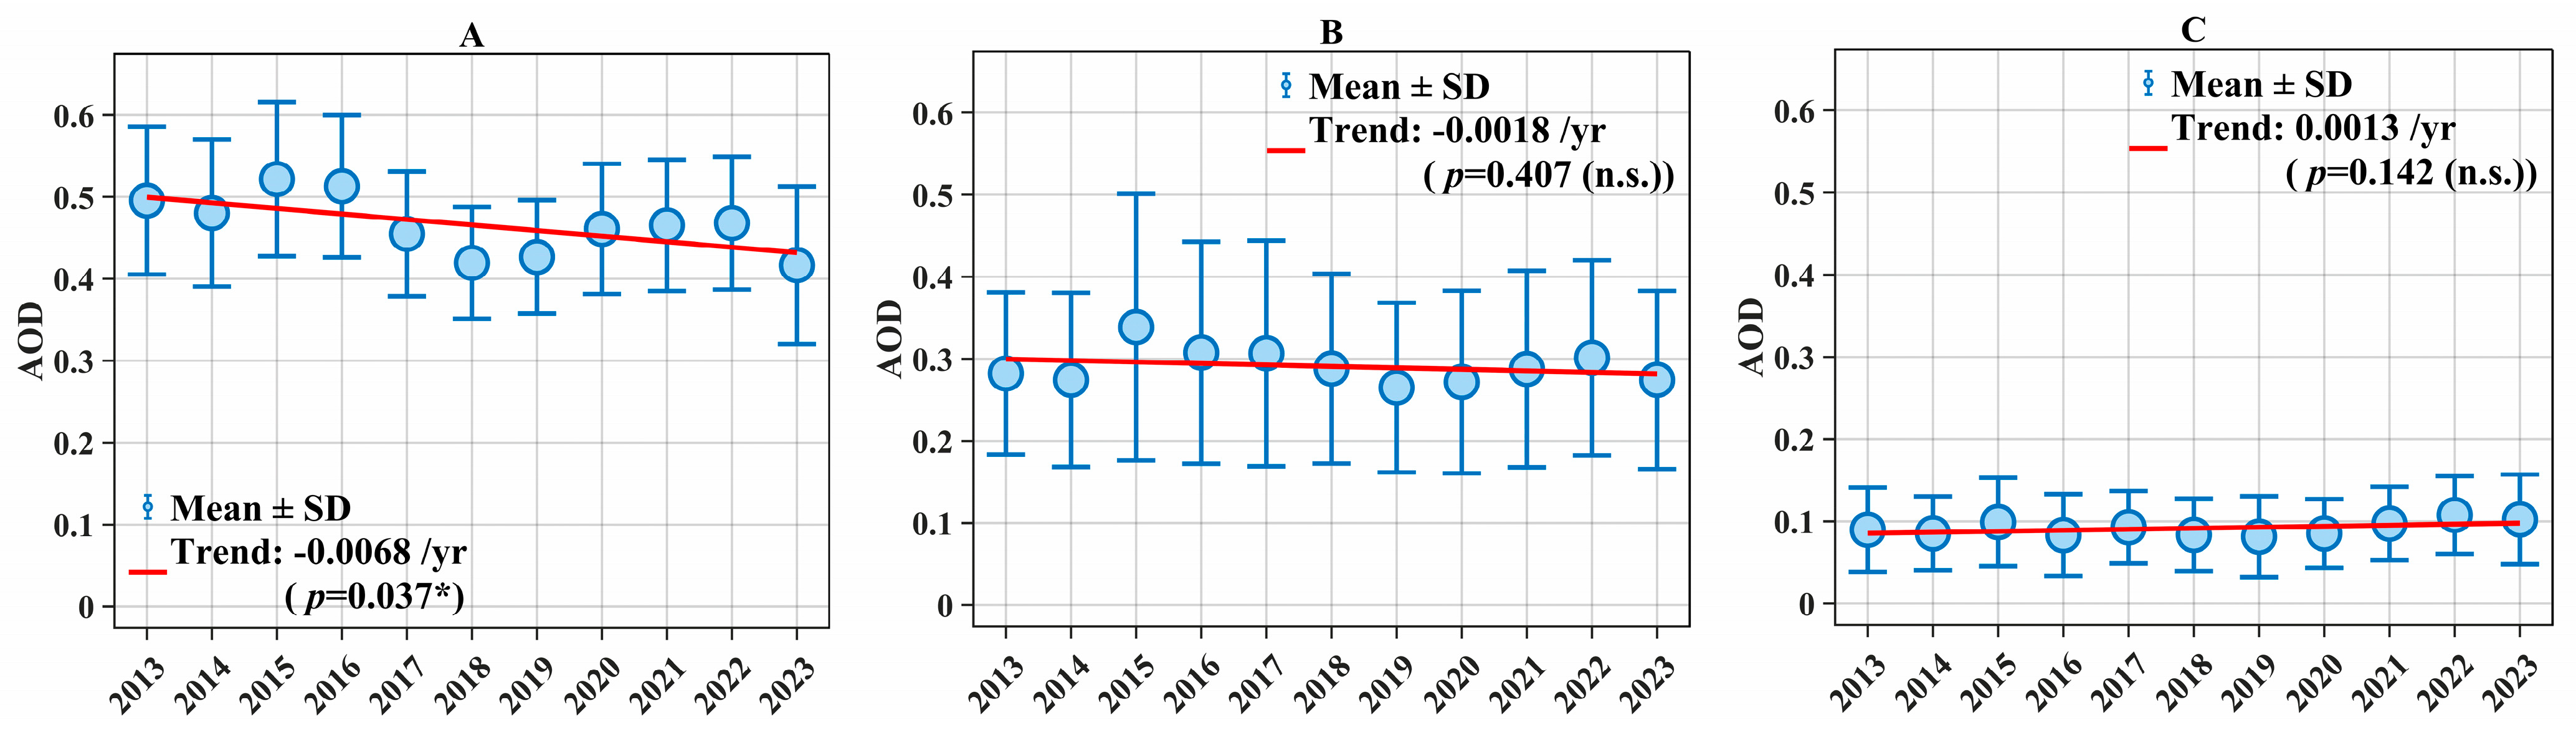
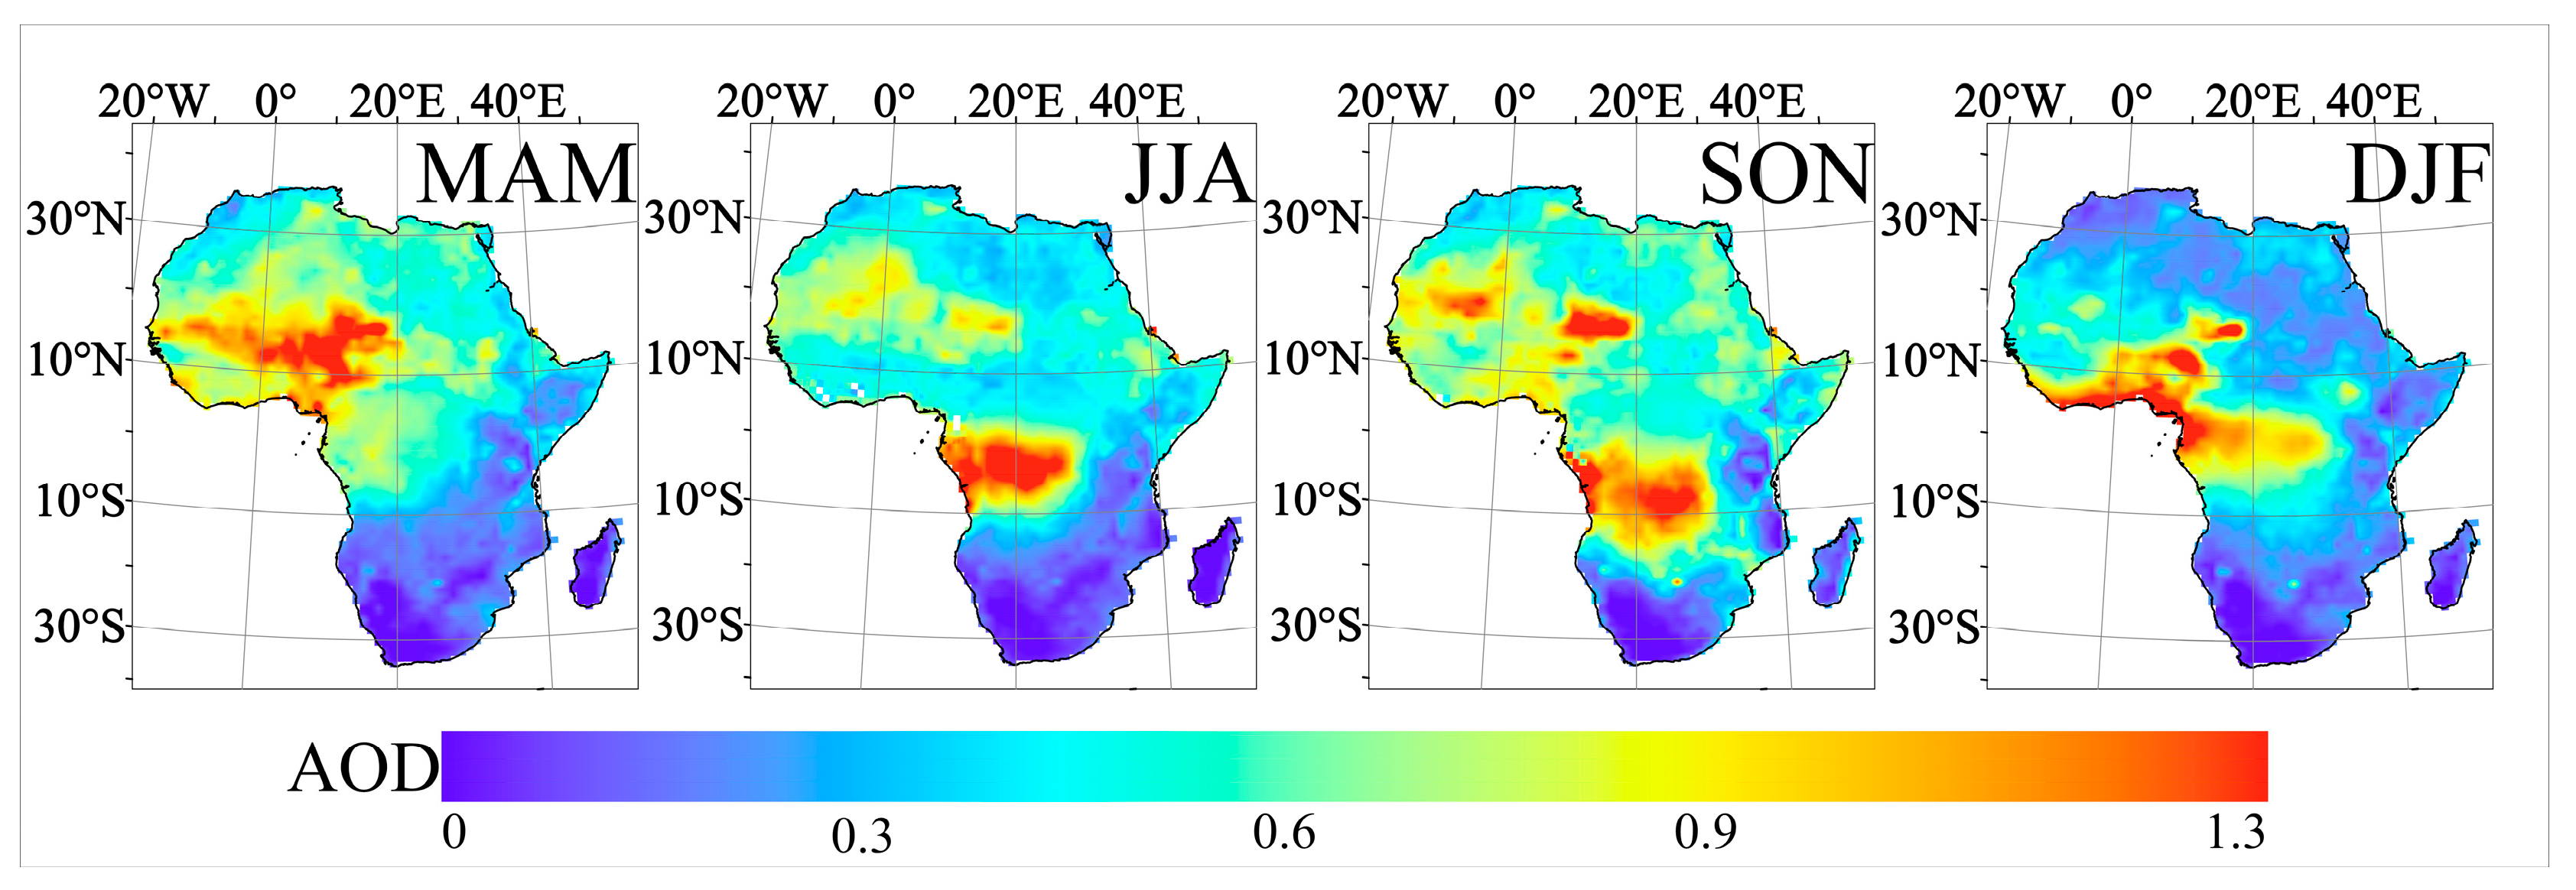
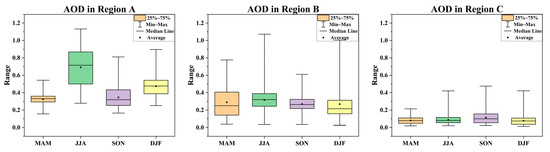
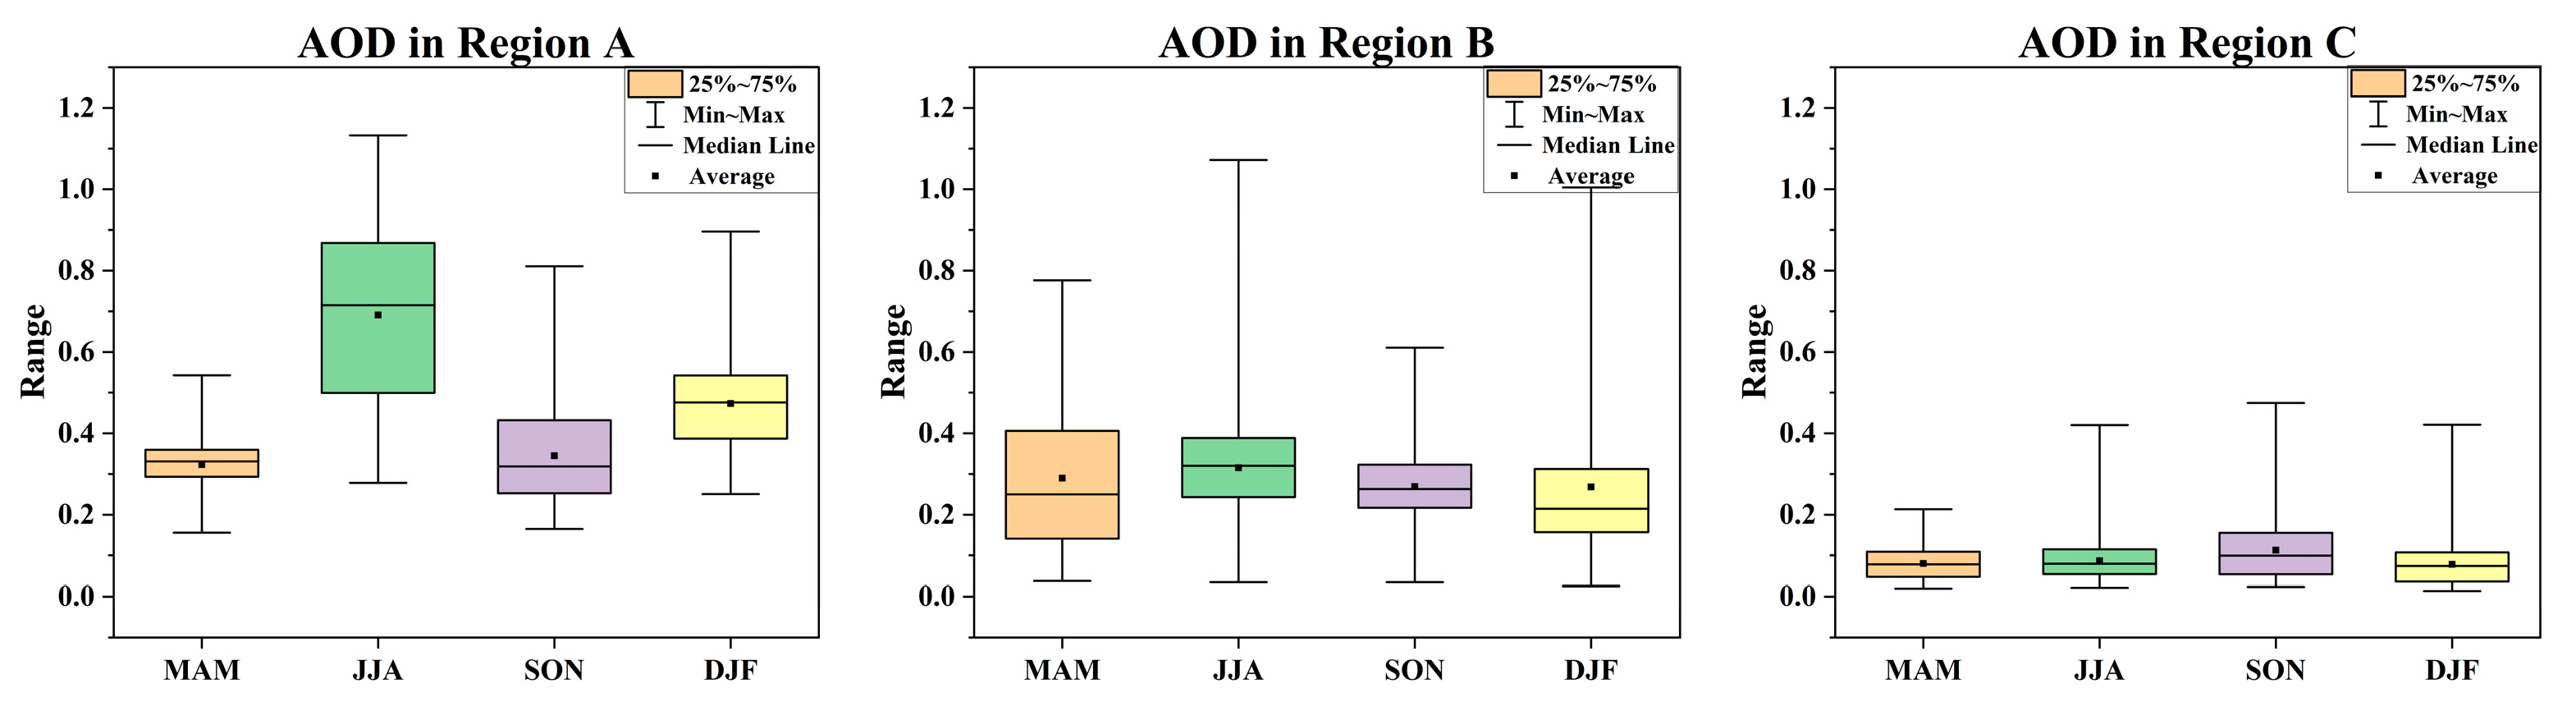
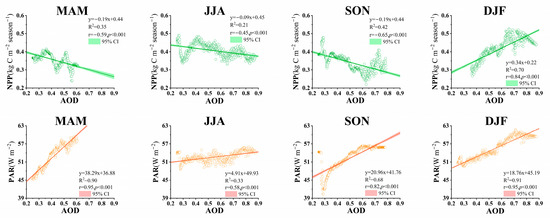
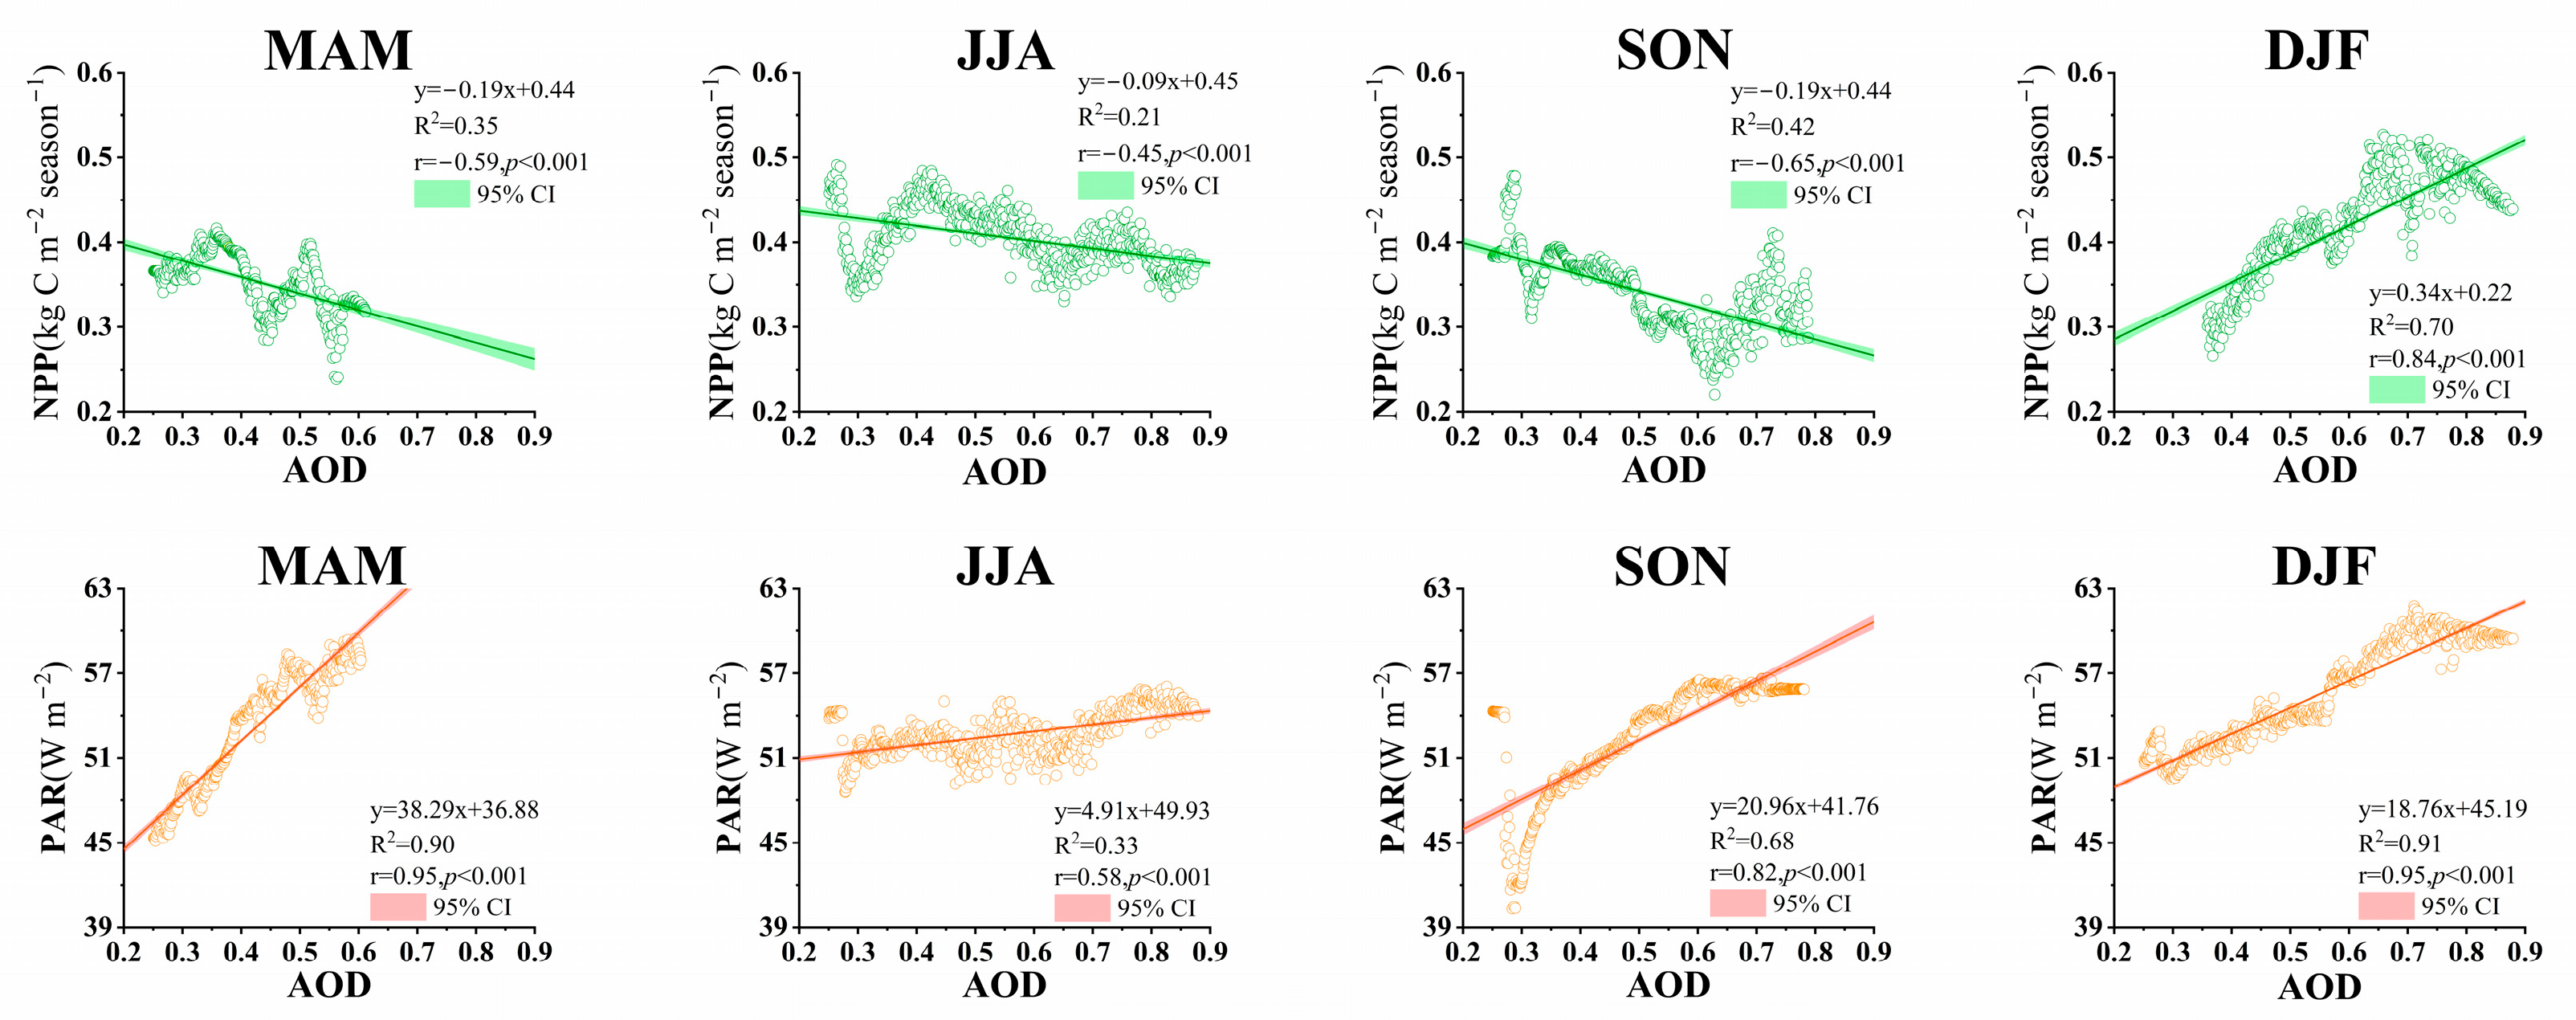
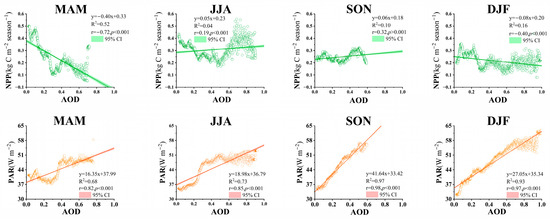
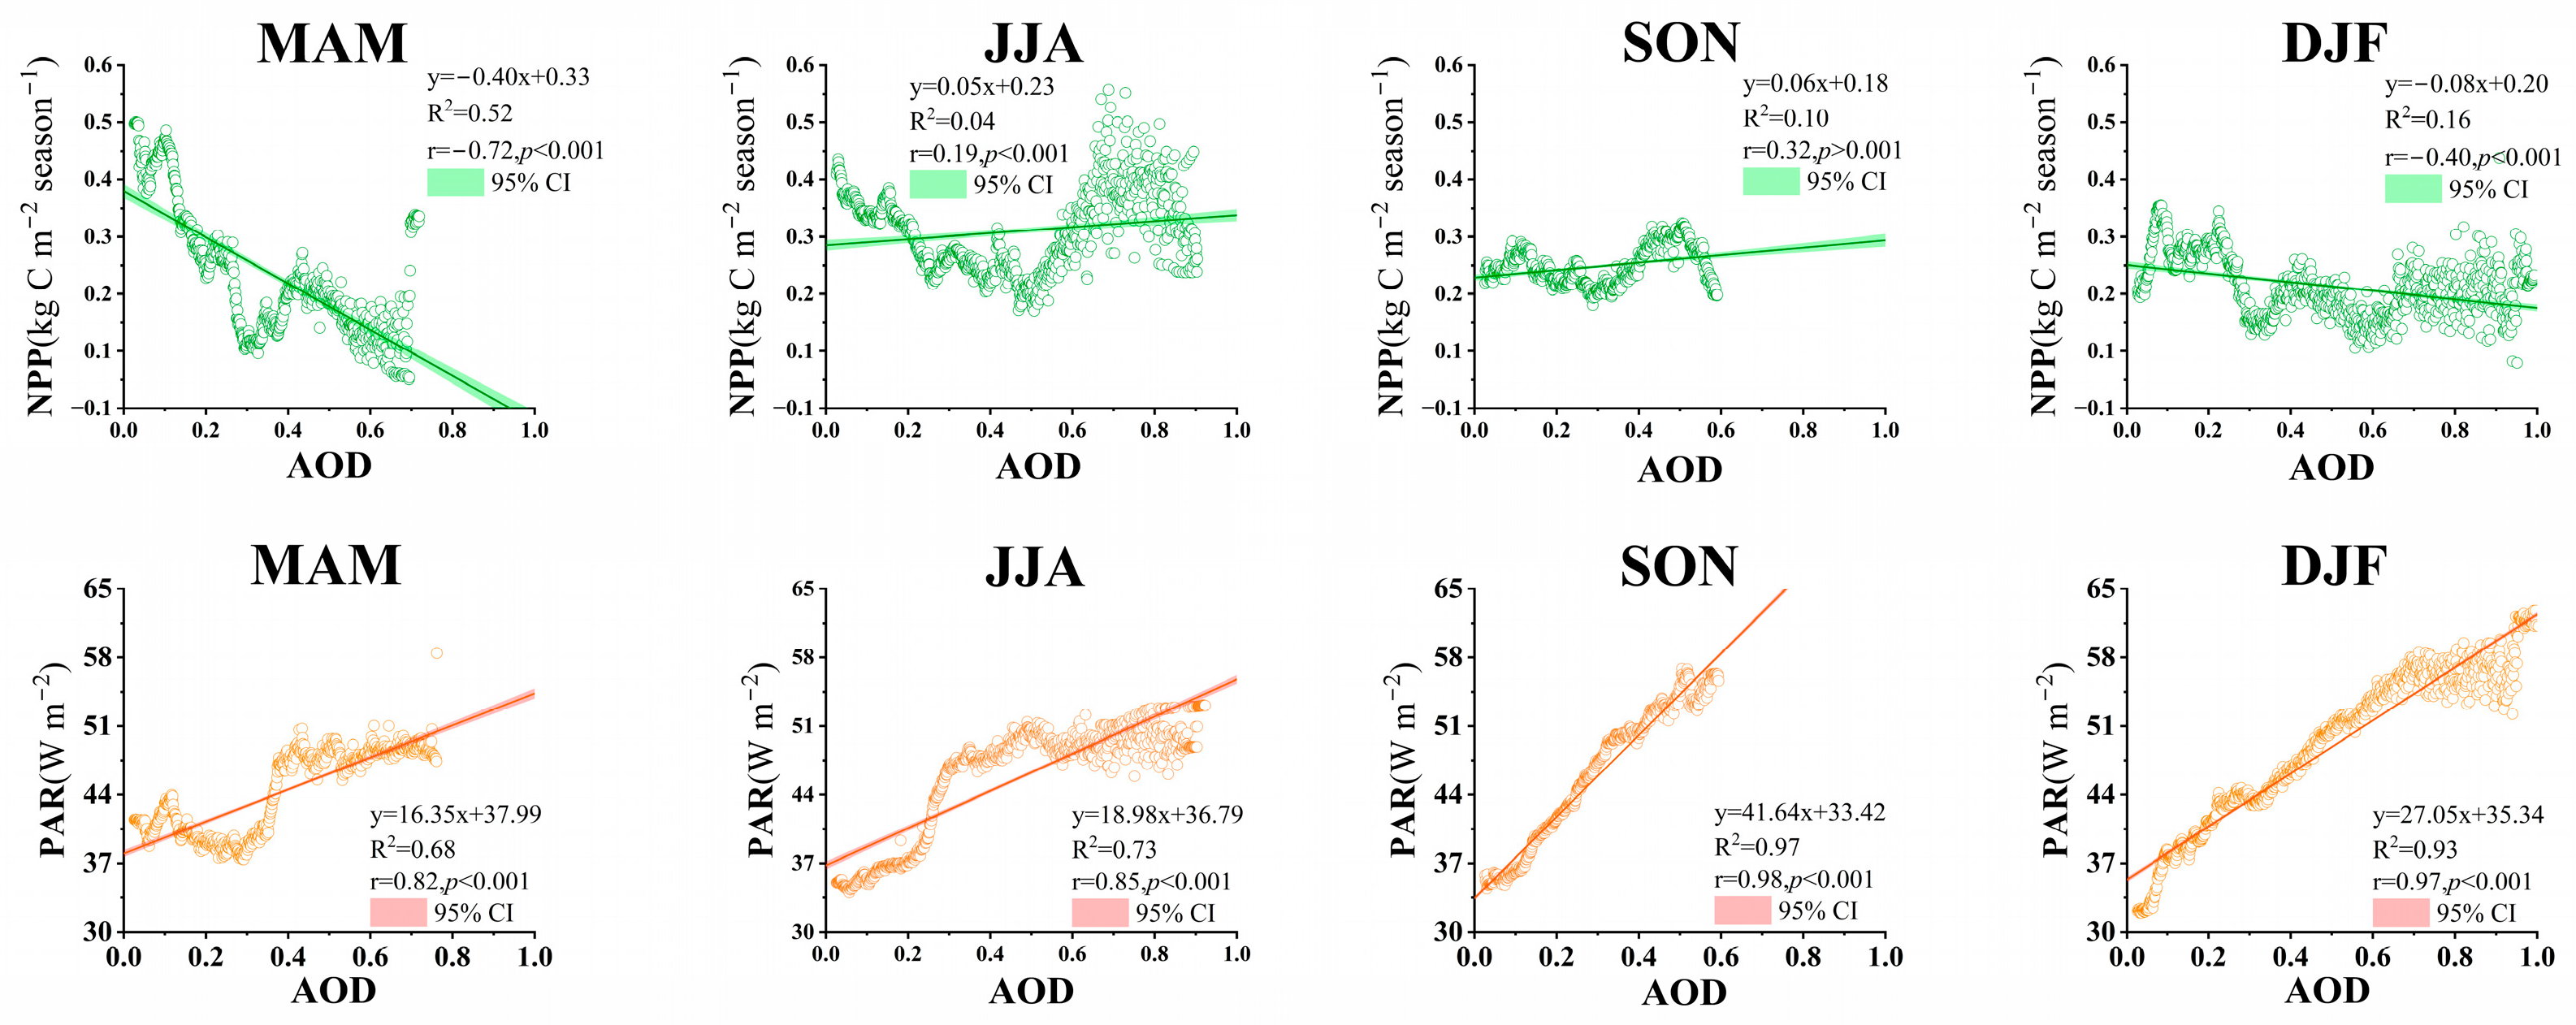
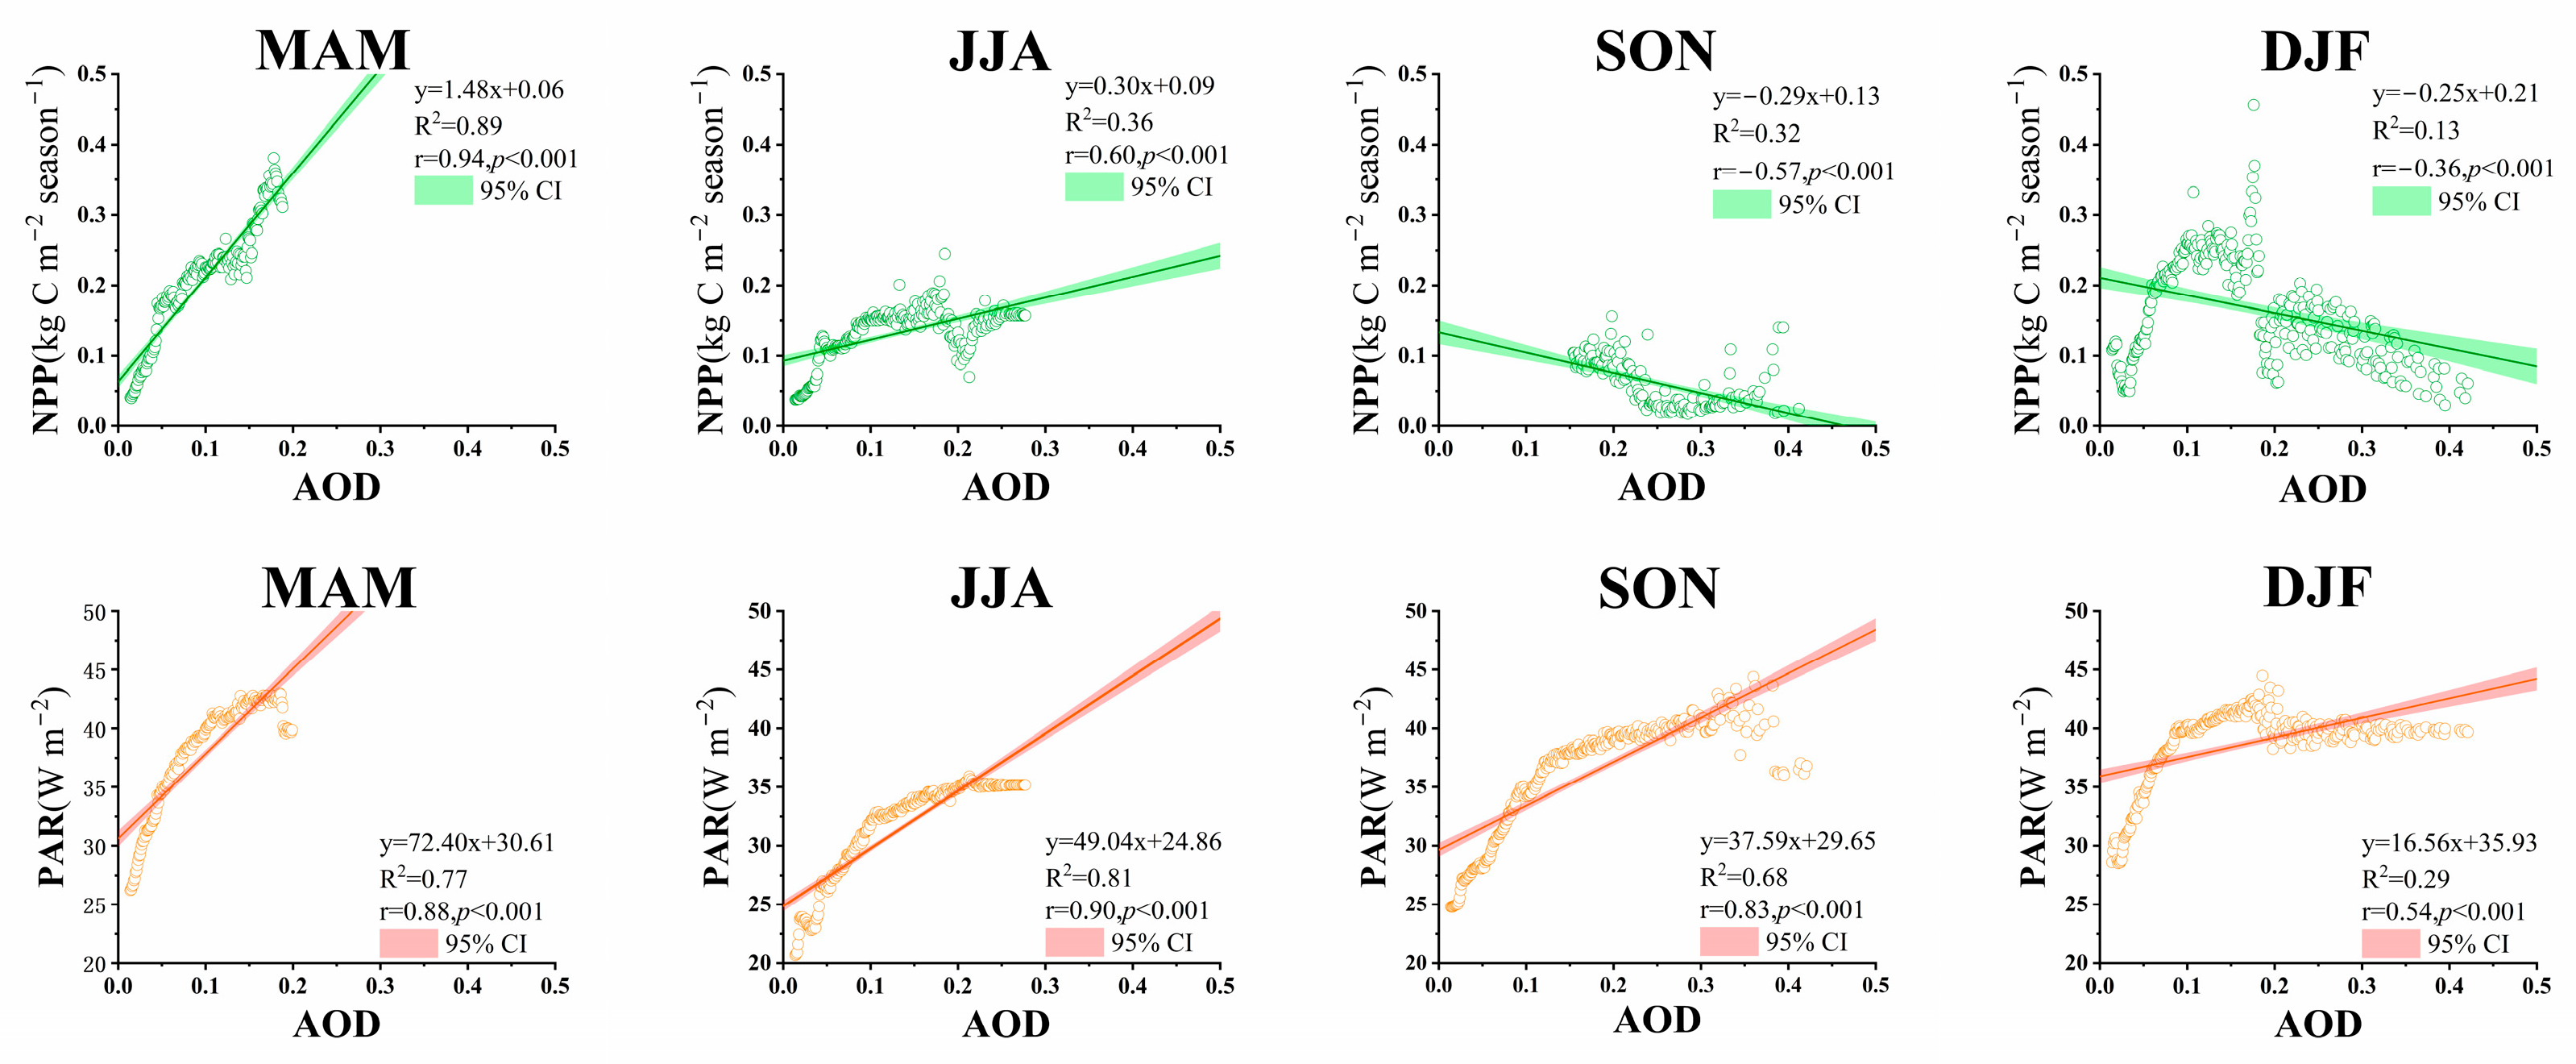
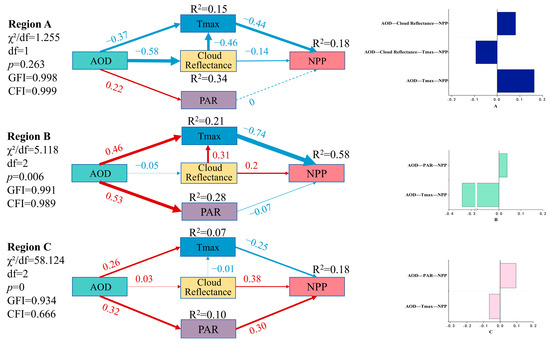
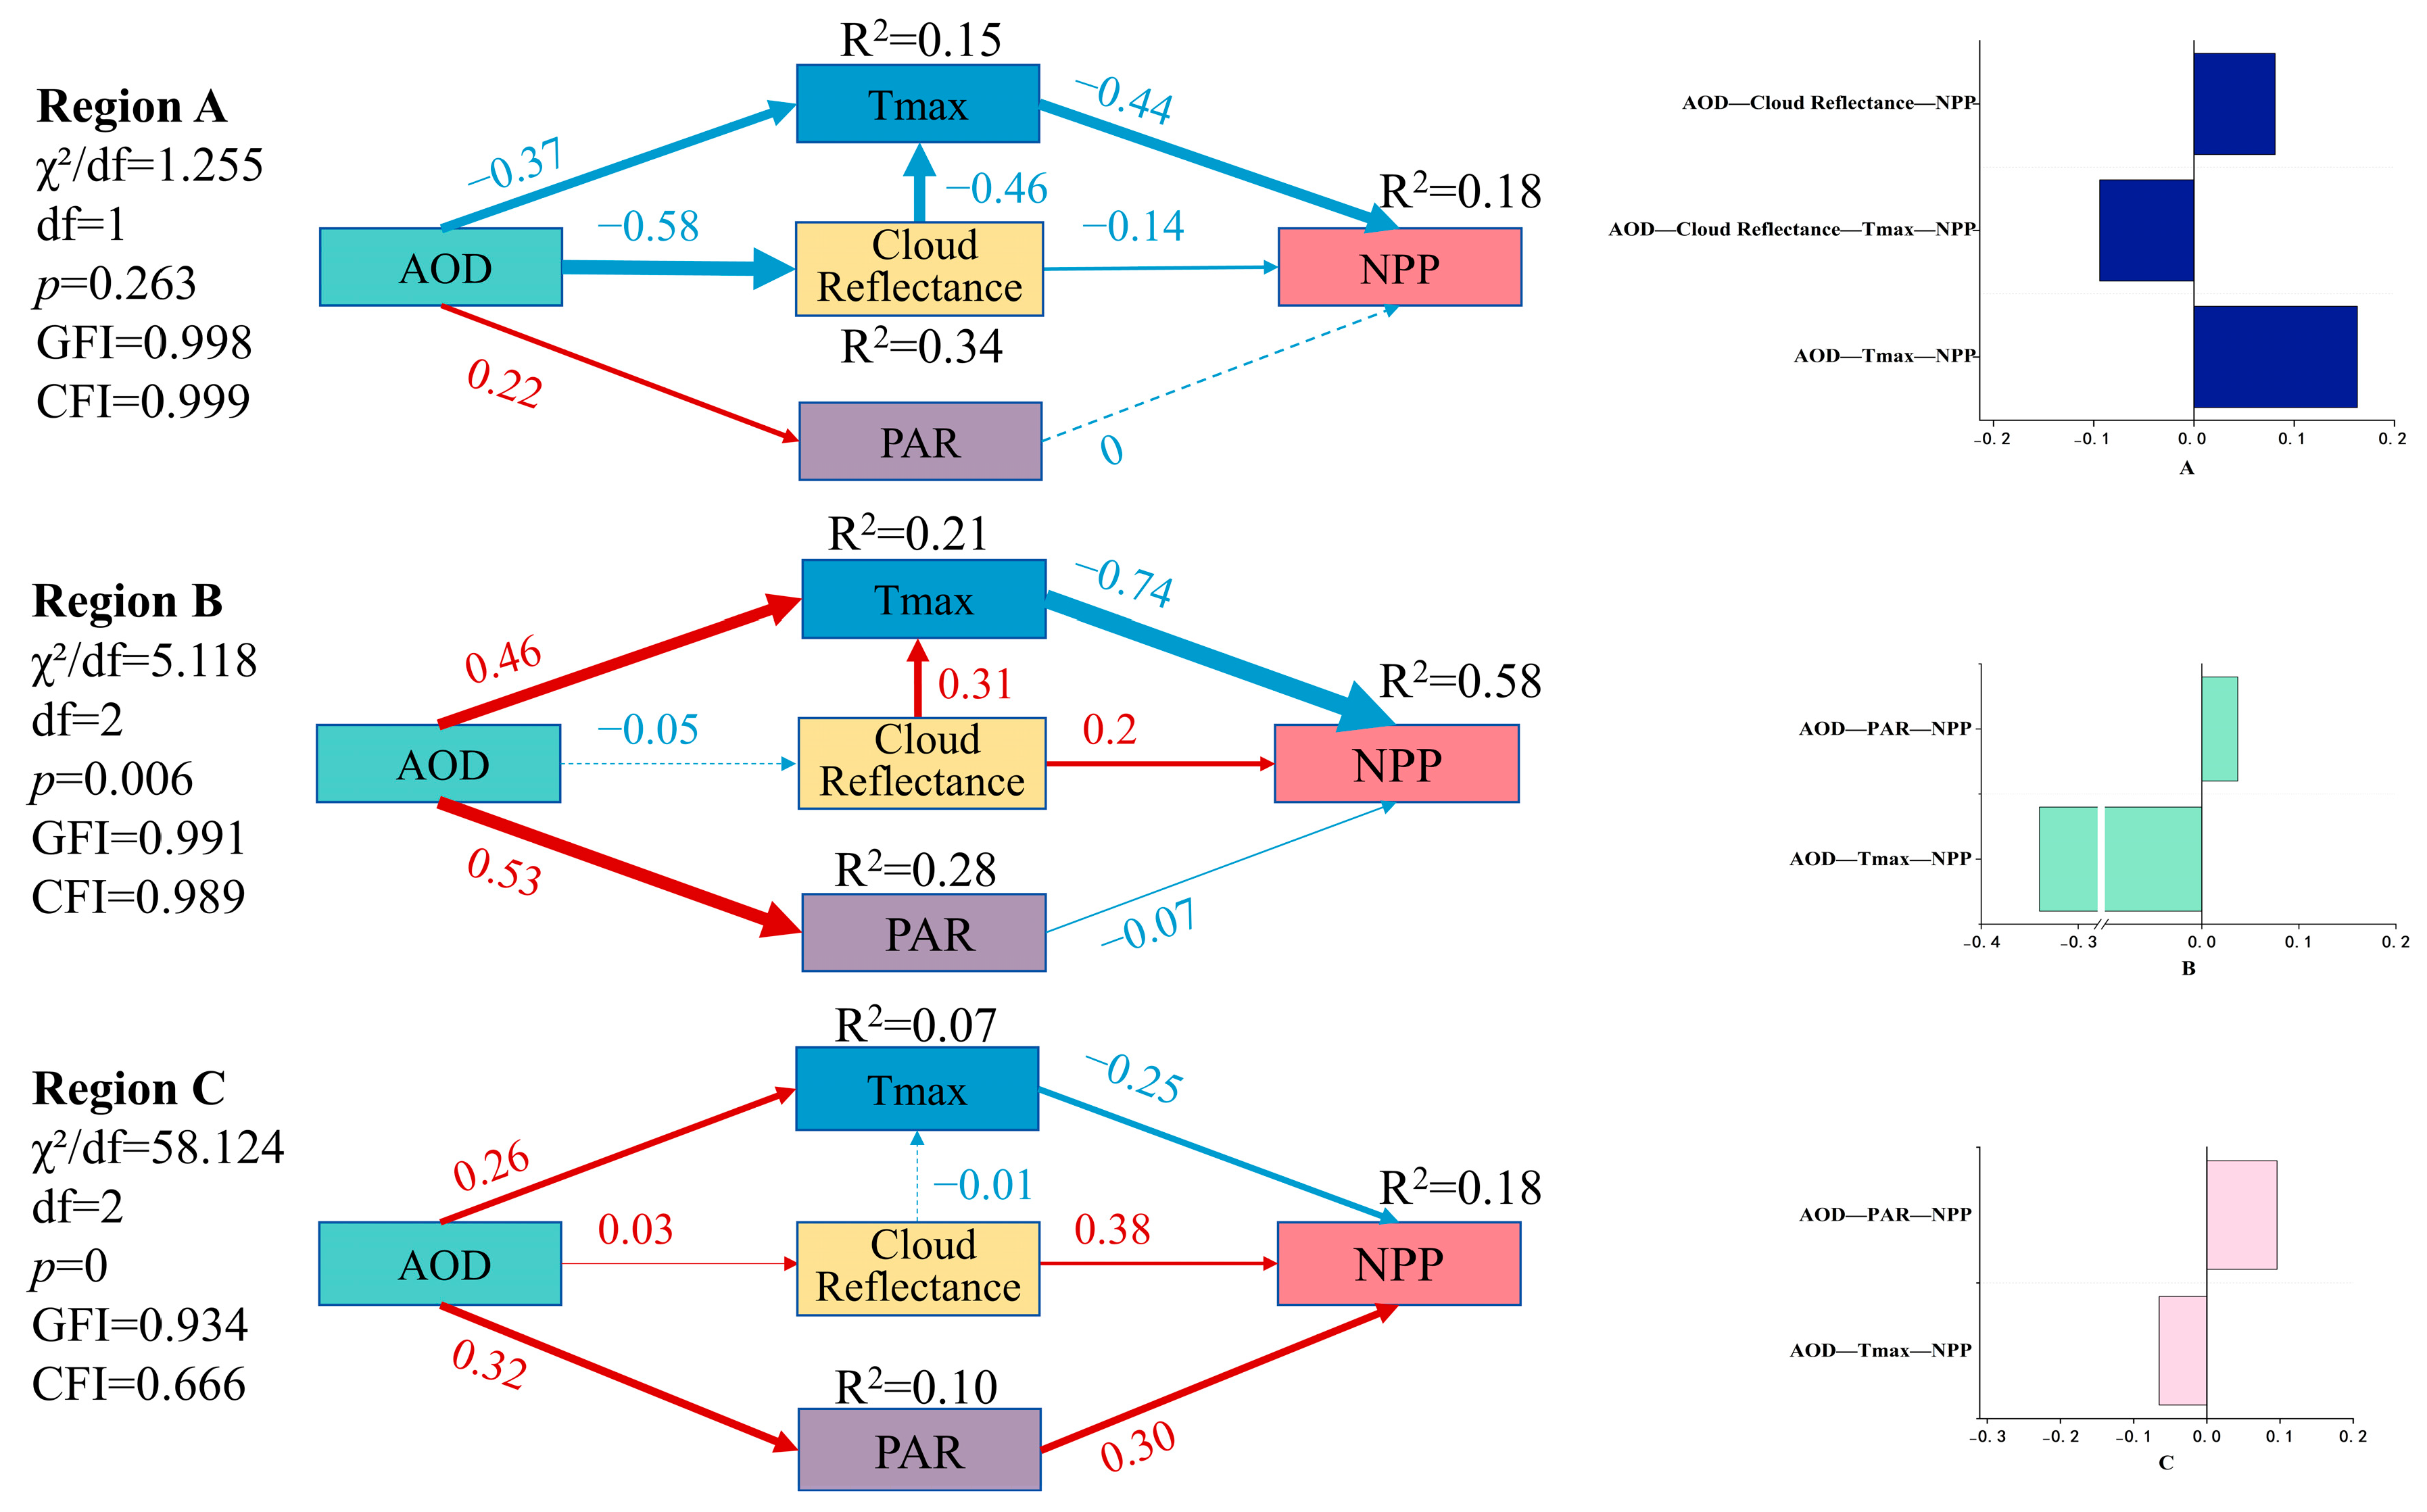

Disclaimer/Publisher’s Note: The statements, opinions and data contained in all publications are solely those of the individual author(s) and contributor(s) and not of MDPI and/or the editor(s). MDPI and/or the editor(s) disclaim responsibility for any injury to people or property resulting from any ideas, methods, instructions or products referred to in the content. |
© 2026 by the authors. Licensee MDPI, Basel, Switzerland. This article is an open access article distributed under the terms and conditions of the Creative Commons Attribution (CC BY) license.