


Abstract
Naphthalene and methylnaphthalene (Nap and MN) are the most abundant polycyclic aromatic hydrocarbons (PAHs) and are important precursors of secondary organic aerosol (SOA) in the atmosphere. 1.2-Phthalic acid (1,2-PhA) and 4-methylphthalic acid (4-MPhA) are usually treated as tracers of SOA from Nap and MN. However, the two tracers also have primary sources, and directly using the tracers to estimate SOA would lead to an overestimation. In this study, we conducted a one-year synchronous observation of the two-ring PAH SOA (SOA2-rings) tracers at nine sites in the Pearl River Delta (PRD) region. We measured and filtered the suitable emission characteristics of SOA2-rings tracers for biomass burning, coal combustion, industrial processes and vehicle exhaust sources. Then, we developed a method to distinguish 1,2-PhA and 4-MPhA from primary emissions and secondary formation. The average proportions of 1,2-PhApri and 4-MPhApri in 1,2-PhA and 4-MPhA were 26.7% and 29.2%, respectively. The direct application of measured 1,2-PhA for estimating SOA2-rings would lead to an overestimation exceeding 30% in the PRD. Furthermore, we estimated SOA2-rings using the separated 1,2-PhAsec and 4-MPhAsec by the tracer-based method. The average contribution of MN to SOA was around three times that of Nap. In addition, when combined with monocyclic aromatic SOA (SOA1-ring) and biogenic SOA, the contributions of SOA1-ring (21%) and SOA2-rings (25%) to total SOA were comparable. SOA2-rings was even the largest contributor to total SOA (~44%) in winter. This study revealed that whether to separate the SOA2-rings tracers for primary emissions and secondary formation is essential in SOA estimation and highlighted that two-ring PAHs make a significant contribution to SOA in the PRD.
1. Introduction
Secondary organic aerosol (SOA) is formed through homogeneous or heterogeneous reactions of volatile organic compounds (VOCs) in the atmosphere [1,2], and it is the most abundant component in organic aerosol (OA) [3,4,5]. Human activities emit quantities of anthropogenic pollutants into the atmosphere, leading to the formation of substantial anthropogenic SOA. Field observations have further confirmed that anthropogenic SOA could even dominate over biogenic SOA (BSOA) at urban sites [6]. Aromatic hydrocarbons, mainly emitted from coal combustion, transportation, solvent use and biomass burning, have been regarded as the major class of anthropogenic SOA precursors for a long time [6].
Recent studies demonstrated that polycyclic aromatic hydrocarbons (PAHs), especially two-ring PAHs with relatively higher volatility, also contribute substantially to anthropogenic SOA formation and should be taken into account [7,8]. Fang et al. reported that SOA derived from two-ring PAHs could contribute 12.4% of total SOA in the Pearl River Delta (PRD) region [8]. Two-ring PAHs are mainly originated from incomplete combustion of various fuels and solvent use [9,10,11]. Nap and MN are the most abundant two-ring PAHs and serve as key precursors of anthropogenic SOA in the atmosphere [7]. A smog chamber experiment simulated the photochemical oxidation process of diesel vehicle exhaust [12]. They found that Nap and MN are the important components of exhaust, and their oxidation products could contribute up to 54% of SOA [12]. This indicated that two-ring PAHs, especially Nap and MN, could also be important anthropogenic SOA precursors.
However, it should be noted that the relative contributions of Nap and MN to SOA or secondary organic carbon (SOC) are still uncertain. During the field observation of a haze event in Beijing, Huang et al. estimated the SOA formed from the oxidation of Nap and MN. Using the precursor consumption-based method, Nap was calculated to contribute 7.6% of SOA, which was much higher than MN (2.6% of SOA). And the two-ring PAHs contributed 10.2% to the total SOA through the precursor consumption-based method, which was lower than the tracer-based method (14.9%) [7]. Based on the CMAQ model, Ye et al. also reported that Nap contributed 8.1% of aromatic-derived SOC, which was 3 times higher compared to MN (2.4%) in the Yangtze River Delta (YRD) region [13]. Yu et al. evaluated the contribution of VOCs to SOC in the YRD region based on the precursor consumption-based method [14]. After adding Nap and MN to the precursor list, the proportion of SOC explained by SOCVOC increased from 25.3% to 39.5%, and MN replaced toluene as the most significant contributor. However, Nap did not contribute significantly to SOC in the study. Fang et al. estimated SOA from two-ring PAHs in Guangzhou using the precursor consumption-based method, and they found that contributions of Nap and MN to SOA were approximately equivalent [8]. The discrepancies in contributions of Nap and MN to SOA or SOC still exist because different methods and parameters are used in various studies.
The tracer-based method was commonly used to estimate atmospheric SOA in field observations. 1.2-PhA is generated from the hydrolysis of phthalic anhydride [12], which has been confirmed to generate from Nap at high yields [15]; thus, 1,2-PhA could be used as a tracer of SOA from the photooxidation of Nap [16]. 4-MPhA is a product of MN photooxidation and is highly correlated with other anthropogenic SOA tracers like 2,3-dihydroxy-4-oxopentanoic acid (DHOPA) and 1,2-PhA in ambient aerosols [17,18,19]; therefore, it could be used as a tracer of SOA from MN [16,17].
However, some studies found that 1,2-PhA and 4-MPhA also have primary emission sources (e.g., biomass burning, industrial processes, coal combustion, and vehicle exhaust) [11,20,21,22], and their contributions cannot be neglected. Using 1,2-PhA and 4-MPhA as tracers without any modification would lead to a gross overestimation for contributions of two-ring PAHs to SOA or SOC [23,24,25]. For example, during a flight observation over China, 1,2-PhA was used to estimate the two-ring PAH SOC; the calculated two-ring PAH SOC even exceeded the measured OC by a factor of 6 [26], highlighting the need to distinguish the sources (primary and secondary) of 1,2-PhA and 4-MPhA in the air.
In order to clarify the contributions of Nap and MN to SOA or SOC more accurately, we carried out a large-scale and long-term observation activity in the PRD region. The PRD region, in the southern coastal part of China, is one of the most urbanized and industrialized areas of China; anthropogenic emissions in this region are substantial [27,28]. And the concentrations of Nap and MN in the PRD showed an apparent seasonal variation, with the lowest in summer and the highest in winter [29]. The increase in two-ring PAHs during winter would have a high potential contribution to the regional SOA. In this work, we measured the primary emission characteristics from the main primary sources for 1,2-PhA and 4-MPhA. Furthermore, we distinguished the primary emission and secondary formation parts of 1,2-PhA and 4-MPhA based on field observations at nine sites in the PRD region. Finally, using the tracer-based method, we used the revised 1,2-PhA and 4-MPhA data to estimate SOA2-rings and evaluate the contribution of SOA2-rings to total SOA in the PRD region.
2. Methodology
2.1. Field Sampling
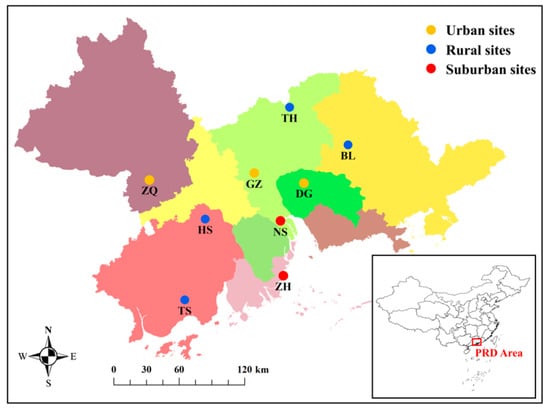
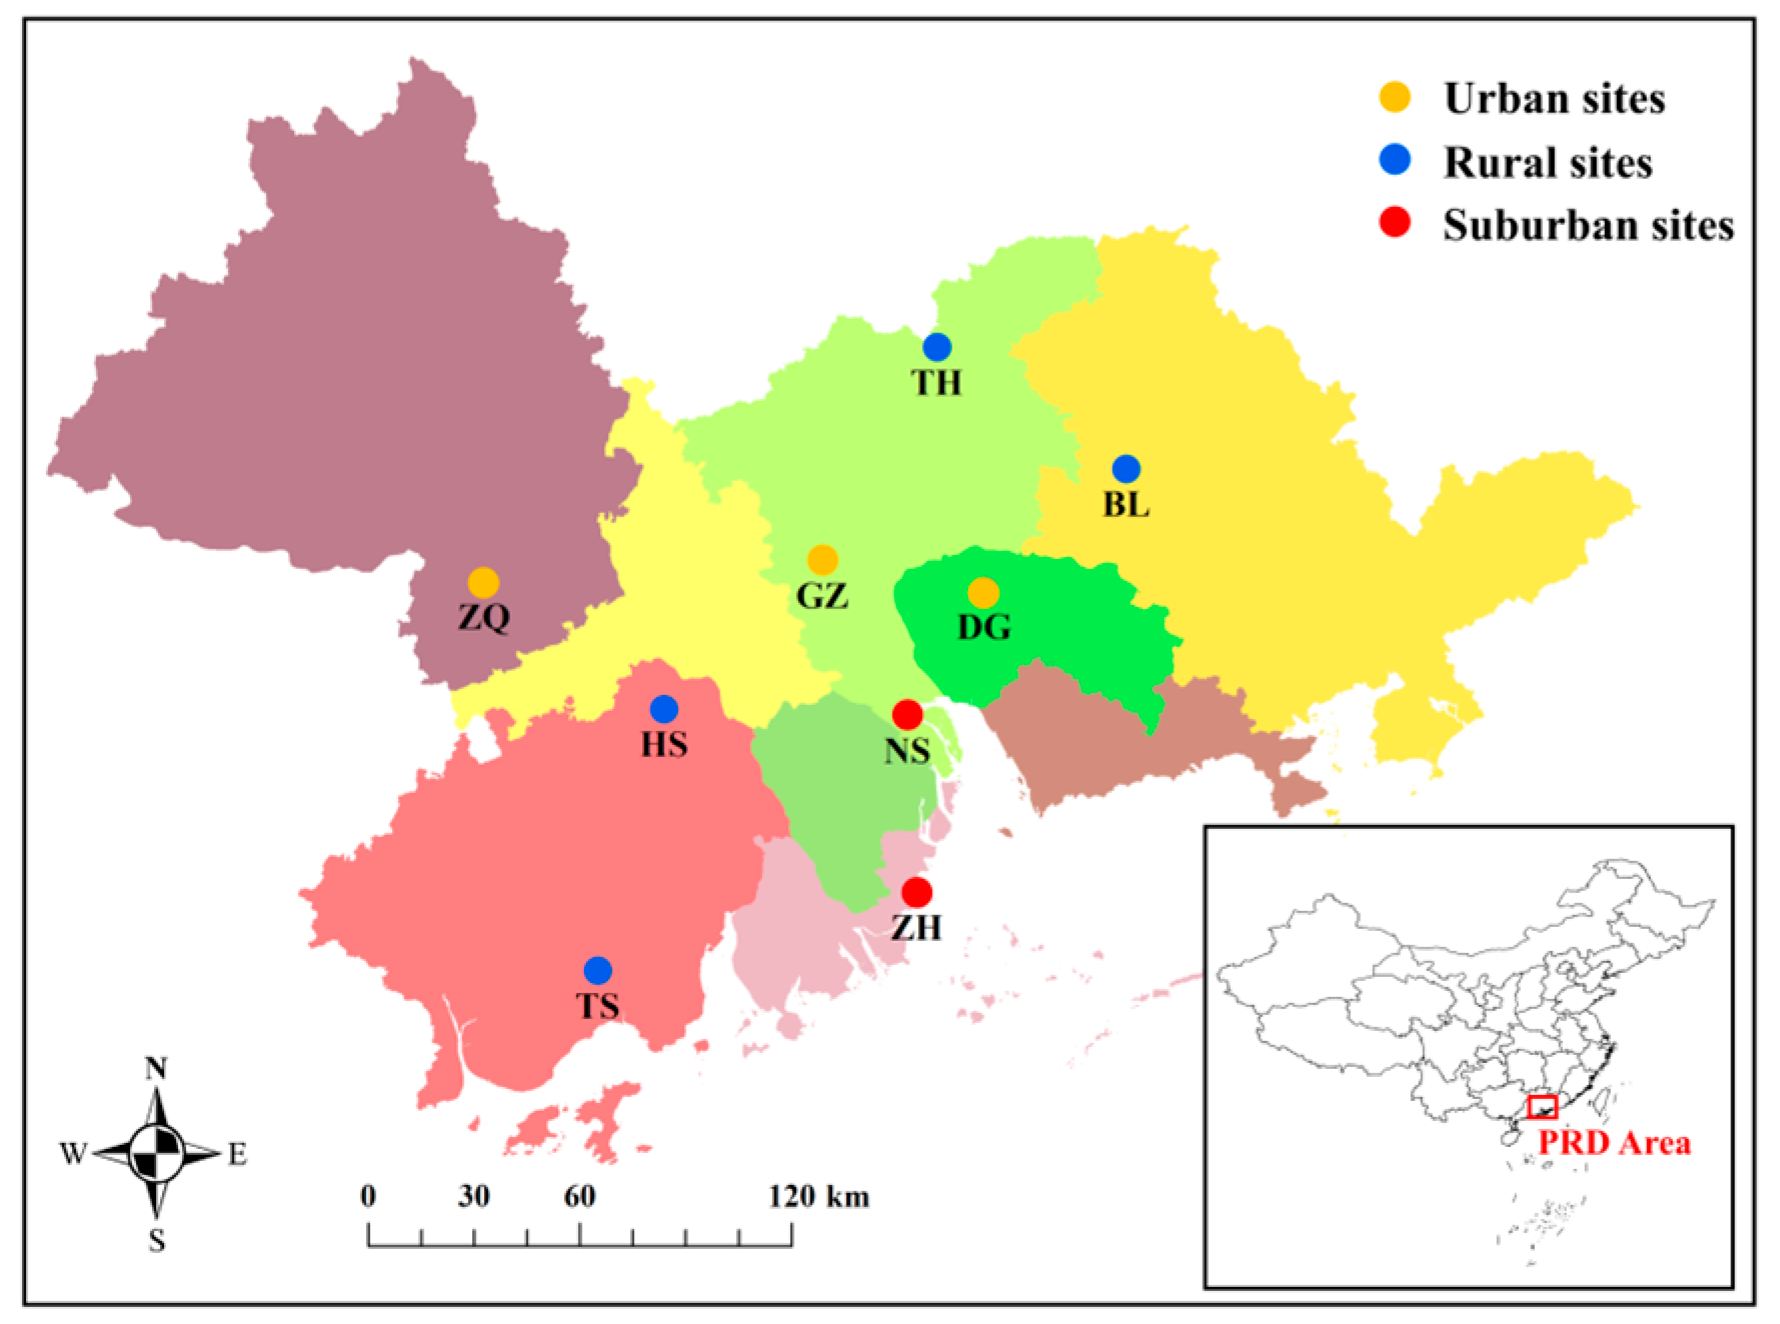
In order to get a more comprehensive understanding of the pollutant levels in the PRD region of China, a concurrent sampling campaign was conducted at 9 sites during 2015 (Figure 1). These sites included 3 urban sites in Zhaoqing (ZQ), Guangzhou (GZ), and Dongguan (DG); 2 suburban sites in Zhuhai (ZH) and Nansha (NS); and 4 rural sites in Boluo (BL), Taishan (TS), Heshan (HS), and Tianhu (TH). Detailed information about these sites can be found in our previous studies [27,30]. At each site, 24 h samples were collected every 6 days from January to December in 2015 on pre-baked quartz filters (8 × 10 inches) using a high-volume PM2.5 sampler at a flow rate of approximately 1.1 m3 min−1. Field blanks were collected at each site every month. Samples collected in January, April, July, and October were selected to represent PM2.5 properties during winter, spring, summer, and fall, respectively. This sampling protocol follows the established methodology for atmospheric research in South China [30,31,32,33]. And these four months could well reflect the meteorological characteristics of the four seasons. Temperature and relative humidity during the sampling periods were within ±10% deviation of the long-term seasonal means. We analyzed a total of 170 samples and 19 blanks in this study, about 4 to 5 samples at each site in each season.
Figure 1.
Sampling sites in the PRD region, including 3 urban sites, Zhaoqing (ZQ), Guangzhou (GZ), and Dongguan (DG); 2 suburban sites, Zhuhai (ZH) and Nansha (NS); and 4 rural sites, Boluo (BL), Taishan (TS), Heshan (HS), and Tianhu (TH).
2.2. Emission Source Sampling
Five coal samples from different regions in China were collected, including Ping Ding Shan (PDS), Xuan Wei (XW), Lin Fen (LF), Qin Yuan (QY), and Jin Cheng (JC). Combustion experiments were conducted in a controlled environment chamber to simulate cooking and heating processes in a honeycomb briquette stove, a common household appliance in China. The combustion experiment followed this sequence: The first honeycomb briquette was ignited at the base of the stove using charcoal. After burning for 1 h, the second briquette was added, followed by the removal of the charcoal ash. The third briquette was introduced after the second had burned for an additional hour. The stove was then transferred to the combustion chamber for immediate sampling. During sampling, particulate matter was collected on a quartz fiber filter (Whatman). Details of coal samples and sampling information were described in a previous study [34].
The on-site open biomass burning experiments were conducted in a field in the rural area of Guangzhou. Six types of biomass commonly used for heating and cooking in rural areas of China were examined, including four types of straw (wheat straw, soybean straw, rice straw and corn straw) and two kinds of pine (pine needles and pine branches). Particulate matter was sampled using an Anderson sampling device positioned both upwind and downwind. All samples were collected on quartz fiber filters that were pre-baked at 450 °C for organic contamination removal. The sampling was conducted at a constant flow rate of 28.3 L/min. The net compound concentration was then calculated by subtracting the upwind concentration from the downwind concentration.
Samples of the PM2.5 from typical small- and medium-sized biomass combustion boilers were collected at 12 factories in Guangzhou, China. The PM2.5 collection was carried out by using smoke nozzles to extract the flue gas at a height of 1.5 to 7 m from the ground at each sampling point. Then, a dilution channel sampler was used to dilute the flue gas by a certain proportion, and PM2.5 samples of the flue gas were collected. The sampling flow rate was 16.7 L min−1.
All source and environmental samples were analyzed using identical chemical methods, as detailed in Section 2.3.
2.3. Chemical Analysis
The meteorological parameters (temperature and relative humidity), gaseous pollutants (SO2, CO, NO2, NO, and O3), organic carbon (OC), elemental carbon (EC), biogenic SOA tracers, DHOPA (tracer of SOA1-ring) and other major PM2.5 components at the 9 sites were reported in our previous studies [27,30]. In this study, we measured two SOA2-rings tracers (1,2-PhA and 4-MPhA). An isotopically labeled standard (phthalic acid-3,4,5,6-d4) was added to the samples as an internal standard. Then, the samples were sonicated in mixed organic solvents of hexane/dichloride methane (1:1, v:v) and methanol/dichloride methane (1:1, v:v) for extraction. The extracts of each sample were combined, filtered, and concentrated to approximately 2 mL. Subsequently, the concentrated solution was used for methylation.
The methylated samples were analyzed through an Agilent gas chromatography/mass spectrometer (GC/MS, 7890/5975C), which was operated in the scan mode with a 30 m HP-5 MS column (i.d. 0.25 mm, film thickness 0.25 μm) with an electron impact (EI) ionization source. The initial GC temperature was set at 65 °C and held for 2 min, then increased to 290 °C at a rate of 5 °C min−1, and maintained for 20 min. A more detailed analytical process of SOA tracers was previously described elsewhere [6]. 1,2-PhA and 4-MPhA were quantitatively determined by the internal standard approach. Table S2 summarizes the concentrations of the two compounds at each sampling site in the PRD region.
2.4. Quality Assurance and Quality Control
The data reported in this study were corrected by field blank values. We analyzed the spiked samples to evaluate the recoveries of the analytical procedures. The results indicated that the recoveries of the analytical method were 92 ± 6% for 1,2-PhA and 95 ± 8% for 4-MPhA. The relative standard deviations of repeated analyses for the target compounds in paired duplicate samples (n = 7) were lower than 15%. Considering the errors in field blanks, recovery and repeatability in analysis, the uncertainties of the four-acid analysis were estimated to be 16% and 14% for 1,2-PhA and 4-MPhA, respectively, using the method developed by Stone et al. [35]. The method detection limits (MDLs) were 0.01 ng m−3 for 1,2-PhA and 0.07 ng m−3 for 4-MPhA.
2.5. Statistical Analysis of Measurement Data
Prior to statistical analysis, all raw measurement data underwent quality control procedures. Invalid records due to instrument malfunction or maintenance were removed, and outliers were identified and reviewed. Descriptive statistics, including mean, standard deviation, minimum, and maximum values, were calculated for pollutant concentrations and meteorological parameters. To assess the statistical significance of differences in pollutant concentrations among multiple groups (e.g., different seasons or sampling sites), one-way analysis of variance was employed, with the significance level set at p < 0.05. The relationships between pollutant concentrations and meteorological variables were evaluated using Pearson correlation analysis. All statistical analyses and graphical presentations were performed using Microsoft Office 2019 (Excel).
3. Results and Discussion
3.1. Primary Emission Characteristics of 1,2-PhA and 4-MPhA
1,2-PhA and 4-MPhA have long been suggested to be secondary products of Nap and MN oxidation [12,16,36]. For instance, 1,2-PhA and 4-MPhA correlate well with SOA formation from Nap and MN in chamber experiments [16]. Up to now, 1,2-PhA and 4-MPhA were widely regarded as tracers for Nap- and MN-derived SOA [17,37]. However, some other studies have found that primary combustion sources can also directly emit 1,2-PhA and 4-MPhA [22,38], and their emission cannot be neglected under actual atmospheric conditions. For example, Huang et al. found that primary 1,2-PhA could account for 57–80% of the total 1,2-PhA concentration during haze episodes in Beijing’s winter [7]. Therefore, it will lead to an overestimation when using observational 1,2-PhA and 4-MPhA data to estimate the SOA2-rings directly. In order to estimate a more accurate value of SOA generated from Nap and MN, we need to separate 1,2-PhA and 4-MPhA from the primary emission and the secondary formation.
Primary 1,2-PhA and 4-MPhA are mainly emitted from anthropogenic sources, including biomass burning, industrial processes, coal combustion, and vehicle exhaust [11,20,21]. In this study, we measured the emission characteristics of 1,2-PhA and 4-MPhA from biomass burning, industrial processes, and coal combustion sources (Table S3 and Figure S1).
For the biomass burning source, we determined the 1,2-PhA and 4-MPhA emission characteristics of four types of straws and two kinds of pines. The mass fractions of 1,2-PhA and 4-MPhA in emitted PM2.5 were in the range of 0.014–0.27 ng/μg and 0.006–0.042 ng/μg. For industrial processes, we measured the 1,2-PhA and 4-MPhA emission characteristics of biomass burning boilers, which are widely used in the PRD region, and mass fractions of 1,2-PhA and 4-MPhA ranged from 0.014 to 1.47 ng/μg and 0.001 to 0.044 ng/μg. The emission characteristics of 1,2-PhA and 4-MPhA for coal combustion were determined by using five types of coal from different coal-producing regions in China. The mass fractions of 1,2-PhA and 4-MPhA were measured to be in the range of 0.068–0.368 and 0.005–0.195 ng/μg. In addition, we also systematically collected published data on 1,2-PhA and 4-MPhA primary emission characteristics [11,22,39], and they are summarized in Table S3 and Figure S1.
Zhang et al. investigated the emission characteristics of chemical species from three types of cereal straw under smoldering and flaming conditions in the laboratory [20], and the mass fractions of 1,2-PhA and 4-MPhA in PM2.5 were measured to be 0.14 ± 0.06 ng/μg and 0.01 ± 0.026 ng/μg. The emission characteristics of chemical constituents in PM2.5 from two different coal combustion systems, including industrial boilers and residential stoves burning anthracite, bituminous, and brown coal, have also been investigated [11]. The mass fractions of 1,2-PhA and 4-MPhA emitted by residential stoves were measured to be 0.12–0.34 ng/μg and 0.011–0.028 ng/μg, and the two mass fractions of 1,2-PhA and 4-MPhA emitted by industry boilers were 0.021–0.084 ng/μg and 0.0025–0.0045 ng/μg. Zeng et al. characterized the emission profiles of organic compounds in flue gases from eight categories of stationary sources, encompassing ultra-low emission power plants and typical industries [39], and the mass fractions of 1,2-PhA in PM2.5 were 0.052–0.160 ng/μg. As for vehicle emissions, Cai et al. measured different types of gasoline and diesel vehicle emissions (1,2-PhA: 0.10–1.07 ng/μg; 4-MPhA: 0.0071–0.47 ng/μg) [21].
In summary, we used the weighted mean mass fractions in PM2.5 for 1,2-PhA and 4-MPhA as their primary emission parameters (1,2-PhApri and 4-MPhApri) for each source. Specifically, for biomass burning, we used the average 1,2-PhA and 4-MPhA emission characteristics from our measurements of six types of biomass burning and the data reported by Zhang et al. [20]. Industrial emission characteristics were derived by averaging the data reported in studies by Zhang et al. [11] and Zeng et al. [39] because industrial emissions in the PRD region were predominantly from coal-fired boilers and power plants during our sampling period. Coal combustion emissions were characterized using averaged data from emission characteristics of our measurements of five coal types combined with coal burning data from Zhang et al. [11]. And vehicle emission profiles were obtained by averaging gasoline and diesel vehicle emission characteristics from Cai et al.’s study [21].
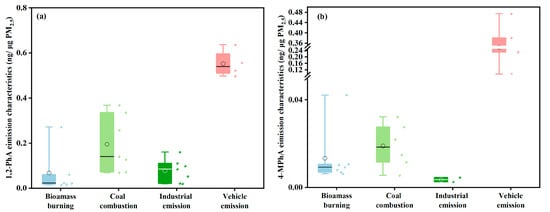
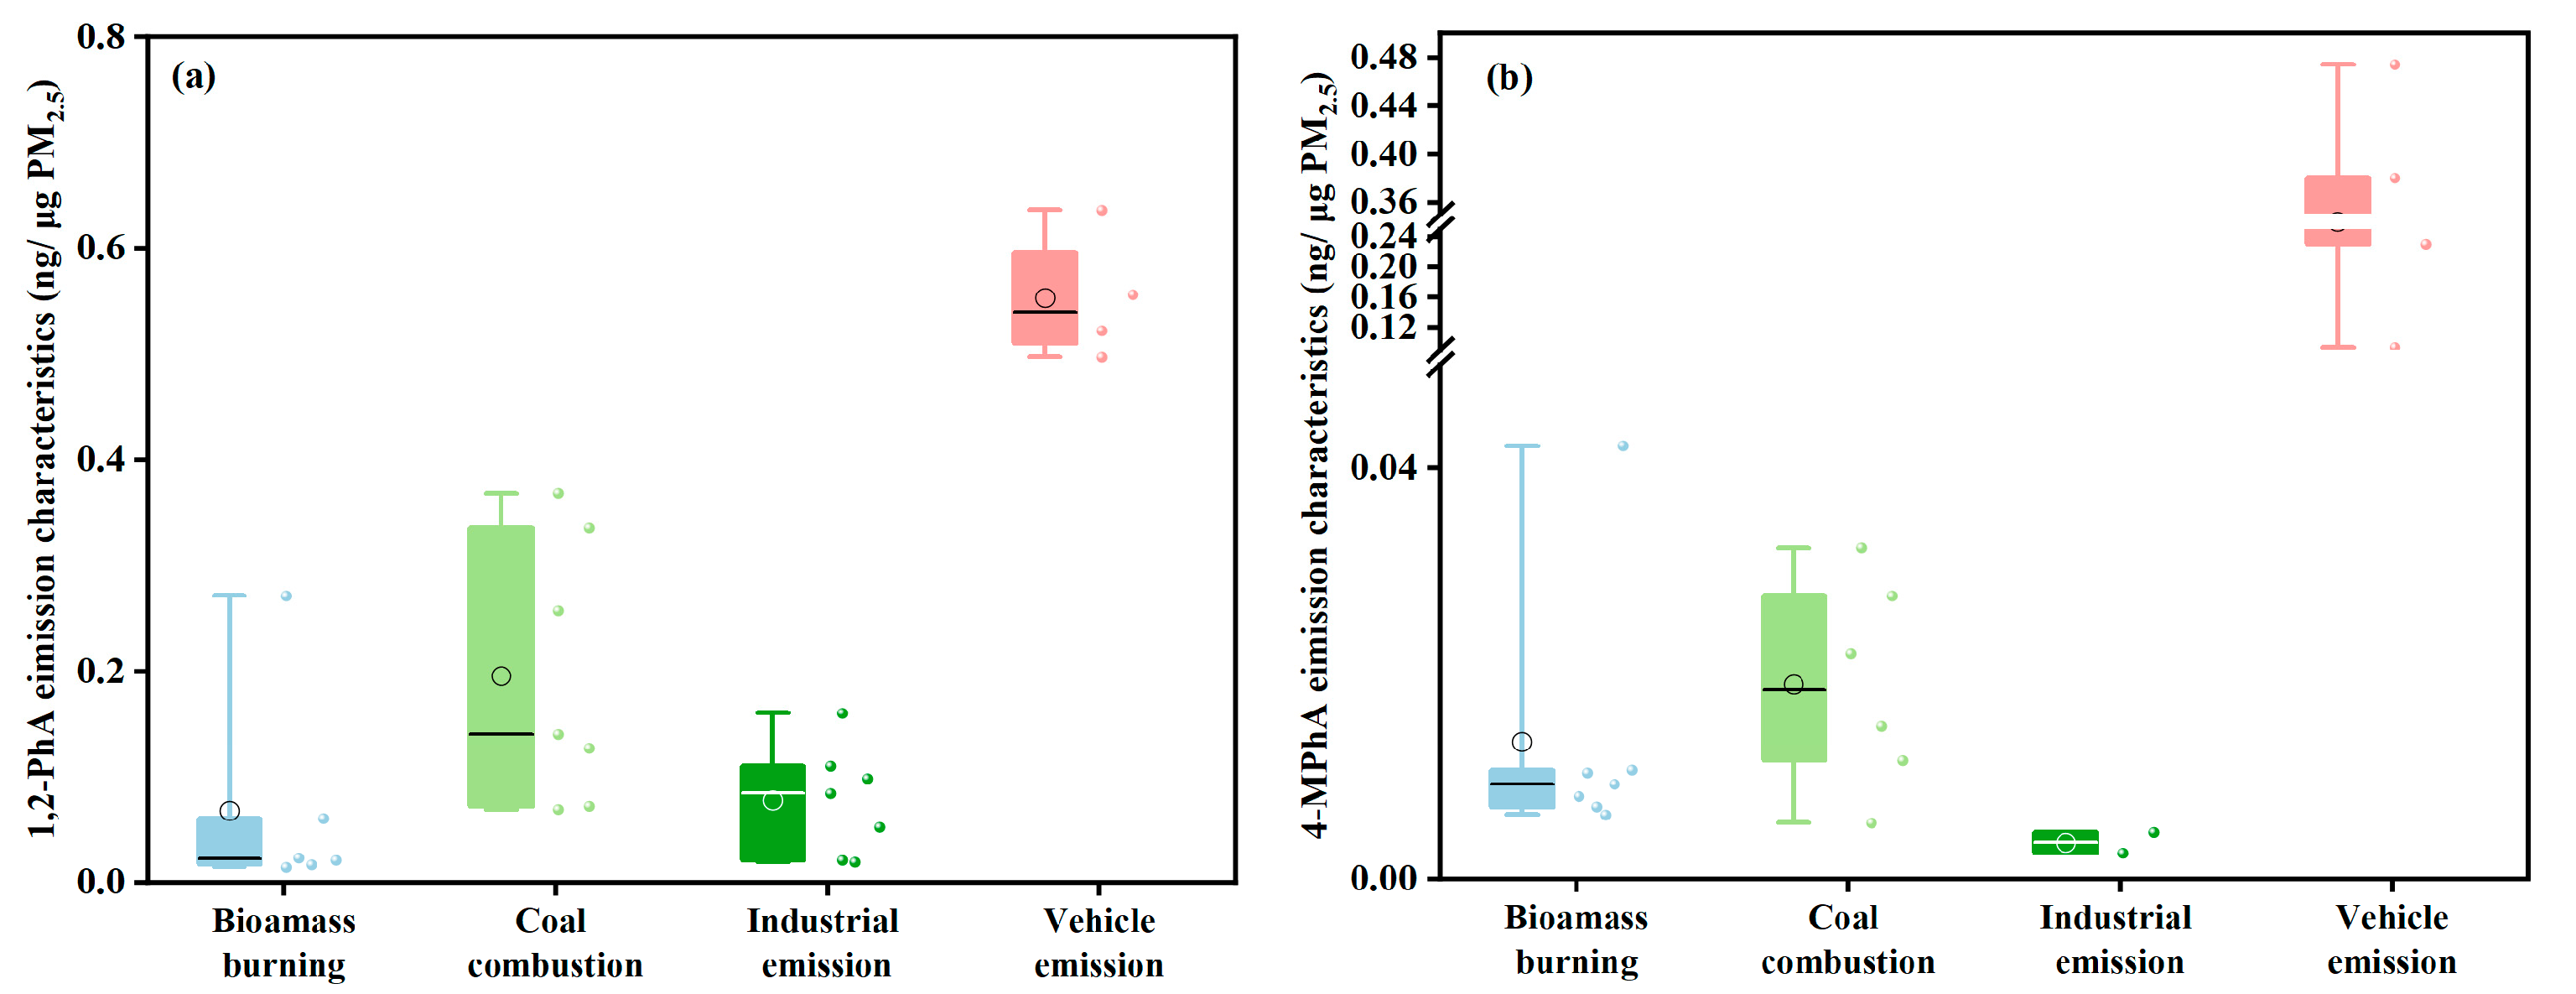
As shown in Figure 2, among the four primary emission sources, vehicle exhaust demonstrated a significantly higher 1,2-PhA emission intensity (0.55 ± 0.13 ng/μg PM2.5), with levels exceeding those from coal combustion (0.19 ± 0.12 ng/μg PM2.5) by more than twofold and exceeding those from biomass burning and industrial emissions by more than fivefold. Compared to 1,2-PhA, 4-MPhA showed significantly lower emission intensity for all four types of sources. Vehicle exhaust exhibited the highest 4-MPhA emission intensity among the four sources, with the mass fractions being 0.24 ± 0.17 ng/μg PM2.5, exceeding the other three sources by an order of magnitude. This suggests that vehicle exhaust may be an important source of primary 1,2-PhA and 4-MPhA in the atmosphere.
Figure 2.
Primary emission characteristics of 1,2-PhA (a) and 4-MPhA (b) from the four sources. The blue columns represent biomass burning, the light green columns represent coal combustion, the dark green columns represent industrial emissions, and the red columns represent vehicular exhaust. Each colored dot indicates an emission characteristic in a source sample. The box with error bars represents 10th, 25th, 75th and 90th percentiles. The white or black horizontal lines represent the median, and the white or black circles represent the average value.
3.2. Distinction of Primary and Secondary Contributions for 1,2-PhA and 4-MPhA
In this study, we used the following method to separate the primary and secondary fractions of 1,2-PhA and 4-MPhA [7]. 1,2-PhApri could be estimated by Equation (1), where (ng PhA/μg PM2.5) refers to the mass fraction of 1,2-PhA in PM2.5 emitted from different emission sources. (%) is the contribution of each source to PM2.5, which was determined by the source apportionment results of PM2.5 in the PRD region during the same sampling period based on positive matrix factorization (PMF) modeling [27]. The PMF source apportionment results indicated that the major PM2.5 sources in the PRD region were: coal combustion (31%), industrial emissions (21%), vehicle exhaust (13%), and biomass burning (7%).
Similar to the estimation method of 1,2-PhApri, 4-MPhApri could be estimated by Equation (2), where refers to the mass fraction of 4-MPhA in PM2.5 emitted from different emission sources and is the contribution of each source to PM2.5 (%).
Based on the above estimated results, 1,2-PhA and 4-MPhA from secondary formation (1,2-PhAsec and 4-MPhAsec) could be calculated by Equations (3) and (4):
where 1,2-PhAobv and 4-MPhAobv are the observed 1,2-PhA and 4-MPhA in this study.
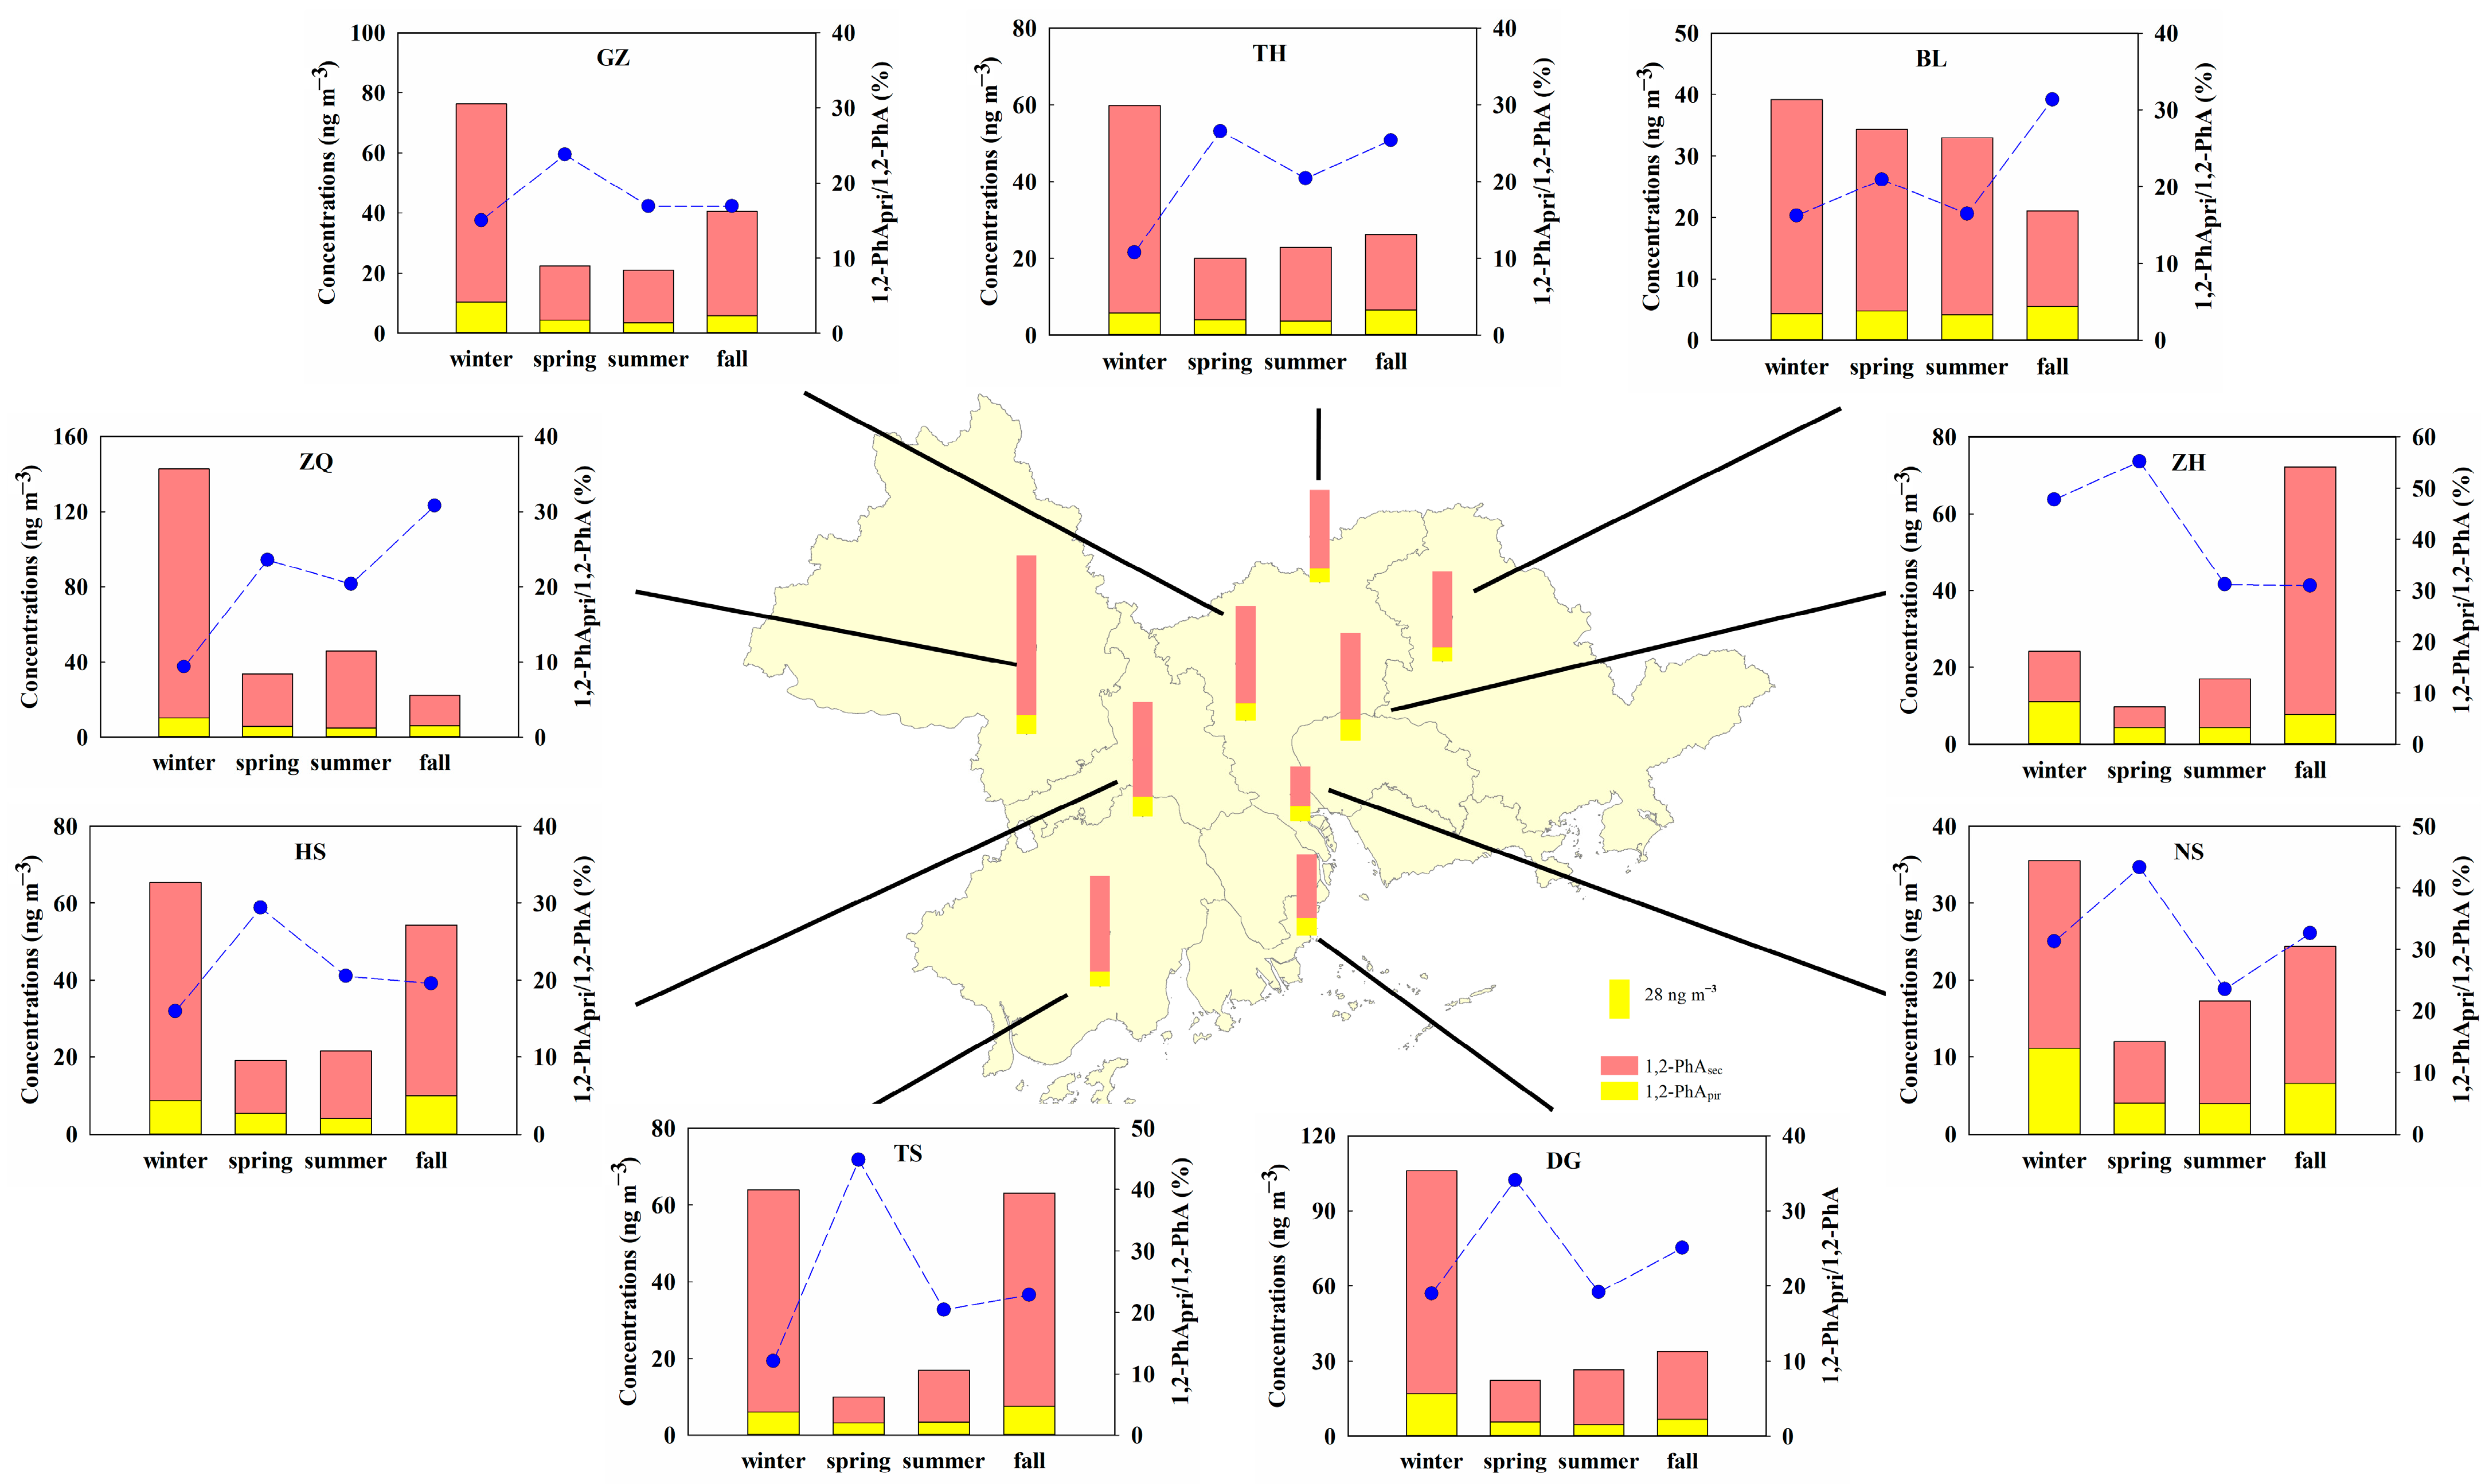
As shown in Figure 3, the annual average concentrations of 1,2-PhApri in the PRD region ranged from 0.62 to 32.9 ng m−3, with a mean concentration of 6.83 ± 1.57 ng m−3. The annual average concentrations of 4-MPhApri ranged from 0.10 to 9.22 ng m−3, with a mean concentration of 1.31 ± 0.46 ng m−3 (Figure S2). The concentration of 1,2-PhApri is higher in urban sites (8.45 ± 6.95 ng m−3) compared to suburban (5.97 ± 4.29 ng m−3) and rural (6.22 ± 4.26 ng m−3) sites. 4-MPhApri concentrations exhibit analogous trends for urban sites (1.83 ± 1.82 ng m−3) and have significantly higher concentrations compared to suburban (1.07 ± 0.76 ng m−3) and rural sites (1.10 ± 0.82 ng m−3). The highest concentrations of 1,2-PhApri and 4-MPhApri were both observed at the ZQ site, with means of 9.78 ± 8.98 ng m−3 and 2.34 ± 0.86 ng m−3, respectively. The lowest concentrations of 1,2-PhApri and 4-MPhApri were both observed at the TH site, with the means of 5.07 ± 2.25 ng m−3 and 0.74 ± 0.37 ng m−3, respectively. ZQ is an important industrial city in the PRD region, which consumes a large amount of energy and emits more anthropogenic pollutants than other cities, while TH is a rural site with lower anthropogenic emissions. In terms of seasonal variations, 1,2-PhApri and 4-MPhApri showed higher concentrations in fall and winter and lower concentrations in spring and summer at all sites (Figure 3 and Figure S2).
Figure 3.
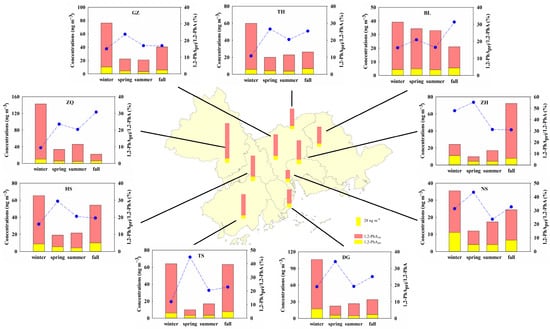
Spatial and seasonal variations in 1,2-PhApri and 1,2-PhAsec at nine sites in the PRD. The bars in the central panel represent the annual average concentrations of 1,2-PhApri and 1,2-PhAsec. The surrounding panels show the seasonal change at each site. The yellow part of the stacked column chart represents 1,2-PhApri, and the pink part represents 1,2-PhAsec. The blue circular dot represents the mass fraction of 1,2-PhApri to 1,2-PhA.
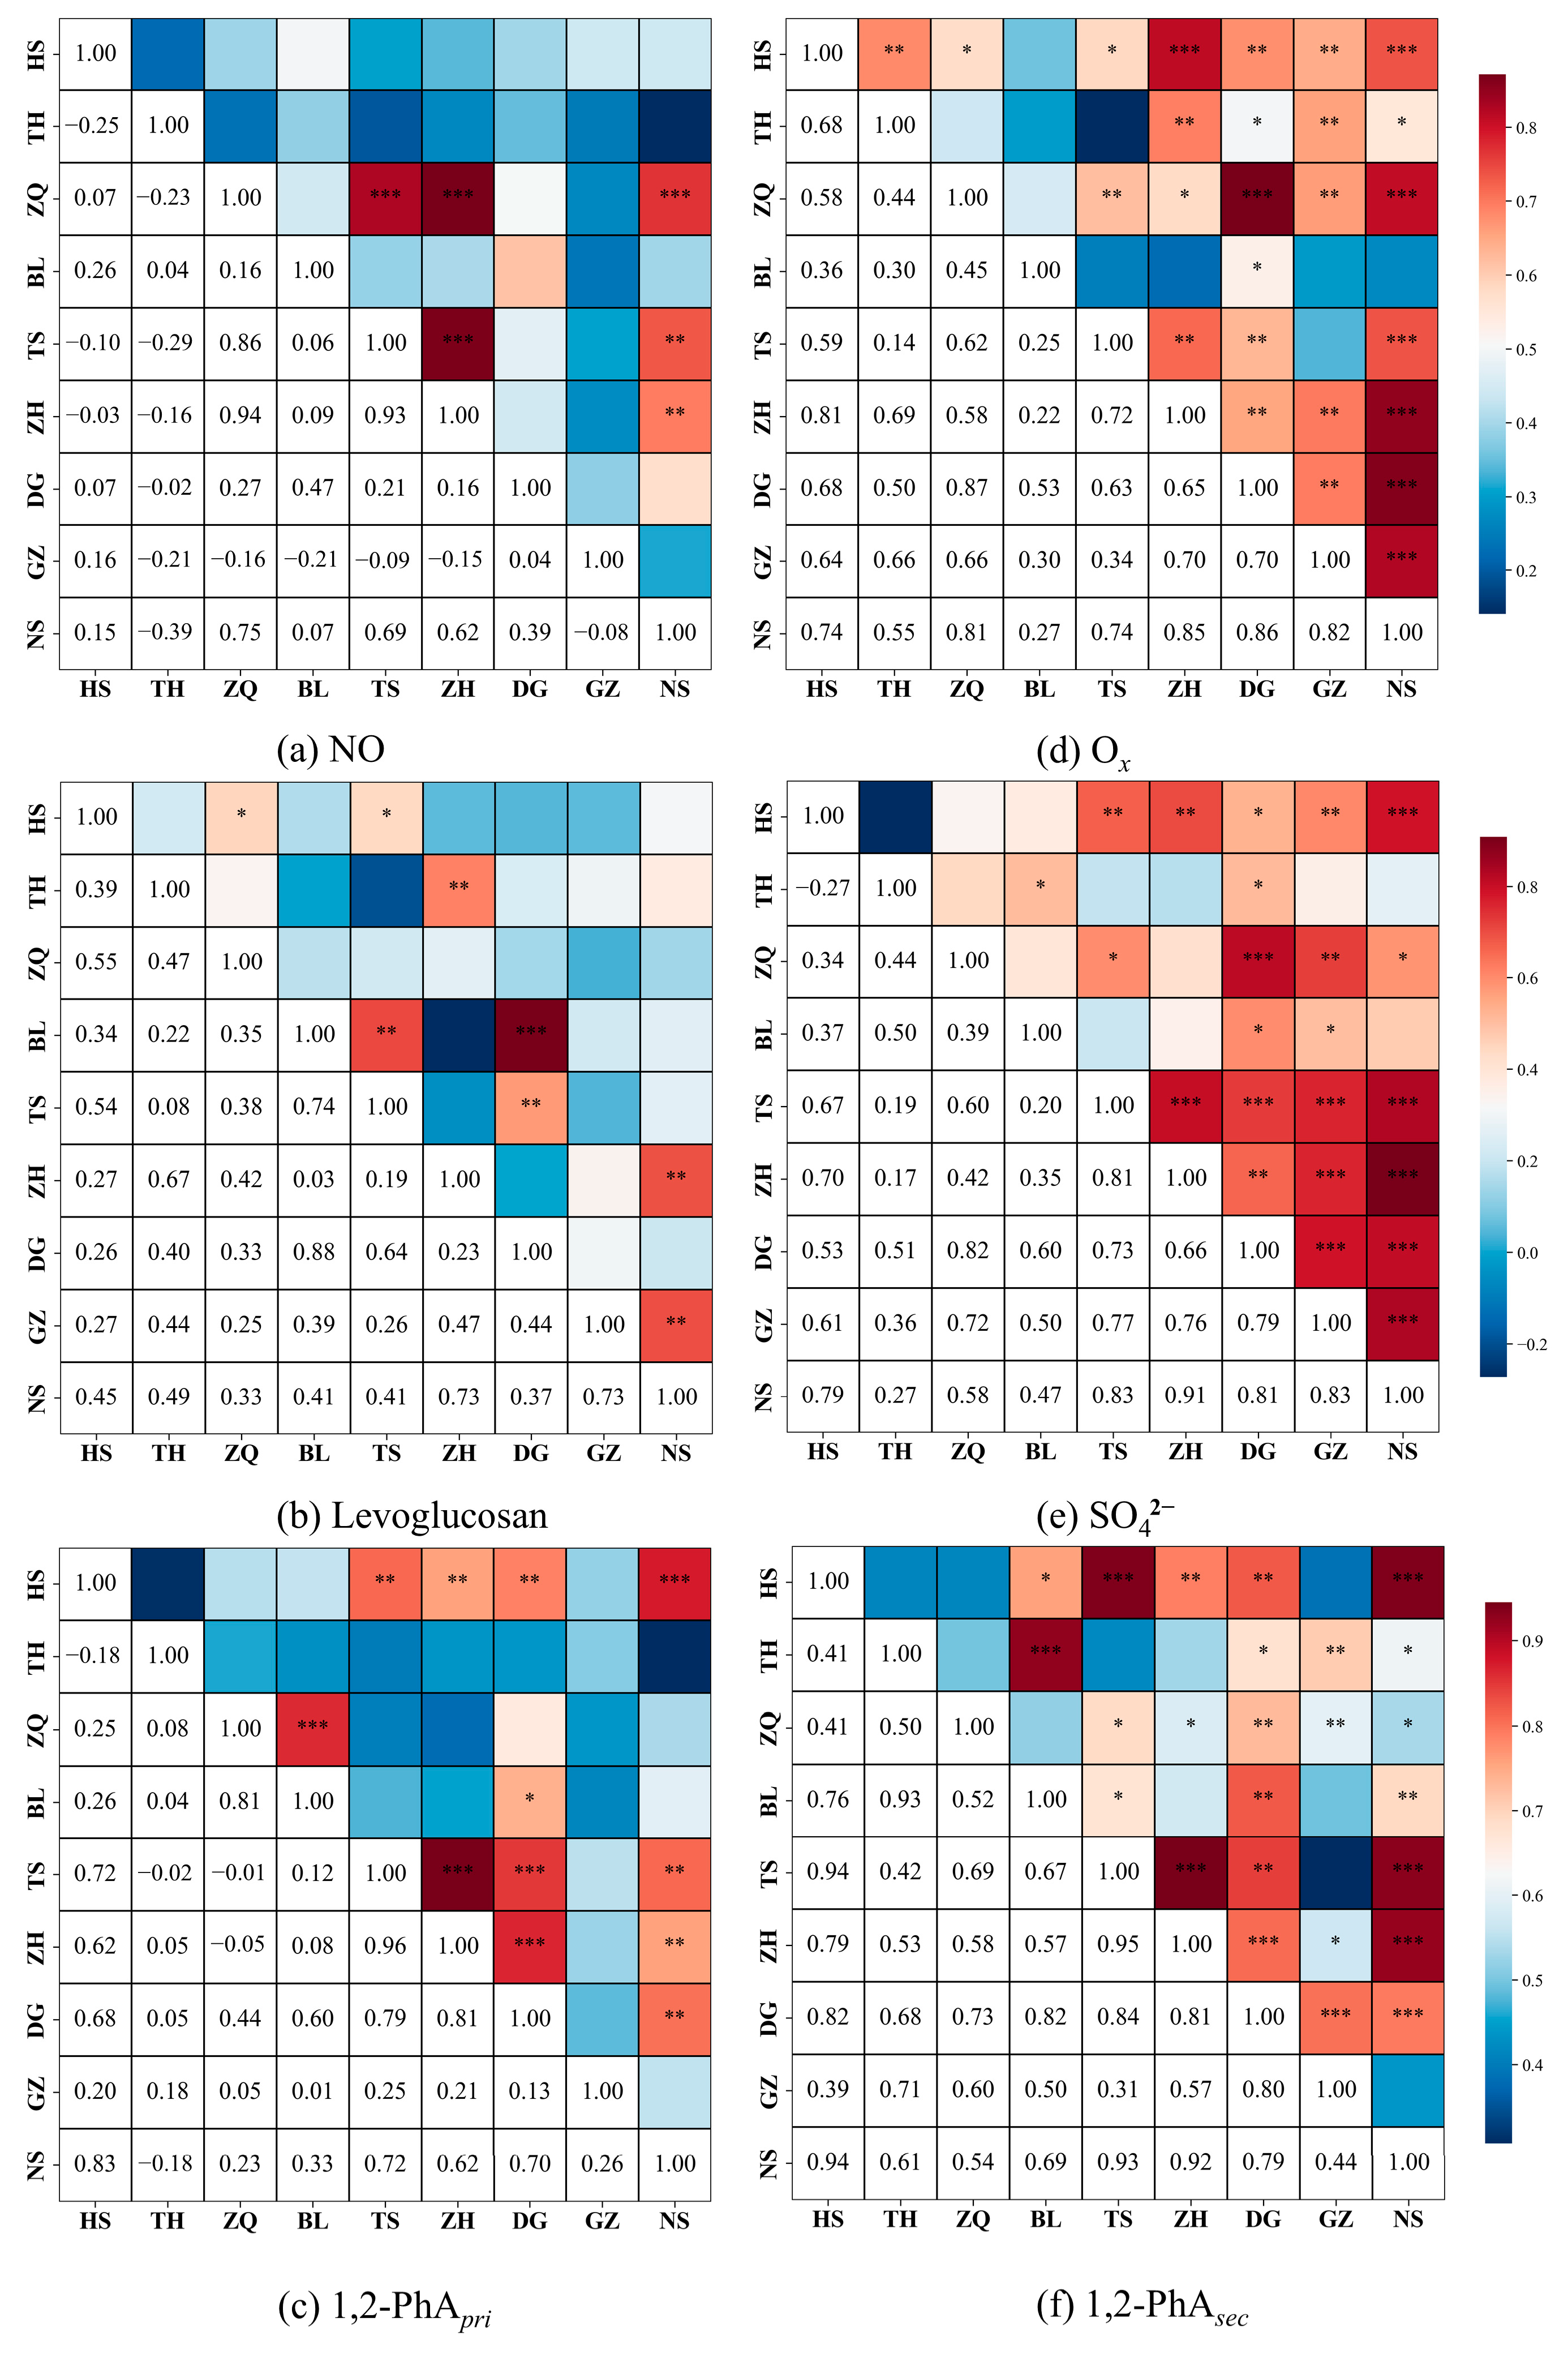
A site-by-site correlation was performed among the nine sites for NO, levoglucosan, 1,2-PhApri, Ox (O3 + NO2), SO42− and 1,2-PhAsec (Figure 4). NO is a characteristic primary pollutant emitted from anthropogenic sources, which serves as an indicator for primary emission processes such as vehicles and power plants. Levoglucosan is predominantly emitted from biomass burning and is usually used for tracing biomass burning sources [40]. Ox and SO42− represent two pivotal categories of secondary pollutants in the atmosphere; their mass concentrations are predominantly determined by atmospheric oxidative ability and precursor concentrations. For correlation analyses involving variables with different sampling frequencies, such as filter-based sample measurements (24 h sampling every 6 days, approximately 18–20 samples per site, total N = 170) and the gaseous pollutant concentrations (hourly automatic monitoring data), the gaseous pollutant concentrations were aggregated to 24 h averages. Only paired data points from the same dates and sites were included in the correlation calculations. As shown in Figure 4, NO and levoglucosan showed no significant correlations across most sites (r: −0.39~0.46, p > 0.05), which is consistent with their characteristics as primary emissions predominantly from local sources. However, Ox and SO42− exhibited strong correlations across nearly all monitoring sites (r: 0.64~0.94, p < 0.05), demonstrating the significant regional transport characteristics of Ox and SO42−. As for 1,2-PhApri, significant correlations were only observed among a small fraction of monitoring sites. Compared to 1,2-PhApri, better correlations for 1,2-PhAsec were observed among sites (e.g., TS and BL, NS and BL). In addition, good correlations for 1,2-PhAsec were found between geographically proximate sites (e.g., ZH and NS, HS and TS, GZ and TH). These results demonstrated that the method used in this study is effective for separating the primary and secondary fractions of SOA2-rings tracers.
Figure 4.
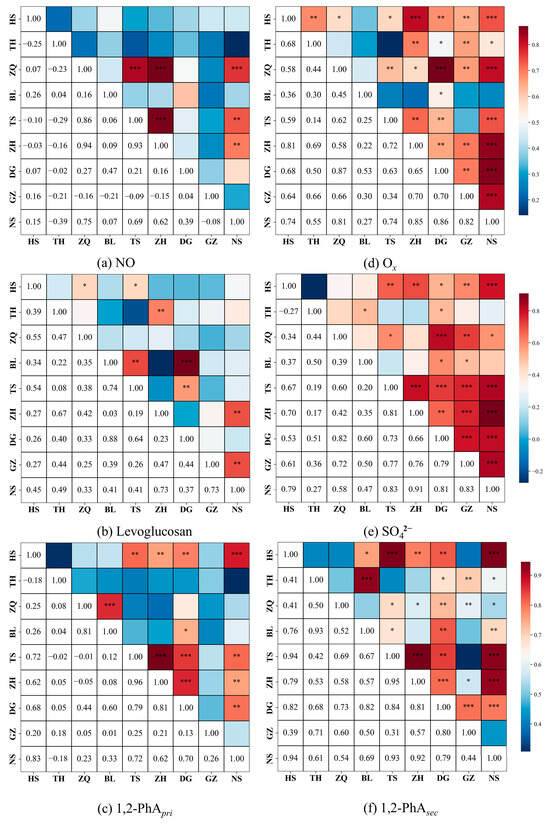
Site-by-site correlation coefficients between each pair of the nine sites for NO, levoglucosan, 1,2-PhApri, Ox, SO42−, and 1,2-PhAsec. The numerical values in the lower left grid cells represent correlation coefficients, while asterisks (*) in the upper right grid cells denote the statistical significance of these correlations (*: p ≤ 0.05, **: p ≤ = 0.01 and ***: p ≤ = 0.001).
To further validate the effectiveness of the separation method, we conducted a correlation analysis between 1,2-PhApri and 4-MPhApri with the main primary emission source tracers, such as picene for the coal combustion source, hopanes and steranes for the vehicle exhaust source, levoglucosan for the biomass burning source, and heavy metal Zn for the industrial emission source. As shown in Table S4, 1,2-PhApri and 4-MPhApri showed significant positive correlations with the four primary emission source tracers at almost all sites in the PRD (p < 0.05), suggesting that the sources of 1,2-PhApri and 4-MPhApri were significantly associated with these primary emission sources. The results indicate that the separation method could distinguish the primary and secondary fractions of 1,2-PhA and 4-MPhA reliably.
The concentrations of 1,2-PhAsec in the PRD region ranged from 2.37 to 291.4 ng m−3 with a mean concentration of 30.3 ± 10.6 ng m−3. The concentrations of 4-MPhAsec ranged from 0.37 to 45.0 ng m−3 with a mean concentration of 4.96 ± 1.17 ng m−3. The highest concentrations of 1,2-PhAsec and 4-MPhAsec were both observed at the ZQ site (52.6 ± 76.8 ng m−3 and 6.67 ± 10.9 ng m−3), while the lowest concentrations were measured at the NS (13.5 ± 10.3 ng m−3) and TH (3.35 ± 2.48 ng m−3) sites, respectively. The concentrations of 1,2-PhAsec and 4-MPhAsec were higher in urban sites (6.02 ± 7.48 ng m−3), followed by suburban (4.53 ± 5.10 ng m−3) and rural (1.02 ± 0.72 ng m−3) sites. An IVOC emission inventory study revealed that the total atmospheric naphthalene emissions in the PRD region in 2015 were approximately 10,508 t/year [28]. Comparative analysis at the same six monitoring stations selected in this study demonstrated that the concentration of 1,2-PhAsec showed a significant positive correlation with its precursor naphthalene emissions (p < 0.05), indicating that the content of a precursor has an important influence on the formation of 1,2-PhAsec.
The concentrations of 1,2-PhAsec and 4-MPhAsec were higher in fall and winter and lower in spring and summer at most sites. Previous studies in the PRD region have also shown that the concentrations of Nap in fall and winter were obviously higher than those in spring and summer [8,29]. This might be attributed to the higher anthropogenic activities (industrial activity, coal-fired power generation, open burning of agricultural biomass, and residential burning of biomass for heating) in fall and winter in the PRD region, leading to an increase in precursor (Nap and MN) emissions, further contributing to the increase in 1,2-PhAsec and 4-MPhAsec concentrations. In addition, a significant positive correlation could be found between 1,2-PhAsec and 4-MPhAsec and Ox and SO42− (Table S5, p < 0.05) at most sites in the PRD, demonstrating that atmospheric oxidation exerts an important influence on 1,2-PhAsec and 4-MPhAsec formation.
The proportions of 1,2-PhApri in 1,2-PhA (1,2-PhApri/1,2-PhA%) were in the range of 18.6% to 39.9%, with an average of 26.7%. As shown in Figure S3, 1,2-PhApri /1,2-PhA% was higher in suburban sites (35.7 ± 4.88%) compared to urban sites (25.0 ± 1.81%) and rural sites (23.9 ± 2.26%). In addition, 1,2-PhApri /1,2-PhA% was found to be higher in spring and fall than in summer and winter. The proportions of 4-MPhApri in 4-MPhA (4-MPhApri/4-MPhA%) were in the range of 20.7% to 34.5%, with an average of 29.2%. Similar to the trend of 1,2-PhApri/1,2-PhA%, 4-MPhApri/4-MPhA% was higher in suburban sites (34.0 ± 8.58%) compared to urban sites (30.3 ± 7.93%) and rural sites (26.4 ± 3.58%). 4-MPhApri/4-MPhA% was also found to be higher in spring and fall than in summer and winter. The non-negligible contributions from 1,2-PhApri and 4-MPhApri suggest that, although atmospheric 1,2-PhA and 4-MPhA were predominantly secondarily formed, their direct application for estimating SOA2-rings would lead to an overestimation exceeding 30%.
3.3. Estimation of SOANap and SOAMN
Using the separated 1,2-PhAsec and 4-MPhAsec, we could calculate SOANap and SOAMN over the PRD region using the tracer-based method [41]. However, 1,2-PhAsec was detected in both Nap and MN photooxidation products [16]. Therefore, 1,2-PhAsec generated by Nap oxidation (1,2-PhAsec(Nap)) should be estimated by subtraction of 1,2-PhAsec generated by MN oxidation (1,2-PhAsec(MN)) from 1,2-PhAsec. 4-MPhAsec was only detected in MN oxidation products [19]. The 1,2-PhAsec(MN) and 4-MPhAsec formation from MN photooxidation in chamber experiments was studied by Kleindienst et al. [16], and the ratio (r) of 1,2-PhAsec(MN) to 4-MPhAsec was 5.43 ± 2.25.
Thus, 1,2-PhA generated by Nap oxidation (1,2-PhAsec(Nap)) could be estimated by Equation (5):
Finally, in this study, we applied 1,2-PhAsec(Nap) and 4-MPhAsec to estimate SOANap and SOAMN and to check the contribution of SOA2-rings to PM2.5.
In ambient air, SOANap and SOAMN can be estimated by dividing measured 1,2-PhAsec(Nap) and 4-MPhAsec by fSOANap and fSOAMN, with the assumption that the chamber-generated relationship between tracers and SOA is stable in the atmosphere (Equations (6) and (7)):
The mass fractions of 1,2-PhA and 4-MPhA in SOANap and SOAMN (fSOANap and fSOAMN) have been measured in chamber experiments [16,36]. However, the value of fSOA varied under different NOx conditions. The chamber experiments carried out by Kleindienst et al. demonstrated that fSOANap is almost stable at 2.0% when NOx is both present and absent [16]. The fSOAMN is 0.18% under NOx-absent conditions and lower than 0.64% under NOx-present conditions. Al-Naiema et al. measured fSOANap values of 2.4% and 5.5% under NOx-present and NOx-absent conditions [37], respectively. NOx levels are relatively more abundant in the PRD region during the sampling period [30]. After considering the combined effects of NOx on fSOA and actual atmospheric conditions, we chose fSOANap and fSOAMN under NOx-present conditions, which were 2.0% and 0.64%, as estimated by Kleindienst et al. [16], respectively (Table S6).
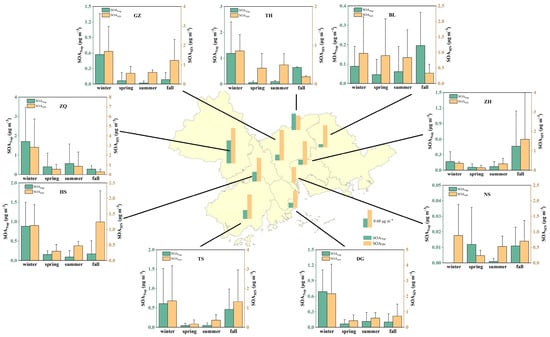
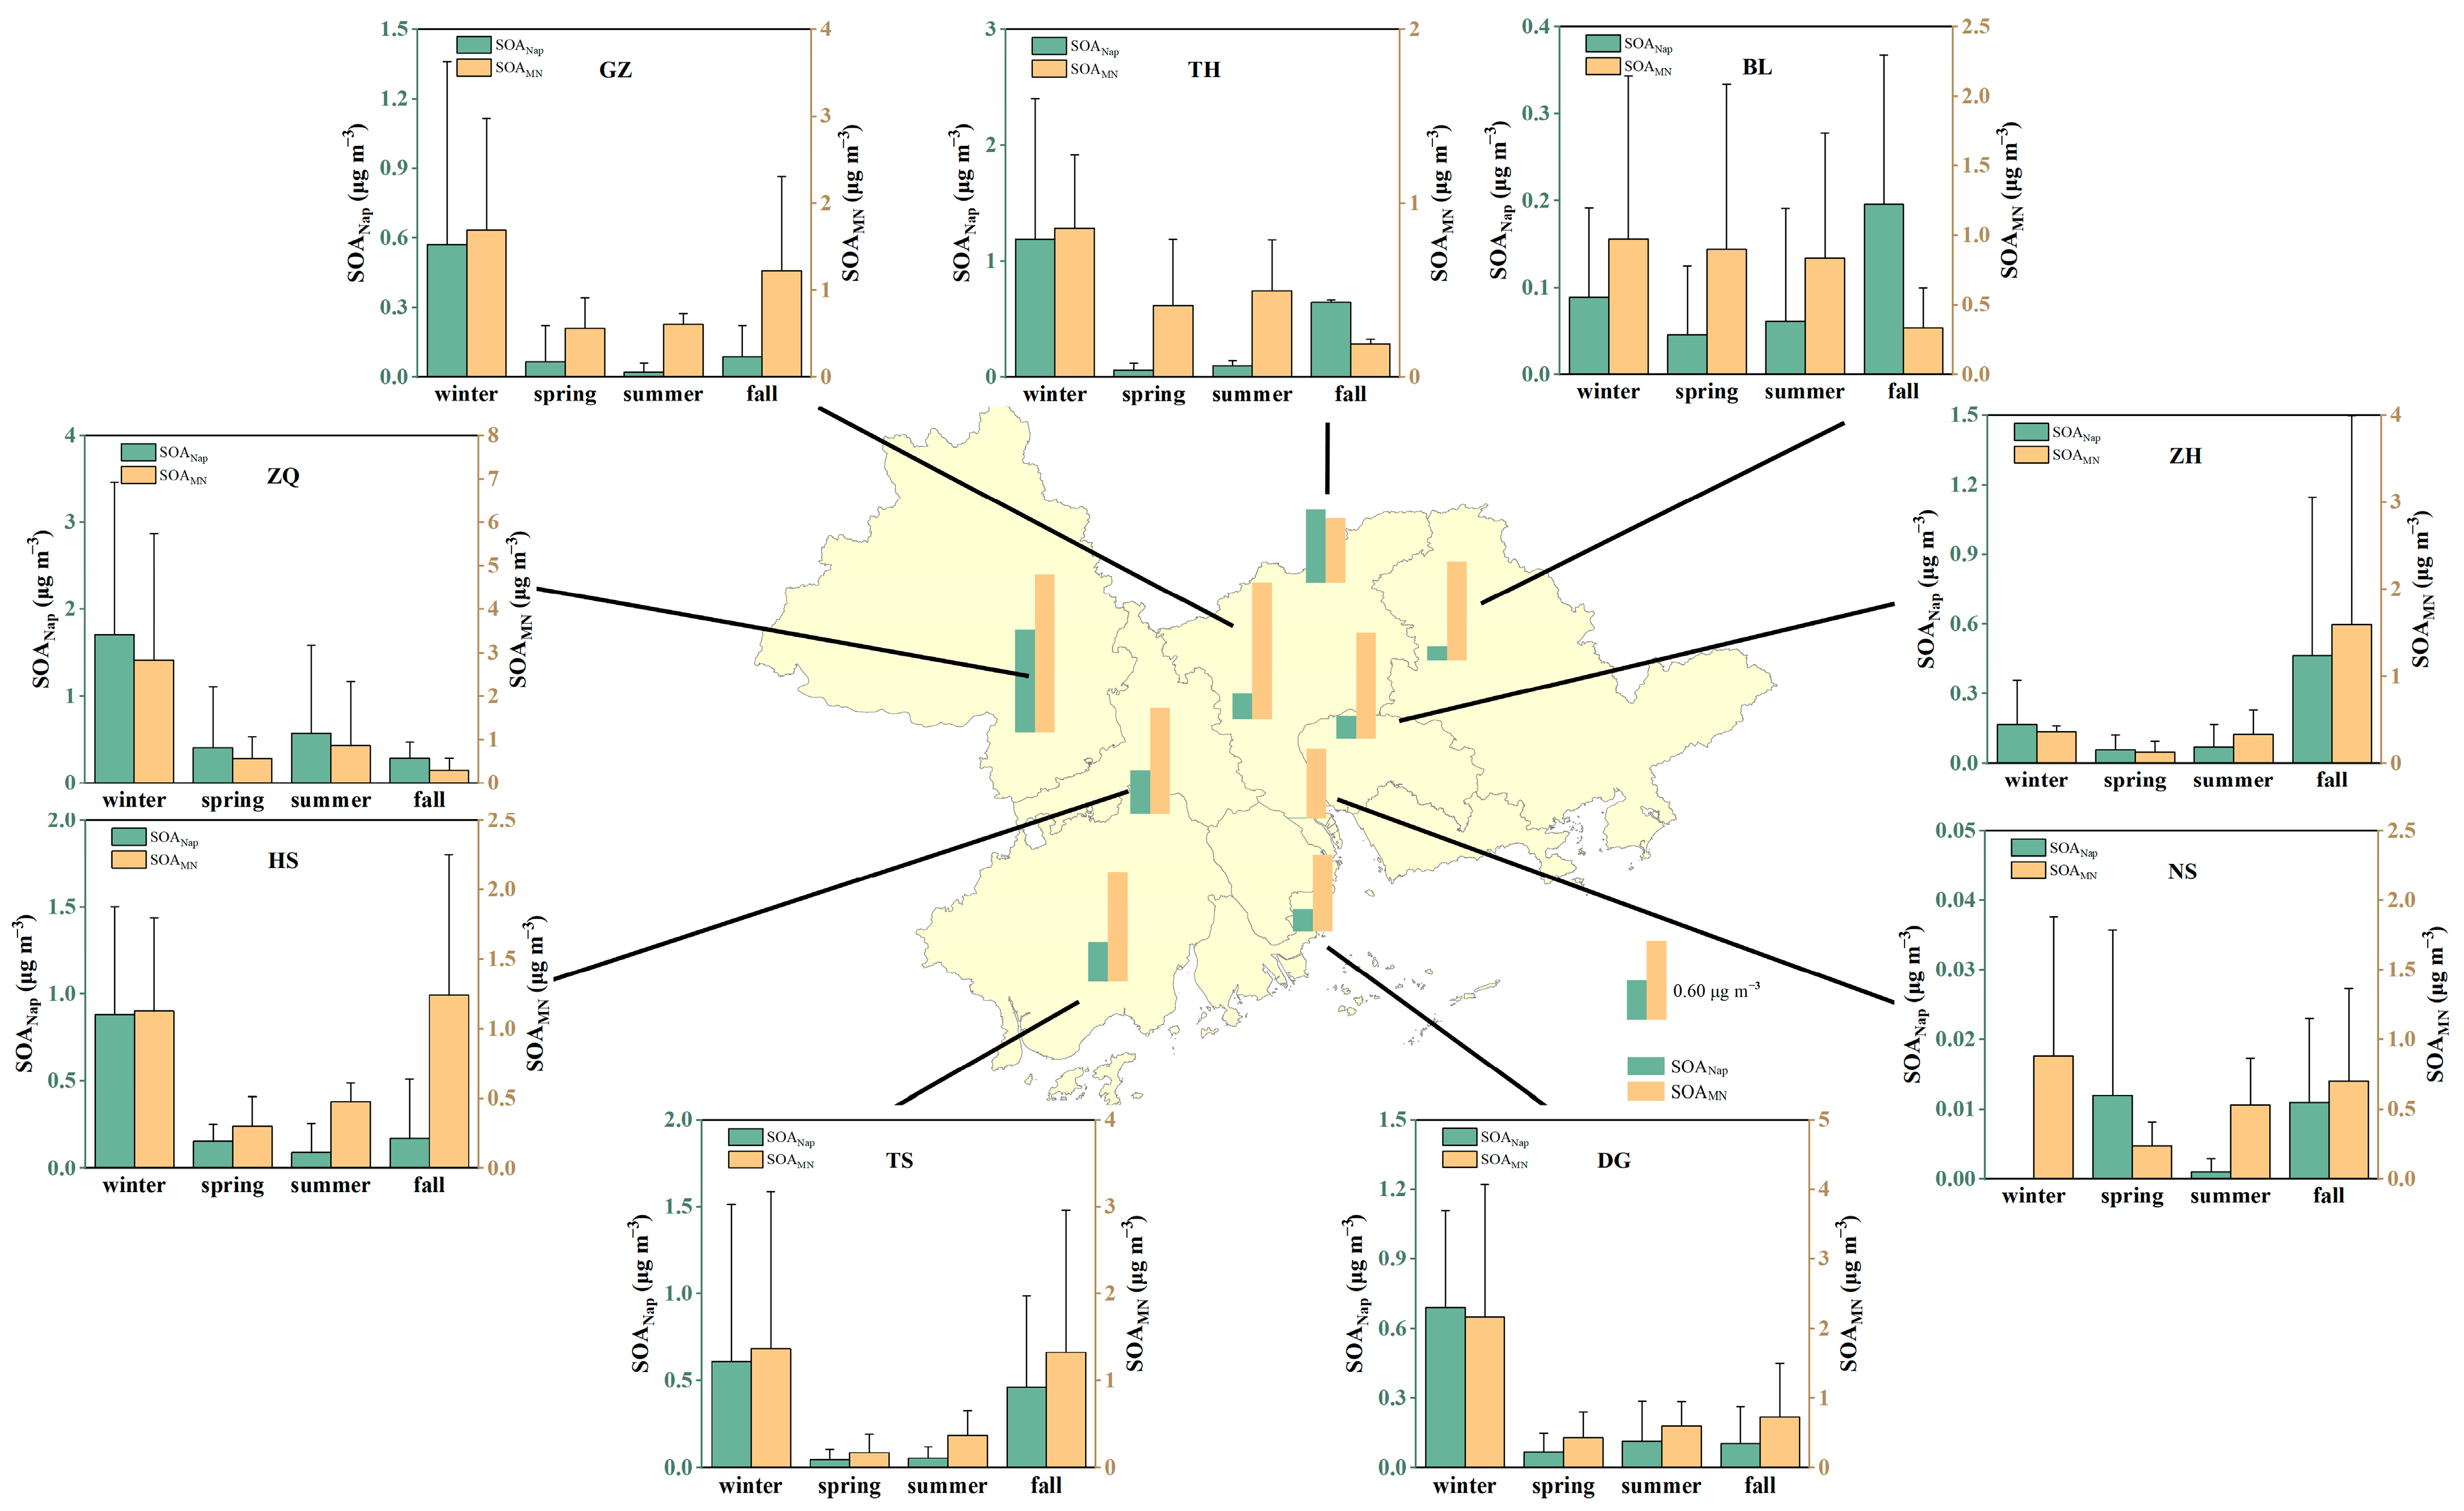
As shown in Figure 5, the annual average concentrations of SOANap and SOAMN were 0.28 μg m−3 and 0.76 μg m−3, respectively. Both SOANap and SOAMN exhibit similar seasonal variations, with higher levels in fall and winter, which is consistent with the seasonal pattern of 1,2-PhAsec and 4-MPhAsec. The average contribution of MN to SOA was three times that of Nap in the PRD. The annual averages of estimated SOA2-rings ranged from 0.38 to 1.93 μg m−3 among the nine sites, with a mean of 0.98 ± 0.44 μg m−3. The mean values in winter, spring, summer and fall were 2.03 ± 1.20, 0.52 ± 0.29, 0.69 ± 0.32 and 0.84 ± 0.27 μg m−3, respectively.
Figure 5.
Spatial and seasonal variations in SOANap (the green bar) and SOAMN (the yellow bar) at nine sites in the PRD. The central figure presents the annual average of SOANap and SOAMN at each site. The surrounding figures show the seasonal change in SOANap and SOAMN at each site. The error bar represents one standard deviation of the sum concentration of SOANap or SOAMN in each season.
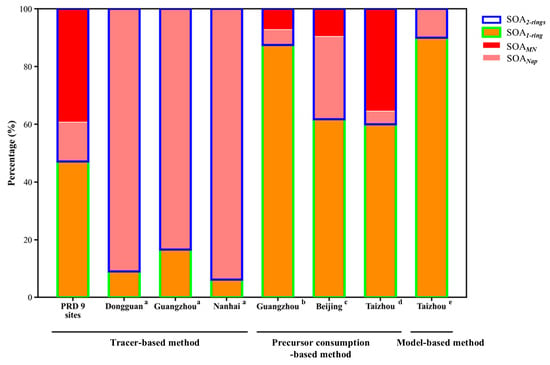
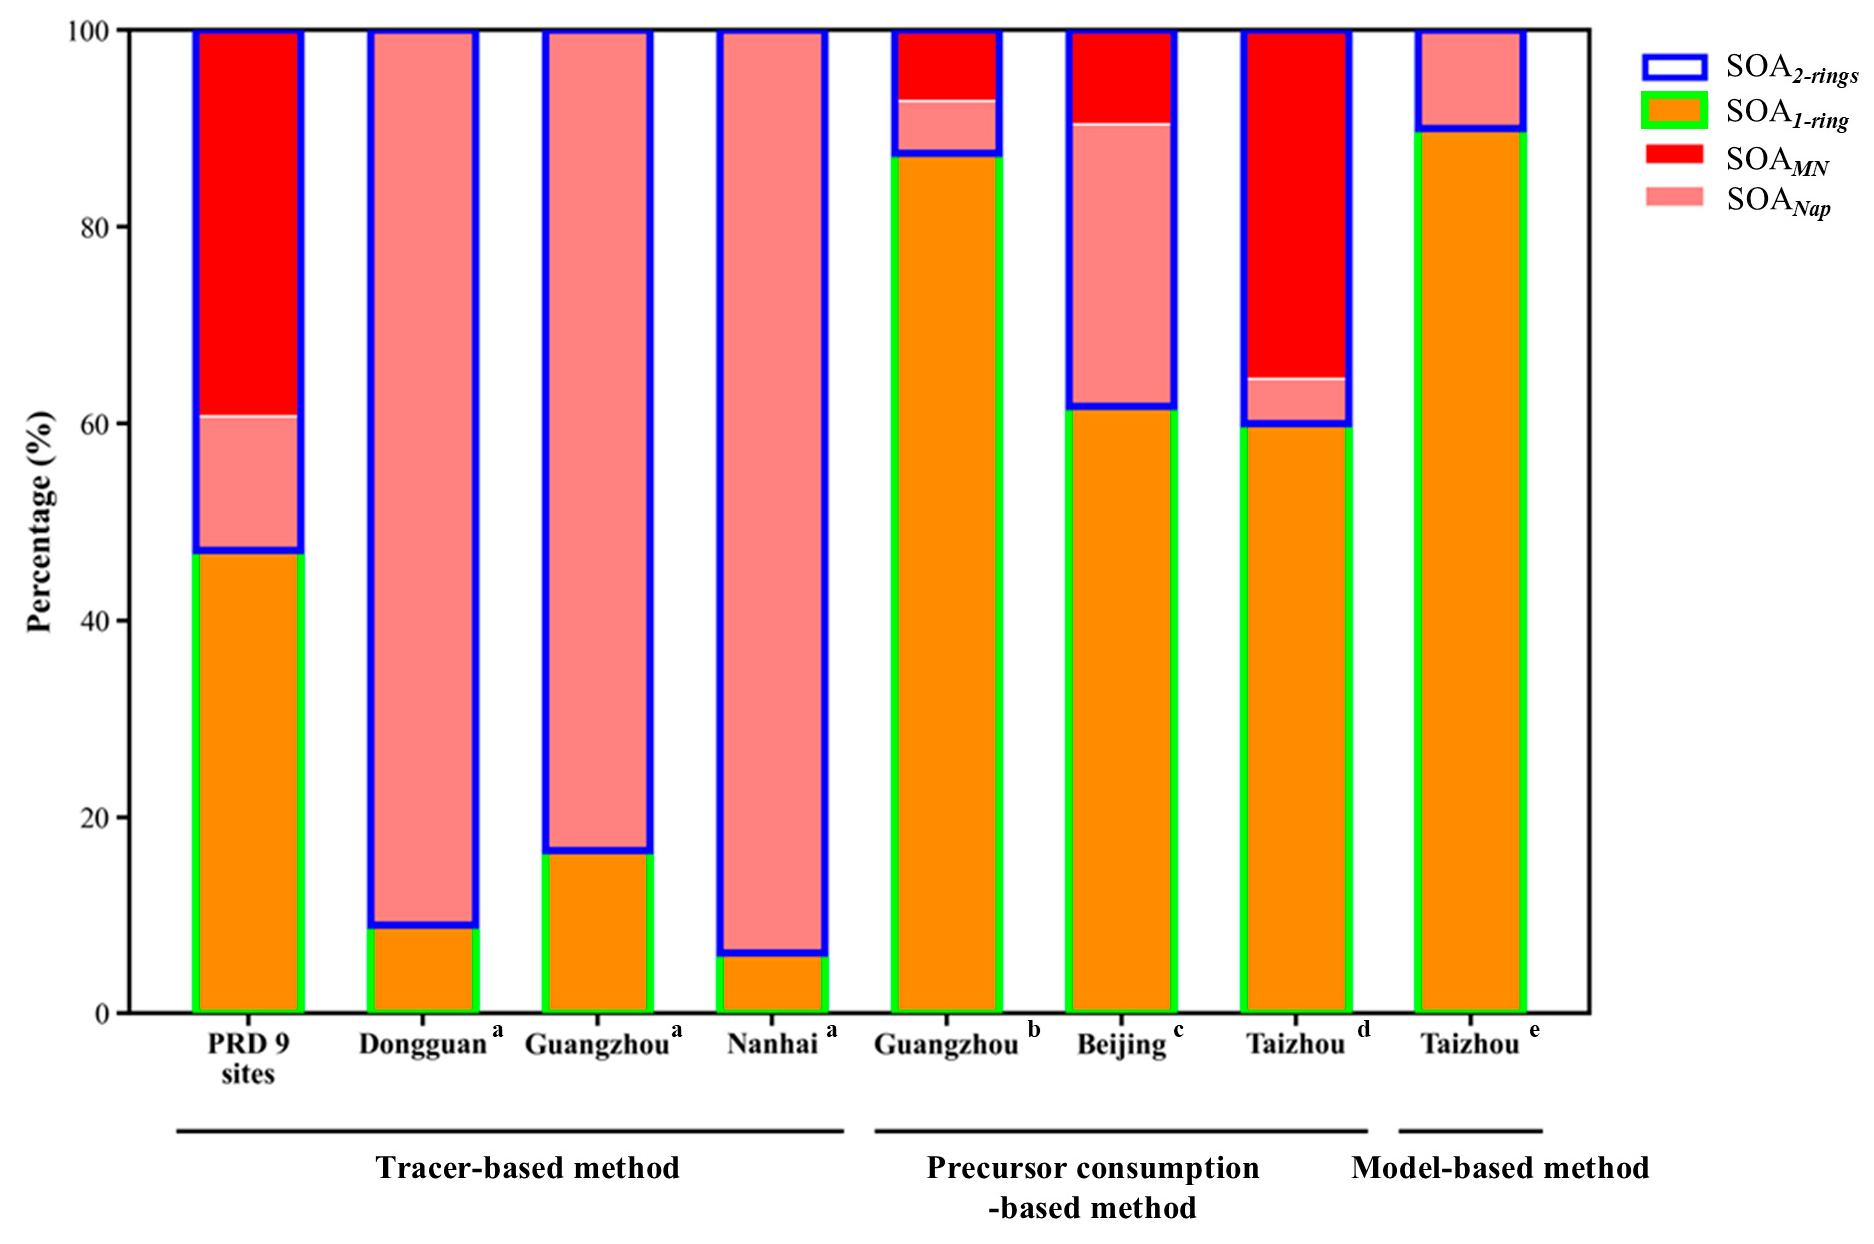
We also summarized the relative contributions of SOA1-ring and SOA2-rings to total aromatic SOA (ASOA, sum of SOANap, SOAMN, and SOA1-ring) estimated in this and previous studies (Figure 6). In this study, the contributions of SOA1-ring and SOA2-rings were comparable, accounting for approximately 47% and 53% of ASOA, respectively (Bar 1 in Figure 6). However, in the study by He et al. in Dongguan, Guangzhou, and Nanhai, which also used the tracer-based method (Bar 2–4 in Figure 6), SOA2-rings was overwhelmingly dominant, and SOA1-ring contributions to ASOA were typically less than 20% [42]. This discrepancy is likely because they estimated SOA2-rings directly based on the measured concentrations of the SOA tracer without explicitly differentiating the primary and secondary contributions. The relative contribution of SOA2-rings to ASOA estimated by the precursor consumption-based method (Bars 5–7) [7,8,14] and the model-based method (Bar 8) [13] was lower than that in our study. The underestimation of the SOA2-rings contribution via the precursor consumption method compared to our study might be attributed to the negatively biased SOA yields from uncorrected vapor wall losses in smog chamber experiments [43]. And the underestimation of SOA2-rings in the model-based method might be attributed to the omission of IVOC precursors in emission inventories [12,43].
Figure 6.
The relative contributions of SOA1-ring (orange columns with green boxes), SOANap (light red columns) and SOAMN (dark red columns) to ASOA in this study (Bar 1, PRD 9 sites) and other studies by different methods (Bars 2–8). The blue boxes represent SOA2-rings. a: The tracer-based method data in Dongguan, Guangzhou and Nanhai were obtained from He et al. [42]. b: The precursor consumption-based method data of Guangzhou was from Fang et al. [8]. c: The precursor consumption-based method data of Beijing was from Huang et al. [7]. d: The precursor consumption-based method data of Taizhou was from Yu et al. [14]. e: The model-based method data of Taizhou was from Ye et al. [13].
Regarding the composition of SOA2-rings, our study identified a dominant contribution of SOAMN. SOAMN accounted for approximately 40% of ASOA and 75% of SOA2-rings, significantly higher than the contribution of SOANap. Our results exhibit a strong similarity to the precursor-based study conducted in Taizhou [14] (Bar 7 in Figure 6), in which SOAMN accounted for approximately 33% of the ASOA and > 85% of the SOA2-rings. It revealed that MN is the main precursor of SOA2-rings formation. In the study utilizing the precursor consumption-based method conducted in Beijing [7] (Bar 6 in Figure 6), the SOA2-rings fraction in Beijing was dominated by SOANap, which may be attributed to the higher SOA yield of naphthalene relative to methylnaphthalene used in the study.
The main precursors of SOA include isoprene, monoterpene, and β-caryophyllene, which were emitted from biogenic sources, and monoaromatics, as well as Nap and MN from anthropogenic sources. The concentrations of SOA tracers of BVOCs and monoaromatics during the same period and at the same sites were measured in our previous studies [30], and the fSOA values we used are summarized in Table S6. Utilizing the tracer-based method, we calculated the SOA derived from both biogenic and anthropogenic sources, abbreviated as SOAtra. The total SOAtra concentrations (sum of SOANap, SOAMN, SOA1-ring and BSOA) at the nine sites in the PRD were estimated [44,45]. The annual average SOAtra was estimated to be 3.15 ± 2.26 μg m−3 at the nine sites. The highest concentration occurred at the ZQ site (5.14 ± 5.10 μg m−3), and the lowest concentration was observed at the NS site (1.81 ± 1.66 μg m−3).
To evaluate the contribution of SOA estimated by the tracer-based method (SOAtra) to the total SOA, we calculated SOC using the EC-tracer method at the nine sites, and further used 1.6 as the ratio of SOA to SOC (SOA/SOC) to estimate the SOAEC to represent the total SOA [44,46].
Since EC is emitted solely from primary combustion sources (e.g., fossil fuel and biomass burning), it is widely used as a tracer for primary organic carbon (POC). Based on this assumption, POC is calculated by multiplying EC by a representative primary OC/EC ratio. Secondary organic carbon (SOC) is then derived as the difference between total OC and estimated POC. SOC can be estimated by Equations (8) and (9):
where OC and EC can be obtained from observations; (OC/EC)pri is the ratio of aerosol OC and EC from fresh primary emissions. We used the minimum R-squared (MRS) method to estimate (OC/EC)pri [47,48]. The MRS method is premised on the assumption that EC is essentially unrelated to SOC, and thus, (OC/EC)pri should be the value that minimizes the correlation coefficient between estimated SOC and measured EC.
POC = (OC/EC)pri × EC
SOC = OC − POC
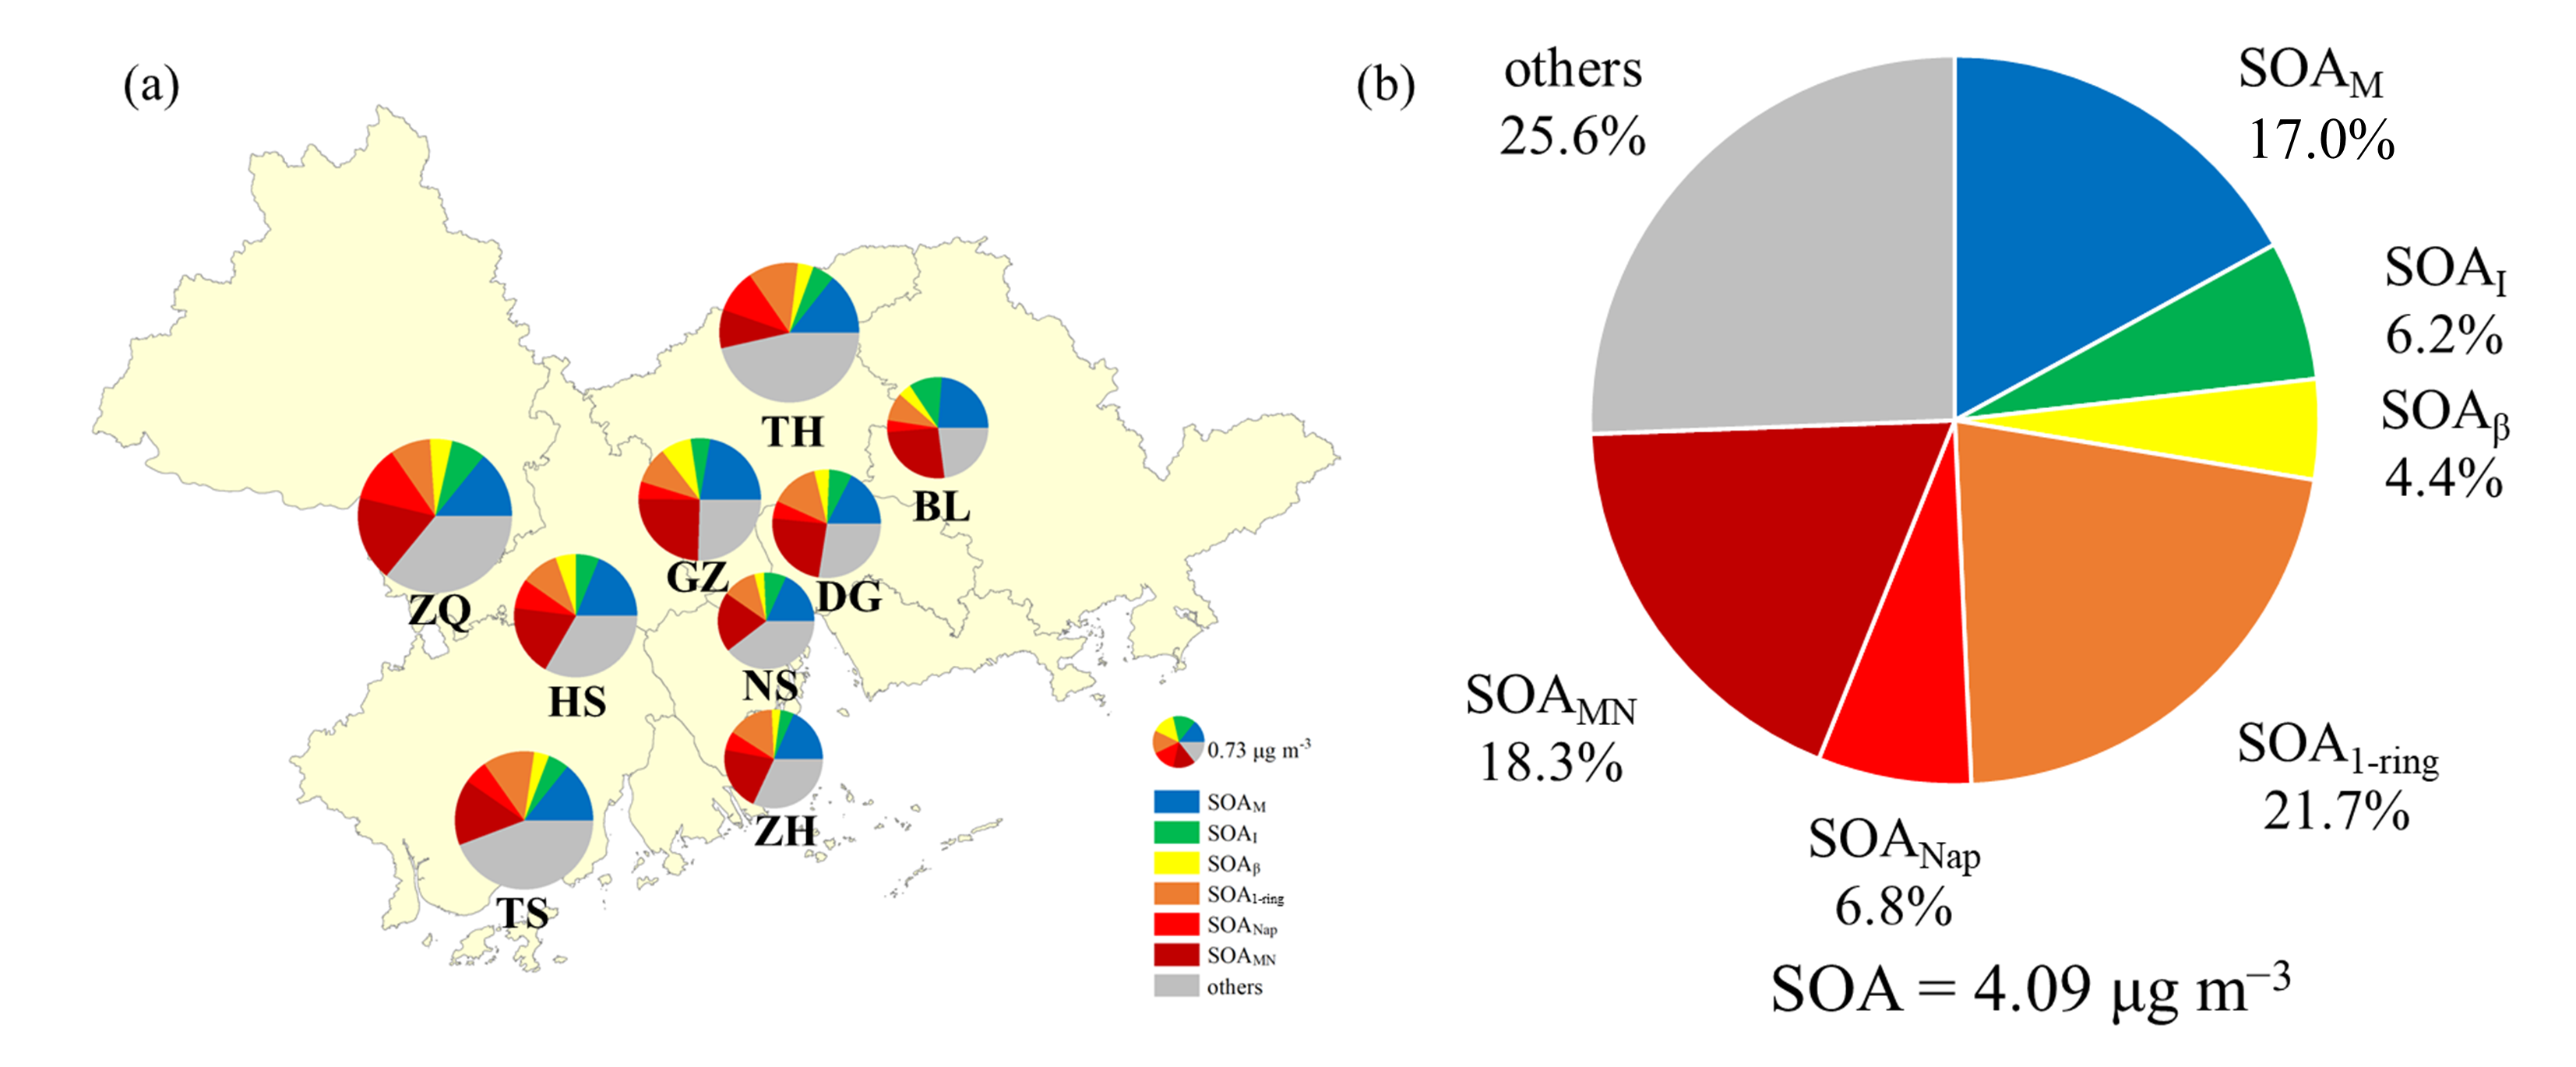
SOAEC (SOA estimated by the EC-tracer method) and SOAtra exhibit a strong positive correlation (r = 0.624, p < 0.001), indicating the estimated SOAEC and SOAtra values were reliable (Figure S4). As shown in Figure 7a, the annual average SOAEC over the PRD was 4.09 ± 1.40 μg m−3; the lowest level was observed at NS (2.57 ± 1.57 μg m−3), and the highest concentration occurred at ZQ (6.55 ± 3.09 μg m−3).
Figure 7.
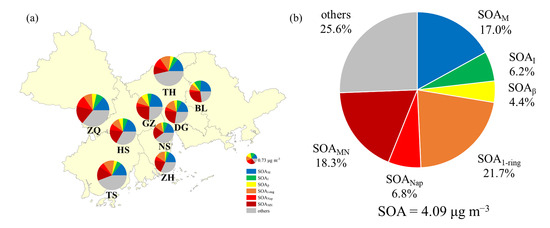
(a) Proportions of 6 types of SOAtra in the total SOA at each site. (b) Average proportions of 6 types of SOAtra in the total SOA at the 9 sites.
Figure 7b shows the proportion of six different types of SOAtra in the total SOA (SOAEC). Based on the whole year dataset, ASOA (2.02 ± 0.71 μg m−3) exhibited a dominant proportion over bsoa (1.13 ± 0.33 μg m−3, 36.2%) over the nine sites, accounting for 46.9% of SOAEC. The contributions of SOA2-rings and SOA1-ring were comparable, accounting for 25% and 21% of SOAEC, respectively. In addition, SOA2-rings was the largest contributor to SOAEC (~44%) in winter, and SOA1-ring contributed ~ one third of SOA in winter. In summer, monoterpenes instead of SOA2-rings became the largest contributor to SOAEC (20%) (Figure S5). This suggests that two-ring PAHs may make a crucial contribution to the formation of SOA in the PRD region, especially in winter.
The concentrations and compositions of estimated SOC in this study and the literature are displayed in Figure S6. In terms of biogenic SOC (BSOC), our study found that it was dominated by monoterpenes (~20%), which is similar to the results of Cheng et al. [49] in Hong Kong. However, in the studies by He et al. [42] in the PRD region (Dongguan, Guangzhou and Nansha) and by Lewandowski et al. [50] in the U.S. (in Atlanta, Birmingham, Centreville and Pensacola), BSOC was dominated by isoprene-derived SOC.
The relative importance of two-ring PAH SOC (SOC2-rings) versus monocyclic aromatic SOC (SOC1-ring)varies significantly across different studies. In U.S. studies, SOC1-ring consistently outweighs SOC2-rings [50]. Conversely, in the two previous PRD studies by Cheng et al. [49] and He et al. [42], a dominant contribution of SOC2-rings and a negligible contribution of SOC1-ring were found. In our study, we found a similar proportion of SOC1-ring (8.9%) and SOC2-rings (10.4%).
As similar tracers were used in the above studies, the different compositions of SOC in the studies might potentially be due to the various tracer concentrations over different sites, the choice of fSOC, and the decision to distinguish the primary and secondary fractions of the SOA tracers. The results highlight that even though the concentration and composition of SOC remain inconsistent across studies, the contribution of two-ring PAHs is equally critical and can even exceed that of traditional aromatics.
4. Conclusions
Two-ring PAHs, especially Nap and MN, are important precursors of SOA. 1,2-PhA and 4-MPhA are commonly used as tracers to estimate SOA derived from Nap and MN. However, some studies have found that the two tracers have primary sources, and using the tracers without any modification would lead to a gross overestimation of the contributions of two-ring PAHs to SOA or SOC.
In this study, we measured the emission characteristics of SOA2-rings tracers (1,2-PhA and 4-MPhA) for biomass burning (0.067 ± 0.082 ng/μg PM2.5 and 0.013 ± 0.012 ng/μg PM2.5) and coal combustion (0.19 ± 0.12 ng/μg PM2.5 and 0.018 ± 0.010 ng/μg PM2.5) sources and summarized the emission characteristics of SOA2-rings tracers from previous studies for industrial processes (0.078 ± 0.051 ng/μg PM2.5 and 0.0035 ± 0.0014 ng/μg PM2.5) and vehicle exhaust (0.55 ± 0.13 ng/μg PM2.5 and 0.24 ± 0.17 ng/μg PM2.5) sources.
Then, we conducted a year-long observation at nine sites in the PRD region and distinguished the primary and secondary fractions of 1,2-PhA and 4-MPhA. The site-by-site correlations were bad for NO, levoglucosan and 1,2-PhApri and were good for Ox, SO42− and 1,2-PhAsec, demonstrating that the method used in this study is effective in separating the primary and secondary fractions of SOA2-rings tracers. The average proportion of 1,2-PhApri and 4-MPhApri in 1,2-PhA and 4-MPhA were 26.7% and 29.2%, respectively. This suggested that the direct application of 1,2-PhA and 4-MPhA for estimating SOA2-rings would lead to an overestimation exceeding 30%.
Using the separated 1,2-PhAsec and 4-MPhAsec, we calculated SOA2-rings over the PRD region using the tracer-based method. The annual average concentrations of SOANap, SOAMN and SOA2-rings were 0.28 μg m−3, 0.76 μg m−3 and 0.98 μg m−3, respectively. When we combined the SOA1-ring and BSOA tracers into the estimation, the contributions of SOA2-rings (25%) and SOA1-ring (21%) were comparable to SOAEC. And SOA2-rings was the largest contributor to SOAEC (~44%) in winter. This suggests that two-ring PAHs may make a crucial contribution to the formation of SOA in the PRD region, especially in winter.
Supplementary Materials
The following supporting information can be downloaded at https://www.mdpi.com/article/10.3390/atmos17040354/s1, Table S1: Abbreviations. Table S2: Concentrations of 1,2-PhA and 4-MPhA in the air of PRD (unit: ng m−3). Table S3: Emission characteristics of 1,2-PhA and 4-MPhA from primary sources. Table S4: Correlations of 1,2-PhApri and 4-MPhApri with primary emission source tracers at 9 sites. Table S5: Correlations of 1,2-PhAsec and 4-MPhAsec with Ox and SO42− at 9 sites. Table S6: SOA mass fractions for six precursor types. Figure S1: Primary emission characteristics of 1,2-PhA (a) and 4-MPhA (b) emitted from the sources measured by this study and reported by previous studies. Box with error bars represent 10th, 25th, 75th and 90th percentiles, respectively. The white or black horizontal lines represent the median and the white or black circles represent the average value. Figure S2: Spatial and seasonal variations of 4-MPhApri and 4-MPhAsec at nine sites in the PRD. The bars in the central panel represent the annual average concentrations of 4-MPhApri and 4-MPhAsec. The surrounding panels show the seasonal change at each site. The green part of the stacked column chart represents 4-MPhApri, and the purple part represents 4-MPhAsec. The blue circular dot represents the mass fraction of 4-MPhApri to 4-MPhA. Figure S3: Seasonal variations of 1,2-PhApri, 1,2-PhAsec, 4-MPhApri and 4-MPhAsec concentrations at urban, suburban and rural sites. Figure S4: Correlation analysis results between SOAEC and SOAtra in the PRD 9 sites. Figure S5: Seasonal variations of the proportion of every individual SOAtra in SOAEC in the PRD. Figure S6: The concentration and compositions of estimated 6 types of SOC in different regions.
Author Contributions
Conceptualization, Y.Z., D.C. and X.D.; methodology, Q.C., Y.Z. and X.D.; validation, Y.Z. and D.C.; formal analysis, Q.C.; investigation, Q.C., T.Z., H.J., Y.H. and K.Y.; data curation, Q.C., T.Z., J.W., P.L. and Z.W.; writing—original draft preparation, Q.C.; writing—review and editing, Y.Z. and X.D.; supervision, Y.Z. and X.D.; funding acquisition, Y.Z. and X.D. All authors have read and agreed to the published version of the manuscript.
Funding
This research was supported by the Guangdong Foundation for Program of Science and Technology Research (2023B0303000007, 2024A1515011181) and the Fundamental Research Program of Shanxi Province (202403021222167).
Institutional Review Board Statement
Not applicable.
Informed Consent Statement
Not applicable.
Data Availability Statement
Data are available upon request from the corresponding author.
Conflicts of Interest
The authors declare no conflicts of interest.
References
- Xiao, M.; Wang, M.; Mentler, B.; Garmash, O.; Lamkaddam, H.; Molteni, U.; Simon, M.; Ahonen, L.; Amorim, A.; Baccarini, A.; et al. Anthropogenic Organic Aerosol in Europe Produced Mainly through Second-Generation Oxidation. Nat. Geosci. 2025, 18, 239–245. [Google Scholar] [CrossRef] [Scilit]
- Carlton, A.G.; Pye, H.O.T.; Baker, K.R.; Hennigan, C.J. Additional Benefits of Federal Air-Quality Rules: Model Estimates of Controllable Biogenic Secondary Organic Aerosol. Environ. Sci. Technol. 2018, 52, 9254–9265. [Google Scholar] [CrossRef] [Scilit]
- Hu, W.W.; Hu, M.; Yuan, B.; Jimenez, J.L.; Tang, Q.; Peng, J.F.; Hu, W.; Shao, M.; Wang, M.; Zeng, L.M.; et al. Insights on Organic Aerosol Aging and the Influence of Coal Combustion at a Regional Receptor Site of Central Eastern China. Atmos. Chem. Phys. 2013, 13, 10095–10112. [Google Scholar] [CrossRef] [Scilit]
- Li, Y.J.; Sun, Y.; Zhang, Q.; Li, X.; Li, M.; Zhou, Z.; Chan, C.K. Real-Time Chemical Characterization of Atmospheric Particulate Matter in China: A Review. Atmos. Environ. 2017, 158, 270–304. [Google Scholar] [CrossRef] [Scilit]
- Zhang, Q.; Jimenez, J.L.; Canagaratna, M.R.; Allan, J.D.; Coe, H.; Ulbrich, I.; Alfarra, M.R.; Takami, A.; Middlebrook, A.M.; Sun, Y.L.; et al. Ubiquity and Dominance of Oxygenated Species in Organic Aerosols in Anthropogenically-Influenced Northern Hemisphere Midlatitudes. Geophys. Res. Lett. 2007, 34, L13801. [Google Scholar] [CrossRef] [Scilit]
- Ding, X.; Zhang, Y.-Q.; He, Q.-F.; Yu, Q.-Q.; Wang, J.-Q.; Shen, R.-Q.; Song, W.; Wang, Y.-S.; Wang, X.-M. Significant Increase of Aromatics-Derived Secondary Organic Aerosol during Fall to Winter in China. Environ. Sci. Technol. 2017, 51, 7432–7441. [Google Scholar] [CrossRef] [Scilit]
- Huang, G.; Liu, Y.; Shao, M.; Li, Y.; Chen, Q.; Zheng, Y.; Wu, Z.; Liu, Y.; Wu, Y.; Hu, M.; et al. Potentially Important Contribution of Gas-Phase Oxidation of Naphthalene and Methylnaphthalene to Secondary Organic Aerosol during Haze Events in Beijing. Environ. Sci. Technol. 2019, 53, 1235–1244. [Google Scholar] [CrossRef] [Scilit]
- Fang, H.; Luo, S.; Huang, X.; Fu, X.; Xiao, S.; Zeng, J.; Wang, J.; Zhang, Y.; Wang, X. Ambient Naphthalene and Methylnaphthalenes Observed at an Urban Site in the Pearl River Delta Region: Sources and Contributions to Secondary Organic Aerosol. Atmos. Environ. 2021, 252, 118295. [Google Scholar] [CrossRef] [Scilit]
- Schauer, J.J.; Kleeman, M.J.; Cass, G.R.; Simoneit, B.R.T. Measurement of Emissions from Air Pollution Sources. 2. C1 through C30 Organic Compounds from Medium Duty Diesel Trucks. Environ. Sci. Technol. 1999, 33, 1578–1587. [Google Scholar] [CrossRef] [Scilit]
- Schauer, J.J.; Kleeman, M.J.; Cass, G.R.; Simoneit, B.R.T. Measurement of Emissions from Air Pollution Sources. 5. C1−C32 Organic Compounds from Gasoline-Powered Motor Vehicles. Environ. Sci. Technol. 2002, 36, 1169–1180. [Google Scholar] [CrossRef] [Scilit]
- Zhang, Y.; Schauer, J.J.; Zhang, Y.; Zeng, L.; Wei, Y.; Liu, Y.; Shao, M. Characteristics of Particulate Carbon Emissions from Real-World Chinese Coal Combustion. Environ. Sci. Technol. 2008, 42, 5068–5073. [Google Scholar] [CrossRef] [Scilit]
- Chan, A.W.H.; Kautzman, K.E.; Chhabra, P.S.; Surratt, J.D.; Chan, M.N.; Crounse, J.D.; Wennberg, P.O.; Flagan, R.C.; Seinfeld, J.H. Secondary Organic Aerosol Formation from Photooxidation of Naphthalene and Alkylnaphthalenes: Implications for Oxidation of Intermediate Volatility Organic Compounds (IVOCs). Atmos. Chem. Phys. 2009, 9, 3049–3060. [Google Scholar] [CrossRef] [Scilit]
- Ye, F.; Li, J.; Gao, Y.; Wang, H.; An, J.; Huang, C.; Guo, S.; Lu, K.; Gong, K.; Zhang, H.; et al. The Role of Naphthalene and Its Derivatives in the Formation of Secondary Organic Aerosol in the Yangtze River Delta Region, China. Atmos. Chem. Phys. 2024, 24, 7467–7479. [Google Scholar] [CrossRef] [Scilit]
- Yu, Y.; Wang, H.; Wang, T.; Song, K.; Tan, T.; Wan, Z.; Gao, Y.; Dong, H.; Chen, S.; Zeng, L.; et al. Elucidating the Importance of Semi-Volatile Organic Compounds to Secondary Organic Aerosol Formation at a Regional Site during the EXPLORE-YRD Campaign. Atmos. Environ. 2021, 246, 118043. [Google Scholar] [CrossRef] [Scilit]
- Wang, L.; Atkinson, R.; Arey, J. Dicarbonyl Products of the OH Radical-Initiated Reactions of Naphthalene and the C1- and C2-Alkylnaphthalenes. Environ. Sci. Technol. 2007, 41, 2803–2810. [Google Scholar] [CrossRef] [Scilit]
- Kleindienst, T.E.; Jaoui, M.; Lewandowski, M.; Offenberg, J.H.; Docherty, K.S. The Formation of SOA and Chemical Tracer Compounds from the Photooxidation of Naphthalene and Its Methyl Analogs in the Presence and Absence of Nitrogen Oxides. Atmos. Chem. Phys. 2012, 12, 8711–8726. [Google Scholar] [CrossRef] [Scilit]
- Al-Naiema, I.M.; Stone, E.A. Evaluation of Anthropogenic Secondary Organic Aerosol Tracers from Aromatic Hydrocarbons. Atmos. Chem. Phys. 2017, 17, 2053–2065. [Google Scholar] [CrossRef] [Scilit]
- Zhao, X.; Wang, X.; Ding, X.; He, Q.; Zhang, Z.; Liu, T.; Fu, X.; Gao, B.; Wang, Y.; Zhang, Y.; et al. Compositions and Sources of Organic Acids in Fine Particles (PM2.5) over the Pearl River Delta Region, South China. J. Environ. Sci. 2014, 26, 110–121. [Google Scholar] [CrossRef] [Scilit] [PubMed]
- He, X.; Huang, X.H.H.; Chow, K.S.; Wang, Q.; Zhang, T.; Wu, D.; Yu, J.Z. Abundance and Sources of Phthalic Acids, Benzene-Tricarboxylic Acids, and Phenolic Acids in PM2.5 at Urban and Suburban Sites in Southern China. ACS Earth Space Chem. 2018, 2, 147–158. [Google Scholar] [CrossRef] [Scilit]
- Zhang, Y.; Shao, M.; Zhang, Y.; Zeng, L.; He, L.; Zhu, B.; Wei, Y.; Zhu, X. Source Profiles of Particulate Organic Matters Emitted from Cereal Straw Burnings. J. Environ. Sci. 2007, 19, 167–175. [Google Scholar] [CrossRef] [Scilit] [PubMed]
- Cai, T.; Zhang, Y.; Fang, D.; Shang, J.; Zhang, Y.; Zhang, Y. Chinese Vehicle Emissions Characteristic Testing with Small Sample Size: Results and Comparison. Atmos. Pollut. Res. 2017, 8, 154–163. [Google Scholar] [CrossRef] [Scilit]
- Mazzoleni, L.R.; Zielinska, B.; Moosmüller, H. Emissions of Levoglucosan, Methoxy Phenols, and Organic Acids from Prescribed Burns, Laboratory Combustion of Wildland Fuels, and Residential Wood Combustion. Environ. Sci. Technol. 2007, 41, 2115–2122. [Google Scholar] [CrossRef] [Scilit]
- Tian, L.; Huang, D.D.; Wang, Q.; Zhu, S.; Wang, Q.; Yan, C.; Nie, W.; Wang, Z.; Qiao, L.; Liu, Y.; et al. Underestimated Contribution of Heavy Aromatics to Secondary Organic Aerosol Revealed by Comparative Assessments Using New and Traditional Methods. ACS Earth Space Chem. 2023, 7, 110–119. [Google Scholar] [CrossRef] [Scilit]
- Ren, H.; Hu, W.; Yue, S.; Wu, L.; Ren, L.; Pan, X.; Wang, Z.; Sun, Y.; Kawamura, K.; Fu, P. Tracer-Based Characterization of Fine Carbonaceous Aerosol in Beijing during a Strict Emission Control Period. Sci. Total Environ. 2022, 841, 156638. [Google Scholar] [CrossRef] [Scilit] [PubMed]
- Fan, Y.; Liu, C.-Q.; Li, L.; Ren, L.; Ren, H.; Zhang, Z.; Li, Q.; Wang, S.; Hu, W.; Deng, J.; et al. Large Contributions of Biogenic and Anthropogenic Sources to Fine Organic Aerosols in Tianjin, North China. Atmos. Chem. Phys. 2020, 20, 117–137. [Google Scholar] [CrossRef] [Scilit]
- Zhang, Y.L.; Kawamura, K.; Watanabe, T.; Hatakeyama, S.; Takami, A.; Wang, W. New Directions: Need for Better Understanding of Source and Formation Process of Phthalic Acid in Aerosols as Inferred from Aircraft Observations over China. Atmos. Environ. 2016, 140, 147–149. [Google Scholar] [CrossRef] [Scilit]
- Yang, K.; Chen, D.-H.; Ding, X.; Li, J.; Zhang, Y.Q.; Zhang, T.; Wang, Q.-Y.; Wang, J.Q.; Cheng, Q.; Jiang, H.; et al. Different Roles of Primary and Secondary Sources in Reducing PM2.5: Insights from Molecular Markers in Pearl River Delta, South China. Atmos. Environ. 2023, 294, 119487. [Google Scholar] [CrossRef] [Scilit]
- Wu, L.; Wang, X.; Lu, S.; Shao, M.; Ling, Z. Emission Inventory of Semi-Volatile and Intermediate-Volatility Organic Compounds and Their Effects on Secondary Organic Aerosol over the Pearl River Delta Region. Atmos. Chem. Phys. 2019, 19, 8141–8161. [Google Scholar] [CrossRef] [Scilit]
- Tang, T.; Cheng, Z.; Xu, B.; Zhang, B.; Zhu, S.; Cheng, H.; Li, J.; Chen, Y.; Zhang, G. Triple Isotopes (δ13C, δ2H, and Δ14C) Compositions and Source Apportionment of Atmospheric Naphthalene: A Key Surrogate of Intermediate-Volatility Organic Compounds (IVOCs). Environ. Sci. Technol. 2020, 54, 5409–5418. [Google Scholar] [CrossRef] [Scilit]
- Zhang, Y.Q.; Chen, D.H.; Ding, X.; Li, J.; Zhang, T.; Wang, J.Q.; Cheng, Q.; Jiang, H.; Song, W.; Ou, Y.-B.; et al. Impact of Anthropogenic Emissions on Biogenic Secondary Organic Aerosol: Observation in the Pearl River Delta, Southern China. Atmos. Chem. Phys. 2019, 19, 14403–14415. [Google Scholar] [CrossRef] [Scilit]
- Huang, W.; Yu, X.; Deng, H.; Chen, B.; Cheng, P.; Yang, W.; Li, M.; Yuan, B.; Wang, M.; Gong, Y. Strong Seasonal Transition and Complex Sources of Volatile Organic Compounds at an Urban Site in Guangzhou, China. J. Geophys. Res. Atmos. 2024, 129, e2024JD040890. [Google Scholar] [CrossRef] [Scilit]
- Kwok, R.H.F.; Fung, J.C.H.; Lau, A.K.H.; Fu, J.S. Numerical Study on Seasonal Variations of Gaseous Pollutants and Particulate Matters in Hong Kong and Pearl River Delta Region. J. Geophys. Res. Atmos. 2010, 115, D16308. [Google Scholar] [CrossRef] [Scilit]
- Ma, X.; Liu, G.; Chen, J. PTR-QMS Observation of OVOCs in an Urban Suburb of Guangzhou: Seasonal Characterization, Source Apportionment and Regional Transport. Atmos. Environ. 2025, 362, 121589. [Google Scholar] [CrossRef] [Scilit]
- Huang, W.; Huang, B.; Bi, X.; Lin, Q.; Liu, M.; Ren, Z.; Zhang, G.; Wang, X.; Sheng, G.; Fu, J. Emission of PAHs, NPAHs and OPAHs from Residential Honeycomb Coal Briquette Combustion. Energy Fuels 2014, 28, 636–642. [Google Scholar] [CrossRef] [Scilit]
- Stone, E.A.; Nguyen, T.T.; Pradhan, B.B.; Dangol, P.M. Assessment of Biogenic Secondary Organic Aerosol in the Himalayas. Environ Chem. 2012, 9, 263–272. [Google Scholar] [CrossRef] [Scilit]
- Kautzman, K.E.; Surratt, J.D.; Chan, M.N.; Chan, A.W.H.; Hersey, S.P.; Chhabra, P.S.; Dalleska, N.F.; Wennberg, P.O.; Flagan, R.C.; Seinfeld, J.H. Chemical Composition of Gas- and Aerosol-Phase Products from the Photooxidation of Naphthalene. J. Phys. Chem. A 2010, 114, 913–934. [Google Scholar] [CrossRef] [Scilit]
- Al-Naiema, I.M.; Offenberg, J.H.; Madler, C.J.; Lewandowski, M.; Kettler, J.; Fang, T.; Stone, E.A. Secondary Organic Aerosols from Aromatic Hydrocarbons and Their Contribution to Fine Particulate Matter in Atlanta, Georgia. Atmos. Environ. 2020, 223, 117227. [Google Scholar] [CrossRef] [Scilit] [PubMed]
- Fushimi, A.; Saitoh, K.; Hayashi, K.; Ono, K.; Fujitani, Y.; Villalobos, A.M.; Shelton, B.R.; Takami, A.; Tanabe, K.; Schauer, J.J. Chemical Characterization and Oxidative Potential of Particles Emitted from Open Burning of Cereal Straws and Rice Husk under Flaming and Smoldering Conditions. Atmos. Environ. 2017, 163, 118–127. [Google Scholar] [CrossRef] [Scilit]
- Zeng, X.; Kong, S.; Zhang, Q.; Ren, H.; Liu, J.; Feng, Y.; Yan, Q.; Qin, S.; Zheng, S.; Yao, L.; et al. Source Profiles and Emission Factors of Organic and Inorganic Species in Fine Particles Emitted from the Ultra-Low Emission Power Plant and Typical Industries. Sci. Total Environ. 2021, 789, 147966. [Google Scholar] [CrossRef] [Scilit]
- Yu, Q.; Ding, X.; He, Q.; Yang, W.; Zhu, M.; Li, S.; Zhang, R.; Shen, R.; Zhang, Y.; Bi, X.; et al. Nationwide Increase of Polycyclic Aromatic Hydrocarbons in Ultrafine Particles during Winter over China Revealed by Size-Segregated Measurements. Atmos. Chem. Phys. 2020, 20, 14581–14595. [Google Scholar] [CrossRef] [Scilit]
- Kleindienst, T.E.; Jaoui, M.; Lewandowski, M.; Offenberg, J.H.; Lewis, C.W.; Bhave, P.V.; Edney, E.O. Estimates of the Contributions of Biogenic and Anthropogenic Hydrocarbons to Secondary Organic Aerosol at a Southeastern US Location. Atmos. Environ. 2007, 41, 8288–8300. [Google Scholar] [CrossRef] [Scilit]
- He, X.; Huang, X.H.H.; Chow, K.S.; Yu, J.Z. Tracking Secondary Organic Aerosol Formation with Molecular Tracers: Contributions from Biogenic and Anthropogenic Precursors. Atmos. Environ. 2025, 360, 121410. [Google Scholar] [CrossRef] [Scilit]
- Zhang, X.; Cappa, C.D.; Jathar, S.H.; McVay, R.C.; Ensberg, J.J.; Kleeman, M.J.; Seinfeld, J.H. Influence of Vapor Wall Loss in Laboratory Chambers on Yields of Secondary Organic Aerosol. Proc. Natl. Acad. Sci. USA 2014, 111, 5802–5807. [Google Scholar] [CrossRef] [Scilit] [PubMed]
- Zhang, J.; He, X.; Ding, X.; Yu, J.Z.; Ying, Q. Modeling Secondary Organic Aerosol Tracers and Tracer-to-SOA Ratios for Monoterpenes and Sesquiterpenes Using a Chemical Transport Model. Environ. Sci. Technol. 2022, 56, 804–813. [Google Scholar] [CrossRef] [Scilit]
- Zhang, J.; He, X.; Gao, Y.; Zhu, S.; Jing, S.; Wang, H.; Yu, J.Z.; Ying, Q. Estimation of Aromatic Secondary Organic Aerosol Using a Molecular Tracer—A Chemical Transport Model Assessment. Environ. Sci. Technol. 2021, 55, 12882–12892. [Google Scholar] [CrossRef] [Scilit]
- Aiken, A.C.; DeCarlo, P.F.; Kroll, J.H.; Worsnop, D.R.; Huffman, J.A.; Docherty, K.S.; Ulbrich, I.M.; Mohr, C.; Kimmel, J.R.; Sueper, D.; et al. O/C and OM/OC Ratios of Primary, Secondary, and Ambient Organic Aerosols with High-Resolution Time-of-Flight Aerosol Mass Spectrometry. Environ. Sci. Technol. 2008, 42, 4478–4485. [Google Scholar] [CrossRef] [Scilit]
- Wu, C.; Yu, J.Z. Determination of Primary Combustion Source Organic Carbon-to-Elemental Carbon (OC/EC) Ratio Using Ambient OC and EC Measurements: Secondary OC-EC Correlation Minimization Method. Atmos. Chem. Phys. 2016, 16, 5453–5465. [Google Scholar] [CrossRef] [Scilit]
- Wu, C.; Wu, D.; Yu, J.Z. Quantifying Black Carbon Light Absorption Enhancement with a Novel Statistical Approach. Atmos. Chem. Phys. 2018, 18, 289–309. [Google Scholar] [CrossRef] [Scilit]
- Cheng, Y.; Ma, Y.; Hu, D. Tracer-Based Source Apportioning of Atmospheric Organic Carbon and the Influence of Anthropogenic Emissions on Secondary Organic Aerosol Formation in Hong Kong. Atmos. Chem. Phys. 2021, 21, 10589–10608. [Google Scholar] [CrossRef] [Scilit]
- Lewandowski, M.; Piletic, I.R.; Kleindienst, T.E.; Offenberg, J.H.; Beaver, M.R.; Jaoui, M.; Docherty, K.S.; Edney, E.O. Secondary Organic Aerosol Characterisation at Field Sites across the United States during the Spring–Summer Period. Int. J. Environ. Anal. Chem. 2013, 93, 1084–1103. [Google Scholar] [CrossRef] [Scilit]
Disclaimer/Publisher’s Note: The statements, opinions and data contained in all publications are solely those of the individual author(s) and contributor(s) and not of MDPI and/or the editor(s). MDPI and/or the editor(s) disclaim responsibility for any injury to people or property resulting from any ideas, methods, instructions or products referred to in the content. |
© 2026 by the authors. Licensee MDPI, Basel, Switzerland. This article is an open access article distributed under the terms and conditions of the Creative Commons Attribution (CC BY) license.