


Abstract
This paper proposes an approach to digitizing the environmental passport for areas where detachable parts of launch vehicles fall in Kazakhstan based on an interactive geographic information system platform and smart maps. An example is considered for zone U-4 (“Ulytau” district of the “Karaganda” region), which includes the fall zones of “Soyuz” launch vehicle blocks (IZ 26, 32, 34, 42, 56). The natural and climatic factors and hazards of the territory are analyzed: the total area of the zones under consideration exceeds 4.1 million hectares, annual precipitation varies between 218 and 289 mm, strong winds of 5.0–6.8 m/s are characteristic, and a high level of fire hazard can develop within 6–7 days. Data on fires for 2021 are provided. For an integrated assessment, a normalized system criterion, environmental sustainability indicator (0–1), has been introduced, aggregating four groups of criteria (chemical, mechanical, pyrogenic, biota) with a breakdown of contributions and calculation of uncertainty (σ and 95% CI). The system criterion of environmental sustainability map identifies local ‘hot spots’ with levels of around 0.8–1.0, while the uncertainty map shows maximums of up to 0.12–0.14 (with background values of ~0.02–0.08), which increases the validity of management decisions on monitoring and reclamation.
1. Introduction
With the long-term operation of the Baikonur rocket and space complex, increasing attention has been paid to the environmental condition of rocket component impact zones (RCIZ) and to the transparency of evidence used in environmental decision-making [1,2]. Environmental passports are official documents that substantiate environmental impact assessments (EIA) for territories affected by the fall of separated rocket stages and fragments; they document baseline conditions, evaluate potential risks, and define mitigation and monitoring measures under regulatory oversight in the Republic of Kazakhstan. Environmental studies indicate that the highest load from rocket and space activities is typically associated with the landing of separated parts in impact zones; therefore, an assessment should account for chemical pollution from toxic rocket fuel components and their transformation products, as well as the mechanical and pyrogenic disturbance of soils, vegetation, and water bodies [3]. To support the comparability and prioritization of impacts across zones, a point-based System Criterion of Environmental Sustainability (SCES) has been used to rank ecological effects and to synthesize expert and regulatory evidence into an integral indicator [1,4]. Prior studies further report that contamination episodes are spatially heterogeneous and may persist over time, with transformation products detectable in soils and seasonal media (e.g., snow cover), while ecosystem recovery can require long periods depending on soil type, season, and disturbance intensity [5,6,7,8,9,10,11,12,13,14]. Despite the availability of environmental passports and related datasets, the linkage of passport records to geographic locations and the tracking of measured indicators are often performed manually. In practice, the workflow involves multiple ministries and regional administrations, which complicates harmonization, slows inter-agency coordination, and limits advanced spatial analysis as well as timely updates of risk assessments.
The digitalization and automation of data collection, validation, storage, and visualization can address these limitations. In particular, a multifunctional web-based cartographic resource can provide an interactive map with standardized data-entry forms, domain constraints, and traceable updates, enabling cost-effective monitoring of annual changes and consistent comparison of observed indicators against permissible limits, including for prospective assessments relevant to national projects and international cooperation. Therefore, the aim of this study was to design and implement a multifunctional interactive GIS platform for environmental passports of rocket stage impact zones, integrating geospatially linked records with SCES-based risk mapping and uncertainty-aware visualization to support evidence-based environmental management.
2. Materials and Methods
The study objects include natural complexes and economic activity sites located in the “Ulytau” district of the “Karaganda” regions, specifically in the fall zones of the first stage of the “Cyclone” launch vehicle and the first stage (side boosters) of the “Soyuz” launch vehicle (zone U-4 areas of falls 26, 32, 34, 42, 56), as well as the habitat of the population in adjacent areas.
To establish a comprehensive regulatory and methodological framework, a systematic review of national and international regulatory documents was conducted, including state standards (SS), federal environmental standards (FES), methodological guidelines (MG), and sanitary rules (SanPiN). The analysis covered methodological approaches for measuring petroleum hydrocarbon concentrations in soil and assessing their ecological and hygienic impacts.
This article addresses critical environmental safety issues in the aerospace sector, specifically the impact of separated launch vehicle components on the environment within fall zones. Particular attention is given to the development of environmental passports for the fall zones located in the Kostanay and Karaganda regions of the Republic of Kazakhstan, according to the requirements of the ST RK 17.0.0.02-2001 standard.
A comprehensive approach was used, including soil-geochemical, hydrochemical, ecological-botanical, and sanitary-epidemiological surveys, instrumental measurements of atmospheric air parameters and natural water conditions, as well as the collection and analysis of soil, plant, and water samples. Sanitary and hygienic evaluations were also carried out in nearby populated areas.
A comprehensive assessment of fire hazard was conducted using the Nesterov Forest Flammability Index (G) [15] in accordance with GOST R 22.1.09-99 (2000). The fire hazard indicator K is calculated as the sum of the products of the daily air temperature (T) and the difference between this temperature and the dew point over the number of days (N) since the last rainfall. Based on the value of the K indicator, five classes of fire weather hazard are defined:
- Up to 300: No fire hazard.
- From 301–1000: Low fire hazard.
- From 1001–4000: Moderate fire hazard.
- From 4001–10000: High fire hazard.
- Over 10000: Extreme fire hazard.
All data were processed and visualized using MapInfo Professional 12.0 (Pitney Bowes Software Inc., Stamford, CT, USA).
2.1. Work in the Field of Standardization
Standardization is grounded in fundamental principles that mirror the key patterns involved in creating standards for space activities, their management, and the conditions necessary for their effective implementation and future development. When creating regulatory documents on standardization, it is important to consider the risks associated with their application, ensuring that the requirements align with the nation’s level of economic development, material and technical infrastructure, and scientific and technological advancements.
The international standard ISO 14001—Environmental Management Systems forms the basis for effective management of environmental aspects at all levels [16]. This standard offers a regulatory framework for organizations addressing environmental protection matters and allows for a swift response to changes in environmental requirements.
Regardless of size, type, and nature of activity, the standard can be applied to the environmental aspects of products and services that an organization controls or can influence, taking into account the life cycle approach. The Republic of Kazakhstan has adopted the harmonized standard, ST RK ISO 14001:2016, which is used as the national basis for the implementation of EMS; within the framework of this study, its provisions are considered as a management framework for planning the monitoring, quality control of results, and subsequent adjustment of the observation program.
In addition to monitoring and remediation requirements, it is important to consider the processes of identifying, assessing, and minimizing environmental risks when analyzing the consequences of launch vehicle crashes and fragmentation. To systematize such assessments, the study uses a life cycle assessment (LCA) approach in accordance with ISO 14040, which complements the ISO 14001 management framework and the applied requirements of ISO 14620-2. LCA allows the source of impact to be linked to possible transfer pathways and ultimate environmental effects, thereby justifying the priorities of preventive and remedial measures.
It is necessary to consider the processes involved in identifying, assessing, and minimizing the environmental risks associated with rocket impact. Key requirements include:
- Assessment of the significance of environmental aspects in the impact zone;
- Setting clear goals and measurable objectives for environmental sustainability efforts;
- Development of a system for monitoring and evaluating results.
Environmental monitoring in areas impacted by SPLV components aims to detect and evaluate the effects of their descent, analyze ecological changes, and formulate strategies to minimize associated negative impacts [17].
The ecological monitoring in the IZ SPLV is a significant part of the complex of ground-based measures that are technologically determined and inextricably linked with ensuring the launch of spacecraft. The monitoring system includes two blocks:
- Operational environmental monitoring (OEM) is conducted before and after each launch of launch vehicles, with the aim of monitoring the pollution of ecosystem components (soil, water, plants, snow, wildlife, the state of the ground layer of the atmosphere) by rocket fuel components and their transformation products;
- Complex research expeditions are conducted to assess the long-term impact on ecosystems and analyze the resilience of natural systems to man-made zones [18].
Monitoring involves the collection, systematization, and analysis of information on the state of ecosystems and their components. It identifies the causes of observed and potential changes in their condition, including sources and factors of chemical, physical (thermal), and mechanical impacts. Monitoring also assesses the correlation between permissible load limits and actual impact levels on ecosystems as a whole [19].
ISO 14040 Standard—Life Cycle Assessment: This standard helps assess all possible environmental impacts associated with the life cycle of objects, such as a launch vehicle (LV). It provides a basis for analyzing the effects of separable rocket parts on ecosystems. Key activities include:
- Defining the boundaries of the analysis system, taking into account all stages: from the development of the rocket to its impact and subsequent disposal.
- Collecting data on the impact on resources, biodiversity, and human health.
- The increasing awareness of environmental issues and their consequences related to the production and operation of LV has driven the development of methods to better understand and analyze these impacts. One of the key approaches is life cycle assessment. It helps to:
- Identify ways to improve the environmental parameters of products at all stages of their life cycle.
- Provide authorities with data for making informed decisions in the area of strategic development, prioritizing tasks, designing new products, and optimizing production processes.
- Establish and implement environmental performance criteria, while also enhancing methods for their calculation and monitoring.
- Using the results in marketing and information campaigns, including the development of environmental certification, creation of declarations of conformity with environmental standards, and preparation of statements on minimizing environmental impact.
The principles and methods of the environmental monitoring of rocket and space activities are studied in the scientific work “Ecological monitoring of the Baikonur Cosmodrome”. The objects of environmental monitoring are the positional area of the Cosmodrome and the IZ SPLV. The ecological parameters for assessing the condition of all ecosystem components have been developed. The systematization and structuring of diverse ecological monitoring data are carried out within GIS-based projects for the monitored sites [20].
The ISO 14620-2 standard (Space systems—Safety requirements) regulates environmental and technical protection during the launch of spacecraft, which is associated with risks to the environment and human health. Its use in developing ecological passports for areas affected by SPLV parts enables the integration of international risk management standards and supports the sustainable development of space activities. This standard provides a basis for documenting environmental risks, hazard control, and developing monitoring systems that meet modern requirements in the field of environmental protection and resource management. Likewise, it regulates the environmental protection of space operations, including the analysis of the environmental impact of rocket launches.
The ISO 14063 standard (External reporting and communication on environmental matters) focuses on the formulation and presentation of environmental information to a wide audience, which is critical to building public confidence in launch-related processes. The basic requirements are as follows:
- Transparency and accessibility of information about the environmental passport.
- Considering the needs of local communities and environmental organizations when shaping the content.
This standard establishes guidelines for organizations on general principles, policies, strategies, and activities related to both internal and external environmental communication
Procedures for environmental monitoring in the SPLV industrial zone are regulated in the national regulations of the Republic of Kazakhstan. These requirements cover the identification of sources of pollution, assessment of the condition of adjacent territories, and analysis of risks for the population associated with exposure to toxic components of fuel and products of their transformation. Key provisions include the (i) determination of the characteristics of polluting substances (including fuel residues and transformation products); (ii) conducting a geoecological assessment of the territories adjacent to the zone of influence; and a (iii) risk assessment for public health. A separate normative basis is the Order of the Minister of Ecology and Natural Resources of the Republic of Kazakhstan, dated 15 November 2023, No. 321, which approves the methodology for environmental impact assessment in the context of space activities (object “…”). The document establishes principles, criteria, and approaches to the assessment and reduction of environmental risks and provides an (a) assessment of characteristics of pollutant substances/parts released due to fall/impact; (b) analysis of the impact zone taking into account geographical, climatic, and ecological features; and (c) recommendations for post-factum environmental monitoring. The specified methodology is also used as a basis for the formation of an environmental passport of the impact zone. Within the framework of the passport, the following is provided: (a) a complete list of potential pollutants; (b) mapping of the spatial distribution of impacts; (c) recommendations for prevention/minimization of long-term consequences. When describing the methodology in this work, international framework approaches to environmental management and reporting, used to increase the reproducibility of monitoring procedures and comparability of results, are additionally taken into account. This document provides the framework for developing an ecological passport for the impact area. The passport should include:
- A comprehensive inventory of potential pollutants;
- Maps depicting the spatial distribution of environmental impacts;
- Recommendations to mitigate impacts and prevent long-term adverse effects.
The methodology was developed taking into account international standards, including UN requirements for environmental protection in the context of space activities. However, analysis shows that the integration of Kazakhstani requirements with international standards, such as ISO 14001, can improve the effectiveness of environmental management and monitoring. Research findings highlight the need to develop ecological passports that consider the localized impact of man-made pollution caused by falling rocket components to mitigate harm to the environment and public health.
For example, as a result of the “Soyuz-FG” launch vehicle accident with the MS-10 manned spacecraft, which occurred in the Ulytau region of the Republic of Kazakhstan on 11 October 2018, two sites of rocket fuel spill were formed. In 2018, 2019, 2022, and 2023, soil monitoring was carried out in this area. The main pollutants were UDMH, NDMA, and petroleum products, which had a limited spatial distribution. The highest concentrations of pollutants were observed directly at the sites of the fragments’ impact.
As measures to reduce the environmental impact of rocket and space activities, research primarily focuses on the detoxification of unsymmetrical dimethylhydrazine (UDMH), which is widely used as rocket fuel. Rocket launches can be accompanied by emissions of toxic compounds, including UDMH, which lead to contamination of the soil and the lower atmosphere. An additional risk is associated with the fall of detachable parts of launch vehicles: upon contact with the ground, they can leave local pockets of contamination due to fuel residues and their transformation products. The literature offers technological solutions, including the neutralization of UDMG with oxidizers and detoxifying reagents, the transition to more environmentally friendly fuel components, and design improvements to rockets to reduce the likelihood of leaks and toxic emissions. The combination of these measures highlights the need for a systematic environmental passport for separable parts of launch vehicles, which should identify sources of pollution, monitoring procedures, and a list of recommended actions for remediation and prevention [21].
Environmental protection measures in this section should be understood as a specific set of actions aimed at preventing pollution, quickly localizing contamination sites after debris falls, and accelerating ecosystem recovery. They include restricting access and surveying the site, taking samples in accordance with traceability requirements, and measures to prevent the spread of pollutants by surface runoff (temporary barriers, sorption materials). Restorative solutions are then applied: chemical detoxification of fuel residues and transformation products, local cleaning/removal of the contaminated layer if necessary, and bioremediation, followed by the restoration of vegetation cover with local species. The effectiveness of the measures is confirmed by regular monitoring (soil–water–air–vegetation), GIS mapping of risk zone dynamics, and updating the environmental passport based on feedback and repeat measurements.
Studies of vegetation at launch vehicle (LV) impact sites in Kazakhstan, conducted 4 to 12 years after the incidents, highlight the importance of factoring in the environmental consequences of rocket and space activities when preparing ecological passports. LV impacts involve chemical, mechanical, and thermal effects that generate man-made disturbed zones. Common outcomes include impact craters, soil degradation, and diminished natural vegetation.
At these sites, annual saltwort communities often develop and can reach relatively high plant cover due to changes in surface runoff. Vegetation gradually recovers with increasing distance from the impact center, reflected by higher cover and greater species richness. In the absence of active biological reclamation, the natural recovery of plant communities may take more than 10 years, especially under extreme desert conditions. The impact decreases with distance but can extend far beyond the central zone; therefore, this gradient should be considered when delineating ecological monitoring areas. Overall, the findings highlight the need for a detailed description of impacts on flora, planned reclamation actions, and recovery forecasts when compiling an ecological passport [22].
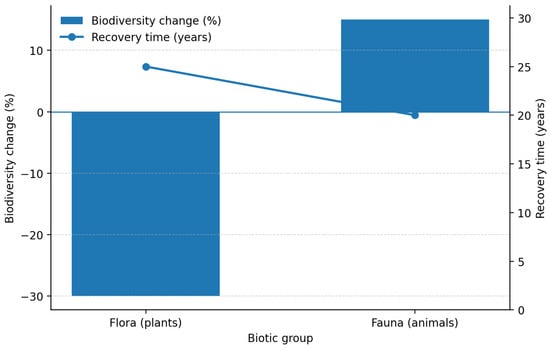
In flora, recovery occurs more quickly due to the adaptive mechanisms of plants. In fauna, recovery is difficult due to the migration of animals and the degradation of their natural environment (Figure 1).
Figure 1.
Biodiversity changes and recovery times for flora and fauna.
With the increasing number of commercial space launches, the impact of rocket and space activities on the environment is becoming increasingly significant. Liquid rocket fuels, widely used in the modern space industry, require a more in-depth study of their environmental impacts. Therefore, it is necessary to indicate in the environmental passport the types of fuel used in space launches and their impact on ecosystems.
Integrating data on the impact of various fuel types and monitoring emissions in line with international standards will help reduce environmental risks and support the sustainable development of the space industry [23].
Mechanical contamination by solid fragments is observed in impact zones where SPLV occurs, resulting in soil oversaturation with aluminum compounds that significantly reduce agricultural crop yields. Rocket fuel quickly penetrates the soil and undergoes chemical transformations, causing the contamination zone to expand. Certain harmful compounds remain in vegetation and can accumulate in herbivorous animals’ meat, ultimately posing a risk to human health through consumption [24]. To solve the problem of the contamination of territories with rocket fuel, the following measures are proposed:
- Development and implementation of environmentally friendly rocket fuels;
- Advancement of rocket launch and operation technologies to reduce harmful emissions;
- Development of efficient systems for monitoring and responding to aerospace emergencies;
- Establishment of international standards and regulatory documents addressing the environmental aspects of space activities [24].
Based on the analysis of regulatory documents, standards, and scientific research related to the environmental impact of space activities, the structure of an environmental passport has been developed. It includes the following components:
- Description of the area: Geographical and ecological characteristics of the territory, including descriptions of natural ecosystems and landscapes.
- Identification of impact sources: Types of rocket fuel and their transformation products, along with assessments of mechanical, chemical, and thermal emissions.
- Environmental impact assessment: Evaluation of the condition of soil, water bodies, air, and vegetation, as well as the impact on the health of populations living near rocket stage impact zones.
- Mitigation measures: Recommendations for land reclamation, including the use of bioremediation technologies and chemical agents to neutralize toxic substances. Thus, the structure of the environmental passport for the impact zones of the separating parts of launch vehicles should consist of the following sections:
- General information about the enterprise developing the environmental passport.
- General information about the authorized body approving the environmental passport.
- General information about the local executive authority on whose territory the areas where the separating units fell are located.
- General information about the territorial environmental protection authority.
- General information about the territorial health authority.
- General information about the territorial emergency response authority.
- General information about the impact area and adjacent territories, including:
- Location of the IZ SPLV.
- Geographical location and geometric characteristics of the IZ.
- Documents defining the conditions for the use of the territory for the IZ SP.
- Registry of land users and landowners in the impact zone and adjacent territories.
- Characteristics of natural and climatic conditions and resources, including:
- Climatic conditions in the area:
- Climate characteristics.
- Dangerous (extreme) meteorological phenomena.
- Landscape characteristics:
- Landscape type:
- Lactogenic base, relief (orography), and soils.
- Characteristics of groundwater.
- Characteristics of open water bodies of the IZ.
- Description of the vegetation cover of the IZ.
- 9.
- Information on economic activity in the IZ in adjacent territories:
- Information about the population.
- Indicators characterizing the population of the IZ in adjacent territories.
- Information about economic activity objects, infrastructure, and road network.
- Characteristics of industrial production facilities in the IZ in adjacent territories.
- Characteristics of agricultural production facilities in the IZ in adjacent territories.
- Characteristics of the main infrastructure facilities of the IZ in adjacent territories.
- Characteristics of specially protected natural areas, natural monuments, ecological and economic zones with special status, and recreational facilities in the IZ in adjacent territories.
- Information on anthropogenic sources of pollution in the IZ in adjacent territories.
- Sources of pollution in the IZ in adjacent territories, indicators of their impact.
- Description of the baseline ecological condition of the surrounding natural environment.
- 10.
- Basic information about the IZ SPLV:
- Weight and size characteristics of the SPLV and their condition during the impact.
- Chemical pollutants when the IZ SPLV.
- The impact of IZ SPLV in adjacent territories.
- Characteristics of fire hazard in the IA territory.
- 11.
- Contamination of impact areas with rocket fuel components and their transformation products:
- The number and locations of the IZ SPLV.
- General information about the fragments of the SPLV.
- Environmental impact on the territory of the IZ.
- Levels of pollution of natural environment objects on the territory of the IZ and adjacent territories by rocket fuel components and their toxic derivatives:
- Soils and ground and their pollution levels.
- Groundwater (underground) water and its pollution levels.
- Open water bodies and the degree of their pollution.
- Atmospheric air.
- Biotic objects and their pollution levels.
- 12.
- Information on rocket and space activities in the IZ SPLV:
- Information on standards and limits for maximum permissible emissions and discharges of pollutants, on standards and limits for waste disposal:
- Characteristics of sources of pollution (emissions) of the atmosphere and emissions of harmful substances.
- Characteristics of waste generated during the acceptance of IZ SPLV.
- Characteristics of sources and storage devices.
- Information on the amount of payments for pollution of natural environmental objects of the IZ.
Nature Conservation Measures:
- Details of environmental surveys conducted, including timeframes, responsible organizations, nature of the work performed, area of the surveyed territory, number of observation points, and number of analyses completed.
- Information on measures taken to eliminate rocket fuel component (RFC) spills, decontaminate (detoxify) contaminated lands, and reclaim disturbed areas.
- Data on the collection, detoxification, and removal of waste and metal debris for subsequent disposal.
- Status of the public alert system during LV operations.
- Description of coordinated actions taken by the Cosmodrome test site and local administrations in the event of incidents resulting in environmental or public harm;
- Information on compensation measures for environmental damage resulting from reduced oxygen concentrations.
- Details of actions taken to detect and extinguish fires caused by the impact components of LV.
Assessment of the Environmental Situation in the IZ and Adjacent Territories:
- Evaluation of the environmental condition, based on pollution indicators within the affected territories.
- Assessment of the sanitary and hygienic conditions in the IZ and nearby areas affected by launch vehicle stage falls.
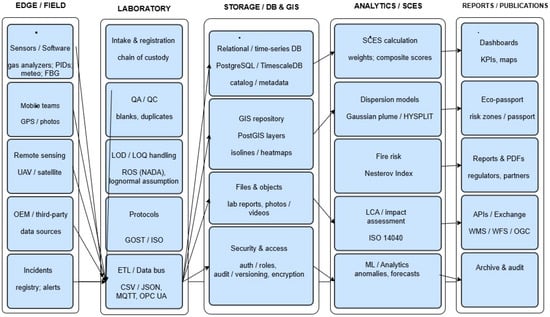
Figure 2 shows the complete pipeline, “data → quality → storage → calculations → publication”, which is necessary to ensure that the environmental passport and risk maps are reproducible, traceable, and regularly updated. On the left is the EDGE/FIELD loop, which contains the primary data sources: instrument measurements and software (PostgreSQL, TimescaleDB, PostGIS, MQTT, OPC UA, ETL/Data Bus, CSV/JSON) gas analyzers, PID sensors, weather stations, FBG sensors), mobile teams (GPS tracking/photography), remote sensing (UAV/satellite), as well as third-party sources (OEM/third-party) and the incident/alert log. Importantly, all these flows are not received “as is”, but are integrated into a single process through the laboratory block and/or directly into the data bus. Next comes the LABORATORY block, which is responsible for the “legal and metrological purity” of the data. This includes sample reception and registration, chain of custody management, QA/QC (quality control: blank samples, duplicates, outlier checking), LOD/LOQ detection limit processing, and rules for handling undetected values (e.g., ROS/NADA and the lognormal distribution assumption). Separate protocols (GOST/ISO) are provided to standardize the methodology, as is an ETL/Data bus integration layer (CSV/JSON, MQTT, OPC UA) that ensures the delivery and unification of data from different manufacturers and formats. The central STORAGE/DB & GIS unit provides a “single source of truth” for further analytics and mapping. It includes a relational/temporal database (PostgreSQL/TimescaleDB) and a metadata catalog, a GIS repository (PostGIS layers, isolines, heat maps), object file storage (laboratory reports, photos/videos), and the critical Security & Access layer: roles and rights, auditing, versioning, and encryption. This allows any indicator on the map to be “unscrewed” back to specific measurements, samples, and protocols. To the right is the ANALYTICS/SCES computational circuit (where SCES is the integrated indicator/criterion of environmental stress/resilience that you use in your work). This circuit performs the following: SCES calculation using weights and composite scores, dispersion models (Gaussian plume/HYSPLIT) for pollutant transport, fire hazard assessment (Nesterov index), LCA/impact assessment according to ISO 14040 (life cycle impact assessment), and ML analytics (anomaly detection, forecasts). This means the system supports both “classical” physical models and statistics/machine learning, depending on the task type.
Figure 2.
Ecopassport Platform.
The final REPORTS/PUBLICATIONS block shows how the results are packaged for users and regulators: interactive dashboards, KPIs and maps, eco-passport generation (passport + risk zones), reports/PDFs for authorized bodies and partners, exchange via API and WMS/WFS/OGC geoservices, as well as archiving and auditing (to record calculation and publication versions). Overall, this architecture makes passport updating an annual/periodic process: data is received, undergoes quality control, stored with metadata and access rights, then indices/maps are calculated, and reports are generated in a standardized format.
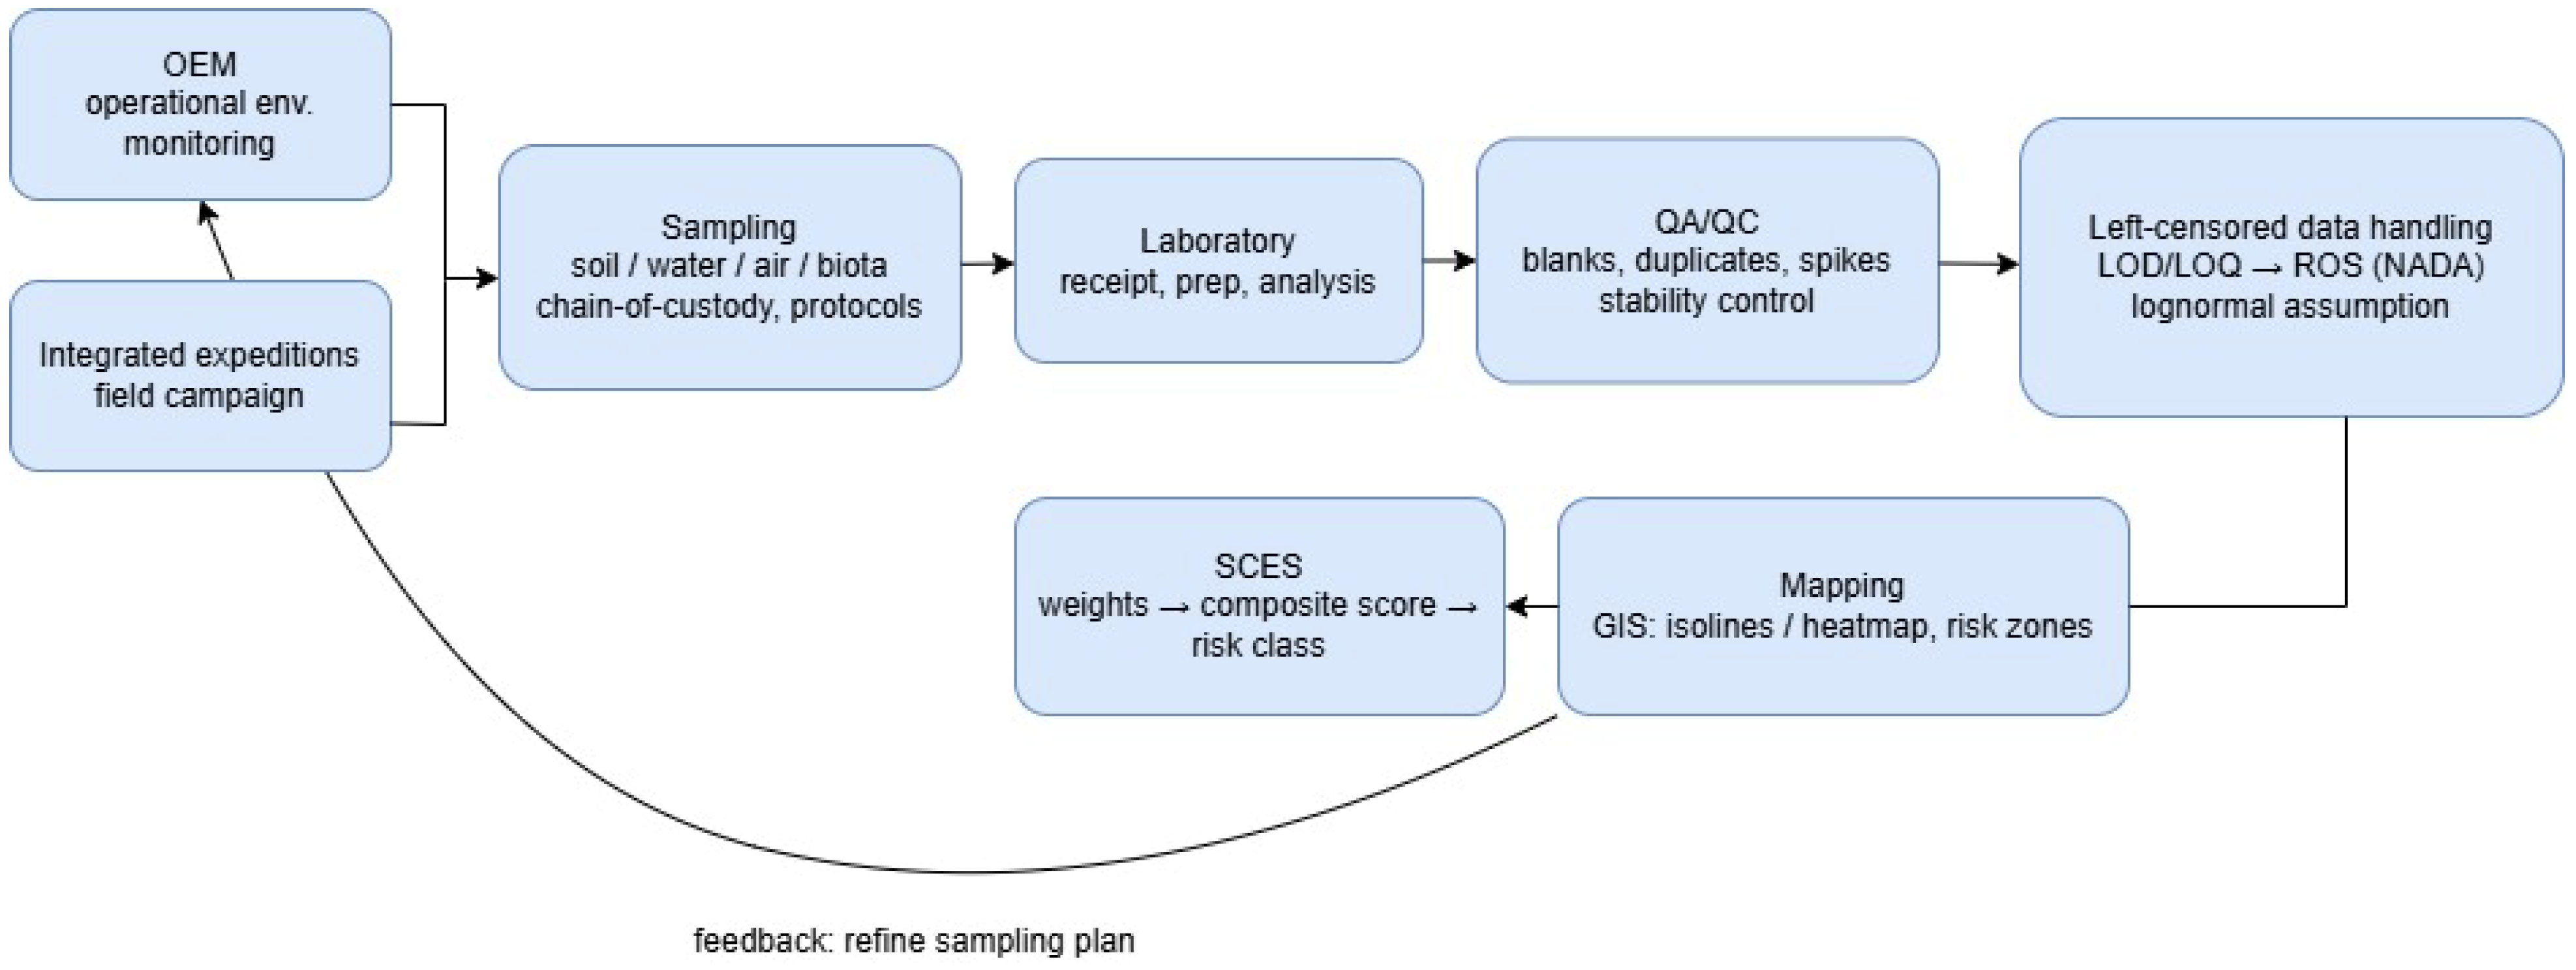
Figure 3 shows the complete workflow for environmental monitoring and risk mapping—from field observations to calculating the integrated index and providing feedback for the next expedition. The process begins with two sources: operational monitoring (OEM) and integrated field expeditions, which specify sampling points and a list of measured parameters. Next, soil/water/air/biota samples are collected, with coordinates and sampling conditions recorded, chain-of-custody (sample traceability) maintained, and protocols followed to ensure the data is legally and methodologically correct. The samples are then sent to the laboratory for registration, preparation, and analysis, after which the results undergo a rigorous QA/QC process (blank samples, duplicates, stability control, and spikes), which eliminates errors and confirms the reliability of the measurements. The processing of left-censored data (values below the detection limits/LOD/LOQ) is shown separately: instead of a crude “0”, correct procedures (e.g., ROS/NADA and the lognormality assumption) are applied to avoid distorting the statistics and subsequent calculations. In the next step, the cleaned data is used to calculate the SCES: the normalized indicators are combined by weights into a composite score, after which a risk class is assigned. The results are transferred to the GIS mapping unit, where contour lines and heat maps are constructed, and risk zones suitable for inclusion in the ecological passport and reporting are identified. A key feature of the scheme is the feedback loop: the resulting maps and risk classes are used to refine the sampling plan (where to densify the network, which indicators to include, which areas to monitor more frequently), making monitoring adaptive and increasing the accuracy of estimates during annual updates.
Figure 3.
Ecological and Analytical Monitoring.
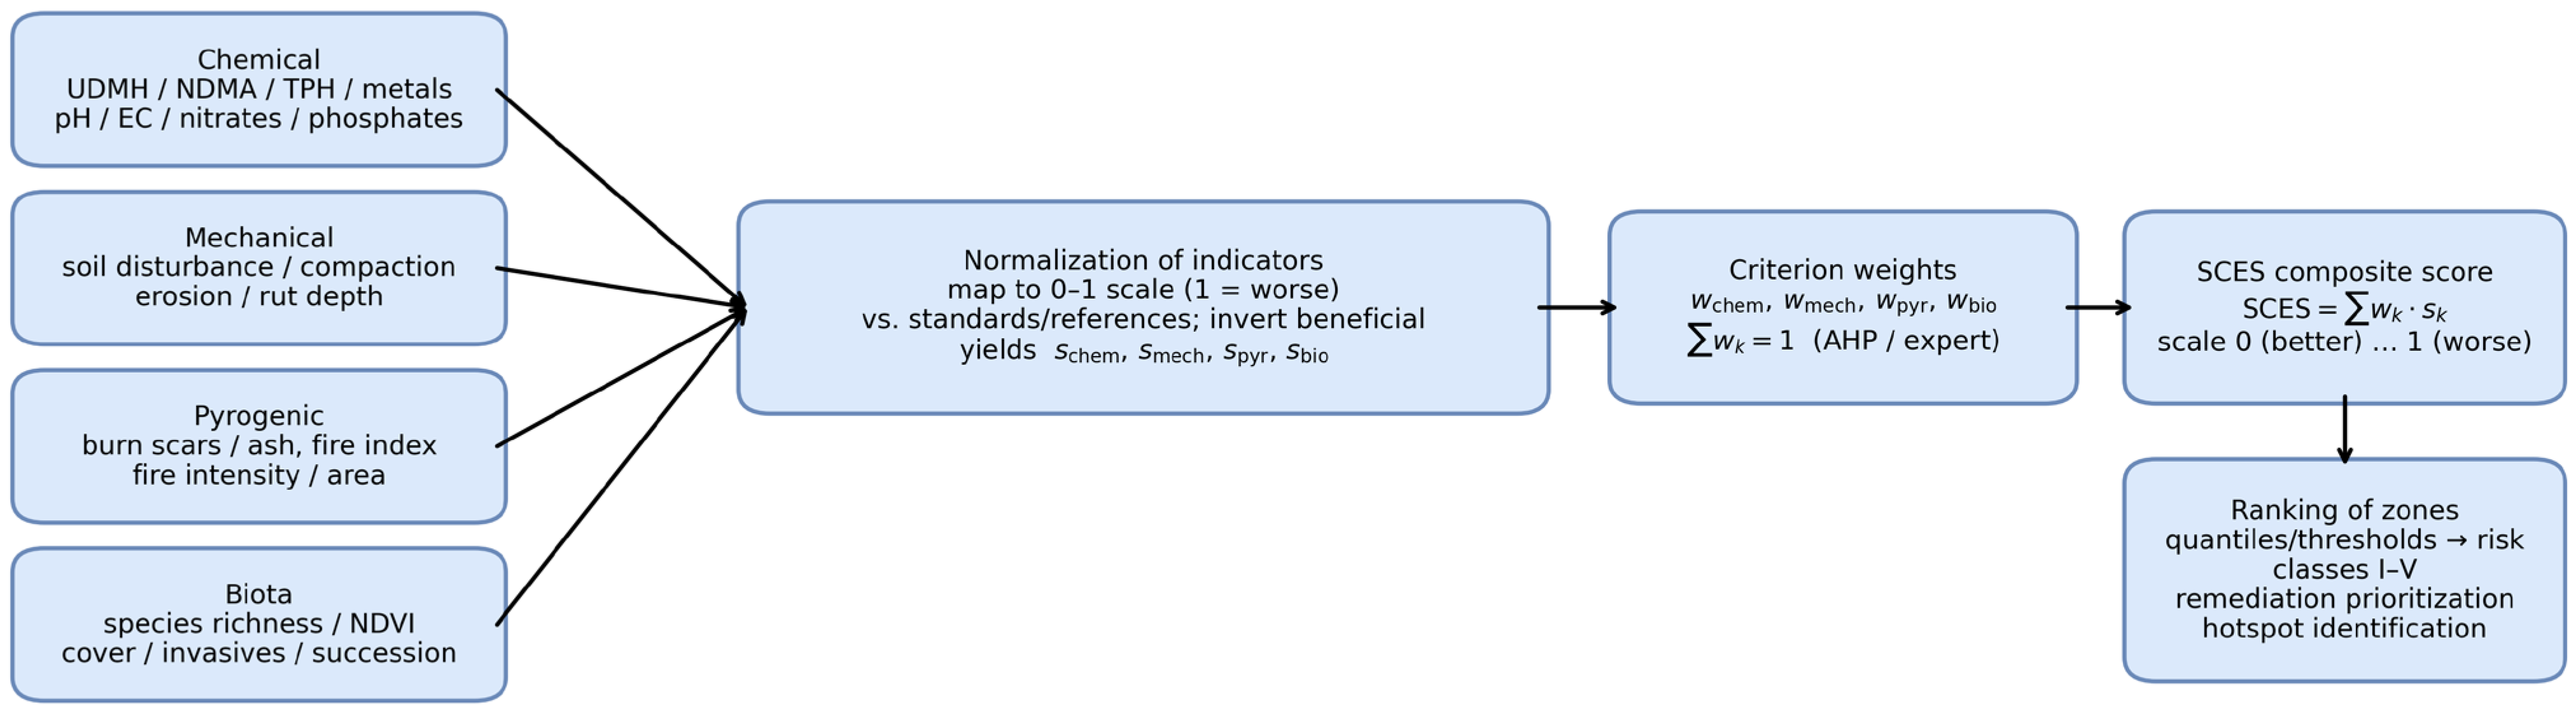
Figure 4 shows the algorithm for constructing the integrated SCES indicator from four groups of criteria: chemical, mechanical, pyrogenic, and biotic. First, measurable indicators are collected for each group (e.g., for chemistry—UDMH/NDMA, petroleum products, metals, pH/EC; for mechanics—soil compaction and disturbance; for pyrogenic factors—burn scars and fire danger indices; for biota—NDVI, projective cover, and species richness). Since these indicators have different units of measurement and different directions of influence, they are converted into standardized scores of 0–1, where 0 corresponds to a favorable state and 1 to the worst (highest risk). For “useful” indicators (e.g., NDVI), an inversion is applied to ensure a uniform interpretation of the scale. Next, the normalized scores are aggregated using weights wk determined by an expert procedure (for example, AHP), and a composite index SCES = ∑wk is calculated. The resulting SCES value is used to rank the territory by impact levels, set thresholds, and identify risk classes (I–V), which helps to justify the boundaries of environmental monitoring zones, identify “hotspots”, and prioritize reclamation activities.
Figure 4.
SCES.
2.2. Meteorological Data (Temperature, Precipitation, and Wind)
Meteorological layers used in the GIS model (long-term mean air temperature, long-term precipitation, and prevailing wind direction/mean wind speed) were taken from official climatological products and monitoring bulletins of RSE “Kazhydromet” (Kazakhstan). The layers were prepared in a unified GIS format (common projection/grid), clipped to the study area (Zone U-4 and adjacent territory), and then used for spatial analysis and visualization.
2.3. Standardization Framework for Reproducible Monitoring and Ecological Passports
This subsection complements Section 2.1 and explains how international standards are applied in practice in the proposed workflow to ensure reproducible environmental monitoring and traceable updates of ecological passports for impact zones. We rely on a combination of national requirements of the Republic of Kazakhstan and ISO standards, as the task involves both procedural elements (sampling, laboratory analysis, QA/QC, data processing) and management elements (planning, impact assessment, reporting, and stakeholder communication). First, the ISO 14001 logic and the PDCA (Plan–Do–Check–Act) cycle are used to organize monitoring as a repeatable management process rather than a one-off measurement campaign: parameters and sampling points are planned, field and laboratory work is carried out, results are verified through QA/QC and validation (including trend analysis), and the program is adjusted based on identified “hot spots” and indicator dynamics. This ensures comparability of results between seasons and years and allows for the systematic updating of environmental passports. Secondly, ISO 14040 (life cycle assessment, LCA) is used as a methodological template for structuring cause-and-effect chains “source → transfer/transformation → impact → mitigation measures”, even if a full LCA is limited by data availability. This approach helps identify stages and factors where impacts can be minimized (e.g., through remediation, reduction in anthropogenic load, and optimization of monitoring design). Thirdly, for tasks specific to launch vehicle impact zones, ISO 14620-2 is used as a benchmark for the integrated assessment of chemical, mechanical, and physical impacts. In this study, this is reflected in the joint analysis of spatially referenced field and laboratory measurements, accurate data processing (including cases below LOD/LOQ), and GIS mapping of spatial impact patterns. Finally, ISO 14063 (environmental communication) sets out principles for presenting results to ensure transparency and trust: the environmental passport and accompanying reports are considered not only as internal reporting documents but also as a tool for interaction with regulators and other stakeholders. Therefore, this article specifically emphasizes the structure of results presentation (maps, risk classes, uncertainty interpretation, and action priorities) to ensure the document is understandable and applicable in practice.
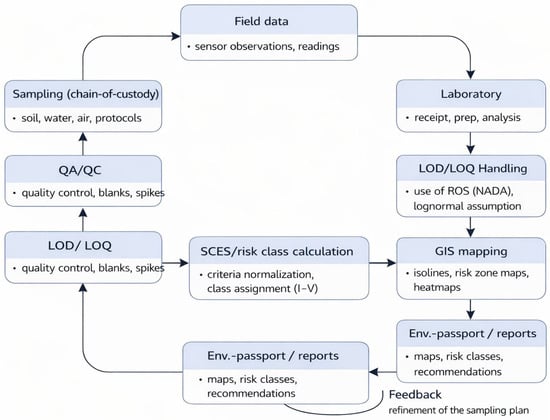
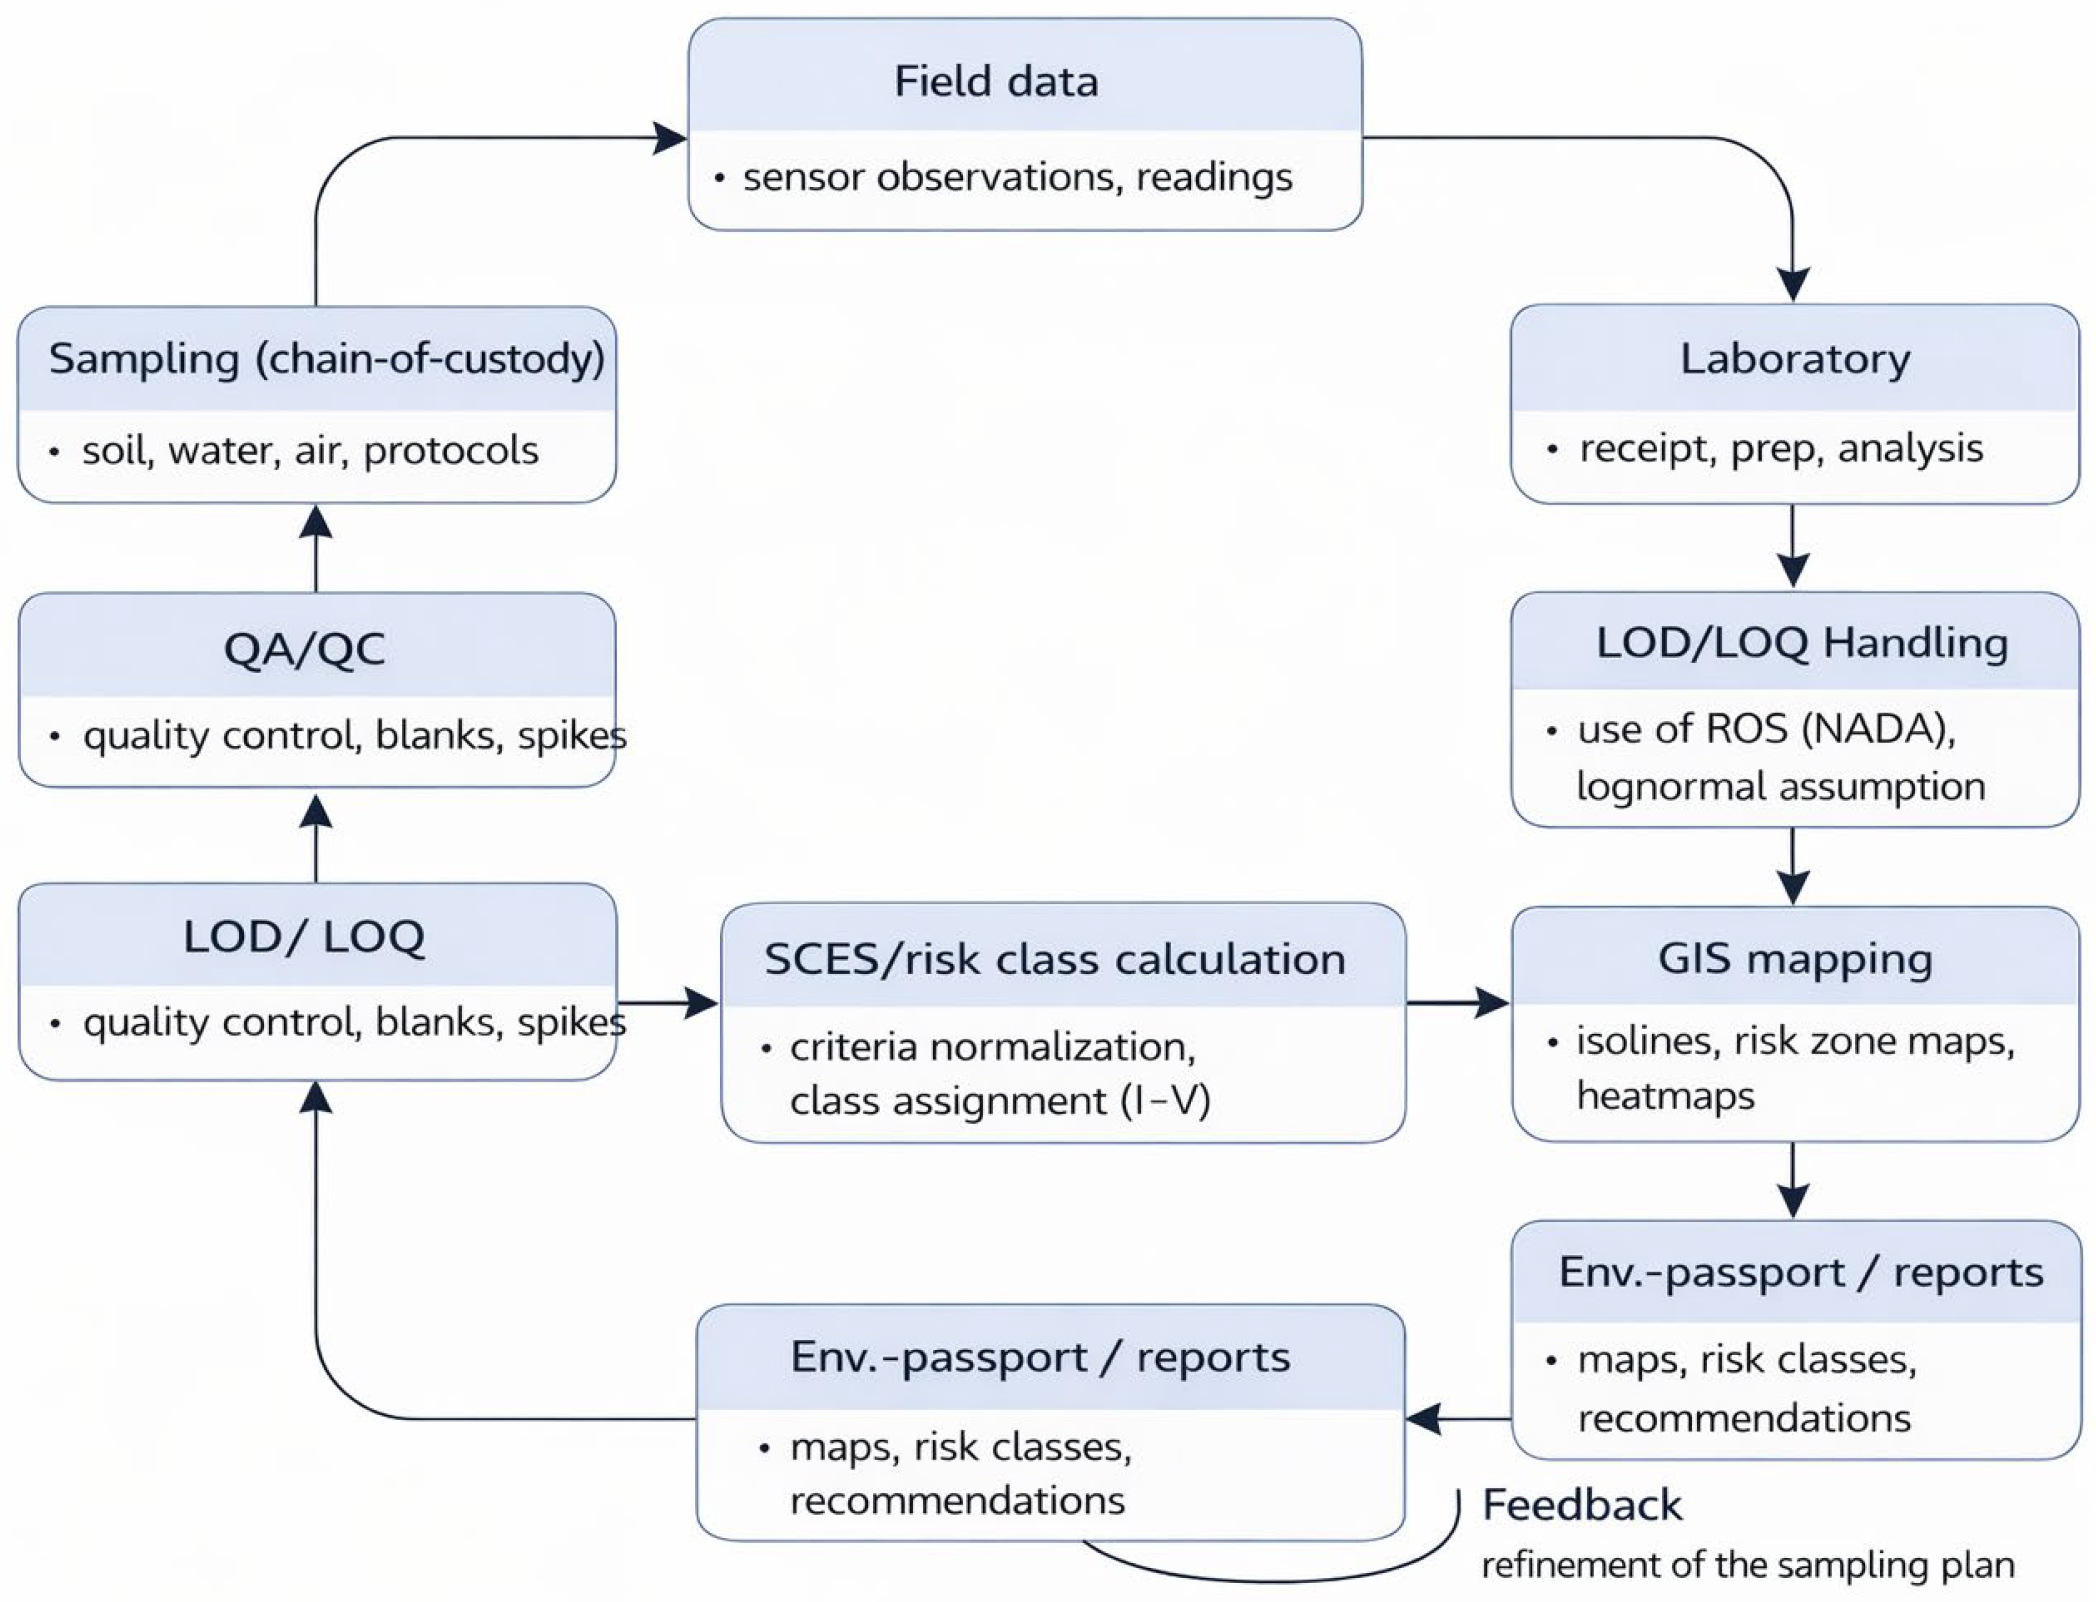
Figure 5 shows the complete process for generating an ecological passport and risk maps based on monitoring data. Field observations and sampling are first performed with chain-of-custody traceability, after which the samples undergo laboratory preparation and analysis. The results are then verified using quality assurance (QA/QC) procedures (blank samples, duplicates, spike controls, stability control), and values below the limits of detection/quantification (LOD/LOQ) are processed using appropriate statistical approaches to avoid biased estimates. Meteorological data are additionally used to ensure comparability of results over time and the correct interpretation of spatial patterns of impact and recovery. In addition to ground-based weather station data, spatially continuous gridded products (e.g., reanalysis and satellite datasets) are used when necessary to provide coverage of precipitation, air temperature, wind speed and direction, humidity, and snow cover characteristics for periods relevant to sampling and post-impact. These data undergo basic quality control (range and consistency checks, gap handling), are aggregated into standard time windows (e.g., monthly and seasonal), and are normalized to a common spatial basis (GIS grid and administrative boundaries) used in the passport. The resulting meteorological layers are used as contextual covariates in SCES synthesis and in uncertainty-based interpretation of “hot spots”, since pollutant transport and deposition, moisture regime and leaching, the likelihood of pyrogenic disturbances, and the rate of ecosystem recovery are significantly influenced by weather variability. If necessary, additional derived indicators (e.g., drought indices, wind exposure metrics, precipitation anomalies) are calculated and stored along with metadata, enabling reproducible updating of risk classes and an explanation of interannual differences in SCES concentrations and values. After cleaning, the data are aggregated into an integral SCES index and converted into risk classes (I–V), which are visualized in a GIS as contour lines, heat maps, and risk zones. The final materials are compiled into an ecological passport and reports, and feedback on identified hot spots is used to refine the monitoring plan for the next cycle.
Figure 5.
The full cycle of obtaining an environmental passport and risk maps from monitoring data.
Table 1 summarizes the key provisions of ISO 14620-2 and shows how they are implemented in the proposed approach. For the Monitoring element, the requirement to collect pollution data is interpreted as organizing measurements using sensors. For the Recovery element, ecosystem restoration requirements are matched with practical remediation measures, including biodegradation methods. Finally, the Fall zone maps block reflects the need for spatial visualization: in this work, this is implemented through the construction of fall zone maps and the display of impacts in GIS. Thus, the table links regulatory requirements and specific technical solutions, ensuring transparency of compliance with the standard.
Table 1.
Key provisions for the application of ISO 14620-2.
Table 2 shows a comparison of Kazakhstan’s national environmental requirements and the relevant international standards applicable to impact assessment and environmental passport management. In terms of identifying sources of pollution, national regulations focus on determining the types of pollutants and analyzing concentrations, while international standards (ISO 14620-2 and ISO 14040) supplement this with an assessment of chemical/mechanical/physical impacts and an analysis of the cumulative effect over the life cycle. The section on environmental monitoring demonstrates the transition from regular environmental measurements (soil, air, water, vegetation) to systematic monitoring management based on the PDCA (ISO 14001) logic and the use of GIS and sensors for accurate mapping of impact areas (ISO 14620-2). Measures to prevent consequences are highlighted separately: the national focus is on soil remediation and recultivation, while international approaches complement this with the search for stages where impact can be minimized (ISO 14040) and strategies to reduce anthropogenic pressure (ISO 14620-2). The table also highlights a key gap: life cycle assessment (LCA) is often not performed in national practice, whereas ISO 14040 requires analysis “from design to disposal”, taking into account biodiversity, resources, and emissions. Finally, international standards (ISO 14001, ISO 14063) on environmental information management and planning reinforce requirements for transparency, stakeholder engagement, and integration of environmental strategy into operational processes, which is important for standardizing practices and increasing trust.
Table 2.
Comparative analysis of national and international standards.
Table 3 presents a comparison of key international ISO standards and their role in the methodology of environmental passports and monitoring. It is shown that ISO 14001 defines the PDCA management logic for regular planning, control, and adjustment of monitoring, while ISO 14040 is used as a framework for impact assessment and the selection of stages where the mitigation effect is maximal. ISO 14620-2 reflects requirements for a comprehensive assessment of chemical/mechanical/physical impacts and supports the use of GIS and sensory data to identify impact zones. ISO 14063 complements the methodology with requirements for transparency and environmental communication, which are important for the preparation of environmental passports and reporting to regulators and stakeholders.
Table 3.
The role of key ISO standards in the methodology of environmental passports and monitoring.
3. Results
Thus, an analysis has been conducted of the regulatory requirements and international standards related to the structure and formatting of the ecological passport for rocket stage impact zones located within the territory of the Republic of Kazakhstan.
A structural framework for the ecological passport of rocket stage impact zones has been developed. This framework is designed to provide essential information on the current environmental conditions of natural sites affected by the negative impacts of rocket and space activities from the Baikonur Cosmodrome. This is particularly important for Kazakhstan, as the current lease agreement for the Baikonur Complex includes 51 rocket stage impact zones. These impact zones are located across nine regions of the Republic of Kazakhstan (Karaganda, Ulytau, Kostanay, Akmola, North Kazakhstan, Pavlodar, Kyzylorda, East Kazakhstan, and Aktobe regions), covering a total area of more than 4.1 million hectares [25,26].
The scientific significance of this research project lies in the development of a fundamentally new concept: the complete cycle of creating ecological passports for areas contaminated by toxic waste from rocket technology is currently performed manually, in stages, and involves the detailed processing of heterogeneous, complex, and structurally diverse information. This project aims to automate that process by implementing it as a web-based resource.
The developed multifunctional map will enable cost-effective monitoring of annual measurement changes and allow comparison of obtained indicators with permissible limits. Analysis of the collected data will support the implementation of logically coherent and evidence-based measures to address violations of the environmental conditions in rocket stage impact zones.
The project also includes the development of a model for describing the topology of contaminated zones and methods for visualizing multidimensional data used to monitor dynamic, real-time systems with complex hierarchical structures. Information about deviations and anomalous events will be provided in graphical form using a cognitive approach.
The conceptual framework for mitigating the technogenic impact of spent rocket stages and failed launches on the environment is based on the following core scientific and methodological principles:
- ‑
- Development of scientific and methodological guidelines for the creation of a multifunctional map with the potential for integration with other information systems;
- ‑
- Scientific studies and fieldwork to collect data necessary for the formation of ecological passports;
- ‑
- Reduction in technogenic impact in emergency impact zones;
- ‑
- Development of algorithms for analyzing and monitoring data related to deviations and abnormal events.
As a result of the research, a methodology has been developed that enables the achievement of set goals and simplifies the process of forming environmental passports without compromising the accuracy and completeness of data. Additionally, a software tool based on the “Smart Map” technology has been created, for which cartographic materials have been developed, including (see Figure 5).
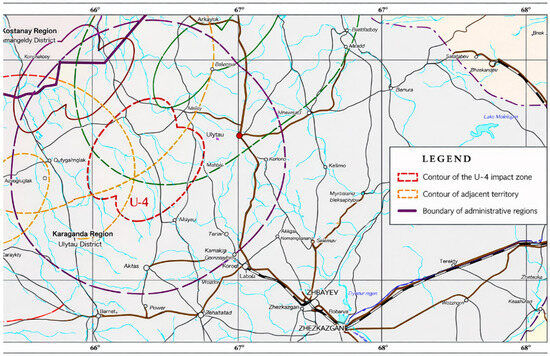
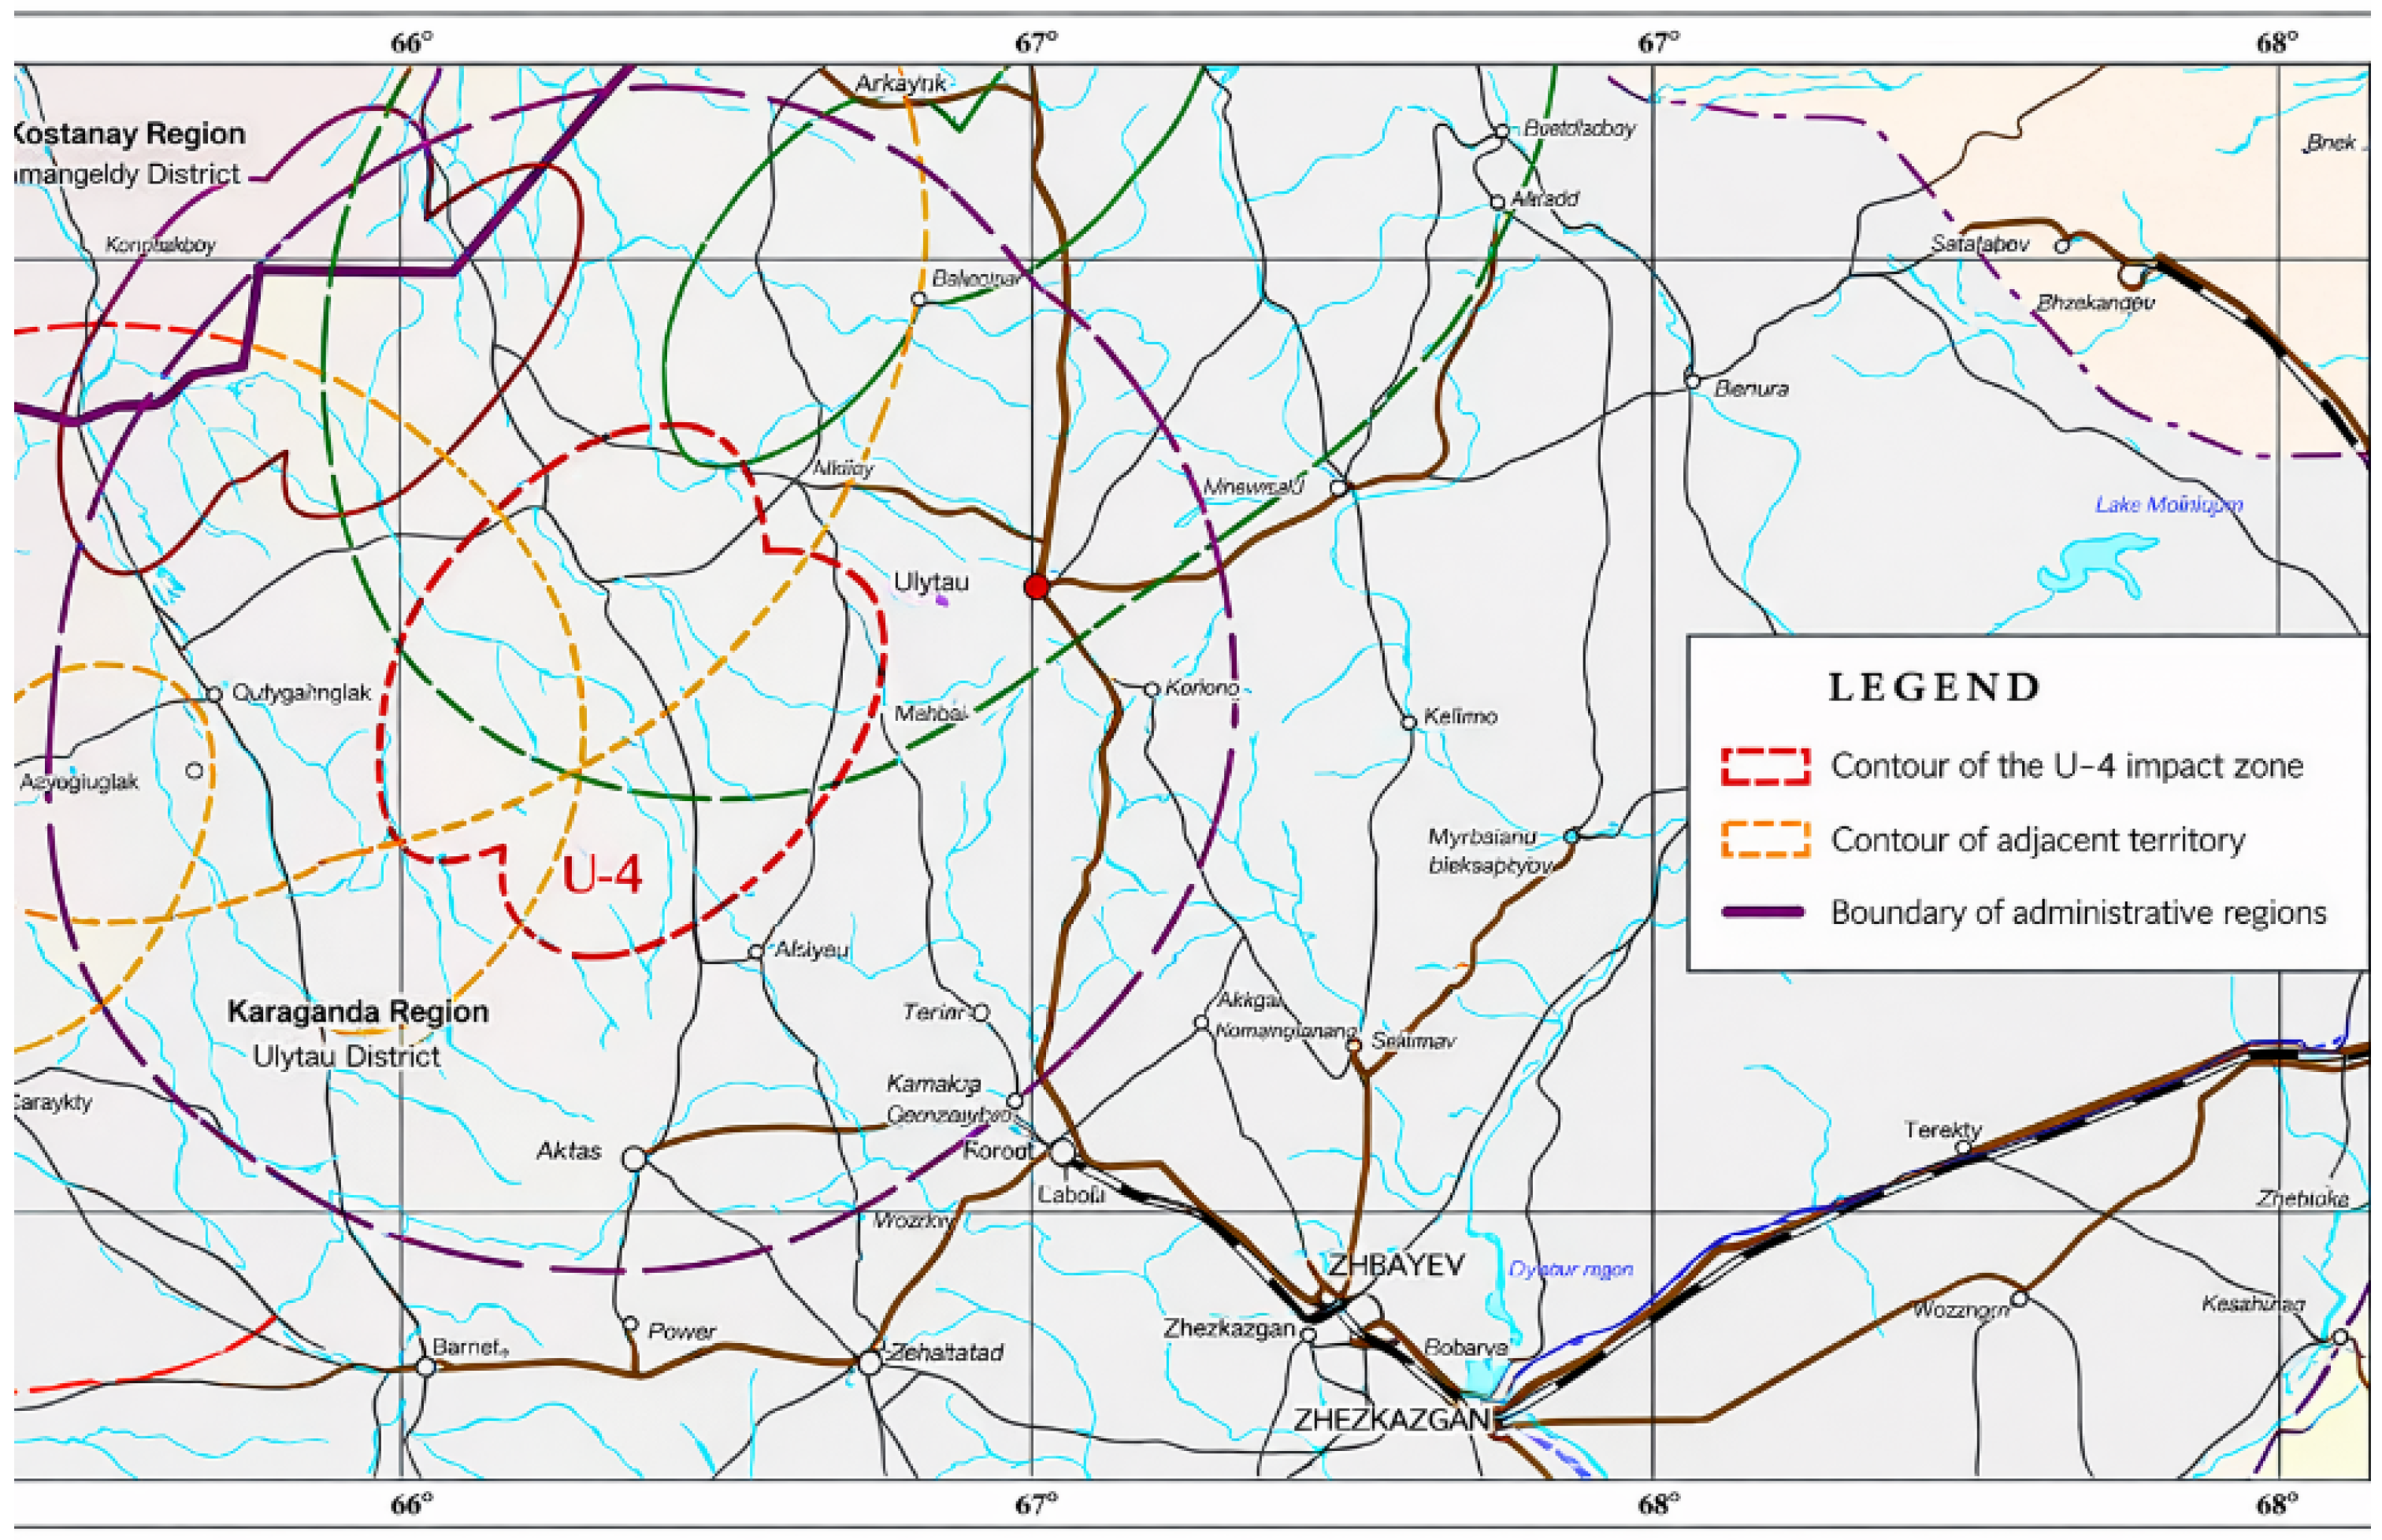
The datasets represent multi-year averaged (climatological) conditions and were used as baseline inputs for the environmental background and SCES mapping (Figure 6, Figure 7 and Figure 8). The U-4 zone is located in the Ulytau district of the Karaganda region. The site with an area of 0.2520 million hectares (2.520 km2) has been allocated, uniting five impact zones (IZ) of the first stage (side blocks) of the Soyuz launch vehicle—IZ 26, 32, 34, 42, 56 (5).
Figure 6.
Location of the rocket stage impact zones and adjacent territory, as shown on the administrative map of the Republic of Kazakhstan.
Figure 7.
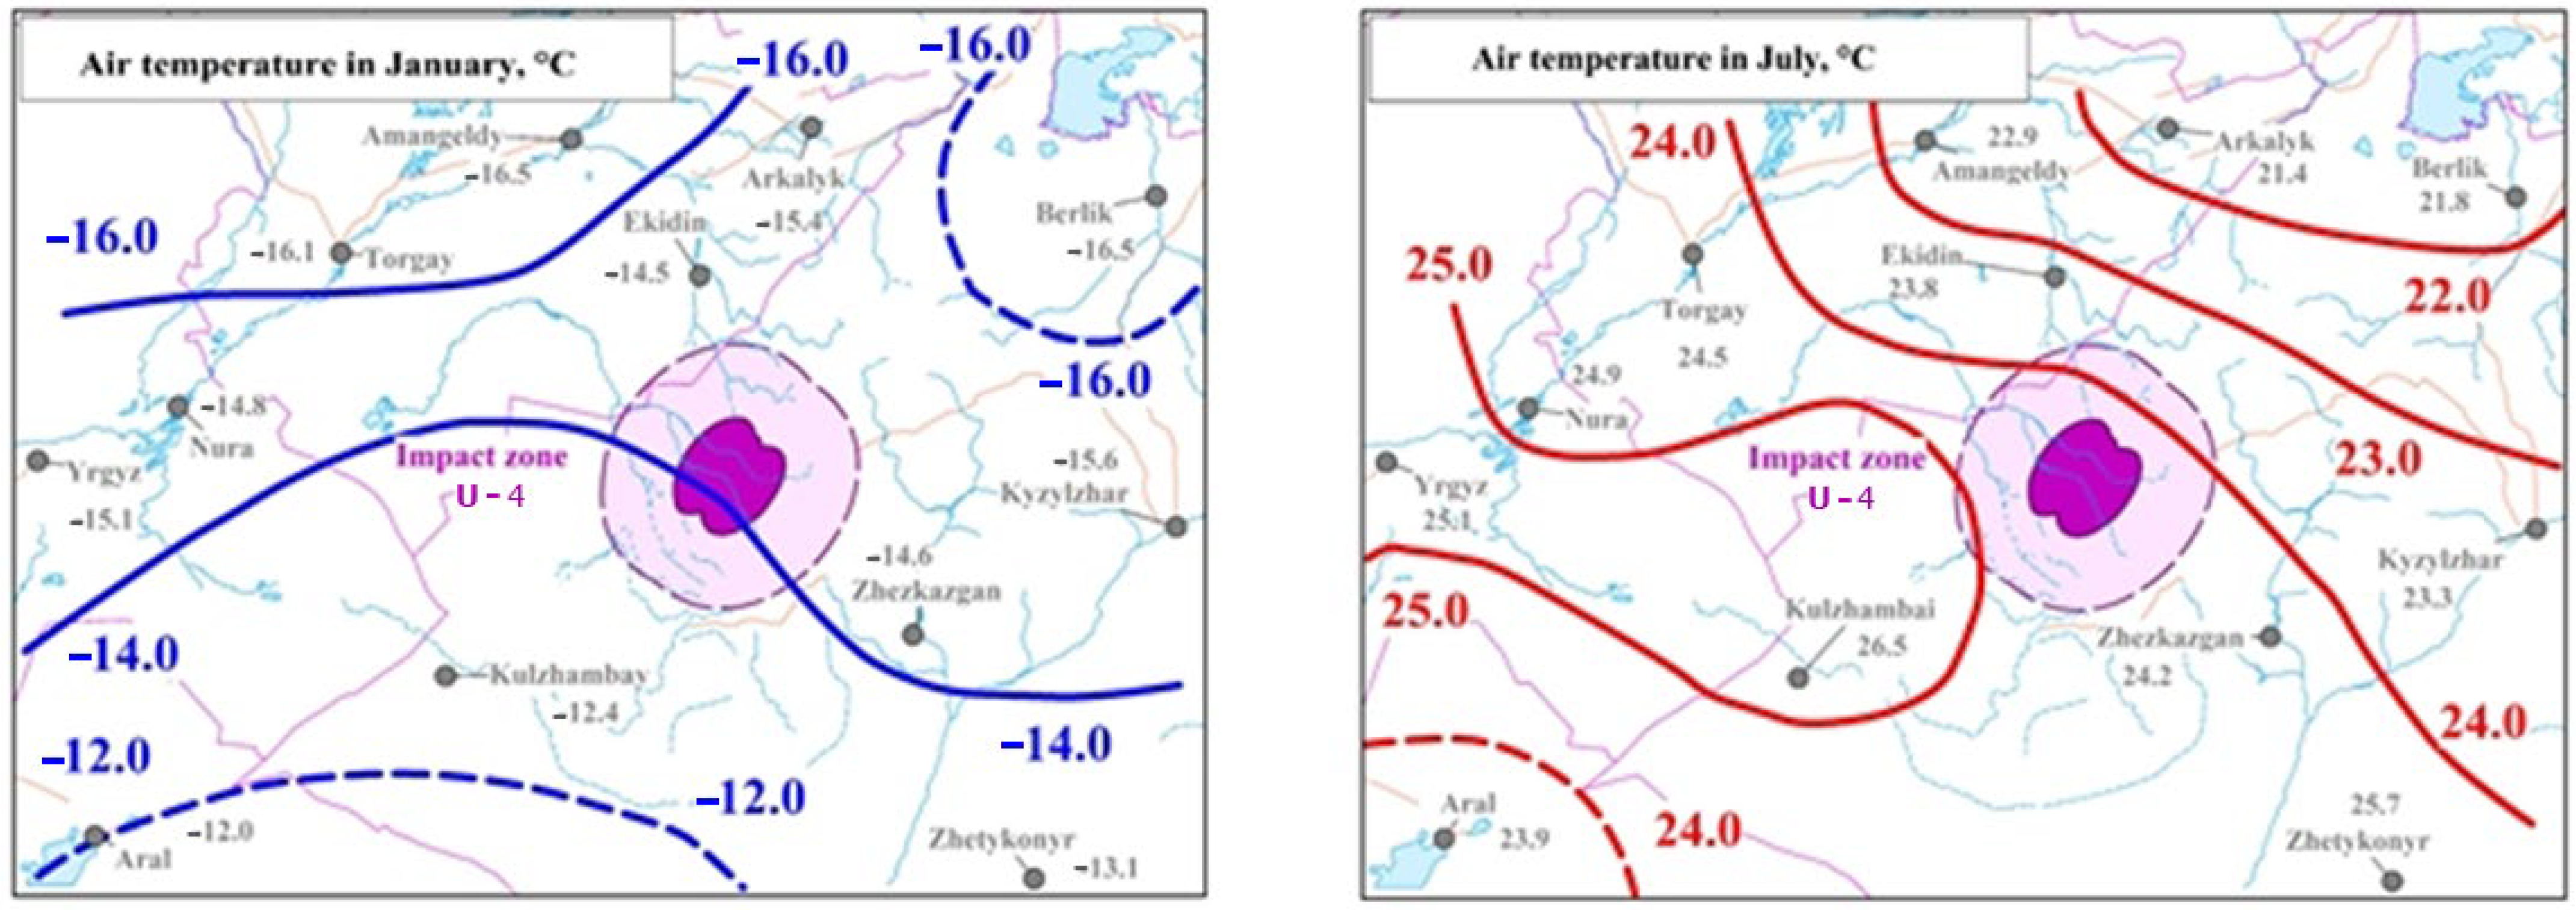
Average long-term daily air temperature (°C) in the fall area and the adjacent territory.
Figure 8.
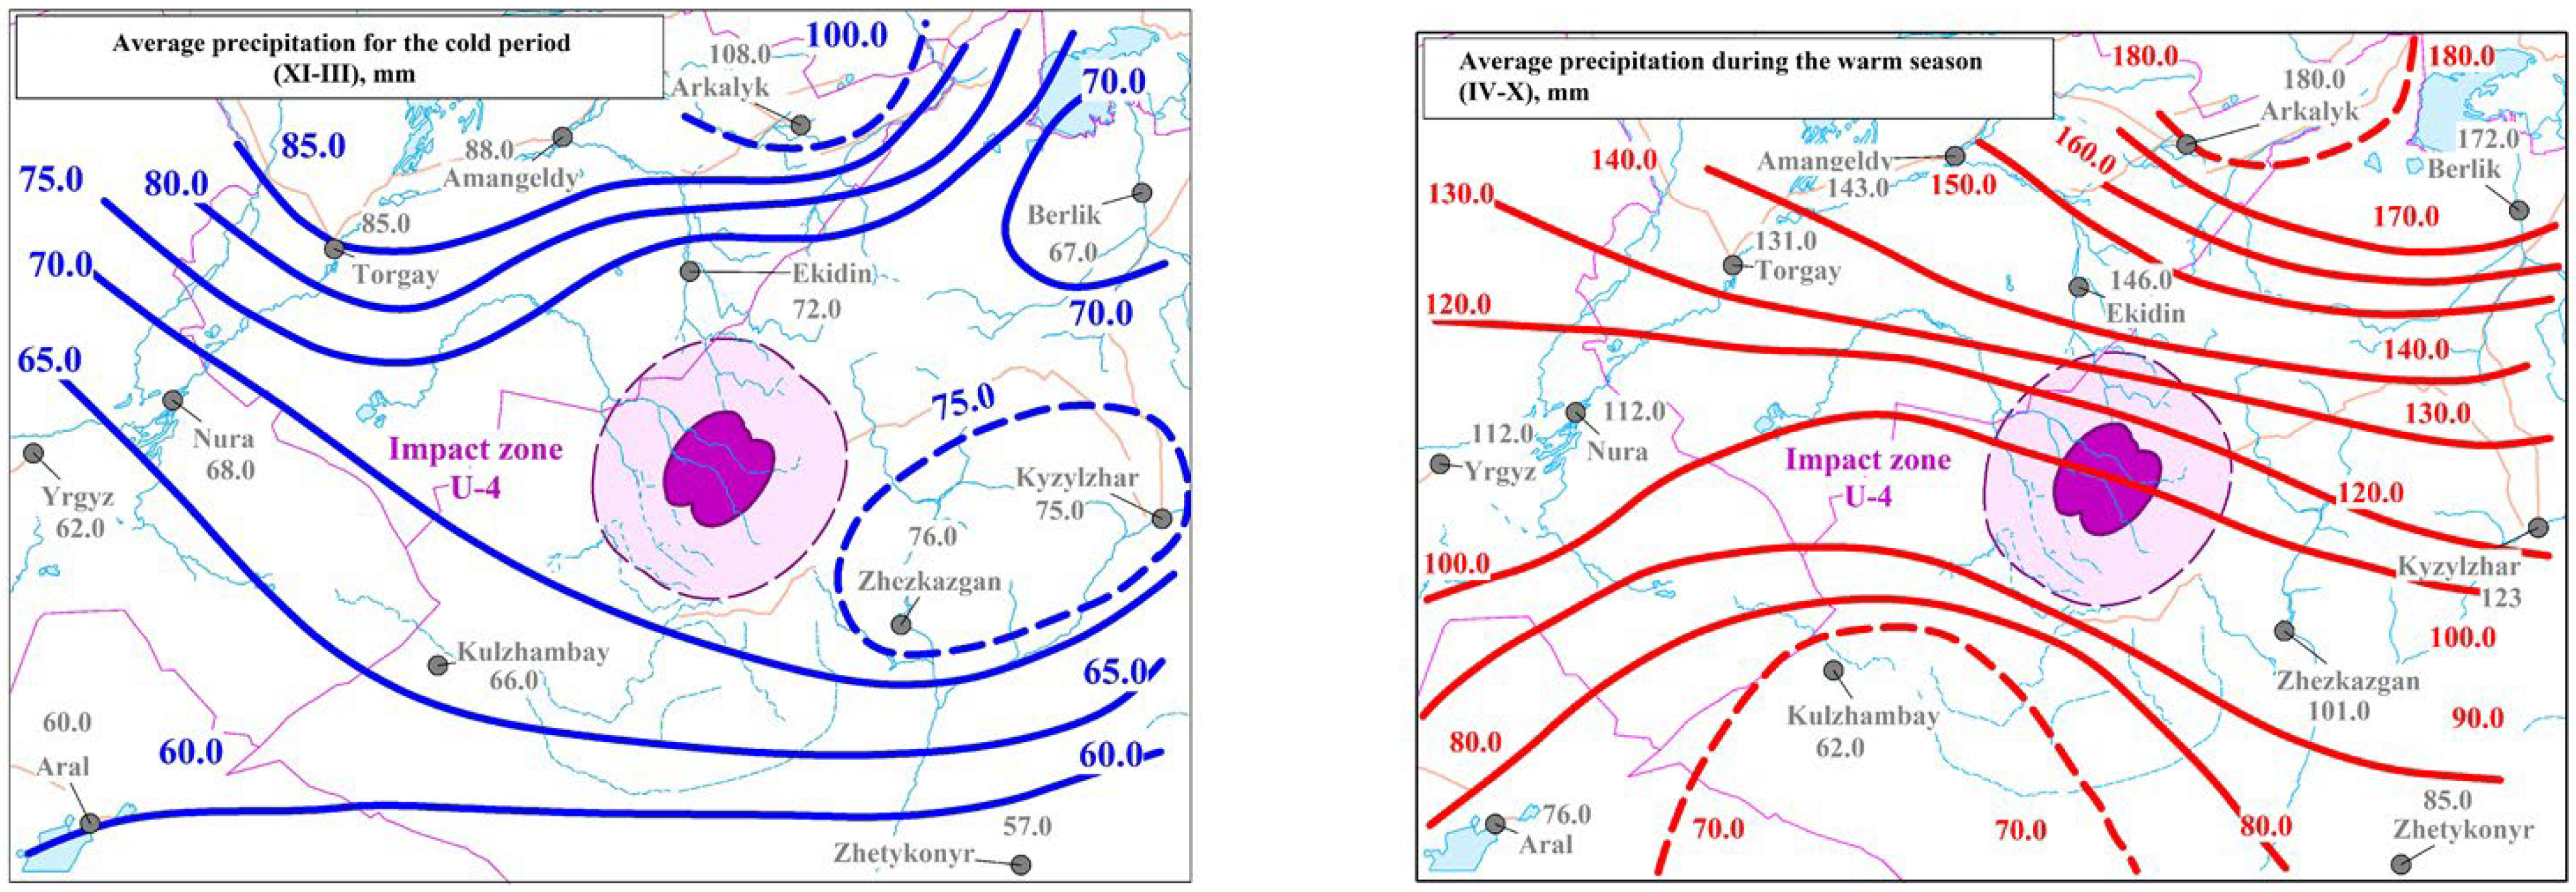
Average atmospheric precipitation (mm) in the impact zones and adjoining region.
The coldest month, January, shows average daily temperatures ranging from −14.0 °C to −16.0 °C in northern and central parts, with the coldest northern sector reaching −16.0 °C or below. Southern areas are milder (−12.4 °C to −14.6 °C). July, the warmest month, features average daily temperatures of between 23.0 °C and 25.0 °C, with maximums reaching up to 26.5 °C in the southwestern sector (Figure 6).
Figure 7 shows the air temperature regime. In January, the isotherms are −16.0, −14.0, and −12.0 °C; the U-4 impact zone is located near the −14.0 °C line (between −16 and −12 °C). In July, the isotherms are 22.0, 23.0, 24.0, and 25.0 °C; the U-4 zone is between 23.0 and 24.0 °C (approximately 23–24 °C). This sets the seasonal conditions for pollutant transformation and the “windows” for field work.
Figure 8 shows annual precipitation. For the cold period (November–March), precipitation isolines range from 60 to 100 mm (labeled 60.0, 65.0, 70.0, 75.0, 80.0, 85.0, 100.0 mm); zone U-4 is approximately in the range of 70–75 mm. For the warm season (IV–X), the isolines are 70–180 mm (labeled 70.0, 80.0, 90.0, 100.0, 120.0, 130.0, 140.0, 150.0, 160.0, 170.0, 180.0 mm); a line of approximately 120.0 mm (i.e., about 120–130 mm) passes through U-4. These values explain when washout/migration downstream is more likely and where monitoring needs to be intensified along the relief depressions.
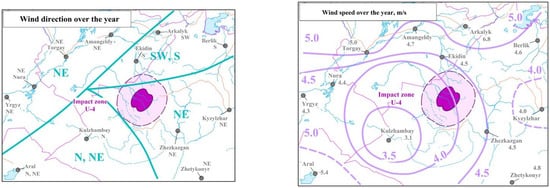
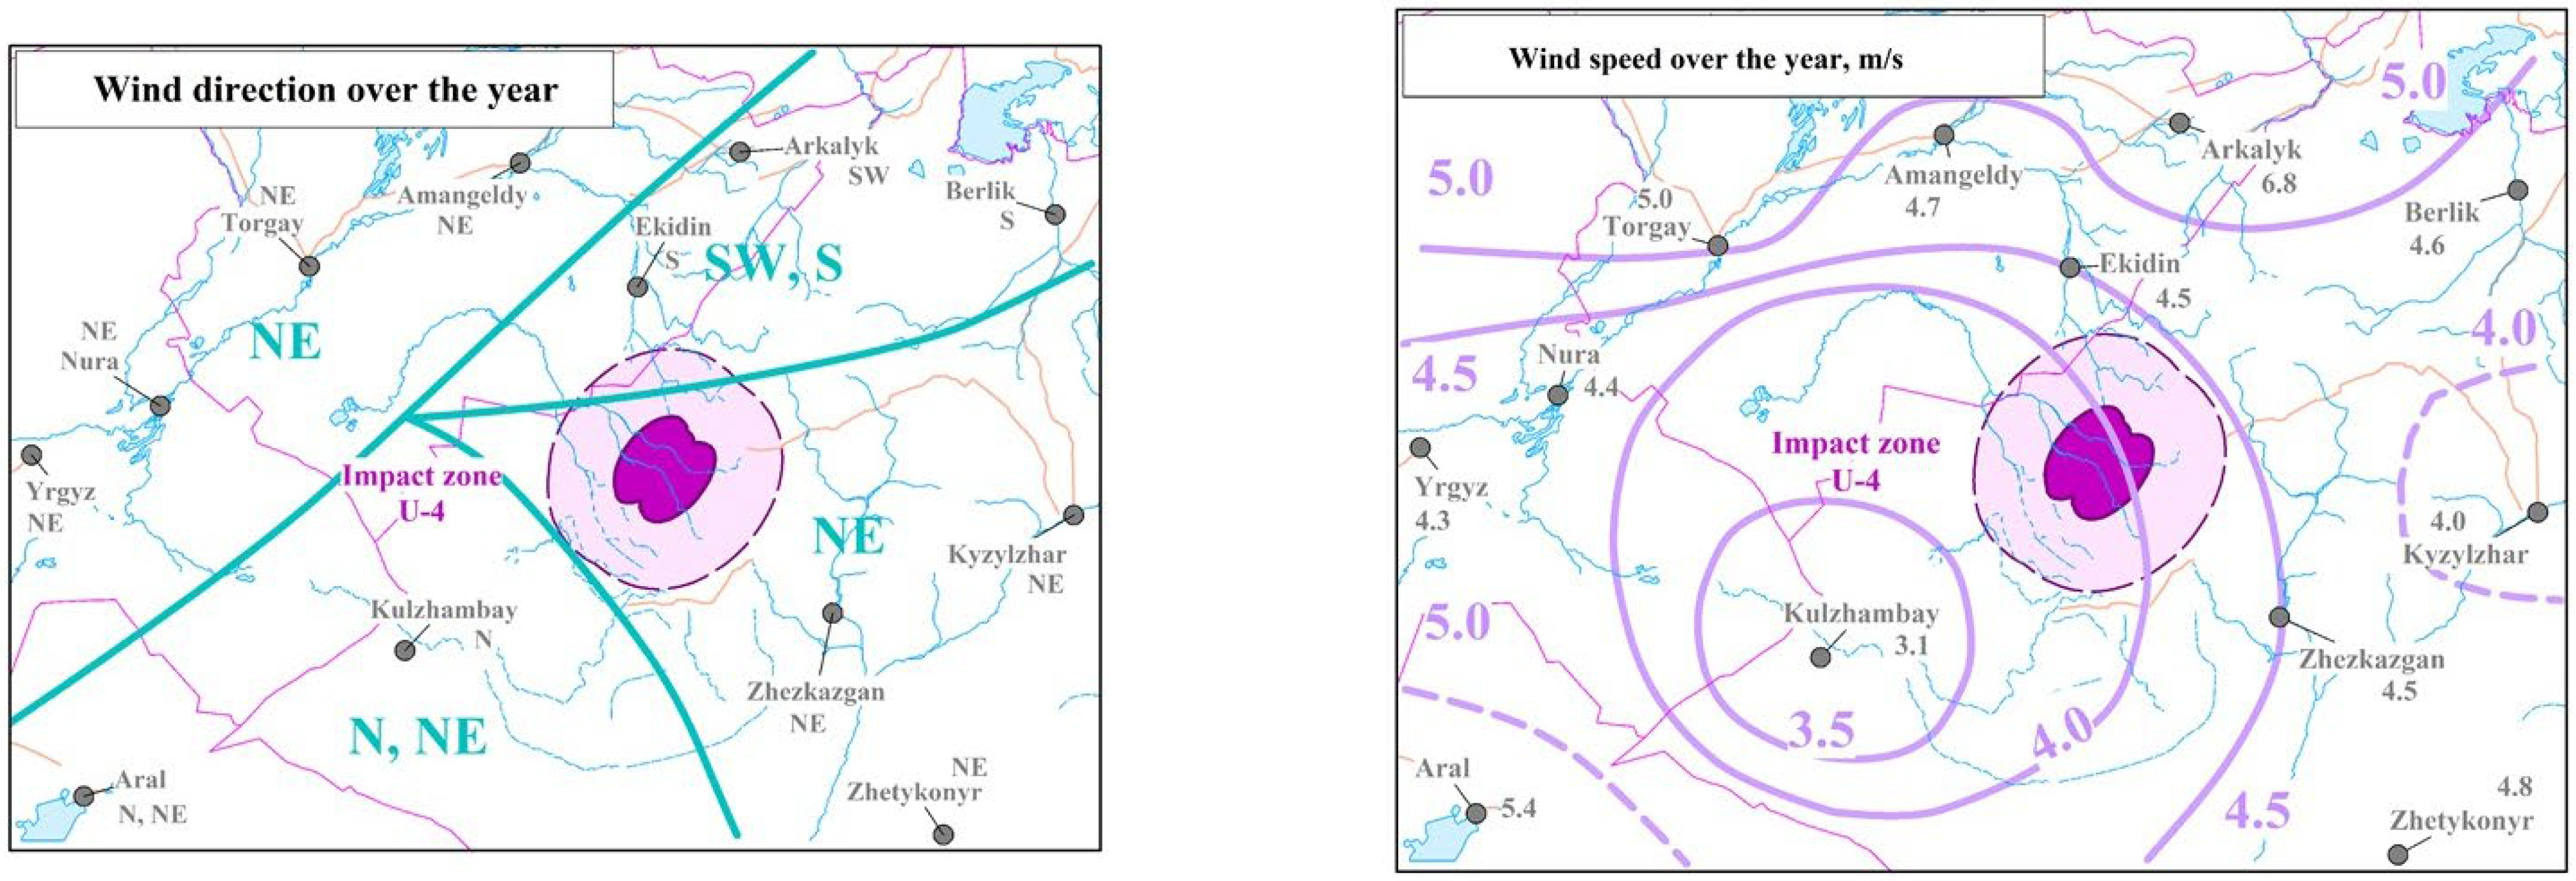
Figure 9 shows the annual characteristics of wind conditions in the U-4 impact zone: prevailing wind directions (NE/N–NE and SW–S) and average wind speeds at isolines of 3.5, 4.0, 4.5, and 5.0 m/s. Zone U-4 is located in the range of approximately 4.0–4.5 m/s, which indicates a significant potential for the transport of aerosols and dust particles from the center of impact. These data are included to justify the asymmetric design of the monitoring zones and the interpretation of a possible “trail” of pollution in the direction of the dominant transport, rather than only within the circular buffer zone.
Figure 9.
Average annual prevailing wind direction and mean wind speed (m/s).
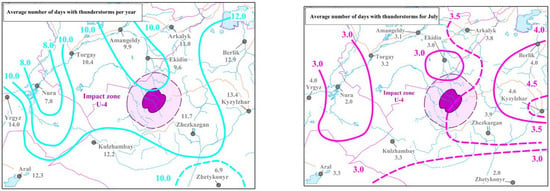
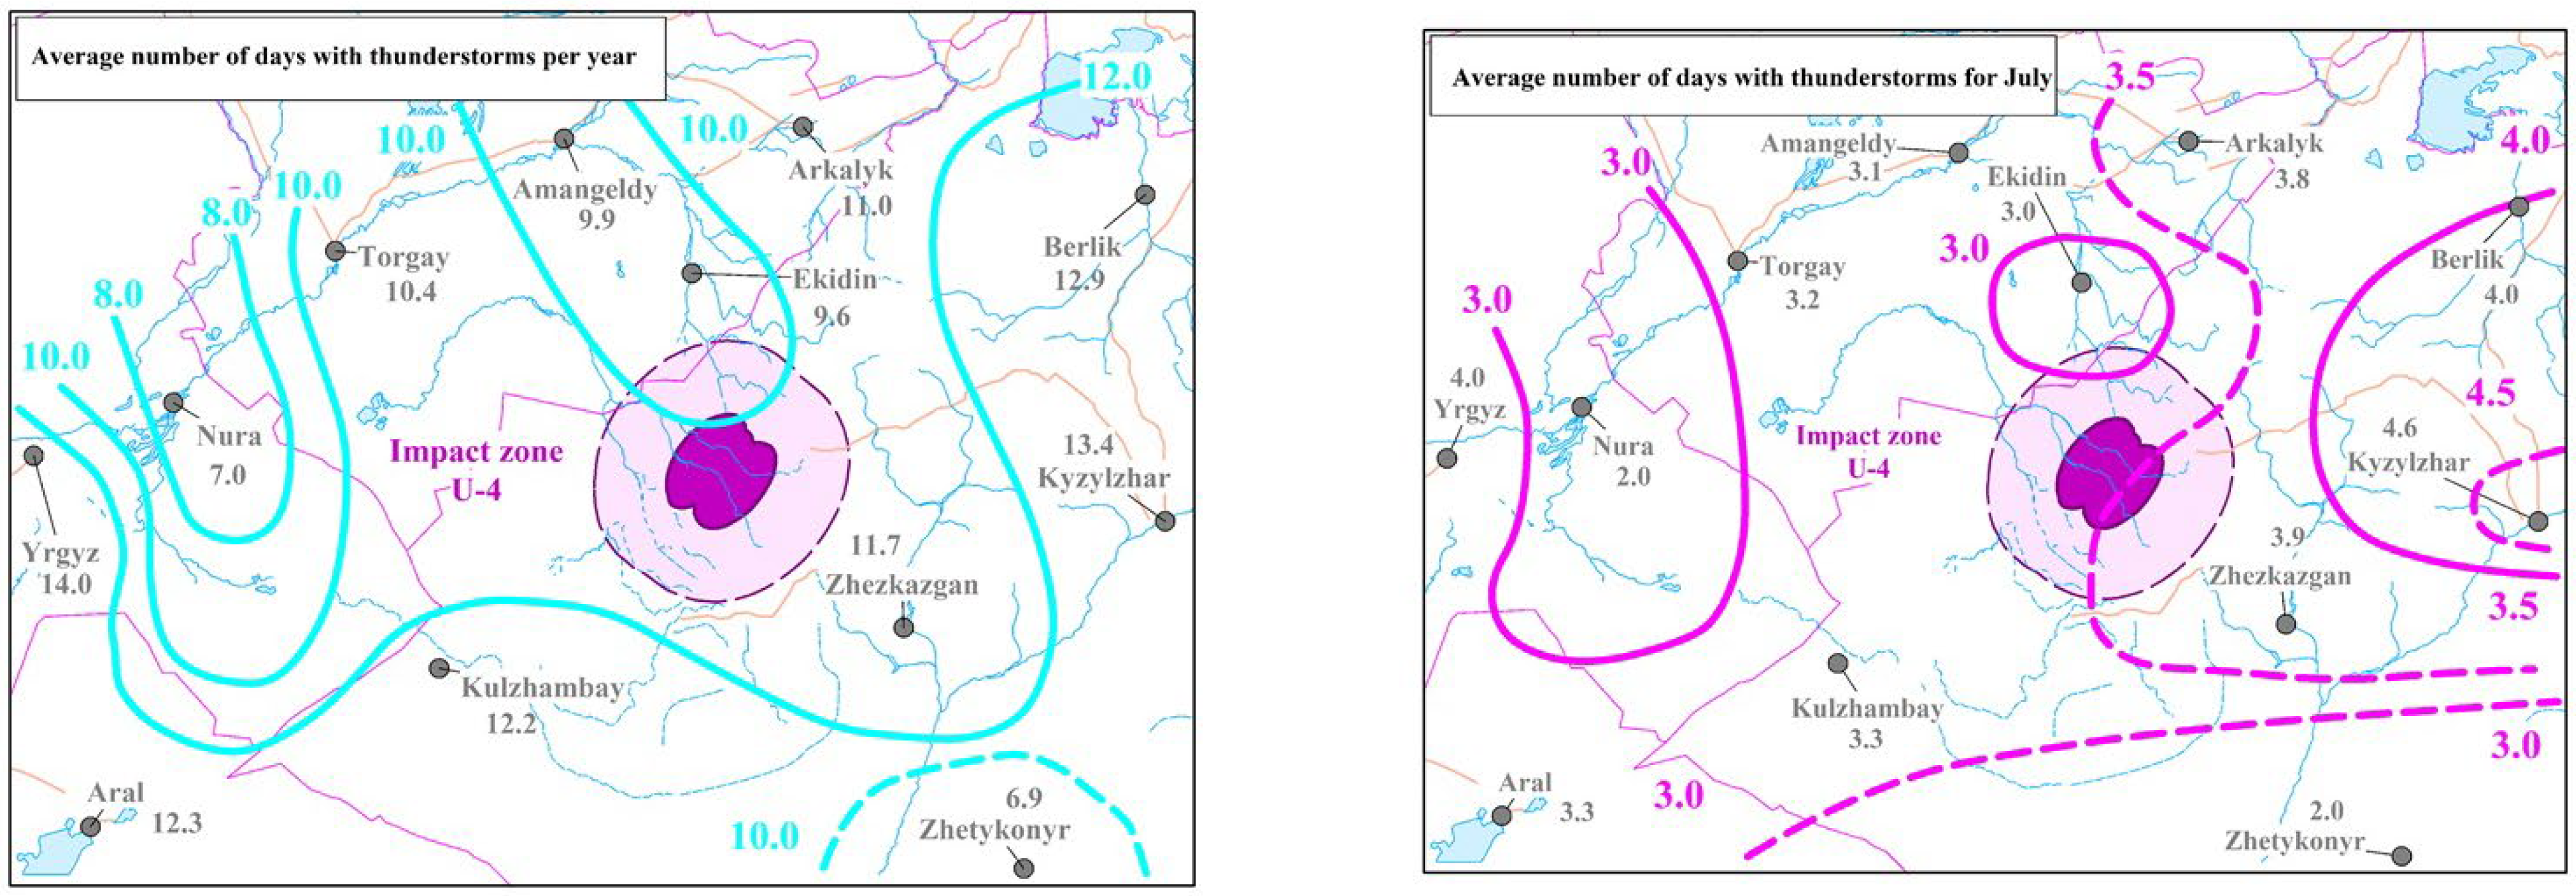
Figure 10 shows thunderstorm activity as an indicator of episodic meteorological events that can intensify the redistribution of pollutants (downpours, squalls). The average number of days with thunderstorms per year varies along isolines of 8.0–12.0 days/year (labeled 8.0, 10.0, 12.0), with the U-4 impact zone located near the level of about 10.0 days/year (approximately 10–12). For July, the values are 3.0–4.5 days (labeled 3.0, 3.5, 4.0, 4.5), and the U-4 zone passes in the region of ≈3.5 days. These maps are included to show the periods and conditions when there is a high probability of short-term but intense washout and transport processes, which is important when choosing the seasonality of monitoring and interpreting interannual variability in indicators.
Figure 10.
Average long-term number of days with thunderstorms.
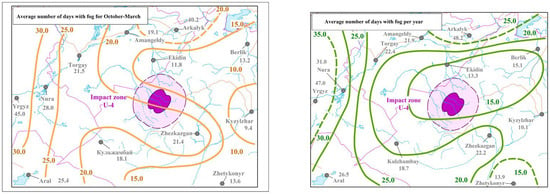
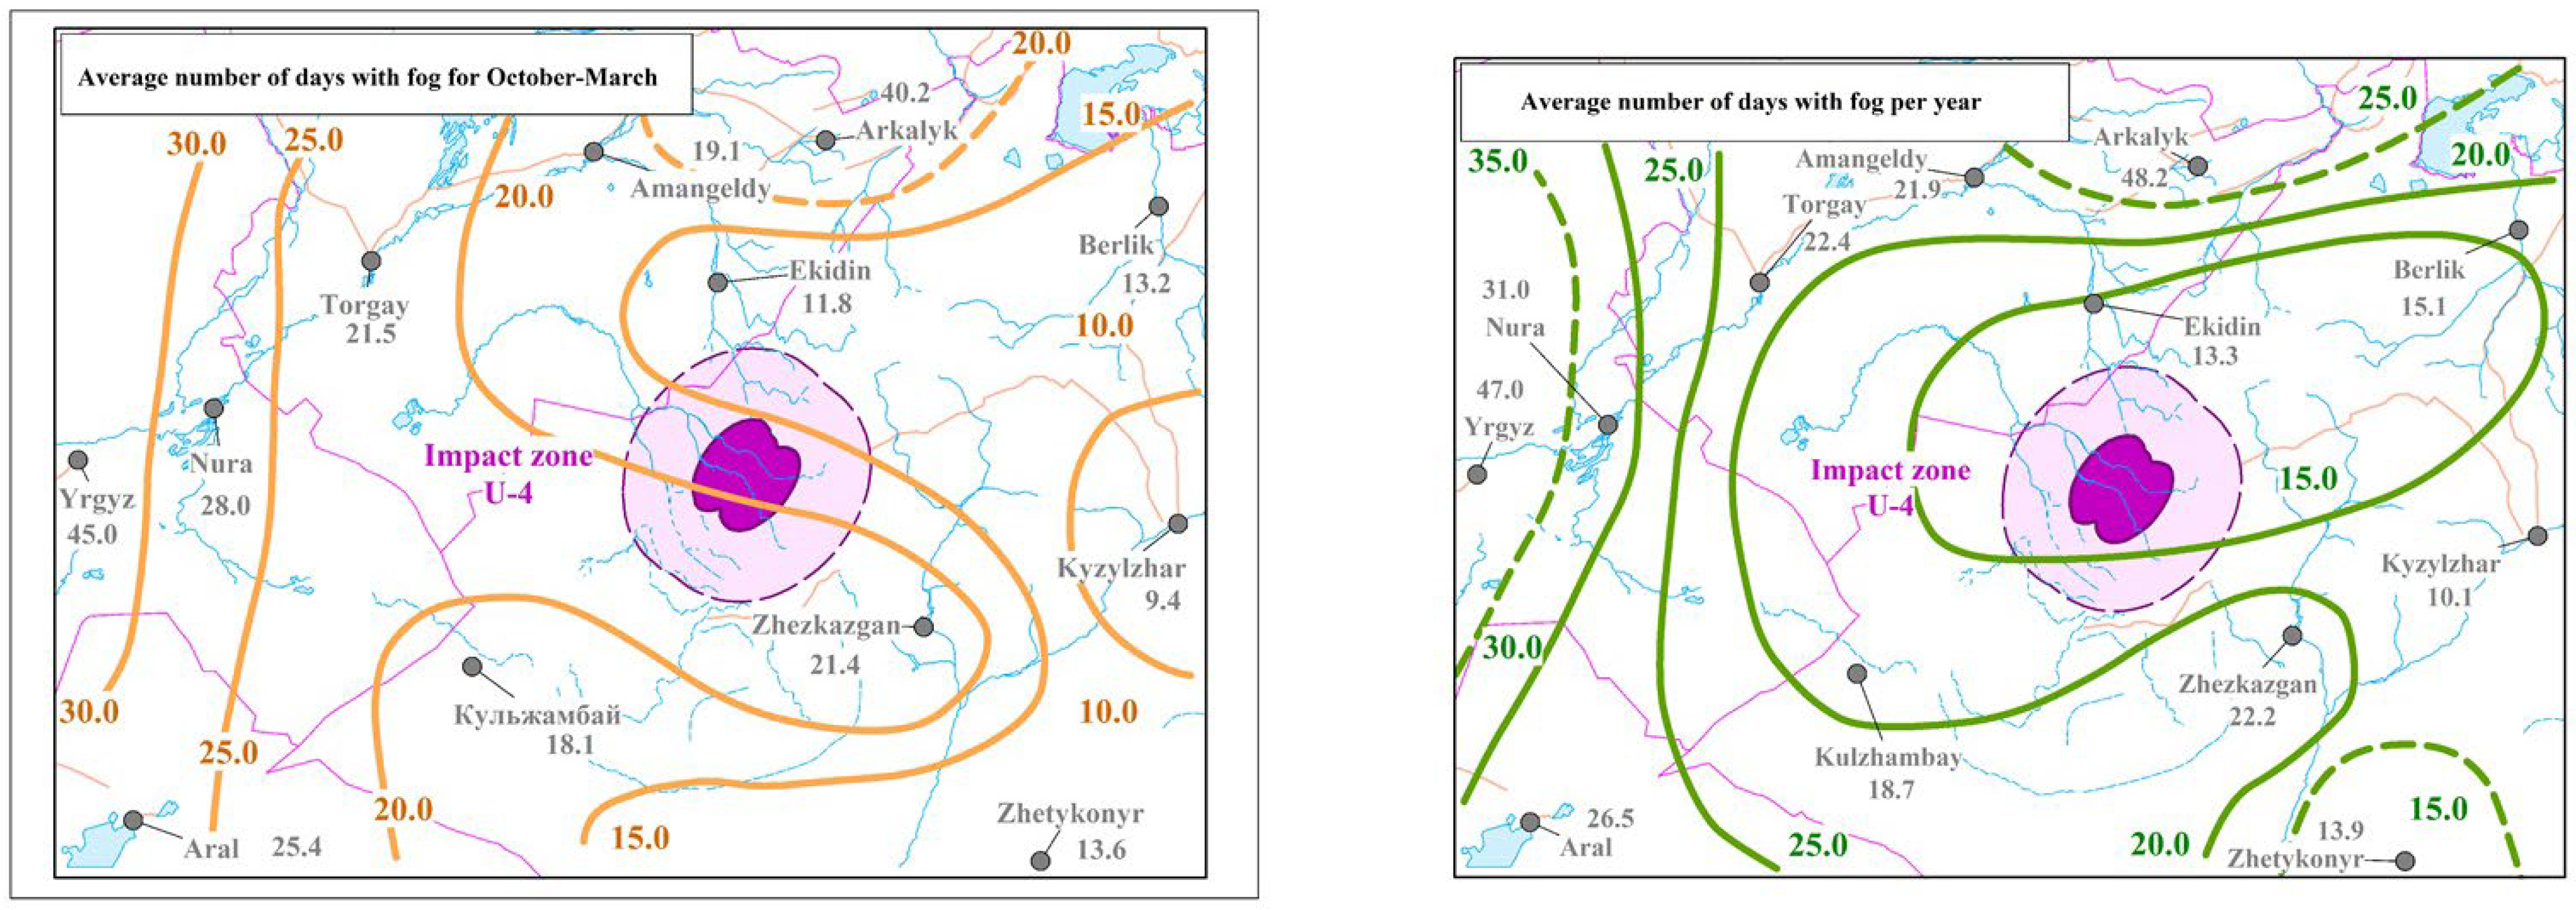
Figure 11 shows the recurrence of fog as a factor affecting the accumulation of impurities in the surface layer and monitoring conditions. For the period October–March, the isolines are 10.0–30.0 days (labeled 10.0, 15.0, 20.0, 25.0, 30.0), with the U-4 impact zone located approximately in the range of 15.0–20.0 days. On the annual map, the average number of days with fog ranges from 15.0 to 35.0 days/year (labeled 15.0, 20.0, 25.0, 30.0, 35.0), and the U-4 zone is also located at approximately ≈15–20 days/year. These data are included to justify seasonal restrictions on field work and to explain possible periods of stable atmospheric stratification, when pollutants are less likely to disperse and may remain near the surface for longer.
Figure 11.
Average long-term number of days with fog.
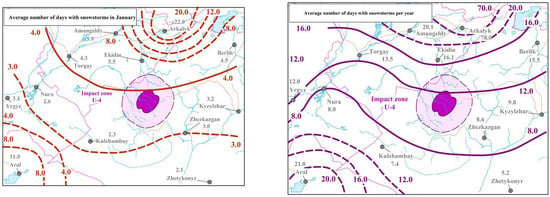
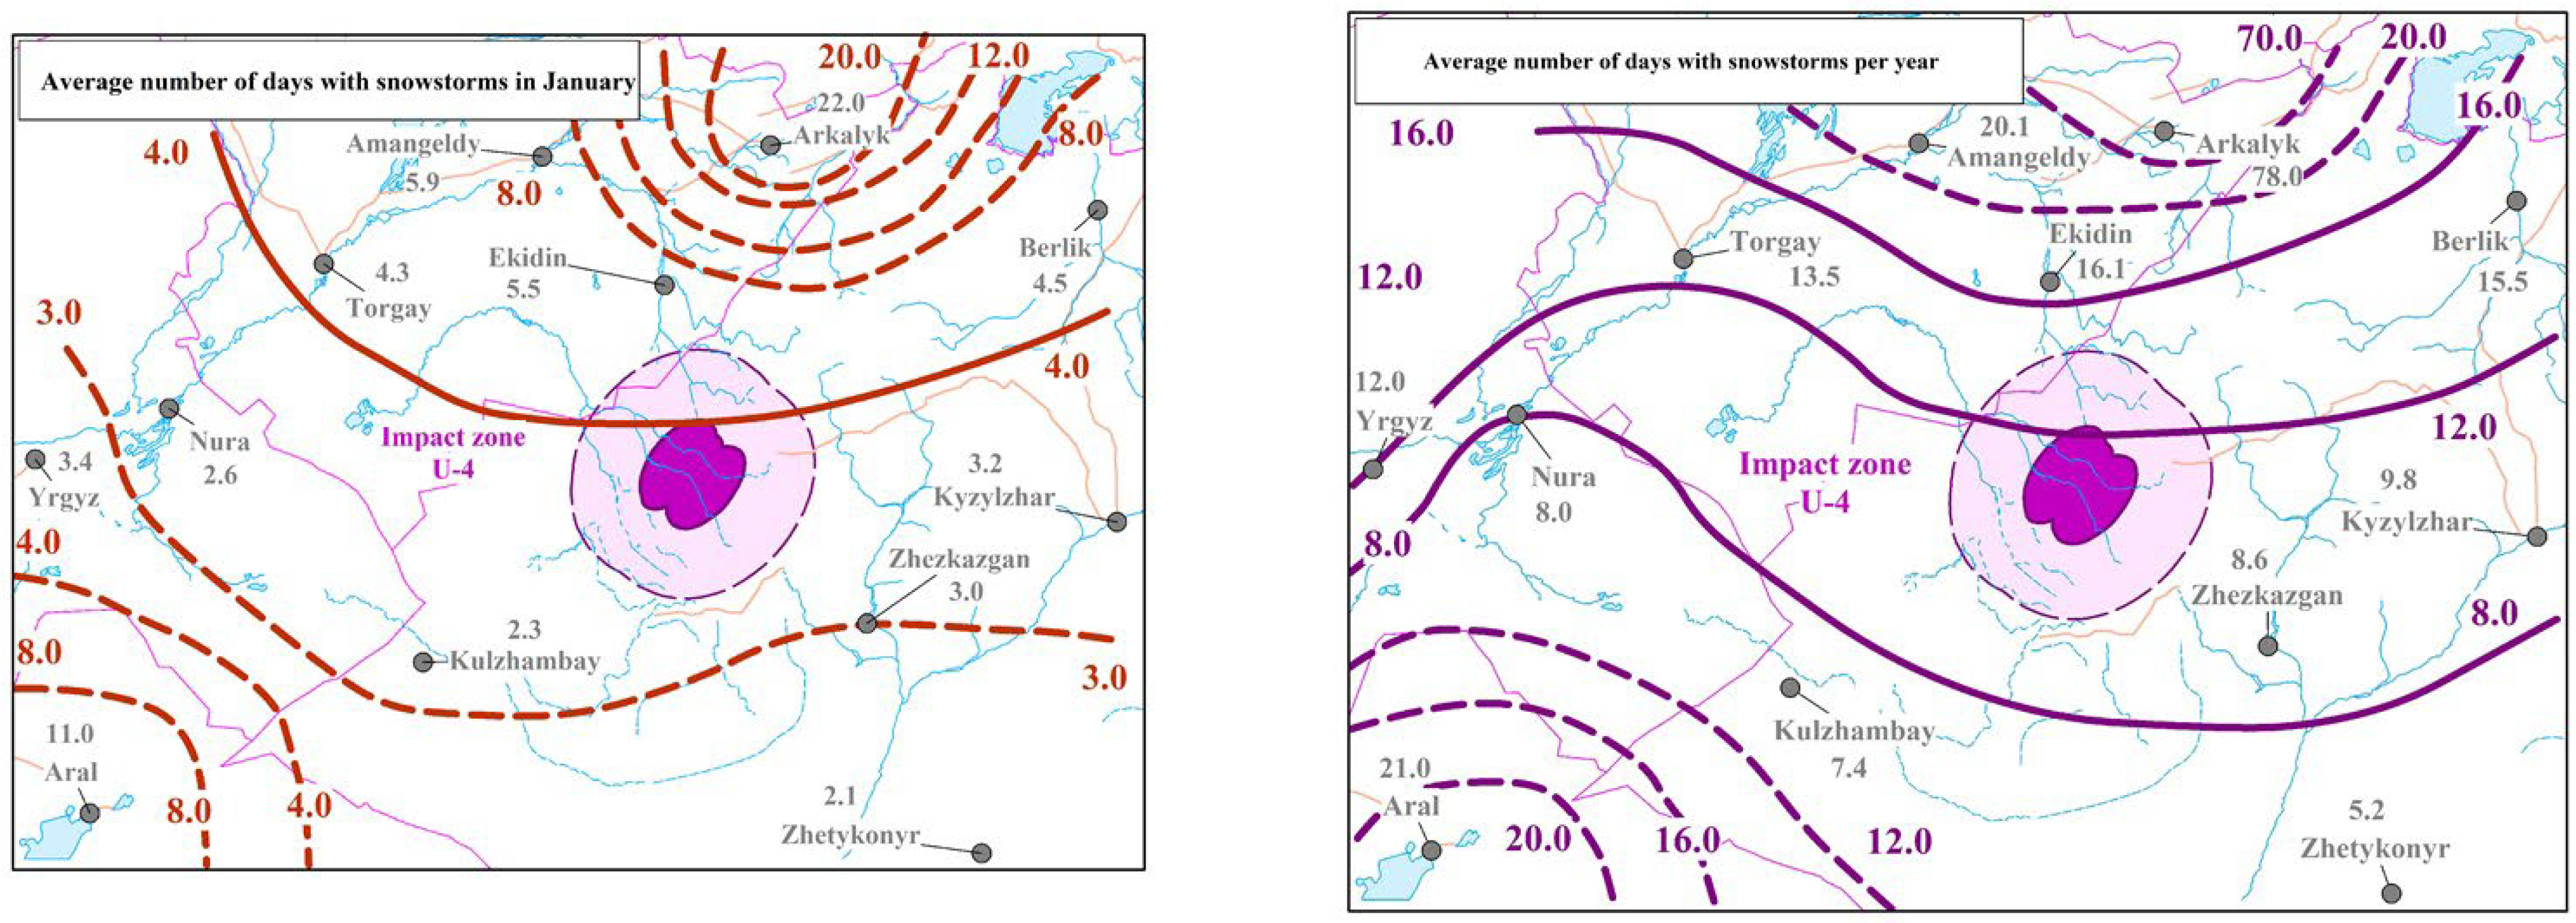
Figure 12 shows the frequency of snowstorms (blizzards) as an indicator of extreme winter conditions affecting particle transport, snow cover redistribution, and the accessibility of the territory for monitoring. For January, the isolines are 3.0–20.0 days (labeled 3.0, 4.0, 8.0, 12.0, 20.0 on the map), with the U-4 impact zone located near values of ≈3.0–4.0 days in January. On the annual map, levels of approximately 12.0–16.0 days/year (labeled 8.0, 12.0, 16.0, 20.0) are found around U-4, i.e., the impact zone is characterized by a recurrence of approximately ≈12–16 days/year. These maps are included to show that winter conditions can limit the regularity of trips and affect the interpretation of data (including through the transfer and redistribution of polluted particles with snow), so the seasonality of monitoring and comparison of results by year should take into account the winter regime.
Figure 12.
Average long-term number of days with blizzards.
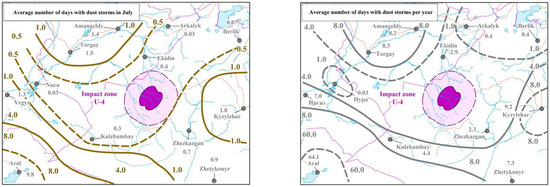
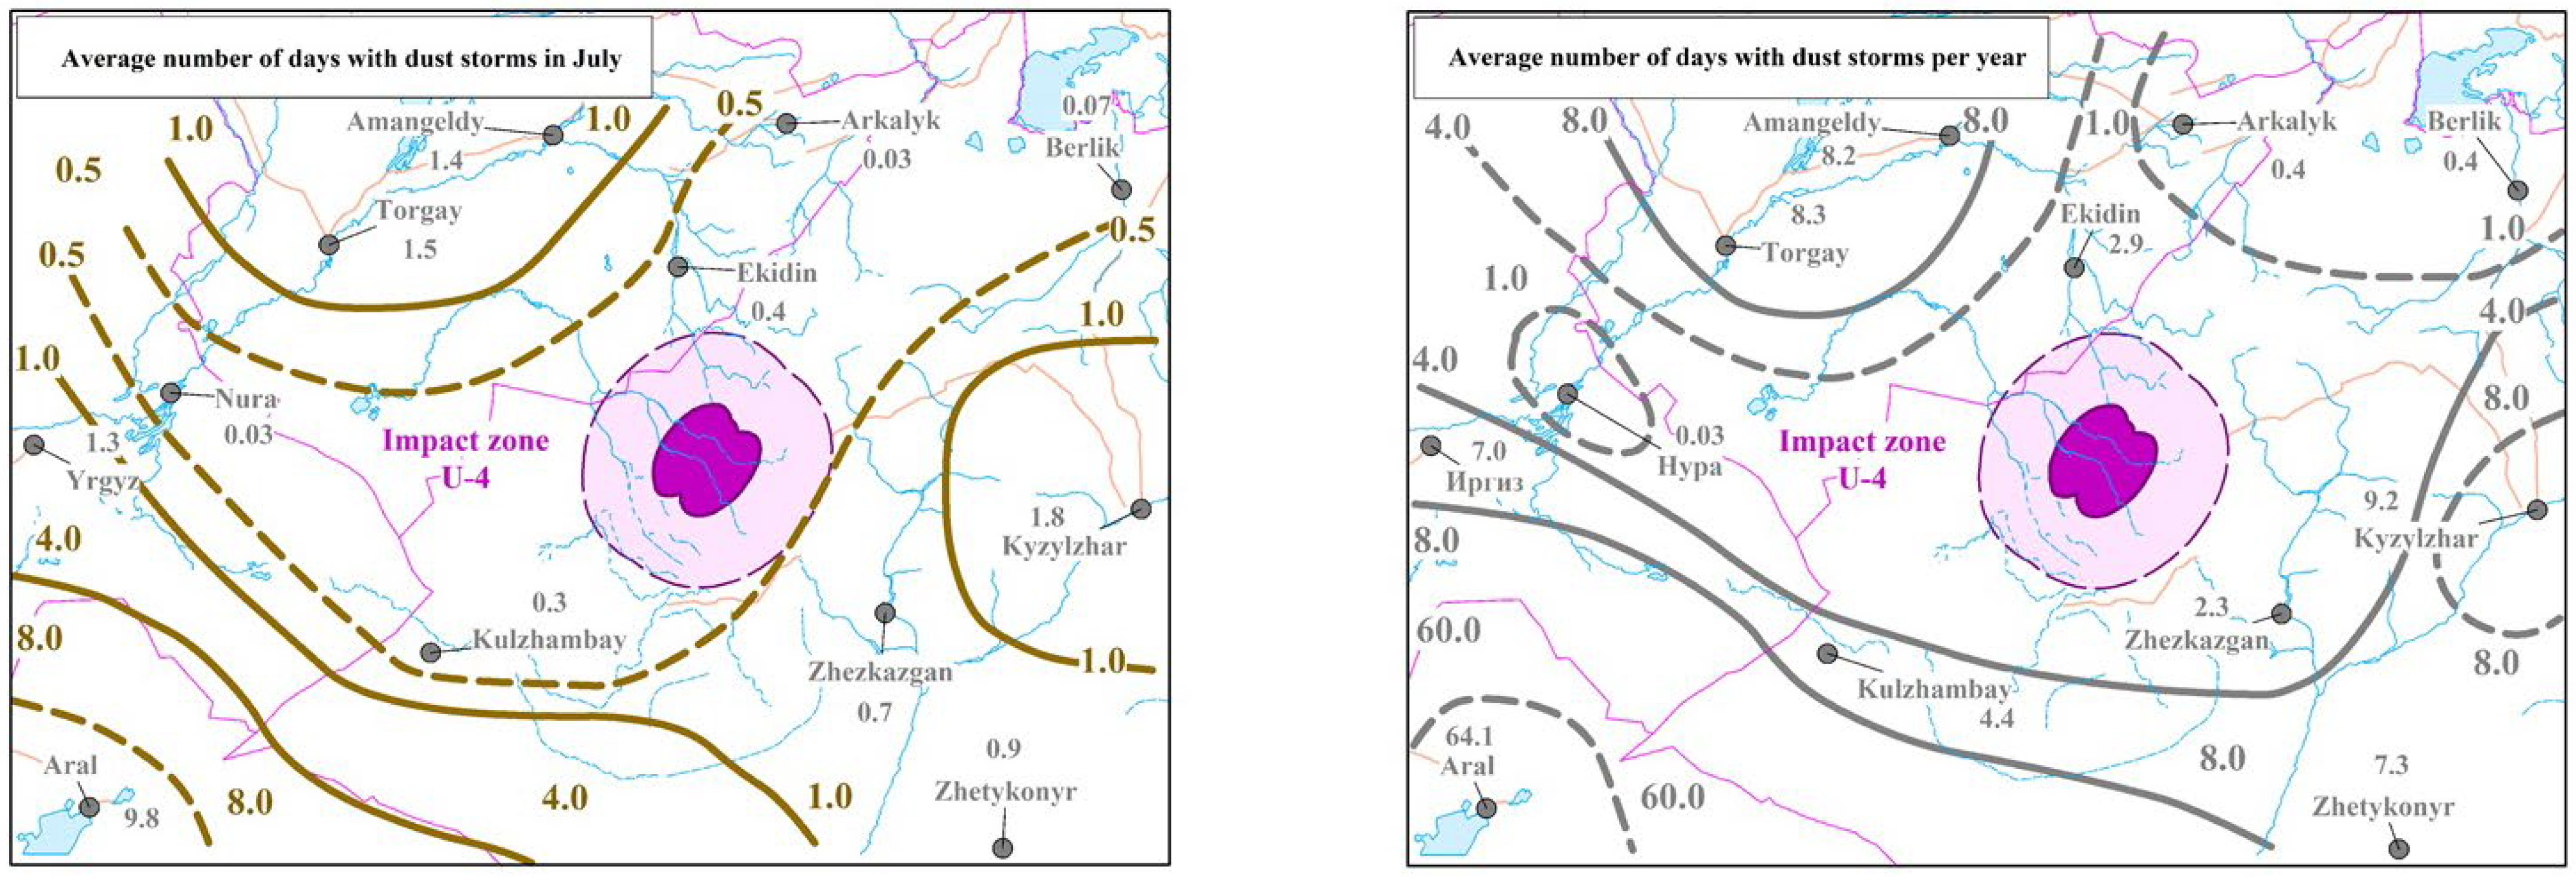
Figure 13 shows the recurrence of dust storms as an indicator of wind erosion and potential secondary transport of contaminated particles during the warm season. For July, the isolines are 0.5–8.0 days (labeled 0.5, 1.0, 4.0, 8.0), with the U-4 impact zone located near the minimum values of ≈0.5–1.0 days in July. The annual map shows levels of 1.0–8.0 days/year (with maxima in drier areas), and the U-4 zone is approximately in the range of ≈2–4 days/year (near the 4.0 isolines). These data are included to justify the need to monitor dust and aerosol components at the periphery of the impact zone and to take into account that even with local soil contamination, dust events can transport particles over distances, affecting the boundaries of monitoring zones and the interpretation of spatial risk distribution.
Figure 13.
Average long-term number of days with dust storms.
Fire hazard in Zone U-4 occurs from the second half of the first decade of April until the last decade of November. Assessment of fire hazard based on the Nesterov Forest Flammability Index (G) indicates the highest risk of fire occurrence in Zone U-4 during July. According to the comprehensive indicator K, calculated for Zone U-4 using average monthly climatic data, a Class III fire hazard is reached after 4 consecutive days without precipitation in July, while a Class IV hazard is reached after 13 days. Based on daily data, a high fire hazard level can be achieved within 6 to 7 days in Zone U-4.
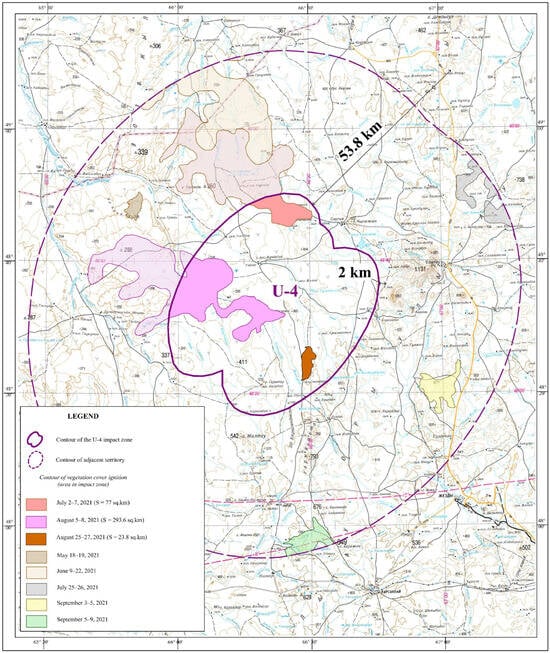
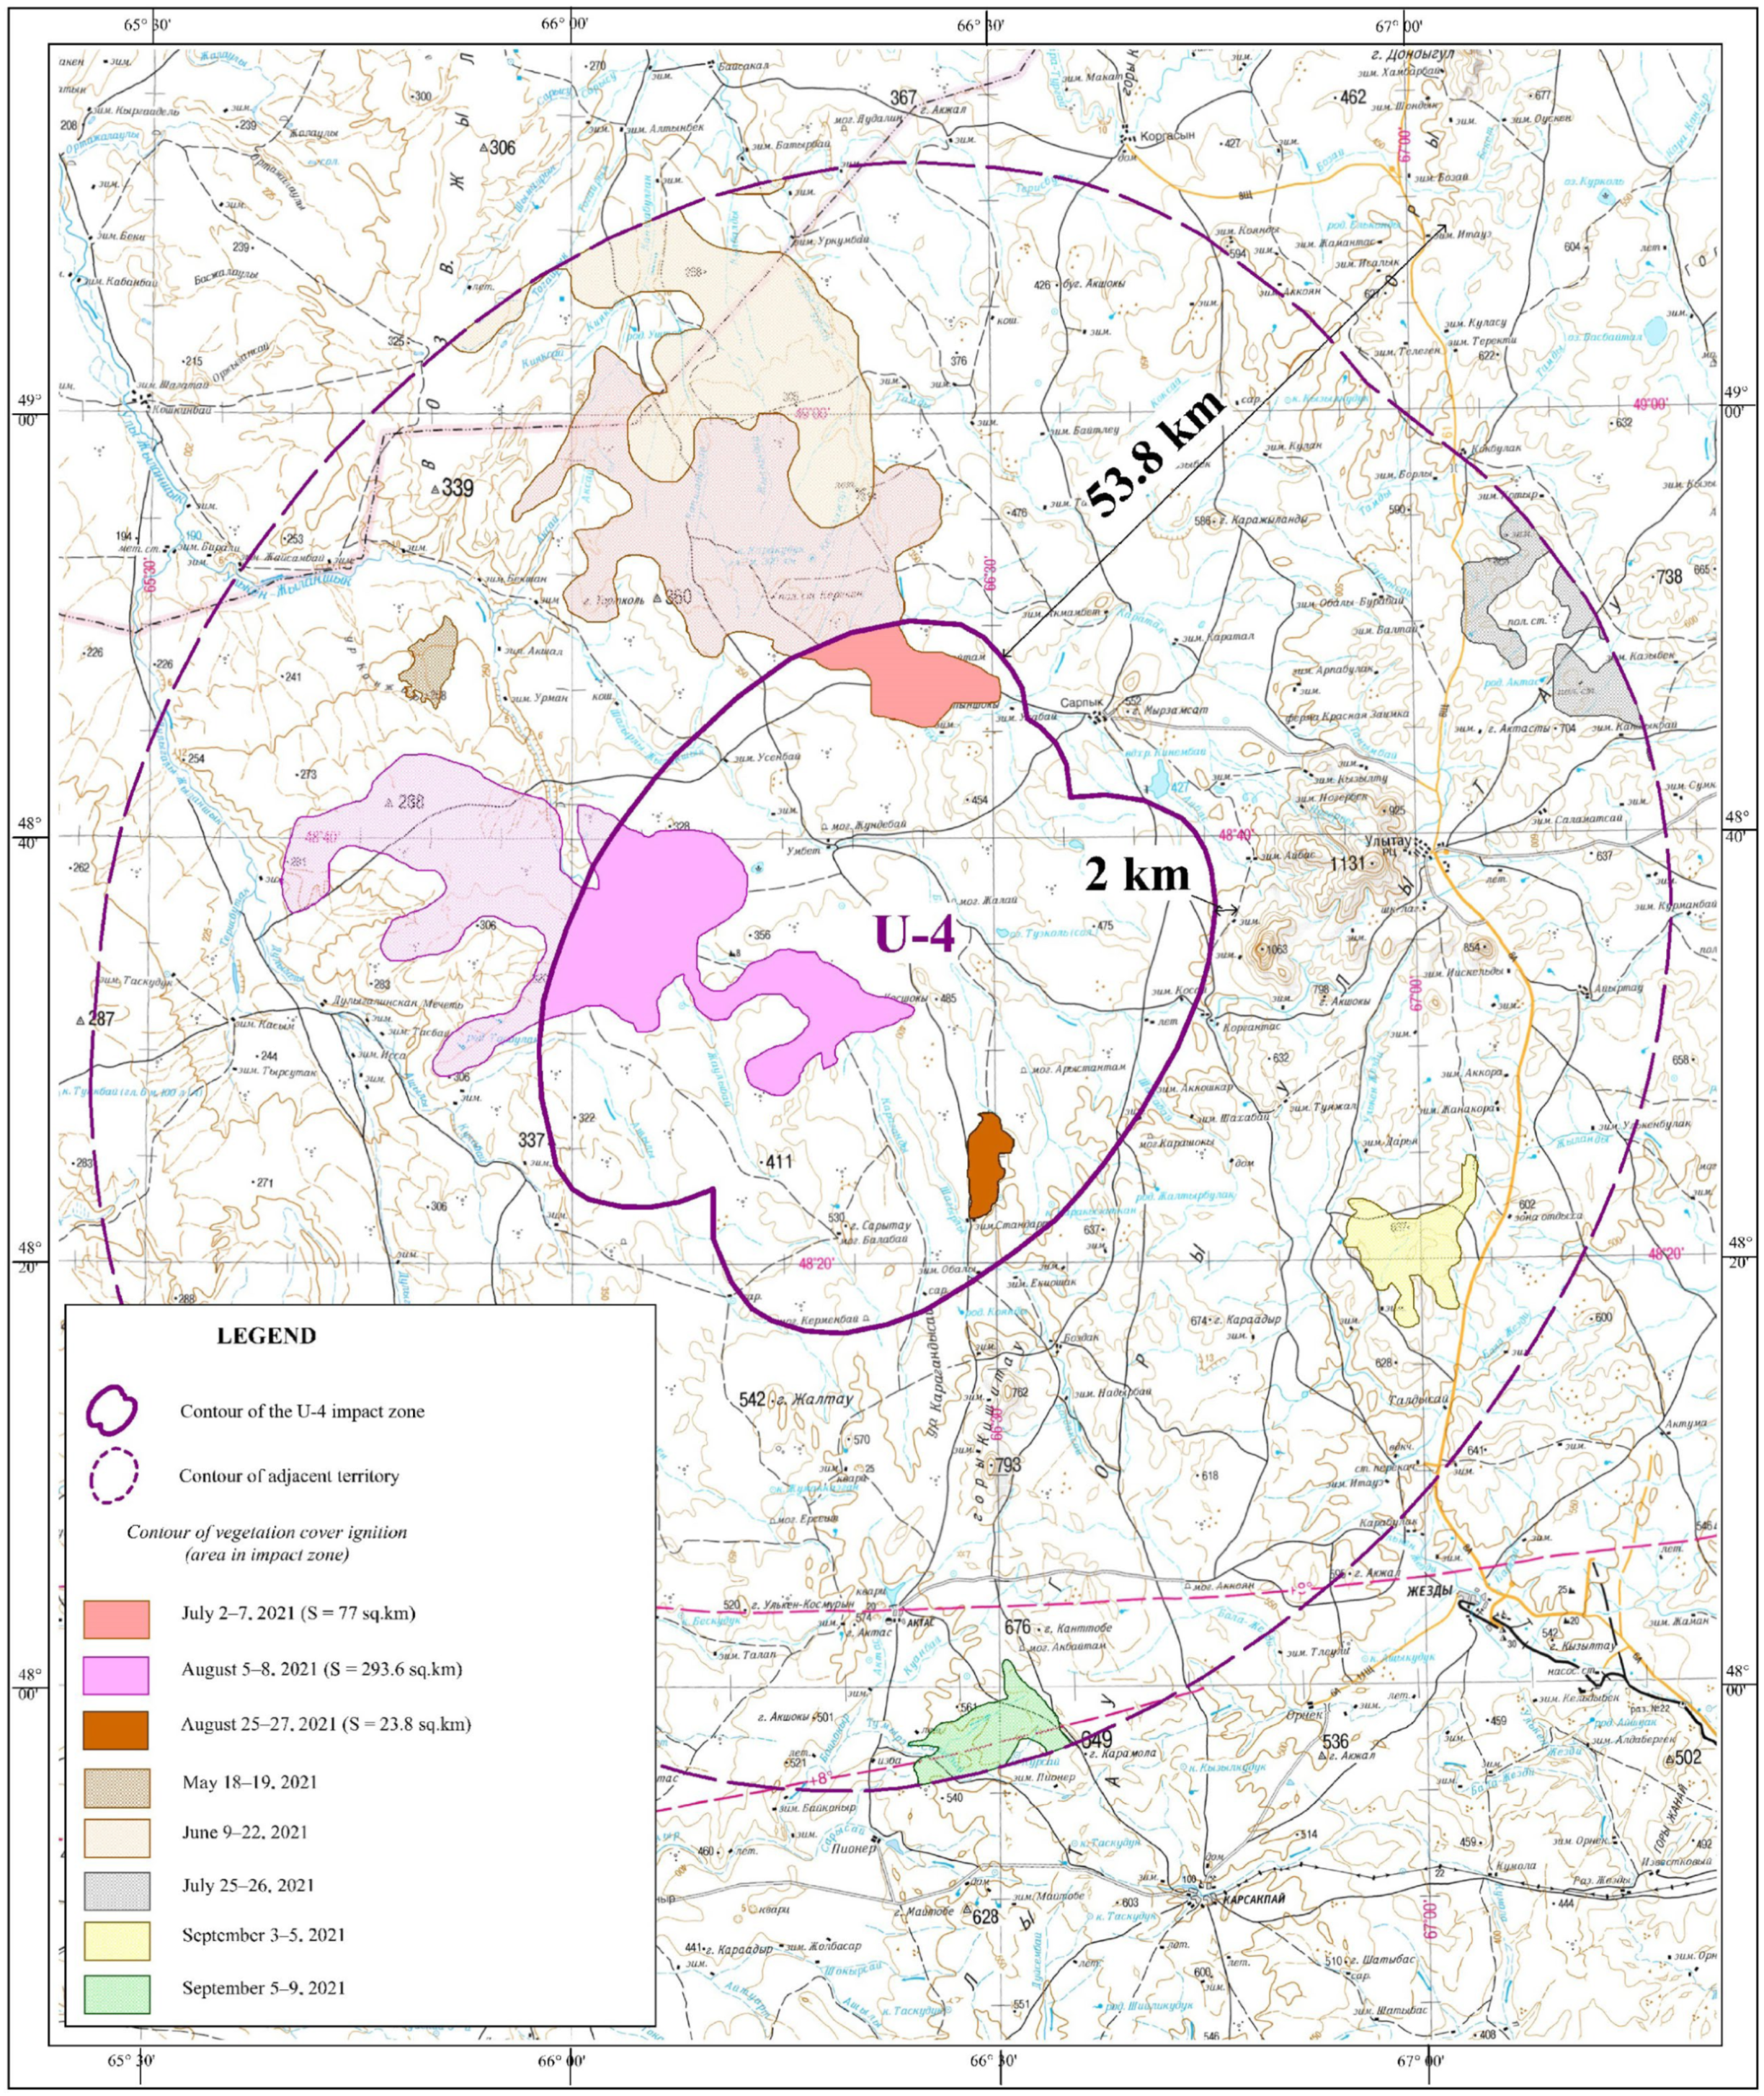
http://mchs.gharysh.kz (accessed on 7 July 2021) imagery data provided by the geoservice http://mchs.gharysh.kz (accessed on 8 August 2021) of JSC NC “Gharysh-Sapary” indicate that in 2021, four large-scale steppe fires occurred in Zone U-4 and the adjacent territories, burning a total area of 394.5 km2 (12% of the zone’s territory). The largest fires, which occurred during the summer periods of 2–7 July and 5–8 August 2021, mainly affected the western and northern parts of Zone U-4 (Figure 14).
Figure 14.
Map of fires in the U-4 impact zone in 2021.
The northwestern and northeastern parts of the study area are occupied by relatively elevated denudational stratified plains composed of sedimentary rock formations. The relief is characterized by gently rolling low hills, structural plains, and alluvial plains (Figure 14).
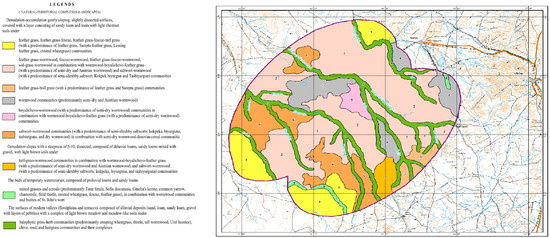
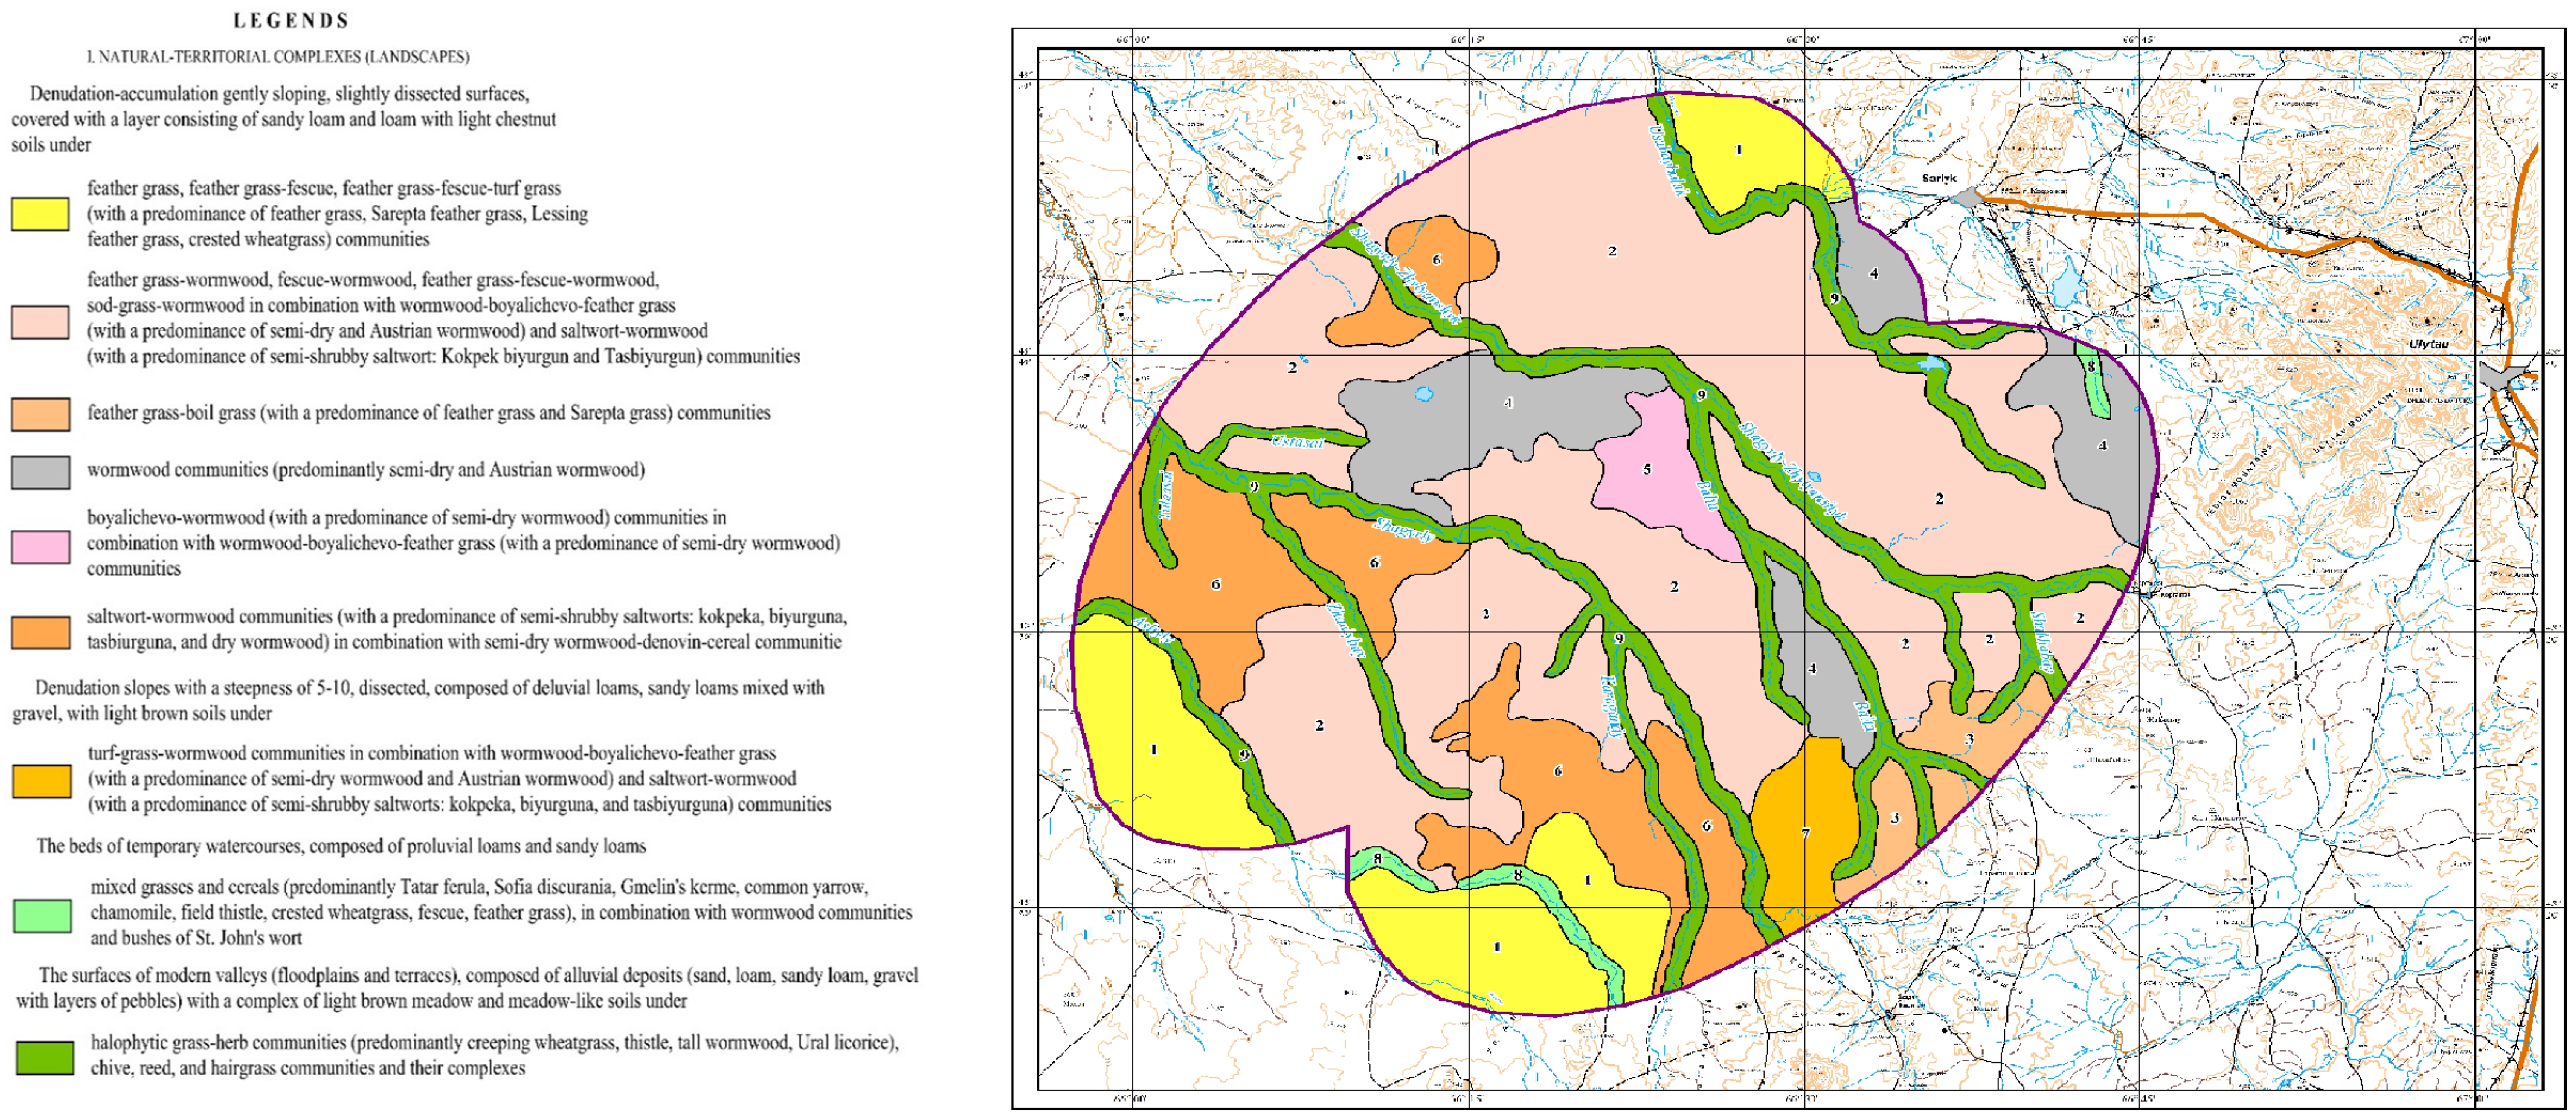
Zone U-4 is situated within Kazakhstan’s desert-steppe (semi-desert) zone and is predominantly covered by light chestnut soils (Calcisols) and associated types. These soils represent a transitional group between steppe (Mollisols) and desert soils, developing under conditions of variable and generally insufficient precipitation. This results in reduced biomass, lower humus content, shallower moisture infiltration, and limited leaching compared to typical chernozems. In the northern sector, poorly and incompletely developed Calcisols predominate on gently rolling hills, while the highest elevations host brown soils (Cambisols). The interfluve of the Shagyrly and Zhylanshyk rivers features a mix of solonetzic Calcisols and Solonetz soils (Solonetz). Floodplains support meadow soils (Fluvisols). The western and southwestern plains are dominated by solonetzic and solonchak soils (Solonchaks). Due to their heavy texture (clay and loam), low permeability, and low organic matter, these soils possess a high sorption capacity for liquid rocket fuels such as heptyl and T-1 kerosene. The elevated cation exchange capacity in solonetz horizons, influenced by exchangeable sodium and fine particles, enhances the soil’s capacity to interact with these contaminants (Figure 14 and Figure 15).
Figure 15.
Soil map of the U-4 impact zones.
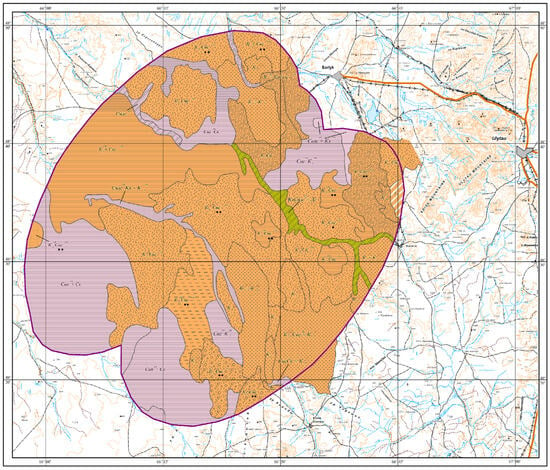
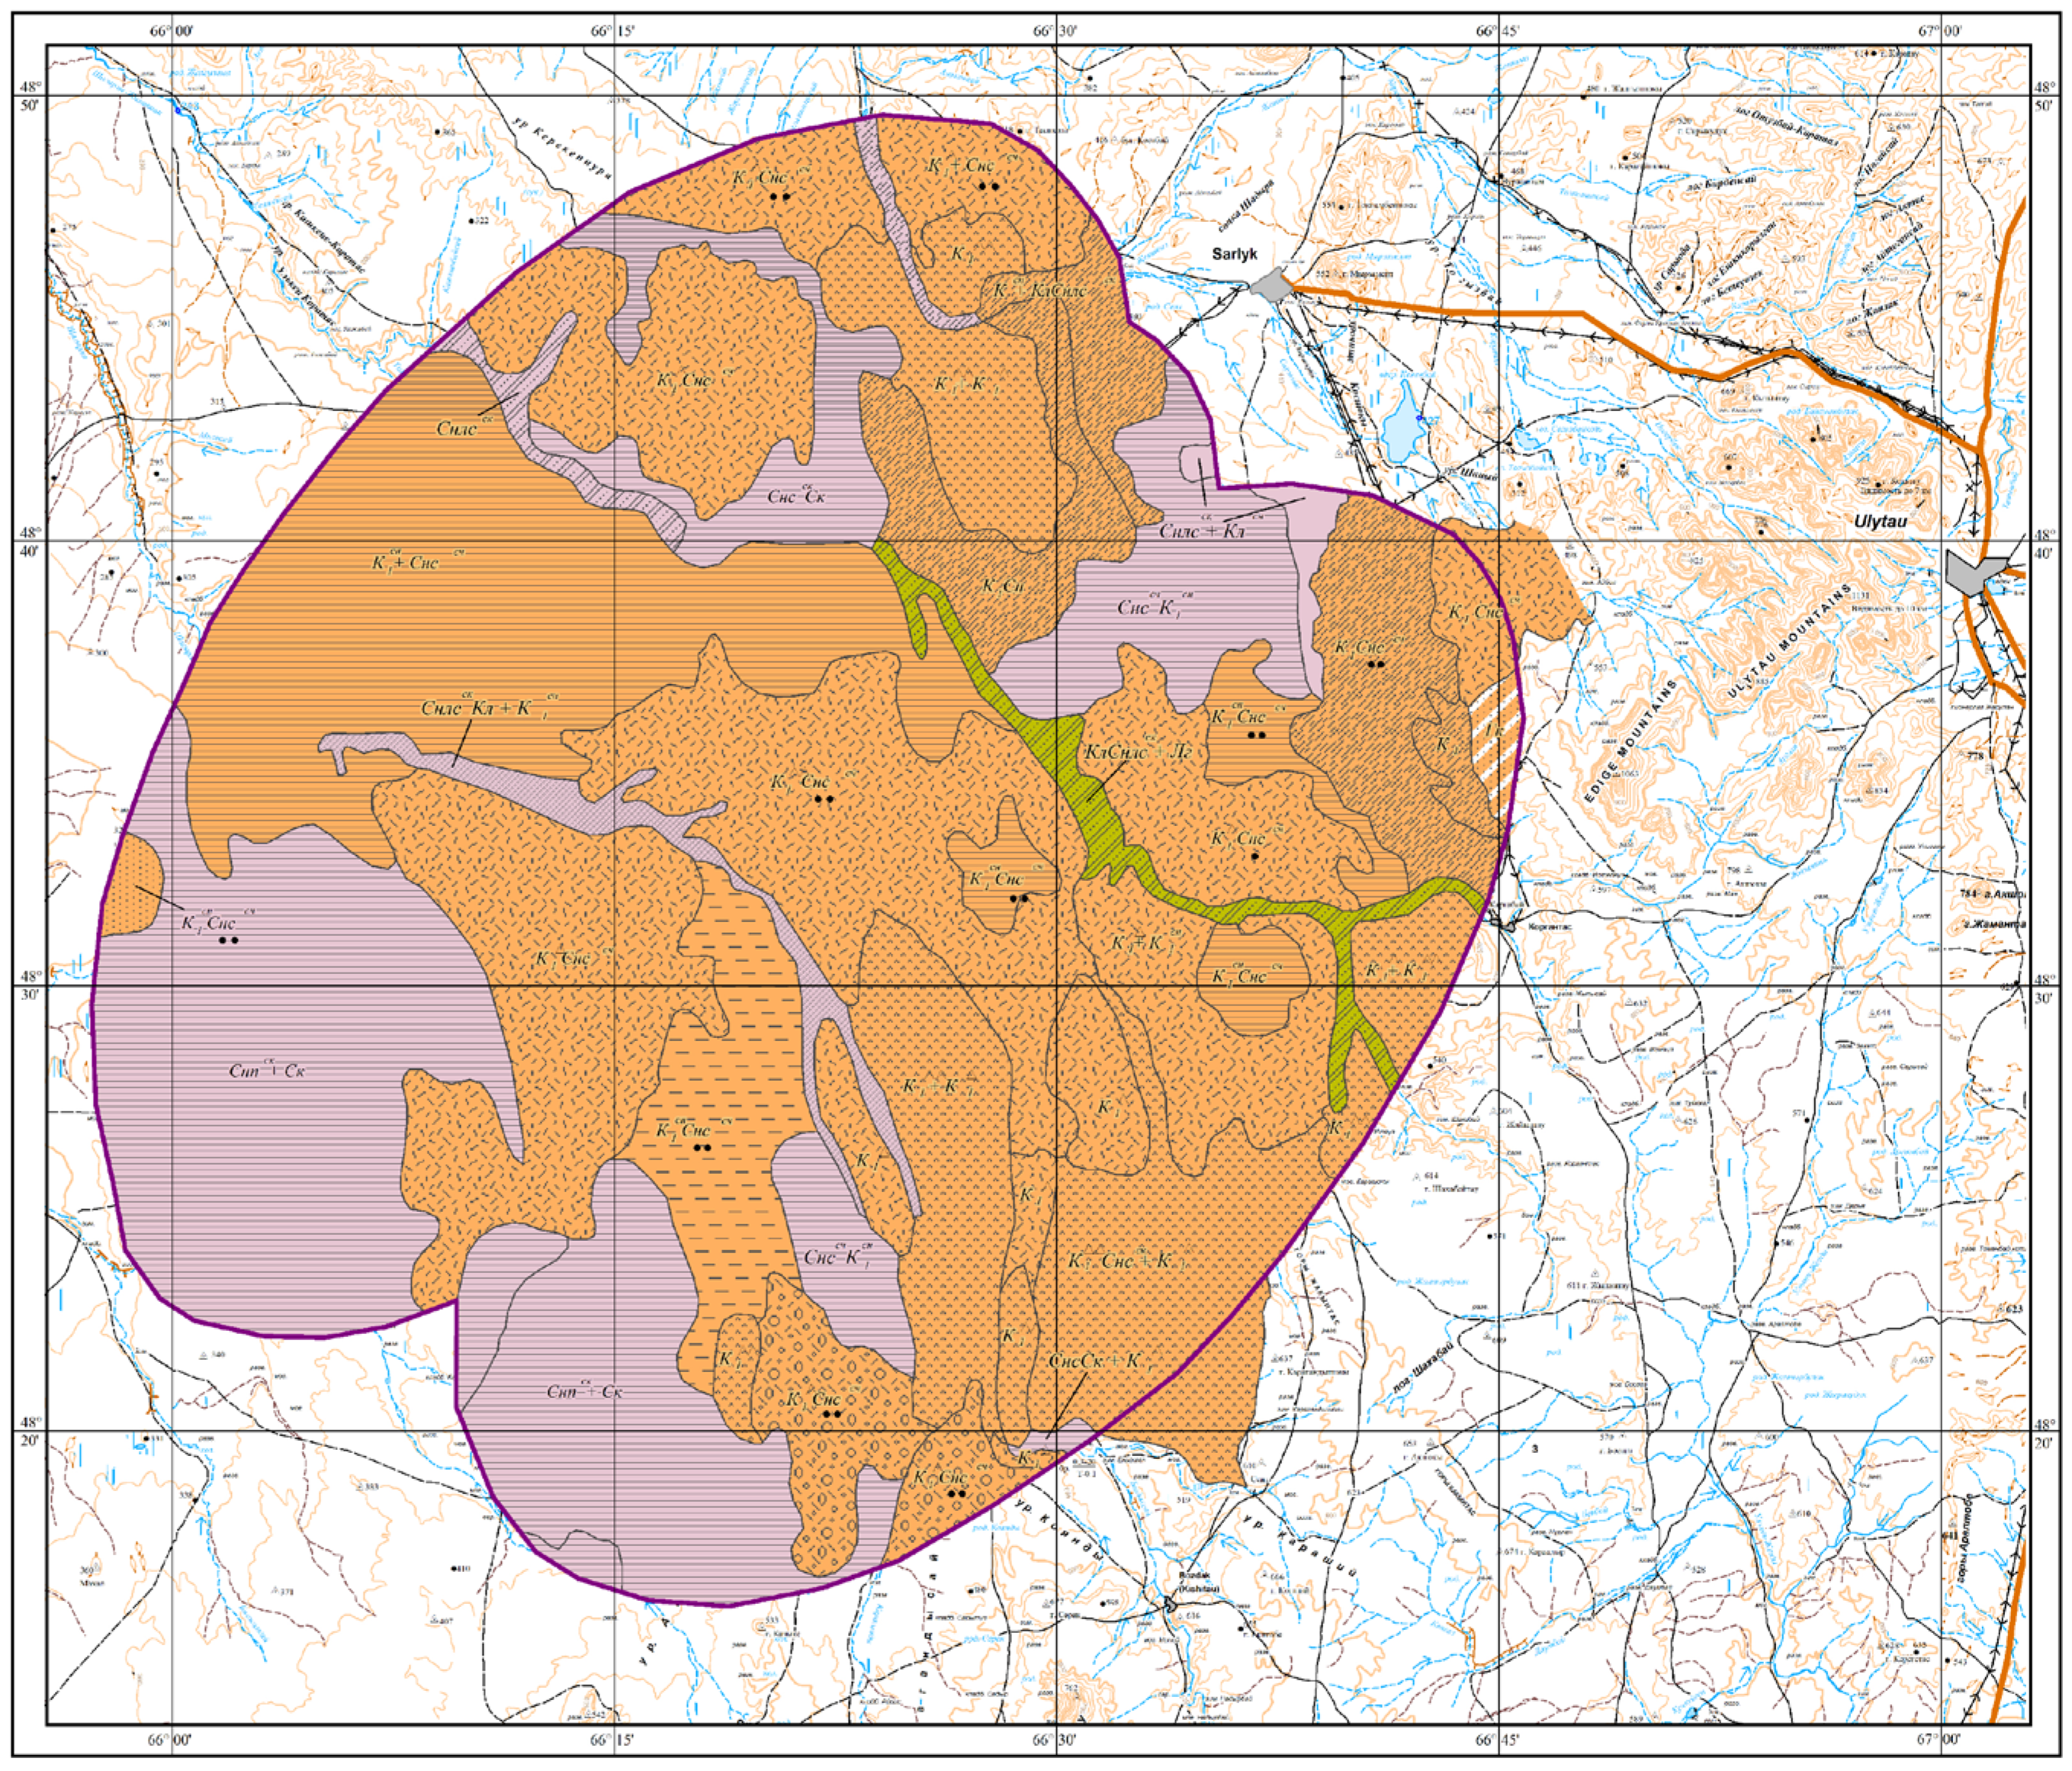
Figure 16 shows that the impact zone crosses soil complexes with varying proportions of saline soils: there are areas with 10–25% and 25–50% saline soils in the complexes (see explanation in Figure 16). In addition, Figure 15 shows differences in the mechanical structure and depth of the underlying horizons, which are important for sampling: intervals of 0–40 cm, 0–60 cm, 40–80 cm, and horizons deeper than 80 cm (also according to the symbols in Figure 16). These numerical gradations explain why monitoring and interpretation of results need to be differentiated within a single zone contour: areas with 25–50% saline soils and/or a thin active layer of 0–40 cm potentially require a different density of observations and approaches to reclamation than areas with 10–25% saline soils and thick layers >80 cm.
Figure 16.
Landscape map of the U-4 impact zone.
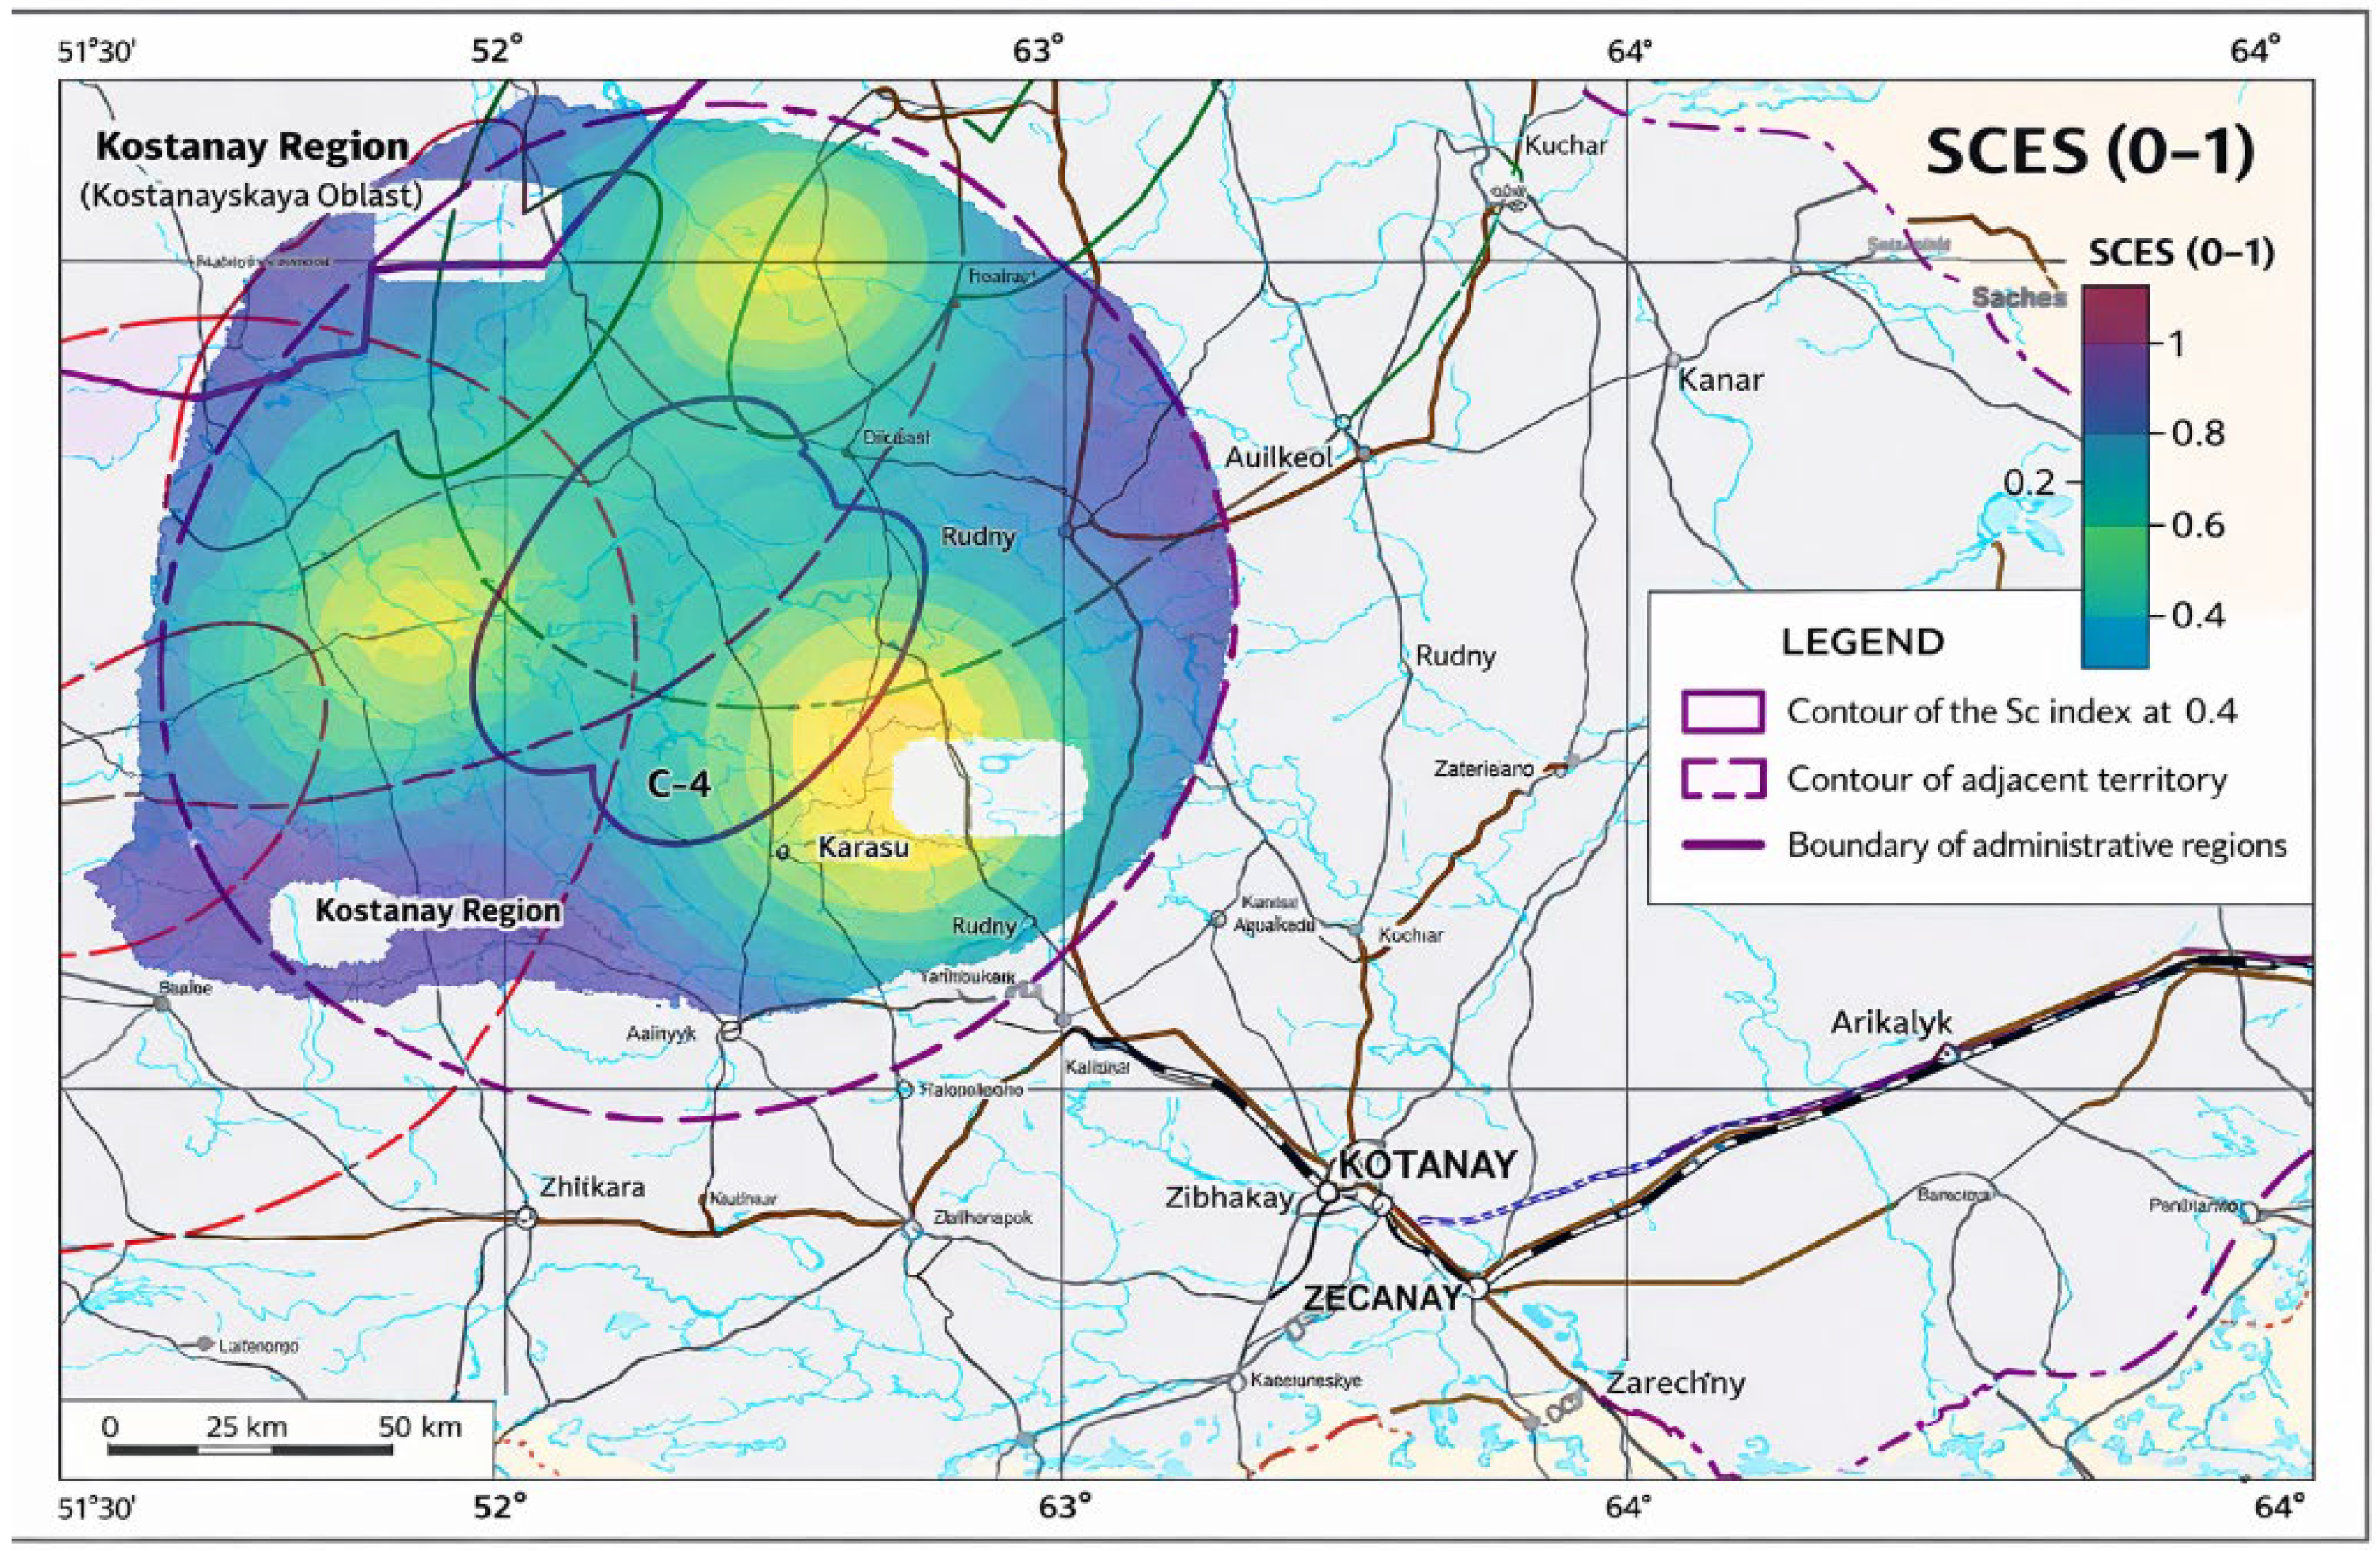
Figure 17 shows the SCES map for the study area: the higher the SCES value, the higher the environmental stress/risk. The map highlights hot spots (class V) in the northeast and south, while low risk (class I) predominates in the west; contour lines mark thresholds of 0.2, 0.4, 0.6, 0.8, and the legend contains both discrete classes and a continuous scale.
Figure 17.
Map of the Integrated Environmental Stress Indicator (SCES).
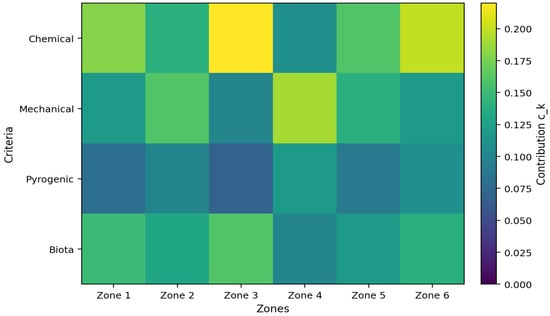
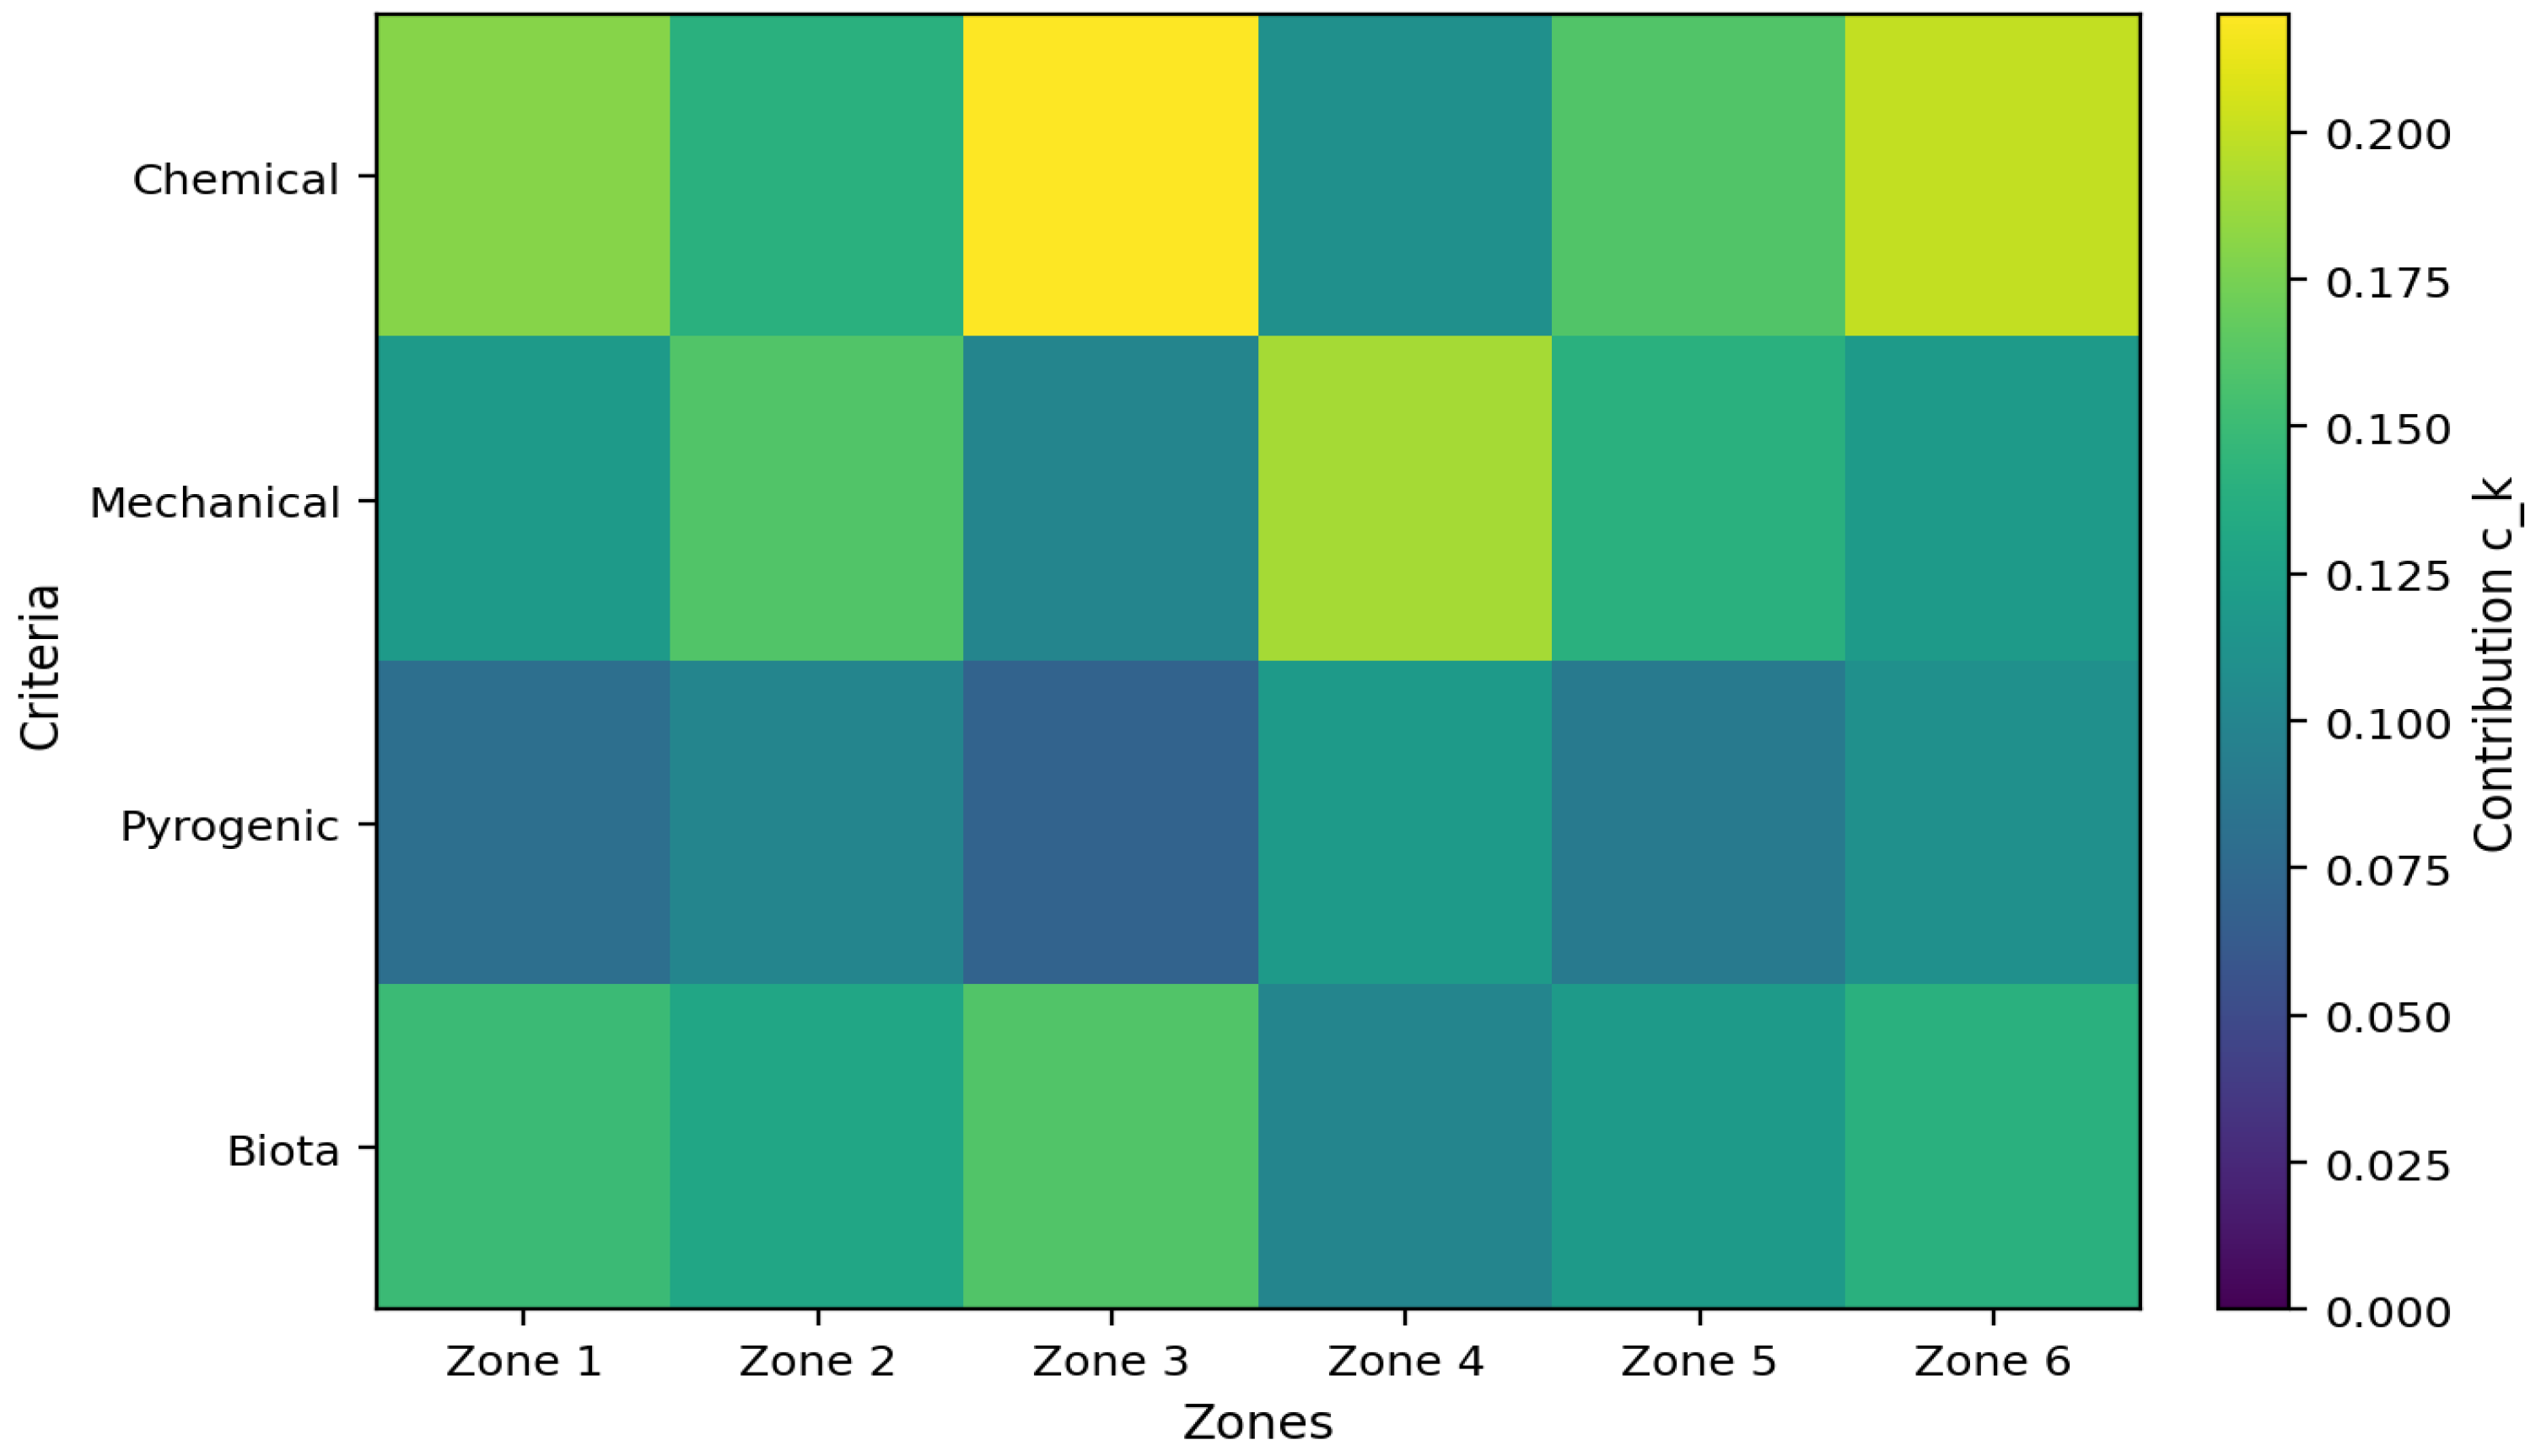
Table 4 provides an analysis of the final SCES indicator. By criteria: For each criterion, a weight and a standardized score are specified , after which the contribution is calculated . The local sensitivities of the model are also shown: and ; that is, it is clear which criterion has the greatest impact on the outcome when changing scores or weights. The uncertainty block also includes an estimate , which allows one to move from the errors of the original indicators to the error of the contribution of each criterion. The summary row provides the formula for the total uncertainty and the 95% confidence interval. , to justify the reliability of the risk map/classes not only by a single number, but also statistically.
Table 4.
Criteria contribution, sensitivity, and uncertainty (95% CI) for SCES.
In the GIS model, long-term averaged layers of temperature, precipitation, and wind were used; therefore, the resulting SCES map represents a climatological baseline of vulnerability, but it may differ from conditions in a particular year under pronounced interannual variability. The robustness of the classes can be supported statistically through the uncertainty estimate and the 95% confidence interval, SCES ± 1.96·σ(SCES); however, meteorological variability should additionally be tested via scenario analysis. Because south-westerly/southerly winds prevail in one sector of the study area and north-easterly winds in the others (3.5–4.5 m/s on average, locally 5.0–6.8 m/s), a shift in wind direction would rearrange downwind impact zones and potentially shift the boundaries of the higher risk classes, particularly for transport-driven hazards. This is also critical for the pyrogenic component. According to the Nesterov fire-danger index, in July, class III is reached after 4 rain-free days and class IV after 13; using daily data, a high-danger level can be reached within 6–7 days, so the risk map should be complemented with “dry” and “wet” precipitation scenarios.
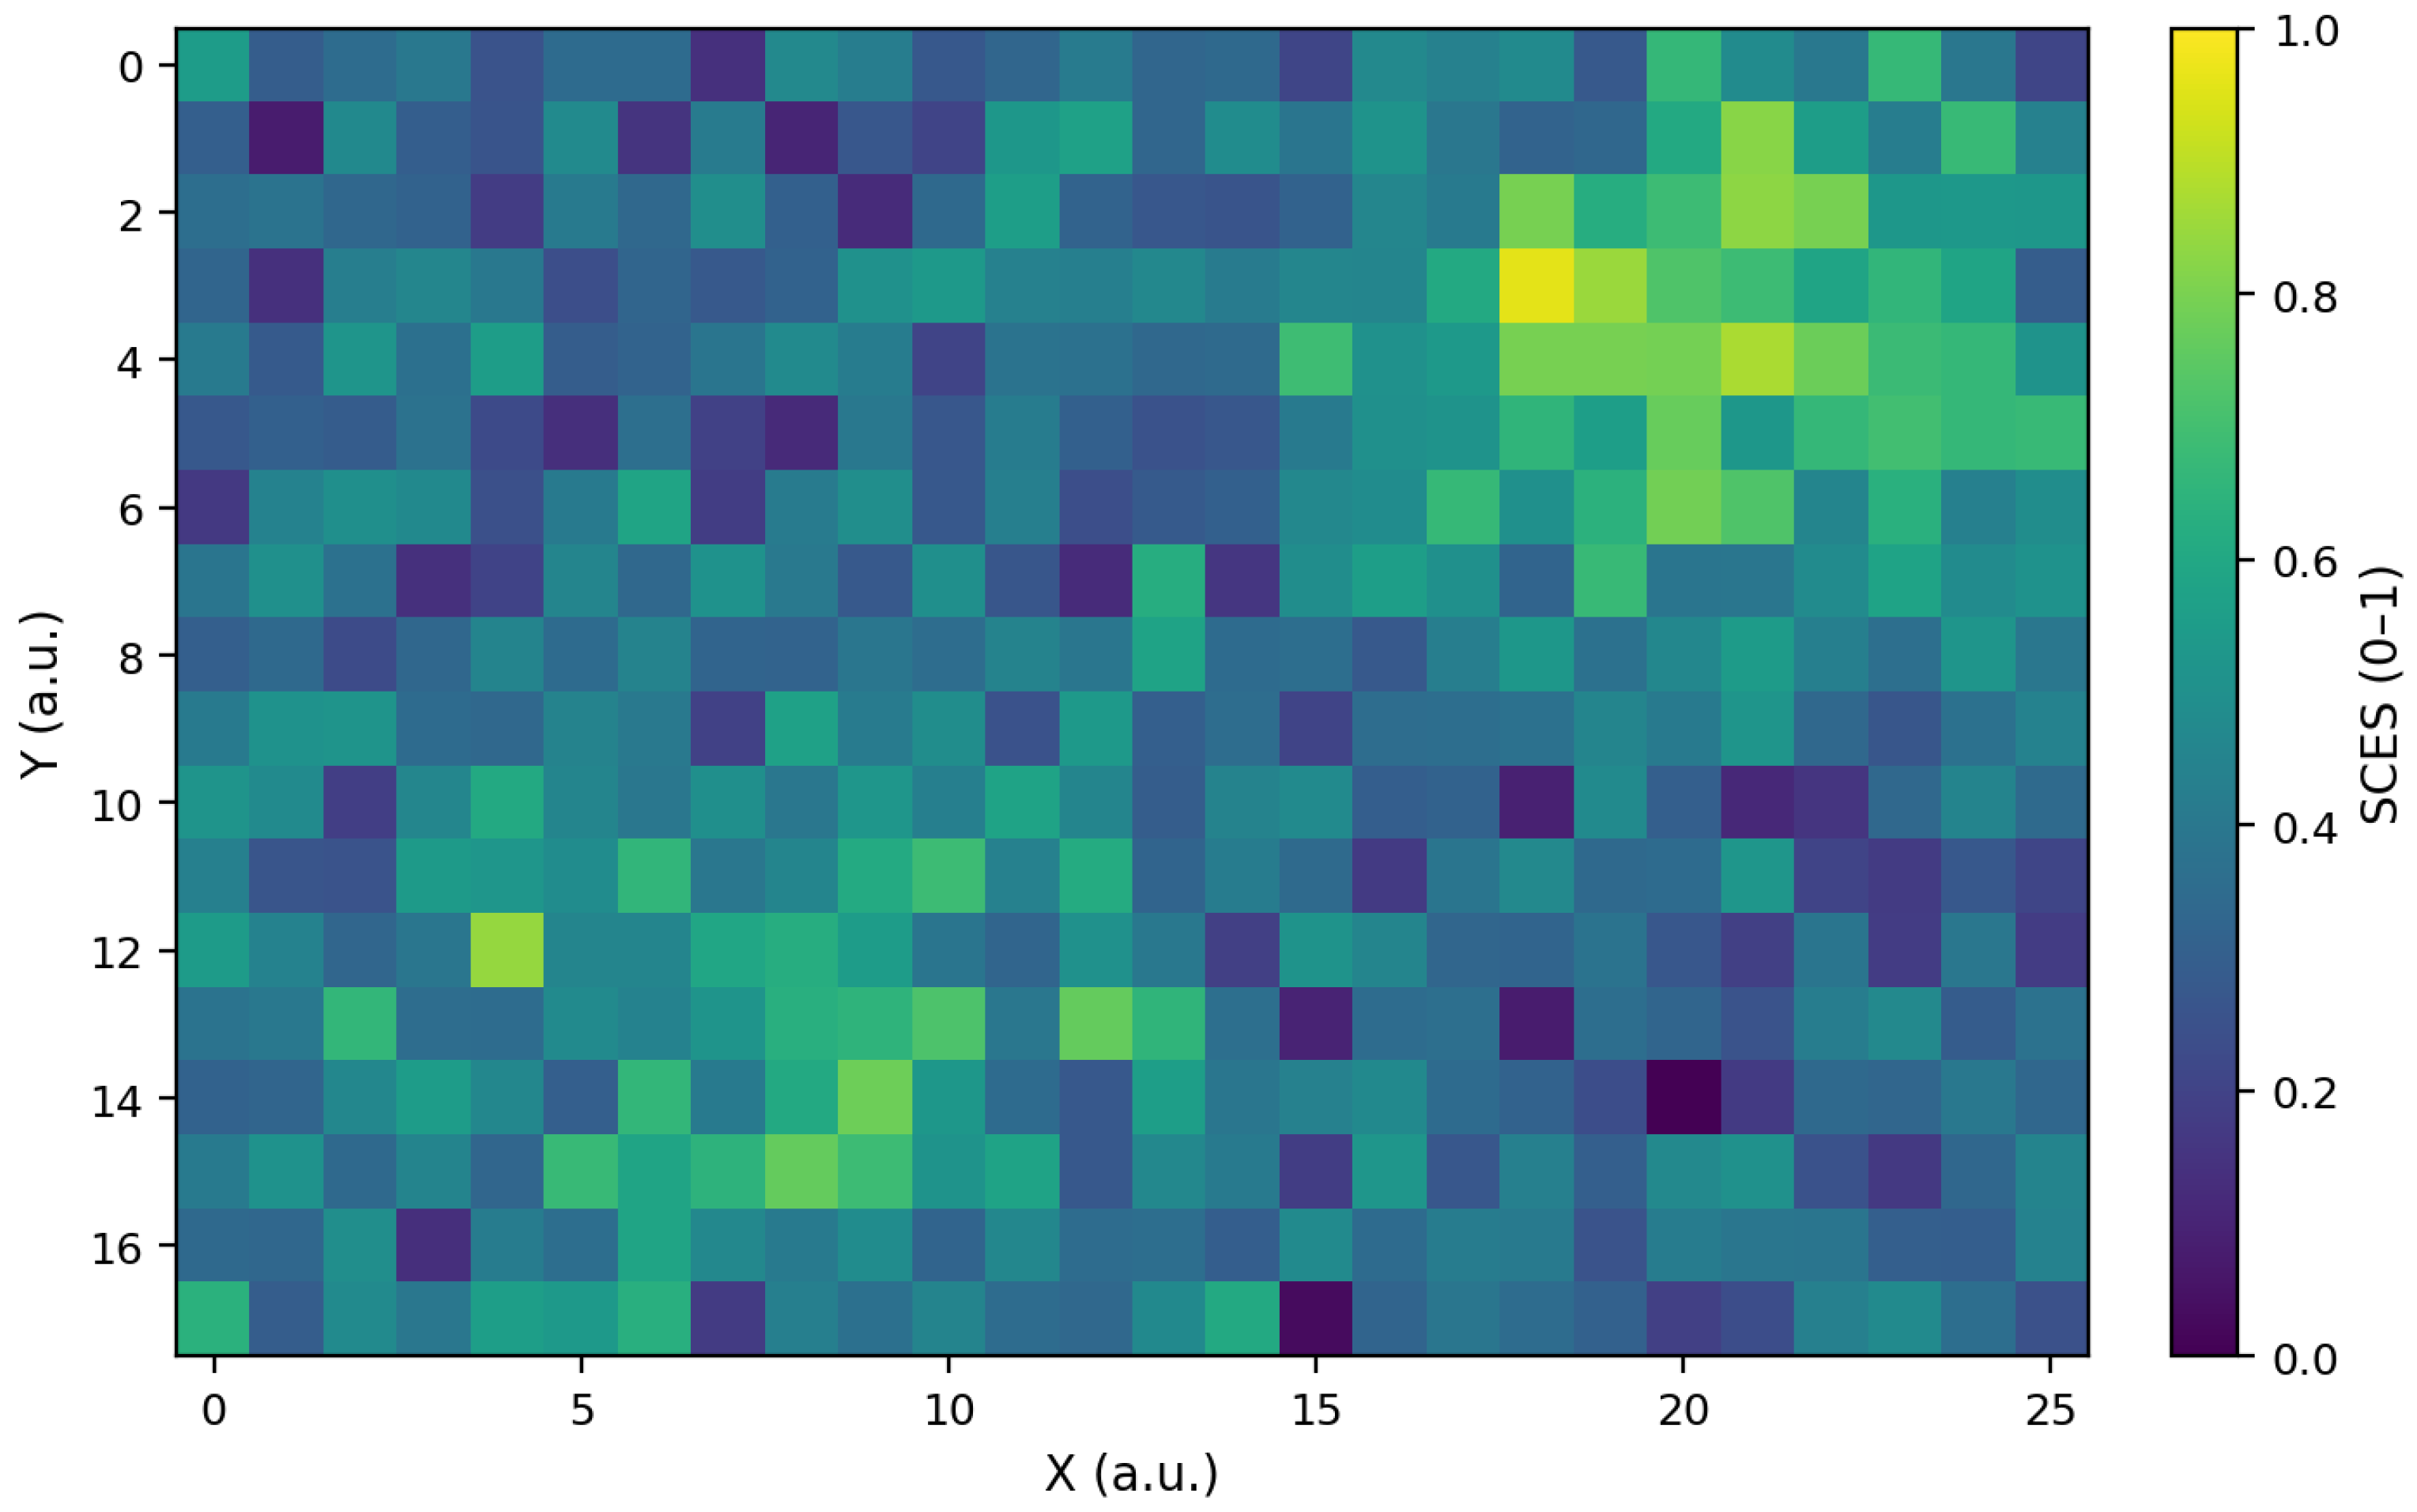
Figure 18 shows a 2D heat map of the normalized SCES index. The highest values (yellow-green zone, approximately 0.8–1.0) are observed in the upper right region at approximately X ≈ 18–23 and Y ≈ 1–5. There is also a local region of elevated values in the lower left part (approximately X ≈ 4–10, Y ≈ 12–15), while the rest of the field mainly contains medium and low levels (~0.2–0.6) with point minima (purple cells).
Figure 18.
2D heat map of the normalized SCES index.
Figure 19 shows the SCES uncertainty map. The maximum uncertainty (yellow areas, approximately 0.12–0.14) is concentrated in the central zone at approximately X ≈ 10–13 and Y ≈ 6–10, indicating the region with the greatest variability/instability of the estimate. Lower values (blue-green, approximately 0.02–0.08) predominate at the edges of the field, indicating that the SCES estimate is more confident there.
Figure 19.
SCES uncertainty map.
4. Discussion
This study goes beyond summarizing advances in web cartography and proposes a reproducible workflow for compiling and updating a digital ecological passport for launch-vehicle impact zones. Modern web-cartography and interactive visualization are essential here because they improve the interpretability of complex environmental data and support decision-making through maps and dashboards [25]. In our case, GIS is not used for visualization only; it is the organizing layer that links field sampling, laboratory outputs, QA/QC, and spatial analytics into one traceable system with secure access and regular updates. The requirements for the multifunctional resource were formulated to ensure structured storage, continuous data updating, GIS integration, data security, an intuitive user interface, and compatibility with existing environmental monitoring platforms. Interactive thematic mapping can be implemented using accessible cartographic services and interfaces, reducing the workload for users without professional cartographic training by relying on cartographic symbols and interactive elements [26,27]. Approaches to reference cartographic tools and intelligent entity search on maps (including semantic-network solutions) further support consistent navigation and interpretation of mapped objects [22]. In the proposed implementation, layered data storage is required to combine terrain, soil, and climatic drivers with dynamic monitoring streams, enabling context-aware analysis of the impact area [28]. The adopted classification of visual-cartographic methods also helps to select appropriate mapping algorithms and improves the overall accuracy and usefulness of “smart” maps for environmental applications [29]. Importantly, our results demonstrate that integrating validated measurements with spatial context changes how the reader should interpret the maps. The climatic layers (Figure 7, Figure 8, Figure 9, Figure 10, Figure 11, Figure 12 and Figure 13) explain why transport pathways (runoff, wind-driven resuspension, event-driven extremes) can shift the spatial footprint of impacts, while the soil map and its legend (Figure 16 and Figure 17) justify why monitoring density and sampling depth should vary across soil units rather than follow distance only. The composite SCES framework (0–1) then provides a consistent risk-oriented score that translates heterogeneous indicators into comparable classes (I–V), enabling hotspot detection and prioritization (Figure 18 and Figure 19). Together, these elements form a practical ecological passport that is not merely a “risk map”, but a decision-support resource linking measurements, uncertainty, and spatial drivers for planning monitoring and mitigation actions.
5. Conclusions
In this paper, a concept and structure of a digital environmental passport for launch vehicle stage/assembly impact zones have been developed. The passport aims to integrate monitoring data and cartographic visualization in a single resource. It is shown that for an area of >4.1 million hectares, key natural factors (precipitation 218–289 mm, winds 5.0–6.8 m/s) and rapid-fire hazard development (6–7 days) require regular map updates and prompt event interpretation (including the 2021 fires). The integrated SCES indicator (0–1) with 4 criterion groups and contribution/sensitivity decomposition allows for ranking zones by risk classes I–V and identifying high-risk areas (up to ~0.8–1.0) with mandatory consideration of the statistical reliability of the results: for individual areas, the uncertainty reaches ~0.12–0.14, while in stable areas it remains at ~0.02–0.08. As a result, the proposed approach provides not only a “risk map” but also a confidence map for the assessment, making the ecological passport a practical tool for planning sampling, prioritizing monitoring, and supporting decisions to reduce anthropogenic impacts in the SPLV IZ.
Future research should expand SCES using satellite and field data, generate SCES forecasts for 7–30 days, refine wₖ weights and class I–V validation thresholds, and reduce the uncertainty of σ(SCES) through calibration and sensitivity analysis.
Author Contributions
Conceptualization, A.K., A.U., Y.B., M.K., and Z.Z.; methodology, A.K., A.U., Y.B., M.K., and Z.Z.; software, M.K. and A.U.; resources, Y.B. and Z.Z.; data curation, Y.B., M.K., and Z.Z.; project administration, A.K. All authors have read and agreed to the published version of the manuscript.
Funding
The work was supported by a grant and funding from the Ministry of Science and Higher Education of the Republic of Kazakhstan within the framework of the Project № AP23488291, “Development of a multifunctional resource for environmental certification of areas where the separated parts of launch vehicles impact by the method of adaptive presentation of interactive GIS”, Institute Information and Computational Technologies, CS MSHE RK.
Institutional Review Board Statement
Not applicable.
Informed Consent Statement
Not applicable.
Data Availability Statement
The original contributions presented in this study are included in the article. Further inquiries can be directed to the corresponding author(s).
Conflicts of Interest
The authors declare no conflicts of interest.
Abbreviations
The following abbreviations are used in this manuscript:
| IZ SPLV | Impact Zones of Separated Parts Launch Vehicle |
| RSA | From Rocket-Space Activities |
| RSC | Rocket-Space Complex |
| RCIZ | Rocket Component Impact Zones |
| EIA | Environmental Impact Assessment |
| GIS | Geographic Information System |
| UDMH | Unsymmetrical Dimethylhydrazine |
| NDMA | N-Nitrosodimethylamine |
| QSAR | Quantitative Structure–Activity Relationship |
| ADME | Absorption–Distribution–Metabolism–Excretion |
| PASS | Prediction of Activity Spectra For Substances |
| BOD | Biochemical Oxygen Demand |
| OML | Organic Matter Load |
| Vac | Vacuum |
| HS | Headspace |
| SPME | Solid Phase Microextraction |
| GC | Gas Chromatography |
| MS | Mass Spectrometry |
| SS(GOST) | State Standards |
| FES | Federal Environmental Standards |
| MG | Methodological Guidelines |
| SanPiN | Sanitary Rules |
| OEM | Operational environmental monitoring |
| ISO | International Organization for Standardization |
| QA | Quality Assurance |
| QC | Quality Control |
| LOD | Left-Censored Data |
| NADA | Method Under the Assumption of Lognormality |
References
- Zhubatov, J.; Tovasarov, A.; Kozlovsky, V.; Alekseeva, D.; Bisarieva, S.; Pozdnyakova, A.; Gusarova, N. Environmental Safety of the Baikonur Cosmodrome; Zhubatov, Z., Ed.; 2011; 555p. (In Russian) [Google Scholar]
- Adushkin, V.V.; Kozlov, S.I.; Petrov, A.V. Environmental Problems and Risks of the Impact of Rocket and Space Technology on the Environment; Ankil: Moscow, Russia, 2000. (In Russian) [Google Scholar]
- Semenkov, I.; Bekeshev, E.; Stepanova, Y.; Karpachevskiy, A.; Lednev, S.; Klink, G.; Yerzhanov, Y.; Bapyshev, A.; Koroleva, T. Environmental impact of the launch vehicle ‘Soyuz-FG’ emergency falling in Kazakhstan. Environ. Sci. Pollut. Res. 2025, 32, 2592–2605. [Google Scholar] [CrossRef] [Scilit] [PubMed]
- Zhubatov, Z.; Kenezov, B.N.; Tovasarov, A.D.; Kozlovsky, V.A.; Batyrbekova, S.E. System of Environmental Regulation of Rocket and Space Activities at the Baikonur Cosmodrome; Nauryzbayev, M.K., Ed.; 2017; 146p. (In Russian) [Google Scholar]
- Koroleva, T.V.; Semenkov, I.N.; Sharapova, A.V.; Krechetov, P.P.; Lednev, S.A. Ecological consequences of accidents during rocket launches in Central Kazakhstan between 1999 and 2018. Environ. Pollut. 2021, 268, 115711. [Google Scholar] [CrossRef] [Scilit] [PubMed]
- Carlsen, L.; Kenesova, O.A.; Batyrbekova, S.E. A preliminary assessment of the potential environmental and human health impact of unsymmetrical dimethylhydrazine as a result of space activities. Chemosphere 2007, 67, 1108–1116. [Google Scholar] [CrossRef] [Scilit] [PubMed]
- Kenessov, B. Transformation products of 1,1-dimethylhydrazine and their distribution in soils of fall places of rocket carriers in Central Kazakhstan. Sci. Total Environ. 2012, 427–428, 78–85. [Google Scholar] [CrossRef] [Scilit] [PubMed]
- Sharapova, A.V.; Semenkov, I.N.; Koroleva, T.V.; Krechetov, P.P.; Lednev, S.A.; Smolenkov, A.D. Snow pollution by nitrogen-containing substances as a consequence of rocket launches from the Baikonur Cosmodrome. Sci. Total Environ. 2020, 709, 136072. [Google Scholar] [CrossRef] [Scilit] [PubMed]
- Lednev, S. Revegetation of areas disturbed by rocket impact in Central Kazakhstan. Ecoscience 2018, 25, 25–38. [Google Scholar] [CrossRef] [Scilit]
- Lednev, S.A. State of Desert Phytocenoses in the Republic of Kazakhstan at Crash Sites of Launch Vehicles. Arid. Ecosyst. 2020, 10, 244–250. [Google Scholar] [CrossRef] [Scilit]
- Maikanov, B.S.; Auteleyeva, L.T.; Zhubatov, Z.K.; Terlikbayev, A.A.; Kamsaev, K.M. The Effect of an Accidental Carrier Rocket Crash on Soil and Vegetation Cover. J. Ecol. Eng. 2022, 23, 176–184. [Google Scholar] [CrossRef] [Scilit]
- Toktar, M.; Zhubato, Z.; Stepanova, Y.; Bekeshev, E. Impact of space and rocket activity on soil cover in central Kazakhstan. E3S Web Conf. 2019, 135, 01105. [Google Scholar] [CrossRef] [Scilit]
- Bekeshev, Y.; Semenkov, I.; Stepanova, Y.; Karpachevskiy, A.; Lednev, S.; Klink, G.; Yerzhanov, Y.; Bapyshev, A.; Koroleva, T. Data on the temporal changes in soil properties at the crash site of the Soyuz-FG launch vehicle, Kazakhstan. Data Brief 2024, 55, 110646. [Google Scholar] [CrossRef] [Scilit] [PubMed]
- Radelyuk, I.; Zhakupbekova, A.; Zhumadildinova, A.; Kashtanov, A.; Baimatova, N. Hidden Contamination Patterns: A Stochastic Approach to Assessing Unsymmetrical Dimethylhydrazine Transformation Products in Kazakhstan’s Rocket Crash Area. Toxics 2025, 13, 963. [Google Scholar] [CrossRef] [Scilit] [PubMed]
- Perevedentsev, Y.; Sherstyukov, B.; Gusarov, A.; Aukhadeev, T.; Mirsaeva, N. Climate-induced fire hazard in forests in the Volga federal district of European Russia during 1992–2020. Climate 2022, 10, 110. [Google Scholar] [CrossRef] [Scilit]
- 14001-ISO 14001:2015; Environmental Management Systems—Requirements with Guidance for Use. Federal Agency for Technical Regulation and Metrology: Moscow, Russia, 2018.
- Kondratyev, A.D.; Krechetov, P.P.; Koroleva, T.V.; Chernitsova, O.V. Baikonur Cosmodrome as a Site for Natural Resource Management; Pelican: Moscow, Russia, 2008. (In Russian) [Google Scholar]
- Kondratyev, A.D.; Koroleva, T.V.; Puzanov, A.V.; Chernitsova, O.V.; Efremenkov, A.A.; Sharapova, A.V.; Gorbachev, I.V.; Dvurechenskaya, E.B. Improving the system of environmental monitoring of the fall areas of separated parts of launch vehicles. World Sci. Cult. Educ. 2012, 6, 482–486. (In Russian) [Google Scholar]
- Koroleva, T.V.; Krechetov, P.P.; Chernitsova, O.V. Environmental Monitoring Framework for the Impact Zone of Launch Vehicle Stage Separation. World Sci. Cult. Educ. 2010, 252–254. (In Russian) [Google Scholar]
- Queen, T.V.; Krechetov, P.P.; Chernitsova, O.V.; Sharapova, A.V. Ecological monitoring of the Baikonur Cosmodrome. Nat. Eng. Sci. 2013, 221–224. (In Russian) [Google Scholar]
- Novikov, V.K.; Novikov, S.V.; Tatarinov, V.V. Possible directions for reducing the influence of the rocket and space industry on the environment. In Proceedings of the XLIII Academic Space Conference: Dedicated to the Memory of Academician S.P. Korolev and Other Outstanding Russian Scientists—Pioneers of Space Exploration, Moscow, Russia, 28 January–1 February 2019; p. 100003. [Google Scholar] [CrossRef] [Scilit]
- Perera, J.A.B.; Zhang, D.; Lu, M. Smart Maps through Semantic Web, Social Media, and Sentiment Analysis. In Proceedings of the 2015 IEEE International Conference on Information Reuse and Integration, San Francisco, CA, USA, 13–15 August 2015; IEEE: Piscataway, NJ, USA, 2015; pp. 49–56. [Google Scholar] [CrossRef] [Scilit]
- Dallas, J.A.; Raval, S.; Gaitan, J.P.A.; Saydam, S.; Dempster, A.G. The environmental impact of emissions from space launches: A comprehensive review. J. Clean. Prod. 2020, 255, 120209. [Google Scholar] [CrossRef] [Scilit]
- Osiko, S.M. Environmental problems of rocket and space activities: The influence of rocket fuel on the state of the environment in the areas where spent stages fall. Young Sci. 2020, 23, 482–485. (In Russian) [Google Scholar]
- Roth, R.E.; Donohue, R.G.; Sack, C.M.; Wallace, T.R.; Buckingham, T.M.A. A process for keeping pace with evolving web mapping technologies. Cartogr. Perspect. 2015, 78, 25–52. [Google Scholar] [CrossRef] [Scilit]
- Tsorlini, A.; Hurni, L.; Sieber, R.; Gloor, T.; Klauser, H. Generation of Thematic Maps with Wizards based on Cartographic Principles: The Case Study of OCAD Thematic Mapper. In Proceedings of the 27th International Cartographic Conference, Rio de Janeiro, Brazil, 23–28 August 2015. [Google Scholar]
- Medyńska-Gulij, B. Cartographic sign as a core of multimedia map prepared by non-cartographers in free map services. Geod. Cartogr. 2014, 63, 55–64. [Google Scholar] [CrossRef] [Scilit]
- Barman, S.; Barman, A.K.; Panda, B.; Sharma, P. Implementation of a smart map using spatial oracle. In Proceedings of the 2015 Third International Conference on Computer, Communication, Control and Information Technology (C3IT), Hooghly, India, 7–8 February 2015; IEEE: Piscataway, NJ, USA, 2015; pp. 1–5. [Google Scholar] [CrossRef] [Scilit]
- Mikulich, L.I.; Alekseychuk, A.E.; Andrienko, G.L.; Andrienko, N.V. “Research into Methods for the Automated Construction of Cognitive-Graphical Forms of Data Representation in Intelligent Information Systems.” Research Project: Grant No. 96-01-00785; Russian Foundation for Basic Research: Moscow, Russia, 1996; 15p. (In Russian) [Google Scholar]

Disclaimer/Publisher’s Note: The statements, opinions and data contained in all publications are solely those of the individual author(s) and contributor(s) and not of MDPI and/or the editor(s). MDPI and/or the editor(s) disclaim responsibility for any injury to people or property resulting from any ideas, methods, instructions or products referred to in the content. |
© 2026 by the authors. Licensee MDPI, Basel, Switzerland. This article is an open access article distributed under the terms and conditions of the Creative Commons Attribution (CC BY) license.