


Abstract
Clouds are essential for regulating the hydrological cycle and Earth’s radiation budget, and their fluctuations over the Tibetan Plateau (TP) have a significant effect on both regional climate dynamics and global atmospheric circulation. Using ground-based Vaisala CL51 ceilometer data and Fengyun-4A (FY-4A) satellite observations from October 2020 to June 2022, this study examines cloud occurrence frequency (COF), cloud vertical structure (including cloud base height (CBH), cloud top height (CTH), and cloud layer stratification), and related macroscopic properties over the Large High Altitude Air Shower Observatory (LHAASO). CL51 and FY-4A had cloud occurrence rates of 43.7% and 37.7%, respectively, over the observation period, with a strong correlation coefficient of 0.82. Given the impact of clouds on Cherenkov light observations by the LHAASO Wide Field of view Cherenkov Telescope Array (WFCTA), we specifically evaluated the cloud occurrence during the operational periods of the LHAASO-WFCTA, finding rates of 34.2% (CL51) and 28.0% (FY-4A), with the lowest rates occurring in the early morning. Due to monsoonal moisture inflow and dry northeasterly winds, seasonal COF changes showed clear peaks in summer (78.8%) and minima in winter (24.8%). Seasonal differences existed in the diurnal COF patterns, with nocturnal prominence in summer/autumn and daytime dominance in spring/winter. The CBH showed daily oscillations, peaking at 18:00 (local solar time) and troughing at 08:00 (local solar time), with seasonal CBH minima in summer/autumn and maxima in spring/winter. Low- and mid-level clouds predominated, with clear diurnal cycles: low- and mid-level clouds rose from morning until midday, while high-level clouds appeared after dusk. Vertical cloud structures were predominantly single-layered (81%), with multi-layered complexity peaking in the summer due to convective activity. The CTH distributions showed unimodal patterns in the fall and winter (1.5–3 km), while in the summer, they showed multimodal extents (up to 12 km). These results improve LHAASO-WFCTA observational scheduling, enhance climate model parameterizations, and deepen our understanding of the dynamics of the TP cloud.
1. Introduction
Clouds play a crucial role in weather systems and climate change. Macroscopic cloud characteristics, such as cloud occurrence frequency (COF), cloud vertical structures (CVSs), including cloud base height (CBH), cloud top height (CTH), and cloud layer structure, influence Earth’s radiation budget and regulate energy flow and atmospheric circulation through radiative interactions [1,2]. However, representing clouds in climate models remains challenging due to the subgrid-scale nature of cloud processes relative to model resolutions. Previous generations of climate models have been shown to underestimate the occurrence of tropical low-level clouds and overestimate their radiative effects, while different cloud heights and vertical overlap states significantly impact radiative outcomes [3]. Therefore, understanding cloud macroscopic properties, such as COF and CVSs, not only helps us better understand the role of clouds but also provides more data for model development. The climatic complexity of the Tibetan Plateau (TP) is profoundly shaped by cloud dynamics, which play a pivotal role in regulating regional energy budgets and modulating global atmospheric circulation patterns [4,5,6]. Studying the macroscopic characteristics of clouds in this region has significant scientific and practical value. Many experts and scholars have conducted research on cloud macroscopic properties over the TP. For example, Wei et al. [7] examined the relationship between cloud occurrence and radiative forcing across the whole TP using CloudSat data, and they found a definite positive association between COF and cloud radiative forcing. The unique cloud and precipitation processes over the TP in summer are primarily triggered by afternoon heating, with clouds and precipitation exhibiting distinct diurnal variations. After midnight, convective precipitation often transitions to stratiform cloud precipitation [8]. Xu et al. [9] used geostationary satellites to study the diurnal variation of COF over the TP, showing that cloud frequency has a clear diurnal cycle, with the highest frequency at 12:00 and the lowest at 04:00. The cloud frequency trends are similar across different regions of the TP. The plateau’s topography compresses cloud layer thickness and CTH, and the CVS associated with precipitation intensity shows strong seasonal variations, such as narrower CTH ranges in spring (around 12 km) and broader ranges in summer (12–18 km) [10]. Different terrains also exhibit varying COF and CVS characteristics [11], making it important to study cloud macroscopic properties in different regions of the TP. Wu et al. [12] analyzed the characteristics of COF under the influence of three important weather systems (westerly troughs, shear lines, and vortex systems) in the Naqu region of the central TP in 2019. The results showed that the COF associated with westerly troughs and shear lines exhibit significant diurnal variations with similar trends, generally following a single-peak and single-valley pattern. The lowest COF was observed before sunrise, while the highest frequency occurred before sunset. In contrast, the diurnal variation of cloud occurrence under vortex systems displayed a multi-peak and multi-valley pattern. Zhou et al. [13] used ground-based Ka-band cloud radar to study COF in the Motuo region of the southeastern TP. They found that the COF reached its lowest value at 12:00 Beijing time and increased rapidly in the afternoon, peaking at 19:00 Beijing time. This result differs from the diurnal variation of cloud occurrence in the southern TP reported by Xu et al. [9], primarily due to differences in detection methods. Satellite observations mainly reflect the variations of high-level clouds over the entire TP, while ground-based instruments primarily capture the variations of local low- and middle-level clouds.
The eastern TP features complex terrain with intersecting mountain ranges and frequent heavy precipitation. Meteorological observations in this region are sparse, and there are few reports on ground-based measurements of cloud macroscopic properties. This study uses data from the Vaisala CL51 ceilometer (CL51) at the Large High Altitude Air Shower Observatory (LHAASO) [14] from October 2020 to June 2022, combined with Fengyun-4A (FY-4A) satellite data, to analyze COF, cloud layers and statistical characteristics of CBH/CTH. The results provide important observational data for studying cloud variations over the TP and offer a reference for the operation of wide field of view Cherenkov telescope array (WFCTA) at the LHAASO station [15].
2. Data and Methodology
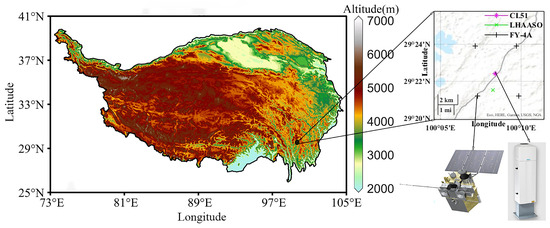
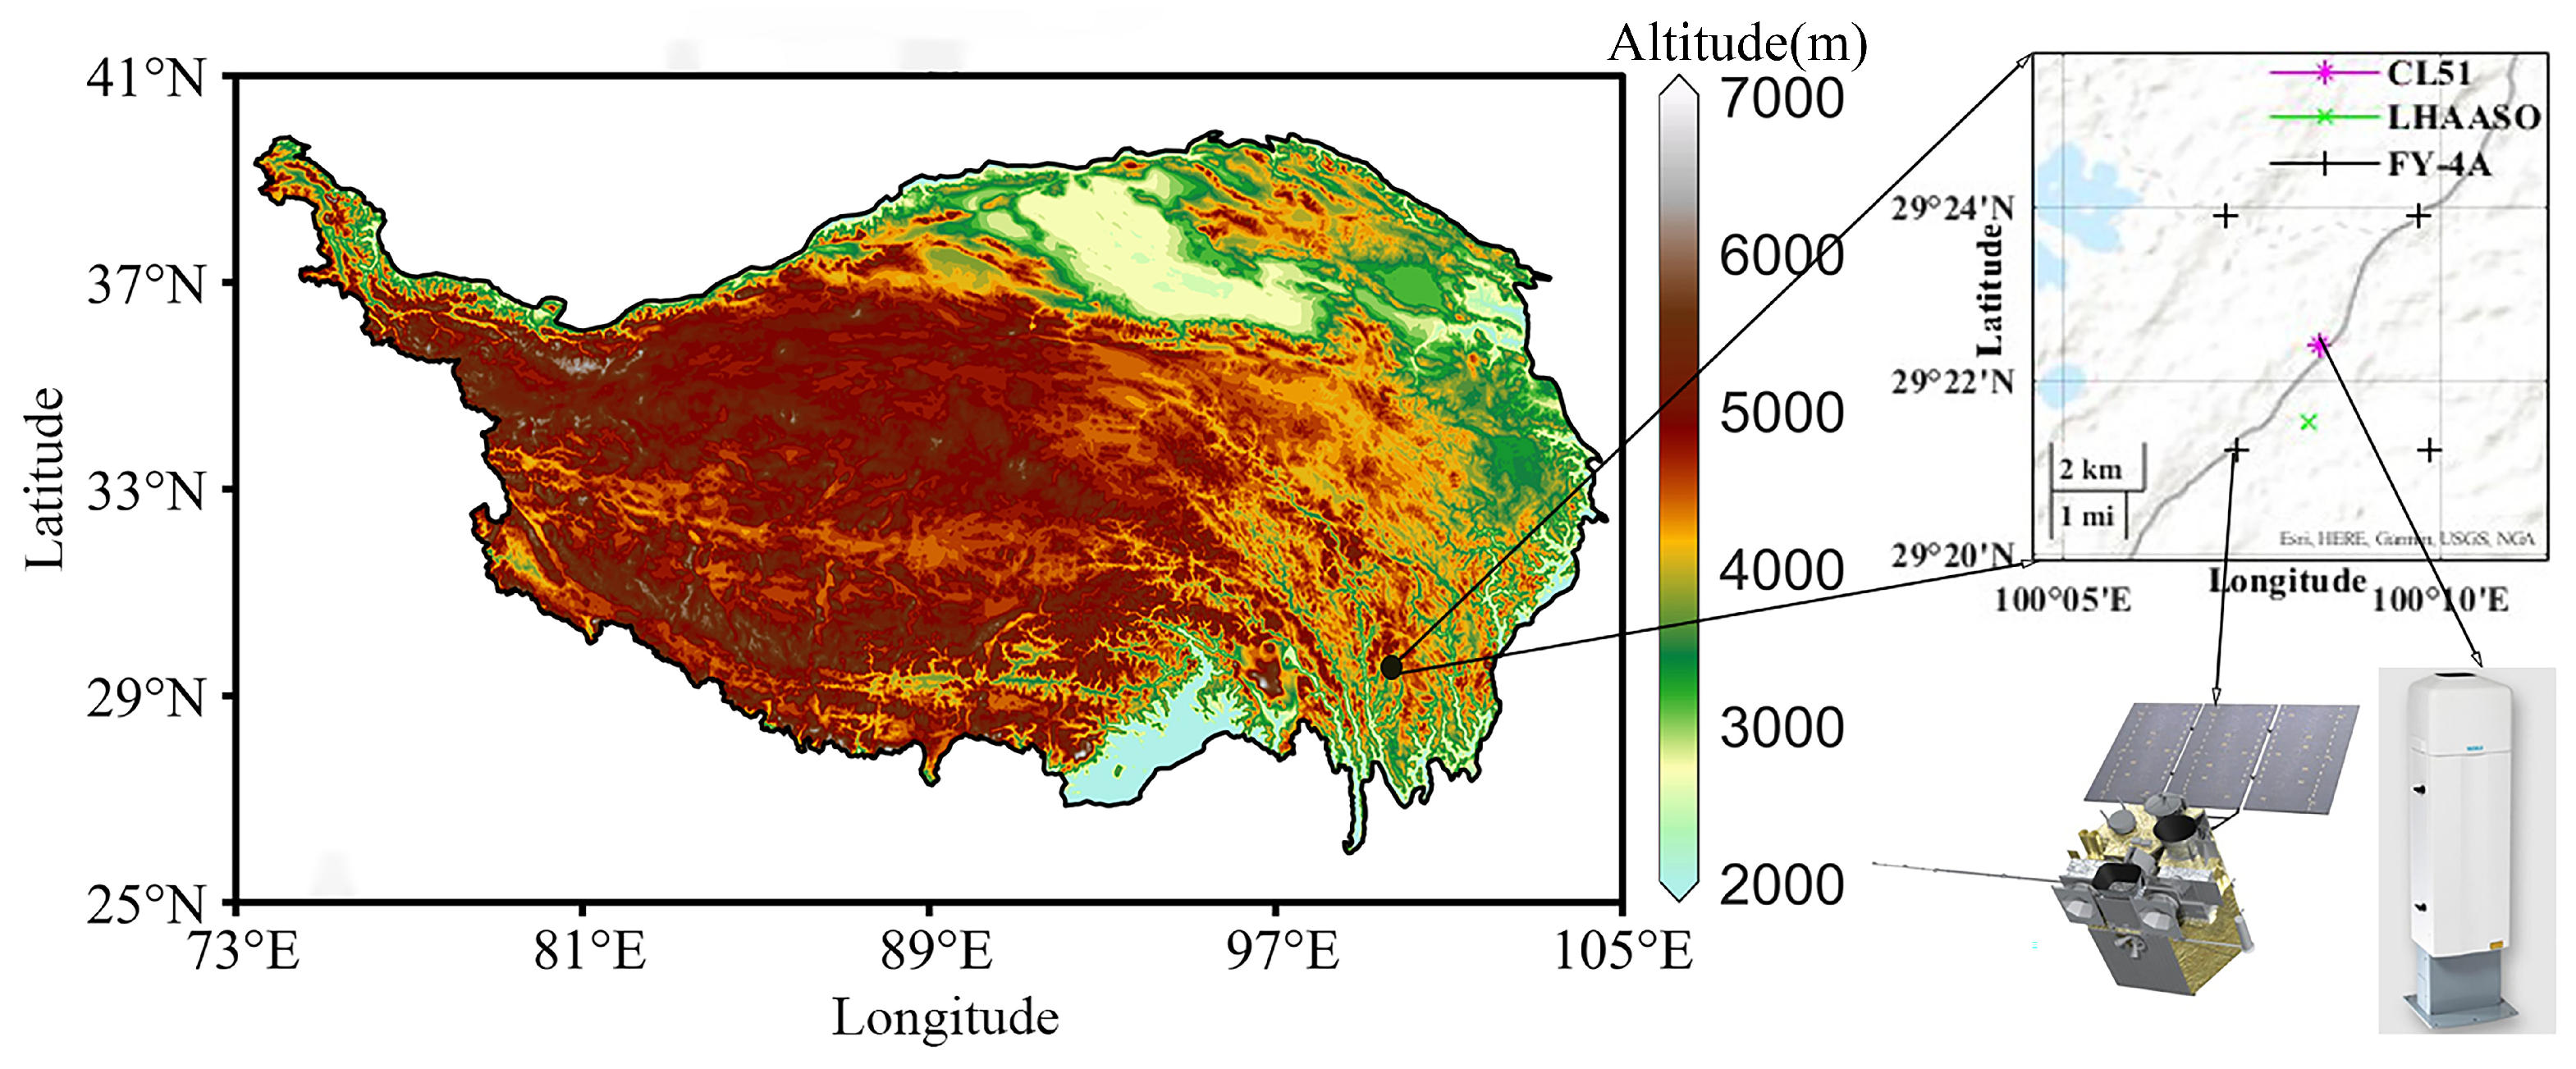
LHAASO (29.35° N, 100.13° E, 4410 m above sea level) is located on Haizi Mountain in Daocheng County, Sichuan Province, on the eastern TP. Figure 1 shows the location of the CL51 at LHAASO and the data selection range of FY-4A. The LHAASO site covers approximately 1.3 square kilometers, with vegetation primarily consisting of grassland and a flat, open terrain.
Figure 1.
The geographical coordinates of CL51 ceilometer (CL51, magenta) within the center of the Large High Altitude Air Shower Observatory (LHAASO, green) array and the curated dataset from the Fengyun-4A (FY-4A, black) satellite.
2.1. CL51
The Vaisala CL51 ceilometer employs pulsed diode laser LIDAR technology. It emits laser pulses at a wavelength of 910 nm and operates with a vertical resolution of 10 m and a temporal resolution of 16 s. The instrument acquires backscatter profiles up to an altitude of 15 km, from which the CBH for up to three layers are retrieved by the manufacturer’s proprietary algorithm [16,17]. If two cloud layers are present within the detection range, the signal increases at different heights, and the CL51 returns the CBH information for both layers. The CL51 can detect up to three cloud layers per emission. Compared to satellite observations, the CL51 provides continuous and high-resolution data. It is also more sensitive to atmospheric particle concentration changes than other lidars, offering high observation accuracy [18].
A key component of the CL51 retrieval algorithm is the use of a contrast threshold, which has been empirically optimized through extensive validation to yield vertical visibility values that align closely with visual observations from ground-based human observers [19]. To further assess the reliability of this threshold-based method, we applied the LevelShiftAD (LSAD) algorithm—an unsupervised anomaly detection technique—to independently identify cloud boundaries from the same backscatter profiles [20]. The LSAD method detects abrupt shifts in echo signals by analyzing median value differences within sliding windows, without relying on predefined empirical thresholds. The high consistency between the cloud boundaries derived from LSAD and those from the CL51 threshold method strongly validates the accuracy and robustness of the CL51 algorithm under the observed conditions.
Recent studies utilizing the CL51 ceilometer have demonstrated its reliability in cloud observation. For instance, Lee et al. [21] conducted a comprehensive analysis of CBH and CVS over Seoul using CL51 data, revealing that the instrument accurately captures seasonal variations in cloud occurrence, with a distinct bimodal distribution of CBH. Song et al. [22] used simultaneous data from the CL31 ceilometer and a water vapor, cloud and aerosol lidar to compare the cloud vertical structure and diurnal variations in CBH and CTH over the Naqu area. The study found that the two devices’ CBH detection accuracy was quite good. Interestingly, there was a noticeable diurnal cycle in the vertical cloud distribution, which showed up as a clear U-shaped distribution. However, the physical reasons underlying this distinctive U-shaped distribution are still unknown due to the poor dispersion of surface meteorological stations over the Tibetan Plateau. Liu et al. [23] compared CBH retrievals between the CL51 and CL31, demonstrating that the CL51’s improved algorithm and extended detection range make it more reliable for detecting multilayered clouds. Despite its advantages, challenges remain, it is susceptible to environmental noise. To improve the signal-to-noise ratio, the CL51 uses the sum of multiple laser pulse returns, effectively eliminating pseudo-noise and Gaussian white noise [24]. Due to its accuracy, high resolution, and strong anti-interference capabilities, the CL51 is widely used at weather stations and airports for cloud monitoring. The CL51 was installed inside the LHAASO array and from October 2020 to June 2022, valid observations were recorded on 530 days, with 2,824,497 detections.
2.2. FY-4A
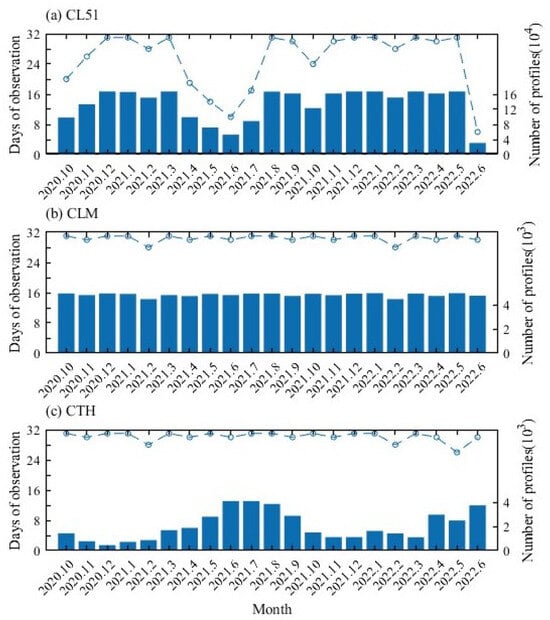
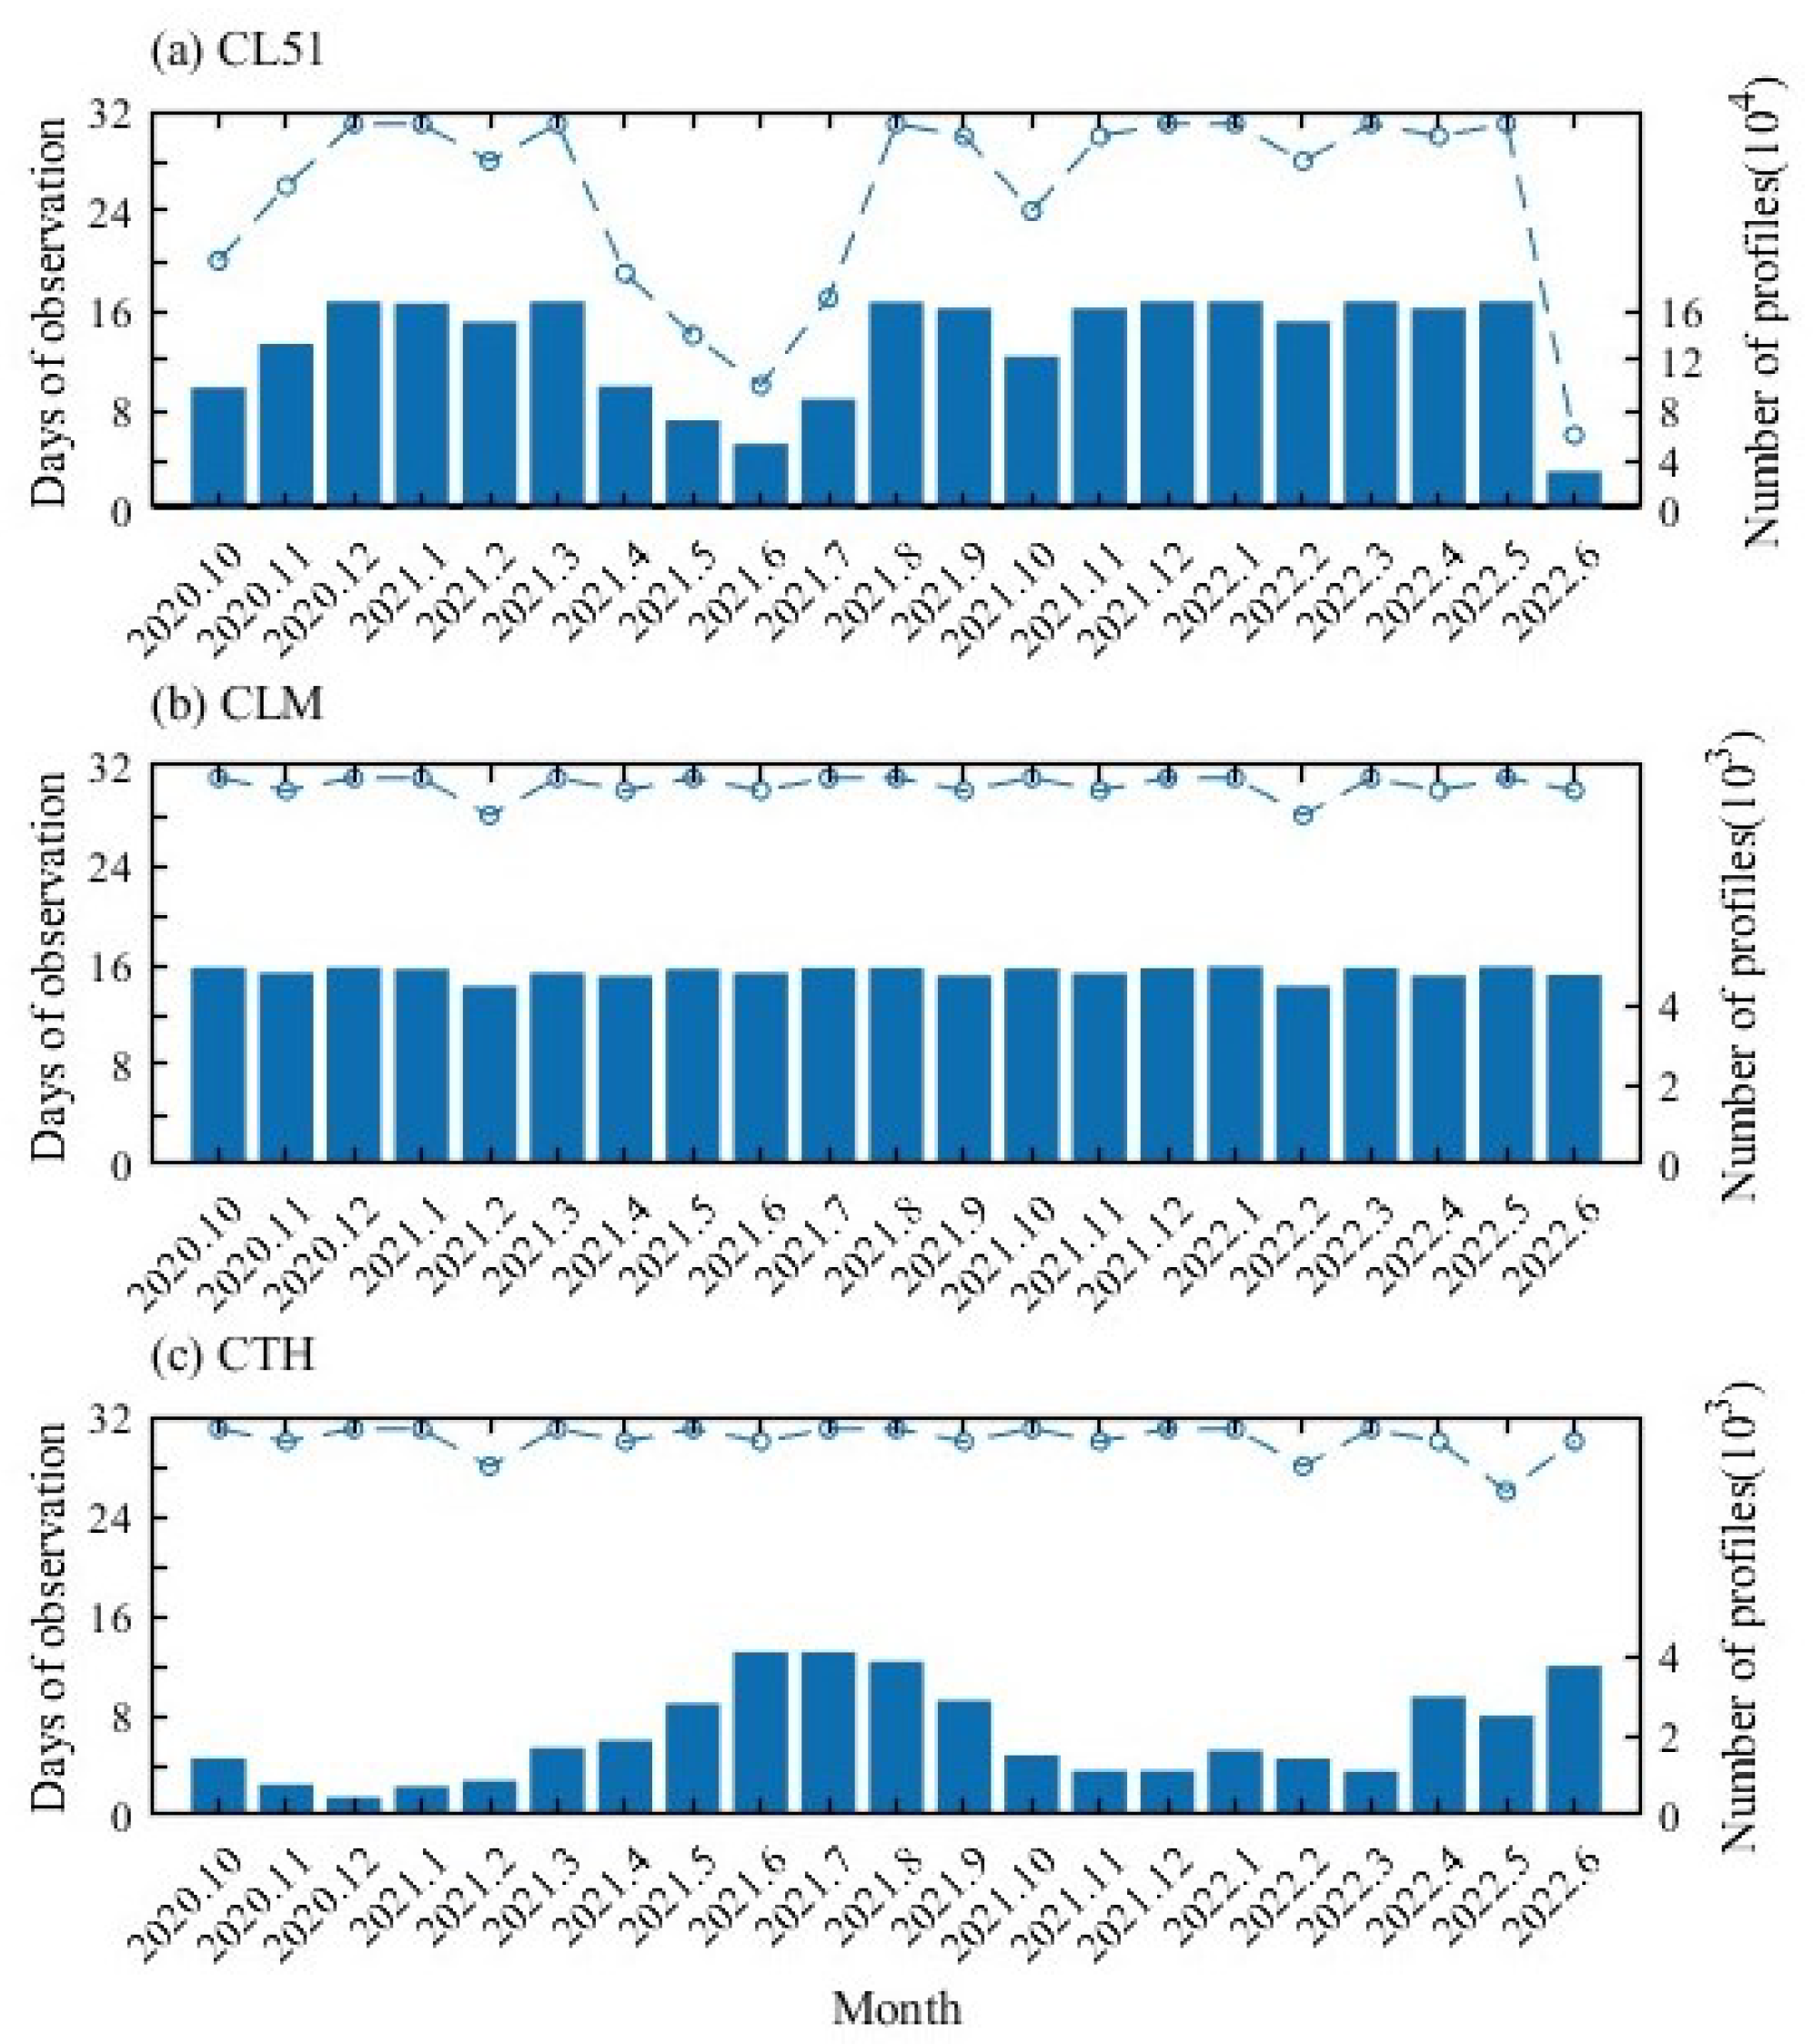
The FY-4A satellite, launched on 11 December 2016, has a time resolution of 15 min and a spatial resolution of 4 km. The Advanced Geostationary Radiation Imager is a key payload of the FY-4A satellite, primarily tasked with obtaining cloud images. It has 14 observation bands with central wavelengths ranging from 0.47 to 13.5 µm [9]. In this study, we used the cloud mask products (CLM) and CTH products from FY-4A during October 2020 to June 2022. The data availability is shown in Figure 2.
Figure 2.
Number of profiles observed (column chart) and days with observation (line chart) of each month during the observation period. (a) CL51, (b) cloud mask products (CLM) data from FY-4A, (c) cloud top height (CTH) data from FY-4A satellite.
2.3. Data Preprocessing
This study employs rigorous data quality control and standardization procedures to ensure the reliability of observational results. Data quality control is essential. First, data affected by precipitation, ground-level fog, or other obstructions are removed. The remaining data are arranged chronologically, and outliers are eliminated to obtain valid observations. Figure 2 shows the data volume, with the line graph representing the number of observation days per month and the bar graph showing the number of valid detections per month. Under normal conditions, the CL51 returns data every 16 s, resulting in 5400 datasets per day.
To spatially match the CL51 data, satellite data from the grid closest to LHAASO were extracted (Figure 1), with a linear distance of less than 5 km. During quality control, data with abnormal data quality flags were removed. Cloud detection typically classifies pixels into four categories: cloud, probably cloud, probably clear, and clear. In this study, only pixels classified as “cloud” were counted for COF, while the other three categories were treated as clear. In the temporal dimension, satellite observation time was converted from Coordinated Universal Time (UTC) to Local Solar Time (LST, LST = UTC + 7 h − 19 min − 29 s). In the analysis of COF, CBH, and other parameters, both instruments were analyzed independently based on their respective resolutions. The COF is defined as follows: COF = (Number of detections with at least one cloud layer/Total number of valid detections) × 100% [18,19,23,25,26]. For diurnal analysis, the hourly COF is calculated as the ratio of the total number of cloud detections in that hour across all observation days to the total number of valid detections in the same hour across all days. For monthly analysis, the COF is the ratio of the total cloud detections in that month to the total valid detections in the month. The diurnal mean CBH and CTH are computed as the arithmetic average of all valid height observations in that hour across all observation days. Additionally, since the satellite’s CTH product provides altitude above sea level, the altitude of LHAASO (4410 m) was subtracted to obtain the height above ground level.
3. Results
3.1. Cloud Occurrence Frequency
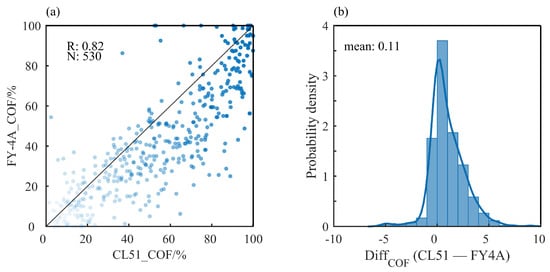
The Cloud occurrence frequency (COF) observed by CL51 and FY-4A was 43.7% and 37.7%, respectively, over the observation period. Given the differing temporal resolutions of the CL51 and FY-4A observations, the daily COF for each instrument is calculated separately using its own cloud detection results and its own total number of valid detections for the same day, totaling 530 samples. The scatter plots and histograms of the differences between the two sets of COF samples derived from the matching are displayed in Figure 3. With a correlation of 0.82, the COFs recorded by the FY-4A and CL51 satellites show good agreement overall, with the majority of the scatters falling around a 1:1 line.
Figure 3.
(a) Scatter plot comparing cloud occurrence frequency (COF) from CL51 and FY-4A, and (b) histogram of the ΔCOF. Here R is the correlation coefficient and N the sample size.
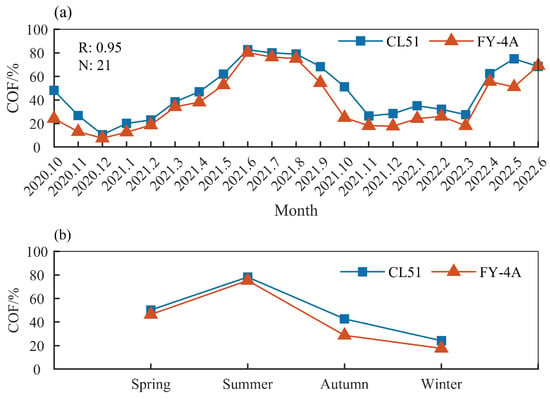
The monthly COF showed interannual variations. Although FY-4A’s COF was slightly lower than the ceilometer’s, both instruments followed similar trends across different years (Figure 4a), demonstrating a strong correlation (R = 0.95). In 2021, the highest COF occurred in June (82.6% for CL51; 80.1% for FY-4A), and the lowest occurred in January (20.1% for CL51; 12.6% for FY-4A). The COF was highest from June to August. From January to May, COF gradually increased, and from September to December, it gradually decreased. The COF for September and October 2020 was similar to that of 2021, but December 2020 had a lower COF than December 2021. From October to May, during the observation period of the WFCTA (20:00–05:00, LST) the COF was 34.2% (CL51) and 28.0% (FY-4A), with the lowest value at midnight. Since clouds increase the absorption of Cherenkov light, telescope observations should prioritize periods with low COF, and cloud-free periods should be selected during data processing. Thus, the impact of clouds on the quality of WFCTA observations at LHAASO cannot be ignored, and these results provide a reference for WFCTA operation.
Figure 4.
(a) COF of each month during the observation period from CL51 (blue squares) and FY-4A (orange triangles). Here R is the correlation coefficient and N the sample size. (adapted from [27]) (b) COF of each season during the observation period from CL51 (blue squares) and FY-4A (orange triangles).
The COF exhibited clear seasonal variations (Figure 4b), with the lowest frequency in winter, a gradual increase in spring, a peak in summer, and a gradual decrease in autumn. The highest COF occurred in summer (78.8%, CL51; 75.2%, FY-4A), and the lowest occurred in winter (24.8%, CL51; 17.6%, FY-4A). Spring had a slightly higher COF than autumn. Due to high temperatures and strong convective activity in summer, the COF was significantly higher than in other seasons.
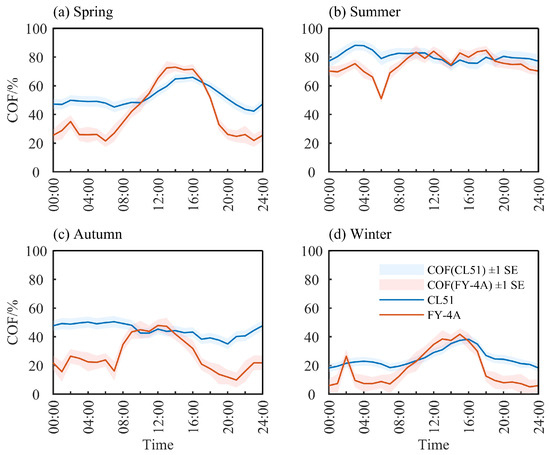
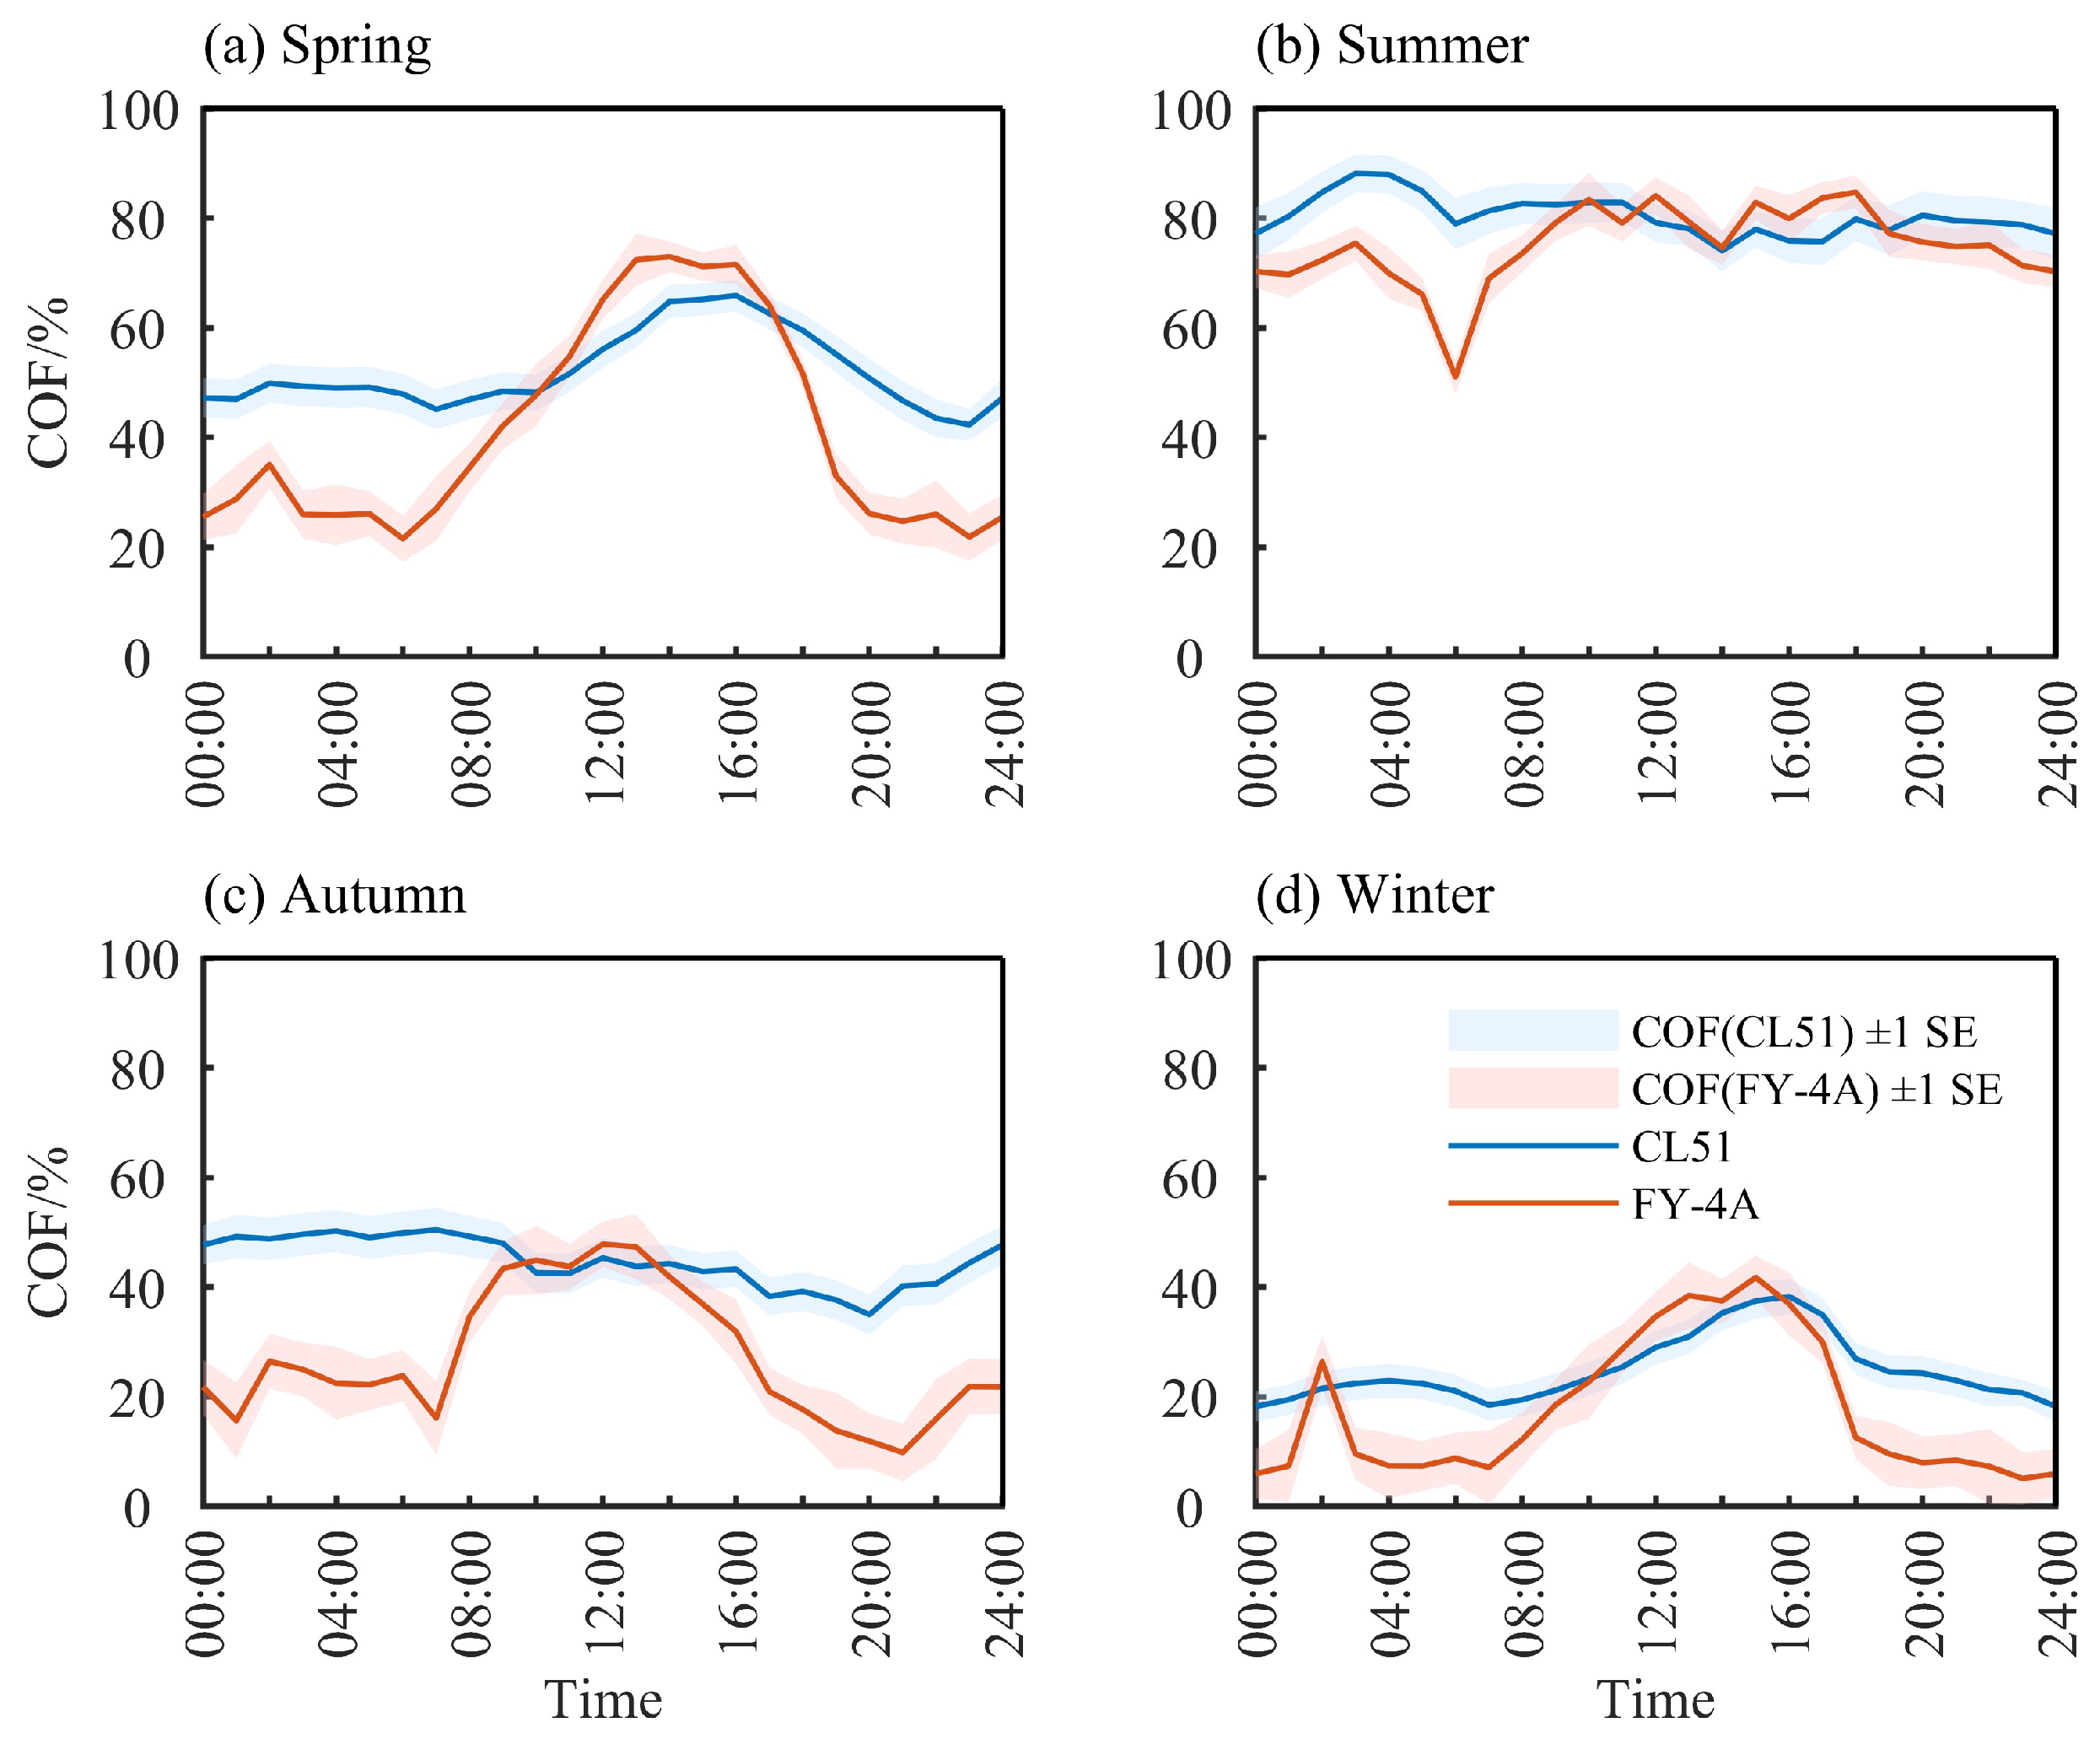
To study the seasonal characteristics of COF in detail, the diurnal variation in COF for each season was analyzed (Figure 5). The results from both instruments agreed well during the day, but the satellite’s COF was consistently lower than the CL51 at night. The largest diurnal variation in COF occurred in spring, with the CL51 showing a variation range of 40–65% and the satellite showing a range of 20–75%. The smallest diurnal variation occurred in summer and autumn. The diurnal trends in spring and winter were similar, as were those in summer and autumn. At LHAASO, winter and spring are dry seasons with limited moisture, resulting in more clouds during the day and fewer at night. In contrast, summer and autumn exhibit the opposite pattern. In spring and winter, COF was lowest before sunrise, increased after sunrise, peaked at 16:00 LST, remained high until sunset, and then decreased. The CL51 observed that autumn COF began to rise at 20:00 LST, remained high at night, peaked at 08:00 LST the next morning (Figure 5c, 50.3%), and then gradually decreased to its lowest value at 20:00 LST (Figure 5c, 34.6%). Summer COF showed pre-dawn minima but maintained persistently high values otherwise. Cloud mostly occurred from midnight to early morning, likely due to the combined effects of local diurnal circulation driven by topographic heating and the South Asian summer monsoon. FY-4A observations showed that spring and summer COF increased slowly after sunrise, peaked, and then decreased rapidly, while in summer and autumn, COF increased rapidly after sunrise, peaked, and then decreased slowly.
Figure 5.
Diurnal cycle of COF in four seasons, derived from CL51 (blue line) and FY-4A (orange line). Shaded areas represent one standard error. (a) Spring, (b) summer, (c) autumn, (d) winter.
3.2. Cloud Vertical Structure
Cloud vertical structures (CVSs) includes CBHs, CTHs, and the frequency distribution of single-layer, multi-layer, and aggregated cloud layers, as well as the spacing between cloud bases [19,28]. Clouds at different vertical levels can influence atmospheric circulation by altering the overall adiabatic heating/cooling gradient [29].
3.2.1. CBHs and CTHs
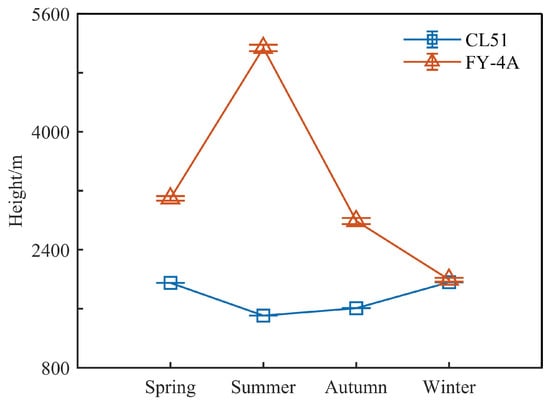
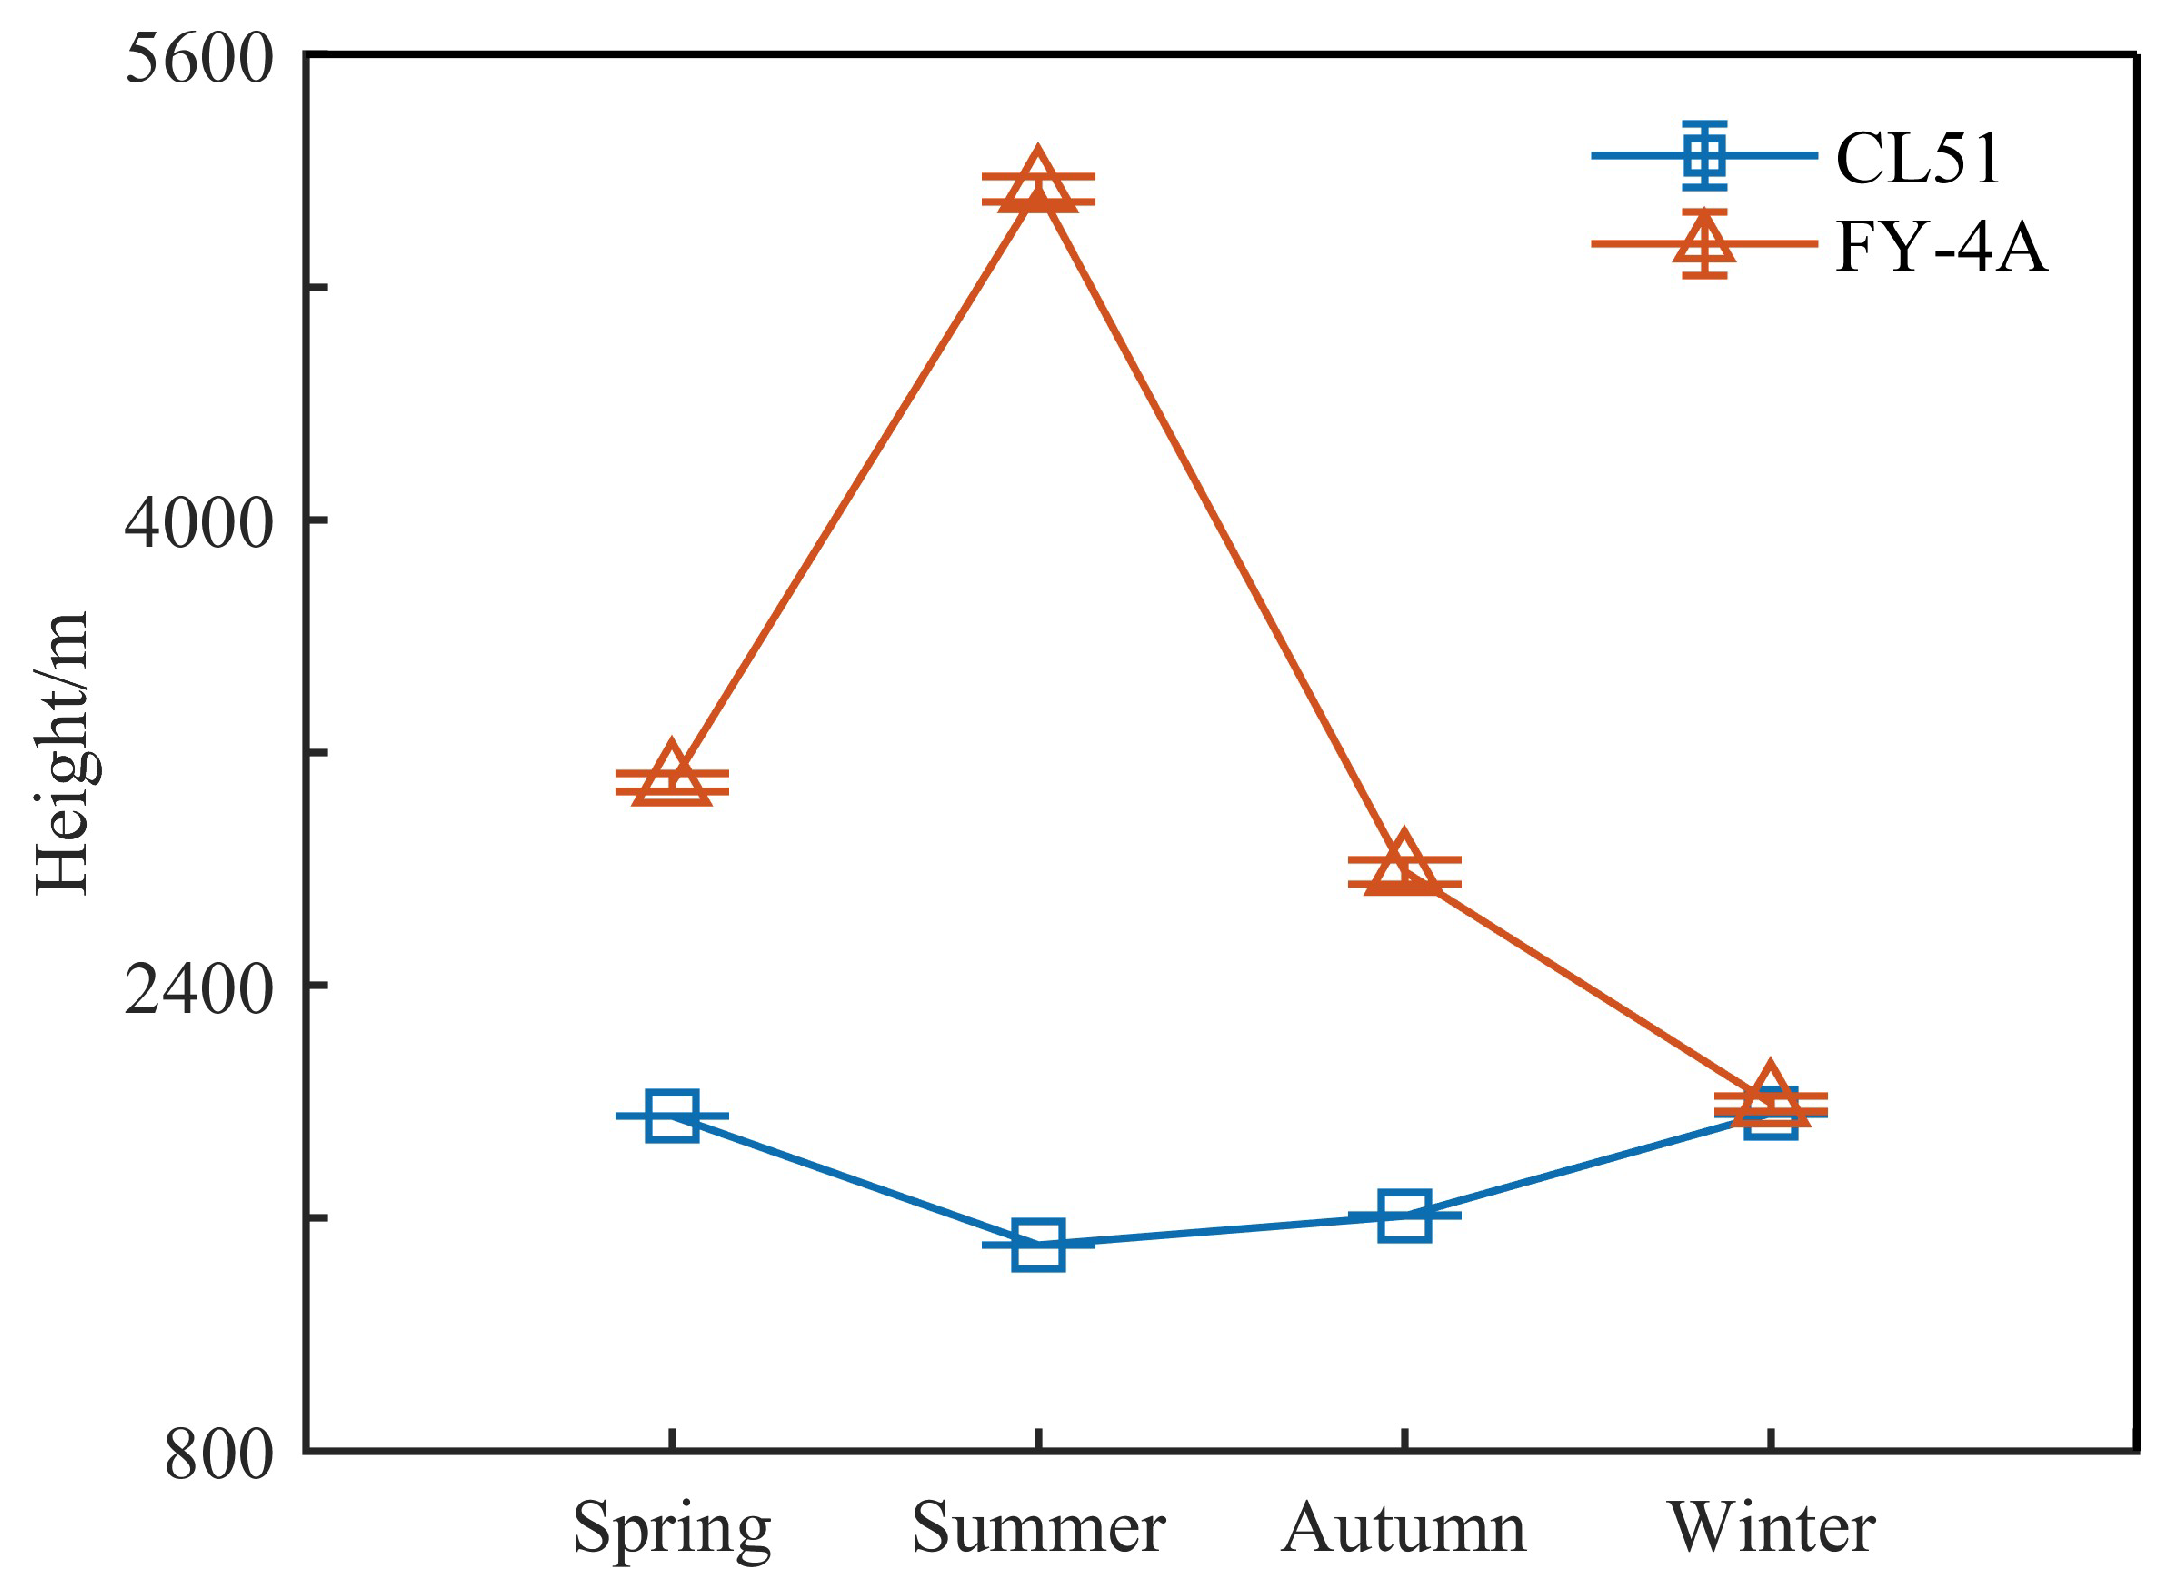
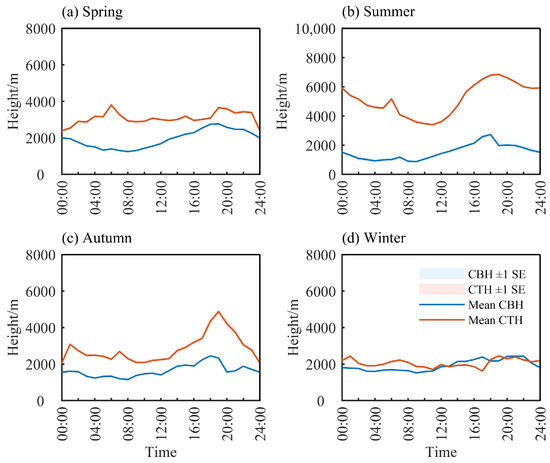
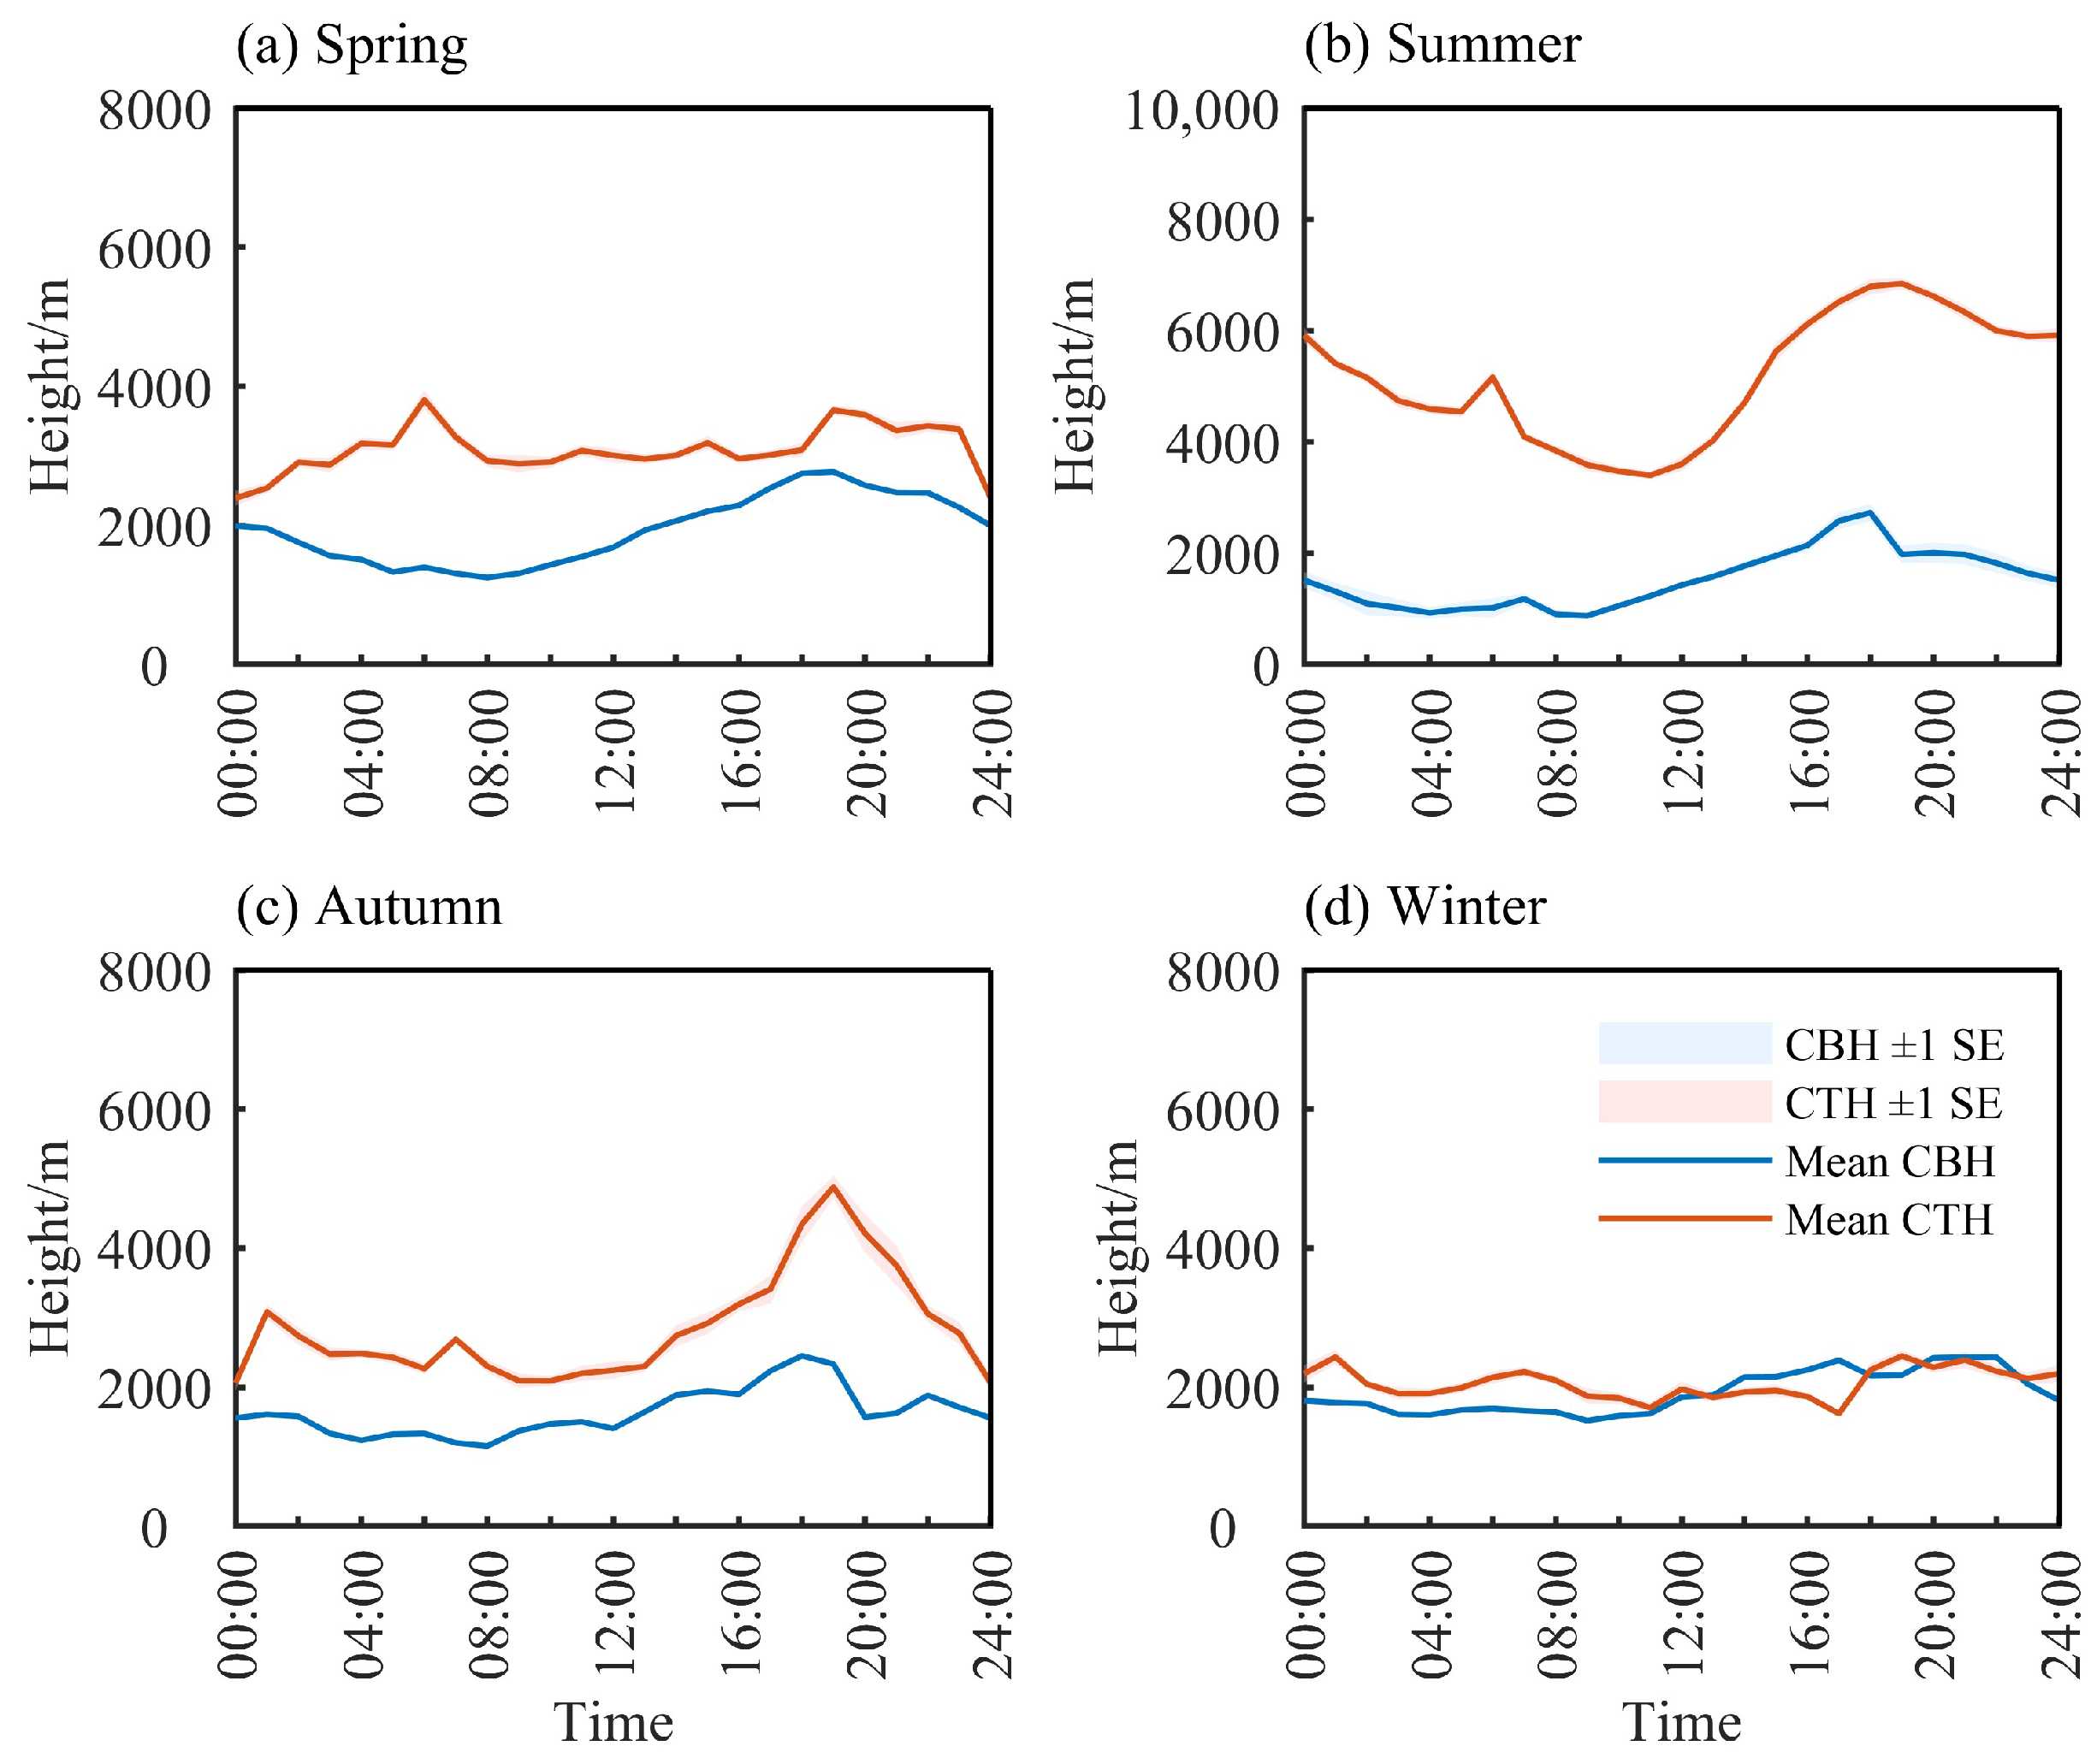
The CBHs refers to the height of the base of the first cloud layer. Seasonally, the average CBH was lowest in summer and higher in spring and winter (Figure 6), consistent with the seasonal variation in cloud height over the TP reported by Li et al. [30]. CTH was highest in summer, indicating strong convection and frequent precipitation clouds, which can develop to greater heights. The CTHs in Winter was the lowest and very close to the average CBH, suggesting thinner cloud layers in winter.
Figure 6.
Seasonal distributions of mean CTH (FY-4A; orange triangles) and cloud base height (CBH, from CL51; blue squares). Error bars indicate ±1 standard error of the mean.
The diurnal variation in CBH and CTH was similar across seasons (Figure 7). From 00:00 to 08:00 LST, CBH gradually decreased, primarily due to cooling of the atmosphere and surface and reduced convective activity. From 08:00 to 18:00 LST, solar radiation increased, warming the surface and atmosphere and causing CBH and CTH to rise. Convective activity was also more active during this period. From 18:00 to 24:00 LST, after sunset, atmospheric cooling suppressed vertical motion, leading to lower CBH and CTH. Zheng et al. [31] reported similar diurnal variations in CBH over Naqu in the central TP. In summer, CTH exceeded 6 km after 12:00 LST (Figure 7b), indicating frequent deep convective clouds in the afternoon. Notably, from 05:00 to 06:00 LST, CTH increased sharply and then decreased. Overall, CTH varied more significantly than CBH, indicating that convective activity has a greater impact on CTH than thermal radiation does on CBH. We also note the phenomenon that CTH is lower than CBH in winter. Since the cloud-top height algorithm of FY-4A is temperature-dependent, lower winter temperatures and relatively drier atmospheric conditions during this season typically inhibit the development of thick cloud layers, which may affect detection accuracy. When the LHAASO altitude (4410 m) is subtracted from the satellite-derived CTH, this value can be slightly underestimated, thereby leading to the observed CTH < CBH pattern.
Figure 7.
Diurnal cycle of CBH (blue line) and CTH (orange line) in four seasons. The shaded areas (representing one standard error) are not visible due to the small scale of the graph. (a) Spring, (b) summer, (c) autumn, (d) winter.
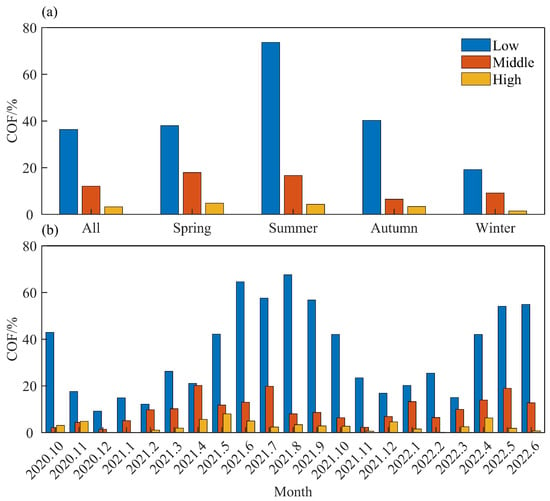
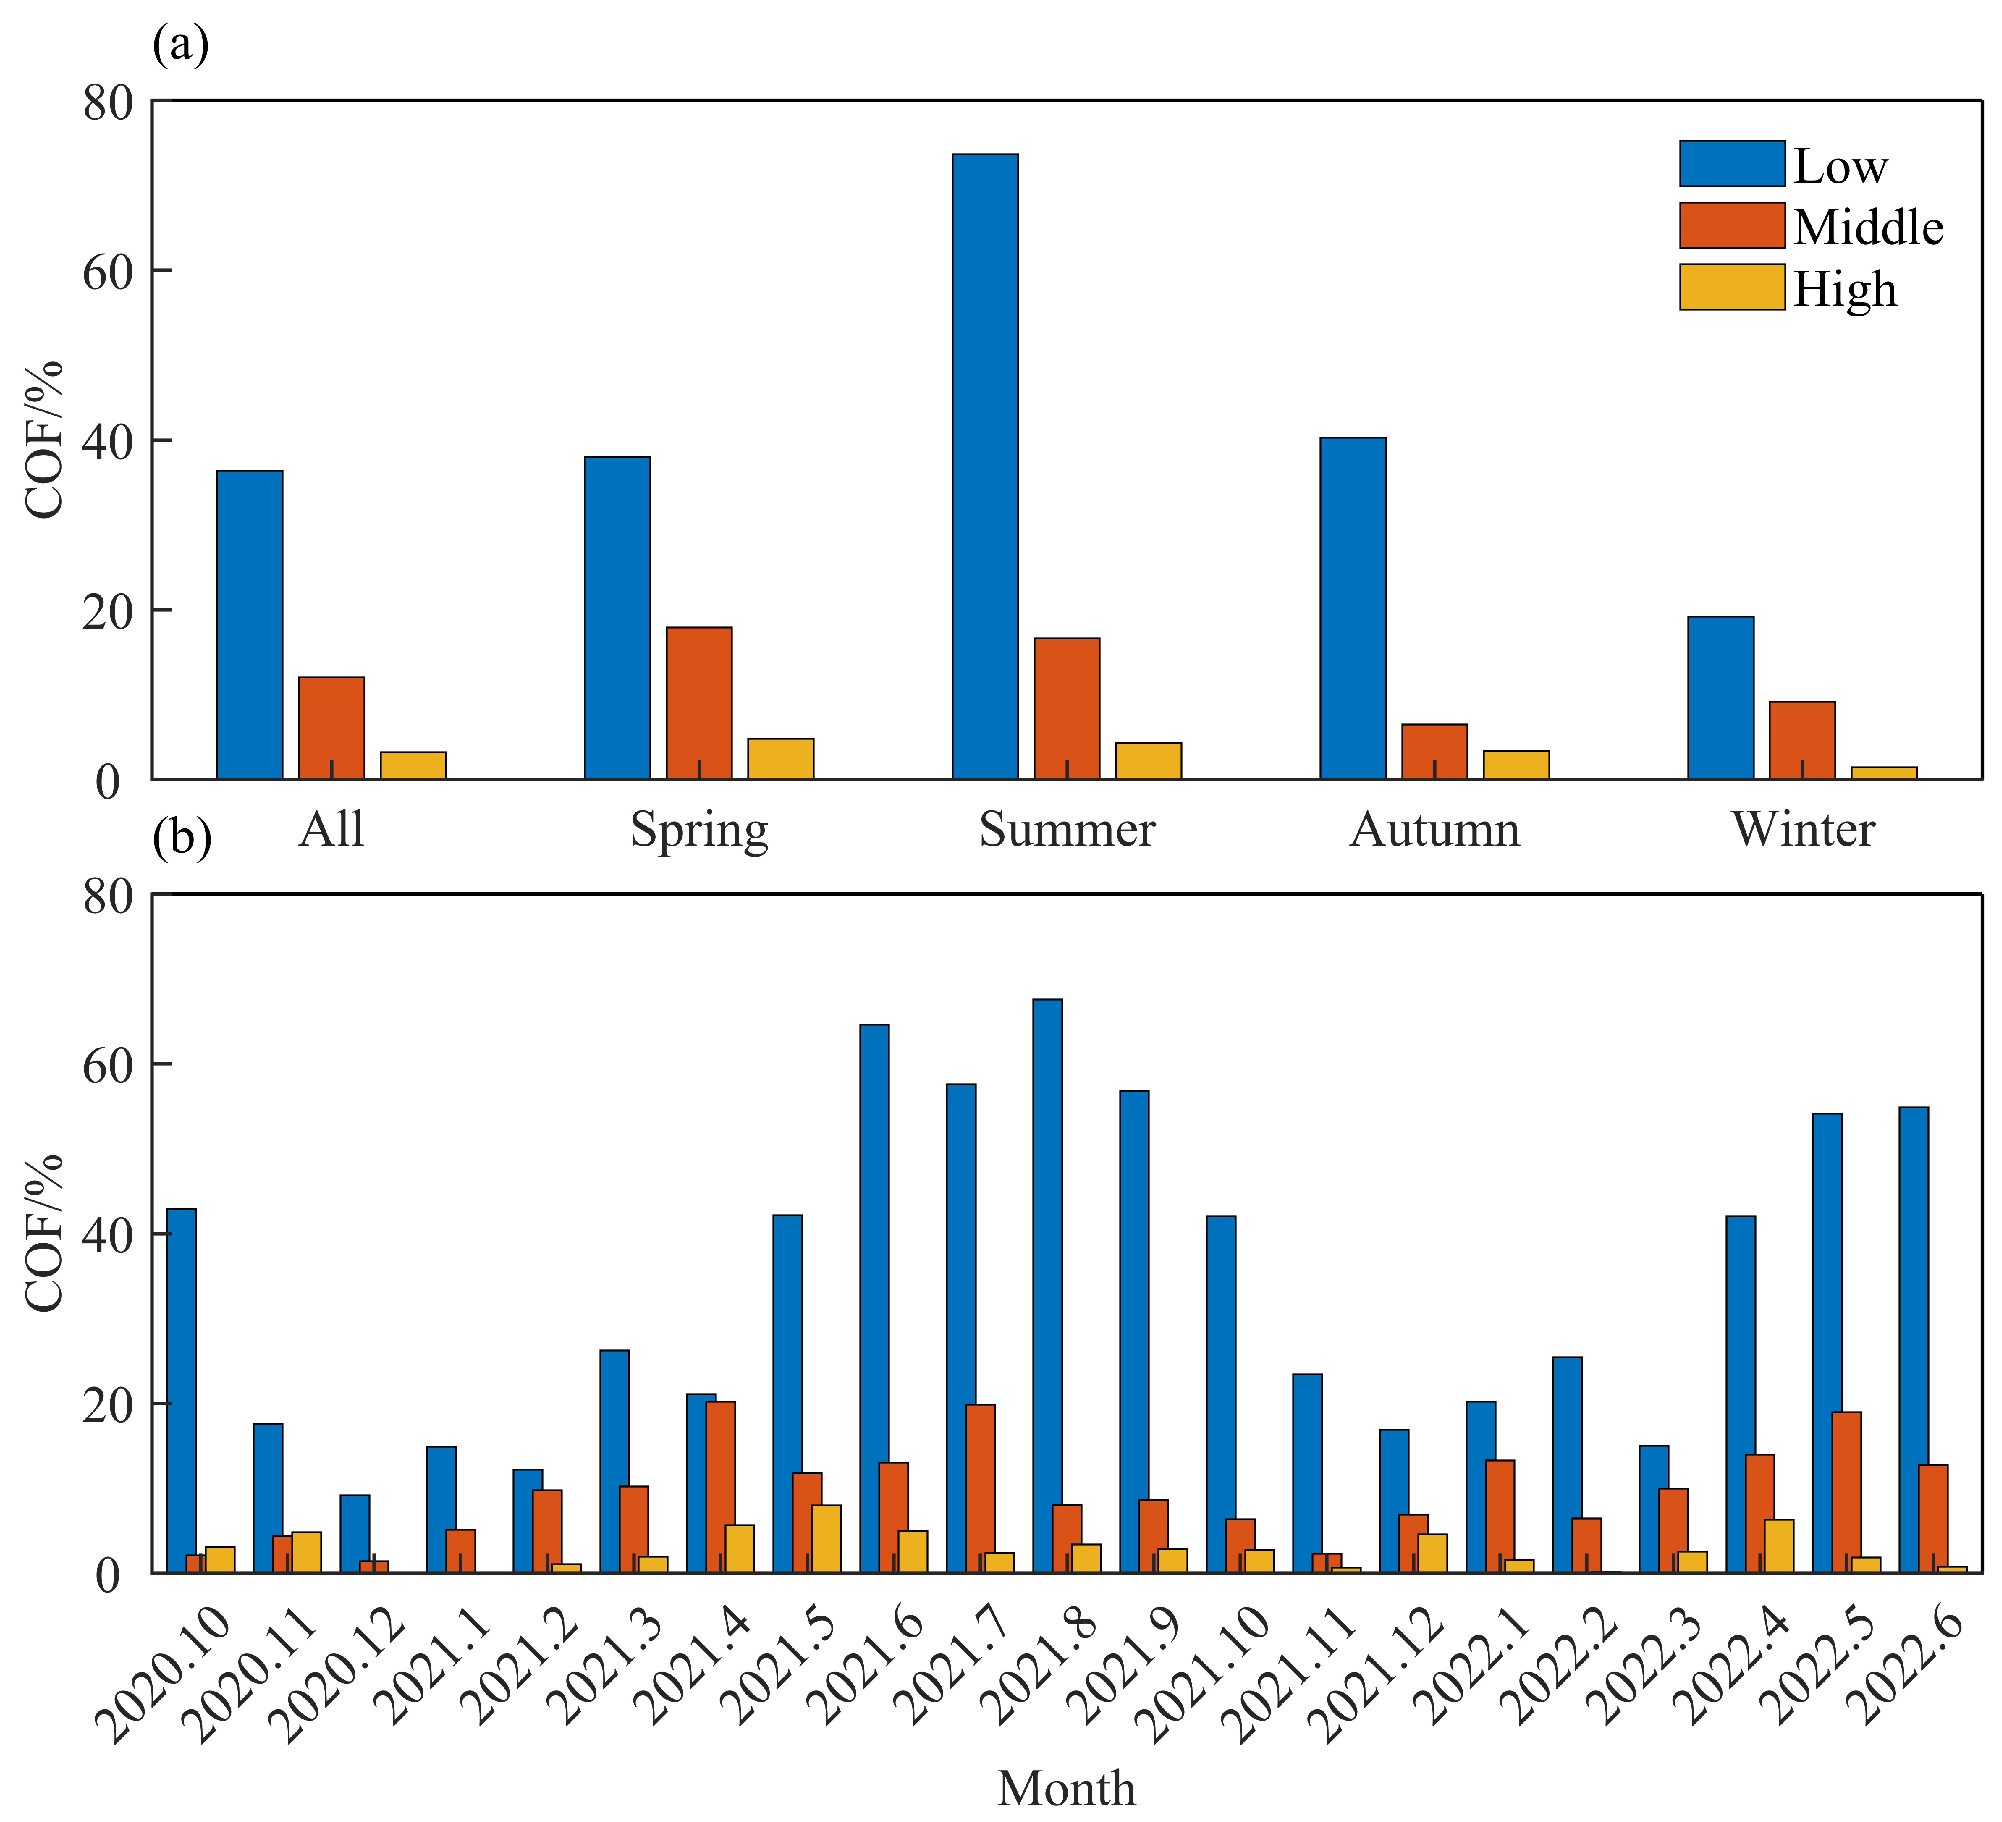
Clouds can be classified into low (CBH ≤ 2000 m), medium (2000 m < CBH ≤ 5000 m), and high clouds (CBH > 5000 m) based on CBH. The annual average COF for low, medium, and high clouds observed by the CL51 was 36.4%, 12.1%, and 3.3%, respectively (Figure 8a). Low clouds had the highest COF, followed by medium clouds, while high clouds had the lowest COF. The COF of different cloud types exhibited clear seasonal characteristics. Low clouds were most frequent in summer (73.6%, CL51) and least frequent in winter (19.2%, CL51). Medium clouds were slightly more frequent in spring (17.9%, CL51) than in summer, with the lowest frequency in autumn (6.5%, CL51). High clouds were least frequent in all seasons, with the highest frequency in spring (4.8%, CL51). During the observation period (Figure 8b), low clouds were most frequent in August 2021, medium clouds were more frequent in April and July, and high clouds peaked in May. The relatively high COF of high clouds in December 2021 contributed to the higher high cloud frequency in winter. The significantly different COF of low and medium clouds in April 2021 compared to other months, especially April 2022, may be due to strong convective activity in April 2021. Overall, medium and low clouds dominated the cloud structure at LHAASO, similar to the cloud structures in Motuo and the southeastern coastal regions of China [13,32], but different from the Taklamakan Desert in northwestern China, where medium and high clouds dominate. This discrepancy likely arises from contrasting moisture regimes: abundant advection in Daocheng and Motuo versus arid conditions in the Taklamakan Desert, while the dry air and high evaporation rates in the desert make it difficult to form thick cloud layers and precipitation.
Figure 8.
The COF for high (yellow), middle (orange), and low (blue) clouds derived from CL51 is presented for (a) the entire observation period and all seasons and (b) the observation period disaggregated by month.
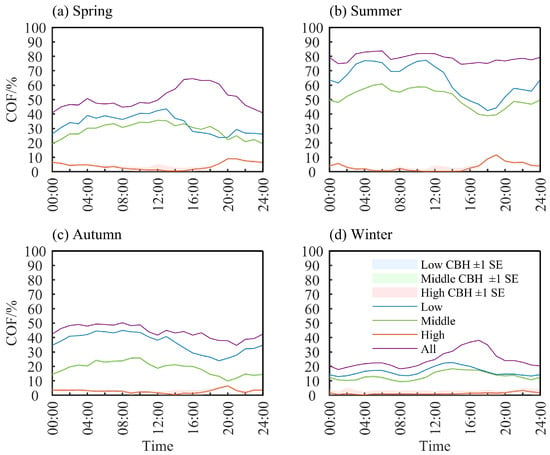
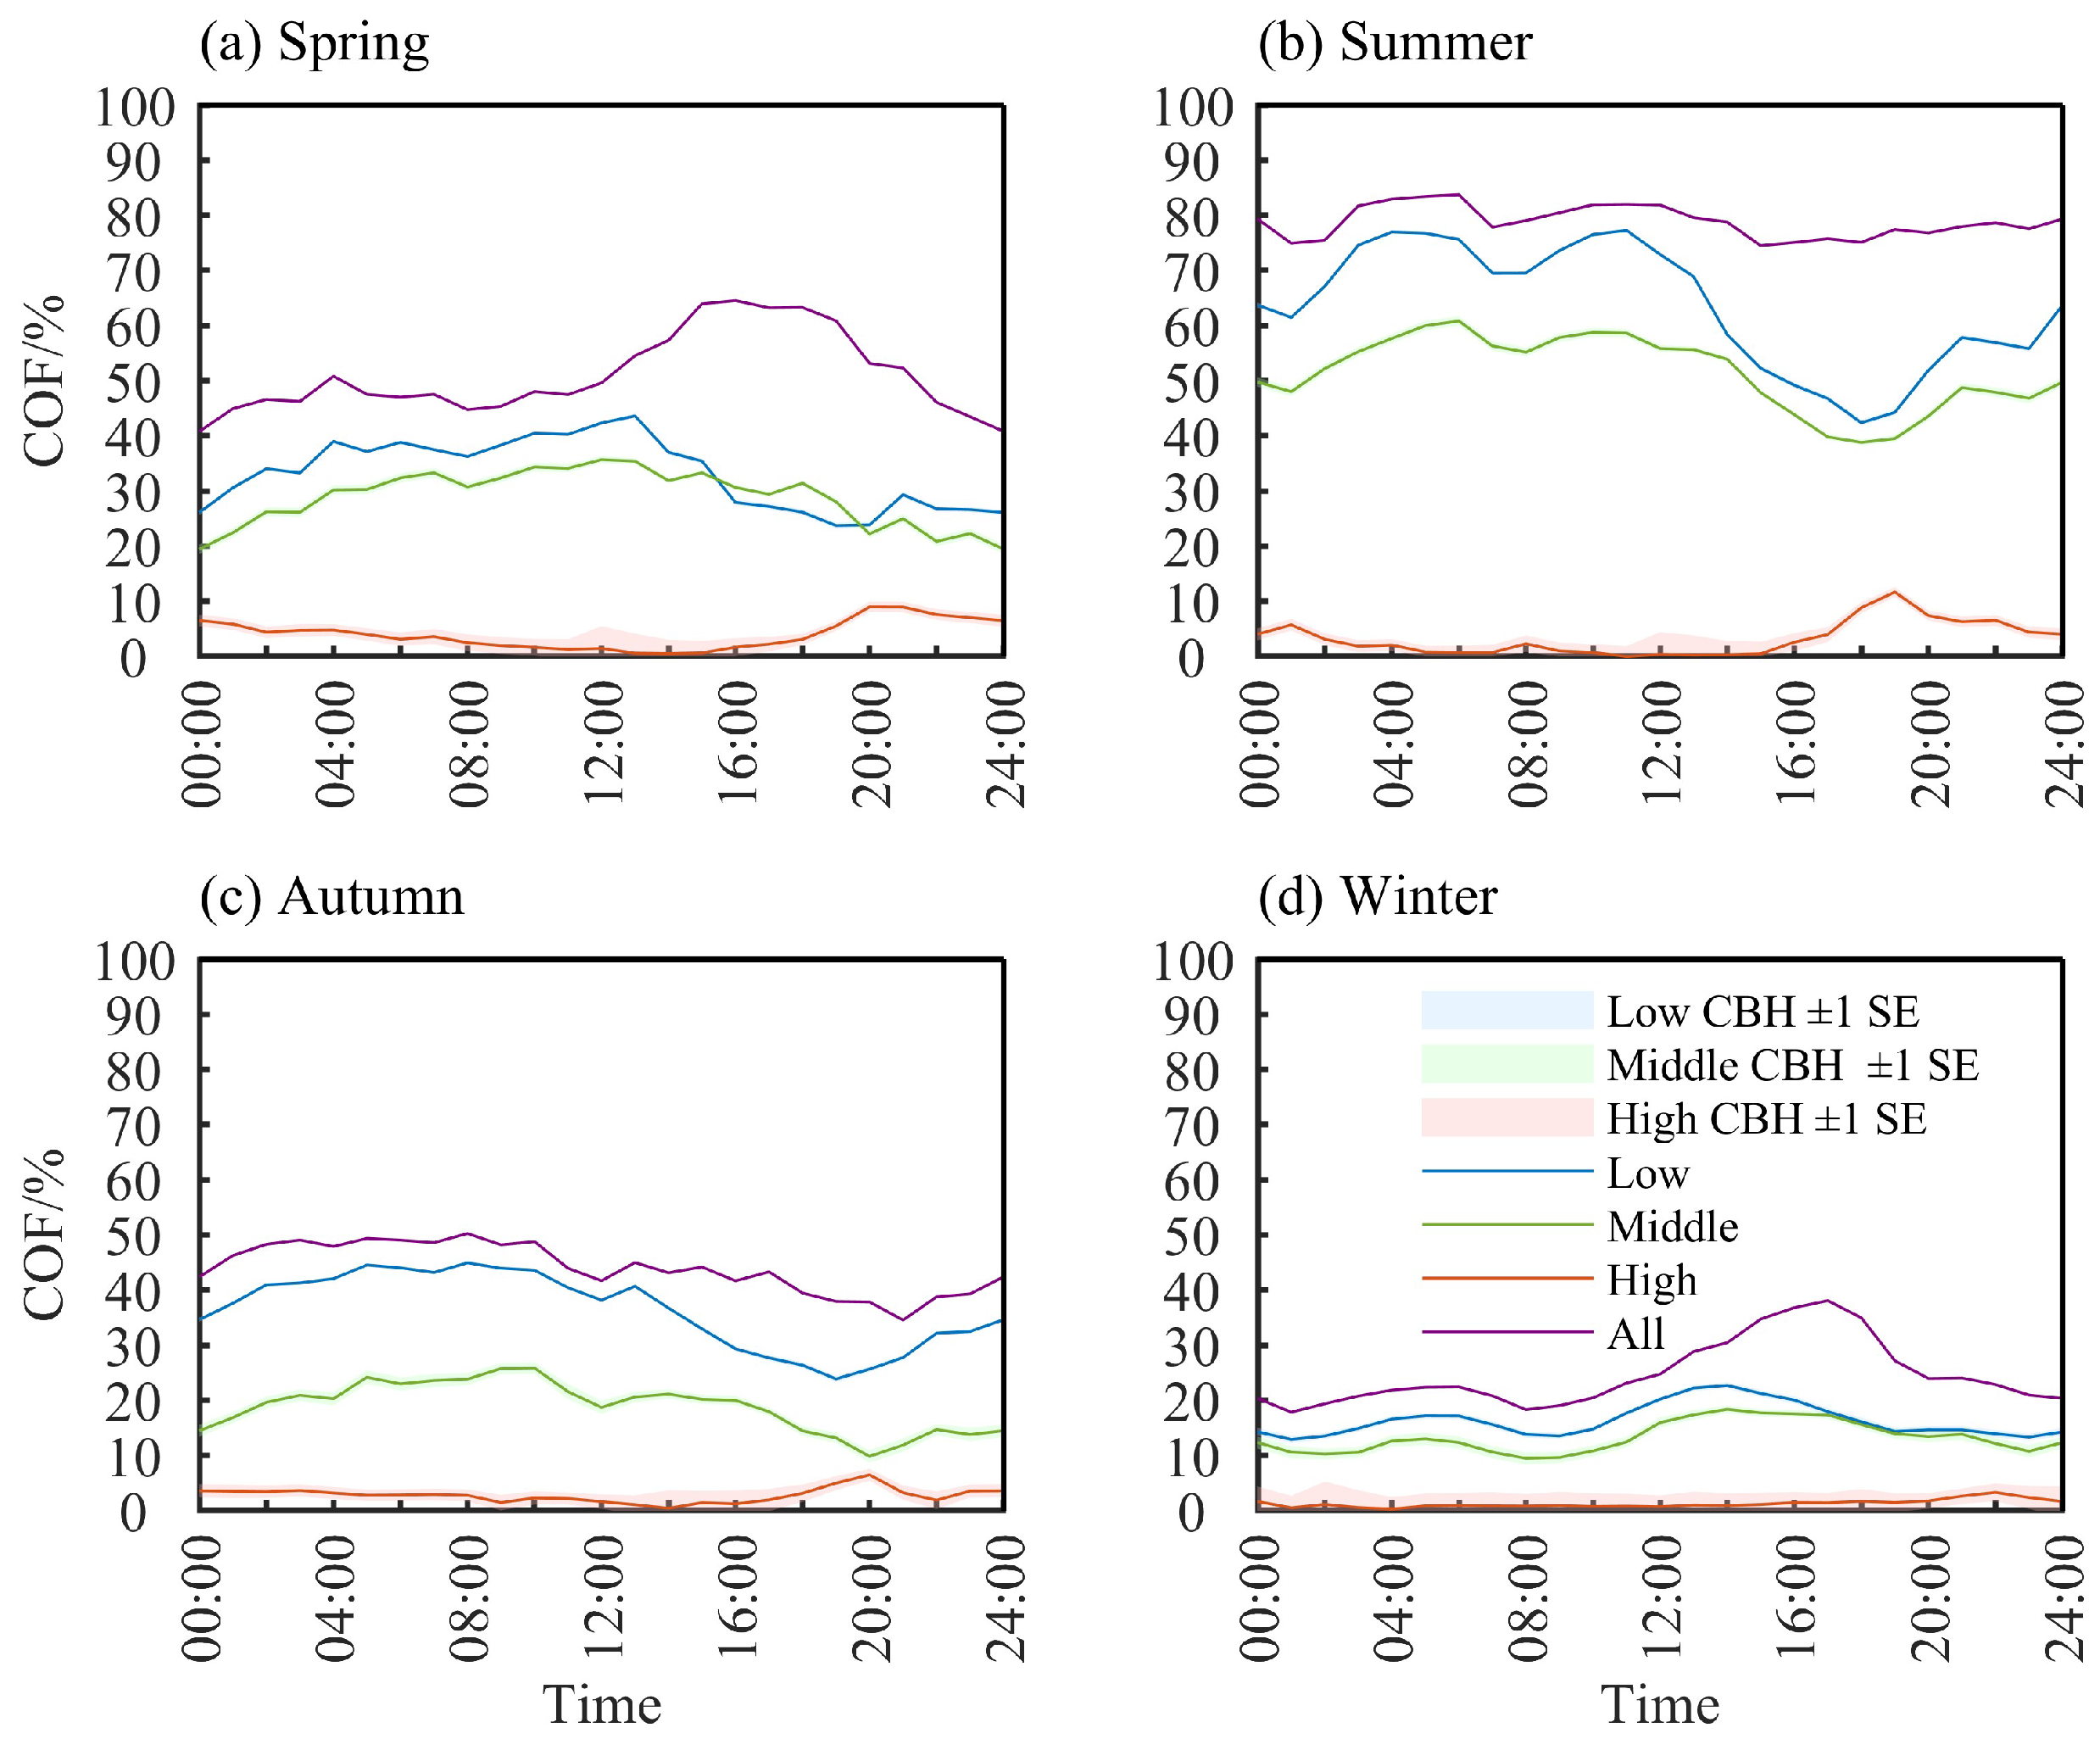
The average diurnal variation in COF for low, medium, and high clouds in different seasons is shown in Figure 9. Similar to the diurnal variation in total CBH, the diurnal variation of different cloud types showed no clear seasonal variation, suggesting that CBH variation is more related to daily atmospheric temperature changes than to seasonal changes. The diurnal trends of low and medium clouds were similar, while high clouds showed the opposite trend. From early morning (03:00–05:00 LST) to noon (11:00–13:00 LST), medium and low clouds were more frequent, while high clouds were rare. Afternoon COF of medium and low clouds gradually decreased, reaching a minimum at 20:00 LST, and then increased again. High-cloud COF gradually increased, peaking around 20:00 LST. This pattern is similar to the diurnal variation of low clouds in central China but differs from that of medium and high clouds [33]. In Wuhan and other regions, low-cloud COF peaks around noon, medium cloud COF is low during the day and high at night, and high cloud COF is high during the day and low at night.
Figure 9.
Diurnal cycle of the occurrence frequencies of high, middle, and low clouds from CL51. The shaded areas (representing one standard error) are not visible due to the small scale of the graph. (a) Spring, (b) summer, (c) autumn, (d) winter.
3.2.2. Cloud Layer Structure
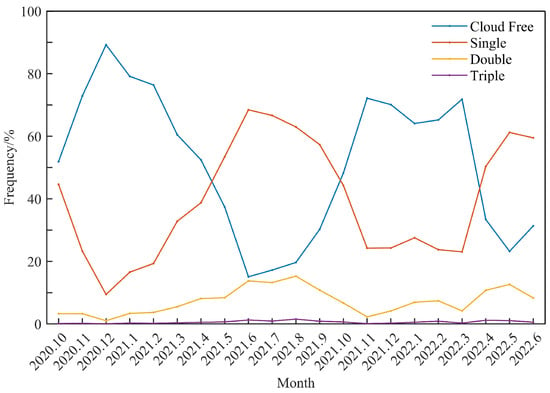
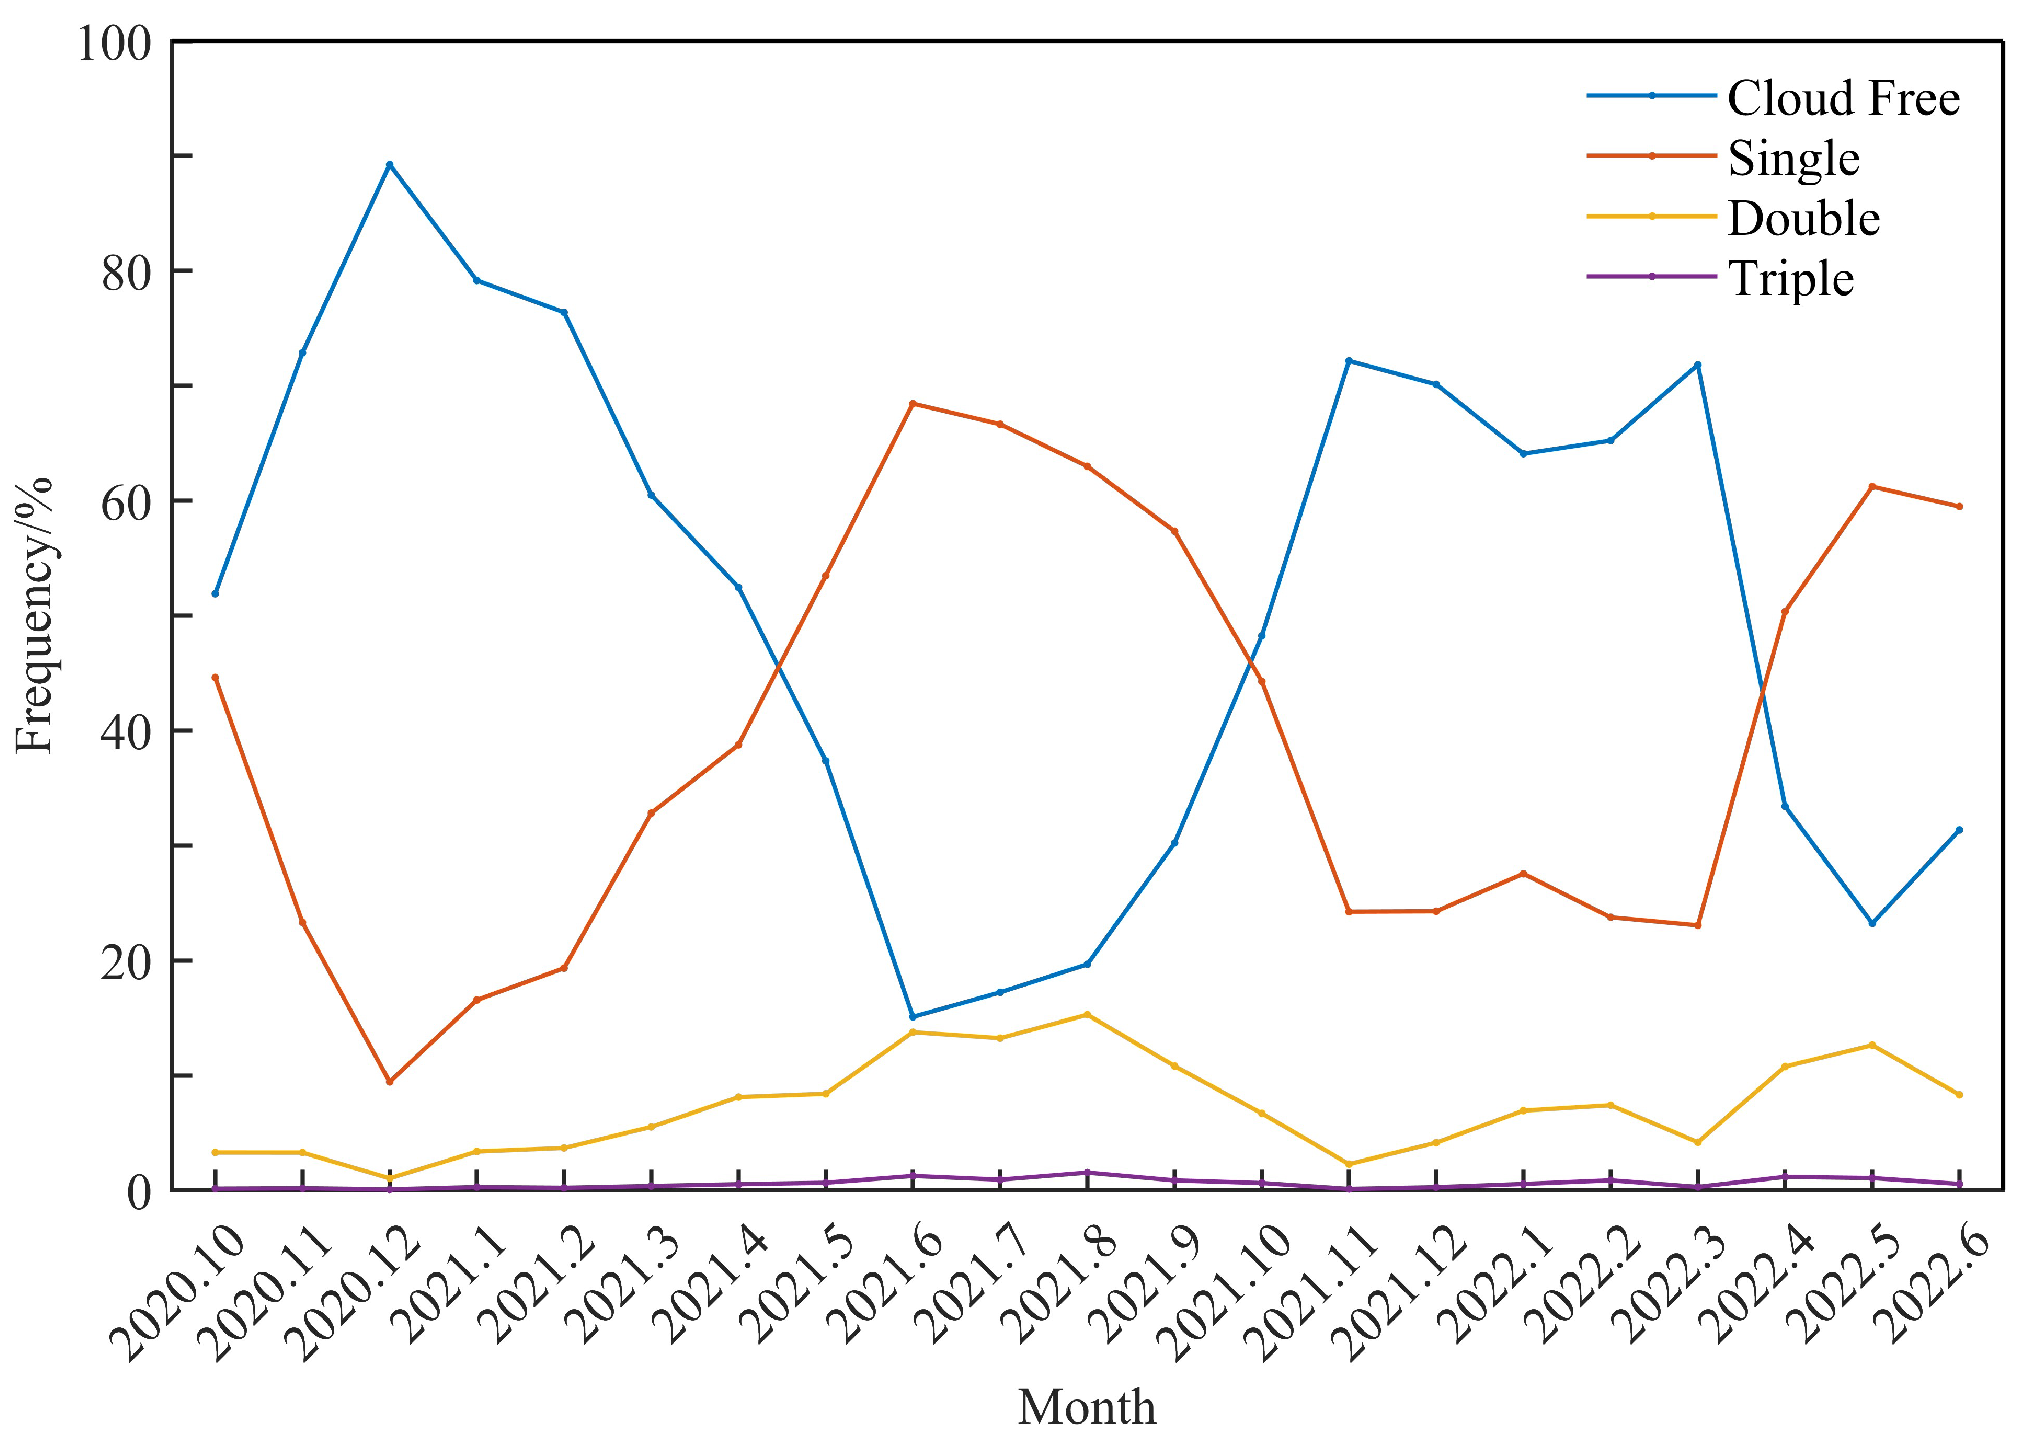
During the observation period, the probability of clear skies at LHAASO was 55% (CL51), and the probability of clouds was 45% (CL51). Among cloudy periods, single-layer clouds accounted for 81% (CL51), double-layer clouds for 15% (CL51), and triple-layer clouds for only 1% (CL51). This reflects the predominance of single-layer clouds, with double-layer clouds as a secondary feature, and very low occurrence of triple-layer or more complex cloud structures at LHAASO.
Monthly cloud layer structure showed similar patterns across different years, with no significant interannual variation but clear seasonal characteristics (Figure 10). Winter had the highest probability of clear skies, while cloud layer complexity increased in spring. Summer had the highest occurrence of both single-layer and multi-layer clouds and the lowest probability of clear skies. In autumn, the probability of clear skies gradually increased, and cloud layer complexity decreased. This is due to strong convective activity in summer, resulting in more complex cloud structures and higher average cloud layer numbers compared to other seasons.
Figure 10.
Distribution of cloud free (blue), single-layer (orange), double-layer (yellow) and triple-layer (purple) during observation.
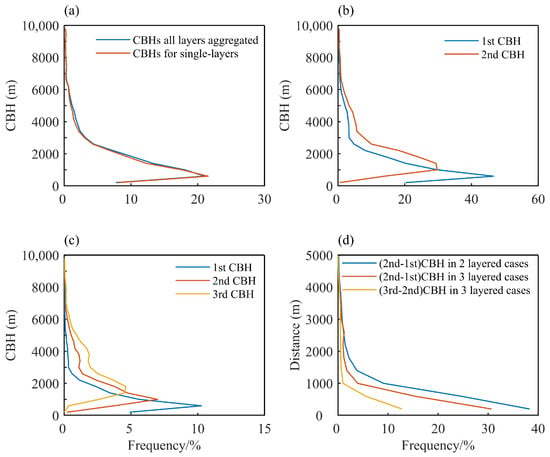
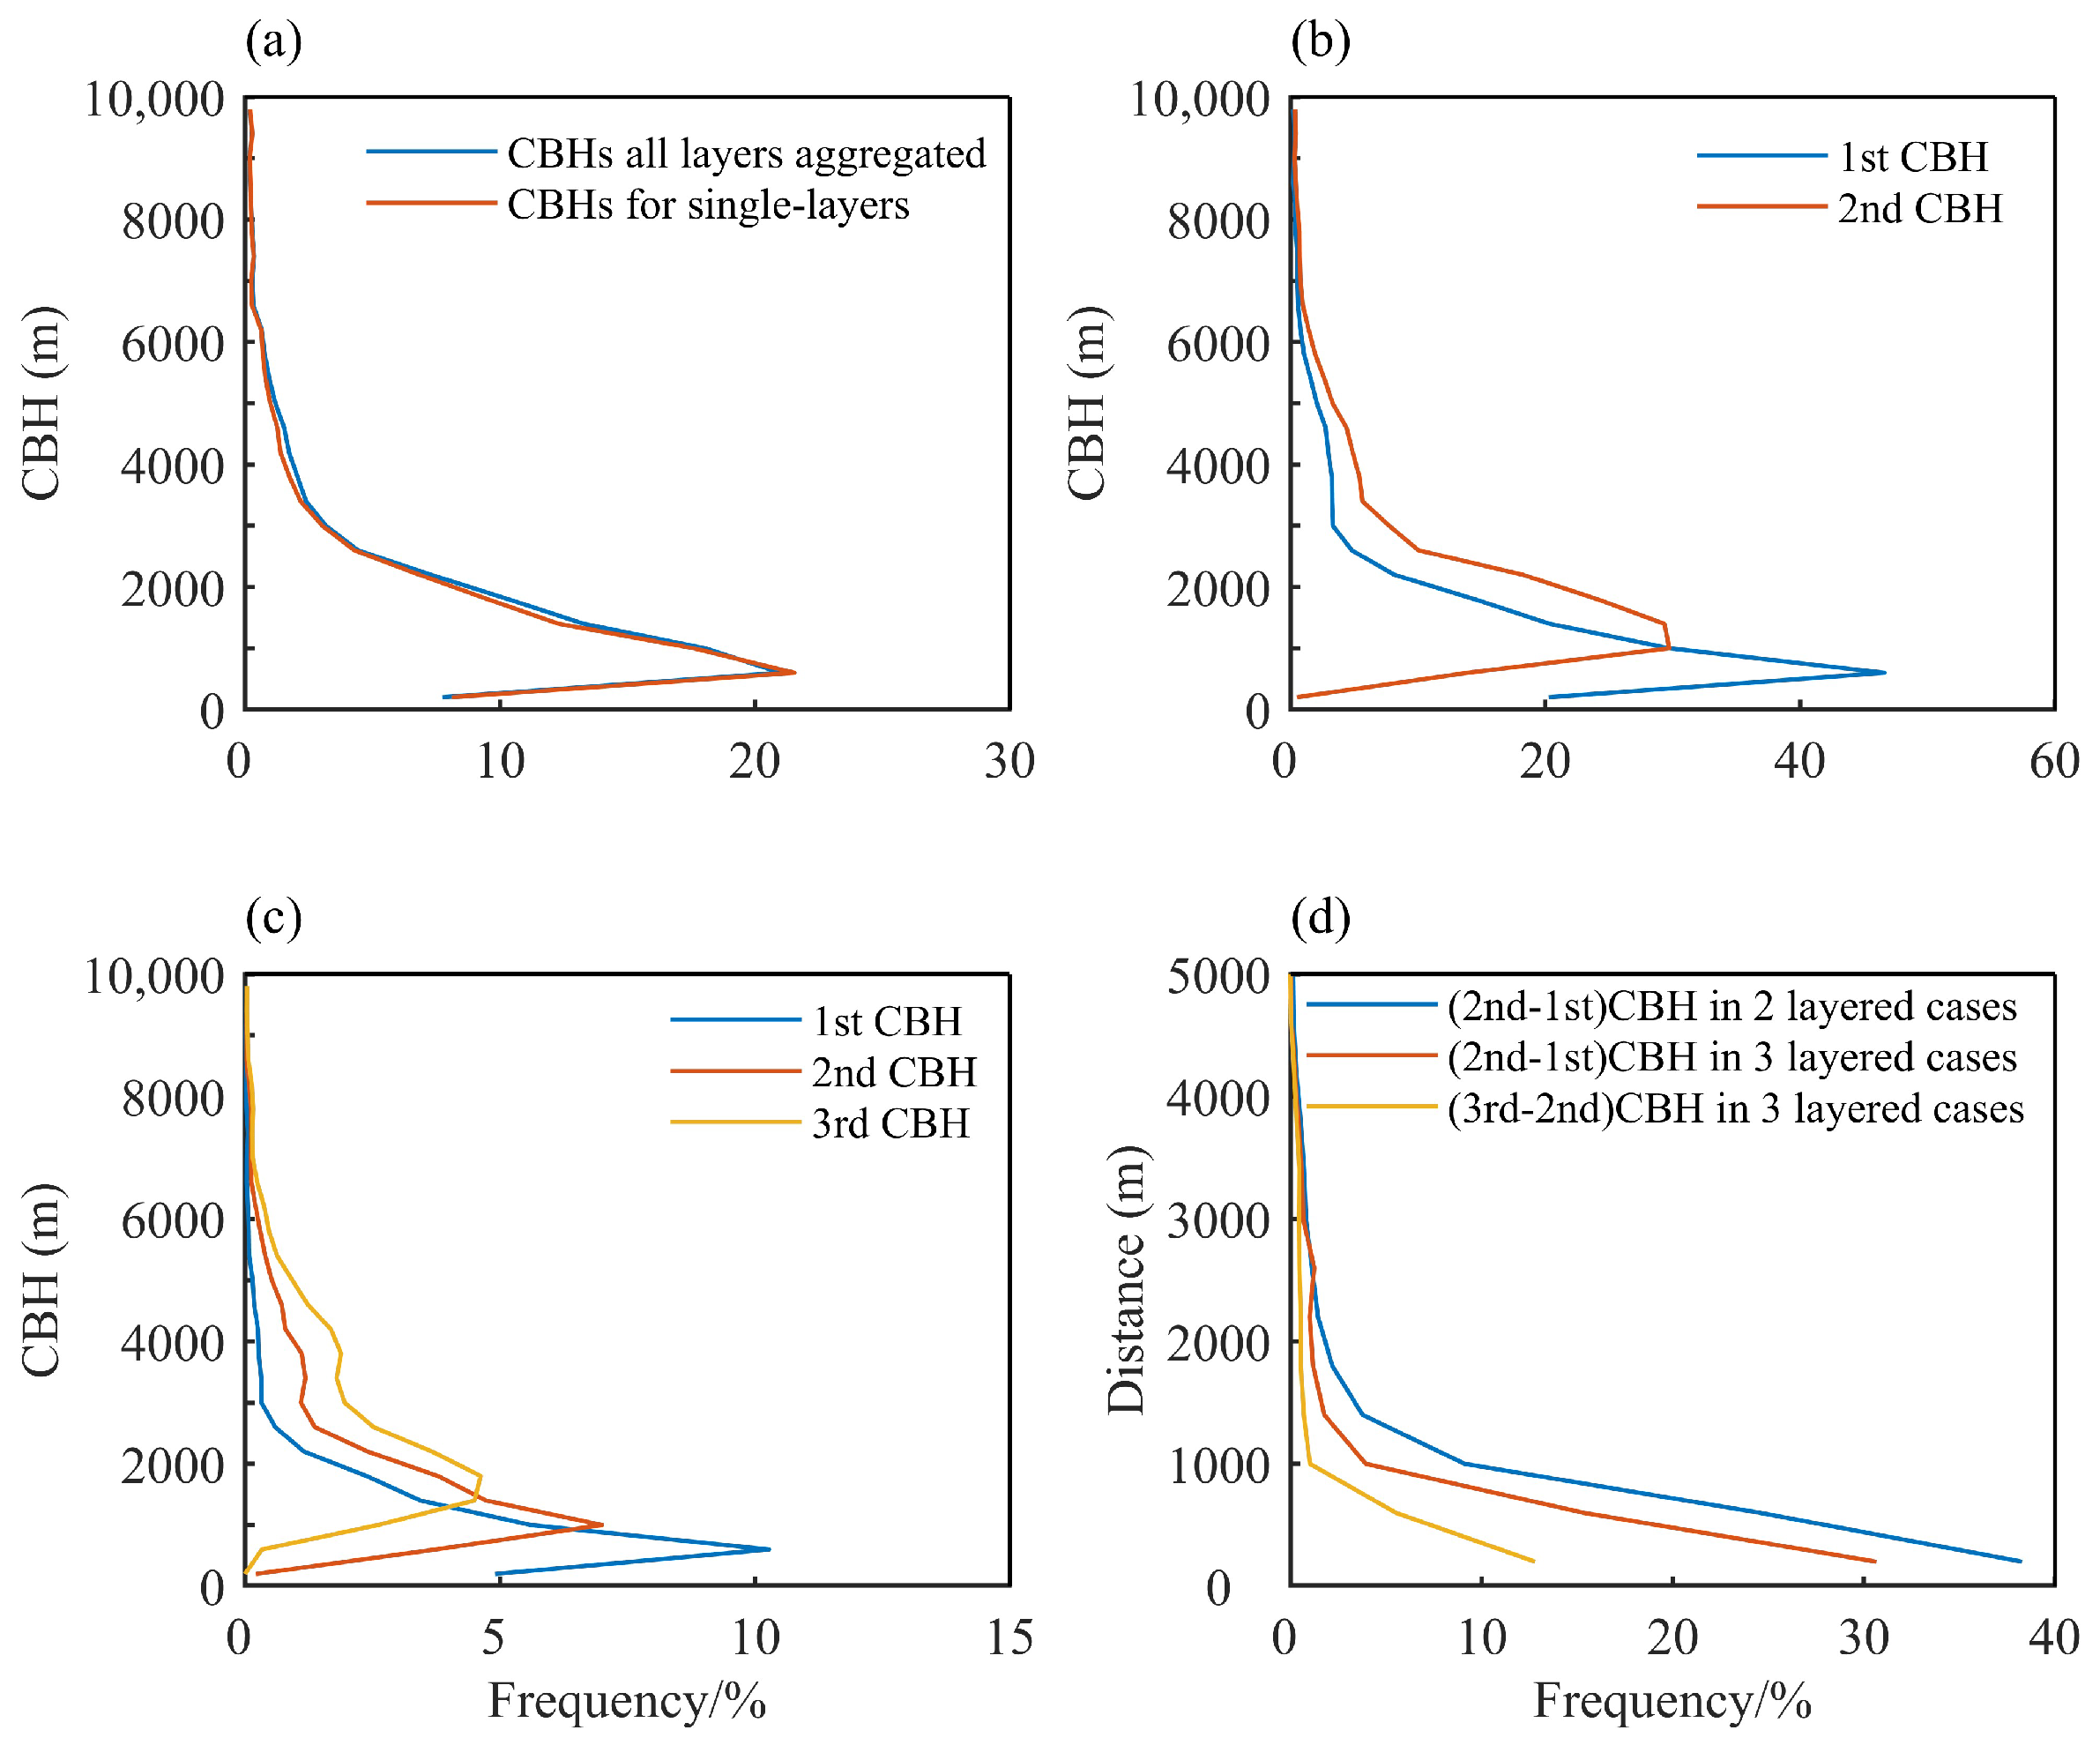
Figure 11 displays the frequency distribution of CBH during the observation period. About 70.43% of CBH values are below 2000 m, according to the distribution of CBHs for all cloud levels (0–10,000 m) (blue line in Figure 11a). The distribution is unimodal, with the highest frequency between 400 m and 800 m. The relatively low CBH peak may be related to the warm and moist air at LHAASO, leading to a relatively low lifting condensation level. The distribution of CBHs for single-layer systems (orange line in Figure 11a) is similar to that of all layers, with the highest frequency between 400 m and 800 m. For double-layer systems (Figure 11b), the CBHs of the lower layer peaks between 400 m and 800 m, while the upper layer peaks between 800 m and 1200 m. For triple-layer systems (Figure 11c), the lowest layer has a unimodal distribution with a peak between 400 m and 800 m, the middle layer has a bimodal distribution with peaks between 800–1200 m and 3200–3600 m, and the highest layer has peaks between 1600–2000 m and 3600–4000 m. For multi-layer systems, the distance between adjacent CBH values is shown in Figure 11d. The distance distribution for all systems peaks between 0 m and 400 m, with most distances below 1000 m.
Figure 11.
Distributions of CBHs (a) for all found layers aggregated (blue) and when a single layer (orange) is detected. (b) for the lower (blue) and higher (orange) layers when two layers are detected. (c) for the lower (blue), middle (orange) and higher (yellow) layers when three layers are detected. (d) Frequency distributions of the distances between the lower and higher layers when two CBHs are detected (blue), between the lower and middle layers (orange), and middle and higher layers when three CBHs were detected (yellow) with 400 m interval bins.
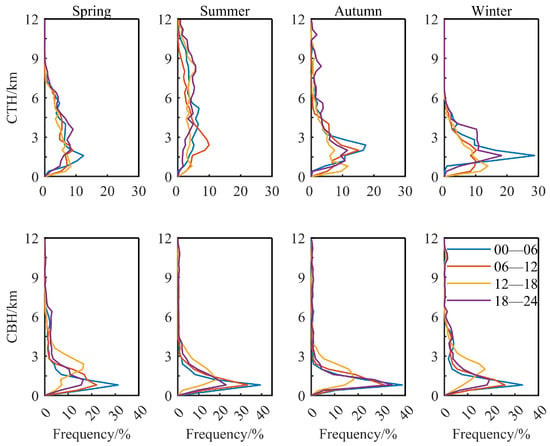
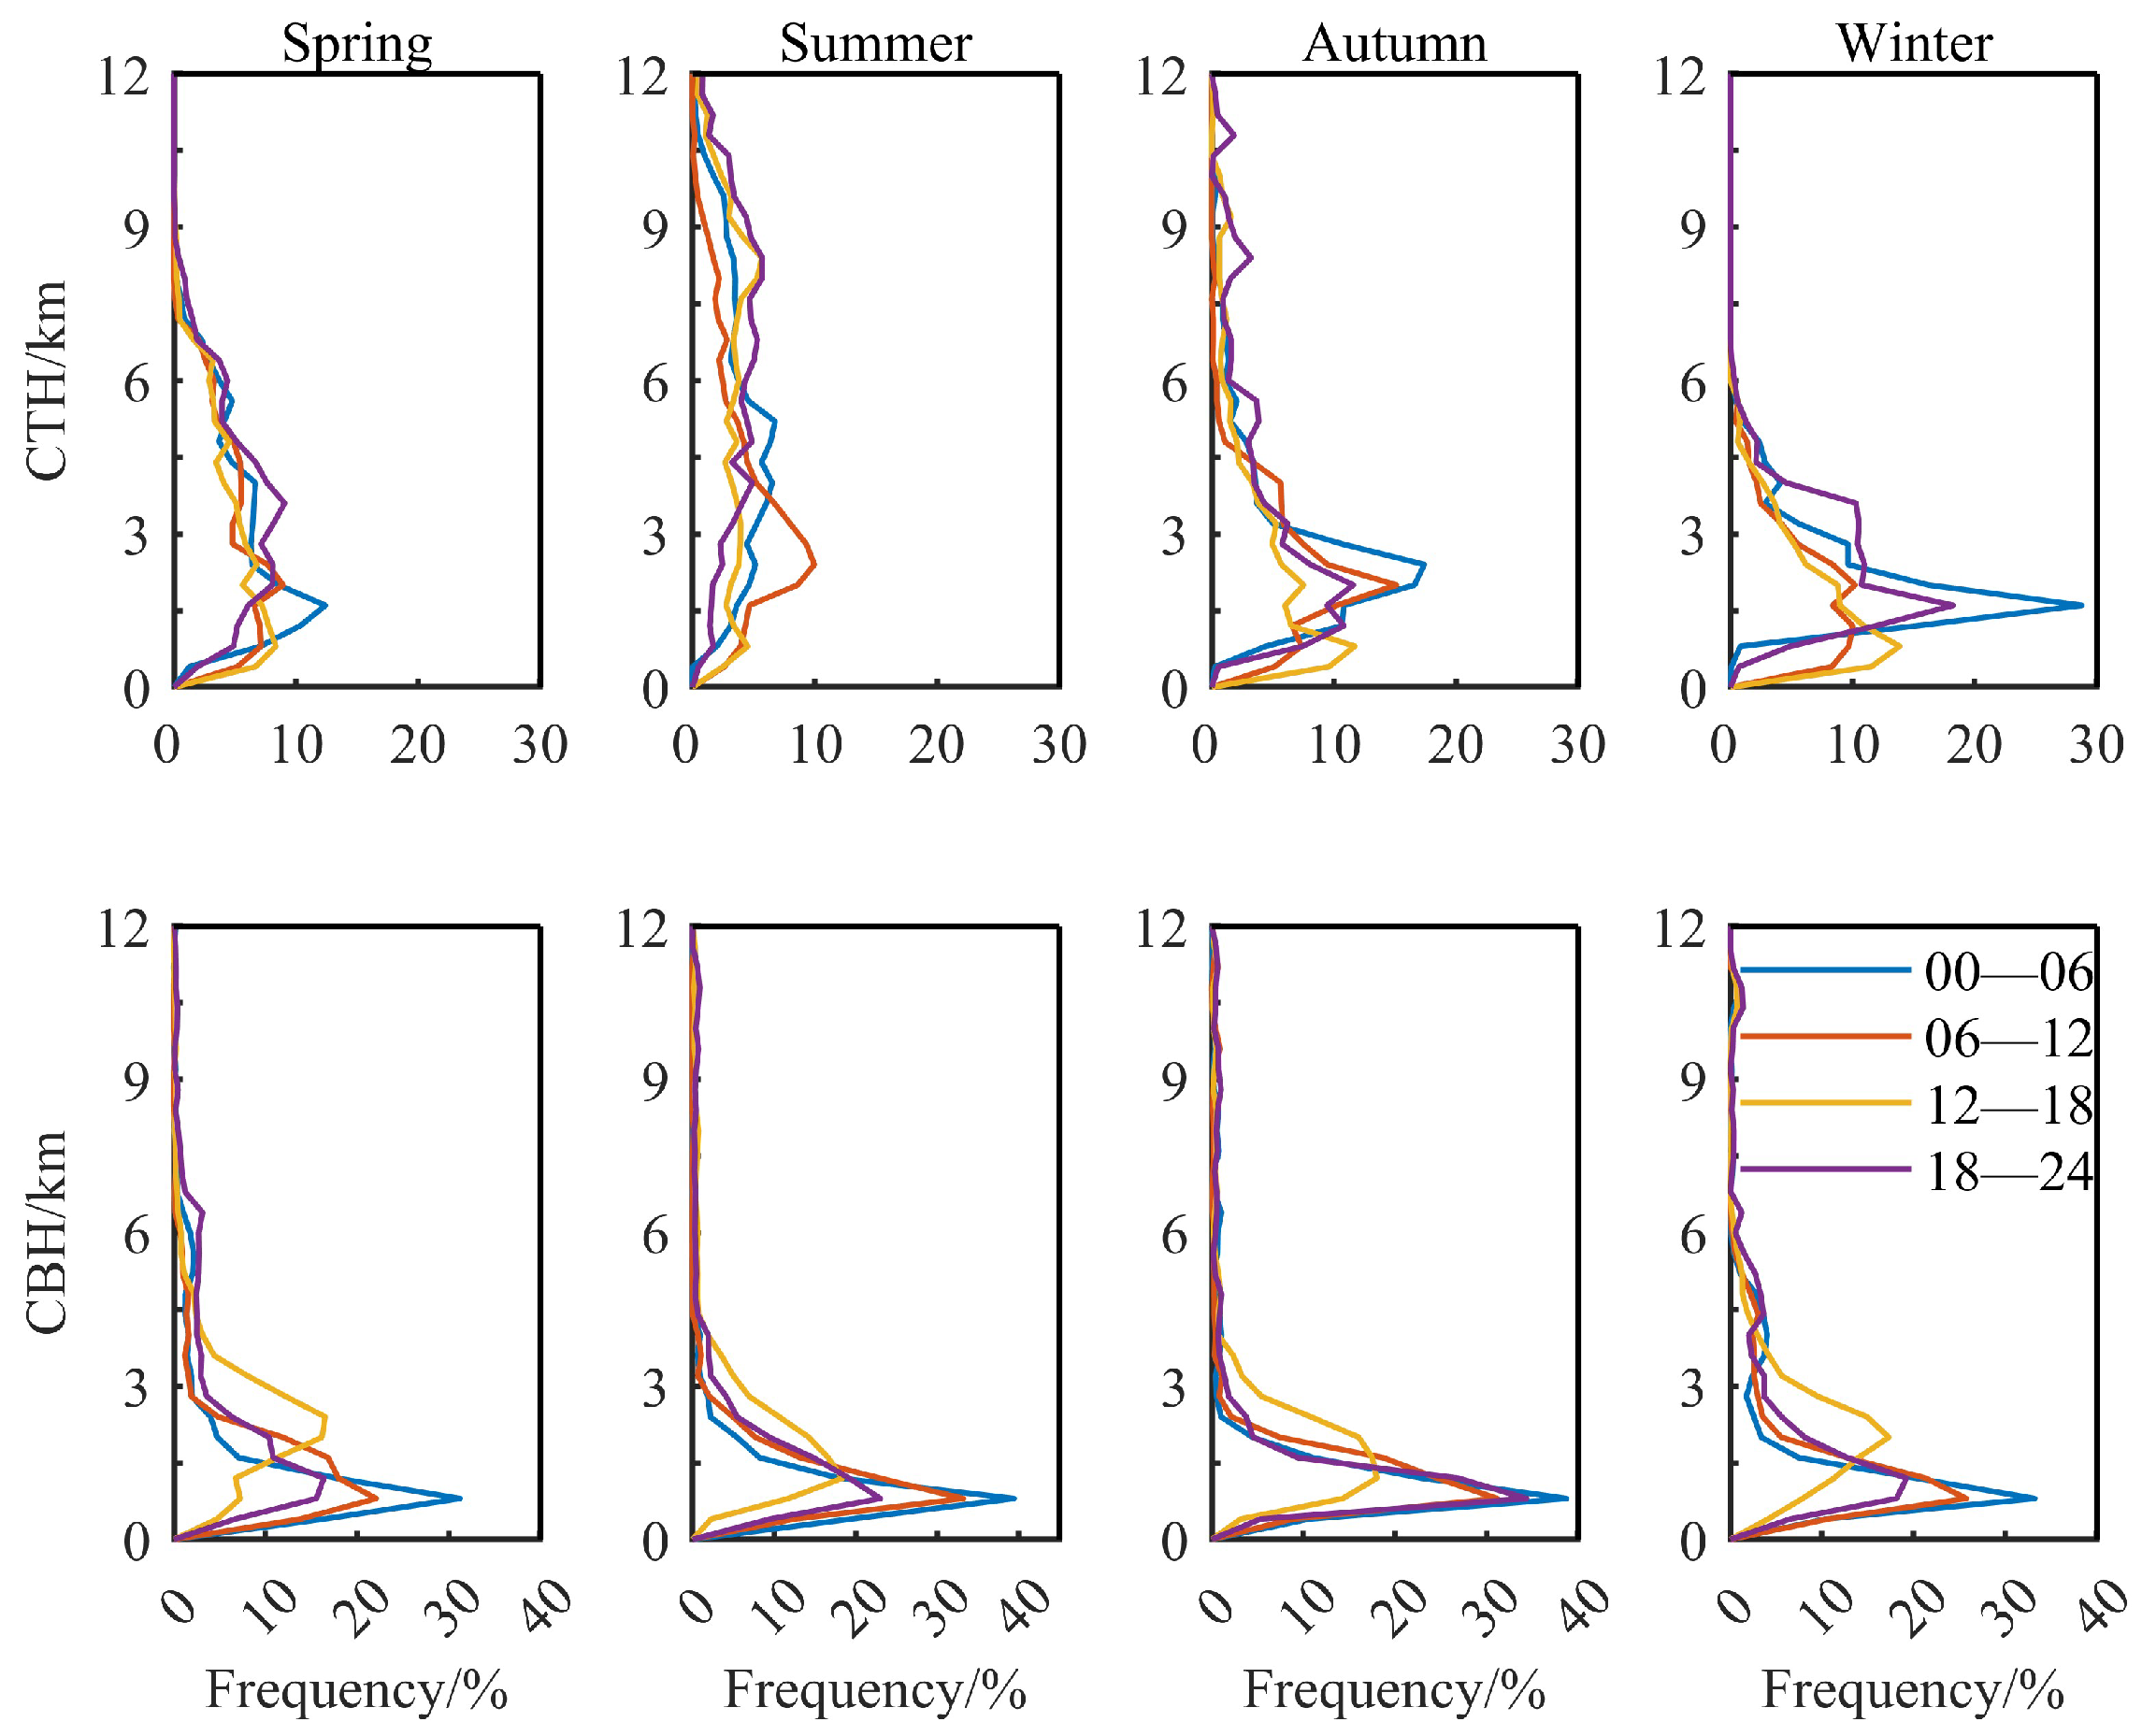
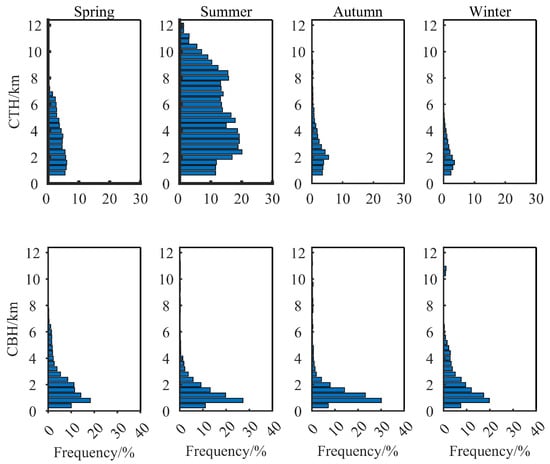
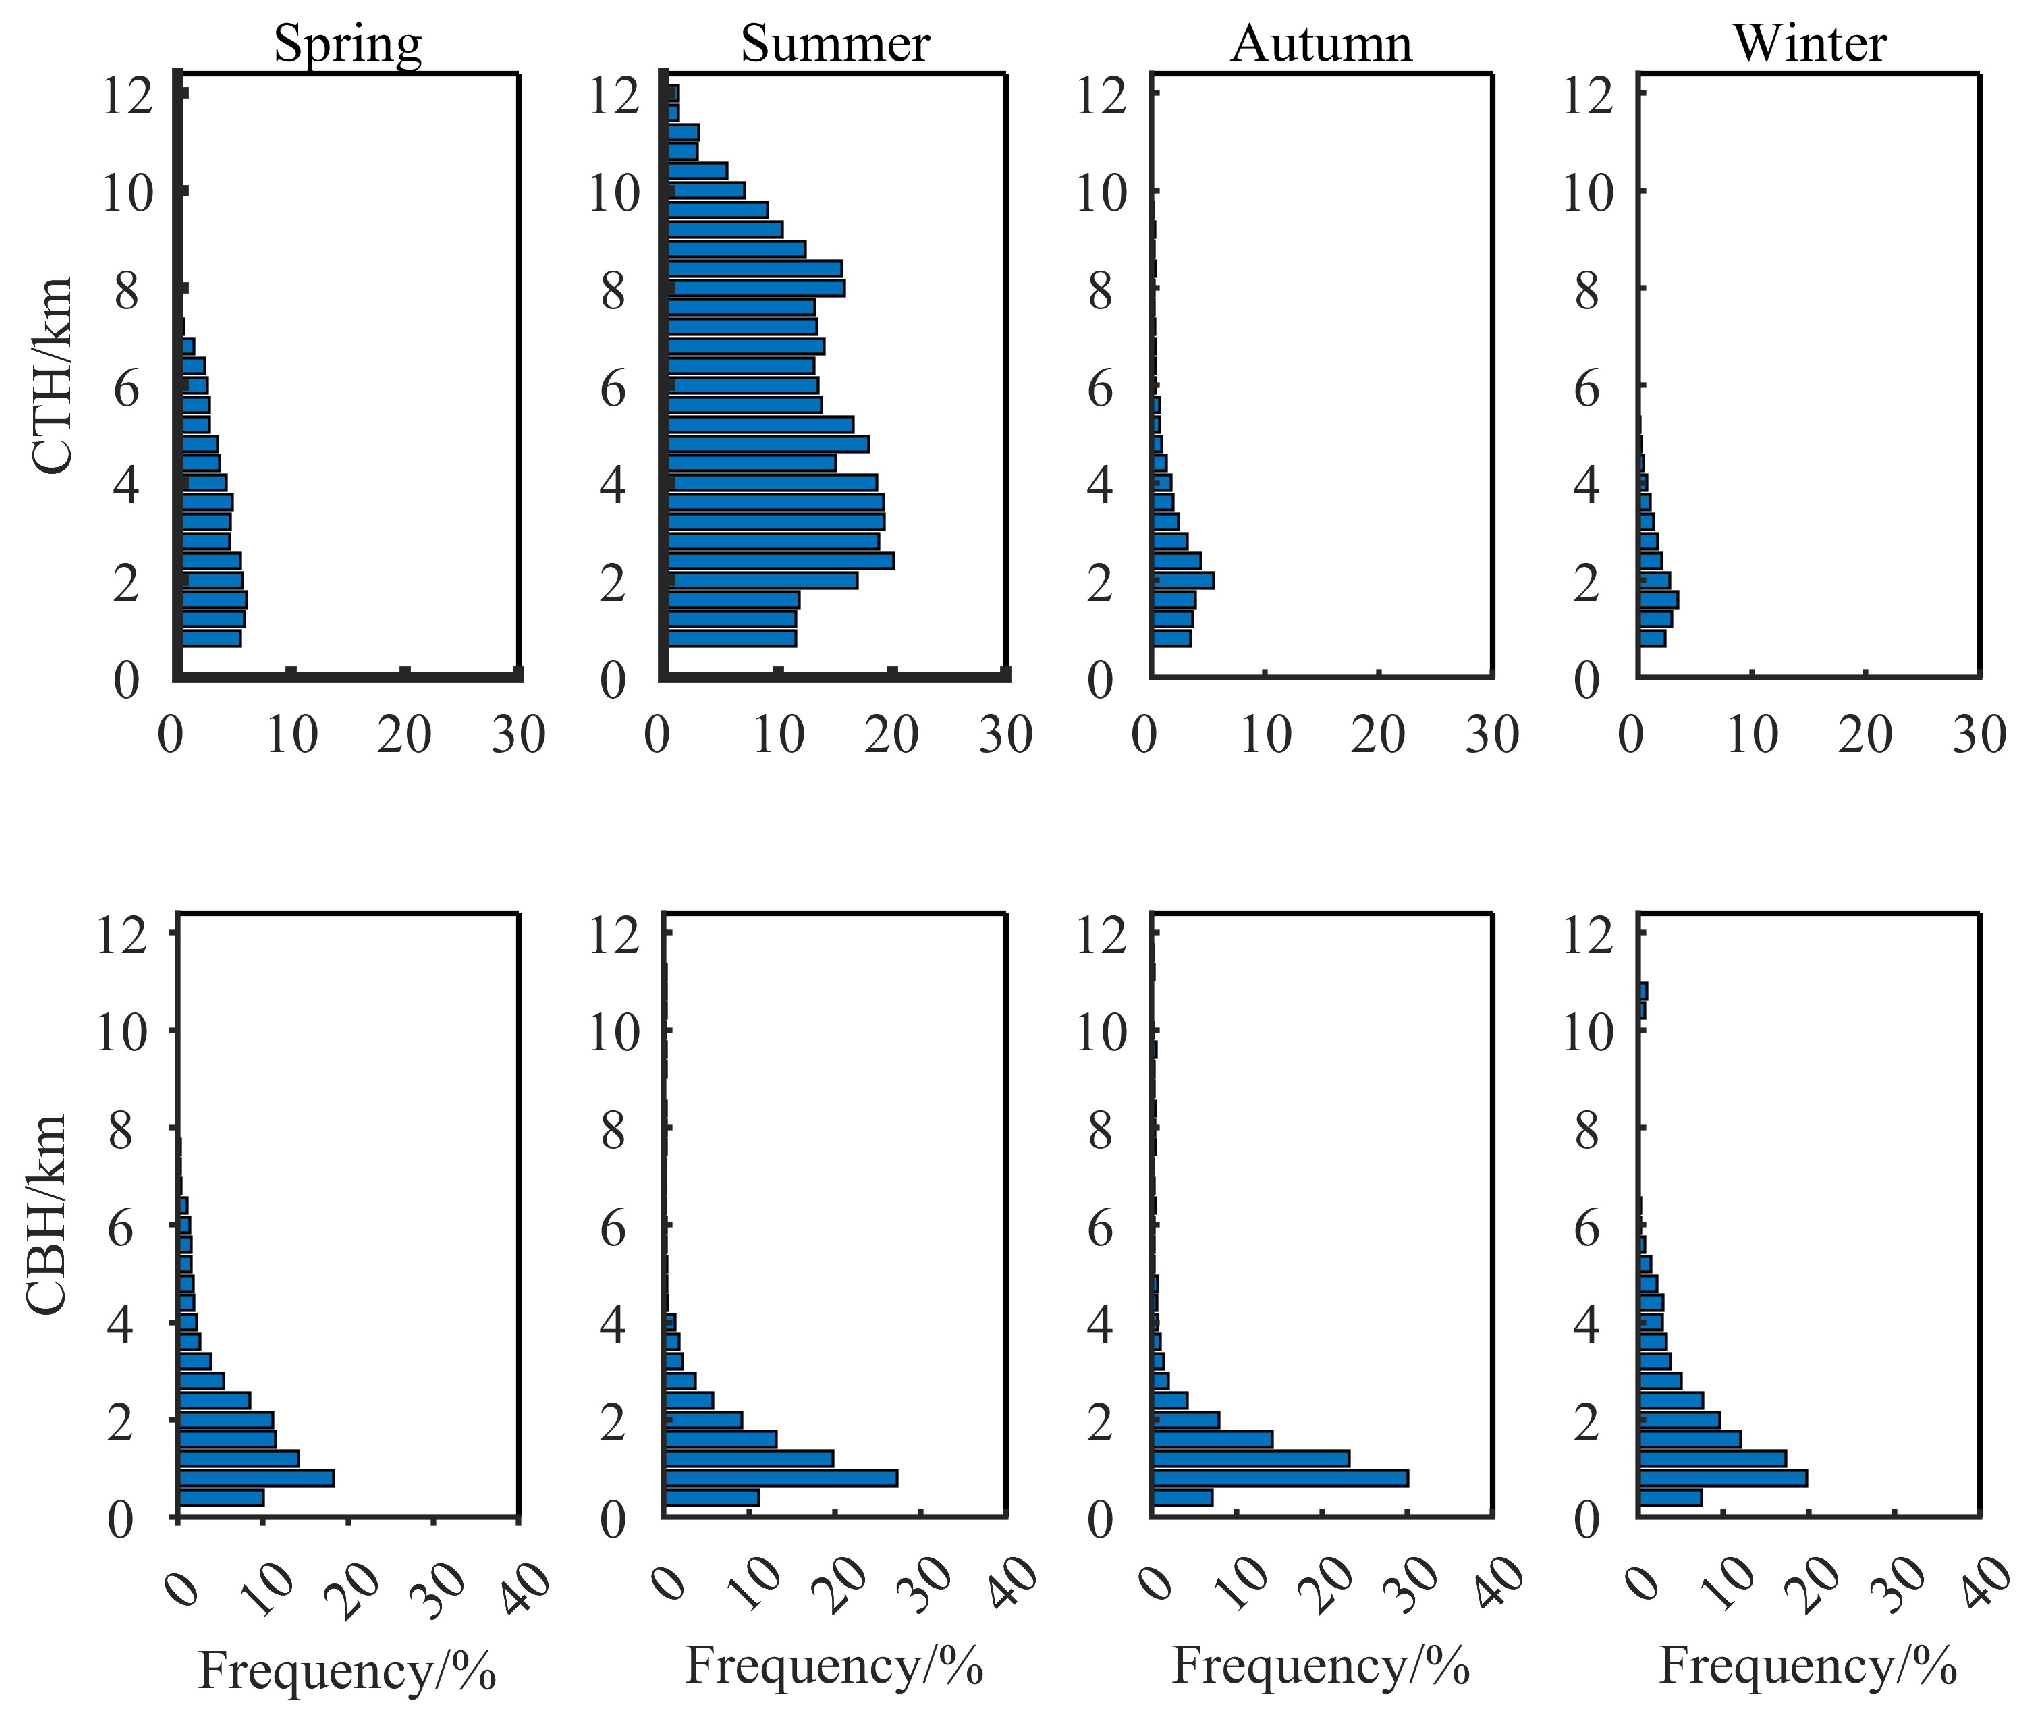
We further analyzed the vertical distribution of CTHs and CBHs at six-hour intervals (Figure 12) as well as the overall occurrence frequency (Figure 13). CBHs exhibit a distinct unimodal feature, with a peak at 0.8 km, likely due to the transport of warm and moist air from the Indian Ocean, which results in a relatively low lifting condensation level in this region. Starting from the nighttime period of 18:00–24:00 LST, the occurrence frequency of CBHs begins to increase, reaching its peak during 00:00–06:00 LST. In the morning period of 06:00–12:00 LST, the occurrence frequency of CBHs decreases, and CBHs rise, peaking between 1.5 km and 3 km during 12:00–18:00 LST. This diurnal variation, where CBHs are lower at night and rise in the afternoon, is consistent with the results discussed in Section 3.2.1. Notably, compared to other seasons, the occurrence frequency of CBHs in autumn during 18:00–24:00 LST is higher, reaching 34.37%.
Figure 12.
The vertical distributions of the occurrence frequencies of the CBHs and CTHs at 6 h intervals in different seasons with 400 m interval bins.
Figure 13.
Distributions of CBHs for all found layers aggregated and CTHs in different seasons with 400 m interval bins.
For CTHs, the distribution in winter is relatively concentrated, with clouds mostly occurring during 00:00–06:00 LST. Both Figures show a peak at 1.6 km. In summer, CTHs are more widely distributed, extending above 12 km. In spring, peaks are observed at 1.6 km and 3.6 km, occurring during 00:00–06:00 LST and 18:00–24:00 LST, respectively. This may be due to the transport of moisture from mountain peaks to valleys at night, leading to increased humidity in valley areas. In summer, the maximum peak occurs during 06:00–12:00 LST at a height of 2.4 km. CTHs above 7 km often appear during 12:00–24:00 LST, while during 00:00–06:00 LST, CTHs drop to around 5 km, where a peak is observed. The overall distribution of CTHs in summer is similar, with multiple peaks at 2400–2800 m, 4800–5200 m, and 8000–8400 m (Figure 13). This indicates that deep convective clouds frequently form from afternoon to early morning in summer and descend from midnight to early morning. In autumn, CTHs mostly occur at heights of 1.5–3 km, with CBHs rising to 8 km during 18:00–24:00 LST, where a peak is observed.
4. Conclusions and Discussion
This study utilizes data from the CL51 and the FY-4A satellite from October 2020 to June 2022 to investigate the COF, CBHs, CTHs, and cloud layer structure over LHAASO on the eastern slope of the TP. The main findings are as follows:
(1) During the observation period over LHAASO, the COF observed by CL51 and FY-4A were 43.7% and 37.7%, respectively, with a strong correlation coefficient of 0.82. During the WFCTA operation period (October to May of the following year, 20:00–05:00 LST), the COF was 34.2% (CL51) and 28.0% (FY-4A), with the lowest values occurring in the early morning. These results provide valuable reference information for the operation of the WFCTA. The COF exhibits seasonal characteristics, with the highest frequency in summer and the lowest in winter. This is closely related to the atmospheric circulation in the region. In summer, the plateau forms a large thermal low-pressure area due to solar radiation, drawing moisture from the Indian Ocean, which, combined with orographic lifting, leads to the formation of abundant clouds and increased precipitation. In winter, the region is influenced by dry northeasterly monsoons from Siberia and Mongolia, resulting in fewer clouds and less precipitation. Diurnal variations in cloud occurrence rate also show distinct seasonal patterns: in spring and winter, clouds are more frequent during the day, while in summer and autumn, clouds are more frequent at night.
FY-4A exhibits a systematic underestimation of COF during nighttime. This discrepancy may be attributed to the temperature-dependent thresholds employed in the FY-4A cloud detection algorithm, which distinguish cloud signatures from the underlying surface. Nocturnal surface cooling often leads to the formation of a temperature inversion layer near the surface, which can obscure low-level clouds and thus reduce their detection efficiency from space. This mechanism offers a plausible explanation for the observed COF differences shown in Figure 3b. Additionally, variations in nocturnal humidity may further influence cloud formation and detectability. These findings suggest that incorporating temperature and humidity analysis could be a meaningful direction for future work to better understand and quantify the satellite-based cloud detection biases under varying thermodynamic conditions.
(2) The cloud structure in this region is primarily single-layered, dominated by low and middle-level clouds. The CBH is lowest at 08:00 LST and highest at 18:00 LST, showing a diurnal pattern of first decreasing and then increasing, consistent with the results of Zhang et al. [34]. Seasonally, the average CBH is lowest in summer, while the average CTH is highest in summer. CBHs are higher in spring and winter and lower in summer and autumn. High-level clouds occur more frequently in spring and summer compared to other seasons, which aligns with the results from the International Satellite Cloud Climatology Project and MODIS/TERRA measurements over the TP [35], Wei et al. [7] found that the COF of high-level clouds in the southeastern TP is significantly higher than in other parts of the TP. This is mainly due to the warm and moist air from the Indian Ocean being lifted by the terrain and enhanced atmospheric instability, leading to frequent convective activity in summer. Additionally, the thermal effect of the plateau causes air to converge toward the interior, enhancing vertical upward motion.
(3) CBHs exhibit a unimodal distribution, with a peak at 0.8 km. Their variations are closely related to weather systems, with significant fluctuations in CBHs during strong convective weather. The vertical distribution of clouds is relatively uniform, and the atmospheric boundary layer height also increases. Convective activity is particularly intense in April, with CBHs often evolving from around 10 km to 1 km, and the atmospheric boundary layer height reaching its annual maximum [36]. Seasonally, CBHs in summer and autumn show a clear unimodal distribution, with clouds concentrated below 2 km, while the vertical distribution of clouds is relatively uniform in spring and winter. CTHs exhibit a unimodal structure in autumn and winter, with peaks at 1.5–3 km, while in summer, CTHs show a multimodal structure with a wide distribution, extending up to 12 km or higher.
These findings provide important observational data for studying cloud variations over the TP, offer a basis for parameterizing cloud vertical structures in climate models, and provide valuable reference information for the operation of the WFCTA.
Author Contributions
Conceptualization, F.Z.; methodology, N.B. and X.Z.; software, N.B.; validation, D.W. and C.S.; formal analysis, N.B.; investigation, N.B., D.W. and C.S.; data curation, N.B. and D.W.; writing—original draft preparation, N.B.; writing—review and editing, F.Z. and X.Z.; visualization, N.B.; supervision, F.Z.; project administration, F.Z.; funding acquisition, F.Z. All authors have read and agreed to the published version of the manuscript.
Funding
This research was funded by the National Key R&D Program of China (2021YFA0718403) and Sichuan Provincial Science & Technology Department Key Projects (2021YFSY0030, 2021YFSY0031).
Institutional Review Board Statement
Not applicable.
Informed Consent Statement
Not applicable.
Data Availability Statement
The FY-4A satellite data are openly available from the National Satellite Meteorological Center Data Portal at: https://data.nsmc.org.cn/DataPortal/cn/home/index.html (accessed on 10 December 2024). The CL51 data presented in this study are available upon request from the corresponding author.
Acknowledgments
The authors thank the National Satellite Meteorological Center for providing the FY-4A data (http://www.nsmc.org.cn).
Conflicts of Interest
The authors declare no conflicts of interest.
References
- Stephens, G.L. Cloud Feedbacks in the Climate System: A Critical Review. J. Clim. 2005, 18, 237–273. [Google Scholar] [CrossRef] [Scilit]
- Voigt, A.; Albern, N.; Ceppi, P.; Grise, K.; Li, Y.; Medeiros, B. Clouds, Radiation, and Atmospheric Circulation in the Present-Day Climate and under Climate Change. WIREs Clim. Change 2021, 12, e694. [Google Scholar] [CrossRef] [Scilit]
- Nam, C.; Bony, S.; Dufresne, J.L.; Chepfer, H. The Too Few, Too Bright Tropical Low-Cloud Problem in CMIP5 Models. Geophys. Res. Lett. 2012, 39, L21801. [Google Scholar] [CrossRef] [Scilit]
- Wu, G.X.; Liu, Y.M.; Wang, T.M.; Wan, R.J.; Liu, X.; Li, W.P.; Wang, Z.Z.; Zhang, Q.; Duan, A.M.; Liang, X.Y. The Influence of Mechanical and Thermal Forcing by the Tibetan Plateau on Asian Climate. J. Hydrometeorol. 2007, 8, 770–789. [Google Scholar] [CrossRef] [Scilit]
- Yang, K.; Wu, H.; Qin, J.; Lin, C.G.; Tang, W.J.; Chen, Y.Y. Recent Climate Changes over the Tibetan Plateau and Their Impacts on Energy and Water Cycle: A Review. Glob. Planet. Change 2014, 112, 79–91. [Google Scholar] [CrossRef] [Scilit]
- Tiwari, S.; Kar, S.C.; Bhatla, R. Dynamic Downscaling over Western Himalayas: Impact of Cloud Microphysics Schemes. Atmos. Res. 2018, 201, 1–16. [Google Scholar] [CrossRef] [Scilit]
- Wei, J.; Duan, K.Q.; Xin, R. Cloud occurrence probability and its radiative forcing characteristics in Qinghai-Tibet Plateau. J. Glaciol. Geocryol. 2020, 42, 368–377. [Google Scholar]
- Tang, J.; Guo, X.L.; Chang, Y. Numerical Simulation Study on Microphysical Characteristics of Clouds and Precipitation over the Tibetan Plateau in Summer 2014. Acta Meteorol. Sin. 2018, 76, 1053–1068. [Google Scholar]
- Xu, W.J.; Lü, D.R. Analysis of Cloud Distribution and Diurnal Variation over the Tibetan Plateau in Summer Based on Geostationary Satellite Observations. Clim. Environ. Res. 2023, 28, 229–241. (In Chinese) [Google Scholar]
- Yan, Y.F.; Wang, X.C.; Liu, Y.M. Cloud Vertical Structures Associated with Precipitation Magnitudes over the Tibetan Plateau and Its Neighboring Regions. Atmos. Ocean. Sci. Lett. 2018, 11, 44–53. [Google Scholar] [CrossRef] [Scilit]
- Chen, H.M.; Yuan, W.H.; Li, J.; Yu, R.C. A Possible Cause for Different Diurnal Variations of Warm Season Rainfall as Shown in Station Observations and TRMM 3B42 Data over the Southeastern Tibetan Plateau. Adv. Atmos. Sci. 2012, 29, 193–200. [Google Scholar] [CrossRef] [Scilit]
- Wu, J.Y.; Sun, Q.; Bi, Y.H.; Tian, Y.F.; Wang, Y.N.; Lü, D.R. Study on Diurnal Variation Characteristics of Cloud Macro Parameters of Three Important Weather Systems over the Tibetan Plateau Using Ka-Band Cloud Radar. Chin. J. Atmos. Sci. 2022, 46, 1030–1040. (In Chinese) [Google Scholar]
- Zhou, R.R.; Wang, G.L.; Zhaxi, S.L. Cloud Vertical Structure Measurements from a Ground-Based Cloud Radar over the Southeastern Tibetan Plateau. Atmos. Res. 2021, 258, 105629. [Google Scholar] [CrossRef] [Scilit]
- Cao, Z.; Chen, M.J.; Chen, S.Z.; Hu, H.B.; Liu, C.; Liu, Y.; Ma, L.L.; Ma, X.H.; Sheng, X.D.; Wu, H.R.; et al. Overview of the Large High Altitude Air Shower Observatory (LHAASO). Chin. Astron. Astrophys. 2019, 43, 457–478. [Google Scholar]
- You, Z.Y. Measurement and Study of Cosmic Ray Proton Energy Spectrum in the Knee Region by LHAASO Experiment. Ph.D. Thesis, Chinese Academy of Sciences, Particle Physics and Nuclear Physics, Beijing, China, 2022. [Google Scholar]
- Wang, Y.; Zhao, C.F.; Dong, Z.P.; Li, Z.Q.; Hu, S.Z.; Chen, T.M.; Tao, F.; Wang, Y.Z. Improved Retrieval of Cloud Base Heights from Ceilometer Using a Non-Standard Instrument Method. Atmos. Res. 2017, 202, 148–155. [Google Scholar] [CrossRef] [Scilit]
- Bai, Z.N.; Alaiyi, A.D.; Li, R.N.; Liu, T. Comparative Analysis of Near-infrared Laser Ceilometer and Visible Laser Radar. Mod. Agric. Sci. Technol. 2015, 647, 251–252, 255. [Google Scholar]
- Zhou, L.L.; Xu, G.R.; Wu, D.Q.; Liu, T. Performance comparison of laser ceilometer and infrared thermometer in cloud bottom height detection. Torrential Rain Disasters 2018, 37, 470–478. [Google Scholar]
- Costa-Surós, M.; Calbó, J.; González, J.A.; Martin-Vide, J. Behavior of Cloud Base Height from Ceilometer Measurements. Atmos. Res. 2013, 127, 64–76. [Google Scholar] [CrossRef] [Scilit]
- Zhao, W.; Wang, Y.N.; Bi, Y.H.; Wu, X.; Tian, Y.F.; Wu, L.; Luo, J.; Hu, X.; Qi, Z.; Li, J.; et al. Unveiling Cloud Vertical Structures over the Interior Tibetan Plateau through Anomaly Detection in Synergetic Lidar and Radar Observations. Adv. Atmos. Sci. 2024, 41, 2381–2398. [Google Scholar] [CrossRef] [Scilit]
- Lee, S.; Hwang, S.O.; Kim, J.; Ahn, M.H. Characteristics of Cloud Occurrence Using Ceilometer Measurements and Its Relationship to Precipitation over Seoul. Atmos. Res. 2018, 201, 46–57. [Google Scholar] [CrossRef] [Scilit]
- Song, X.; Zhai, X.; Liu, L.; Wu, S. Lidar and Ceilometer Observations and Comparisons of Atmospheric Cloud Structure at Nagqu of Tibetan Plateau in 2014 Summer. Atmosphere 2017, 8, 9. [Google Scholar] [CrossRef] [Scilit]
- Liu, L.; Sun, X.J.; Liu, X.C.; Gao, T.C.; Zhao, S.J. Comparison of Cloud Base Height Derived from a Ground-Based Infrared Cloud Measurement and Two Ceilometers. Adv. Meteorol. 2015, 2015, 853861. [Google Scholar] [CrossRef] [Scilit]
- Qiao, X.Y.; Xue, L.Y.; Tian, Y. Observation of atmospheric boundary layer height of pollution weather with lidar ceilometer. Environ. Prot. Sci. 2022, 48, 121–126. [Google Scholar]
- Poore, K.D.; Wang, J.H.; Rossow, W.B. Cloud Layer Thicknesses from a Combination of Surface and Upper-Air Observations. Am. Meteorol. Soc. 1995, 8, 550–568. [Google Scholar] [CrossRef] [Scilit]
- Rossow, W.B.; Schiffer, R.A. ISCCP Cloud Data Products. Bull. Am. Meteorol. Soc. 1991, 72, 2–20. [Google Scholar] [CrossRef] [Scilit]
- Zhu, F.R. Researches on the atmospheric conditions over the LHAASO. In Proceedings of the 39th International Cosmic Ray Conference, Geneva, Switzerland, 15–24 July 2025. [Google Scholar]
- Li, J.M.; Huang, J.P.; Yi, Y.H.; Lü, D.R. Statistical Characteristics of Cloud Vertical Distribution over East Asia Using Satellite-Borne Lidar Data. Chin. J. Atmos. Sci. 2009, 33, 689–707. (In Chinese) [Google Scholar]
- Randall, D.A.; Harshvardhan; Dazlich, D.A.; Corsetti, T.G. Interactions among Radiation, Convection, and Large-Scale Dynamics in a General Circulation Model. Am. Meteorol. Soc. 1989, 46, 1943–1970. [Google Scholar] [CrossRef] [Scilit]
- Li, D.; Liu, Y.Z.; Shao, T.B.; Luo, R.; Tan, Z.Y. Evaluation of ERA5 Cloud Base Height Products Using Ground-Based Observations. Chin. J. Atmos. Sci. 2024, 48, 735–744. (In Chinese) [Google Scholar] [CrossRef] [Scilit]
- Zheng, J.F.; Yang, H.; Zeng, Z.M.; Liu, L.P.; Zou, M.L.; Zeng, Z.Y. Study on Macroscopic Characteristics of Summer Clouds over Naqu Using Millimeter-Wave Radar Data. J. Infrared Millim. Waves. 2021, 40, 471–482. [Google Scholar]
- Cai, Y.P.; Luo, C.R.; Chen, S.; Wang, Z.S.; Lü, Q.Y.; Huang, P. Observation of Cloud Characteristics with Ceilometer in the Southeast Coast of China. Meteorol. Mon. 2023, 49, 170–177. [Google Scholar]
- Xu, G.R.; Zhang, W.G.; Wan, X.; Wang, B. Cloud Occurrence Frequency and Cloud Liquid Water Path for Non-Precipitating Clouds Using Ground-Based Measurements over Central China. J. Atmos.-Sol.-Terr. Phys. 2021, 215, 105575. [Google Scholar] [CrossRef] [Scilit]
- Zhang, Q.; Song, X.Q.; Liu, J.T.; Dai, G.Y.; Wu, S.H. Observation of cloud base height with ceilometer in Tibetan Plateau during summer. J. Optoelectron. Laser 2016, 27, 406–412. [Google Scholar]
- Li, Y.D.; Liu, X.D.; Chen, B.D. Cloud Type Climatology over the Tibetan Plateau: A Comparison of ISCCP and MODIS/TERRA Measurements with Surface Observations. Geophys. Res. Lett. 2006, 33, L17716. [Google Scholar] [CrossRef] [Scilit]
- Liu, J.; Tang, X.F.; Xia, J.J.; Zhu, F.R. Variation of the Atmospheric Boundary Layer Height at the Eastern Edge of the Qinghai-Tibet Plateau. Plateau Mt. Meteorol. Res. 2024, 44, 32–39. [Google Scholar]
Disclaimer/Publisher’s Note: The statements, opinions and data contained in all publications are solely those of the individual author(s) and contributor(s) and not of MDPI and/or the editor(s). MDPI and/or the editor(s) disclaim responsibility for any injury to people or property resulting from any ideas, methods, instructions or products referred to in the content. |
© 2026 by the authors. Licensee MDPI, Basel, Switzerland. This article is an open access article distributed under the terms and conditions of the Creative Commons Attribution (CC BY) license.