Abstract
This study examines two wildfire events in the southern Amazon in August 2021, addressing the challenges in investigating the development of pyro-convective clouds in tropical regions. The analysis combines the Normalized Difference Vegetation Index, Fire Radiative Power derived from the Suomi-NPP and NOAA-20 satellites, and meteorological conditions from thermodynamic profiles and atmospheric modeling. The Meso-NH model was applied exploratorily with two simulations that allow convection, at a 2.5 km resolution. In the first case, a pyro-convective cloud (PyroCu) formed directly from active fires. In the second, a deep convective cloud developed over dispersed fire hotspots, exhibiting characteristics compatible with pyro-convective activity, although uncertainties remain regarding its classification as a true PyroCb. The results indicate that background thermodynamic instability primarily controls vertical plume development, modulating the influence of fire intensity. Incorporating high-resolution thermodynamic profiles into coupled atmospheric and chemical dispersion models can improve estimates of smoke injection height, complementing information on fire power. The results provide a basis for future developments related to understanding tropical pyro-convective clouds, showing how smoke dispersion may occur in the tropical region depending on the vertical structure of the atmosphere and fire intensity.
1. Introduction
Wildfires are among the most impactful natural disasters on the planet. In addition to human losses and the material damage directly associated with burning, smoke and emitted pollutants can cause serious public health impacts, reaching distant regions and persisting for long periods after the initial event [1,2,3,4,5,6]. Large wildfires also cause profound impacts on biodiversity, carbon cycle, air quality, and the well-being of vulnerable populations [7,8]. In recent decades, there has been a marked increase in the frequency, extent, and intensity of these events worldwide [9,10,11,12], a trend widely associated with increased vegetation dryness and the worsening of climate change [13,14,15,16,17].
In Brazil, studies indicate a strong relationship between fires, heatwaves, and droughts, reinforcing the nature of extreme compound events [5,6,18]. Recently, studies also started to draw attention to meteorological phenomena affecting fire spread on a sub-daily scale during wildfires in the Pantanal Wetland [19,20]. In the Amazon, in turn, the situation is particularly concerning, with wildfires increasing both in extent and severity, driven by the combination of climate change, forest degradation and the expansion of human activities. Extreme droughts associated with El Niño events considerably influence fire susceptibility and result in peaks of burning such as those recorded in 2005, 2010, 2015–2016 and 2019 [7,21]. Recent evidence shows that even in years without El Niño there is a growing trend of fires in mature forests, resulting from forest degradation, increased flammability and reduced canopy moisture. These processes promote high-intensity and large wildfires [22,23]. Moreover, elevated temperatures, reduced precipitation and intensified solar radiation, are all factors that affect the likelihood of a fire starting and spreading across different biomes [6,24,25].
The occurrence of large wildfires in the Amazon region is strongly associated with synoptic patterns that favor hot, dry, and persistent air. These patterns are often modulated by years of extreme drought and the presence of atmospheric blocking, which reduces moisture transport from the South Atlantic Convergence Zone and the tropical Atlantic [7,26,27,28]. This combination of factors results in a strong water deficit, increased vegetation flammability, and a deepening of the atmospheric boundary layer. As a consequence, a highly favorable environment for rapid fire spread is established [29,30]. Extreme wildfires have also increased the search for a better understanding of these events and related phenomena. The large energy flux released by intense burning can significantly alter the thermodynamic structure of the atmosphere [31,32]. In some cases, the heat and aerosols emitted by the fire can trigger the formation of fire-induced convective clouds, such as pyro-cumulus (pyroCu). When convection intensifies and reaches higher levels of the troposphere, it can evolve into pyrocumulonimbus (pyroCb), a system capable of generating its own weather conditions and characterized by deep updrafts that are able to transporting smoke and fire particles to the upper troposphere or even the stratosphere [33,34,35,36]. These phenomena, frequently associated with mega-fires, expand the reach and persistence of the atmospheric impacts of fire, as demonstrated by recent studies [37,38]. The accumulation of dry and dead vegetation plays a central role in these processes, which reinforces the importance of understanding fuel characteristics and their influence on fire behavior and the formation of pyro-convective clouds [39].
However, most of the current understanding of PyroCu and PyroCb formation is based on studies conducted in midlatitude regions, particularly in western North America and Australia [33,34,35,36,37,38,39]. These studies provide a solid physical framework for fire–atmosphere coupling, but they are embedded in thermodynamic environments that differ substantially from those of tropical regions. In the Amazon and other tropical areas, the atmosphere is characterized by a deeper troposphere and a convective regime associated with high moisture availability and strong instability, which modify how heat and moisture released by fires interact with the background environment [21,27]. As a result, direct extrapolation of pyro-convective behavior from temperate to tropical regions is uncertain and requires dedicated observational and modeling studies in tropical settings.
Understanding the processes responsible for the formation of pyro-convective clouds requires tools capable of representing, in an integrated manner, combustion, heat flux, and atmospheric response [31,32,33]. In this context, fire–atmosphere coupled models have become important for investigating the behavior of extreme fires and the development of PyroCu and PyroCb [40,41,42,43,44]. Systems such as WRF-SFIRE [45], Meso-NH/ForeFire [46], Meso-NH/Blaze [47] and ACCESS-Fire [48] explicitly incorporate feedbacks between fire and the atmospheric environment, allowing simulations that capture how released heat alters stability, intensifies updrafts, and modifies local wind patterns. These works reinforce the importance of high-resolution atmospheric models to investigate the mechanisms controlling the formation, intensification, and evolution of pyro-convective events, contributing to a more robust understanding and forecasting of extreme fires. Additionally, remote sensing from radar and Lidar has supported advancements in fire smoke detection and characterization, also helping to validate numerical simulations of pyro-convection and explore extreme wildfires [31,44,49]. Furthermore, satellite imagery can be crucial for fire monitoring and identification of PyroCb clouds [50,51]. Therefore, identifying regions where pyro-convective clouds can occur is extremely important to improve firefighting strategies, ensure operational safety, and anticipate their social, ecological, and climatic impacts [52]. Considering the importance of studying pyro-convective phenomena, and given the lack of studies on pyro-convective clouds in tropical forests, this study aims to discuss two periods in which wildfires were identified in the southern Amazon, highlighting the main aspects of cloud development and their possible connection with the wildfires. The methodology and dataset used are described in the next section (Section 2). The results are shown in Section 3, followed by a general discussion in Section 4. Concluding remarks and future perspectives are presented in Section 5.
2. Materials and Methods
2.1. Case Studies in August 2021
Two wildfires have been considered as case studies aiming to discuss their effects in the atmosphere, namely by triggering convective phenomena: The first event (Case 1) occurred on 7 August 2021, with fire activity observed between 16:00 and 19:00 UTC. The second event (Case 2) took place on 23 August 2021, during the period from 16:10 to 20:10 UTC. Furthermore, the two wildfires occurred in the AMACRO region (Figure 1), located at the tri-border area of the Brazilian Amazon states of Amazonas, Acre, and Rondônia. This region has been widely recognized as the new frontier of deforestation in the Amazon Basin [53]. Officially designated as the Abunã–Madeira Sustainable Development Zone, AMACRO encompasses 32 municipalities: seven in Amazonas, covering 300,690 km2; thirteen in Acre, totaling 72,565 km2; and twelve in Rondônia, with an area of 84,895 km2. Altogether, the region spans approximately 458,150 km2, according to the Superintendence for the Development of the Amazon [54].
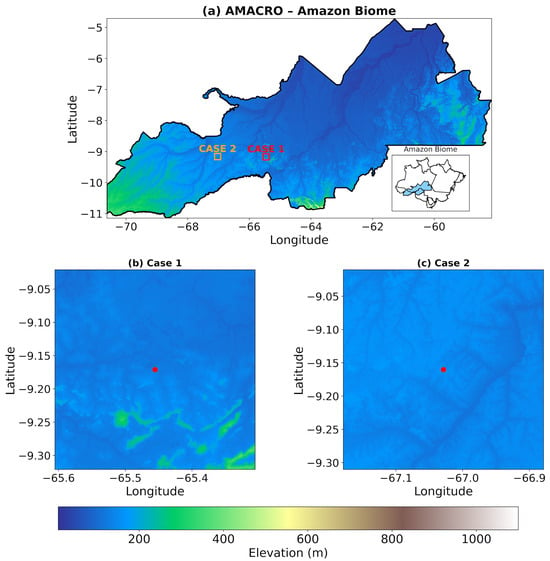
Figure 1.
Digital Elevation Model (DEM) of the AMACRO region, located within the Amazon biome, derived from the Shuttle Radar Topography Mission (SRTM) database. Panel (a) shows the regional DEM with the AMACRO boundary and the locations of the two case-study areas. Panels (b,c) present zoomed-in DEM views of Case 1 and Case 2, respectively, with red markers indicating the exact locations. Elevation is given in meters above sea level.
Although AMACRO has recorded a decline in deforested area for the second consecutive year, the magnitude of land-use change remains alarming. In 2024, deforestation decreased by approximately 13% compared to 2023; however, 5753 deforestation alerts were still detected, totaling 89,826 hectares of cleared area [53]. These figures indicate that the region continues to rank among the most active deforestation frontiers in the Amazon, reflecting persistent anthropogenic pressure on highly sensitive ecosystems [52].
This pressure advances predominantly in a south–north direction, expanding from historically occupied areas toward public lands designated for conservation, including Strict Protection Units, Sustainable Use Units, Indigenous Lands, and public areas without a defined purpose [52,55]. Cattle ranching is the primary driver of landscape conversion, strongly shaping territorial occupation and land transformation patterns widely documented across Amazonian frontiers [53,54].
Consistent with this process, MapBiomas land use and land cover mapping shows that pasture areas in AMACRO increased by 77% between 2000 and 2010. From 2010 to 2021, corresponding to the most recent update of the historical series, pasture expansion reached an additional 42.8%, totaling 6,568,649 hectares. This expansion is directly linked to deforestation, as new pastures are predominantly established through the removal of native vegetation for agricultural purposes [56,57]. Figure 2 presents the land use and land cover classes for the two case-study areas. The first episode occurred in a region consisting of pasture, whereas the second case in a forested area.
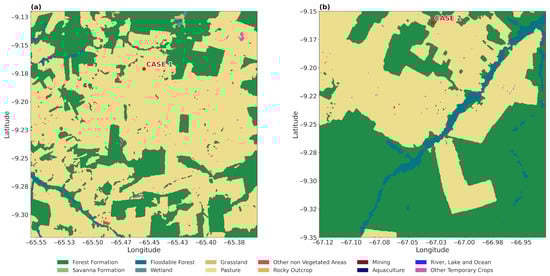
Figure 2.
Land use and land cover maps for the two studied cases: (a) Case 1 and (b) Case 2. The red points indicate the central location of each wildfire. The colors represent different types of land cover according to MapBiomas data.
Under these conditions, ongoing land-use transformation combined with the widespread use of fire as a land-management tool represents a major driver of environmental degradation [58]. Satellite-based analyses further indicate that deforestation in active Amazonian frontiers promotes recurrent burning, leading to modifications in land–atmosphere exchanges and enhanced surface heating [59]. Together, these processes can intensify fire behavior, linking sustained human disturbance in the region to extreme fire–atmosphere interactions [60]. The cases considered here illustrate the variability of pyro-convective intensity within the region, reflecting differences in active fires distribution, fuel availability, and atmospheric conditions, highlighting the potential for localized impacts of biomass burning on atmospheric processes in the Amazon [61,62].
2.2. Data and Models
For the analysis of wildfires episodes over the AMACRO frontier in the Amazon Basin, an integrated set of remote sensing products and meteorological datasets was employed. This integrated approach allows a comprehensive assessment of fire activity, vegetation conditions, and atmospheric dynamics associated with fire–atmosphere interactions, as widely adopted in recent studies addressing fire behavior and its atmospheric impacts in Brazil and other tropical regions [5,6,25].
Satellite observations were primarily based on imagery from the Advanced Baseline Imager (ABI) onboard the GOES-16 satellite, including the infrared channel (Channel 13) and the visible channel. These data were analyzed for two wildfires events: 7 August 2021 (Case 1), between 16:00 and 19:00 UTC, and 23 August 2021 (Case 2), between 16:10 and 20:10 UTC. ABI imagery enabled continuous monitoring of the spatial and temporal evolution of smoke plumes and cloud-top characteristics, following consolidated methodologies applied in studies of pyro-convection and high-intensity wildfires [60,63].
Fire activity was quantified using Fire Radiative Power (FRP) data derived from the Visible Infrared Imaging Radiometer Suite (VIIRS) sensors onboard the Suomi National Polar-orbiting Partnership (Suomi NPP) and NOAA-20 satellites. FRP data were obtained through the Fire Information for Resource Management System [FIRMS; https://firms.modaps.eosdis.nasa.gov/download/ (accessed on 27 December 2025)], which provides consistent and near-real-time global fire observations at spatial resolutions suitable for the detection and characterization of active fires. These data were used to assess fire intensity and its temporal correspondence with the development of clouds, following approaches successfully applied in analyses of fire behavior, climate extremes, and associated atmospheric impacts across different Brazilian biomes [6,25].
To provide a detailed characterization of fire intensity, the FRP values were analyzed using Kernel Density Estimation (KDE), complementing the classification of fires into four intensity classes (Low, Moderate, High, and Extreme). These classes were defined using a data-driven, empirical approach based on the statistical distribution of FRP in the analyzed dataset. The class limits (<10, 10–50, 50–200, and >200 MW/h) were set to separate weak, intermediate, and very high radiative power released by active fires observed in the VIIRS detections during the study period. These thresholds are not intended to represent universal physical regimes of fire behavior, but rather relative categories that facilitate comparison between days and cases.
FRP is widely used as a proxy for fire energy release and its interaction with atmospheric processes [31,36], but FRP retrievals are subject to uncertainties related to sensor resolution, sub-pixel fire area, viewing geometry, smoke and cloud effects [51]. In addition, regional differences in fuels and combustion efficiency in tropical environments may affect the relationship between FRP and fire intensity [21,27]. Therefore, the intensity classes should be interpreted as comparative indicators rather than absolute measures of fire severity.
Vegetation conditions were characterized based on spectral information from optical sensors, used to calculate the Normalized Difference Vegetation Index (NDVI). Data from the VIIRS and Sentinel-2 sensors were considered, selecting exclusively dates with valid and cloud-free observations over the study area. During the analyzed period, Sentinel-2 images from 1, 6, and 11 August 2021 were used, as well as VIIRS images from 5 and 13 August 2021. All vegetation data were accessed and processed through the Google Earth Engine [GEE; https://earthengine.google.com/ (accessed on 27 December 2025)] platform, which is widely employed in studies of vegetation dynamics and fire–ecosystem interactions at regional to continental scales [64,65,66].
The selection of pre- and post-fire NDVI dates was based on three main criteria: (i) data availability in the MODIS/VIIRS archive, (ii) minimal cloud contamination, and (iii) temporal proximity to the fire events. Because the Amazon exhibits strong seasonal and phenological variability, NDVI variations may also reflect vegetation cycles not directly related to fire disturbance [21,27]. In addition, residual cloud contamination can affect surface reflectance even after standard quality filtering [51]. These sources of uncertainty are therefore acknowledged in the interpretation of NDVI changes.
Large-scale atmospheric circulation relevant to smoke transport and pyro-convection development were characterized using European Centre for Medium-Range Weather Forecasts (ECMWF) Analysis, accessed through the Meteorological Archival and Retrieval System (MARS) [ECMWF; https://www.ecmwf.int/ (accessed on 27 December 2025)]. This data was used at a horizontal resolution of 0.125° × 0.125°, providing detailed information on synoptic circulation patterns in the study region. The large-scale environment can control plume dispersion and convective organization during extreme wildfire events [36,67,68].
In addition to the observational datasets, two convection-permitting simulations were performed using the non-hydrostatic mesoscale atmospheric model Meso-NH [69]. The Meso-NH have been extensively used to characterize the key atmospheric conditions before and during several Portuguese wildfires, revealing conditions that favour fire growth, linked to orographic effects, phenomena occurring from fire–atmosphere interaction, or even under specific weather patterns, e.g., [40,41,70,71,72]. Here, the simulations were conducted in an exploratory way and with a horizontal grid spacing of 2500 m (300 × 300 grid points), allowing to identify the main fire–weather conditions during the study periods. Each numerical experiment had a total of 30-h simulated, starting at 18:00 UTC of the day before the event. The model physical configuration is similar to the Portuguese studies, with shallow convection parameterized using the Eddy Diffusivity Kain-Fritsch (EDKF) scheme [73], whereas cloud microphysics considered five types of hydrometeors (cloud droplets, raindrops, graupel, snow, and ice crystals) (ICE3 Scheme [74]). The turbulence scheme is based on a prognostic equation for turbulent kinetic energy (TKE) using a 1.5 order closure 1D scheme [75] and radiation parameterization was based on the Rapid Radiative Transfer Model [76]. The surface fluxes are calculated based on different schemes, depending on the surface type (e.g., nature, urban, ocean, lake), and from the externalized surface model SURFEX [77].
The Meso-NH simulations were not designed to explicitly reproduce the fire plume, since fire–atmosphere coupling was not included. Their main purpose was to characterize the background thermodynamic and dynamic environment in which fire-related convection developed, including atmospheric instability, the vertical moisture profile, and wind structure [69]. The 2.5 km horizontal resolution allows the explicit representation of deep convective processes and is suitable for diagnosing CAPE, CIN, and the vertical circulation associated with intense convective events [31]. Thus, the simulations were used to describe the environmental conditions that favored or limited pyro-convective development, rather than to directly simulate the fire-forced updrafts.
Table 1 summarizes the datasets used in the analysis of the two wildfire events, including the sensors, data sources, spatial and temporal coverage, and their respective applications in the study.

Table 1.
Summary of datasets and models used in the analysis of each case study.
3. Results
3.1. Vegetation Conditions and Fire Radiative Power
The analysis of NDVI images (Figure 3) for the two case studies reveals distinct patterns of burned vegetation. Satellite images for the exact days of the events were not available; therefore, the closest images before and after the events were used to assess vegetation conditions.
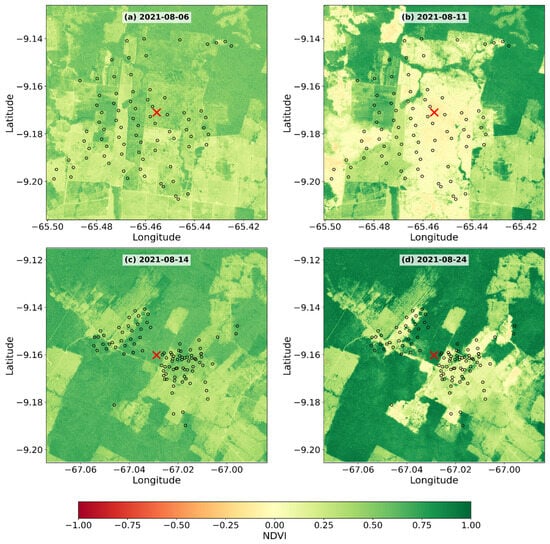
Figure 3.
NDVI Before and After Fire-Induced Convective Events: Case 1 (7 August 2021) and Case 2 (23 August 2021); (a) Pre-Case 1, (b) Post-Case 1, (c) Pre-Case 2, and (d) Post-Case 2. The dots represent active fires whereas red sign × fire location.
In Case 1 (Figure 3a,b), corresponding to 7 August 2021, the pre-event image (Figure 3a) shows a relatively homogeneous landscape, with NDVI values indicating dense and healthy vegetation. The post-event image from 11 August 2021 (Figure 3b) shows a reduction in NDVI in the central and western parts of the image in areas affected by the fire. It is also important to note that this region consists of pasture (Figure 2a). This pattern indicates that the effects of the fire were restricted to specific regions, and the daily spatial distribution of FRP confirms the fire activity distribution, with a concentration of high-energy fire pixels (Figure 4, left panel).
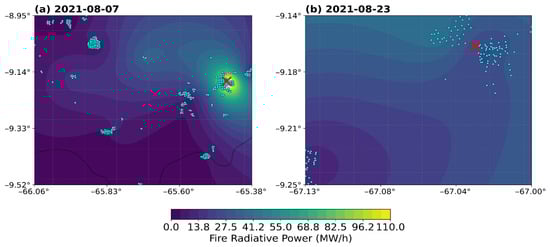
Figure 4.
Spatial distribution of daily Fire Radiative Power (FRP) derived from Suomi NPP and NOAA-20 VIIRS observations during 7 August 2021 (a) and 23 August 2021 (b). Each panel represents the interpolated FRP field for a single day based on active fire detections. The red cross (X) indicates the wildfires region.
The FRP density distribution (Figure 5), stratified into intensity classes (Low, Moderate, High, and Extreme), reveals a clear temporal evolution of fire activity before and after the case study. On 5 and 6 August 2021 (Figure 5a,b), the distribution is predominantly bimodal, with one mode associated with low to moderate intensities and a second mode already located within the Extreme class. Although the maximum density values occur in the highest intensity class, the magnitude of these extreme peaks remains relatively low compared to 7 August (Figure 5c), indicating the presence of elevated FRP values that were still infrequent and spatially less concentrated. On the subsequent days, 8 and 9 August (Figure 5d,e), a progressive reduction in extreme intensity is observed. On 8 August, the density maximum shifts back to the High class, suggesting a loss of the critical thermal concentration. On 9 August (Figure 5e), a renewed but localized increase in extreme FRP values is evident; however, these peaks lack the spatial coherence and intensity observed on 7 August (Figure 5c), which suggests the absence of a new significant wildfire event.
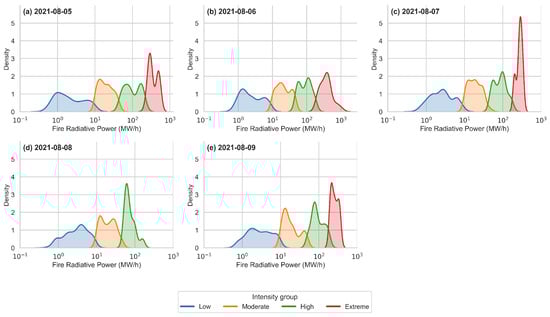
Figure 5.
Kernel density estimation (KDE) of Fire Radiative Power (FRP) for 5–9 August 2021, highlighting the temporal evolution of fire intensity on 7 August 2021. Panels (a–e) correspond to 5, 6, 7, 8, and 9 August 2021, respectively.
The day of 7 August 2021 stands out as the period of maximum FRP intensity and spatial concentration throughout the analyzed sequence, with an extreme, well-defined, and highly concentrated thermal core coinciding with the location of the wildfire event (Figure 4, left panel). The intense radiative energy release observed on this day indicates a strong fire-induced thermal forcing, capable of sustaining vigorous vertical motions and triggering fire-driven convection [31,34,78].
In Case 2 (Figure 3c,d), corresponding to the episode on 23 August 2021, the pre-event image (Figure 3c) shows generally high vegetation cover, although with areas of clearing due to natural fragmentation or agricultural practices. The post-event image (Figure 3d) shows a more pronounced and fragmented NDVI reduction, with larger and dispersed clearings. In this case, fire was observed affecting a forested area (Figure 2b). The 23 August case (Figure 4, right panel) stands out due to the concentration of active fires near point X, although FRP intensity is lower than Case 1.
Figure 6 presents the Kernel Density Estimation (KDE) of Fire Radiative Power (FRP) for the period from 20 to 24 August 2021, highlighting the temporal evolution of the thermal intensity associated with the event recorded on 23 August 2021. The analysis was performed in a point-based manner, considering exclusively the area where the fire developed, centered at approximately 9.1602° S, 67.0288° W. Consequently, the density estimates directly represent the variability in radiative energy release from the fire that acted as the primary thermal forcing for the triggering and intensification of convection.
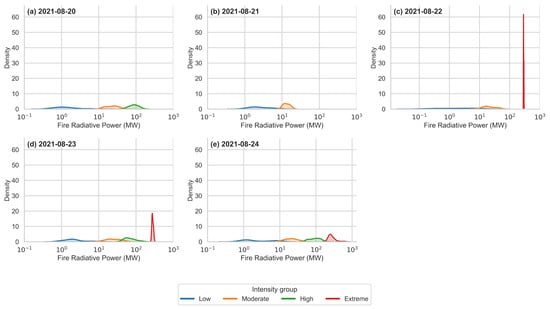
Figure 6.
Kernel density estimation (KDE) of Fire Radiative Power (FRP) for 20–24 August 2021, highlighting the temporal evolution of fire intensity in the event on 23 August 2021. Panels (a–e) correspond to 20, 21, 22, 23 and 24 August 2021, respectively.
In contrast to the first event (Figure 4, right panel), in which extreme energy release was abrupt and concentrated on the day of the event itself, this episode exhibits a more complex scenario, characterized by an extreme thermal forcing also established on the previous day (Figure 6c). On 22 August (Figure 6c), the KDE curves reveal a marked increase in density within the Extreme class, with values reaching approximately 60, sharply contrasting with periods without severe convective activity, when extreme densities are absent (Figure 6a,b).
On 23 August (Figure 6d), the maximum density in the Extreme class showed slightly lower values, around 20, yet still exceptionally high from an energetic perspective and when compared to 20 and 21 August (Figure 6a,b). On 24 August (Figure 6e), a progressive decline in density within the Extreme class was observed, with the distribution gradually shifting back toward lower and moderate intensity ranges.
Comparison between the two cases highlights that higher-energy fire-induced convective events can be associated with the heterogeneous aspects of the land cover of the region, namely pasture (Case 1) and forested area (Case 2), and the active fire concentration. For instance, Case 1 was characterized as an agglomeration of active fires, whereas Case 2 it was more spatially dispersed. These results reinforce the relationship between convection intensity and biomass loss, emphasizing the importance of continuous monitoring of wildfires with high temporal and spatial resolution to assess the impacts of extreme events on Amazonian ecosystems.
3.2. Meteorological Conditions and Cloud Development
Aiming to identify the main features of the wildfires in an atmospheric context, this section presents the results for both periods individually, highlighting the large-scale circulation and fire–weather conditions, the vertical structure of the atmosphere and meteorological phenomena identified by satellite images.
3.2.1. Case 1: 7 August 2021
Large-Scale Environment
The complete analysis and discussion of the large-scale circulation and wind fields are presented in the Supplementary Materials (Figures S1–S6). Table 2 summarizes the wind characteristics at different atmospheric levels during the 7 August 2021 wildfire. It highlights how the combination of moderate winds aloft, weak flow at mid-levels, and calm conditions near the surface can create a vertically favorable environment for the convective column. This wind profile, together with the location of the observed FRP hotspot, indicates that the convective column may have developed almost vertically above the fire-affected area, maintaining its radial morphology and relative stationarity [31,33,36,67,78,79].
Table 2.
Summary of wind characteristics at 250 hPa, 500 hPa, and 850 hPa levels during the wildfire event on 7 August 2021 (Case 1).
Fire–Weather Conditions and Vertical Structure of the Atmosphere
The Meso-NH model simulations allowed for the characterization of the fire–weather conditions and thermodynamic environment associated with each event. The simulation complemented the soundings obtained near the wildfire giving insights into atmospheric instability and the depth and intensity of convective processes on the atmosphere.
Fire–weather elements like air temperature, relative humidity and wind field near the surface are crucial to support fire ignition and its development. Figure 7 shows high temperatures (>30 °C), relatively low relative humidity values (<50%), and weak wind speeds (<2.5 m/s) favouring fire development in the afternoon.
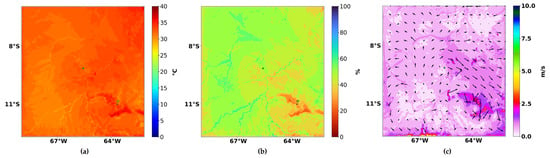
Figure 7.
Fire–weather variables at 18:00 UTC on 7 August 2021 obtained from the 2.5 km resolution simulation: (a) air temperature at 2 m, (b) relative humidity at 2 m, and (c) wind field (m/s), speed and direction at 10 m. Green dot represents the wildfire location.
Concerning the vertical structure of the atmosphere, the nearest sounding launched on that day shows a stable atmosphere in the region at 12:00 UTC (Figure 8a). The simulated profile at 15:00 UTC shows moderate convection (Figure 8b). The cloud condensation level (LCL) is located at 1032 m, while the level of free convection (LFC) reaches 4367 m, indicating that the air parcel needs to rise approximately 4.3 km before becoming unstable. The SB-CAPE is −741.21 J/kg and the ML-CAPE is 39.43 J/kg, suggesting instability sufficient for moderate vertical updrafts. Convective inhibition (CIN) presents intermediate values (SB-CIN = −60.89 J/kg; ML-CIN = −88.92 J/kg), indicating initial barriers that limit convective development.
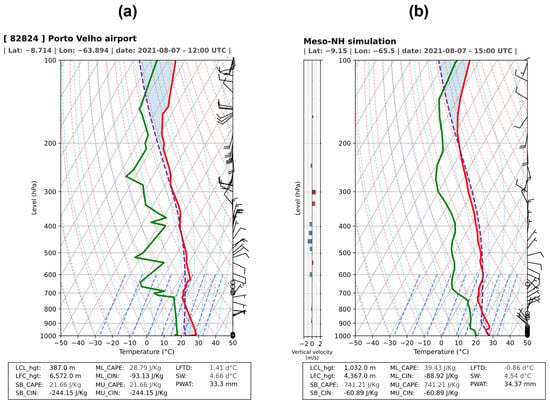
Figure 8.
Thermodynamic profiles from (a) sounding launched from Porto Velho at 12:00 UTC, 7 August 2021, and (b) simulated by the Meso-NH model at 15:00 UTC in the wildfire region on 7 August 2021, with a horizontal model resolution of 2.5 km. The solid red and green lines represent temperature and dew point temperature, respectively. The dashed purple line represents the profile path. CAPE and CIN areas are shaded in red and blue, respectively.
The temperature profile shows a limited convective plume, with a thermal gradient typical of a low tropopause, reaching approximately 500 hPa. The lifted freezing level (LFTD) is −0.86 °C, the SW is 4.54 °C, and the precipitable water (PWAT) reaches 34.37 mm, indicating moderate moisture content and sufficient for condensation. The wind and omega diagram (left subpanel of Figure 8b) shows localized upward currents, with positive omega values close to 2 Pa/s in some layers. Overall, the event presents a narrow plume of moderate intensity without significant stratospheric penetration, characteristic of a typical PyroCu environment [31].
Satellite Observation and Cloud Development
This sub-section highlights the main features of the wildfire event from satellite observation. In Case 1 (August 7), a pyro-cumulus plume emerged around 14:50 UTC over the fire hotspot located at coordinates (−9.13; −65.49), approximately 77.5 km east of Vista Alegre do Abunã. During the entire observed period, from 15:30 to 21:00 UTC (Figure 9), the plume remained relatively stationary over the burn site, exhibiting a radial morphology and grayish coloration in the True Color images (Figure 9a–c), indicating a high soot concentration. Analysis of the infrared (Figure 9d–f) channel revealed the first significant cloud cooling at 16:40 UTC, with a minimum brightness temperature of −4.5 °C at 17:00 UTC (Figure 9g), reaching its convective peak around 19:30 UTC, followed by the onset of dissipation. Considering the observed FRP and atmospheric conditions, the PyroCu cloud developed as a relatively narrow plume of moderate intensity. Although the Meso-NH model does not include fire–atmosphere coupling, observations indicate that localized heating from active fires may have contributed qualitatively to the plume’s vertical growth, supporting its persistence above the hotspot under the ambient CAPE and CIN conditions.
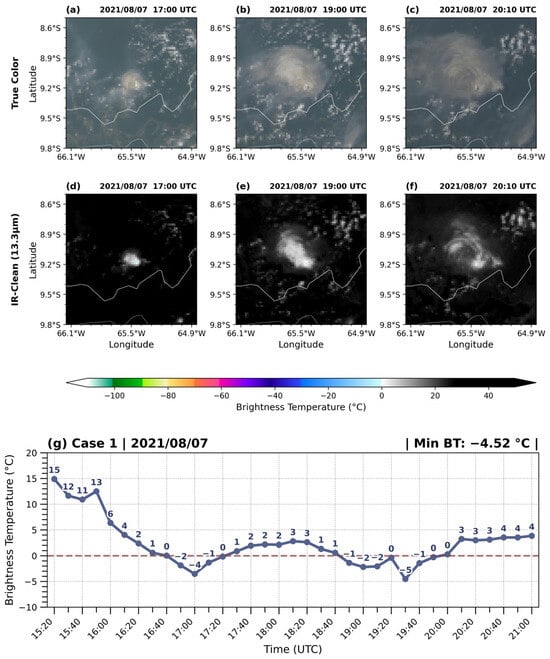
Figure 9.
GOES-16 satellite images with True Color composites (channels 1, 2, and 3; 0.47 μm, 0.64 μm, 0.865 μm; panels (a–c)) and Infrared channel (channel 13; 10.3 μm; panels (d–f)) for Case 1 on 7 August 2021, at 17:00 (a,d), 19:00 (b,e), and 20:10 (c,f) UTC, and the temporal variation of minimum brightness temperature (blue line; °C; panel (g)) in the infrared channel (channel 13; 10.3 μm) of the GOES-16 satellite between 15:00 and 21:00 UTC on 7 August 2021. The dashed red lines indicate the 0 °C isotherm.
3.2.2. Case 2: 23 August 2021
Large-Scale Environment
The complete analysis of the large-scale circulation and wind fields for Case 2 (Figures S4–S6) is provided in the Supplementary Material. To synthesize the atmospheric conditions associated with the second event, Table 3 summarizes the wind intensity and the prevailing flow direction at key tropospheric levels. This integrated view highlights how the vertical distribution of relatively weak to moderate winds, combined with a consistent directional shear from easterly flow in the lower troposphere to westerly flow aloft, may have created a dynamic environment favorable for the organization, vertical development, and persistence of a convective column in the presence of an active fire. The table provides a concise framework linking the wind structure at different levels to the potential evolution of a PyroCb-type cloud.
Table 3.
Summary of wind characteristics at 250 hPa, 500 hPa, and 850 hPa levels during the wildfire event on 23 August 2021.
Fire–Weather Conditions and Vertical Structure of the Atmosphere
Fire–weather conditions obtained from the Meso-NH simulation at 2.5 km resolution are shown in Figure 10. The results revealed high temperatures (~35 °C), relative humidity values of 50%, and weak wind speeds (<2.5 m/s) in the afternoon.
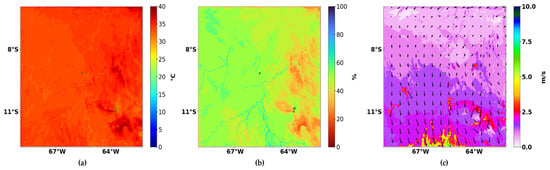
Figure 10.
Fire–weather variables at 18:00 UTC on 23 August 2021 obtained from the 2.5 km resolution simulation: (a) air temperature at 2 m, (b) relative humidity at 2 m, and (c) wind field (m/s), speed and direction at 10 m. Green dot represents the wildfire location.
For the vertical structure of the atmosphere (Figure 11), the sounding launched in Rio Branco city at 12:00 UTC (Figure 11a) shows a weak to moderate atmospheric instability in the late morning and high values of precipitable water (PWAT = ~45 mm). However, the profile simulated at 2.5 km resolution near the wildfire shows an increase in atmospheric instability during the afternoon and a highly unstable atmosphere at 18:00 UTC (Figure 11b). The LCL and LFC coincide at 1418 m, allowing the air parcel to rise freely without initial barriers. The SB-CAPE is 3143.41 J/kg and the ML-CAPE is 1583.09 J/kg, indicating strong instability capable of sustaining deep updrafts. CIN is zero (0 J/kg), enabling immediate and vigorous convective development.
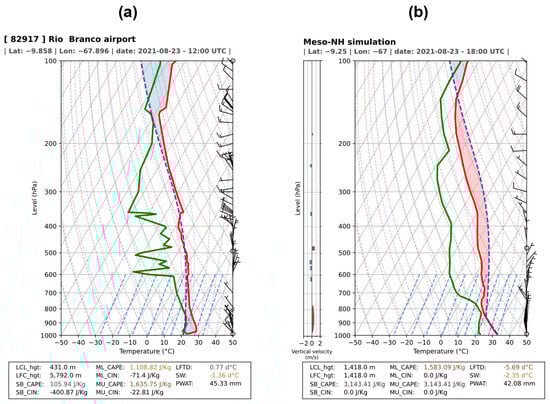
Figure 11.
Thermodynamic profiles from (a) sounding launched from Rio Branco at 12:00 UTC, 23 August 2021, and (b) simulated by the Meso-NH model at 18:00 UTC in the wildfire region on 23 August 2021, with a horizontal model resolution of 2.5 km. The solid red and green lines represent temperature and dew point temperature, respectively. The dashed purple line represents the profile path. CAPE and CIN areas are shaded in red and blue, respectively.
The temperature profile shows a robust and deep plume (Figure 11b), with an LFTD of −5.69 °C and a negative SW (−2.35 °C), indicating strong instability in the upper layer and potential ascent up to the tropopause. The PWAT of 42.08- mm indicates a deeply moist atmosphere, essential for intense convection. The wind diagram suggests vertically organized flow, with wind intensification with height, favoring ventilation and maintenance of the convective plume.
In summary, the event of 7 August 2021 (PyroCu) is characterized by moderate convection, initial CIN barriers, and restricted vertical development, whereas the event of 23 August 2021 shows deep convection and absence of inhibition. The Meso-NH simulations reproduce these contrasting pyro-convective scenarios, highlighting the importance of atmospheric instability, moisture content, and vertical wind structure [32,51,70]. Observed FRP data suggest that localized fire heating may have contributed qualitatively to the vertical development of the PyroCu cloud [60].
Satellite Observation and Cloud Development
In Case 2 (23 August 2021), the temporal evolution of the pyro-convective plume is illustrated using GOES-16 True Color and infrared imagery (Figure 12). At 17:00 UTC, the True Color image (Figure 12a) shows the initial development of the plume over the fire-affected area, characterized by a localized and relatively compact structure. At 18:10 UTC (Figure 12b), the plume exhibits a clear increase in vertical extent and horizontal spreading, with enhanced brightness and a denser appearance, indicating intensification of the convective process. By 19:00 UTC (Figure 12c), the plume reaches its maximum spatial extent and organization, displaying a well-defined convective core.
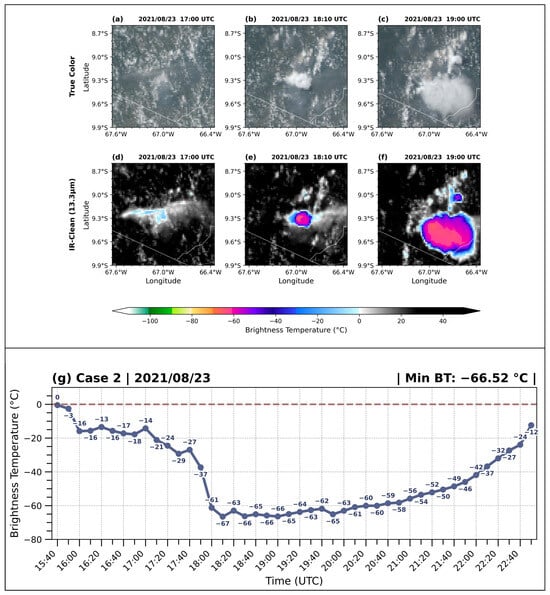
Figure 12.
GOES-16 satellite images with True Color composites (channels 1, 2, and 3; 0.47 μm, 0.64 μm, 0.865 μm; panels (a–c)) and Infrared channel (channel 13; 10.3 μm; panels (d–f)) for the wildfire event on 23 August 2021 at 17:00 (a,d), 18:10 (b,e), and 19:00 (c,f) UTC, and the temporal variation of minimum brightness temperature (blue line; °C; panel (g)) in the infrared channel (channel 13; 10.3 μm) of the GOES-16 satellite between 14:00 UTC on 23 August and 00:40 UTC on 24 August 2021. The dashed red lines indicate the 0 °C isotherm.
The infrared channel images at the same time (Figure 12d–f) provide evidence of rapid cloud-top cooling associated with plume intensification. At 17:00 UTC (Figure 12d), moderately cold brightness temperatures are observed, marking the early convective stage. A pronounced cooling occurs by 18:10 UTC (Figure 12e), followed by the development of very cold cloud tops at 19:00 UTC (Figure 12f), consistent with strong vertical growth. The temporal evolution of brightness temperature (Figure 12g) highlights a sharp decrease, reaching a minimum value of −65.2 °C, which denotes the peak convective intensity of the event. In this case (Case 2—Cb/PyroCb hereafter), it is clear the development of a cumulonimbus cloud over the wildfire region. Although the cloud exhibited features consistent with pyro-convective development, the lack of direct evidence of plume–cloud coupling and of cloud-top height relative to the tropopause prevents a definitive classification of this system as a PyroCb. This should be recognized as a key limitation of the study. Observed FRP values indicate active fire presence, but without fire–atmosphere coupling in the Meso-NH simulations, only a qualitative assessment of the fire’s contribution to vertical development is possible. Since FRP values are lower than the first case and a favorable condition for the development of deep convective clouds existed, the lack of observation does not allow establishing a direct link between the active fires and convective system, leaving uncertainties for the definition of this case as a typical PyroCb that forms directly from the fire.
4. Discussion
The study presents two case studies of wildfires in southern Amazon in August 2021. The periods were initially analyzed from the vegetation aspects and fire radiative power, followed by the meteorological conditions that helped to obtain an overview of the challenges that can arise when seeking identification of pyro-convective clouds in the region. The lack of observational data prevents an in-depth analysis of the clouds identified by the satellite. However, the periods were characterized as Case 1—PyroCu and Case 2—Cb/PyroCb-like. Although the cloud in Case 2 developed above active fires and exhibited features consistent with pyro-convective activity, the absence of direct measurements of cloud-top height relative to the tropopause prevents a definitive classification as a PyroCb. Additionally, since the Meso-NH simulations do not include fire–atmosphere coupling, only a qualitative assessment of the fire’s contribution to vertical development is possible. Accordingly, this limitation is considered an important methodological aspect of the study.
Although the Meso-NH simulations do not include fire–atmosphere coupling, they adequately reproduce the main thermodynamic and large-scale features observed during both events. In Case 1, the model represents a moderately unstable atmosphere with non-negligible CIN and limited CAPE, consistent with the observed shallow pyro-convective development (PyroCu). In Case 2, the simulations show a highly unstable environment with large CAPE, near-zero CIN, and a deep moist profile, in agreement with the development of a deep convective system over the fire-affected area observed by satellite.
However, the model cannot reproduce the buoyancy induced by the fire itself, the narrow structure of the smoke plume, or the direct plume–cloud coupling observed in satellite imagery. Therefore, the role of fire heating in triggering or intensifying convection is interpreted qualitatively, and the Meso-NH results are used as environmental constraints on convection rather than as a full representation of pyro-convective dynamics.
In this sense, the modeling is used as a complementary tool to distinguish between situations in which the background atmosphere alone is sufficient to sustain deep convection (Case 2) and those in which fire-related thermal forcing is likely required to explain the observed cloud development (Case 1).
Although systematic studies of pyro-convective thresholds in the Amazon are still lacking, previous work in other regions has shown that both fire intensity and background atmospheric instability influence the transition from PyroCu to deep convection, e.g., [31,34]. In this context, the two cases analyzed here allow an interpretation based on physical consistency with the literature rather than a purely descriptive comparison.
The results suggest that, under Amazonian conditions, the large-scale thermodynamic environment likely exerts primary control on whether fire-related convection remains shallow (PyroCu-like) or develops into deep convective systems with characteristics compatible with PyroCb-like behavior, while FRP acts as a secondary modulator of the initial buoyancy of the fire-affected updraft.
Land-use type may further influence fire behavior and plume structure through differences in fuel load and moisture availability, as discussed in previous studies of fire dynamics and combustion efficiency in different vegetation types, e.g., [21,27,51]. In the present cases, grassland fires (Case 1) were associated with localized high FRP but only shallow pyro-convective development, whereas fires in forested areas (Case 2), despite lower FRP, occurred under a much more unstable atmospheric background and were associated with deep convection developing over fire-affected regions.
These results are consistent with previous studies conducted in mid-latitude regions but also highlight the lack of dedicated observational and modeling studies of pyro-convection in tropical South America. This underscores the need for future work to establish regional relationships between fire energy release, atmospheric instability, and the occurrence of PyroCu- versus PyroCb-like convection.
During the PyroCu event on 7 August (Case 1), the wildfire was characterized by an agglomerate of active fires with high FRP values (>100 MW/h), and the fire–weather conditions near the surface were marked by high air temperature (>30 °C) and relative humidity below 50% and weak wind speeds (<2.5 m/s). The upper troposphere (250 hPa) remained relatively calm, with predominantly southerly flow ranging from 10 to 20 m/s. This calmness acted as a “favorable cap,” allowing the convective column to ascend vertically without premature horizontal dispersion. Small variations in wind direction in adjacent areas indicated a relatively homogeneous dynamic environment, contributing to the plume’s persistence over the hotspot and maintenance of its radial morphology. At the mid-level (500 hPa), weak east/northeast winds favored vertical motion of the plume. Any potential contribution of fire heating is not represented in the Meso-NH simulations and is considered only qualitatively based on observations. At the lower level (850 hPa), low wind intensity and high convective inhibition (CIN) indicated that the atmosphere did not provide dynamical support for spontaneous convection, making fire-related thermal forcing inferred from observations a likely contributor to the column’s vertical development [80,81]. The combination of these factors suggest that the plume remained concentrated over the hotspot, reaching moderate altitudes with a LFC of approximately 4367 m and SB-CAPE of 741 J/kg, consistent with moderate convection [34,79].
In contrast, during the Cb/PyroCb event on 23 August (Case 2), the wildfire was characterized by more dispersed active fires and lower FRP values (25–30 MW/h). However, the atmosphere exhibited much more favorable conditions for deep convection, suggesting that even lower FRP values, in combination with an unstable background environment, can be associated with deep convective development [31,34,78,82]. The convective cloud formed over the active fires, but we lack evidence of a direct link between the fire convective column and cloud development, as identified in Case 1 when pyroCu developed enveloped in a high quantity of smoke. This second case reveals the challenges of studying fire phenomena in this tropical region, specially due the lack of observational data.
At the surface, fire–weather conditions included high temperatures (~35 °C), relative humidity values of 50%, and weak wind speeds (<2.5 m/s) in the afternoon. The large-scale circulation in the upper-levels (250 hPa) revealed moderately strong and consistently west/northwest winds with low horizontal variability, favoring the verticalization of the plume and its relative stationarity. At the mid and lower levels (500 and 850 hPa, respectively), directional wind shear with height remained of low magnitude, promoting vertical organization of the convection [81,82]. The lower level (850 hPa) exhibited weak winds, providing low turbulence and absence of strong jets, creating a highly conducive environment for vertical motion [36,82]. The potential effect of fire heating on the plume is not explicitly represented in Meso-NH and is interpreted qualitatively from observational data.
Therefore, this configuration allowed the column to breach the tropopause and form the characteristic Cumulonimbus (Cb) morphology, reaching stratospheric altitudes without excessive dispersion and consistent with other studies of PyroCb clouds [31,83]. In this case, the main challenge was to differentiate the pyroCb from a Cb developing over active fires with low FRP values, which represented the main limitation of this study. In addition, the lack of direct observations of plume–cloud coupling and of cloud-top height relative to the tropopause prevents a fully robust classification of this system as a true PyroCb, and this must be considered a key methodological limitation of the present analysis. The fire plume exhibited deep convective development, visible in the satellite images at different stages, with progressive cooling at the top of the plume, indicating the intensification of the convective system developing over the fire-affected region. The system evolved into an intense Cumulonimbus (Cb), reaching significantly low brightness temperatures, at which point it began its dissipation process. This case highlights how the interaction between local thermodynamic conditions and the intense heat released by fires can generate deep convective systems with rapid evolution and strong convective intensity, emphasizing the role of wildfires as a potential contributor in environments already favorable to deep convection, rather than a directly simulated trigger [31,83].
Analysis of FRP density (KDE) reinforces the differences between the events. In the first case, the radiative energy peak was concentrated on the day of the event, reflecting a moderately intense, short-lived fire event. In Case 2, significant radiative energy was observed both on the day before and on the day of the event, indicating prior heat accumulation, while the unstable atmosphere in this case provided the dynamic trigger for the vertical development of the convective system over the fire-affected area, consistent with the literature [7,34]. This scenario demonstrates that the combination of extreme energy release and favorable atmospheric conditions is critical for the transition from an intense plume to a deep convective system with characteristics compatible with PyroCb, rather than a definitively classified PyroCb [31,84].
The identification and understanding of the dynamics and microphysics of pyro-convective clouds is a topic that has been discussed in the scientific community for the last two decades, but has gained more attention in recent years due to the increasing number of extreme fire occurrences and the dangers associated with them, e.g., [85,86]. Pyro-convective clouds are recognized for exhibiting a different microphysics than traditional convective clouds, all because fire aerosols influence the microphysical processes inside the cloud, which have also been called pyro-meteors [87]. Therefore, several challenges remain in the context of fire–atmosphere interaction and related phenomena.
Beyond the scientific characterization of the events, the results have direct implications for fire hazard and risk management in the Amazon, particularly in the AMACRO region, which represents an expanding frontier of deforestation and fire use [21,27,51]. The analysis indicates that, under highly unstable atmospheric conditions, even fires with moderate FRP can be associated with deep convective development, increasing the unpredictability of fire behavior and allowing plumes to rapidly intensify and organize into vertically extensive systems capable of modifying local and regional circulation, as observed in other pyro-convective environments [31,34,83,84]. Such systems can inject large amounts of smoke and aerosols into the upper troposphere and potentially near the lower stratosphere, favoring long-range transport and increasing impacts on air quality, aviation safety, and regional radiative balance [31,83,85,86]. In a region with rapidly changing land use and limited observational infrastructure, this represents an additional challenge for fire monitoring and early-warning systems, highlighting the need for integrated fire–atmosphere surveillance strategies that consider not only fire intensity but also background atmospheric instability as a key driver of hazardous fire behavior [34,79,82].
In summary, this study demonstrates that pyro-convective events in the Amazon can vary significantly in intensity and impact depending on the interaction between wildfire energy accumulation and largely atmospheric configuration. The presentation of two distinct cases, with different atmospheric stability and wind profiles, provides robust evidence of the importance of considering vertical wind structure and thermal energy availability in the development of pyro-convective clouds in the region, or deep Cb clouds developing over active fires with low FRP values. Moreover, it underscores the need for integrated wildfire and atmospheric monitoring to assess the risk of fire-associated convection in the region under specific atmospheric stability regime, filling a relevant gap in the scientific literature.
5. Conclusions
This study represents an effort and a step towards a better understanding of the development of pyro-convective clouds in the Amazon region, an area known worldwide for deforestation caused by fire. However, numerous challenges remain due to the lack of observations, which hinders an in-depth study of these convective systems and physical processes that occur as a result of fires in the region.
In the present study, a small pyro-convective cloud (PyroCu) was identified above a cluster of active fire with high FRP values and high amount of smoke, emphasizing the origin of this cloud from the fire convective column. In the second case, although the active fire appeared more dispersed and with lower FRP values, a deep convective cloud developed, presenting typical cumulonimbus features. However, due to the fact that this system developed over a region of active fires, the study suggests that this system could be considered a pyrocumulonimbus, although some uncertainty remains.
In Case 1, the PyroCu event, the plume remained relatively stationary, with moderate convection limited by CIN and weak to moderate winds. In contrast, in Case 2, Cb/PyroCb, the cloud system developed in a highly unstable environment, with elevated CAPE, near-zero CIN, and low vertical wind shear, allowing ascent up to the upper troposphere. Furthermore, the results demonstrate that the intensity and extent of fire-induced convection depend on the interaction between the thermal energy accumulated by the fire and the vertical structure of the atmosphere. Extreme events, such as PyroCb, require pre-accumulated heat and favorable conditions of instability for the rapid development of deep convective columns.
The main scientific contribution of this study is the demonstration that, under Amazonian conditions, background atmospheric instability exerts a primary control on the transition from PyroCu-like clouds to deep convection, while FRP acts as a secondary modulator of initial buoyancy. In contrast to many mid-latitude and Australian studies, where extreme fire intensity is often the dominant factor in PyroCb formation, our results show that even relatively low FRP values can be associated with deep convection when CAPE is large and CIN is weak.
Methodologically, this work introduces a physically consistent integration of satellite-derived fire radiative power, KDE-based FRP density, and convection-resolving atmospheric simulations to diagnose pyro-convective potential in a tropical region where such approaches remain rare. Rather than proposing a new algorithm, the novelty lies in applying this combined framework to Amazonia to distinguish between PyroCu-like and PyroCb-like regimes based on environmental controls.
In terms of atmospheric dispersion and atmospheric chemistry modeling, these results emphasize the role of thermodynamic structure in controlling smoke plume behavior in tropical fires. The identification of CAPE and CIN as key factors in the vertical development of the plume suggests that coupled dispersion–chemistry systems may benefit from explicitly representing atmospheric stability when prescribing smoke injection heights. In this sense, physically based guidance is provided to support the improvement and evaluation of existing plume-rise models.
Despite these advances, major challenges remain. In particular, the lack of sustained observational efforts in the region limits progress beyond exploratory analyses. Establishing an observation network for continuous monitoring is therefore crucial. Integrated wildfire monitoring and detailed atmospheric analysis are essential for improving the understanding of Amazonian vegetation vulnerability and for informing strategies to mitigate risks associated with extreme pyro-convective events.
Overall, this work provides region-specific evidence that pyro-convection in southern Amazonia is primarily modulated by the thermodynamic structure of the tropical atmosphere, with fire acting as an effective trigger only in environments already favorable to deep convection. This represents a distinct contribution to the global understanding of fire–convection interactions in tropical environments.
By contributing to a better representation of plume rise and vertical injection in dispersion–chemistry frameworks, these findings may help reduce uncertainties in simulated smoke transport and its potential implications for air quality and aerosol–radiation interactions over the Amazon and surrounding regions.
Finally, this study provides evidence of the development of pyro-convective clouds, but emphasizes the challenge of understanding their internal dynamics in the region. This study is ongoing, and efforts have been directed to automatic identification of these systems over this tropical region from satellite imagery, which will support decision-makers and future developments. Fire–atmosphere coupled simulations can be useful, but require high computational costs. On the other hand, how these pyro-convective clouds can impact tropics and climate remains unknown and observation remains indispensable for clarifying these issues.
Supplementary Materials
The following supporting information can be downloaded at https://www.mdpi.com/article/10.3390/atmos17020173/s1. Figure S1. Wind fields (m/s) in the upper troposphere (250 hPa) over the wildfire location and surrounding areas on 7–8 August 2021. Panels show the diurnal evolution at (a) 06:00 UTC, (b) 12:00 UTC, (c) 18:00 UTC, and (d) 00:00 UTC on 8 August; Figure S2. Wind fields (m/s) in the mid-troposphere (500 hPa) over the wildfire location and surrounding areas on 7–8 August 2021. Panels show the diurnal evolution at (a) 06:00 UTC, (b) 12:00 UTC, (c) 18:00 UTC, and (d) 00:00 UTC on 8 August; Figure S3. Wind fields (m/s) in the lower troposphere (850 hPa) over the wildfire location and surrounding areas on 7–8 August 2021. Panels show the diurnal evolution at (a) 06:00 UTC, (b) 12:00 UTC, (c) 18:00 UTC, and (d) 00:00 UTC on 8 August; Figure S4. Wind fields (m/s) in the upper troposphere (250 hPa) over the wildfire location and surrounding areas on 23–34 August 2021. Panels show the diurnal evolution at (a) 06:00 UTC, (b) 12:00 UTC, (c) 18:00 UTC, and (d) 00:00 UTC on 8 August; Figure S5. Wind fields (m/s) in the mid-troposphere (500 hPa) over the wildfire and surrounding areas on 23–24 August 2021. Panels show the diurnal evolution at (a) 06:00 UTC, (b) 12:00 UTC, (c) 18:00 UTC, and (d) 00:00 UTC on 8 August; Figure S6. Wind fields (m/s) in the lower troposphere (850 hPa) over the wildfire and surrounding areas on 23–24 August 2021. Panels show the diurnal evolution at (a) 06:00 UTC, (b) 12:00 UTC, (c) 18:00 UTC, and (d) 00:00 UTC on 8 August.
Author Contributions
Conceptualization, K.F.d.S.B., F.T.C. and P.V.d.A.M.; Data curation, K.F.d.S.B., F.T.C. and P.V.d.A.M.; Formal analysis, K.F.d.S.B., F.T.C., P.V.d.A.M.; M.C.L.d.S. and C.B.; Investigation, K.F.d.S.B., F.T.C. and P.V.d.A.M.; Methodology, K.F.d.S.B. and F.T.C.; Software, K.F.d.S.B., F.T.C. and M.C.C.L.; Supervision, F.T.C. and H.B.G. (Helber Barros Gomes); Validation, F.T.C., D.L.H., F.D.d.S.S., J.N., H.B. and M.T.S.; Visualization, H.B.G. (Heliofábio Barros Gomes), R.L.C., J.d.B.S.; F.L.d.A.P.; and D.M.C.d.L.; Writing—original draft, K.F.d.S.B.; Writing—review and editing, F.T.C. and H.B.G. (Helber Barros Gomes). All authors have read and agreed to the published version of the manuscript.
Funding
This research received no external funding.
Institutional Review Board Statement
Not applicable.
Informed Consent Statement
Not applicable.
Data Availability Statement
The data presented in this study are available from the following public domain resources. Active fire data from the Visible Infrared Imaging Radiometer Suite (VIIRS) aboard the Suomi National Polar-orbiting Partnership (S-NPP) and NOAA-20 satellites are available from the Fire Information for Resource Management System (FIRMS), operated by NASA (https://firms.modaps.eosdis.nasa.gov/download/; accessed on 27 December 2025). Vegetation index data (NDVI) derived from VIIRS and Sentinel-2 sensors were accessed and processed through the Google Earth Engine platform (https://earthengine.google.com/; accessed on 27 December 2025). Large-scale atmospheric circulation fields were obtained from the European Centre for Medium-Range Weather Forecasts (ECMWF) Analysis through the Meteorological Archival and Retrieval System (MARS) (https://www.ecmwf.int/; accessed on 27 December 2025). The numerical simulations performed with the Meso-NH model were generated specifically for this study and are available from the corresponding author upon reasonable request.
Acknowledgments
The authors thank the Coordination for the Improvement of Higher Education Personnel (CAPES, Brazil), the Federal University of Campina Grande (UFCG), the Federal University of Alagoas (UFAL), and the University of Évora for their institutional support.
Conflicts of Interest
The authors declare no conflicts of interest.
References
- Johnston, F.H.; Henderson, S.B.; Chen, Y.; Randerson, J.T.; Marlier, M.; DeFries, R.S.; Kinney, P.; Bowman, D.M.J.S.; Brauer, M. Estimated global mortality attributable to smoke from landscape fires. Environ. Health Perspect. 2012, 120, 695–701. [Google Scholar] [CrossRef] [PubMed]
- Xu, R.; Yu, P.; Abramson, M.J.; Johnston, F.H.; Samet, J.M.; Bell, M.L.; Haines, A.; Li, S.; Guo, Y. Wildfires, global climate change, and human health. N. Engl. J. Med. 2020, 383, 2173–2181. [Google Scholar] [CrossRef] [PubMed]
- O’Dell, K.; Hornbrook, R.S.; Permar, W.; Levin, E.J.T.; Garofalo, L.A.; Apel, E.C.; Blake, N.J.; Jarnot, A.; Pothier, M.A.; Farmer, D.K.; et al. Correction to Hazardous Air Pollutants in Fresh and Aged Western US Wildfire Smoke and Implications for Long-Term Exposure. Environ. Sci. Technol. 2022, 56, 5. [Google Scholar] [CrossRef]
- Forgioni, F.P.; Bresciani, C.; Reis, A.; Müller, G.V.; Herdies, D.L.; Cabral Júnior, J.B.; dos Santos Silva, F.D. Aerosol Transport from Amazon Biomass Burning to Southern Brazil: A Case Study of an Extreme Event During September 2024. Atmosphere 2025, 16, 1138. [Google Scholar] [CrossRef]
- Bezerra, K.F.S.; Gomes, H.B.; Nascimento, J.; Ray, P.; Baltaci, H.; Silva, M.C.L.; Herdies, D.L.; Silva, F.D.S.; Gomes, H.B.; de Oliveira-Júnior, J.F.; et al. Tropical Wildfires Analyzed Through Remote Sensing and Machine Learning. Earth Syst. Environ. 2025. [Google Scholar] [CrossRef]
- Bezerra, K.F.S.; Gomes, H.B.; Nascimento, J.P.; Herdies, D.L.; Baltaci, H.; Silva, M.C.L.; de Oliveira, G.; Koster, E.; Gomes, H.B.; Silva, M.T.; et al. Fire and the Vulnerability of the Caatinga Biome to Droughts and Heatwaves. Atmosphere 2026, 17, 46. [Google Scholar] [CrossRef]
- Aragão, L.E.O.C.; Anderson, L.O.; Fonseca, M.G.; Rosan, T.M.; Vedovato, L.B.; Wagner, F.H.; Silva, C.V.J.; Silva Junior, C.H.L.; Arai, E.; Aguiar, A.P.; et al. 21st Century drought-related fires counteract the decline of Amazon deforestation carbon emissions. Nat. Commun. 2018, 9, 536. [Google Scholar] [CrossRef]
- Libonati, R.; Pereira, J.M.C.; Da Camara, C.C.; Peres, L.F.; Oom, D.; Rodrigues, J.A.; Santos, F.L.M.; Trigo, R.M.; Gouveia, C.M.P.; Machado-Silva, F.; et al. Twenty-first century droughts have not increasingly exacerbated fire season severity in the Brazilian Amazon. Sci. Rep. 2021, 11, 4400. [Google Scholar] [CrossRef]
- Westerling, A.L.; Hidalgo, H.G.; Cayan, D.R.; Swetnam, T.W. Warming and earlier spring increase Western U.S. forest wildfire activity. Science 2006, 313, 940–943. [Google Scholar] [CrossRef]
- Dennison, P.E.; Brewer, S.C.; Arnold, J.D.; Moritz, M.A. Large wildfire trends in the western United States, 1984–2011. Geophys. Res. Lett. 2014, 41, 2928–2933. [Google Scholar] [CrossRef]
- Westerling, A.L. Correction to ‘Increasing Western US Forest Wildfire Activity: Sensitivity to Changes in the Timing of Spring’. Philos. Trans. R. Soc. B Biol. Sci. 2016, 371, 20160373. [Google Scholar] [CrossRef]
- Parks, S.A.; Abatzoglou, J.T. Warmer and drier fire seasons contribute to increases in area burned at high severity in western US forests from 1985 to 2017. Geophys. Res. Lett. 2020, 47, e2020GL089858. [Google Scholar] [CrossRef]
- Flannigan, M.D.; Krawchuk, M.A.; de Groot, W.J.; Wotton, B.M.; Gowman, L.M. Implications of changing climate for global wildland fire. Int. J. Wildland Fire 2009, 18, 483–507. [Google Scholar] [CrossRef]
- Yue, X.; Mickley, L.J.; Logan, J.A.; Kaplan, J.O. Ensemble projections of wildfire activity and carbonaceous aerosol concentrations over the western United States in the mid-21st century. Atmos. Environ. 2013, 75, 54–64. [Google Scholar] [CrossRef]
- Barbero, R.; Abatzoglou, J.T.; Larkin, N.K.; Kolden, C.A.; Stocks, B. Climate change presents increased potential for very large fires in the contiguous United States. Int. J. Wildland Fire 2015, 24, 892–899. [Google Scholar] [CrossRef]
- Abatzoglou, J.T.; Williams, A.P. Impact of anthropogenic climate change on wildfire across western US forests. Proc. Natl. Acad. Sci. USA 2016, 113, 11770–11775. [Google Scholar] [CrossRef] [PubMed]
- Bezerra, K.F.S.; Baltaci, H.; Ray, P.; Nascimento, J.P.; Herdies, D.L.; Lyra, M.J.A.; Silva, M.C.L.; Silva, F.D.S.; e Silva, C.M.S.; Gomes, H.B. Simultaneous Drought and Heatwave Events During Austral Summer in Northeast Brazil. Int. J. Climatol. 2025, 45, e8920. [Google Scholar] [CrossRef]
- Libonati, R.; Geirinhas, J.L.; Silva, P.S.; Russo, A.; Rodrigues, J.A.; Belém, L.B.C.; Nogueira, J.; Roque, F.O.; DaCamara, C.C.; Nunes, A.M.B.; et al. Assessing the role of compound drought and heatwave events on unprecedented 2020 wildfires in the Pantanal. Environ. Res. Lett. 2022, 17, 015005. [Google Scholar] [CrossRef]
- Couto, F.T.; Santos, F.L.M.; Campos, C.; Purificação, C.; Andrade, N.; López-Vega, J.M.; Lacroix, M. A Case Study of the Possible Meteorological Causes of Unexpected Fire Behavior in the Pantanal Wetland, Brazil. Earth 2024, 5, 548–563. [Google Scholar] [CrossRef]
- Couto, F.T.; Santos, F.L.M.; Campos, C.; Purificação, C.; Andrade, N.; Lopez-Veja, J.M.; Lacroix, M. Exploratory analysis of atmospheric modelling use over Pantanal wildfires. Ra’e Ga Espaç. Geogr. Anál. 2025, 63, 35–56. [Google Scholar] [CrossRef]
- Marengo, J.A.; Espinoza, J.C. Extreme seasonal droughts and floods in Amazonia: Causes, trends and impacts. Int. J. Climatol. 2016, 36, 1033–1050. [Google Scholar] [CrossRef]
- Fonseca, M.G.; Alves, L.M.; Aguiar, A.P.D.; Arai, E.; Anderson, L.O.; Rosan, T.M.; Shimabukuro, Y.E.; de Aragão, L.E.O.E.C. Effects of climate and land-use change scenarios on fire probability during the 21st century in the Brazilian Amazon. Glob. Change Biol. 2019, 25, 2903–2917. [Google Scholar] [CrossRef]
- Brando, P.M.; Soares-Filho, B.; Rodrigues, L.; Assunção, A.; Morton, D.; Tuchschneider, D.; Fernandes, E.C.M.; Macedo, M.N.; Oliveira, U.; Coe, M.T. The gathering firestorm in southern Amazonia. Sci. Adv. 2020, 6, eaay1632. [Google Scholar] [CrossRef]
- Mu, Y.; Hu, Y.; Jones, C.; Biggs, T.; Domingues, T.F.; Funk, C.; Peterson, P. Increasing dry-season vapor pressure deficit in the Amazon Basin: Historical trends, future projections, and links to deforestation. Environ. Res. Commun. 2025, 7, 101001. [Google Scholar] [CrossRef]
- Bezerra, K.F.S.; Gomes, H.B.; Nascimento, J.P.; Baltaci, H.; Osman, M.; Silva, M.C.L.; Ferreira, T.R.; Lins, M.C.C.; Rocha, L.H.S.; Gomes, H.B.; et al. Climate Extremes and Fire Behavior in the Brazilian Cerrado: A Multi-Years Assessment (2012–2023). Earth Syst. Environ. 2025. [Google Scholar] [CrossRef]
- Papastefanou, P.; Zang, C.S.; Angelov, Z.; Anderson de Castro, A.; Jimenez, J.C.; De Rezende, L.F.C.; Ruscica, R.C.; Sakschewski, B.; Sörensson, A.A.; Thonicke, K.; et al. Recent extreme drought events in the Amazon rainforest: Assessment of different precipitation and evapotranspiration datasets and drought indicators. Biogeosciences 2022, 19, 3843–3861. [Google Scholar] [CrossRef]
- Espinoza, J.C.; Segura, H.; Ronchail, J.; Drapeau, G.; Gutierrez-Cori, O. Evolution of wet-day and dry-day frequency in the western Amazon basin: Relationship with atmospheric circulation and impacts on vegetation. Water Resour. Res. 2016, 52, 8671–8688. [Google Scholar] [CrossRef]
- Yoon, J.H.; Zeng, N. An Atlantic influence on Amazon rainfall. Clim. Dyn. 2010, 34, 249–264. [Google Scholar] [CrossRef]
- Richardson, D.; Black, A.S.; Irving, D.; Matear, R.J.; Monselesan, D.P.; Risbey, J.S.; Squire, D.T.; Tozer, C.R. Global increase in wildfire potential from compound fire weather and drought. npj Clim. Atmos. Sci. 2022, 5, 23. [Google Scholar] [CrossRef]
- Holdrege, M.C.; Schlaepfer, D.R.; Palmquist, K.A.; Crist, M.; Doherty, K.E.; Lauenroth, W.K.; Remington, T.E.; Riley, K.; Short, K.C.; Tull, J.C.; et al. Wildfire probability estimated from recent climate and fine fuels across the big sagebrush region. Fire Ecol. 2024, 20, 22. [Google Scholar] [CrossRef]
- Lareau, N.P.; Clements, C.B. Environmental controls on pyrocumulus and pyrocumulonimbus initiation and development. Atmos. Chem. Phys. 2016, 16, 4005–4020. [Google Scholar] [CrossRef]
- Katich, J.M.; Apel, E.C.; Bourgeois, I.; Brock, C.A.; Bui, T.; Campuzano-Jost, P.; Commane, R.; Daube, B.; Dollner, M.; Fromm, M.; et al. Pyrocumulonimbus affect average stratospheric aerosol composition. Science 2023, 379, 815–820. [Google Scholar] [CrossRef]
- Fromm, M.; Servranckx, R. Transport of forest fire smoke above the tropopause by supercell convection. Geophys. Res. Lett. 2003, 30, 1542. [Google Scholar] [CrossRef]
- Fromm, M.; Tupper, A.; Rosenfeld, D.; Servranckx, R.; McRae, R. Violent pyro-convective storm devastates Australia’s capital and pollutes the stratosphere. Geophys. Res. Lett. 2006, 33, L05815. [Google Scholar] [CrossRef]
- McRae, R.H.D.; Sharples, J.J.; Wilkes, S.R.; Walker, A. An Australian pyro-tornadogenesis event. Nat. Hazards 2013, 65, 1801–1811. [Google Scholar] [CrossRef]
- Peterson, D.A.; Campbell, J.R.; Hyer, E.J.; Fromm, M.D.; Kablick, G.P., III; Cossuth, J.H.; DeLand, M.T. Wildfire-driven thunderstorms cause a volcano-like stratospheric injection of smoke. npj Clim. Atmos. Sci. 2018, 1, 30. [Google Scholar] [CrossRef]
- Kablick, G.P.; Allen, D.R.; Fromm, M.D.; Nedoluha, G.E. Australian pyroCb smoke generates synoptic-scale stratospheric anticyclones. Geophys. Res. Lett. 2020, 47, e2020GL088101. [Google Scholar] [CrossRef]
- Hirsch, E.; Koren, I. Record-breaking aerosol levels explained by smoke injection into the stratosphere. Science 2021, 371, 1269–1274. [Google Scholar] [CrossRef] [PubMed]
- Lee, J.M.; Mirocha, J.D.; Lareau, N.P.; Whitney, T.; To, W.; Kochanski, A.; Lassman, W. Sensitivity of pyrocumulus convection to tree mortality during the 2020 Creek Fire in California. Geophys. Res. Lett. 2023, 50, e2023GL104193. [Google Scholar] [CrossRef]
- Couto, F.T.; Filippi, J.-B.; Baggio, R.; Campos, C.; Salgado, R. Numerical investigation of the Pedrógão Grande pyrocumulonimbus using a fire-to-atmosphere coupled model. Atmos. Res. 2024, 299, 107223. [Google Scholar] [CrossRef]
- Couto, F.T.; Filippi, J.-B.; Baggio, R.; Campos, C.; Salgado, R. Triggering Pyro-Convection in a High-Resolution Coupled Fire–Atmosphere Simulation. Fire 2024, 7, 92. [Google Scholar] [CrossRef]
- Peace, M.; Greenslade, J.; Ye, H.; Kepert, J.D. Simulations of the Waroona fire using the coupled atmosphere–fire model ACCESS-Fire. J. South. Hemisph. Earth Syst. Sci. 2022, 72, 126–138. [Google Scholar] [CrossRef]
- Campos, C.; Couto, F.T.; Filippi, J.-B.; Baggio, R.; Salgado, R. Modelling pyro-convection phenomenon during a mega-fire event in Portugal. Atmos. Res. 2023, 290, 106776. [Google Scholar] [CrossRef]
- Campos, C.; Couto, F.T.; Santos, F.L.M.; Pinto, P.; Purificação, C.; Silva, H.M.; Rio, J.; Lopes, M.; Baggio, R.; Filippi, J.-B.; et al. Assessing wildfire dynamics during a megafire in Portugal using the MesoNH/ForeFire coupled model. Q. J. R. Meteorol. Soc. 2025, e70075. [Google Scholar] [CrossRef]
- Coen, J.L.; Cameron, M.; Michalakes, J.; Patton, E.G.; Riggan, P.J.; Yedinak, K.M. WRF-Fire: Coupled Weather–Wildland Fire Modeling with the Weather Research and Forecasting Model. J. Appl. Meteorol. Climatol. 2013, 52, 16–38. [Google Scholar] [CrossRef]
- Filippi, J.; Bosseur, F.; Pialat, X.; Santoni, P.; Strada, S.; Mari, C. Simulation of Coupled Fire/Atmosphere Interaction with the MesoNH-ForeFire Models. J. Combust. 2011, 2011, 540390. [Google Scholar] [CrossRef]
- Costes, A.; Rochoux, M.; Lac, C.; Masson, V. Subgrid-scale fire front reconstruction for ensemble coupled atmosphere-fire simulations of the FireFlux I experiment. Fire Saf. J. 2021, 126, 103475. [Google Scholar] [CrossRef]
- Hoffman, C.M.; Sieg, C.H.; Linn, R.R.; Mell, W.; Parsons, R.A.; Ziegler, J.P.; Hiers, J.K. Advancing the Science of Wildland Fire Dynamics Using Process-Based Models. Fire 2018, 1, 32. [Google Scholar] [CrossRef]
- Jiang, M.; Bai, M.; He, Z.; Fan, G.; Tang, M.; Liang, Z. A Technology of Forest Fire Smoke Detection Using Dual-Polarization Weather Radar. Forests 2025, 16, 1471. [Google Scholar] [CrossRef]
- McHardy, T.M.; Peterson, D.A.; Apke, J.M.; Miller, S.D.; Campbell, J.R.; Hyer, E.J. Novel comparison of pyrocumulonimbus updrafts to volcanic eruptions and supercell thunderstorms using optical flow techniques. J. Geophys. Res. Atmos. 2024, 129, e2023JD039418. [Google Scholar] [CrossRef]
- Chen, Y.; Morton, D.C.; Randerson, J.T. Remote Sensing for Wildfire Monitoring: Insights into Burned Area, Emissions, and Fire Dynamics. One Earth 2024, 7, 1022–1028. [Google Scholar] [CrossRef]
- Silva-Junior, C.H.L.; Silva, F.B.; Arisi, B.M.; Mataveli, G.; Pessôa, A.C.M.; Carvalho, N.S.; Reis, J.B.C.; Silva Júnior, A.R.; Motta, N.A.C.S.; Moreira e Silva, P.V.; et al. Brazilian Amazon indigenous territories under deforestation pressure. Sci. Rep. 2023, 13, 5851. [Google Scholar] [CrossRef]
- Rajão, R.; Soares-Filho, B.; Nunes, F.; Börner, J.; Machado, L.; Assis, D.; Figueira, D. The rotten apples of Brazil’s agribusiness. Science 2020, 369, 246–248. [Google Scholar] [CrossRef]
- Spera, S.; Winter, J.; Partridge, T. Brazilian maize yields negatively affected by climate after land clearing. Nat. Sustain. 2020, 3, 845–852. [Google Scholar] [CrossRef]
- Montaveli, G.A.; Chaves, M.E.; Brunsell, N.A.; Aragão, L.E.O. The emergence of a new deforestation hotspot in Amazonia. Perspect. Ecol. Conserv. 2021, 19, 33–36. [Google Scholar] [CrossRef]
- Schielein, J.; Börner, J. Recent transformations of land-use and land-cover dynamics across different deforestation frontiers in the Brazilian Amazon. Land Use Policy 2018, 76, 81–94. [Google Scholar] [CrossRef]
- Lapola, D.M.; Pinho, P.; Barlow, J.; Aragão, L.E.O.C.; Berenguer, E.; Carmenta, R.; Liddy, H.M.; Seixas, H.; Silva, C.V.J.; Silva-Junior, C.H.L.; et al. The drivers and impacts of Amazon forest degradation. Science 2023, 379, eabp8622. [Google Scholar] [CrossRef] [PubMed]
- Sands, E.; Pope, R.J.; Doherty, R.M.; O’Connor, F.M.; Wilson, C.; Pumphrey, H. Satellite-observed relationships between land cover, burned area, and atmospheric composition over the southern Amazon. Atmos. Chem. Phys. 2024, 24, 11081–11102. [Google Scholar] [CrossRef]
- Ahmad, S.; Holmes, T.; Lahmers, T.; Konapala, G.; Getirana, A.; Nie, W.; Libonati, R. Human footprint drives sustained evapotranspiration decline in Amazonia. Atmos. Chem. Phys. 2025, 25, 1–18. [Google Scholar] [CrossRef]
- Muth, L.J.; Bierbauer, S.; Hoose, C.; Vogel, B.; Vogel, H.; Hoshyaripour, G.A. Influence of Fire-Induced Heat and Moisture Release on Pyro-Convective Cloud Dynamics During the Australian New Year’s Event: A Study Using Convection-Resolving Simulations and Satellite Data. Atmos. Chem. Phys. 2025, 25, 16027–16040. [Google Scholar] [CrossRef]
- Liu, L.; Cheng, Y.; Wang, S.; Wei, C.; Pöhlker, M.L.; Pöhlker, C.; Artaxo, P.; Shrivastava, M.; Andreae, M.O.; Pöschl, U.; et al. Impact of biomass burning aerosols on radiation, clouds, and precipitation over the Amazon: Relative importance of aerosol–cloud and aerosol–radiation interactions. Atmos. Chem. Phys. 2020, 20, 13283–13301. [Google Scholar] [CrossRef]
- Herbert, R.; Stier, P. Satellite observations of smoke–cloud–radiation interactions over the Amazon rainforest. Atmos. Chem. Phys. 2023, 23, 4595–4616. [Google Scholar] [CrossRef]
- Kingsmill, D.E.; French, J.R.; Lareau, N.P. In situ microphysics observations of intense pyroconvection from a large wildfire. Atmos. Chem. Phys. 2023, 23, 1–21. [Google Scholar] [CrossRef]
- Gorelick, N.; Hancher, M.; Dixon, M.; Ilyushchenko, S.; Thau, D.; Moore, R. Google Earth Engine: Planetary-scale geospatial analysis for everyone. Remote Sens. Environ. 2017, 202, 18–27. [Google Scholar] [CrossRef]
- Forkel, M.; Andela, N.; Harrison, S.P.; Lasslop, G.; van Marle, M.; Chuvieco, E.; Dorigo, W.; Forrest, M.; Hantson, S.; Heil, A.; et al. Emergent relationships with respect to burned area in global satellite observations. Biogeosciences 2019, 16, 4223–4240. [Google Scholar] [CrossRef]
- Giglio, L.; Boschetti, L.; Roy, D.P.; Humber, M.L.; Justice, C.O. The Collection 6 MODIS burned area mapping algorithm and product. Remote Sens. Environ. 2020, 217, 72–85. [Google Scholar] [CrossRef] [PubMed]
- Damoah, R.; Spichtinger, N.; Servranckx, R.; Fromm, M.; Eloranta, E.W.; Razenkov, I.A.; James, P.; Shulski, M.; Forster, C.; Stohl, A. A case study of pyro-convection using transport model and remote sensing data. Atmos. Chem. Phys. 2006, 6, 173–185. [Google Scholar] [CrossRef]
- Peterson, D.A.; Fromm, M.D.; McRae, R.H.D.; Campbell, J.R.; Hyer, E.J.; Taha, G.; Camacho, C.P.; Kablick, G.P.; Schmidt, C.C.; DeLand, M.T. Australia’s Black Summer pyrocumulonimbus super outbreak reveals potential for increasingly extreme stratospheric smoke events. npj Clim. Atmos. Sci. 2021, 4, 38. [Google Scholar] [CrossRef]
- Lac, C.; Chaboureau, J.-P.; Masson, V.; Pinty, J.-P.; Tulet, P.; Escobar, J.; Leriche, M.; Barthe, C.; Aouizerats, B.; Augros, C.; et al. Overview of the Meso-NH model version 5.4 and its applications. Geosci. Model Dev. 2018, 11, 1929–1969. [Google Scholar] [CrossRef]
- Couto, F.T.; Campos, C.; Purificação, C.; Santos, F.L.M.; Andrade, H.N.; Andrade, N.; Nunes, A.B.; Guiomar, N.; Salgado, R. Synoptic and Regional Meteorological Drivers of a Wildfire in the Wildland–Urban Interface of Faro (Portugal). Fire 2025, 8, 362. [Google Scholar] [CrossRef]
- Purificação, C.; Andrade, N.; Potes, M.; Salgueiro, V.; Couto, F.T.; Salgado, R. Modelling the Atmospheric Environment Associated with a Wind-Driven Fire Event in Portugal. Atmosphere 2022, 13, 1124. [Google Scholar] [CrossRef]
- Purificação, C.; Campos, C.; Henkes, A.; Couto, F.T. Exploring the atmospheric conditions increasing fire danger in the Iberian Peninsula. Q. J. R. Meteorol. Soc. 2024, 150, 3475–3494. [Google Scholar] [CrossRef]
- Pergaud, J.; Masson, V.; Malardel, S.; Couvreux, F. A Parameterization of Dry Thermals and Shallow Cumuli for Mesoscale Numerical Weather Prediction. Bound. Lay. Meteorol. 2009, 132, 83–106. [Google Scholar] [CrossRef]
- Pinty, J.-P.; Jabouille, P. A mixed-phase cloud parameterization for use in mesoscale non-hydrostatic model: Simulations of a squall line and of orographic precipitations. In Proceedings of the Conference on Cloud Physics, Everett, WA, USA, 17–21 August 1998; American Meteorological Society: Boston, MA, USA, 1999; pp. 217–220. [Google Scholar]
- Cuxart, J.; Bougeault, P.; Redelsperger, J.L. A turbulence scheme allowing for mesoscale and large-eddy simulations. Q. J. R. Meteorol. Soc. 2000, 126, 1–30. [Google Scholar] [CrossRef]
- Mlawer, E.J.; Taubman, S.J.; Brown, P.D.; Iacono, M.J.; Clough, S.A. Radiative transfer for inhomogeneous atmospheres: RRTM, a validated correlated-k model for the longwave. J. Geophys. Res. 1997, 102, 16663–16682. [Google Scholar] [CrossRef]
- Masson, V.; Le Moigne, P.; Martin, E.; Faroux, S.; Alias, A.; Alkama, R.; Belamari, S.; Barbu, A.; Boone, A.; Bouyssel, F.; et al. The SURFEXv7.2 land and ocean surface platform for coupled or offline simulation of earth surface variables and fluxes. Geosci. Model Dev. 2013, 6, 929–960. [Google Scholar] [CrossRef]
- Peterson, D.; Hyer, E.; Campbell, J.; Fromm, M.; Hair, J.; Butler, C.; Fenn, M. The 2013 Rim Fire: Implications for predicting extreme fire spread, pyroconvection, and smoke emissions. Bull. Am. Meteorol. Soc. 2015, 96, 229–247. [Google Scholar] [CrossRef]
- Peterson, D.A.; Hyer, E.J.; Campbell, J.R.; Solbrig, J.E.; Fromm, M.D. A conceptual model for development of intense pyrocumulonimbus in western North America. Mon. Weather Rev. 2017, 145, 2235–2255. [Google Scholar] [CrossRef]
- Doswell, C.A., III. The distinction between large-scale and mesoscale contributions to severe convection: A case study example. Weather Forecast. 1987, 2, 3–16. [Google Scholar] [CrossRef]
- Markowski, P.M.; Richardson, Y.P. Mesoscale Meteorology in Midlatitudes; John Wiley & Sons: Hoboken, NJ, USA, 2010; ISBN 978 0 470 74213 6. [Google Scholar]
- Rodriguez, B.; Lareau, N.P.; Kingsmill, D.E.; Clements, C.B. Extreme Pyroconvective Updrafts During a Megafire. Geophys. Res. Lett. 2020, 47, e2020GL089001. [Google Scholar] [CrossRef]
- Ke, Z.; Tang, Q.; Zhang, J.; Chen, Y.; Randerson, J.P.; Li, J.; Zhang, Y. Simulating pyrocumulonimbus clouds using a multiscale wildfire simulation framework. Geophys. Res. Lett. 2025, 52, e2024GL114025. [Google Scholar] [CrossRef]
- McRae, R.H.D.; Sharples, J.J.; Fromm, M. Linking local wildfire dynamics to pyroCb development. Nat. Hazards Earth Syst. Sci. 2015, 15, 417–428. [Google Scholar] [CrossRef]
- Lareau, N.P.; Nauslar, N.J.; Bentley, E.; Roberts, M.; Emmerson, S.; Brong, B.; Mehle, M.; Wallman, J. Fire-Generated Tornadic Vortices. Bull. Am. Meteorol. Soc. 2022, 103, E1296–E1320. [Google Scholar] [CrossRef]
- Sharples, J.J.; Hilton, J.E. Modeling vorticity-driven wildfire behavior using near-field techniques. Front. Mech. Eng. 2020, 5, 69. [Google Scholar] [CrossRef]
- McCarthy, N.; Guyot, A.; Dowdy, A.; McGowan, H. Wildfire and Weather Radar: A Review. J. Geophys. Res. 2019, 124, 266–286. [Google Scholar] [CrossRef]


Disclaimer/Publisher’s Note: The statements, opinions and data contained in all publications are solely those of the individual author(s) and contributor(s) and not of MDPI and/or the editor(s). MDPI and/or the editor(s) disclaim responsibility for any injury to people or property resulting from any ideas, methods, instructions or products referred to in the content. |
© 2026 by the authors. Licensee MDPI, Basel, Switzerland. This article is an open access article distributed under the terms and conditions of the Creative Commons Attribution (CC BY) license.