


Abstract
Fugitive emissions from storage-tank accessories are important sources of volatile organic compounds (VOCs) in chemical industrial parks, but the applicability of estimation methods requires field evaluation. Optical gas imaging (OGI) was used to screen about 200 selected volatile organic liquid storage tanks in a Chinese chemical park. Evident emissions were detected at 46 tanks; breathing valves (14) and foam generators (13) accounted for about 59% of detections. Twelve of the 13 foam generators were inaccessible to flame ionization detector (FID) measurements, illustrating the complementary coverage of OGI and probe-based screening. FID readings for 14 breathing valves were 2125–8423 µmol mol−1, above the numerical criterion of 2000 µmol mol−1 in amendments to GB 31570/31571/31572. Regulatory interpretation requires the applicable operating-pressure condition and facility requirements. For 30 FID-accessible accessories, annualized estimates from the OGI emission-factor and correlation-equation methods were 26.3 and 1.86 t a−1, respectively, assuming continuous release for 8760 h. The approximately 14-fold difference reflects the methods’ different category mappings and dependence on screening readings; it does not establish their accuracy against an independent mass-emission reference. The findings support attention to inaccessible accessories and further field validation of accessory-specific emission estimates.
1. Introduction
Volatile organic compounds (VOCs) are precursors of tropospheric ozone and secondary organic aerosol. A recent multisite modeling study in China linked uncertainties in VOC predictions to uncertainties in ozone predictions [1]. Health effects depend on the compound, exposure level, and duration; some VOCs can cause eye and respiratory irritation [2], and benzene is a recognized human carcinogen [3]. These findings motivate VOC emission control but do not establish exposure or health effects attributable to the tanks examined here. This study addresses source detection and emission estimation, rather than ambient air-quality or health-outcome assessment.
Organic liquid storage tanks are basic facilities for storing and transferring raw materials and products in the petrochemical and chemical industries. Wang et al. analyzed methods for estimating VOC losses from organic liquid storage tanks [4]. Liu et al. reviewed VOC control technologies for petrochemical applications [5]. China’s comprehensive VOC control plan identifies storage and transfer as control priorities [6], and GB 37822-2019 establishes requirements for fugitive VOC emissions [7]. The 2024 amendments to GB 31570-2015, GB 31571-2015, and GB 31572-2015 specify a breathing-valve detection value below 2000 µmol mol−1 when operating pressure is below 75% of the set opening pressure [8]. Application of this provision also depends on the relevant facility and implementation requirements. Reliable emission estimates are needed for industrial-park inventories and control decisions; the suitability of accessory-level estimation methods therefore warrants evaluation.
Liu et al. examined factors affecting breathing losses from petrochemical storage tanks [9]. Li et al. applied the TANKS 4.0.9d model to different tank types and discussed the meteorological, sealing, and stored-liquid inputs needed for its use [10]. Rampi et al. contrasted mechanistic and inventory-based approaches for modeling VOC emissions from hydrocarbon tanks [11]. Tagliaferri et al. showed that the temporal resolution of emission inputs affects dispersion estimates from hydrocarbon storage tanks [12]. Jackson combined tank-emission estimates with dispersion modeling and risk assessment in Dar-es-Salaam [13]. Eisaei et al. measured vapors from underground-tank vent pipes at gas stations in Tehran and evaluated a vapor-control system [14]. Zhang et al. characterized the emission characteristics and source profiles of VOCs from a petroleum processing plant [15]. These studies address different source configurations and assessment objectives. In practice, industrial-park inventories commonly adopt correlation equations derived from equipment leaks [16]. Recent work has constructed source profiles and dynamic VOC emission inventories for an integrated refinery-petrochemical complex [17]. The applicability of these equipment-leak correlations to vent-type storage-tank accessories warrants evaluation under the conditions examined here. The optical gas imaging (OGI) emission-factor method facilitates large-scale screening, but its factors are mainly derived from overseas studies and vary with the assumed detection threshold [18]. A field comparison can identify differences between the estimates, although an independent mass-emission reference is required to evaluate accuracy.
OGI visualizes gas releases through infrared contrast between a gas plume and its background. Zimmerle et al. examined OGI detection limits under realistic controlled conditions [19]. Ravikumar et al. evaluated OGI effectiveness for methane leak detection [20]. Quantitative OGI systems use additional analysis to estimate mass release rates [21]; these systems are distinct from assigning an emission factor to an OGI detection. A recent review assessed standardized methods for monitoring diffuse VOC emissions, including optical approaches [22]. In a recent controlled methane-release assessment, Ilonze et al. reported substantial variability in quantitative OGI estimates [23], highlighting the need for validation under relevant field conditions. Accordingly, this study screened approximately 200 volatile organic liquid storage tanks in a Chinese chemical industrial park. It describes the detected sample by accessory and tank type, compares breathing-valve screening readings with the conditional regulatory criterion, and examines differences between two emission-estimation methods. It does not independently validate either method or estimate population-wide accessory failure rates.
2. Materials and Methods
2.1. Study Objects and Industrial Park Overview
The study was conducted in a large chemical industrial park in China dominated by cumene-phenol-acetone production and fine-chemical manufacturing. Stored materials included aromatic compounds (e.g., benzene (C6H6), cumene (C9H12), and phenol (C6H6O)), ketones (e.g., acetone, C3H6O), olefins and light hydrocarbons (including diisobutylene, isooctene, and C5–C7 fractions), chlorinated hydrocarbons (1,2-dichloroethane, C2H4Cl2), ethers (methyl tert-butyl ether, C5H12O), and nitriles (acrylonitrile, C3H3N). The surveyed population consisted mainly of fixed-roof and internal floating-roof tanks with nominal capacities of 100–15,000 m3. Potential release points on approximately 200 volatile organic liquid storage tanks, selected from the approximately 1000 tanks in the park according to material reactivity, capacity, and control status, were screened during the field campaign, with OGI applied to every visible sealing point on each selected tank. This targeted selection was not a census or a random sample of all tanks in the park. C5–C7 fractions are mixtures rather than a single molecular species. The available information does not establish the total number of accessories or obscured sealing points that were not inspected.
2.2. OGI Principle
OGI techniques include active and passive systems. The passive GF320 camera (FLIR Systems, Wilsonville, OR, USA) used here detects infrared radiance contrast between a gas plume and its background within a spectral band of 3.2–3.4 µm [24]. Gas absorption and emission, the background radiance, and the gas–background temperature contrast affect plume visibility; sunlight is not a required illumination source. Detectability also depends on gas composition, viewing geometry, wind, and operator practice [19,20]. Image shape or darkness alone is not a calibrated measure of VOC concentration or mass flux. In this study, the camera was used for qualitative screening; emissions were subsequently estimated using the methods in Section 2.4.
2.3. Instruments and Detection Methods
A handheld optical gas imaging camera (FLIR GF320) was used to scan inaccessible sealing points on tank roofs and accessories, such as breathing valves, that had not been included in LDAR control. Potential leak sources were identified from plume images. Accessible suspected leak points were then measured to obtain screening readings using a flame ionization detector (FID, TVA2020, Thermo Fisher Scientific, Franklin, MA, USA). The main technical parameters of the instrument are listed in Table 1. To reduce interference from environmental factors, the field measurements were strictly limited to daytime conditions with a ground-level wind speed below 6 m s−1 and relative humidity below 90%, and dusty or wet conditions were avoided. This was a single field inspection. These wind and humidity limits describe the screening conditions, not measured campaign averages. Campaign-average temperature, relative humidity, and barometric pressure cannot be characterized from the available information. Annualization of the inspection results is described in Section 2.4.
Table 1.
Reported camera configuration and manufacturer specifications for the GF320 [24].
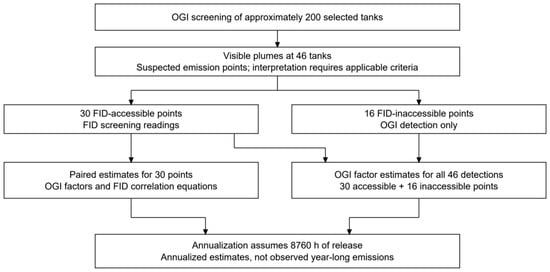
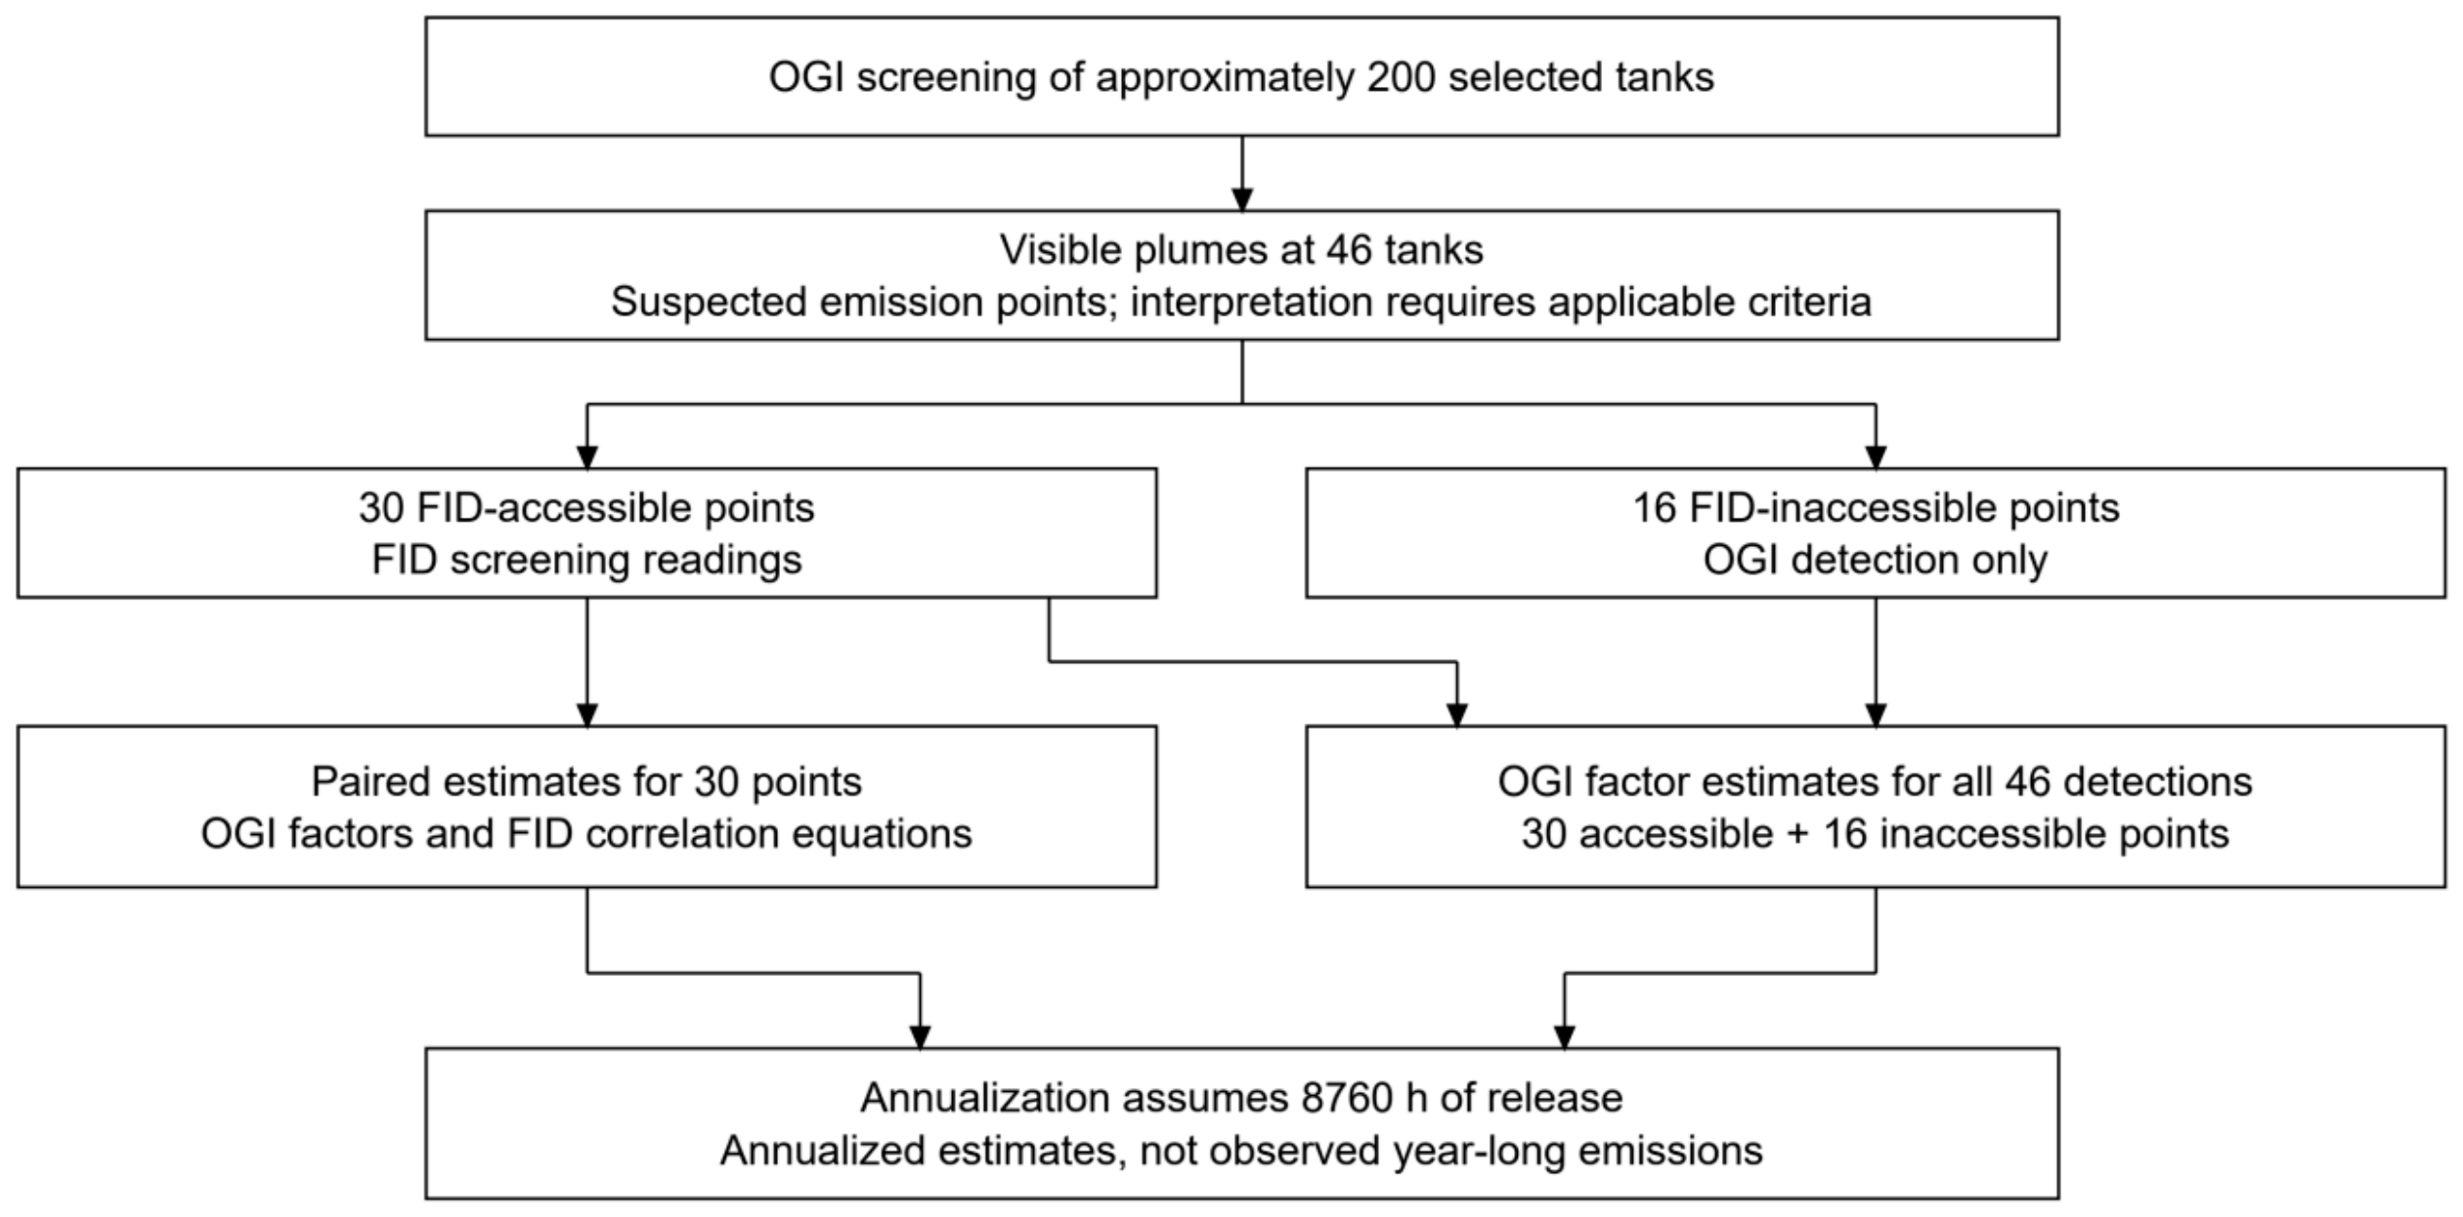
During screening, the GF320 was first used to scan the breathing valves and tank-top accessories. If a cloud-like leak plume appeared in the image, the tank number and stored material were recorded, and accessible suspected points were measured using the FID. When the concentration exceeded the leak-determination criterion, the enterprise was informed so that the source could be repaired promptly. The screening followed three priority principles: priority was given to tanks containing materials with strong instrument responses and high reactivity; to large tanks with many accessories and to different tank types; and to tanks whose breathing gas had not yet been collected and treated. The detection workflow is shown in Figure 1. When numerous accessories were present in the viewing area, the minimum observation time was determined according to Table 2.
Figure 1.
OGI screening and the two emission-estimation pathways. A visible plume identifies a suspected emission point; regulatory leak determination requires the applicable criteria and operating conditions.
Table 2.
Minimum observation time for different detection regions (i is the number of sealing points).
The inspected positions covered each potential leaking component as far as possible, including valves (valve stems, valve-body packing glands, and all connection interfaces), safety valves and vent lines, flanges (including gasket edges and welds), open-ended lines, and insulated sealing points. Under Clause 6.2.3 of HJ 1230-2021, a distinct plume originating from a sealing point indicates a suspected leak point. Leak determination requires comparison of the measured detection value with the applicable criterion under Clause 6.3.1 of HJ 1230-2021 [25]. Instrument sensitivity is distinct from a regulatory leak criterion, and a methane sensitivity specification cannot be treated as a validated detection limit for the surveyed VOC mixtures. To control differences in operator interpretation, detection and image interpretation were performed by the same trained team, and uncertain points were rechecked and confirmed in the field. To ensure detection quality, non-uniformity correction was performed before the instrument was used each day, and an appropriate movement speed was maintained to avoid missed detections. During continuous detection lasting more than 30 min, operators rested for at least 5 min every 30 min or worked alternately in pairs to avoid fatigue. Viewing distances and angles were unavailable, limiting reconstruction of the observation geometry.
2.4. Emission Accounting Methods and Scope Definition
Standing and working losses released through breathing valves during normal storage-tank operation are design-related emissions and are commonly calculated internationally using US EPA AP-42 Chapter 7 and the TANKS series of models [26]. These models estimate standing (breathing) and working losses using semi-empirical equations: standing losses arise from the thermal expansion and contraction of the tank vapor space driven by diurnal temperature changes, and working losses arise from vapor displacement during liquid filling and withdrawal. The estimated values are derived from parameters such as the vapor pressure of the stored liquid, tank dimensions, annual throughput, and local meteorological conditions. The two methods in this study estimate emissions associated with accessory releases detected by OGI. These screening-level leak-emission estimates cannot replace the results of breathing-loss models, and the two should not simply be added together. At the same time, OGI images cannot strictly distinguish normal opening emissions from abnormal leakage at breathing valves. Therefore, this study uniformly uses the term detected fugitive emission and uses the FID concentration level as supplementary characterization.
For points detected by OGI, emissions were estimated using two methods. The OGI emission-factor method uses published factors developed for component screening by the American Petroleum Institute and CONCAWE [18,27]. The arithmetic mean of four factors corresponding to nominal detection thresholds of 3, 6, 30, and 60 g h−1 was assigned to each component class (Table 3). This equal weighting is an accounting assumption, not a calibration to the survey’s detection performance. Accessories were mapped to these classes as specified in Table 4. Annualized emissions were calculated using Equation (1).
where EOGI is the annual VOC emission estimate (t a−1), EFi is the assigned emission factor for accessory i (g h−1), and t is the assumed annual release duration, set to 8760 h.
EOGI = Σi (EFi × t)/106,
Table 3.
OGI emission factors at four nominal detection thresholds [18,27].
Table 4.
Accessory-to-component mapping adopted in this study using the published factor classes in Table 3.
The correlation-equation method was based on quantitative FID results. The leak rate was calculated using Equation (2) according to the correlation equation for the corresponding component type in the Guidelines for Screening VOC Pollution Sources in the Petrochemical Industry [16] and was then converted to annual emissions.
where eTOC is the total-organic-compound (TOC) emission rate (kg h−1), SV is the net screening value after subtraction of the ambient background (µmol mol−1), and a and b are component-class coefficients. The exponent b is dimensionless; with SV entered in µmol mol−1, a has units of (kg h−1) (µmol mol−1)−b. The empirical coefficients a and b depend on the component class; b varies by equation type from approximately 0.6 to 0.9. Both methods were annualized assuming continuous leakage for 8760 h. A single inspection and the presence of nitrogen blanketing do not establish continuous release throughout the year. These results are therefore annualized scenarios, not year-long measurements. Intermittent emissions would require the rate and duration of each operating state. A common duration cancels in the method ratio only when applied consistently to the same points. VOC emission rates are obtained by multiplying TOC rates by the VOC-to-TOC mass fraction; the guideline specifies a default of unity when that fraction is unavailable [16]. The material-specific VOC-to-TOC mass fractions are unavailable, limiting interpretation of the reported estimates as absolute VOC masses. Outlets of end-of-pipe control facilities, such as activated-carbon adsorption and alkaline scrubbing, are not storage-tank accessories and were not included in the statistics.
eTOC = a × (SV)b,
3. Results and Discussion
3.1. Detection Characteristics of Fugitive VOC Emissions from Storage-Tank Accessories
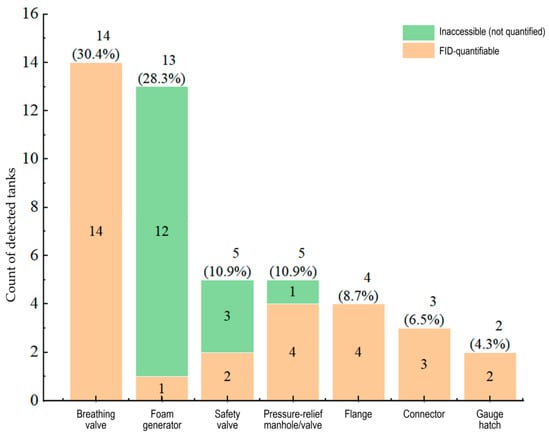
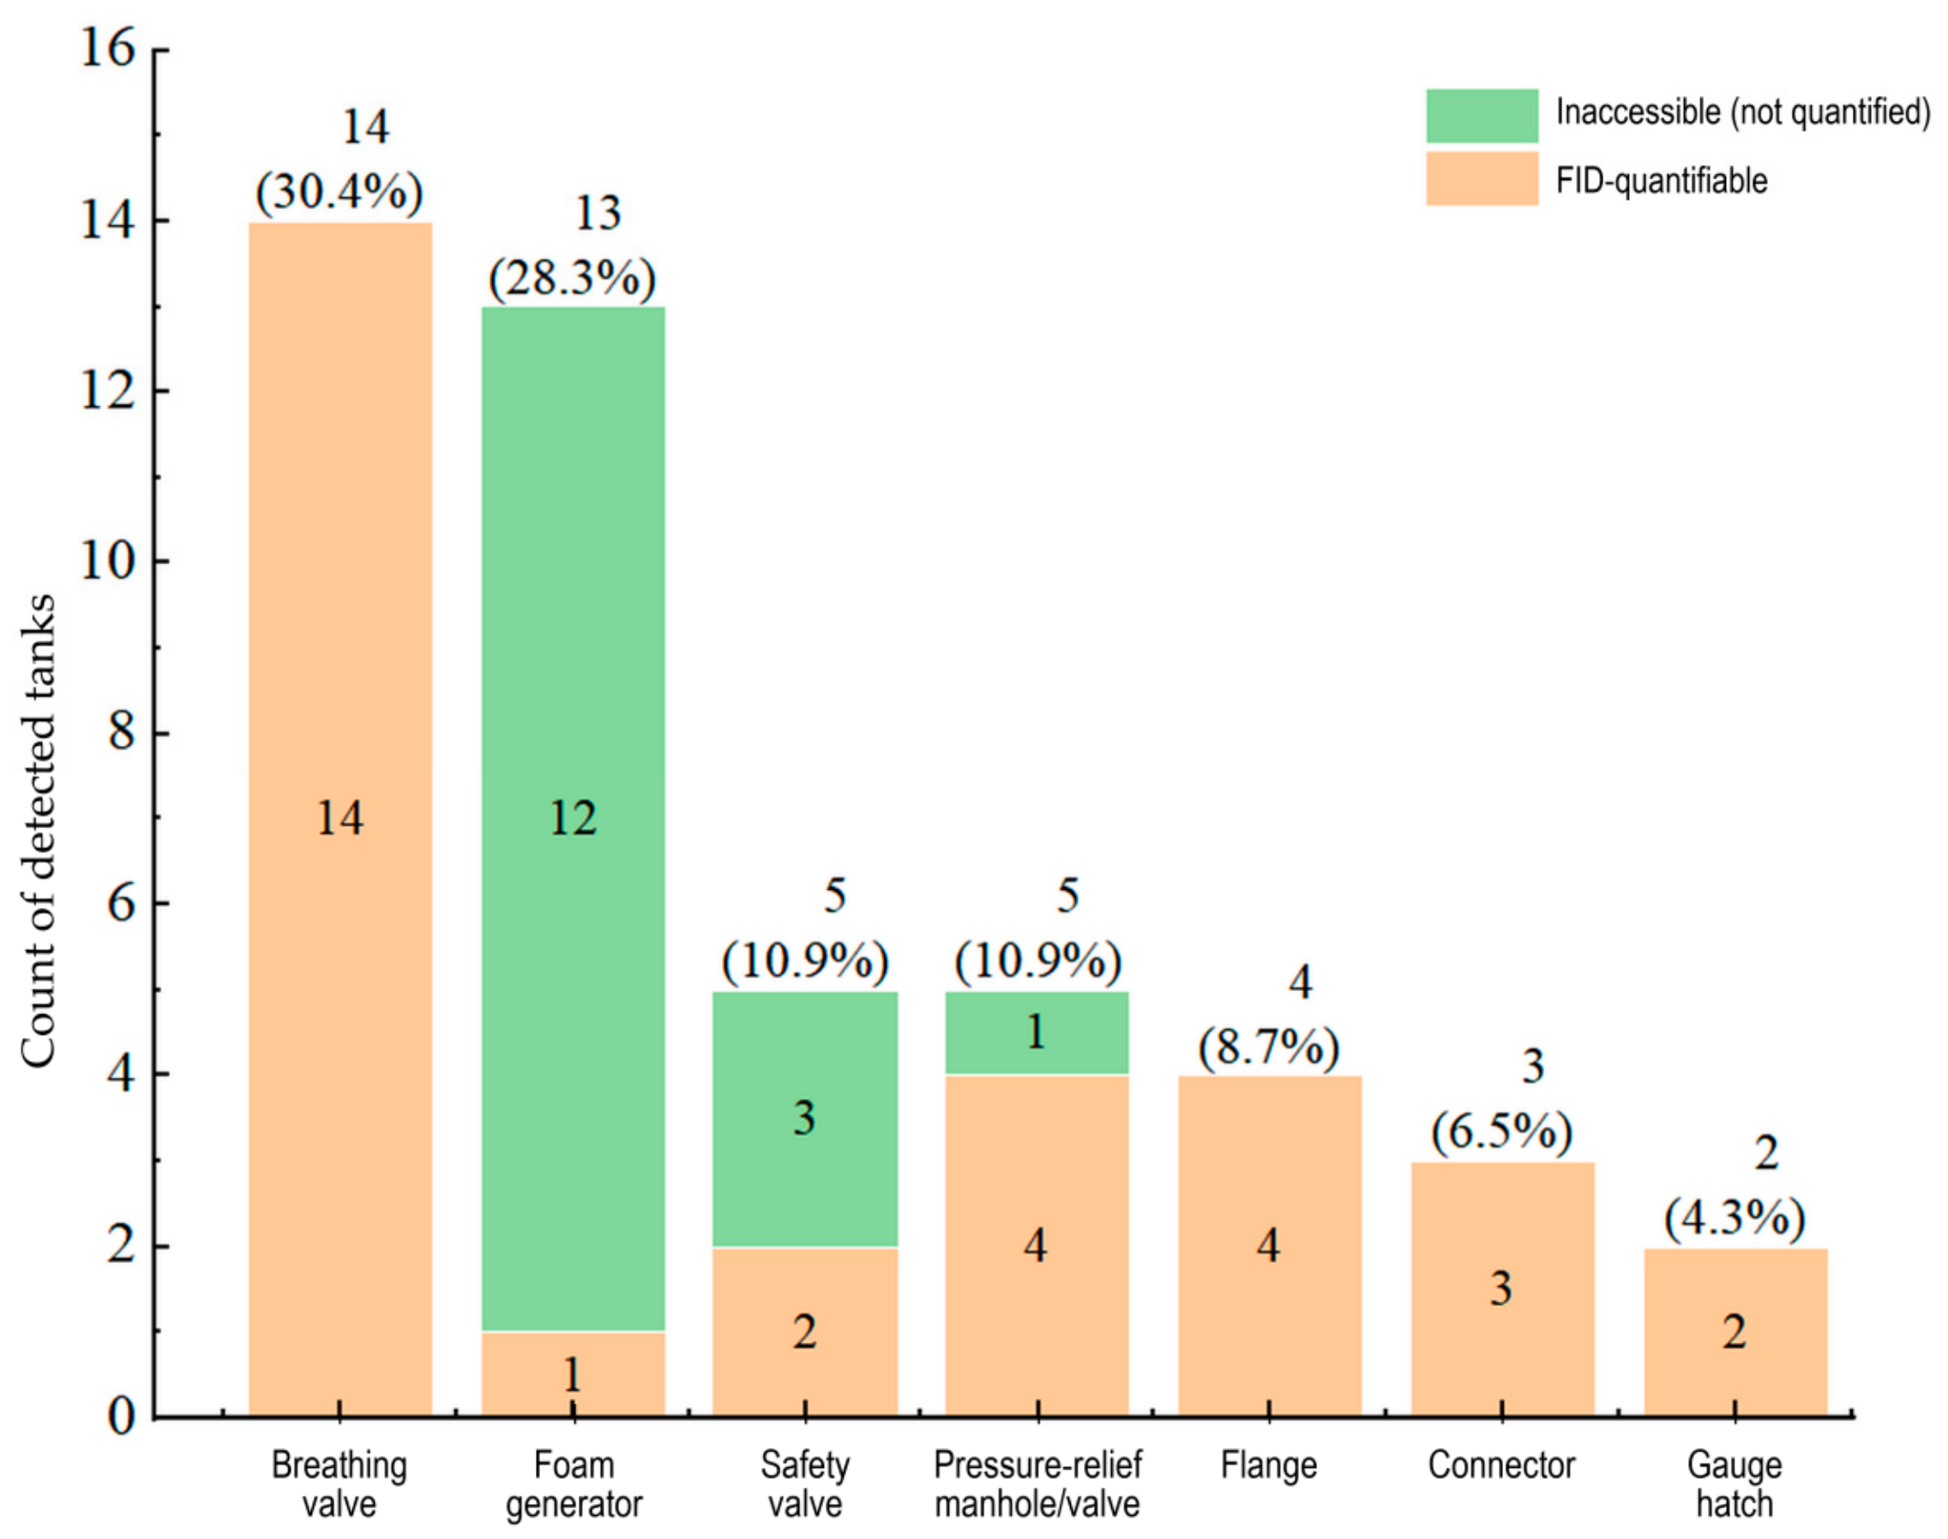
Among approximately 200 volatile organic liquid storage tanks in the industrial park, OGI detected evident fugitive VOC emissions from 46 tanks, corresponding to approximately 23% of the selected tanks. Of these, 30 had accessible points that could be measured using the FID, whereas 16 showed evident plumes but could not be measured using the FID. The distribution of detected leaks among accessories is shown in Figure 2. Breathing valves (14 tanks, 30.4%) and foam generators (13 tanks, 28.3%) were the two most frequent accessory categories in the detected sample and together accounted for approximately 59% of detections. They were followed by safety valves and pressure-relief manholes/valves (five tanks each), flanges (four tanks), connectors (three tanks), and gauge hatches (two tanks). Tank roofs are difficult to access and contain numerous accessories, making complete coverage by conventional detection methods difficult.
Figure 2.
Distribution of detected fugitive emissions of volatile organic compounds (VOCs) from storage-tank accessories.
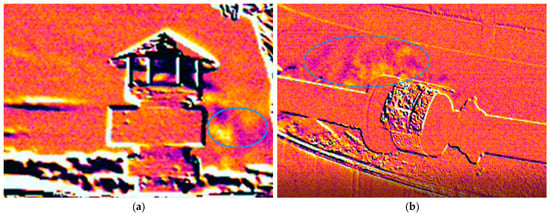
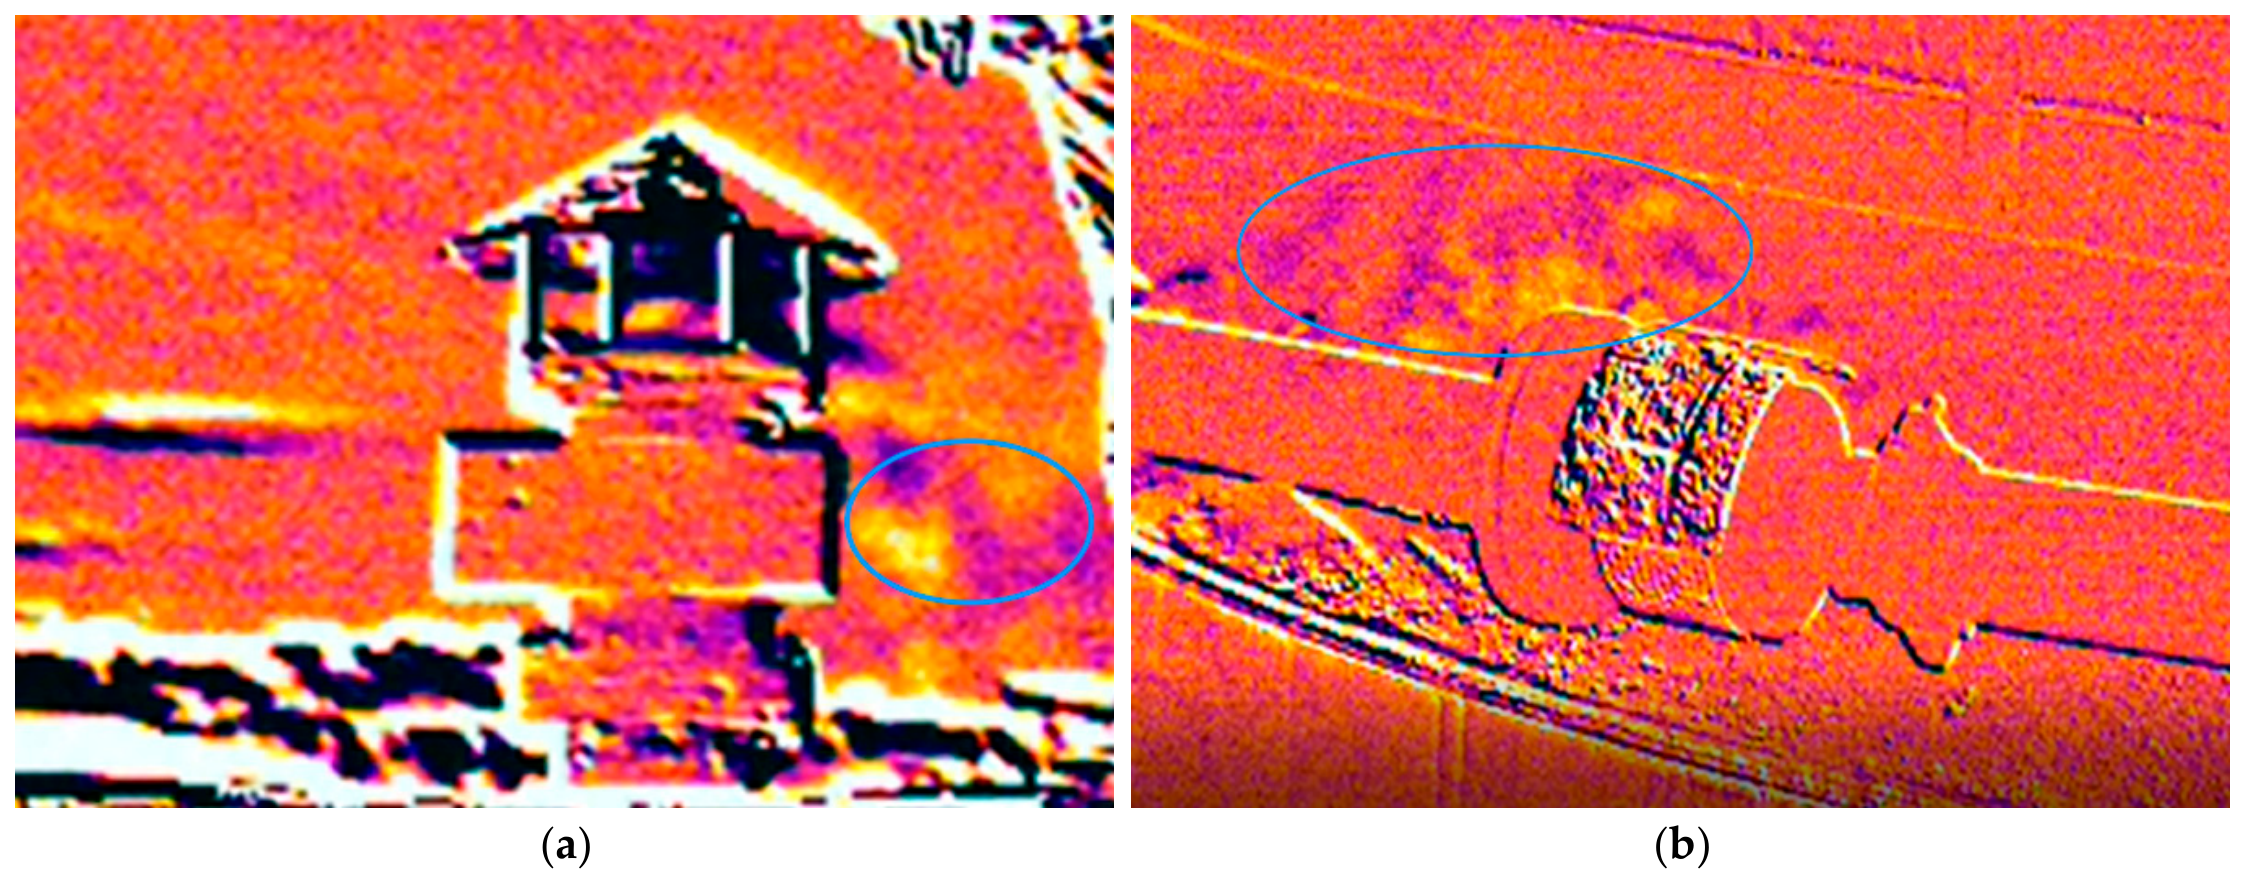
OGI revealed evident plumes at foam generators on 13 tanks. The available evidence does not establish the mechanism responsible for these releases. Twelve of these 13 points were inaccessible to probe measurements, supporting the complementary use of OGI for inspection coverage. This observation does not establish a population-wide failure frequency or show that these releases were first detected at the respective sites. Published OGI factor-development and comparative field studies provide methodological context [18,27], but differences in inspected component populations prevent direct comparison of accessory-specific detection percentages. Figure 3 shows representative OGI images.
Figure 3.
Optical gas imaging (OGI) images of a breathing valve and a foam generator. (a) Breathing valve, flame ionization detector (FID) reading of 2125 µmol mol−1. (b) Foam generator, FID leak-detection reading of 7970 µmol mol−1. The image display is qualitative and is not a VOC concentration scale. The FID readings are separate point measurements. A calibrated spatial scale cannot be inferred from the displayed images alone. The blue ovals highlight the regions containing the suspected gas plumes. The colors are the qualitative false-color infrared display and do not represent VOC concentrations.
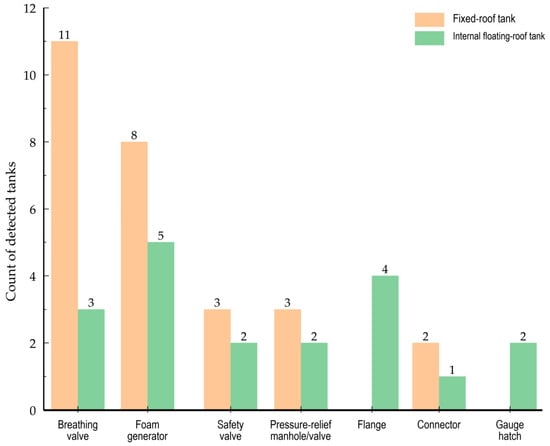
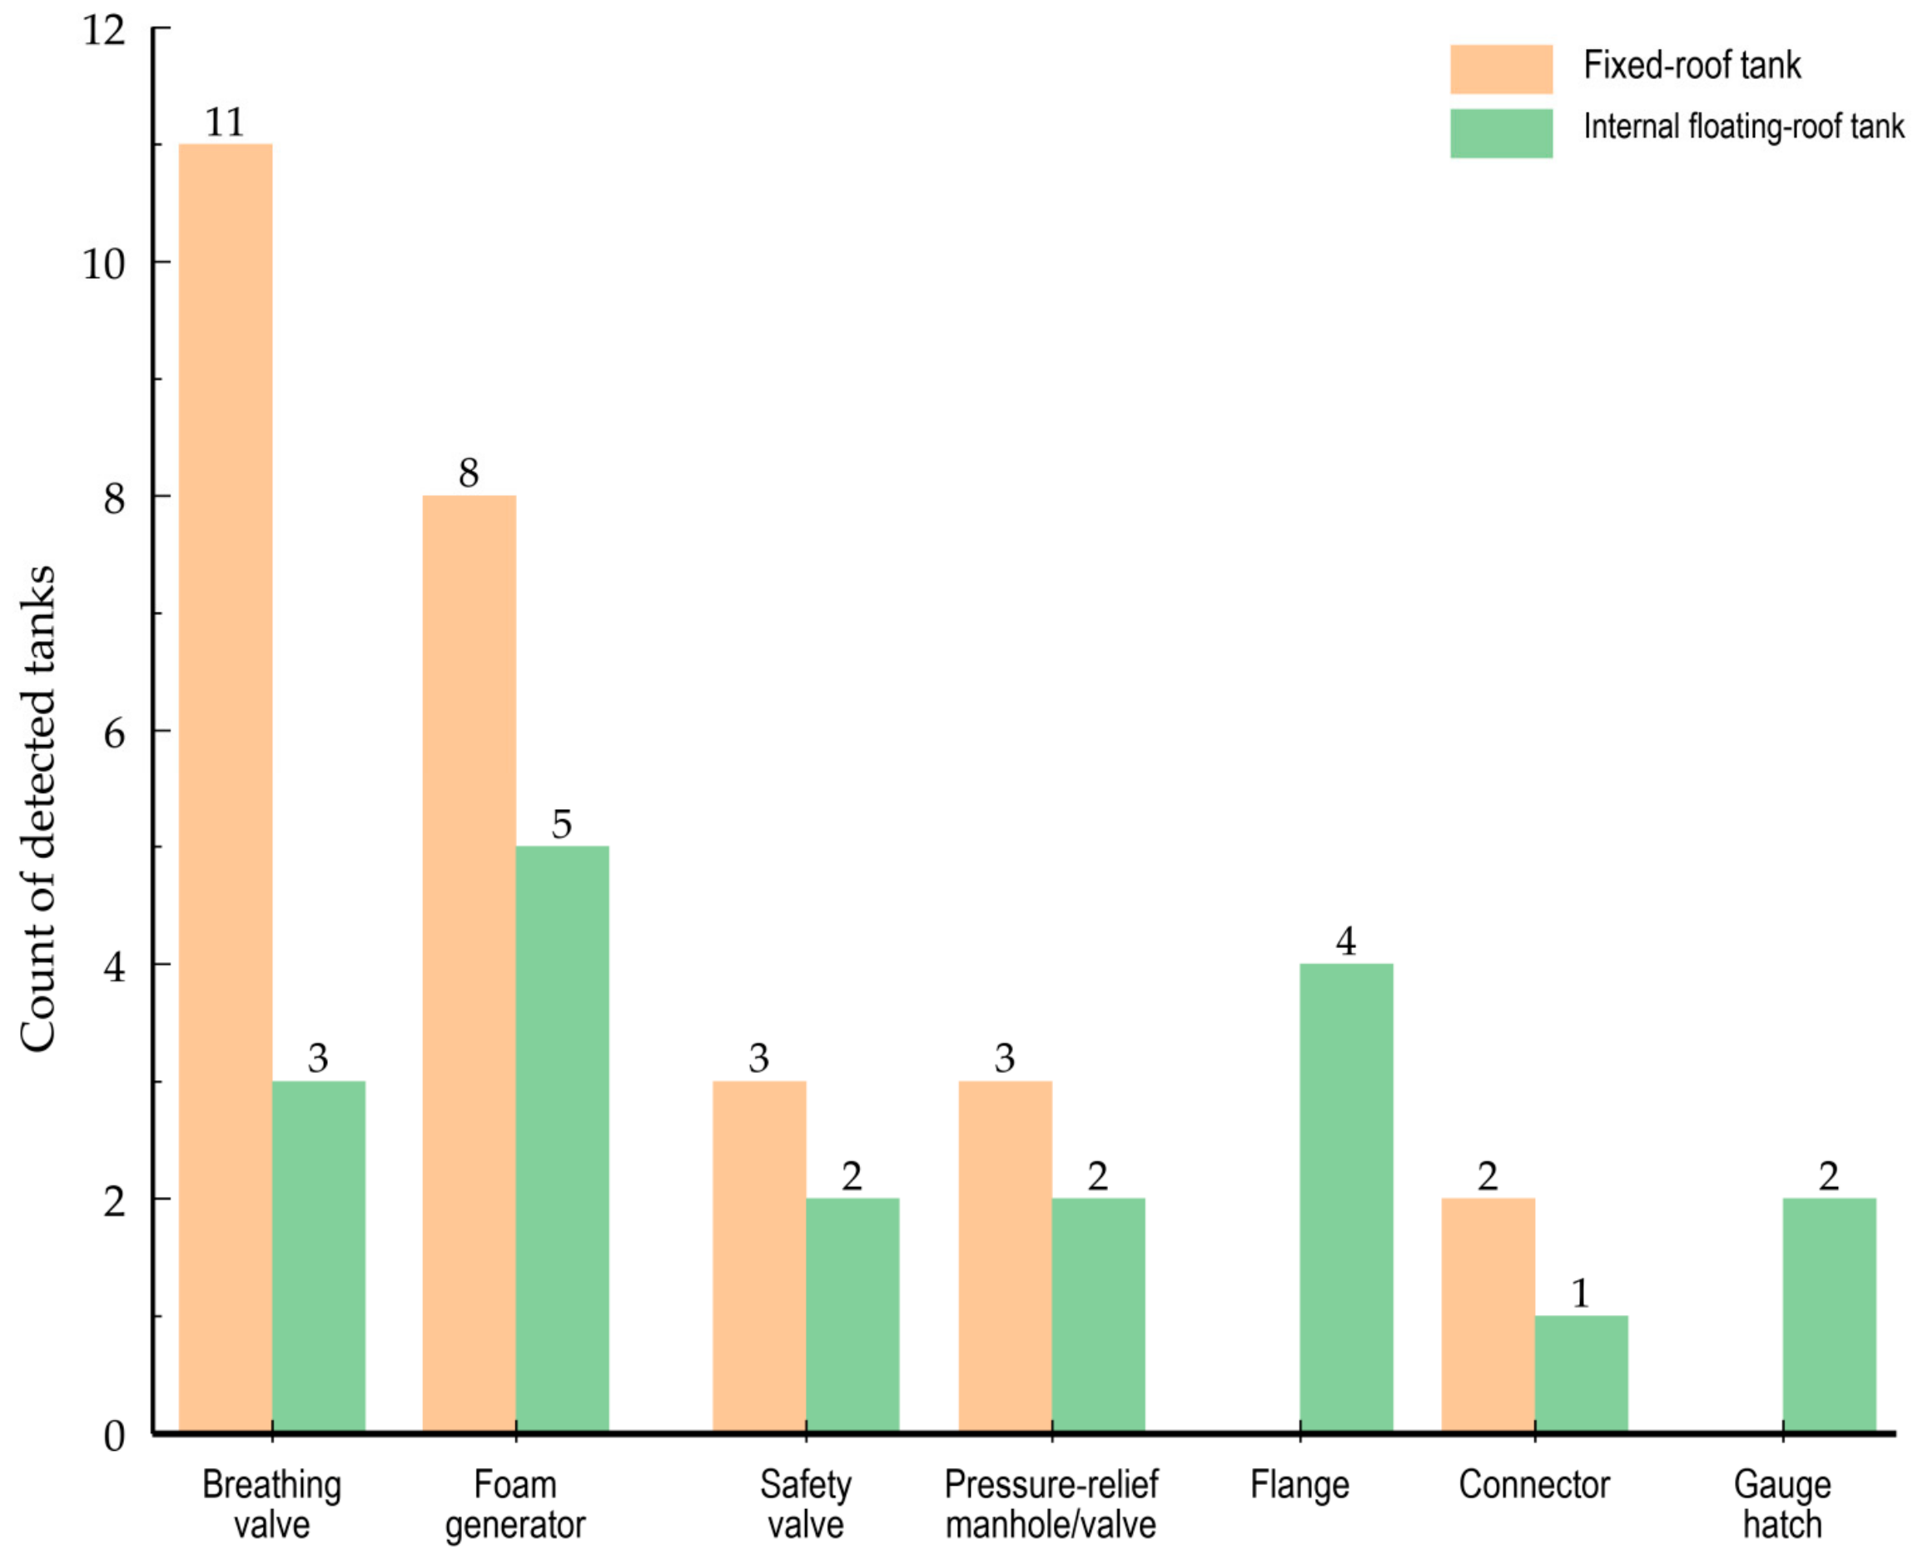
With respect to the association between accessories and tank types (Figure 4), the composition of leaking accessories differed among tank types in the study sample. Breathing-valve detections occurred mainly on fixed-roof tanks. All flange and gauge-hatch detections occurred on internal floating-roof tanks, whereas foam generators were distributed across both tank types. In addition, internal floating-roof tanks accounted for 41% of all detected tanks, indicating that fugitive emissions from floating-roof-tank accessories also warrant attention. Detected leaks are summarized by accessory type in Table 5. The capacity and tank-type distribution of detected tanks is shown in Table 6. Leak detections on fixed-roof tanks were concentrated in small tanks with capacities of 500 m3 or less, whereas detections on internal floating-roof tanks occurred mainly in medium and large tanks with capacities above 500 m3. Table 5 and Table 6 describe the 46 detected cases. Without the numbers inspected in each roof-type and capacity category, these distributions cannot establish category-specific detection probabilities or relative failure rates.
Figure 4.
Distribution of detected accessory leaks by tank type.
Table 5.
Summary of detected leaks by accessory type (n = 46).
Table 6.
Distribution of detected tanks by capacity and roof type (n = 46).
In terms of accessibility, only 30 of the 46 tanks detected by OGI had FID-accessible points. Twelve of the 13 foam generators and three of the five safety valves could not be measured with the probe because they were elevated and inaccessible, whereas almost all breathing valves, flanges, connectors, and gauge hatches could be measured. OGI can cover elevated and inaccessible accessories that are difficult to inspect using conventional probe-based screening and can therefore supplement the blind spots of conventional screening.
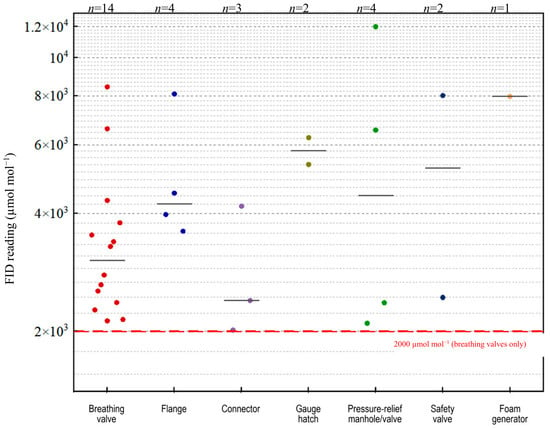
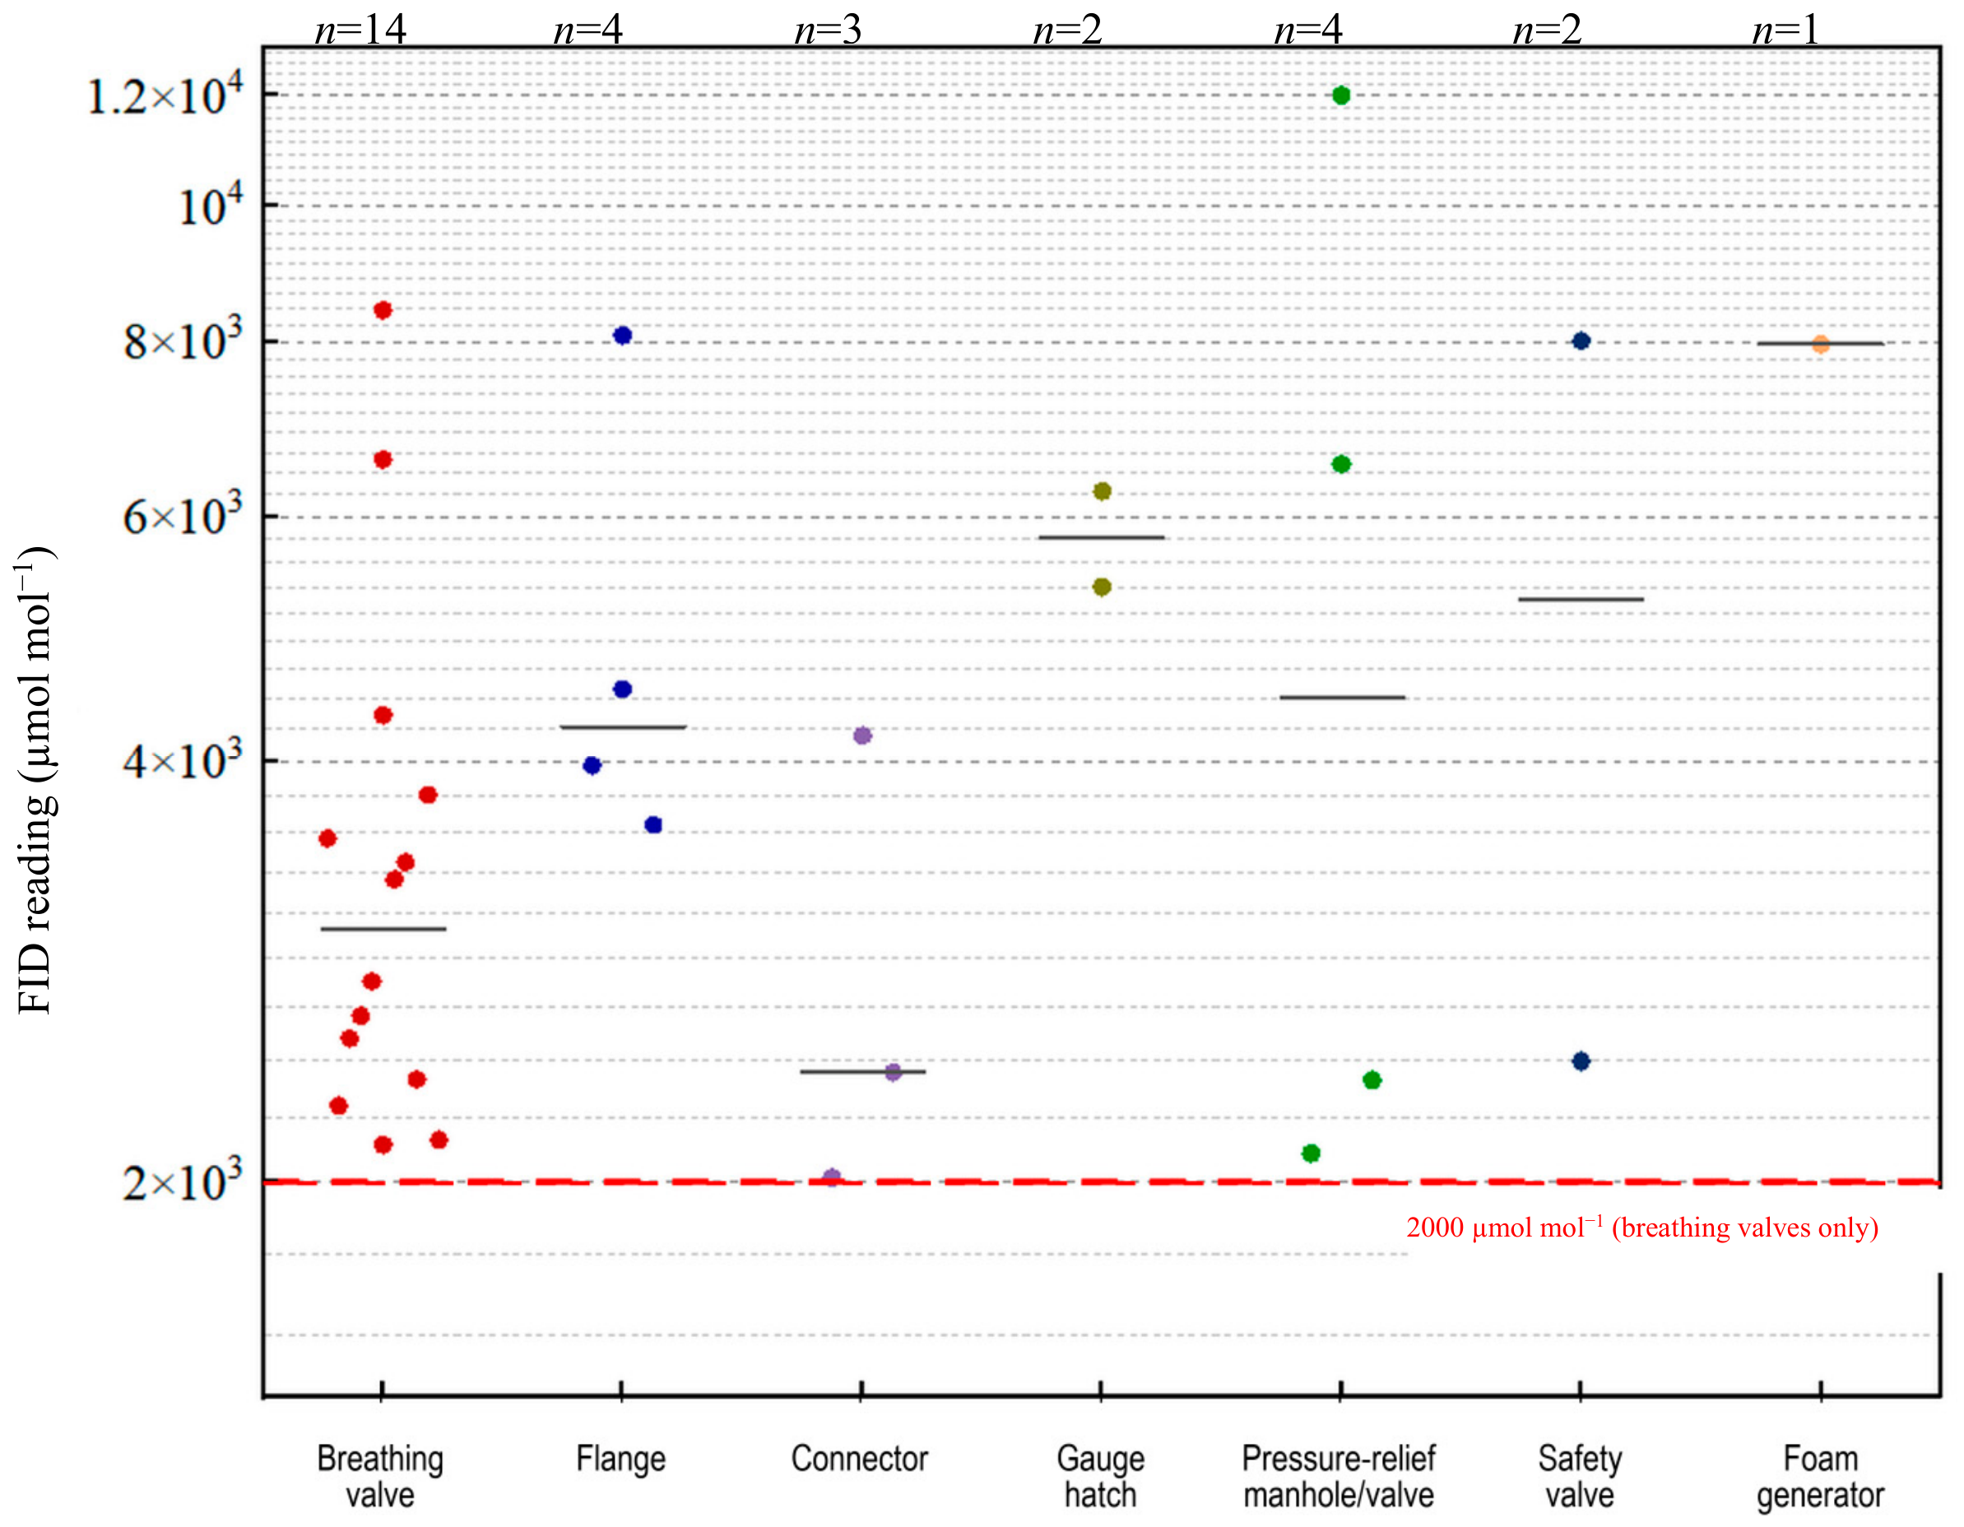
The FID readings for the 14 breathing valves ranged from 2125 to 8423 µmol mol−1 (Figure 5), exceeding the numerical value of 2000 µmol mol−1 specified in the 2024 amendments to GB 31570-2015, GB 31571-2015, and GB 31572-2015 [8]. The breathing-valve provision applies when operating pressure is below 75% of the set opening pressure, subject to the applicable facility and implementation requirements. These readings warrant checking the corresponding operating records; they do not, by themselves, establish a regulatory violation. Unlike Table 5, which summarizes all 46 detected cases, Figure 5 presents the FID-accessible subset of 30 points.
Figure 5.
FID screening readings for the 30 accessible points, grouped by accessory type (µmol mol−1). The red dashed line marks the numerical reference of 2000 µmol mol−1 for breathing valves; its regulatory application requires an operating pressure below 75% of the set opening pressure and the applicable facility requirements. Gray dashed lines are gridlines.
3.2. Comparison of Emissions Estimated by the Two Quantification Methods
Applying the OGI emission-factor method to all 46 detected cases gives an annualized estimate of approximately 43 t a−1 under the 8760 h assumption. Using the factor sets at nominal thresholds of 3 and 60 g h−1 gives approximately 19 and 73 t a−1, respectively; the underlying factors range from 29 to 210 g h−1 (Table 3). This is a factor-scenario range, not a statistical confidence interval. For the 30 FID-accessible accessories, the OGI emission-factor and correlation-equation estimates are 26.3 and 1.86 t a−1, respectively (Table 7 and Figure 6), a ratio of approximately 14. The discrepancy demonstrates sensitivity to the selected estimation framework, rather than a measured error against an independent reference.
Table 7.
Annualized emission estimates for the 30 FID-accessible accessories (8760 h assumed release duration).
Figure 6.
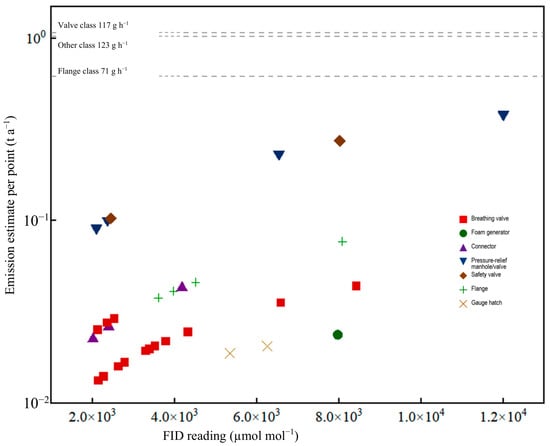
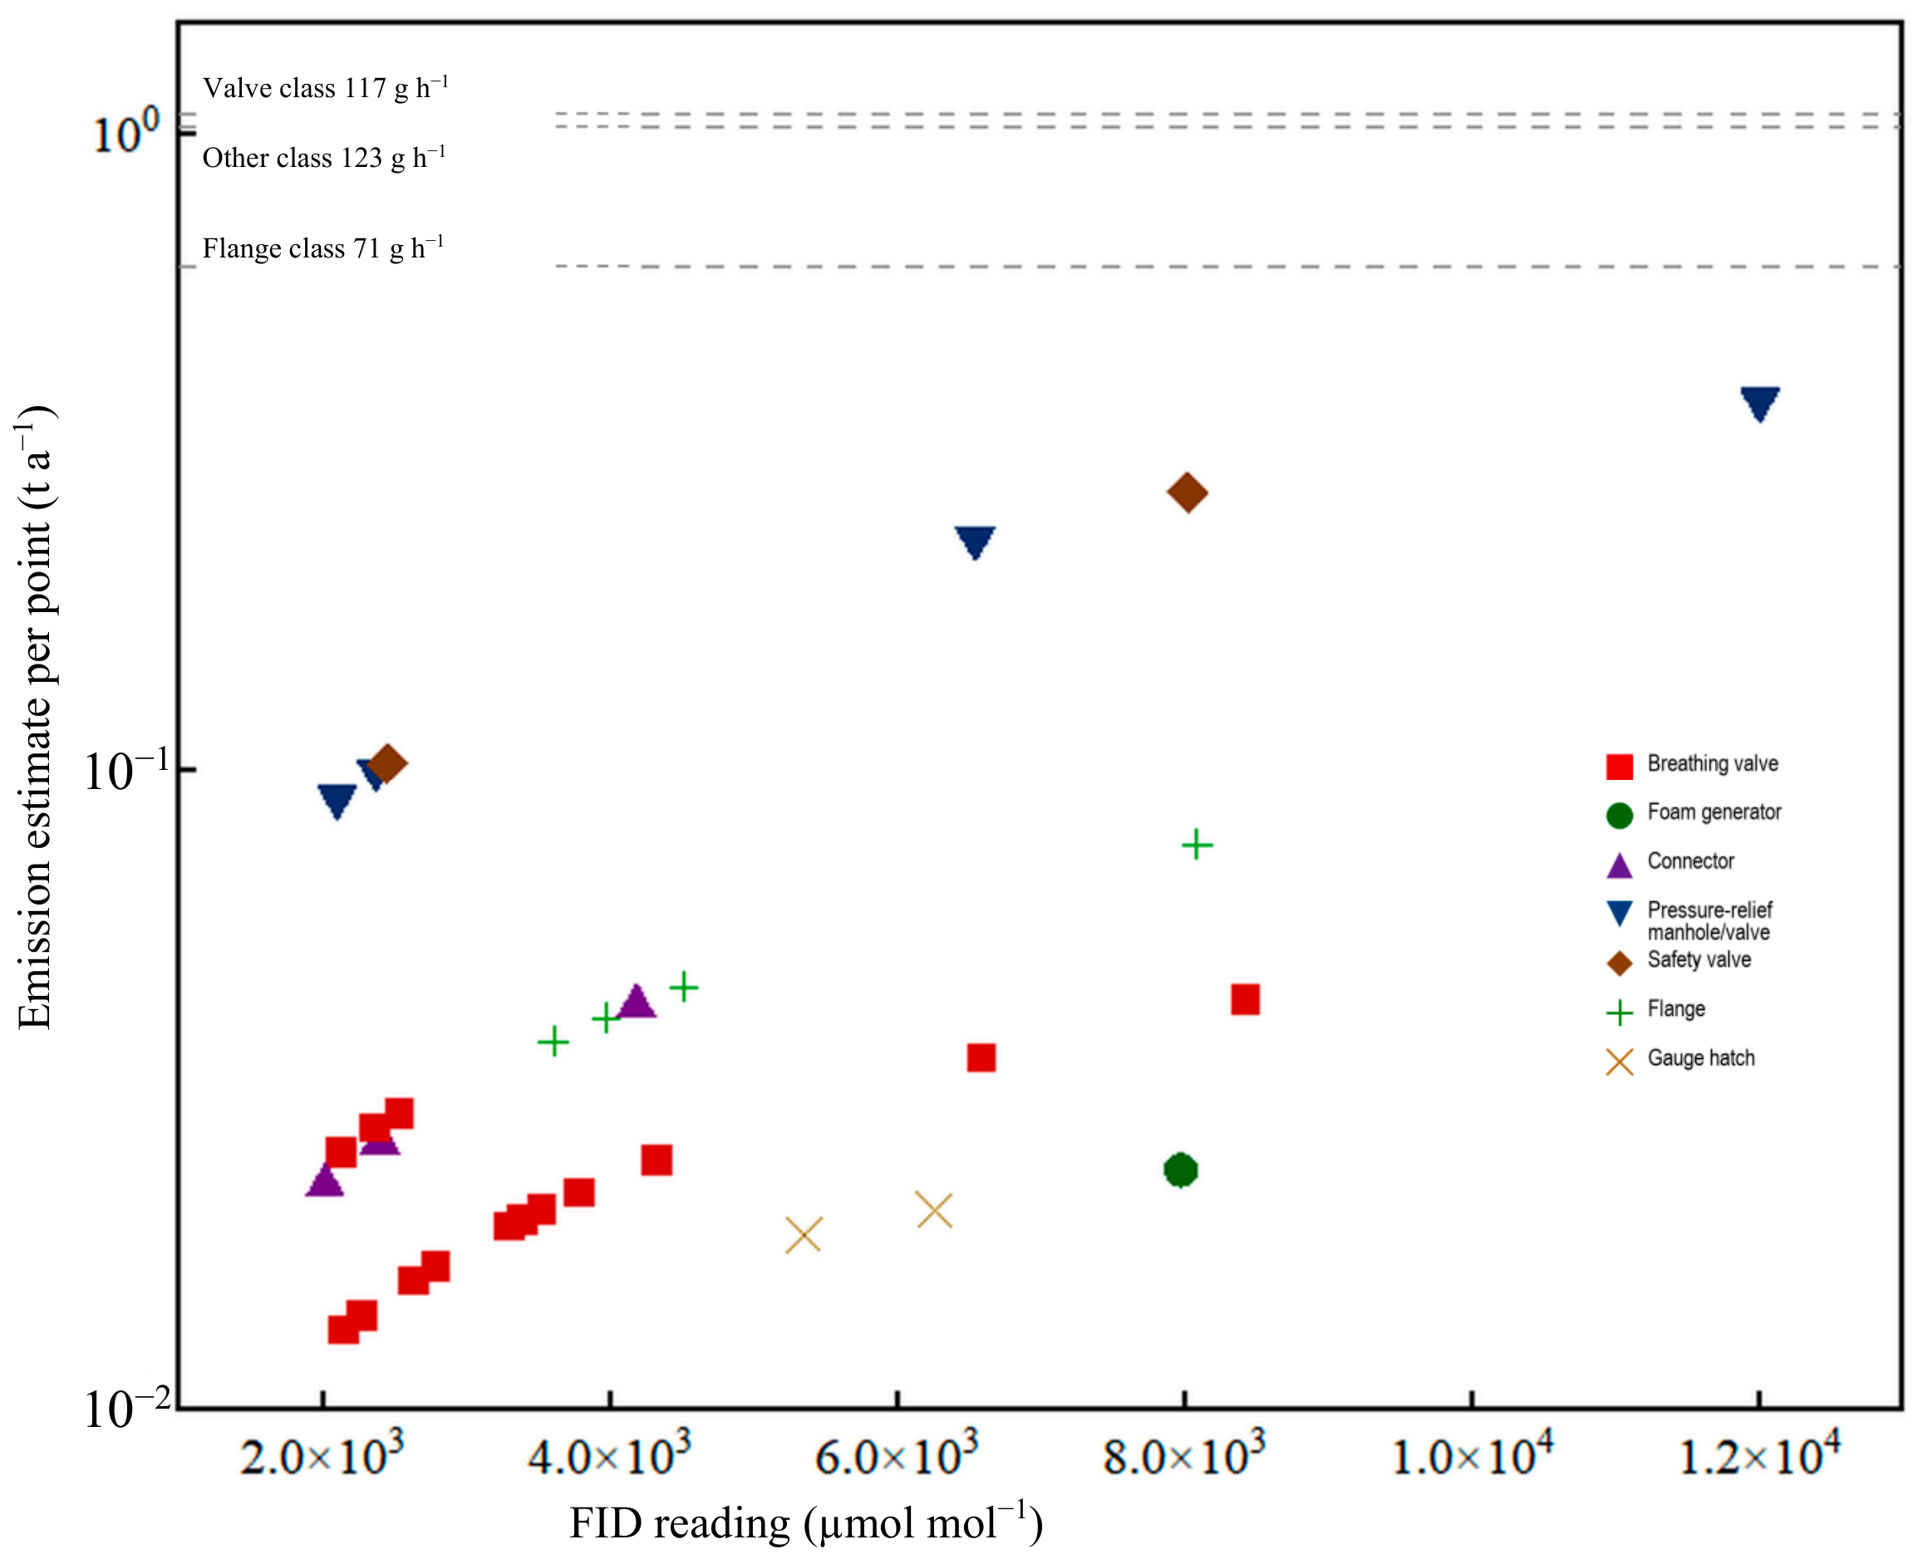
Comparison of estimated annual emissions per point (vertical axis, t a−1) and FID screening readings (horizontal axis, µmol mol−1). Both methods assume 8760 h of release; OGI factor estimates are independent of the FID reading. The gray dashed horizontal lines show the OGI factor-based annualized estimates per point: approximately 0.622, 1.025, and 1.077 t a−1 for the flange, valve, and other classes, respectively, assuming 8760 h of release.
The accessory-level differences in Table 7 should not be interpreted as independent measured deviations for each accessory, because their structure is largely determined by the component-classification mappings of the two methods. On the one hand, the OGI emission-factor method has only three categories: flange, valve, and other. Accessories assigned to the same category therefore receive identical OGI estimates. The equal estimates for the foam generator and breathing valve arise because both were assigned the other-category factor of 123 g h−1, rather than because their emission behavior was identical. Only one foam generator could be quantified, so Table 7 does not report a difference ratio for this category and the single-point value is provided only for reference. Safety valves and pressure-relief manholes/valves were assigned the pressure-relief-equipment correlation equation. Their estimates depend jointly on the coefficient a, exponent b, and screening value. Under the reported assignments, the ratios between the OGI and correlation estimates were approximately three to five for these categories. After considering the classification effects, the correlation-equation estimates of annual emissions per point (0.013–0.38 t a−1) at the FID screening readings in this study (2 × 10³–1.2 × 10⁴ µmol mol−1) were generally one to two orders of magnitude lower than the OGI emission-factor estimates (0.62–1.08 t a−1). In the reported sample, the smaller method ratios occurred in the categories assigned to the pressure-relief-equipment equation. This conclusion is supported mainly by breathing valves (n = 14), flanges (n = 4), and connectors (n = 3), which were the larger categories but still provide limited evidence for generalization; small-sample categories, including gauge hatches and safety valves, provide only qualitative support. In Figure 6, the OGI method appears as three horizontal lines independent of concentration, whereas the correlation-equation method appears as points that vary with FID readings and equation coefficients; the two are generally separated by one to two orders of magnitude.
The methods respond differently to the observed information. OGI factors assign one value to each component class, whereas correlation equations depend on the FID screening value and the chosen component equation. A point concentration does not uniquely determine mass flux at a vent because airflow and dilution also influence the reading. These differences make method transfer to tank-top accessories uncertain, but the present data do not establish that either method is systematically high or low. Ilonze et al. found substantial variability in controlled-release tests of a quantitative OGI system [23]; that methane study used an image-based quantification algorithm, so its errors cannot be transferred directly to the factor method or VOC mixtures examined here. Controlled-release chamber tests likewise show that enclosure design and mixing influence direct flux measurements [28]. An independent reference suitable for the accessory geometry and gas composition is therefore needed to assess accuracy. Ambient ozone concentrations or pollution-episode counts cannot validate accessory mass-emission estimates because they also depend on atmospheric chemistry, transport, and other sources [1].
3.3. Uncertainty Analysis
The principal uncertainties concern temporal representativeness, detection, sample composition, and method mapping. A single inspection characterizes the observed release state. The 8760 h duration is an explicit scenario assumption, not evidence of continuous annual leakage. Applying the same duration to the same paired points leaves their estimate ratio unchanged, but unknown point-specific release durations could change both annual totals and their aggregate ratio. The approximately 19–73 t a−1 OGI range represents alternative factor scenarios for all 46 detections. The 16 FID-inaccessible points are included in that OGI total but excluded from the 30-point paired comparison; their exclusion does not make the 46-point estimate inherently conservative. Detection limits and compound-dependent response may also affect which emissions were observed. The absence of tank-type survey denominators precludes population-level comparisons. Category mapping further affects the estimates: changing safety-valve or pressure-relief manhole assignments changes their assigned OGI factors, without establishing the physically correct mapping. The approximately 14-fold ratio is conditional on the reported mapping and mass conventions and requires independent field validation. Generalization beyond this targeted, single-park survey should be cautious.
3.4. Control Implications
The observed detection counts and access limitations support prioritizing inspection of breathing valves and foam generators in this park. These priorities describe the detected sample, not the highest population failure rates. Normal pressure-relief opening during tank breathing or filling is one possible explanation for breathing-valve detections [26]. Leakage past an incompletely seated valve is an alternative hypothesis. The available observations cannot distinguish these possibilities because corresponding pressure and valve-condition evidence is unavailable. Foam-generator seals and maintenance records merit inspection, while breathing-valve settings should be checked against design requirements and actual operating pressure. Automated monitoring and fault-diagnosis methods for storage-tank pressure-vacuum relief valves have recently been developed and could support these checks [29]. Compliance assessment should apply the relevant standard, including the condition that operating pressure is below 75% of the set opening pressure for the 2000 µmol mol−1 breathing-valve criterion [8]. The amendments specify implementation and repair provisions that depend on facility and operating circumstances; the breathing-valve provision became applicable to existing enterprises on 31 December 2025. The numerical screening readings alone do not establish retrospective non-compliance. OGI can complement probe screening at elevated or inaccessible locations, but follow-up measurements and operating records are needed to characterize release mechanisms and duration. Field evaluations of LDAR effectiveness at petrochemical facilities also support prioritizing high-emitting accessories [30].
4. Conclusions
- (1)
- OGI detected evident fugitive VOC emissions from 46 of approximately 200 volatile organic liquid storage tanks in the industrial park. Breathing valves (14 tanks) and foam generators (13 tanks) together accounted for approximately 59% and were the most frequent categories among the detected cases. Among the detected tanks, 27 were fixed-roof tanks and 19 were internal floating-roof tanks, indicating that fugitive emissions from floating-roof-tank accessories also warrant attention.
- (2)
- FID readings were available for 30 of the 46 detected cases. Twelve of 13 foam-generator detections were inaccessible to the probe, demonstrating an inspection-coverage limitation that OGI can help address. This does not establish a general exclusion of foam generators from all LDAR programs.
- (3)
- The 14 breathing-valve FID readings (2125–8423 µmol mol−1) exceeded the numerical value of 2000 µmol mol−1 in the amended standards. A regulatory determination additionally requires the applicable facility provisions and confirmation that operating pressure was below 75% of the set opening pressure. The survey readings alone do not establish these conditions.
- (4)
- Under the common 8760 h annualization assumption, the two methods yielded 26.3 and 1.86 t a−1 for the 30 paired points, a difference of approximately 14-fold. This difference reflects the estimation framework and component mapping; it does not identify the more accurate method. Independent mass-flux measurements, appropriate gas-response characterization, and release-duration information are needed to validate annual estimates.
Future studies may combine field comparisons of emissions from storage-tank accessories to further validate the estimation performance of the two methods, develop locally derived emission factors for storage-tank accessories, and integrate elevated fixed OGI or online infrared monitoring with tank-farm operating-condition data to deepen analysis of emission dynamics and provide methodological support for storage-tank VOC emission inventories and LDAR supervision.
Author Contributions
Conceptualization, G.Z. and M.B.; methodology, M.B.; formal analysis, M.B.; investigation, M.B. and Y.L.; resources, Y.L.; data curation, M.B.; writing—original draft preparation, M.B.; writing—review and editing, G.Z. and Y.L.; supervision, G.Z. and Y.L.; project administration, G.Z.; funding acquisition, Y.L. All authors have read and agreed to the published version of the manuscript.
Funding
This research was funded by the Shanghai Municipal Bureau of Ecology and Environment, grant numbers Hu Huan Ke [2024] No. 10 and Hu Huan Ke [2025] No. 7, and the Shanghai Chemical Industry Park Administration Committee, grant number 12020200199.
Institutional Review Board Statement
Not applicable.
Informed Consent Statement
Not applicable.
Data Availability Statement
The data presented in this study are available on reasonable request from the corresponding author. The data are not publicly available because they were obtained from enterprises in the industrial park and are subject to commercial confidentiality.
Acknowledgments
The authors thank the enterprises in the chemical industrial park for their cooperation during the field survey.
Conflicts of Interest
The authors declare no conflicts of interest.
References
- She, Y.; Li, J.; Lyu, X.; Guo, H.; Qin, M.; Xie, X.; Gong, K.; Ye, F.; Mao, J.; Huang, L.; et al. Current status of model predictions of volatile organic compounds and impacts on surface ozone predictions during summer in China. Atmos. Chem. Phys. 2024, 24, 219–233. [Google Scholar] [CrossRef] [Scilit]
- U.S. Environmental Protection Agency. Volatile Organic Compounds’ Impact on Indoor Air Quality. Available online: https://www.epa.gov/indoor-air-quality-iaq/volatile-organic-compounds-impact-indoor-air-quality (accessed on 29 September 2026).
- International Agency for Research on Cancer. Benzene. IARC Monographs on the Evaluation of Carcinogenic Risks to Humans, Volume 120; IARC: Lyon, France, 2018; Available online: https://publications.iarc.who.int/576 (accessed on 29 September 2026).
- Wang, F.T.; Chen, J.; Zhou, X.S.; Cui, J.S.; Zhuang, S.Y. Analysis of methods for estimating VOC losses from organic liquid storage tanks in the petrochemical industry. Saf. Health Environ. 2017, 17, 29–33. (In Chinese) [Google Scholar]
- Liu, S.D.; Hou, S.D.; Liu, Z.S.; Liao, C.J.; Wang, K.L.; Zhao, L. Progress in control technologies for deep reduction of VOCs from domestic petrochemical organic liquid storage tanks. Pet. Refin. Eng. 2022, 52, 11–18. (In Chinese) [Google Scholar]
- Ministry of Ecology and Environment of the People’s Republic of China. Comprehensive Control Plan for Volatile Organic Compounds in Key Industries: Huan Da Qi [2019] No. 53; Ministry of Ecology and Environment: Beijing, China, 2019. Available online: https://www.mee.gov.cn/xxgk2018/xxgk/xxgk03/201907/t20190703_708395.html (accessed on 31 August 2026). (In Chinese)
- GB 37822-2019; Standard for Fugitive Emission of Volatile Organic Compounds. China Environment Publishing Group: Beijing, China, 2019. Available online: https://www.mee.gov.cn/xxgk2018/xxgk/xxgk01/201906/t20190610_706028.html (accessed on 31 August 2026). (In Chinese)
- Ministry of Ecology and Environment of the People’s Republic of China. State Administration for Market Regulation. Announcement on the Amendments to Emission Standard of Pollutants for Petroleum Refining Industry (GB 31570-2015), Emission Standard of Pollutants for Petroleum Chemistry Industry (GB 31571-2015), and Emission Standard of Pollutants for Synthetic Resin Industry (GB 31572-2015); Announcement No. 17 of 2024; Ministry of Ecology and Environment: Beijing, China, 2024. Available online: https://www.mee.gov.cn/xxgk2018/xxgk/xxgk01/202406/t20240611_1075417.html (accessed on 31 August 2026). (In Chinese)
- Liu, M.M.; Liu, F.; Wang, Y.Q.; Duan, W.C. Analysis of factors affecting breathing losses from storage tanks in petrochemical enterprises. Chem. Environ. Prot. 2017, 37, 357–361. (In Chinese) [Google Scholar]
- Li, J.; Wang, M.Y.; Zhang, J.; He, W.Q.; Nie, L.; Shao, X. Study on the quantitative estimation method for VOC emissions from petrochemical storage tanks based on the TANKS 4.0.9d model. Huan Jing Ke Xue 2013, 34, 4718–4723. (In Chinese) [Google Scholar] [PubMed]
- Rampi, D.; Tagliaferri, F.; Invernizzi, M. Modeling VOC emissions from hydrocarbon tanks: Mechanistic insights vs. inventory approaches. Comput. Chem. Eng. 2026, 210, 109633. [Google Scholar] [CrossRef] [Scilit]
- Tagliaferri, F.; Sironi, S.; Invernizzi, M. Assessing VOC Dispersion from Hydrocarbon Storage Tanks: A Case Study on Emission Temporal Resolution. Appl. Sci. 2026, 16, 1851. [Google Scholar] [CrossRef] [Scilit]
- Jackson, M.M. Organic liquids storage tanks volatile organic compounds (VOCs) emissions dispersion and risk assessment in developing countries: The case of Dar-es-Salaam City, Tanzania. Environ. Monit. Assess. 2006, 116, 363–382. [Google Scholar] [CrossRef] [Scilit] [PubMed]
- Eisaei, H.R.; Ahmadi Dehrashid, S.S.; Khani, M.R.; Hashemi, S.M. Assessment and control of VOCs emitted from gas stations in Tehran, Iran. Pollution 2015, 1, 363–371. [Google Scholar] [CrossRef]
- Zhang, C.; Sun, H.; Zhao, F.; Duan, W.; Zhao, D. Emission characteristics, source profiles and associated environmental impacts of volatile organic compounds (VOCs) from a typical oilfield centralized processing plant in Southern Xinjiang, China. Environ. Pollut. 2026, 405, 128545. [Google Scholar] [CrossRef] [Scilit] [PubMed]
- Ministry of Ecology and Environment of the People’s Republic of China. Guidelines for Screening VOC Pollution Sources in the Petrochemical Industry; Ministry of Ecology and Environment: Beijing, China, 2015. Available online: https://www.mee.gov.cn/gkml/hbb/bgt/201511/t20151124_317577.htm (accessed on 31 August 2026). (In Chinese)
- Cheng, A.; Li, S.; Li, W. Study on volatile organic compound source profiles and dynamic emission inventories in an integrated refinery-petrochemical complex. Atmos. Pollut. Res. 2025, 16, 102550. [Google Scholar] [CrossRef] [Scilit]
- Lev-On, M.; Epperson, D.; Siegell, J.; Ritter, K. Derivation of new emission factors for quantification of mass emissions when using optical gas imaging for detecting leaks. J. Air Waste Manag. Assoc. 2007, 57, 1061–1070. [Google Scholar] [CrossRef] [Scilit] [PubMed]
- Zimmerle, D.; Vaughn, T.; Bell, C.S.; Bennett, K.; Deshmukh, P.; Thoma, E. Detection limits of optical gas imaging for natural gas leak detection in realistic controlled conditions. Environ. Sci. Technol. 2020, 54, 11506–11514. [Google Scholar] [CrossRef] [Scilit] [PubMed]
- Ravikumar, A.P.; Wang, J.; Brandt, A.R. Are optical gas imaging technologies effective for methane leak detection? Environ. Sci. Technol. 2017, 51, 718–724. [Google Scholar] [CrossRef] [Scilit] [PubMed]
- Abdel-Moati, H.; Morris, J.; Zeng, Y.; Kangas, P.; McGregor, D. New optical gas imaging technology for quantifying fugitive emission rates. In Proceedings of the International Petroleum Technology Conference, Doha, Qatar, 6–9 December 2015. Paper No. IPTC-18471-MS. [Google Scholar] [CrossRef] [Scilit]
- Carrera, L.; Sironi, S.; Invernizzi, M. Toward Effective Monitoring of Diffuse VOC Emissions: A Critical Discussion and Review of the Applications of EN 17628:2022. Sensors 2025, 25, 1561. [Google Scholar] [CrossRef] [Scilit] [PubMed]
- Ilonze, C.; Wang, J.; Ravikumar, A.P.; Zimmerle, D. Methane Quantification Performance of the Quantitative Optical Gas Imaging (QOGI) System Using Single-Blind Controlled Release Assessment. Sensors 2024, 24, 4044. [Google Scholar] [CrossRef] [Scilit] [PubMed]
- FLIR Systems. User’s Manual: FLIR GF Series; Publication T810223. Available online: https://support.flir.com/DSDownload/Assets/T810223-en-US_A4-lr.pdf (accessed on 29 September 2026).
- HJ 1230-2021; Technical Guide for Leak Detection and Repair of Volatile Organic Compounds in Industries. China Environment Publishing Group: Beijing, China, 2021. Available online: https://www.mee.gov.cn/ywgz/fgbz/bz/bzwb/dqhjbh/xgbz/202201/t20220112_966774.shtml (accessed on 31 August 2026). (In Chinese)
- U.S. Environmental Protection Agency. AP-42, Chapter 7, Section 7.1: Organic Liquid Storage Tanks. 2026. Available online: https://www.epa.gov/system/files/documents/2026-08/c7s1_2026.pdf (accessed on 7 October 2026).
- CONCAWE. Techniques for Detecting and Quantifying Fugitive Emissions: Results of Comparative Field Studies; Report No. 6/15; CONCAWE: Brussels, Belgium, 2015; Available online: https://www.concawe.eu/wp-content/uploads/2017/01/rpt_15-6.pdf (accessed on 31 August 2026).
- Williams, J.P.; El Hachem, K.; Kang, M. Controlled-release testing of the static chamber methodology for direct measurements of methane emissions. Atmos. Meas. Tech. 2023, 16, 3421–3435. [Google Scholar] [CrossRef] [Scilit]
- Jiang, Z.; Meng, L.; Jiang, P.; Zhang, Y.; Xiu, G. Intelligent monitoring of storage tank pressure-vacuum relief valve: A deep learning approach for fault diagnosis and emission quantification. Process Saf. Environ. Prot. 2026, 217, 109396. [Google Scholar] [CrossRef] [Scilit]
- Dai, A.; Zhao, S.; Yuan, S.; Liu, R.; Liang, B.; Liu, Z. Research on the effectiveness of LDAR and precise emission reduction strategies of five typical petrochemical companies. J. Clean. Prod. 2025, 489, 144745. [Google Scholar] [CrossRef] [Scilit]

Disclaimer/Publisher’s Note: The statements, opinions and data contained in all publications are solely those of the individual author(s) and contributor(s) and not of MDPI and/or the editor(s). MDPI and/or the editor(s) disclaim responsibility for any injury to people or property resulting from any ideas, methods, instructions or products referred to in the content. |
© 2026 by the authors. Licensee MDPI, Basel, Switzerland. This article is an open access article distributed under the terms and conditions of the Creative Commons Attribution (CC BY) license.