


Abstract
Codon usage bias is important for regulating protein translation efficiency and accuracy. The HSP90 gene, a pivotal gene in plants, maintains homeostasis in plant protein stress responses and organelle immune defense functions. We systematically examine codon usage preferences in six forage grass species and the regulatory mechanisms of the HSP90 gene in governing codon preference. A set of metrics is evaluated, including effective codon number (ENC), codon adaptation index, and relative synonymous codon usage. Neutral evolutionary trajectories reveal usage preferences for six plant codons, with natural selection serving as the primary driving factor. The correlation between the ENC–GC3 curve (ENC relative to third-position GC content in synonymous codons) and codon bias index reveals these genes to exhibit moderate codon bias. The phenomenon of evolutionary constraints is exemplified by a propensity for C/G-terminating codons, concomitant with a suppression of NUA/NCG codons (NUA is an abbreviation for UA dinucleotide, and NCG is an abbreviation for CG dinucleotide). Phylogenomic reconstruction reveals a conserved diversification pathway, positioning P. giganteum A. Rich. at the basal node of the evolutionary framework. This study identified through systematic assessment that natural selection is the primary evolutionary force driving the biased use of codons in grass HSP90 genes. This finding provides actionable insights for enhancing abiotic stress tolerance in forage germplasm through precise codon engineering.
1. Introduction
The Poaceae includes major forage grasses and staple cereal crops that are important components of global agricultural systems and livestock production [1]. However, these grasses have been negatively affected by abiotic stresses driven by climate change, particularly rising temperatures and water scarcity [2,3] that mostly impair chloroplast function and reduce photosynthetic efficiency [4,5]. Within chloroplasts, the HSP90 gene affects the spatial function and physiological role of proteins under extreme environmental conditions [6]. HSP90 proteins function as molecular chaperones, facilitating the proper folding of newly synthesized peptides and stabilizing proteins denatured by environmental stresses [7]. However, despite the functional importance of HSP90, the evolutionary trajectory and regulatory networks governing expression of HSP90 genes in Poaceae grasses are incompletely known [8]. Investigation of the influence of codon usage bias (CUB)—which modulates translational efficiency and gene expression optimization [9,10]—on regulatory mechanisms of HSP90 in this family is warranted [9,10].
CUB reflects the degree of preference exhibited by genes for specific codons. This phenomenon is attributable to the combined effects of mutation patterns, tRNA abundance, and genomic structure [11,12]. In plants, the distinct CUB characteristics between nuclear and organellar genomes, and monocot and dicot lineages, reflect distinct evolutionary pressures [13]. For instance, monocots generally manifest protein-coding sequences (CDS) with augmented GC content, whereas dicots exhibit an AT-rich genomic composition. This divergence is associated with disparate selection pressures on translational accuracy and efficiency [14]. Gene expression levels typically correlate positively with the degree of bias in corresponding codons. This is particularly evident in stress-responsive genes, where codon optimization can enhance mRNA stability and translational efficiency under adverse conditions [15,16]. These insights have been leveraged in cutting-edge biotechnological research; for example, targeted synonymous codon replacement has been used to engineer stress-tolerant cyanobacterial systems [17].
The HSP90 gene occurs in plants and animals. It encodes a molecular chaperone that plays an important role in integrating protein homeostasis, growth and development, hormone signaling transduction, and stress-resistant immune responses. It achieves this by regulating the maturation and stability of target proteins [18]. While HSP90 homologs are important mediators of heat tolerance and pathogen defense responses, insufficient research on HSP90 genes has been performed in plant genetics. These genes may positively affect plant adaptation to stress [19], while their specific regulatory mechanisms governing codon usage pattern—particularly in grass species—are poorly understood [20,21]. Accordingly, despite the potential significance of HSP90 gene research for enhancing forage stress resistance, few studies have expressly investigated this gene family [22,23].
We investigate HSP90 gene codon-usage patterns in six economically important grasses, and quantify key CUB metrics (e.g., ENC, RSCU, and codon adaptation index (CAI)). We intend to elucidate the evolutionary mechanisms driving HSP90 codon preference to advance understanding of HSP90 use regulation mechanisms in this crop group. We also investigate the primary drivers of the CUB phenomenon in HSP90 genes in Poaceae by correlating codon-usage patterns with gene-expression profiles and integrating genomic features, including GC content.
2. Materials and Methods
2.1. Collecting and Preprocessing HSP90 Gene Sequence Data
A dataset for six species was constructed by integrating protein sequence datasets from five Poaceae grasses (Pennisetum giganteum A. Rich., P. purpureum Schumach., Elymus sibiricus L., E. curvula (Schrad.) Nees., and Lolium perenne L.) with previously sequenced proteome data for Dactylis glomerata. Data were obtained from the NCBI database [24]. To accurately identify HSP90 proteins, a dual screening strategy was used: (1) a Hidden Markov Model (HMM)-based profiling using the PF00183 (HSP90 family) domain model from the Pfam database (http://pfam.xfam.org/; accessed on 2 March 2025) for sequence-profile alignment [25], and (2) an aa local BLAST 2.11.0 search using Arabidopsis thaliana (L.) Heynh. HSP90 protein sequences as queries. A domain analysis of candidate sequences was performed using Pfam and SMART databases (https://smart.embl.de/; accessed on 4 March 2025); the frequency of the conserved HATPase_c (histidine kinase-like ATPase) and characteristic HSP90 domains was validated using the InterPro database (https://www.ebi.ac.uk/interpro/; accessed on 4 March 2025) to ensure result reliability [26]. To ensure annotation accuracy, sequences lacking either aforementioned domain were manually excluded (Raw Sequence Data for Six Grasses in Supplementary Materials). This integrated strategy aligns with established protocols in codon usage research to minimize false-positive results in gene family identification [27]. Prior to phylogenetic tree construction, the optimal nucleotide substitution model for aligning sequences of the HSP90 CDS was determined using ModelTest-NG v0.1.7 software. Model selection was based on the Bayesian Information Criterion. The (ultimately selected) GTR + G model was used for tree inference analysis in MEGA X 11 software.
2.2. Calculation of Codon Bias Metrics
Codon bias analysis of the HSP90 gene for the six grasses was performed using TBtools II v2.052 software. CDS values of HSP90 homologous proteins were extracted from each genome [28]. For CDS screening, the sequence had to commence with ATG and conclude with TGA, TAA, or TAG.
Many codon preference indices have been developed, including the relative frequency of the third base in codons; T3s, A3s, G3s, and C3s were calculated using the CUSP program in EMBOSS software 6.6.0 [29]. ENC values (ranging 20–60) across species were calculated using the CHIPS algorithm; an ENC of 20 indicates an extreme preference for a codon, whereas one of 60 indicates an extreme disfavor for the 60th codon. This metric quantifies the strength of codon preference and the degree of translation optimization [30,31]. Results were visualized to illustrate species-specific distributions of third-position nucleotides (T3s, A3s, G3s, C3s), and overall genomic GC content (GCall).
2.3. Construction of the ENC-GC3 Curve
The effective codon number (ENC) was used to quantify the CUB of HSP90 genes for the six species [32]. Correlations between ENC values and GC content at the third codon site (GC3) were also explored. A theoretical ENC–GC3 curve (solid line) was constructed based on a neutral codon-usage hypothesis to distinguish mutation pressure from selection-driven bias. A comparative analysis integrating the codon bias index (CBI) with ENC values—where a negative correlation exists (i.e., lower ENC indicates stronger bias)—was performed to examine correlations between codon optimization and protein translation efficiency [33]. To identify codon usage patterns among taxonomic groups, mean ENC values were calculated for each species.
2.4. Analysis of PR2-Bias Plot
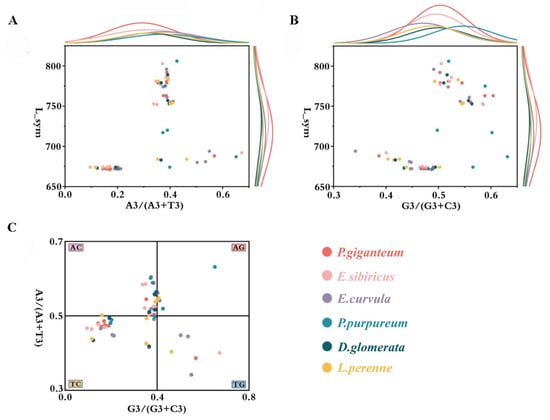
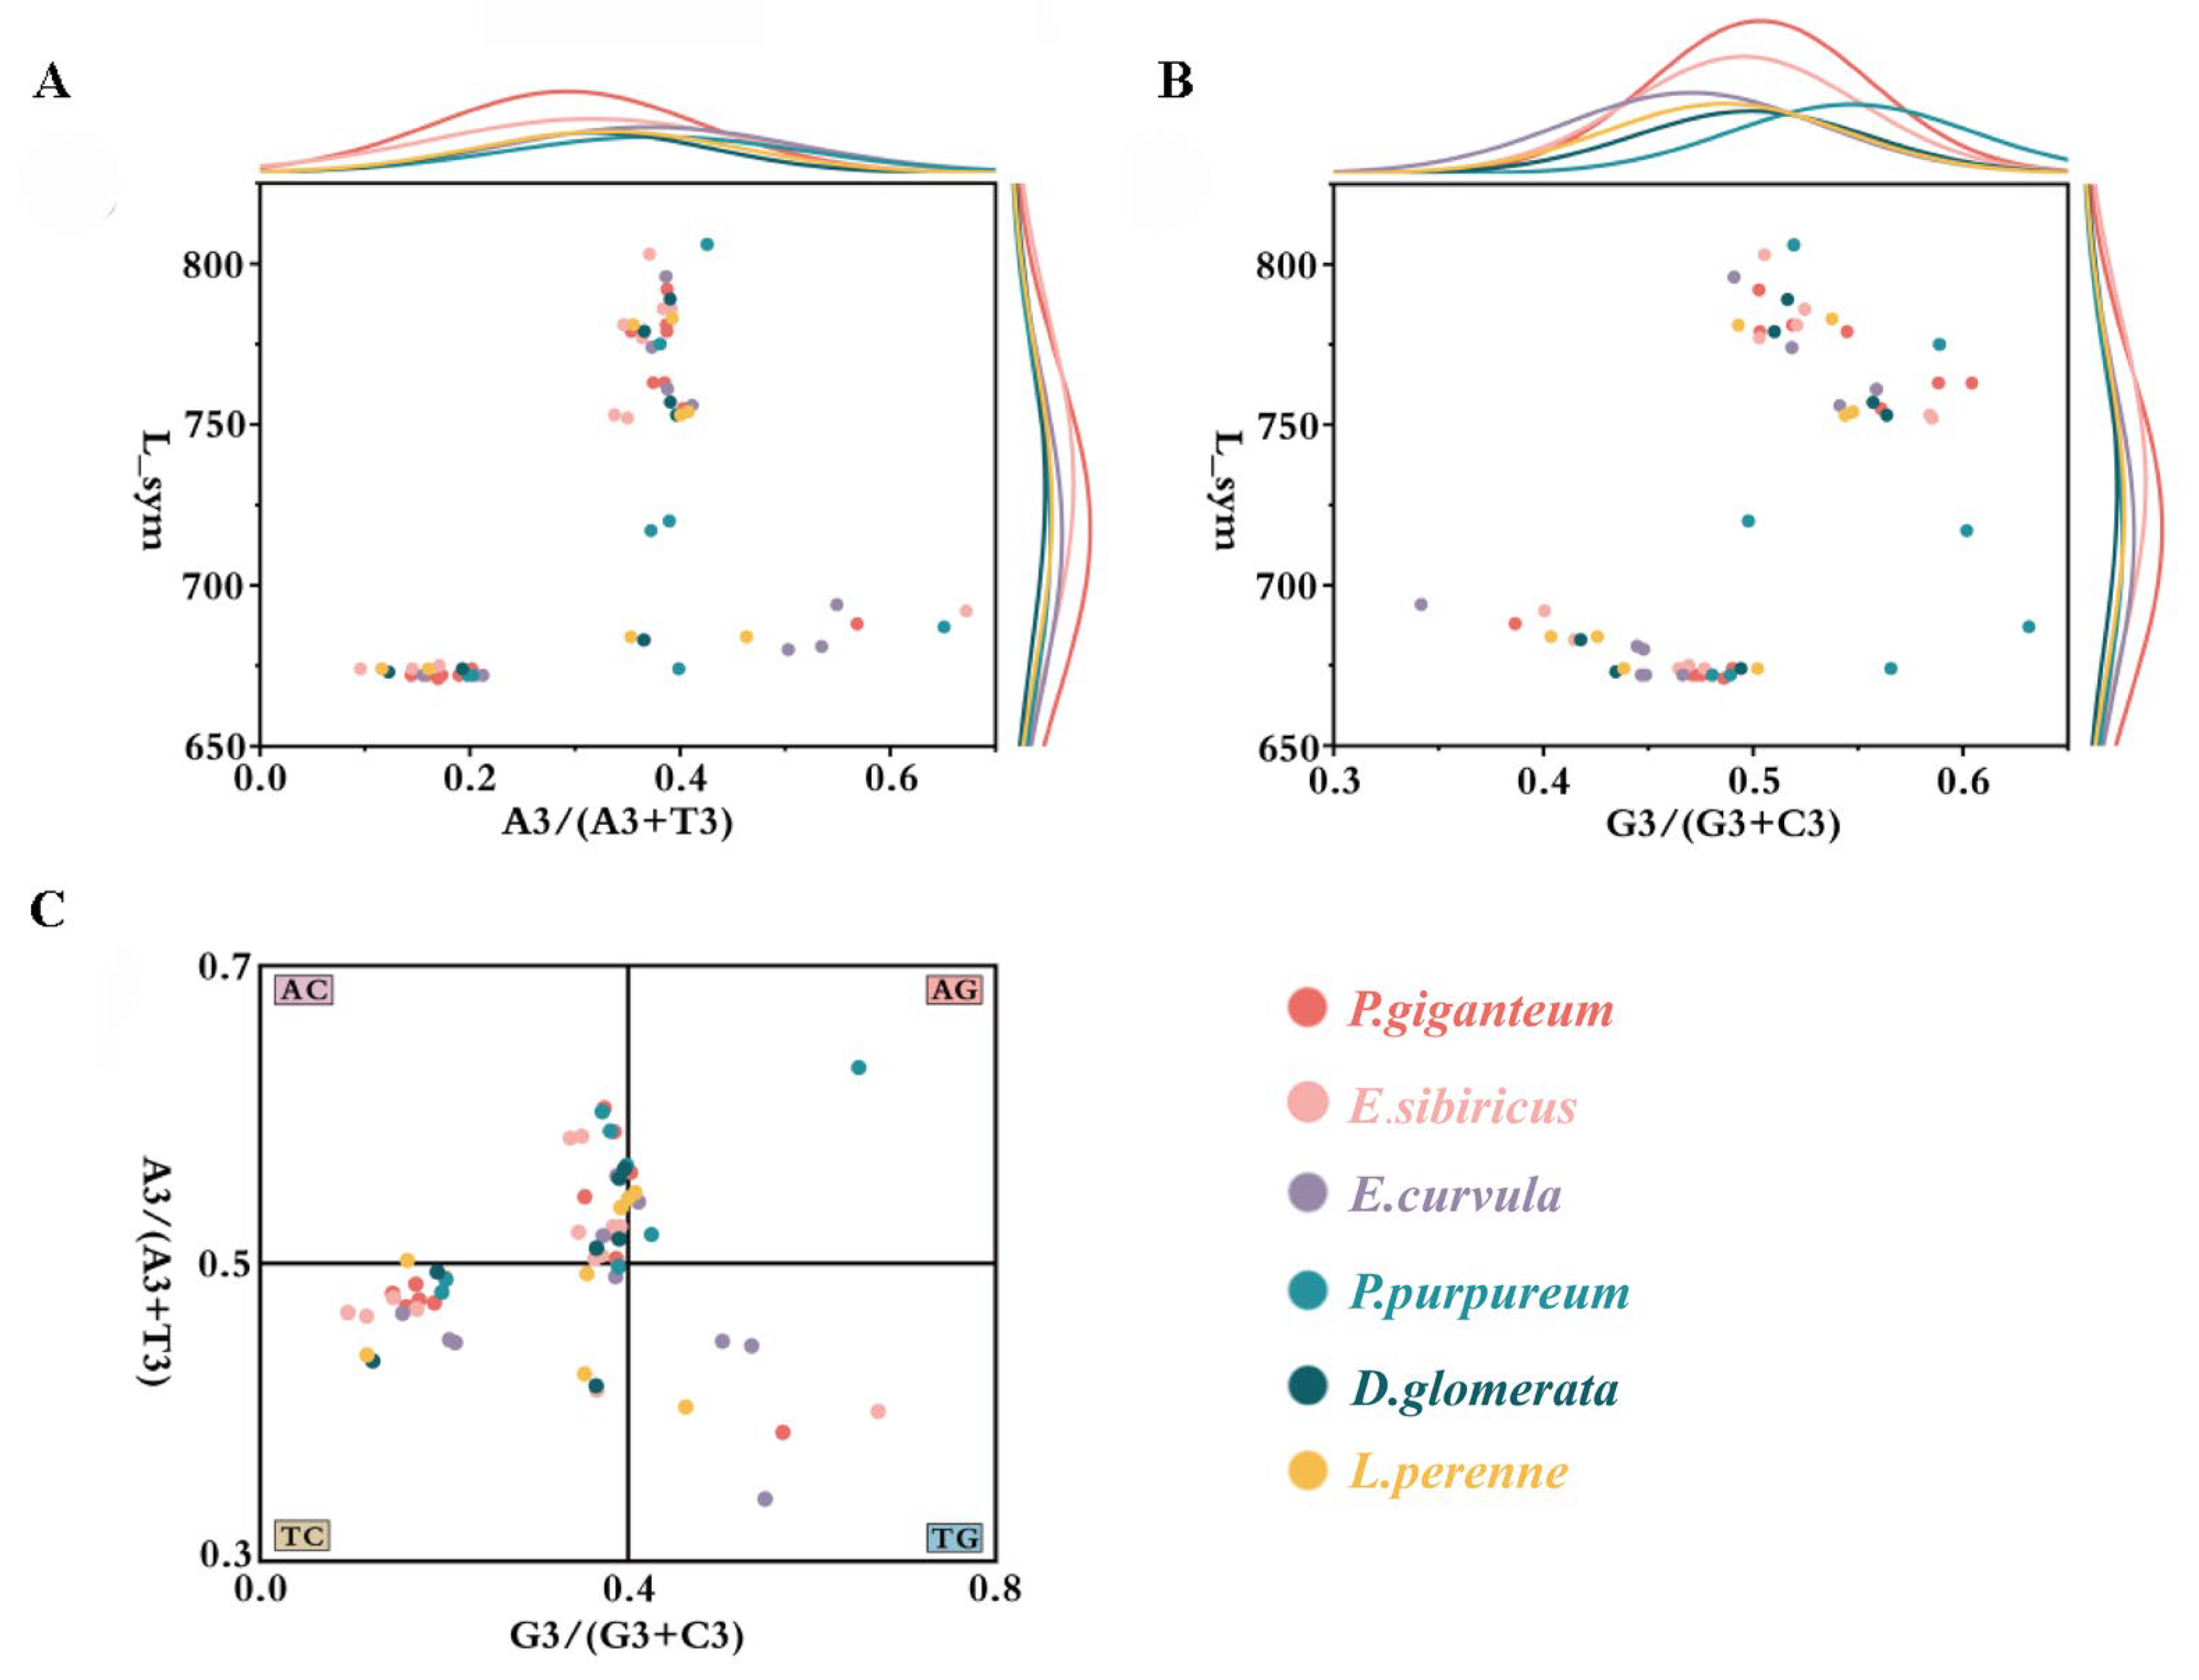
To assess the relative roles of mutation and selection in shaping CUB, Parity Rule 2 (PR2) plot analysis was performed [34]. Assuming strict neutral mutation pressure, the frequencies of purine (A/G) and pyrimidine (T/C) at the third codon position should be equal (i.e., A/(A + T) = 0.5 and G/(G + C) = 0.5). For each codon, third-position nucleotide ratios were calculated as G3/(G3 + C3) (x-axis) and A3/(A3 + T3) (y-axis). If mutation pressure solely governed codon usage, all points should center around |0.5|; deviations indicate that additional factors (primarily natural selection) must be considered. We quantified these deviations by calculating a symmetry index (L_sym) for each species, as outlined by Sueoka. Higher L_sym values indicate more balanced nucleotide usage (closer to parity), and lower values denote stronger directional bias [35].
2.5. Analysis of Neutrality Plot
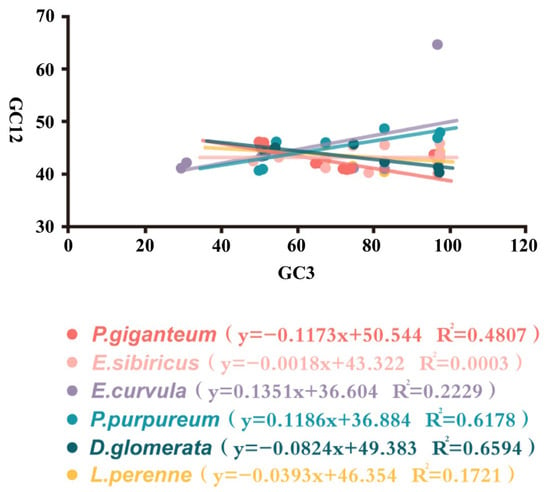
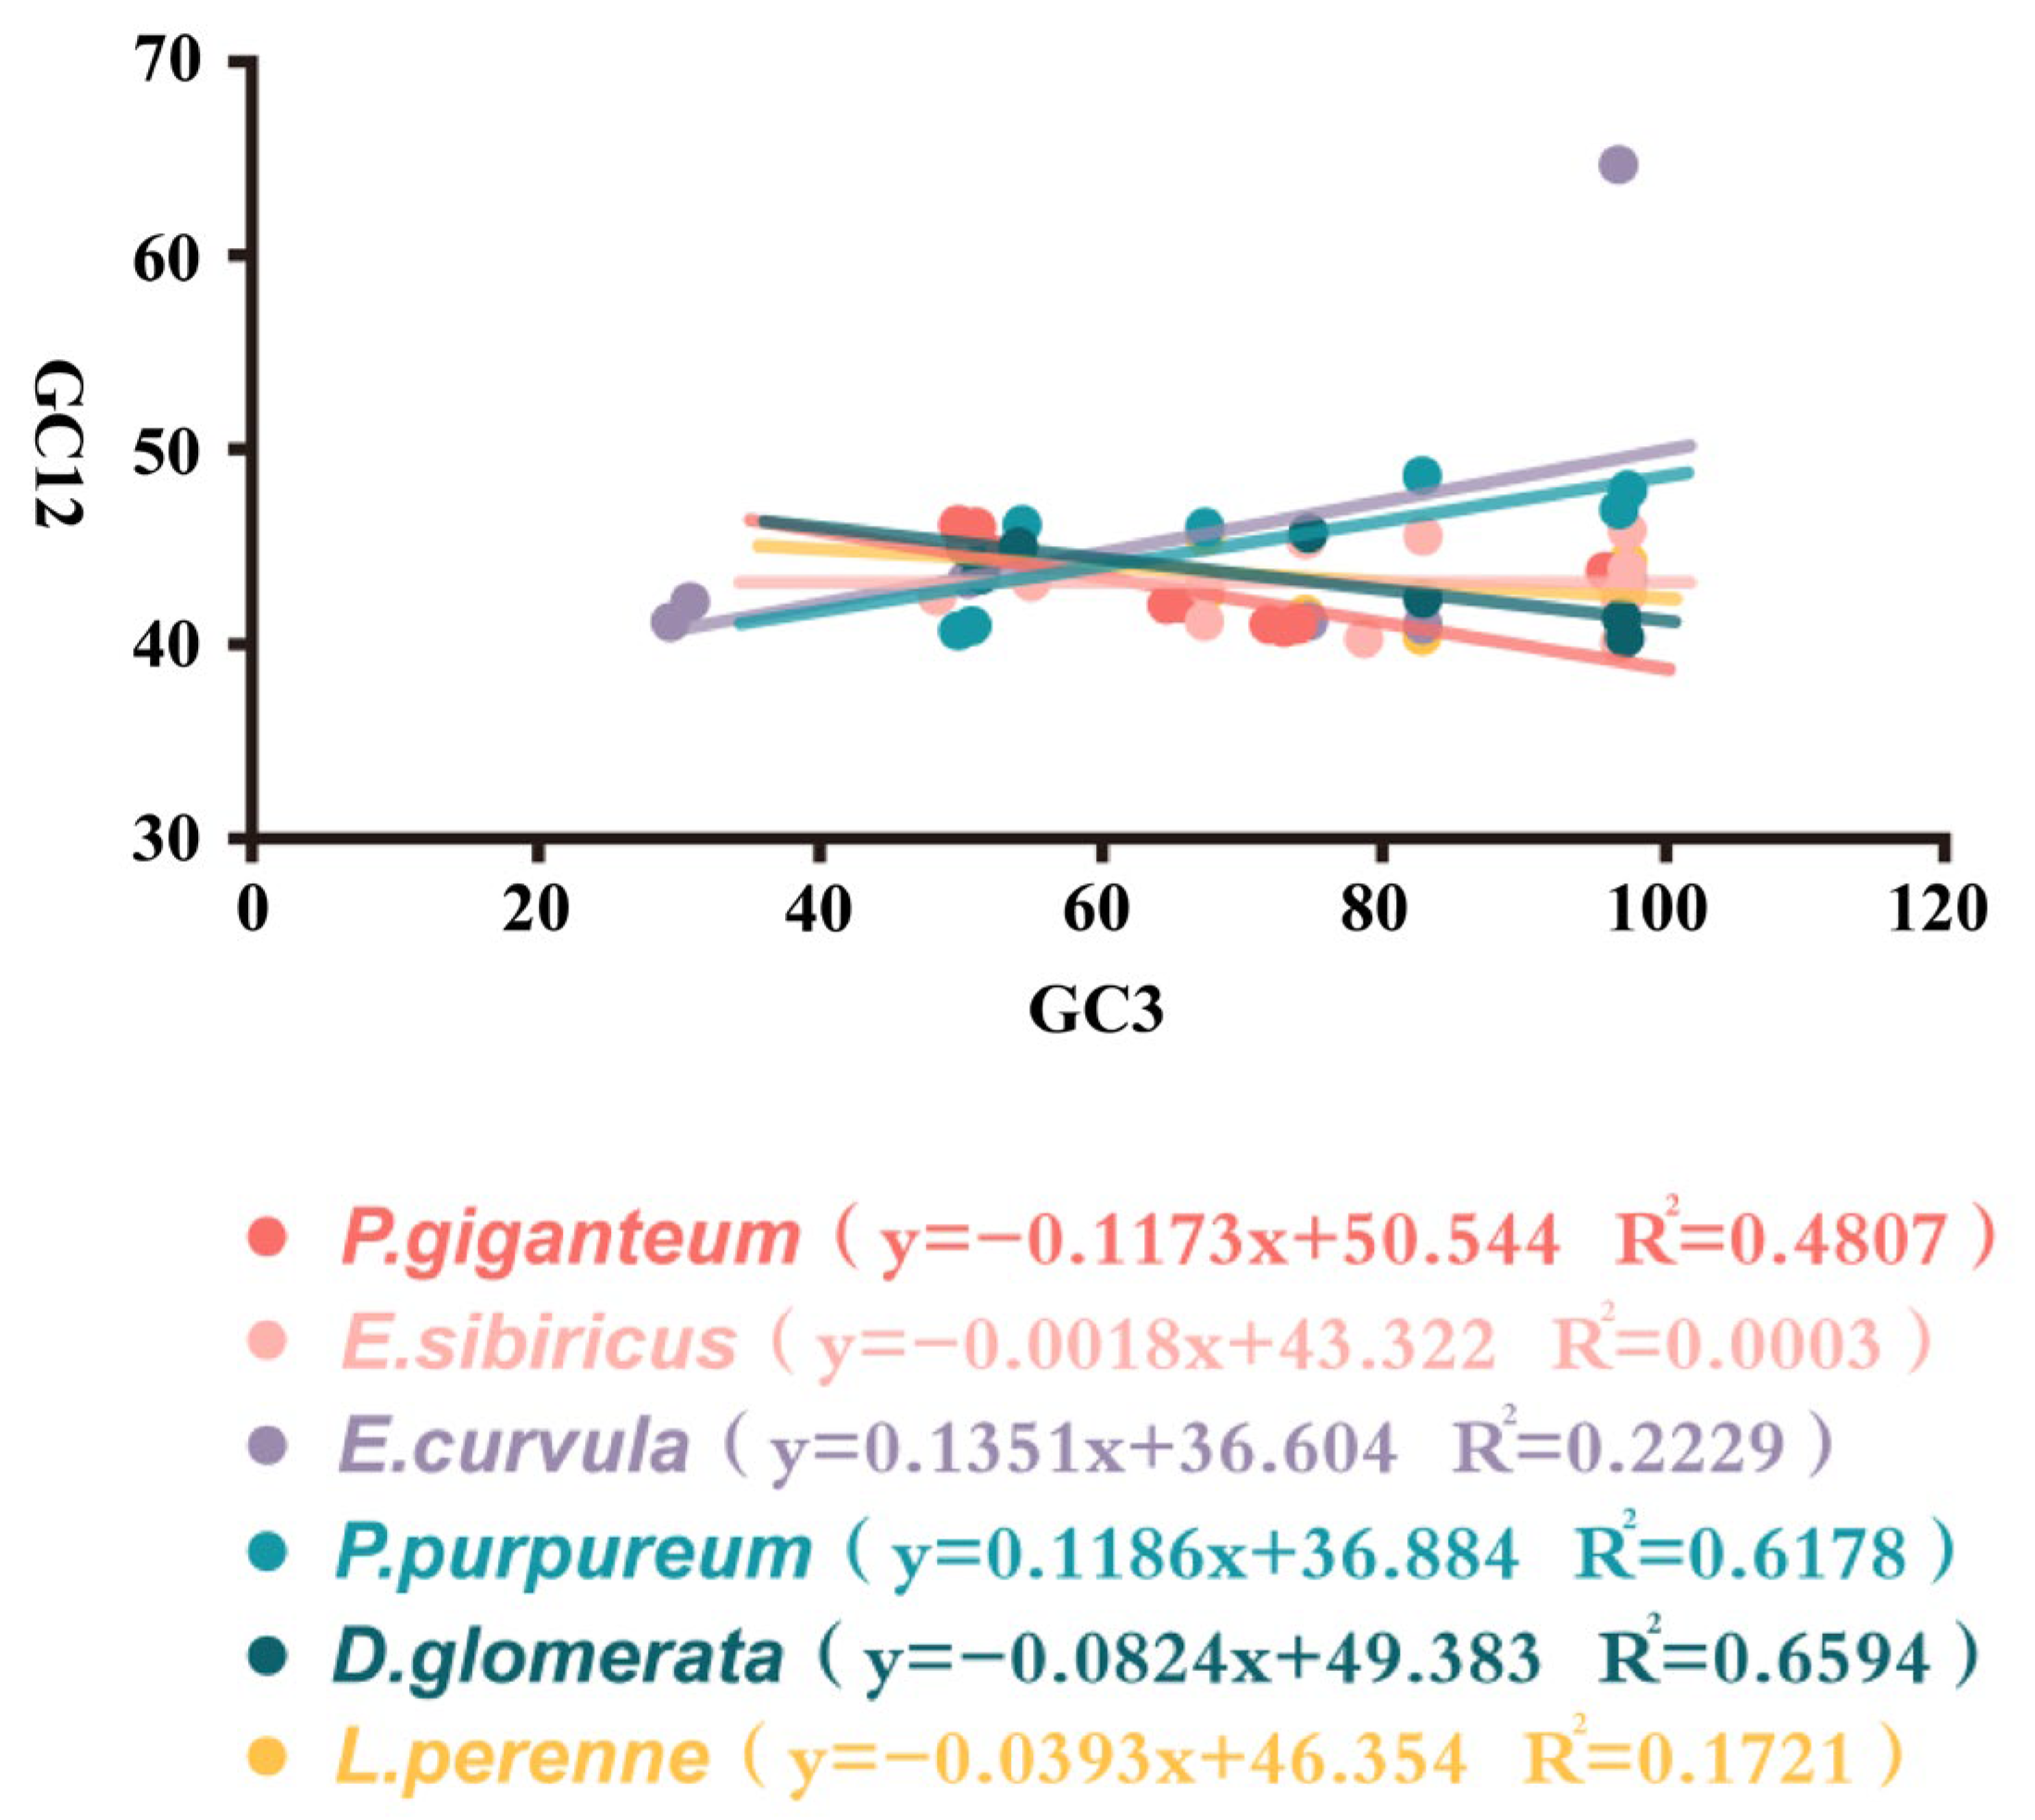
Neutral zone analysis was used to investigate the primary drivers of codon preference in the HSP90 gene. For each gene, the average GC content at codon positions one and two (GC12) is plotted against GC3 [36], and the relative contributions of natural and mutation-driven forces can be inferred from the magnitude of linear regression between GC12 and GC3. A slope approaching zero indicates that selection-driven codon optimization predominates, while a slope approaching one indicates that neutral codon mutation drift is largely driven by mutation [37]. To quantify the respective contributions of mutation and selection, we used the regression slope () to estimate the relative role of mutational pressure; the contribution of natural selection and other factors was calculated as [38]. During the analysis, we calculated p-values, tested the significance of the slope and the normality of the data, and removed outliers.
2.6. Analysis Codon Usage Patterns Using Correspondence Analysis (COA)
To visualize major trends in codon usage among HSP90 genes, correspondence analysis (COA) was performed based on relative synonymous codon usage (RSCU) values [39]. COA—a multivariate statistical technique suitable for frequency data such as codon counts—has been widely used in studies of CUB [40]. To identify the primary axes of variation, a matrix comprising RSCU values of 59 sense codons (excluding AUG, UGG, and stop codons) was constructed and projected into a multidimensional space. The first two axes (that account for the greatest proportion of total variance) were plotted to illustrate the distribution of genes and species according to codon usage profile. This approach identifies the major axes of variation and quantifies their contribution to codon usage divergence.
2.7. Evolutionary Force Analysis of L_aa and Nucleotide Parameters
To investigate evolutionary forces underlying CUB, linear regression analyses were performed between amino acid length (L_aa) and nucleotide composition parameters (GC3, GC12) [41,42]. This approach identifies the synergistic effects of codon composition constraints and translational expression in influencing patterns of codon bias in HSP90 genes across the six grass species.—P. giganteum, E. sibiricus L., E. curvula (Schrad.) Nees., P. purpureum Schumach., D. glomerata L. and L. perenne L.
2.8. Correlations Among Codon Bias Metrics
The degree of codon bias is assessed through key metrics, including CAI, CBI, and Enc [43]. A correlation heatmap visualized relationships among these indices. In the numeric matrix, values approaching |0| indicate weaker correlations, while those closer to |1| are stronger. Positive and negative values represent positive and negative correlations, respectively [44].
2.9. Identification of Optimal Codons
To identify optimal codons, high-expression HSP90 genes were screened using ENc and CAI rankings [45,46,47]. Based on expression levels, the upper and lower 5% of genes represent high- and low-expression level gene sets, respectively. We used the CodonW v1.4.2 program to calculate relative synthetic codon usage difference (ΔRSCU) values. We designate codons with an RSCU value > 1.5 or a relative usage frequency > 60% to be optimal codons [48].
2.10. HSP90 Gene Codon Usage Preferences
To evaluate interspecific divergence in codon usage, a comparative analysis of codon usage frequency was performed between HSP90 genes from the six grass species and those of four model plants (A. thaliana, Brachypodium distachyon P. Beauv., Oryza sativa L., and Zea mays L.) (Table S1). Plant sequence data were obtained from Phytozome (http://www.phytozome.net) and the Rice Genome Annotation Project database (http://rice.plantbiology.msu.edu), both accessed on 8 March 2025 [49,50]. Homologous genes were identified by local BLAST searches using A. thaliana HSP90 sequences as queries, followed by manual validation to ensure domain completeness. A codon usage frequency ratio from 0.5 to 2.0 was considered to indicate no significant difference; ratios outside this range denoted significant bias.
2.11. Construction of Neighbor-Joining Phylogenetic Tree
Full-length CDS values for the HSP90 genes of the six grasses were used to infer phylogenetic relationships. A neighbor-joining phylogenetic tree was formulated using MEGA X software, underpinned by the p-distance substitution model [51], to account for synonymous and nonsynonymous substitutions without assuming rate heterogeneity [52]. Branch reliability was evaluated using 1000 bootstrap replicates; branch lengths denote the extent of evolutionary divergence.
3. Results
3.1. Identifying HSP90 Genes
The 62 non-redundant HSP90 genes identified across the six species were apportioned: P. giganteum (16), E. sibiricus (13), E. curvula (10), P. purpureum (8), D. glomerata (7), and L. perenne (8) (Table S2). CDS exhibited length polymorphism, ranging from 2094 bp (Pgi01A00048250) to 2505 bp (PenpuB70040706), with a maximum intragenic length variation of 411 bp (Table S3).
Grand average of hydropathy (GRAVY) analysis revealed 83.87% of HSP90 proteins to have values ranging from −0.7 to −0.5, suggesting an optimized balance between solubility and stability. Extreme hydrophobicity variations were observed in EJB0506952 (−0.888) and PenpuB10013629 (−0.464), indicating potential functional diversification in protein conformational dynamics or environmental adaptation. Codon usage preference was evaluated using the Aromo index, which categorizes the HSP90 genes into high-, moderate-, or low-preference groups. The high-preference group (17.74%, Aromo ≥ 0.085) was primarily enriched in structural/constitutively expressed proteins requiring rapid translation, such as ribosomal subunits and stress chaperones. The moderate-preference group (75.81%, 0.075 ≤ Aromo < 0.085) exhibited an intermediate level of bias, potentially facilitating dynamic regulatory processes—including stress signaling and metabolic modulation—through tunable expression. The low-preference group (6.45%, Aromo < 0.075) was characterized by codon diversity, which may be associated with lineage-specific ecological adaptation or evolutionary novelty.
3.2. HSP90 Gene Codon Usage Indices
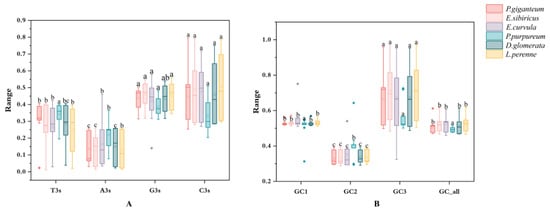
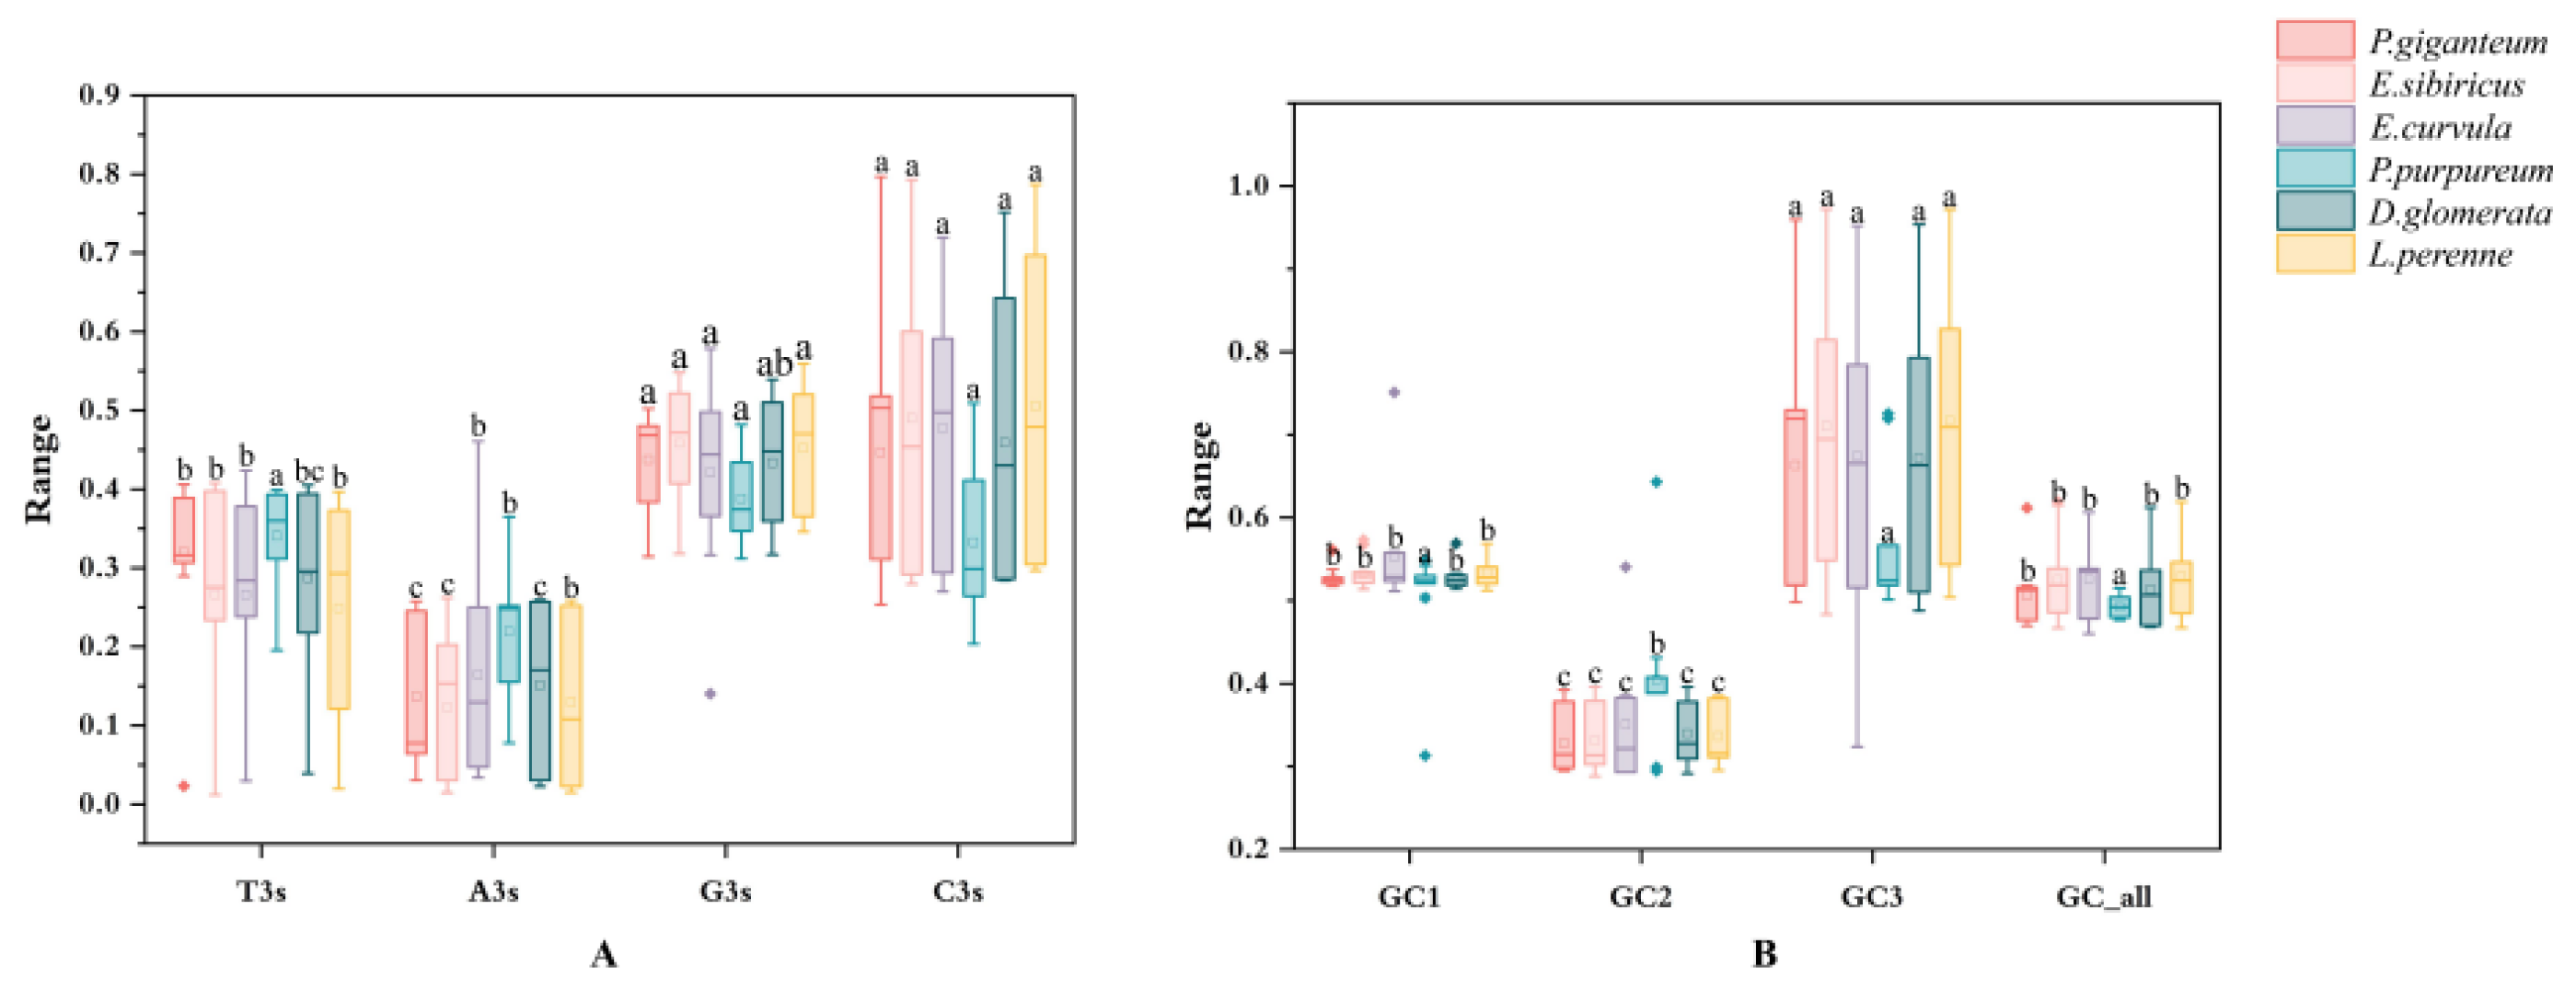
The nucleotide composition at the third codon position was investigated to reveal codon selection preferences in HSP90 genes (Figure 1). Wobble site frequencies were T3 (28.99%), A3 (14.98%), G3 (43.44%), and C3 (45.52%). This pronounced G/C-ending codon bias is consistent with genomic optimization strategies that favor translationally efficient codons, particularly for stress-inducible transcripts that require rapid synthesis.
Figure 1.
Codon composition metrics of HSP90 genes in six grass species. (A) Different lowercase letters signifies substantial disparities (p < 0.05) in the nucleotide frequencies of the third codon (T3s, A3s, G3s, C3s) within a singular species. (B) The utilization of different lowercase letters signifies substantial disparities (p < 0.05) in the positional and total GC content (GC, GC2, GC3, GCall) within a singular species.
Multivariate assessment of positional GC content across the six grasses yielded mean values of 53.04% (GC1), 34.80% (GC2), and 67.05% (GC3) [53]. Because the GC3 content exceeded the distribution ranges of GC1 (31.32–75.1%) and GC2 (28.82–64.31%), a conserved evolutionary strategy might exist, as evidenced by the preferential G/C enrichment observed at the third codon position.
3.3. Effective Number of Codons (ENC)-GC3s Plot Analysis
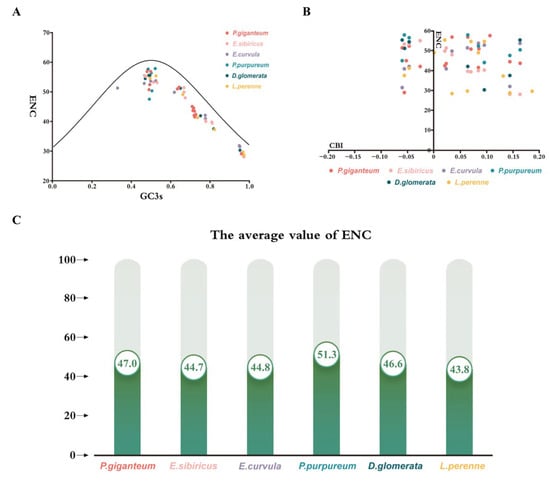
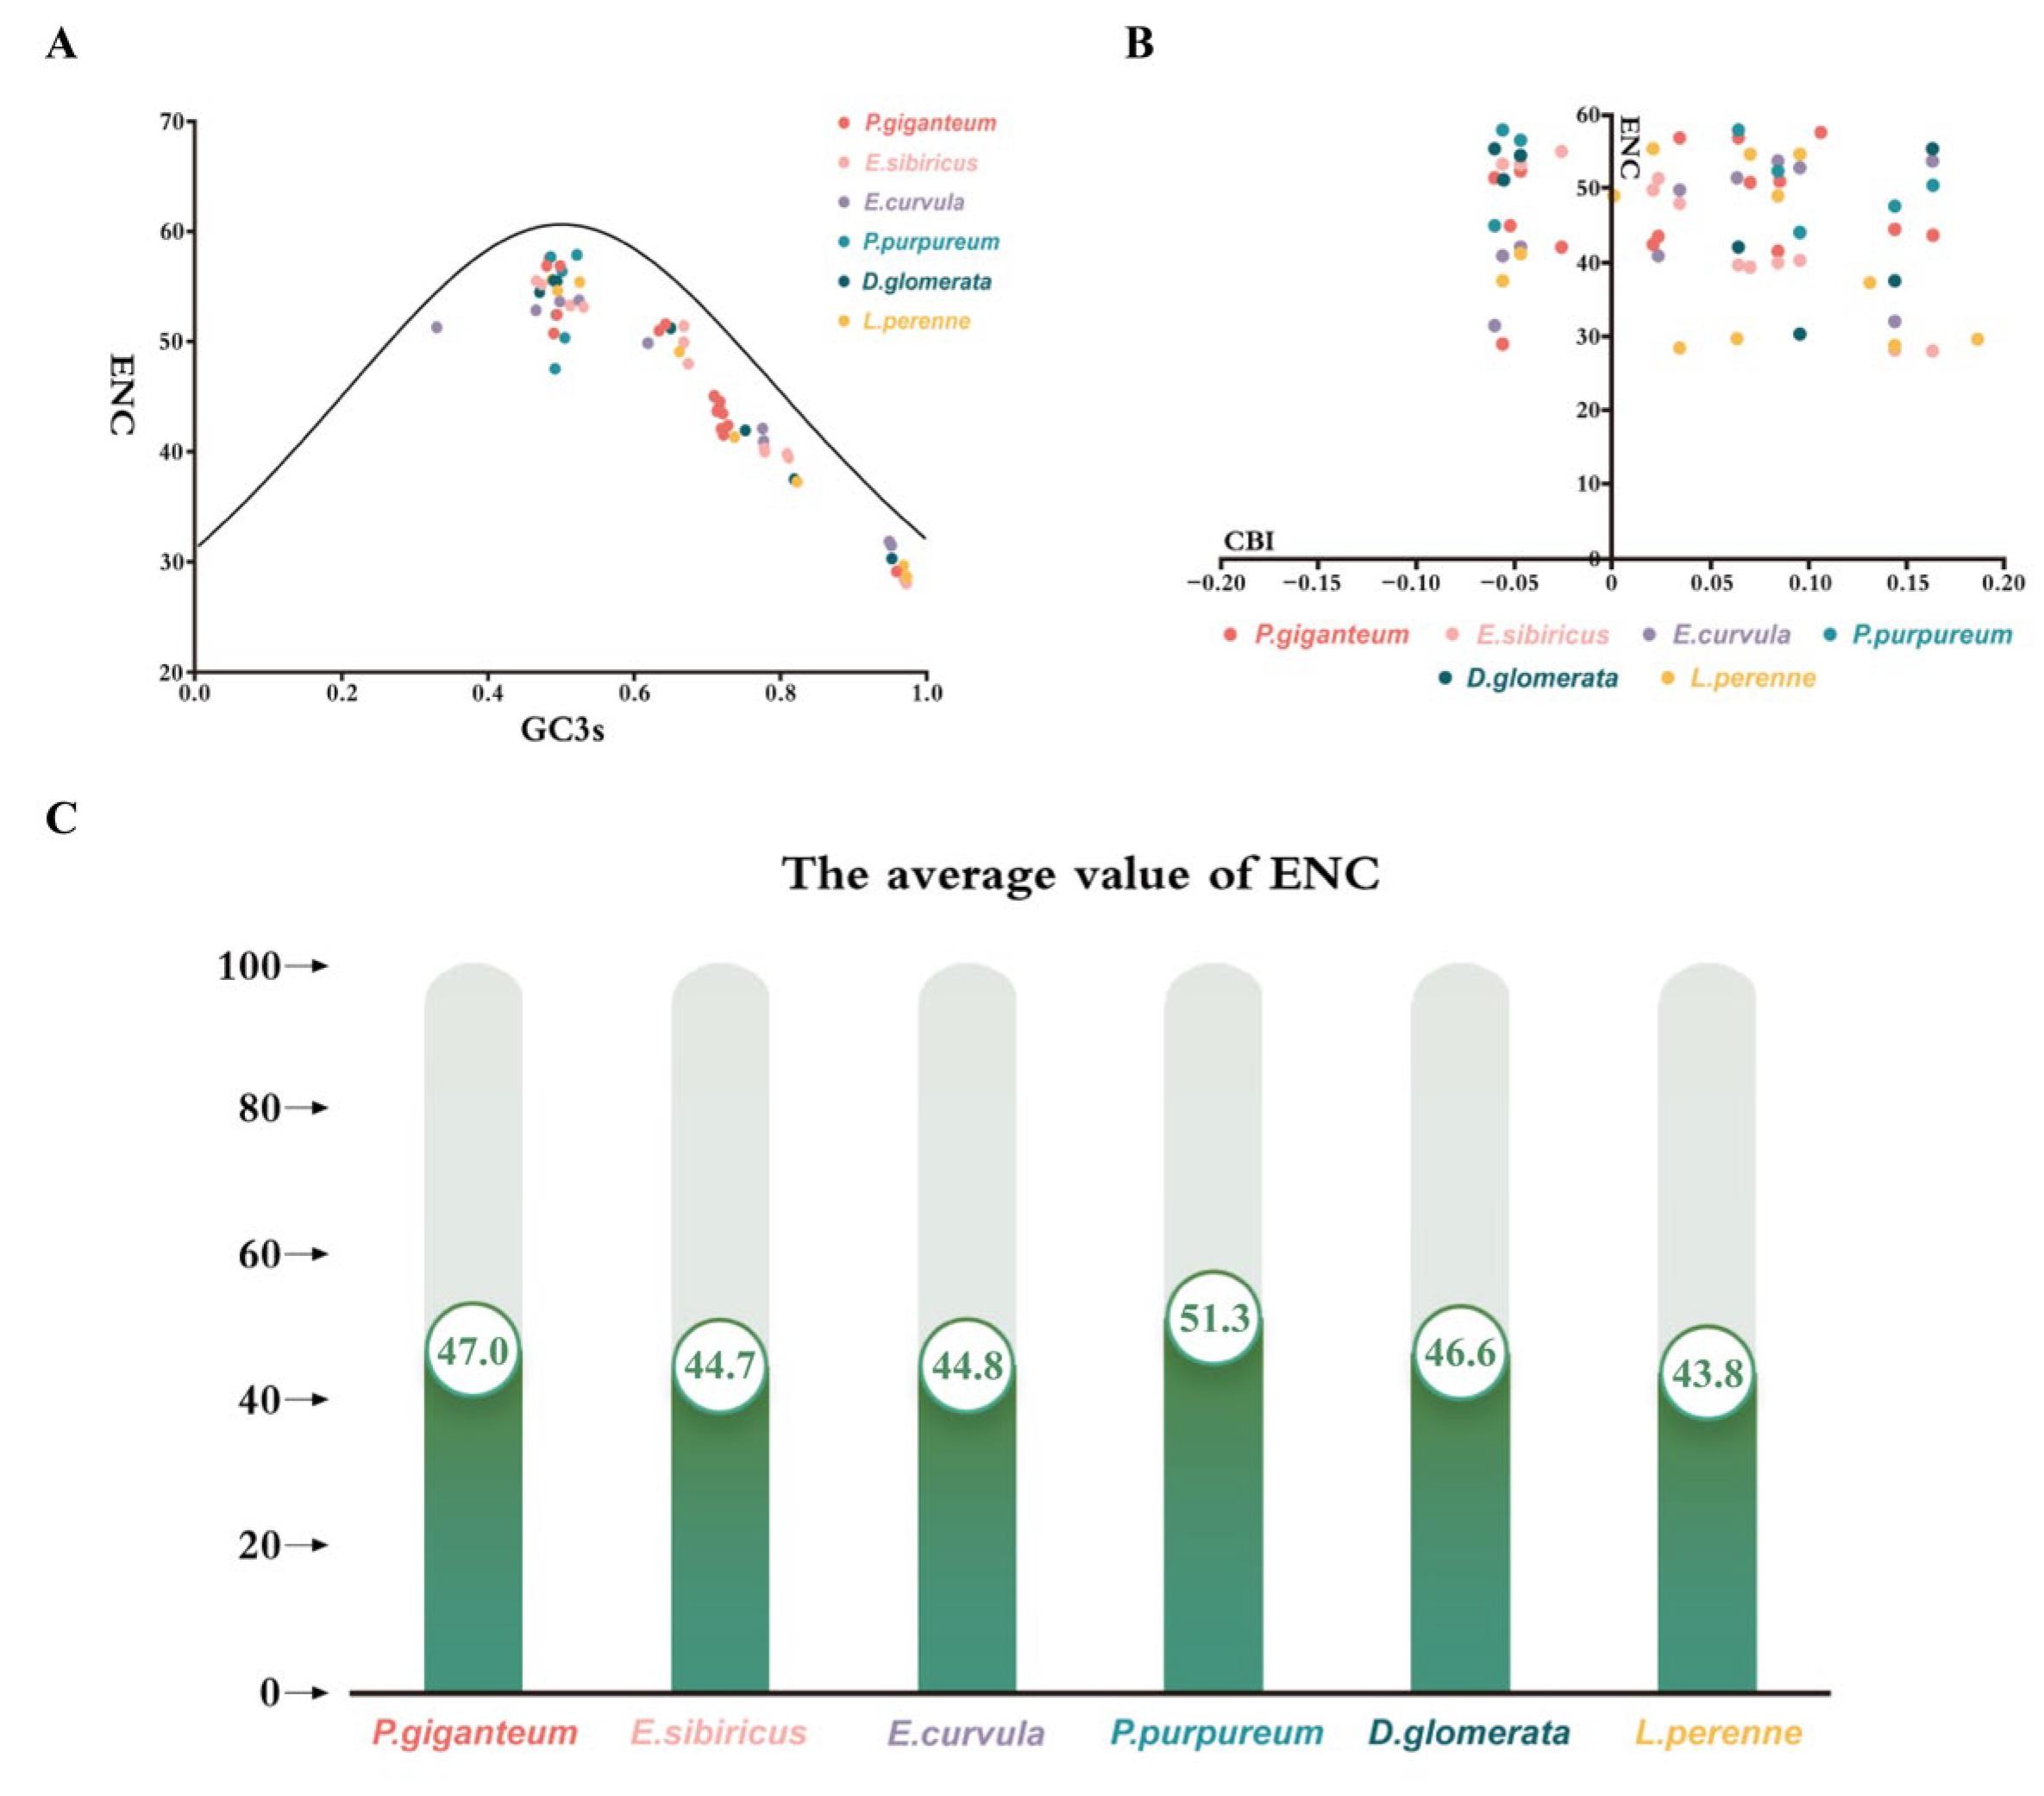
Codon usage patterns of HSP90 genes in these six species were systematically investigated through a multidimensional analysis integrating ENC, GC3, and CBI. A nonlinear regression model was used to align observed data with the established correlation between ENC and GC3 (Figure 2A), assuming neutral evolution. Observed ENC values for all species fell significantly below the predicted neutral curve, indicating strong CUB in HSP90 genes, with bias intensity increasing with decreased ENC. The relationship between CBI and ENC (Figure 2B) revealed CBI values to mostly concentrate within the 0–0.20 range (minimum: −0.05), and for an inverse linear relationship to exist between CBI and ENC (Pearson’s r = −0.72, p < 0.001). This indicates that HSP90 genes exhibit a moderate CUB (mean ENC 43–52) (Figure 2C), which maintains a balance between translational efficiency and genetic plasticity. This observation contrasts with the pronounced bias in genes such as ribosomal proteins (ENC < 35). Based on these findings, the CUB of HSP90 genes is largely constrained by forces of natural selection rather than mutational pressure [54].
Figure 2.
The effective number of codons (ENC) for HSP90 genes among six grass species. (A) ENC–GC3s relationship: points adjacent to the theoretical curve (solid line) indicate the CUB is predominantly shaped by mutational pressure; deviations below the curve suggest natural selection is the primary evolutionary driver. (B) CBI–ENC correlation. (C) Interspecific variation in mean ENC values.
3.4. PR2 Plot Analysis
PR2 map analysis indicates that biased usage of A, T, G, and C nucleotides across four of the six grass species is largely constrained by natural selection. Data points across the four regions of the PR2 plot are asymmetrically distributed, indicating distinct nucleotide usage preference (Figure 3B). The majority of species are characterized by a ratio of G3/(G3 + C3) < 0.5 and A3/(A3 + T3) < 0.5 within the specified range [55], reflecting a more frequent use of C (over G) and T (over A) at the third codon position. The significant disparity between measured and anticipated mean values lends credence to the hypothesis that, within the framework of regulating CUB, natural selection exerts an important influence, with the synergistic interplay between mutation and selection pressures playing an important role. Analysis grounded in the symmetry index (L_sym) of species-specific nucleotide composition parameters (Figure 3A,C) revealed substantial interspecific disparities. Both P. giganteum and E. sibiricus L. had higher median A3/(A3 + T3) values with concentrated data distribution (Figure 3A), indicating a higher symmetry index and greater stability of nucleotide preference. In contrast, E. curvula and L. perenne had a lower symmetry index and greater data dispersion, suggesting higher variability in their nucleotide usage. A similar pattern was observed for G3/(G3 + C3) (Figure 3C), where the symmetry indices for P. giganteum and E. sibiricus were significantly higher than those of E. curvula and L. perenne. These results reveal inter-specific divergence in genomic composition among these species and provide a basis for investigating how this variation influences their functional and adaptive traits.
Figure 3.
PR2-plot analysis and symmetry indices of nucleotide usage at the third codon position in six grass species. (A) A3/(A3 + T3) (B) PR2 plot analysis of the HSP90 gene across species. Species-specific symmetry index (L_sym) variation for and (C) G3/(G3 + C3).
3.5. Neutrality Plot Analysis
Significant variation in HSP90 gene neutral sites for the six grass species was apparent in correlations between codons GC12 and GC3 (Figure 4). Based on the neutral mutation–selection equilibrium model, the regression slope () reflects the relative contribution of mutational pressure, while the contribution of natural selection and other factors can be estimated as [39]. Accordingly, the contribution of mutational pressure to CUB in HSP90 genes ranged 0.18–13.51%, whereas natural selection and other selective forces accounted for the remaining 86.49–99.82% of observed variation. The p-values for the six Poaceae species were as follows: P. giganteum and E. sibiricus: p < 0.01; E. curvula and P. purpureum: p < 0.001; D. glomerata (0.1088); L. perenne (0.2667).
Figure 4.
Neutrality plot analysis of GC12 versus the third codon position (GC3) for the HSP90 genes in six grass species.
3.6. Correspondence Analysis
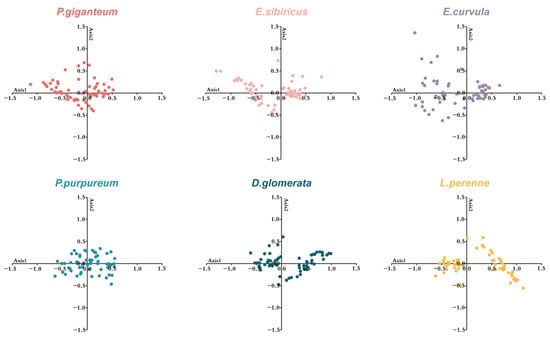
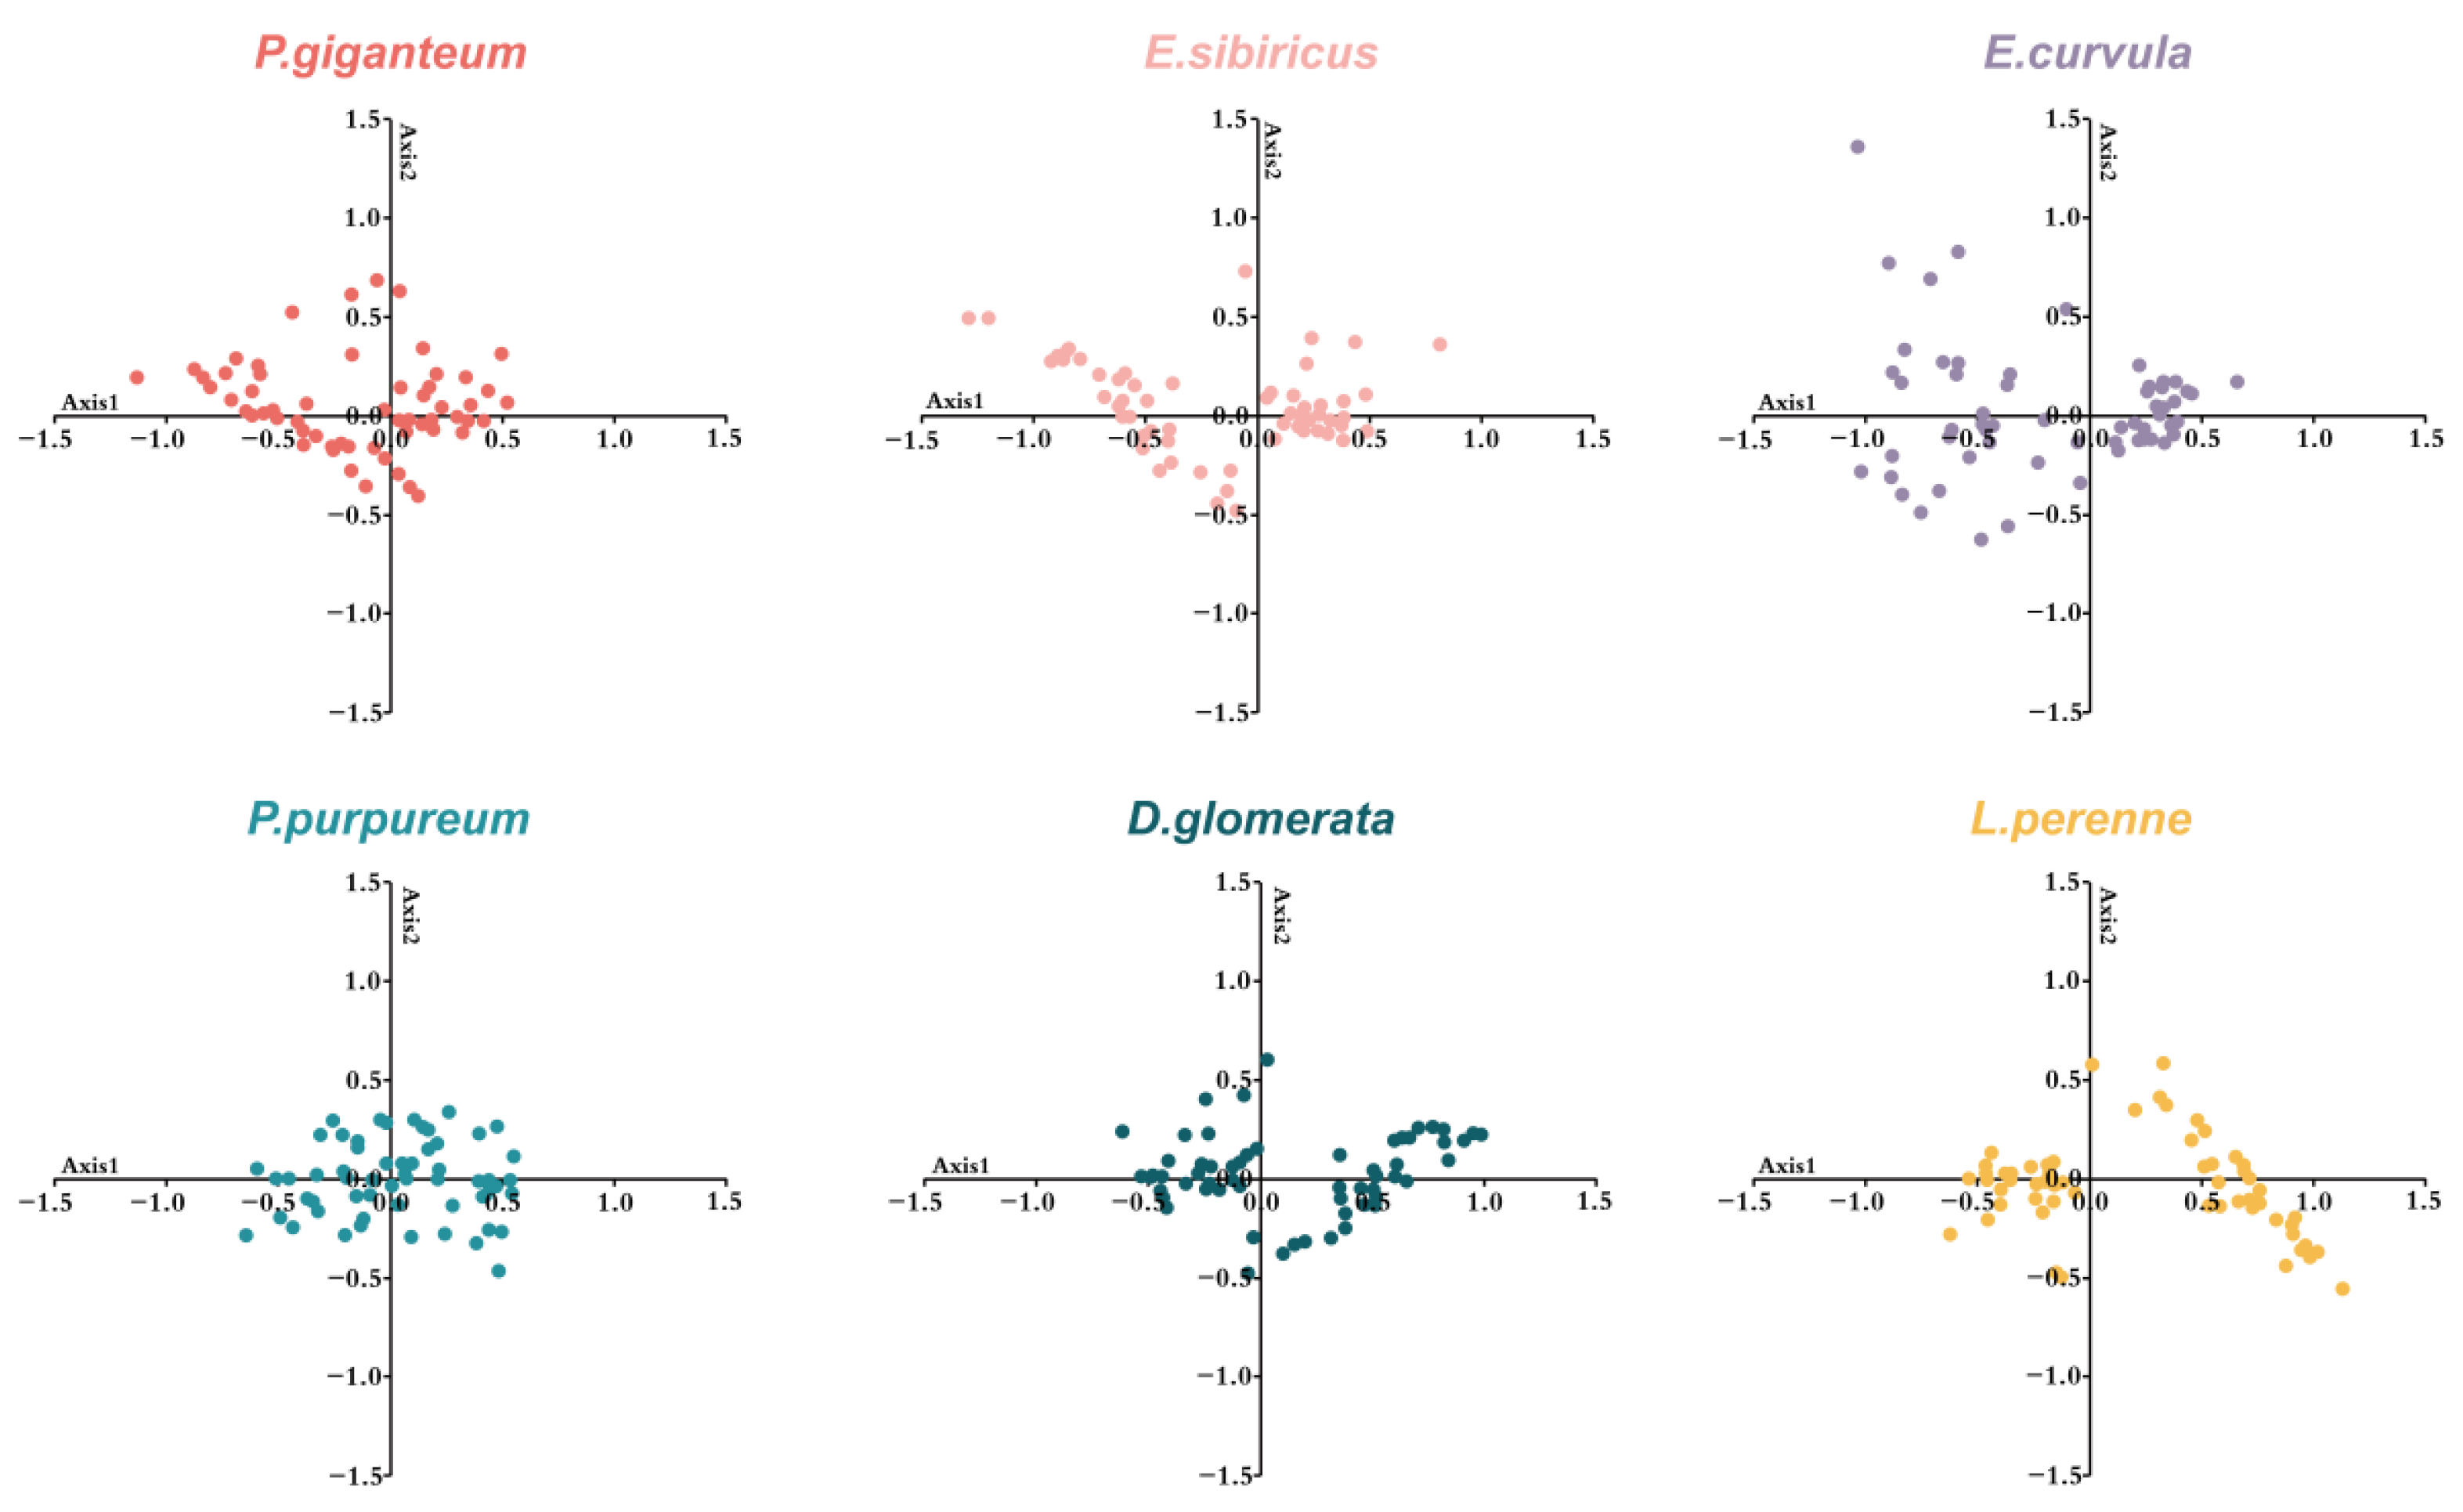
The Correspondence analysis (COA) of codon usage patterns in the HSP90 genes of these six grasses revealed significant differences in the contribution of the major variation axes. The first principal axis explained 59.97% (P. giganteum), 67.30% (E. sibiricus), 59.65% (E. curvula), 60.16% (P. purpureum), 69.86% (D. glomerata), and 73.95% (L. perenne), while the second explained 20.61%, 15.35%, 20.21%, 22.73%, 13.03%, and 13.54%, respectively (Figure 5). Axis one contributed an average of 65.15% to the total variance, indicating that it was the primary determinant of codon usage divergence. These results suggest that codon usage optimization in HSP90 genes is not governed by a single selective pressure, but that it is coregulated by multiple factors. The residual variation along the secondary axis lends further support to the combined effects of natural selection and mutational bias in shaping CUB in Poaceae HSP90 genes.
Figure 5.
Correspondence analysis based on relative synonymous codon usage (RSCU) of the HSP90 gene in six grass species.
3.7. Dissecting L_aa and Nucleotide Parameter Evolutionary Drivers
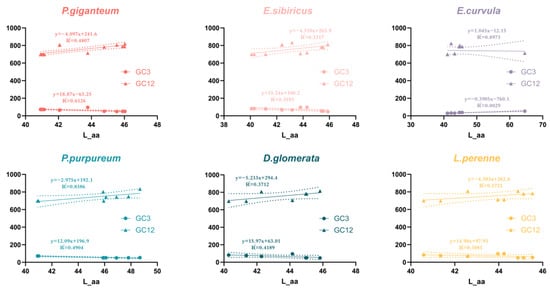
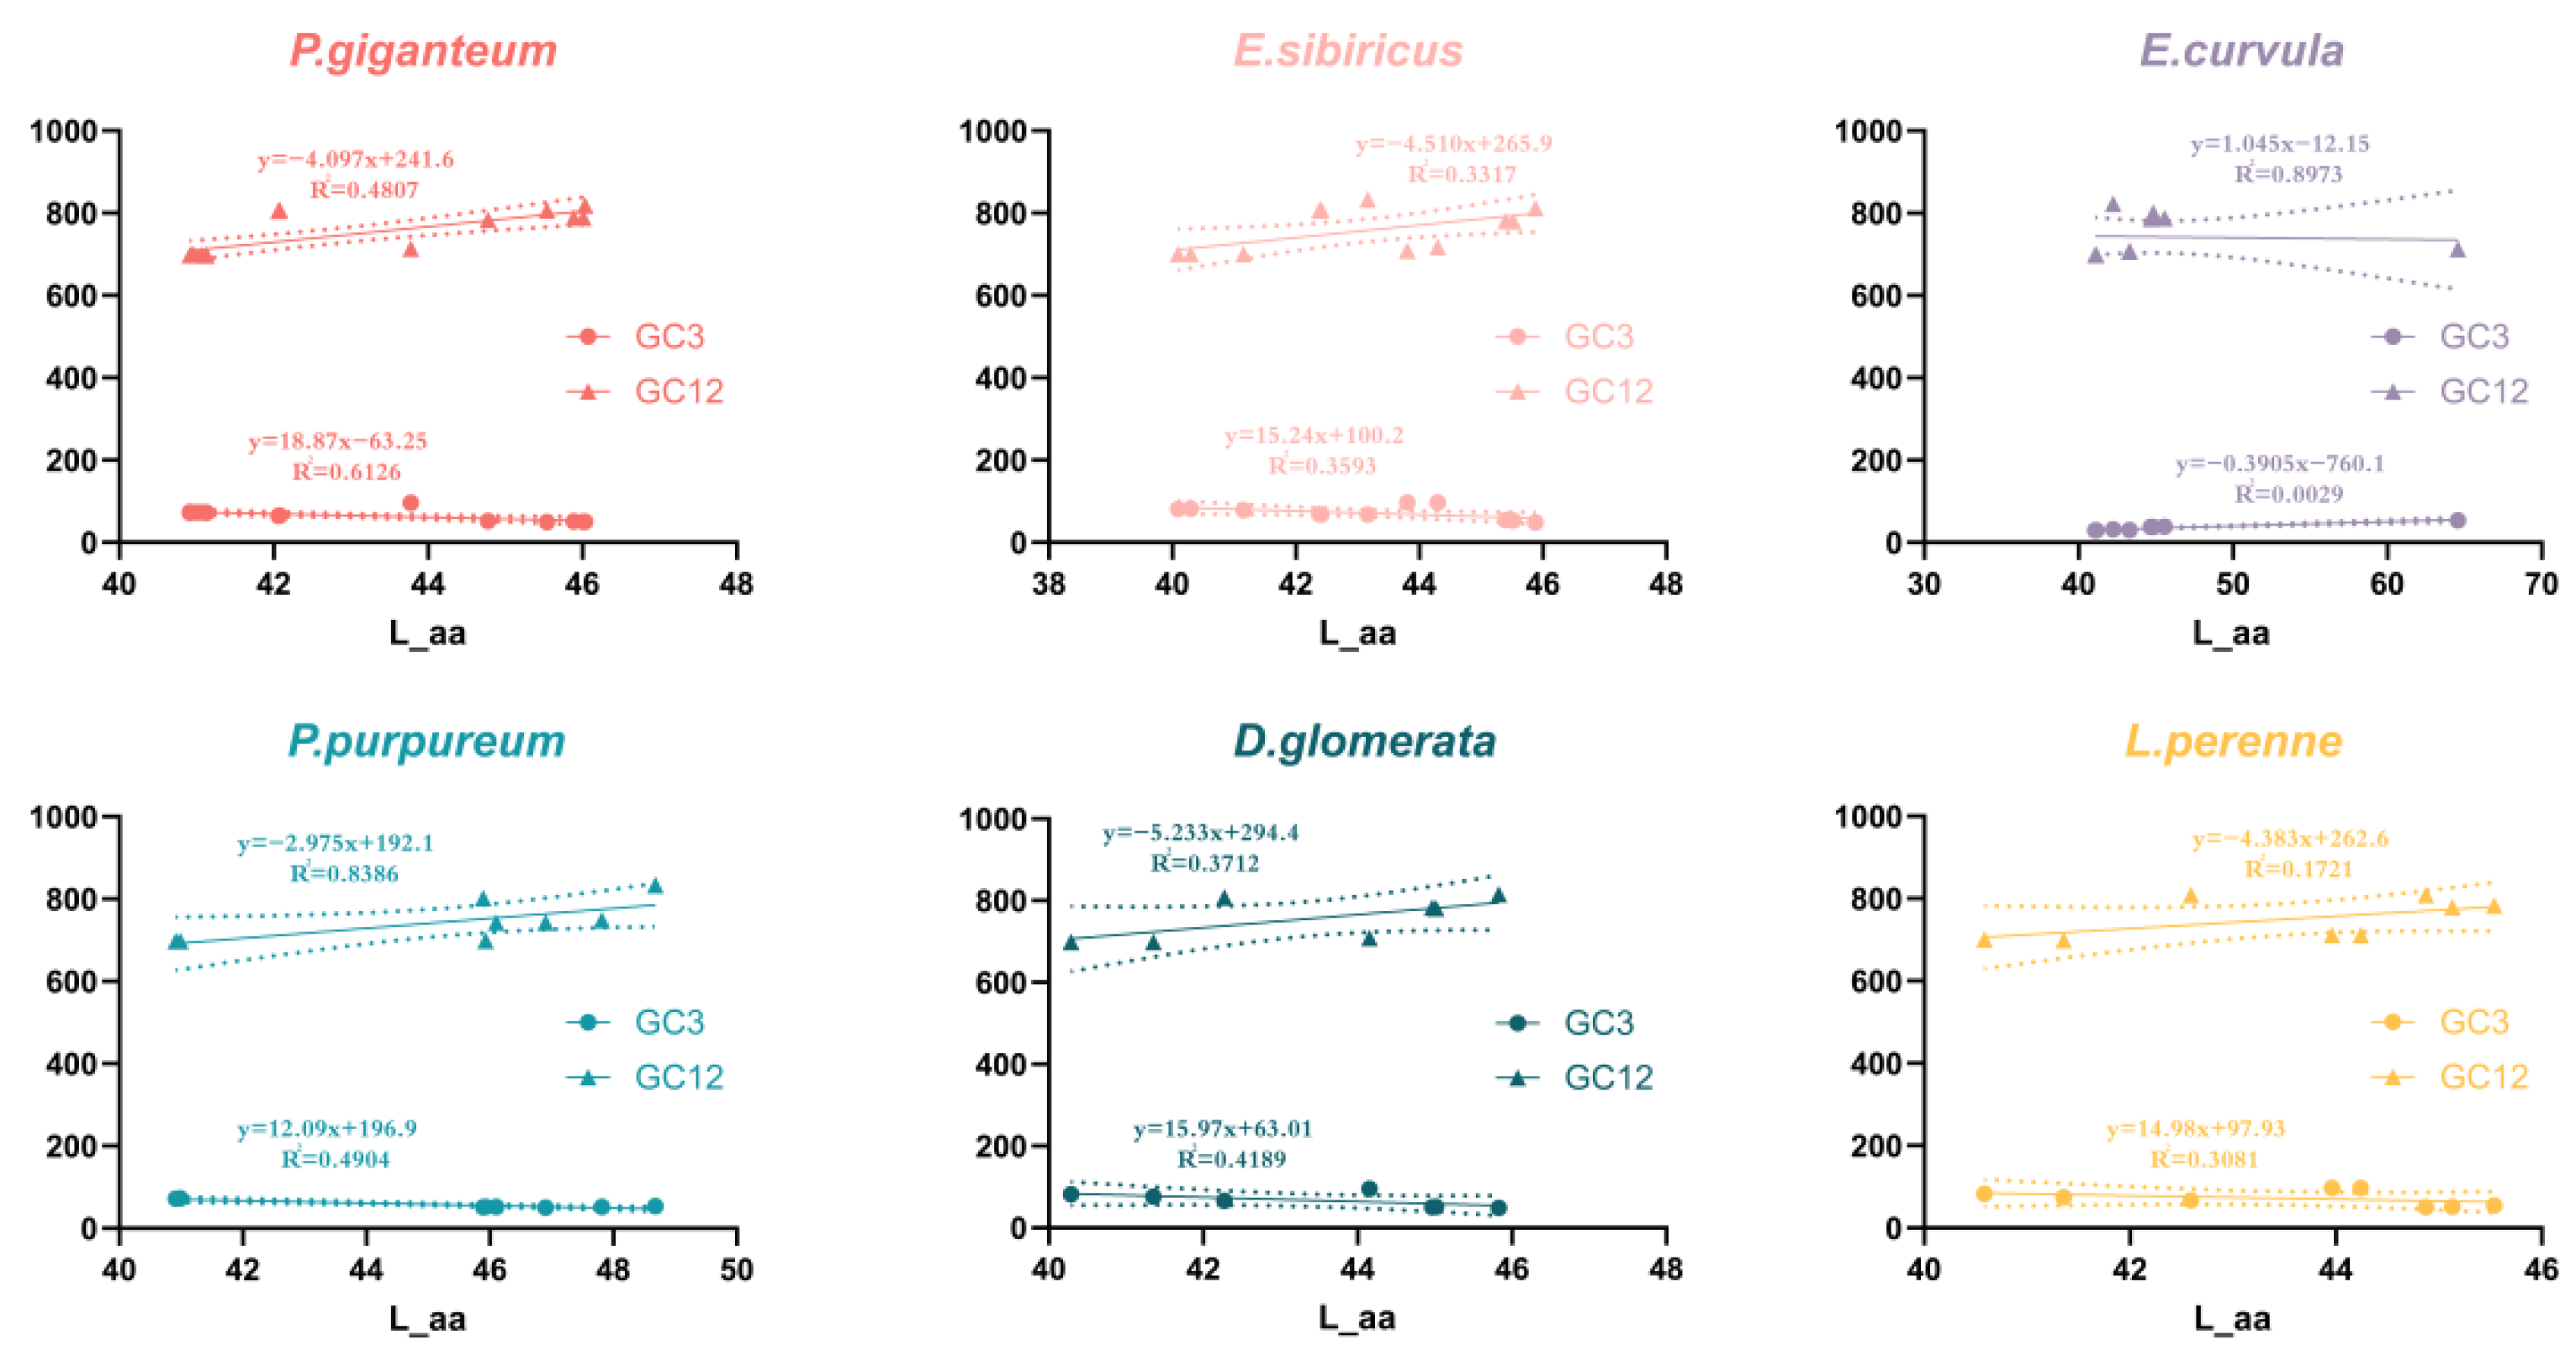
Analysis of relationships among GC12, GC3, and L_aa in HSP90 genes of the six grasses revealed significant interspecific differences (Figure 6). The association between GC12 and L_aa was weak in P. giganteum, E. sibiricus, D. glomerata, and L. perenne (R2 values ranging from 0.1721 to 0.4807) and strong in E. curvula and P. purpureum (R2 = 0.8973 and 0.8386, respectively). This indicates a marked relationship between GC12 and L_aa in these latter two species. Only P. giganteum exhibited a strong correlation between GC3 and L_aa (R2 = 0.6126); this relationship was weak for all other species (R2 = 0.3081–0.4904); for E. curvula, this correlation was nearly negligible (R2 = 0.0029), indicating the generally weak influence of GC3 on L_aa. These results reveal pronounced inter-specific variation in relationships among GC12, GC3, and L_aa, suggesting that CUB in HSP90 genes of these species is primarily governed by natural selection rather than mutational pressure.
Figure 6.
Correlations between amino acid length (L_aa) and nucleotide parameters in HSP90 genes of six grass species.
3.8. Correlation Coefficient Analysis of Codon Usage Indices
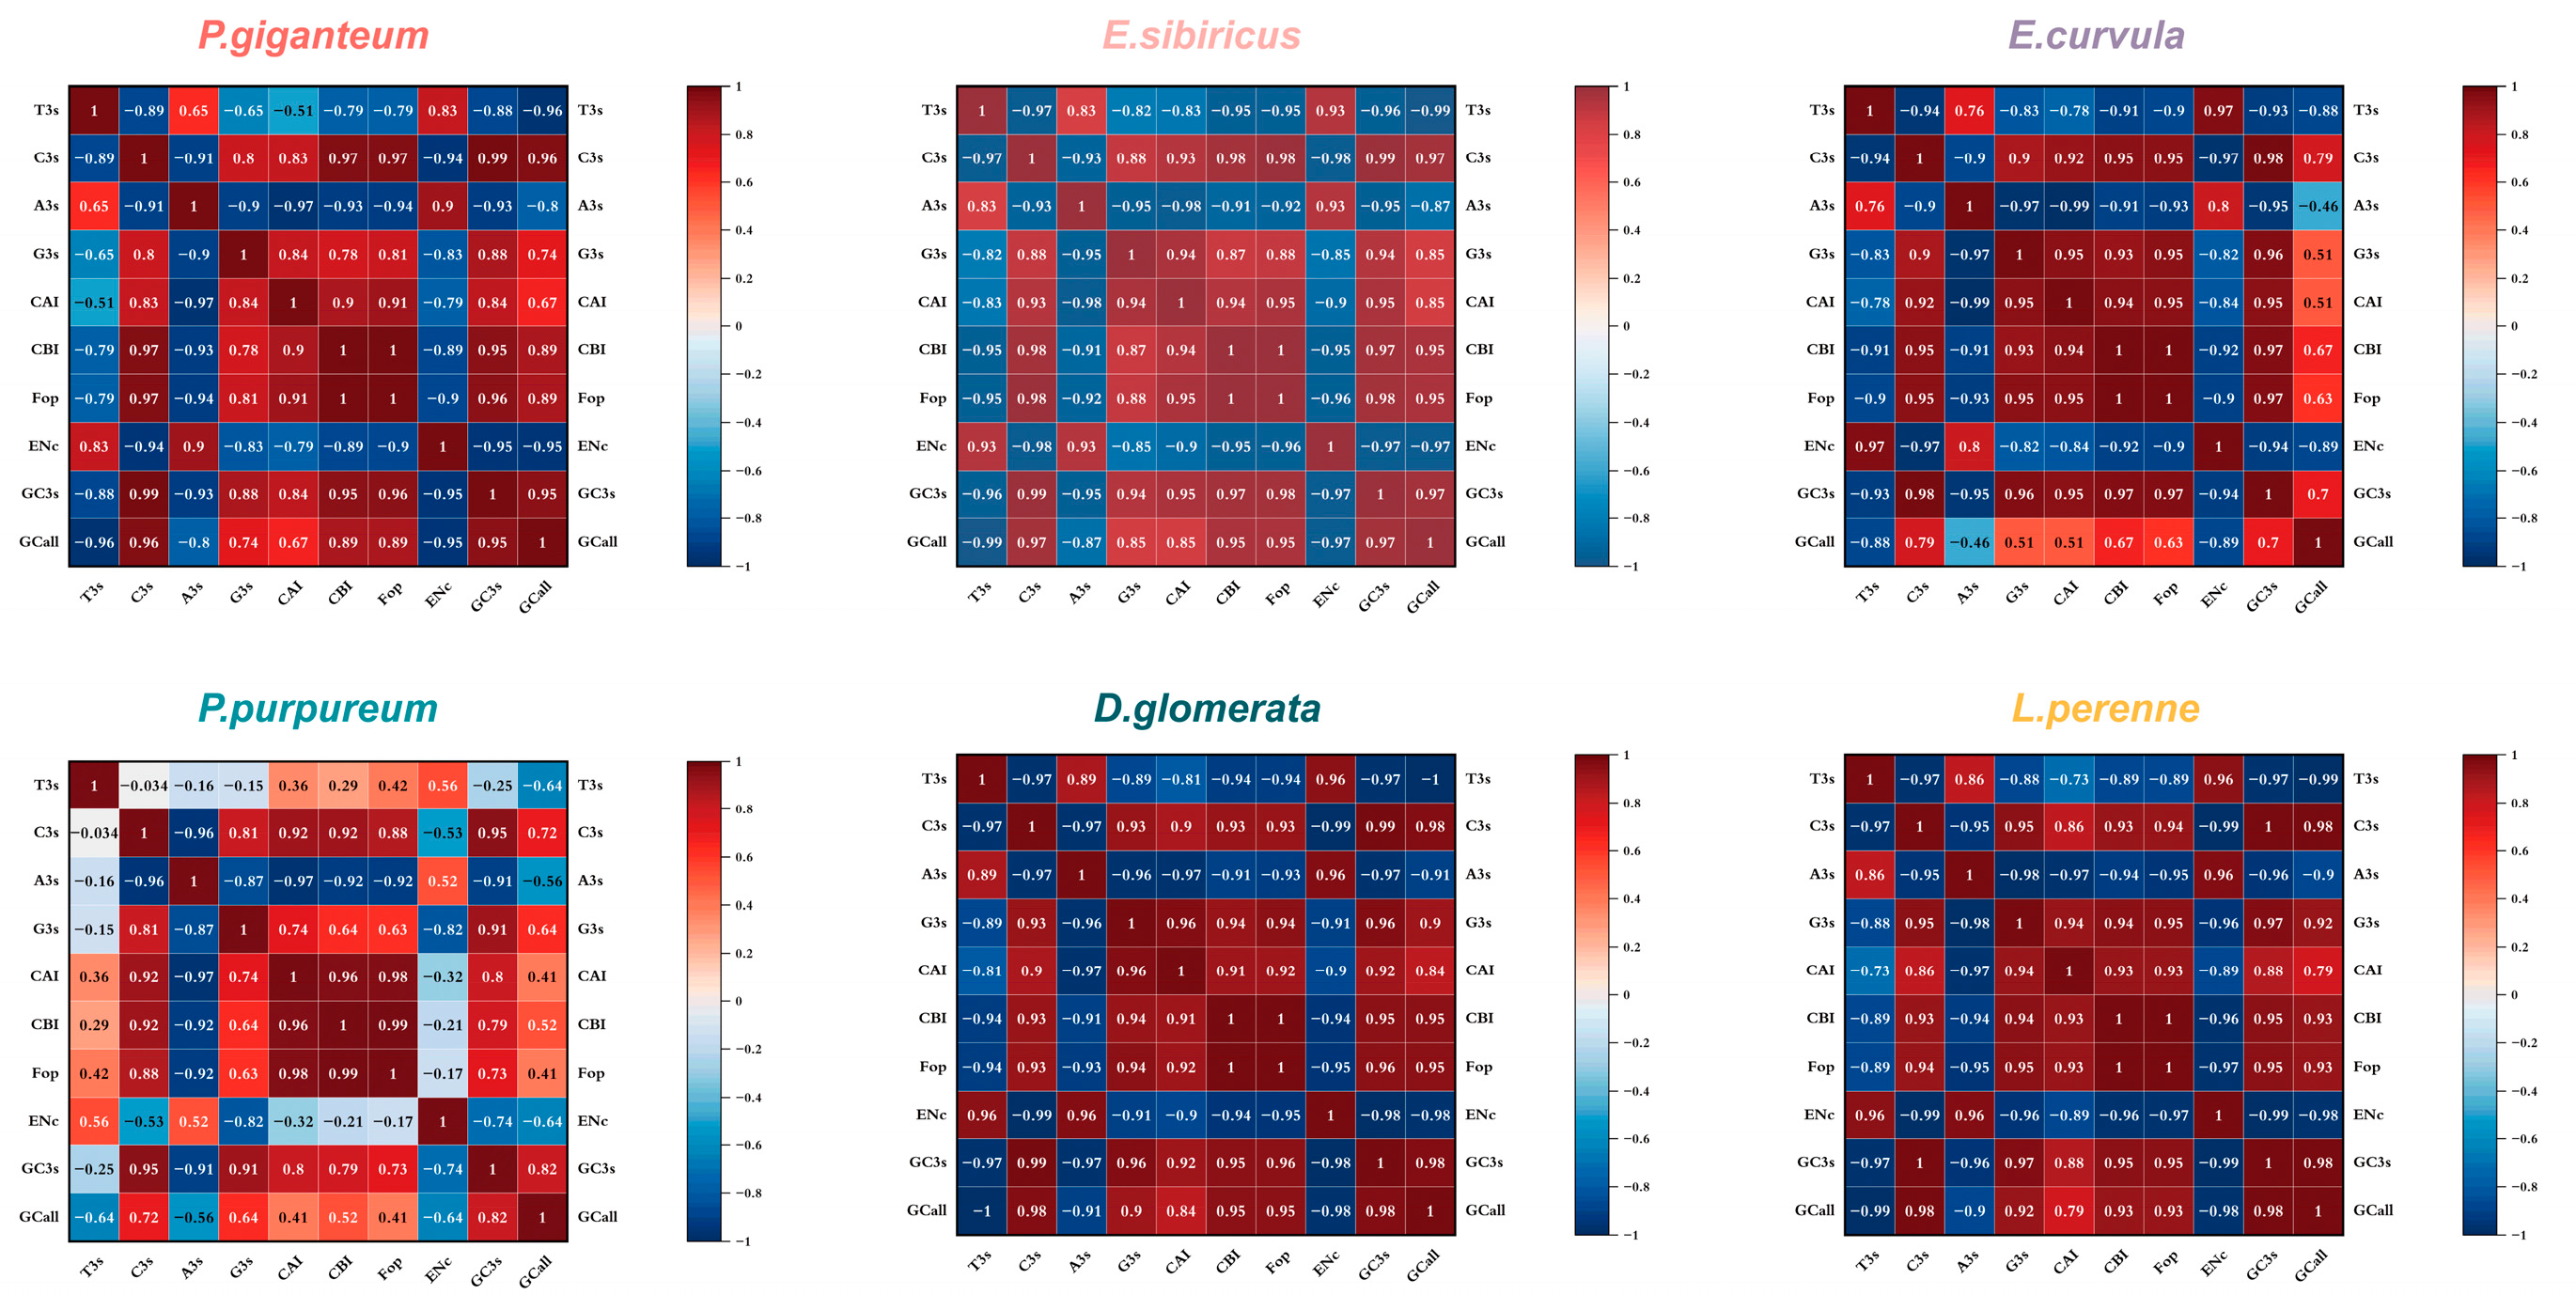
In our study, we constructed a correlation heatmap of codon usage bias indices for the HSP90 gene in six Poaceae forage species (Figure 7). Heatmap analysis revealed distinct association patterns among the evaluated indices. The Codon Adaptation Index (CAI), the Codon Bias Index (CBI), the GC content at the third codon position (GC3s), the genomic GC content (GCall), and the G3s index exhibited strong positive correlations with the Frequency of Optimal Codons (Fop). This suggests that a trend toward codon usage optimization exists that is driven by translation efficiency, where gene expression is inferred from values. ENc correlated negatively with these indices, indicating reduced synonym codon usage evenness under conditions of high translational efficiency. This phenomenon is consistent with the process of natural selection-driven optimization. The spatially conserved intensity distribution of correlations across species also suggests evolutionary conservation of regulatory mechanisms in Poaceae grasses. For instance, the strong positive correlation between GC3 and GCall reveals the constraint of nucleotide composition on codon choice, while the negative correlation between ENc and GC3 supports an antagonistic effect of mutational bias against natural selection.
Figure 7.
Correlation analysis on codon usage indices for the HSP90 gene in six grasses. Blue–red denotes the degree of Pearson correlation (negative–positive) among ENc, CAI, CBI, Fop, G3, GC3, and GCall indices. Strong positive correlations (e.g., among GC3, GCall, and Fop) and negative correlations (e.g., ENc with GC3) indicate the interplay of natural selection and mutation pressure in shaping codon usage.
3.9. Differential Distribution of Optional Codons Across Species
Analysis of all 64 codons revealed variation in the distribution of high-frequency codons within the HSP90 gene across the six grasses (Table 1). The AUG codon, which encodes methionine (Met), was most abundant, followed by the arginine (Arg) AGG and leucine (Leu) CUC codons. Thirteen codons occurred in both P. giganteum and E. sibiricus, while E. curvula, P. purpureum, D. glomerata, and L. perenne had 9, 5, 8, and 16 codons, respectively. The majority of selected high-frequency codons terminated with G or C at the third nucleotide position, indicating a significant GC bias at the synonymous codon terminus in HSP90 genes of these species.
Table 1.
Distribution statistics of high-frequency codons (top five) in six Poaceae forage grasses.
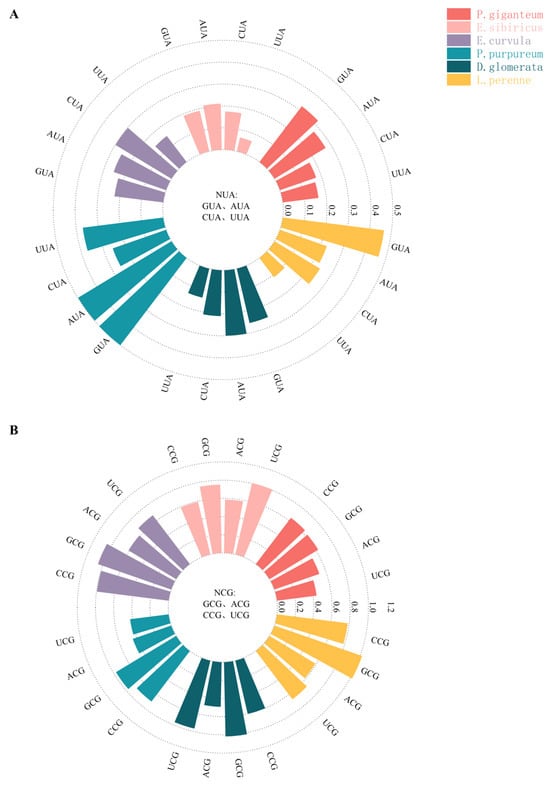
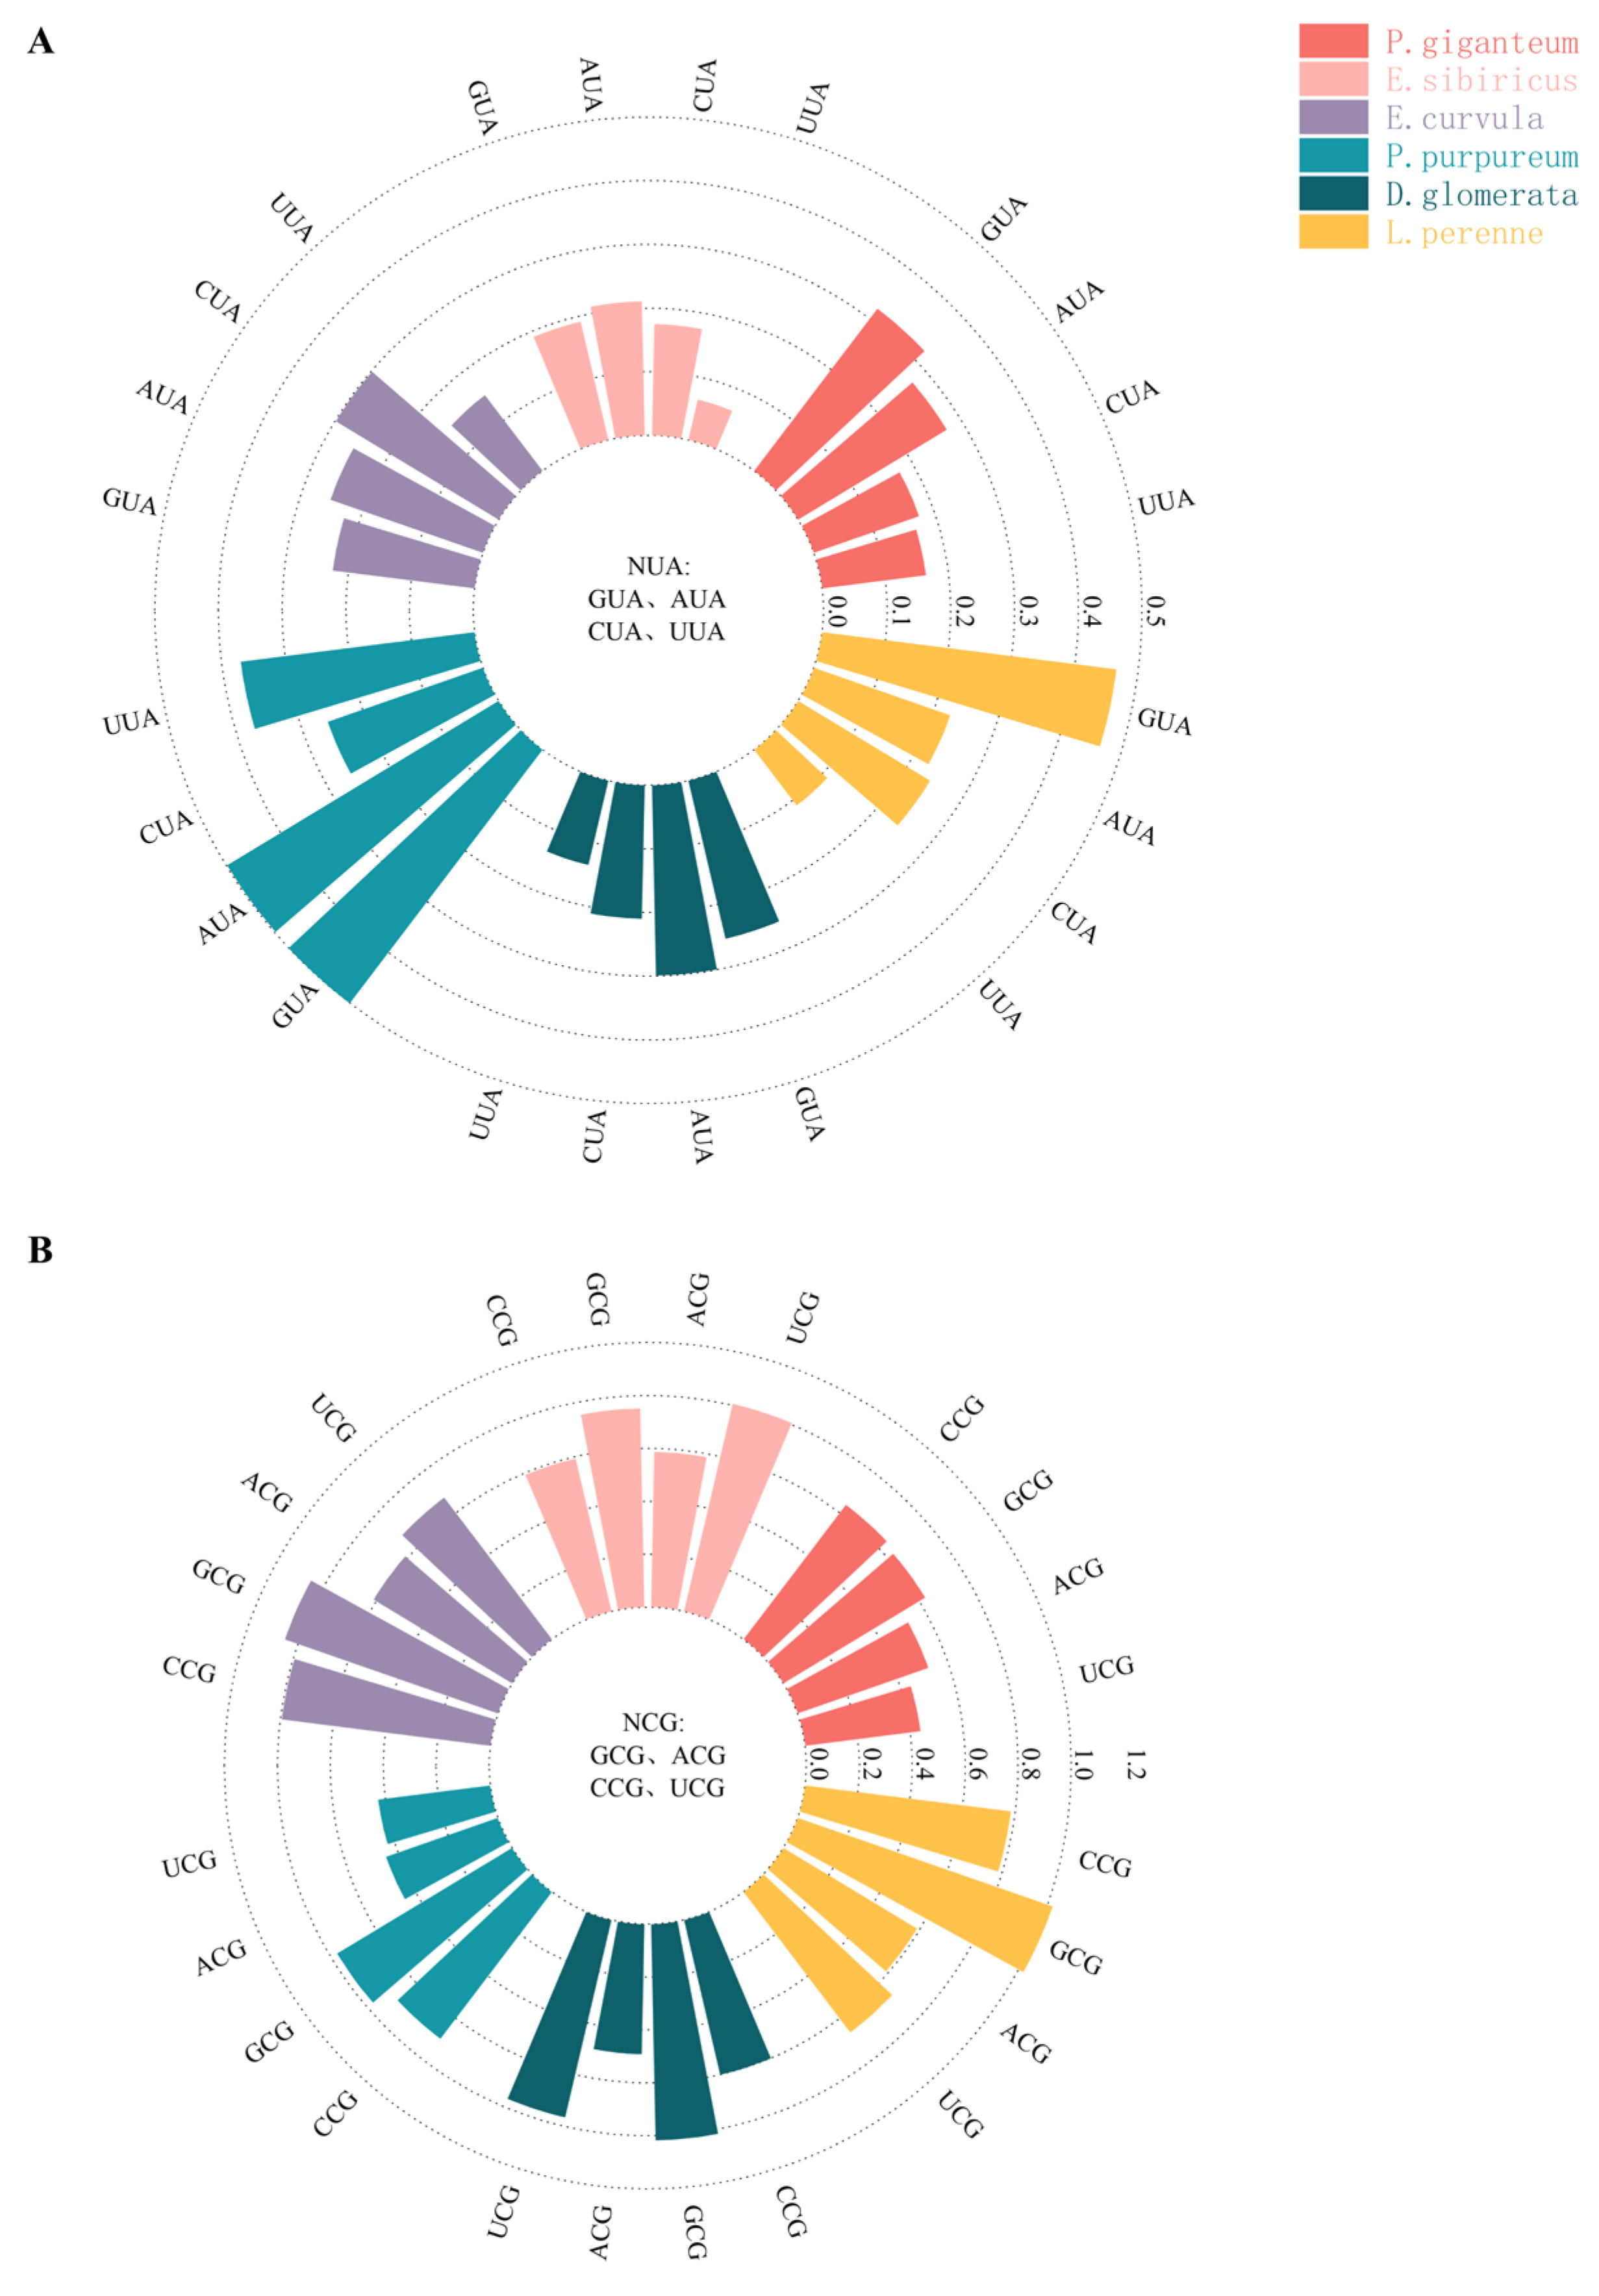
An investigation into codon usage patterns in these grasses revealed a predilection for high-frequency codons that terminate with C or G. RSCU values are conspicuously low for four NUA-type codons (Figure 8A). Four NUA-type codons (encoding leucine and tyrosine) had consistently and significantly low RSCU values across all species (Figure 8A), suggesting strong selective avoidance of these synonymous codons in HSP90 genes [56]. Four NCG-type codons also exhibited low RSCU values (Figure 8B)—a characteristic that might help to mitigate potential mutation risks associated with DNA methylation [57]. Collectively, these results reveal the complex interplay between CUB and evolutionary constraints in the structure of HSP90 genes in these grass species.
Figure 8.
RSCU values for six grasses: (A) NUA- and (B) NCG-type codons.
3.10. Differences in the CUB Domain of HSP90 Genes Between Gramineae and Other Species
As demonstrated by a comparison of codon bias in the HSP90 gene among six grass species and four reference plants (A. thaliana, S. italica, O. sativa, and Z. mays), significant interspecific differences were revealed (Supplementary Table S3). The six grasses exhibited moderate variation in codon preference, with ranges for A. thaliana being 22–50 (34.38–78.13% of total codons), B. distachyon (31–55; 48.44–85.94%), O. sativa (12–51; 18.75–79.69%), and Z. mays (28–48; 43.75–75.00%). The average number of conserved codons for A. thaliana was 29.33, and for B. distachyon (21.17), O. sativa (29.00), and Z. mays (28.00). These patterns suggest that A. thaliana, O. sativa, and Z. mays are more suitable as heterologous expression systems for the HSP90 gene in Poaceae plants.
3.11. Phylogenetic Analysis of Different Poaceae Forage Species
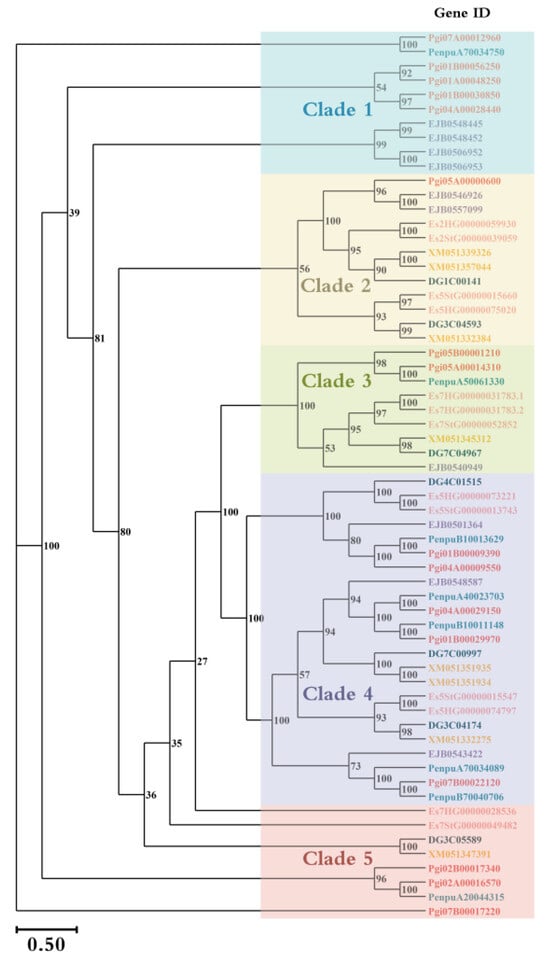
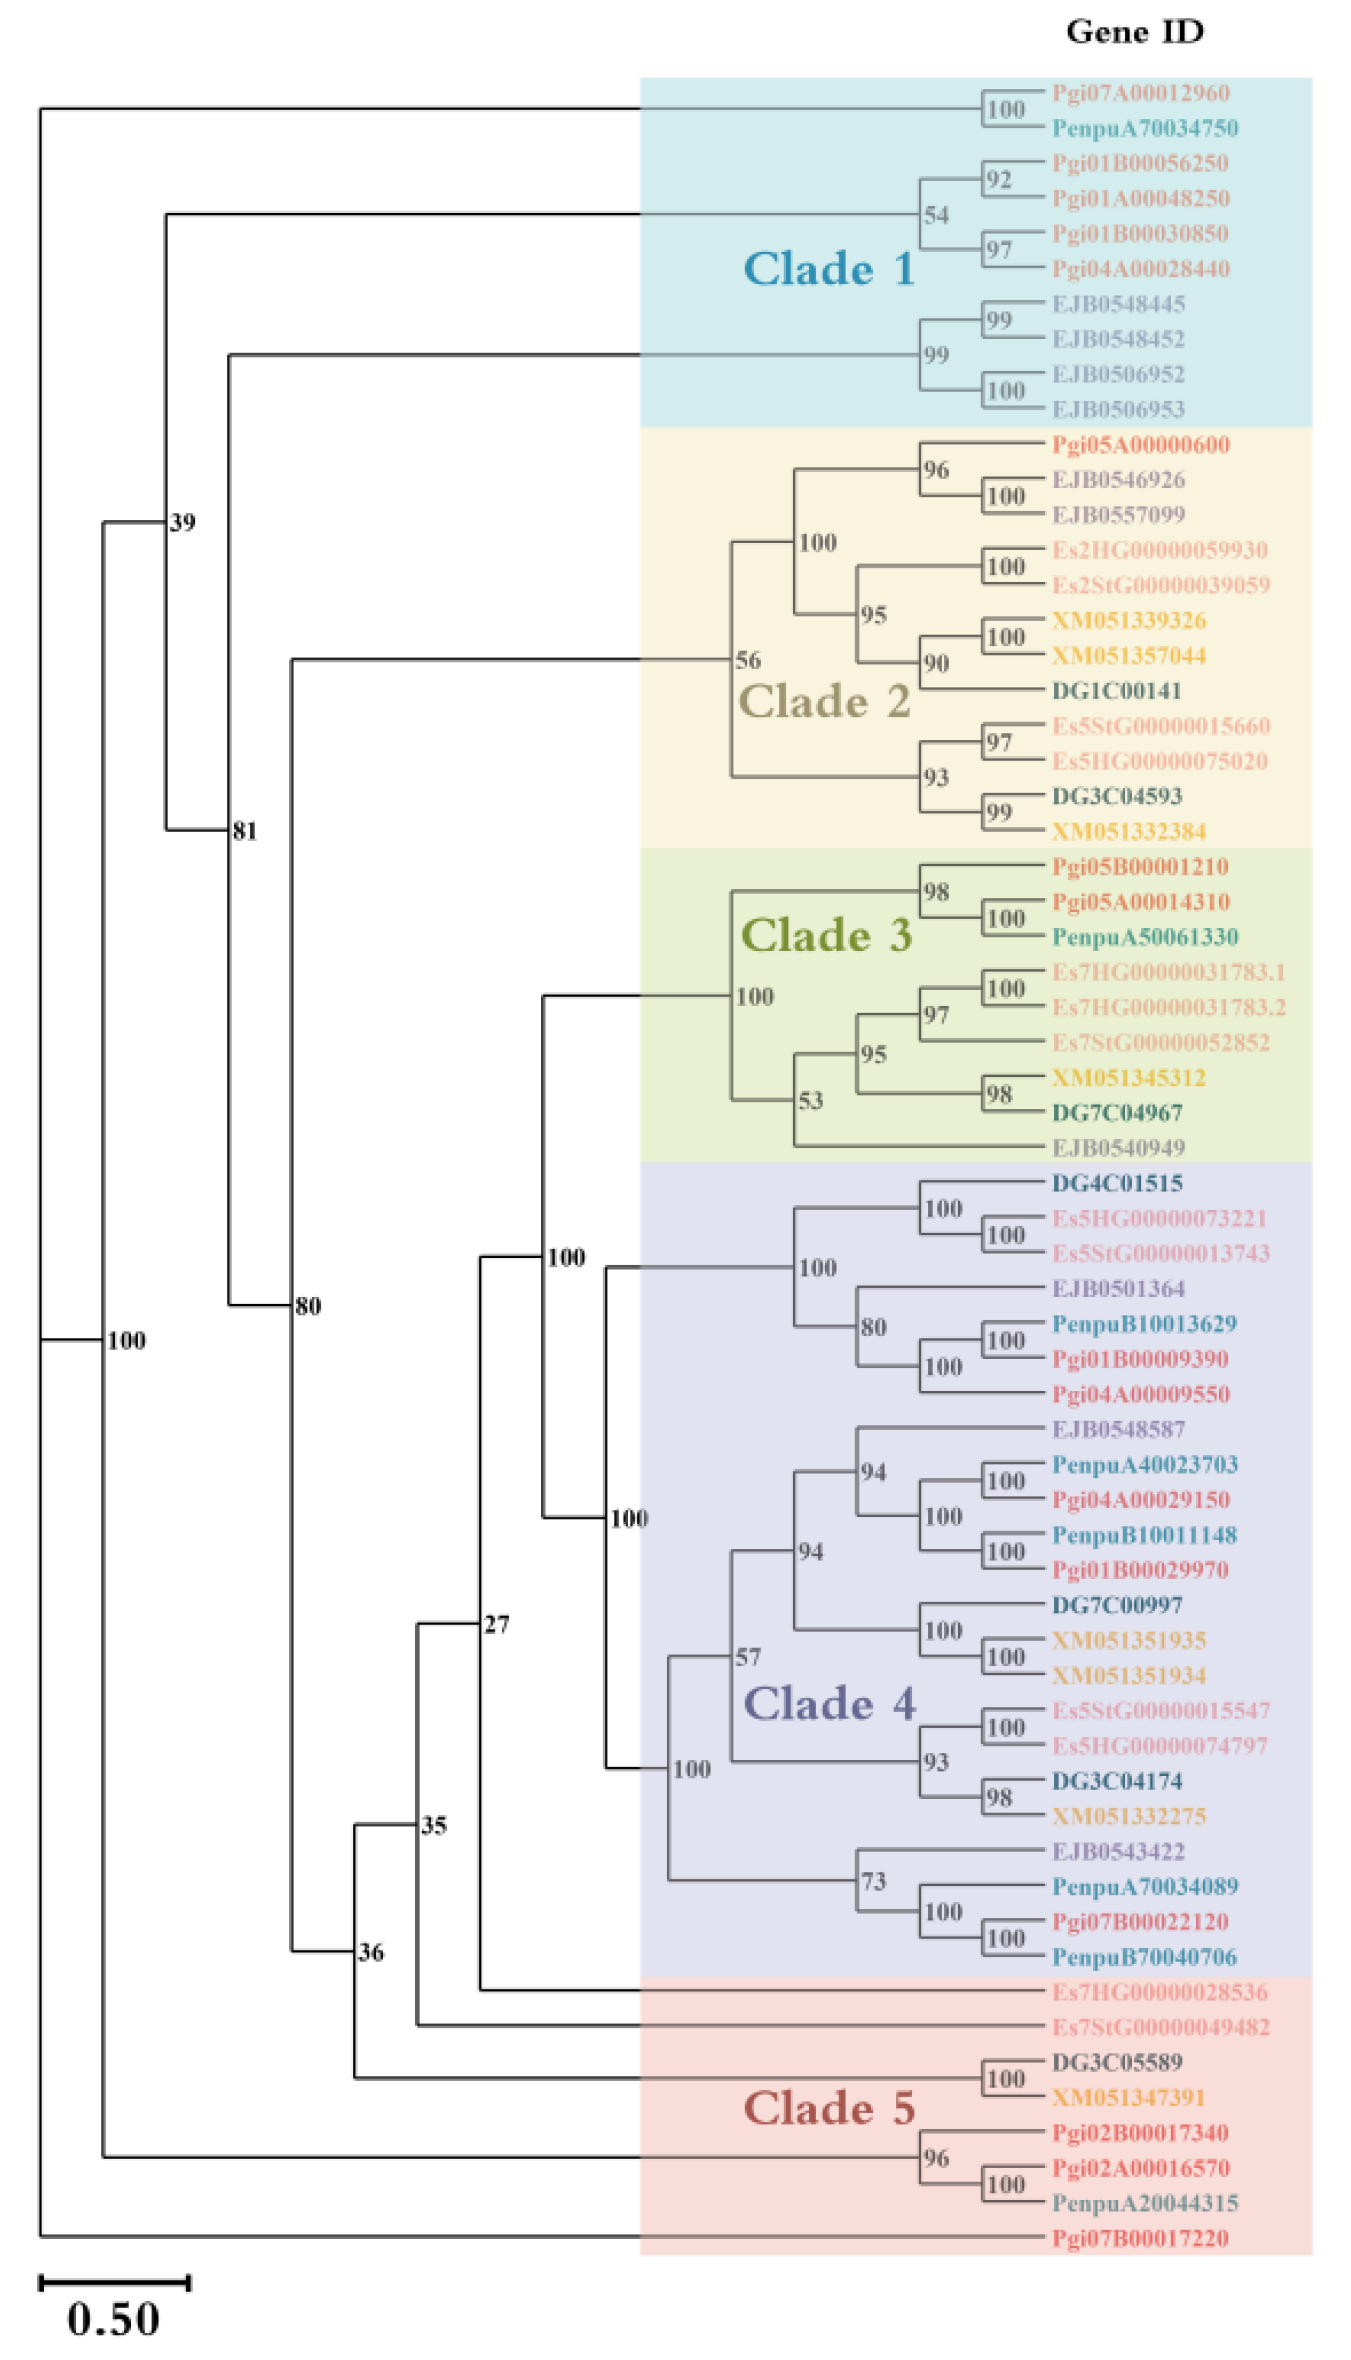
The phylogenetic tree (Figure 9) depicts the complex evolutionary relationships among HSP90 gene family members among the six grasses. Three major clades that diverge from the root node receive bootstrap support (values of 100, 81, and 39), suggesting a robust evolutionary analysis. These clades then diversify into multiple subclades, with certain branches having bootstrap support levels of 100, indicating substantial conservation during evolutionary processes. Clade I represents a relatively ancient evolutionary lineage, with P. giganteum only; sequence conservation within this clade suggests that this species occupies a basal evolutionary position in the HSP90 gene family. Clade II is more diverse, with three distinct subclades: one with E. curvula only; one with E. curvula, E. sibiricus, P. purpureum, D. glomerata, and L. perenne; and one with P. giganteum, E. curvula, E. sibiricus, P. purpurogenum, D. glomerata, and L. perenne, which further formed several sister branches with bootstrap support values of 100. In contrast, Clade III was relatively simply structured, containing P. giganteum only, providing key insights into the evolutionary history of this gene family. These results reveal the complex evolutionary dynamics and conservation patterns within the HSP90 gene family of these grass species.
Figure 9.
Phylogenetic tree of the HSP90 gene family reconstructed from sequence data of six grass species. Three major clades (I, II, and III) with bootstrap support values indicated at nodes (100, 81, and 39 for primary clades) are apparent. Clade I (basal) contains only P. giganteum; clade II has high diversity and multiple subclades encompassing E. curvula, E. sibiricus, P. purpureum, D. glomerata, and L. perenne; clade III comprises only P. giganteum sequences. Bootstrap values of 100 on terminal branches indicate strong evolutionary conservation. Branch lengths are proportional to genetic distance. Colors distinguish different clades and subclades for clarity.
4. Discussion
4.1. Natural Selection Driving the Dominant Role of CUB
Natural selection exerts a predominant influence on the evolution of CUB in HSP90 genes within the Poaceae. The ENC–GC3 plot first revealed all genes to have ENC values below the anticipated neutral curve, suggesting that mutational pressure is not the sole determinant [58]. The PR2-plot exhibited significant nucleotide asymmetry, precluding the possibility of purely mutation-driven processes [59]. Neutrality plot analysis exhibited extremely low regression slopes between GC12 and GC3 (<0.2), with quantitative estimates indicating mutational pressure to contribute only 0.18–13.51% to CUB, but for natural selection to contribute to 86.49–99.82% of observed variation. These results indicate that natural selection is the predominant evolutionary force shaping CUB in HSP90 genes. ENC values for each species deviated significantly from the neutral expectation curve, indicating strong selective pressure to optimize codon usage for efficient protein synthesis under stress conditions [60]. This finding is particularly noteworthy given the importance of HSP90 in maintaining proteostasis under abiotic stress, where rapid and accurate translation of this molecular chaperone is necessary for cellular tolerance. The observed moderate CUB in HSP90 genes (average ENC values 43–52) suggests an evolutionary trade-off between translational efficiency and genomic flexibility. Unlike high-bias genes such as those encoding ribosomal proteins, which prioritize maximal translation speed, HSP90 genes retain a degree of codon diversity, potentially enabling adaptation to fluctuating environmental conditions. However, despite the compelling evidence from ENC–GC3s, PR2, and neutrality plot analyses that strongly support natural selection as being the predominant force shaping CUB in these HSP90 genes, this interpretation has limitations. First, theoretical curves underlying these analyses are predicated on the assumption of the mutation–selection equilibrium, which may not fully capture the complexity of real evolutionary processes [61]. Second, factors other than mutation and selection (e.g., gene expression level, tRNA abundance, and mRNA secondary structure) may also influence CUB. The contributions of these factors are difficult to quantify within the current analytical framework. Consequently, the estimated selection contributions (86.49–99.82%) should be regarded as approximations of the relative strength of selection rather than as absolute values.
4.2. Codon Preference and Functional Adaptation
The HSP90 gene has a significant predilection for codons that terminate with G or C (usage frequency at the third nucleotide position: T = 28.99%; G = 43.44%; C = 45.52%), a strategy postulated to enhance translational efficiency [62,63]. G/C-rich codons typically correspond to higher tRNA abundance and faster decoding rates, thereby supporting the demand for rapid protein synthesis under stress conditions. This preference is particularly advantageous for stress-responsive genes like HSP90, which require the rapid production of molecular chaperones to maintain proteostasis under challenges such as high temperature or drought. Conversely, the predominance of NUA- and NCG-type codons reveals the importance of evolutionary constraints in shaping the genetic code. Avoidance of NUA codons (that encode for leucine and tyrosine) may serve to mitigate the risk of methylation-induced mutations [64]. Low NCG codon RSCU values imply a mechanism that preserves transcriptional stability by constraining genomic regions susceptible to elevated methylation [65]. These patterns are consistent with other research in the domain of plant genomics and suggest that CUB serves as an evolutionary balance between optimizing translation and preserving genomic integrity.
4.3. Interspecific Variability and Evolutionary Divergence
Interspecific divergence in codon usage patterns was observed among HSP90 genes of the six grass species (e.g., P. giganteum and E. sibiricus had a higher L_sym, whereas E. curvula and L. perenne were more variable). This divergence reflects distinct evolutionary adaptations to specific ecological niches: the stable nucleotide preferences in P. giganteum and E. sibiricus may indicate adaptation to relatively consistent environmental conditions, ensuring reliable protein synthesis through conserved codon usage. In contrast, the high variability in E. curvula and L. perenne indicates an adaptation to diverse ecological demands through flexible translational strategies. The low correlation between GC12 and GC3 values in the neutrality map (with regression slopes < 0.2 for most species) further underscores the limited impact of mutational pressure.
5. Conclusions
We report codon bias patterns in HSP90 genes of six grass species, and demonstrate natural selection to be the predominant driving force behind codon optimization. A moderate CUB (ENC range 43–52) reflects an evolutionary trade-off between translational efficiency and genetic adaptability. The marked preference for G/C-terminating codons suggests the evolution of constraint mechanisms that enhance stress resistance. Interspecies symmetry indices and GC12–GC3 relationships diverge differently. Additionally, we identify A. thaliana, O. sativa, and Z. mays to be optimal heterologous expression systems for Poaceae HSP90 genes. These findings establish a scientific foundation for targeted molecular breeding of forage crop stress resistance through codon-directed approaches.
Supplementary Materials
The following supporting information can be downloaded at: https://www.mdpi.com/article/10.3390/agronomy16070699/s1. Table S1: Comparison of codon usage frequency between six Poaceae forage species and four typical organisms; Table S2: The information of HSP90 genes in Six Poaceae Forages; Table S3: Codon information in HSP90 coding regions of six Poaceae forage. Raw Sequence Data for Six Pasture Grasses: The raw sequence data for the six forage species was obtained from the NCBI database and subsequently processed. The species include P. giganteum, E. sibiricus L., E. curvula (Schrad.) Nees., P. purpureum Schumach., D. glomerata L., and L. perenne L.
Author Contributions
Conceptualization, S.L. and J.L.; Methodology, Q.L.; Software, S.L. and X.H.; Validation, H.W., C.L., X.H. and W.C.; Formal analysis, H.W., C.L., X.H. and W.C.; Investigation, L.H.; Resources, Q.L., L.H., G.N. and G.F.; Data curation, L.H.; Writing—original draft, S.L., J.L., Q.L., C.L. and W.C.; Writing—review & editing, G.F.; Visualization, S.L., J.L. and G.N.; Supervision, G.F.; Project administration, H.W.; Funding acquisition, G.N. and G.F. All authors have read and agreed to the published version of the manuscript.
Funding
This research was funded by the National Key Research and Development Program of China (Grant No. 2023YFF1001400), National Natural Science Foundation of China (Grant No. U23A20218), China Agriculture Research System (CARS-34) from the Ministry of Agriculture and Rural Affairs of China, and the National Undergraduate Innovation and Entrepreneurship Training Program (Grant No. 202410626020).
Data Availability Statement
The original contributions presented in this study are included in the article/Supplementary Materials. Further inquiries can be directed to the corresponding author.
Conflicts of Interest
The authors declare no conflicts of interest.
References
- Bata, T. Widespread Development of Silcrete in the Cretaceous and Evolution of the Poaceae Family of Grass Plants. Earth Sci. Res. 2016, 5, 1. [Google Scholar] [CrossRef] [Scilit]
- Devos, K.M. Grass genome organization and evolution. Curr. Opin. Plant Biol. 2009, 13, 139–145. [Google Scholar] [CrossRef] [Scilit] [PubMed]
- Ren, Q.; Wang, Y.; Lin, Y.C.; Zhen, Z.; Cui, Y.; Qin, S. The extremely large chloroplast genome of the green alga Haematococcus pluvialis: Genome structure, and comparative analysis. Algal Res. 2021, 56, 102308. [Google Scholar] [CrossRef] [Scilit]
- Farouk, O.Y.; Fahim, J.R.; Attia, E.Z.; Kamel, M.S. Phytochemical and biological profiles of the genus Phragmites (Family Poaceae): A review. S. Afr. J. Bot. 2023, 163, 659–672. [Google Scholar] [CrossRef] [Scilit]
- Liu, Q.; Li, S.; He, D.; Liu, J.; He, X.; Lin, C.; Li, J.; Huang, Z.; Huang, L.; Nie, G.; et al. Comparative Analysis of Codon Usage Patterns in the Chloroplast Genomes of Fagopyrum Species. Agronomy 2025, 15, 1190. [Google Scholar] [CrossRef] [Scilit]
- Inoue, H.; Li, M.; Schnell, D.J. An essential role for chloropiast heat shock protein 90 (Hsp90C) in protein import into chloroplasts. Proc. Natl. Acad. Sci. USA 2013, 110, 3173–3178. [Google Scholar] [CrossRef] [Scilit]
- Li, T.; Ma, Z.; Ding, T.; Yang, Y.; Wang, F.; Wan, X.; Liang, F.; Chen, X.; Yao, H. Codon usage bias and phylogenetic analysis of chloroplast genome in 36 gracilariaceae species. Funct. Integr. Genom. 2024, 24, 45. [Google Scholar] [CrossRef] [Scilit]
- Backe, S.J.; Sager, R.A.; Heritz, J.A.; Wengert, L.A.; Meluni, K.A.; Aran-Guiu, X.; Panaretou, B.; Woodford, M.R.; Prodromou, C.; Bourboulia, D.; et al. Activation of autophagy depends on Atg1/Ulk1-mediated phosphorylation and inhibition of the Hsp90 chaperone machinery. Cell Rep. 2024, 43, 113672. [Google Scholar] [CrossRef] [Scilit]
- Willmund, F.; Schroda, M. HEAT SHOCK PROTEIN 90C is a bona fide Hsp90 that interacts with plastidic HSP70B in Chlamydomonas reinhardtii. Plant Physiol. 2005, 138, 2310–2322. [Google Scholar] [CrossRef] [Scilit]
- Wu, J.; Li, Y.; Yin, H.; Zhao, L.; Xu, C.; Fu, X.; Shang, J.; Liu, S.; Guo, H.; Ma, F. Plant Heat Shock Protein Hsp90 enhances stress resistance through integrating protein quality control, chloroplast protection, hormone signal network, and immune defense. J. Exp. Bot. 2025, 77, 910–931. [Google Scholar] [CrossRef] [Scilit]
- Barbhuiya, P.A.; Uddin, A.; Chakraborty, S. Codon usage pattern and evolutionary forces of mitochondrial ND genes among orders of class Amphibia. J. Cell. Physiol. 2020, 236, 2850–2868. [Google Scholar] [CrossRef] [Scilit] [PubMed]
- Yang, B.; Cheng, Z.; Luo, L.; Cheng, K.; Gan, S.; Shi, Y.; Liu, C.; Wang, D. Comparative analysis of codon usage patterns of Plasmodium helical interspersed subtelomeric (PHIST) proteins. Front. Microbiol. 2023, 14, 1320060. [Google Scholar] [CrossRef] [Scilit] [PubMed]
- Shen, L.; Chen, S.; Liang, M.; Qu, S.; Feng, S.; Wang, D.; Wang, G. Comparative analysis of codon usage bias in chloroplast genomes of ten medicinal species of Rutaceae. BMC Plant Biol. 2024, 24, 424. [Google Scholar] [CrossRef] [Scilit] [PubMed]
- Mistry, J.; Chuguransky, S.; Williams, L.; Qureshi, M.; Salazar, G.A.; Sonnhammer, E.L.L.; Tosatto, S.C.E.; Paladin, L.; Raj, S.; Richardson, L.J.; et al. Pfam: The protein families database in 2021. Nucleic Acids Res. 2020, 49, D412–D419. [Google Scholar] [CrossRef] [Scilit]
- Sahoo, S.; Das, S.S.; Rakshit, R. Codon usage pattern and predicted gene expression in Arabidopsis thaliana. Gene X 2019, 2, 100012. [Google Scholar] [CrossRef] [Scilit]
- Li, G.; Zhang, L.; Xue, P. Codon usage pattern and genetic diversity in chloroplast genomes of Panicum species. Gene 2021, 802, 145866. [Google Scholar] [CrossRef] [Scilit]
- Li, C.; Zhou, L.; Nie, J.; Wu, S.; Li, W.; Liu, Y.; Liu, Y. Codon usage bias and genetic diversity in chloroplast genomes of Elaeagnus species (Myrtiflorae: Elaeagnaceae). Physiol. Mol. Biol. Plants 2023, 29, 239–251. [Google Scholar] [CrossRef] [Scilit]
- An, H.; Ding, J.; Chen, E.; Li, R.; Lin, M.; Qian, H.; Zhao, G. Characterization and functional analysis of small heat shock protein gene HSP20.1 in Bombyx mandarina. Int. J. Trop. Insect Sci. 2024, 44, 1–10. [Google Scholar] [CrossRef] [Scilit]
- Fang, J.; Liu, B.; Liu, G.; Verbruggen, H.; Zhu, H. Six Newly Sequenced Chloroplast Genomes from Trentepohliales: The Inflated Genomes, Alternative Genetic Code and Dynamic Evolution. Front. Plant Sci. 2021, 12, 780054. [Google Scholar] [CrossRef] [Scilit]
- Donoghue, M.T.A.; Keshavaiah, C.; Swamidatta, S.H.; Spillane, C. Evolutionary origins of Brassicaceae specific genes in Arabidopsis thaliana. BMC Evol. Biol. 2011, 11, 47. [Google Scholar] [CrossRef] [Scilit]
- Smith, R.D. Enhanced effective codon numbers to understand codon usage bias. Bio Syst. 2022, 220, 104734. [Google Scholar] [CrossRef] [Scilit]
- Zhang, Y.; Chang, Y.W.; Wang, Y.C.; Yan, Y.Q.; Du, Y.Z. The small heat shock protein Hsp20.8 imparts tolerance to high temperatures in the leafminer fly, Liriomyza trifolii (Diptera: Agtomyzidae). Bull. Entomol. Res. 2024, 114, 230–236. [Google Scholar] [CrossRef] [Scilit] [PubMed]
- Yu, T.; Li, J.; Yang, Y.; Qi, L.; Chen, B.; Zhao, F.; Bao, Q.; Wu, J. Codon usage patterns and adaptive evolution of marine unicellular cyanobacteria Synechococcus and Prochlorococcus. Mol. Phylogenetics Evol. 2012, 62, 206–213. [Google Scholar] [CrossRef] [Scilit] [PubMed]
- Huang, L.; Feng, G.; Yan, H.; Zhang, Z.; Bushman, B.S.; Wang, J.; Bombarely, A.; Li, M.; Yang, Z.; Nie, G.; et al. Genome assembly provides insights into the genome evolution and flowering regulation of orchardgrass. Plant Biotechnol. J. 2020, 18, 373–388. [Google Scholar] [CrossRef] [Scilit] [PubMed]
- Coggill, P.; Finn, R.D.; Bateman, A. Identifying protein domains with the Pfam database. Curr. Protoc. Bioinform. 2008, 23, 2–5. [Google Scholar] [CrossRef] [Scilit]
- Blum, M.; Andreeva, A.; Florentino, L.C.; Chuguransky, S.R.; Grego, T.; Hobbs, E.; Pinto, B.L.; Orr, A.; Paysan-Lafosse, T.; Ponamareva, I.; et al. InterPro: The protein sequence classification resource in 2025. Nucleic Acids Res. 2025, 53, D444–D456. [Google Scholar] [CrossRef] [Scilit]
- Letunic, I.; Doerks, T.; Bork, P. SMART 7: Recent updates to the protein domain annotation resource. Nucleic Acids Res. 2012, 40, D302–D305. [Google Scholar] [CrossRef] [Scilit]
- Chen, C.; Wu, Y.; Li, J.; Wang, X.; Zeng, Z.; Xu, J.; Liu, Y.; Feng, J.; Chen, H.; He, Y.; et al. TBtools-II: A “One for All, All for One” Bioinformatics Platform for Biological Big-data Mining. Mol. Plant 2023, 16, 1733–1742. [Google Scholar] [CrossRef] [Scilit]
- Rice, P.; Longden, I.; Bleasby, A. EMBOSS: The European Molecular Biology Open Software Suite. Trends Genet. 2000, 16, 276–277. [Google Scholar] [CrossRef] [Scilit]
- Zhou, M.; Tong, C.; Shi, J. Analysis of Codon Usage Between Different Poplar Species. J. Genet. Genom. 2007, 34, 555–561. [Google Scholar] [CrossRef] [Scilit]
- Choudhury, M.N.; Uddin, A.; Chakraborty, S. Codon usage bias and its influencing factors for Y-linked genes in human. Comput. Biol. Chem. 2017, 69, 77–86. [Google Scholar] [CrossRef] [Scilit]
- Fuglsang, A. Estimating the “effective number of codons”: The Wright way of determining codon homozygosity leads to superior estimates. Genetics 2006, 172, 1301–1307. [Google Scholar] [CrossRef] [Scilit] [PubMed]
- Sueoka, N. Directional mutation pressure and neutral molecular evolution. Proc. Natl. Acad. Sci. USA 1988, 85, 2653–2657. [Google Scholar] [CrossRef] [Scilit] [PubMed]
- Canady, V.A. Final parity rule strengthens consumer protections, improves MH, SUD access. Ment. Health Wkly. 2024, 34, 1–3. [Google Scholar] [CrossRef] [Scilit]
- Sueoka, N.; Kawanishi, Y. DNA G + C content of the third codon position and codon usage biases of human genes. Gene 2000, 261, 53–62. [Google Scholar] [CrossRef] [Scilit]
- Hu, Q.; Wu, J.; Fan, C.; Luo, Y.; Liu, J.; Deng, Z.; Li, Q. Comparative analysis of codon usage bias in the chloroplast genomes of eighteen Ampelopsideae species (Vitaceae). BMC Genom. Data 2024, 25, 80. [Google Scholar] [CrossRef] [Scilit]
- Rao, A.; Chen, Z.; Wu, D.; Wang, Y.; Hou, N. Codon usage bias in the chloroplast genomes of Cymbidium species in Guizhou, China. S. Afr. J. Bot. 2024, 164, 429–437. [Google Scholar] [CrossRef] [Scilit]
- Sun, Y.; Wu, Y.; Liu, Z. An improved differential evolution with adaptive population allocation and mutation selection. Expert Syst. Appl. 2024, 258, 125130. [Google Scholar] [CrossRef] [Scilit]
- Kudlats, J.; Money, A.; Hair, J.F., Jr. Correspondence analysis: A promising technique to interpret qualitative data in family business research. J. Fam. Bus. Strategy 2014, 5, 30–40. [Google Scholar] [CrossRef] [Scilit]
- Sourial, N.; Wolfson, C.; Zhu, B.; Quail, J.; Fletcher, J.; Karunananthan, S.; Bandeen-Roche, K.; Béland, F.; Bergman, H. Correspondence analysis is a useful tool to uncover the relationships among categorical variables. J. Clin. Epidemiol. 2009, 63, 638–646. [Google Scholar] [CrossRef] [Scilit]
- Du, M.Z.; Liu, S.; Zeng, Z.; Alemayehu, L.A.; Wei, W.; Guo, F.B. Amino acid compositions contribute to the proteins’ evolution under the influence of their abundances and genomic GC content. Sci. Rep. 2018, 8, 7382. [Google Scholar] [CrossRef] [Scilit] [PubMed]
- Echols, N.; Harrison, P.; Balasubramanian, S.; Luscombe, N.M.; Bertone, P.; Zhang, Z.; Gerstein, M. Comprehensive analysis of amino acid and nucleotide composition in eukaryotic genomes, comparing genes and pseudogenes. Nucleic Acids Res. 2002, 30, 2515–2523. [Google Scholar] [CrossRef] [Scilit] [PubMed]
- Zhao, F.; Zhou, Z.; Dang, Y.; Na, H.; Adam, C.; Lipzen, A.; Ng, V.; Grigoriev, I.V.; Liu, Y. Genome-wide role of codon usage on transcription and identification of potential regulators. Proc. Natl. Acad. Sci. USA 2021, 118, e2022590118. [Google Scholar] [CrossRef] [Scilit]
- Li, N.; Li, Y.; Zheng, C.; Huang, J.; Zhang, S. Genome-wide comparative analysis of the codon usage patterns in plants. Genes Genom. 2016, 38, 723–731. [Google Scholar] [CrossRef] [Scilit]
- Gerdol, M.; De Moro, G.; Venier, P.; Pallavicini, A. Analysis of synonymous codon usage patterns in sixty-four different bivalve species. PeerJ 2015, 3, e1520. [Google Scholar] [CrossRef] [Scilit] [PubMed]
- Duan, H.; Zhang, Q.; Wang, C.; Li, F.; Tian, F.; Lu, Y.; Hu, Y.; Yang, H.; Cui, G. Analysis of codon usage patterns of the chloroplast genome in Delphinium grandiflorum L. reveals a preference for AT-ending codons as a result of major selection constraints. PeerJ 2021, 9, e10787. [Google Scholar] [CrossRef] [Scilit]
- Sheng, J.; She, X.; Liu, X.; Wang, J.; Hu, Z. Comparative analysis of codon usage patterns in chloroplast genomes of five Miscanthus species and related species. PeerJ 2021, 9, e12173. [Google Scholar] [CrossRef] [Scilit]
- Choudhuri, S.; Sau, K. CodonU: A Python Package for Codon Usage Analysis. IEEE/ACM Trans. Comput. Biol. Bioinform. 2023, 21, 36–44. [Google Scholar] [CrossRef] [Scilit]
- Hamilton, J.P.; Li, C.; Buell, C.R. The rice genome annotation project: An updated database for mining the rice genome. Nucleic Acids Res. 2024, 53, D1614–D1622. [Google Scholar] [CrossRef] [Scilit]
- Goodstein, D.M.; Shu, S.; Howson, R.; Neupane, R.; Hayes, R.D.; Fazo, J.; Mitros, T.; Dirks, W.; Hellsten, U.; Putnam, N.; et al. Phytozome: A comparative platform for green plant genomics. Nucleic Acids Res. 2012, 40, D1178–D1186. [Google Scholar] [CrossRef] [Scilit]
- Kumar, S.; Stecher, G.; Li, M.; Knyaz, C.; Tamura, K. MEGA X: Molecular Evolutionary Genetics Analysis across Computing Platforms. Mol. Biol. Evol. 2018, 35, 1547–1549. [Google Scholar] [CrossRef] [Scilit]
- Mello, B. Estimating TimeTrees with MEGA and the TimeTree Resource. Mol. Biol. Evol. 2018, 35, 2334–2342. [Google Scholar] [CrossRef] [Scilit]
- Zhang, R.; Zhang, L.; Wang, W.; Zhang, Z.; Du, H.; Qu, Z.; Li, X.Q.; Xiang, H. Differences in Codon Usage Bias between Photosynthesis-Related Genes and Genetic System-Related Genes of Chloroplast Genomes in Cultivated and Wild Solanum Species. Int. J. Mol. Sci. 2018, 19, 3142. [Google Scholar] [CrossRef] [Scilit]
- Quax, T.E.; Wolf, Y.I.; Koehorst, J.J.; Wurtzel, O.; van der Oost, R.; Ran, W.; Blombach, F.; Makarova, K.S.; Brouns, S.J.; Forster, A.C.; et al. Differential Translation Tunes Uneven Production of Operon-Encoded Proteins. Cell Rep. 2013, 4, 938–944. [Google Scholar] [CrossRef] [Scilit]
- Xu, W.; Xing, T.; Zhao, M.; Yin, X.; Xia, G.; Wang, M. Synonymous codon usage bias in plant mitochondrial genes is associated with intron number and mirrors species evolution. PLoS ONE 2017, 10, e0131508. [Google Scholar] [CrossRef] [Scilit]
- Rogers, S.O. Evolution of the genetic code based on conservative changes of codons, amino acids, and aminoacyl tRNA synthetases. J. Theor. Biol. 2019, 466, 1–10. [Google Scholar] [CrossRef] [Scilit]
- Villicaña, S.; Bell, J.T. Genetic impacts on DNA methylation: Research findings and future perspectives. Genome Biol. 2021, 22, 127. [Google Scholar] [CrossRef] [Scilit]
- Yan, J.; Tang, C.; Tang, H.; Jia, B.; Feng, C.; Qi, J.; Li, Y.; Li, X. Analysis of Codon Usage Bias Between Entomopathogenic Fungus Ophiocordyceps sinensis and Its Host, Thitarodes xiaojinensis. Biology 2026, 15, 346. [Google Scholar] [CrossRef] [Scilit]
- Zhao, X.; Lan, X.; Wang, Z.; Li, D.; Sun, W.; Gai, Y.; Liu, B. Comparative chloroplast genomics of Cypripedioideae: Structural divergence, adaptive evolution, and phylogenomic insights. Front. Plant Sci. 2026, 16, 1723281. [Google Scholar] [CrossRef] [Scilit]
- Yi, J.; Chen, W.; Wang, M.; Lian, G.; Tao, S.; Li, Z.J. Application of genetic code expansion to regulate the synthesis of poly(lactate-co-3-hydroxybutyrate) in Escherichia coli. Biochem. Eng. J. 2024, 211, 109478. [Google Scholar] [CrossRef] [Scilit]
- Bürger, R.; Hofbauer, J. Mutation load and mutation-selection-balance in quantitative genetic traits. J. Math. Biol. 2004, 32, 193–218. [Google Scholar] [CrossRef] [Scilit]
- Victor, M.P.; Acharya, D.; Chakraborty, S.; Ghosh, T.C. The combined influence of codon composition and tRNA copy number regulates translational efficiency by influencing synonymous nucleotide substitution. Gene 2020, 745, 144640. [Google Scholar] [CrossRef] [Scilit]
- Qian, W.; Yang, J.R.; Pearson, N.M.; Maclean, C.; Zhang, J. Balanced codon usage optimizes eukaryotic translational efficiency. PLoS Genet. 2012, 8, e1002603. [Google Scholar] [CrossRef] [Scilit]
- Dobersch, S.; Yamamoto, N.; Schutter, A.; Cavender, S.M.; Robertson, T.M.; Kartha, N.; Samraj, A.N.; Doron, B.; Poole, L.A.; Wladyka, C.L.; et al. HMGA2 and protein leucine methylation drive pancreatic cancer lineage plasticity. Nat. Commun. 2025, 16, 4866. [Google Scholar] [CrossRef] [Scilit]
- Wegman, R.; Langberg, M.; Davis, R.B.; Liu, X.; Luo, M.; Yu, M.C.; Walker, S.E. Protein Arginine Methylation of the Translation Initiation Factor eIF1A Increases Usage of a Near-cognate Start Codon. bioRxiv 2024. Preprint. [Google Scholar]

Disclaimer/Publisher’s Note: The statements, opinions and data contained in all publications are solely those of the individual author(s) and contributor(s) and not of MDPI and/or the editor(s). MDPI and/or the editor(s) disclaim responsibility for any injury to people or property resulting from any ideas, methods, instructions or products referred to in the content. |
© 2026 by the authors. Licensee MDPI, Basel, Switzerland. This article is an open access article distributed under the terms and conditions of the Creative Commons Attribution (CC BY) license.