


Abstract
The SQS_PSY family (Squalene/phytoene synthase family), with squalene synthase (SQS) and phytoene synthase (PSY) as core members, comprises enzymes that catalyze the head-to-head condensation of isoprenoid precursors. These enzymes play pivotal roles in mediating plant responses to both biotic and abiotic stresses; nevertheless, their specific functions in soybean defense against Phytophthora sojae infection remain elusive. In the present study, a comprehensive bioinformatics approach was utilized to identify 12 SQS_PSY family members in the soybean genome, followed by subsequent analyses of chromosomal distribution, phylogenetic relationships, gene structures, conserved motifs, and cis-acting regulatory elements within promoter regions. Notably, multiple cis-elements responsive to biotic and abiotic stresses were detected in the promoter regions of SQS_PSY genes in soybean, implying their potential involvement in stress-responsive pathways. To elucidate their roles in defense, resistant and susceptible soybean cultivars were inoculated with P. sojae, and RNA-seq was conducted on sampled tissues. Integrated with quantitative real-time PCR (qRT-PCR) validation, our findings demonstrated that GmSQS1 exhibited differential expression patterns between resistant and susceptible cultivars at multiple time points post-inoculation. Furthermore, the functional role of GmSQS1 in enhancing soybean resistance to P. sojae was confirmed using a transgenic hairy root system. Collectively, this study preliminarily validated the functions of the SQS_PSY genes in soybean and offers novel insights into their potential application for improving resistance against Phytophthora root rot.
1. Introduction
Yield reduction induced by soybean diseases poses a formidable challenge to major soybean-producing countries worldwide. As the second-largest global soybean producer, the United States has incurred substantial economic losses in its soybean industry due to such diseases [1]. Specifically, from 1996 to 2016, soybean diseases caused losses of nearly 4.55 billion US dollars in the United States [1]. Soybean root rot, a widespread and destructive soil-borne disease in soybean production, is triggered by infections of various pathogenic microorganisms, including Phytophthora [2], Fusarium [3,4], and Pythium [5]. This disease induces root rot, plant wilting, and even mortality in soybeans; in severe cases, yield losses range from 30% to 50%, which significantly impairs soybean yield and quality. Notably, soybean root rot caused by Phytophthora sojae (P. sojae) ranks among the most devastating diseases threatening soybean production, resulting in annual economic losses of 1 to 2 billion US dollars globally [6,7]. Soybean-producing regions in China are also severely threatened by P. sojae-mediated root rot. Current strategies for controlling Phytophthora root rot primarily encompass chemical control, resistant variety selection, agricultural control, and biological control [8]. However, methods such as chemical control have a narrow application scope and fail to effectively manage Phytophthora root rot in soybeans. In contrast, resistant soybean varieties are not only cost-effective but also exhibit robust control efficacy. Therefore, breeding and cultivating disease-resistant varieties is deemed the most economical and effective approach [9,10,11]. The core of disease-resistant variety breeding lies in the excavation of disease-resistant genes. R proteins, transcription factors, and small RNAs all have the capacity to mediate soybean resistance to P. sojae. Rps1k-1 and Rps1k-2 are members of the R protein family, and transgenic soybean plants expressing either Rps1k-1 or Rps1k-2 display enhanced resistance to P. sojae [12,13]. Disclosed transcription factors involved in regulating Phytophthora root rot resistance include the WRKY and ERF families [14,15,16]. For instance, GmWRKY31 can cooperate with GmHDL56 to modulate the expression of the disease-resistant gene GmNPR1, thereby improving soybean resistance [14]. In terms of small RNAs, miR393 and miR166 collaboratively participate in the basal defense response of soybean roots against P. sojae infection [17]; gma-MiR1507a regulates soybean resistance to P. sojae by modulating the expression of its target gene GmRGA4 [18]. Relevant studies have indicated that the zinc finger protein GmZFP03 can elevate the activity and gene expression level of superoxide dismutase, thereby enhancing soybean resistance to Phytophthora root rot [19]. Additionally, accumulating evidence has demonstrated that P. sojae effectors can regulate soybean resistance to P. sojae through interactions with soybean genes [20,21,22]: the virulence activity of PsAvh413 promotes trehalose biosynthesis in soybeans, and overexpression or knockout of GmTPS6, respectively, facilitates or suppresses P. sojae infection [22]. In summary, the excavation of disease-resistant genes is crucial to the success of soybean resistance breeding against Phytophthora root rot, and a thorough understanding of the molecular mechanisms underlying soybean–P. sojae interactions will lay a solid foundation for developing durable resistant varieties.
The SQS_PSY family (squalene/phytoene synthase family) comprises enzymes that catalyze the head-to-head condensation of isoprenoid precursors, with squalene synthase (SQS) and phytoene synthase (PSY) serving as core members [23,24]. Specifically, PSY mediates the condensation of two geranylgeranyl diphosphate (GGPP) molecules to form phytoene, a key rate-limiting step in carotenoid biosynthesis [24]. Carotenoids are well-documented to regulate plant resistance to abiotic stresses while modulating plant growth and development [25]. SQS, on the other hand, catalyzes the condensation of two farnesyl diphosphate (FPP) molecules to generate squalene (SQ), against pathogens (e.g., bacteria, fungi, viruses) through multiple pathways, including strengthening physical barriers, inducing chemical defenses and regulating signaling pathways, thereby functioning as a critical component of the plant innate immune system. Notably, triterpenoids have been shown to enhance disease resistance in soybeans [26,27]. Phytosterols, natural plant compounds, play important roles in plant responses to both biotic and abiotic stresses [28,29,30]. Plants can adjust their sterol ratios to enhance their ability to counteract pathogen attacks [31]. Relevant studies have shown that overexpression of SQS in Panax ginseng increases sterol and triterpenoid contents [32], whereas silencing SQS in Nicotiana benthamiana reduces host resistance to Pseudomonas syringae and Xanthomonas campestris [29]. Collectively, these findings indicate that genes of the SQS_PSY family are involved in regulating plant resistance to biotic and abiotic stresses.
Soybean [Glycine max (L.) Merr.] is a major oil crop cultivated and consumed worldwide. Widely acknowledged as one of the most versatile crops on Earth, its planting area has increased more significantly than that of any other major crop [33]. As one of the five most important food crops globally [34], soybean production, like that of other economically important crops, is challenged by various abiotic and biotic stresses, including adverse weather conditions, diseases, pests, weeds, and variations in soil quality [35]. Accordingly, addressing these challenges is crucial for ensuring the profitability of soybean production and safeguarding global food and feed security. Nevertheless, the role of the soybean SQS_PSY family in regulating resistance to Phytophthora remains unclear.
Previously, research investigations concerning the SQS and PSY genes have been documented in various species, including Arabidopsis thaliana [23,36], Medicago sativa [37], and Spinacia oleracea [38]. However, there has been a paucity of studies focusing on the soybean, especially with respect to its resistance to P. sojae. The objective of this study is to identify SQS_PSY family genes at the genome-wide level using bioinformatics approaches, and to systematically analyze their chromosomal distribution, the physicochemical properties of encoded proteins, phylogenetic relationships, and conserved protein motifs and structures, as well as cis-acting elements. To further explore the function of SQS_PSY family members in soybean resistance to Phytophthora root rot, previously identified resistant and susceptible soybean varieties were inoculated with Phytophthora, followed by transcriptome sequencing to investigate the expression patterns of SQS_PSY genes during Phytophthora infection. The transcriptome results were subsequently validated via qRT-PCR. Finally, an expression vector was constructed and transformed into soybean hairy roots to elucidate the specific role of SQS_PSY genes in soybean resistance to Phytophthora root rot. This study aims to lay a foundation for clarifying the biological function of the SQS_PSY family in soybeans.
2. Materials and Methods
2.1. Identification and Chromosome Mapping of Soybean SQS_PSY Family Gene
All genomic sequences and gene structure annotation files utilized in this study were retrieved from the Ensembl database (http://plants.ensembl.org/index.html) (accessed on 16 December 2025). After acquiring the SQS_PSY protein domain (PF00494) from the Pfam database (http://pfam.xfam.org/) (accessed on 16 December 2025), a Hidden Markov Model (HMM) was constructed, and the HMM search function integrated in TBtools-II software v2.390 was employed to search for candidate genes. Subsequently, BLAST alignment against the entire soybean genome was performed using Arabidopsis SQS and PSY protein sequences as references to verify and differentiate SQS and PSY genes. The preservation of intact functional domains within the conserved SQS_PSY regions was further substantiated through the utilization of the Pfam database, thereby guaranteeing the accuracy and reliability of gene functional annotation. Additionally, the chromosome locations of the identified genes were mapped via the visualization module of TBtools-II.
2.2. Physicochemical Properties Analysis and Subcellular Localization of the Soybean SQS_PSY Family
TBtools-II software was used for bioinformatics analysis of the soybean SQS_PSY family gene, which included calculating key physicochemical properties such as amino acid composition, molecular weight, isoelectric point, and instability coefficient. Furthermore, the subcellular localization results of all identified soybean SQS_PSY members were predicted in silico using the online tool WOLFPSORT (https://wolfpsort.Hgc.jp/) (accessed on 17 December 2025). The raw WoLF PSORT output is provided in the Table S1.
2.3. Phylogenetic Analysis and Collinearity Analysis of the Soybean SQS_PSY Family
Protein sequences from Glycine max (Glycine_max_v2.1), Arabidopsis thaliana (TAIR10), Glycine soja (ASM419377v2), Oryza sativa (IRGSP-1.0), Triticum aestivum (IWGSC.62), and Zea mays (Zm-B73-REFERENCE-NAM-5.0.62) were aligned using ClustalW. Subsequently, a Neighbor-Joining (NJ) phylogenetic tree was constructed with MEGA6 software. Evolutionary distances were calculated employing the p-distance method, where 1000 bootstrap replicates were set via the self-boot function, and all other parameters were kept at their default values. The exported Newick (nwk) format files were beautified through the online website ITOL (https://itol.embl.de/) (accessed on 21 December 2025). The OneStepMCScanX function of TBtools-II was used to conduct collinearity analysis on the soybean genome. The collinearity relationship of the soybean SQS_PSY family genes were visualized using TBtools-II software.
2.4. Analysis of Conserved Structural Domains and Gene Structures of the Soybean SQS_PSY Family
Conserved motifs among the 12 soybean SQS_PSY family gene members were predicted and analyzed using the online tool MEME (https://meme-suite.org/meme/doc/overview.html?mantype=web) (accessed on 22 December 2025), with the number of motifs set to 10 and other parameters maintained at their default settings. Subsequently, the CD-Search function of the NCBI database (https://www.ncbi.nlm.nih.gov/) (accessed on 22 December 2025) was utilized to identify SQS_PSY domains, and TBtools-II software was employed to visualize the structural distribution of these 12 soybean SQS_PSY gene members.
2.5. Analysis of Cis-Acting Elements of the Soybean SQS_PSY Gene Promoters
The 3000 bp promoter regions upstream of the transcription start site of the SQS_PSY family genes were batch-extracted using TBtools-II software. Thereafter, the online prediction tool PlantCare (http://bioinformatics.psb.Ugent.be/webtools/plantcare/html/) (accessed on 27 December 2025) was applied to predict and analyze cis-acting elements of the soybean SQS_PSY gene promoter sequence (Table S2). Promoters with unique functional elements were screened out, and their cis-acting element distribution was plotted using TBtools-II software.
2.6. Inoculation of Plant Materials and Phytophthora
In the present study, soybean chromosome segment substitution lines (CSSLs) (ZYD0006 x SN14), which had been previously identified to exhibit extreme resistance (R24, R206) and susceptibility (R158) to Phytophthora root rot, were used as experimental materials. Soybean seeds were surface-sterilized via chlorine gas fumigation, soaked in sterile water after sterilization, and cultured in the dark for 3 days to induce yellowed seedlings. The Phytophthora strain Shuguang 30 was propagated on V8 solid medium for 5–7 days. Agar blocks with a diameter of 1.5 cm and uniform size were taken from the edge of the colony with a punch. Soybean seedlings were inoculated with Phytophthora spp. using the hypocotyl wound inoculation method [22]. Specifically, the experimental group received agar blocks containing P. sojae, whereas the control group was inoculated with agar blocks without the pathogen. These seedlings were cultured under a 16 h light/8-h dark photoperiod, and samples were collected at 12 h and 36 h after inoculation [39]. For each time point, three biological replicates were established, with each replicate comprising hypocotyl tissues pooled from three seedlings for subsequent RNA-seq.
2.7. RNA-Seq
Total RNA was isolated from soybean (Glycine max) hypocotyl tissues using TRIzol reagent (Invitrogen, Carlsbad, CA, USA) in strict accordance with the manufacturer’s guidelines. The quality and integrity of the extracted RNA were assessed using a NanoDrop 2000 spectrophotometer (Thermo Fisher Scientific, Waltham, MA, USA) and an Agilent 2100 Bioanalyzer (Agilent Technologies, Santa Clara, CA, USA). Only samples exhibiting an RNA Integrity Number (RIN) of ≥7.0 and an OD260/280 ratio within the range of 1.8–2.2 were selected for library construction. mRNA was enriched from total RNA using oligo (dT) magnetic beads and fragmented into approximately 200 bp fragments. Sequencing libraries were constructed using the MGIEasy RNA Library Prep Kit (MGI Tech, Shenzhen, China) following the MajorBio standard protocol. The quality of the constructed libraries was validated using the Agilent 2100 Bioanalyzer and quantified by qPCR. Qualified libraries were sequenced on the MGI DNBSEQ-T7/Illumina NovaSeq X Plus platform (San Diego, CA, USA) to generate 150 bp paired-end reads with a sequencing depth of ≥6 Gb per sample. The reproducibility of transcriptome data among biological replicates was confirmed through Pearson correlation coefficient analysis, with all pairwise correlation coefficients (r) exceeding 0.9, indicating low inter-replicate variability and high reliability of the sequencing data. Williams82 was used as the reference genome, and the FPKM values (Table S3) were used to quantify gene expression levels. Gene function annotations were carried out against NR, Swissprot, PFAM, KEGG, GO, and other databases. Differentially expressed genes (DEGs) were screened under the criteria of p-value < 0.05 and |log2FC| ≥ 1, where log2FC = log2 (treatment FPKM/control FPKM). Heatmaps depicting the gene expression patterns of the SQS_PSY gene family were generated and visualized with TBtools software, with the construction being grounded on the quantified gene expression values (Table S3). Transcript sequencing was performed by Shanghai Meiji Biomedical Technology Co., Ltd (Shanghai, China).
2.8. Construction of Overexpression Vector and Transformation of Soybean Hairy Roots
In this study, the pSOY1 vector carrying the strong constitutive CaMV 35S promoter was used to construct an overexpression vector for the GmSQS1 gene, thereby enabling constitutive high-level expression of the gene in plants. The pSOY1-GmSQS1 (Figure S1) construct and the empty vector pSOY1-GFP were transformed into Agrobacterium rhizogenes strain K599. to plasmid into the cotyledons of DN50 soybean generate transgenic soybean hairy roots. Hairy roots of genetically modified soybeans were grown on rooting medium supplemented with antibiotics. After 14 days, a handheld ultraviolet light was used to illuminate the transgenic hairy roots to identify GFP-positive hairy roots based on the green fluorescence signal, and non-transgenic roots were eliminated. Positive transgenic hairy roots with similar lengths and sizes were selected for Phytophthora inoculation [40]. For the infection assay, soybean hairy roots were inoculated with P. sojae by placing mycelial plugs, excised from the edge of 7-day-old colonies grown on 10% V8 agar medium, with the mycelium-side down on the surface of 14-day-old hairy roots. Subsequently, the inoculated roots were incubated at 25 °C in the dark under high humidity conditions for 48 h prior to disease assessment [22]. The experiment was conducted with three biological replicates, each comprising ten transgenic hairy roots.
2.9. RNA Extraction and Gene Expression Analysis
Total RNA was extracted from samples via the Trizol method, and cDNA was synthesized using the Kangwei HiFiScript cDNA Synthesis Kit. The reaction mixture was subjected to qRT-PCR using 2 × SYBR Green qPCR Mix on a Roche LightCycler480 real-time detection system. Three biological replicates were performed for each sample. The relative expression of the target gene was calculated using the 2−ΔΔCt method. Primers for qRT-PCR (Tables S4 and S5) were designed using the Primer-BLAST tool on the NCBI website (https://www.ncbi.nlm.nih.gov/tools/primer-blast/) (accessed on 28 December 2025). Specifically, PsActin (VMD GeneID: 108986) was used as the gene for detecting Phytophthora biomass, and the soybean gene GmCYP2 served as the reference gene [22]. Relative expression levels were normalized to the uninoculated control and PsActin.
2.10. Data Analysis
Statistical analysis of experimental data (Tables S6 and S7) was performed using SAS 9.2. The analysis of differences between the two samples was conducted using Student’s t-test.
3. Result
3.1. Identification and Chromosome Mapping of the Soybean SQS_PSY Family Gene
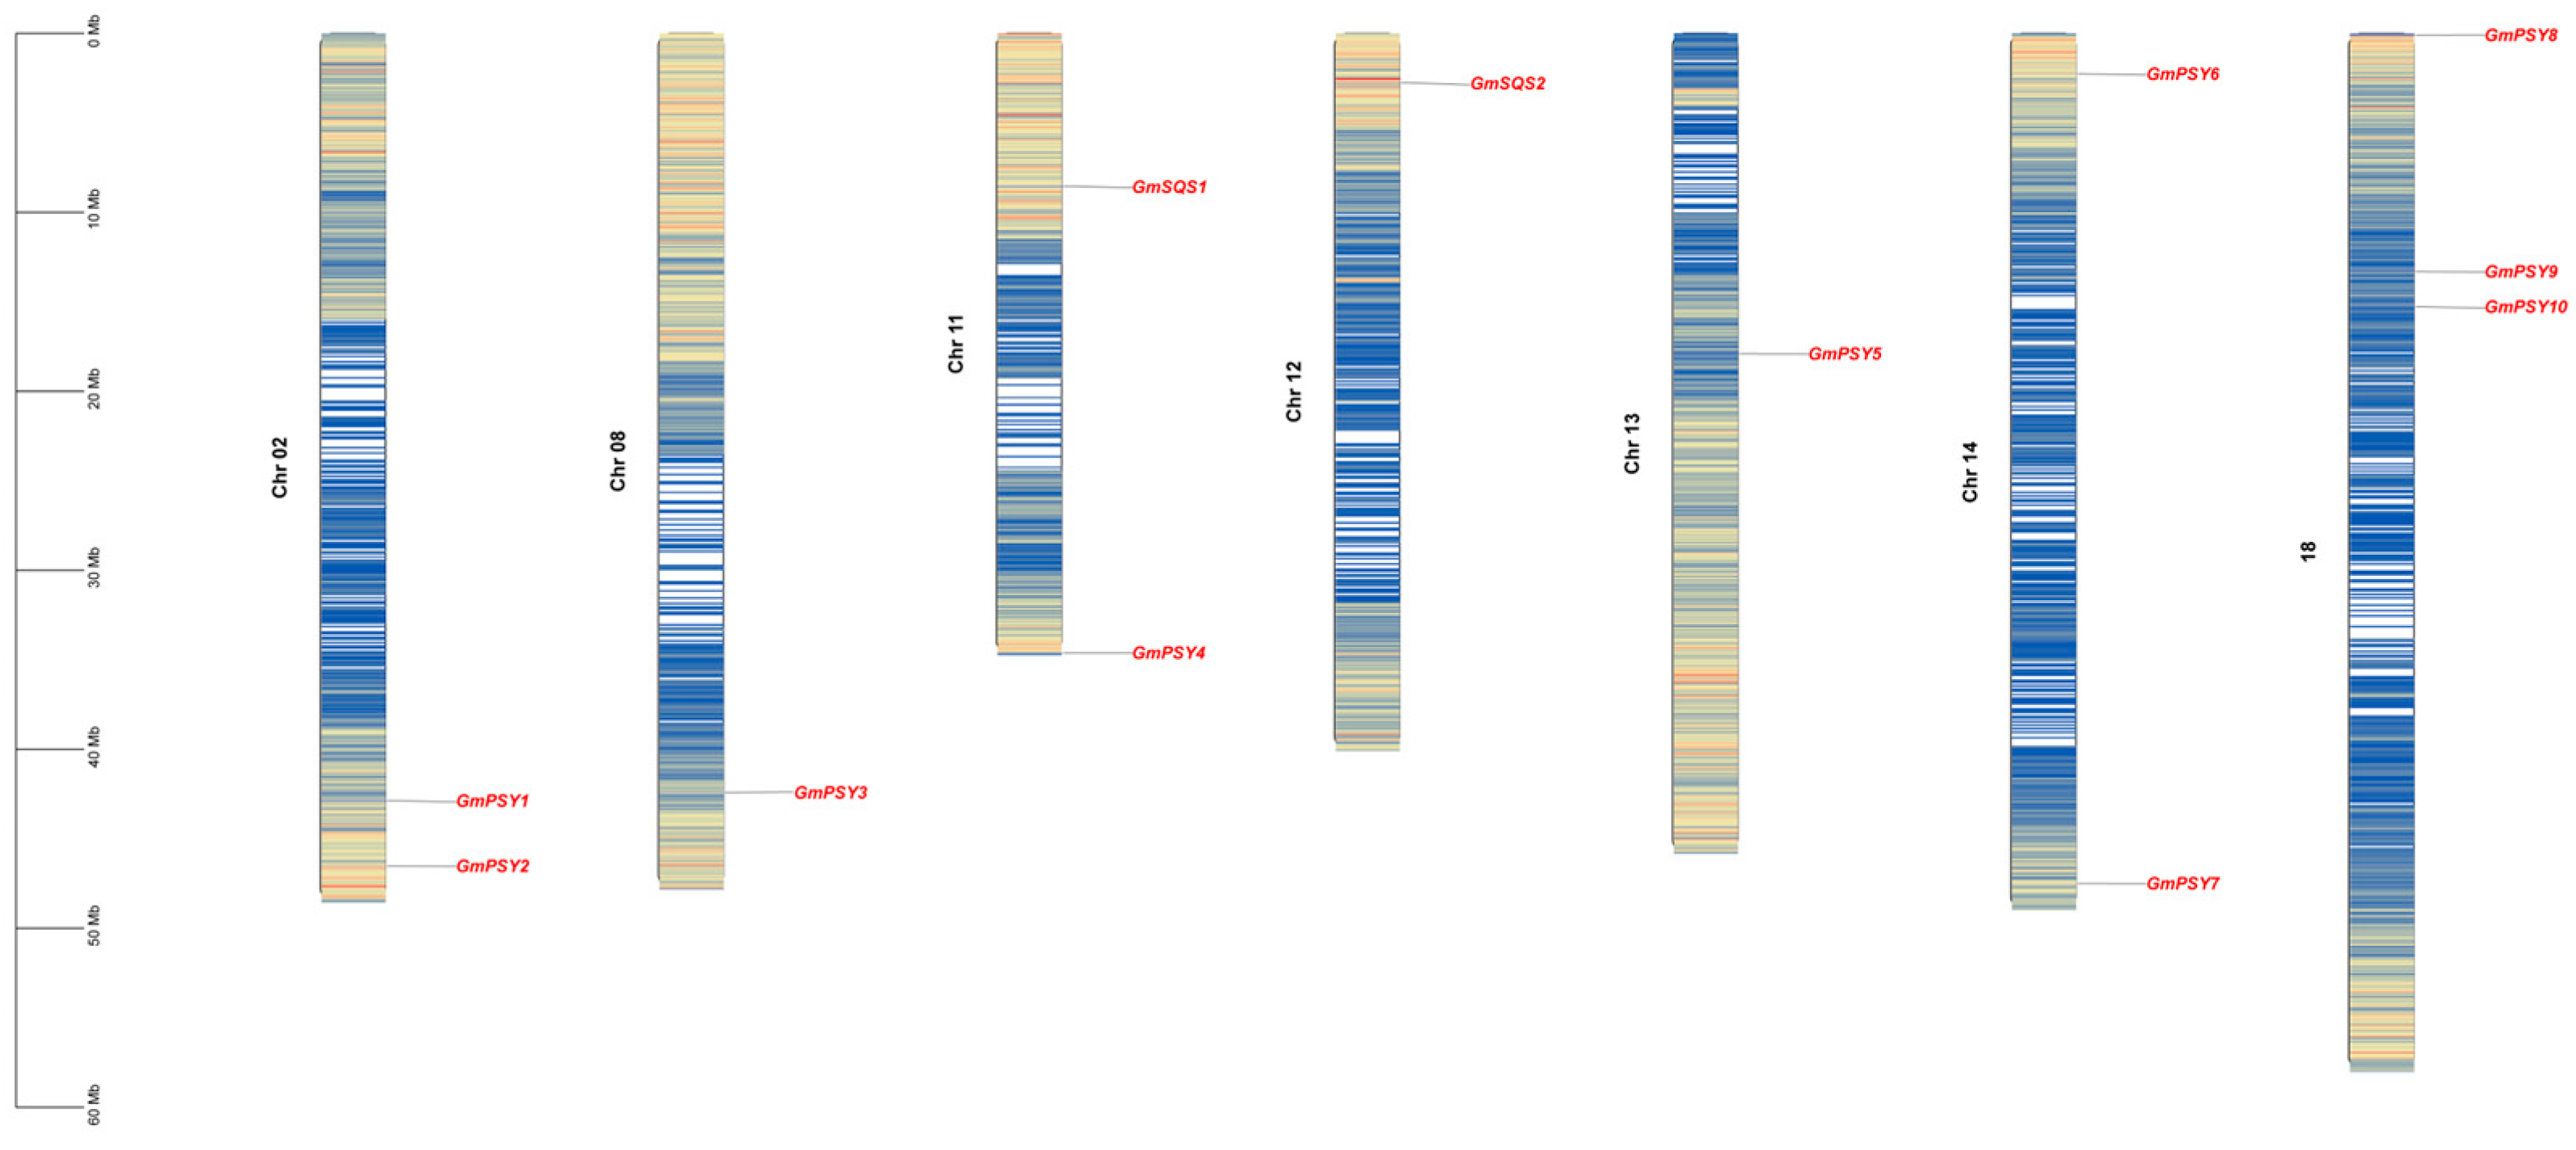
Based on soybean genomic data, a total of 12 SQS_PSY family genes were identified and mapped to the soybean genome, which were named GmSQS1, GmSQS2, and GmPSY1–GmPSY10 sequentially according to their chromosomal locations. These 12 genes are distributed on chromosomes 2, 2, 8, 11, 12, 13, 14, 18, 18, and 18, respectively. Specifically, GmPSY1 and GmPSY2 are localized on chromosome 2; GmSQS1 and GmPSY4 are located on chromosome 11; GmPSY8, GmPSY9, and GmPSY10 are clustered on chromosome 18 (Figure 1).
Figure 1.
Chromosomal distribution of SQS_PSY genes in soybean. The scale on the left indicates the length of the chromosomes. The bar graph represents the chromosomes harboring SQS_PSY genes out of the total 20 chromosomes. The corresponding gene symbols are shown on the right side of the chromosomes.
3.2. Physical and Chemical Properties Analysis and Subcellular Localization of the Large SQS_PSY Family
The physicochemical properties of the SQS_PSY genes in soybean were predicted, and the results are summarized in Table 1. The length of amino acid residues encoded by SQS_PSY family genes ranged from 68 aa to 436 aa, with GmPSY1 encoding the longest sequence (436 aa) and GmPSY10 the shortest (68 aa). The isoelectric point (pI) of the soybean SQS_PSY family proteins varied from 5.72 to 9.38. Specifically, eight GmPSY genes (GmPSY2, GmPSY3, GmPSY4, GmPSY5, GmPSY6, GmPSY7, GmPSY8, and GmPSY9) had a pI greater than 7, indicating that they are basic proteins, whereas four genes (GmPSY1, GmSQS1, GmSQS2, and GmPSY10) exhibited a pI below 7 and thus belonged to acidic proteins. Regarding the instability coefficient, all SQS_PSY family proteins except GmPSY10 had a coefficient greater than 40, indicating that these proteins are unstable in vitro. In contrast, GmPSY10 had an instability coefficient less than 40, suggesting it is a stable protein. Additionally, the SQS_PSY family genes all had negative the grand average of hydropathicity (GRAVY) values, indicating they are hydrophilic proteins.
Table 1.
Physicochemical properties and subcellular localization prediction of the SQS_PSY family gene.
Subcellular localization prediction results (Table 1) revealed that all SQS_PSY genes except GmSQS1 were localized to chloroplasts, while GmSQS1 was localized to the cytoplasm. In subcellular localization prediction analysis, GmPSY2, GmPSY3, GmPSY6, GmPSY9 and GmPSY10 exhibited high confidence (Score ≥ 10). In contrast, GmPSY1, GmSQS1, GmPSY4, GmSQS2, GmPSY5, GmPSY7, and GmPSY8 showed middle confidence (5 ≤ Score ≤ 9).
3.3. Phylogenetic Analysis and Collinearity Analysis of the SQS_PSY Family
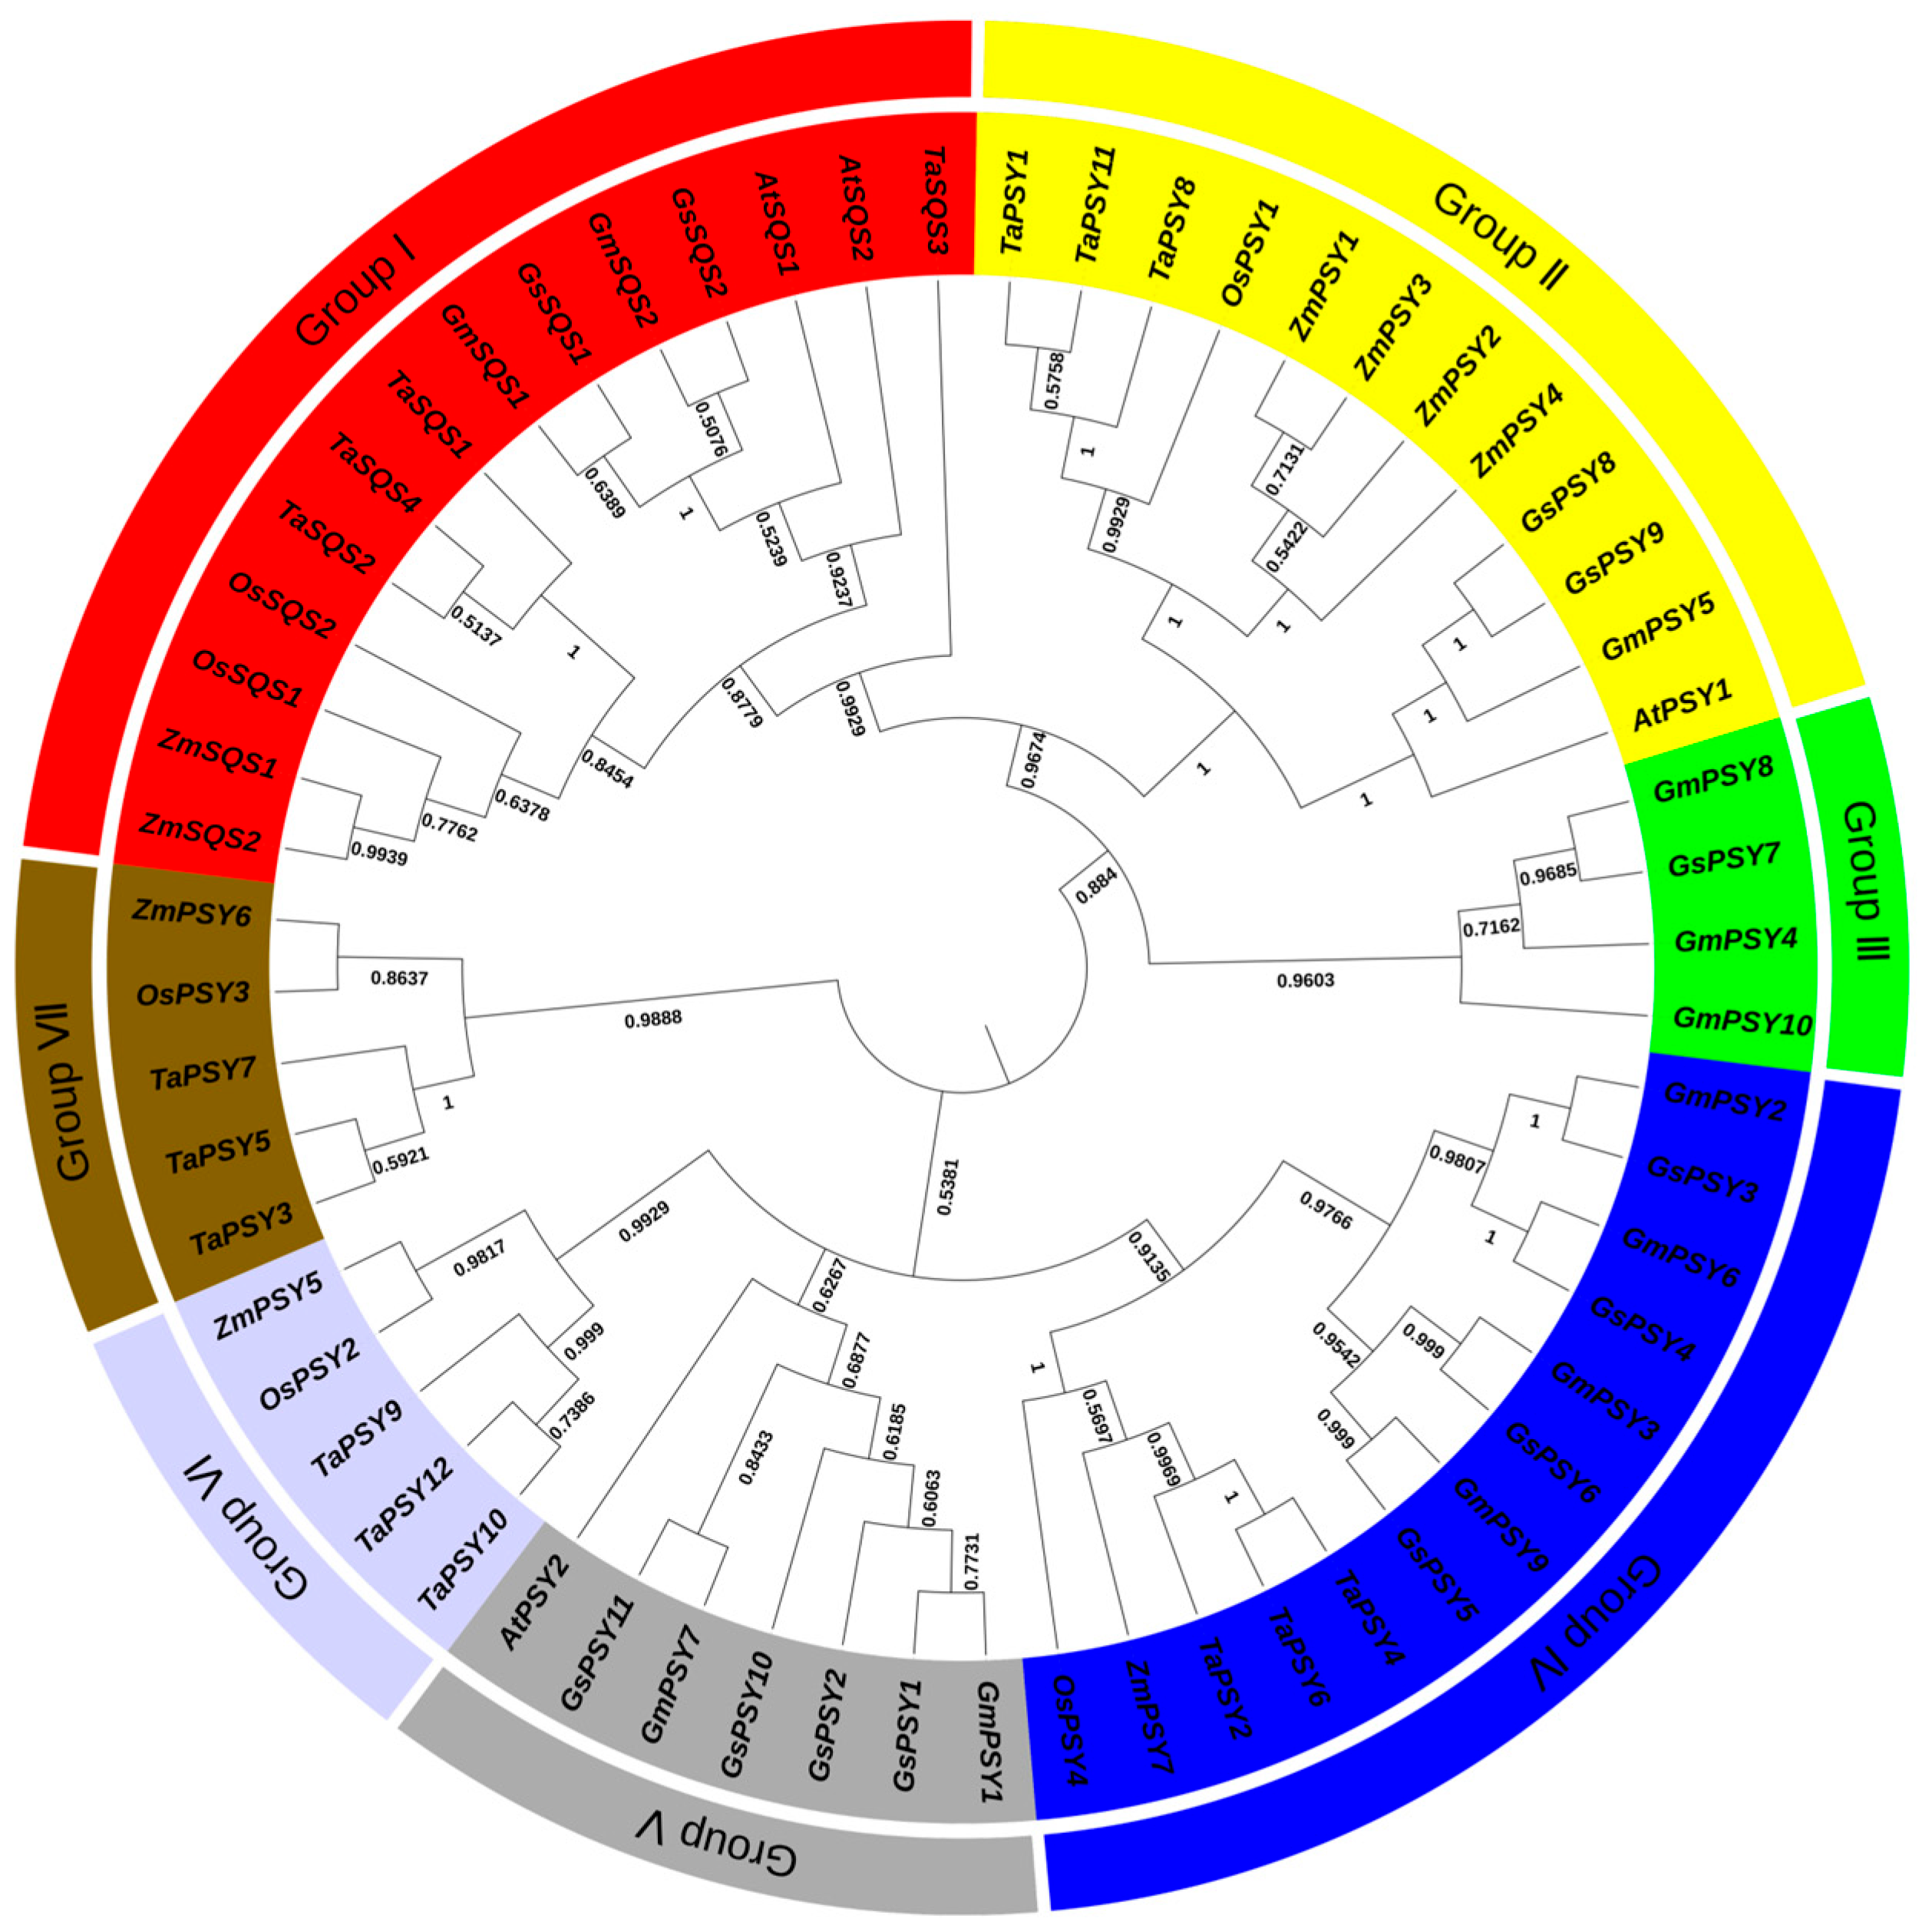
To explore the evolutionary relationships of SQS_PSY family genes, a phylogenetic tree was constructed using the SQS_PSY gene families of soybean, wild soybean, Arabidopsis, maize, wheat, and rice. As shown in Figure 2, the SQS_PSY genes from all tested species were clustered into seven subfamilies (Groups I–VII). Specifically, Group I contained 14 SQS genes from various species, including two GmSQS genes; these GmSQS genes clustered closely with SQS genes from dicotyledonous plants (e.g., AtSQS and GsSQS), whereas SQS genes from monocotyledonous species formed a distinct sub-clade within this group. Group II included 12 PSY genes across species, with 1 GmPSY gene that clustered with PSY genes from dicotyledonous plants such as AtPSY and GsPSY. Group III comprised 3 GmPSY genes and 1 GsPSY gene, representing a clade unique to soybean and wild soybean. Group IV contained 13 PSY genes from multiple species, including 4 GmPSY genes that clustered together with GsPSY genes. Group V included 7 PSY genes from various species, with 2 GmPSY genes clustering with AtPSY and GsPSY genes; notably, this group exclusively contained genes from dicotyledonous plants. Both Group VI and Group VII contained 5 dicotyledonous PSY genes. Overall, the phylogenetic tree indicated that soybean SQS_PSY genes share relatively close genetic and evolutionary relationships with those from Arabidopsis and wild soybean.
Figure 2.
Phylogenetic tree of SQS_PSY family genes by species. The phylogenetic tree was generated using MEGA6 software and the Neighbor-Joining (NJ) method was applied. Branch lengths represent evolutionary divergence. Numbers at nodes indicate bootstrap support values based on 1000 replicates. The abbreviated species names are as follows: At, Arabidopsis thaliana; Gm, Glycine max; Os, Oryza sativa; Zm, Zea mays; Ta, Triticum aestivum; Gs, Glycine soja.
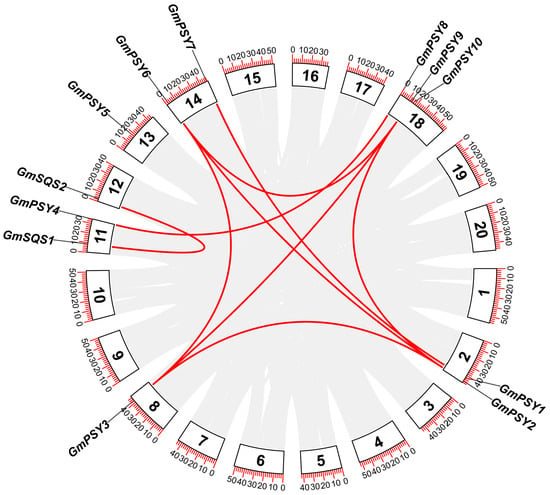
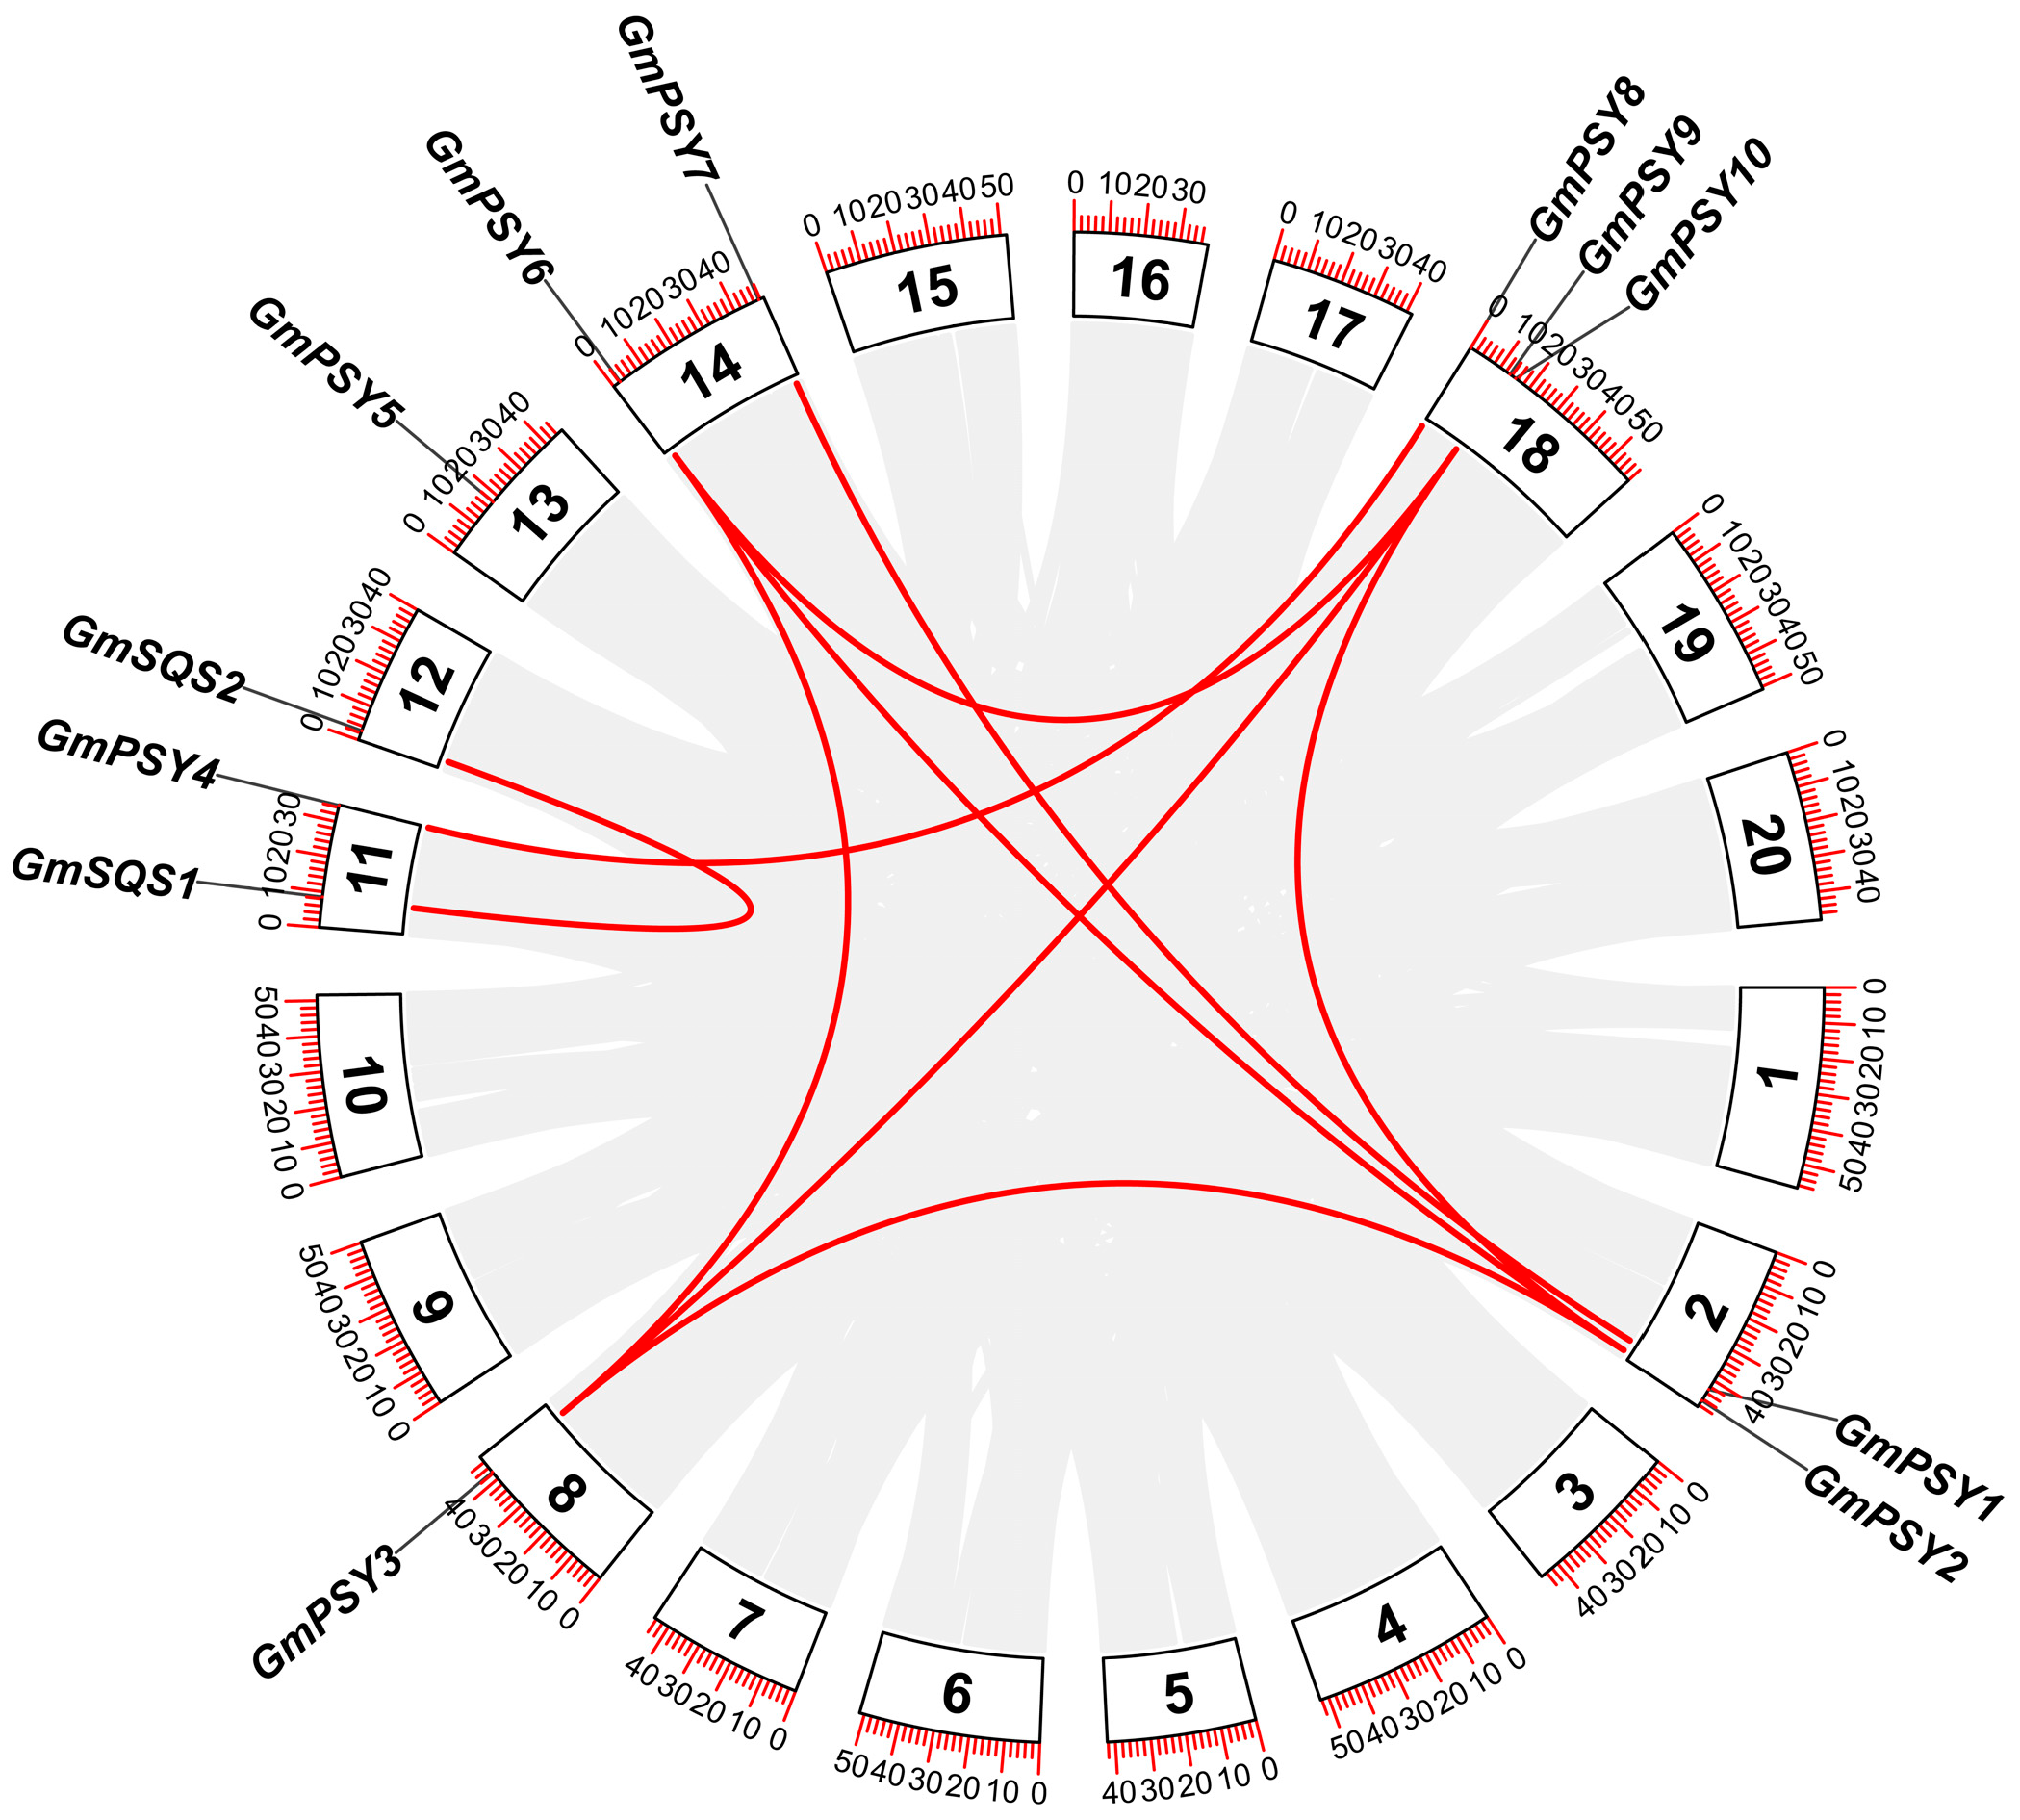
Gene replication is inherently associated with genetic evolution, and collinearity analysis was performed to characterize duplication events among soybean SQS_PSY genes. As illustrated in Figure 3, among the studied genes, GmPSY2, GmPSY3, and GmPSY6 had undergone three rounds of replication, while GmPSY1, GmPSY4, GmPSY7, GmPSY8, GmSQS1, and GmSQS2 had each undergone one round of replication.
Figure 3.
Collinearity analysis of soybean SQS_PSY family genes. Each chromosome is labeled with its corresponding number. Red lines indicate gene pairs among members of the SQS_PSY family.
3.4. Analysis of Conserved Structural Domains and Gene Structure of the Soybean SQS_PSY Family
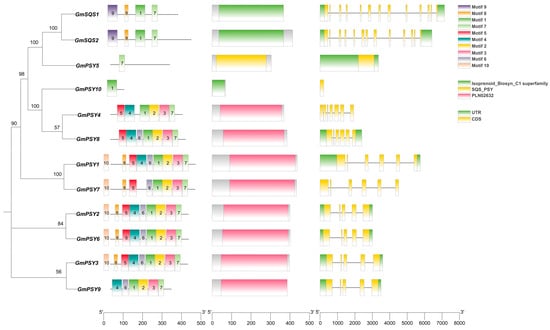
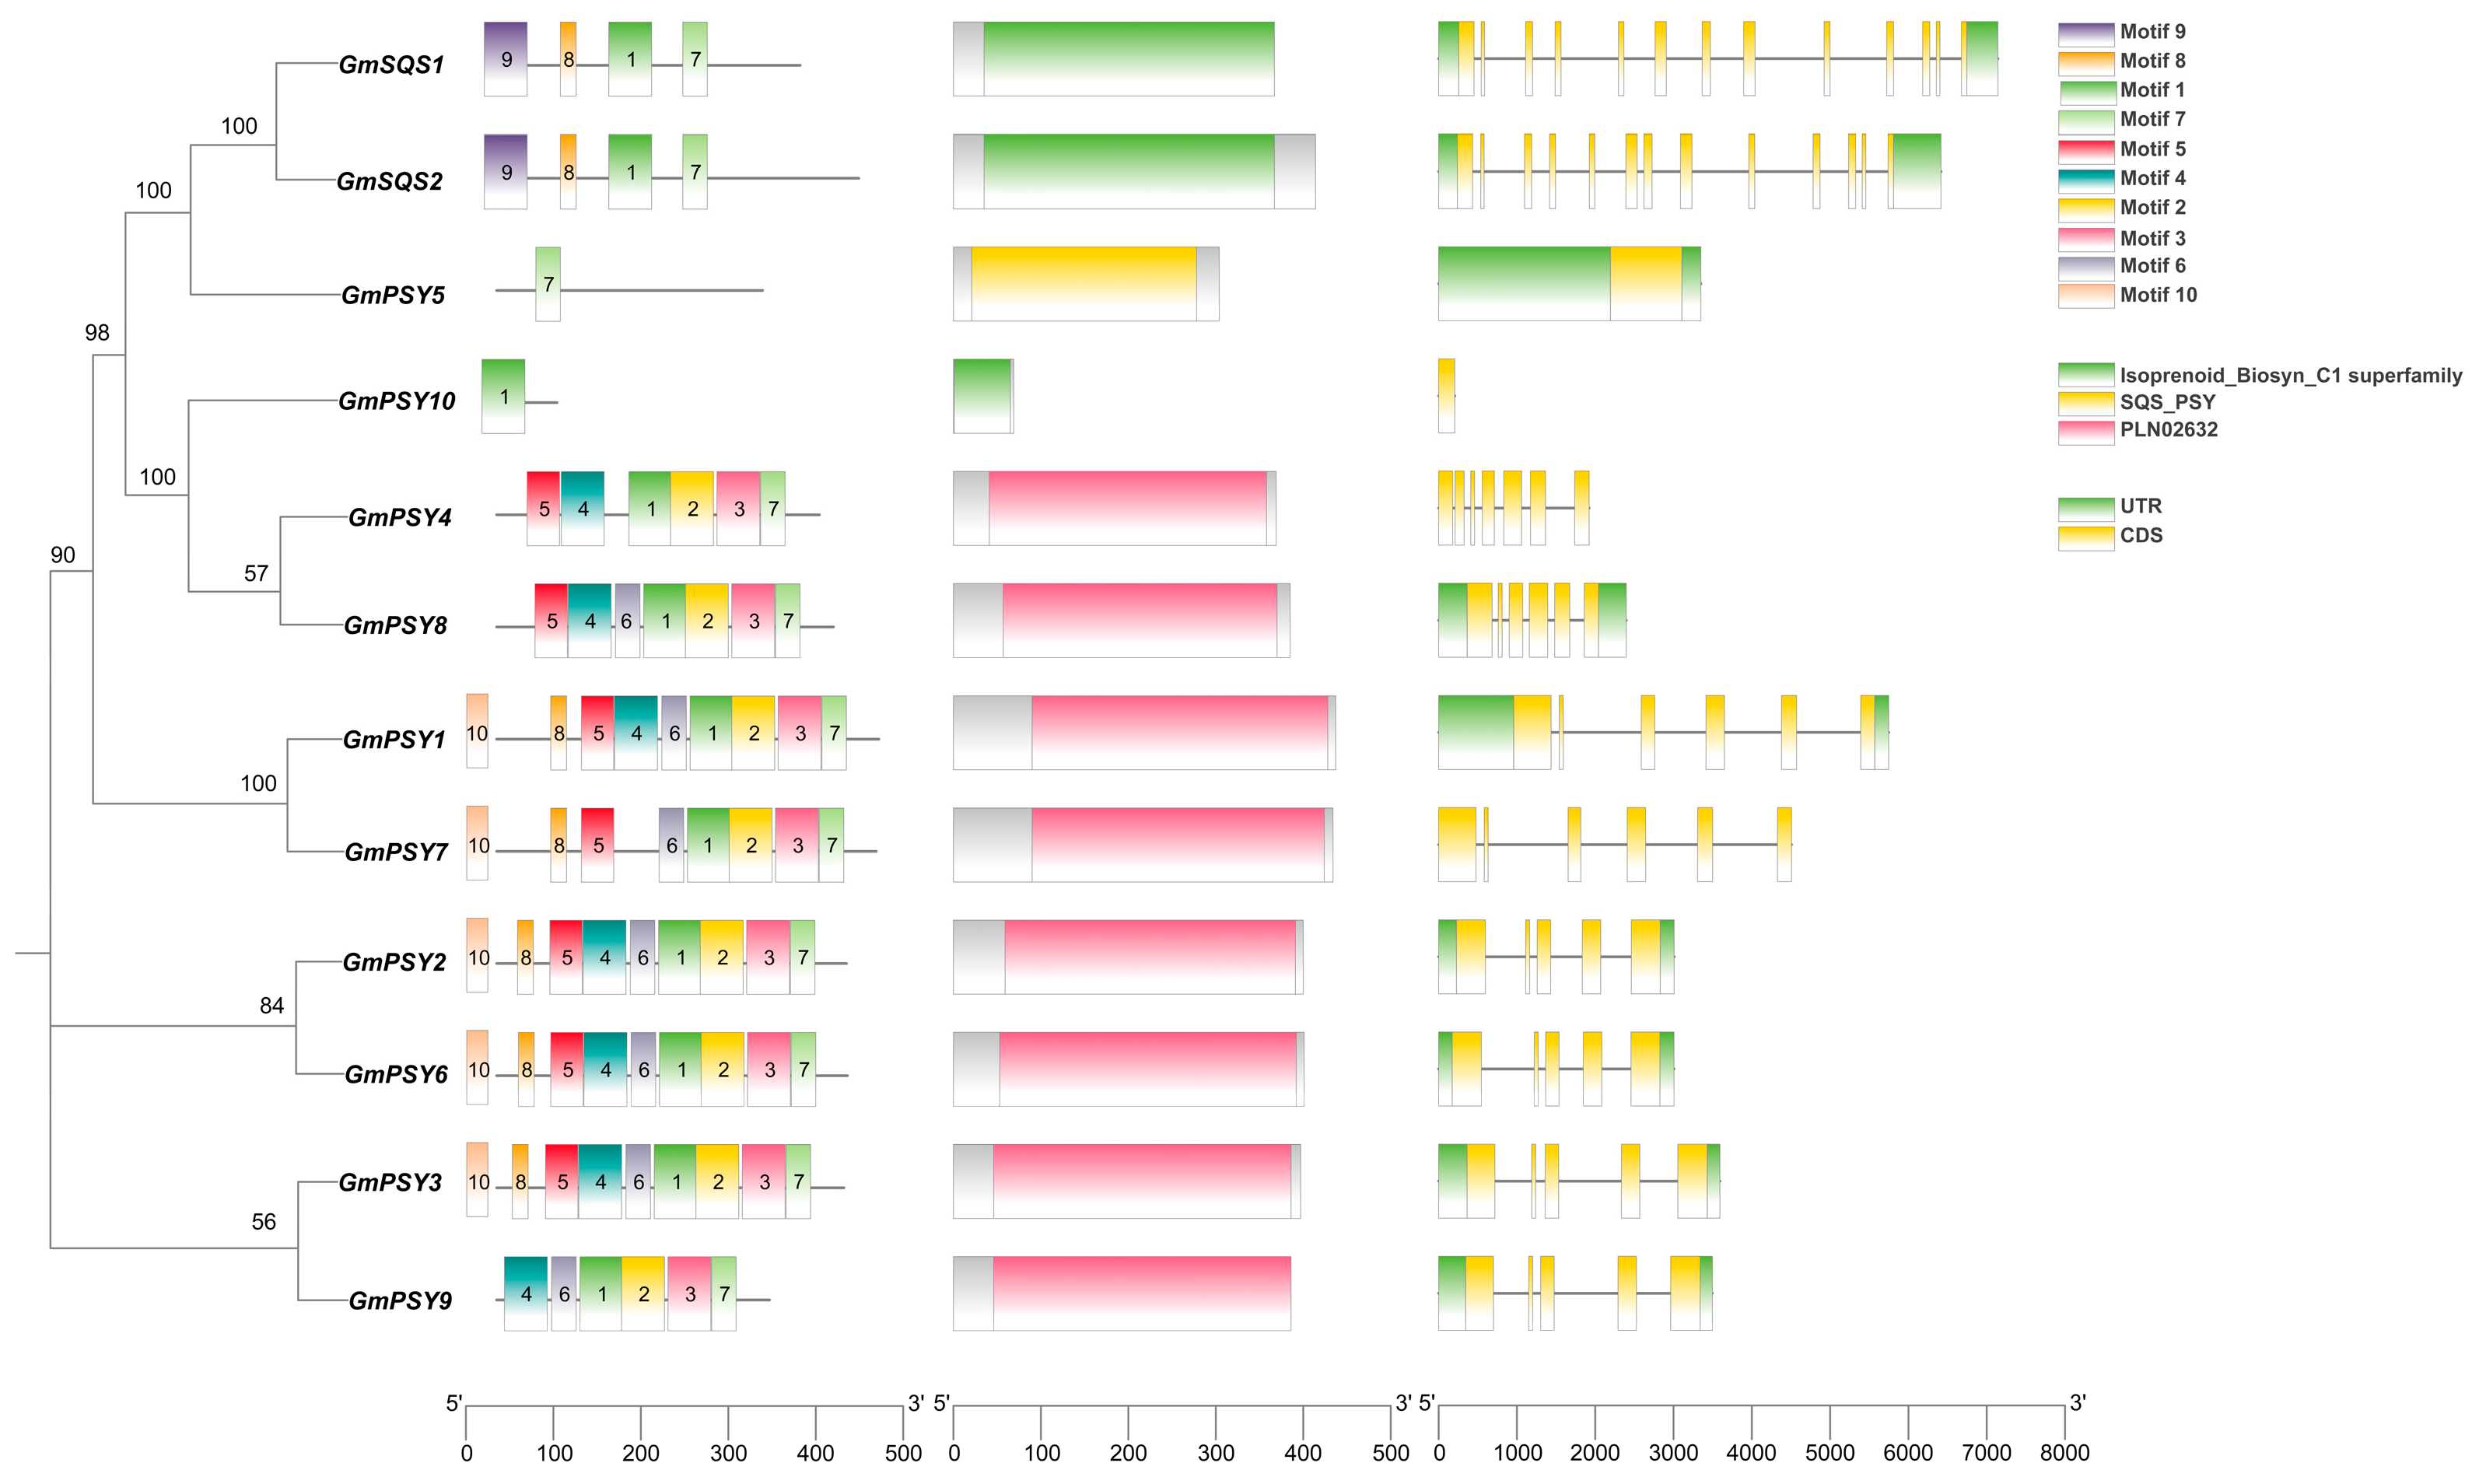
Analysis of conserved protein motifs (Figure 4) demonstrated that GmPSY1, GmPSY2, GmPSY3, GmPSY4, GmPSY6, GmPSY7, GmPSY8, and GmPSY9 contained similar types and numbers of motifs. Notably, GmPSY8 is deficient in Motif6, Motif8, and Motif10; GmPSY4 lacks Motif8 and Motif10; GmPSY9 lacks Motif5, Motif8, and Motif10. In contrast, GmPSY5 and GmPSY10 contain only one type of conserved motif, whereas GmSQS1 and GmSQS2 possess identical motifs.
Figure 4.
Gene structure. Ten different motifs are represented in various colors. Green boxes represent UTR regions, yellow boxes represent exons, and black lines represent introns. The scale bar at the bottom indicates the length of the gene sequences in base pairs (bp).
Structural domain analysis (Figure 4) indicated that the SQS_PSY family gene harbored three distinct domains: PLN02632, Isoprenoid_Biosyn_C1 superfamily, and SQS_PSY. Among these genes, GmSQS1, GmSQS2, and GmPSY10 contain the Isoprenoid_Biosyn_C1 superfamily domain; GmPSY5 contains the SQS_PSY domain; and all other GmPSY genes contain the PLN02632 domain.
Gene structure analysis (Figure 4) demonstrated that the GmSQS gene family contained multiple exons. Most GmPSY genes had 5–7 exons, whereas GmPSY5 and GmPSY10 have only one exon. Remarkably, GmSQS1 and GmSQS2 have the highest number of exons, reaching up to 13.
3.5. Analysis of Cis-Acting Elements of the Soybean SQS_PSY Gene Promoter
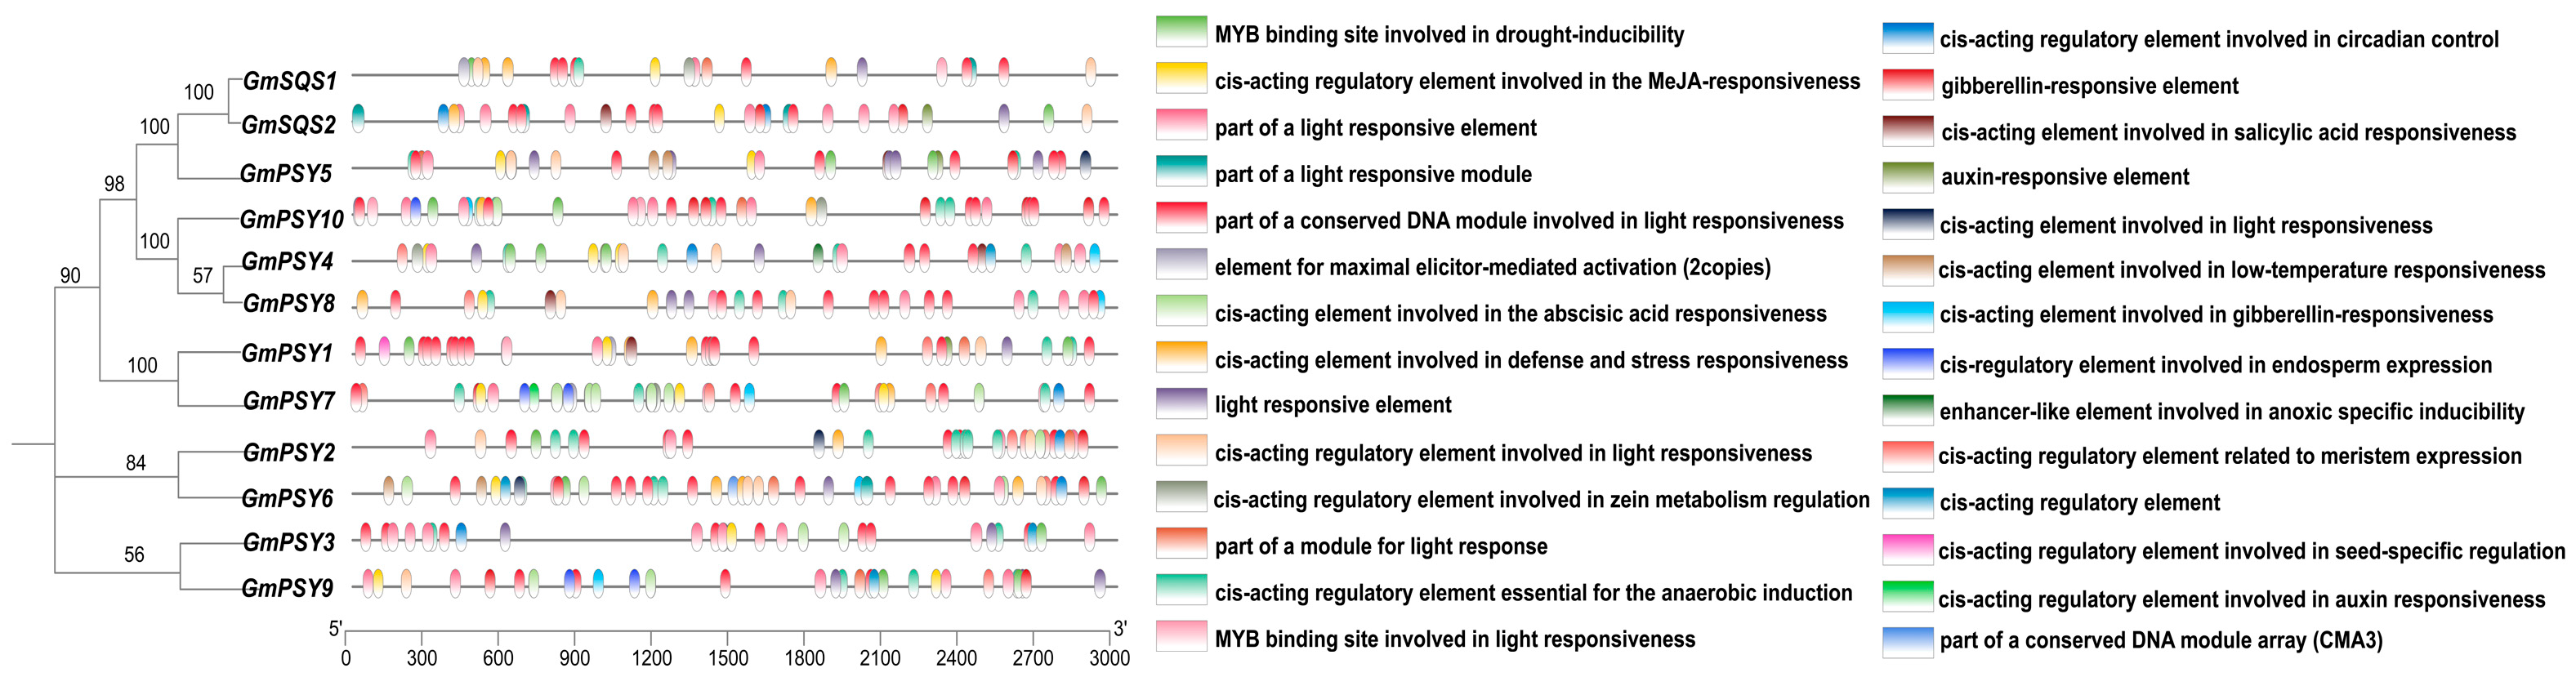
Cis-acting element analysis was conducted on the 3000 bp upstream regions of the 12 soybean SQS_PSY family genes (Figure 5). After excluding non-functional elements, a total of 437 functionally characterized elements were identified. Among these, 217 elements were associated with light responses, and 90 were involved in hormone responses, including 32 related to methyl jasmonate responses, 32 to abscisic acid responses, 21 to gibberellin responses, and 5 to auxin responses. Additionally, 37 elements were responsive to hypoxia induction, and 34 were involved in stress responses (18 linked to abiotic stresses and 16 to biotic stresses). A small number of tissue-specific elements and special physiological elements (e.g., those involved in circadian rhythm) were also detected.
Figure 5.
Analysis of cis-acting elements of the soybean SQS_PSY family genes. Different colored blocks represent various cis-acting element types.
Nearly all promoters of the SQS_PSY family genes contained light-responsive elements. Some family members harbored elements involved in stress and hormone responses, while a few contained tissue-specific elements. Collectively, these in silico prediction results indicate that the SQS_PSY family genes are predominantly subject to regulation by light signals. Additionally, stress and hormone signals are likely to act together, while tissue-specific cis-acting elements may contribute to refined and nuanced regulatory control.
3.6. Biological Stress and RNA-Seq in Soybean
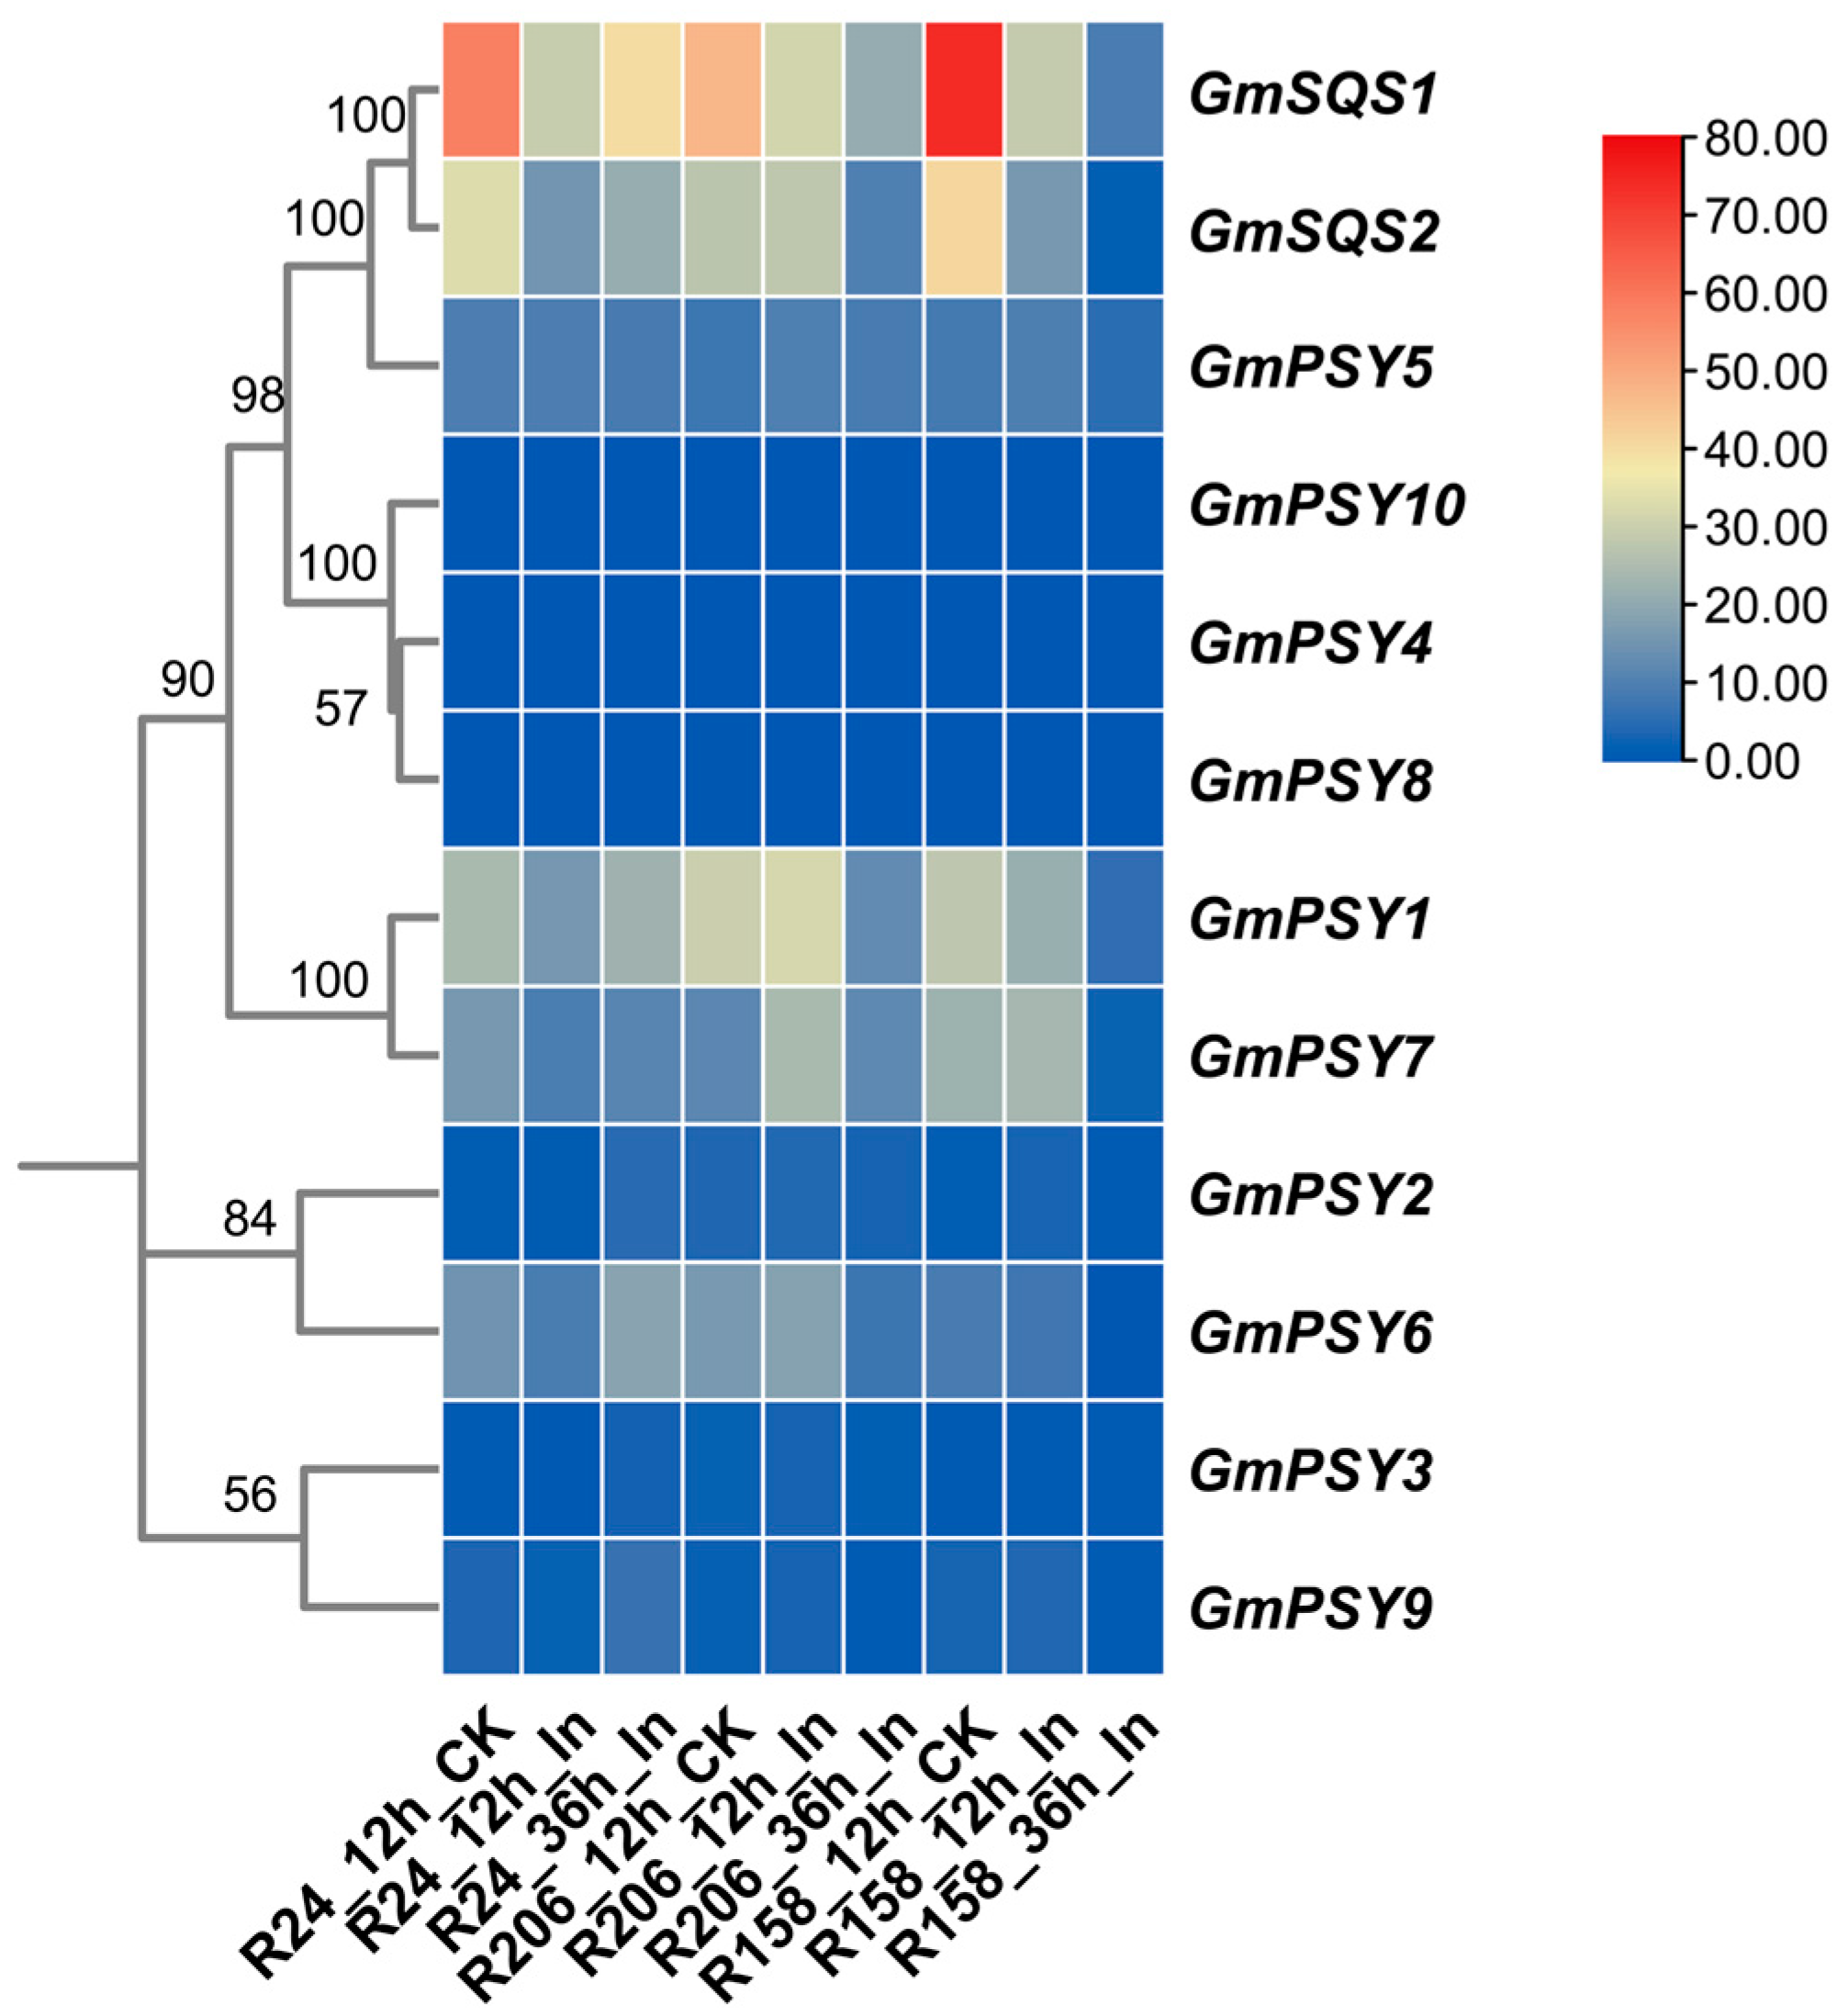
To investigate the role of the SQS_PSY family gene in resistance to Phytophthora root rot, two disease-resistant soybean varieties (R24 and R206) and one susceptible variety (R158) were inoculated with P. sojae. Hypocotyls inoculated with P. sojae were collected for transcriptome sequencing at 12 and 36 h post-inoculation (hpi). The 12 hpi time point corresponds to the early infection stage, during which the pathogen initiates penetration and the host activates early defense responses. In contrast, the 36 hpi time point corresponds to the critical colonization stage, during which hyphae spread rapidly and cause obvious lesions. By analyzing these two time points, we can systematically investigate the dynamic expression patterns of target genes during the early recognition and subsequent colonization stages of pathogen infection. As shown in Figure 6, transcriptome data revealed that the GmPSY family genes were either not expressed or exhibited low expression levels following P. sojae inoculation. Conversely, the expression of GmSQS1 and GmSQS2 was inhibited after P. sojae infection, with significant differences observed between resistant and susceptible varieties. GmSQS1 and GmSQS2 exhibited different expression dynamics in the two varieties following infection by P. sojae. Specifically, the reduction in transcript levels was less pronounced in resistant varieties compared to the susceptible variety (Table S3).
Figure 6.
Heat map of the soybean SQS_PSY family gene expression. The color key indicates fold changes (P. sojae vs. control) scaled by row, with red to blue representing upregulation to downregulation. R24, R206 and R158 are different soybean cultivars. In: Inoculated with P. sojae. CK: Control check. Hypocotyls inoculated with P. sojae were collected at 12 and 36 hpi.
3.7. Expression Profiles of the SQS_PSY Genes in Soybean Members Under Biological Stress
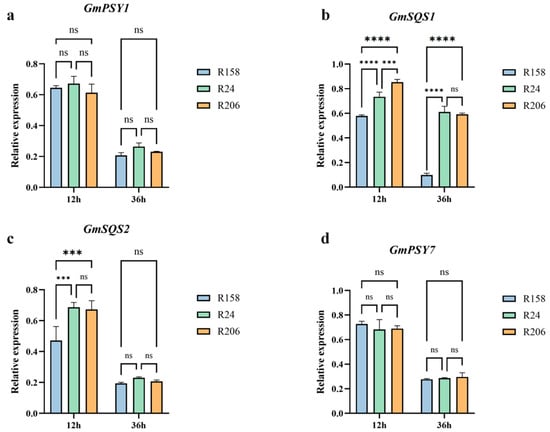
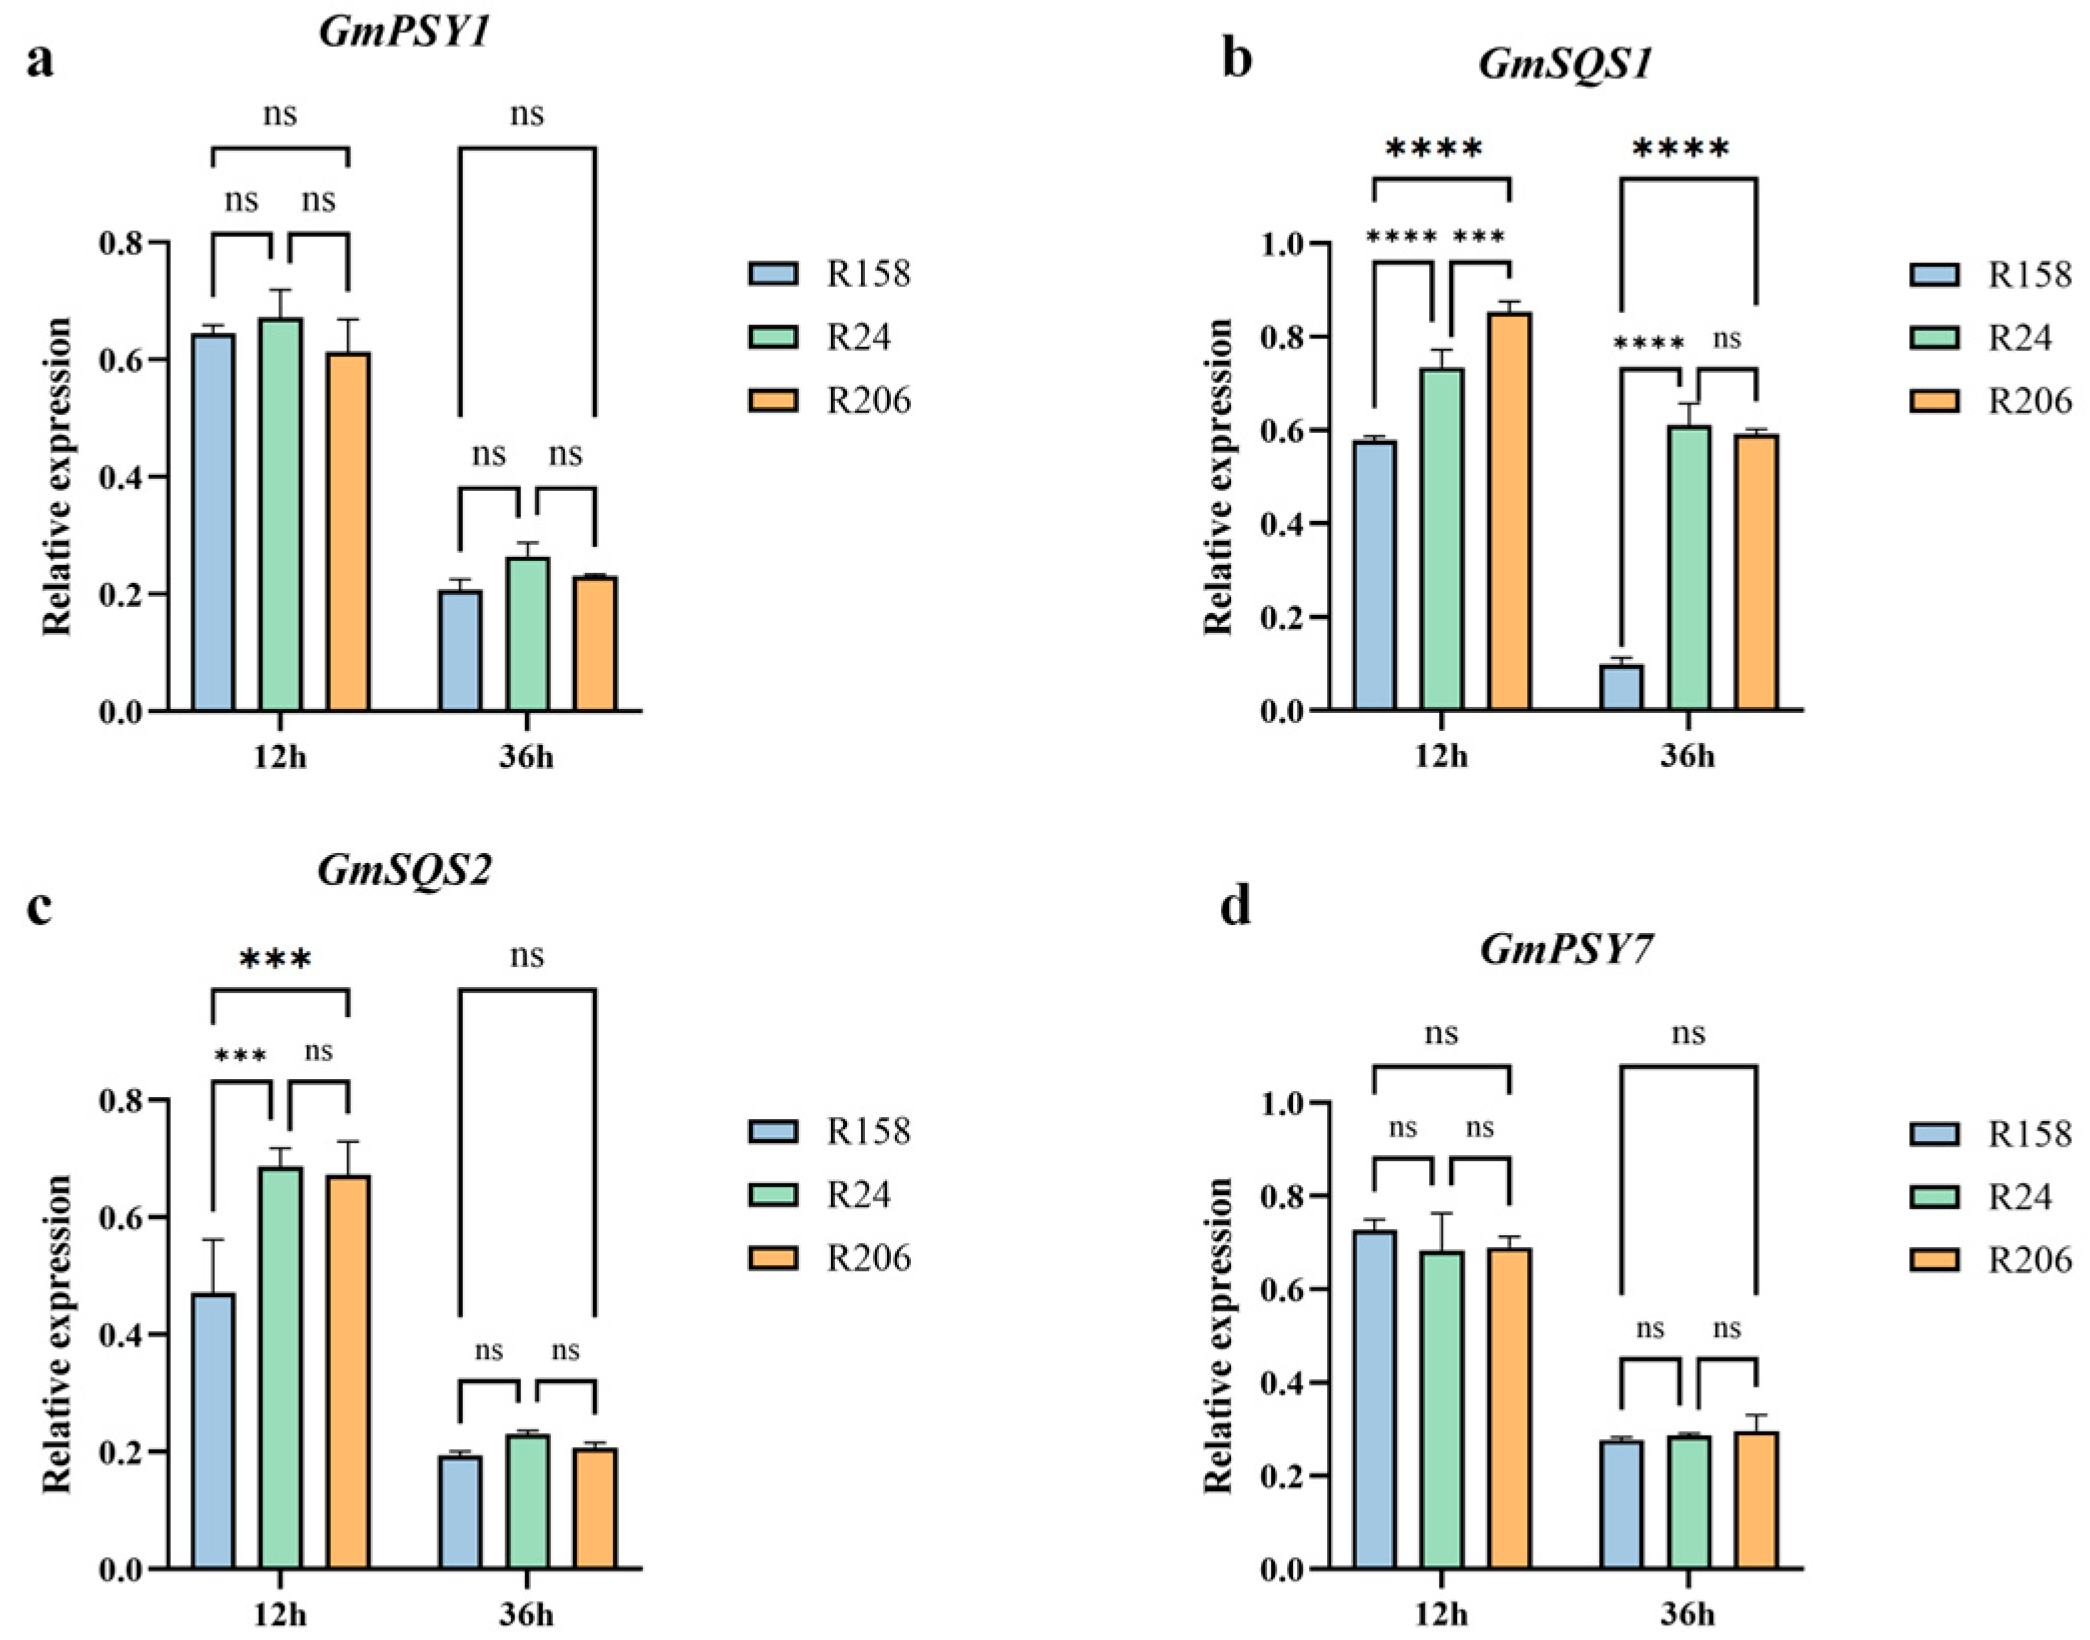
To further verify the role of GmSQS genes in P. sojae infection, qRT-PCR was used to verify the transcriptome results. Based on transcriptome data analysis, key genes were screened using the criteria of FPKM > 5 (to ensure reliable expression abundance) and significant differential expression upon pathogen inoculation. Furthermore, GmPSY1, GmPSY7, GmSQS1, and GmSQS2 were found to exhibit consistent expression trends across the two resistant varieties. The qRT-PCR results were generally consistent with those of transcriptome sequencing; however, slight discrepancies in the magnitude of expression differences were observed between the two methods, which are inherent to their distinct technical characteristics. Specifically, GmPSY1 (Figure 7a) and GmPSY7 (Figure 7d) showed no differences in expression between resistant and susceptible varieties at 12 h and 36 h after inoculation with P. sojae; GmSQS2 (Figure 7c) showed differences in expression between resistant and susceptible varieties at 12 h and no differences in expression at 36 h; GmSQS1 (Figure 7b) was differentially expressed between resistant and susceptible varieties at 12 h and 36 h. The differential expression of GmSQS1 may be the reason for the different resistance of resistant and susceptible varieties to Phytophthora root rot.
Figure 7.
Relative expression quantity of the GmPSY1, GmSQS1, GmSQS2, and GmPSY7. (a) Relative expression of GmPSY1 in resistant and susceptible varieties at 12 h and 36 h post-Phytophthora inoculation; (b) Relative expression of GmSQS1 in resistant and susceptible varieties at 12 h and 36 h post-Phytophthora inoculation; (c) Relative expression of GmSQS2 in resistant and susceptible varieties at 12 h and 36 h post-Phytophthora inoculation; (d) Relative expression of GmPSY7 in resistant and susceptible varieties at 12 hpi and 36 hpi. Data are presented as means ± SD from three biological replicates, with each replicate containing three technical replicates (n = 3 × 3 = 9). Relative expression levels were normalized to the uninoculated control and PsActin. A two-tailed Student t-test is performed; Statistical significance: ns = no significant difference; *** p < 0.001; **** p < 0.0001.
3.8. Effect of Overexpressing GmSQS1 on P. sojae Infection in Soybean Hairy Roots
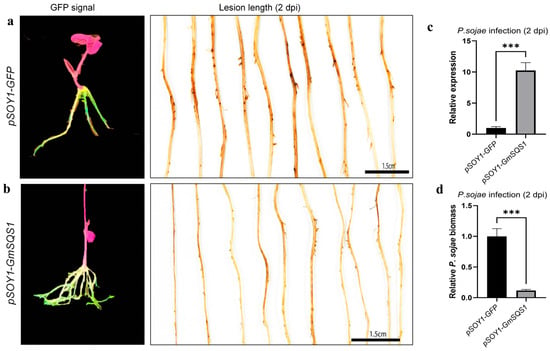
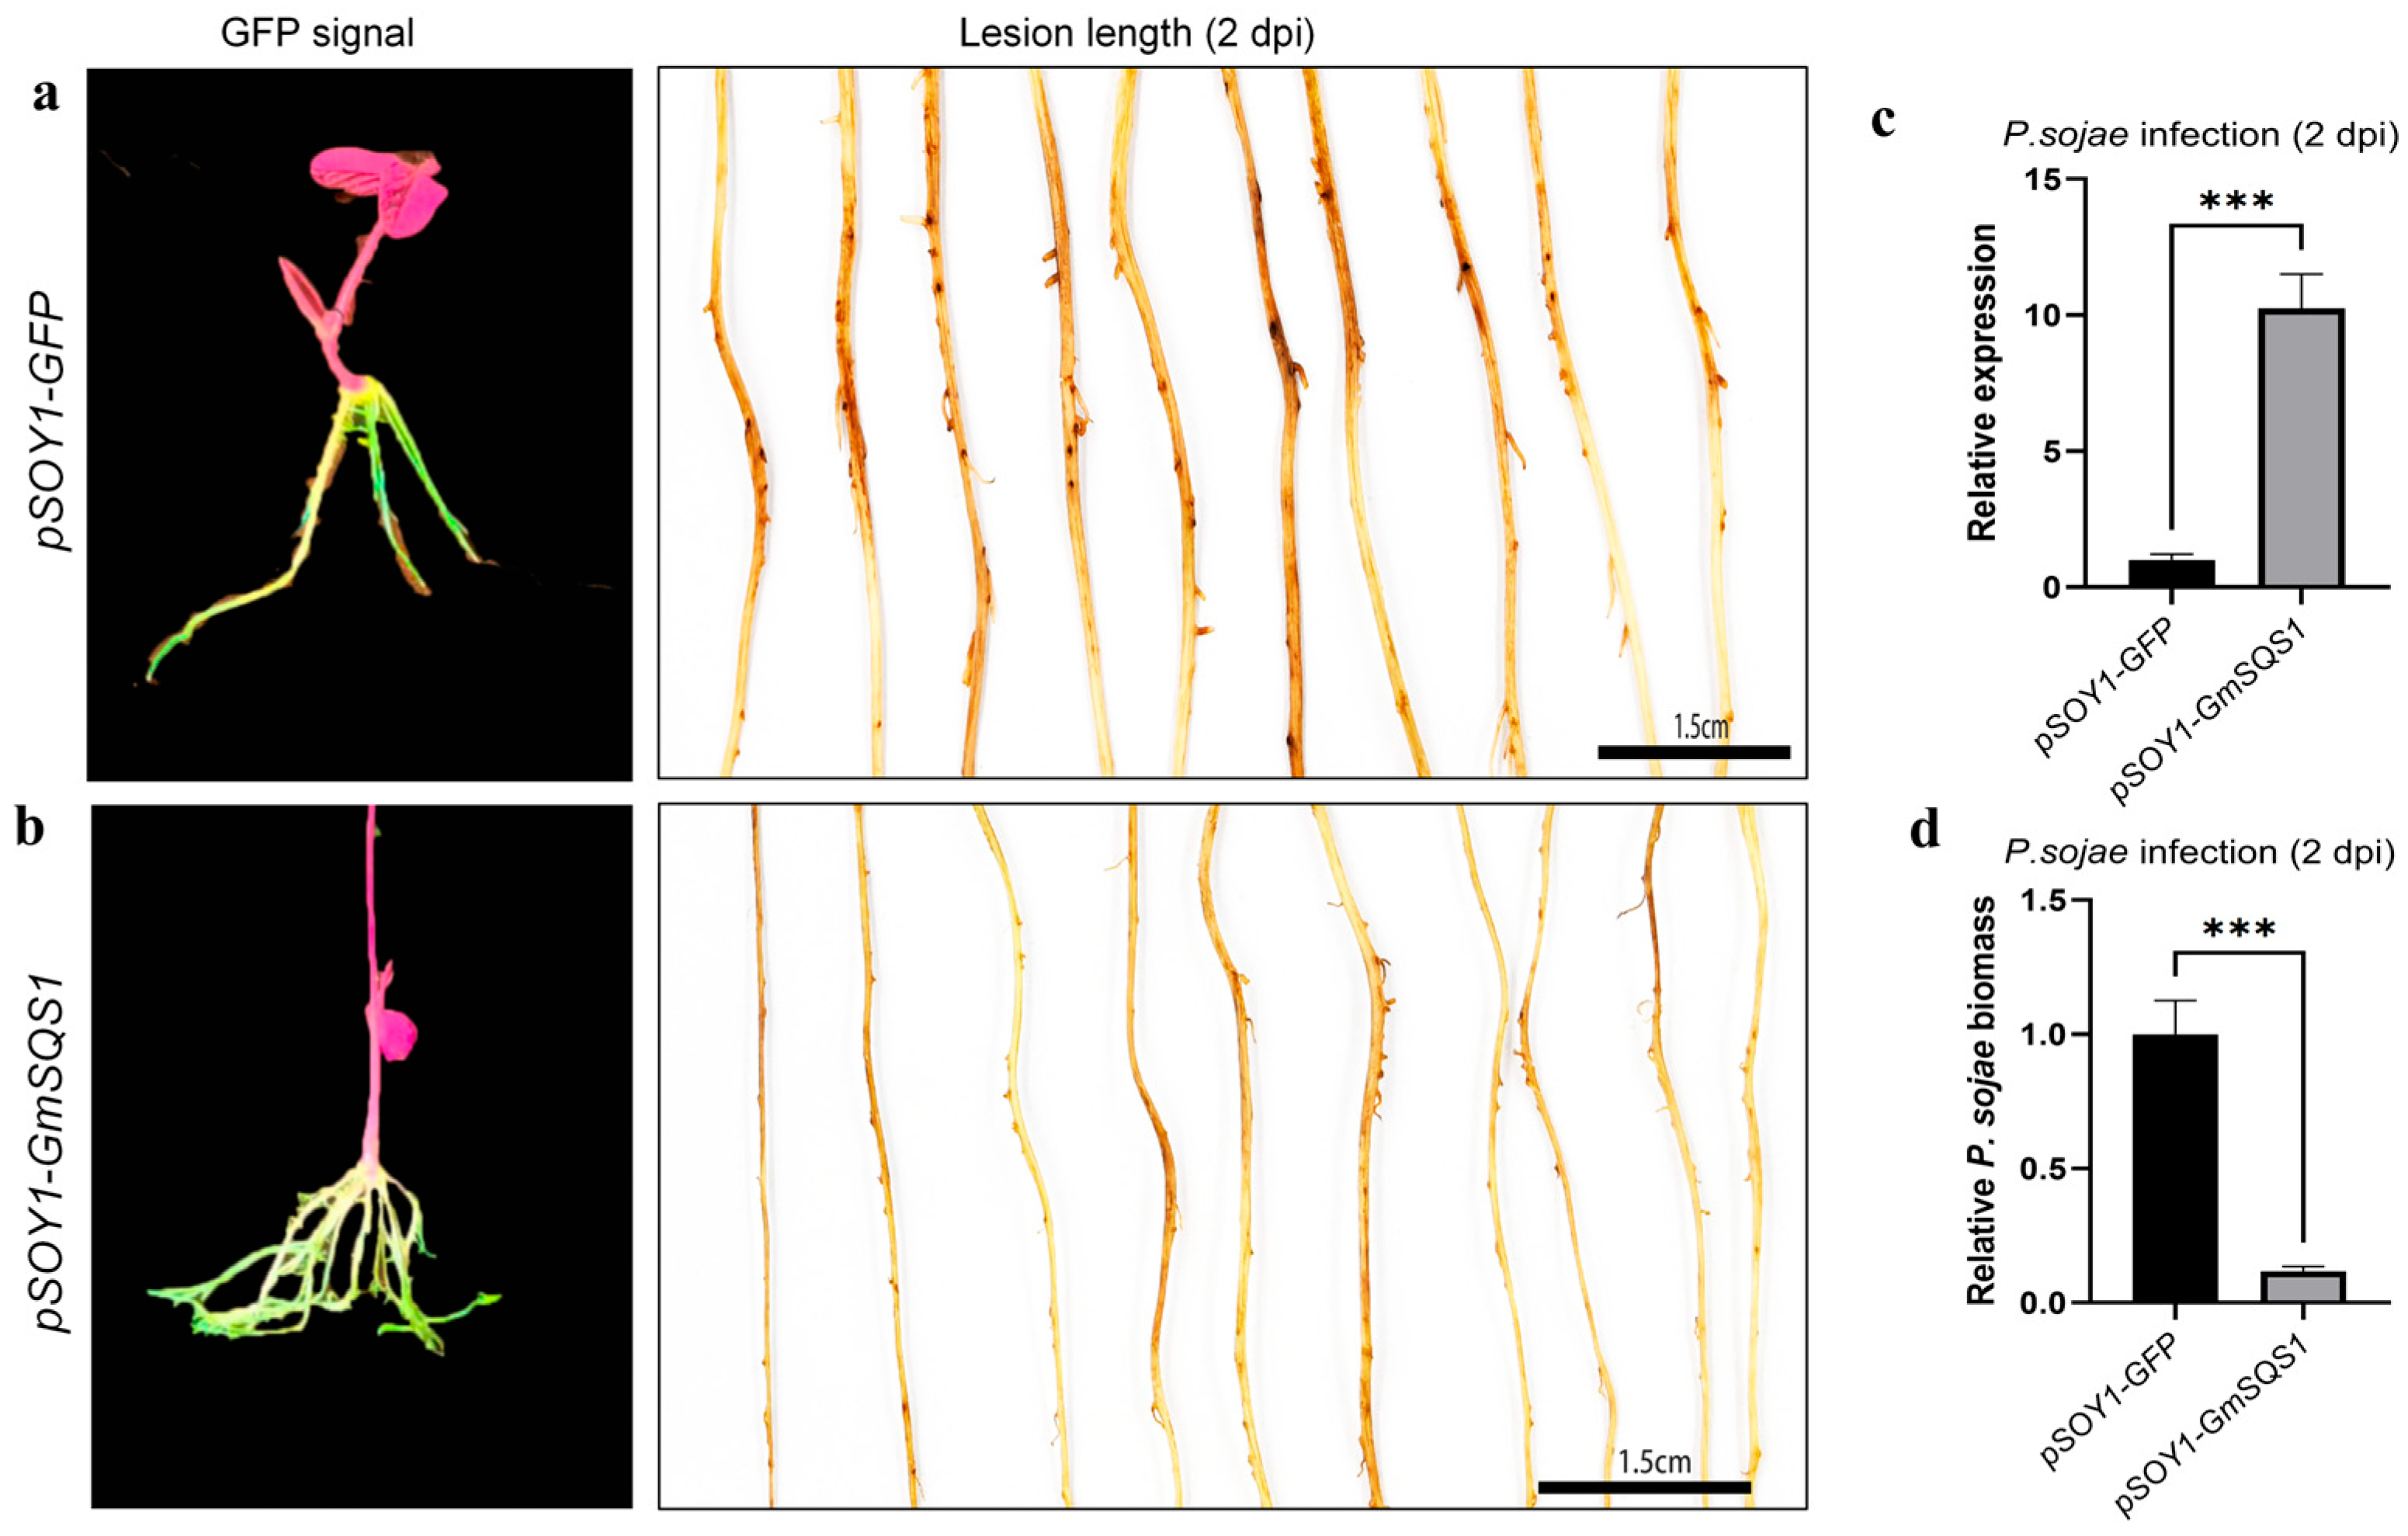
In this study, the binary overexpression vector of GmSQS1 was successfully constructed, with the detailed vector structure depicted in the accompanying figure. GmSQS1 was overexpressed in soybean via hairy root transformation. The transgenic hairy roots were then inoculated with P. sojae, and samples were collected at 2 days post-inoculation (dpi) to quantify P. sojae biomass. At 2 dpi, phenotypic observations showed that the lesion length of pSOY1-GmSQS1 (Figure 8b) transgenic hairy roots was significantly reduced compared with that of pSOY1-GFP (Figure 8a). Consistent with these observations, quantitative analysis revealed that, relative to pSOY1-GFP, the expression of GmSQS1 in pSOY1-GmSQS1 hairy roots was increased by 10-fold (Figure 8c), while the biomass of P. sojae was reduced by 8-fold (Figure 8d). Collectively, these findings confirm that overexpression of GmSQS1 can enhance soybean resistance to P. sojae.
Figure 8.
Analysis of transgenic hairy roots against Phytophthora root rot. (a) pSOY1-GFP signal detection and lesion length measurement at 2 days post-inoculation (dpi), respectively; (b) pSOY1-GmSQS1 GFP signal detection and lesion length measurement at 2 days post-inoculation (dpi), respectively; (c) Relative expression quantity of the in pSOY1-GFP and pSOY1-GmSQS1 transgenic hairy roots; (d) Phytophthora biomass determination at 2 dpi. Data are presented as the mean ± standard deviation (SD) of three biological replicates, with each replicate consisting of 10 independent transgenic hairy roots (n = 9). *** indicates a significant difference between the pSOY1-GFP and pSOY1-GmSQS1 groups at the p < 0.001 level under the same conditions.
4. Discussion
The SQS_PSY family genes in soybean can be broadly categorized into two subfamilies (SQS and PSY), with each subfamily further subdivided into distinct subgroups. Members within the same subfamily are highly conserved and may exert similar biological functions [41]. Notably, the soybean genome encodes 9 copies of SQS_PSY genes, and it is speculated that gene duplication events during soybean evolution drove the expansion of the SQS_PSY family genes [38]. The process of gene duplication and neofunctionalization is often accompanied by intron gain, while intron loss is associated with functional simplification of genes [42,43,44]. The SQS_PSY family genes harbor a substantial array of cis-acting elements associated with responses to light, hormones, and stress [23,45]. These complex and diverse cis-acting elements endow the SQS_PSY family with multiple functional potentials. Specifically, in the context of stress responses, GmPSY genes are predominantly implicated in abiotic stress adaptation (e.g., drought stress) [46] and regulate soybean resistance to abiotic stresses. Conversely, GmSQS genes primarily respond to biotic stresses [29].
To elucidate the role of SQS_PSY genes in resistance to P. sojae root rot, resistant and susceptible soybean varieties previously identified in our laboratory were inoculated with P. sojae. Samples were collected at 12 hpi and 36 hpi for transcriptome sequencing, which revealed that most GmPSY genes were expressed at low levels following P. sojae inoculation, with no significant differences between resistant and susceptible varieties. This phenomenon is likely attributed to the tissue-specific expression pattern of GmPSY genes, which are predominantly localized to chloroplasts and barely expressed in hypocotyls, the target tissue for inoculation in this study [41]. In contrast, GmSQS gene expression was remarkably downregulated upon P. sojae inoculation, and significant differences were observed between resistant and susceptible varieties. During P. sojae infection, effector proteins secreted by the pathogen disrupt the expression of defense-related genes in soybean [46]. It is speculated that these effectors suppress the expression of GmSQS in susceptible varieties, while resistant varieties show reduced sensitivity to this repression, resulting in milder GmSQS downregulation. This differential GmSQS expression is hypothesized to underlie the divergent resistance phenotypes of resistant and susceptible cultivars in response to P. sojae [47].
To confirm whether the low resistance of susceptible varieties to P. sojae stems from the inhibition of GmSQS, the pSOY1-GmSQS1 overexpression vector was constructed and transformed into soybean hairy roots, aiming to test if this manipulation could rescue the susceptibility phenotype of susceptible varieties. Notably, hairy root inoculation results showed that compared with the empty vector control, the length of lesions formed on pSOY1-GmSQS1 transgenic hairy roots after P. sojae infection was significantly reduced (Figure 8b), and the biomass was reduced by 8-fold (Figure 8d). Previous studies have demonstrated that overexpression of SQS genes in various plant species can stimulate the biosynthesis of secondary metabolites, including terpenoids and sterols [32]. Triterpenoids, recognized as important antimicrobial metabolites, have been extensively documented to enhance disease resistance in soybean [26,27]. Consequently, it is reasonable to infer that the enhanced resistance to P. sojae observed in soybean hairy roots overexpressing GmSQS1 primarily stems from alterations in secondary metabolite biosynthesis, particularly concerning terpenoids and triterpenoids [8,48]. These metabolites likely function as phytoalexins, impeding the invasion and expansion of P. sojae, thereby improving soybean resistance to Phytophthora root rot.
However, the present study still harbors certain limitations. To further verify the function of GmSQS1 and ascertain whether the diminished resistance in susceptible soybean varieties results from the suppression of GmSQS1, knockout mutants are imperative. Moreover, the question of whether overexpression of GmSQS1 enhances resistance by modulating secondary metabolism remains to be addressed. Metabolomic analysis is essential to identify the specific secondary metabolites regulated by GmSQS1 and to determine whether these metabolites directly contribute to the altered resistance to P. sojae in soybean. These aspects deserve further investigation in future studies. Such investigations will not only provide new insights for the control of Phytophthora root rot but also pave the way for breeding resistant soybean varieties.
5. Conclusions
Transcriptome sequencing (RNA-seq) was performed to analyze the expression patterns of SQS_PSY genes in soybean following Phytophthora inoculation, with the results validated by qRT-PCR to explore their potential involvement in the stress response. RNA-seq analysis revealed that the expression levels of GmPSY1, GmSQS1, GmSQS2, and GmPSY7 were altered following Phytophthora inoculation. Among these DEGs, qRT-PCR validation confirmed that only GmSQS1 exhibited significant expression differences at all time points post-inoculation. The role of GmSQS1 in soybean resistance to Phytophthora root rot was further verified via transgenic hairy root assays. The results showed that compared with the control group, the lesion length and Phytophthora biomass in GmSQS1-overexpressing transgenic hairy roots were significantly reduced. Collectively, these findings provide a basis for in-depth exploration of the SQS_PSY genes in soybean, while laying a solid foundation for the excavation of soybean resistance-related genes against Phytophthora root rot and the breeding of disease-resistant germplasm.
Supplementary Materials
The following supporting information can be downloaded at: https://www.mdpi.com/article/10.3390/agronomy16050512/s1, Figure S1: Schematic diagram of the recombinant vector pSOY1-GmSQS1 constructed in this study; Table S1: Subcellular Localization Analysis of SQS_PSY genes in soybean; Table S2: The cis-acting elements of SQS_PSY genes in soybean; Table S3: FPKM of SQS_PSY genes in soybean; Table S4: Primers used for qRT-PCR; Table S5: The primers used for GmSQS1 cloning; Table S6: The qRT-PCR results of SQS_PSY genes in soybean; Table S7: The qRT-PCR results of transgenic hairy roots.
Author Contributions
Conceptualization, J.C., R.T., P.W. (Pucheng Wang) and P.W. (Pengju Wang); data curation, J.C. and R.T.; formal analysis, J.C.; funding acquisition, D.X. and J.Z.; investigation, J.C., P.W. (Pucheng Wang) and P.W. (Pengju Wang); methodology, J.C.; project administration, D.X. and J.Z.; resources, D.X. and J.Z.; supervision, D.X. and J.Z.; validation, J.C., P.W. (Pucheng Wang) and P.W. (Pengju Wang); visualization, J.C. and R.T.; writing—original draft, J.C., R.T., P.W. (Pucheng Wang) and P.W. (Pengju Wang); writing—review and editing, D.X. and J.Z. All authors have read and agreed to the published version of the manuscript.
Funding
This research was funded by the Agriculture Science and Technology Major Project, and Heilongjiang Provincial Key R&D Project (grant number JD2023GJ01-14). The APC was funded by the Agriculture Science and Technology Major Project, and Heilongjiang Provincial Key R&D Project (grant number JD2023GJ01-14).
Data Availability Statement
The raw transcriptome sequencing data generated in this study have been deposited in the NCBI Sequence Read Archive (SRA) under the BioProject accession number PRJNA1400237. The datasets supporting the conclusions of this article are included within the article and its Supplementary Materials.
Acknowledgments
We thank Jianan Zou for her valuable guidance on experimental design and manuscript revision. We also acknowledge the technical support from the Key Laboratory of Soybean Biology (Ministry of Education) and the National Key Laboratory of Smart Farm Technology and System at Northeast Agricultural University, and the helpful discussions with all members of our research group.
Conflicts of Interest
The authors declare no conflicts of interest.
References
- Bandara, A.Y.; Weerasooriya, D.K.; Bradley, C.A.; Allen, T.W.; Esker, P.D. Dissecting the economic impact of soybean diseases in the United States over two decades. PLoS ONE 2020, 15, e0231141. [Google Scholar] [CrossRef] [Scilit]
- Xue, Z.L.; Ma, Q.H.; Liu, F.M.; Huang, Z.Q.; Gao, W.N.; Zhang, C.; Liu, X.L. Occurrence and control of soybean Phytophthora root rot. Acta Phytopathol. Sin. 2025, 55, 175–184. [Google Scholar]
- Jiang, C.; Dong, Y.H.; Meng, L.Q.; Wang, X.X.; Liu, Z.T.; Chen, J.Y. Research progress on soybean root rot caused by Fusarium and its biological control. Soybean Sci. 2024, 43, 656–662. [Google Scholar]
- Wang, S.; Li, X.M.; Liu, C.L.; Yang, F.; Jiang, X.; Li, M.; Cao, D.W.; Xu, C.; Guo, Y.A. Identification and pathogenicity of Fusarium species causing soybean root rot in Heilongjiang Province. Acta Phytopathol. Sin. 2023, 53, 126–128. [Google Scholar]
- Lu, K.; Qi, K.; Ma, L.G.; Ma, G.Y.; Li, C.S. Pathogen identification of Pythium root rot disease on soybean. Chin. J. Oil Crop Sci. 2022, 44, 652–658. [Google Scholar]
- Yu, S.F.; Wang, C.L.; Hu, Y.F.; Wen, Y.C.; Sun, Z.B. Biocontrol of three severe diseases in soybean. Agriculture 2022, 12, 1391. [Google Scholar] [CrossRef] [Scilit]
- Tyler, B.M. Phytophthora sojae: Root rot pathogen of soybean and model oomycete. Mol. Plant Pathol. 2007, 8, 1–8. [Google Scholar] [CrossRef] [Scilit] [PubMed]
- Yang, B. Research Progress on Pathogenic Mechanism, Host Molecule Response, and Prevention and Control Methods of Soybean Phytophthora sojae. J. Agric. Sci. Technol. 2025, 27, 133. [Google Scholar]
- Zhong, C.; Sun, S.; Yao, L.; Wang, X.; Zhao, J.; Chen, S.; Liu, S. Fine mapping and identification of a novel phytophthora root rot resistance locus RpsZS18 on chromosome 2 in soybean. Front. Plant Sci. 2018, 9, 44. [Google Scholar] [CrossRef] [Scilit]
- Sun, J.; Li, L.; Zhao, J.; Wang, X.; Chen, S.; Liu, S. Genetic analysis and fine mapping of RpsJS, a novel resistance gene to Phytophthora sojae in soybean [Glycine max (L.) Merr.]. Theor. Appl. Genet. 2014, 127, 913–919. [Google Scholar] [CrossRef] [Scilit]
- Dorrance, A.E. Management of Phytophthora sojae of soybean: A review and future perspectives. Can. J. Plant Pathol. 2018, 40, 210–219. [Google Scholar] [CrossRef] [Scilit]
- Graham, M.A.; Marek, L.F.; Shoemaker, R. PCR Sampling of disease resistance-like sequences from a disease resistance gene cluster in soybean. Theor. Appl. Genet. 2002, 105, 50–57. [Google Scholar] [CrossRef] [Scilit]
- Gao, H.; Narayanan, N.N.; Ellison, L.; Bhattacharyya, M.K. Two classes of highly similar coiled coil-nucleotide binding-leucine rich repeat genes isolated from the Rps1-k locus encode Phytophthora resistance in soybean. Mol. Plant-Microbe Interact. 2005, 18, 1035–1045. [Google Scholar] [CrossRef] [Scilit] [PubMed]
- Fan, S.; Dong, L.; Han, D.; Cheng, Y.; Kong, F.; Wang, Y.; Wang, X.; Chen, S. GmWRKY31 and GmHDL56 enhances resistance to Phytophthora sojae by regulating defense-related gene expression in soybean. Front. Plant Sci. 2017, 8, 781. [Google Scholar] [CrossRef] [Scilit] [PubMed]
- Dong, L.; Cheng, Y.; Wu, J.; Fan, S.; Han, D.; Wang, X.; Chen, S. Overexpression of GmERF5, a new member of the soybean EAR motif-containing ERF transcription factor, enhances resistance to Phytophthora sojae in soybean. J. Exp. Bot. 2015, 66, 2635–2647. [Google Scholar] [CrossRef] [Scilit]
- Zhang, C.; Tian, Q.; Zhang, Z.; Ma, J.; Gao, H.; Xu, P.; Zhang, C. GmERF1 positively regulates soybean resistance to Phytophthora sojae by enhancing salicylic acid signaling. Plant Cell Rep. 2025, 44, 268. [Google Scholar] [CrossRef] [Scilit]
- Guo, N.; Ye, W.W.; Wu, X.L.; Zhang, X.Y.; Wang, X.C. Microarray profiling reveals microRNAs involving soybean resistance to Phytophthora sojae. Genome 2011, 54, 954–958. [Google Scholar] [CrossRef] [Scilit]
- Wong, J.; Gao, L.; Yang, Y.; Wang, Y.; Wang, X. Roles of small RNAs in soybean defense against Phytophthora sojae infection. Plant J. 2014, 79, 928–940. [Google Scholar] [CrossRef] [Scilit]
- Li, W.; Zheng, X.; Cheng, R.; Zhong, C.; Zhao, J.; Liu, T.H.; Liu, S. Soybean ZINC FINGER PROTEIN03 targets two SUPEROXIDE DISMUTASE1s and confers resistance to Phytophthora sojae. Plant Physiol. 2023, 192, 633–647. [Google Scholar] [CrossRef] [Scilit]
- Deng, S.; Zhang, Y.; Fang, X.; Gou, H.; Sun, R.; Xuan, H.; Guo, N. Overexpression of GmSRC2 confers resistance to Phytophthora sojae in soybean. Plant Sci. 2024, 349, 112247. [Google Scholar] [CrossRef] [Scilit]
- Zhu, X.; Guo, L.; Zhu, R.; Zhou, X.; Zhang, J.; Li, D.; Qiao, Y. Phytophthora sojae effector PsAvh113 associates with the soybean transcription factor GmDPB to inhibit catalase-mediated immunity. Plant Biotechnol. J. 2023, 21, 1393–1407. [Google Scholar] [CrossRef] [Scilit]
- Zhu, X.; Fang, D.; Li, D.; Zhang, J.; Jiang, H.; Guo, L.; Qiao, Y. Phytophthora sojae boosts host trehalose accumulation to acquire carbon and initiate infection. Nat. Microbiol. 2023, 8, 1561–1573. [Google Scholar] [CrossRef] [Scilit]
- Busquets, A.; Keim, V.; Closa, M.; Del Arco, A.; Boronat, A.; Arró, M.; Ferrer, A. Arabidopsis thaliana contains a single gene encoding squalene synthase. Plant Mol. Biol. 2008, 67, 25–36. [Google Scholar] [CrossRef] [Scilit]
- Cazzonelli, C.I.; Pogson, B.J. Source to sink: Regulation of carotenoid biosynthesis in plants. Trends Plant Sci. 2010, 15, 266–274. [Google Scholar] [CrossRef] [Scilit] [PubMed]
- Liu, Y.; Zhao, R.; Lu, Z.F.; Li, R.L. Research progress in the biological metabolic pathway and functions of plant carotenoids. Biotechnol. Bull. 2025, 41, 23–31. [Google Scholar]
- Yu, Q.; Ren, Z.; Liu, L.; Zhang, L.; Yin, X.; Shen, W.; Liu, B. LC/MS and MALDI-MSI reveal the different distribution of terpenoids in Glycine max and Glycine soja seeds. LWT 2025, 211, 117781. [Google Scholar] [CrossRef] [Scilit]
- Nguyen, N.S.; Poelstra, J.W.; Stupar, R.M.; McHale, L.K.; Dorrance, A.E. Comparative transcriptomics of soybean genotypes with partial resistance toward phytophthora sojae, conrad, and M92-220 to moderately susceptible fast neutron mutant soybeans and sloan. Phytopathology 2024, 114, 1851–1868. [Google Scholar] [CrossRef] [Scilit] [PubMed]
- Kumar, S.; Singh, B.; Singh, D. Diversity of Phytosterols in Leaves of Wild Brassicaceae Species as Compared to Brassica napus Cultivars: Potential Traits for Insect Resistance and Abiotic Stress Tolerance. Plants 2020, 9, 1745. [Google Scholar]
- Wang, K.; Senthil-Kumar, M.; Ryu, C.-M.; Kang, L.; Mysore, K.S. Phytosterols play a key role in plant innate immunity against bacterial pathogens by regulating nutrient efflux into the apoplast. Plant Physiol. 2012, 158, 1789–1802. [Google Scholar] [CrossRef] [Scilit]
- Chen, I.W.; Grebenok, R.J.; Schaller, H.; Zhu-Salzman, K.; Behmer, S.T. Aphid growth and reproduction on plants with altered sterol profiles: Novel insights using Arabidopsis mutant and overexpression lines. J. Insect Physiol. 2020, 123, 104054. [Google Scholar] [CrossRef] [Scilit] [PubMed]
- Rogowska, A.; Szakiel, A. The role of sterols in plant response to abiotic stress. Phytochem. Rev. 2020, 19, 1525–1538. [Google Scholar] [CrossRef] [Scilit]
- Ding, C.; Wang, X.; Wang, Y. Bioinformatics analysis of the squalene synthase gene and the amino acid sequence in ginseng species. Int. J. Clin. Exp. Med. 2015, 8, 12818. [Google Scholar]
- Hartman, G.L.; West, E.D.; Herman, T.K. Crops that feed the World 2. Soybean—Worldwide production, use, and constraints caused by pathogens and pests. Food Secur. 2011, 3, 5–17. [Google Scholar] [CrossRef] [Scilit]
- Savary, S.; Willocquet, L.; Pethybridge, S.J.; Esker, P.; McRoberts, N.; Nelson, A. The global burden of pathogens and pests on major food crops. Nat. Ecol. Evol. 2019, 3, 430–439. [Google Scholar] [CrossRef] [Scilit] [PubMed]
- Lal, R. Soil degradation as a reason for inadequate human nutrition. Food Secur. 2009, 1, 45–57. [Google Scholar] [CrossRef] [Scilit]
- Farré, G.; Vranová, E.; Cominelli, E.; Tonelli, C. Molecular evolution and diversification of phytoene synthase (PSY) gene family. Plant J. 2022, 110, 1347–1364. [Google Scholar]
- Kang, J.; Zhang, Q.; Jiang, X.; Zhang, T.; Long, R.; Yang, Q.; Wang, Z. Molecular cloning and functional identification of a squalene synthase encoding gene from alfalfa (Medicago sativa L.). Int. J. Mol. Sci. 2019, 20, 4499. [Google Scholar] [CrossRef] [Scilit] [PubMed]
- Ren, L.; Qiao, S.T.; Ge, C.H.; Wei, Z.T.; Xu, C.X. Identification and expression analysis of spinach PSY gene family. Biotechnol. Bull. 2023, 39, 169–178. [Google Scholar]
- Sun, R.; Han, A.; Wang, H.; Wang, C.; Lu, Y.; Ni, D.; Guo, N.; Xing, H.; Zhao, J. Integrated Transcriptome and Metabolome Analysis Reveals Molecular Mechanisms Underlying Resistance to Phytophthora Root Rot. Plants 2024, 13, 1705. [Google Scholar] [CrossRef] [Scilit] [PubMed]
- Graham, T.L.; Graham, M.Y.; Subramanian, S.; Yu, O. Soybean Hairy Root Transformation for the Analysis of Gene Function. Methods Mol. Biol. 2023, 2658, 167–182. [Google Scholar]
- Birchler, J.A.; Yang, H. The multiple fates of gene duplications: Deletion, hypofunctionalization, subfunctionalization, neofunctionalization, dosage balance constraints, and neutral variation. Plant Cell 2022, 34, 2466–2474. [Google Scholar] [CrossRef] [Scilit]
- Liu, C.Y.; Wright, B.; Allen-Vercoe, E.; Gu, H.; Beiko, R. Phylogenetic clustering of genes reveals shared evolutionary trajectories and putative gene functions. Genome Biol. Evol. 2018, 10, 2255–2265. [Google Scholar] [CrossRef] [Scilit]
- Zhang, D.; Leng, L.; Chen, C.Y.; Long, M.; Wu, C.I. Dosage sensitivity and exon shuffling shape the landscape of polymorphic duplicates in Drosophila and humans. Nat. Ecol. Evol. 2021, 6, 273–282. [Google Scholar] [CrossRef] [Scilit]
- Parenteau, J.; Maignon, L.; Berthoumieux, M.; Ameur, A.; Dutertre, M.; Duros, C.; Duret, L.; Glemin, S. Introns are mediators of cell response to starvation. Nature 2019, 565, 612–616. [Google Scholar] [CrossRef] [Scilit] [PubMed]
- Welsch, R.; Wüst, F.; Bär, C.; Al-Babili, S.; Beyer, P. A Third Phytoene Synthase Is Devoted to Abiotic Stress-Induced Abscisic Acid Formation in Rice and Defines Functional Diversification of Phytoene Synthase Genes. Plant Physiol. 2008, 147, 367–380. [Google Scholar] [CrossRef] [Scilit] [PubMed]
- Wang, W.; Jiao, F. Effectors of Phytophthora pathogens are powerful weapons for manipulating host immunity. Planta 2019, 250, 413–425. [Google Scholar] [CrossRef] [Scilit]
- Zhao, Y.; Yang, B.; Xu, H.; Wu, J.; Xu, Z.; Wang, Y. The Phytophthora effector Avh94 manipulates host jasmonic acid signaling to promote infection. J. Integr. Plant Biol. 2022, 64, 2199–2210. [Google Scholar] [CrossRef] [Scilit]
- Qian, J.; Liu, Y.; Ma, C.; Chao, N.; Chen, Q.; Zhang, Y.; Wu, Y. Positive selection of squalene synthase in Cucurbitaceae plants. Int. J. Genom. 2019, 2019, 5913491. [Google Scholar] [CrossRef] [Scilit] [PubMed]

Disclaimer/Publisher’s Note: The statements, opinions and data contained in all publications are solely those of the individual author(s) and contributor(s) and not of MDPI and/or the editor(s). MDPI and/or the editor(s) disclaim responsibility for any injury to people or property resulting from any ideas, methods, instructions or products referred to in the content. |
© 2026 by the authors. Licensee MDPI, Basel, Switzerland. This article is an open access article distributed under the terms and conditions of the Creative Commons Attribution (CC BY) license.