


Abstract
Balancing food production, water conservation, and carbon emissions (CEs) is critical in Northeast China (NEC), yet food–carbon–water (FCW) interactions remain poorly quantified at pixel scale. Conceptually, we move beyond administrative-unit nexus assessments by providing a crop-explicit, grid-based FCW diagnosis that identifies where crop-specific bottlenecks emerge and supports zoning-oriented interventions. We fused multi-source datasets with process models to estimate CEs, water use efficiency (WUE), and yield for maize, rice, and soybean at 500 m resolution during 2001–2020 and evaluated synergies/trade-offs based on Sen’s slope trends and nexus performance using coupling coordination degree (CCD). Annual mean CE (230.8–37,300 kg CO2-eq ha−1), yield (0–10,031 kg ha−1), and WUE (0–6 kg C m−3) exhibited pronounced spatial heterogeneity. Higher CEs and yield concentrated in the central–southern plains, whereas WUE showed a patchier pattern with localized high values. Temporally, CEs increased for all crops, with rice consistently exhibiting the highest CEs. Soybean showed the most pronounced WUE improvement, reaching >2.0 kg C m−3 after the early 2010s. Pixel-wise correlations revealed a robust CE–WUE antagonism for all crops (r = −0.33 to −0.60), while CE–yield coupling was crop-dependent (soybean positive, maize weakly negative, rice non-significant). Trend-based coupling further showed that synchronized CE and yield increases dominated 45.7% of croplands, whereas trade-offs were more common when WUE was involved (CE–WUE: 38.0%; WUE–yield: 41.8%), peaking in rice systems (61.8% and 54.0%, respectively). CCD mapping indicated widespread basic coordination but strong crop contrasts. Rice had the lowest coordination (mean CCD = 0.36 ± 0.17) and the largest shares of moderate-to-severe imbalance, identifying rice as the primary FCW bottleneck, whereas maize and soybean more frequently achieved good-to-high coordination. These results support a zoned strategy that consolidates coordinated maize/soybean areas, prioritizes paddy water-saving and low-emission upgrades, and limits further rice expansion in water-constrained zones.
1. Introduction
Feeding a growing global population while staying within planetary boundaries for water use and carbon emissions (CEs) is a central challenge for twenty-first century agriculture [1]. Cropland ecosystems provide food and fiber but also regulate water and carbon fluxes, and are themselves important sources of greenhouse gas emissions [2]. Recent assessments of climate change adaptation in food–energy–water systems show that many measures simultaneously generate benefits and trade-offs across sectors, underscoring the need to design strategies that jointly secure food supplies, conserve water, and mitigate climate impacts [3]. In intensive farming systems, yield gains are often achieved through higher inputs and irrigation, which can increase carbon emissions and consumptive water use or lower water use efficiency (WUE), creating difficult trade-offs between food security, water conservation, and climate mitigation [4,5,6,7]. A spatially explicit diagnosis of crop-specific synergies and trade-offs is therefore essential for guiding targeted interventions.
CEs, crop yield, and WUE are core indicators that jointly characterize the performance of cropland ecosystems within the food–carbon–water (FCW) nexus. Process-based models and satellite observations have been widely applied to quantify WUE and its spatiotemporal variability across China’s ecosystems and to attribute its climate controls [8]. For agriculture specifically, a new 1 km global cropland WUE dataset for 2001–2020 provides an unprecedented basis for analyzing spatiotemporal patterns of water–carbon coupling in cropping systems [9]. At field-to-regional scales, remote sensing has been exploited to assess crop-specific WUE responses to irrigation and management practices [10,11], for example for maize in typical irrigation districts of Northwest China [12]. Collectively, these studies underscore that improving WUE is a necessary condition for sustaining or increasing productivity under tightening water constraints, but they seldom evaluate how WUE improvements co-evolve with emissions intensity and yield outcomes.
Indicator choice in FCW analyses is not unique. Carbon performance can be expressed as net ecosystem carbon balance or product-based life cycle footprints, whereas water performance is often measured as crop water productivity or water footprint. Here we adopt area-based carbon emission intensity from crop farming because it aligns with inventory accounting and reflects management-controlled inputs and rice CH4 emissions that are directly targeted by mitigation policies. For water, we use a carbon-based ecosystem WUE, which can be estimated consistently from remote sensing and meteorological forcing and is widely used to diagnose water–carbon coupling at large scales [13]. We note that agronomic water productivity based on observed grain yield is an alternative indicator in irrigated-crop studies [14], but long-term, crop-explicit yield observations are not available at 500 m for NEC. Therefore, we reconstruct yield from NPP using crop-specific harvest indices to provide a spatially continuous proxy for coupling diagnostics.
In parallel, nexus-oriented frameworks have been proposed to quantify coordination and imbalance among multiple sustainability objectives. Coupling coordination degree (CCD) models are increasingly used to assess the coordinated development of water–energy–food systems and to diagnose bottlenecks in resource governance [15,16,17]. Related applications have examined coordination between agricultural eco-efficiency and food security [18] and the coupling dynamics of regional water–food–carbon systems under land use change [19]. However, most CCD studies rely on socio-economic statistics aggregated to administrative units, limiting their ability to capture within-region heterogeneity and inform grid-scale management. Integrating biophysical indicators, such as WUE and crop-specific yield, with emissions at high spatial resolution remains comparatively rare, despite being crucial for cropping structure optimization in intensive agricultural landscapes.
Northeast China (NEC) is China’s largest commercial grain base and a strategic region for national food security. Over recent decades, NEC has experienced pronounced warming, shifts in precipitation regimes, and substantial changes in cropping structure and crop distribution [20,21,22]. These changes have been shown to alter agricultural water dynamics, including evapotranspiration, irrigation water requirements, and water stress risks for major crops such as maize, rice, and soybean [23]. Meanwhile, emerging evidence indicates that vegetation productivity (e.g., NPP) changes in China reflect interacting influences of climate, land use, and management [24] and that cropping structure and diversity can stabilize food production at broader scales [25]. Together, these findings point to NEC as a critical testbed for understanding how cropping choices shape the joint outcomes of productivity, water use, and emissions.
Despite this progress, key gaps remain. First, the spatiotemporal dynamics and interactions among CE, WUE, and yield have not been systematically quantified for different crop types and cropping structure configurations in NEC at grid scale; many studies focus on a single metric (e.g., yield or WUE) or treat cropland as homogeneous, obscuring crop-specific mechanisms. Second, although CCD approaches are widely used in nexus assessments [15,19], their application to a biophysical FCW nexus that jointly integrates cropland emissions, water–carbon efficiency, and grain yield at high resolution is still limited. Third, few studies combine long-term remote sensing with detailed crop-type and cropping structure information to pinpoint where synergies or trade-offs emerge and link these patterns explicitly to dominant crop types across NEC.
To address these gaps, we develop a grid-based FCW assessment framework for NEC to map and quantify synergies and trade-offs among CE, WUE, and crop yield at 500 m resolution during 2001–2020. Specifically, we (i) characterize spatial patterns and temporal trends of CEs, WUE, and yield for maize, rice, and soybean; (ii) quantify pixel-scale synergies and trade-offs among the three indicators and examine how these relationships vary along productivity gradients; and (iii) construct a CCD model to evaluate FCW coordination and identify priority zones for cropping structure optimization and management improvement. Therefore, we test three hypotheses: (H1) CEs, WUE, and yield exhibit distinct spatial patterns and interannual coupling across major crops; (H2) rice systems show lower FCW coordination and more frequent WUE-involved trade-offs than maize and soybean; and (H3) CCD-based zoning can identify crop-specific priority areas for coordinated mitigation and productivity interventions. We evaluate these hypotheses using pixel-wise Sen’s slopes and Mann-Kendall significance (p < 0.05), direction-based coupling categories, and the areal proportions of each category by crop. By providing a high-resolution, crop-explicit diagnosis of FCW interactions, this study aims to support strategies that jointly enhance food security, improve water productivity, and mitigate emissions in NEC.
2. Materials and Methods
2.1. Study Area
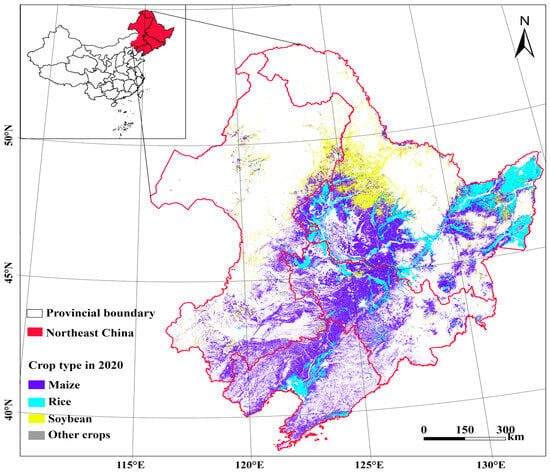
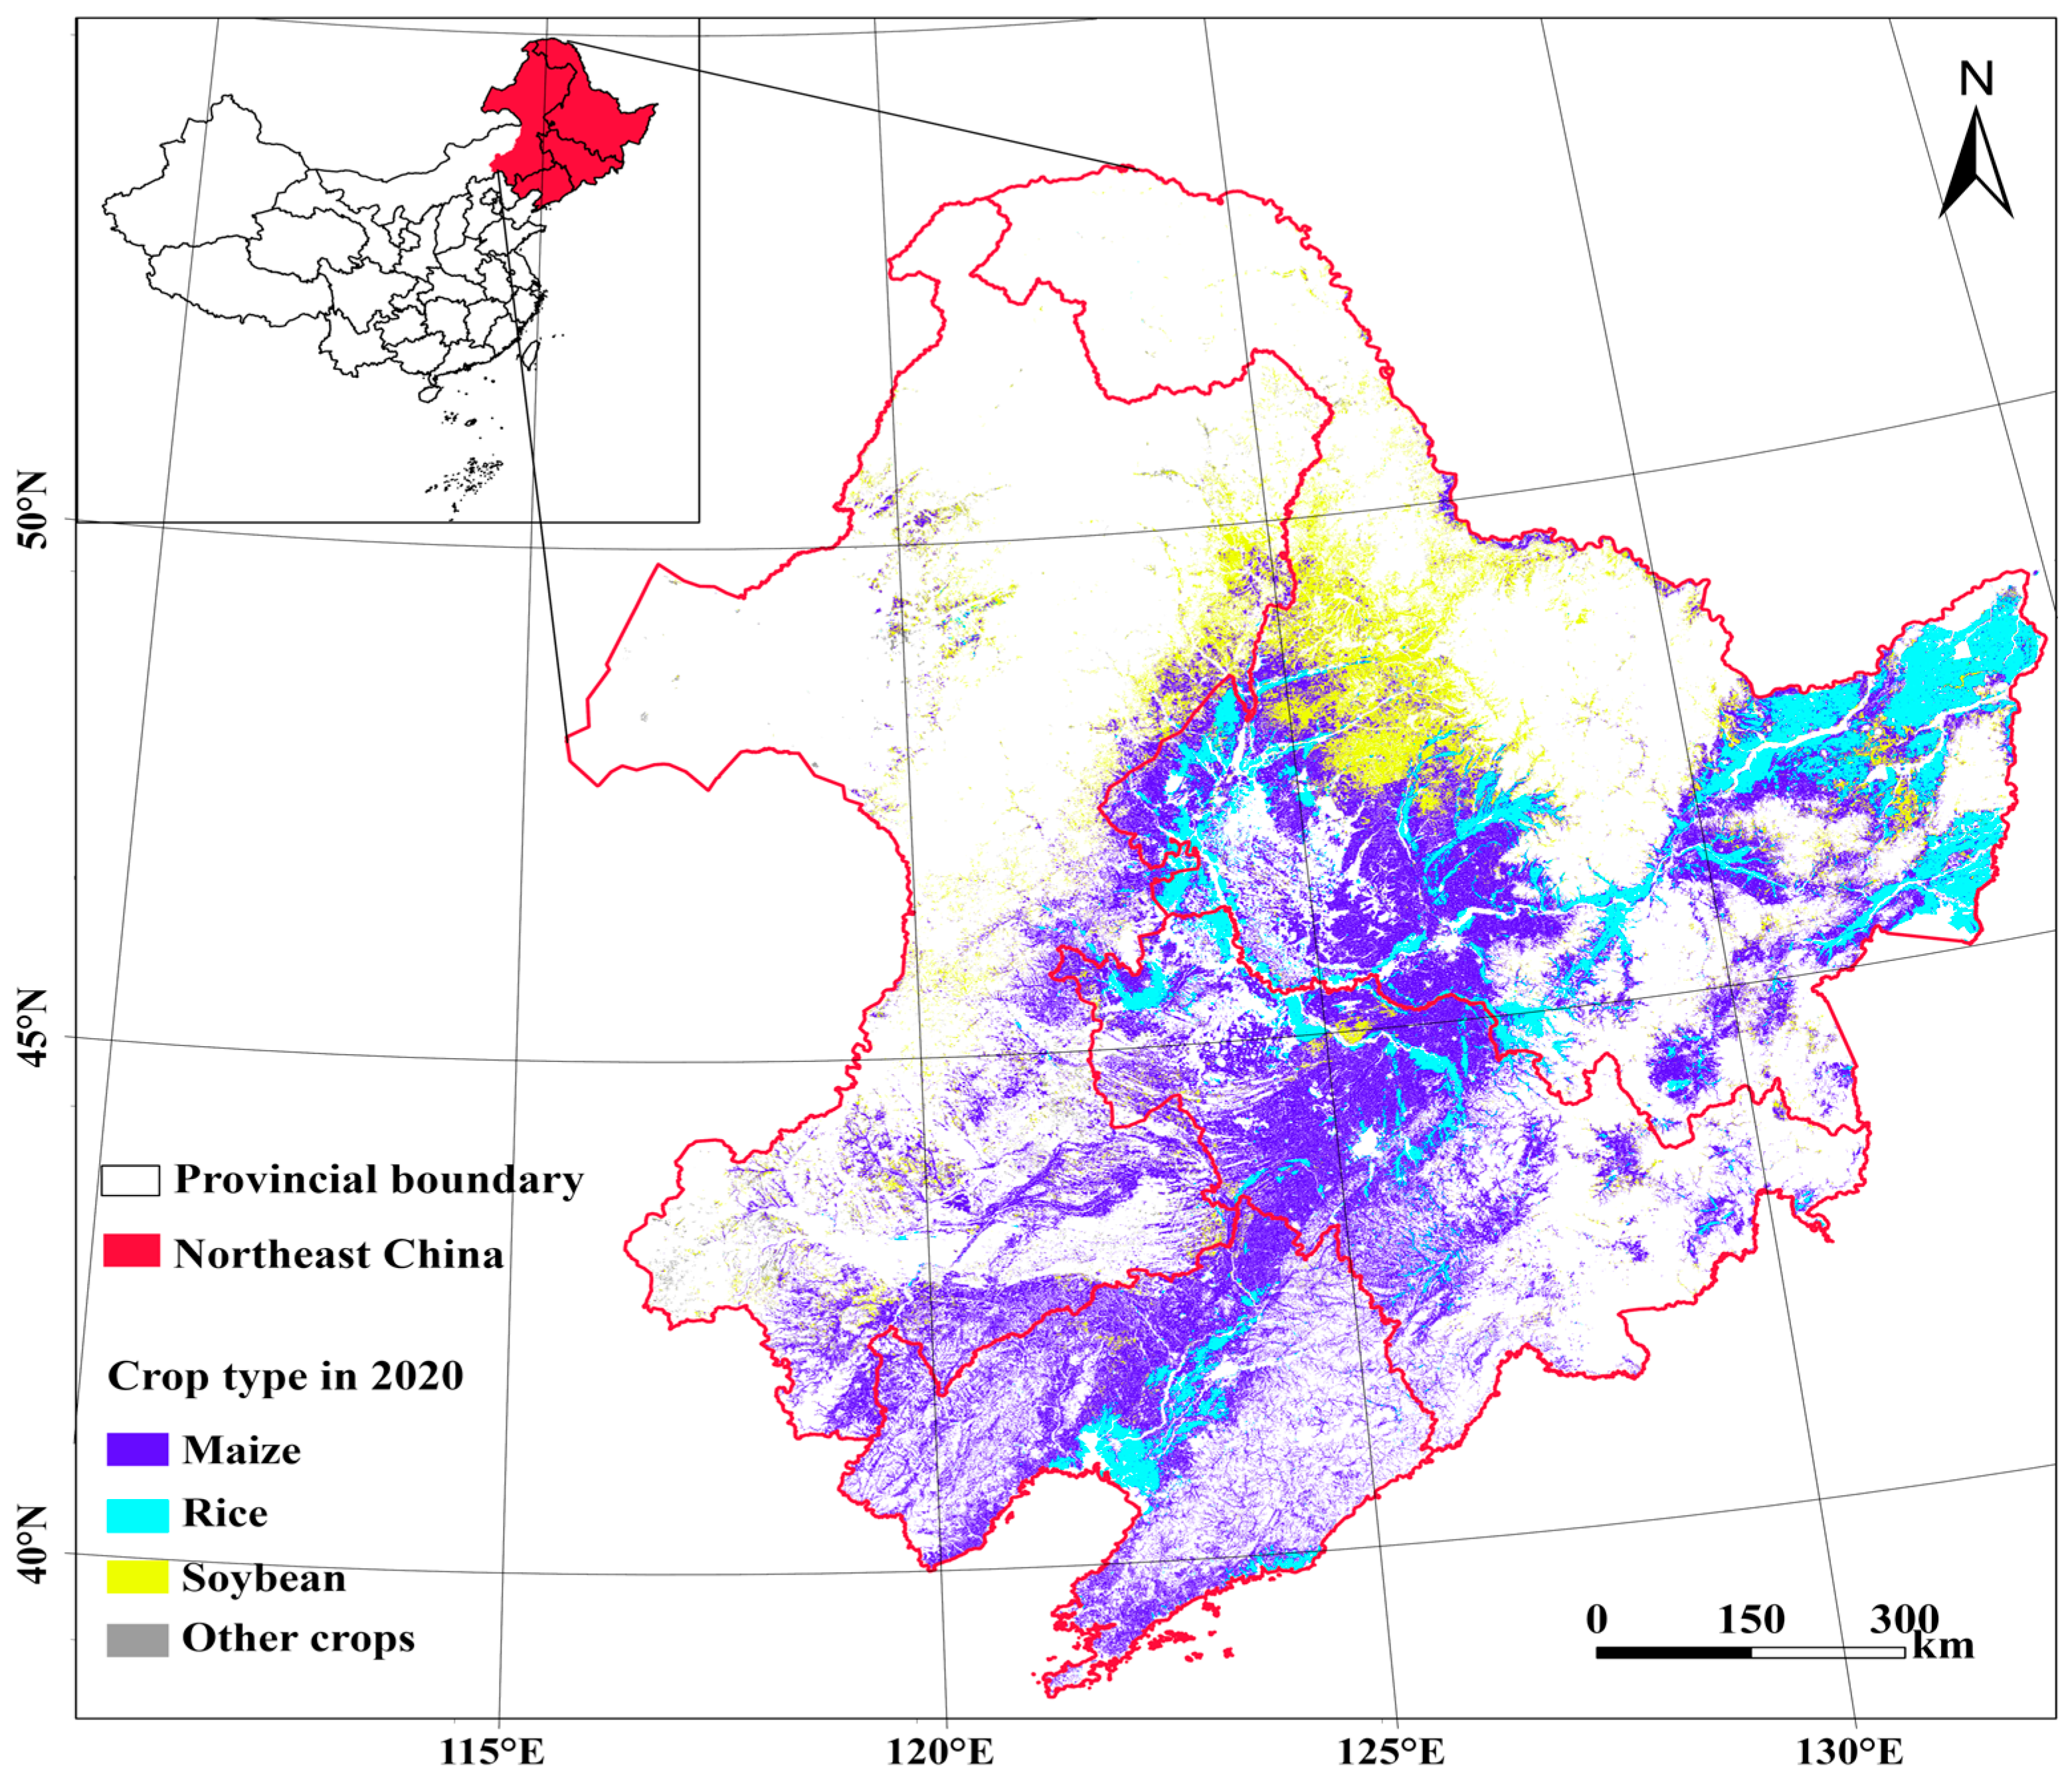
NEC comprises Heilongjiang, Jilin, Liaoning, and the eastern part of Inner Mongolia (40–53° N, 115–135° E; Figure 1), covering about 1.1 × 10⁶ km2. The region has a temperate continental monsoon climate, with mean annual temperatures of 4–10 °C and precipitation of 400–800 mm that generally decreases northwards. Fertile black soils support highly productive rainfed and irrigated cropping systems. As China’s principal grain basket, NEC contributes roughly 25% of national grain output. In 2020, maize dominated the central and southern plains (~45% of cropland), rice was concentrated in low-lying, well-irrigated paddies of the southern and eastern plains (~15%), and soybean was prevalent in the northern and northeastern black soil uplands (~20%), interspersed with mixed rotations and other crops in marginal areas [26] (Figure 1). This heterogeneous cropland mosaic underpins the regional FCW nexus and motivates our crop-explicit analysis of long-term NPP, yield, and WUE dynamics.
Figure 1.
Location of the study area and spatial distribution of major crops in Northeast China in 2020.
2.2. Data Collection and Sources
2.2.1. Crop Type Maps
Annual crop type maps for 2001–2020 were obtained from a previously developed remote sensing product for NEC that combines multi-source satellite imagery with ground survey data and machine learning classification [21]. The maps distinguish four crop categories at 500 m spatial resolution: maize, rice, soybean, and other crops. The product reports an overall classification accuracy >85% based on validation against city- and county-level agricultural statistics. A dominant crop mask was derived for each year and used to stratify trends, synergy/trade-off types, and coordination indices by cropping system.
2.2.2. Net Primary Productivity (NPP)
Annual NPP for 2001–2020 was derived from our previous work using a remote-sensing-driven light use efficiency (LUE) model implemented on the Google Earth Engine (GEE) platform [23]. The model, a variant of the CASA framework, assimilates MODIS vegetation indices, gridded meteorological data, and crop parameters to estimate aboveground NPP for each 500 m cropland pixel across NEC. These NPP estimates were used to derive carbon-based WUE (Section 2.2.4) and to calculate crop yield via biomass allocation (Section 2.2.5).
In the LUE formulation, monthly NPP is computed as:
where absorbed photosynthetically active radiation (APAR) is given by:
and the fraction of absorbed PAR (FPAR) is estimated from NDVI as:
with and . The maximum LUE is set to 0.389 g C MJ−1 for crops and is down-regulated by scalar functions , , and that account for low-temperature stress (), deviation from the optimal temperature (), and water stress.
2.2.3. Carbon Emissions (CEs)
CEs during 2001–2020 were quantified using a crop-specific carbon footprint inventory for NEC [27]. CEs represent cultivation- and input-related greenhouse gas emissions associated with crop production, including fertilizer-induced N2O, paddy CH4 emissions for rice, on-farm energy use, and upstream inputs (e.g., fertilizers, pesticides, plastic film, irrigation electricity, and seeds) [27,28,29,30]. To enable pixel-scale analyses, annual province-by-crop CE intensities were rasterized to 500 m on the GEE platform [31]. For each year and crop, we overlaid the 500 m crop-type maps with provincial administrative boundaries and assigned a uniform CE intensity (kg CO2-eq ha−1 yr−1) to pixels within each province–crop stratum. Pixel-area weighting was used to conserve provincial crop-specific totals, and raster-reconstructed totals were checked against the tabular inventory for benchmark years [32,33].
2.2.4. Water Use Efficiency (WUE)
Crop evapotranspiration (, mm) was calculated using the FAO-56 approach as = × , where is the reference evapotranspiration computed with the Penman–Monteith equation and is the crop coefficient. We derived from local phenological calendars and crop-specific field observations to reflect regional crop growth stages [34].
WUE (kg C m−3) was defined as NPP divided by , representing carbon assimilation per unit water consumed [35]:
2.2.5. Crop Yield
Crop yield was derived from NPP using a process-based biomass allocation scheme [7]. For crop (maize, rice, or soybean), the harvested dry yield (kg ha−1) was calculated as:
where is the harvest index, is the ratio of aboveground biomass to total biomass, is the carbon-to-biomass conversion coefficient, and is the grain water content at harvest. Parameter values for each crop were taken from previous field experiments and literature for NEC and nearby regions.
Because NPP appears in both WUE (Equation (4)) and the NPP-to-yield conversion (Equation (5)), WUE and yield share a common NPP numerator and are therefore not statistically independent; we interpret WUE–yield coupling primarily as a diagnostic of how ETc dynamics co-vary with NPP-derived productivity (Section 4.4.1). To strengthen external validation of the productivity pipeline, we cite an independent NEC yield reconstruction using 500 m productivity data and the same annual crop type product, which was validated against prefecture-level statistical yearbooks (R2 = 0.76 for maize, 0.69 for rice, and 0.81 for soybean) [36].
2.3. Methods
2.3.1. Pixel-Scale Trend Analysis
Long-term trends in CEs, WUE, and yield were quantified for each 500 m cropland pixel over 2001–2020 using the non-parametric Sen’s slope estimator combined with the Mann-Kendall (MK) test. This approach is widely used to detect monotonic trends in hydro-climatic and ecosystem variables because it is robust to non-normality, serial correlation, and outliers [24].
For an indicator time series (), Sen’s slope is calculated as the median of all pairwise slopes:
The MK statistic tests the null hypothesis of no monotonic trend. Pixels with |Z| > 1.96 were considered to exhibit significant trends at p < 0.05 (two-sided). Significant upward and downward trends correspond to Z > 0 and Z < 0, respectively.
2.3.2. Synergies, Trade-Offs, and Correlations Among Indicators
To characterize joint changes between indicators, we combined the sign of Sen’s slope (β) and Mann-Kendall (MK) significance (two-sided p < 0.05) for each pixel and indicator pair. Because CE is a cost indicator (lower is better), coupling types for CE-involved pairs were defined using a “co-improvement/co-degradation” logic. Let and denote the Sen’s slopes of the two indicators and , denote the corresponding MK statistics. A trend was considered significant when (two-sided ). For CE–WUE and CE–yield, we defined:
- (1)
- Synergistic improvement (co-increase): and ( WUE or yield), with at least one significant trend.
- (2)
- Synergistic deterioration (co-decrease): and , with at least one significant trend.
- (3)
- Trade-off (Type A): and , with at least one significant trend.
- (4)
- Trade-off (Type B): and , with at least one significant trend.
- (5)
- Non-significant: all remaining combinations, including cases where both trends are non-significant ( and ).
For WUE–yield (both benefit indicators), synergistic increase/decrease and trade-offs were defined using the original sign-based rules (both slopes positive/negative versus opposite signs), with the same significance criterion.
In addition to trend-based coupling, we quantified interannual co-variation by computing the Pearson correlation coefficient between the 20-year time series of each indicator pair at each pixel:
To diagnose whether WUE–yield trade-offs are associated with dynamics (given the shared NPP numerator), we also computed an ETc proxy as yield/WUE (proportional to under the fixed allocation parameters of Equation (5)) and examined its trend sign in pixels where yield and WUE trends have opposite signs.
2.3.3. Coupling Coordination Degree Index
To synthesize overall FCW performance, we adapted the CCD model to integrate CEs, WUE, and yield into a single index. First, we calculated the long-term mean of each indicator at every pixel and normalized them to dimensionless indices. Because CE is a cost indicator, it was reverse-normalized so that larger normalized values indicate lower emissions. Specifically, for WUE and yield:
and for CE:
where denotes the long-term mean of CE, WUE, or yield at each pixel and and are the regional minima and maxima, respectively. The three indices , , and represent the relative levels of low emission intensity, water use efficiency, and grain production.
The comprehensive development level of the FCW system at each pixel was then calculated as the arithmetic mean of the three indices:
The coupling degree described how tightly these subsystems interact and was defined for a three-element system as:
Finally, the coupling coordination degree combines the interaction strength and overall development level:
ranges from 0 to 1, with larger values indicating a more coordinated system characterized by lower CE and higher WUE and yield. Pixels were classified into five coordination levels: severe imbalance (0–0.2), moderate imbalance (0.2–0.4), basic coordination (0.4–0.6), good coordination (0.6–0.8), and high coordination (0.8–1.0). Given that WUE and yield share an NPP numerator and CE is inventory-based, D is interpreted as an integrated diagnostic index rather than coordination among three independent subsystems. Differences among crops were assessed using Kruskal–Wallis tests followed by Dunn’s post hoc comparisons with Bonferroni correction [37]. Raster processing was implemented in GEE, and statistical analyses were conducted in Python 3.10.
3. Results
3.1. Spatiotemporal Patterns of CE, Yield, and WUE
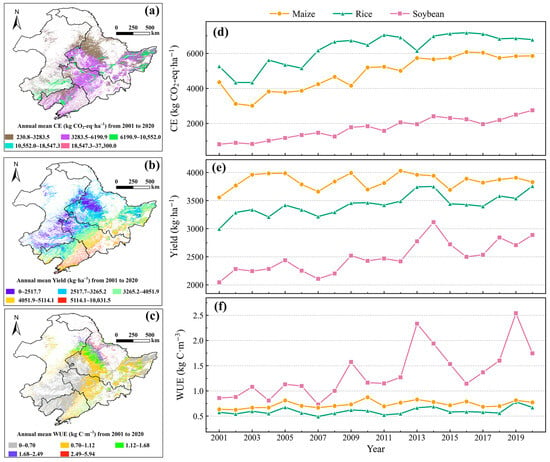
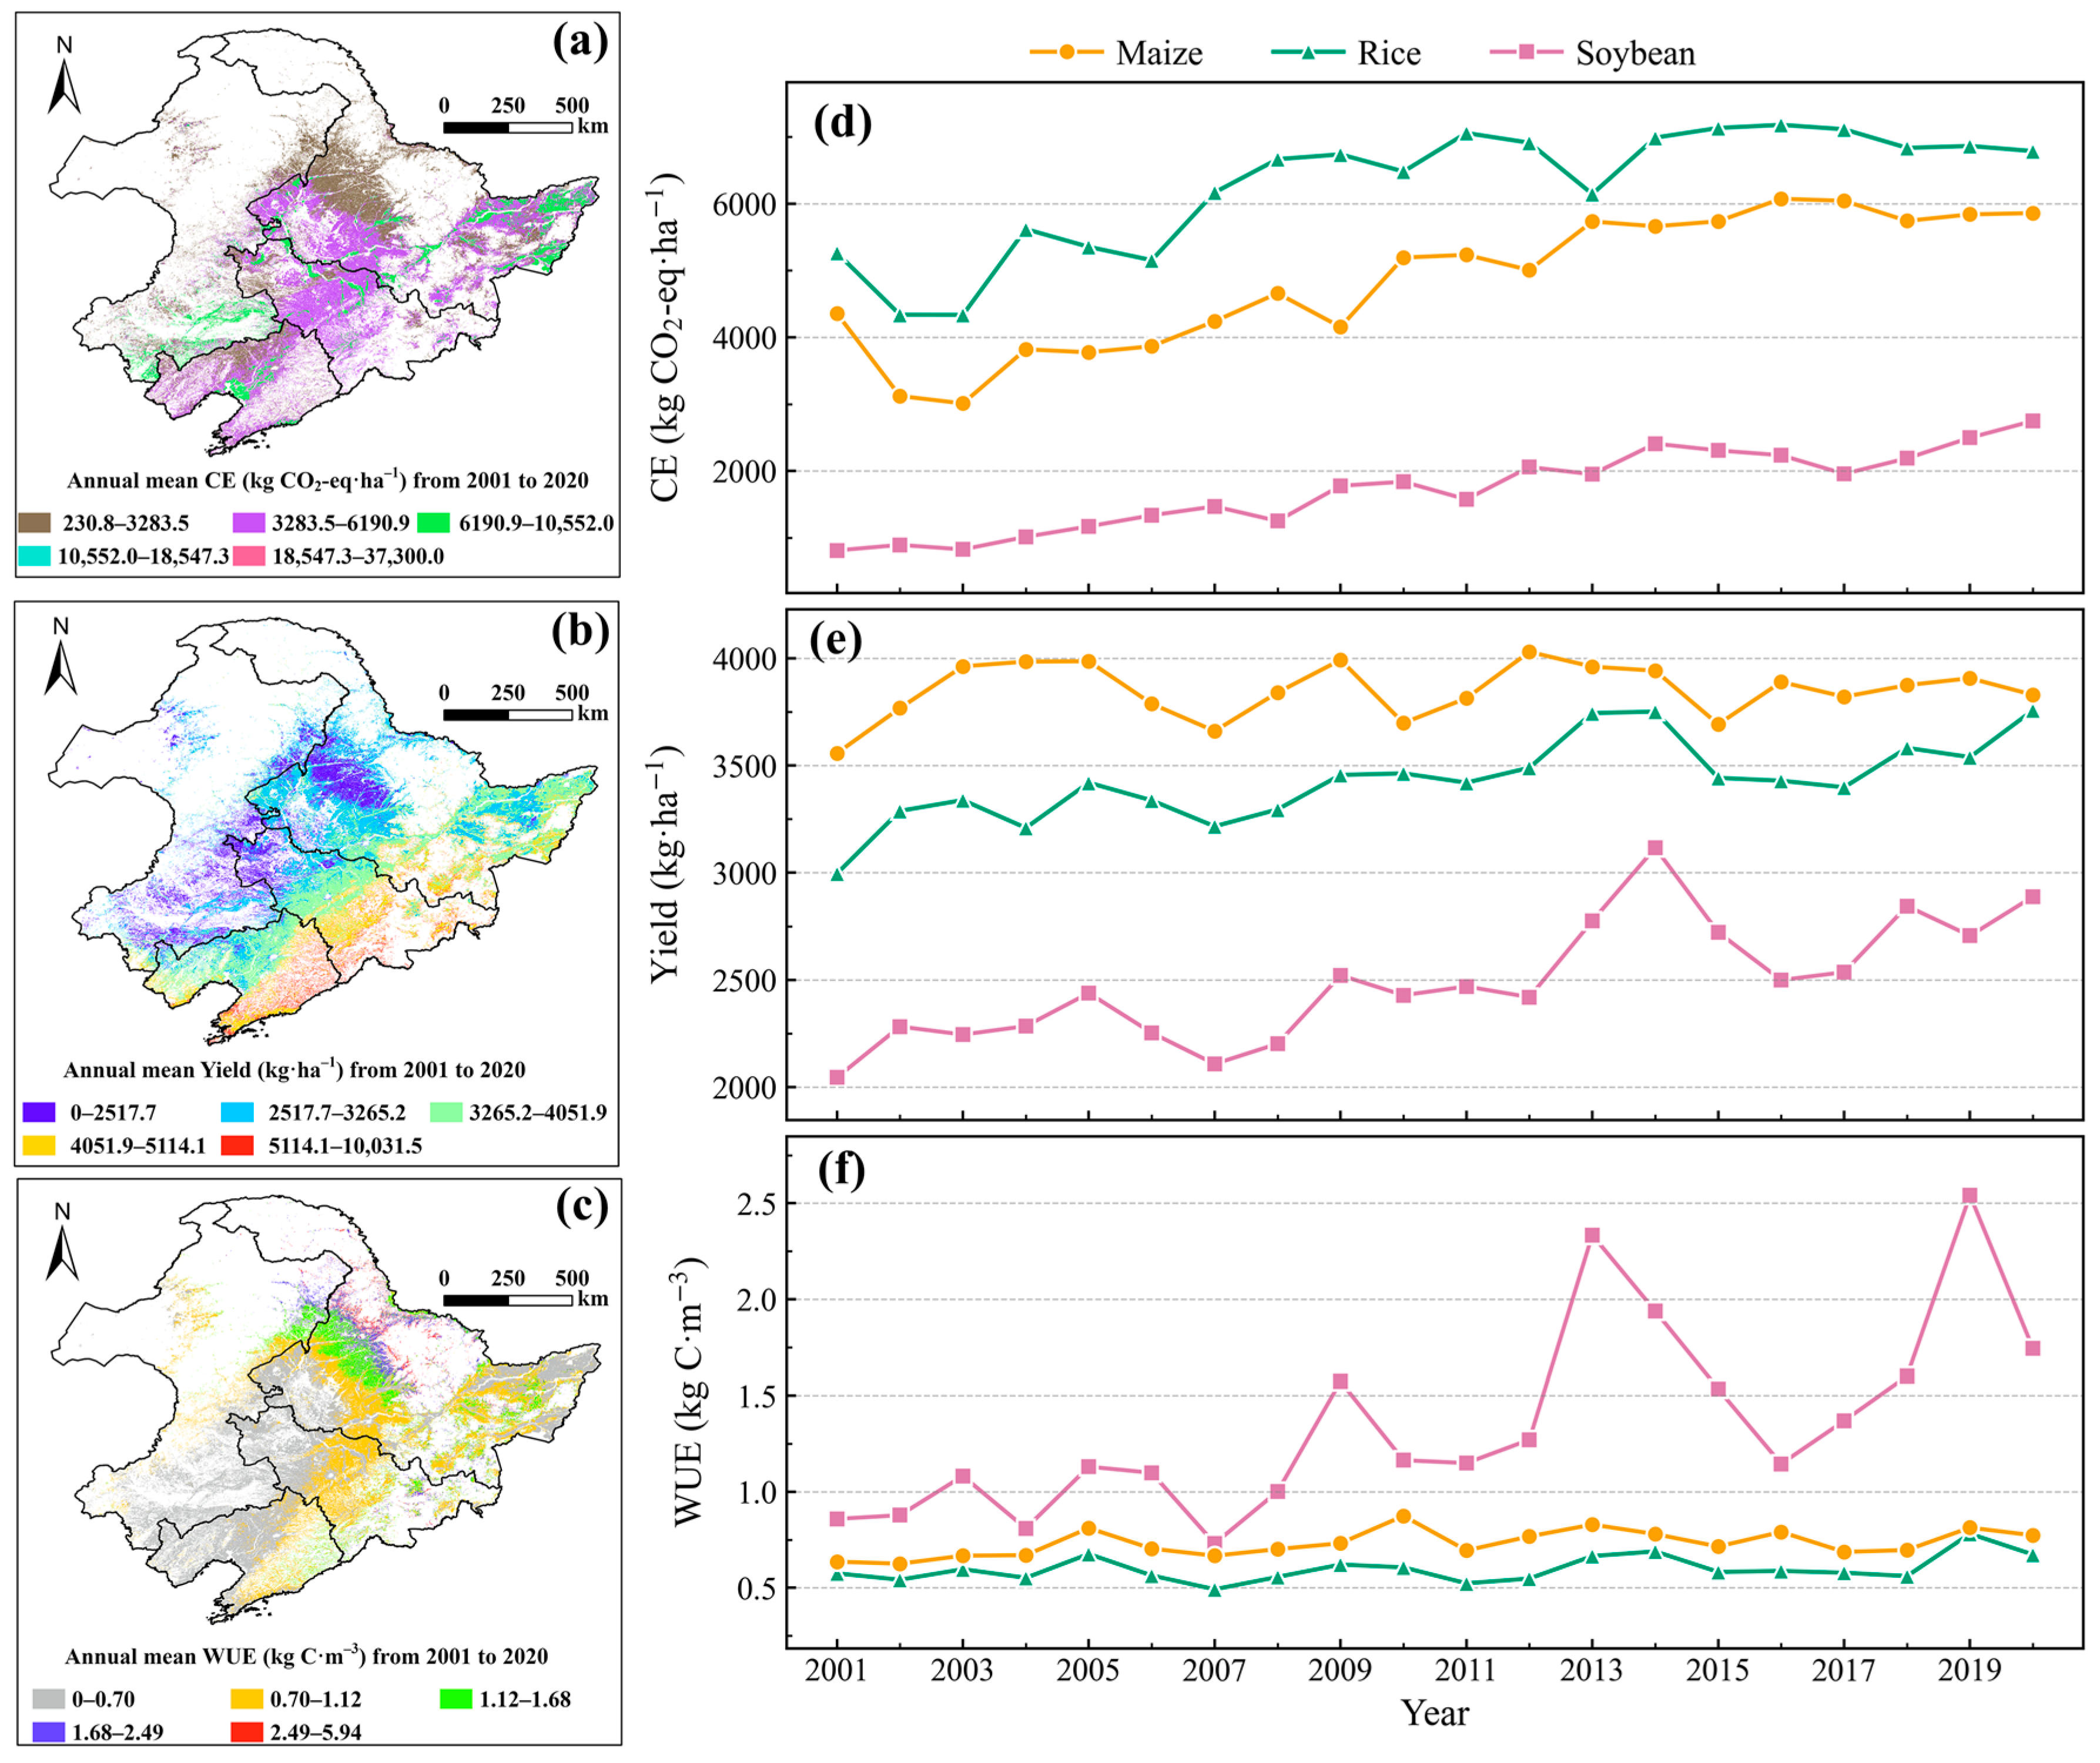
To test Hypothesis 1 (spatial heterogeneity and crop-specific FCW patterns), we first mapped the multi-year mean patterns and interannual trajectories of CEs, yield, and WUE for maize, rice, and soybean across NEC (Figure 2). Annual mean CEs (230.8–37,300 kg CO2-eq ha−1), yield (0–10,031 kg ha−1), and WUE (0–6 kg C m−3) exhibited pronounced spatial heterogeneity across NEC croplands during 2001–2020 (Figure 2a–c). Spatially, higher CE intensities and higher yields were concentrated in the central–southern plains and declined toward the western and northern margins (Figure 2a,b), whereas WUE showed a patchier pattern with localized high values rather than a monotonic regional gradient (Figure 2c). Interannually, crop-specific dynamics were evident (Figure 2d–f): CE increased overall for all three crops, with rice consistently exhibiting the highest CE, maize intermediate, and soybean the lowest but rising toward the end of the period (Figure 2d). Yield also increased for maize and rice with comparatively modest year-to-year variability, while soybean yield remained lower but showed episodic gains in the early-to-mid 2010s and again in the later years (Figure 2e). WUE displayed the strongest crop contrast: maize and rice varied within a relatively narrow range, whereas soybean WUE increased markedly and became more variable after the early 2010s, reaching peak values > 2.0 kg C m−3 (Figure 2f). Overall, NEC experienced concurrent increases in crop production and carbon emission intensity, accompanied by divergent water use trajectories across crops, with soybean showing the most pronounced WUE improvement.
Figure 2.
Spatial distributions and temporal dynamics of carbon emissions (CEs), crop yield and water use efficiency (WUE) in Northeast China (2001–2020). (a–c) Spatial patterns of annual means; (d–f) interannual variations in crop-specific means for maize, rice, and soybean.
3.2. Pixel-Scale Correlations Between CE, Yield, and WUE
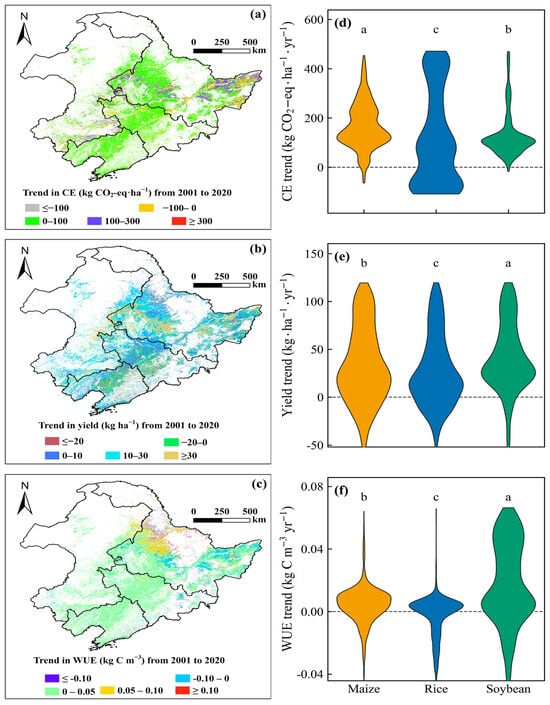
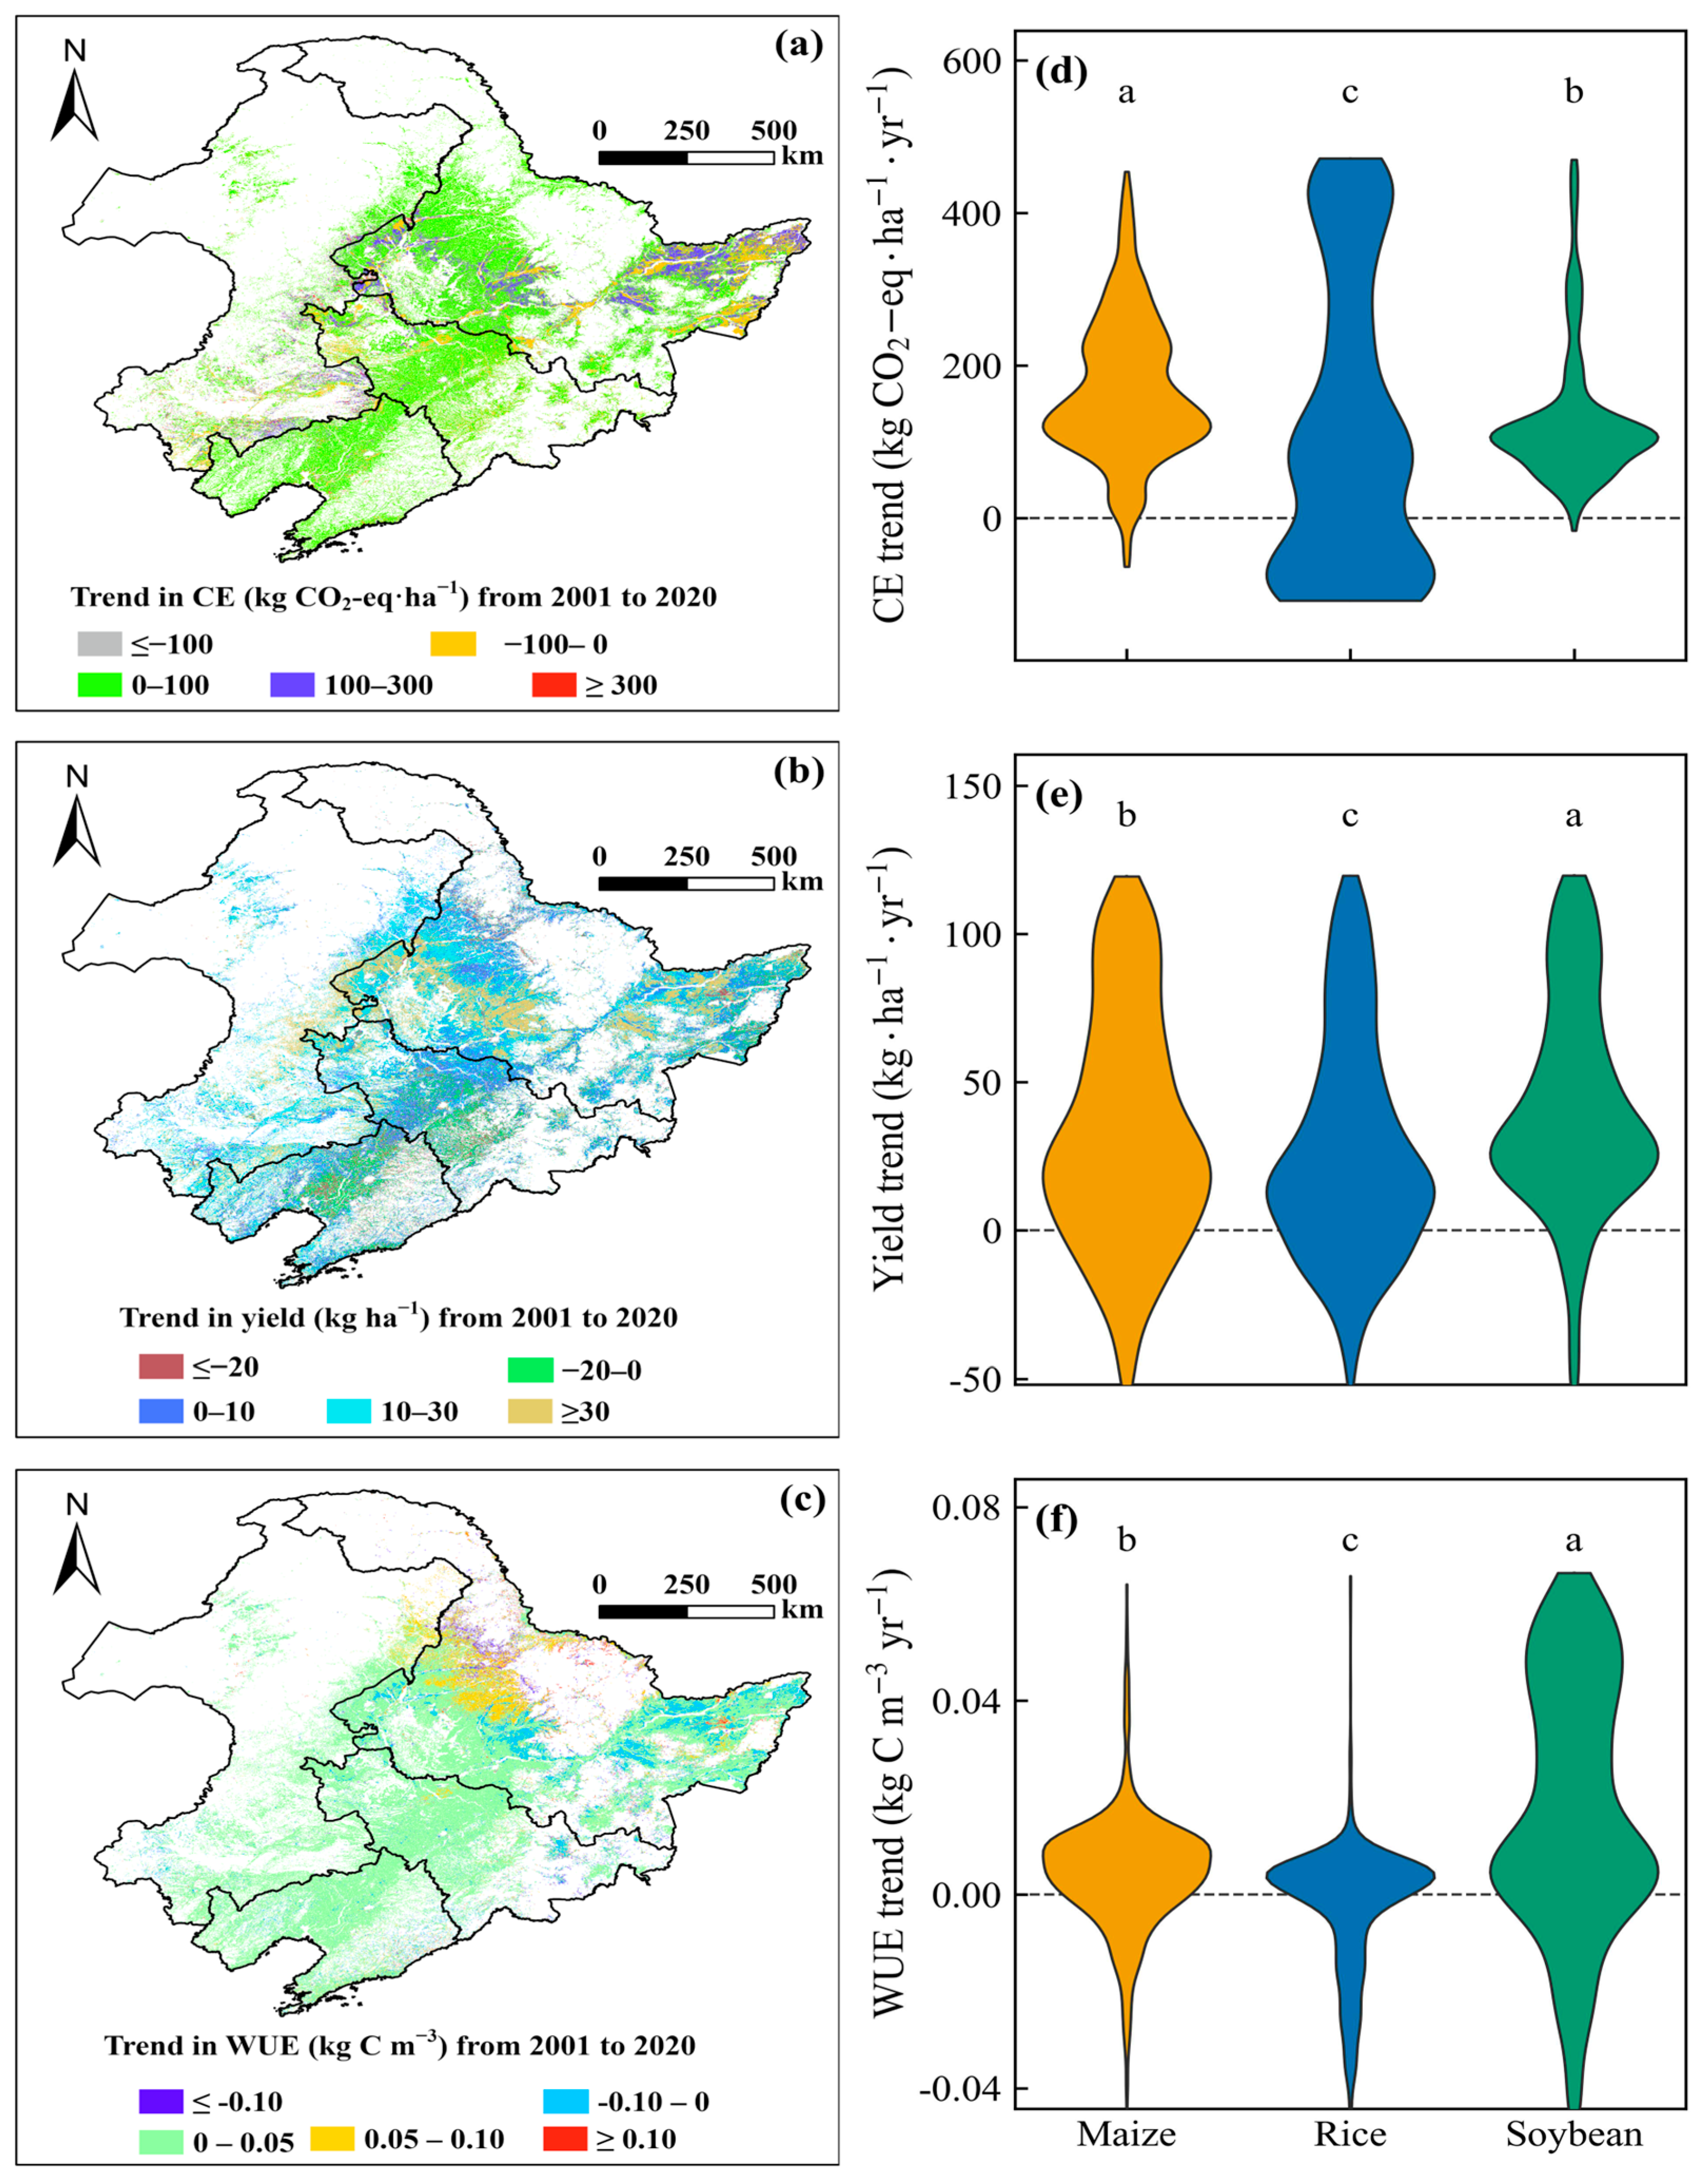
To further evaluate Hypothesis 1, we quantified pixel-wise Sen’s slope trends and interannual Pearson correlations among CE, yield, and WUE (Figure 3 and Figure 4). Pixel-scale Sen’s slope estimates showed pronounced spatial heterogeneity in long-term trends of yield and WUE across NEC croplands (Figure 3b,c). In contrast, the spatial pattern of CE trends largely followed province boundaries and crop distribution because CE is assigned uniformly within each province–crop stratum (Figure 3a). CE trends were predominantly positive, indicating widespread increases in emission intensity, while declines were limited in extent. Yield trends were generally positive but weaker in magnitude, characterized by extensive areas of modest increases and fewer patches of pronounced gains or persistent decreases (Figure 3b). WUE trends increased across most cropland pixels, with the strongest gains being concentrated in the southern and eastern croplands, whereas negative WUE trends were spatially limited and occurred mainly in scattered localized areas (Figure 3c). The violin plots further highlighted significant crop-specific contrasts (Figure 3d–f). CE trend distributions differed markedly among crops, with maize showing the strongest positive central tendency, soybean intermediate, and rice the weakest and most variable distribution with a larger negative tail (Figure 3d). Soybean exhibited the highest yield trend among crops (Figure 3e) and the largest WUE increases (Figure 3f), whereas rice showed comparatively small WUE changes. NEC experienced broadly increasing CEs alongside improving crop production, while WUE responses diverged substantially among crops, with soybean showing the greatest improvement in WUE.
Figure 3.
Spatial patterns and crop distributions of long-term trends in carbon emissions (CEs), yield, and water use efficiency (WUE) in Northeast China (2001–2020). (a–c) Spatial maps of Sen’s slope trends; (d–f) violin plots of trend distributions for maize, rice, and soybean. Letters denote significant differences among crops (Kruskal–Wallis test followed by Dunn’s post hoc test with Bonferroni correction, p < 0.05). For visualization, extreme values were truncated to the central 95% range, whereas statistical tests were performed on the full dataset. CE has no within-province spatial variability for a given crop in a given year by construction.
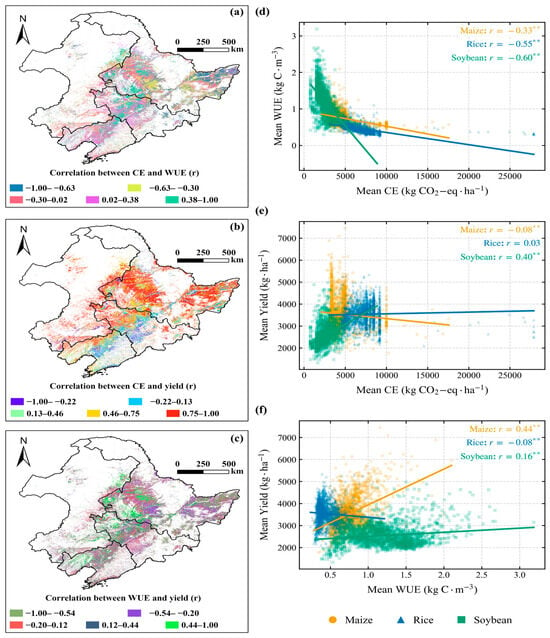
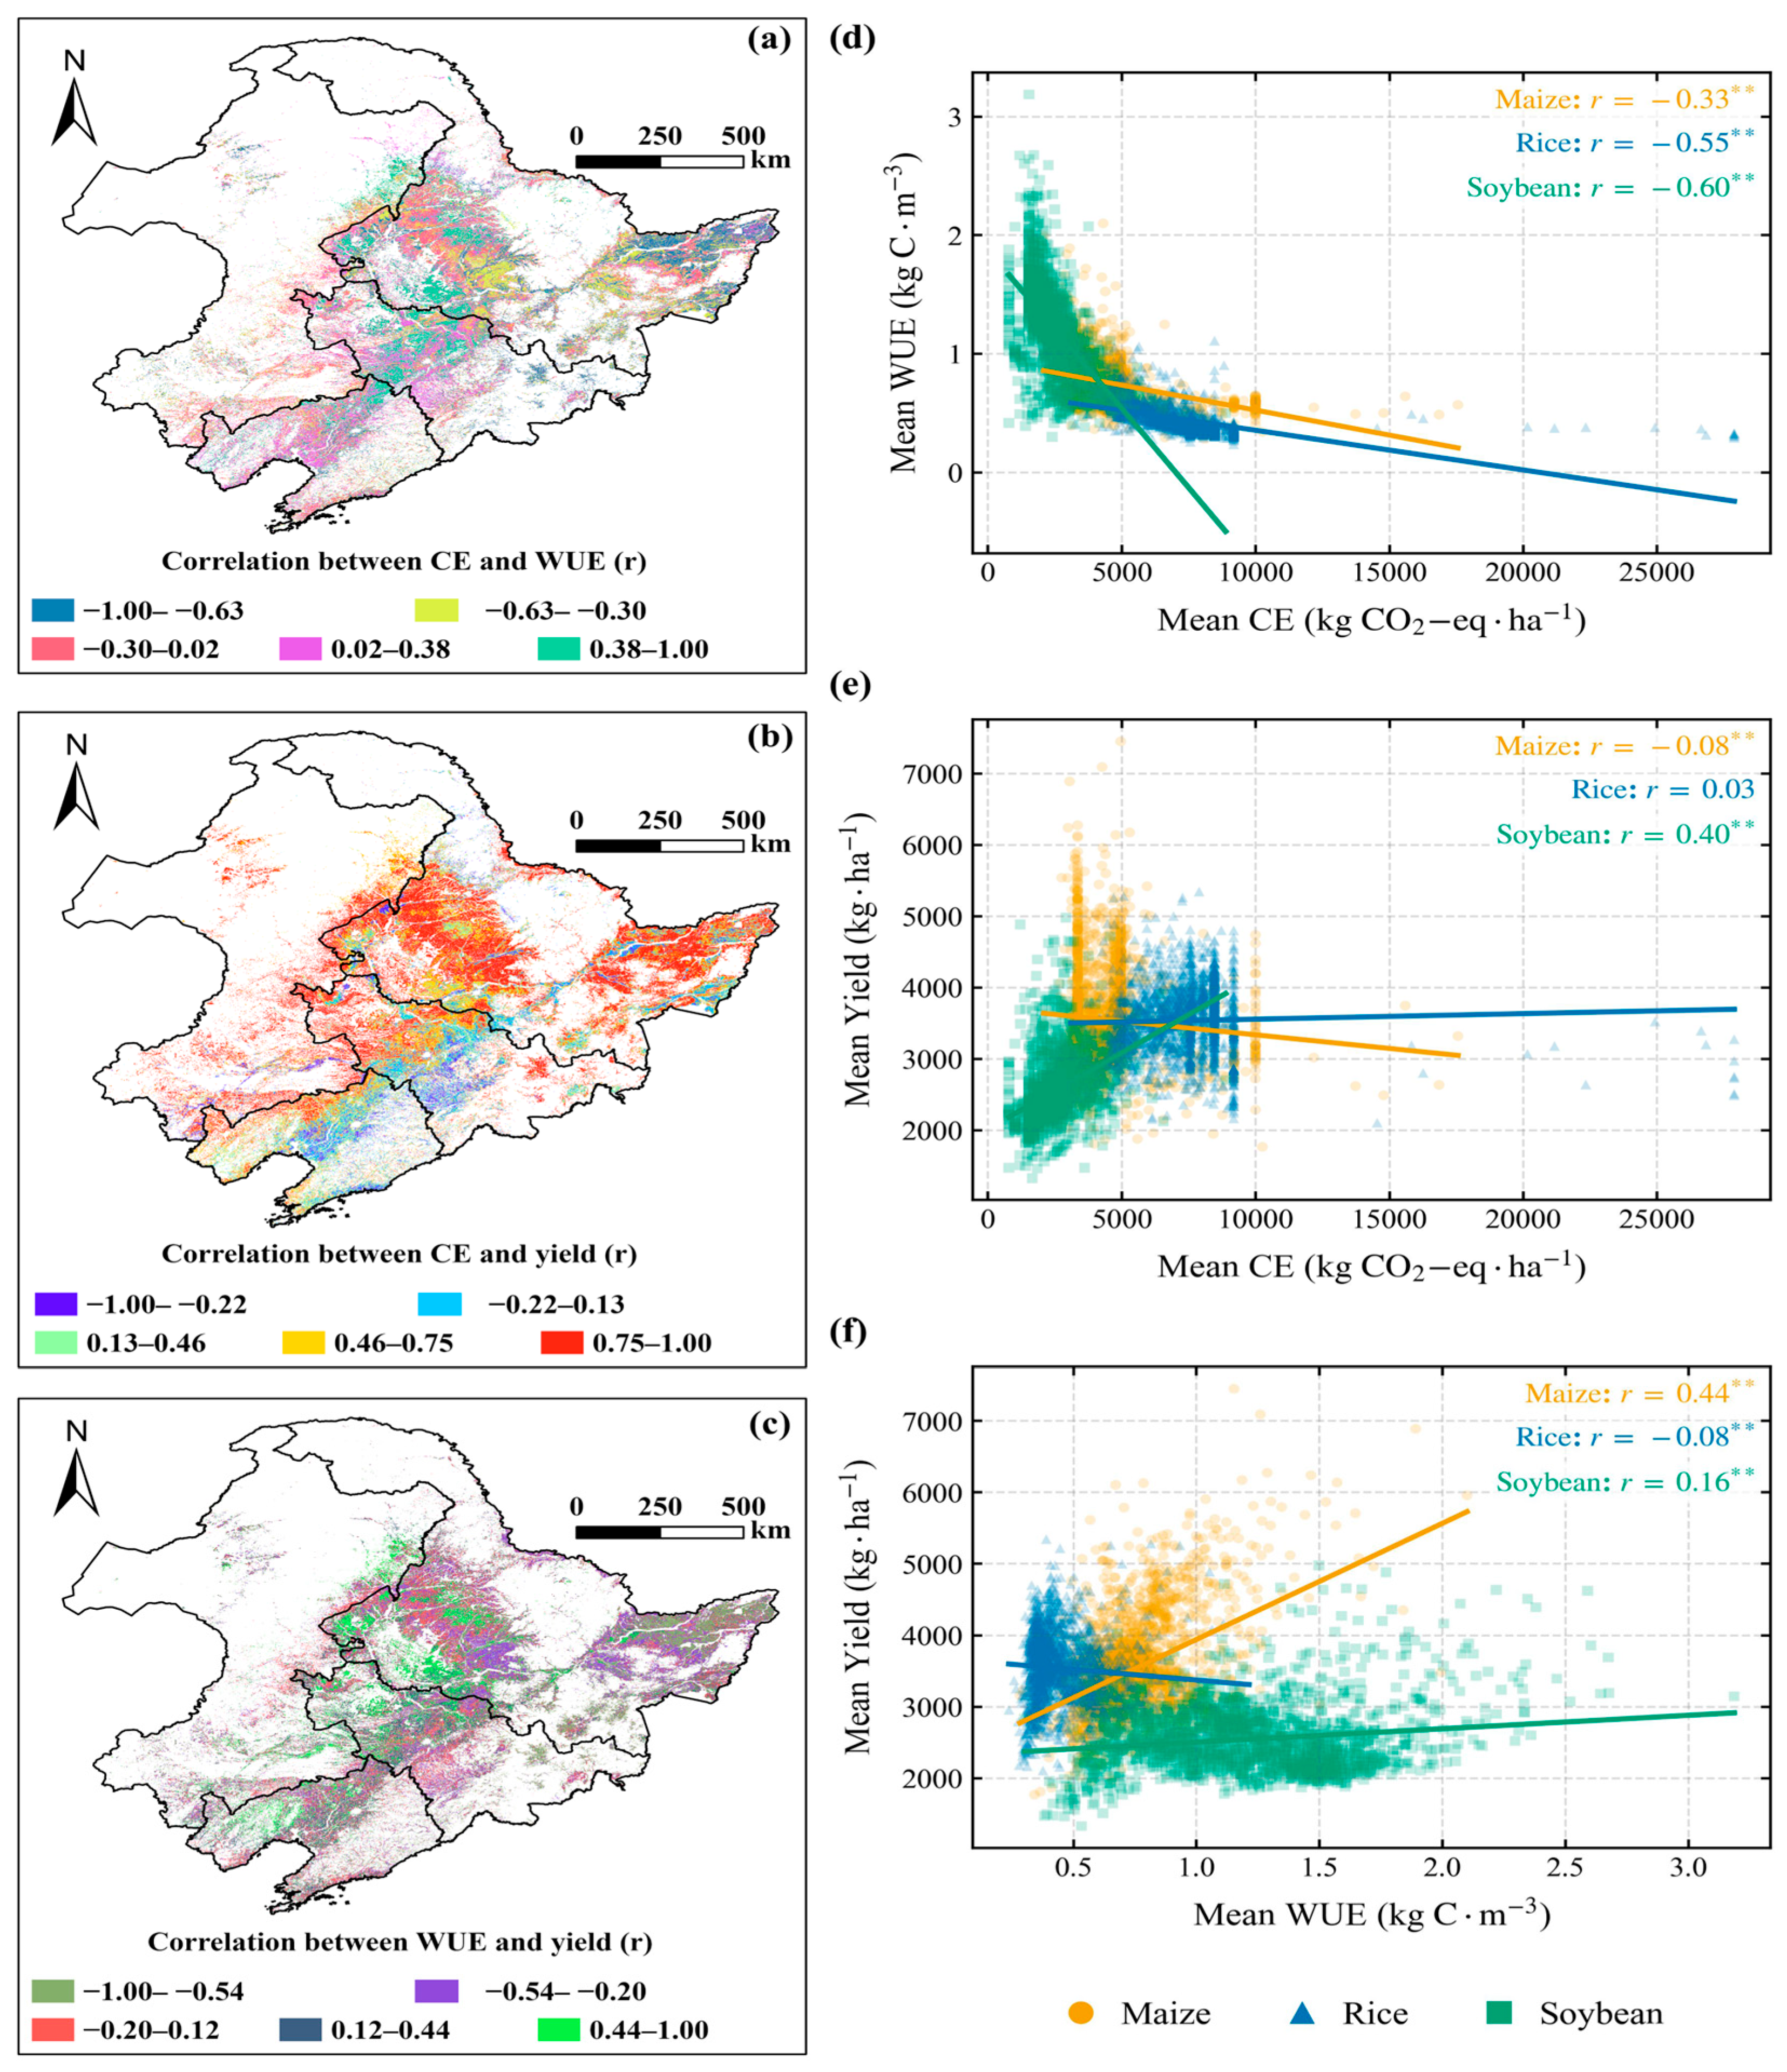
Figure 4.
Spatial patterns of Pearson correlation coefficients (r) and scatter plots of multi-year mean values among carbon emissions (CEs), water use efficiency (WUE), and crop yield in Northeast China’s croplands (2001–2020). (a–c) Spatial distributions of r for CE–WUE, CE–yield, and WUE–yield; (d–f) crop-specific scatter plots with linear regression lines and Pearson’s r (asterisks indicate significance: ** p < 0.01).
Pixel-scale Pearson correlations revealed clear crop-dependent coupling among CE, WUE, and yield across NEC croplands (Figure 4). Spatially, CE–WUE correlations ranged from strongly negative to positive, with widespread negative values and only scattered positive patches (Figure 4a), indicating that higher emission intensity often coincided with lower WUE. CE–yield correlations were predominantly positive and spatially concentrated in large portions of the central and eastern croplands (Figure 4b), suggesting that yield gains were frequently accompanied by higher emissions. In contrast, WUE–yield correlations were more heterogeneous, with mixed positive and negative clusters across the region (Figure 4c). Scatter plots of multi-year means further confirmed these crop-specific relationships (Figure 4d–f). CE was negatively associated with WUE for all crops, with stronger negative correlations in rice (r = −0.55 **) and soybean (r = −0.60 **) than in maize (r = −0.33 **) (Figure 4d). CE–yield relationships differed by crop: soybean showed a clear positive association (r = 0.40 **), maize exhibited a weak negative association (r = −0.08 **), and rice showed no significant relationship (r = 0.03) (Figure 4e). For WUE–yield, maize displayed a moderate positive association (r = 0.44 **), soybean a weak positive association (r = 0.16 **), and rice a weak negative association (r = −0.08 **) (Figure 4f).
3.3. Synergies and Trade-Offs in Long-Term Trends of CE, Yield, and WUE
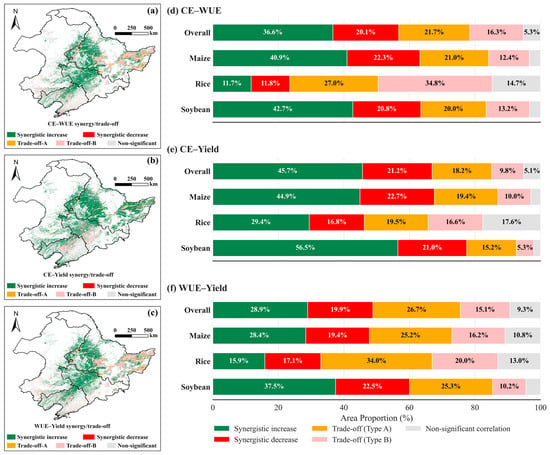
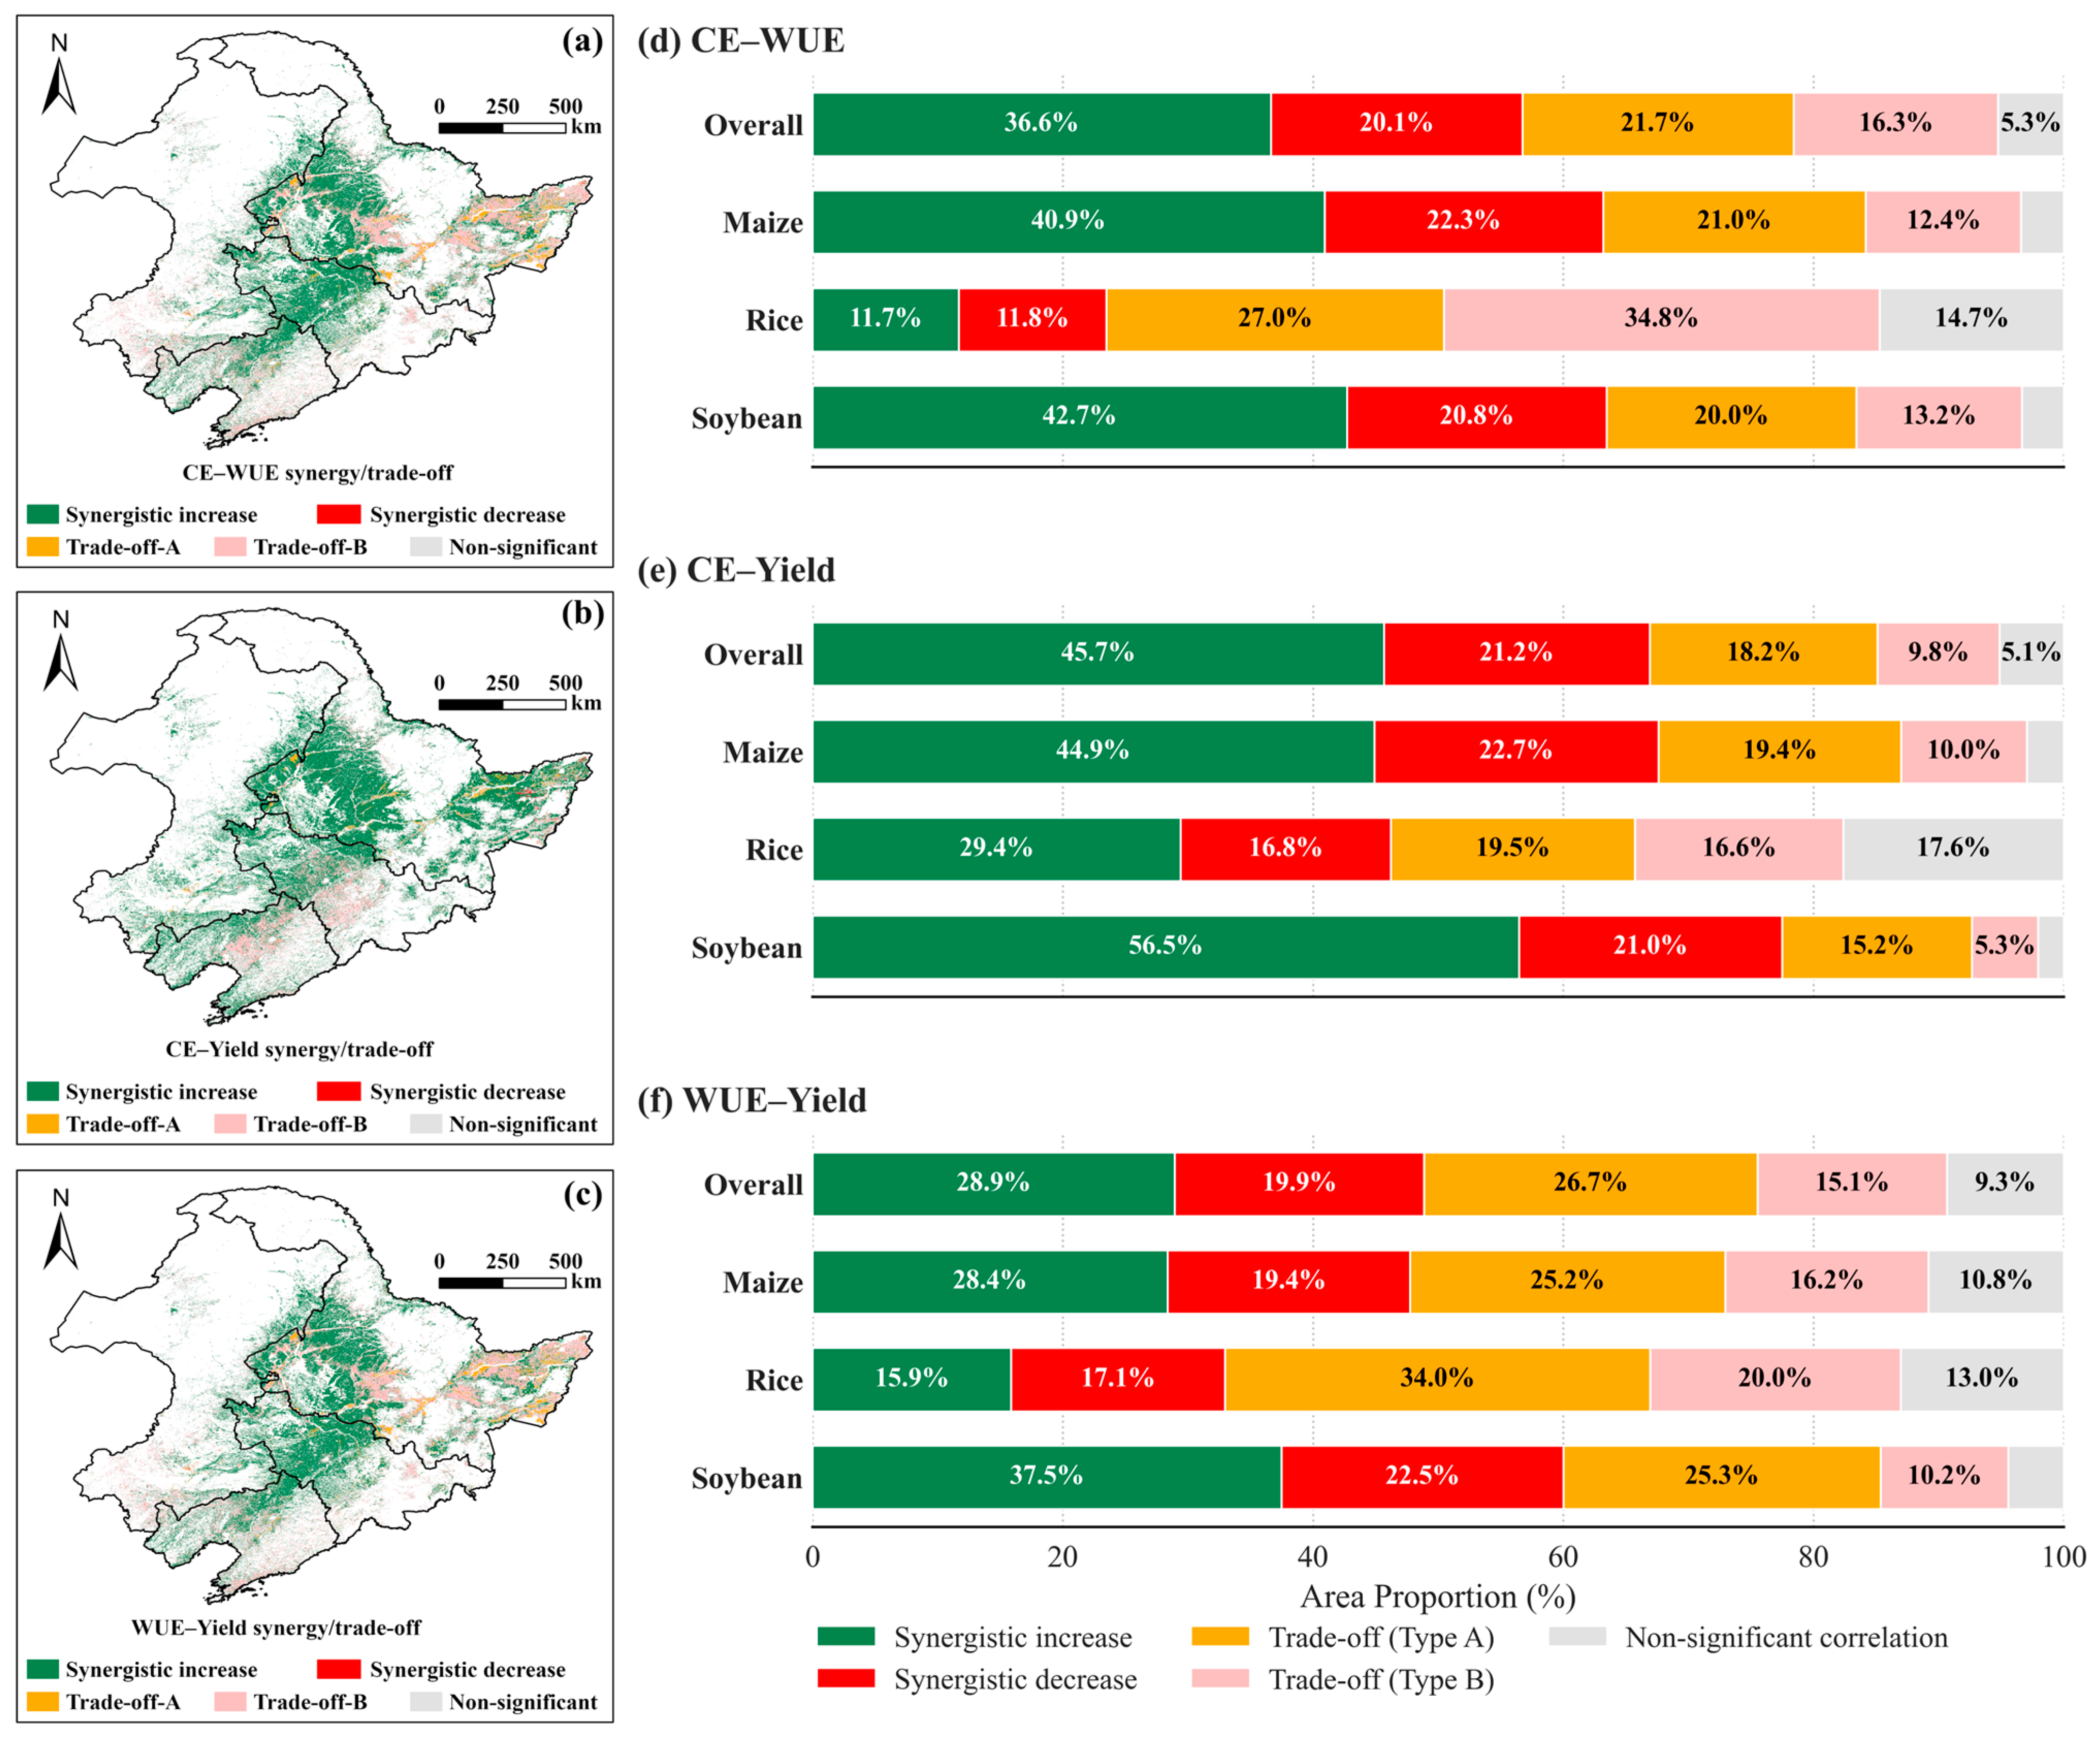
To test Hypotheses 1 and 2, we classified pixel-level synergies and trade-offs for the three indicator pairs based on the sign and significance of Sen’s slopes (Figure 5, Figure 6 and Figure 7). Across NEC croplands, the CE–yield pair was dominated by synergistic increase, accounting for 45.7% of the total area. This co-increase pattern was most prevalent in soybean systems (56.5%), followed by maize (44.9%) and rice (29.4%), whereas synergistic decrease remained lower (21.2% overall) (Figure 5b,e). In contrast, CE–WUE exhibited a substantially higher share of trade-offs (Types A and B combined 38.0% overall), with the strongest trade-off dominance in rice (61.8%) compared with maize (33.4%) and soybean (33.2%) (Figure 5a,d). For the WUE–yield pair, trade-offs were also widespread (41.8% overall), peaking in rice (54.0%) and remaining lower in maize (41.4%) and soybean (35.5%) (Figure 5c,f). Overall, yield gains were commonly accompanied by increasing emission intensity, whereas WUE-involved pairs showed larger shares of opposite-direction trends, particularly in rice systems; interpretation of WUE–yield coupling should consider their shared NPP dependence.
Figure 5.
Spatial patterns and area proportions of synergies and trade-offs in long-term trends among carbon emissions (CEs), water use efficiency (WUE), and crop yield in Northeast China’s croplands (2001–2020). (a–c) Maps of trend-coupling categories for CE–WUE, CE–yield, and WUE–yield pairs; (d–f) area proportion of coupling category for maize, rice, soybean, and overall.
Figure 6.
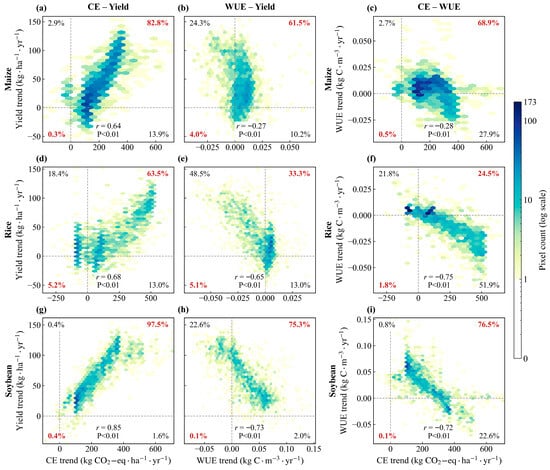
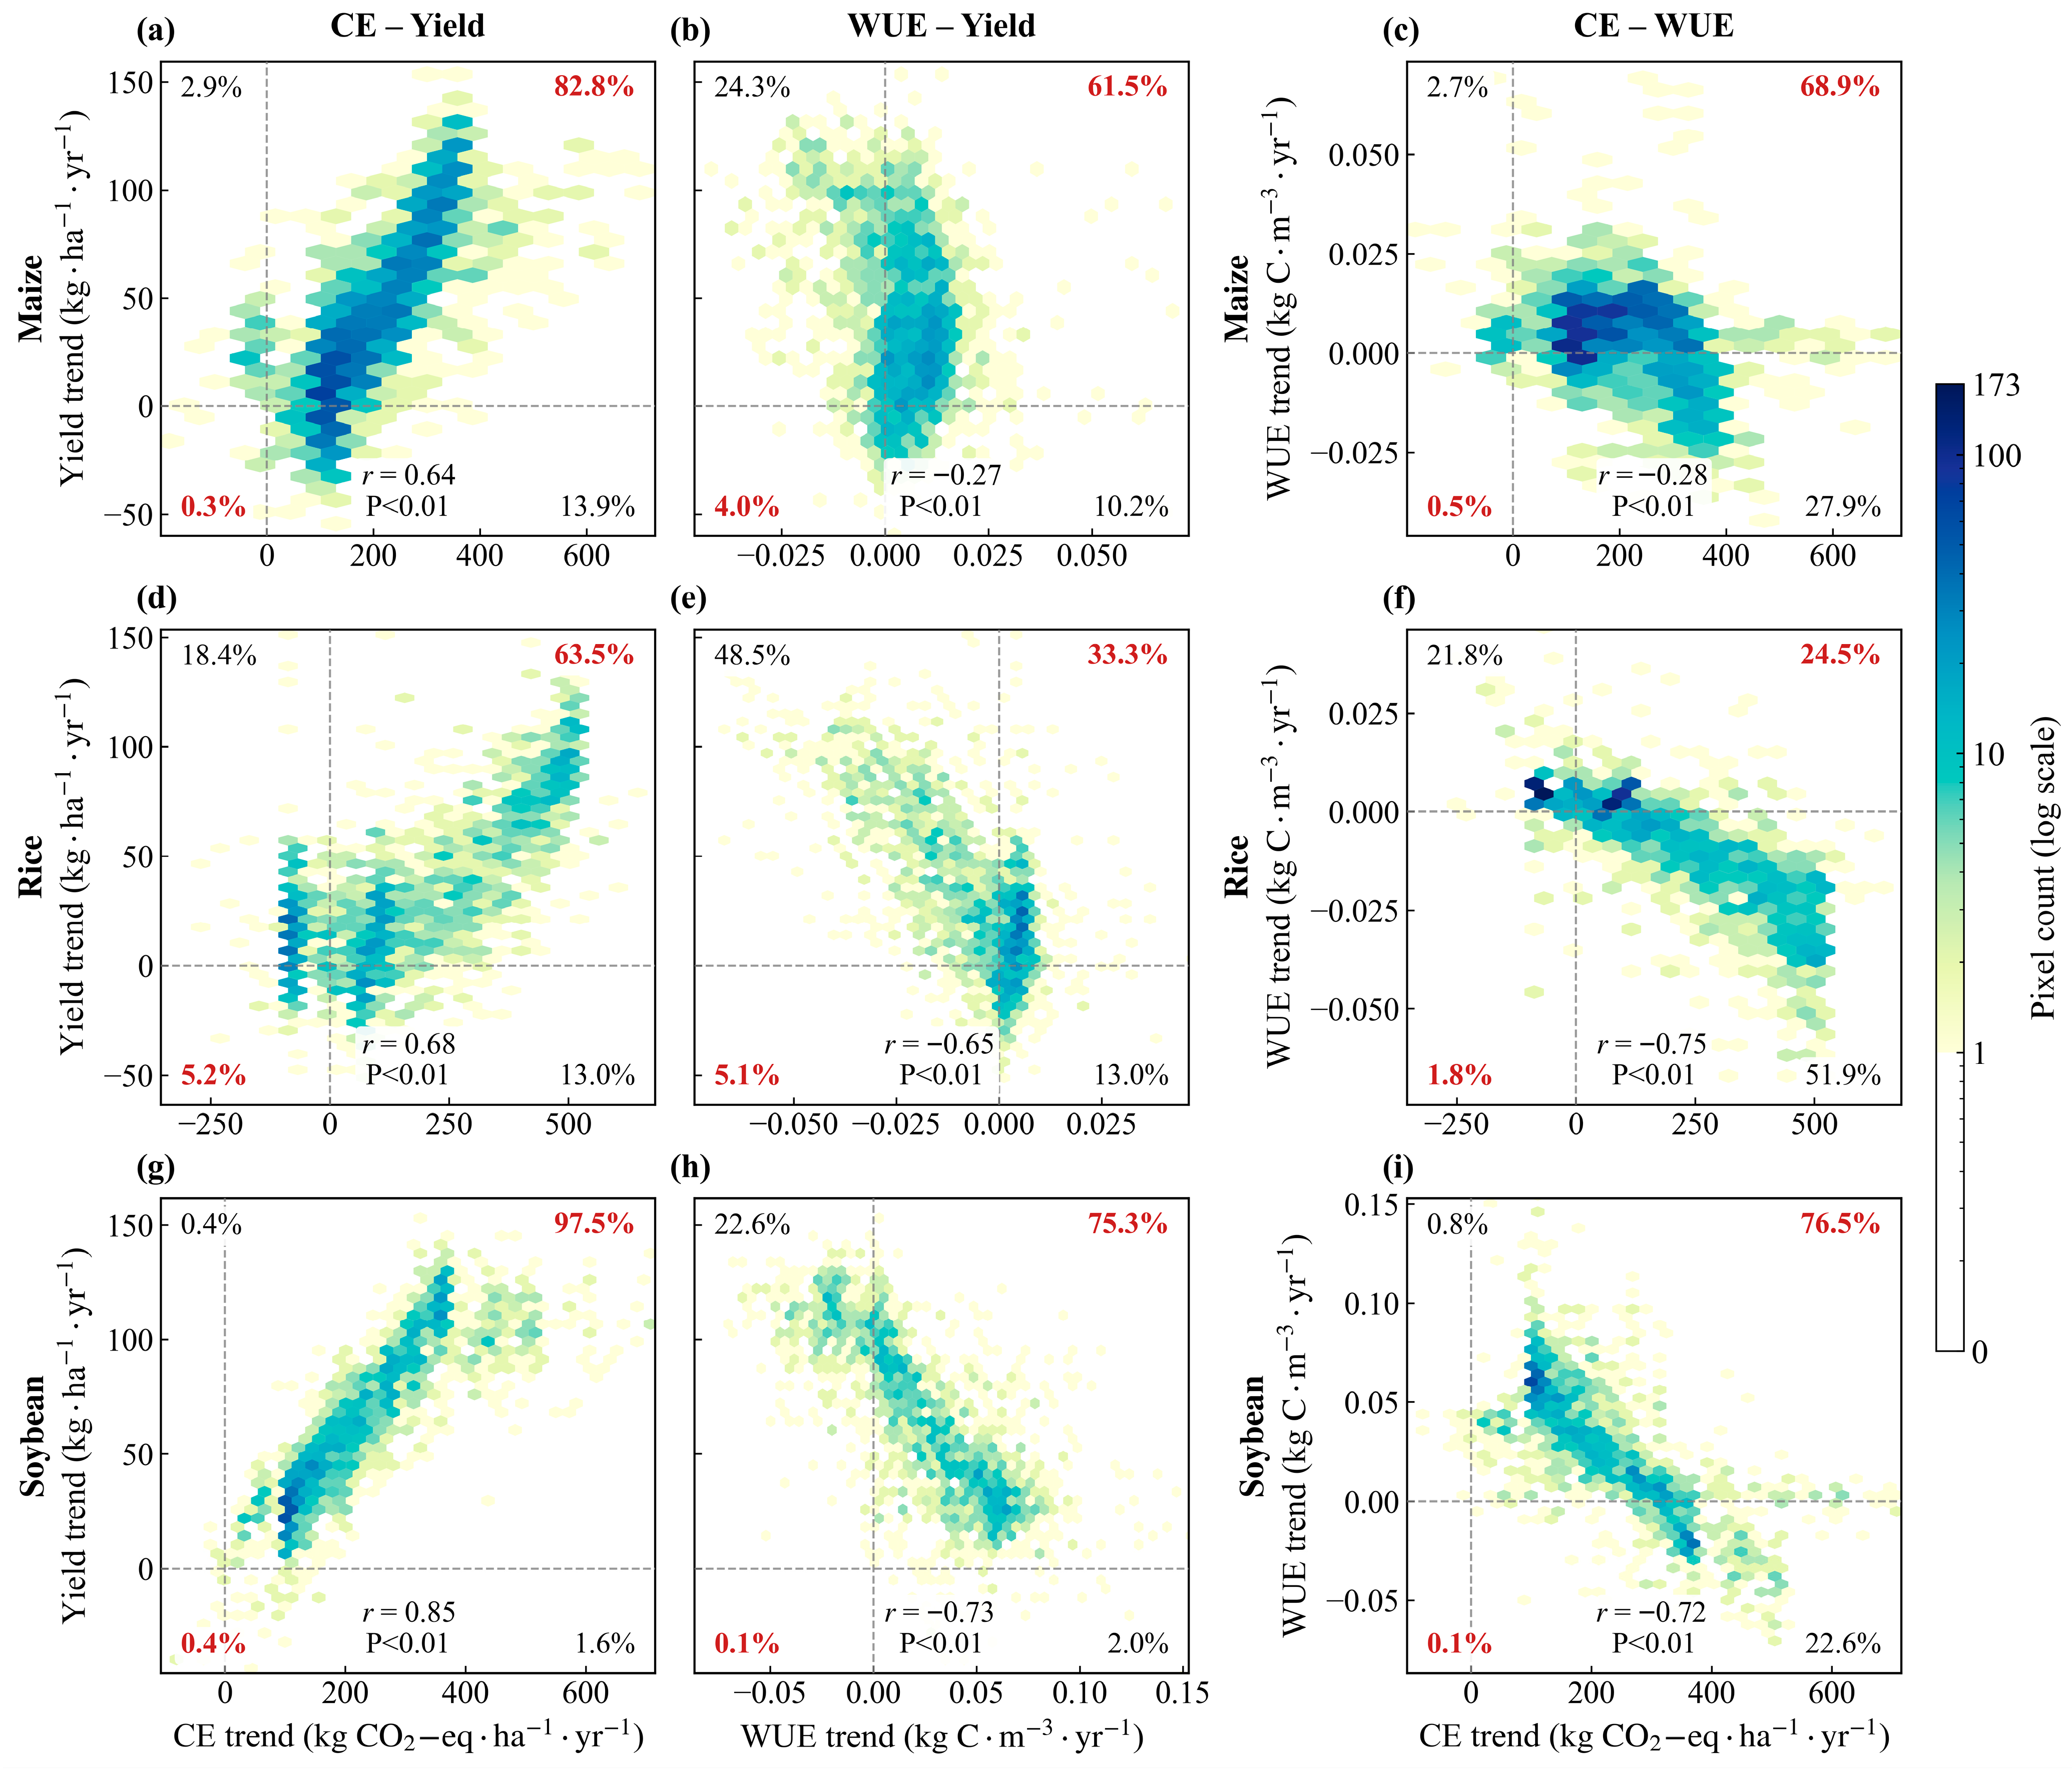
Pixel-level relationships among long-term trends in carbon emissions (CEs), water use efficiency (WUE), and crop yield in Northeast China’s croplands (2001–2020). (a–i) Hexbin plots of Sen’s slope trends for CE–yield (a,d,g), WUE–yield (b,e,h), and CE–WUE (c,f,i) across maize (a–c), rice (d–f), and soybean (g–i). Color intensity indicates logarithmic pixel density (log10 scale). Quadrant percentages denote proportions of synergistic increases (I), synergistic decreases (III), and trade-offs (II, IV); corner percentages denote the proportions of pixels in each quadrant. Pearson’s r denotes the correlation of paired trend slopes (p < 0.01 for all).
Figure 7.
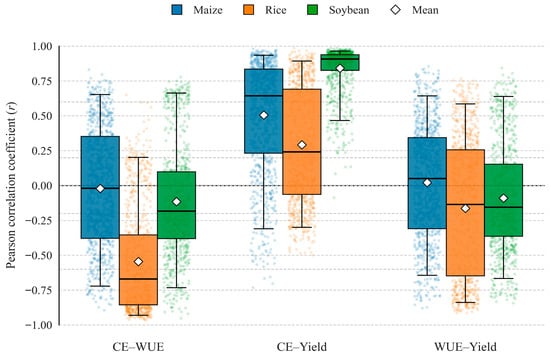
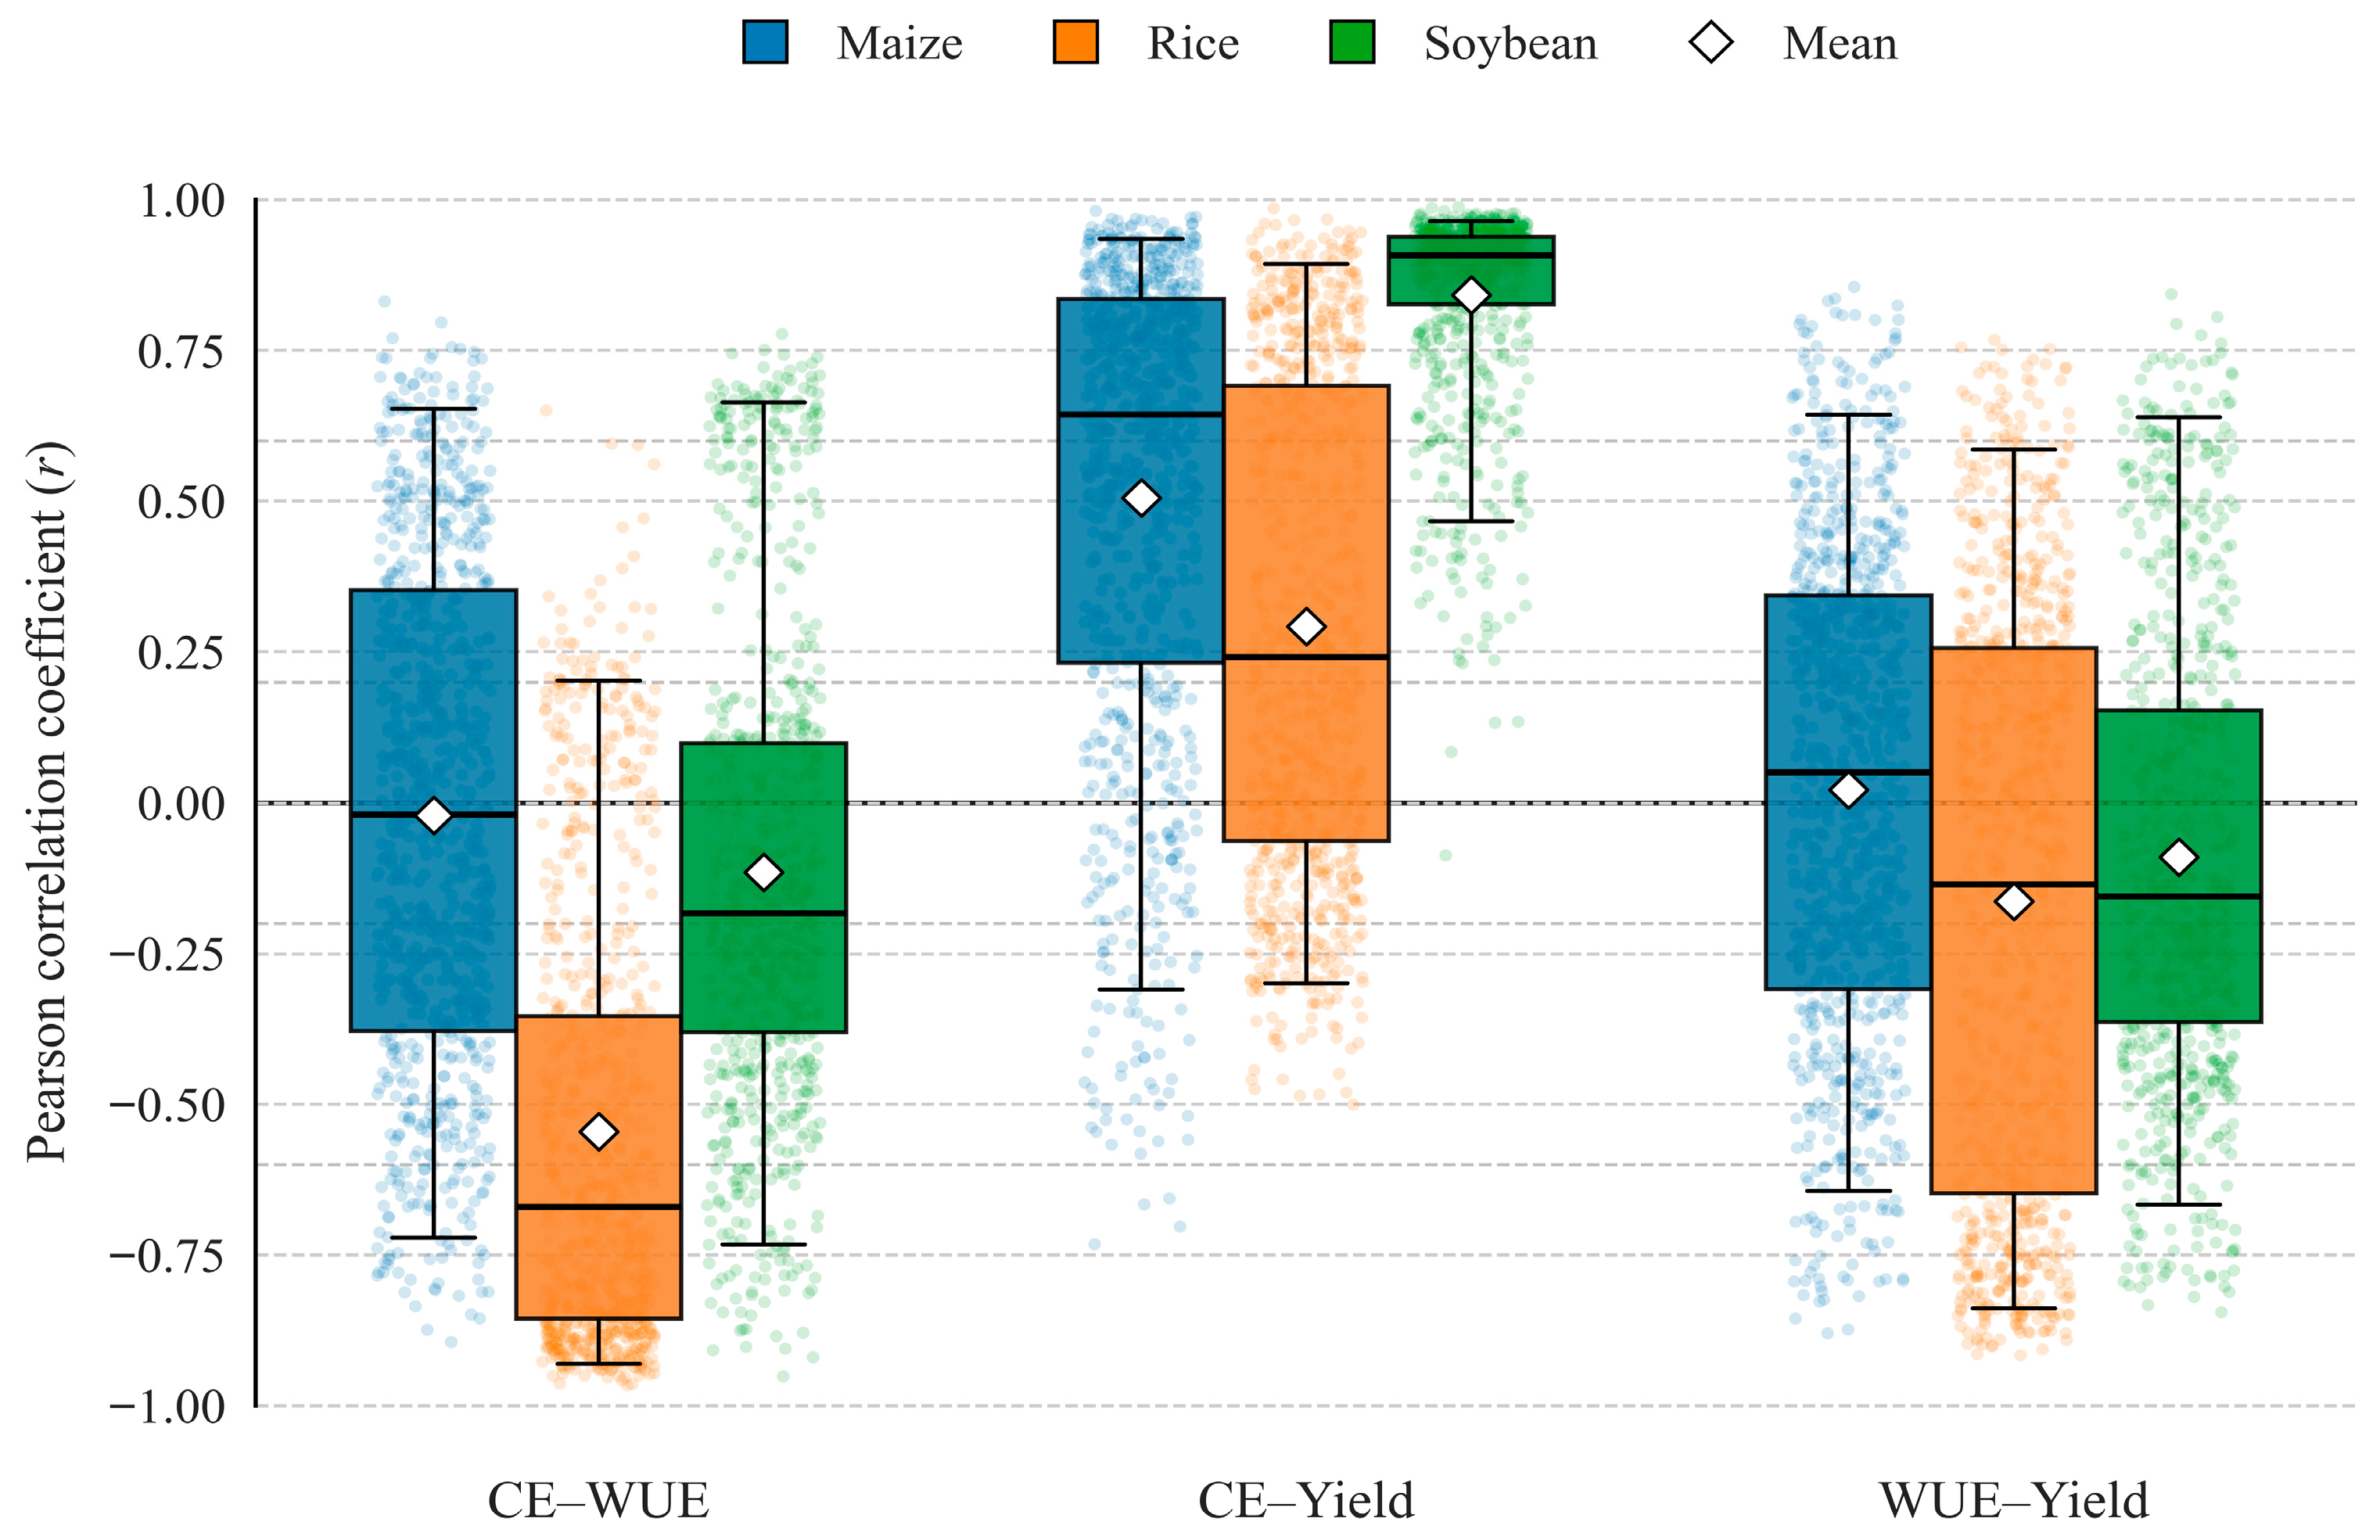
Distributions of per-pixel interannual Pearson correlation coefficients (r) among carbon emissions (CEs), water use efficiency (WUE), and crop yield for maize, rice, and soybean in Northeast China’s croplands (2001–2020). Points represent time-series r per pixel; boxplots show medians (lines), means (diamonds), interquartile ranges (boxes), and 5th–95th percentiles (whiskers).
Long-term changes in the FCW nexus showed a clear contrast between the emission–production linkage and water-related coupling (Figure 6 and Figure 7). Trend relationships indicated a consistently positive association between CEs and yield across crops (r = 0.64–0.85; all p < 0.01), with concurrent increases (quadrant I) dominating maize (82.8%), rice (63.5%), and soybean (97.5%), whereas concurrent decreases (quadrant III) were rare (≤5.2%) (Figure 6a,d,g). In contrast, WUE–yield trend coupling was negative for all crops (r = −0.27 to −0.73; all p < 0.01) and strengthened from maize to rice and soybean, indicating that yield improvements were frequently accompanied by declining WUE, particularly in rice and soybean systems (Figure 6b,e,h). Likewise, CE–WUE trend coupling was uniformly negative (r = −0.28 to −0.75; all p < 0.01), with the largest share of pixels showing rising CE together with declining WUE (quadrant IV: 27.9% in maize, 51.9% in rice, and 22.6% in soybean) (Figure 6c,f,i). Consistent with these trend-based patterns, per-pixel interannual Pearson correlations reinforced a broadly negative CE–WUE relationship and a generally positive, but crop-dependent, CE–yield coupling, while WUE–yield correlations were weakly positive in maize but negative in rice and soybean (Figure 7). Collectively, these results suggest that long-term yield gains across NEC were commonly achieved alongside increasing emission intensity, whereas the water-related component introduced persistent trade-offs, especially for rice.
3.4. Coupling Coordination Degree of the Food–Carbon–Water Nexus
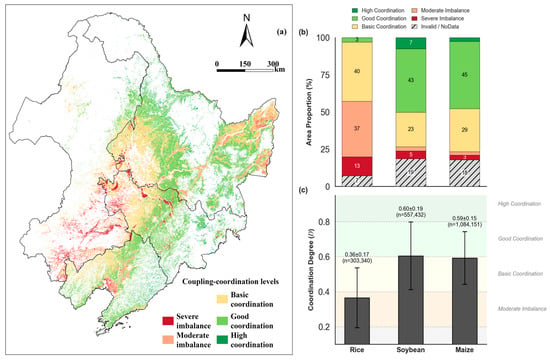
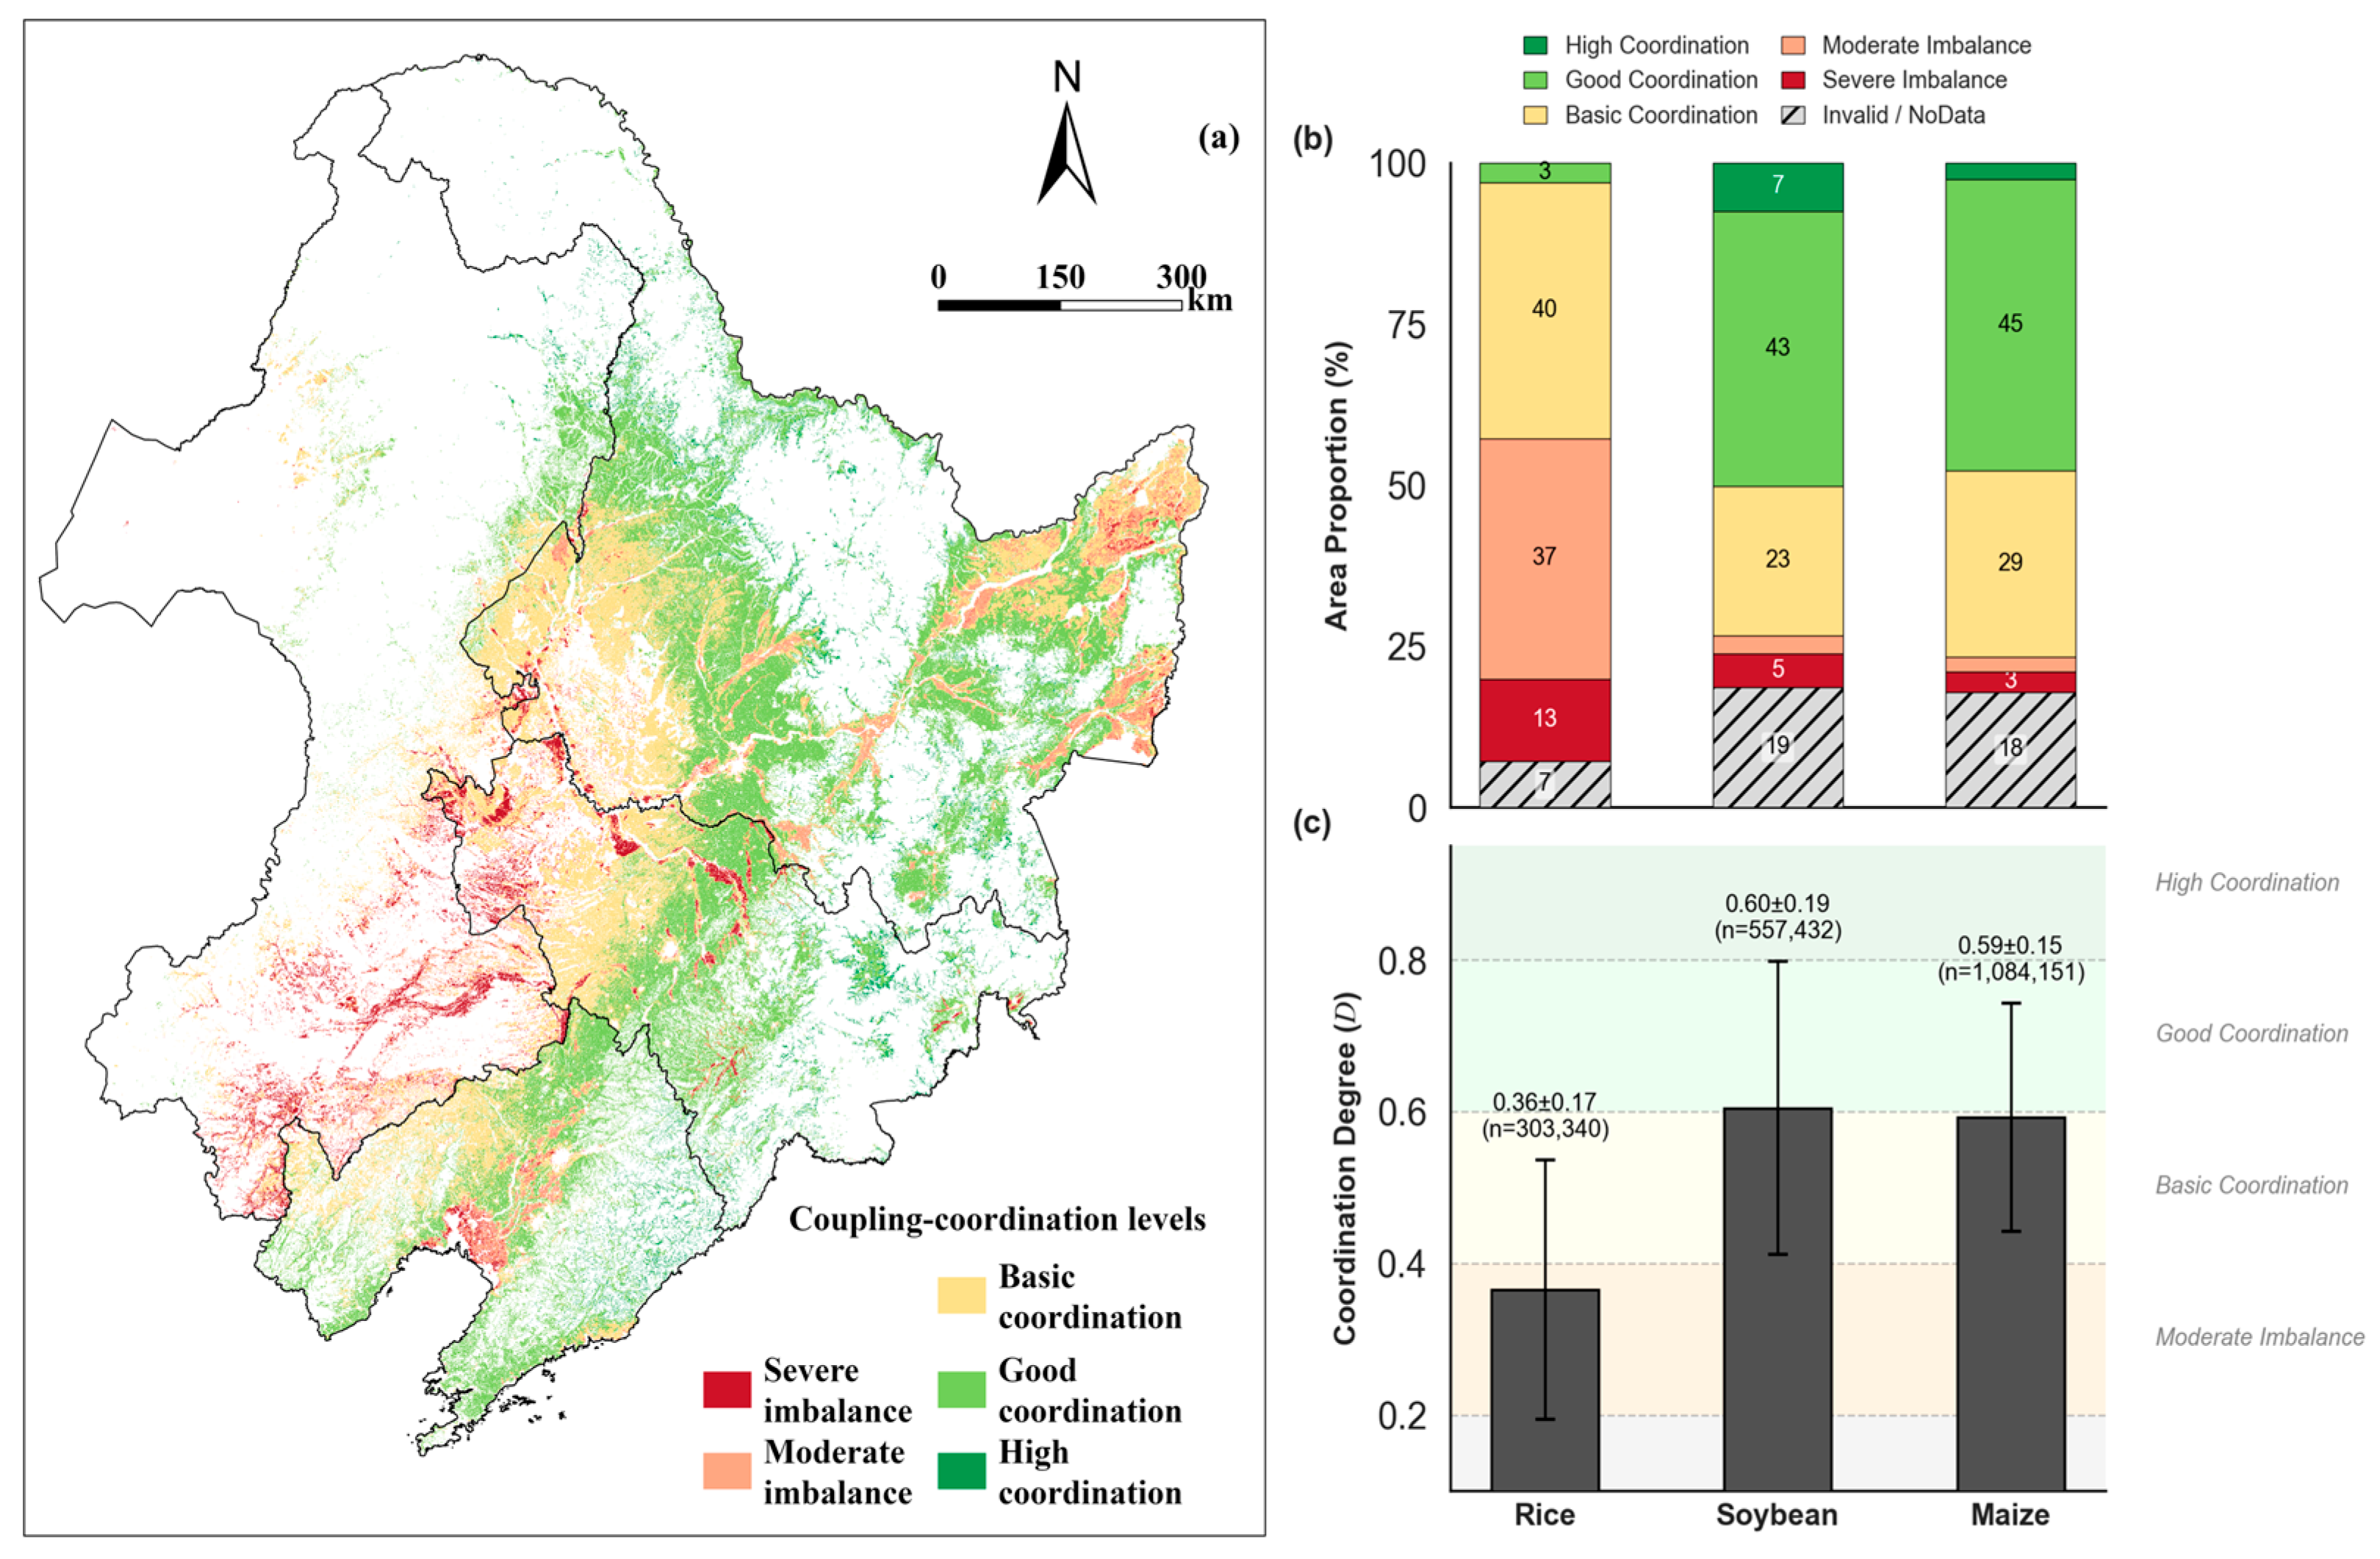
To test Hypotheses 2 and 3, we synthesized CEs, WUE, and yield into CCD and mapped coordination classes across NEC (Figure 8). The CCD assessment indicated that NEC croplands were dominated by basic-to-good coordination, with clear spatial clustering by landscape position and cropping systems (Figure 8). Spatially, basic coordination (0.4–0.6) prevailed across the major cultivated plains, whereas good-to-high coordination (≥0.6) was concentrated in the central–eastern uplands and along intensively managed production belts. Moderate and severe imbalance occurred mainly in localized marginal or transitional areas and along scattered patches of intensive cropland where subsystem levels were strongly mismatched (Figure 8a). Area composition further highlighted crop contrasts (Figure 8b). Rice exhibited the largest share of moderate imbalance (37%) and severe imbalance (13%), with only a small fraction reaching good/high coordination (3%), whereas soybean and maize showed substantially higher proportions of good and high coordination (soybean: 43% good and 7% high; maize: 45% good and a small high coordination fraction) despite non-negligible invalid pixels (19% and 18%, respectively). Consistent with these distributions, mean CCD values were crop-dependent (Figure 8c): rice had the lowest average coordination (0.36 ± 0.17), while soybean (0.60 ± 0.19) and maize (0.59 ± 0.15) exhibited higher coordination and broader variability. These patterns suggest that coordination in the FCW nexus is generally suboptimal in rice systems, while maize and soybean systems more frequently achieve coordinated outcomes, implying substantial potential to improve nexus performance through targeted emission reduction and water management alongside agronomic optimization.
Figure 8.
Spatial patterns and crop-specific distributions of coupling coordination degree (CCD) levels for the carbon emission (CE)–water use efficiency (WUE)–yield system in Northeast China. (a) Spatial map of CCD categories; (b) area proportions by coordination level and crop; (c) mean ± SD of CCD values by crop (n denotes the number of valid pixels).
4. Discussion
4.1. Synergies and Trade-Offs Among CE, Yield, and WUE
Across NEC, trend–slope coupling showed a consistently positive association between inventory-based CEs and NPP-derived yield (r = 0.64–0.85; all p < 0.01), with concurrent increases dominating maize (82.8%), rice (63.5%), and soybean (97.5%) croplands (Figure 6). Because CE is uniform within each province–crop–year stratum whereas yield and WUE are derived at 500 m, this pattern should be interpreted as a scale-consistent association driven mainly by between-province and between-crop contrasts rather than field-level causal responses of emissions to yield. Accordingly, our maps are most suitable for regional diagnosis and zoning-oriented prioritization; management-level causal attribution would require finer-scale activity data and process-based emission modeling.
Water-related coupling introduced a persistent constraint. CE–WUE trend coupling was uniformly negative ( to , ), and a large fraction of pixels exhibited the “increasing CE coupled with declining WUE” configuration, particularly in rice (51.9%) (Figure 6). Likewise, WUE–yield trend coupling was negative for all crops ( to −0.73), implying that locations with stronger yield gains often showed weaker improvements—or even declines—in carbon-based water productivity. Taken together, the key nexus tension in NEC is not simply raising yield, but raising yield while stabilizing (or reducing) area-based emissions and sustaining water productivity.
Rice systems constituted the strongest FCW bottleneck. Rice showed the highest prevalence of WUE-involved trade-offs (CE–WUE: 61.8%; WUE–yield: 54.0%), and it also exhibited the lowest CCD (0.36 ± 0.17) with a disproportionately large share of moderate-to-severe imbalance. Mechanistically, continuously or long-duration flooded paddies tend to incur substantial non-productive water losses (e.g., percolation, seepage, and open-water evaporation) and create anaerobic conditions that elevate CH4 emissions, thereby weakening the translation of agronomic yield gains into improvements in water productivity and emissions performance [38,39,40]. Water-saving irrigation strategies such as alternate wetting and drying (AWD) have been widely reported to reduce irrigation demand and methane emissions while maintaining yields under appropriate thresholds, although potential N2O trade-offs highlight the need for coordinated water–nitrogen management [41,42,43]. In this context, closing the “water productivity gap” in rice is likely pivotal for improving overall FCW coordination in NEC.
4.2. Crop Contrasts and Implications for Cropping Structure
Crop contrasts indicated that higher coordination in maize and soybean arose through different pathways. For maize, CE–yield associations in multi-year means were weakly negative, while interannual WUE–yield co-variation remained moderately positive, suggesting that short-term water–yield co-movement could still be favorable where climate variability and management aligned. In other words, maize systems may offer more scope for “management-enabled” water productivity gains without necessarily increasing area-based emissions proportionally, particularly if irrigation energy use and input efficiencies are improved. By contrast, soybean exhibited a clear positive CE–yield association alongside the most pronounced WUE improvement over time. This pattern was consistent with an “efficiency-emissions divergence” risk: even when carbon-based water productivity improved, yield recovery or expansion could still raise area-based CEs through increased mechanization, energy consumption, and upstream embodied emissions from inputs and operations captured in the CE inventory framework.
These crop-specific mechanisms supported a differentiated cropping structure strategy. In water-constrained areas or where irrigation pumping costs are high, limiting further paddy expansion and consolidating maize/soybean production may improve aggregate FCW outcomes, given rice’s stronger water and emissions constraints. In rice advantage zones, the priority should shift from area expansion to improving “productivity per unit water and per unit emission” via irrigation modernization and integrated water-nutrient management [44]. Evidence from China-focused syntheses indicates that intermittent/water-saving irrigation can improve water productivity and sustain yields, reinforcing the feasibility of “upgrade rather than expand” pathways for rice.
4.3. Coordination Status of the FCW System and Targeted “Zoning Governance”
The CCD assessment indicated that NEC croplands were dominated by basic-to-good coordination, but coordination was strongly crop-structured, with rice acting as a regional bottleneck (Figure 8). Rice accounted for the largest shares of moderate (37%) and severe (13%) imbalance, whereas soybean and maize exhibited substantially higher fractions of good/high coordination. Because CCD integrates the normalized subsystem levels (low emission intensity, water productivity, and yield) with their coupling strength, it can provide a spatial diagnosis of where FCW performance is mismatched rather than a simple composite score. In this study, it enabled prioritization of interventions toward pixels and clusters where the limiting subsystem was most pronounced.
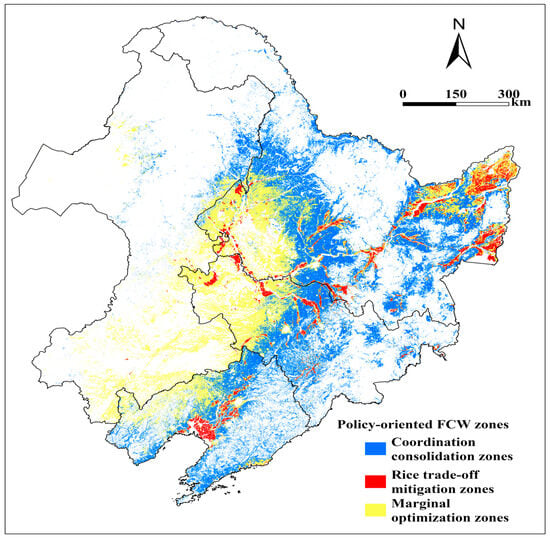
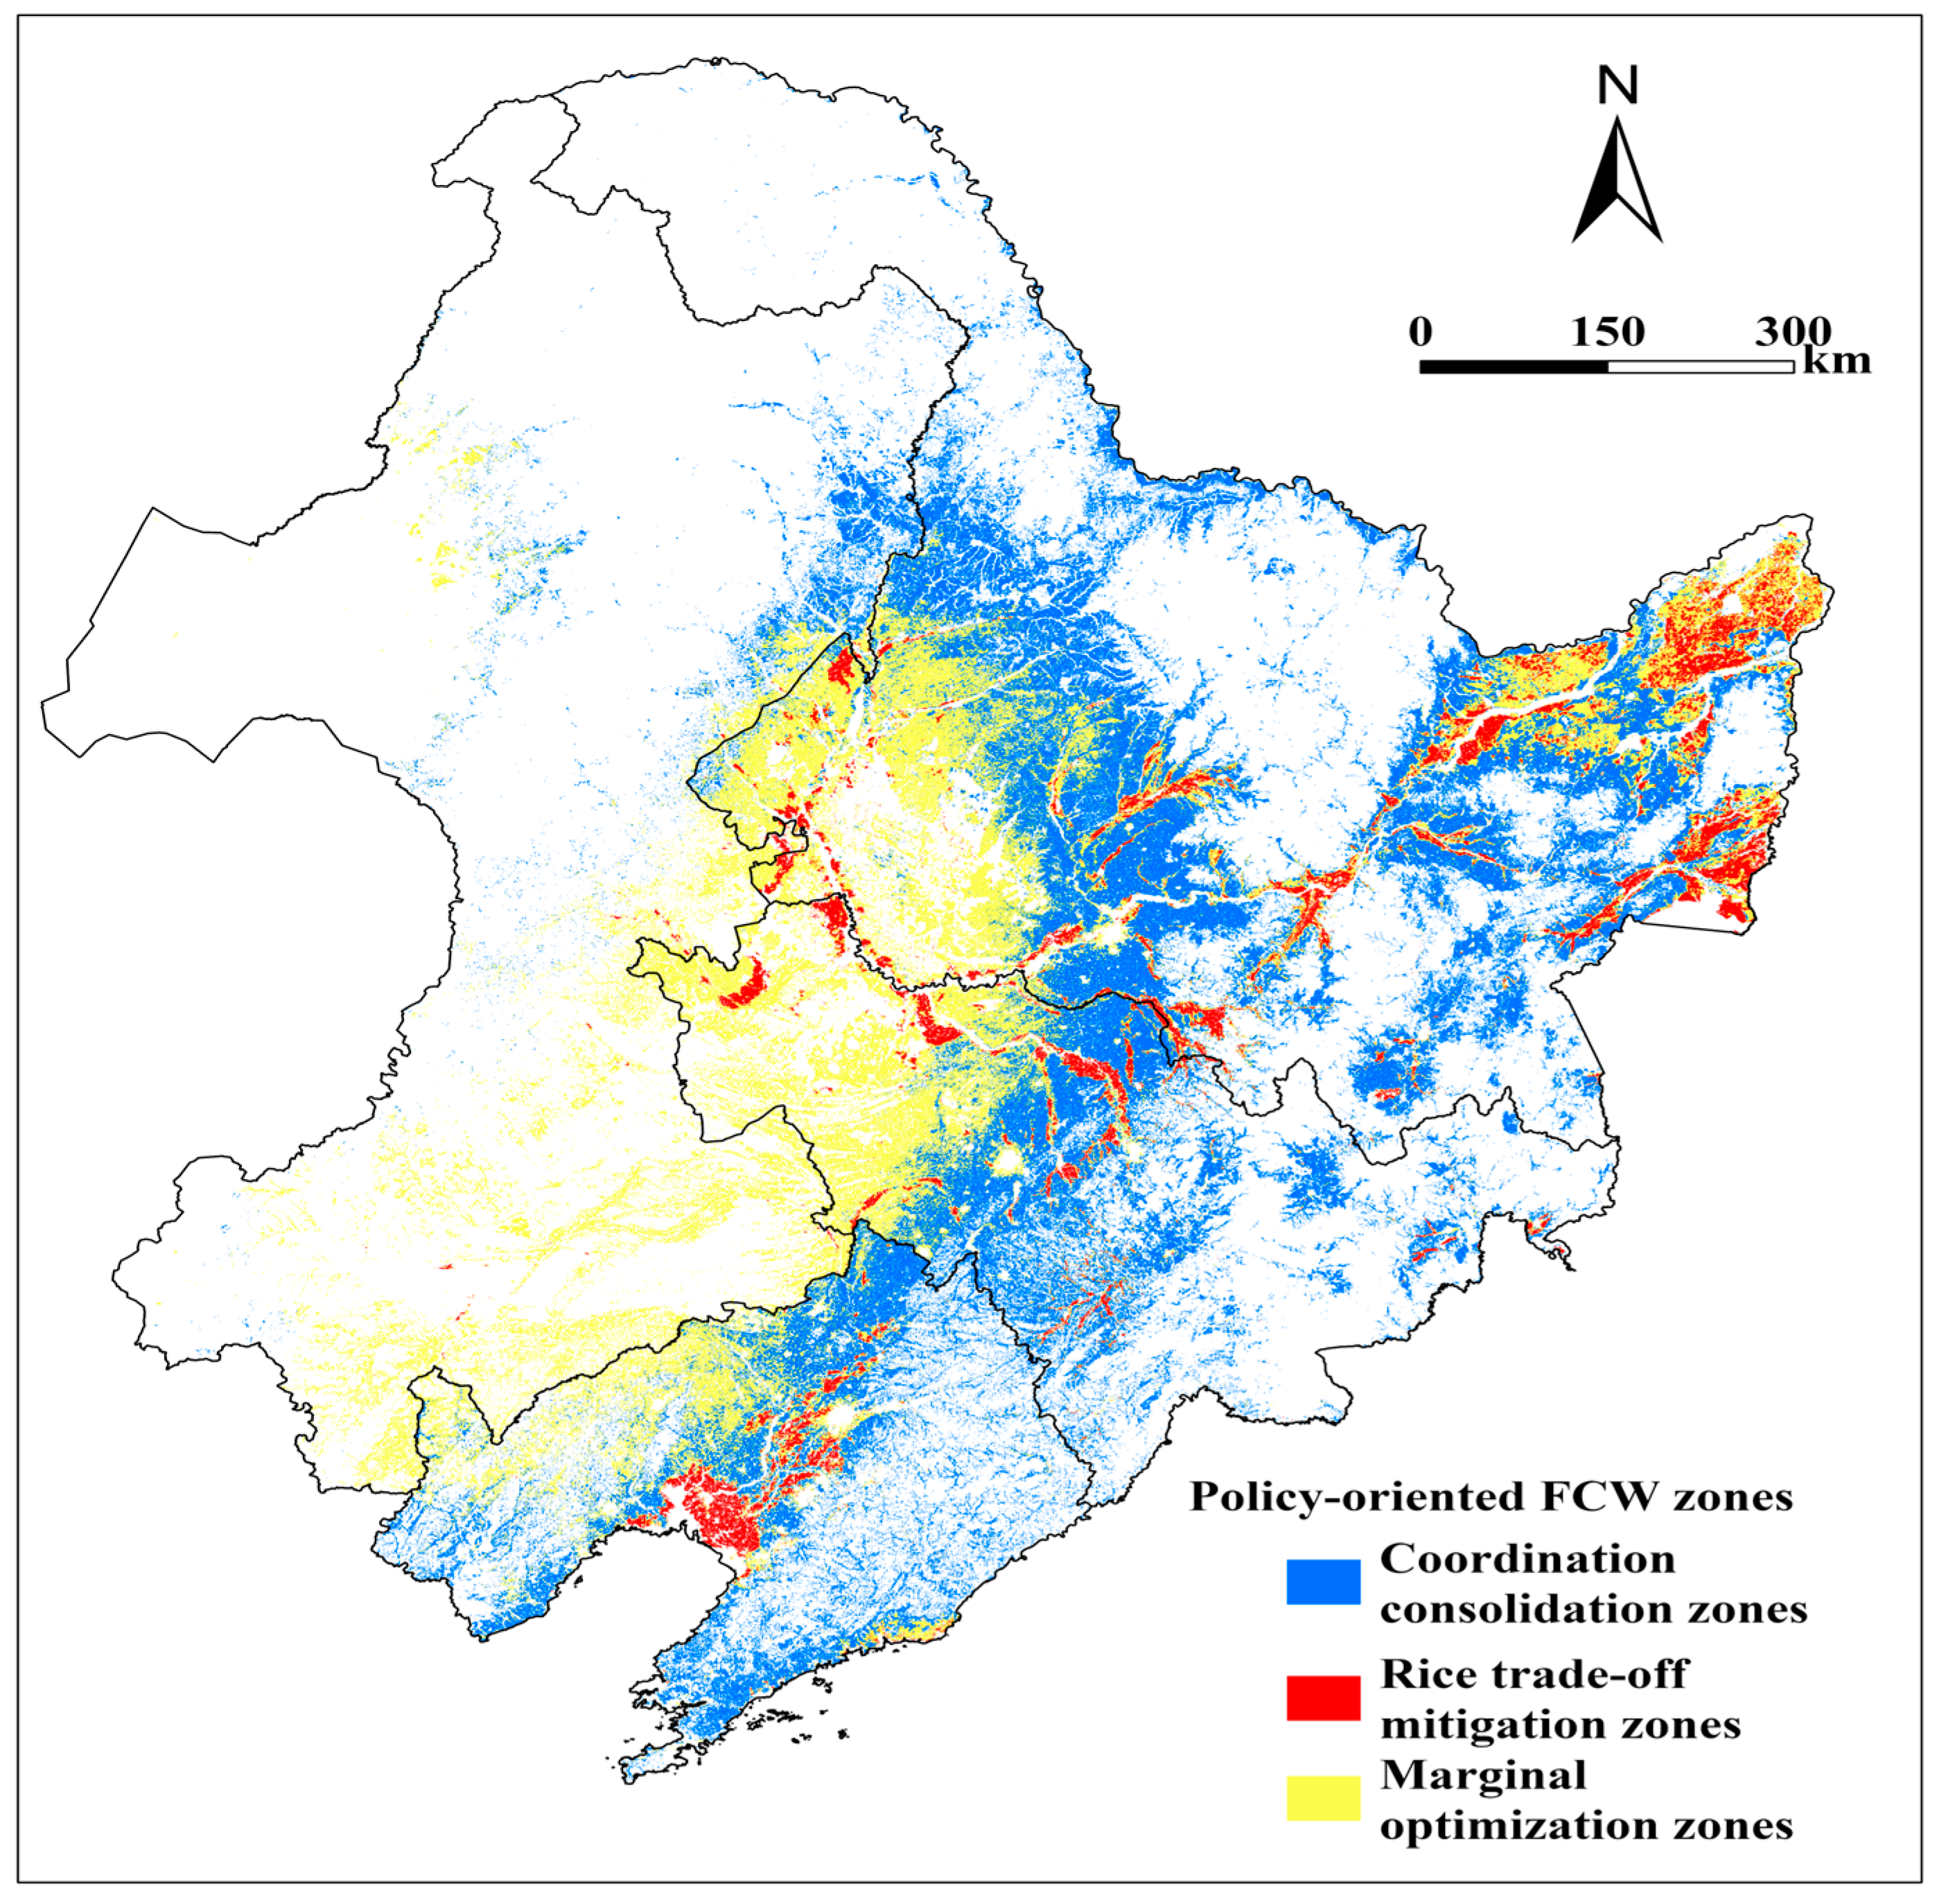
To operationalize zoning, we delineated three management zones (Figure 9) by overlaying the CCD classes (Figure 8a) with the dominant crop map (Figure 1). Pixels with CCD ≥ 0.6 dominated by maize/soybean were classified as coordination consolidation zones; pixels with CCD < 0.4 dominated by rice were classified as rice trade-off mitigation zones; the remaining croplands, typically with CCD = 0.4–0.6 or mismatched subsystem levels, were classified as marginal optimization zones. For policymaking, each zone is linked to an intervention package and monitoring targets. Coordination consolidation zones should prioritize input-use efficiency (e.g., fertilizer optimization and energy-efficient irrigation) to prevent rebound increases in CE while maintaining yield stability. Rice trade-off mitigation zones should prioritize water regime upgrading (e.g., AWD where feasible) and coordinated methane–nitrogen management to jointly reduce CH4/N2O-related emissions and improve water productivity without yield penalties [45,46]. Marginal optimization zones should prioritize rotation/redesign and risk-buffering (e.g., rice expansion constraints in water-stressed pockets and rotation incentives) to avoid shifts toward imbalance. Where adoption barriers exist, performance-based payments linked to verified water-saving and greenhouse gas mitigation, and targeted rotation/soybean incentives can improve implementation feasibility [47,48].
Figure 9.
Zoning of the food–carbon–water nexus based on coupling coordination degree and dominant crop type in Northeast China (2001–2020).
Practical applications of this work extend beyond the three-zone map. The 500 m CE–WUE–yield layers and coupling diagnostics can be used to (i) benchmark and monitor multi-objective performance of water-saving and emission reduction programs at sub-provincial scales, (ii) identify locations where single-objective interventions are likely to trigger FCW trade-offs, (iii) support measurement, reporting, and verification for agricultural carbon accounting by linking inventory-based CE factors to spatially explicit crop areas, and (iv) provide a baseline for scenario evaluation of cropping structure adjustments, irrigation modernization, and input reduction policies.
Overall, the results provide a direct test of the three hypotheses: (H1) strong spatial heterogeneity and crop-specific coupling are evident from pixel-scale patterns, correlations, and trend coupling (Figure 2, Figure 3, Figure 4, Figure 5, Figure 6 and Figure 7); (H2) rice consistently exhibits the highest WUE-involved trade-offs and the lowest CCD, identifying it as the dominant FCW bottleneck (Figure 5, Figure 6, Figure 7 and Figure 8); and (H3) CCD mapping delineates coordination versus imbalance clusters, providing an operational basis for zoning-oriented management recommendations (Figure 8).
4.4. Methodological Considerations and Uncertainties
4.4.1. Structural Dependence Between Yield and WUE
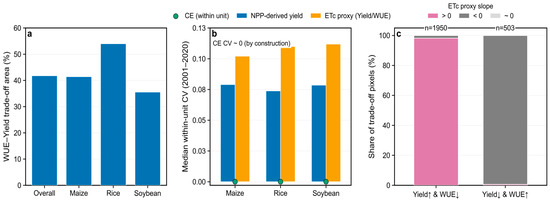
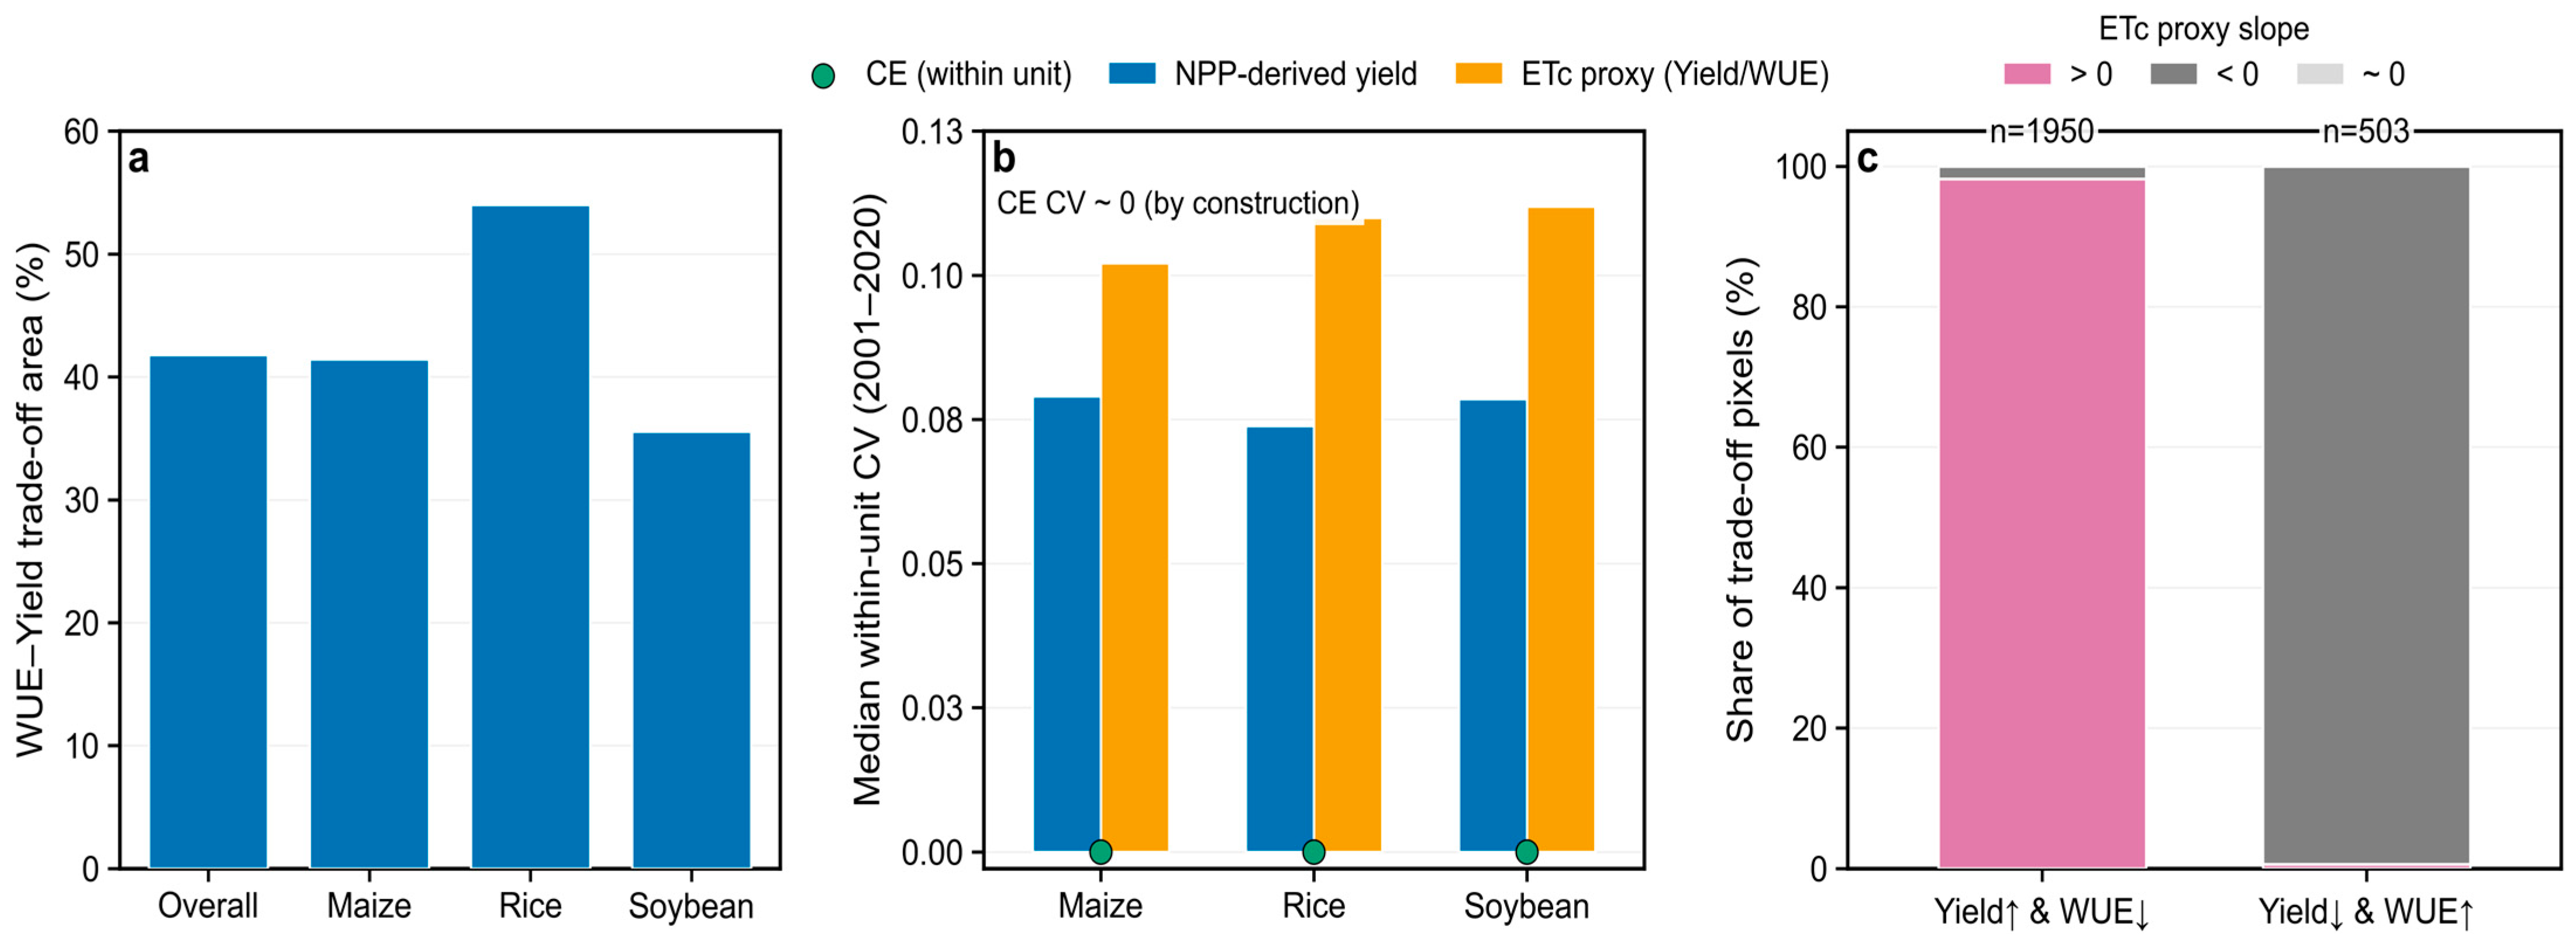
Independent NEC yield reconstructions validated against agricultural statistics (R2 = 0.76 for maize, 0.69 for rice, and 0.81 for soybean) support the use of NPP-based yield allocation at regional scales [36]. Nonetheless, because yield is allocated from NPP and WUE is defined as NPP/, both variables share the same NPP field. Under a null expectation of temporally constant , yield and WUE must exhibit identical trend signs; thus, WUE–yield trade-offs cannot arise from the indicator definitions alone and instead reflect variability and trends. Consistently, the proxy diagnostic (yield/WUE) shows that yield↑ and WUE↓ trade-offs are dominated by positive proxy slopes (n = 1950), whereas yield↓ and WUE↑ trade-offs are dominated by negative slopes (n = 503) (Figure 10c). Uniform scalar perturbations that rescale NPP-related parameters or harvest index would proportionally rescale yield (and WUE) but would not change correlation coefficients or sign-based trend categories; however, alternative stress function parameterizations could alter spatiotemporal heterogeneity and should be tested in future work [13,49]. More formal attribution of the ET-driven component could be obtained using partial correlations controlling for NPP and sensitivity tests based on independent yield/WUE products and alternative WUE metrics.
Figure 10.
proxy diagnostics of WUE–yield trade-offs and within-unit variability in Northeast China croplands (2001–2020). (a) Percentage of pixels classified as WUE–yield trade-off for the whole region and for maize, rice, and soybean. (b) Median within-unit coefficient of variation (CV) for inventory-based carbon emissions (CEs), NPP-derived yield, and an proxy (yield/WUE). (c) For WUE–yield trade-offs pixels grouped by opposite trend signs (yield↑ and WUE↓ vs yield↓ and WUE↑), stacked proportions of proxy slope classes (>0, <0, and ≈0); n denotes pixel counts.
4.4.2. Spatial Scale Constraint of Inventory-Based CE
Our CE layer is based on province-by-crop annual inventories; therefore, the within-stratum spatial variability of CE across 500 m pixels is zero by construction (Figure 10b). Consequently, CE-related “fine-scale” maps should be interpreted as between-province contrasts overlaid on pixel-level variability in NPP and components, rather than as resolved sub-provincial emission heterogeneity [32,33]. Developing spatially explicit emissions proxies constrained by activity data, process models, and remote sensing would strengthen hotspot identification and mitigation targeting [50,51].
4.4.3. Uncertainty, Especially for Paddy Rice
was estimated using the FAO-56 Penman–Monteith framework, which may not fully capture non-productive losses in flooded systems. As a result, a substantial share of apparent WUE variation in rice can reflect ET model uncertainty rather than agronomic performance alone. Future work should validate against independent ET products (e.g., MODIS ET and GLEAM) and flux-based benchmarks where available, report uncertainty bounds, and propagate them to WUE and CCD classifications near coordination thresholds [52,53].
4.4.4. Implications for CCD-Based Coordination Diagnostics
Because CCD integrates NPP-derived WUE and yield with a coarser emissions layer, it provides a relative coordination diagnosis rather than a proof of coordination among independent subsystems. We therefore emphasize crop contrasts and zoning patterns that are robust to indicator substitutions. A practical next step is to conduct CCD sensitivity tests using alternative yield/WUE datasets and to distinguish rainfed versus irrigated regimes using existing irrigated area and paddy inundation products, and then reassess whether the “rice bottleneck” remains consistent across datasets [28,54,55].
5. Conclusions
This study developed a 500 m, crop-explicit framework to diagnose food–carbon–water (FCW) interactions across NEC during 2001–2020 by integrating inventory-based CE, carbon-based WUE (NPP/), and NPP-allocated yield. We reveal pronounced spatial heterogeneity: higher CE intensities (uniform within each province–crop–year stratum) and higher yields were generally concentrated in the central–southern plains, whereas WUE exhibited a more fragmented spatial pattern. CEs increased for all crops; synchronized CE–yield increases dominated 45.7% of croplands, and a consistent CE–WUE antagonism emerged across crops (r = −0.33 to −0.60).
Rice systems showed the weakest FCW coordination (mean CCD = 0.36 ± 0.17) and the highest shares of WUE-involved trade-offs (CE–WUE: 61.8%; WUE–yield: 54.0%), supporting zoning strategies that consolidate maize/soybean-dominated high-CCD areas while curbing further CE growth and that prioritize paddy upgrades or limit expansion in water-constrained areas. Methodologically, interpretation is constrained by the shared NPP dependence of WUE and yield, the uniform within-province downscaling of CE, and uncertainty in , particularly for flooded rice. Future work can address these limits by integrating independent yield and ET products, downscaling CE with sub-provincial activity proxies, explicitly distinguishing irrigated and rainfed regimes and coupling the CCD framework with agent-based or economic optimization models to evaluate FCW pathways under CMIP6 climate scenarios and policy interventions.
Author Contributions
Conceptualization, Y.L.; methodology, Z.H. and Y.L.; software, Z.H.; data curation, Z.H., S.L., B.Z. and C.L.; formal analysis, Z.H.; visualization, Z.H.; writing—original draft preparation, Z.H.; writing—review and editing, Y.L., S.L., B.Z., C.L. and Z.Z.; supervision, Y.L. and Z.Z.; project administration, Y.L.; funding acquisition, Y.L. All authors have read and agreed to the published version of the manuscript.
Funding
This research was supported by the National Natural Science Foundation of China (Grant No. 42571325) and the Open Collaboration Fund of State Key Laboratory of Black Soils Conservation and Utilization (Grant No. 2023HTDGZ-KF-09).
Data Availability Statement
The original contributions presented in this study are included in the article. Further inquiries can be directed to the corresponding author.
Conflicts of Interest
The authors declare no competing financial interests or personal relationships that could have influenced the work reported in this paper.
References
- Foley, J.A.; Ramankutty, N.; Brauman, K.A.; Cassidy, E.S.; Gerber, J.S.; Johnston, M.; Mueller, N.D.; O’Connell, C.; Ray, D.K.; West, P.C.; et al. Solutions for a Cultivated Planet. Nature 2011, 478, 337–342. [Google Scholar] [CrossRef] [Scilit] [PubMed]
- Gao, B.; Huang, T.; Ju, X.; Gu, B.; Huang, W.; Xu, L.; Rees, R.M.; Powlson, D.S.; Smith, P.; Cui, S. Chinese Cropping Systems Are a Net Source of Greenhouse Gases despite Soil Carbon Sequestration. Glob. Change Biol. 2018, 24, 5590–5606. [Google Scholar] [CrossRef] [Scilit] [PubMed]
- Torhan, S.; Grady, C.A.; Ajibade, I.; Galappaththi, E.K.; Hernandez, R.R.; Musah-Surugu, J.I.; Nunbogu, A.M.; Segnon, A.C.; Shang, Y.; Ulibarri, N.; et al. Tradeoffs and Synergies Across Global Climate Change Adaptations in the Food-Energy-Water Nexus. Earths Future 2022, 10, e2021EF002201. [Google Scholar] [CrossRef] [Scilit]
- NIU, K.; GUO, H.; LIU, J. Can Food Security and Low Carbon Be Achieved Simultaneously?—An Empirical Analysis of the Mechanisms Influencing the Carbon Footprint of Potato and Corn Cultivation in Irrigation Areas. J. Integr. Agric. 2023, 22, 1230–1243. [Google Scholar] [CrossRef] [Scilit]
- Liu, W.; Yang, H.; Folberth, C.; Müller, C.; Ciais, P.; Abbaspour, K.C.; Schulin, R. Achieving High Crop Yields with Low Nitrogen Emissions in Global Agricultural Input Intensification. Environ. Sci. Technol. 2018, 52, 13782–13791. [Google Scholar] [CrossRef] [Scilit]
- Qin, K.; Li, J.; Yang, X. Trade-Off and Synergy among Ecosystem Services in the Guanzhong-Tianshui Economic Region of China. Int. J. Environ. Res. Public Health 2015, 12, 14094–14113. [Google Scholar] [CrossRef] [Scilit]
- Yang, D.; Liu, Y.; Wang, J. Trade-Offs and Synergies of Food-Water-Land Benefits for Crop Rotation Optimization in Northeast China. Agric. Ecosyst. Environ. 2024, 379, 109377. [Google Scholar] [CrossRef] [Scilit]
- Liu, Y.; Xiao, J.; Ju, W.; Zhou, Y.; Wang, S.; Wu, X. Water Use Efficiency of China’s Terrestrial Ecosystems and Responses to Drought. Sci. Rep. 2015, 5, 13799. [Google Scholar] [CrossRef] [Scilit] [PubMed]
- Jiang, M.; Zheng, C.; Jia, L.; Chen, J. A 20-Year Dataset (2001–2020) of Global Cropland Water-Use Efficiency at 1-Km Grid Resolution. Sci. Data 2025, 12, 574. [Google Scholar] [CrossRef] [Scilit]
- Wang, T.; Sun, S.; Yin, Y.; Zhao, J.; Tang, Y.; Wang, Y.; Gao, F.; Luan, X. Status of Crop Water Use Efficiency Evaluation Methods: A Review. Agric. For. Meteorol. 2024, 349, 109961. [Google Scholar] [CrossRef] [Scilit]
- Karthikeyan, L.; Chawla, I.; Mishra, A.K. A Review of Remote Sensing Applications in Agriculture for Food Security: Crop Growth and Yield, Irrigation, and Crop Losses. J. Hydrol. 2020, 586, 124905. [Google Scholar] [CrossRef] [Scilit]
- Jiang, L.; Yang, Y.; Shang, S. Remote Sensing—Based Assessment of the Water-Use Efficiency of Maize over a Large, Arid, Regional Irrigation District. Remote Sens. 2022, 14, 2035. [Google Scholar] [CrossRef] [Scilit]
- Cai, W.; Ullah, S.; Yan, L.; Lin, Y. Remote Sensing of Ecosystem Water Use Efficiency: A Review of Direct and Indirect Estimation Methods. Remote Sens. 2021, 13, 2393. [Google Scholar] [CrossRef] [Scilit]
- He, M.; Kimball, J.; Maneta, M.; Maxwell, B.; Moreno, A.; Beguería, S.; Wu, X. Regional Crop Gross Primary Productivity and Yield Estimation Using Fused Landsat-MODIS Data. Remote Sens. 2018, 10, 372. [Google Scholar] [CrossRef] [Scilit]
- Xu, S.; He, W.; Shen, J.; Degefu, D.M.; Yuan, L.; Kong, Y. Coupling and Coordination Degrees of the Core Water–Energy–Food Nexus in China. Int. J. Environ. Res. Public Health 2019, 16, 1648. [Google Scholar] [CrossRef] [Scilit] [PubMed]
- Lv, Y.; Li, Y.; Zhang, Z.; Luo, S.; Feng, X.; Chen, X. Spatio-Temporal Evolution Pattern and Obstacle Factors of Water-Energy-Food Nexus Coupling Coordination in the Yangtze River Economic Belt. J. Clean. Prod. 2024, 444, 141229. [Google Scholar] [CrossRef] [Scilit]
- Mondal, K.; Chatterjee, C.; Singh, R. Examining the Coupling and Coordination of Water-Energy-Food Nexus at a Sub-National Scale in India—Insights from the Perspective of Sustainable Development Goals. Sustain. Prod. Consum. 2023, 43, 140–154. [Google Scholar] [CrossRef] [Scilit]
- Wang, R.; Chen, J.; Li, M. Coupling and Coordinating Relationship between Agricultural Eco-Efficiency and Food Security System in China. Int. J. Environ. Res. Public Health 2022, 20, 431. [Google Scholar] [CrossRef] [Scilit]
- Zhao, L.; Yu, J.; Song, X.; Niu, Y.; Xie, J.; Zhang, L.; Li, X. Impact of Land-Use Change on Coupling Coordination Degree of Regional Water–Food–Carbon System. Front. Sustain. Food Syst. 2024, 8, 1449041. [Google Scholar] [CrossRef] [Scilit]
- Pang, R.; Sun, D.; Sun, W. Spatiotemporal Variations in Grain Yields and Their Responses to Climatic Factors in Northeast China During 1993–2022. Land 2025, 14, 1693. [Google Scholar] [CrossRef] [Scilit]
- Liu, Y.; Wang, J. Revealing Annual Crop Type Distribution and Spatiotemporal Changes in Northeast China Based on Google Earth Engine. Remote Sens. 2022, 14, 4056. [Google Scholar] [CrossRef] [Scilit]
- Du, G.; Han, L.; Yao, L.; Faye, B. Spatiotemporal Dynamics and Evolution of Grain Cropping Patterns in Northeast China: Insights from Remote Sensing and Spatial Overlay Analysis. Agriculture 2024, 14, 1443. [Google Scholar] [CrossRef] [Scilit]
- Xiao, X.; Zhang, J.; Liu, Y. Impacts of Crop Type and Climate Changes on Agricultural Water Dynamics in Northeast China from 2000 to 2020. Remote Sens. 2024, 16, 1007. [Google Scholar] [CrossRef] [Scilit]
- Wang, G.; Peng, W.; Zhang, L.; Zhang, J. Quantifying the Impacts of Natural and Human Factors on Changes in NPP Using an Optimal Parameters-Based Geographical Detector. Ecol. Indic. 2023, 155, 111018. [Google Scholar] [CrossRef] [Scilit]
- Renard, D.; Tilman, D. National Food Production Stabilized by Crop Diversity. Nature 2019, 571, 257–260. [Google Scholar] [CrossRef] [Scilit] [PubMed]
- Yang, Z.; Chu, L.; Wang, C.; Pan, Y.; Su, W.; Qin, Y.; Cai, C. What Drives the Spatial Heterogeneity of Cropping Patterns in the Northeast China: The Natural Environment, the Agricultural Economy, or Policy? Sci. Total Environ. 2023, 905, 167810. [Google Scholar] [CrossRef] [Scilit]
- Hou, Z.; Liu, Y.; Wang, J.; Manevski, K.; Zeng, Z. Multi-Objective Optimization Framework for Cropping Structure Based on Water-Carbon-Economy Nexus: Large-Scale Case Study in Northeast China. Field Crops Res. 2026, 340, 110367. [Google Scholar] [CrossRef] [Scilit]
- Arenas-Calle, L.N.; Heinemann, A.B.; Soler Da Silva, M.A.; Dos Santos, A.B.; Ramirez-Villegas, J.; Whitfield, S.; Challinor, A.J. Rice Management Decisions Using Process-Based Models with Climate-Smart Indicators. Front. Sustain. Food Syst. 2022, 6, 873957. [Google Scholar] [CrossRef] [Scilit]
- Sah, D.; Devakumar, A.S. The Carbon Footprint of Agricultural Crop Cultivation in India. Carbon Manag. 2018, 9, 213–225. [Google Scholar] [CrossRef] [Scilit]
- Zhang, Z.; Macedo, I.; Linquist, B.A.; Sander, B.O.; Pittelkow, C.M. Opportunities for Mitigating Net System Greenhouse Gas Emissions in Southeast Asian Rice Production: A Systematic Review. Agric. Ecosyst. Environ. 2024, 361, 108812. [Google Scholar] [CrossRef] [Scilit]
- Gorelick, N.; Hancher, M.; Dixon, M.; Ilyushchenko, S.; Thau, D.; Moore, R. Google Earth Engine: Planetary-Scale Geospatial Analysis for Everyone. Remote Sens. Environ. 2017, 202, 18–27. [Google Scholar] [CrossRef] [Scilit]
- Zhen, W.; Tang, Y.; Wang, H.; Qin, Q. Crop-Specific Embodied Greenhouse Gas Emissions Inventory for 28 Staple Crops in China from 2007 to 2017. Sci. Data 2025, 12, 421. [Google Scholar] [CrossRef] [Scilit] [PubMed]
- Li, C.; Jia, J.; Wu, F.; Zuo, L.; Cui, X. County-Level Intensity of Carbon Emissions from Crop Farming in China during 2000–2019. Sci. Data 2024, 11, 457. [Google Scholar] [CrossRef] [Scilit] [PubMed]
- Ippolito, M.; De Caro, D.; Cannarozzo, M.; Provenzano, G.; Ciraolo, G. Evaluation of Daily Crop Reference Evapotranspiration and Sensitivity Analysis of FAO Penman-Monteith Equation Using ERA5-Land Reanalysis Database in Sicily, Italy. Agric. Water Manag. 2024, 295, 108732. [Google Scholar] [CrossRef] [Scilit]
- Liu, X.; Feng, X.; Fu, B. Changes in Global Terrestrial Ecosystem Water Use Efficiency Are Closely Related to Soil Moisture. Sci. Total Environ. 2020, 698, 134165. [Google Scholar] [CrossRef] [Scilit]
- Lin, X.; Liu, Y.; Wang, J. Spatiotemporal Change of Crop Yield and Its Response to Planting Structural Shifts in Northeast China from 2001 to 2021. Land 2025, 14, 640. [Google Scholar] [CrossRef] [Scilit]
- Dinno, A. Nonparametric Pairwise Multiple Comparisons in Independent Groups Using Dunn’s Test. Stata J. Promot. Commun. Stat. Stata 2015, 15, 292–300. [Google Scholar] [CrossRef] [Scilit]
- Fukai, S.; Mitchell, J. Factors Determining Water Use Efficiency in Aerobic Rice. Crop Environ. 2022, 1, 24–40. [Google Scholar] [CrossRef] [Scilit]
- Bo, Y.; Wang, X.; van Groenigen, K.J.; Linquist, B.A.; Müller, C.; Li, T.; Yang, J.; Jägermeyr, J.; Qin, Y.; Zhou, F. Improved Alternate Wetting and Drying Irrigation Increases Global Water Productivity. Nat. Food 2024, 5, 1005–1013. [Google Scholar] [CrossRef] [Scilit]
- Foley, D.J.; Thenkabail, P.S.; Aneece, I.P.; Teluguntla, P.G.; Oliphant, A.J. A Meta-Analysis of Global Crop Water Productivity of Three Leading World Crops (Wheat, Corn, and Rice) in the Irrigated Areas over Three Decades. Int. J. Digit. Earth 2020, 13, 939–975. [Google Scholar] [CrossRef] [Scilit]
- Tian, Z.; Fan, Y.; Wang, K.; Zhong, H.; Sun, L.; Fan, D.; Tubiello, F.N.; Liu, J. Searching for “Win-Win” Solutions for Food-Water-GHG Emissions Tradeoffs across Irrigation Regimes of Paddy Rice in China. Resour. Conserv. Recycl. 2021, 166, 105360. [Google Scholar] [CrossRef] [Scilit]
- Enriquez, Y.; Yadav, S.; Evangelista, G.K.; Villanueva, D.; Burac, M.A.; Pede, V. Disentangling Challenges to Scaling Alternate Wetting and Drying Technology for Rice Cultivation: Distilling Lessons from 20 Years of Experience in the Philippines. Front. Sustain. Food Syst. 2021, 5, 675818. [Google Scholar] [CrossRef] [Scilit]
- Li, L.; Huang, Z.; Mu, Y.; Song, S.; Zhang, Y.; Tao, Y.; Nie, L. Alternate Wetting and Drying Maintains Rice Yield and Reduces Global Warming Potential: A Global Meta-Analysis. Field Crops Res. 2024, 318, 109603. [Google Scholar] [CrossRef] [Scilit]
- Carrijo, D.R.; Lundy, M.E.; Linquist, B.A. Rice Yields and Water Use under Alternate Wetting and Drying Irrigation: A Meta-Analysis. Field Crops Res. 2017, 203, 173–180. [Google Scholar] [CrossRef] [Scilit]
- Wang, H.; Zhang, Y.; Zhang, Y.; McDaniel, M.D.; Sun, L.; Su, W.; Fan, X.; Liu, S.; Xiao, X. Water-Saving Irrigation Is a ‘Win-Win’ Management Strategy in Rice Paddies—With Both Reduced Greenhouse Gas Emissions and Enhanced Water Use Efficiency. Agric. Water Manag. 2020, 228, 105889. [Google Scholar] [CrossRef] [Scilit]
- Islam, S.M.M.; Gaihre, Y.K.; Islam, M.R.; Ahmed, M.N.; Akter, M.; Singh, U.; Sander, B.O. Mitigating Greenhouse Gas Emissions from Irrigated Rice Cultivation through Improved Fertilizer and Water Management. J. Environ. Manag. 2022, 307, 114520. [Google Scholar] [CrossRef] [Scilit]
- Qiao, L.; Silva, J.V.; Fan, M.; Mehmood, I.; Fan, J.; Li, R.; van Ittersum, M.K. Assessing the Contribution of Nitrogen Fertilizer and Soil Quality to Yield Gaps: A Study for Irrigated and Rainfed Maize in China. Field Crops Res. 2021, 273, 108304. [Google Scholar] [CrossRef] [Scilit]
- Singh, D.; Sharma, O.P.; Kushwah, N.; Chauhan, A.P.S.; Jain, M. Agronomic Considerations for Sustainable Intensification of Crop Production. Plant Sci. Arch. 2023, 8, 7–9. [Google Scholar] [CrossRef] [Scilit]
- El Masri, B.; Schwalm, C.; Huntzinger, D.N.; Mao, J.; Shi, X.; Peng, C.; Fisher, J.B.; Jain, A.K.; Tian, H.; Poulter, B.; et al. Carbon and Water Use Efficiencies: A Comparative Analysis of Ten Terrestrial Ecosystem Models under Changing Climate. Sci. Rep. 2019, 9, 14680. [Google Scholar] [CrossRef] [Scilit] [PubMed]
- Zheng, B.; Zhang, Q.; Tong, D.; Chen, C.; Hong, C.; Li, M.; Geng, G.; Lei, Y.; Huo, H.; He, K. Resolution Dependence of Uncertainties in Gridded Emission Inventories: A Case Study in Hebei, China. Atmos. Chem. Phys. 2017, 17, 921–933. [Google Scholar] [CrossRef] [Scilit]
- Wang, R.; Zhang, Y.; Zhao, S.; Wang, X. Open-Data-Based City-Scale Gridded Carbon Dioxide Emission Inventory: Supporting Urban Carbon Monitoring in Chengdu, China. Carbon Footpr. 2024, 3, 14. [Google Scholar] [CrossRef] [Scilit]
- Ghorbanpour, A.K.; Peddinti, S.R.; Hessels, T.; Bastiaanssen, W.; Kisekka, I. Enhancing Evapotranspiration Estimates in Composite Terrain through the Integration of Satellite Remote Sensing and Eddy Covariance Measurements. Sci. Total Environ. 2025, 963, 178530. [Google Scholar] [CrossRef] [Scilit]
- Martens, B.; Miralles, D.G.; Lievens, H.; Van Der Schalie, R.; De Jeu, R.A.M.; Fernández-Prieto, D.; Beck, H.E.; Dorigo, W.A.; Verhoest, N.E.C. GLEAM v3: Satellite-Based Land Evaporation and Root-Zone Soil Moisture. Geosci. Model Dev. 2017, 10, 1903–1925. [Google Scholar] [CrossRef] [Scilit]
- Shen, R.; Peng, Q.; Li, X.; Chen, X.; Yuan, W. CCD-Rice: A Long-Term Paddy Rice Distribution Dataset in China at 30 m Resolution. Earth Syst. Sci. Data 2025, 17, 2193–2216. [Google Scholar] [CrossRef] [Scilit]
- Doelman, J.C.; Beier, F.D.; Stehfest, E.; Bodirsky, B.L.; Beusen, A.H.W.; Humpenöder, F.; Mishra, A.; Popp, A.; van Vuuren, D.P.; de Vos, L.; et al. Quantifying Synergies and Trade-Offs in the Global Water-Land-Food-Climate Nexus Using a Multi-Model Scenario Approach. Environ. Res. Lett. 2022, 17, 045004. [Google Scholar] [CrossRef] [Scilit]
Disclaimer/Publisher’s Note: The statements, opinions and data contained in all publications are solely those of the individual author(s) and contributor(s) and not of MDPI and/or the editor(s). MDPI and/or the editor(s) disclaim responsibility for any injury to people or property resulting from any ideas, methods, instructions or products referred to in the content. |
© 2026 by the authors. Licensee MDPI, Basel, Switzerland. This article is an open access article distributed under the terms and conditions of the Creative Commons Attribution (CC BY) license.