


Abstract
While organic amendments are extensively applied to increase soil organic carbon (SOC), the mechanisms by which they restructure soil food web energetics to regulate microbial necromass formation and carbon sequestration remain unclear. We conducted a 105-day incubation experiment to investigate how three organic amendments (straw, biochar, liquid organic fertilizer), differing in C:N ratio and pH, and applied at three rates, affect nematode food web energetics and carbon sequestration in black soils of Northeast China. Results showed that amendment properties and application rates jointly shaped nematode energetic structure, differentially regulating total energy flux (Et) and flow uniformity (U). Straw (moderate C:N, near-neutral pH) strongly increased both Et (up to 587% above control) and U (peak at 1.68) by fostering fungivore-dominated energy channels. Despite its high C:N ratio, biochar’s alkaline pH favored bacterial-dominated channels, improving flow uniformity (U up to 1.61) without increasing Et. Liquid fertilizer (low C:N, high pH) produced rate-dependent outcomes: the low rate increased Et by 210% above control via enhanced bacterial channels, whereas the high rate suppressed Et but elevated U by reducing energy allocated to plant parasites. Critically, energy flow uniformity correlated positively with fungal necromass carbon, which drove SOC accumulation, whereas total flux was strongly linked to bacterial necromass carbon, suppressing SOC. All amendments finally enhanced omnivore-predator energy flux, boosting top-down regulation and uniform energy distribution. However, mineral fertilizer truncated the food web and suppressed flow uniformity, failing to increase SOC. Therefore, organic amendments enhance SOC by restructuring nematode-mediated energy flow by reinforcing fungal-dominated channels and/or increasing flow uniformity, thereby promoting fungal necromass accumulation and providing a mechanistic basis for targeted management of degraded black soils.
1. Introduction
Agricultural soils globally represent critical reservoirs containing approximately 1500 Pg of organic carbon (about two times the carbon in the atmosphere) and simultaneously support food production, ecosystem services, and climate regulation through carbon sequestration [1,2,3]. This regulatory function has become increasingly urgent as atmospheric CO2 concentrations have risen from approximately 280 ppm in the pre-industrial era to over 420 ppm presently, intensifying the need for terrestrial carbon sinks to mitigate climate change impacts [4,5]. The black soil (Mollisols) region of Northeast China, one of the world’s most fertile agricultural zones, has experienced substantial depletion of soil organic carbon (SOC) due to intensive cultivation practices and inadequate replenishment of organic matter [4]. This degradation threatens both regional agricultural productivity and the carbon balance, highlighting the urgent need for biologically informed management strategies that simultaneously restore soil functionality and enhance carbon sequestration potential [6,7].
Soil biota function as master regulators of carbon transformations in agricultural ecosystems through complex trophic interactions and energy channeling [8,9,10]. Within the soil micro-food web, nematodes and microorganisms play central roles in organic matter decomposition and stabilization [7,11,12]. As the most abundant soil metazoans, nematodes form a multi-channel energy network through their functional groups with distinct feeding habits (e.g., bacterial feeders, fungal feeders, plant parasites, and omnivore-predators) [13], thereby regulating microbial communities and governing the flow and fate of carbon [14,15,16]. Recent advances highlight that the distribution of energy across these trophic channels, quantified as energy flow uniformity, critically influences the efficiency of carbon conversion into stable soil pools [17,18]. Moreover, bacterial- and fungal-feeding nematodes exert direct top-down control on their microbial prey, selectively regulating microbial community composition and activity through grazing pressure [19,20]. This trophic regulation influences the relative abundance of fungal versus bacterial biomass, thereby shaping the quantity and composition of microbial necromass—a dominant and persistent component of SOC [7,21]. Consequently, the energetic structure of nematode food webs serves as a critical biological bridge between organic inputs and the formation of stable carbon pools, mediated through the regulation of microbial turnover and necromass accumulation [22].
Organic amendments are widely adopted to enhance soil fertility and carbon storage [23,24], yet their effects on SOC sequestration are largely mediated by impacts on soil biotic communities [25,26,27]. Amendments with distinct intrinsic properties, such as C:N ratio, pH, and lability, differentially shape the structure and activity of microbial and nematode communities, thereby steering carbon flow through specific energy channels [28,29,30,31]. For instance, high C:N materials may promote fungal-based energy pathways, while more labile, low C:N inputs could favor bacterial-dominated flows [32]. Crucially, application rates interact with these intrinsic properties to determine whether carbon inputs stimulate balanced, multi-channel energy distribution or create trophic imbalances that limit long-term carbon stabilization [15,33]. Despite growing evidence that organic amendments can enhance soil carbon stocks, the underlying biological mechanisms remain largely unknown. Recent studies have established a link between the energetic characteristics of nematode food webs (total flux and flow uniformity enhanced by organic amendments) and ecosystem multifunctionality [18,31,34]. Huang et al. [31], for example, demonstrated in a field study on the Loess Plateau that organic amendments enhance ecosystem multifunctionality through restructuring nematode community composition and energy distribution patterns. However, the specific pathways connecting organic amendment properties (intrinsic quality and application rates) to SOC sequestration via nematode-mediated energy redistribution and subsequent microbial necromass formation remain largely unexplored.
This knowledge gap is especially pronounced for black soils, where the balance between bacterial and fungal decomposition pathways strongly determines carbon stabilization mechanisms [7,27]. While previous studies have examined the effects of individual organic amendments on soil biota or carbon dynamics, few have systematically compared multiple amendment types with contrasting properties to isolate the effects of material quality [24,31]. Furthermore, the dose-dependent responses of nematode food web energetics to these amendments and their cascading effects on microbial necromass formation [35] have received limited attention. These limitations hinder the development of targeted management strategies to optimize the biological regulation of carbon sequestration [1,36].
This study, therefore, investigates how three types of organic amendments (straw, biochar, and liquid organic fertilizer) with distinct properties (e.g., C:N ratio, pH), applied at varying rates, influence carbon sequestration in black soils from northeast China through the restructuring of nematode community energy flow and microbial necromass formation. We hypothesize that (1) organic amendments enhance SOC storage primarily by restructuring energy flow patterns of nematode food webs rather than through direct carbon input alone; and (2) amendments that promote higher energy flow uniformity, specifically those enhancing fungal-feeding channels, will maximize the conversion of organic inputs into stable, fungal-dominated necromass carbon. By integrating the assessment of amendment properties, nematode food web energetics, and microbial carbon pathways, this research aims to provide a mechanistic framework for designing organic management strategies that simultaneously enhance soil carbon storage and ecosystem sustainability in one of China’s most vital agricultural regions.
2. Materials and Methods
2.1. Soil Collection
Soil for the incubation experiment was collected in October 2022 (after soybean harvest) from a typical cropland under soybean–maize rotation at the Keshan Experimental Station (48°03′20″ N, 125°49′19″ E) in Keshan County, Qiqihar City, Heilongjiang Province, China. The soil is classified as Phaeozem (World Reference Base for Soil Resources) or thick Mollisol (USDA Soil Taxonomy) with a clay loam to clay texture. Prior to sampling, the field received conventional fertilizer applications annually: urea (228 kg ha−1), diammonium phosphate (235 kg ha−1), and potassium sulfate (192 kg ha−1). Surface soil (0–20 cm depth) was collected using a five-point sampling method following soybean harvest, homogenized, and passed through a 5 mm sieve to remove crop residues, stones, and soil macrofauna. The initial soil properties were as follows: pH (H2O) 5.78, soil organic carbon (SOC) 22.21 g kg−1, total nitrogen (TN) 1.07 g kg−1, total phosphorus (TP) 1.02 g kg−1, available nitrogen (NO3−-N and NH4+-N) 18.15 mg kg−1, and available phosphorus (AP) 1.36 mg kg−1. Soil pH was determined in a 1:2.5 (w/v) soil-to-water suspension using a PHS-3E laboratory pH meter (Shanghai Leici Instrument Factory, Shanghai, China). All subsequent pH values were determined using this method. SOC was quantified by the Walkley–Black dichromate oxidation method [37]. TN was analyzed by the micro-Kjeldahl method [38]. TP was determined via the ammonium molybdate spectrophotometric method after acid digestion [38]. AP was extracted with 0.5 M NaHCO3 and measured spectrophotometrically [38]. Inorganic nitrogen (NO3−-N and NH4+-N) was extracted with 2 M KCl and quantified using a continuous-flow autoanalyzer (SAN++, Skalar Analytical, Breda, The Netherlands).
2.2. Organic Amendment Preparation and Experimental Design
In this study, three types of organic amendments were employed: maize straw, biochar, and liquid organic fertilizer. These amendments possessed inherently distinct physicochemical properties, as detailed in Table 1. Maize straw was collected from the same experimental field after maize harvest, with properties of pH 6.24, total organic carbon 319.6 g kg−1, total nitrogen 9.41 g kg−1, and C:N ratio of 33.96. Biochar was purchased from Liaoning Jinhafu Agricultural Development Co. (Dalian, Liaoning, China), produced from corn straw pyrolyzed at 450 °C under anaerobic conditions, with pH 9.15, total organic carbon 369.4 g kg−1, total nitrogen 5.57 g kg−1, and C:N ratio of 66.32. Liquid organic fertilizer was obtained from Xi’an Qinhang Ecological Agricultural Technology Co., Ltd. (Shaanxi, China), with properties of pH 10.21, total organic carbon 126.0 g kg−1, total nitrogen 11.81 g kg−1, and C:N ratio of 10.68.
Table 1.
Inherent properties of organic amendments.
The incubation experiment included 11 treatments: three types of organic amendments applied at three rates each (low, moderate, and high), plus mineral fertilizer and an unfertilized control. Each treatment was replicated 20 times, resulting in a total of 220 experimental units. Baseline soil properties were uniform across all treatments, as described in Section 2.1. For maize straw (S), the moderate application rate (S2) corresponded to the typical field application rate of 12 t ha−1 in the black soil region, with application depth (20 cm) and soil bulk density (1.10 g cm−3) considered in the calculation (1.74 g C kg−1 soil, Table 2). Low and high straw application rates (S1 and S3) were set at 50% and 150% of the moderate rate, respectively (Table 2). Biochar (B) and liquid organic fertilizer (L) application rates were determined based on equivalent carbon input relative to the corresponding straw treatments. Table 2 quantifies application-rate-dependent inputs for three types of organic amendments, detailing total amendment mass and carbon and nitrogen masses applied per kg of soil. Mineral fertilizer (F) application followed the conventional rates for black soils: 146 kg N ha−1, 107 kg P2O5 ha−1, and 96 kg K2O ha−1.
Table 2.
Application rates and elemental inputs of organic amendments (carbon and nitrogen mass applied per kg soil).
2.3. Incubation Procedure and Sampling
Prior to the experiment, biochar and straw were sieved through a 2 mm mesh, while liquid organic fertilizer was diluted with distilled water at a 1:2 ratio. For each experimental unit, 500 g of field-moist soil was placed in a cylindrical glass container and thoroughly mixed with the designated amendment or fertilizer. Then, the prepared soil samples were adjusted to 65% of field water-holding capacity and placed in a growth chamber with a normal light–dark cycle (16/8 h light/dark cycle) at a constant temperature of 25 °C. Soil moisture was maintained using the constant weight method, with water replenishment every 2 days. Destructive sampling was conducted at five time points (5, 15, 30, 60, and 105 days after incubation initiation), with four replicates per treatment sampled at each time point. At each sampling time, soil samples were divided into two subsamples: (1) air-dried for the determination of soil pH (H2O), organic carbon, and amino sugar contents; and (2) stored at 4 °C for analysis of nematode community composition.
2.4. Measurement of Soil Organic Carbon and Microbial Necromass Carbon
Soil organic carbon (SOC) was quantified by the Walkley–Black dichromate oxidation method [37], which involves the exothermic oxidation of organic matter by potassium dichromate in concentrated sulfuric acid. Readily oxidizable carbon (ROC) was measured using the potassium permanganate oxidation colorimetric method [39].
Microbial necromass carbon was determined via amino sugar analysis [40]. Briefly, 0.5 g of sieved soil was hydrolyzed with 6 M HCl at 105 °C, filtered, and the pH adjusted to 6.7. The solution was centrifuged to remove sediments, and the supernatant was lyophilized. The residue was transferred to anhydrous methanol, centrifuged, and the methanol solution was dried under N2 flow. N-methylglucosamine was added as an internal standard prior to freeze-drying. The treated samples were analyzed for glucosamine (GlcN), galactosamine (GalN), and muramic acid (MurA) using high-performance liquid chromatography (Agilent 7890, Agilent Technologies, Santa Clara, CA, USA).
Fungal necromass carbon (FNC), bacterial necromass carbon (BNC), and total microbial necromass carbon (MNC) were calculated as follows [41,42]:
where 179.17 and 251.23 are the molecular weights of GlcN and MurA, respectively; 9 and 45 represent the conversion factors from fungal GlcN and bacterial MurA to necromass carbon.
FNC = (GlcN/179.1 − 2 × MurA/251.23) × 179.17 × 9
BNC = 45 × MurA
MNC = FNC + BNC
2.5. Nematode Extraction and Identification
Soil nematodes were extracted from 100 g of fresh soil using a sequential procedure involving modified Baermann pan extraction followed by sugar centrifugal flotation [43]. Before subsampling, all soil samples were thoroughly homogenized to ensure representativeness. For extraction, soil was placed as a thin layer on milk filters mounted above 1 cm of water in 20 cm diameter wire-mesh pans. After 48 h of incubation at 22 °C, nematodes in the water were collected on a 500-mesh sieve (25 μm aperture). The soil residue remaining on the filter was then processed through sugar centrifugation to recover additional nematodes that were not extracted by the modified Baermann pan method [43]. This sequential approach was selected because it maximizes extraction efficiency by recovering both motile nematodes via the modified Baermann method and less motile forms via centrifugation. Previous validation with our Mollisol soil type confirmed this sequential approach achieves >90% extraction efficiency, significantly higher than either the Baermann method or sugar centrifugal flotation used alone.
The total nematode abundance in each sample was quantified under a dissecting microscope at 40× magnification and expressed as individuals per 100 g of dry soil. Subsequently, nematodes were heat-killed at 60 °C for 2 min to relax their bodies, then preserved in 4% formalin solution. For taxonomic analysis, a minimum of 100 individuals per sample were randomly selected and identified to genus level using a compound light microscope (Zeiss Primo Star, Oberkochen, Germany) at 400× and 1000× magnification, following taxonomic keys from De Nematoden van Nederland [44], Mononchida: The Predaceous Soil Nematodes [45], and Pictorical Key to Soil Animals of China [46]. Each identified genus was assigned to one of four functional trophic groups according to feeding habits and mouthpart morphology: bacterial feeders (BF), fungal feeders (FF), plant parasites (PP), and omnivore-predators (OP) [13]. Each genus was also assigned to different functional guilds based on their colonizer-persister (cp) value, ranging from 1 (r-strategist) to 5 (K-strategist) [47].
2.6. Statistical Analyses
All statistical analyses and visualizations were performed using R software (version 4.5.1; http://www.r-project.org/index.html, accessed on 11 September 2025), with statistical significance defined at p < 0.05 unless otherwise specified.
2.6.1. Nematode Community Composition and Diversity
Non-metric multidimensional scaling (NMDS) ordination based on Bray–Curtis dissimilarity matrices was employed to visualize patterns in nematode community composition (genus-level relative abundance) across treatments and sampling times. Analyses were conducted using the metaMDS function in the vegan package [48]. Separate NMDS ordinations were performed for each organic amendment type (straw: S1–S3; biochar: B1–B3; liquid organic fertilizer: L1–L3), with mineral fertilizer (F) and unfertilized control (CK) included as reference treatments in each ordination. Permutational multivariate analysis of variance (PERMANOVA) was implemented using the adonis2 function with 999 permutations to statistically assess the effects of sampling time, fertilization treatment, and their interaction on nematode community structure. Trophic structure was characterized by calculating the relative abundance of each functional group (bacterial feeders, fungal feeders, plant parasites, and omnivore-predators). Nematode taxonomic diversity was assessed using two complementary metrics: genus richness (total number of genera) and the Shannon-Wiener diversity index (H’ = −ΣPi × lnPi, where Pi represents the proportional abundance of genus i in the community) [49]. Tables S1–S5 present the absolute abundance, trophic classification, cp values, and mean individual biomass of soil nematode genera across fertilization treatments at days 5, 15, 30, 60, and 105 of incubation.
2.6.2. Nematode Community Energetic Structure
The energetic structure of soil nematode food webs was quantified using a stepwise energy flux modeling approach (Figure S1) [18], visualized as a micro-food web (five-node model) with network-wide metrics (including biomass and energy flux through trophic groups) using the igraph package in R. This methodology connects nematode abundance to energy dynamics through six sequential steps:
Step 1: Fresh biomass collection. The average fresh biomass (Wt) of individual nematodes within each taxon (genus) was obtained from the Nematode Ecophysiological Parameters database (http://nemaplex.ucdavis.edu, accessed on 21 November 2025). The total biomass (µg 100 g−1 dry soil) of each taxon was calculated by multiplying average individual biomass by nematode abundance.
Step 2: Individual metabolism calculation. The carbon allocated into production (PC) of nematode individuals per day (µg C 100 g−1 dry soil day−1) was calculated as:
where Nt, Wt, and mt represent the individual number, fresh biomass, and cp-value of taxon t, respectively [12]. This calculation assumes a dry weight of 20% of fresh biomass and a carbon content of 52% of dry weight. Life-cycle duration of nematodes in days was approximated as 12 times the cp-scale [50].
PC = ∑(Nt(0.1(Wt/mt/12))),
The carbon used in respiration (RC, µg C 100 g−1 dry soil day−1) of nematode individuals was calculated based on the allometric power dependence of metabolism and body size of soil organisms [51]:
where a represents the relative molecular weights of carbon and oxygen in CO2 (12/44 = 0.273), converted by a coefficient of 0.058 to estimate carbon respiration in µg per day [49,52], and b is close to 0.75 [53].
RC = ∑(Nt(a(Wt b))),
The metabolic footprints (F, µg C 100 g−1 dry soil day−1) of nematode individuals were calculated by summing PC and RC [12,50]:
F = ∑(Nt(0.1(Wt/mt/12) + 0.0159(Wt 0.75)))
Step 3: Construction of the nematode food web topology. A five-node micro-food web was established with bacterivores, fungivores, plant parasites, and omnivore-predators as trophic nodes, and basal resources (detritus and living roots) as the energy source. In this food web, omnivore-predators were assumed to have uniform feeding preferences, with energy obtained from other trophic groups depending on their relative abundance [54].
Step 4: Trophic group biomass and metabolism aggregation. Total metabolism for each trophic group (node) was calculated by summing individual biomass/metabolism values of all nematodes within that functional group.
Step 5: Assimilation efficiency assignment. Diet-specific assimilation efficiencies (ea) of each trophic group were applied following established values from previous studies [55,56]: 0.60 for bacterivores, 0.38 for fungivores, 0.25 for plant parasites, and 0.50 for omnivore-predators.
Step 6: Calculation for energy flux between nodes. Assuming the energetic relationships in the nematode food web were in a steady-state system, the energy flux through each trophic group (Fi, μg C 100 g−1 dry soil day−1) was calculated as [9,54,57]:
where L is the energy loss to higher trophic levels through consumption, and ea is the diet-specific assimilation efficiency. The energy flux to omnivore-predators was initially calculated without accounting for energy loss to higher trophic levels (as no higher trophic groups were considered in this study), thus equaling their metabolic demand (F0, calculated as the sum of production and respiration components for omnivore-predators). Subsequently, the energy loss (L) of plant parasites, bacterivores, and fungivores to omnivore-predators were computed as:
where Dio represents the density-dependent feeding preference of omnivore-predators for trophic group i, determined based on their proportional abundance.
Fi = (F + L)/ea,
L = Dio × Fo,
Finally, the energy flow uniformity (U) of the nematode food web (unitless) was calculated as the ratio of the mean of summed energy fluxes through each energy channel to the standard deviation of these means [17], indicating the evenness of energy distribution across different pathways in the food web.
2.6.3. Pathways Linking Organic Amendment Properties to Carbon Sequestration via Nematode Community Energetics
For each organic amendment (straw, biochar, and liquid organic fertilizer), two-way analysis of variance (ANOVA) was applied using the base stats package to assess the effects of fertilization treatment (low, moderate and high application of each amendment, plus mineral fertilizer and unfertilized control), incubation time (sampling day), and their interaction on nematode community variables (total abundance, diversity, trophic structure and energetic parameters), microbial necromass carbon pools, and soil organic carbon accumulation. Dose–response relationships between organic amendment application rates and nematode community parameters were evaluated using linear regression analyses between application levels (coded numerically as 50, 100, and 150 corresponding to low, moderate, and high application rates, respectively) and NMDS axis 1 scores, diversity indices, and relative abundances and energy fluxes of trophic groups for each sampling time point. One-way ANOVA followed by post hoc pairwise comparisons (Tukey HSD for homogeneous variances; Tamhane’s T2 for heterogeneous variances) was used to compare the effects of each organic amendment treatment with the mineral fertilizer and unfertilized control treatments at each time point. Prior to analyses, normality was verified using Kolmogorov–Smirnov test, and variance homogeneity was assessed using Levene’s test, using the stats and car packages.
To examine the mechanistic pathways linking organic amendments to soil carbon sequestration through nematode community characteristics, we focused on day 105 data, when the system had reached relative stability and carbon sequestration effects were well established. This approach also minimized confounding effects from early decomposition dynamics while capturing the longer-term biological regulation of carbon pools.
Redundancy analysis (RDA) was performed using the vegan package to quantify the effects of organic amendment properties and input quantities (C and N inputs) on nematode trophic structure. The organic amendment property index (OMI) was represented as the first principal component based on intrinsic amendment properties, including chemical stoichiometry ratio ((C:N)−1) and pH deviation from neutrality (-|pH-7|). The nematode trophic structure matrix consisted of relative abundances of four trophic groups: plant parasites (PP), fungal feeders (FF), bacterial feeders (BF), and omnivore-predators (OP). The significance of the RDA model and its individual terms was assessed using permutation tests (9999 permutations).
Multivariate ordinary least squares (OLS) regression models were implemented to quantify relationships between nematode trophic structure and energetic parameters using the stats, broom, and car packages in R. Two analytical frameworks were established: (1) predictive models (trophic energy flux models) analyzing how trophic group relative abundances and Shannon diversity determine energy flux allocation to different trophic groups, and (2) functional models (system-level energy models) investigating how relative energy fluxes through trophic groups shape system-level energetic dynamics (total energy flux and energy flow uniformity). Prior to modeling, normality was verified using Shapiro–Wilk tests, with log-transformations applied to non-normal variables, and all predictors were standardized using Z-scores. Crucially, multicollinearity was rigorously assessed using variance inflation factors (VIF), with all models demonstrating acceptable VIF values (<5; range: 1.38–4.83). Model performance was evaluated using the coefficient of determination (R2) and statistical significance (p-value), with significant relationships (p < 0.05) visualized through scatter plots with regression lines and 95% confidence intervals using the ggplot2 package.
Spearman correlation analysis was employed to quantify relationships among organic amendment characteristics, nematode energetic parameters, and soil carbon components using the stats package. Random Forest analysis was implemented through the randomForest package to evaluate the relative importance of predictors in explaining variation in microbial necromass carbon pools and soil carbon fractions. For each response variable, 1000 regression trees were built, and variable importance was quantified by the percentage increase in mean squared error (%IncMSE) when each predictor was permuted. To verify robustness against multicollinearity, we conducted sensitivity analysis by comparing complete models with reduced models excluding the least important predictor (Fi-PP%). Variable importance rankings remained identical between model versions.
Partial least squares path modeling (PLS-PM) was performed using the plspm package to elucidate the direct and indirect effects of organic amendment characteristics, nematode energetic structure, and microbial necromass carbon on soil organic carbon accumulation. Prior to modeling, all variables were standardized using Z-score transformation to ensure comparability. Seven latent variables were defined: (1) Organic amendment characteristics represented by OMI, carbon inputs, and nitrogen inputs; (2) Energetic structure reflected by relative energy fluxes through different trophic groups (bacterivores, fungivores, plant parasites and omnivore-predators); (3) Total energy flux; (4) Flow uniformity; (5) Bacterial necromass carbon (BNC); (6) Fungal necromass carbon (FNC); (7) Soil organic carbon (SOC). The model structure was specified based on mechanistic insights from regression, correlation, and Random Forest analyses, with organic amendment characteristics hypothesized to influence the energetic structure of nematode food webs, which, in turn, affects microbial necromass accumulation and ultimately soil carbon sequestration. Multicollinearity diagnostics (variance inflation factors) confirmed acceptable levels both within latent constructs and in the structural model (all VIF < 5). Model quality was evaluated using the goodness-of-fit (GoF) index and coefficients of determination (R2) for latent variables.
3. Results
3.1. Nematode Abundance and Community Composition
Organic amendments distinctly altered nematode abundance dynamics (Figure 1a,c,e; Table S6). Straw (S) consistently enhanced nematode abundance in a positive, dose-dependent manner throughout the incubation period (p < 0.001), with populations peaking at day 30 (S3: 4295 ind./100 g dry soil) and remaining significantly elevated relative to the unfertilized control (CK) and mineral fertilizer (F) treatments until day 105 (p < 0.05; Figure 1a). Biochar (B) induced a non-monotonic response pattern, with abundance increasing at days 30 and 60 but declining most significantly under the highest rate (B3) by day 105 (p < 0.05; Figure 1c). In contrast, liquid organic fertilizer (L) exhibited a pronounced negative dose-dependent effect (Table S7), with moderate and high rates (L2 and L3) significantly suppressing abundance from day 30 onward (Figure 1e). Mineral fertilizer (F) consistently reduced abundance relative to the unfertilized control across all sampling points (Figure 1a,c,e).
Figure 1.
Effects of organic amendment type and application rate on soil nematode abundance and trophic structure over a 105-day incubation. (a,c,e): Total nematode abundance. (b,d,f): Relative abundance of nematode trophic groups. Amendments are straw (S; (a,b)), biochar (B; (c,d)), and liquid organic fertilizer (L; (e,f)), applied at low (1), moderate (2), and high (3) rates. Mineral fertilizer (F) and an unfertilized control (CK) are included for comparison. Trophic groups: PP, plant parasites; FF, fungal feeders; BF, bacterial feeders; OP, omnivore-predators. Error bars represent standard errors. Lowercase letters above error bars indicate significant differences among treatments within a sampling time (p < 0.05, Tukey’s HSD test).
Non-metric multidimensional scaling (NMDS) ordination revealed pronounced shifts in nematode community composition across all amendment regimes (Figure S2), statistically confirmed by PERMANOVA (p < 0.001 for sampling time, fertilization treatment, and their interaction). Straw treatments showed progressive community divergence with significant positive dose-responses at days 60–105, while biochar elicited only transient dose-dependent shifts at day 30, and liquid organic fertilizer induced a brief positive dose response at day 5 that dissipated thereafter (Table S7).
3.2. Nematode Community Diversity and Trophic Structure
Organic amendments substantially reshaped soil nematode community trophic structure, with distinct temporal dynamics and dose–response patterns (Figure 1b,d,f; Tables S6 and S7). Straw induced a fungal-dominated food web (Figure 1b), with fungal feeders (FF) increasing dose-dependently from day 30 onward (45.71–57.77% by day 30) and remaining elevated through day 105 (p < 0.05 vs. F and CK). Concurrently, omnivore-predators (OP) progressively increased to 30.48–33.01% under S2 and S3 by day 105 (vs. 5.71% in CK), while plant parasites (PP) declined dose-dependently to 12.06–17.46% (vs. 48.25% in CK).
Biochar favored bacterial feeders (BF) from day 15 onward (9.36–46.03%; Figure 1d), with significant dose-dependency only at day 15 (p < 0.05; Table S7). By day 105, biochar significantly enhanced OP (22.86–23.81%) and suppressed PP (20.00–24.44% vs. 48.25% in CK), without a dose-dependent effect on these responses.
Liquid organic fertilizer established a bacterial-dominated pathway (Figure 1f), with BF consistently exceeding 34.62% across all rates, peaking at 52.06% under L1 by day 105. While PP was persistently suppressed (11.11–15.24% by day 105) and FF remained low (11.75–26.98%) relative to straw treatments, OP increased markedly by day 105 (22.86–24.76%). Mineral fertilizer (F) consistently reduced OP (1.27% at day 105) and was less effective at suppressing PP than organic amendments (Figure 1b,d,f).
Nematode diversity (genera number and Shannon index) responded differentially to organic amendments (Figure S3). Straw temporarily reduced diversity by day 30 but recovered by day 105 (Figure S3a,b). Biochar showed more moderate effects on nematode diversity (Figure S3c,d), with both diversity indices remaining statistically similar to CK except for a significant increase under S1 at day 105. Liquid organic fertilizer caused immediate and persistent diversity suppression from day 5 onward (Figure S3e,f). Mineral fertilizer consistently reduced diversity relative to CK, with the strongest suppression at mid-incubation (days 30–60; Figure S3).
3.3. Energy Structure of Nematode Food Webs
Organic amendments fundamentally reshaped the energy structure of nematode food webs (Figure 2, Figure 3 and Figure S4; Tables S6 and S7). Mineral fertilizer (F) consistently suppressed both total energy flux (Et) and energy flow uniformity (U) throughout the incubation (Figure 2), resulting in the lowest values at day 105 (Et = 170.24 µg C 100 g−1 dry soil day−1; U = 0.70), reflecting a highly constrained, bacterivore-dominated energy channel with minimal omnivore-predator biomass (3.30 µg 100 g−1 dry soil).
Figure 2.
Effects of organic amendment type and application rate on the total energy flux through soil nematodes and the energy flow uniformity over a 105-day incubation. (a,c,e): Total energy flux; (b,d,f): Energy flow uniformity. Amendments are straw (S; (a,b)), biochar (B; (c,d)), and liquid organic fertilizer (L; (e,f)), applied at low (1), moderate (2), and high (3) rates. Mineral fertilizer (F) and an unfertilized control (CK) are included for comparison. Error bars represent standard errors. Lowercase letters above error bars indicate significant differences among treatments within a sampling time (p < 0.05, Tukey’s HSD test).
Figure 3.
Energetic structure of nematode food webs in response to organic amendment type and application rate at the end of incubation (day 105). For each fertilization treatment, a five-node food web is shown, with energy channels from basal resources (R) to bacterivores (green), fungivores (blue), and plant parasites (red), and further to omnivore-predators (purple). Line widths are proportional to energy flux (μg C 100 g−1 dry soil day−1); number in nodes indicates fresh biomass (μg 100 g−1 dry soil).
Straw amendment promoted a high-throughput, fungivore-driven energy pathway with strong positive dose-dependence (Figure 2a,b, Figure 3 and Figure S4a). Total energy flux (Et) through soil nematodes increased progressively with both time and application rate (Figure 2a), peaking at day 105 under S3 (2133.25 µg C 100 g−1 dry soil day−1), representing a 587% increase over CK and 1153% over F (p < 0.001). This enhancement was driven by sustained elevation in energy flux to fungal feeders (Fi-FF; Figure 3), which comprised 45.71–57.77% of Et by day 30 and remained elevated (32.70–38.52%) through day 105 (Figure S4a). Energy flux to omnivore-predators (Fi-OP) increased linearly with straw application rate (Table S7), reaching 717.00 µg C 100 g−1 dry soil day−1 under S3 at day 105 (vs. 34.17 µg C 100 g−1 dry soil day−1 in CK; Figure 3), with Fi-OP% peaking at 33.62% (vs. 1.06% in F; Figure S4a). This upward energy transfer supported substantial omnivore-predator biomass accumulation (Figure 3), while energy allocation to plant parasites declined dose-dependently to 10.30–20.55% by day 105 (Figure S4a). Straw application ultimately optimized energy partitioning by day 105, with the moderate rate (S2) achieving the highest final uniformity (U = 1.68 vs. 0.92 in CK; Figure 2b).
Biochar induced a non-linear, threshold-type energy response without clear dose-dependence (Figure 2c,d, Figure 3 and Figure S4b). Total energy flux remained generally comparable to CK, and significantly lower than in straw treatments (Figure 2c). Energy flux peaked at mid-incubation (day 30), particularly under B2 (1027.55 µg C 100 g−1 dry soil day−1), then declined but remained elevated relative to F through day 105 (Figure 2c). Energy allocation shifted dynamically during incubation (Figure S4b). Early decomposition (day 30) was characterized by bacterial channel dominance under B1 and B2, with bacterial feeders accounting for 40.56–43.84% of Et, concomitant with peak bacterivore biomass (B1 and B2: 731.02 and 724.90 µg 100 g−1 dry soil, respectively). By day 105, energy flow shifted toward enhanced top-down control, with significantly elevated omnivore-predator energy flux (Fi-OP: 89.7–126.4 µg C 100 g−1 dry soil day−1) and biomass (193.9–311.0 µg 100 g−1 dry soil) relative to CK (83.0 µg 100 g−1 dry soil), particularly under B2 (Figure 3). Concurrently, energy allocation to plant parasites was markedly suppressed (16.27–19.73% of Et vs. 47.93% in CK; Figure S4b). These shifts collectively increased energy flow uniformity by day 105, especially under B2 and B3 (U = 1.53–1.61 vs. 0.92 in CK; Figure 2d).
Liquid organic fertilizer exhibited consistently lower total energy flux than straw, with distinct temporal dynamics and dose responses (Figure 2e; Table S7). Total energy flux was initially suppressed across all application rates at day 5, and remained suppressed under L2-L3 from day 30 onward (≥20% lower than CK at day 105; Figure 2e). This suppression was driven by markedly reduced energy flow to plant parasites (e.g., Fi-PP under L2 and L3 at day 105 was 85.06% and 82.25% lower than CK, respectively), with lower plant parasite biomass (10.65 and 9.89 µg 100 g−1 dry soil under L2 and L3, respectively; Figure 3). In contrast, the low rate (L1) exhibited a remarkable recovery by day 105, with Et exceeding both CK and F (p < 0.05; Figure 2e). Under L1, energy flux was redirected toward omnivore-predators (175.98 µg C 100 g−1 dry soil day−1 at day 105 vs. 34.17 in CK), predominantly fueled by bacterivores (66.1% of Fi-OP) and supporting higher omnivore-predator biomass (422.68 µg 100 g−1 dry soil) than CK (Figure 3). Consequently, energy flow uniformity rebounded significantly by day 105 across all liquid fertilizer treatments compared to CK and F, with L3 achieving the highest uniformity (U = 1.49, 61.76% greater than CK; Figure 2f).
3.4. Soil Organic Carbon and Microbial Necromass Carbon Dynamics
Microbial necromass carbon exhibited amendment-specific patterns (Figure 4a–i; Tables S8 and S9). All organic amendments significantly enhanced total microbial necromass carbon compared to F and CK (p < 0.05), but with distinct temporal trajectories (Figure 4 a–i). Straw promoted robust, dose-dependent accumulation of both bacterial (BNC) and fungal (FNC) necromass carbon (Figure 4a,d), peaking at day 60 under S3 (FNC: 7.37 g kg−1; BNC: 2.09 g kg−1), which exceeded CK values by 27.65% and 26.05%, respectively (p < 0.05). However, the fungal:bacterial necromass ratio (FNC:BNC) decreased gradually with increasing straw application rate (e.g., from 5.15 under S1 to 3.52 under S3 at day 105), indicating a shift toward greater bacterial contribution to necromass (Figure 4g).
Figure 4.
Effects of organic amendment type and application rate on soil microbial necromass carbon over a 105-day incubation. (a–c): bacterial necromass carbon (BNC); (d–f): fungal necromass carbon (BNC); (g–i): fungal to bacterial necromass carbon (FNC: BNC). Amendments are straw (S; (a,d,g)), biochar (B; (b,e,h)), and liquid organic fertilizer (L; (c,f,i)), applied at low (1), moderate (2), and high (3) rates. Mineral fertilizer (F) and an unfertilized control (CK) are included for comparison. Error bars represent standard errors. Lowercase letters above error bars indicate significant differences among treatments within a sampling time (p < 0.05, Tukey’s HSD test).
Biochar induced a temporal pattern of BNC (Figure 4b) and FNC (Figure 4e) accumulation that peaked at day 60, then declined at day 105, though remaining significantly higher than CK values. It resulted in a shift toward fungal-derived carbon, with FNC:BNC ratios (4.71–5.00) dramatically elevated across all application rates relative to CK (2.71) at day 105 (Figure 4h). Liquid organic fertilizer showed distinct temporal patterns: BNC peaked at day 30 under L3 (Figure 4c), whereas FNC peaked at day 60 under L1 (Figure 4f). By day 105, the FNC:BNC ratio declined sharply with increasing application rate (from 4.64 under L1 to 2.91 under L3; Figure 4i), reflecting a dose-dependent shift from fungal to bacterial residue dominance. In contrast, mineral fertilizer increased FNC relative to CK by day 105 (Figure 4d–f) and maintained a higher FNC:BNC ratio (3.17 vs. 2.71; Figure 4g–i).
Organic amendments significantly altered soil organic carbon (SOC) and readily oxidizable carbon (ROC) dynamics (Figure 5; Tables S8 and S9). Straw induced pronounced, dose-dependent increases in SOC (Figure 5a), peaking at day 60 under S3, which exceeded CK and F by 15.09% and 17.76%, respectively (p < 0.05). Readily oxidizable carbon (ROC), a labile carbon component, exhibited an even stronger response to straw (Figure 5d), with S3 increasing ROC by 33.97% and 39.93% relative to CK and F at day 30 (p < 0.05). Biochar increased SOC with a delayed response, reaching maximum values at day 105 (exceeding CK and F by 20.18% and 23.92%, respectively; Figure 5b), though ROC peaked at day 30, followed by a gradual decline (Figure 5e). In contrast, liquid organic fertilizer elevated SOC only at the highest application rate (L3) during days 30-60, with no persistent effects at day 105 (Figure 5c), while consistently increasing ROC across most sampling times and peaking under L3 at day 30 (Figure 5f). Mineral fertilizer consistently suppressed SOC relative to CK throughout the incubation (Figure 5a–c) and significantly reduced ROC at day 105 (Figure 5d–f).
Figure 5.
Effects of organic amendment type and application rate on soil organic carbon (a–c) and readily oxidizable carbon (d–f) over a 105-day incubation. Amendments are straw (S; (a,d)), biochar (B; (b,e)), and liquid organic fertilizer (L; (c,f)), applied at low (1), moderate (2), and high (3) rates. Mineral fertilizer (F) and an unfertilized control (CK) are included for comparison. Error bars represent standard errors. Lowercase letters above error bars indicate significant differences among treatments within a sampling time (p < 0.05, Tukey’s HSD test).
3.5. Mechanistic Pathways Linking Amendment Properties, Nematode Energetics, and Carbon Accumulation
To elucidate the mechanistic pathways governing organic carbon accumulation through nematode community regulation, we analyzed data from the terminal incubation stage (day 105), when the system reached relative stability and carbon sequestration effects were well-established.
Redundancy analysis (RDA) indicated that nematode trophic structure was fundamentally governed by both amendment intrinsic properties and their application rates (F = 9.54, p < 0.001; Figure S5). The first two RDA axes explained 54.6% of the total variance, with the amendment property index (OMI) accounting for 45.7% of the variation on the primary axis, while carbon and nitrogen inputs contributed mainly to the secondary axis (8.9%). OMI clearly differentiated amendment types: straw treatments were associated with fungal feeders (FF), biochar with plant parasites (PP), and liquid organic fertilizer with bacterial feeders (BF). Carbon input positively correlated with omnivore-predators (OP), inducing pronounced dose-dependent shifts in straw treatments, moderate responses in liquid fertilizer, and minimal variation in biochar applications.
Linear regression analyses revealed strong correlations between nematode trophic structure and energy allocation (Figure 6). At day 105, the relative abundance of each trophic group strongly predicted its corresponding relative energy flux (R2 > 0.75, p < 0.001; Figure 6a–d). These fluxes played distinct roles in system-level energetics: relative energy flux of fungal feeders was positively correlated with total energy flux (R2 = 0.27, p < 0.01; Figure 6e), while that of bacterivores negatively influenced both total energy flux (R2 = 0.48, p < 0.001; Figure 6f) and energy flow uniformity (R2 = 0.38, p < 0.001; Figure 6g). In contrast, the relative energy flux of omnivore-predators was positively associated with energy flow uniformity (R2 = 0.27, p < 0.01; Figure 6h). Shannon diversity was positively related to the relative abundance of plant parasites (R2 = 0.20, p < 0.05; Figure 6i), which in turn suppressed the relative energy fluxes of both fungal feeders (R2 = 0.16, p < 0.05; Figure 6j) and omnivore-predators (R2 = 0.35, p < 0.01; Figure 6k).
Figure 6.
Relationships between nematode community structure and food-web energetics across different organic amendments. (a–d) Trophic group dominance determines energy allocation: Linear regressions between the relative abundance and relative energy flux of (a) bacterial feeders (BF), (b) fungal feeders (FF), (c) plant parasites (PP), and (d) omnivore-predators (OP). (e–h) Trophic regulation of system-level energy dynamics: Linear regressions showing how the relative energy fluxes of trophic groups influence (e,f) total energy flux and (g,h) energy flow uniformity in nematode food webs. (i–k) Diversity-mediated trophic interactions: Relationships showing (i) the link between Shannon diversity and PP relative abundance, and the subsequent effects of PP abundance on (j) FF and (k) OP relative energy fluxes. Black lines represent fitted OLS regression models; shaded areas indicate 95% confidence intervals. Model fit and significance are indicated by R2 and p-values.
Spearman correlation and Random Forest analyses revealed that the energetic structure of the nematode food web played a pivotal role in regulating microbial necromass carbon pools (Figure 7a). Fungivore relative energy flux exhibited the strongest positive correlation with bacterial necromass carbon (BNC; r = 0.88, p < 0.001; %IncMSE = 23.03) and was positively associated with fungal necromass carbon (FNC; r = 0.42, p < 0.05; %IncMSE = 9.56) and soil organic carbon (SOC; r = 0.49, p < 0.05; %IncMSE = 13.17), but negatively correlated with FNC:BNC ratio (r = −0.88, p < 0.001; %IncMSE = 26.74). Bacterivore relative energy flux negatively influenced BNC (r = −0.65, p < 0.001; %IncMSE = 15.29) and SOC (r = −0.56, p < 0.01; %IncMSE = 10.97), while positively related to FNC:BNC (r = 0.59, p < 0.01; %IncMSE = 11.58). Plant-parasite relative energy flux was negatively correlated with BNC (r = −0.56, p < 0.001; %IncMSE = 5.40) and readily oxidizable carbon (ROC; r = −0.77, p < 0.001; %IncMSE = 23.09), but positively related to FNC:BNC (r = 0.53, p < 0.01; %IncMSE = 3.55). Omnivore-predator relative energy flux consistently promoted both BNC (r = 0.40, p < 0.05; %IncMSE = 5.22) and FNC accumulation (r = 0.63, p < 0.001; %IncMSE = 15.23), and was positively linked to ROC (r = 0.66, p < 0.001; %IncMSE = 14.75). Both total energy flux (Et) and energy flow uniformity (U) showed significant positive relationships with FNC (p < 0.05; %IncMSE = 13.06 and 9.89, respectively), and U was also positively correlated with SOC (r = 0.48, p < 0.05; %IncMSE = 7.79).
Figure 7.
Mechanistic pathways linking organic amendment characteristics to soil carbon sequestration through nematode food-web energetics and microbial necromass formation. (a) Contributions of organic amendment properties, resource inputs, and nematode energetic variables to microbial necromass carbon pools and soil carbon fractions. The analysis is based on Spearman correlation and Random Forest regression. Circle size indicates the relative importance of each predictor (percentage increase in mean squared error, %IncMSE). Color scale denotes Spearman’s correlation coefficients, with asterisks indicating significance levels: * p < 0.05, ** p < 0.01, *** p < 0.001. Variable abbreviations: OMI, organic amendment property index (first principal component based on amendment chemical stoichiometry ratio ((C:N)−1) and pH deviation from neutrality (-|pH-7|)); C inputs, carbon input quantity; N inputs, nitrogen input quantity; Fi-BF%, relative energy flux to bacterivores; Fi-FF%, relative energy flux to fungivores; Fi-PP%, relative energy flux to plant parasites; Fi-OP%, relative energy flux to omnivore-predators; Et, total energy flux through nematodes; U, energy flow uniformity; BNC, bacterial necromass carbon; FNC, fungal necromass carbon; FNC:BNC, fungal-to-bacterial necromass carbon ratio; SOC, soil organic carbon; ROC, readily oxidizable carbon. (b) Partial least squares path model (PLS-PM) depicting the direct and indirect effects. The model illustrates how organic amendment characteristics (OMI, C inputs, and N inputs) influence nematode energetic structure (relative energy fluxes of bacterivores, fungivores, plant parasites, and omnivore-predators), which subsequently regulate total energy flux (Et) and energy flow uniformity (U), and ultimately affect microbial necromass carbon (BNC, FNC) and SOC accumulation. Red and blue arrows denote significant negative and positive standardized path coefficients, respectively; gray dashed arrows represent non-significant paths. The significant standard path coefficients were shown on arrows, with the arrow width proportional to the coefficient. R2 values adjacent to endogenous latent variables indicate the proportion of variance explained by those variables. The GoF index represents the overall goodness-of-fit of the model.
The partial least squares path model (PLS-PM) revealed distinct mechanistic pathways through which organic amendments regulate SOC accumulation via nematode energetics and microbial necromass (GoF = 0.64; Figure 7b). Organic amendment characteristics (OMI and input quantities) exerted a strong positive effect on nematode energetic structure (β = 0.86), explaining 73.7% of its variance. This energetic structure strongly influenced both total energy flux (β = 0.85) and energy flow uniformity (β = 0.52), which differentially regulated microbial necromass carbon: total energy flux positively affected both BNC (β = 0.86) and FNC (β = 0.39), while energy flow uniformity enhanced FNC (β = 0.47) but did not significantly affect BNC. Critically, BNC and FNC exerted opposing effects on SOC accumulation: BNC showed a negative relationship (β = −0.38), while FNC showed a strong positive relationship (β = 0.48). This model explained 69.50% of the variance in SOC accumulation, demonstrating that organic amendments enhance SOC primarily by promoting fungal-dominated energy channels and increasing FNC, with the energetic structure of nematode communities playing a pivotal mediating role.
4. Discussion
4.1. Organic Amendment Properties Regulate Nematode Food Web Energetics
Our study demonstrates that intrinsic properties of organic amendments, represented by an index (OMI) integrating chemical stoichiometry (N:C ratio) and pH, serve as the primary determinant of nematode food web energetic structure [31,32,58]. Straw, with its moderate C:N (33.96) and near-neutral pH (6.24), consistently promoted a fungal-dominated channel, significantly increasing the abundance and energy flux of fungal-feeding nematodes by day 105. This aligns with the microbial efficiency-matrix stabilization (MEMS) framework, in which higher C:N resources favor fungal assimilation, likely due to their enzymatic capacity to decompose complex carbon compounds and their hyphal networks that efficiently exploit heterogeneous resources [29,34,59]. This shift toward fungivore-driven decomposition was accompanied by a substantial rise in omnivore-predator energy flux, reflecting enhanced top-down regulation that stabilizes energy distribution across trophic levels [9,17].
The energetic response to biochar suggests that its pH may play a critical role in modulating outcomes predicted solely by stoichiometry. Despite its high C:N ratio (66.32), which would theoretically favor fungal dominance [29], biochar’s alkalinity (pH = 9.15) may have contributed to suboptimal conditions for many fungal taxa while potentially favoring alkaliphilic bacterial groups [60,61]. Consequently, the total energy flux under biochar remained comparable to that in CK and was significantly lower than in straw treatments. Early decomposition was characterized by bacterial channel dominance (up to 40.6–43.8% of energy flux at day 30), but by day 105, energy flow uniformity increased significantly (U = 1.53–1.61) through enhanced omnivore-predator regulation rather than increased energy flux. This temporal progression indicates that biochar shapes soil biota communities largely through indirect physicochemical mediation of habitat conditions [60,62], fostering a more balanced energy distribution across trophic channels without markedly altering total energy throughput.
In contrast, liquid organic fertilizer (C:N = 10.68; pH 10.21) exhibited strong, but temporally dynamic, rate-dependent effects on food web energetics, consistently favoring bacterial-dominated channels (>34.6% bacterial feeders) due to its low C:N ratio and high pH [29,31] (Figure 1f). Dose-dependent energy flow patterns emerged from day 30 onward (Figure 2e,f). Moderate and high rates (L2, L3) suppressed total energy flux by ≥20% relative to the control at day 105, whereas the low rate (L1) exhibited remarkable energetic recovery, exceeding both the CK and F treatments (Figure 2e). This recovery involved substantial energy redirection toward omnivore-predators (175.98 vs. 34.17 μg C 100 g−1 dry soil day−1 in CK; Figure 3), further promoting balanced energy distribution under L1 (Figure 2f). Critically, liquid organic fertilizer consistently suppressed energy flow through plant-parasitic nematodes, with L2 and L3 treatments reducing this flux by 85.06% and 82.25%, respectively, at day 105 (Figure 3). This pronounced suppression, stronger than under straw or biochar amendments (Figure S4), was likely from competitive displacement or altered root–microbe interactions from labile nutrient inputs [18,19], contributing to elevated energy flow uniformity under L2 and L3 despite their limited total energy flux (Figure 2f).
Despite these divergent initial energetic pathways, all organic amendments converged toward balanced energy distribution by day 105. While early decomposition showed distinct channel dominance (fungal-dominant under straw, bacterial-dominant under biochar, and liquid fertilizer), each amendment progressively shifted toward more uniform energy flow. This convergence was driven primarily by increased omnivore-predator energy flux during later incubation (days 60–105), enhancing top-down regulation and trophic connectivity [61]. Crucially, pathways to this stability differed: straw uniquely enhanced both total flux and uniformity; biochar improved energy flow uniformity without increasing total flux relative to CK; liquid organic fertilizer’s effects on both flux and uniformity were strongly rate-dependent. These results underscore that diverse organic inputs can restructure energy flow across multiple channels, unlike mineral fertilizer [63]. Mineral fertilization maintained constrained, bacterivore-dominated energetics (Et = 170.24 µg C 100 g−1 soil day−1; U = 0.70) with minimal omnivore-predator influence (<2% of flux), reflecting a trophically truncated system that inhibits higher-level regulation and fungal-mediated stabilization essential for long-term carbon sequestration [35,64,65,66].
Ultimately, amendment properties (C:N ratio, pH) and application rates interactively determine nematode food web energetics, with intrinsic characteristics governing dominant energy channels while application rates modulate their magnitude and temporal dynamics [67]. This interaction determines whether inputs promote balanced multi-channel flows or trophic imbalances [68]. Optimal carbon sequestration thus requires strategic matching of amendment types with appropriate application rates to harmonize energy channel activation with food web complexity.
4.2. Restructured Energetic Pattern Mediates Microbial Necromass and SOC Accumulation
Our analysis establishes that the energetic restructuring of nematode food webs is a pivotal mechanism linking organic amendments to SOC accumulation via microbial necromass formation. This challenges the paradigm equating carbon sequestration with carbon input quantity [6,58], underscoring the decisive role of biological regulation in determining carbon fate [16,22,35]. Path modeling quantified this cascade: amendments (characterized by intrinsic properties and input quantities) directly influenced nematode energetic structure (β = 0.86), shaping total energy flux (β = 0.85) and energy flow uniformity (β = 0.52). These energetic parameters differentially regulated microbial necromass: total flux positively affected both BNC (β = 0.86) and FNC (β = 0.39), while uniformity enhanced FNC (β = 0.47). Critically, BNC and FNC exerted opposing effects on SOC (β = −0.38 and β = 0.48, respectively), demonstrating that amendments enhance SOC primarily by promoting fungal-dominated channels and/or by prompting a more uniform energy distribution, thereby increasing fungal necromass contribution. These findings align with evidence that fungal residues contribute more to stable SOC pools due to their complex composition and stronger mineral associations than bacterial residues [7,69,70].
This mechanistic pathway explains why mineral fertilizer’ fails to enhance SOC, despite marginal increases in microbial necromass relative to CK by day 105. Lacking sustained organic substrate and complex food web structure [31], mineral fertilization induced a priming effect that accelerated native SOC decomposition [71,72], offsetting minimal gains from microbial necromass production. These results highlight that without proper biological regulation mediated by food web complexity, increased microbial activity does not ensure net carbon sequestration [7,27,63]. The positive correlation between energy flux to fungal feeders and FNC (r = 0.63, p < 0.01) suggests moderate grazing by higher trophic levels likely stimulates fungal turnover, enhancing the “microbial carbon pump” for converting living biomass into persistent necromass—a mechanism fundamentally impaired under mineral fertilization due to simplified food webs lacking top-down regulation [16,19,35,68].
While energy flow uniformity (U) is an important stability indicator enhanced by amendments [31,34], its role is integrative rather than solely deterministic. High straw input (S3) yielded the greatest absolute FNC and SOC gains despite slightly lower flow uniformity than the moderate rate, likely due to its substantial boost in total energy throughput. Liquid organic fertilizer achieved high energy flow uniformity even with suppressed total energy flux at high rates, but its FNC and SOC contributions were less pronounced than at the low rate. Biochar improved uniformity without increasing total energy flux, yet still aided fungal necromass accumulation. Thus, both total energy throughput and channel dominance are critical for short-term carbon accumulation [17,33,67], reflecting the dual importance of energy quantity and distribution quality. Moreover, a convergence toward balanced energy distribution occurred by day 105 across all amendments, driven by increased omnivore-predator energy flux, enhanced top-down regulation, and trophic connectivity [12,61,73]. The emergence of comparable stability in energy flow uniformity through distinct energetic pathways, such as fungal-dominated (straw), bacterial-then-balanced (biochar), or bacterial with suppressed plant parasites (liquid organic fertilizer), highlights the resilience of soil food webs to diverse organic inputs while maintaining functional stability.
4.3. Implications for Sustainable Management of Black Soils and Future Research Directions
Our findings provide a mechanistic foundation for designing biologically informed strategies to counter SOC depletion in China’s black soils. The contrast between organic amendments and mineral fertilization highlights that rebuilding soil biological complexity is as critical as nutrient supply for long-term soil health [65]. Unlike mineral fertilizer, which simplified food webs and suppressed carbon stabilization, organic amendments increased energy flow uniformity within nematode food webs, promoting fungal necromass accumulation and SOC stabilization. This challenges the paradigm that sequestration depends primarily on carbon input quantity [6,58], demonstrating instead that stabilization efficiency is governed by biological processes within soil food webs [18,27,74]. Notably, biochar and liquid organic fertilizer improved energy flow uniformity despite lower total flux, revealing that distribution quality can compensate for limited energy throughput. This nuanced interplay underscores the need for management strategies that optimize both energy distribution patterns and total carbon inputs to enhance SOC stabilization [9,17].
Translating these principles into practice requires integrating biological indicators (e.g., food web energetics) into management frameworks. All amendments enhanced late-stage energy flow uniformity: straw uniquely increased both total flux and uniformity; biochar improved uniformity by rebalancing channels without raising total flux. For liquid organic fertilizer, achieving optimal outcomes depends critically on application rate. Low rates may provide insufficient substrate, whereas high rates suppress total flux and reinforce bacterial dominance, though they still raise uniformity by strongly suppressing plant-parasitic energy flow. Given its high pH, co-application with acidifying amendments could mitigate alkalinity-induced constraints on fungal activity, potentially redirecting energy flow toward more efficient fungal-driven sequestration. A promising integrated strategy is to combine reduced mineral fertilizer with tailored organic amendments, harnessing productivity benefits while rebuilding biological complexity essential for long-term carbon sequestration [2,15,74,75].
Future research should validate these mechanisms under field conditions across diverse cropping systems and extend beyond our 105-day incubation to capture longer-term dynamics. Integrating food web energetics with soil physicochemical properties (e.g., mineralogy, aggregation) will yield a more holistic understanding of carbon stabilization [76,77]. Optimizing the “microbial carbon pump” through biologically informed management represents a universal and promising pathway toward climate-smart agriculture in this critical region [7,78].
5. Conclusions
This study demonstrates that the carbon sequestration potential of organic amendments in black soils is governed by the interplay between their intrinsic properties (C:N ratio and pH) and application rates, mediated by the restructuring of nematode food-web energetics (particularly the quantity and distribution of energy flux). Due to its moderate C:N ratio and near-neutral pH, straw uniquely enhanced both total energy flux and flow uniformity, establishing a fungivore-dominated pathway that maximized fungal necromass carbon (FNC) accumulation and drove significant SOC gains. In contrast, biochar’s high pH offset its high C:N ratio, favoring bacterial channels initially but ultimately improving energy flow uniformity through enhanced top-down regulation without increasing total flux, thus still promoting a higher fungal contribution to the necromass pool. Liquid organic fertilizer, with its low C:N and high pH, strongly reinforced bacterial pathways, but its effects were highly rate-dependent: low rates restored total energy flux and channeled energy to omnivore-predators, whereas high rates suppressed total flux but still raised uniformity by drastically reducing energy flow to plant parasites. This underscores the need for precise rate management and, potentially, pH adjustment to optimize its carbon sequestration function. These amendment-specific energetic patterns differentially regulated microbial necromass carbon (FNC, BNC, and their ratio), which critically determined SOC accumulation: FNC positively contributed to SOC, whereas bacterial necromass carbon showed a negative relationship. Conversely, mineral fertilization truncated food web structure, suppressed energy flow uniformity, and failed to enhance SOC. Therefore, the interaction between amendment properties and application rate steers energy flow patterns, microbial residue composition, and ultimately carbon sequestration. These findings provide a mechanistic basis for designing tailored, biology-informed management strategies that synchronize amendment type and dosage to enhance carbon storage and ecosystem stability in degraded black soils.
Supplementary Materials
The following supporting information can be downloaded at: https://www.mdpi.com/article/10.3390/agronomy16040414/s1, Table S1. Absolute abundance, trophic classification and colonizer-persister (cp) values of soil nematode genera across fertilization treatments at day 5 of incubation. Table S2. Absolute abundance, trophic classification and colonizer-persister (cp) values of soil nematode genera across fertilization treatments at day 15 of incubation. Table S3. Absolute abundance, trophic classification and colonizer-persister (cp) values of soil nematode genera across fertilization treatments at day 30 of incubation. Table S4. Absolute abundance, trophic classification and colonizer-persister (cp) values of soil nematode genera across fertilization treatments at day 60 of incubation. Table S5. Absolute abundance, trophic classification and colonizer-persister (cp) values of soil nematode genera across fertilization treatments at day 105 of incubation. Table S6. Results of two-way ANOVA examining the effects of incubation time, fertilization treatment (within each organic amendment type), and their interaction on soil nematode community characteristics (F- and p-values). Table S7. Linear regression results for the dose-response relationships between organic amendment application rate and soil nematode community characteristics, analyzed separately for each amendment type across the incubation period. Table S8. Results of two-way ANOVA examining the effects of incubation time, fertilization treatment (within each organic amendment type), and their interaction on soil organic carbon and microbial necromass carbon (F- and p-values). Table S9. Linear regression results for the dose-response relationships between organic amendment application rate and soil carbon components, analyzed separately for each amendment type across the incubation period. Figure S1. Schematic diagram illustrating the six-step approach for quantifying the energetic structure of soil nematode food webs. Figure S2. Non-metric multidimensional scaling (NMDS) ordination of soil nematode community composition in response to organic amendment type, application rate, and incubation time. Figure S3. Effects of organic amendment type and application rate on soil nematode diversity over a 105-day incubation. Figure S4. Effects of organic amendment type and application rate on the relative energy flux through trophic groups within soil nematode food web over a 105-day incubation. Figure S5. Redundancy analysis (RDA) of nematode trophic structure in response to organic amendment properties and input quantities.
Author Contributions
Conceptualization, J.H., G.L. and H.W.; methodology, J.H., F.S. and J.Z.; validation, J.H., H.W. and Z.W.; investigation, J.H., F.S. and Z.W.; resources, G.L. and S.Z.; data curation, J.H., J.Z. and Z.W.; writing—original draft preparation, J.H., J.Z. and Z.W.; writing—review and editing, F.S., H.W. and G.L.; visualization, J.Z. and G.L.; supervision, J.H., G.L. and S.Z.; project administration, J.H.; funding acquisition, J.H. All authors have read and agreed to the published version of the manuscript.
Funding
This work was supported by Joint Fund of the National Natural Science Foundation of China (U2243225), the Horizontal Research Project funded by Xi’an Qinheng Ecological Technology Co., Ltd. (20250292300880), the QinChuangyuan Project of Shaanxi Province (QCYRCXM-2022-361), and the Open Foundation of Technology Innovation Center for Land Engineering and Human Settlements, Shaanxi Land Engineering Construction Group Co., Ltd. and Xi’an Jiaotong University (2024WHZ2048).
Data Availability Statement
The original contributions presented in this study are included in the article/Supplementary Material. Further inquiries can be directed to the corresponding author.
Acknowledgments
The contributions of Tianyuan Huang and Jianjun Mai in carrying out the incubation experiment are gratefully acknowledged.
Conflicts of Interest
The authors declare no conflicts of interest.
Abbreviations
The following abbreviations are used in this manuscript:
| BF | bacterivorous nematodes |
| FF | fungivorous nematodes |
| PP | plant-parasitic nematodes |
| OP | omnivorous-predatory nematodes |
| Et | total energy flux |
| U | energy flow uniformity |
| BNC | bacterial necromass carbon |
| FNC | fungal necromass carbon |
| SOC | soil organic carbon |
| ROC | readily oxidizable carbon |
References
- Macías, F.; Camps Arbestain, M. Soil carbon sequestration in a changing global environment. Mitig. Adapt. Strateg. Glob. Change 2010, 15, 511–529. [Google Scholar] [CrossRef] [Scilit]
- Lal, R. Soil health and carbon management. Food Energy Secur. 2016, 5, 212–222. [Google Scholar] [CrossRef] [Scilit]
- Minasny, B.; Malone, B.P.; McBratney, A.B.; Angers, D.A.; Arrouays, D.; Chambers, A.; Chaplot, V.; Chen, Z.-S.; Cheng, K.; Das, B.S.; et al. Soil carbon 4 per mille. Geoderma 2017, 292, 59–86. [Google Scholar] [CrossRef] [Scilit]
- Wang, X.; Li, S.; Wang, L.; Zheng, M.; Wang, Z.; Song, K. Effects of cropland reclamation on soil organic carbon in China’s black soil region over the past 35 years. Glob. Change Biol. 2023, 29, 5460–5477. [Google Scholar] [CrossRef] [Scilit]
- Wagg, C.; Bender, S.F.; Widmer, F.; van der Heijden, M.G. Soil biodiversity and soil community composition determine ecosystem multifunctionality. Proc. Natl. Acad. Sci. USA 2014, 111, 5266–5270. [Google Scholar] [CrossRef] [Scilit]
- Lal, R. Soil Carbon Sequestration Impacts on Global Climate Change and Food Security. Science 2004, 304, 1623–1627. [Google Scholar] [CrossRef] [Scilit] [PubMed]
- Liang, C.; Amelung, W.; Lehmann, J.; Kästner, M. Quantitative assessment of microbial necromass contribution to soil organic matter. Glob. Change Biol. 2019, 25, 3578–3590. [Google Scholar] [CrossRef] [Scilit] [PubMed]
- Paul, E.A. The nature and dynamics of soil organic matter: Plant inputs, microbial transformations, and organic matter stabilization. Soil Biol. Biochem. 2016, 98, 109–126. [Google Scholar] [CrossRef] [Scilit]
- Barnes, A.D.; Jochum, M.; Lefcheck, J.S.; Eisenhauer, N.; Scherber, C.; O’Connor, M.I.; de Ruiter, P.; Brose, U. Energy Flux: The Link between Multitrophic Biodiversity and Ecosystem Functioning. Trends Ecol. Evol. 2018, 33, 186–197. [Google Scholar] [CrossRef] [Scilit] [PubMed]
- Kou, X.; Su, T.; Ma, N.; Li, Q.; Wang, P.; Wu, Z.; Liang, W.; Cheng, W. Soil micro-food web interactions and rhizosphere priming effect. Plant Soil 2018, 432, 129–142. [Google Scholar] [CrossRef] [Scilit]
- Six, J.; Frey, S.D.; Thiet, R.K.; Batten, K.M. Bacterial and Fungal Contributions to Carbon Sequestration in Agroecosystems. Soil Sci. Soc. Am. J. 2006, 70, 555–569. [Google Scholar] [CrossRef] [Scilit]
- Ferris, H. Form and function: Metabolic footprints of nematodes in the soil food web. Eur. J. Soil Biol. 2010, 46, 97–104. [Google Scholar] [CrossRef] [Scilit]
- Yeates, G.W.; Bongers, T.; De Goede, R.G.; Freckman, D.W.; Georgieva, S.S. Feeding habits in soil nematode families and genera-an outline for soil ecologists. J. Nematol. 1993, 25, 315–331. [Google Scholar]
- Barnes, A.D.; Weigelt, P.; Jochum, M.; Ott, D.; Hodapp, D.; Haneda, N.F.; Brose, U. Species richness and biomass explain spatial turnover in ecosystem functioning across tropical and temperate ecosystems. Philos. Trans. R. Soc. B Biol. Sci. 2016, 371, 20150279. [Google Scholar] [CrossRef] [Scilit]
- Pan, F.; Han, X.; Li, N.; Yan, J.; Xu, Y. Effect of organic amendment amount on soil nematode community structure and metabolic footprints in soybean phase of a soybean-maize rotation on Mollisols. Pedosphere 2020, 30, 544–554. [Google Scholar] [CrossRef] [Scilit]
- Du, L.; Bol, R.; Tu, C.; Sun, X.; Luo, R.; Liu, Q.; Luo, L.; Zhan, J.; Yin, C.; Zhu, B.; et al. Micro-Faunal and Edaphic Controls on Microbial Carbon Cycling Across Primary and Secondary Successional Trajectories. Glob. Change Biol. 2025, 31, e70642. [Google Scholar] [CrossRef] [Scilit]
- Buzhdygan, O.Y.; Meyer, S.T.; Weisser, W.W.; Eisenhauer, N.; Ebeling, A.; Borrett, S.R.; Buchmann, N.; Cortois, R.; De Deyn, G.B.; de Kroon, H.; et al. Biodiversity increases multitrophic energy use efficiency, flow and storage in grasslands. Nat. Ecol. Evol. 2020, 4, 393–405. [Google Scholar] [CrossRef] [Scilit]
- Wan, B.; Hu, Z.; Liu, T.; Yang, Q.; Li, D.; Zhang, C.; Chen, X.; Hu, F.; Kardol, P.; Griffiths, B.S.; et al. Organic amendments increase the flow uniformity of energy across nematode food webs. Soil Biol. Biochem. 2022, 170, 108695. [Google Scholar] [CrossRef] [Scilit]
- Thakur, M.P.; Geisen, S. Trophic Regulations of the Soil Microbiome. Trends Microbiol. 2019, 27, 771–780. [Google Scholar] [CrossRef] [Scilit]
- Wilschut, R.A.; Geisen, S. Nematodes as Drivers of Plant Performance in Natural Systems. Trends Plant Sci. 2021, 26, 237–247. [Google Scholar] [CrossRef] [Scilit] [PubMed]
- Kallenbach, C.M.; Grandy, A.S.; Frey, S.D.; Diefendorf, A.F. Microbial physiology and necromass regulate agricultural soil carbon accumulation. Soil Biol. Biochem. 2015, 91, 279–290. [Google Scholar] [CrossRef] [Scilit]
- Wan, B.; Liu, T.; Gong, X.; Zhang, Y.; Li, C.; Chen, X.; Hu, F.; Griffiths, B.S.; Liu, M. Energy flux across multitrophic levels drives ecosystem multifunctionality: Evidence from nematode food webs. Soil Biol. Biochem. 2022, 169, 108656. [Google Scholar] [CrossRef] [Scilit]
- Lin, Z.; Lu, X.; Xu, Y.; Sun, W.; Yu, Y.; Zhang, W.; Mishra, U.; Kuzyakov, Y.; Wang, G.; Qin, Z. Increased straw return promoted soil organic carbon accumulation in China’s croplands over the past 40 years. Sci. Total Environ. 2024, 945, 173903. [Google Scholar] [CrossRef] [Scilit]
- Nahar, M.S.; Grewal, P.S.; Miller, S.A.; Stinner, D.; Stinner, B.R.; Kleinhenz, M.D.; Wszelaki, A.; Doohan, D. Differential effects of raw and composted manure on nematode community, and its indicative value for soil microbial, physical and chemical properties. Appl. Soil Ecol. 2006, 34, 140–151. [Google Scholar] [CrossRef] [Scilit]
- Schmidt, H.-P.; Kammann, C.; Hagemann, N.; Leifeld, J.; Bucheli, T.D.; Sánchez Monedero, M.A.; Cayuela, M.L. Biochar in agriculture—A systematic review of 26 global meta-analyses. GCB Bioenergy 2021, 13, 1708–1730. [Google Scholar] [CrossRef] [Scilit]
- Sun, Q.; Yang, X.; Bao, Z.; Gao, J.; Meng, J.; Han, X.; Lan, Y.; Liu, Z.; Chen, W. Responses of microbial necromass carbon and microbial community structure to straw- and straw-derived biochar in brown earth soil of Northeast China. Front. Microbiol. 2022, 13, 967746. [Google Scholar] [CrossRef] [Scilit]
- Kou, X.; Morriën, E.; Tian, Y.; Zhang, X.; Lu, C.; Xie, H.; Liang, W.; Li, Q.; Liang, C. Exogenous carbon turnover within the soil food web strengthens soil carbon sequestration through microbial necromass accumulation. Glob. Change Biol. 2023, 29, 4069–4080. [Google Scholar] [CrossRef] [Scilit]
- Dong, M.; Zhou, H.; Wang, J.; Yang, J.; Lai, J.; Chen, Y.; Sun, F.; Ye, X.; Wu, Y. Responses of soil microbial metabolism, function and soil quality to long-term addition of organic materials with different carbon sources. Biochar 2024, 6, 80. [Google Scholar] [CrossRef] [Scilit]
- Cotrufo, M.F.; Wallenstein, M.D.; Boot, C.M.; Denef, K.; Paul, E. The Microbial Efficiency-Matrix Stabilization (MEMS) framework integrates plant litter decomposition with soil organic matter stabilization: Do labile plant inputs form stable soil organic matter? Glob. Change Biol. 2013, 19, 988–995. [Google Scholar] [CrossRef] [Scilit]
- Vestergård, M.; Bang-Andreasen, T.; Buss, S.M.; Cruz-Paredes, C.; Bentzon-Tilia, S.; Ekelund, F.; Kjøller, R.; Hindborg Mortensen, L.; Rønn, R. The relative importance of the bacterial pathway and soil inorganic nitrogen increase across an extreme wood-ash application gradient. GCB Bioenergy 2018, 10, 320–334. [Google Scholar] [CrossRef] [Scilit]
- Huang, T.; Huang, J.; Zhang, J.; Li, G.; Zhao, S. Organic Amendments Enhance Agroecosystem Multifunctionality via Divergent Regulation of Energy Flow Uniformity in Soil Nematode Food Webs. Agronomy 2025, 15, 1048. [Google Scholar] [CrossRef] [Scilit]
- Wan, B.; Barnes, A.D.; Potapov, A.; Yang, J.; Zhu, M.; Chen, X.; Hu, F.; Liu, M. Altered litter stoichiometry drives energy dynamics of food webs through changing multiple facets of soil biodiversity. Soil Biol. Biochem. 2024, 191, 109331. [Google Scholar] [CrossRef] [Scilit]
- Luo, J.; Zhang, X.; Kou, X.; Xie, H.; Bao, X.; Mahamood, M.; Liang, W. Effects of residue mulching amounts on metabolic footprints based on production and respiration of soil nematodes in a long-term no-tillage system. Land Degrad. Dev. 2021, 32, 2383–2392. [Google Scholar] [CrossRef] [Scilit]
- Zhu, B.; Wan, B.; Liu, T.; Zhang, C.; Cheng, L.; Cheng, Y.; Tian, S.; Chen, X.; Hu, F.; Whalen, J.K.; et al. Biochar enhances multifunctionality by increasing the uniformity of energy flow through a soil nematode food web. Soil Biol. Biochem. 2023, 183, 109056. [Google Scholar] [CrossRef] [Scilit]
- Liang, C.; Schimel, J.P.; Jastrow, J.D. The importance of anabolism in microbial control over soil carbon storage. Nat. Microbiol. 2017, 2, 17105. [Google Scholar] [CrossRef] [Scilit] [PubMed]
- Luo, L.; Wang, J.; Lv, J.; Liu, Z.; Sun, T.; Yang, Y.; Zhu, Y.-G. Carbon Sequestration Strategies in Soil Using Biochar: Advances, Challenges, and Opportunities. Environ. Sci. Technol. 2023, 57, 11357–11372. [Google Scholar] [CrossRef] [Scilit]
- Walkley, A.; Black, I.A. An examination of the degtjareff method for determining soil organic matter, and a proposed modification of the chromic acid titration method. Soil Sci. 1934, 37, 29–38. [Google Scholar] [CrossRef] [Scilit]
- Lu, R. Analytical Methods of Soil Agricultural Chemistry; China Agricultural Science Press: Beijing, China, 2000. (In Chinese) [Google Scholar]
- Blair, G.; Lefroy, R.; Lisle, L. Soil carbon fractions based on their degree of oxidation, and the development of a carbon management index for agricultural systems. Aust. J. Agric. Res. 1995, 46, 1459–1466. [Google Scholar] [CrossRef] [Scilit]
- Zhang, X.; Amelung, W. Gas chromatographic determination of muramic acid, glucosamine, mannosamine, and galactosamine in soils. Soil Biol. Biochem. 1996, 28, 1201–1206. [Google Scholar] [CrossRef] [Scilit]
- Joergensen, R.G.; Wichern, F. Quantitative assessment of the fungal contribution to microbial tissue in soil. Soil Biol. Biochem. 2008, 40, 2977–2991. [Google Scholar] [CrossRef] [Scilit]
- Chen, G.; Ma, S.; Tian, D.; Xiao, W.; Jiang, L.; Xing, A.; Zou, A.; Zhou, L.; Shen, H.; Zheng, C.; et al. Patterns and determinants of soil microbial residues from tropical to boreal forests. Soil Biol. Biochem. 2020, 151, 108059. [Google Scholar] [CrossRef] [Scilit]
- Liu, M.; Chen, X.; Qin, J.; Wang, D.; Griffiths, B.; Hu, F. A sequential extraction procedure reveals that water management affects soil nematode communities in paddy fields. Appl. Soil Ecol. 2008, 40, 250–259. [Google Scholar] [CrossRef] [Scilit]
- Bongers, A.M.T. De Nematoden Van Nederland; Pirota Schoorl, Bibliotheek Uitgave KNNV, nr. 46: Utrecht, The Netherlands, 1988; p. 408. [Google Scholar]
- Ahmad, W.; Jairajpuri, M.S. Mononchida: The Predatory Soil Nematodes; Brill: Leiden, The Netherlands, 2010. [Google Scholar]
- Yin, W. Pictorical Key to Soil Animals of China; Science Press: Beijing, China, 1998. [Google Scholar]
- Bongers, T.; Bongers, M. Functional diversity of nematodes. Appl. Soil Ecol. 1998, 10, 239–251. [Google Scholar] [CrossRef] [Scilit]
- Oksanen, J.; Blanchet, F.G.; Kindt, R.; Legendre, P.; Minchin, P.; O’Hara, R.B.; Simpson, G.; Solymos, P.; Stevens, M.H.H.; Wagner, H. Vegan: Community Ecology Package; CRAN: Windhoek, Namibia, 2015. [Google Scholar]
- Shannon, C.E. A mathematical theory of communication. Bell Syst. Tech. J. 1948, 27, 379–423. [Google Scholar] [CrossRef] [Scilit]
- van den Hoogen, J.; Geisen, S.; Routh, D.; Ferris, H.; Traunspurger, W.; Wardle, D.A.; de Goede, R.G.M.; Adams, B.J.; Ahmad, W.; Andriuzzi, W.S.; et al. Soil nematode abundance and functional group composition at a global scale. Nature 2019, 572, 194–198. [Google Scholar] [CrossRef] [Scilit]
- West, G.B.; Brown, J.H.; Enquist, B.J. A General Model for the Origin of Allometric Scaling Laws in Biology. Science 1997, 276, 122–126. [Google Scholar] [CrossRef] [Scilit]
- Klekowski, R.Z.; Wasilewska, L.; Paplinska, E. Oxygen Consumption by Soil-Inhabiting Nematodes. Nematologica 1972, 18, 391–403. [Google Scholar] [CrossRef] [Scilit]
- Atkinson, H.J. 5—Respiration in Nematodes. In Aging and Other Model Systems; Zuckerman, B.M., Ed.; Academic Press: Cambridge, MA, USA, 1980; pp. 101–142. [Google Scholar]
- Cui, S.; Liang, S.; Zhang, X.; Li, Y.; Liang, W.; Sun, L.; Wang, J.; Martijn Bezemer, T.; Li, Q. Long-term fertilization management affects the C utilization from crop residues by the soil micro-food web. Plant Soil 2018, 429, 335–348. [Google Scholar] [CrossRef] [Scilit]
- Barnes, A.D.; Jochum, M.; Mumme, S.; Haneda, N.F.; Farajallah, A.; Widarto, T.H.; Brose, U. Consequences of tropical land use for multitrophic biodiversity and ecosystem functioning. Nat. Commun. 2014, 5, 5351. [Google Scholar] [CrossRef] [Scilit] [PubMed]
- De Ruiter, P.C.; Van Veen, J.A.; Moore, J.C.; Brussaard, L.; Hunt, H.W. Calculation of nitrogen mineralization in soil food webs. Plant Soil 1993, 157, 263–273. [Google Scholar] [CrossRef] [Scilit]
- Jochum, M.; Barnes, A.D.; Ott, D.; Lang, B.; Klarner, B.; Farajallah, A.; Scheu, S.; Brose, U. Decreasing Stoichiometric Resource Quality Drives Compensatory Feeding across Trophic Levels in Tropical Litter Invertebrate Communities. Am. Nat. 2017, 190, 131–143. [Google Scholar] [CrossRef] [Scilit]
- Schmidt, M.W.I.; Torn, M.S.; Abiven, S.; Dittmar, T.; Guggenberger, G.; Janssens, I.A.; Kleber, M.; Kögel-Knabner, I.; Lehmann, J.; Manning, D.A.C.; et al. Persistence of soil organic matter as an ecosystem property. Nature 2011, 478, 49–56. [Google Scholar] [CrossRef] [Scilit] [PubMed]
- Frey, S.D.; Six, J.; Elliott, E.T. Reciprocal transfer of carbon and nitrogen by decomposer fungi at the soil–litter interface. Soil Biol. Biochem. 2003, 35, 1001–1004. [Google Scholar] [CrossRef] [Scilit]
- Lehmann, J.; Rillig, M.C.; Thies, J.; Masiello, C.A.; Hockaday, W.C.; Crowley, D. Biochar effects on soil biota—A review. Soil Biol. Biochem. 2011, 43, 1812–1836. [Google Scholar] [CrossRef] [Scilit]
- Chen, J.; Sun, X.; Zheng, J.; Zhang, X.; Liu, X.; Bian, R.; Li, L.; Cheng, K.; Zheng, J.; Pan, G. Biochar amendment changes temperature sensitivity of soil respiration and composition of microbial communities 3 years after incorporation in an organic carbon-poor dry cropland soil. Biol. Fertil. Soils 2018, 54, 175–188. [Google Scholar] [CrossRef] [Scilit]
- Gul, S.; Whalen, J.K.; Thomas, B.W.; Sachdeva, V.; Deng, H. Physico-chemical properties and microbial responses in biochar-amended soils: Mechanisms and future directions. Agric. Ecosyst. Environ. 2015, 206, 46–59. [Google Scholar] [CrossRef] [Scilit]
- Zhu, B.; Whalen, J.K.; Wu, J.; Yang, J.; Mao, X.; Wan, B.; Tian, S.; Hu, F.; Chen, X.; Liu, M. Soil food web structure coordinated by soil omnivores sustains soil multifunctionality in moderate vermicompost amended fields. Soil Biol. Biochem. 2024, 192, 109391. [Google Scholar] [CrossRef] [Scilit]
- Zhu, B.; Kardol, P.; Jiang, L.; Cheng, Y.; Tian, S.; Chen, X.; Liu, M. Organic amendments enhance the temporal stability of crop productivity through stimulating multitrophic network complexity. Soil Tillage Res. 2026, 257, 106988. [Google Scholar] [CrossRef] [Scilit]
- Bardgett, R.D.; van der Putten, W.H. Belowground biodiversity and ecosystem functioning. Nature 2014, 515, 505–511. [Google Scholar] [CrossRef] [Scilit]
- Wang, H.; Xing, Y.; Yan, G.; Liu, G.; Wang, Q. Nitrogen addition and precipitation reduction alter ecosystem multifunctionality and decrease soil nematode abundance and trophic energy fluxes in a temperate forest. Appl. Soil Ecol. 2024, 201, 105489. [Google Scholar] [CrossRef] [Scilit]
- Domene, X.; Mattana, S.; Sánchez-Moreno, S. Biochar addition rate determines contrasting shifts in soil nematode trophic groups in outdoor mesocosms: An appraisal of underlying mechanisms. Appl. Soil Ecol. 2021, 158, 103788. [Google Scholar] [CrossRef] [Scilit]
- Zheng, H.; Gao, D.; Zhou, Y.; Zhao, J. Energy flow across soil food webs of different ecosystems: Food webs with complex structures support higher energy flux. Geoderma 2023, 439, 116666. [Google Scholar] [CrossRef] [Scilit]
- Wang, X.; Yu, G.-H.; Kuzyakov, Y.; Yin, B.-H.; Kappler, A.; Liu, C.-Q. Contribution of fungal biomass to persistent soil carbon across natural ecosystems. Sci. China Earth Sci. 2025, 68, 444–456. [Google Scholar] [CrossRef] [Scilit]
- Klink, S.; Keller, A.B.; Wild, A.J.; Baumert, V.L.; Gube, M.; Lehndorff, E.; Meyer, N.; Mueller, C.W.; Phillips, R.P.; Pausch, J. Stable isotopes reveal that fungal residues contribute more to mineral-associated organic matter pools than plant residues. Soil Biol. Biochem. 2022, 168, 108634. [Google Scholar] [CrossRef] [Scilit]
- Abdalla, K.; Sun, Y.; Zarebanadkouki, M.; Gaiser, T.; Seidel, S.; Pausch, J. Long-term continuous farmyard manure application increases soil carbon when combined with mineral fertilizers due to lower priming effects. Geoderma 2022, 428, 116216. [Google Scholar] [CrossRef] [Scilit]
- Yang, K.; Liu, Y.; Ge, S.; Zou, C.; Liu, L.; Zhang, X. Soil microbes mediate the priming effect in response to 12 years of nitrogen management in different crop cultivation patterns. Appl. Soil Ecol. 2025, 206, 105844. [Google Scholar] [CrossRef] [Scilit]
- Long, X.; Zhao, J.; Li, J.; Liao, X.; Wang, J.; Fu, Z.; Zhang, W.; Liu, X.; Wang, K. Disturbance intensity shapes the soil micro-food web compositions and energy fluxes during seven-year land use changes. Soil Biol. Biochem. 2024, 194, 109424. [Google Scholar] [CrossRef] [Scilit]
- Tao, F.; Huang, Y.; Hungate, B.A.; Manzoni, S.; Frey, S.D.; Schmidt, M.W.I.; Reichstein, M.; Carvalhais, N.; Ciais, P.; Jiang, L.; et al. Microbial carbon use efficiency promotes global soil carbon storage. Nature 2023, 618, 981–985. [Google Scholar] [CrossRef] [Scilit]
- Amelung, W.; Bossio, D.; de Vries, W.; Kögel-Knabner, I.; Lehmann, J.; Amundson, R.; Bol, R.; Collins, C.; Lal, R.; Leifeld, J.; et al. Towards a global-scale soil climate mitigation strategy. Nat. Commun. 2020, 11, 5427. [Google Scholar] [CrossRef] [Scilit] [PubMed]
- Angst, G.; Mueller, K.E.; Castellano, M.J.; Vogel, C.; Wiesmeier, M.; Mueller, C.W. Unlocking complex soil systems as carbon sinks: Multi-pool management as the key. Nat. Commun. 2023, 14, 2967. [Google Scholar] [CrossRef] [Scilit]
- Li, J.; Zhu, X.; Zhou, F.; Li, Y.; Ma, X.; Zhang, W.; Bao, X.; Zheng, T.; Bai, Z.; He, H.; et al. Biochemical heterogeneity of soil components manipulating long-term organic carbon pool buildup over mineral protection in the mollisol. Soil Tillage Res. 2025, 252, 106578. [Google Scholar] [CrossRef] [Scilit]
- Mercer, G.D.; Mickan, B.S.; Gleeson, D.B.; Walker, E.; Krohn, C.; Bühlmann, C.H.; Ryan, M.H. Probing the pump: Soil carbon dynamics, microbial carbon use efficiency and community composition in response to stoichiometrically-balanced compost and biochar. Soil Biol. Biochem. 2025, 205, 109770. [Google Scholar] [CrossRef] [Scilit]
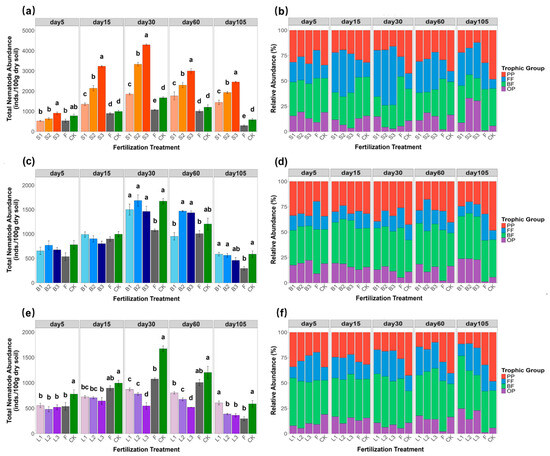
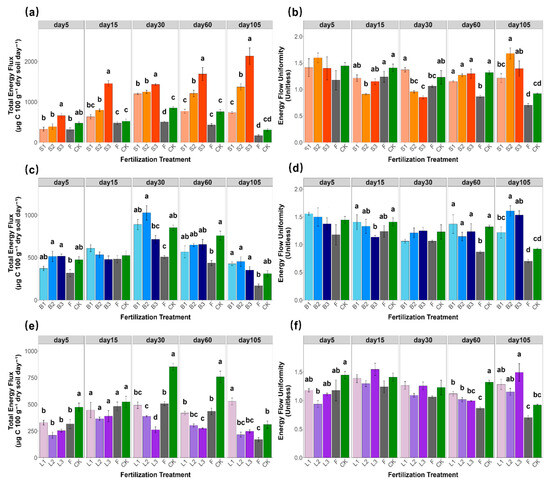
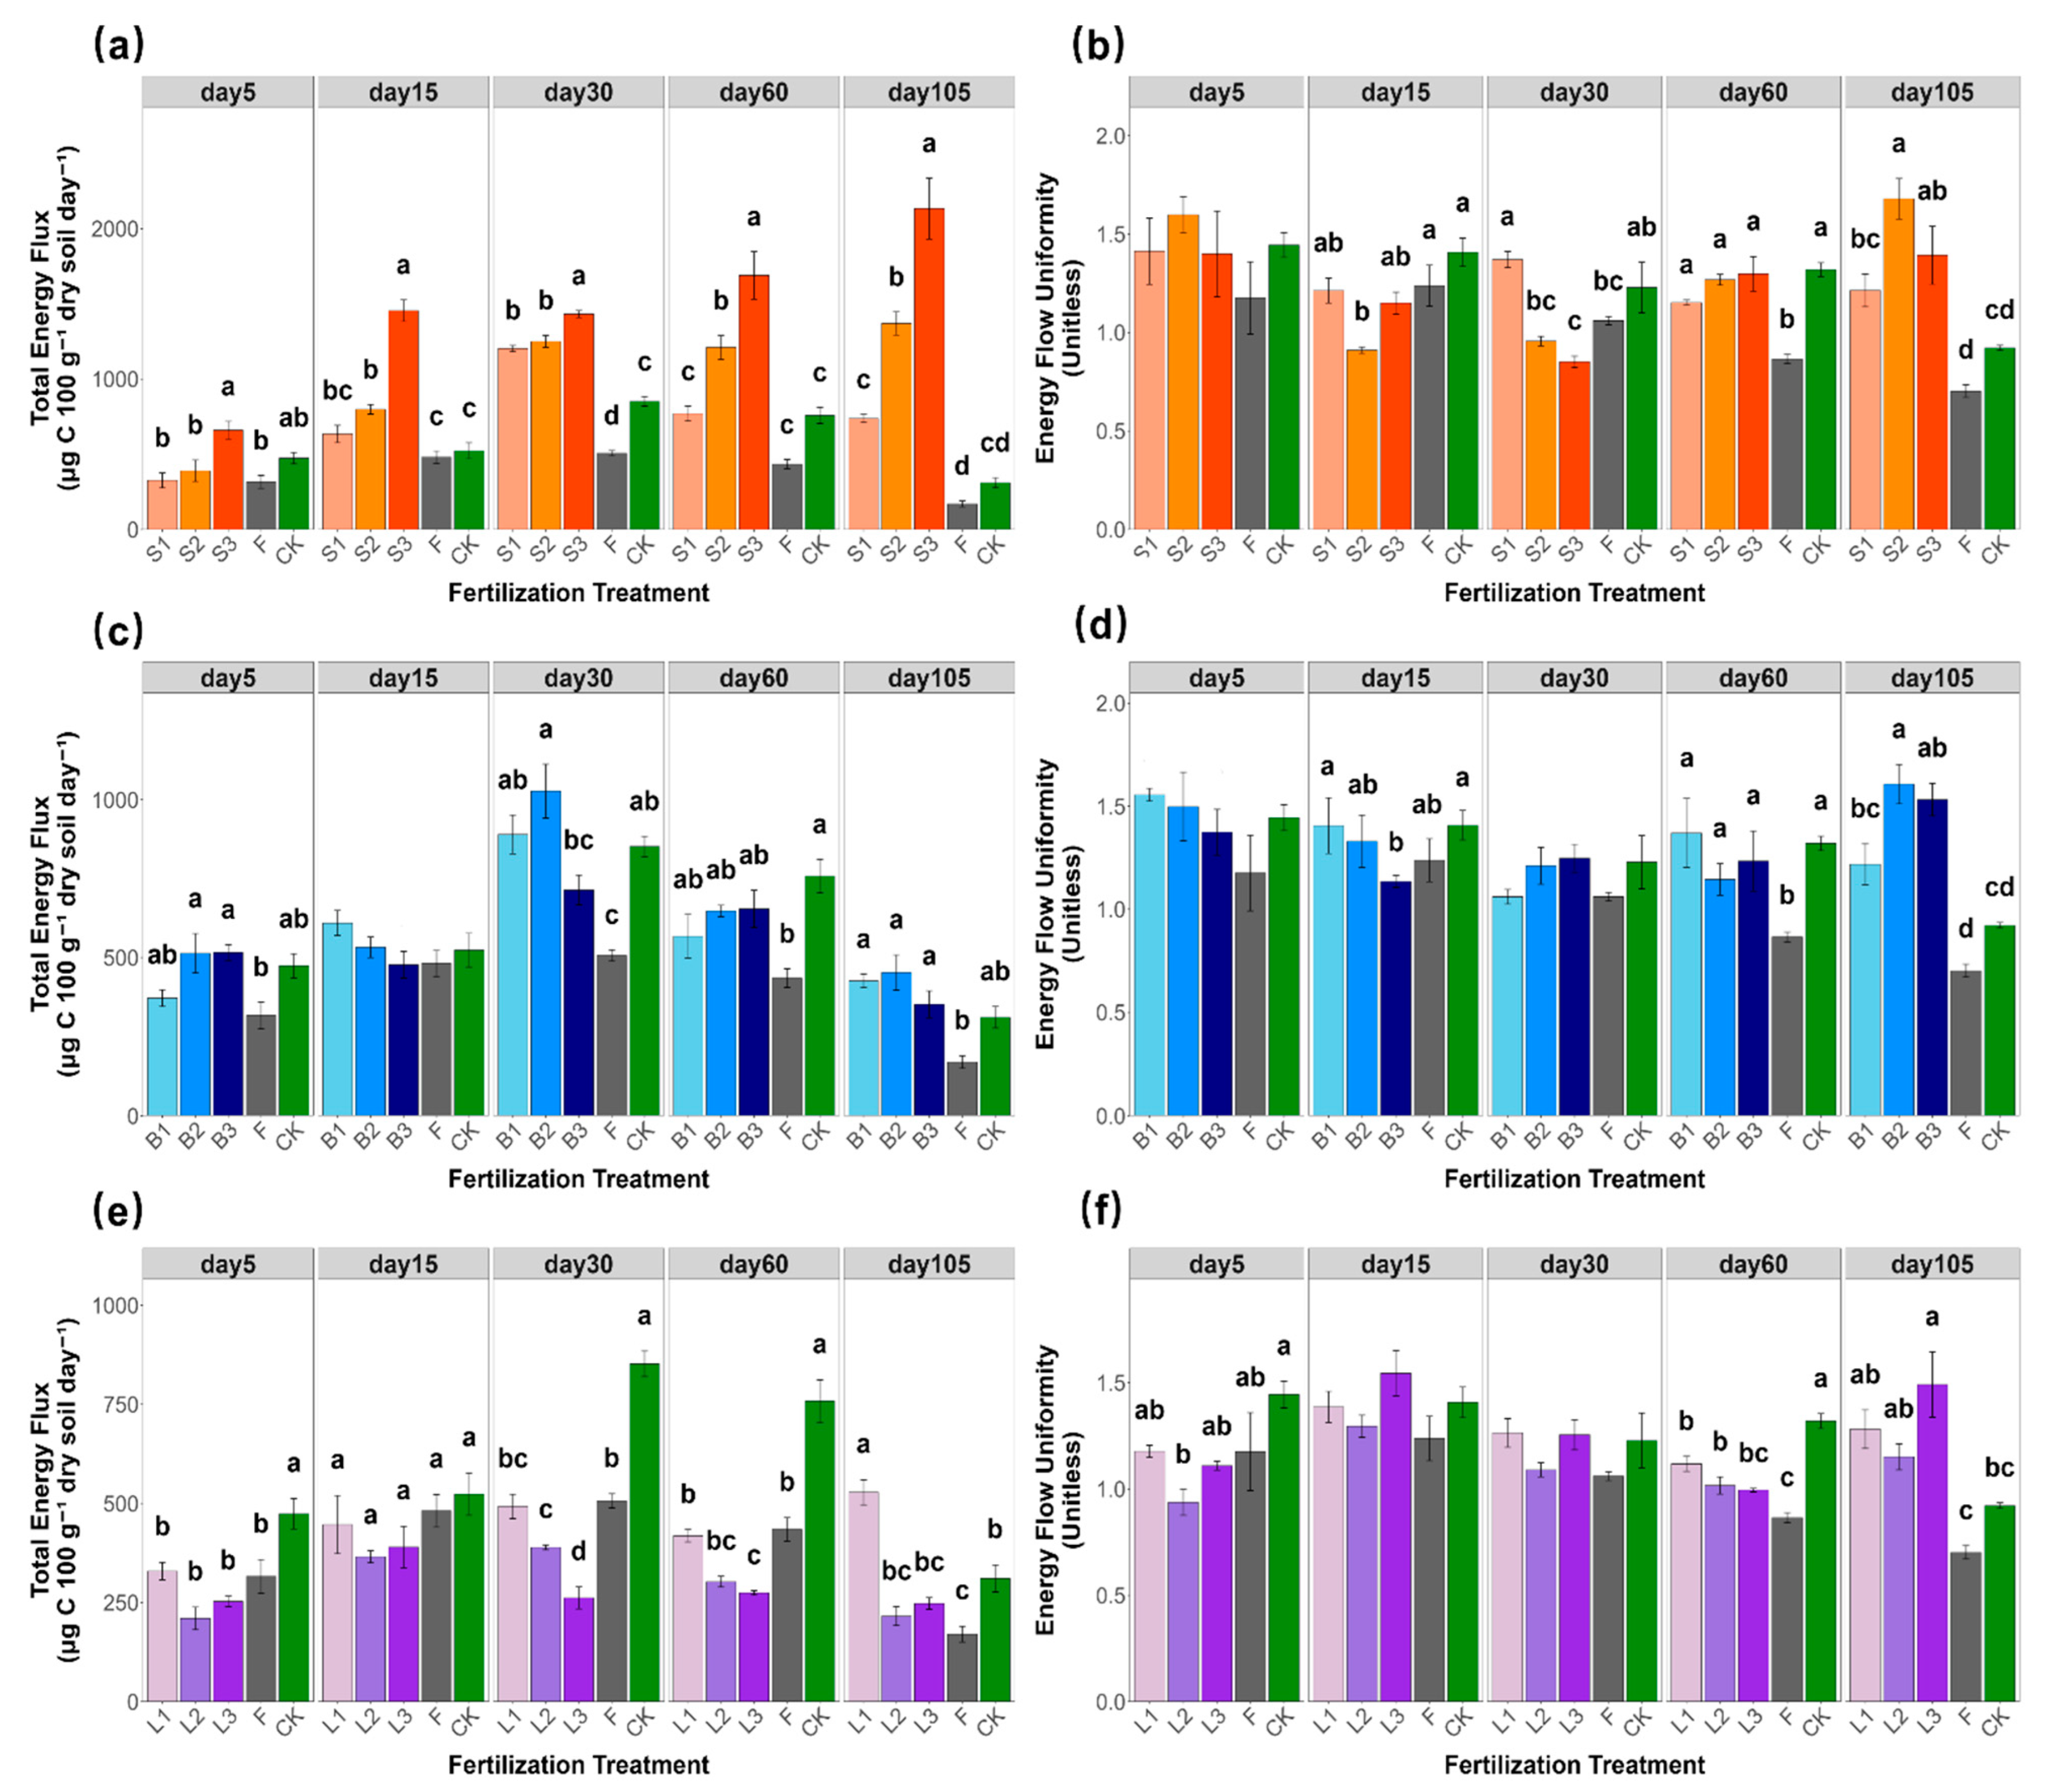
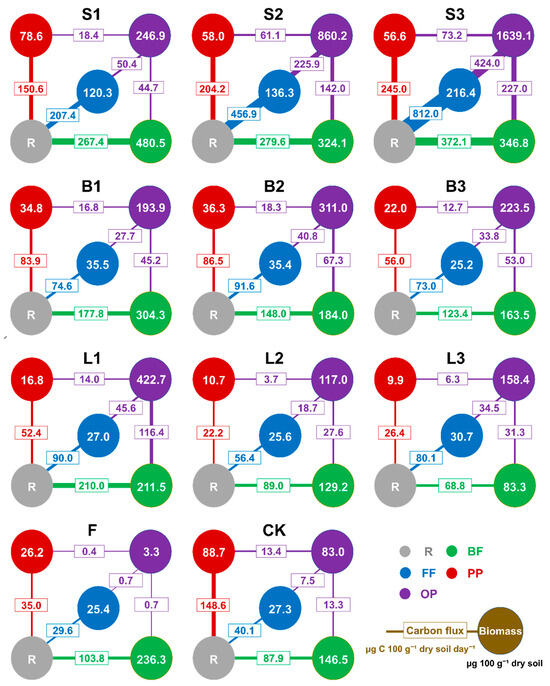
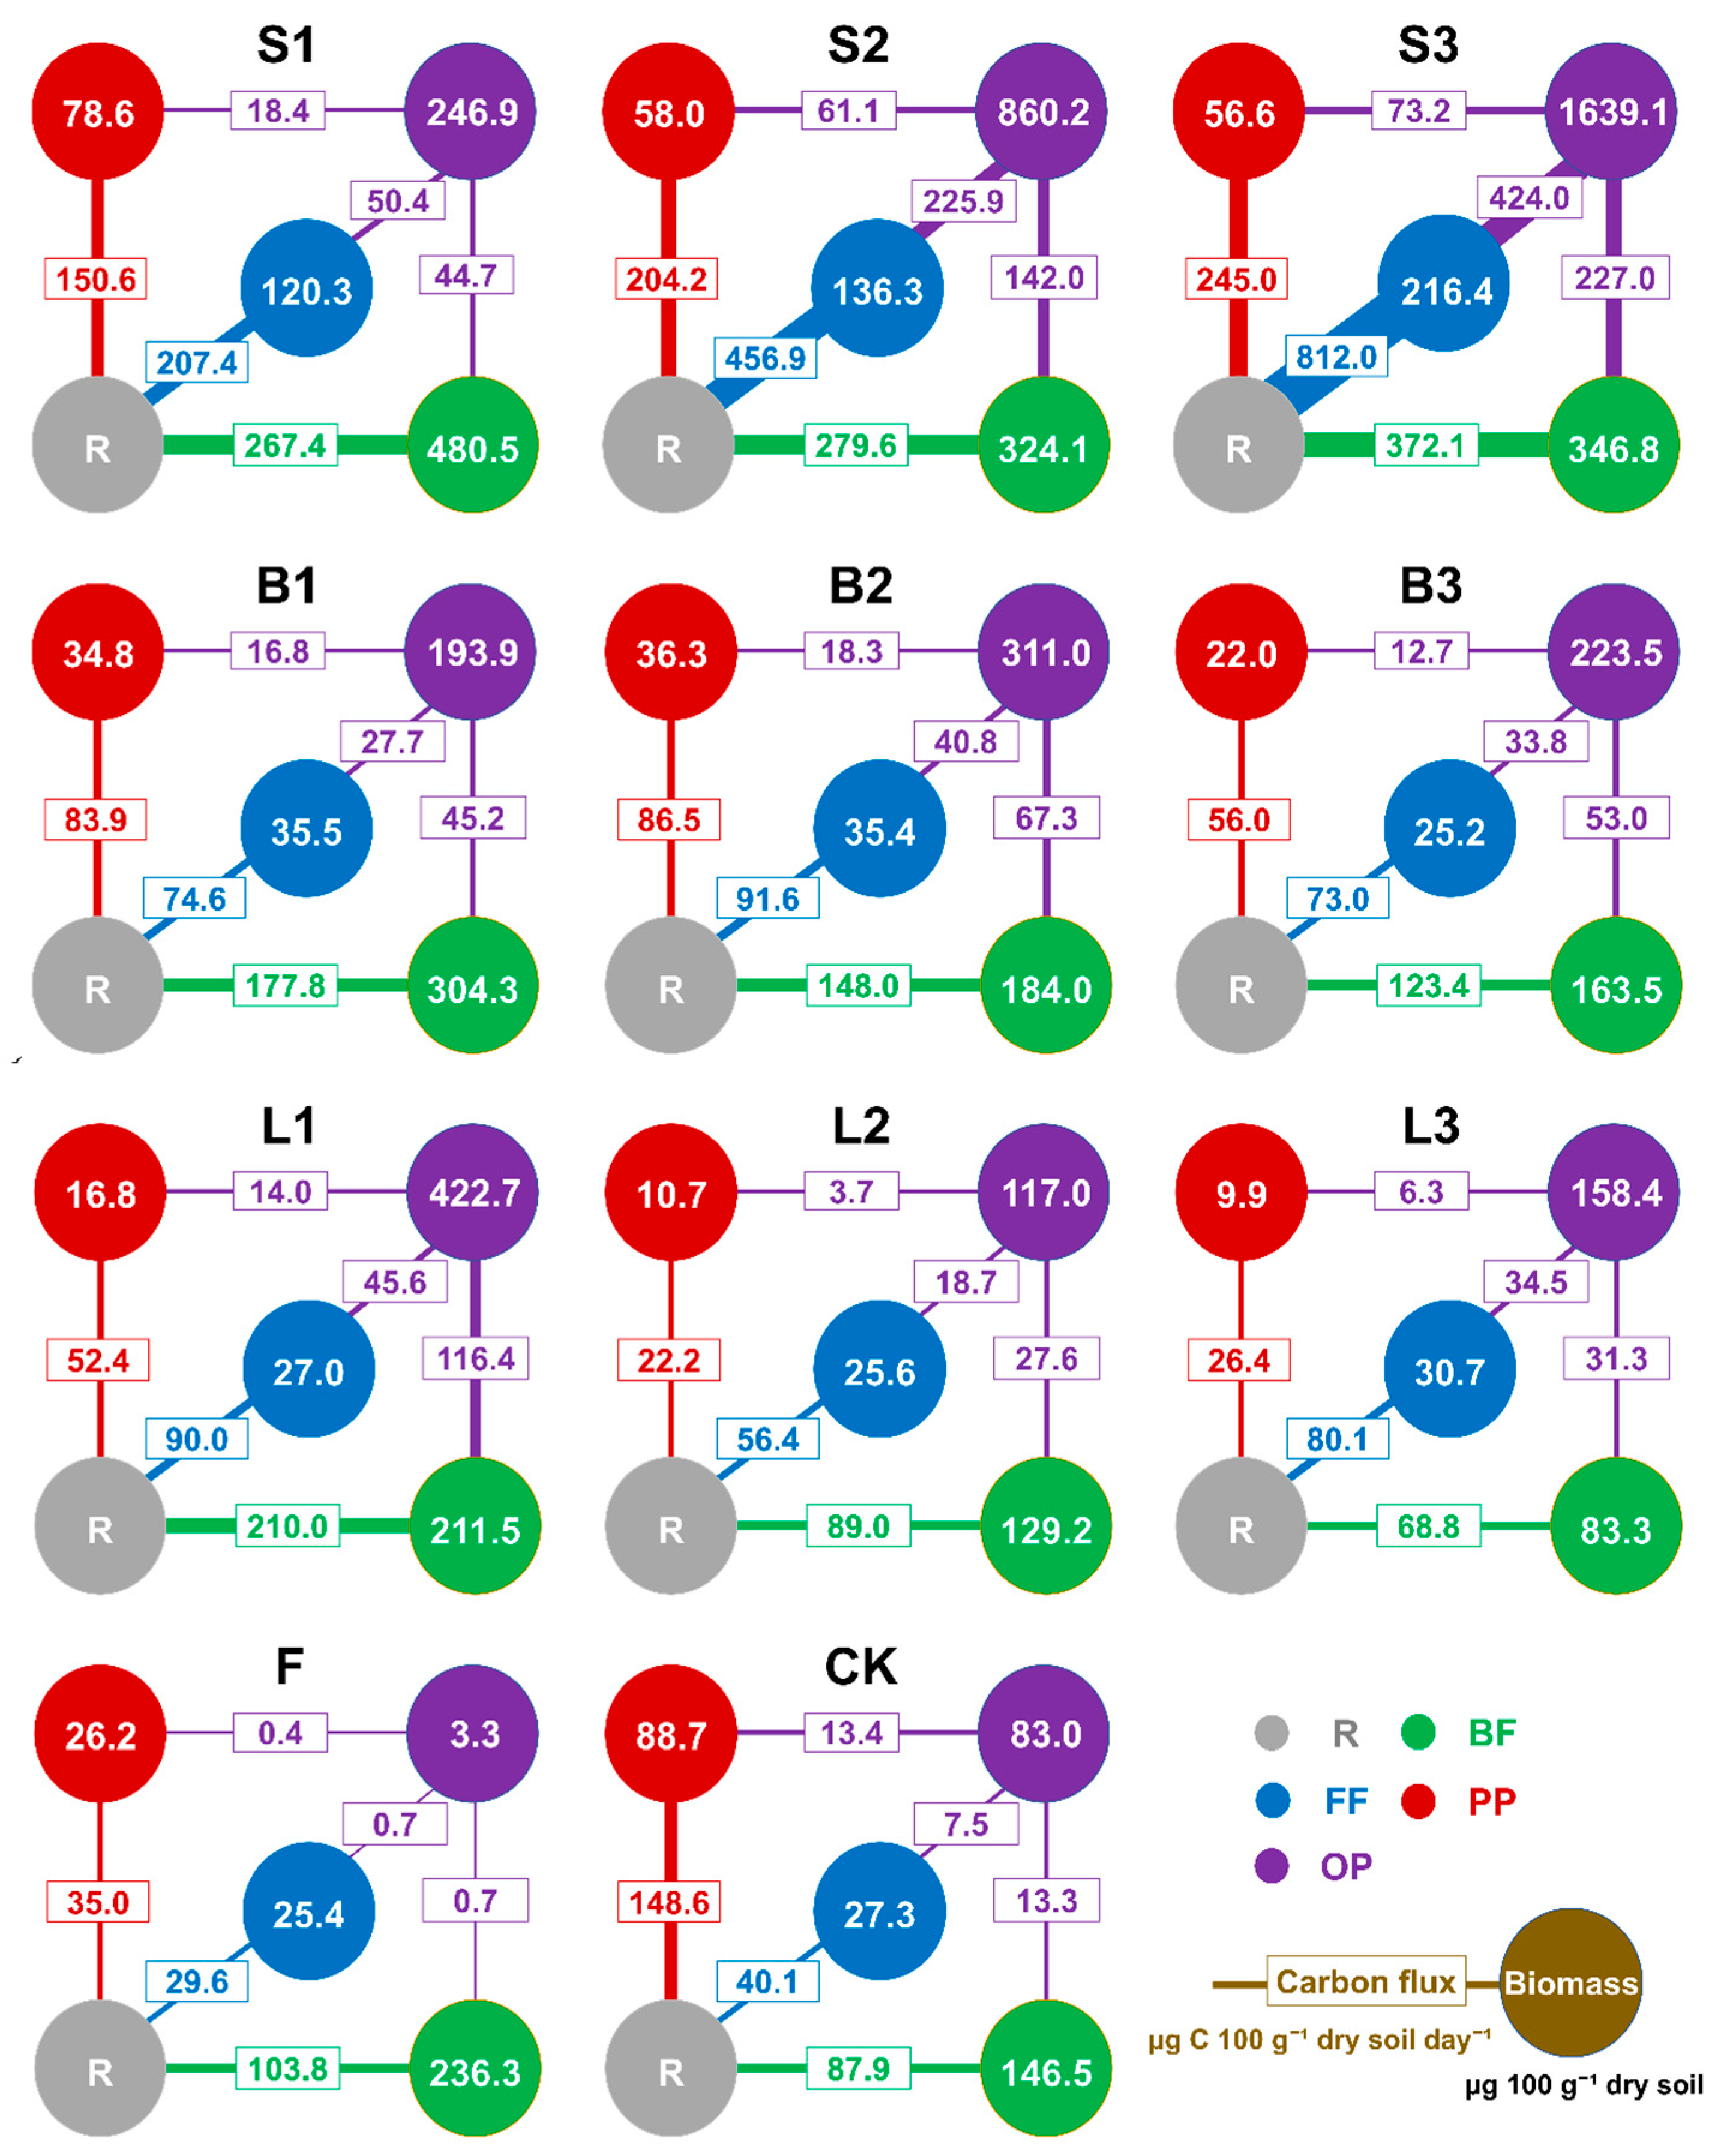
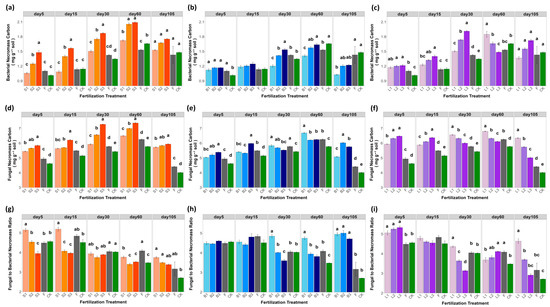
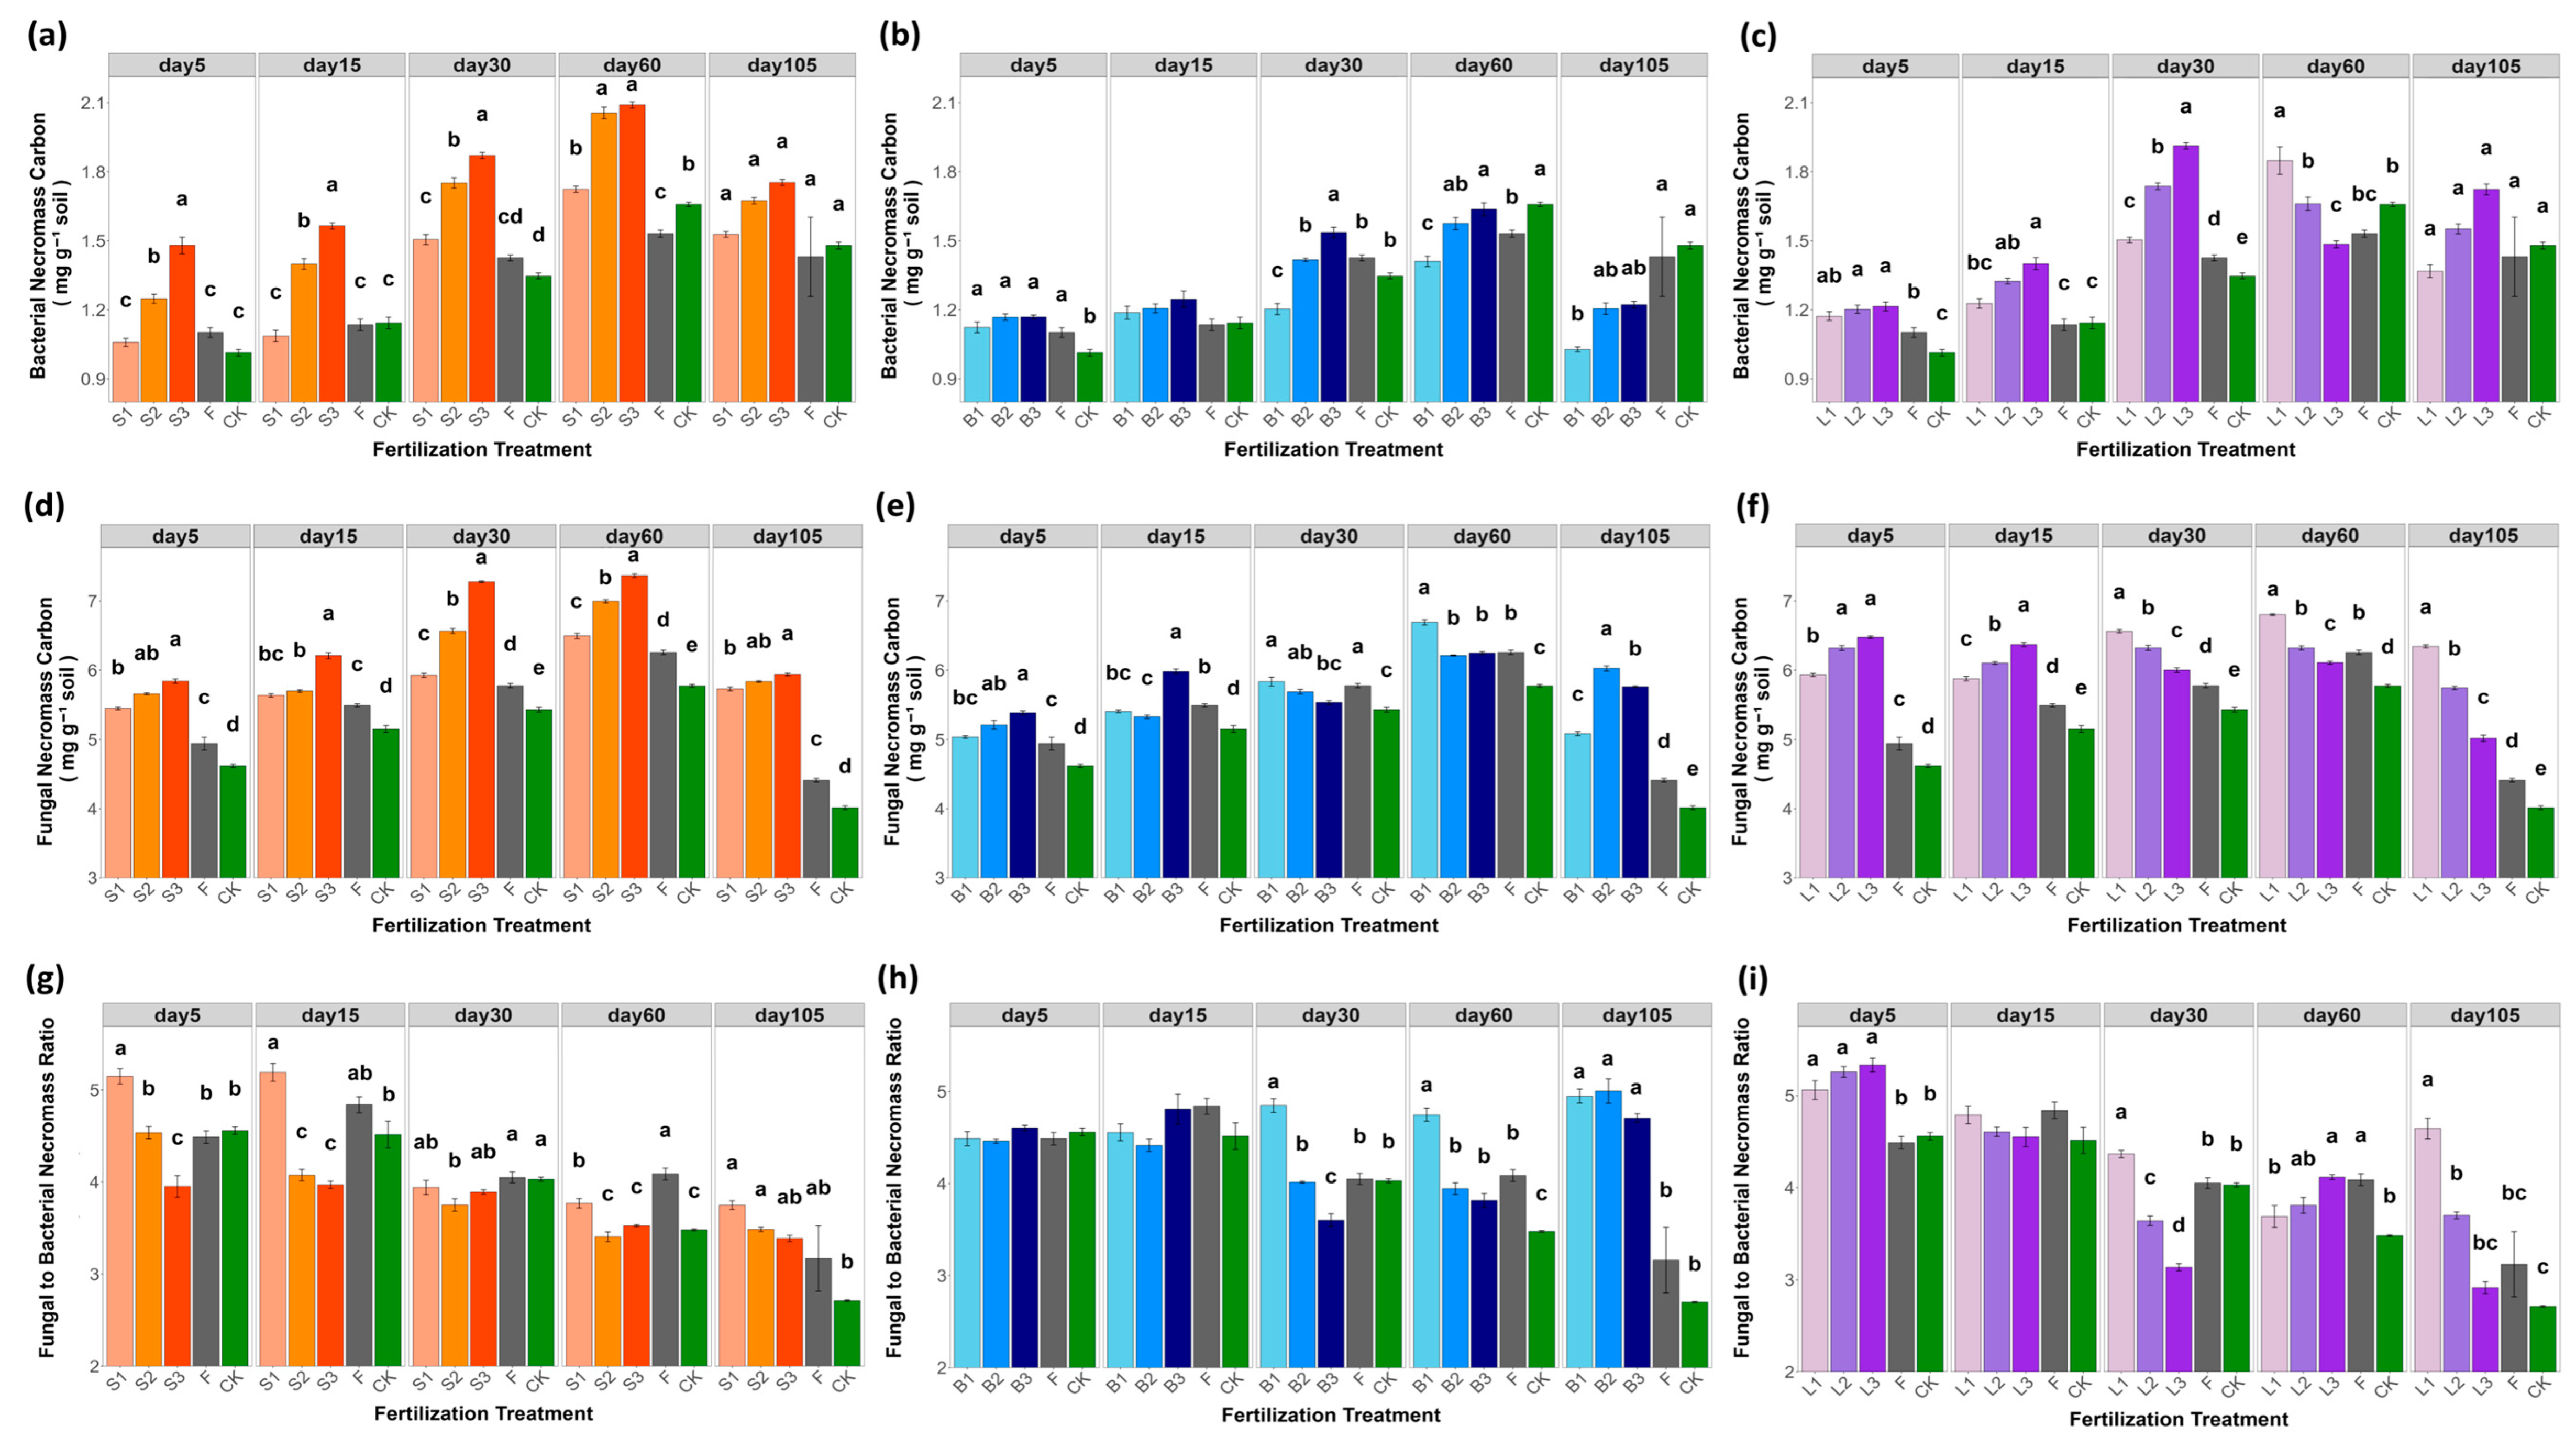
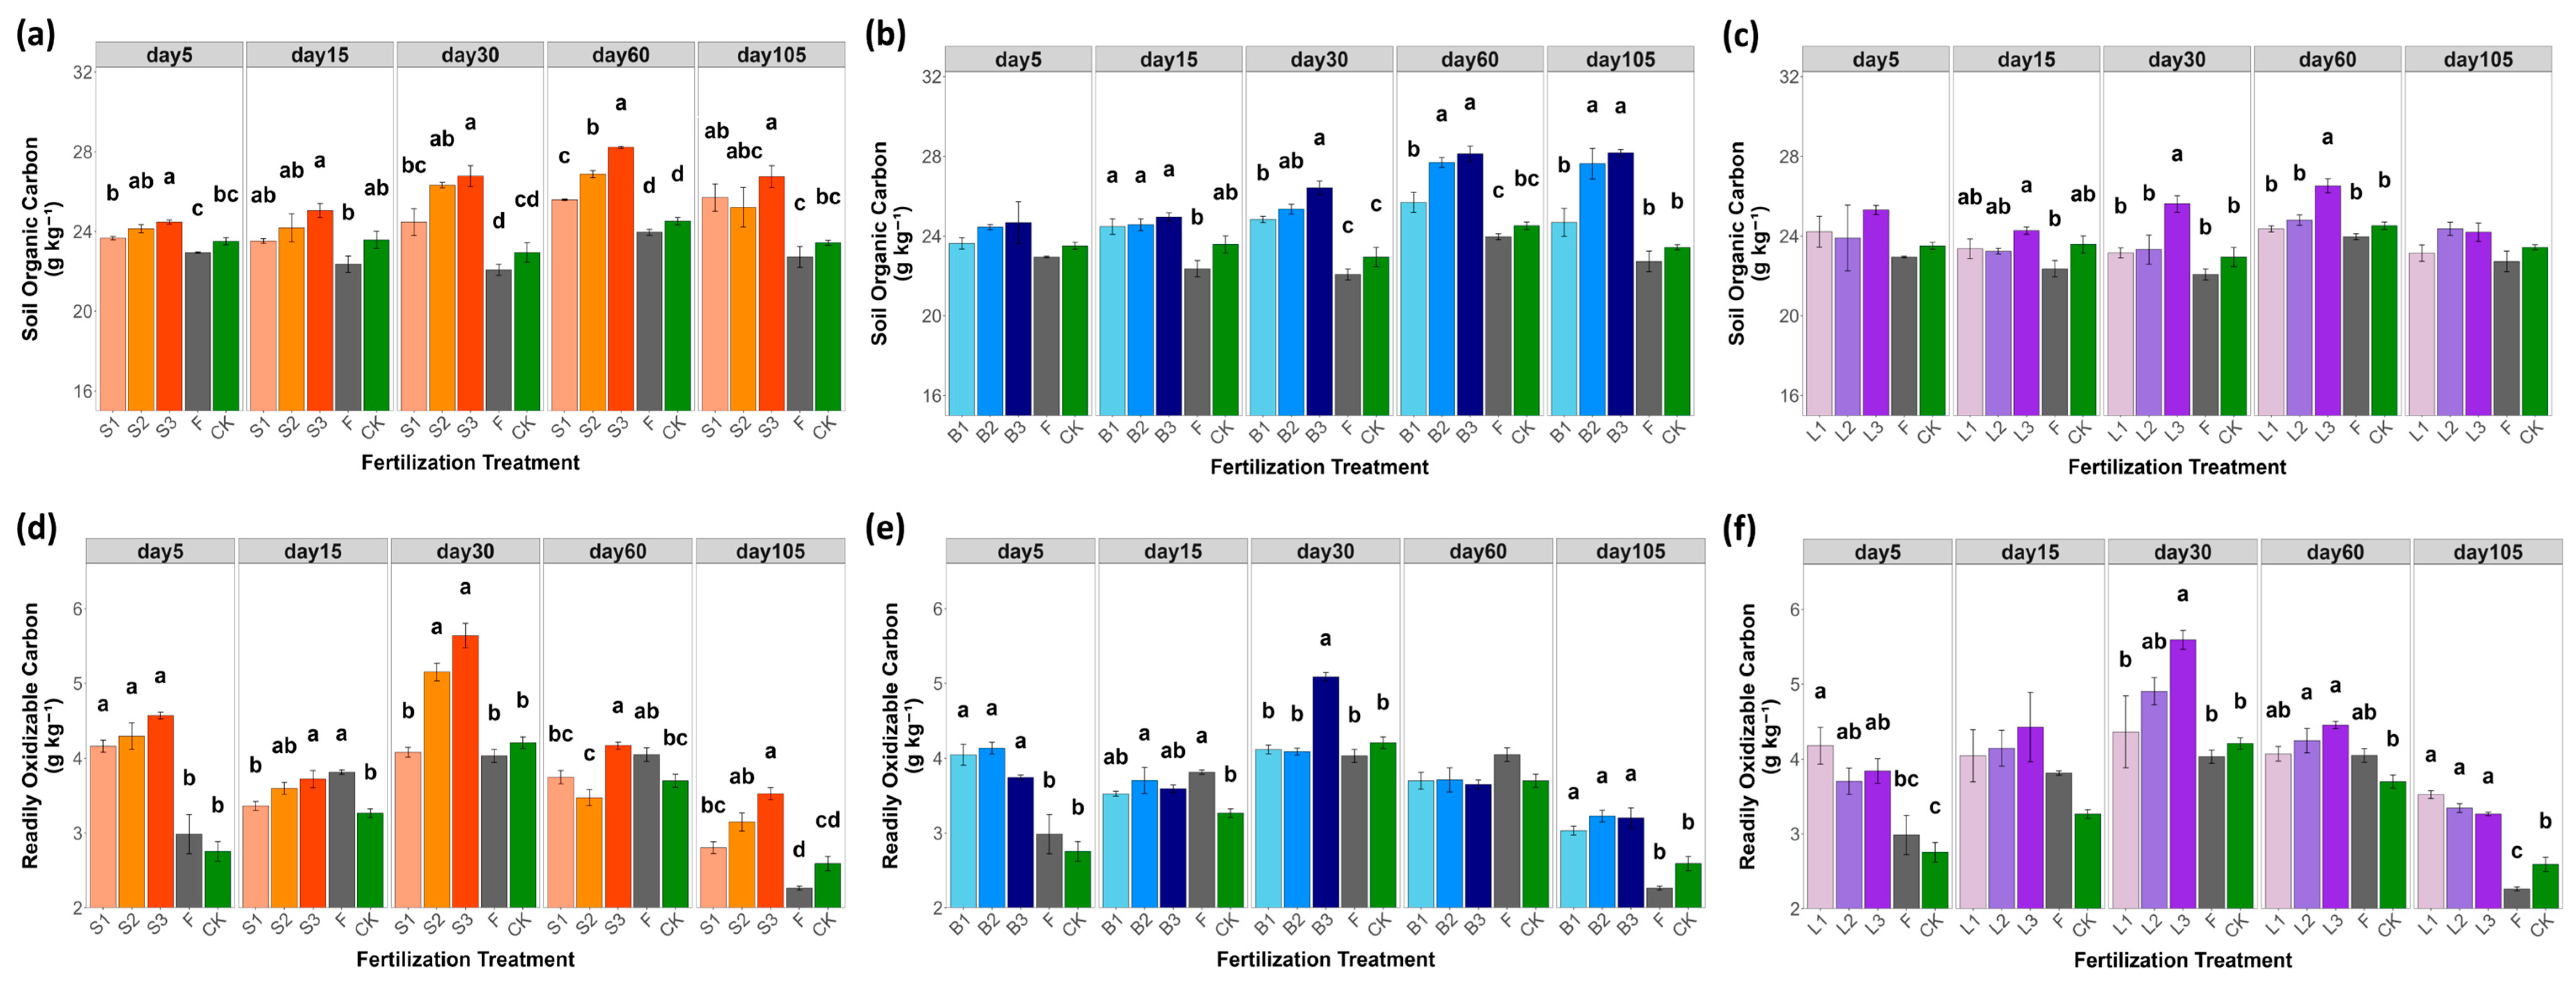
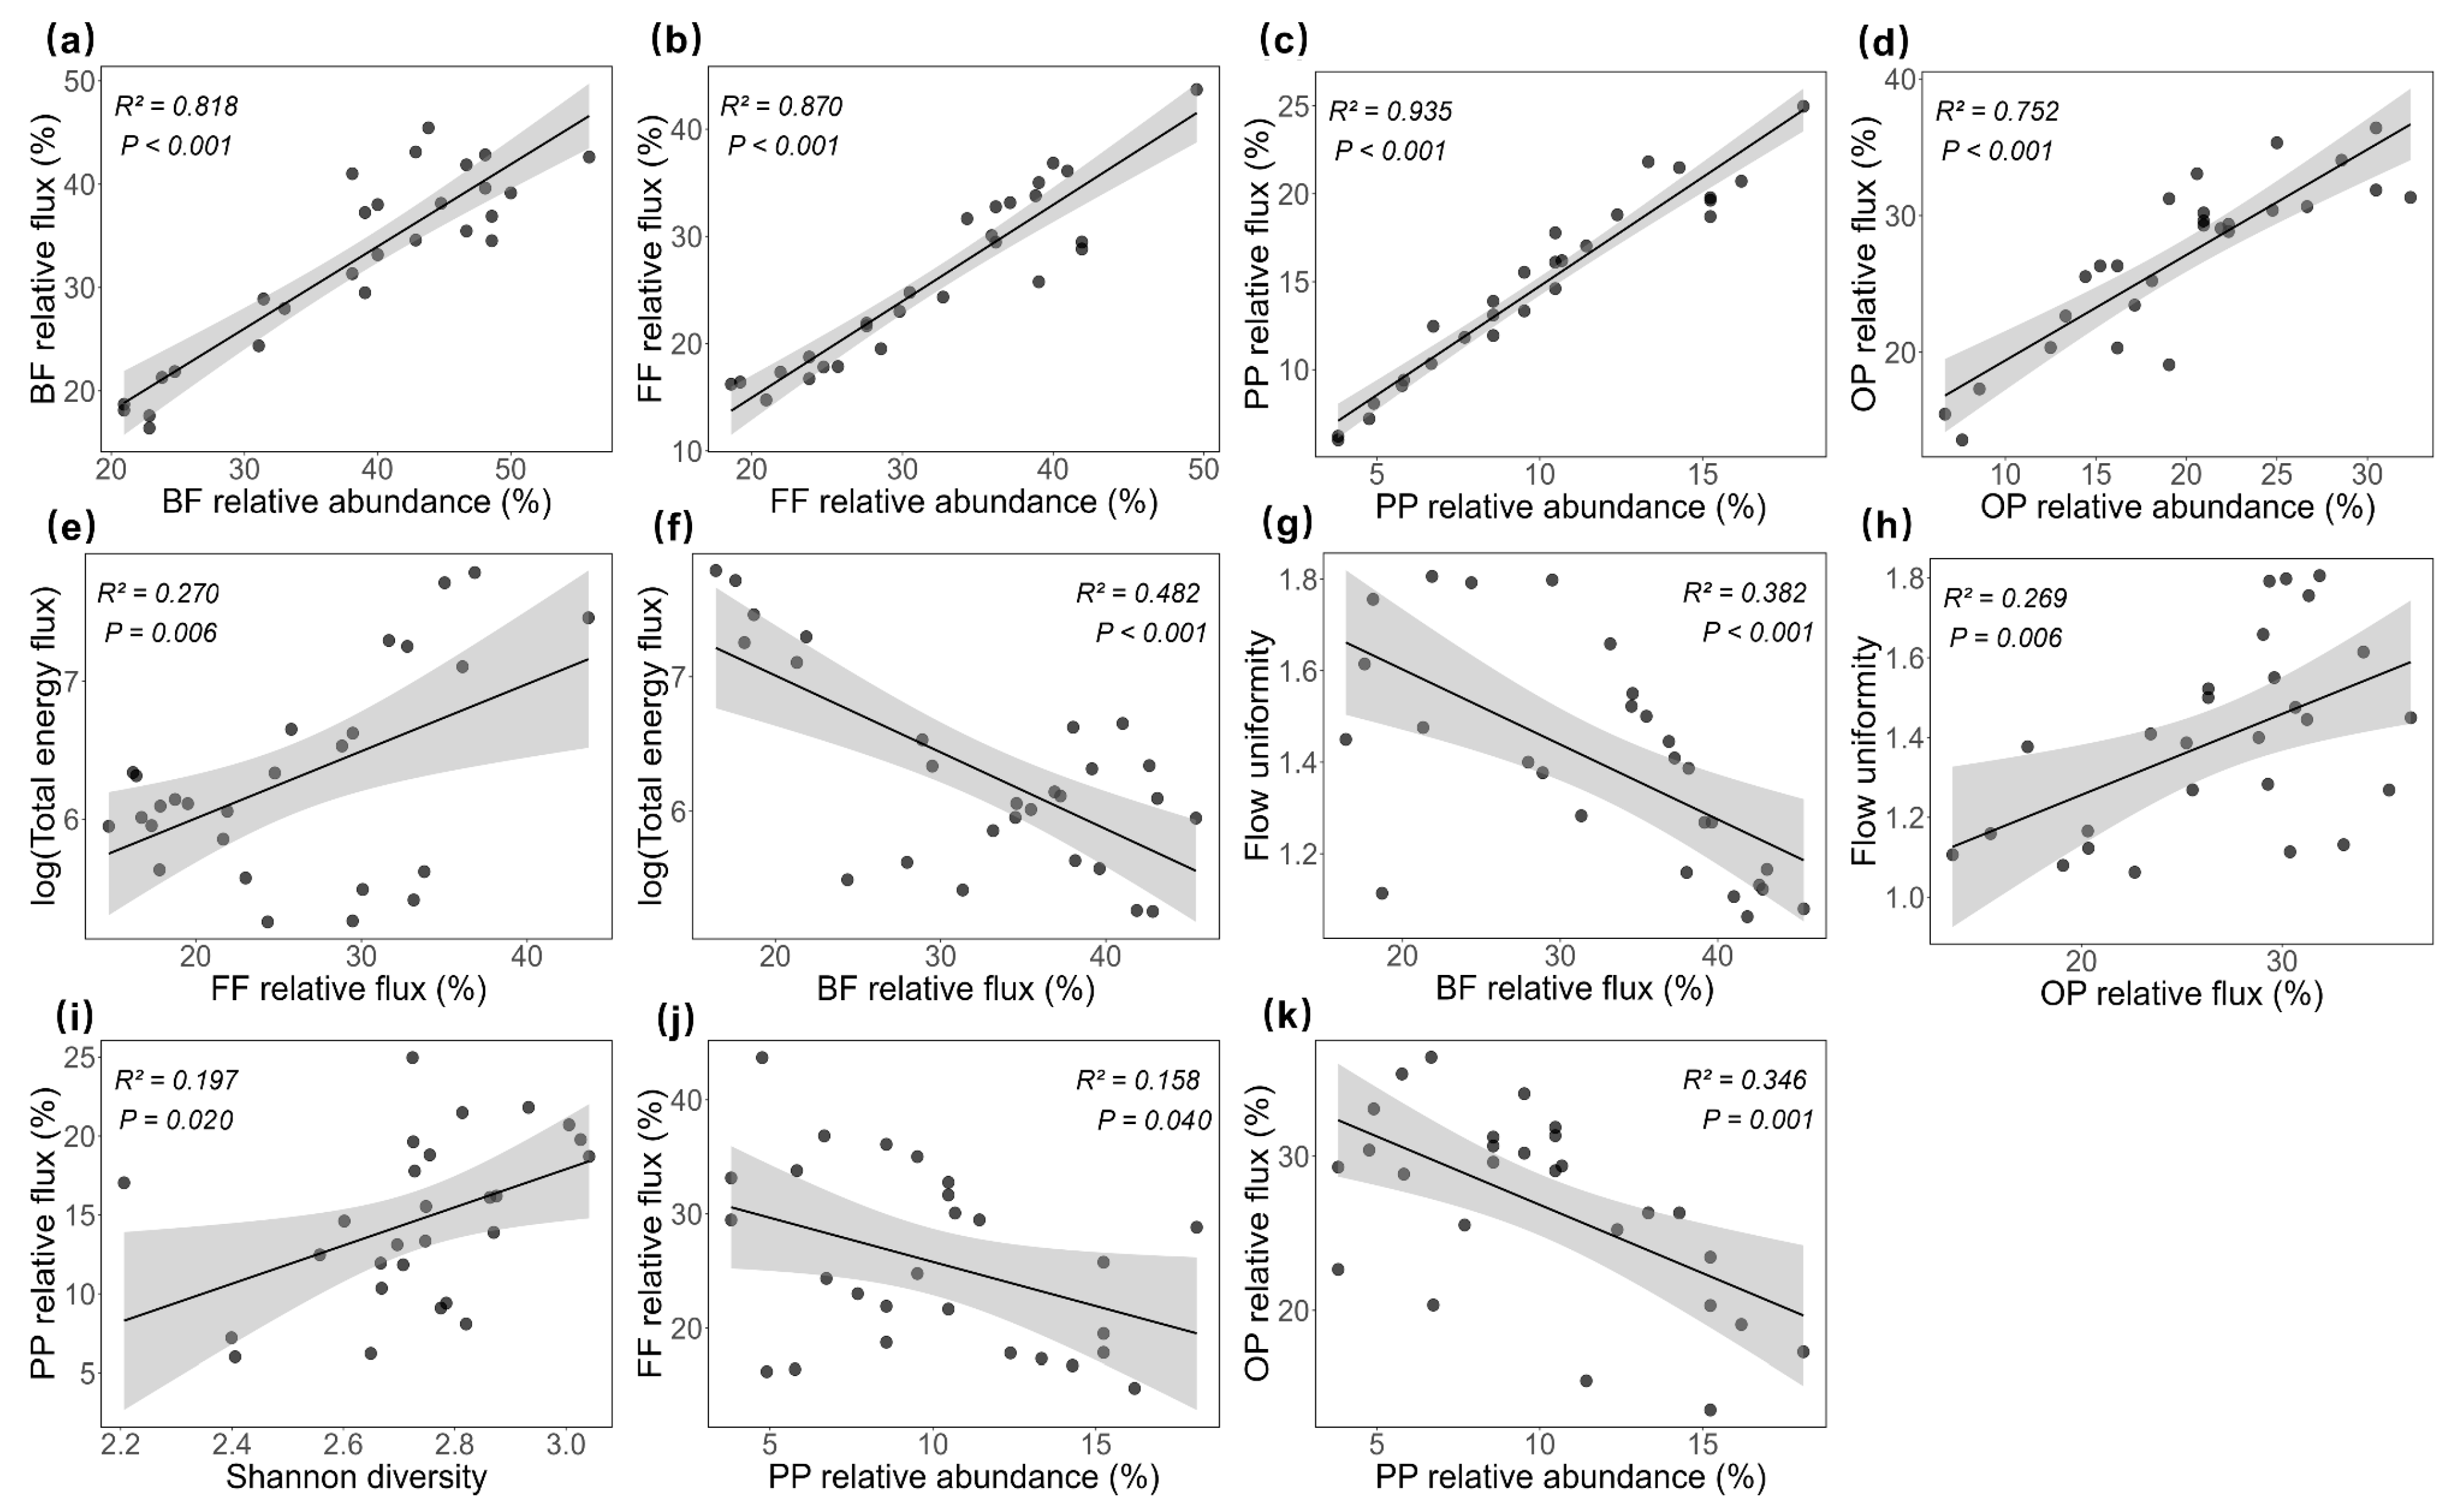
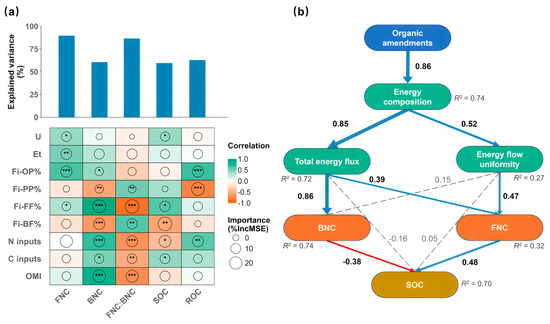
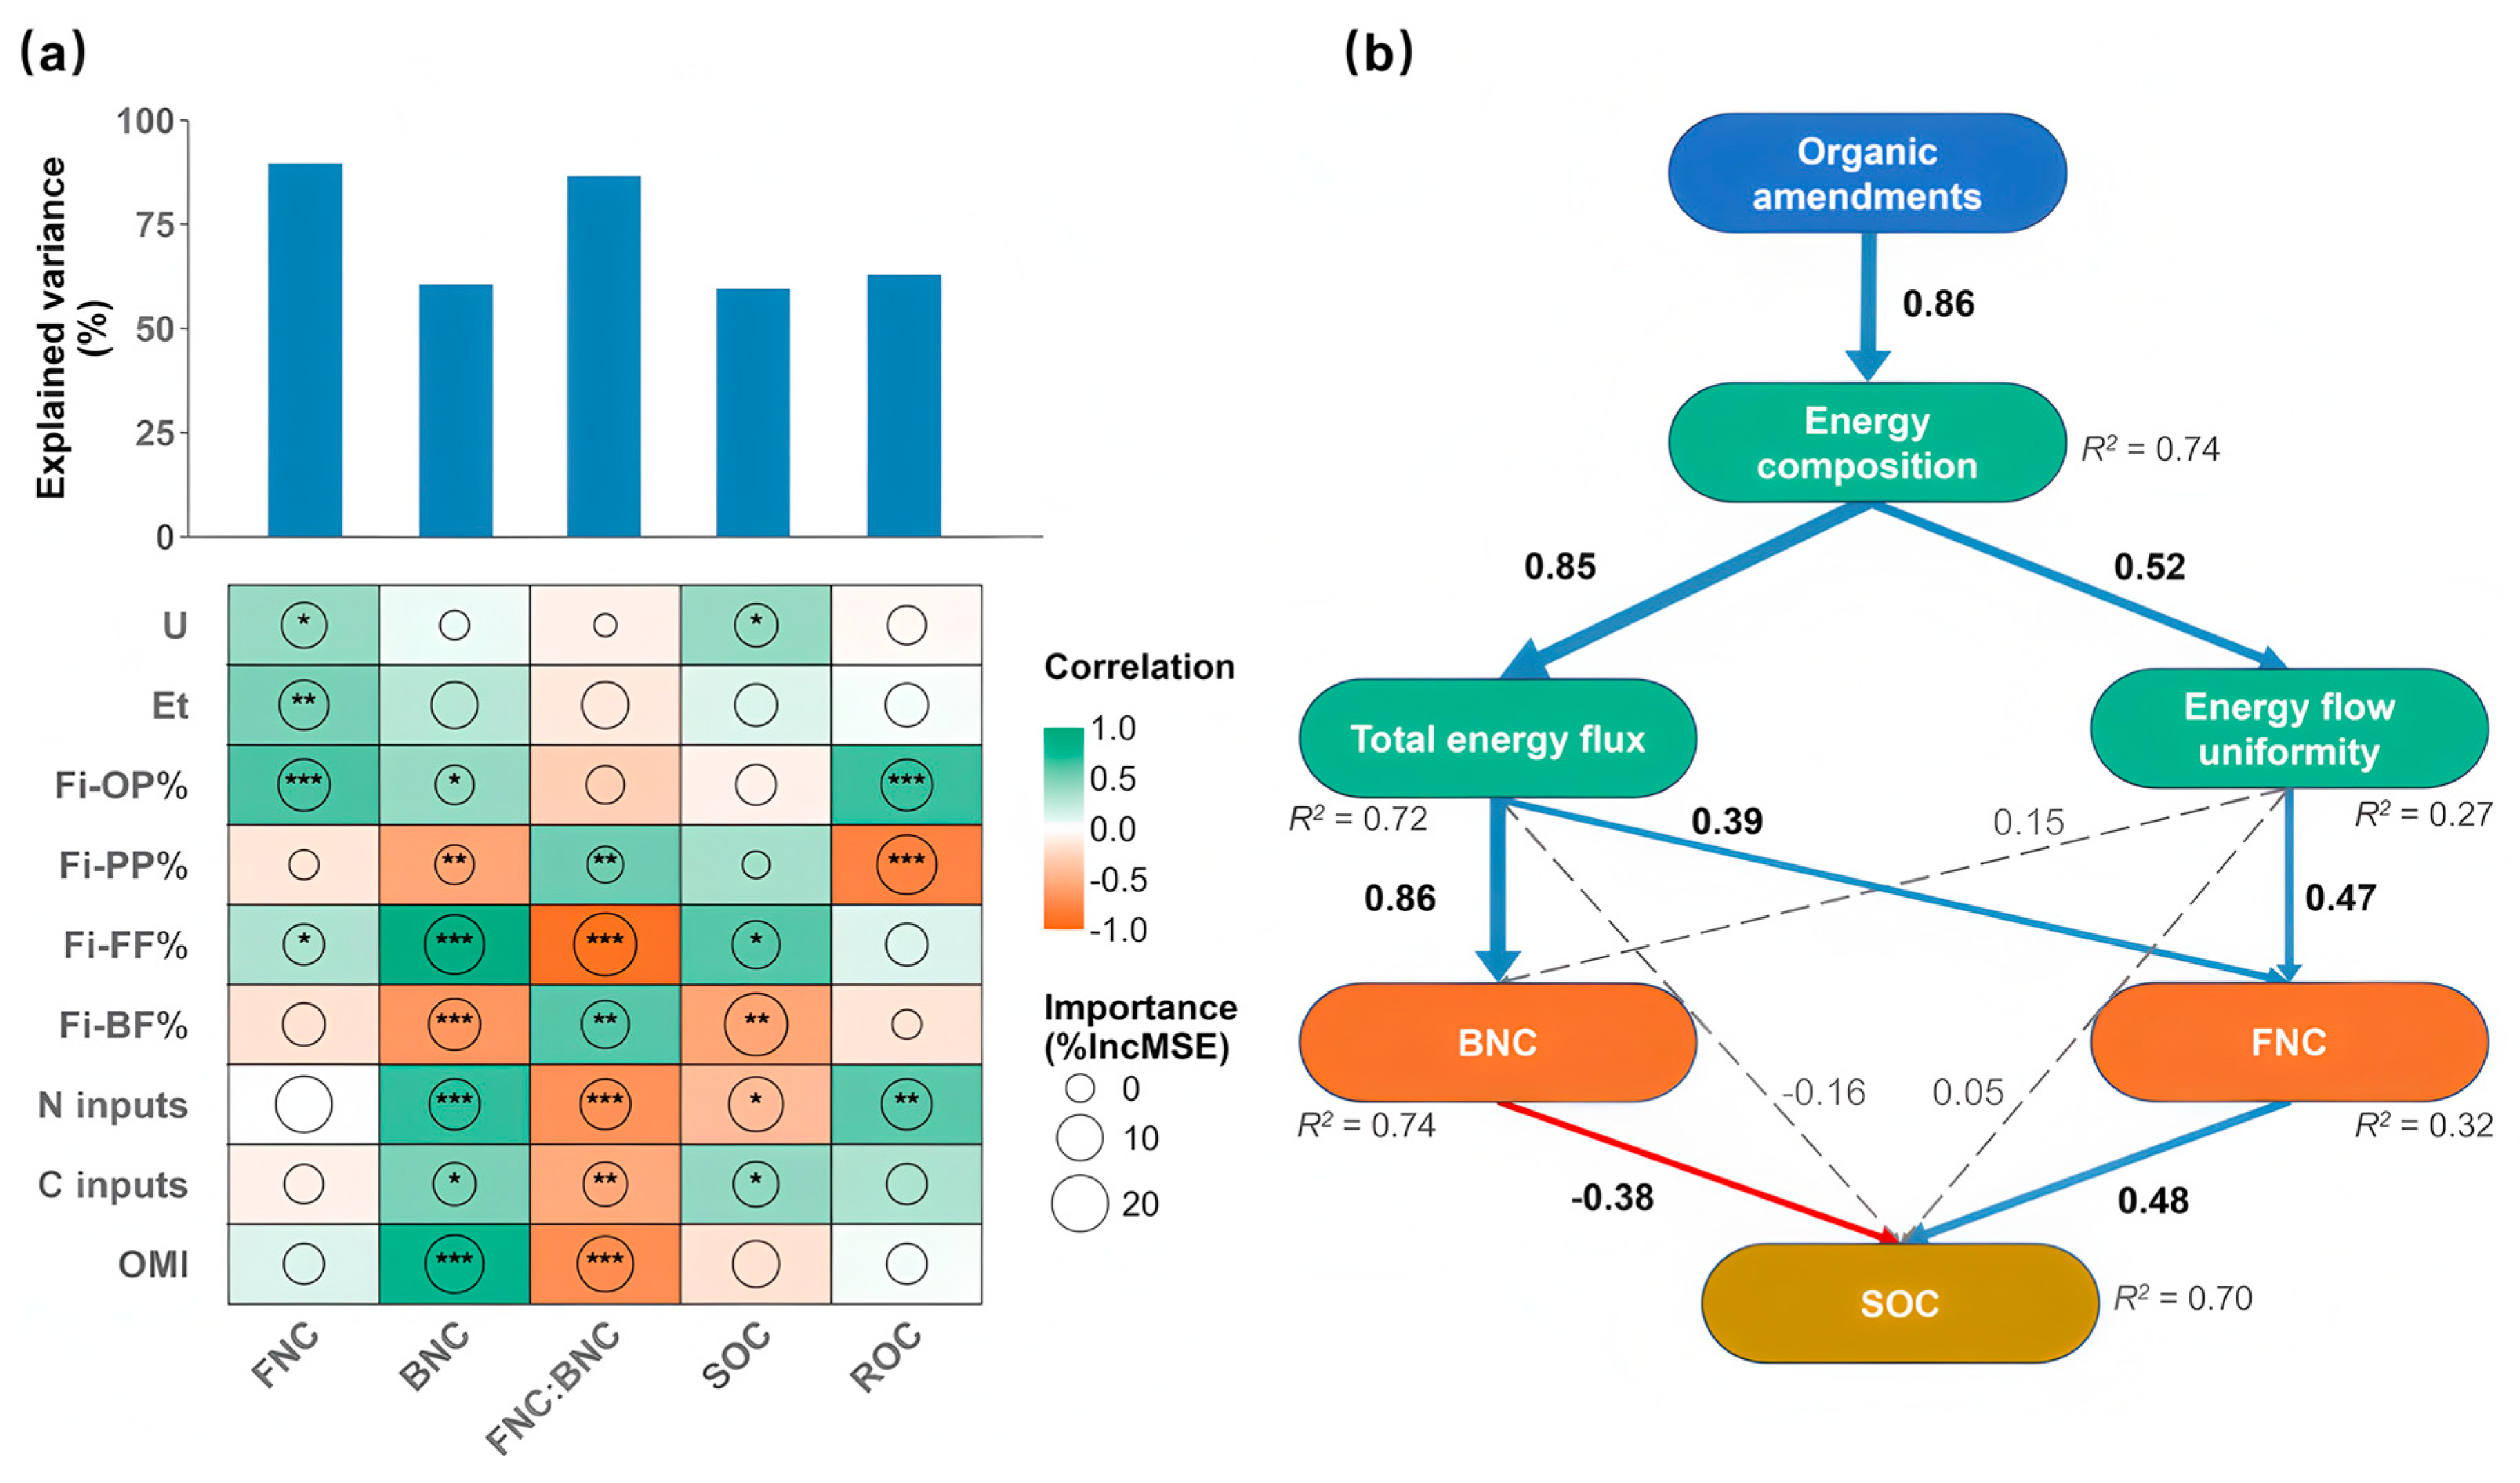

Disclaimer/Publisher’s Note: The statements, opinions and data contained in all publications are solely those of the individual author(s) and contributor(s) and not of MDPI and/or the editor(s). MDPI and/or the editor(s) disclaim responsibility for any injury to people or property resulting from any ideas, methods, instructions or products referred to in the content. |
© 2026 by the authors. Licensee MDPI, Basel, Switzerland. This article is an open access article distributed under the terms and conditions of the Creative Commons Attribution (CC BY) license.