


Abstract
To clarify the effects of nitrogen application rates on production performance, nutritional quality, and nitrogen use efficiency in a silage maize/sweet sorghum intercropping system, this study established a 3:3 intercropping treatment (B), a silage maize monoculture (S), sweet sorghum monoculture (T)—as well as six nitrogen application rates: 0 (N0), 120 (N1), 180 (N2), 240 (N3), 300 (N4), and 360 kg ha−1 (N5). The results showed that both the cropping system and nitrogen application rate significantly influenced crop growth and yield formation. The N4 (300 kg ha−1) treatment yielded the best results, promoting plant height and dry matter accumulation in both crops. Under intercropping conditions, the biomass of silage maize at the milky stage was significantly higher than that under the N0 treatment. Excessive nitrogen application (N5) did not further promote crop growth and, instead, weakened the complementary benefits of intercropping. The 3:3 intercropping combination with the N4 nitrogen application rate yielded higher forage yields and Feed Value; hay yield and crude protein yield increased by 37.86% and 52.04%, respectively, compared to N0, while crude protein content increased by 10.70%, resulting in a comprehensive production advantage over monoculture. At the same time, the N4 treatment offered a higher return on nitrogen fertilizer investment and helped maintain total nitrogen levels in the 0–40 cm soil layer. In summary, a 3:3 intercropping system of silage maize and sweet sorghum, combined with the application of 300 kg ha−1 of nitrogen fertilizer, is the optimal cultivation model under the conditions of this experiment and can serve as a preliminary recommendation for optimizing nitrogen fertilizer management in grass forage intercropping systems in arid irrigation areas.
1. Introduction
Since China implemented its “Grain-to-Forage Conversion” policy, silage forage production has received sustained attention; however, in arid and semi-arid regions, forage production still faces challenges such as limited land resources, increasing pressure on water and fertilizer inputs, and room for improvement in production efficiency [1,2]. Therefore, establishing a forage production system that combines high biomass yield, excellent nutritional quality, and high nutrient use efficiency is a key objective of current forage cultivation research.
Silage maize (Zea mays L.) is widely used in forage production due to its high biomass, rich carbohydrate content, and suitability for silage [3,4,5]. Appropriate nitrogen application promotes the growth and yield formation of silage maize; however, excessive nitrogen application limits yield gains and leads to reduced nitrogen use efficiency, increased residual nitrogen in the soil, and a higher risk of potential nitrogen loss [6,7]. Therefore, forage production needs to shift from a reliance solely on nitrogen fertilizer inputs to the synergistic optimization of crop composition and nitrogen supply.
Intercropping can enhance land productivity and resource use efficiency by leveraging the spatiotemporal differences in resource acquisition and utilization among different crops [8,9]. Existing research has largely focused on grass–legume intercropping systems, suggesting that symbiotic nitrogen fixation, interspecific nutrient complementarity, and niche differentiation in legumes are key factors underpinning yield advantages [10,11]. However, for grass-grass intercropping systems lacking biological nitrogen fixation, there remains a lack of systematic evidence regarding whether their production advantages are consistently present, whether they depend on specific nitrogen supply levels, and whether they can simultaneously improve forage yield, nutritional quality, and nitrogen use efficiency.
Sweet sorghum (Sorghum bicolor (L.) Moench) is a C4 crop with strong drought tolerance and adaptability; its stalks are rich in soluble sugars and have good potential for forage production and use in mixed silage [12]. Although silage maize and sweet sorghum are both C4 grass crops, they differ in growth stages, plant architecture, and biomass allocation. A rational combination of the two may enhance system biomass yield and forage nutrient composition; however, their shared nitrogen requirements may also intensify interspecific competition. Therefore, whether silage maize–sweet sorghum intercropping can yield land-use advantages, and whether such advantages are accompanied by improvements in nutritional quality and nitrogen use efficiency, requires verification through field trials.
Appropriate nitrogen supply may alleviate nitrogen limitation, thereby transforming potential complementary effects into system-level production advantages; however, research on this intercropping system under the arid irrigation conditions of Xinjiang remains insufficient, and there is a lack of comprehensive field evaluations integrating nitrogen supply, interspecific relationships, yield, and quality. Therefore, it is necessary to clarify the relative contributions of silage maize and sweet sorghum to the system’s production advantage under different nitrogen application rates and to identify a nitrogen management range that balances yield, quality, and resource utilization.
Based on this, this study conducted field trials in 2025 under arid irrigation conditions in Xinjiang to compare the growth, yield, forage quality, interspecific interactions, nitrogen use efficiency, and soil nitrogen response of silage maize–sweet sorghum 3:3 strip intercropping, silage maize monoculture, and sweet sorghum monoculture at six nitrogen application rates. The study primarily addresses the following questions: (1) Under different nitrogen application rates, does the silage maize–sweet sorghum strip intercropping system offer advantages in terms of land use and yield? (2) How does nitrogen supply regulate the growth performance, dry matter accumulation, and interspecific relationships of the two crops? (3) Are the yield advantages of the intercropping system accompanied by changes in forage quality, nitrogen use efficiency, and soil nitrogen status? (4) Which nitrogen application rate yields the best overall performance under the experimental conditions?
This study proposes the following hypotheses: (1) There is a significant interaction between cropping patterns and nitrogen application rates; silage maize–sweet sorghum intercropping exhibits significant land-use advantages under appropriate nitrogen supply; (2) Optimal nitrogen application increased the system’s dry matter and crude protein yields, and maize and sorghum contributed differently to the system’s yield gain; (3) As nitrogen application rates increased, the marginal gains in yield and nitrogen accumulation diminished, nitrogen use efficiency declined, and soil nitrogen status at harvest was significantly altered. This study aims to provide field-based evidence for nitrogen fertilizer management in dual-grass forage intercropping systems in Xinjiang and similar arid irrigated regions, and to offer preliminary insights into the intrinsic relationships among nitrogen supply, interspecific interactions, and production-ecological effects in non-nitrogen-fixing grass intercropping systems.
2. Materials and Methods
2.1. Experimental Site
Field trials were conducted from 3 May to 30 September 2025, at the Sanping Comprehensive Practical Training Base of Xinjiang Agricultural University (87°21′01″ E, 43°56′23″ N, elevation 680 m). The trial area has a temperate continental semi-arid climate, characterized by hot, dry summers and cold winters; the long-term average sunshine duration is 2880.4 h, annual precipitation ranges from 230 to 300 mm, and annual evaporation is approximately 2468 mm (Figure 1). During the experiment, the average temperature was 23.09 °C, cumulative precipitation was 110.30 mm, and cumulative sunshine hours totaled 1591.1 h. Prior to sowing, soil samples were collected from the 0–20 cm plow layer of the experimental site using the five-point sampling method; the samples were mixed and air-dried naturally for the determination of basic soil physicochemical properties. The soil texture of the experimental site was gravelly sandy loam. The contents of total nitrogen, alkali-hydrolyzable nitrogen, total phosphorus, available phosphorus, total potassium, and readily available potassium were 0.58 g·kg−1, 34.54 mg·kg−1, 0.68 g·kg−1, 16.01 mg·kg−1, 10.37 g·kg−1, and 268.20 mg·kg−1, respectively; organic matter content was 16.7 g·kg−1, and pH was 8.36. The previous crop was silage maize, and fertilization and field management during the preceding growing season were conducted according to local conventional cultivation practices.
Figure 1.
Changes in the daily mean temperature, max temperature, min temperature, and precipitation in the study area throughout the year.
The silage maize variety tested was “Jingang Silage 50” (Approval No.: Guoshen Yu 2007028), provided by Xinjiang Qicai Agriculture Co., Ltd.(Xinjiang, China); the sweet sorghum variety tested was “Hunnigreen,” provided by Bailv (Tianjin, China) International Grass Industry Co., Ltd.
The nitrogen fertilizer used in the trial was urea (N ≥ 46%); the phosphorus fertilizer was potassium dihydrogen phosphate (P2O5 ≥ 52%, K2O ≥ 34%); and the supplemental potassium fertilizer was potassium sulfate (K2O ≥ 52%). The nitrogen application rates for each treatment were calculated based on pure nitrogen; specific application rates are shown in Table 1. The total phosphorus and potassium fertilizer application rates over the entire growing season were 60 kg P2O5 ha−1 and 120 kg K2O ha−1, respectively. The potassium supplied by potassium dihydrogen phosphate was included in the total potassium input, and any shortfall was supplemented with potassium sulfate to ensure that, apart from nitrogen fertilizer application rates, the phosphorus and potassium inputs were identical across all treatments.
Table 1.
Experiment with different treatments and fertilizer rates.
2.2. Experimental Design
This experiment employed a two-factor split-plot design, with planting pattern as the main factor and nitrogen application rate as the subplot factor, comprising a total of 3 blocks, i.e., 3 replications. The main factor included 3 planting patterns: 3:3 strip intercropping of silage maize and sweet sorghum (B), silage maize monoculture (S), and sweet sorghum monoculture (T). The secondary factor comprised six nitrogen application rates, all calculated as pure nitrogen: 0 (N0), 120 (N1), 180 (N2), 240 (N3), 300 (N4), and 360 kg N ha−1 (N5). Within each block, the three cropping systems were randomly assigned to the main plots, and the six nitrogen application subplots were then randomly arranged within each main plot. The experiment comprised 18 treatment combinations, totaling 54 subplots. Each subplot measured 48 m2 (10.0 m × 4.8 m), with 1.0 m-wide buffer zones established between subplots and between plot groups to reduce edge effects and prevent lateral migration of water and nutrients.
The experiment began with uniform planting on 13 May 2025. Both silage maize and sweet sorghum were planted manually using the hole-planting method, with a row spacing of 40 cm and a hole spacing of 25 cm. After emergence, thinning was conducted at the three-leaf stage to leave one plant per hole; the theoretical total density for each planting pattern was 100,000 plants ha−1. The intercropping treatments employed an equal-density alternating configuration, with silage maize and sweet sorghum each planted in three consecutive rows to form a single-crop strip. Each crop strip was 1.2 m wide, and the two crop strips were arranged alternately, maintaining a row spacing of 40 cm between adjacent rows of different crops. Under this configuration, silage maize and sweet sorghum each occupy 50% of the land area in the intercropping system; calculated based on the total area of the intercropping system, the theoretical density for both crops is 50,000 plants ha−1. The plant and row spacing for the monoculture treatments were consistent with those of the intercropping treatments, and the total planting density of the system was maintained at 100,000 plants ha−1. All treatments were harvested simultaneously on 7 September 2025. Figure 2 shows the field layout of the plots and the sampling areas.
Figure 2.
Planting pattern diagram.
This experiment employed a combined “base fertilizer + topdressing” fertilization method. All phosphorus and potassium fertilizers, as well as 40% of the prescribed nitrogen fertilizer, were applied as base fertilizer by broadcasting them evenly before sowing and incorporating them into the 0–20 cm soil layer using rotary tilling. The remaining 60% of the nitrogen fertilizer was applied as topdressing in equal proportions during the jointing stage (V6) and the large-flared stage (V12) of silage maize, with each application accounting for 30% of the total nitrogen application; topdressing in the sweet sorghum monoculture plots was completed simultaneously on the same day. Topdressing was carried out via drip irrigation, using an integrated water-fertilizer application method. After the fertilizer was fully dissolved, it was applied with water to the corresponding subplots through a drip irrigation system equipped with independent valves. In the intercropping treatments, drip tapes were laid between crop rows to ensure a relatively uniform supply of water and fertilizer between the different crop strips. The entire experiment utilized a membrane-free surface drip irrigation system. A total of 10 irrigations were applied throughout the growing season, with a total irrigation volume of 360 mm. See Table 2 for specific irrigation times and volumes. With the exception of nitrogen application rates, uniform management protocols were maintained across all treatments regarding irrigation schedules, P and K fertilizer inputs, weed suppression, and integrated pest management (IPM). These measures were conducted following local best practices for maximizing forage yield.
Table 2.
Irrigation Schedule and Water Application Rates.
2.3. Measurement Indices and Methods
2.3.1. Measurement of Production Performance Indicators
Plant height: In each plot, randomly select 10 silage maize plants and 10 sweet sorghum plants, measure the vertical height from the ground to the highest point of each plant, and calculate the average.
Dry matter accumulation: During the tasseling, grain-filling, and milky stages of silage maize, 5 silage maize plants and 5 sweet sorghum plants were randomly selected from each plot. After weighing the whole plants in the field, the plants were chopped and mixed thoroughly; representative subsamples were taken back to the laboratory and placed in kraft paper bags. The samples were first blanched at 105 °C for 30 min, then dried in an oven at 75 °C until constant weight was reached. Dry weight was determined using an electronic balance, and the dry matter accumulation per plant was calculated.
Fresh forage yield: Harvesting was conducted uniformly during the milky stage of silage maize (at which time sweet sorghum was in the jointing stage). In each plot, the six middle rows (i.e., one complete intercropping strip) were selected for yield measurement, excluding the outer rows. The fresh weight of the silage maize ears and stalks (including stems and leaves) was measured separately; the sum of these two values constituted the fresh weight of the entire maize plant. At the same time, the fresh weight of the entire sweet sorghum plant was measured. Based on the area measured, the fresh forage yield was converted to kg ha−1 per unit area.
Dry Matter (DM): Content: After determining the fresh grass yield, randomly collect 5 plants from each row in the yield measurement area, mix them thoroughly, and grind them mechanically. Accurately weigh 500 g of the fresh sample, place it in a forced-air oven at 105 °C to inactivate enzymes for 30 min, then adjust the temperature to 80 °C and dry until constant weight is reached to calculate the dry matter content.
Crude protein yield (CPY) is calculated using Equation (1):
In the equation, CP represents the crude protein content of forage (%); DMY represents dry matter yield (kg ha−1), calculated as the product of fresh forage yield and dry matter content.
2.3.2. Determination of Nutritional Quality Parameters
The dried samples, after determining dry matter yield, were ground using a miniature plant grinder (Model FW100) and sieved through a 40-mesh sieve, then set aside. Determine the quality indicators for each crop sample, including crude protein (CP, Kjeldahl method), neutral detergent fiber (NDF, Van Soest method), acid detergent fiber (ADF, Van Soest method), and starch content (ST, anthrone-sulfuric acid colorimetric method). The nutritional quality of the intercropping treatment’s mixed system was calculated by weighting the dry matter yields of silage maize and sweet sorghum according to their respective proportions.
Relative feeding value (RFV) is calculated using Equations (2) and (3):
In this context, DMI refers to dry matter intake (%), which is calculated using the following formula:
DMI = 120/NDF
DDM stands for digestible dry matter (%), and the formula for calculating it is:
2.3.3. Inter-Species Competition Between Silage Maize and Sweet Sorghum and Their Land Equivalence Ratios
Relative Interaction Index (RII): Calculated to analyze the intensity of competition and promotion between crops in different intercropping systems [13]. An RII value less than 0 indicates competition, while an RII value greater than 0 indicates promotion. The calculation formula is as follows:
In the equation, Ys and Yt represent the forage yields of silage maize and sweet sorghum, respectively, when grown as monocrops; Ysi and Yti represent the yields of silage maize and sweet sorghum, respectively, when grown in an intercrop system. The same convention applies below.
Land Equivalent Ratio (LER): An important indicator for evaluating the yield advantage of intercropping systems, it is defined as the sum of the ratios of the yields from intercropping two or more crops to the corresponding yields from monoculture. The value of the LER reflects the efficiency of land resource utilization [14]. An LER greater than 1 indicates that the intercropping system has a yield advantage; an LER less than 1 indicates that the intercropping system has a yield disadvantage.
Aggressivity (A): Refers to the ratio of the relative yield increases between two forage species [15,16]. A > 0 indicates that a species has stronger competitive ability than other species; A < 0 indicates that a species has weaker competitive ability than other species. Component yields are calculated based on the area in hectares occupied by each species. The calculation formula is as follows:
A = (Ysi/Ys) − (Yti/Yt)
Competitive Ratio (CR): It is another indicator for assessing interspecific competition among crops in intercropping systems [17,18]. It measures the degree of competition between one crop and another in an intercropping system. A CR value greater than 1 indicates that the species has a stronger ability to compete for nutrients than other species; a CR value less than 1 indicates that the species has a weaker ability to compete for nutrients than other species.
Intercropping Response Effect (IRE): The relative change in yield from intercropping compared to monocropping:
2.3.4. Determination of Nitrogen Uptake and Utilization by Plants and Soil Nitrogen Parameters
- •
- Calculation of Nitrogen Content per Plant and Nitrogen Fertilizer Utilization Efficiency:
Plant grind samples (sifted through a 40-mesh sieve) set aside in Section 2.3.1 were treated using the combined H2SO4–H2O2 digestion method, and the total nitrogen content (%) of the plants was determined using a fully automated Kjeldahl nitrogen analyzer. Each treatment was analyzed in triplicate. Calculate nitrogen accumulation based on plant dry matter yield and nitrogen content, and calculate relevant nitrogen fertilizer use efficiency indicators [19,20].
Agronomic efficiency nitrogen (NAE, kg·kg−1): NAE = (YN − Y0)/FN
Nitrogen uptake efficiency (NUPE, kg·kg−1): NUE = UN/FN
Nitrogen partial factor productivity (NPFP, kg·kg−1): NPFP = YN/FN
Nitrogen physiological efficiency (NPE, kg·kg−1): NPE = (YN − Y0)/(UN − U0)
In the equation, YN and Y0 represent the dry matter yield (kg ha−1) for the nitrogen-applied treatment and the nitrogen-free (control, N0) treatment, respectively; UN and U0 represent the total nitrogen accumulation in the aboveground parts of plants (kg ha−1) for the nitrogen-applied treatment and the nitrogen-free treatment, respectively. FN represents the amount of nitrogen applied (kg ha−1) for the corresponding treatment.
- •
- Soil Sample Collection and Analysis
Soil samples were collected in mid-September (at the time of harvest, when silage maize was in the milky stage and sweet sorghum was in the jointing stage). A soil auger (inner diameter 5 cm) was used to collect soil samples from the 0–20 cm and 20–40 cm soil layers. Sampling method: For monoculture treatments (silage maize monoculture and sweet sorghum monoculture), three points were randomly selected in an “S” pattern within each plot, and the samples were equally mixed. For intercropping treatments, one sample was collected from each of the following locations on the same sampling transect: within the silage maize row, within the sweet sorghum row, and in the row between the two crops at their boundary (for a total of 3 samples), which were then equally mixed to accurately reflect the nutrient status of the rhizosphere and non-rhizosphere soils in the intercropping system. After removing plant and animal residues and stones from the mixed soil samples from each soil layer, the samples were placed in a cool, well-ventilated area to air-dry naturally, then ground and sieved for later use. Total soil nitrogen was determined using the Kjeldahl method, and alkali-hydrolyzable nitrogen was determined using the alkali diffusion method; for specific procedures, refer to Methods of Agricultural Chemical Analysis of Soils [21].
2.3.5. Data Processing and Statistical Analysis
The experimental data were preliminarily organized using Microsoft Excel 2013, and the results are expressed as mean ± standard error (Mean ± SE). All statistical analyses were performed using SPSS Statistics 26.0, and figures and graphs were created using Origin 2024. Since this experiment employed a split-plot design, all parameters were analyzed using a linear mixed model (LMM). In the model, planting pattern, nitrogen application rate, and their interaction were set as fixed effects, while block and “block × planting pattern” were set as random effects to reflect the main-field error structure. Prior to performing analysis of variance (ANOVA), the normality of the model residuals (Shapiro–Wilk test) and homogeneity of variances (Levene’s test) were assessed; data that did not meet these assumptions were analyzed after being processed using appropriate methods, such as logarithmic transformation. When the interaction between planting pattern and nitrogen application rate was significant, simple effects analysis was performed; when the interaction was not significant, the corresponding main effects were interpreted. Tukey’s method was used for multiple comparisons, with a significance level set at p < 0.05. For the system competition and dominance evaluation indices, a one-sample t-test was used to test the significance of differences between the Land Equivalent Ratio (LER) and 1, as well as between the Relative Interaction Index (RII) and Aggressivity (A) and 0, respectively.
3. Results and Analysis
3.1. Effects of Nitrogen Application Rates and Planting Patterns on Plant Height in Silage Maize and Sweet Sorghum
Nitrogen application rates (N), planting patterns (P), and their interaction had significant and highly significant effects (p < 0.05 or p < 0.01), respectively, on the plant height of silage maize and sweet sorghum at different growth stages (Table 3). Overall, nitrogen application significantly increased the plant height of both crops, but the nitrogen application level corresponding to peak plant height varied depending on the crop type and planting pattern.
Table 3.
Analysis of Variance for Plant Height of Silage Maize and Sweet Sorghum Under Different Treatments.
Silage maize plant height generally decreased as nitrogen application rates increased (Figure 3A). At the VT stage, the plant height of silage maize grown as a monoculture was slightly higher than that of the intercropped treatment under low nitrogen conditions; however, at the R2 and R3 stages, the plant height of intercropped silage maize was higher than that of the monoculture treatment at most nitrogen application levels. At the R3 stage, intercropped silage maize reached its maximum plant height of 357.63 cm under the N4 treatment, significantly higher than that of the sole-cropped silage maize at the same nitrogen application rate and 12.91% higher than the N0 treatment under the same planting system. Sweet sorghum plant height responded more significantly to intercropping than silage maize (Figure 3B). At all measurement periods, the plant height of sweet sorghum in intercropping was higher than that of sweet sorghum in monoculture under most nitrogen application rates. At the R3 stage, sweet sorghum in intercropping reached its maximum plant height of 383.27 cm under the N3 treatment, whereas the peak plant height of sweet sorghum in monoculture mostly occurred under the N4 or N5 treatments. Overall, the N3–N4 treatments were more conducive to increasing the plant height of both crops, while the N5 treatment did not further increase plant height, and some treatments even showed a downward trend.
Figure 3.
Effects of nitrogen regulation and intercropping patterns the plant height. Note: (A) represents the plant height of silage maize, and (B) represents the plant height of sweet sorghum. The lowercase letters indicate significant differences among the 12 treatment groups of silage maize/sweet sorghum (p < 0.05).
3.2. Effects of Nitrogen Application Rates and Planting Patterns on Dry Matter Accumulation in Silage Maize and Sweet Sorghum
Cultivation system (P), nitrogen application rate (N), and their interaction significantly affected dry matter accumulation at each growth stage in both crops (p < 0.05, Table 4). Overall, dry matter accumulation followed an upward trend initially, then declined as nitrogen application rates increased, and the intercropping treatment showed a clear advantage during the R2 and R3 stages.
Table 4.
Analysis of Variance for Dry Matter Accumulation in Silage Maize and Sweet Sorghum Under Different Treatments.
For silage maize, maximum dry matter accumulation was achieved under the N4 treatment at both the VT and R2 stages (Figure 4A). At the R2 stage, the maximum dry matter accumulation for intercropped and sole-cropped silage maize was 163.33 and 159.44 g plant−1, respectively, representing increases of 38.29% and 27.55% compared to the N0 treatment. At the R3 stage, intercropped silage maize reached a maximum of 454.37 g plant−1 under the N4 treatment, representing a 60.80% increase over N0; stand-alone silage maize reached a maximum of 297.77 g Plant−1 under the N5 treatment, representing a 31.34% increase over N0.
Figure 4.
Effects of nitrogen regulation and intercropping patterns on dry matter accumulation. Note: (A) Dry matter accumulation in silage maize, (B) Dry matter accumulation in sweet sorghum. The lowercase letters indicate significant differences among the 12 treatment groups of silage maize/sweet sorghum (p < 0.05)
Sweet sorghum exhibited different response patterns (Figure 4B). At the VT and R2 stages, sweet sorghum in intercropping reached maximum yields under the N4 treatment, at 185.56 and 325.47 g plant−1, respectively, representing increases of 38.02% and 77.34% compared to the N0 treatment. At the R3 stage, intercropped sweet sorghum reached a maximum of 389.68 g plant−1 under the N2 treatment, representing a 31.48% increase compared to N0; sweet sorghum grown as a monoculture reached a maximum of 294.04 g plant−1 under the N5 treatment. The results indicate that intercropping promoted dry matter accumulation during the later growth stages and reduced the nitrogen application rate required for sweet sorghum to reach its maximum accumulation.
3.3. Effects of Nitrogen Application Rates and Planting Patterns on Mixed Forage Yield and Crude Protein Yield
Analysis of variance (ANOVA) indicated that planting pattern (P), nitrogen application rate (N), and their interaction (P × N) had significant or highly significant effects on fresh forage yield, dry forage yield, and crude protein yield (p < 0.05 or p < 0.001; Table 5). Overall, at the same nitrogen application rate, yield indicators were generally higher in the intercropping system (B) than in the monoculture silage maize (S) and monoculture sweet sorghum (T) systems.
Table 5.
Analysis of variance for plant height and dry matter accumulation under different treatments.
Fresh forage and hay yields generally increased with nitrogen application rates. However, the magnitude of the response and the nitrogen levels at which peak yields were reached differed among the various cropping systems (Figure 5). Under the intercropping system, fresh forage yield remained at a high level after the N3 treatment, with a maximum of 111,985.79 kg ha−1; dry forage yield, however, followed a pattern of initially increasing and then decreasing with increasing nitrogen application, reaching a maximum of 39,928.03 kg ha−1 under the N4 treatment, a 37.86% increase compared to the N0 treatment. In contrast, fresh forage yields for both silage maize and sweet sorghum in the intercropping system reached their highest values under the N3 treatment; silage maize dry matter yield in the monoculture system declined after the N4 treatment, indicating that further increases in nitrogen application did not lead to additional increases in dry matter production.
Figure 5.
Effects of nitrogen regulation and intercropping patterns on mixed forage yield. Note: Lowercase letters indicate significant differences among nitrogen fertilizer treatments under the same intercropping pattern (p < 0.05), while uppercase letters denote significant differences within the same nitrogen fertilizer treatment across different intercropping patterns (p < 0.05).
The response of crude protein yield to nitrogen application rates and cropping systems was generally consistent with that of hay yield (Figure 5). In the intercropping system, crude protein yield initially increased and then decreased with increasing nitrogen application, reaching a maximum of 3560.70 kg ha−1 under the N4 treatment—a 52.04% increase compared to the N0 treatment—and was higher than the corresponding monocropping treatments at all nitrogen application rates. Crude protein yields for both silage maize and sweet sorghum under monoculture increased with increasing nitrogen application rates, reaching maximum values in the N5 treatment (2799.16 and 1946.01 kg ha−1, respectively). However, these values remained lower than those of the N4 treatment in the intercropping system.
In summary, nitrogen application significantly increased forage yield and crude protein yield, but the optimal nitrogen application rate varied among the different cropping systems. The intercropping system achieved higher hay yields and crude protein yields under the N4 treatment, while the monocropping system typically reached peak yields at higher nitrogen application rates.
3.4. Multivariate Comprehensive Assessment of the Nutritional Quality of Mixed Forage Crops Based on Intercropping Systems and Nitrogen Application Regulation
Based on five key nutritional quality indicators—crude protein (CP), neutral detergent fiber (NDF), acid detergent fiber (ADF), starch (ST), and relative feed value (RFV)—this study used radar charts to comprehensively evaluate the nutritional quality of mixed forage under different treatments (Figure 6). To facilitate comparisons among the different indicators, each indicator was standardized before being plotted on the radar chart; an outward extension of the radar chart’s outline indicates a higher composite score for the corresponding indicator, signifying superior feed value.
Figure 6.
Multivariate assessment of treatment combinations in the silage maize-sweet sorghum intercropping system. Note: 0 to 1.2 (with —0.2 as the minimum score and 1.2 as the maximum score) to quantify the nutritional quality content of the mixed forage. CP, NDF, ADF, ST, and RFV denote crude protein content, ether extract, neutral detergent fiber content, acid detergent fiber content, starch, and relative feeding value, respectively.
The results of the analysis of variance (ANOVA) indicate that planting pattern (P) had a highly significant effect (p < 0.001) on all five nutritional indicators and was the key factor determining the basic nutritional quality; in contrast, nitrogen application rate (N) had no significant effect on most indicators but did significantly increase the relative feed value (RFV) (p < 0.001). The interaction between the two had a significant effect on RFV (p = 0.001) (Table 6). As shown in the radar chart (Figure 6), there are marked differences in the feed value of the mixed forage under different planting patterns.
Table 6.
Analysis of Variance for the Nutritional Quality of Mixed Forage Under Different Treatment Conditions.
The radar chart for intercropping model (B) showed the most balanced profile. It performed well on positive indicators such as CP, ST, and RFV, while its NDF and ADF scores were also at favorable levels. Mode B achieved the highest CP content of 8.92% (BN4), an RFV of 145.64, and kept NDF and ADF at approximately 44.31% and 25.06%, respectively (Table 7). This indicates that the intercropping mode effectively reduced indigestible fiber components and yielded the highest overall feed quality.
Table 7.
Effects of Nitrogen Regulation and Intercropping Patterns on the Nutritional Quality of Mixed Forage Crops. Note: Lowercase letters indicate significant differences among nitrogen fertilizer treatments under the same intercropping pattern (p < 0.05), while uppercase letters denote significant differences within the same nitrogen fertilizer treatment across different intercropping patterns (p < 0.05).
The radar chart profiles for pure silage maize (S) showed a marked outward extension in both the CP and ST directions, with CP content ranging from 8.66% to 9.61%; under certain nitrogen fertilizer treatments, this content was even higher than that of the intercropping system. However, the high fiber content limited the increase in RFV;
The radar chart profile for sweet sorghum (T) grown as a sole crop shows a different distribution pattern: its NDF (56.01–57.34%) and ADF (36.66–37.75%) scores extend outward from the highest levels, while CP (6.16–6.60%), ST and RFV (97.35–99.99) are clustered toward the center (Table 7 or Figure 6). This is primarily because the sweet sorghum grains have not yet fully developed, resulting in an overall nutritional quality lower than that of B and S.
Based on the five indicators, the BN4 treatment exhibited superior overall feed value under the experimental conditions, with higher scores for CP, ST, and RFV, as well as favorable NDF and ADF levels. Compared with BN4, BN5 did not show any significant further improvement; meanwhile, the overall quality of the monoculture treatments was generally lower than that of the intercropped N4 treatment. These results indicate that intercropping, combined with appropriate nitrogen application, enhances the overall feed value of mixed forage.
3.5. Effects of Nitrogen Application Rates on Interspecific Interactions and Competitive Relationships in Intercropping Systems
Analyses of relative interaction intensity (RII), land equivalence ratio (LER), intercropping responsiveness (IRE), invasiveness (A), and competition ratio (CR) indicated that nitrogen application rates significantly influenced interspecific interactions and competitive relationships in the silage maize–sweet sorghum intercropping system (Figure 7).
Figure 7.
Land use and interspecific competition between silage maize and sweet sorghum. Note: (A) Relative Interaction Index (B) Land Equivalent Ratio (C) Competitive Ratio and Aggressivity (D) Intercropping Response Effect. Lowercase letters indicate significant differences between the six nitrogen gradients (p < 0.05).
In terms of land use efficiency, the LER values for the N0–N4 treatments ranged from 1.27 to 1.62 and were all significantly greater than 1 (p < 0.05; Figure 7B), indicating that the intercropping system exhibits a land use advantage within the appropriate nitrogen application range. However, under the N5 treatment, the LER dropped to 1.27 and was not significantly different from 1, suggesting that excessive nitrogen application weakened the intercropping advantage. IRE results further indicated that the IRE of sweet sorghum under the N1–N4 treatments was significantly greater than 0, demonstrating a stable yield-increasing effect of intercropping (Figure 7D). In contrast, silage maize exhibited low or even negative IRE values at low nitrogen levels, but these values increased significantly to 44.67% under the N4 treatment (p < 0.01), indicating that appropriate nitrogen application significantly enhanced the yield response of silage maize in the intercropping system.
The RII results showed that intercropping had an overall positive effect on silage maize, with its RII being significantly greater than 0 under all N0–N4 treatments; in contrast, the RII for sweet sorghum was significantly less than 0 under N1–N4 treatments, indicating that it was subject to some competitive inhibition in the intercropping system (Figure 7A). The A and CR results further indicated that nitrogen application altered the relative competitive ability of the two crops (Figure 7C). Under the N0–N3 treatments, silage maize had A < 0 and CR < 1, indicating that sweet sorghum possessed a stronger competitive advantage; whereas under the N4 and N5 treatments, silage maize’s A became positive and CR > 1, suggesting that higher nitrogen application levels enhanced silage maize’s relative competitive ability, making it the dominant species in the competition.
Overall, moderate nitrogen application optimizes interspecific relationships in the silage maize–sweet sorghum intercropping system. The N4 treatment significantly increased the RII and IRE of silage maize while maintaining a high LER. It promoted a shift in competitive advantage from sweet sorghum to silage maize, indicating that this nitrogen application rate is beneficial for enhancing the yield advantage and resource-use coordination of the intercropping system.
3.6. Effects of Nitrogen Application Management on Nitrogen Use Efficiency in Forage Crops
Analysis of variance (ANOVA) revealed that the intercropping system (P), nitrogen application rate (N), and the interaction between nitrogen application rate and intercropping system (P × N) had highly significant effects (p < 0.001) on nitrogen use efficiency (NUPE), nitrogen fertilizer-derived productivity (NPFP), nitrogen agronomic efficiency (NAE), and nitrogen physiological efficiency (NPE) (Table 8). This indicates that appropriate intercropping patterns can significantly regulate and improve the efficiency of forage crops in absorbing and utilizing nitrogen.
Table 8.
Analysis of variance for nitrogen use efficiency.
Both NUPE and NPFP showed a consistent downward trend as nitrogen application rates increased (Figure 8B,C). Both indices reached their highest values under the N1 treatment and decreased significantly as nitrogen application rates increased, indicating that high nitrogen application rates reduced the absorption efficiency and yield returns per unit of nitrogen input. Specifically, in the intercropping system (B), NUPE and NPFP under the N1 treatment were 3.17 and 241.97 kg·kg−1, respectively, indicating high nitrogen uptake and nitrogen fertilizer production efficiency.
Figure 8.
Effects of nitrogen management on forage nitrogen use efficiency in silage maize-sweet sorghum intercropping systems. Note: (A) Agronomic efficiency nitrogen, (B) Nitrogen uptake efficiency, (C) Nitrogen partial factor productivity (D) Nitrogen physiological efficiency. Lowercase letters indicate significant differences among nitrogen fertilizer treatments under the same intercropping pattern (p < 0.05), while uppercase letters denote significant differences within the same nitrogen fertilizer treatment across different intercropping patterns (p < 0.05).
NAE showed an initial increase followed by a decrease as nitrogen application rates increased (Figure 8A), indicating that moderate nitrogen application enhances the yield-increasing effect of nitrogen fertilizer. In the intercropping system, NAE remained at relatively high levels under the N2 and N4 treatments, at 46.86 and 36.55 kg·kg−1, respectively; In the silage maize monoculture (S), NAE reached its highest value under the N3 treatment, at 25.56 kg·kg−1; in the sweet sorghum monoculture (T), it reached its highest value under the N5 treatment, at 23.91 kg·kg−1.
NPE reflects a crop’s ability to convert absorbed nitrogen into biomass and is significantly influenced by nitrogen application rates (Figure 8D). Under the intercropping system, NPE reached its highest value in the N4 treatment, indicating that this nitrogen application rate enhances the physiological nitrogen conversion efficiency of the intercropped population. For monocropped silage maize and monocropped sweet sorghum, NPE was highest under the N3 and N2 treatments, respectively, but showed a declining trend with further increases in nitrogen application rates.
3.7. Effects of Nitrogen Application Management on Total Nitrogen and Alkaline-Hydrolyzable Nitrogen Content in Soil
Total soil nitrogen (STN) and alkaline–hydrolyzable nitrogen (SAN) reflect soil nitrogen reserves and the capacity to supply nitrogen during the current growing season, respectively. Analysis of variance (ANOVA) results indicated that planting pattern (P) and nitrogen application rate (N) had significant and highly significant effects on STN and SAN concentrations in the 0–20 cm and 20–40 cm soil layers (p < 0.05, p < 0.001; Figure 9 and Figure 10), while the P × N interaction was not significant in any soil layer or parameter. Both nitrogen parameters exhibited distinct vertical distribution patterns, with concentrations in the 0–20 cm soil layer generally higher than those in the 20–40 cm soil layer, indicating that soil nitrogen is enriched in the surface layer.
Figure 9.
Effects of nitrogen management on soil total nitrogen in silage maize–sweet sorghum intercropping systems. Note: (A) Total nitrogen in the 0–20 cm soil layer, (B) Total nitrogen in the 20–40 cm soil layer. P denotes intercropping pattern, and N denotes nitrogen application rate. * and *** indicate significant differences at the 0.05 level (p < 0.05) and 0.001 level (p < 0.001) under the P, N, and P × N treatment conditions, respectively; same below. Lowercase letters indicate significant differences among nitrogen fertilizer treatments under the same intercropping pattern (p < 0.05), while uppercase letters denote significant differences within the same nitrogen fertilizer treatment across different intercropping patterns (p < 0.05).
Figure 10.
Effects of nitrogen management on alkali-hydrolyzable nitrogen in silage maize–sweet sorghum intercropping systems. Note: (A) Alkaline hydrolysable nitrogen in the 0–20 cm soil layer, (B) alkaline hydrolysable nitrogen in the 20–40 cm soil layer. P denotes intercropping pattern, and N denotes nitrogen application rate. * and *** indicate significant differences at the 0.05 level (p < 0.05) and 0.001 level (p < 0.001) under the P, N, and P × N treatment conditions, respectively; same below. Lowercase letters indicate significant differences among nitrogen fertilizer treatments under the same intercropping pattern (p < 0.05), while uppercase letters denote significant differences within the same nitrogen fertilizer treatment across different intercropping patterns (p < 0.05).
Total soil nitrogen content generally increased with higher nitrogen application rates, but the patterns of change differed among the various cropping systems (Figure 9). In the 0–20 cm soil layer, STN content in the intercropping system (B) reached a higher level under the N4 treatment and was significantly higher than that under the N0–N3 treatments (p < 0.05); when the nitrogen application rate was further increased to N5, the STN content did not continue to rise. In contrast, the surface STN content in the silage maize monoculture (S) and sweet sorghum monoculture (T) plots continued to increase with rising nitrogen application rates, reaching the highest values under the N5 treatment. Comparisons among different cropping systems showed that under no-nitrogen or low-nitrogen conditions, soil STN content was relatively low in the sweet sorghum monoculture, while the intercropping and silage maize monoculture treatments maintained higher levels of total soil nitrogen. STN content in the 20–40 cm soil layer was lower than that in the topsoil, but its response to nitrogen application generally followed the same trend as that of the topsoil.
The response of soil alkali-soluble nitrogen (SAN) content to nitrogen application rates was more direct (Figure 10). As nitrogen application rates increased, SAN concentrations in both the 0–20 cm and 20–40 cm soil layers showed a consistent upward trend across all three cropping systems, with most treatments reaching their highest values under the N5 treatment. A cross-comparison revealed that, at the same nitrogen application rates, SAN concentrations were generally higher in the intercropping system and the silage maize monoculture treatments, while those in the sweet sorghum monoculture treatment were relatively lower at most nitrogen application rates, with the difference being particularly pronounced in the low—nitrogen treatment in the 0–20 cm soil layer.
Overall, nitrogen application significantly increased both total soil nitrogen and alkali-hydrolyzable nitrogen, but the responses of the two to increased nitrogen application were not entirely consistent. SAN levels continued to rise with increasing nitrogen application, whereas STN did not increase further under the intercropping system following the N4 treatment. Considering both soil nitrogen reserves and available nitrogen levels, the N4 treatment maintained high levels of total nitrogen and available nitrogen in the topsoil within the intercropping system, indicating that moderate nitrogen application helps balance soil nitrogen retention and supply capacity, whereas excessive nitrogen application did not further increase total nitrogen accumulation in the soil.
3.8. Comprehensive Evaluation of System Production Performance Based on PCA
To comprehensively evaluate forage production performance under different cultivation systems and nitrogen application rates, this study employed principal component analysis (PCA) to perform dimensionality reduction on eight yield and quality indicators, including fresh forage yield (X1), hay yield (X2), crude protein yield (X3), crude protein content (X4), neutral detergent fiber (X5), acid-washed fiber (X6), starch content (X7), and relative feed value (X8), to establish a comprehensive evaluation system that integrates yield and quality.
The PCA results show that the eigenvalues of the first two principal components are both greater than 1, with variance contributions of 66.3% and 19.0%, respectively, for a cumulative contribution of 85.3% (Figure 11). This indicates that PC1 and PC2 can explain most of the variation in the original indicators and can be used to characterize the primary differences in production performance among the different treatments.
Figure 11.
PCA plots under different treatments. Note: Since the units and orders of magnitude of the various nutritional quality indicators differ, all indicators were standardized (using Z−scores) prior to conducting PCA and plotting the graphs.
In terms of variable loadings, fresh forage yield, hay yield, crude protein yield, crude protein content, starch content, and relative feed value exhibited high positive loadings on PC1, while NDF and ADF showed negative loadings on PC1. Therefore, PC1 can be interpreted primarily as a composite dimension representing yield increases and improvements in feed value. PC2, on the other hand, is primarily associated with yield traits such as fresh forage yield and hay yield, reflecting further differences in yield formation. The distribution of sample scores indicates that different cropping systems exhibit a certain degree of separation in the PCA space. Treatments under intercropping (B) and silage maize monoculture (S) were predominantly distributed in the positive region of PC1, whereas the sweet sorghum monoculture (T) treatment was mainly distributed in the negative region of PC1, indicating that its overall yield and quality performance were relatively low and that it had higher fiber content.
The principal component scoring function based on the principal component load matrix is constructed as follows:
Y1 = 0.062X1 + 0.142X2 + 0.176X3 + 0.162X4 − 0.159X5 − 0.147X6 + 0.170X7 + 0.178X8
Y2 = 0.574X1 + 0.387X2 + 0.190X3 − 0.198X4 + 0.125X5 + 0.201X6 − 0.097X7 − 0.145X8
Using the variance contribution rates of each principal component as weights, we further establish a comprehensive evaluation function:
Y = 0.663Y1 + 0.190Y2
The standardized data for each indicator were substituted into the comprehensive evaluation model to calculate the composite scores for different treatments and rank them (Table 9). The results showed that treatments with higher composite scores were primarily concentrated in the intercropping systems. Among them, treatment BN4 had the highest composite score of 0.72 and ranked first; the BN3 and BN5 treatments had similar scores of 0.66, ranking second and third, respectively. These results indicate that the silage maize–sweet sorghum intercropping system outperforms the monocropping system in terms of overall yield and quality performance. Furthermore, the N4 nitrogen application rate effectively balances high yield with high quality, making it the nitrogen management level with the best overall production performance under the conditions of this study.
Table 9.
Comprehensive ranking and score of different treatments.
4. Discussion
4.1. Mechanisms of Production Advantages: The Synergy of Competitive Regulation and Ecological Complementarity
The yield advantages of intercropping systems typically stem from the spatiotemporal complementarity and moderate competition in resource utilization among crops, rather than a simple increase in the yield of a single crop [22,23,24]. Previous studies have shown that a 3:3 row ratio of silage maize and sweet sorghum outperforms other configuration models in terms of fresh forage yield, land equivalence ratio, and comprehensive production performance [25]. Building on this, the present study further found that appropriate nitrogen application can modulate the relative competitive ability of silage maize and sweet sorghum; it is therefore hypothesized that this may help translate the potential complementary advantages of this intercropping system into actual yield gains.
Differences in the growth rhythms of the aboveground parts of silage maize and sweet sorghum may constitute an important ecological basis for the yield advantage of this system. Silage maize grows rapidly during the early growth stages, enabling it to establish a canopy earlier and enhance its ability to acquire resources in the early stages; sweet sorghum grows relatively slowly in the early stages but enters a phase of rapid jointing and biomass accumulation in the middle and late stages, which compensates for the formation of dry matter in the stand. This time lag between growth peaks helps reduce simultaneous competition between the two crops for light, space, and nutrients during the same period, thereby improving the continuity of resource utilization within the stand. Previous studies have also shown that the complementarity of crop growth stages, canopy structure, and resource acquisition timing is a key mechanism by which intercropping systems enhance land-use efficiency and yield stability [24,26,27].
However, whether temporal ecological niche complementarity can translate into actual yield advantages depends on whether interspecific competition is maintained within an appropriate range. In this study, the land equivalence ratio (LER) for the intercropping system was greater than 1 under all treatments from N0 to N4, indicating that the silage maize–sweet sorghum intercropping system offers land-use advantages; however, when nitrogen application was further increased to N5, the LER decreased, suggesting that excessive nitrogen application did not continue to enhance system productivity. Results from competition indices further show that nitrogen application levels altered the relative competitive status of the two crops. At low to medium nitrogen application levels, silage maize exhibited lower aggressiveness and a lower competition ratio, while sweet sorghum demonstrated a relative competitive advantage; at higher nitrogen application levels, however, silage maize’s competitive ability increased, and competitive dominance gradually shifted toward silage maize. These results indicate that nitrogen supply not only affects individual crop growth but can also reshape the competitive landscape of the intercropped community by altering the relative growth vigor and resource acquisition capacity of the two crops [28].
Treatment N4 may represent a relatively appropriate level of nitrogen regulation under the conditions of this experiment. Under this treatment, both the relative interaction index (RII) and intercropping response effect (IRE) for silage maize were at relatively high levels, indicating that moderate nitrogen application enhanced its positive response within the intercropping system; at the same time, the system still maintained a high LER, suggesting that the enhanced competitive ability of silage maize did not completely undermine the complementary contribution of sweet sorghum. In other words, the interspecific relationship under N4 conditions is not simply one of competitive exclusion, but rather a balanced state of “moderate competition—increased population yield.” In contrast, under low-nitrogen conditions, insufficient resource supply intensifies competition between the two crops for limited nitrogen, making it difficult to fully realize their complementary potential; conversely, excessive nitrogen application may promote excessive growth of the dominant crop, exacerbate imbalances in population structure, and weaken the compensatory effect of the companion crop, thereby reducing the system’s overall yield-enhancing effect [29].
Overall, the row ratio determines the potential spatial structure and ecological complementarity of the intercropping system, while nitrogen management further modulates the intensity of interspecific competition. An appropriate 3:3 row ratio provides the structural conditions for the staggered growth stages, canopy differentiation, and potential spatial complementarity between silage maize and sweet sorghum; moderate nitrogen application transforms potential complementary advantages into actual productivity by alleviating nitrogen limitations, regulating relative competitive abilities among crops, and maintaining stable population structure. Therefore, the yield advantage of the silage maize–sweet sorghum intercropping system is not driven by a single factor but is the result of the synergistic interaction between spatial configuration and nitrogen management.
4.2. Mechanisms Underlying Differences in Nitrogen Use Efficiency Between Intercropping and Monoculture Systems
Nitrogen use efficiency is a key indicator for evaluating the economic benefits and environmental sustainability of forage production. The results of the analysis of variance (ANOVA) in this study indicate that the intercropping system, nitrogen application rate, and their interaction (P × N) had significant or highly significant effects (p < 0.01) on nitrogen uptake efficiency (NUPE), nitrogen partial factor productivity (NPFP), agronomic efficiency nitrogen (NAE), and nitrogen physiological efficiency (NPE). The improvement in nitrogen use efficiency observed in this study resulted from the combination of a rational intercropping system and an appropriate nitrogen application rate, rather than a simple linear response driven by a gradient in nitrogen application rates [30,31].
In this study, both NUPE and NPFP decreased as nitrogen application rates increased, exhibiting the typical characteristics of diminishing returns to nitrogen fertilizer. At lower nitrogen application rates, crops exhibit higher uptake and yield returns per unit of nitrogen input; as nitrogen fertilizer application increases, crop nitrogen requirements are gradually met, and the additional nitrogen cannot be fully absorbed and converted into biomass, leading to a decline in the efficiency of nitrogen fertilizer application per unit. This pattern is consistent with general theories of nitrogen management in agricultural ecosystems, namely that once exogenous nitrogen inputs exceed the crop demand threshold, continued application of nitrogen fertilizer is unlikely to yield corresponding yield gains and may even increase the risk of soil nitrogen residue [32,33].
In contrast to the continuous decline in NUPE and NPFP, NAE exhibited a nonlinear response to the nitrogen application gradient. Under the intercropping system, NAE remained at relatively high levels under the N2 and N4 treatments, indicating that moderate nitrogen application can alleviate nitrogen limitation, promote plant height, dry matter accumulation, and forage yield, thereby enhancing the yield-increasing effect per unit of nitrogen fertilizer. The fact that the intercropping system maintained relatively high NAE at certain nitrogen application levels may be related to its stronger ability to form high plant populations. On the one hand, silage maize and sweet sorghum differ in their growth stages, population structure, and peak resource demands, which can reduce the synchrony of resource competition to some extent; on the other hand, the higher fresh forage, hay, and crude protein yields in the intercropping treatments enhance the return on nitrogen fertilizer investment. Therefore, even though NUPE decreases with increasing nitrogen application rates, the intercropping system may still maintain high agronomic nitrogen efficiency through yield gains. Similar studies indicate that the advantages of intercropping often stem from spatiotemporal complementarity in resource use rather than a simple increase in the nitrogen uptake efficiency of individual crops [24,26,27].
When the nitrogen application rate was further increased to N5, both NAE and NPFP decreased significantly, indicating that excessive nitrogen application reduced the marginal returns on nitrogen fertilizer. The soil nitrogen results from this study showed that under high-nitrogen treatments, total soil nitrogen (STN) and alkaline-hydrolyzable nitrogen (SAN) contents in the 0–40 cm soil layer increased, suggesting that a significant proportion of the added nitrogen may not have been effectively absorbed by the crops but instead remained in the soil as residual nitrogen. At this point, crop yields tend to plateau in response to additional nitrogen, and the match between nitrogen fertilizer application and forage yield declines, resulting in a simultaneous decrease in both the agronomic efficiency of nitrogen fertilizer and its contribution to productivity. These results further illustrate that the key to nitrogen fertilizer management is not to maximize nitrogen application rates, but rather to match soil nitrogen availability with the crop’s stage-specific needs, thereby reducing nitrogen surplus and lowering the potential risk of nitrogen loss.
It is worth noting that the silage maize–sweet sorghum intercropping system is a typical “double grass” intercropping system, and its nitrogen utilization mechanism differs from that of the classic “grass–legume” intercropping system. In grass-legume intercropping, legumes supplement the system with biological nitrogen sources through symbiotic nitrogen fixation, thereby alleviating competition for nitrogen among species under low-nitrogen or no-nitrogen-application conditions and improving the system’s nitrogen input and utilization efficiency [34,35]. In contrast, silage maize and sweet sorghum are both high-nitrogen-demand grass crops, and the system’s nitrogen supply relies primarily on soil background nitrogen and exogenous nitrogen fertilizer inputs. Therefore, under low-nitrogen conditions, these two crops are more likely to compete for limited nitrogen, making it difficult to fully realize the complementary potential of intercropping. Only when nitrogen supply reaches an appropriate level—thereby alleviating nitrogen limitation—are differences in growth timing and complementary population structures more likely to translate into actual yield benefits.
From the perspective of interspecific competition, under low-nitrogen conditions, sweet sorghum’s strong tolerance to poor soils may give it a certain advantage in nutrient competition, thereby limiting the early growth of silage maize; as nitrogen application rates increase, the competitive ability of silage maize gradually strengthens, and the stand structure tends toward equilibrium. Under the N4 treatment, the intercropping system maintained both a high land-equivalent ratio and high yield performance, while also sustaining high NAE and NPE values. This indicates that this level of nitrogen application helps to balance competition among crops. In contrast, although the N5 treatment increased the supply of available nitrogen in the soil, it did not translate into yield or nitrogen-use advantages; rather, it may have weakened the system’s synergistic effects due to excessive growth of the dominant crop and nitrogen utilization approaching saturation.
In summary, the nitrogen-use advantage of the silage maize–sweet sorghum intercropping system does not manifest as a simultaneous improvement in all nitrogen efficiency indicators. Rather, it is primarily reflected in increased agronomic returns from nitrogen fertilizer through yield gains in plant population density at appropriate nitrogen application rates. Based on a comprehensive evaluation of indicators such as yield, quality, land-equivalent ratio, interspecific competition, and nitrogen use efficiency, N4 (300 kg N·ha−1) can be considered the optimal nitrogen fertilizer management level under the conditions of this study.
4.3. Residual Effects of Soil Nutrients and Implications for the Environment and Ecology
Soil nitrogen retention characteristics reflect the relationship between nitrogen fertilizer application and crop uptake during the growing season, and are also related to the maintenance of soil fertility and potential environmental risks in the future. Analysis of nitrogen distribution in the 0–40 cm soil profile in this study indicates that nitrogen application significantly increased soil total nitrogen (STN) and alkali-soluble nitrogen (SAN) content; however, the responses of different nitrogen forms to the nitrogen application gradient were not entirely consistent. Overall, STN and SAN concentrations in the 0–20 cm soil layer were higher than those in the 20–40 cm soil layer, exhibiting a distinct pattern of enrichment in the surface layer, indicating that nitrogen fertilizer application, root residues, and organic matter return primarily influence the soil nitrogen pool in the arable layer.
Under the intercropping system, surface STN content reached a relatively high level under the N4 treatment (300 kg N ha−1), but did not continue to increase with further nitrogen application to the N5 treatment, indicating that excessive nitrogen input does not correspondingly enhance the soil’s total nitrogen retention capacity. In contrast, STN content in both cropping systems continued to rise with increasing nitrogen application and reached a maximum in the N5 treatment. This suggests that higher soil nitrogen retention in the monoculture system may stem more from the accumulation of exogenous nitrogen fertilizers, whereas the intercropping system may achieve a relative balance between nitrogen retention and utilization at appropriate nitrogen application levels through stronger plant uptake and biomass return. As an indicator of available nitrogen, SAN responds more directly to nitrogen application; it generally increased with increasing nitrogen application in both soil layers and reached higher levels in the N5 treatment. Therefore, the increase in SAN under the N5 treatment should be interpreted as an excess supply of available nitrogen or increased residual nitrogen, rather than a continued improvement in production efficiency. These results indicate that the residual nitrogen effect in intercropping systems is not simply a matter of “the higher the residual nitrogen, the better”; rather, attention should be focused on striking a balance between maintaining the soil nitrogen pool and crop uptake and utilization.
From the perspective of intercropping ecology, appropriate crop combinations and spatial arrangements help improve the spatiotemporal efficiency of soil resource utilization [36]. Silage maize and sweet sorghum differ in their growth stages, population structure, and peak resource requirements, which may reduce simultaneous competition for nitrogen during the same period and improve the efficiency of nitrogen uptake and utilization in the 0–40 cm soil layer. Compared with monocultures, intercropping systems can increase yield and crude protein production through stand complementarity at appropriate nitrogen application rates, thereby improving the return on nitrogen investment per unit. Similar studies have also shown that intercropping can improve nutrient use efficiency by optimizing plant community structure, making it an important approach to achieving low-input, high-efficiency agriculture [24,26,27]. However, this advantage exhibits certain threshold characteristics: when nitrogen supply is excessive, interspecific complementary effects may be weakened, the competitive ability of the dominant crop may increase, and the resource acquisition space of the weaker crop may be reduced, thereby diminishing the overall synergistic effect of the system.
The findings of this study offer certain ecological insights for forage production in arid and semi-arid irrigated areas of Northwest China. This region experiences scarce precipitation and high evaporation rates, making agricultural production highly dependent on irrigation; at the same time, some soils have a light texture and limited capacity to retain water and nutrients. Under the combined effects of high nitrogen inputs and irrigation, nitrogen not absorbed by crops may accumulate in the soil profile and leach downward with irrigation water or rainfall, increasing the potential risk of nitrate accumulation in deep soil layers and groundwater contamination. Previous studies have shown that optimizing nitrogen application rates, improving crop nitrogen use efficiency, and refining cropping systems are key measures for reducing nitrogen losses from farmland [32,37]. It should be noted that this study only assessed nitrogen status in the 0–40 cm soil layer and did not directly monitor the migration of nitrate nitrogen to deeper layers, leaching losses, or gaseous nitrogen emissions. Therefore, assessments of environmental risks remain inferences of potential risks and require further validation.
Based on the findings of this study regarding yield, quality, nitrogen use efficiency, interspecific competition, and soil nitrogen retention characteristics, the silage maize-sweet sorghum 3:3 intercropping system with 300 kg N ha−1 of nitrogen fertilizer (BN4) demonstrated superior overall performance under the experimental conditions. This treatment not only maintained high forage yield and feed value but also preserved favorable total soil nitrogen levels, while avoiding the problems of excessive accumulation of available nitrogen and reduced nitrogen fertilizer efficiency observed in the high-nitrogen N5 treatment. Therefore, under the conditions of this experiment, the BN4 treatment demonstrated a good balance between high forage yield and residual soil nitrogen. It can serve as a preliminary recommended nitrogen application regimen for forage production in the arid and semi-arid regions of Northwest China; however, its broad applicability still requires verification through future multi-year, multi-site trials.
4.4. Limitations of the Study and Future Directions
Although this study provides experimental evidence to elucidate the effects of nitrogen regulation on production performance, nitrogen use efficiency, and interspecific competition in a silage maize–sweet sorghum intercropping system, certain limitations remain. First, this study conducted nitrogen application gradient experiments using a fixed intercropping configuration with a 3:3 row ratio. This configuration was selected based on the results of previous studies, which indicated that a 3:3 intercropping ratio of silage maize and sweet sorghum performed better in terms of fresh forage yield, land equivalence ratio, and comprehensive production performance. However, this study did not further examine the coupled effects of different planting densities, row spacings, strip widths, and row–position combinations under this row ratio in conjunction with nitrogen application rates. Therefore, the optimal nitrogen application rates obtained in this study are primarily applicable to the population structure established in this experiment, and their suitability under different field layouts and mechanized production conditions requires further validation.
Second, this study is based solely on the results of field trials conducted during a single growing season in 2025, representing a relatively short experimental period. Crop growth, interspecific competition, nitrogen uptake and utilization, and residual soil nitrogen are all susceptible to interannual variations in temperature, precipitation, sunlight, and irrigation conditions. Particularly in arid and semi-arid irrigation areas of Northwest China, fluctuations in water and heat conditions may alter the intensity of silage maize and sweet sorghum’s response to nitrogen application, as well as their resource-complementary effects. Therefore, the conclusions of this study regarding optimal nitrogen application rates and the regulatory effects of interspecific relationships still require further validation through multi-year, multi-site trials to confirm their stability and regional applicability.
Furthermore, this study primarily evaluated the comprehensive effects of the intercropping system based on yield, quality, nitrogen use efficiency, competition indices, and nitrogen retention characteristics in the 0–40 cm soil layer; it did not directly monitor process-related indicators such as root spatial distribution, canopy light interception, migration of nitrate nitrogen to deeper soil layers, nitrogen leaching, gaseous nitrogen losses, and greenhouse gas emissions. Consequently, explanations regarding resource-complementary mechanisms and potential environmental risks are still primarily based on inferences drawn from experimental results and existing literature; future research will need to validate these findings through more direct process observations.
Future research could be further deepened in the following areas. First, building on the previously screened 3:3 row ratio of silage maize and sweet sorghum, further coupled studies on “spatial configuration and nitrogen management” should be conducted to compare different combinations of planting density, row spacing, strip width, and nitrogen application rates, to identify optimized cultivation models better suited for large–scale and mechanized production. Second, conduct multi-year, multi-site continuous field trials to evaluate variations in this intercropping system’s response to nitrogen application under different climatic years and ecological regions, thereby improving the stability of recommended nitrogen application rates and the reliability of their widespread adoption. Third, we will incorporate methods such as in situ root system observation, nitrogen isotope tracing, monitoring of nitrate nitrogen profiles in deep soil layers, greenhouse gas emission measurements, and economic benefit analysis to further elucidate the processes of nitrogen uptake, allocation, residue, and loss in the silage maize–sweet sorghum intercropping system. The aforementioned research will help refine the theories of precision fertilization and efficient cultivation for the “dual grass” forage intercropping system in the arid regions of Northwest China.
5. Conclusions
This study indicates that a 3:3 silage maize–sweet sorghum intercropping system, combined with appropriate nitrogen application, can synergistically enhance forage yield, quality, and nitrogen use efficiency. Nitrogen application significantly promoted the growth and dry matter accumulation of both crops, with 300 kg ha−1 (N4) yielding the best results; the BN4 treatment achieved higher dry forage yield, crude protein yield, and overall forage quality. Appropriate nitrogen supply helps mitigate interspecific competition between silage maize and sweet sorghum, maintaining a high land-equivalent ratio and agronomic efficiency of nitrogen fertilizer; whereas excessive nitrogen application (N5), although it may increase fresh forage yield, did not further improve dry matter accumulation or quality, and led to reduced nitrogen use efficiency and an excess of available nitrogen in the soil. Considering yield, quality, interspecific interactions, nitrogen use efficiency, and residual soil nitrogen effects, the silage maize–sweet sorghum 3:3 intercropping system with 300 kg ha−1 of nitrogen fertilizer is the preferred cultivation model under the conditions of this experiment. It can serve as a preliminary recommendation for optimizing nitrogen fertilizer management in forage crops in the arid and semiarid regions of Northwest China.
Author Contributions
L.Z.: conceptualization, methodology, investigation, data curation, and writing—original draft preparation; A.Y.: conceptualization and writing—review and editing; H.C.: data curation and investigation; L.W. and L.C.: investigation and formal analysis; K.X.: methodology, writing—review and editing, and funding acquisition. All authors have read and agreed to the published version of the manuscript.
Funding
This work was supported by the earmarked fund for XARS, the Xinjiang Backbone Talent Training Project for Agriculture, Rural Areas and Farmers (2022SNGGGCC019) and the Young Top-notch S&T Talents Program of Xinjiang Uygur Autonomous Region (2022TSYCCX0044).
Data Availability Statement
The original contributions presented in the study are included in the article; further inquiries can be directed to the corresponding author.
Conflicts of Interest
The authors declare no conflicts of interest.
References
- Wang, P.; Deng, X.; Jiang, S. Diffused Impact of Grassland Degradation over Space: A Case Study in Qinghai Province. Phys. Chem. Earth Parts A/B/C 2017, 101, 166–171. [Google Scholar] [CrossRef] [Scilit]
- Wang, M.; Shi, W.; Kamran, M.; Chang, S.; Jia, Q.; Hou, F. Effects of Intercropping and Regulated Deficit Irrigation on the Yield, Water and Land Resource Utilization, and Economic Benefits of Forage Maize in Arid Region of Northwest China. Agric. Water Manag. 2024, 298, 108876. [Google Scholar] [CrossRef] [Scilit]
- Robles Jimenez, L.E.; Osorio Avalos, J.; Castelan Ortega, O.A.; Angeles Hernandez, J.C.; Gonzalez Ronquillo, M. Forage Yield, Chemical Composition and Potential Milk Yield Using Maize Silage from Asia, Europe, North and South American Continents: A Systematic Review. Trop. Subtrop. Agroecosyst. 2024, 27, 113. [Google Scholar] [CrossRef] [Scilit]
- Cusicanqui, J.A.; Lauer, J.G. Plant Density and Hybrid Influence on Corn Forage Yield and Quality. Agron. J. 1999, 91, 911–915. [Google Scholar] [CrossRef] [Scilit]
- Karnatam, K.S.; Mythri, B.; Un Nisa, W.; Sharma, H.; Meena, T.K.; Rana, P.; Vikal, Y.; Gowda, M.; Dhillon, B.S.; Sandhu, S. Silage Maize as a Potent Candidate for Sustainable Animal Husbandry Development—Perspectives and Strategies for Genetic Enhancement. Front. Genet. 2023, 14, 1150132. [Google Scholar] [CrossRef] [Scilit] [PubMed]
- Sadeghpour, A.; Ketterings, Q.M.; Godwin, G.S.; Czymmek, K.J. Under- or Over-Application of Nitrogen Impact Corn Yield, Quality, Soil, and Environment. Agron. J. 2017, 109, 343–353. [Google Scholar] [CrossRef] [Scilit]
- Shen, S.; Feng, B.; Zhang, D.; Zou, J.; Yang, Y.; Rees, R.M.; Topp, C.F.E.; Hu, S.; Qiao, B.; Huang, W.; et al. Optimizing N Applications Increases Maize Yield and Reduces Environmental Costs in a 12-Year Wheat-Maize System. Field Crops Res. 2025, 322, 109741. [Google Scholar] [CrossRef] [Scilit]
- Moore, V.M.; Schlautman, B.; Fei, S.; Roberts, L.M.; Wolfe, M.; Ryan, M.R.; Wells, S.; Lorenz, A.J. Plant Breeding for Intercropping in Temperate Field Crop Systems: A Review. Front. Plant Sci. 2022, 13, 843065. [Google Scholar] [CrossRef] [Scilit] [PubMed]
- Stomph, T.J.; Dordas, C.; Baranger, A.; de Rijk, J.; Dong, B.; Evers, J.; Gu, C.; Li, L.; Simon, J.; Jensen, E.S. Designing Intercrops for High Yield, Yield Stability and Efficient Use of Resources: Are There Principles? In Advances in Agronomy; Elsevier: Amsterdam, The Netherlands, 2020; Volume 160, pp. 1–50. [Google Scholar]
- Li, X.-F.; Wang, P.; Tian, X.-L.; Dong, N.; Li, L. Complementarity for Nitrogen Use in Maize/Faba Bean Intercropping with Inoculation. Plant Soil 2025, 506, 343–357. [Google Scholar] [CrossRef] [Scilit]
- Rodriguez, C.; Carlsson, G.; Englund, J.-E.; Flöhr, A.; Pelzer, E.; Jeuffroy, M.-H.; Makowski, D.; Jensen, E.S. Grain Legume-Cereal Intercropping Enhances the Use of Soil-Derived and Biologically Fixed Nitrogen in Temperate Agroecosystems. A Meta-Analysis. Eur. J. Agron. 2020, 118, 126077. [Google Scholar] [CrossRef] [Scilit]
- Samarappuli, D.; Berti, M.T. Intercropping Forage Sorghum with Maize Is a Promising Alternative to Maize Silage for Biogas Production. J. Clean. Prod. 2018, 194, 515–524. [Google Scholar] [CrossRef] [Scilit]
- Armas, C.; Ordiales, R.; Pugnaire, F.I. Measuring Plant Interactions: A New Comparative Index. Ecology 2004, 85, 2682–2686. [Google Scholar] [CrossRef] [Scilit]
- Gong, X.; Ferdinand, U.; Dang, K.; Li, J.; Chen, G.; Luo, Y.; Yang, P.; Feng, B. Boosting Proso Millet Yield by Altering Canopy Light Distribution in Proso Millet/Mung Bean Intercropping Systems. Crop J. 2020, 8, 365–377. [Google Scholar] [CrossRef] [Scilit]
- Couso, L.L.; Biganzoli, F.; Fernández, R.J. Field Competitive Equivalence between Grasses Differing in Drought Tolerance in a Patagonian Semiarid Steppe. J. Arid. Environ. 2014, 102, 21–26. [Google Scholar] [CrossRef] [Scilit]
- Lithourgidis, A.S.; Dordas, C.A.; Damalas, C.A.; Vlachostergios, D.N. Annual Intercrops: An Alternative Pathway for Sustainable Agriculture. Aust. J. Crop Sci. 2011, 5, 396–410. [Google Scholar]
- Dhima, K.V.; Lithourgidis, A.S.; Vasilakoglou, I.B.; Dordas, C.A. Competition Indices of Common Vetch and Cereal Intercrops in Two Seeding Ratio. Field Crops Res. 2007, 100, 249–256. [Google Scholar] [CrossRef] [Scilit]
- Willey, R.W.; Rao, M.R. A Competitive Ratio for Quantifying Competition Between Intercrops. Ex. Agric. 1980, 16, 117–125. [Google Scholar] [CrossRef] [Scilit]
- Mitra, B.; Singha, P.; Roy Chowdhury, A.; Sinha, A.K.; Skalicky, M.; Brestic, M.; Alamri, S.; Hossain, A. Normalized Difference Vegetation Index Sensor-Based Nitrogen Management in Bread Wheat (Triticum aestivum L.): Nutrient Uptake, Use Efficiency, and Partial Nutrient Balance. Front. Plant Sci. 2023, 14, 1153500. [Google Scholar] [CrossRef] [Scilit] [PubMed]
- Liu, B.; Zhang, J.; Shu, C.; Cheng, Q.; Chen, Q.; Xie, H.; Shi, Y.; Tie, X.; Wang, J.; Liu, N.; et al. Coupling of Straw Returning and Nitrogen-Water Integration on Rice Nitrogen Recovery and Soil Carbon Pool. J. Agric. Food Res. 2025, 22, 102150. [Google Scholar] [CrossRef] [Scilit]
- Lu, R. Methods of Soil and Ahricutural Chemistry Analysis; China Agricultural Science and Technology Press: Beijing, China, 1999. [Google Scholar]
- Willey, R.W. Intercropping—Its Importance and Research Needs. Part 1. Competition and Yield Advantages. Field Crop Abstr. 1979, 32, 1–10. [Google Scholar]
- Wiley, R. The Ecology of Intercropping. By J. H. Vandermeer. Cambridge: Cambridge University Press (1989), Pp. 237, £30.00. Ex. Agric. 1990, 26, 366. [Google Scholar] [CrossRef] [Scilit] [PubMed]
- Brooker, R.W.; Bennett, A.E.; Cong, W.; Daniell, T.J.; George, T.S.; Hallett, P.D.; Hawes, C.; Iannetta, P.P.M.; Jones, H.G.; Karley, A.J.; et al. Improving Intercropping: A Synthesis of Research in Agronomy, Plant Physiology and Ecology. New Phytol. 2015, 206, 107–117. [Google Scholar] [CrossRef] [Scilit] [PubMed]
- Zhang, L.J.; Xie, K.Y.; Yan, A.; Wang, L.; Cui, H.T.; Zhu, Z. Research on the Production Performance of Intercropping Systems of Silage Corn and Sweet Sorghum/Grain Corn. Acta Agrest. Sin. 2026, 34, 1942–1952. [Google Scholar]
- Yu, Y.; Stomph, T.-J.; Makowski, D.; Van Der Werf, W. Temporal Niche Differentiation Increases the Land Equivalent Ratio of Annual Intercrops: A Meta-Analysis. Field Crops Res. 2015, 184, 133–144. [Google Scholar] [CrossRef] [Scilit]
- Maitra, S.; Hossain, A.; Brestic, M.; Skalicky, M.; Ondrisik, P.; Gitari, H.; Brahmachari, K.; Shankar, T.; Bhadra, P.; Palai, J.B.; et al. Intercropping—A Low Input Agricultural Strategy for Food and Environmental Security. Agronomy 2021, 11, 343. [Google Scholar] [CrossRef] [Scilit]
- Qiu, Y.; Wang, Z.; Sun, D.; Lei, Y.; Li, Z.; Zheng, Y. Advances in Water and Nitrogen Management for Intercropping Systems: Crop Growth and Soil Environment. Agronomy 2025, 15, 2000. [Google Scholar] [CrossRef] [Scilit]
- Demie, D.T.; Stomph, T.J.; Döring, T.F.; Krauss, G.; Gaiser, T.; Ewert, F.; Hernández-Ochoa, I.M.; Van Der Werf, W.; Seidel, S.J. Moderate Gains in Total Yield but Large Shifts in Yield Partitioning Due to Trait Variations in a Cereal/Legume Intercropping System: A Modelling Approach. Field Crops Res. 2026, 346, 110580. [Google Scholar] [CrossRef] [Scilit]
- Zhang, H.; Shi, W.; Ali, S.; Chang, S.; Jia, Q.; Hou, F. Legume/Maize Intercropping and N Application for Improved Yield, Quality, Water and N Utilization for Forage Production. Agronomy 2022, 12, 1777. [Google Scholar] [CrossRef] [Scilit]
- Nasar, J.; Zhao, C.J.; Khan, R.; Gul, H.; Gitari, H.; Shao, Z.; Abbas, G.; Haider, I.; Iqbal, Z.; Ahmed, W.; et al. Maize-Soybean Intercropping at Optimal N Fertilization Increases the N Uptake, N Yield and N Use Efficiency of Maize Crop by Regulating the N Assimilatory Enzymes. Front. Plant Sci. 2023, 13, 1077948. [Google Scholar] [CrossRef] [Scilit] [PubMed]
- Zhang, X.; Davidson, E.A.; Mauzerall, D.L.; Searchinger, T.D.; Dumas, P.; Shen, Y. Managing Nitrogen for Sustainable Development. Nature 2015, 528, 51–59. [Google Scholar] [CrossRef] [Scilit] [PubMed]
- Ladha, J.K.; Tirol-Padre, A.; Reddy, C.K.; Cassman, K.G.; Verma, S.; Powlson, D.S.; Van Kessel, C.; De B. Richter, D.; Chakraborty, D.; Pathak, H. Global Nitrogen Budgets in Cereals: A 50-Year Assessment for Maize, Rice and Wheat Production Systems. Sci. Rep. 2016, 6, 19355. [Google Scholar] [CrossRef] [Scilit] [PubMed]
- Peoples, M.B.; Herridge, D.F.; Ladha, J.K. Biological Nitrogen Fixation: An Efficient Source of Nitrogen for Sustainable Agricultural Production? Plant Soil 1995, 174, 3–28. [Google Scholar] [CrossRef] [Scilit]
- Hauggaard-Nielsen, H.; Gooding, M.; Ambus, P.; Corre-Hellou, G.; Crozat, Y.; Dahlmann, C.; Dibet, A.; Von Fragstein, P.; Pristeri, A.; Monti, M.; et al. Pea–Barley Intercropping for Efficient Symbiotic N2-Fixation, Soil N Acquisition and Use of Other Nutrients in European Organic Cropping Systems. Field Crops Res. 2009, 113, 64–71. [Google Scholar] [CrossRef] [Scilit]
- Bo, Y.; Xing, Y.; Liu, C.; Shi, X.; Liu, C.; Zhou, Y. Unveiling Drivers and Optimizing Strategies for Enhanced Land and Nitrogen Fertilizer Use Efficiency of Sorghum Intercropping: A Meta-Analysis. Field Crops Res. 2025, 332, 110033. [Google Scholar] [CrossRef] [Scilit]
- Quemada, M.; Baranski, M.; Nobel-de Lange, M.N.J.; Vallejo, A.; Cooper, J.M. Meta-Analysis of Strategies to Control Nitrate Leaching in Irrigated Agricultural Systems and Their Effects on Crop Yield. Agric. Ecosyst. Environ. 2013, 174, 1–10. [Google Scholar] [CrossRef] [Scilit]
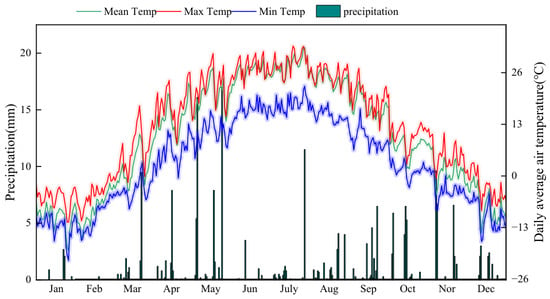
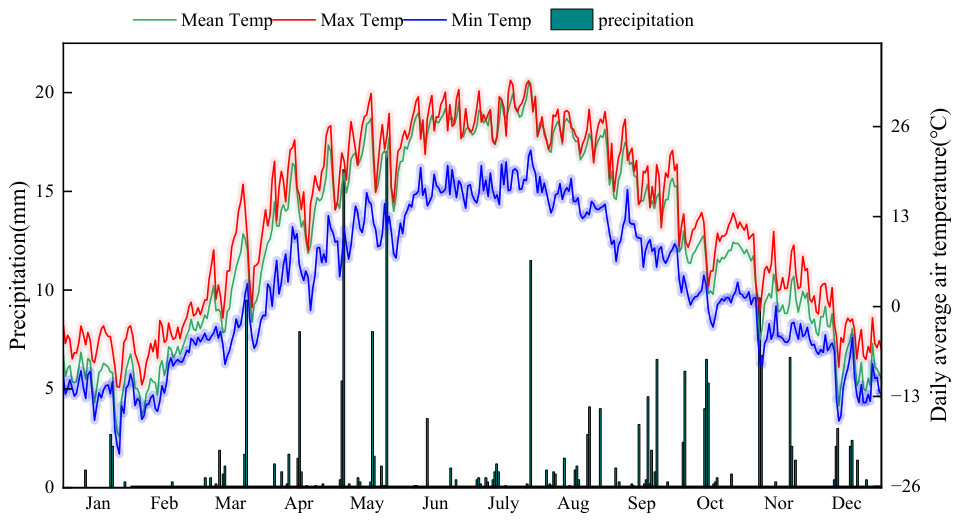
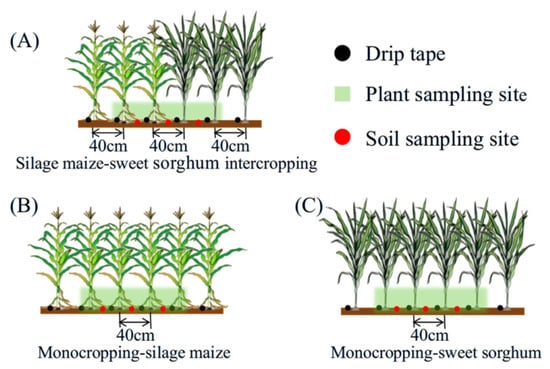
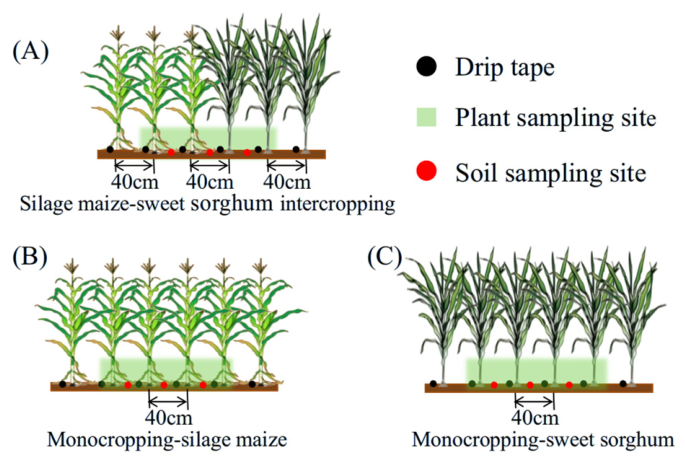
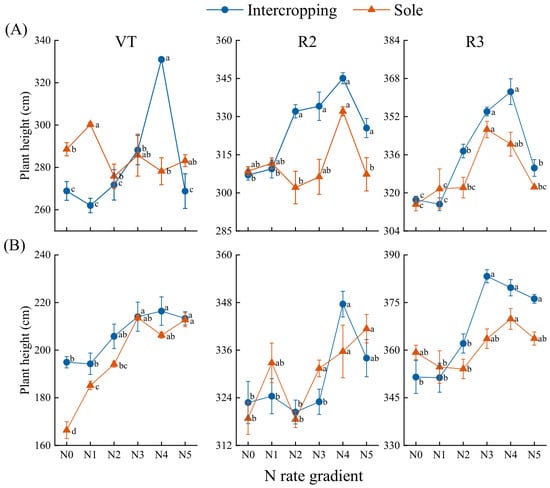
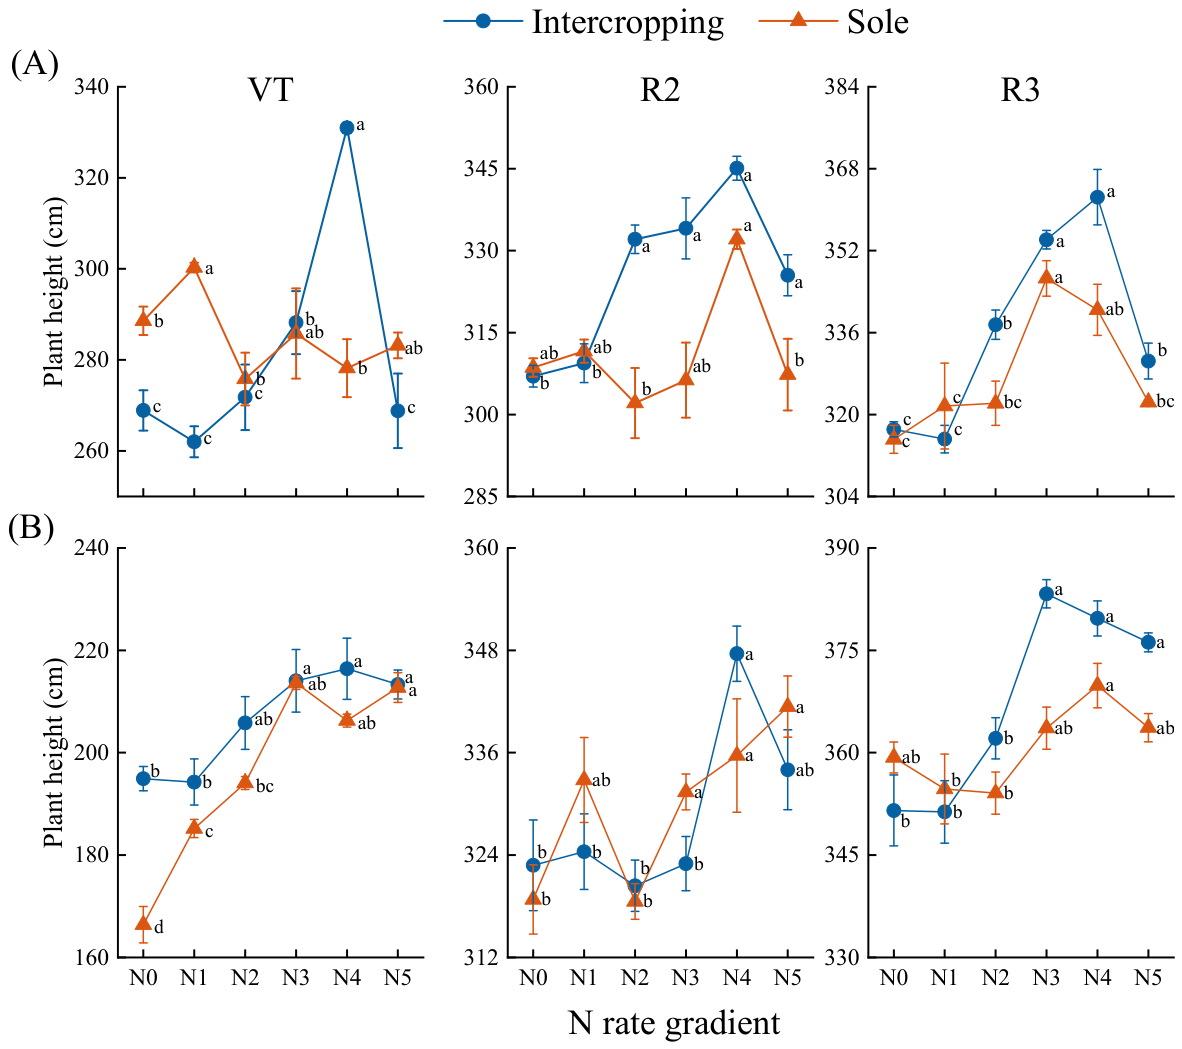
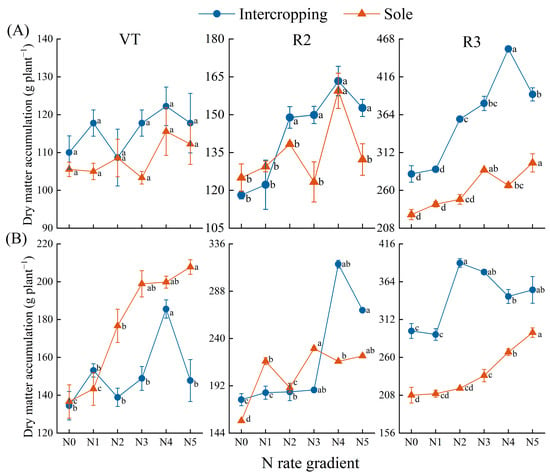
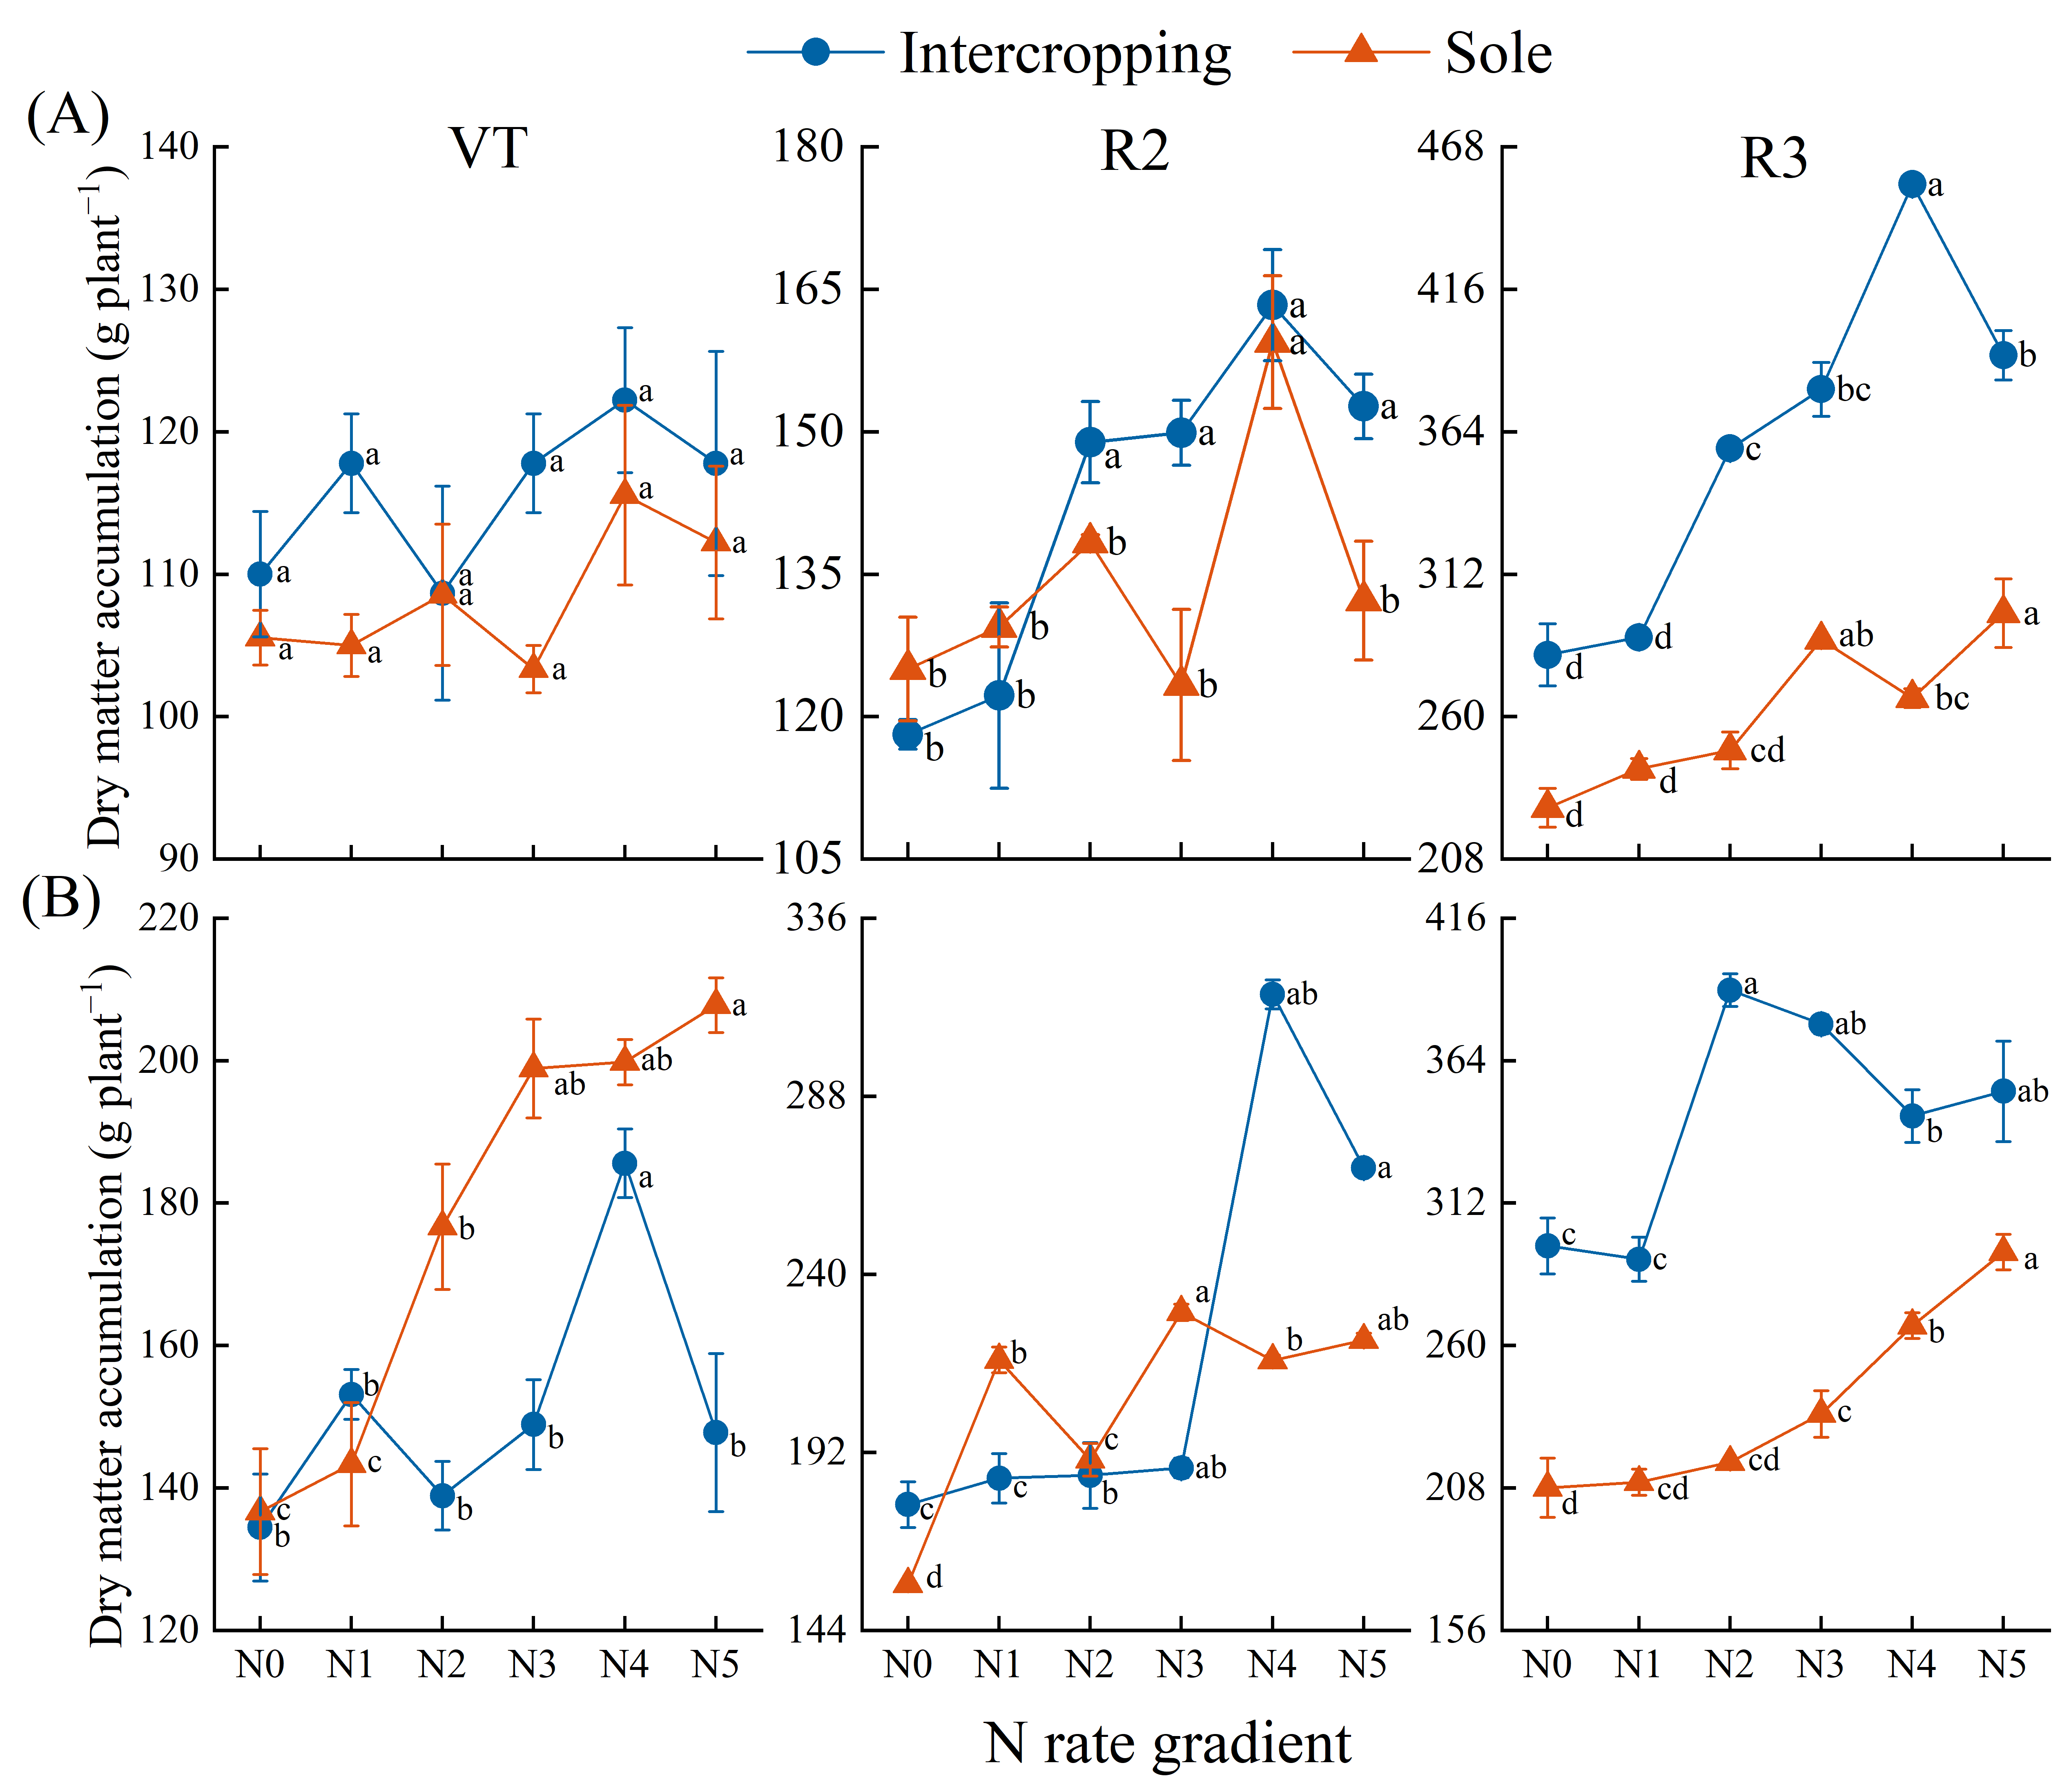
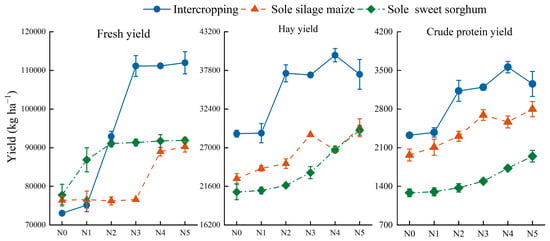
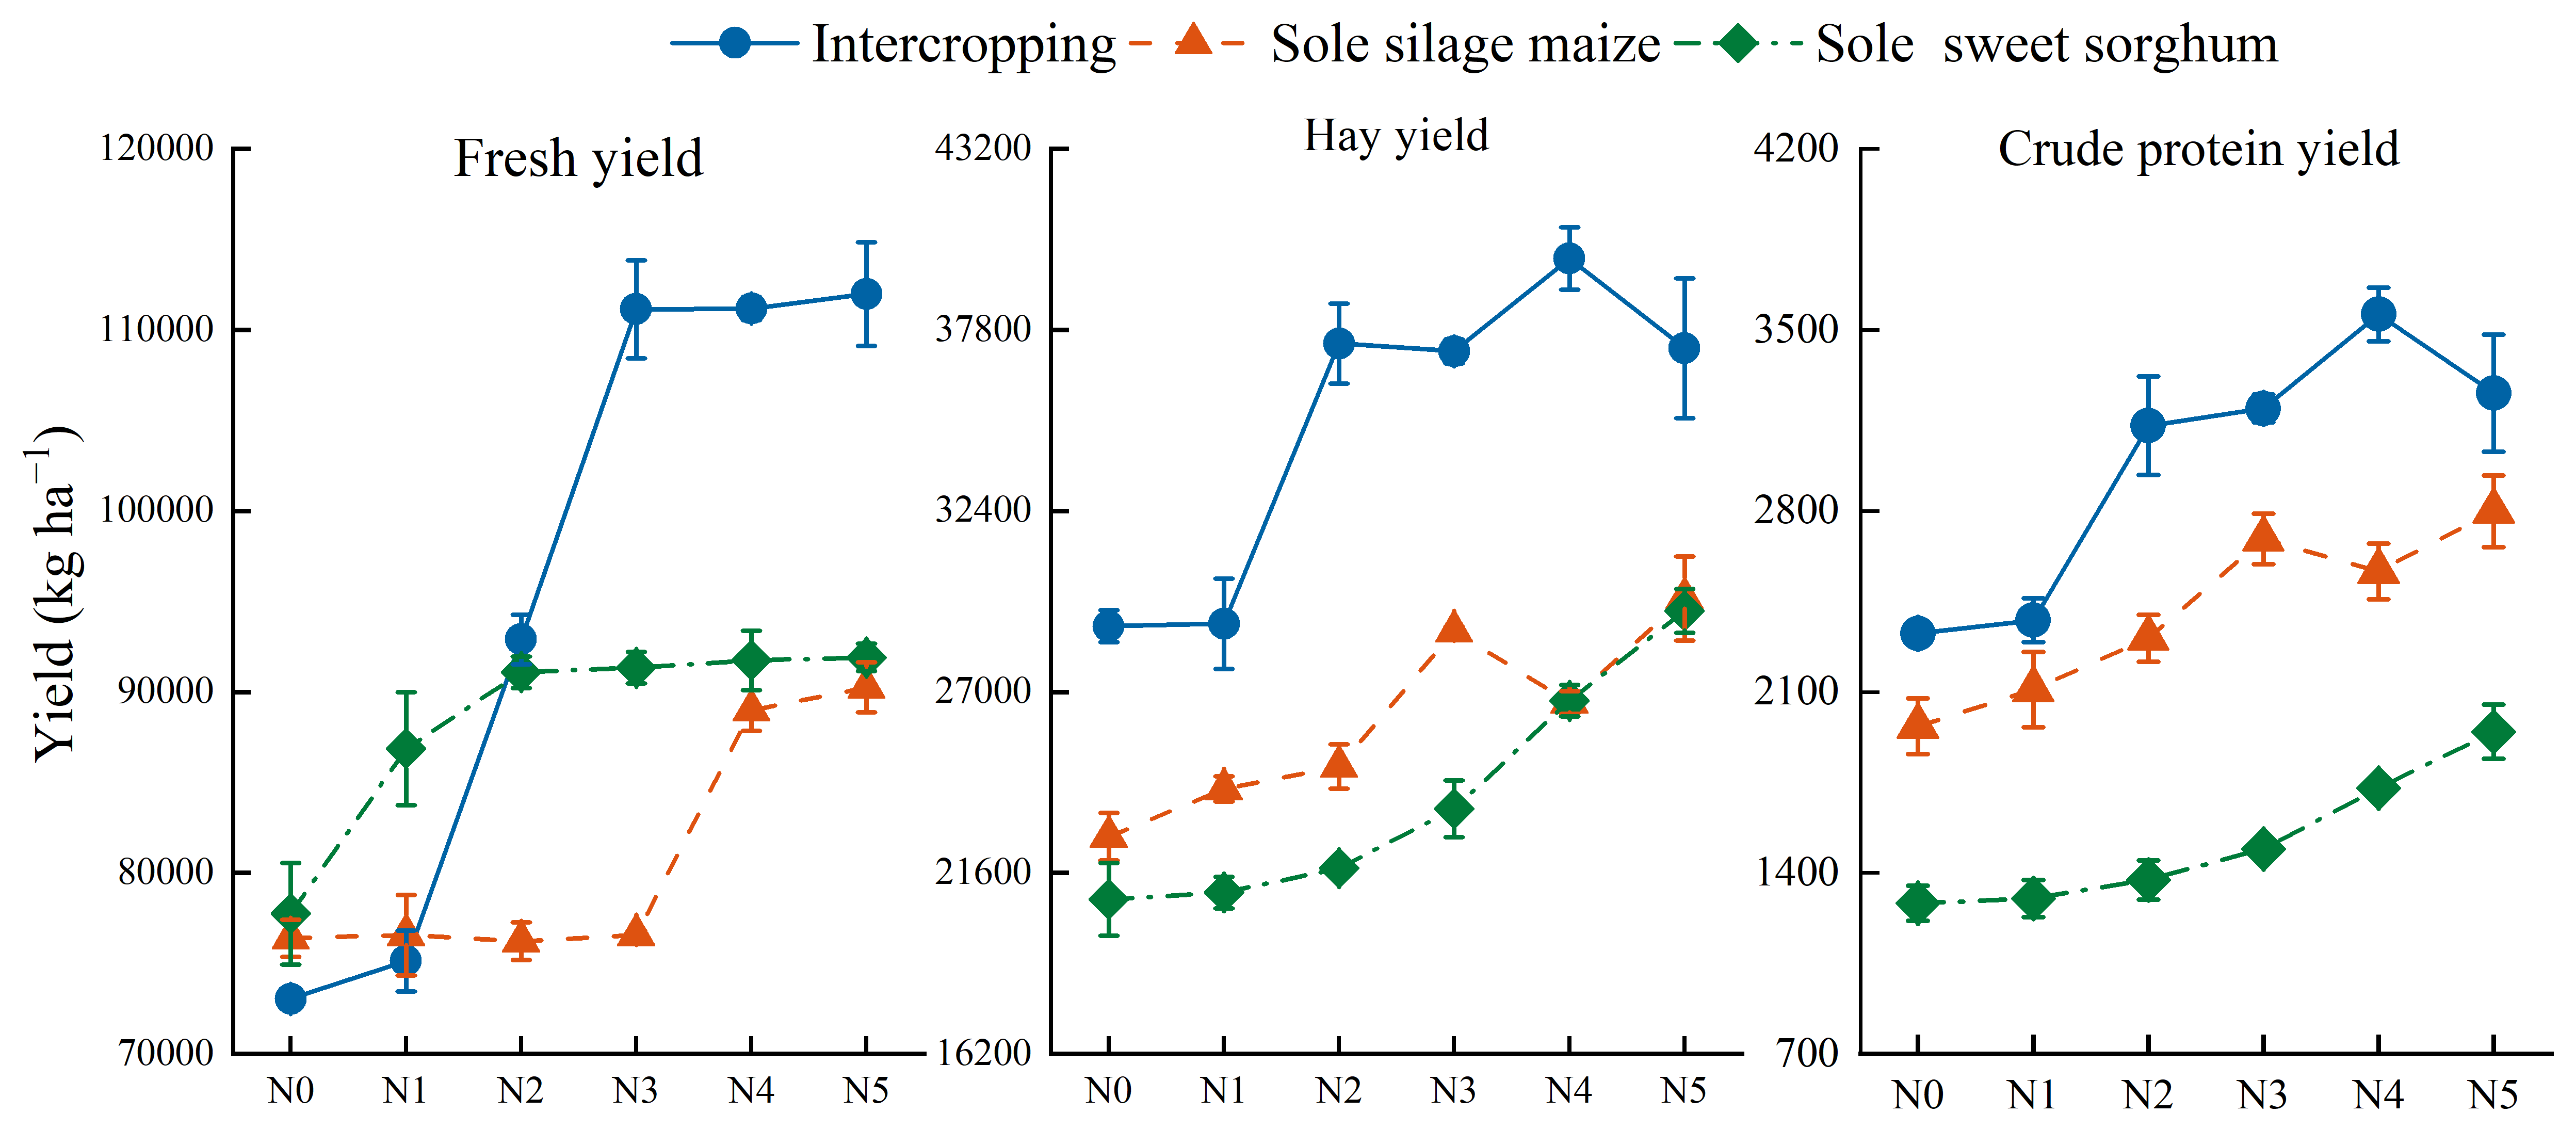
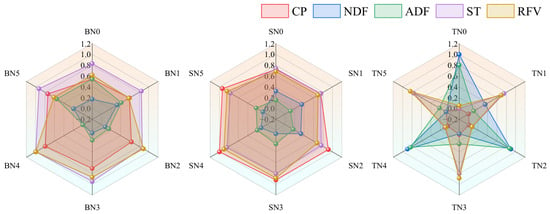
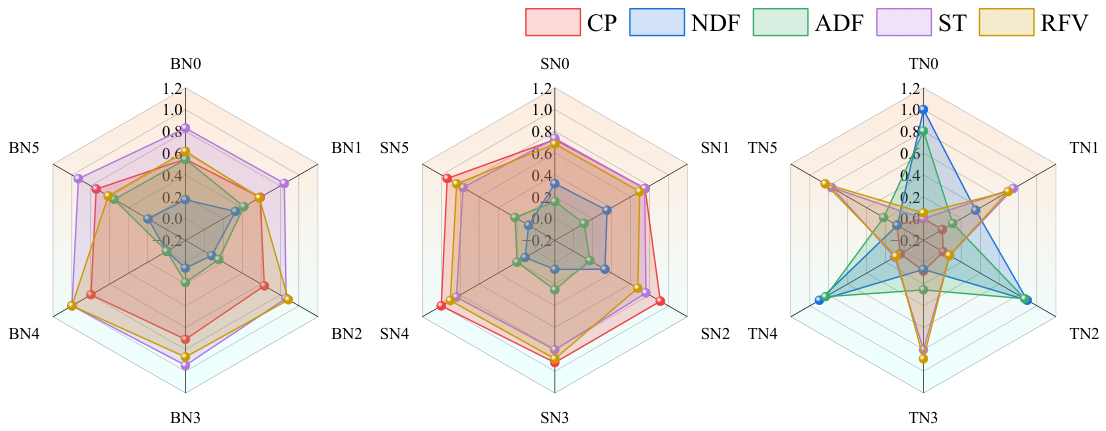
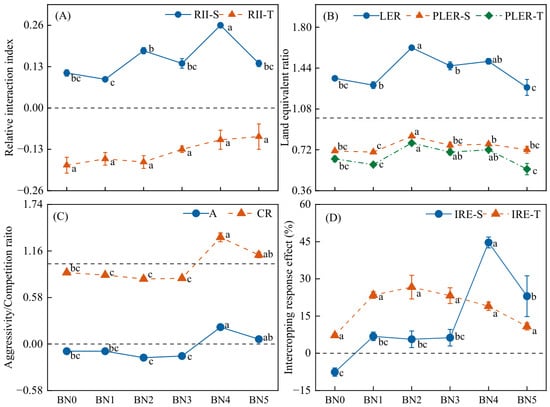
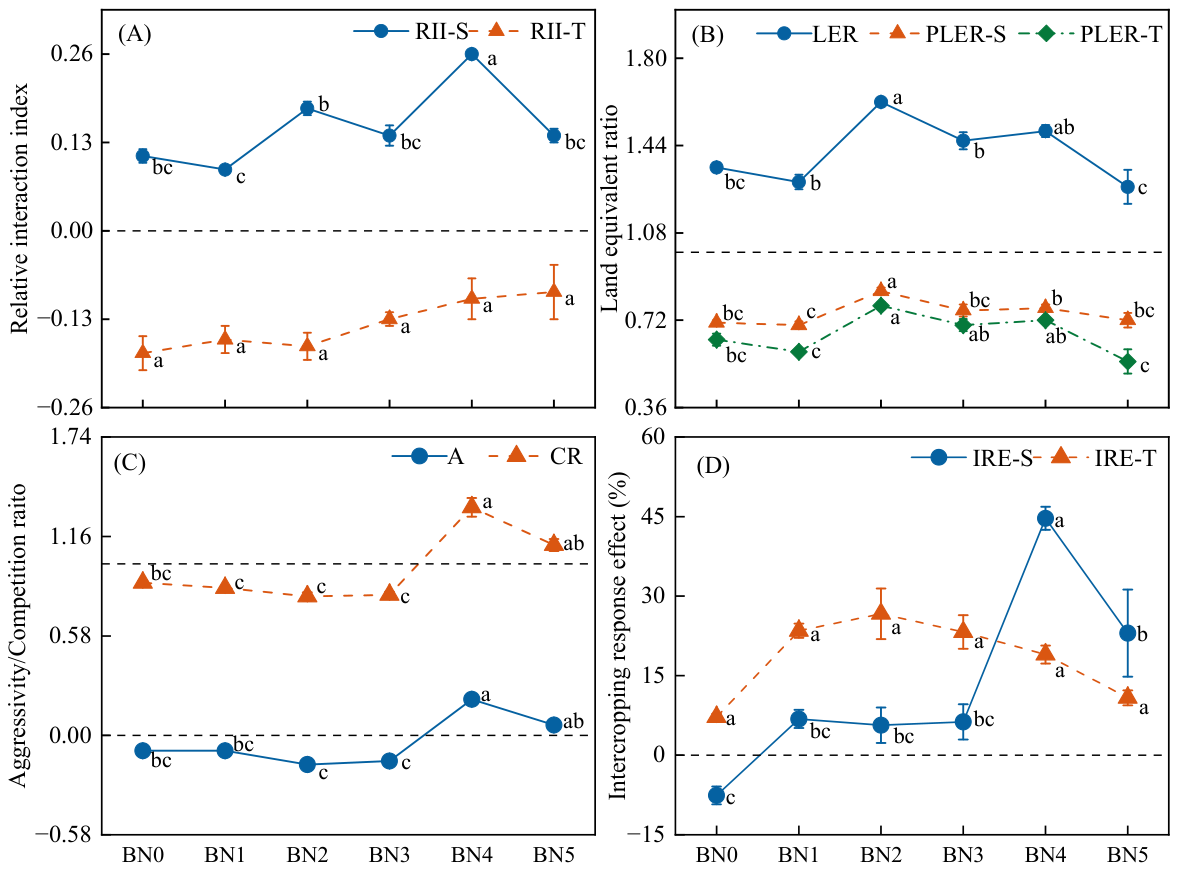
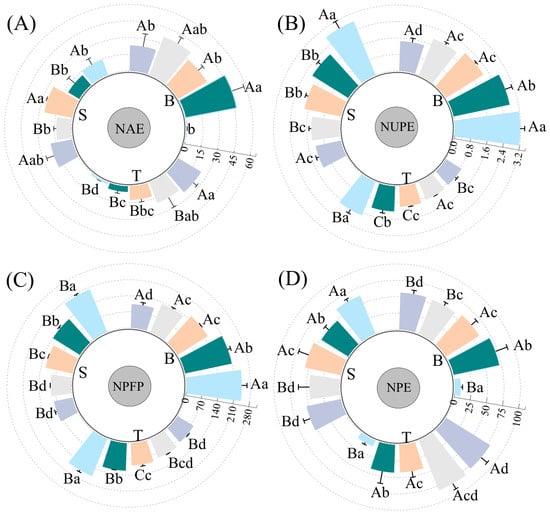
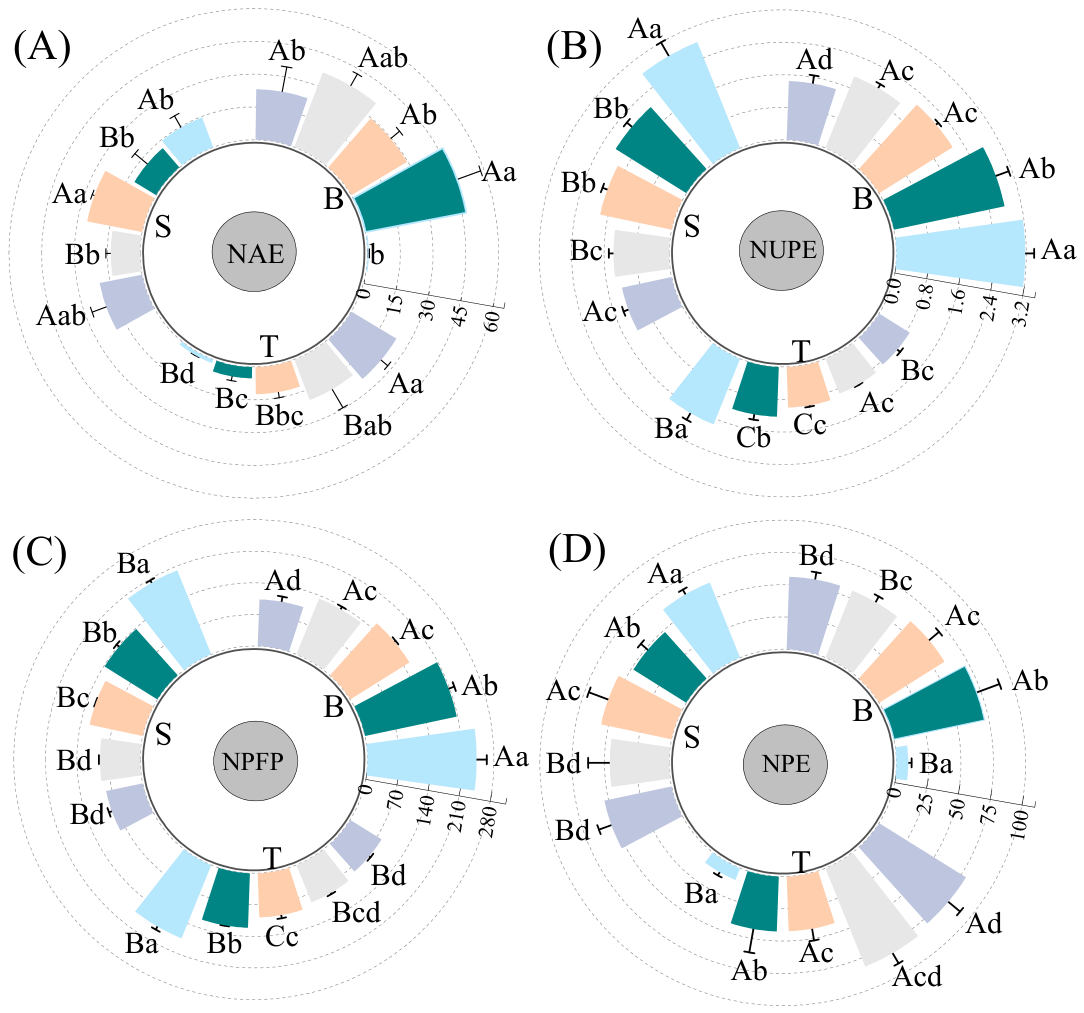
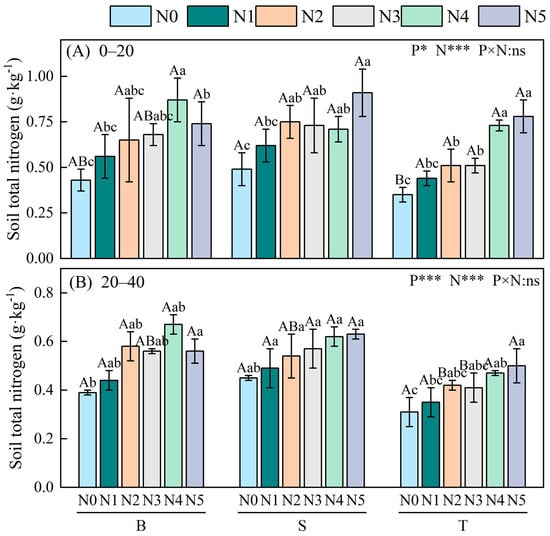
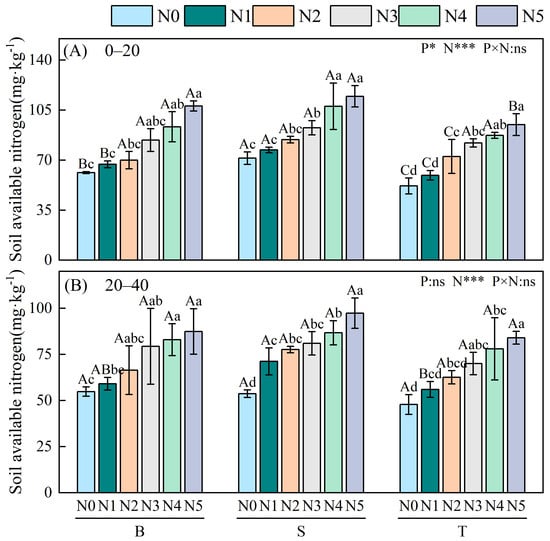
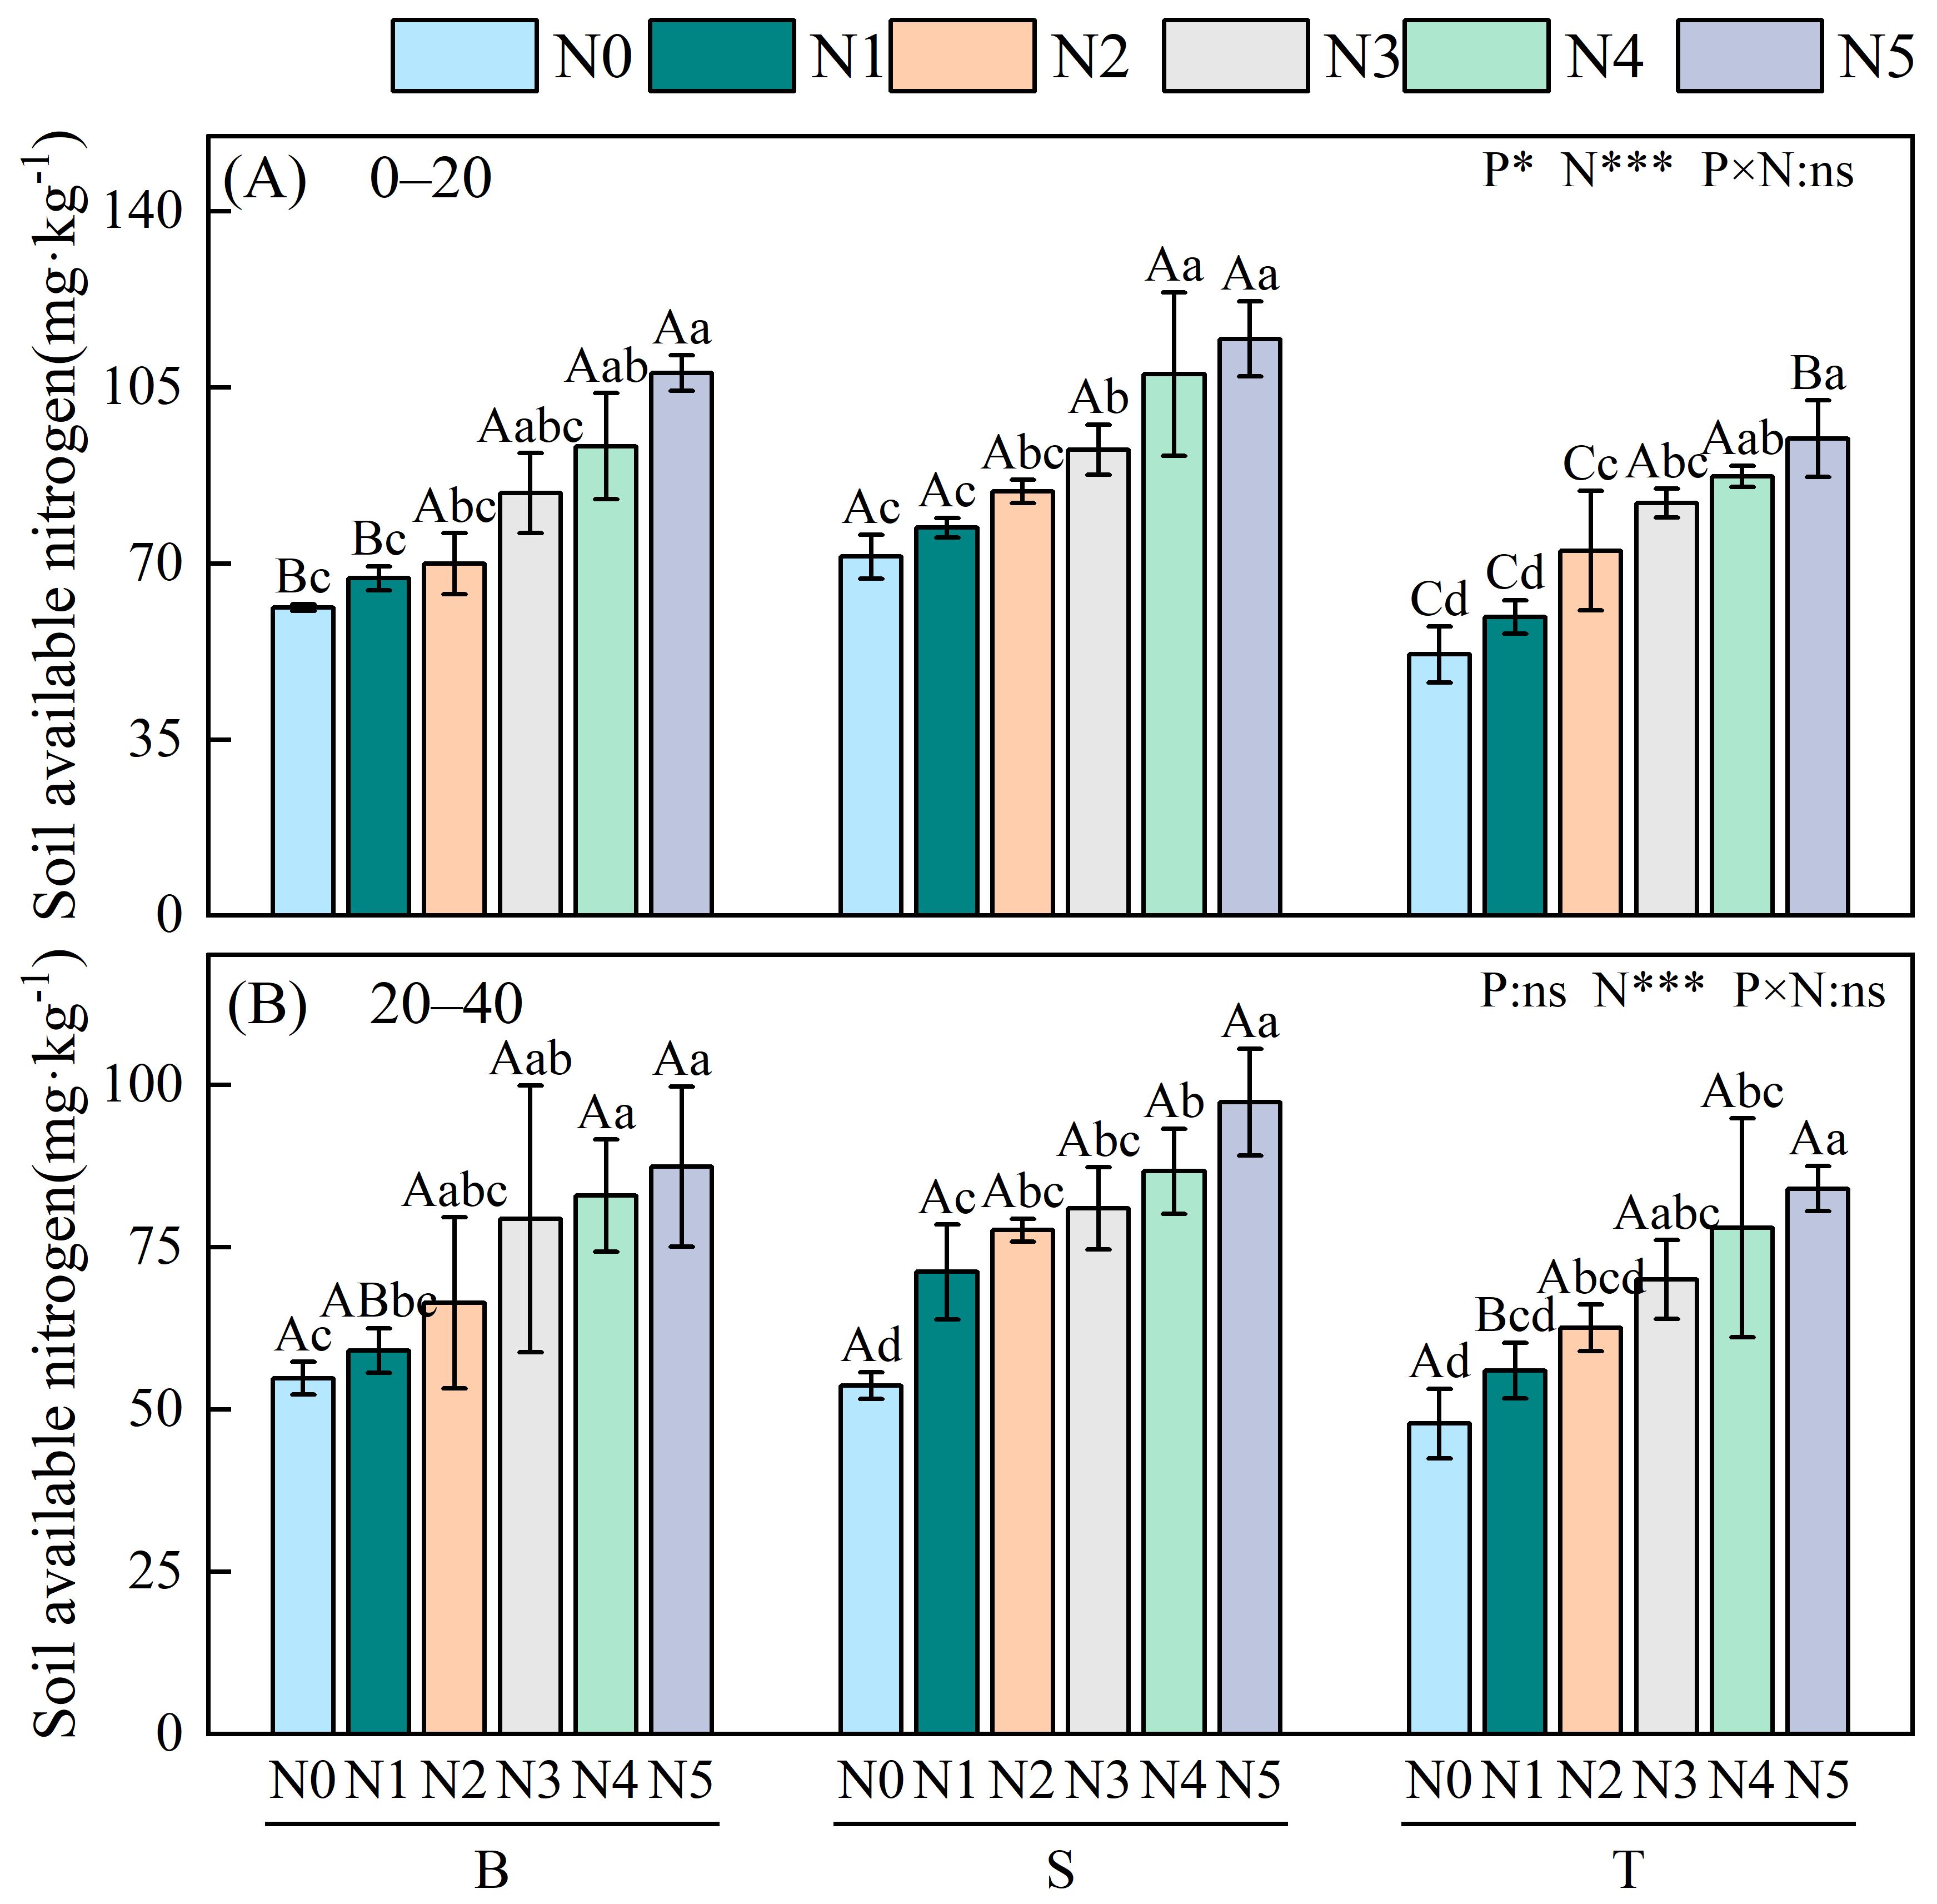
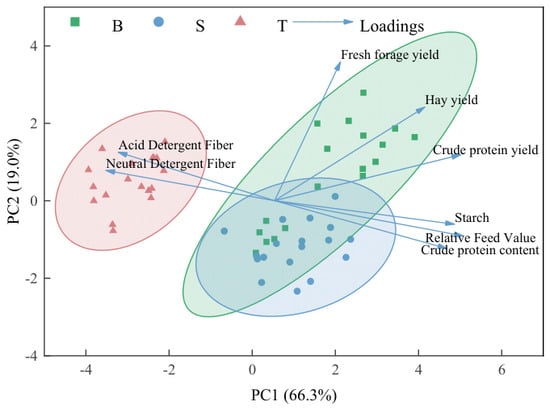
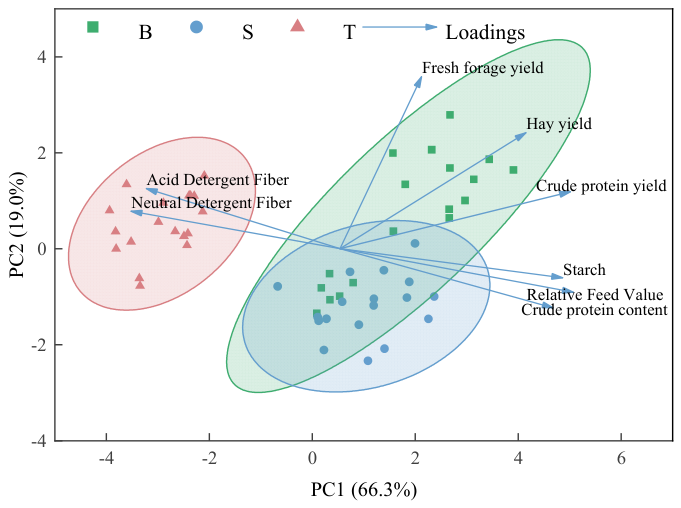

Disclaimer/Publisher’s Note: The statements, opinions and data contained in all publications are solely those of the individual author(s) and contributor(s) and not of MDPI and/or the editor(s). MDPI and/or the editor(s) disclaim responsibility for any injury to people or property resulting from any ideas, methods, instructions or products referred to in the content. |
© 2026 by the authors. Licensee MDPI, Basel, Switzerland. This article is an open access article distributed under the terms and conditions of the Creative Commons Attribution (CC BY) license.