


Abstract
Maize (Zea mays L.) is the dominant cereal of continental Hungary, yet the Pannonian belt lost one-third of its planted area over the last decade (1150 kha to 770 kha in 2025). This study quantified how supplemental irrigation and biostimulants affect maize transpiration. Fourteen Dynamax Flow32-1K stem-heat-balance sensors recorded sap flow at 15 min resolution on the Sushi FAO 340 hybrid across seven irrigated–rainfed plot pairs at Karcag, Hungary. Measurements spanned a dry 2024 season (irrigation: 253 mm; precipitation: 7.9 mm; VPDmax: 1.71 kPa) and a wetter 2025 season (120 mm irrigation; 62.9 mm precipitation; mean VPDmax: 1.33 kPa). A Control-only mixed-effects model returned a year × irrigation interaction F(1, 84) = 106 (p < 10−15): irrigation raised transpiration by 77% in 2024 and lowered it by 12% in 2025. The VPDmax–transpiration coupling was inverted in 2024, the field signature of stomatal closure under soil-water limitation. The irrigated Big Compost plot reached a grain-based WUE of 97.5 kg mm−1 versus 41.6 kg mm−1 for the matched Control. This was a 2.3-fold within-2025 separation at similar per-plant transpiration. The irrigation response differed sharply between seasons. However, the amendment classes were tested in different years, and the irrigation dose differed between seasons (253 mm in 2024 versus 120 mm in 2025). The cross-class contrast is therefore exploratory, and every cross-year comparison is provisional. With one sensor per plot, the amendment ranking remains a hypothesis for a replicated, same-season, and same-dose follow-up.
1. Introduction
Maize (Zea mays L.) is among the most water-demanding crops of the temperate continental belt, with transpiration accounting for 60–90% of field-level evapotranspiration during the mid-to-late growing season [1]. Heat and drought stress around silking is the single largest yield risk in continental climates. Even brief windows of high temperature and water deficit at the jointing-to-silking stage suppress photosynthesis, accelerate senescence, and depress grain set [2]. The Pannonian Basin is a sub-continental analogue for the warming-and-drying trajectory projected over temperate cereal belts. Here, summer precipitation has become increasingly unreliable while irrigation capacity remains limited. Water-use efficiency (WUE) is therefore the central agronomic lever for maintaining sustainable production [3].
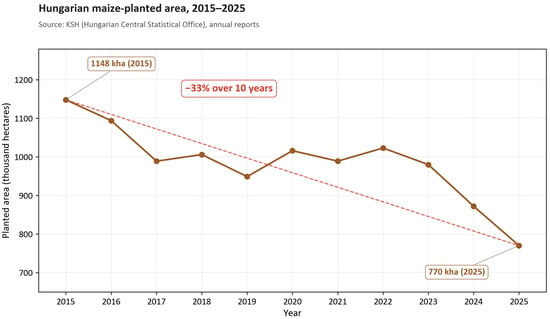
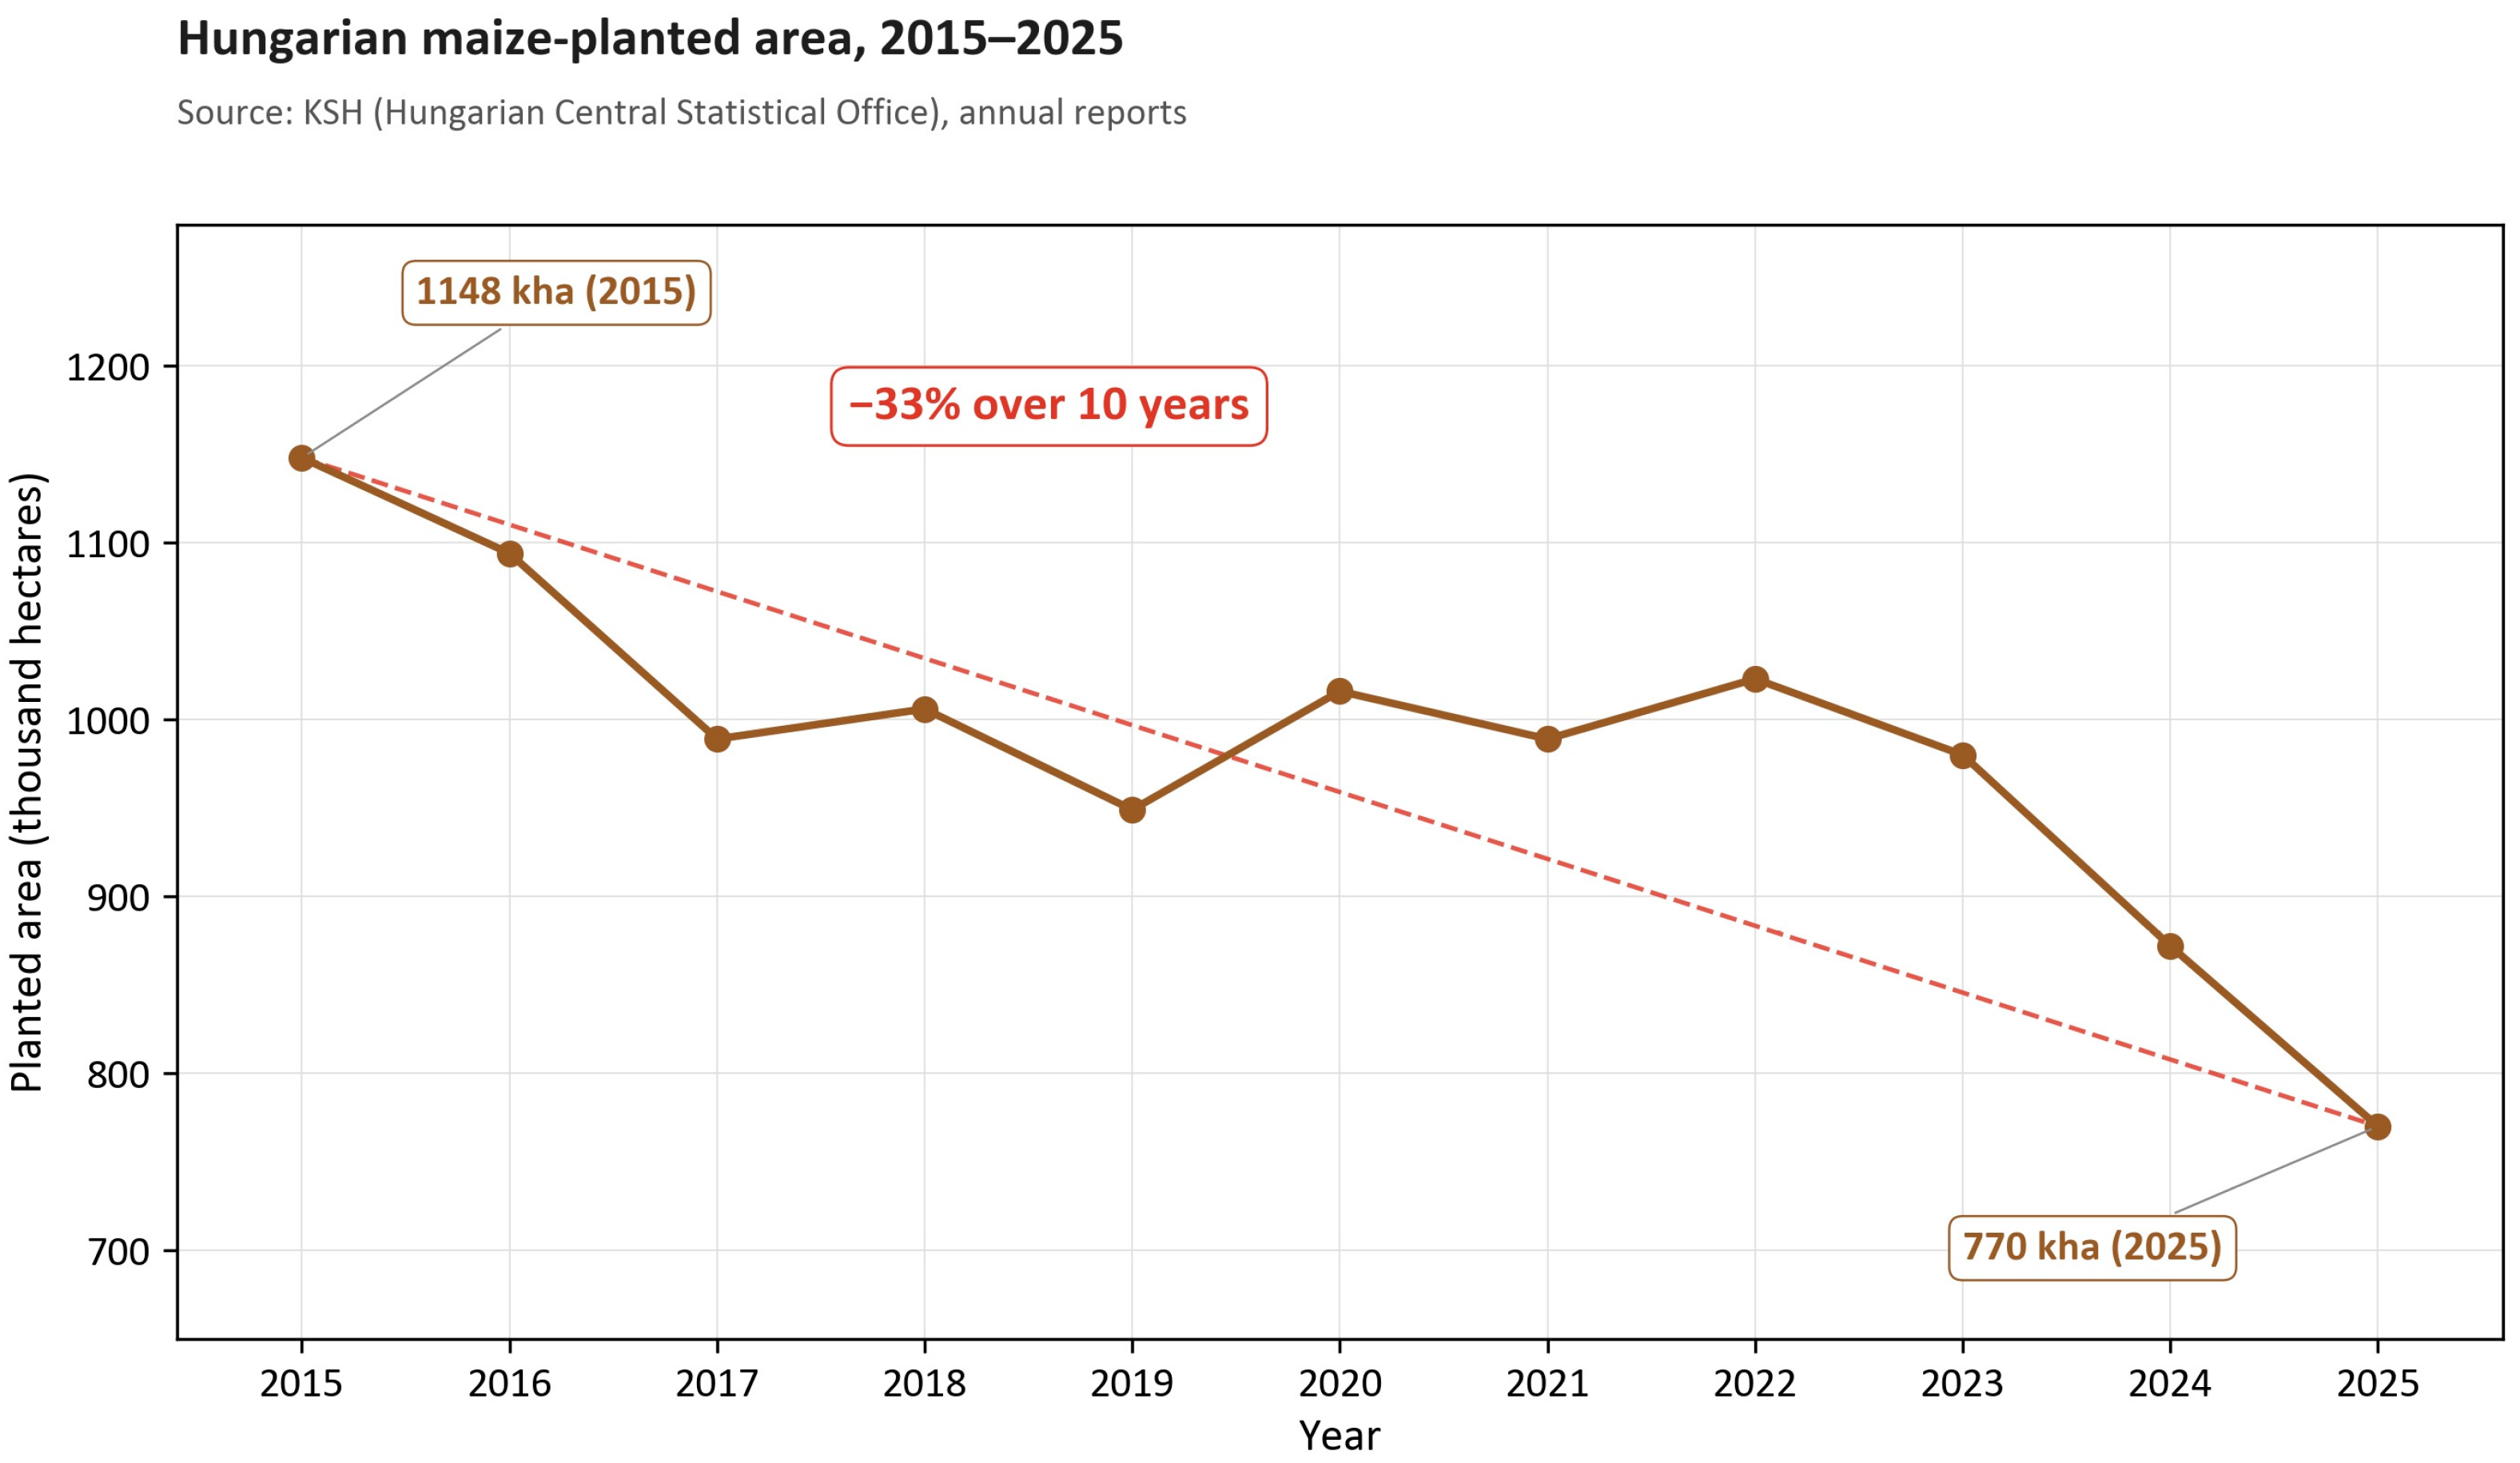
The scale of the problem is visible in national statistics. The Hungarian maize-planted area shrank from approximately 1150 kha a decade ago to 770 kha in 2025—the lowest value on the hundred-year KSH (Hungarian Central Statistical Office) record and a 33% contraction in ten years (Figure 1; [4]). On the 50-year national maize series, Huzsvai et al. [5] showed that variety renewal and agronomic intensification only partly offset the climate signal, and that residual year-to-year yield variability did not decline. In a subsequent analysis of long-term temporal patterns, Huzsvai et al. [6] projected that the future probability of yield failure on the Hungarian Great Plain will rise further under continued warming and drying. The Karcag station record corroborates this shift at the sub-regional scale: Zsembeli et al. [7] documented rising mean annual temperature and increasingly uneven warm-season precipitation distribution at the trial site. Identifying effective, field-scalable water-saving measures is therefore both locally and globally relevant. The Pannonian Basin serves as a working laboratory for the warming-and-drying conditions now emerging across the Mediterranean–continental transition zone of Europe. The same conditions are modelled for the maize belts of North America and East Asia.
Figure 1.
Hungarian maize-planted area, 2015–2025. Source: KSH (Hungarian Central Statistical Office) annual reports on the planted area of major crops. The 2025 reading of 770 kha is the lowest value on the hundred-year KSH record, representing a 33% contraction relative to the 2015 area of 1148 kha. The shrinking national area places irrigation- and biostimulant-driven plant-level transpiration preservation at the centre of the agronomic policy agenda.
Two main adaptation tracks have received the most attention in the recent agronomic literature. The first is precision irrigation and fertiliser scheduling: modelling and field-trial evidence in semi-arid maize systems consistently demonstrates that the same total input of water and nutrients can yield very different biomass returns depending on timing, frequency, and antecedent soil-water status [8,9]. The second track uses soil amendments and biostimulants to modify the plant–soil–atmosphere water balance without enlarging the irrigation budget. Composts can raise soil aggregate stability, organic matter content, and plant-available water capacity [10]. Microbial inoculants can modify stomatal conductance, root architecture, and drought-tolerance traits [11,12,13]. Field evidence from the same continental climate confirms that endophytic Trichoderma foliar biostimulants can raise maize drought resilience under Hungarian open-field conditions [14]. Bulgari et al. [15] and Rouphael and Colla [16] reviewed the main biostimulant classes and their proposed mechanisms. These classes include protein hydrolysates, humic substances, seaweed extracts, and microbial inoculants. The present study examines their hypothesised field-scale transpiration response, which has rarely been measured directly. However, the reported effects of microbial biostimulants remain strongly dose-, genotype- and environment-dependent. Responses frequently vary among maize cultivars and application regimes. Positive outcomes observed under controlled pot conditions do not always translate consistently to open-field environments under variable climatic and soil conditions [17,18,19]. Beyond the physical soil response, conditioner-type biostimulants stimulate soil microbial activity and the mineralisation pathways supporting nutrient uptake, thus aligning this management track with the European Green Deal Farm-to-Fork targets of a 20% reduction in synthetic fertiliser use by 2030. Crucially, most published evidence on these treatments relies on soil-water-balance or yield-based proxies. These integrated measures confound transpiration, soil evaporation, and the yield-per-mm conversion. They cannot isolate the plant-level signal.
Stem-heat-balance (SHB) sap-flow sensors are uniquely suited to isolate that signal [20,21]. They deliver a continuous proxy of whole-plant transpiration at sub-hourly resolution and have been applied in maize for sensor calibration [20], meteorological-driver attribution [22], cover-crop interactions [23], plastic-mulch responses [24], and evapotranspiration partitioning [1,25,26]. A recent heat-pulse implementation has further refined whole-plant maize transpiration measurement and cross-checked SHB-type gauges under field irrigation [27]. The literature converges on three properties: maize sap flow is driven primarily by solar radiation and atmospheric vapour-pressure deficit (VPD), it follows a diurnal curve peaking near solar noon, and it is suppressed by drought stress in a dose-dependent manner [22,28]. Recent satellite-based attribution work [29] further isolated the heat-stress component of the irrigation benefit, showing that supplemental water both relieves stomatal limitation and cools the canopy through enhanced transpiration. The Debrecen group has developed a parallel precision-irrigation track for the same maize hybrid family. Magyar et al. [30] calibrated a HYDRUS-based soil-moisture model against field maize data. Nagy et al. [31] translated this approach into a satellite-derived crop-coefficient product that closes the canopy-level ET budget. The present sap-flow record is designed to anchor the plant-level transpiration term directly within that modelling framework, rather than reconstructing it from a soil-water balance closure.
A complementary physiological thread links transpiration dynamics to embolism formation in maize stems during peak demand and partial overnight refilling [32]. Soil amendments that improve root-zone water delivery should not only raise daytime sap flow but also reduce the embolism-driven mid-afternoon depression and increase the night-time baseline—predictions testable with the same sap-flow record. Despite the depth of this mechanistic understanding, to our knowledge, no field study has evaluated biostimulants and compost amendments on the same continental-climate site using a direct, continuous, plant-level transpiration record across both a drought and a near-normal season. That gap constitutes the primary novelty of the present work.
The main goal of this study is to quantify how supplemental irrigation and conditioner-type biostimulants influence maize plant-level transpiration under contrasting drought and normal seasons in the Pannonian Basin. Three specific objectives were pursued:
- (1)
- Season-dependent irrigation response. Quantify the year × irrigation interaction in Control plants over the common 43-day window DOY 205–247. Test whether the irrigation benefit changes sign between the dry 2024 and wetter 2025 seasons, which differed in both climate and applied irrigation dose.
- (2)
- Treatment-level transpiration and WUE ranking. Identify exploratory differences in maize sap flow and water-use efficiency within each season. The 2024 foliar-biostimulant plots and the 2025 compost plots are reported separately against their same-year Controls. Cross-class rankings are treated only as hypotheses because the amendment class is confounded with year.
- (3)
- VPD–transpiration coupling inversion. Characterise the daily scale VPD–transpiration relationship within each season and irrigation class, testing the hypothesis that severe soil-water limitation inverts the positive VPD–transpiration coupling that operates under adequate soil water.
Together, these three objectives provide a quantitative anchor for the replicated successor trial that the single-sensor design makes necessary. They also deliver the first continuous plant-level transpiration record for maize across a dry and a near-normal season on continental chernozem.
2. Materials and Methods
2.1. Study Site
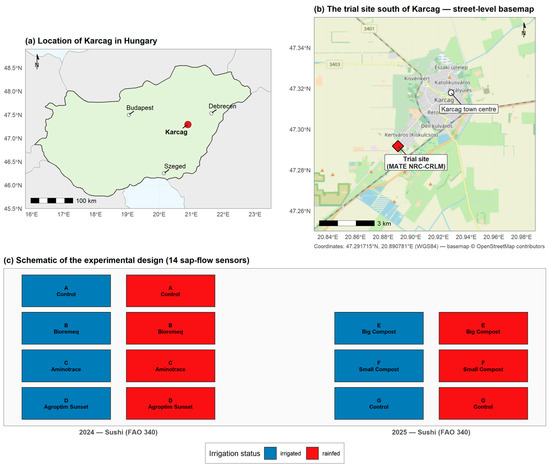
The two-year field experiment was run at the National Research Centre for Climate and Regional Land Management, the Hungarian University of Agriculture and Life Sciences. The site lies on the southern margin of Karcag in the Nagykunság sub-region of the Hungarian Great Plain (47.291715° N, 20.890781° E, 87.3 m a.s.l.; Figure 2a,b). The Trans-Tisza low-relief alluvial plain, bordered by the Tisza and Berettyó rivers, has a moderately continental climate with a long-term (1991–2020) growing-season mean of 20.6 °C and 244 mm of precipitation between May and August (HungaroMet regional norms; HABP station 55405). The Nagykunság sub-region has been classified as drought-prone in the multidecadal Pálfai Drought Index record (PaDI), with the 2022 HuClim-based PaDI placing the Great Hungarian Plain in the serious drought class [33]. The soil is a deep solonetzic meadow chernozem with a clay–loam texture in the rooting zone (Vertic Calcic Clayic Solonetz, World Reference Base). The 0–50 cm A-horizon is humus-rich (humus 3.9%) and strongly compacted (Arany plasticity index 52–55). Topsoil chemistry (0–20 cm): pH(KCl) 6.8, NO3 + NO2 37.2 mg kg−1, P2O5 709 mg kg−1, K2O 428 mg kg−1, Na 161 mg kg−1, total salt 0.12%. Soil texture and salinity were stable across both trial years. The water regime of this chernozem subtype has been characterised by Hernádi et al. [34].
Figure 2.
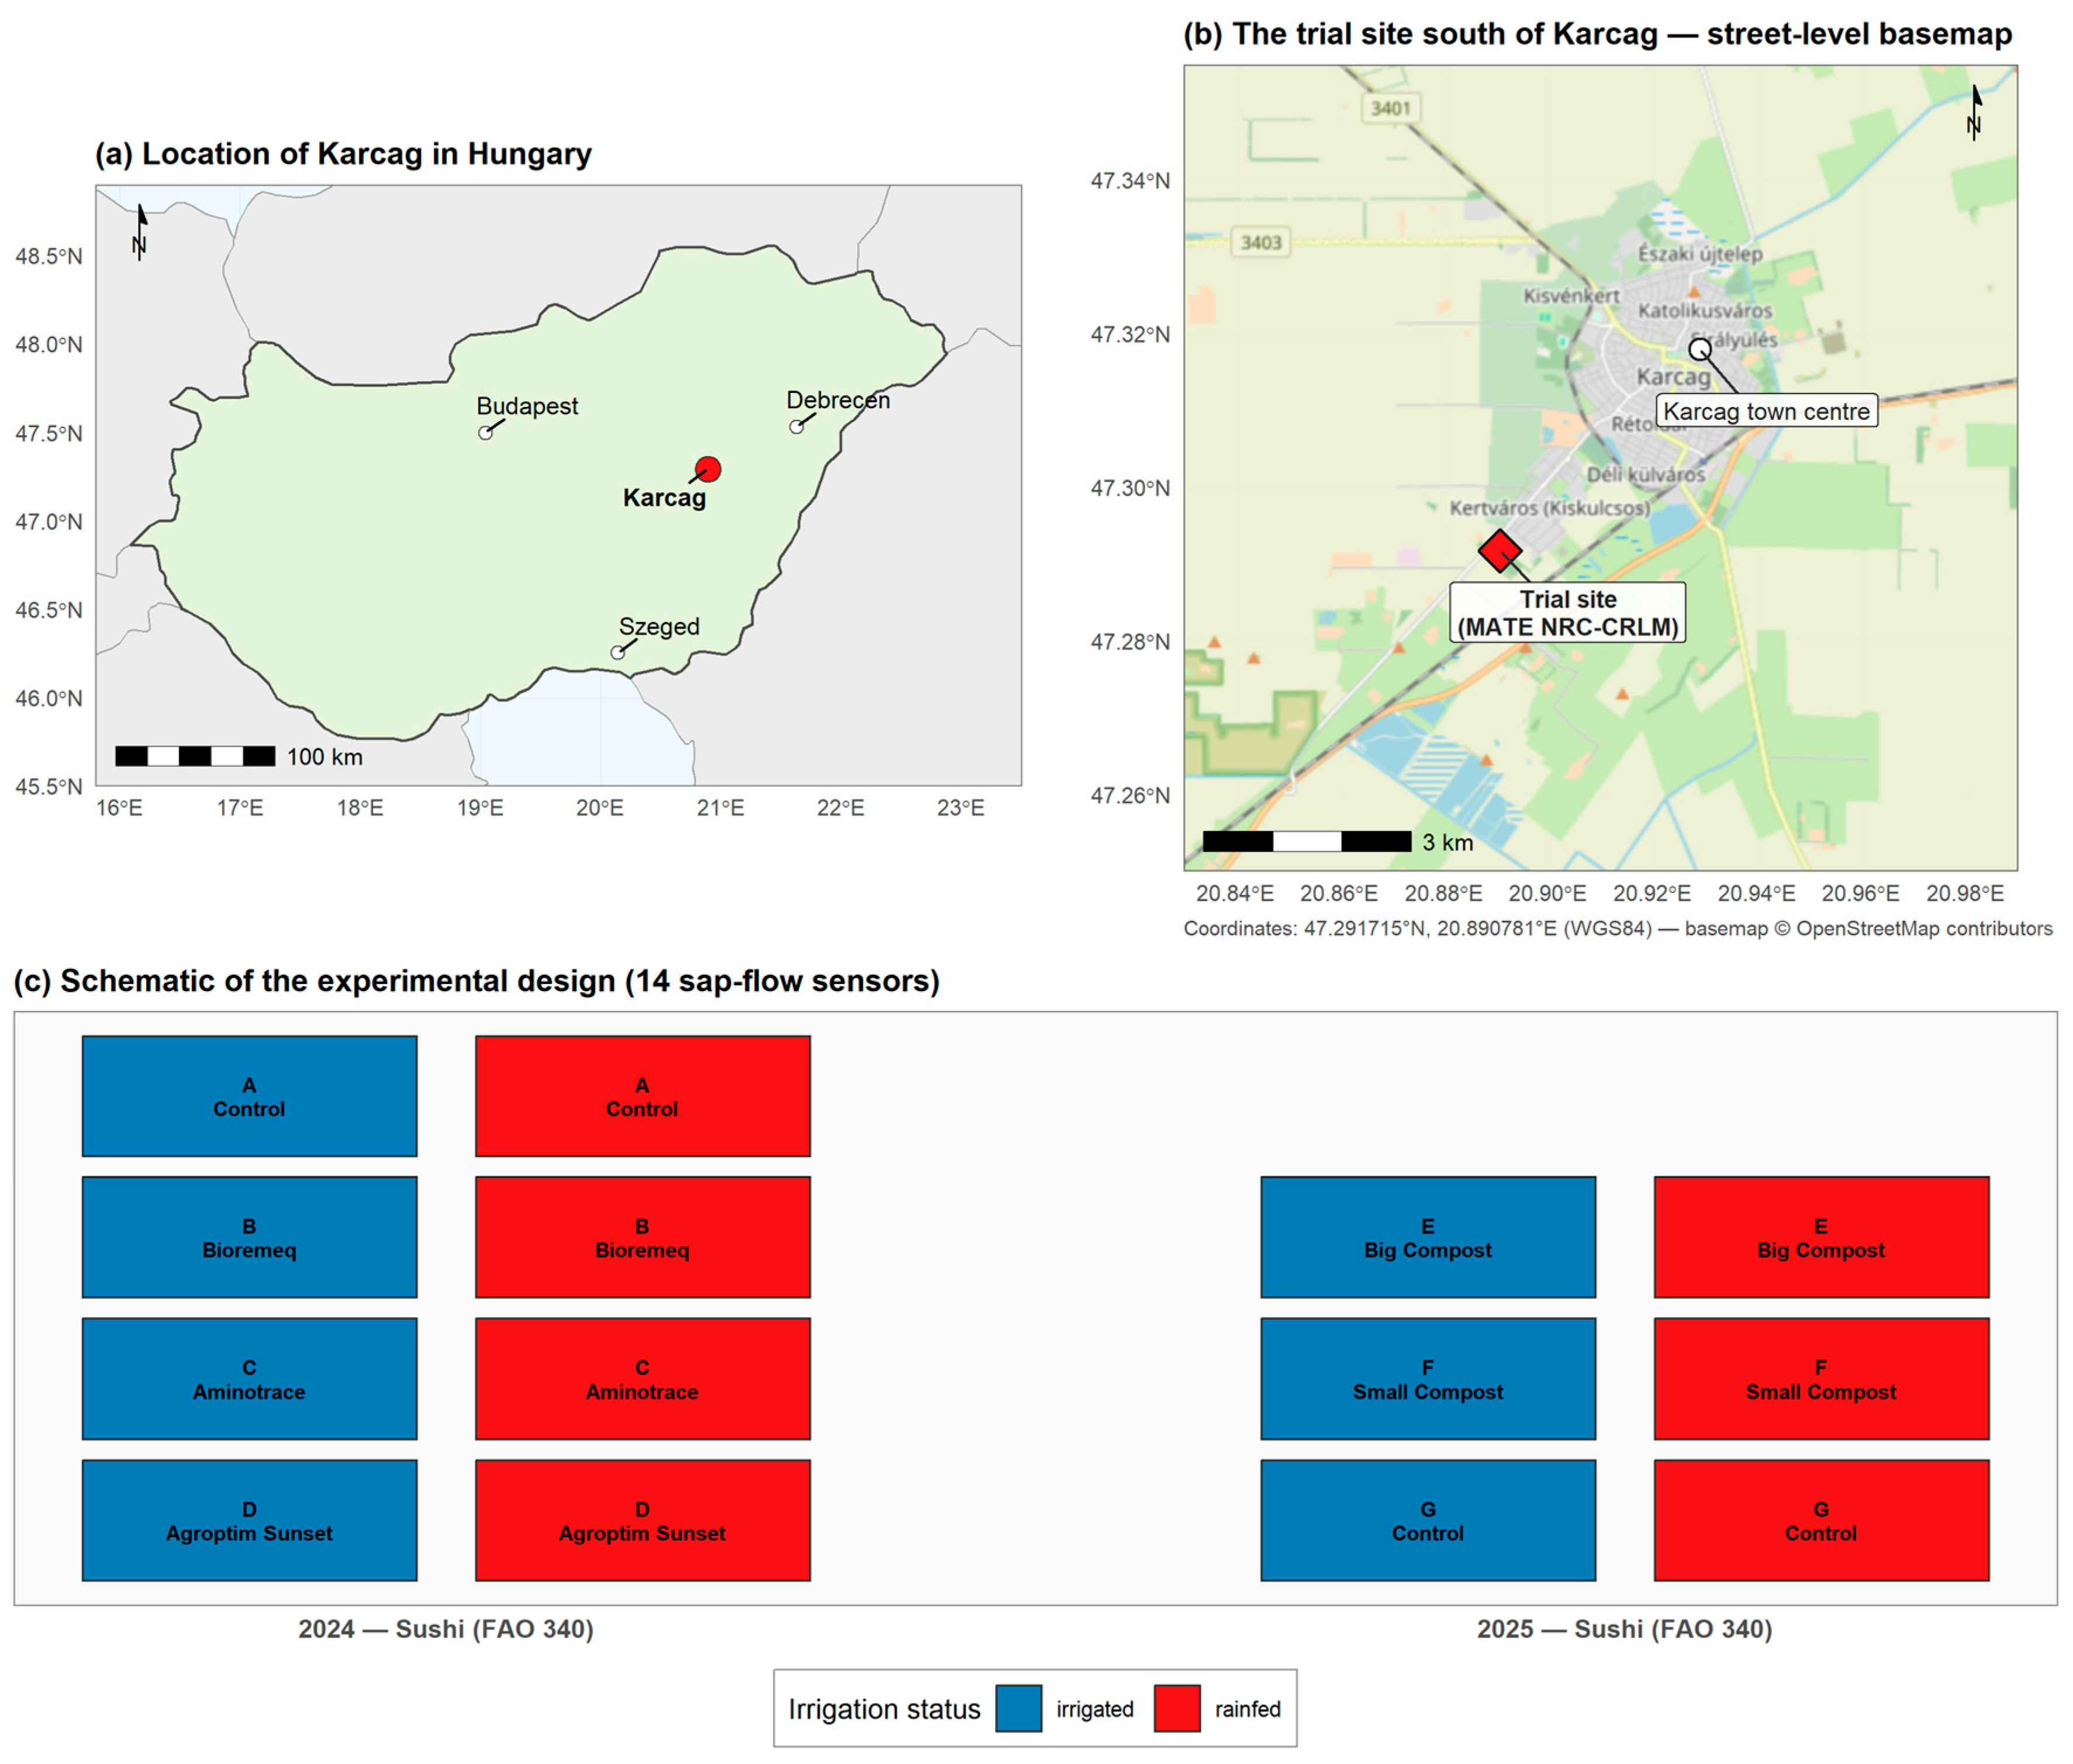
Study site and experimental layout. (a) Location of Karcag in Hungary, with Budapest, Debrecen, and Szeged shown for context. (b) The trial site (red diamond) is on the southern margin of Karcag, at 47.291715° N, 20.890781° E (WGS84). (c) Schematic of the seven treatment-by-irrigation groups (A–G) and the 14 stem-heat-balance sensors deployed across the two seasons. Blue: irrigated; red: rainfed.
2.2. Experimental Design and Treatments
The experiment used a paired sub-plot design, with one rainfed and one irrigated sub-plot per treatment. Both years used the same field block and the same Sushi FAO 340 hybrid. This removes hybrid differences, but the year contrast still combines seasonal climate with different irrigation doses. Fourteen Dynamax Flow32-1K SHB sensors (Dynamax Inc., Houston, TX, USA) covered seven treatment groups (A–G), each with one irrigated and one rainfed sensor (Figure 2c). Because each plot carried a single sensor, the design is observational with repeated daily measurements; biological replication is absent and is the principal limitation of the study (see Section 4.4). Importantly, the foliar biostimulant treatments were applied only in 2024, and the compost treatments only in 2025. Therefore, the treatment class is completely confounded with year. Any comparison between the foliar-biostimulant and compost classes is confounded with the contrasting seasonal climate of the two years. We treat every such comparison throughout as exploratory and hypothesis-generating, not as a controlled between-class test. A replicated trial that grows both amendment classes in the same season is the only clean resolution (Section 4.1 and Section 4.6). In 2024, maize was sown on 9 May at 65,000 plants ha−1 (emergence ~19 May). Foliar treatments were applied on 14 June at the 10–12-leaf stage: Control (no amendment), Bioremeq (microbial biostimulant, 2% solution, 10 mL plot−1, Green Arsenal Hungary Kft., Budapest, Hungary), Aminotrace (amino-acid + microelement biostimulant, 2 L ha−1, Aminocore Deutschland GmbH, Nordhorn, Germany) and Agroptim Sunset (mineral foliar product, 2 L ha−1, Olmix SA, Bréhan, France). Irrigated sub-plots received 38 high-frequency drip applications between 9 June and 5 September, totalling 253.3 mm. Basal fertilisation: N 85, P2O5 100, K2O 100 kg ha−1.
In 2025, the same Sushi FAO 340 hybrid was sown on 21 May at 71,000 plants ha−1 (70 cm row × 20 cm plant spacing) [35]. Treatments were Control, Big Compost (green-waste-based compost, 25 t ha−1, produced by KTHKN Kft., Karcag, Hungary) and Small Compost (same material, 15 t ha−1), each paired with irrigated and rainfed sub-plots. Six low-frequency irrigation events from 5 June to 15 August delivered 120 mm—less than half the 2024 dose. The 2024 and 2025 irrigation totals differ by more than twofold (253 versus 120 mm). We therefore report every cross-year contrast of absolute transpiration as provisional. A same-dose successor trial is required to separate the irrigation-volume effect from the seasonal-climate effect (Section 4.1). Basal fertilisation was higher (N 125, P2O5 200, K2O 200 kg ha−1), reflecting the compost-driven nutrient release schedule. The 2025 compost treatments continue a site-specific soil-conditioner research programme: Zsembeli et al. [7] previously reported that calcium- and magnesium-based soil conditioners measurably raised the available soil-moisture pool and reduced secondary salinisation on the same meadow-chernozem block.
2.3. Sap-Flow Monitoring and Data Acquisition
Sap flow was monitored with 14 Dynamax Flow32-1K SHB sensors from the SGB13–SGB16 model family. The sensors use the Sakuratani constant-power heat-balance principle [36] and the maize calibration of Wang et al. [20]. Nguyen et al. [28] used the same sensor family, and Vandegehuchte and Steppe [37] provided a methodological review. Each sensor was installed at the V8 stage on a representative plant within its sub-plot; bark was lightly cleaned, conductive grease was applied to maximise thermal contact, and sensors were wrapped with reflective foam insulation and weatherproof tape. A CR1000 data logger (Campbell Scientific, Inc., Logan, UT, USA) with a mains-charged 12 V buffer battery recorded raw DG_Flow values at 60 s intervals and stored 15 min means.
Sensor heating power was set to the manufacturer’s default for the stem-diameter range encountered (7–12 mm) [28]. The sheath-conductance parameter Ksh was held at 1.0 in 2024 and 0.8 in 2025 [38], reflecting the denser 2025 stand (71,000 versus 65,000 plants ha−1) and the resulting thinner mean stem diameter (7–10 versus 9–12 mm). Because flux output scales linearly with 1/Ksh in the Sakuratani formulation [32], the 2025 absolute totals are 25% higher than under the 2024 setting. The Ksh change does not affect within-year plot ranking; a sensitivity check confirms that rescaling 2025 to uniform Ksh = 1.0 increases, rather than decreases, the year contrast. We acknowledge that harmonising both seasons to a single Ksh value a priori would have been methodologically preferable to a post hoc rescaling check. The rescaling moves the year contrast in the conservative direction, since it widens and never narrows the difference. We nonetheless report the cross-year comparison of absolute transpiration as provisional rather than definitive.
2.4. Sap-Flow Data Cleaning Protocol
Raw 15 min DG_Flow records were quality-controlled and baseline-corrected with a four-step protocol following Wang et al. [20]:
- (i)
- Physiological cap: Values exceeding the per-stem-area upper bound implied by Wang et al. [20] were flagged and removed.
- (ii)
- Rate-of-change filter: Adjacent-record changes greater than 30 g h−1 per 15 min were treated as electrical spikes and replaced with the local Hampel-window median.
- (iii)
- Baseline correction: The pre-dawn quantile (10%) of each five-day rolling window was subtracted to remove temperature- and battery-related drift.
- (iv)
- Gap filling: Internal gaps shorter than 12 h were linearly interpolated; longer gaps were left empty, and the affected days were excluded from daily aggregates.
For each sensor and each day, we computed the mean sap-flow rate (Qd), the daily peak (Qd,max), and the daily total Td = 24 × Qd (g plant−1 d−1), together with running cumulative totals over the common window. For cross-study comparisons, totals were also expressed in mm d−1 using the planted area per plant (1538 cm2 plant−1 in 2024; 1408 cm2 plant−1 in 2025). Within-trial inference uses per-plant g d−1 to avoid canopy-size confounding.
2.5. Common Analysis Window
The 2024 sap-flow series covers DOY 193–249; the 2025 series starts on DOY 205. All between-year comparisons are therefore restricted to the overlapping window DOY 205–247 (24 July to 4 September, 43 days), hereafter the common window. This ensures the two seasons share the same phenological stage range and day length. Within-year analyses use the full season.
2.6. Meteorological Data and Derived Variables
Climatic forcing came from the HungaroMet automatic station 55405 at the trial site, archived at 10 min resolution. Daily mean vapour-pressure deficit was computed as VPDavg = ½[es(Tmax) + es(Tmin)](1 − RHavg/100), with daytime maximum VPDmax = es(Tmax)(1 − RHmin/100), following FAO-56 [39]. Growing-degree days (GDD; base 8 °C, cap 30 °C) and extreme-degree days (EDD30; °C d above 30 °C) followed Zhu and Burney [29]. Reference evapotranspiration (ET0) was obtained from the Hargreaves–Samani equation [40], applied uniformly to both years because the HungaroMet file lacked global radiation values, precluding Penman–Monteith FAO-56. The single-method approach preserves the symmetry of the between-year contrast.
2.7. External Reference Values for Unmeasured Variables
Three classes of variables were not measured in the present trial. For each, we used the closest available field record on the same soil type and climate zone, restricting the substituted value to context and limit-bounding rather than statistical inference.
Leaf area index (LAI). No LAI measurements were made. LAI was estimated from cloud-free Sentinel-2 NDVI (L2A, bands B08 and B04, single 10 × 10 m pixel at the trial coordinates, tile 34TFT) via the Beer–Lambert form calibrated for maize by Furlanetto et al. [41]: LAI = −ln[(NDVI∞ − NDVI)/(NDVI∞ − NDVIsoil)]/k, with k = 0.59, NDVI∞ = 0.92, NDVIsoil = 0.15. The implied peak LAI envelope is 3.5–5.0 for both seasons, providing a canopy-size reference for the mm d−1 planted-area conversion. The estimate rests on a single 10 × 10 m pixel. It cannot resolve treatment-level canopy differences. We therefore use LAI only as a season-level envelope. Big Compost plots probably carried larger canopies, so their mm d−1 values may be conservative. All within-trial inference uses per-plant g d−1 rather than mm d−1, which removes the canopy-size confounding.
Soil moisture. Continuous soil-water content was not recorded; only 14 manual gravimetric samples were taken across both seasons. The 4-year (2018–2022) continuous soil-moisture record of Juhász et al. [42] at the same Karcag lysimeter station (13–26 V/V% over the warm-season window) is used as the envelope reference. These 14 samples are too sparse for a continuous soil–plant–atmosphere analysis. The soil-water side of the mechanism is therefore bounded, not measured continuously, during the experimental period.
Drought context. The Pálfai Drought Index for the Great Hungarian Plain was taken from Kis et al. [43]. The European Drought Observatory Combined Drought Indicator (CDI) [44] was extracted at the trial coordinates from the standard 5 km grid. The Carpathian multi-index framework of Spinoni et al. [45] and the Penman–Monteith ET0 grid of Lakatos et al. [46] provided cross-checks in the standard idiom of the European drought-monitoring literature.
2.8. Statistical Analysis
Within each year, we fitted a linear mixed-effects model (Equation (1)):
where Tij is the daily transpiration on date j in the treatment-irrigation plot {t,i}; δj ~ N(0, σd2) is a random intercept for date; and εij is the residual. The (1|sensor) random effect was deliberately omitted because, with one sensor per {treatment × irrigation} plot per year, it is mathematically confounded with the fixed-effect interaction, causing the fit to become singular. Models were fitted with lme4::lmer [47] under REML and tested with type-III F-tests via Satterthwaite denominator degrees of freedom (lmerTest). Treatment plots were ranked with Tukey HSD letter-coding via emmeans [48] and multcomp (family-wise α = 0.05); these letters denote exploratory sensor-record separability and not replicated treatment effects. Daily scale residual autocorrelation was checked with Durbin–Watson statistics (|DW − 2| < 0.4 in all seven plots); AR(1) refitting via nlme::lme shifted point estimates by less than 5%, so the simpler (1|date) fits are retained.
Paired t-tests contrasted common-window daily totals between the irrigated and rainfed sensors in each treatment group, with Cohen’s d as standardised effect size (effsize). Post hoc statistical power at α = 0.05 and 1 − β = 0.8 was estimated with pwr::pwr.t.test; the minimum detectable Cohen’s d over n = 43 paired days is dmin = 0.43.
A separate Control-only across-year model fitted Tij ~ year × irrigation + (1|date), restricted to the common window, tested whether the irrigation response differed between seasons. One plot (Group D 2024) showed mild heteroscedasticity; the main conclusions were re-checked with a sandwich variance estimator and did not change. All analyses ran in R 4.4.2 (lme4 1.1–35, lmerTest 3.1–3, emmeans 1.10.4, multcomp 1.4–26, pwr 1.3–0, effsize 0.8.1). The integrated research database contains thirteen harmonised tables in long format; analysis scripts query it directly so that text and data cannot diverge during revisions.
3. Results
3.1. Two Contrasting Growing Seasons
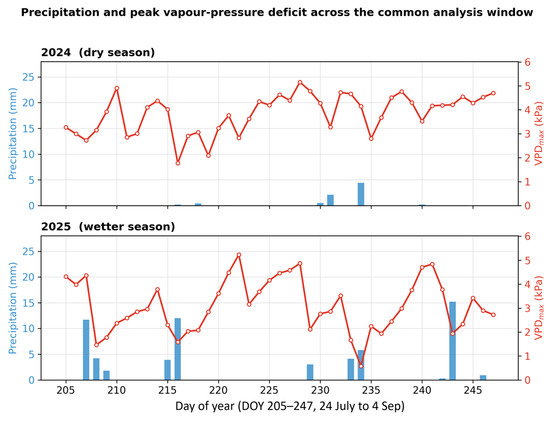
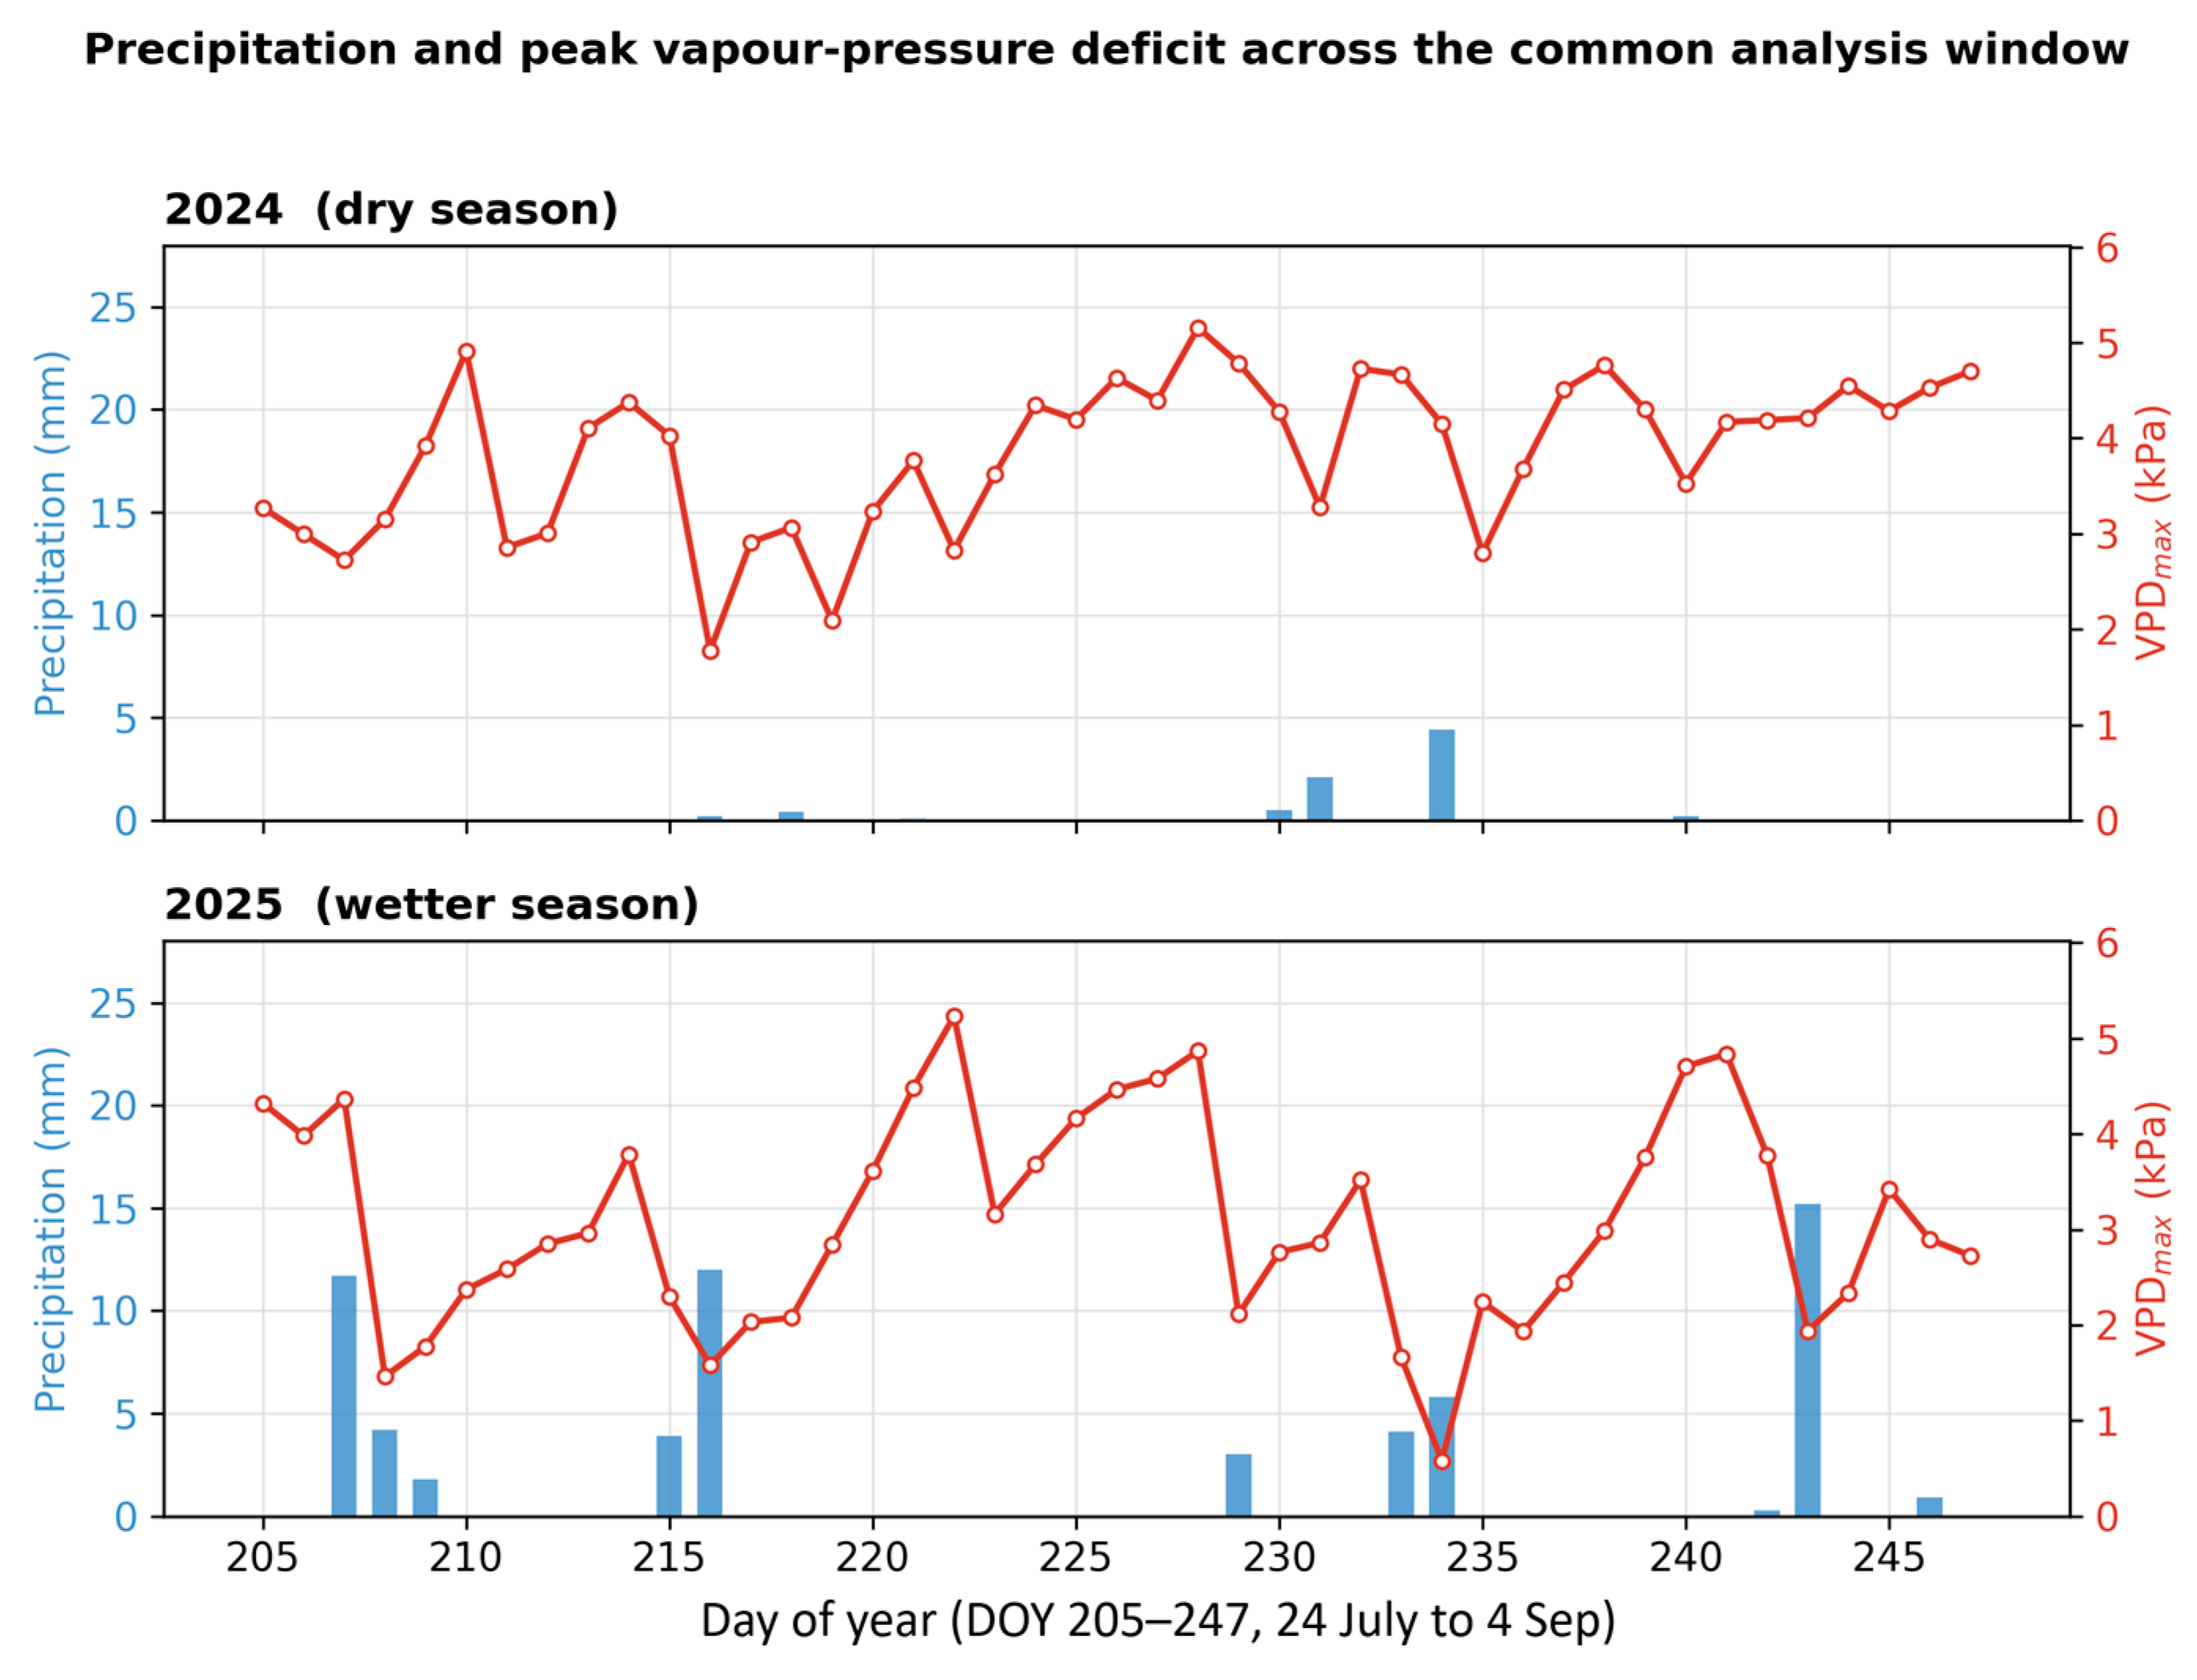
The two trial years framed a drought-versus-normal contrast within a single site (Table 1). Across the common window (DOY 205–247), mean air temperature was 25.3 °C in 2024 versus 23.0 °C in 2025, mean daytime VPDmax 1.71 versus 1.33 kPa, and EDD30 161 versus 82 °C d. The starkest contrast was in precipitation: only 7.9 mm fell over the 43-day window in 2024 versus 62.9 mm in 2025, an eight-fold difference. Hargreaves–Samani ET0 accumulated to 245 mm (2024) and 224 mm (2025), so atmospheric demand was 9% higher in the dry year, while rainfall was near zero (Figure 3). The European Drought Observatory CDI classified the 2024 window in the Alert category for most of DOY 205–247; the 2025 window remained in watch or no-flag. The Carpathian multi-index framework of Spinoni et al. [45] positioned the 2024 PaDI reading in the upper third of the 1961–2010 SPEI-12 anomaly distribution for the Pannonian sub-region, and the Penman–Monteith ET0 grid of Lakatos et al. [46] corroborated the elevated trial-site Hargreaves–Samani value.
Table 1.
Climatic context of the two trial seasons at Karcag for the full May–September window and for the common 43-day analysis window (DOY 205–247). T_mean = daily mean air temperature; T_peak = seasonal maximum; VPD computed following Allen et al. [39]; EDD30 = extreme-degree days above 30 °C; ET0 from Hargreaves–Samani [40].
Figure 3.
Climatic context of the two trial seasons at Karcag over the common 43-day window (DOY 205–247, 24 July to 4 September). The two seasons appear in separate panels. Blue bars give daily precipitation (mm, left axis). The red line with open markers gives daily peak vapour-pressure deficit VPDmax (kPa, right axis).
Sap-flow magnitudes across all sensors and treatments fell within 2.0–4.5 mm d−1 (Table 2), inside the 2.34–6.97 mm d−1 range reported by Nguyen et al. [28] for field maize using the same Dynamax SHB sensor family, confirming that the calibration and data-cleaning pipeline did not introduce a systematic bias.
Table 2.
Per-treatment summary of grain yield, water-use efficiency (WUE = grain yield ÷ cumulative transpiration), sap-flow magnitudes, and cumulative seasonal transpiration over the common window (DOY 205–247). Sensor numbers refer to the Dynamax Flow32-1K unit identifiers used in the field. The 2024 (foliar-biostimulant) and 2025 (compost) treatment classes were grown in different seasons under different irrigation doses (253 versus 120 mm); the two year-blocks are set apart in the table (rule and colour) and are not directly comparable, so any cross-class contrast is exploratory and hypothesis-generating only.
3.2. Treatment × Irrigation Effects Within Each Year
The within-year mixed-effects ANOVA returned strong main and interaction terms for both treatment and irrigation status (Table 3). In 2024, treatment explained F(3,294) = 73.7 (p < 10−34), irrigation F(1,294) = 244.0 (p < 10−39), and the treatment × irrigation interaction F(3,294) = 39.8 (p < 10−21). The same three terms were similarly large in 2025 (treatment F(2,206) = 59.6, irrigation F(1,206) = 48.0, interaction F(2,206) = 40.7; all p < 10−10). Critically, the interaction term equaled or exceeded the main irrigation term in both years, indicating that the benefit of irrigation was treatment-dependent.
Table 3.
Within-year mixed-effects ANOVA on daily transpiration totals (g plant−1 d−1) restricted to the common window. Random effect: (1|date). Type-III F-tests via lmerTest with Satterthwaite denominator degrees of freedom.
Because each plot carried a single sensor, these F-tests quantify the time-course separability of seven sensor records across 39–43 days of observation and should not be interpreted as tests of replicable treatment-level effects across biological replicates (see Section 4.4 for full discussion of this limitation).
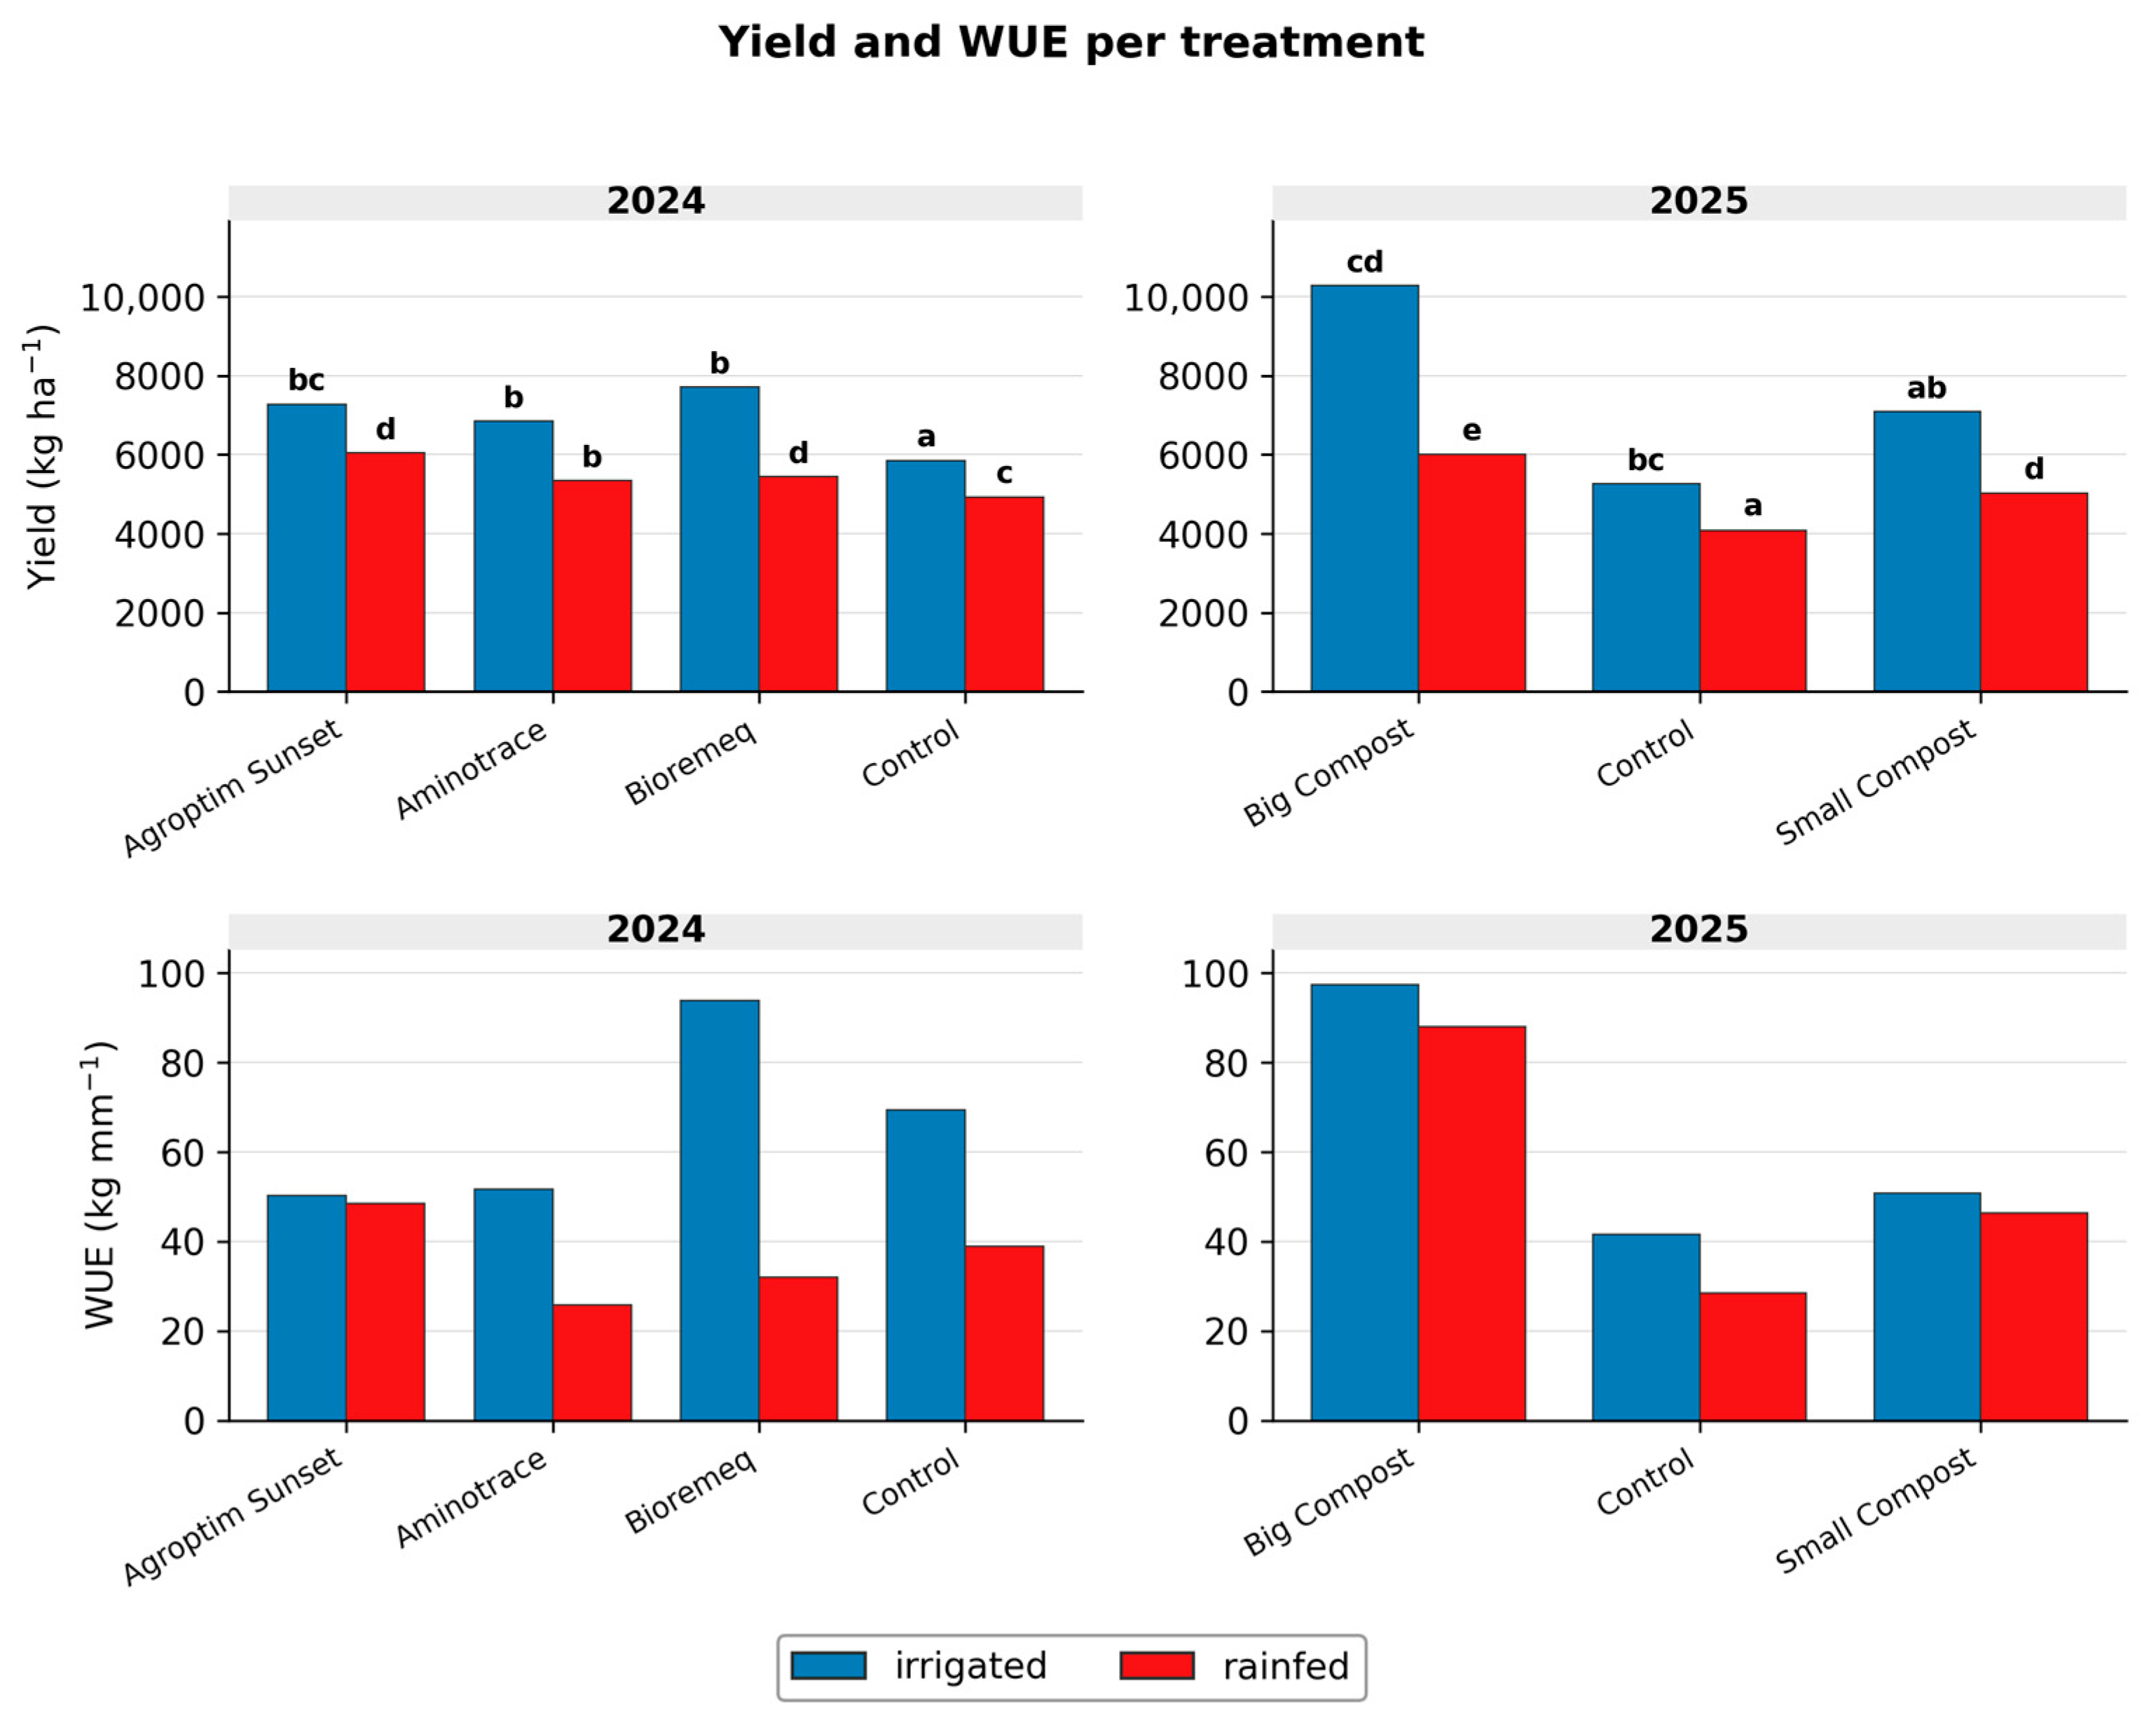
Tukey HSD letter-coding (Table 4 and Figure 4) ranked the plots within each year. In 2024, the irrigated Control headed the list (524.5 g d−1, group a); three irrigated biostimulant plots shared group b (Aminotrace irrig., Bioremeq irrig.); while rainfed Bioremeq and Agroptim Sunset lagged at the bottom (group d, 126–166 g d−1). In 2025, the rainfed Control and irrigated Small Compost led (488.5 and 475.2 g d−1, groups a/ab), whereas the rainfed Big Compost was the lowest (232.5 g d−1, group e).
Table 4.
Tukey HSD letter-coding on within-year estimated marginal means (EMM) of daily transpiration (g plant−1 d−1), α = 0.05. Cells sharing a letter within a year are not significantly different. These letters reflect exploratory sensor-record separability across 39 to 43 observation days. They are hypothesis-generating only, not replicated treatment effects.
Figure 4.
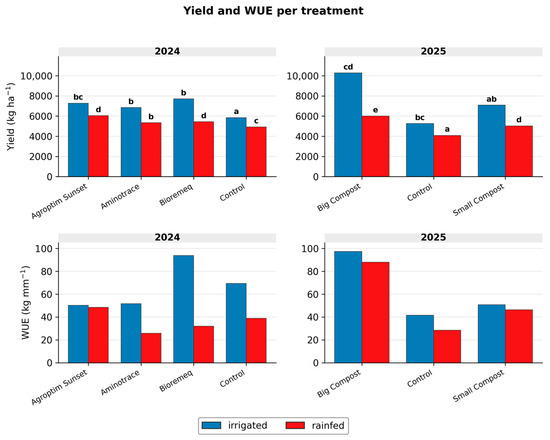
Grain yield (top row, kg ha−1) and water-use efficiency (bottom row, kg mm−1) per treatment plot for 2024 (left column) and 2025 (right column). Bars are coloured by irrigation status (dark: irrigated; light: rainfed). Letters above the top-row bars are Tukey HSD groupings (α = 0.05) computed on daily transpiration totals within each year; these letters denote exploratory, hypothesis-generating separations among single-sensor records only. They do not indicate statistically replicated treatment effects.
3.3. Paired Effects and Effect Sizes
Paired t-tests on common-window daily totals (Table S1) returned five separations in the irrigation-positive direction. Group D (Agroptim Sunset, 2024) gave the largest relative gain (+172%, Cohen’s d = 1.80, large), followed by Group B (Bioremeq, 2024; +120%, d = 1.97, large) and Group E (Big Compost, 2025; +73%, d = 1.16, large). Group F (Small Compost, 2025) gave a medium effect (d = 0.60), and Group A (Control, 2024) gave a small one (d = 0.32).
Two plots separated in the opposite direction: Group C (Aminotrace, 2024; −8%, d = −0.20) and Group G (Control, 2025; −12%, d = −0.28). Both effects were small in magnitude, and both fell below the dmin = 0.43 detectability floor (Table S2). Plausible sources include microsite soil-water heterogeneity, plant-to-plant variation in vigour and rooting depth, and sensor-baseline drift; the single-sensor design cannot distinguish among these possibilities. For Group C (Aminotrace, 2024) specifically, the rainfed sensor’s higher mean (16.3 versus 15.0 g h−1) sits well within the spread expected from single-sensor microsite variability, and post hoc inspection of the Group C record showed no baseline-drift flags or gap-fill artefacts beyond the cleaning thresholds. However, with one sensor per plot, a localised installation effect or a more favourable rooting microsite on the rainfed plant cannot be excluded. Because the pair is below the dmin = 0.43 floor (d = −0.20), it is treated as inconclusive and is not interpreted as a treatment effect.
3.4. Year-by-Irrigation Interaction in the Controls
The Control-only model used T ~ year × irrigation + (1|date) over the common window (Table 5). The year main effect was not significant (F(1,84) = 1.58, p = 0.21). The irrigation effect was strong (F(1,84) = 38.0, p < 10−7), and the year × irrigation interaction was stronger (F(1,84) = 106.0, p < 10−15). The irrigation increment changed sign between seasons: +77% in the dry 2024 season and −12% in the wetter 2025 season. This is the study’s principal statistical observation: the irrigation response differed sharply between the two observed seasons. Because the applied doses also differed, the interaction cannot partition the effect of climate from the effect of irrigation amount.
Table 5.
Across-year mixed-effects ANOVA on Control daily transpiration over the common window. The year × irrigation interaction indicates a season-dependent irrigation response within the present single-sensor dataset.
3.5. Diurnal Patterns
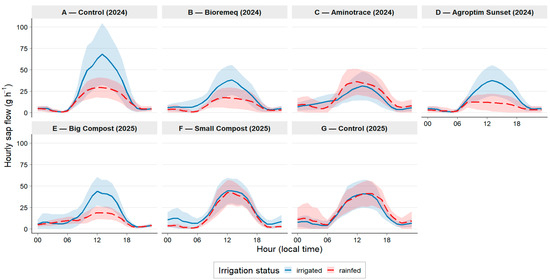
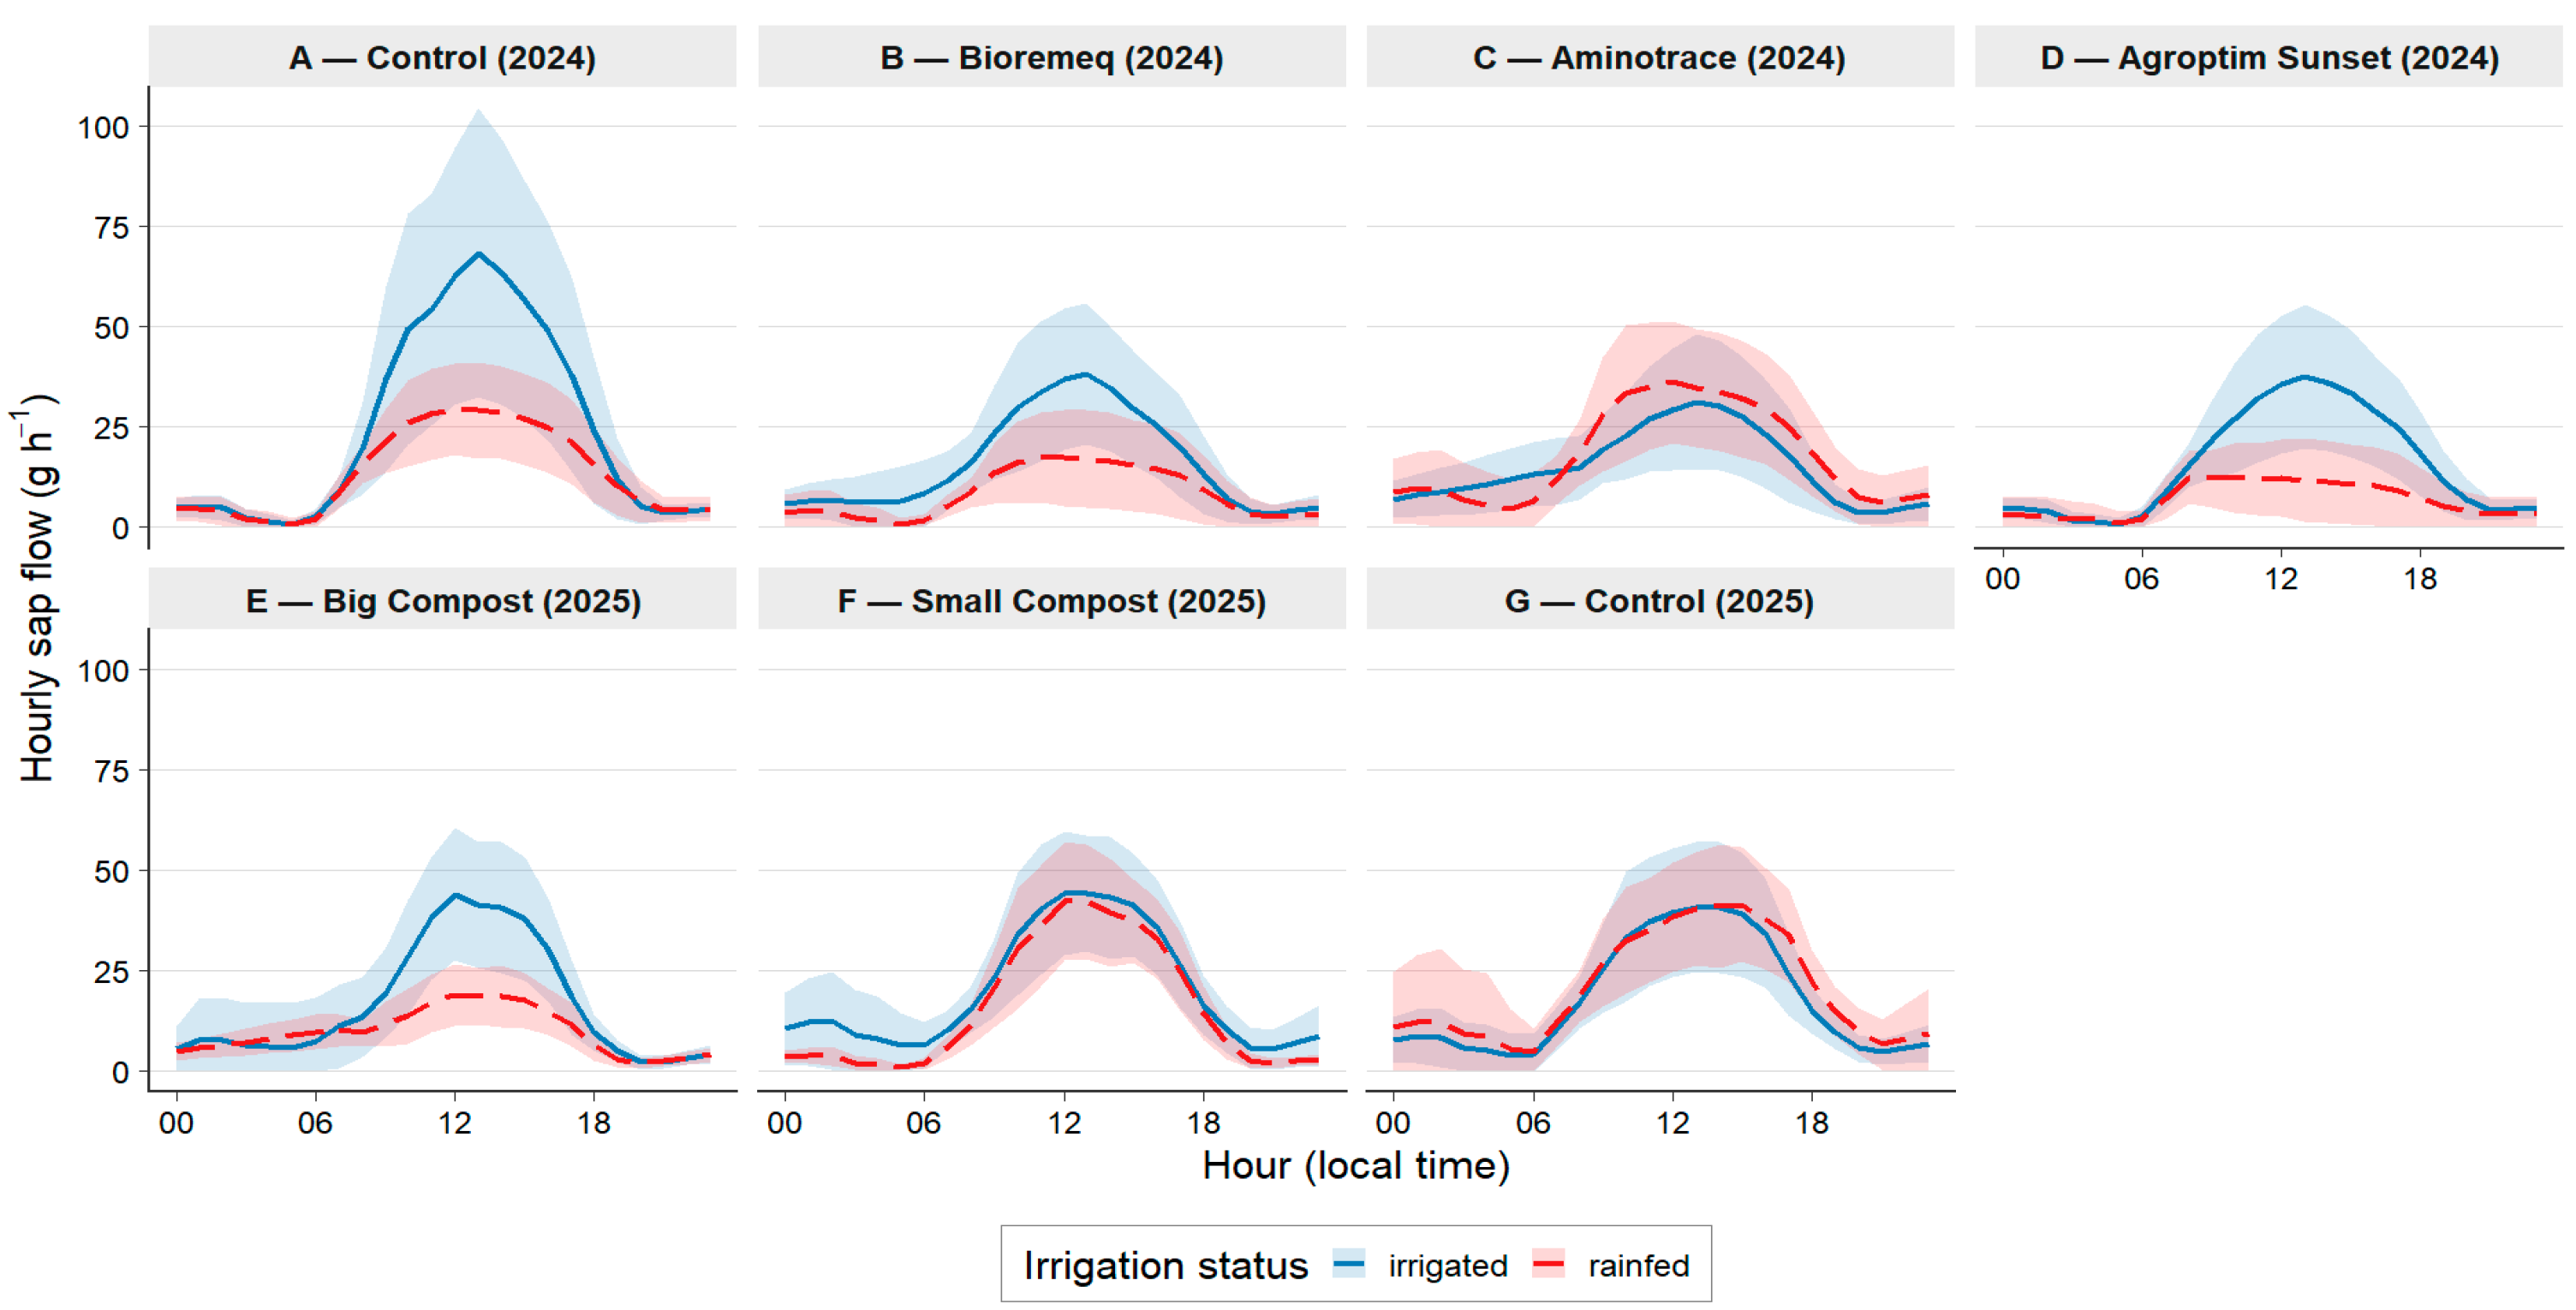
All seven groups peaked between 11:00 and 13:00 local time, tracking the daily VPD curve, and decayed to near-zero between 21:00 and 04:00 (Figure 5). Irrigated sensors showed visibly higher peaks than their rainfed counterparts in five of the seven groups, consistent with the paired-effect results. The rainfed Bioremeq (Group B) and rainfed Agroptim Sunset (Group D) profiles flattened markedly, with peaks below 30 g h−1, whereas their irrigated counterparts reached 70–130 g h−1. A small but visible night-time signal (00:00–04:00) was present in the irrigated Control 2024 profile, consistent with the xylem-recovery/refilling phenomenon documented in maize by Gleason et al. [32].
Figure 5.
Mean diurnal sap-flow profiles for the seven treatment groups (A–G) over the common window DOY 205–247. Blue solid lines: irrigated plots; red dashed lines: rainfed plots. Shaded bands: ±1 SD across days. Each panel labels the treatment name and year. Groups B and D (Bioremeq and Agroptim Sunset, 2024) show the most pronounced irrigated–rainfed separation, with rainfed peaks remaining below 30 g h−1.
3.6. Sap Flow vs. VPD Coupling
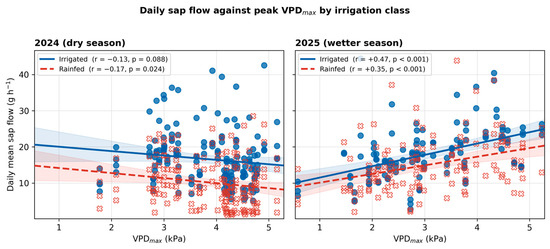
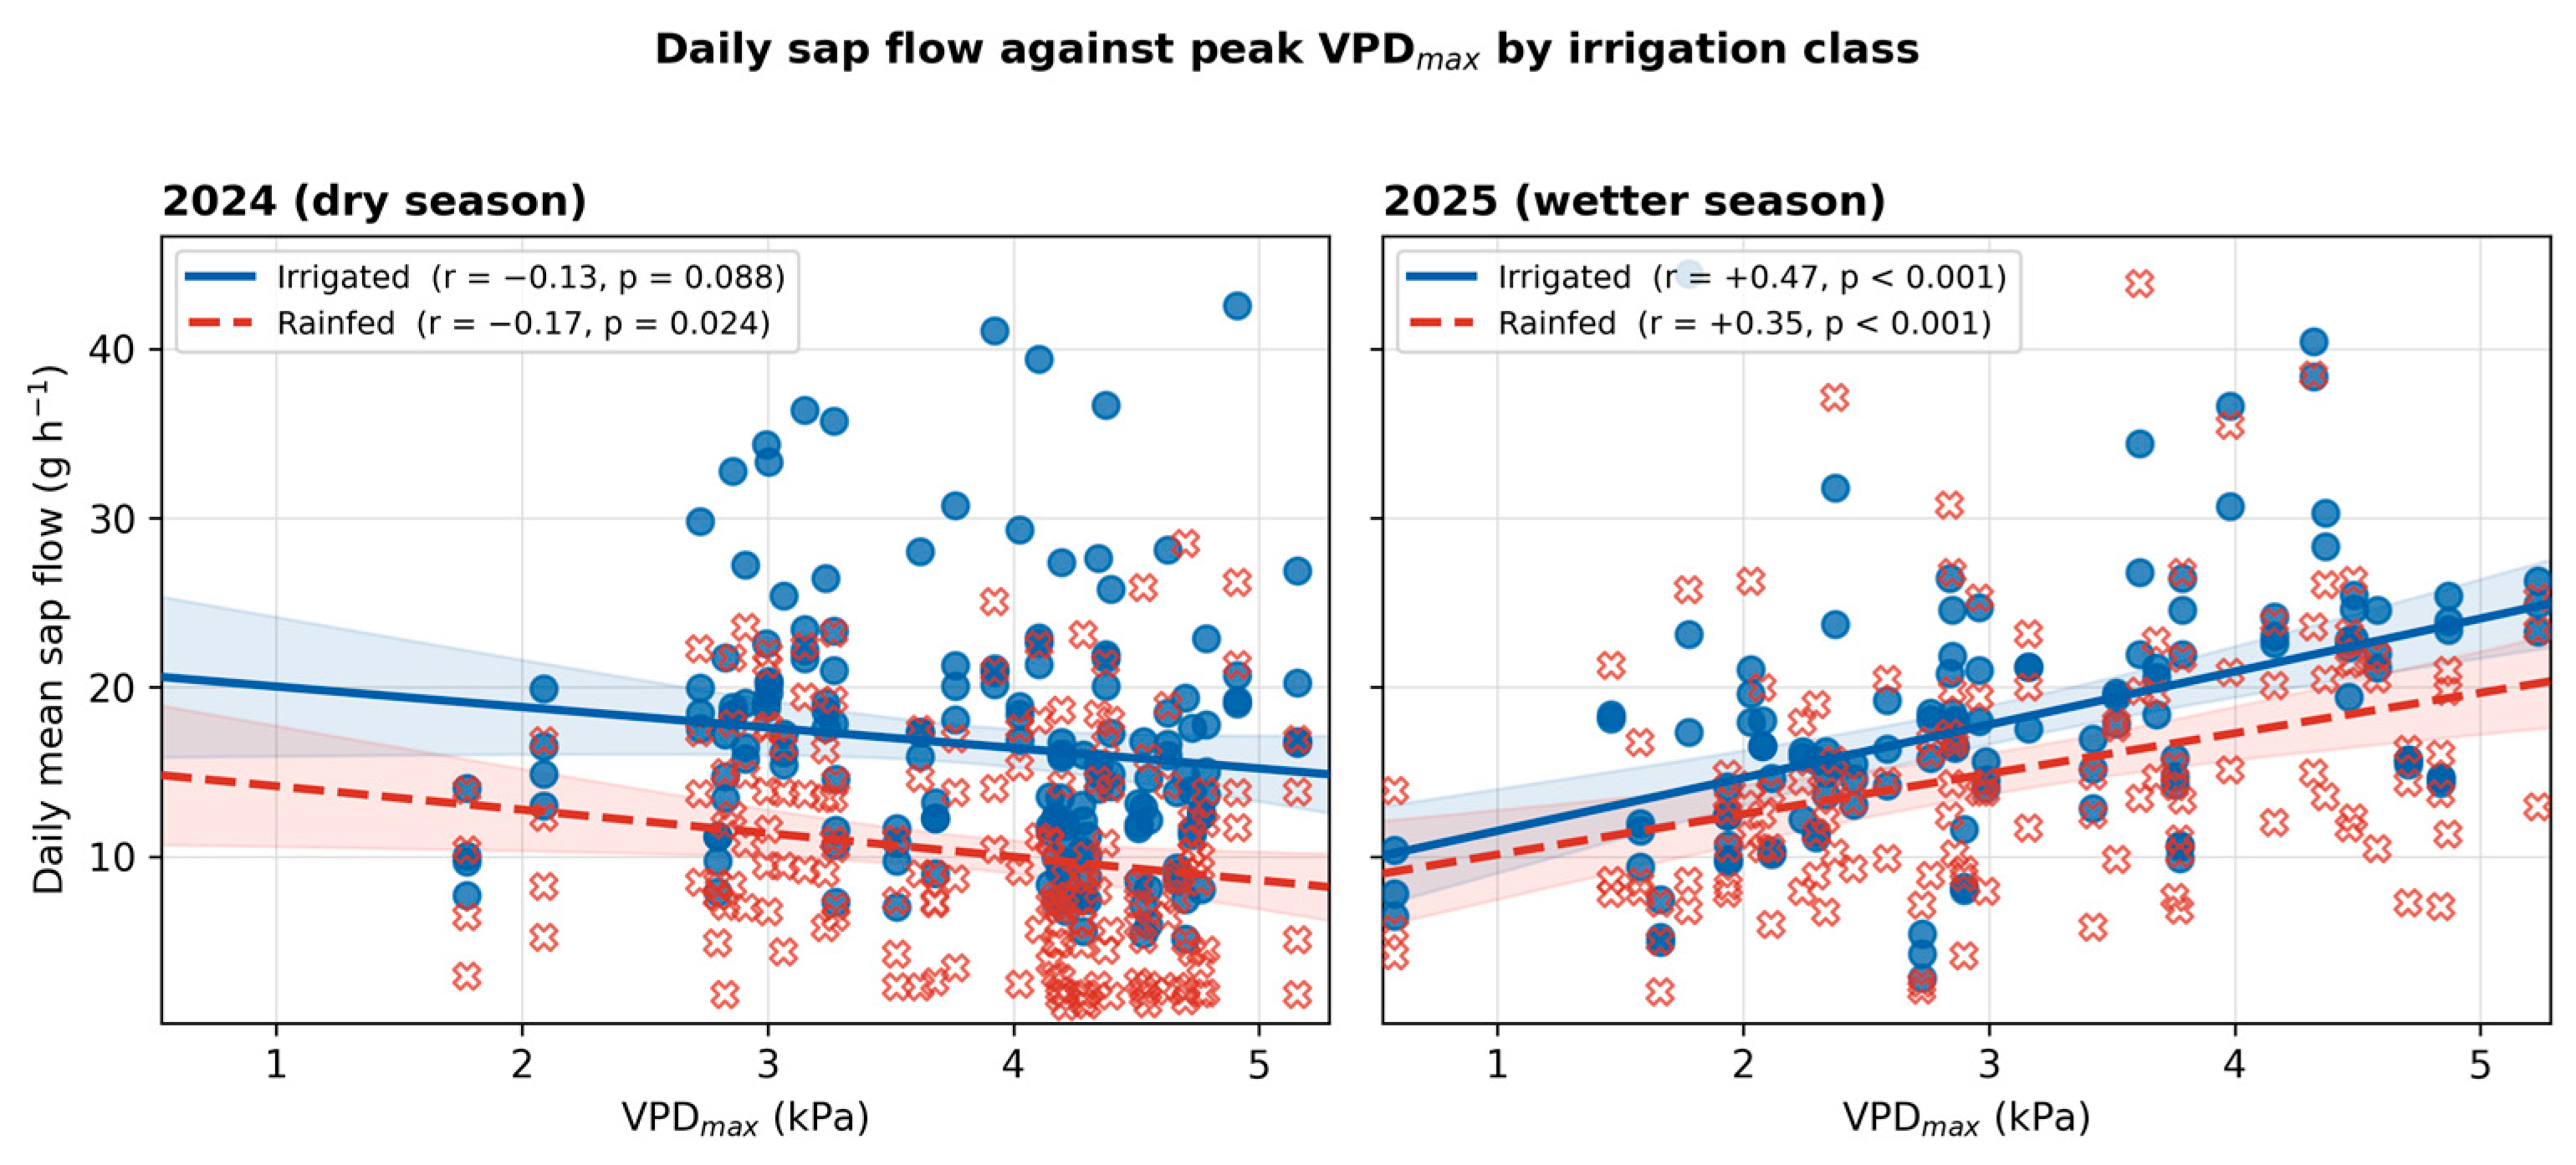
Fitting the daily transpiration–VPDmax relationship separately for each season and irrigation class (Figure 6) revealed a clear contrast. In 2025 (wetter season), both classes showed a positive coupling (irrigated r = 0.47, p < 10−7; rainfed r = 0.35, p < 10−4), consistent with the standard expectation that under non-limiting soil water, atmospheric demand drives day-to-day transpiration variance. In 2024 (dry season), the pattern inverted: the irrigated class gave a weak, non-significant trend (r = −0.13, p = 0.088), and the rainfed class gave a slightly negative, marginally significant slope (r = −0.17, p = 0.024). The negative slope on the rainfed side indicates that on the highest-VPD days, soil-water limitation forced stomatal closure and lowered sap flow, breaking the positive VPD–transpiration coupling operating under sufficient soil water. This coupling inversion is a within-year drought signature. On the highest-VPD days of the dry 2024 season, soil-water limitation suppressed transpiration below its demand-driven potential. This within-year evidence is independent of the across-year interaction in Section 3.4 and does not share its assumptions.
Figure 6.
Daily mean sap flow against daily peak vapour-pressure deficit (VPDmax) for the dry 2024 season (left) and the wetter 2025 season (right). Blue-filled circles with a solid line denote irrigated sensors. Red crosses with a dashed line denote rainfed sensors. The shaded bands give the 95% confidence interval of the OLS fit. The two panels share identical axes. The positive coupling holds in 2025. In 2024, both classes lose it, and the slopes turn negative.
3.7. Cumulative Seasonal Water Use
Cumulative transpiration over the 43-day window (Figure S1) was 18.7 kg per plant (mean) in irrigated 2024 plots versus 11.6 kg in their rainfed pairs (a 38% reduction). In 2025, the values were 18.0 and 15.6 kg (a 13% reduction). The relative irrigation increment was therefore roughly three times larger in the dry year, matching the year × irrigation interaction of the across-year ANOVA.
3.8. Yield, Water-Use Efficiency, and Treatment Ranking
Grain yield rose with irrigation in all seven groups (range +6% to +71%; Figure 4, top row). The largest gain was in Group E (Big Compost, 2025): irrigated yield reached 10,276 kg ha−1 versus 6002 kg ha−1 for the rainfed pair (+71%). Grain-based WUE (grain yield/cumulative transpiration; Figure 4, bottom row) placed the irrigated Big Compost sensor at the top of the ranking (97.5 kg mm−1), followed by irrigated Bioremeq 2024 (93.8 kg mm−1) and rainfed Big Compost 2025 (88.1 kg mm−1). The Big Compost–Control contrast in 2025 was the largest in the trial: WUE 97.5 versus 41.6 kg mm−1, a 2.3-fold separation at roughly the same per-plant transpiration. The 2024 foliar biostimulants gave irrigated WUE values of 50–94 kg mm−1, with Bioremeq leading that within-year group. The foliar and compost values do not support a controlled mechanistic comparison because the amendment classes were tested in different years. Their apparent cross-class pattern is reported only as an exploratory hypothesis. The distribution of daily mean sap-flow rates across the common window is shown by treatment group in Supplementary Figure S2; the irrigated–rainfed separation mirrors the paired-effect ranking in Supplementary Table S1, with Groups B and D showing the widest divergence in 2024.
Post hoc power for the seven paired contrasts ranged from 0.99 (the five large/medium effects) down to 0.34 and 0.45 for the two reversed plots (Groups C and G; Table S2). The effects reported as biologically meaningful (d ≥ 0.6) all sit above the dmin = 0.43 detectability floor. The two reversals (d = −0.20 and −0.28) sit below it and are formally underpowered, providing a further reason to treat them as inconclusive.
4. Discussion
4.1. The Irrigation Benefit Was Season-Dependent Under Unequal Irrigation Doses
The central result of this two-year trial is that the irrigation benefit differed sharply between the two seasons. The difference was large enough to change the sign of the effect. The two seasons differed in both seasonal climate and applied irrigation dose, so this result describes the combined regime and not climate alone. The Control-only year × irrigation interaction (F(1,84) = 106.0, p < 10−15) dwarfed the year main effect (F(1,84) = 1.6, n.s.). Therefore, the seasons did not differ in average absolute transpiration. They differed only in how much irrigation changed it. In the dry 2024 season (precipitation 7.9 mm, EDD30 = 161 °C d), irrigated Control plants transpired 77% more than the rainfed pair. In the wetter 2025 season (precipitation 62.9 mm, EDD30 = 82 °C d), the irrigated Control transpired 12% less than its rainfed counterpart.
Two factors jointly contribute to this inversion. First, the seasonal water balance reversed direction: the dry 2024 atmospheric demand met a near-empty soil, whereas 2025 received 62.9 mm of rain and started with a fuller root-zone reserve. Second, the applied irrigation dose differed: 253 mm in 2024 versus 120 mm in 2025. A descriptive normalisation gives approximately +0.30% transpiration gain per applied millimetre in 2024 and −0.10% per millimetre in 2025. This calculation does not separate the irrigation amount from the seasonal climate because it assumes a linear response to applied water. Such linearity is not physiologically guaranteed across this dose range. We therefore use the normalisation only as context and report the cross-year interpretation as provisional. A same-dose follow-up trial is required to separate the two contributions cleanly. The sheath-conductance parameter also differed between years: Ksh = 1.0 in 2024 and Ksh = 0.8 in 2025. This calibration choice does not explain the observed interaction. Rescaling the 2025 series to Ksh = 1.0 increases rather than decreases the year contrast (Section 2.3).
This result is consistent with established maize physiology. Under severe soil-moisture limitation, stomatal conductance becomes the rate-limiting step, and supplemental water releases that limitation. At adequate soil-water status, the marginal value of additional water for transpiration approaches zero [28,49]. Grossiord et al. [50] documented the same dependence at the trait scale: stomatal sensitivity to VPD is itself modulated by soil-water status, so the same VPD signal can drive opposite transpiration responses depending on the antecedent root-zone water budget. Klimešová et al. [22] reported a closely related result in pot studies, where the correlation between maize transpiration and atmospheric drivers collapsed under severe drought and recovered when water was supplied. The present study provides, to our knowledge, the first continuous plant-level field record of this transpiration response across two contrasting seasons on Hungarian chernozem soil. Because the seasons differed in irrigation dose as well as climate, the record documents the combined regime rather than a pure climate effect.
4.2. VPD Coupling Inversion Is an Independent Line of Evidence
The daily VPDmax–transpiration scatter (Figure 6) provides a second, within-year line of evidence for drought-driven stomatal regulation in the dry 2024 season. Under non-limiting soil water (2025), both irrigation classes showed a strong positive coupling (r = 0.35–0.47, p < 10−4), consistent with the canonical expectation that atmospheric demand drives the day-to-day variation in transpiration. Under severe drought (2024), the irrigated class lost most of its coupling (r = −0.13, n.s.) and the rainfed class crossed into a slightly negative slope (r = −0.17, p = 0.024): the highest-VPD days were precisely the days when soil-water limitation forced the greatest stomatal closure, suppressing transpiration below its own demand-driven potential. The two lines of evidence point to the same underlying control by soil-water status. The across-year ANOVA shows that the irrigation response changed sign between seasons. The within-year VPD-coupling analysis shows suppressed transpiration on the highest-demand days of 2024. They reinforce each other without shared assumptions.
VPDmax, as used here, is an upper-bound metric because Tmax and RHmin rarely coincide, so the regression slopes in Figure 6 are conservative estimates of the true afternoon-peak VPD coupling; the qualitative inversion between years is independent of that calibration choice. Breakdown of VPD coupling under severe drought has been reported for maize and other C4 species in pot studies [22], but the Karcag record adds a multi-season, open-field example in a continental climate, which has practical value for irrigation scheduling and model calibration.
4.3. Big Compost–Control WUE Separation Within 2025
Within the 2025 season, the irrigated Big Compost plot (grain-based WUE 97.5 kg mm−1, yield 10,276 kg ha−1) achieved 95% more grain than the irrigated Control (WUE 41.6 kg mm−1, 5271 kg ha−1) at roughly the same per-plant transpiration (Table 2). This 2.3-fold WUE separation is a within-year, same-dose single-pair estimate. It suggests that the Big Compost treatment may have increased yield without a proportional increase in per-plant transpiration. Replicated measurements are required before this pattern can be interpreted as a treatment effect.
With one sensor per plot, this result is a single plant-pair point estimate; the following mechanistic candidates are testable hypotheses for a replicated follow-up trial. Green-waste composts of this type raise soil aggregate stability, organic-matter content, and plant-available water capacity [10,51], potentially supporting biomass accumulation without a proportional rise in stomatal water loss. Additionally, compost-driven soil microbial activity enhances nutrient mineralisation, so a larger fraction of above-ground biomass can be directed to grain under the same transpiration budget. Klimešová et al. [22] reported an analogous pattern in pot studies: 44–63% reductions in maize transpiration left grain yield largely unchanged up to the severest stress level. The 2024 foliar-biostimulant values and the 2025 compost values are reported separately. The amendment classes were tested under different seasonal conditions and irrigation doses. Therefore, these data cannot establish whether foliar products and composts affect different parts of the production function. That mechanistic distinction remains a hypothesis for a replicated trial that tests both classes in the same season.
4.4. Pseudoreplication and the Boundaries of Inference
The single sensor per {treatment × irrigation} plot meets the Hurlbert [52] definition of pseudoreplication: the units of inference (treatment-level effects) are not biologically replicated, even though each plot contributes 39–43 daily observations. Within the linear mixed model, this forced the omission of the (1|sensor) random effect because it became confounded with the fixed-effect interaction. The residual within-plot variation that remains in the model is therefore day-to-day variability across the window, not biological replication of plants. All F-tests and Cohen’s d values quantify sensor-record separability, not treatment-level reproducibility.
The consequences are proportional to the strength of the observed effects. The five pairs with d ≥ 0.6 and power ≥ 0.79 describe sensor separations that are stable across the 43-day window and consistent across multiple summary metrics (diurnal profile, cumulative transpiration, Tukey letter grouping). We interpret these as exploratory, hypothesis-generating observations for replicated follow-up rather than treatment-level conclusions. The two reversed pairs (d = −0.20, −0.28) remain inconclusive, as discussed in Section 3.3. The Big Compost–Control WUE gap is the finding most in need of replication: its magnitude is large but rests on a single plant comparison.
4.5. Comparison with the Published Maize Sap-Flow Record
Daily transpiration totals at Karcag (2.0–4.5 mm d−1, peak 4.7 mm d−1) fall inside the 2.34–6.97 mm d−1 range reported by Nguyen et al. [28] for irrigated field maize using the same Dynamax SHB sensor family (Table S3). Cumulative seasonal transpiration of 18–19 kg per plant in the irrigated plots corresponds to approximately 128–139 mm over the 43-day window, within the literature range. The atmospheric forcing was also broadly comparable: ET0 of 224–245 mm over 43 days, EDD30 of 82–161 °C d, and growing-season precipitation of 195–223 mm match the values of Zhu and Burney [29] for the same drought metric. The fact that an independent project on different soils with a different sensor team produces values inside the same magnitude envelope strengthens confidence in the present calibration pipeline.
Two methodological qualifications apply to this comparison. First, Karcag ET0 is computed by the Hargreaves–Samani equation, which typically returns values 5–15% above Penman–Monteith FAO-56 on continental sites in temperate humid summers; the Karcag ET0 entries in Table S3 should be read as upper-bound estimates. Second, the mm d−1 conversion uses planted ground area rather than LAI-based projected area; Big Compost plots almost certainly carried larger canopies, making their mm d−1 values conservative lower bounds of canopy-level transpiration. Both qualifications act in the same direction across both years, leaving the within-trial contrasts unaffected.
4.6. Limitations and Future Work
Five constraints bound the inference and define the priorities for the replicated successor trial:
No biological replication. One sensor per {treatment × irrigation} plot makes every treatment-level claim exploratory. The successor trial will deploy ≥3 replicate sensors per plot, at which the pre-specified d ≥ 0.6 effect reaches 0.8 power.
Treatment class confounded with year. Foliar biostimulants (2024) and composts (2025) were never grown in the same season, so between-class comparisons are confounded with climate and are not controlled contrasts.
No leaf-level gas exchange. The soil-water → stomatal-regulation → sap-flow chain is inferred from the agreement between the VPD-coupling and ANOVA evidence, not measured directly; porometer/LI-COR 6800 data are a priority.
Sparse soil moisture. Only 14 gravimetric samples were taken, so the soil-water deficit → stomatal-closure pathway is inferred indirectly from the VPD-coupling reversal rather than from continuous in situ soil-moisture measurement. Continuous probes are planned.
Unequal irrigation dose and single-pixel LAI. The 2025 dose was less than half the 2024 dose, and LAI rested on one Sentinel-2 pixel that cannot resolve treatment-level canopy differences; both keep the cross-year and mm d−1 comparisons provisional. A same-dose, replicated, canopy-resolved successor trial would resolve them. A replicated follow-up at the same site is in planning and will prioritise three hypotheses sharpened here: the season-dependent irrigation benefit, the compost-driven WUE gain, and whether the transpiration-amplitude differences among amendments carry through to yield-per-mm at the field scale.
4.7. Regional Outlook
The season-dependent irrigation pattern reported here is consistent with the Hungarian regional context. Huzsvai et al. [6] projected that the future probability of yield failure on the Hungarian Great Plain will rise further, with the steepest increase in dry-and-hot years matching the 2024 conditions of the present trial. The transpiration record obtained here shows that the irrigation increment is concentrated in exactly such seasons; in wetter seasons, it disappears. This asymmetry has direct implications for irrigation policy in a region where the energy and opportunity cost of every applied millimetre is rising alongside drought frequency. The plant-level sap-flow record is complementary to the model-based irrigation-planning approach of Siphiwe et al. [53] applied to maize on a Debrecen field approximately 50 km from Karcag: their HYDRUS-2D simulation returned soil-moisture targets of 17.5–32.2 V/V% for the same continental maize system. The two approaches address opposite ends of the soil–plant–atmosphere chain; one models the soil-water side, the other measures the transpiration response, and the water-balance boundary conditions of one are validation targets of the other.
5. Conclusions
Two seasons of stem-heat-balance sap-flow monitoring on irrigated and rainfed maize at Karcag, analysed over the common 43-day window DOY 205–247, support four exploratory conclusions:
- (1)
- Season-dependent irrigation response under unequal doses. The Control-only year × irrigation interaction reached F(1,84) = 106 (p < 10−15): irrigation raised transpiration by 77% in the dry 2024 season and lowered it by 12% in the wetter 2025 season on the same Sushi FAO 340 hybrid. The interaction shows that the response differed between the two observed irrigation regimes. It cannot separate the seasonal climate from the 53% smaller dose applied in 2025. The interpretation is therefore provisional pending a same-dose trial.
- (2)
- VPD–transpiration coupling inversion. In 2025, both irrigation classes showed the expected positive VPD–transpiration coupling (r = 0.35–0.47). In 2024, the irrigated class lost its coupling (r = −0.13, n.s.) and the rainfed class crossed into a slightly negative slope (r = −0.17), indicating that severe soil-water limitation suppressed transpiration on the highest-demand days. This within-year result independently corroborates the across-year ANOVA.
- (3)
- Big Compost–Control WUE separation within 2025. This comparison was made within the 2025 season under the same irrigation dose. The irrigated Big Compost sensor reached WUE 97.5 kg mm−1 versus 41.6 kg mm−1 for the matched irrigated Control at roughly the same per-plant transpiration, a 2.3-fold separation. This within-year contrast is not confounded with season, but it still rests on a single plant pair and needs replication. Whether compost also outperforms the 2024 foliar biostimulants (WUE 50–94 kg mm−1) cannot be judged from these data, because the two amendment classes were grown in different years; that cross-class ranking is left as a hypothesis for a same-season replicated trial.
- (4)
- Sensor performance and calibration validation. Daily transpiration totals (2.0–4.5 mm d−1), ET0, GDD, and EDD30 fell inside the published ranges for field maize in temperate continental climates (Table S3).
Overall, three structural constraints bound every treatment-level statement above: the single sensor per plot, the confounding of amendment class with year, and the unequal irrigation dose between the two seasons. All rankings are therefore exploratory hypotheses, not controlled treatment effects. The planned successor trial will address all three: three or more sensors per plot, both amendment classes grown in the same season, a single irrigation dose, leaf-level gas exchange, and continuous soil-moisture monitoring.
Supplementary Materials
The following supporting information can be downloaded at https://www.mdpi.com/article/10.3390/agronomy16141305/s1: Table S1 (paired t-tests), Table S2 (post hoc power), Table S3 (published maize sap-flow comparison), Figure S1 (cumulative transpiration), Figure S2 (daily sap-flow distributions).
Author Contributions
Conceptualization, D.P. and J.T.; methodology, D.P. and G.T.; software, D.P. and G.S.N.; validation, D.P., G.S.N. and A.N.; formal analysis, D.P.; investigation, D.P., G.K., G.T. and G.S.N.; resources, J.T. and A.N.; data curation, D.P. and G.T.; writing—original draft preparation, D.P.; writing—review and editing, G.K., A.N., G.S.N. and J.T.; visualisation, D.P.; supervision, J.T. and A.N.; project administration, J.T.; funding acquisition, J.T. All authors have read and agreed to the published version of the manuscript.
Funding
This research was funded by the TKP2021-NKTA-32 project. The publication was additionally supported by the University of Debrecen Program for Scientific Publication.
Data Availability Statement
The data and analysis scripts are held in an integrated research database. Readers interested in access should contact the first author, Dávid Pásztor (pasztor.david@agr.unideb.hu) with a brief statement of intended use. All materials will be provided upon reasonable request.
Acknowledgments
The authors thank the field staff at the National Research Centre for Climate and Regional Land Management, Hungarian University of Agriculture and Life Sciences, for trial maintenance and harvest support. During the preparation of this manuscript, the authors used a large-language-model assistant (Anthropic Claude, 2024–2025) to support English-language editing. No content was generated by the AI without subsequent author review. All scientific claims, experimental data, statistical analyses, and conclusions originate from the authors and have been verified against the underlying field measurements and source literature. The authors take full responsibility for the content of the publication.
Conflicts of Interest
The authors declare no conflicts of interest.
Abbreviations
The following abbreviations are used in this manuscript:
| DOY | Day of year |
| EDD30 | Extreme-degree days above 30 °C |
| ET0 | Reference evapotranspiration |
| FAO | Food and Agriculture Organization |
| GDD | Growing-degree days (base: 8 °C, cap: 30 °C) |
| HABP | HungaroMet Automatic Weather Station network |
| HSD | Honestly significant difference (Tukey) |
| K_sh | Sheath-conductance parameter (Sakuratani) |
| LAI | Leaf area index |
| LMM | Linear mixed-effects model |
| NDVI | Normalised difference vegetation index |
| PaDI | Pálfai Drought Index |
| REML | Restricted maximum likelihood |
| SHB | Stem heat balance (sap-flow technique) |
| VPD | Vapour-pressure deficit |
| WGS84 | World Geodetic System 1984 |
| WUE | Water-use efficiency (yield per cumulative transpiration) |
References
- Wang, Y.; Horton, R.; Xue, X.; Ren, T. Partitioning Evapotranspiration by Measuring Soil Water Evaporation with Heat-Pulse Sensors and Plant Transpiration with Sap Flow Gauges. Agric. Water Manag. 2021, 252, 106883. [Google Scholar] [CrossRef]
- Fan, X.; Hu, X.; Ma, Y.; Pang, Y.; Sun, J.; Hou, P. Influence of High Temperature and Drought Stress at Jointing Stage on Crop Physiological Responses and Growth in Summer Maize Plants (Zea mays L.). Front. Plant Physiol. 2024, 2, 1331421. [Google Scholar] [CrossRef]
- Škeříková, M.; Brant, V.; Kroulík, M.; Pivec, J.; Zábranský, P.; Hakl, J.; Hofbauer, M. Water Demands and Biomass Production of Sorghum and Maize Plants in Areas with Insufficient Precipitation in Central Europe. Plant Soil Environ. 2018, 64, 367–378. [Google Scholar] [CrossRef]
- Hungarian Central Statistical Office (KSH). A Fontosabb Növények Vetésterülete, 2025. Június 1; KSH: Budapest, Hungary, 2025. [Google Scholar]
- Huzsvai, L.; Zsembeli, J.; Kovács, E.; Juhász, C. Can Technological Development Compensate for the Unfavorable Impacts of Climate Change? Conclusions from 50 Years of Maize (Zea mays L.) Production in Hungary. Atmosphere 2020, 11, 1350. [Google Scholar] [CrossRef]
- Huzsvai, L.; Juhász, C.; Seddik, L.; Kovács, G.; Zsembeli, J. The Future Probability of Winter Wheat and Maize Yield Failure in Hungary Based on Long-Term Temporal Patterns. Sustainability 2024, 16, 3962. [Google Scholar] [CrossRef]
- Zsembeli, J.; Sinka, L.; Rivera-García, A.; Czellér, K.; Tuba, G.; Krištof, K.; Findura, P. Effect of Soil Conditioning on the Moisture Content and the Salt Profile of the Soil Under Irrigation with Saline Water. Agriculture 2019, 65, 77–87. [Google Scholar] [CrossRef]
- Zhang, H.; Zhang, R.; Sun, L.; Li, H.; Xue, Y.; Zhao, X.; Liu, J.; Yuan, C. Optimized Irrigation and Fertilization for Spring Maize under Warming and Wetting Climate in a Semi-Arid Region of China. Front. Plant Sci. 2025, 16, 1600561. [Google Scholar] [CrossRef] [PubMed]
- Arinaitwe, U.; Thomason, W.; Frame, W.H.; Reiter, M.S.; Langston, D. Optimizing Maize Agronomic Performance Through Adaptive Management Systems in the Mid-Atlantic United States. Agronomy 2025, 15, 1059. [Google Scholar] [CrossRef]
- Zhang, W.; Xiong, Y.; Li, Y.; Qiu, Y.; Huang, G. Effects of Organic Amendment Incorporation on Maize (Zea mays L.) Growth, Yield and Water-Fertilizer Productivity under Arid Conditions. Agric. Water Manag. 2022, 269, 107663. [Google Scholar] [CrossRef]
- Othibeng, K.; Nephali, L.; Myoli, A.; Buthelezi, N.; Jonker, W.; Huyser, J.; Tugizimana, F. Metabolic Circuits in Sap Extracts Reflect the Effects of a Microbial Biostimulant on Maize Metabolism under Drought Conditions. Plants 2022, 11, 510. [Google Scholar] [CrossRef] [PubMed]
- Notununu, I.; Moleleki, L.; Roopnarain, A.; Adeleke, R. Enhancing Maize Drought and Heat Tolerance: Single vs Combined Plant Growth Promoting Rhizobacterial Inoculation. Front. Plant Sci. 2024, 15, 1480718. [Google Scholar] [CrossRef] [PubMed]
- Armanhi, J.S.L.; De Souza, R.S.C.; Biazotti, B.B.; Yassitepe, J.E.D.C.T.; Arruda, P. Modulating Drought Stress Response of Maize by a Synthetic Bacterial Community. Front. Microbiol. 2021, 12, 747541. [Google Scholar] [CrossRef] [PubMed]
- Csótó, A.; Tóth, G.; Riczu, P.; Zabiák, A.; Tarjányi, V.; Fekete, E.; Karaffa, L.; Sándor, E. Foliar Spraying with Endophytic Trichoderma Biostimulant Increases Drought Resilience of Maize and Sunflower. Agriculture 2024, 14, 2360. [Google Scholar] [CrossRef]
- Bulgari, R.; Cocetta, G.; Trivellini, A.; Vernieri, P.; Ferrante, A. Biostimulants and Crop Responses: A Review. Biol. Agric. Hortic. 2015, 31, 1–17. [Google Scholar]
- Rouphael, Y.; Colla, G. Editorial: Biostimulants in Agriculture. Front. Plant Sci. 2020, 11, 40. [Google Scholar] [CrossRef] [PubMed]
- Ocwa, A.; Mohammed, S.; Mousavi, S.M.N.; Illés, Á.; Bojtor, C.; Ragán, P.; Rátonyi, T.; Harsányi, E. Maize Grain Yield and Quality Improvement Through Biostimulant Application: A Systematic Review. J. Soil Sci. Plant Nutr. 2024, 24, 1609–1649. [Google Scholar] [CrossRef]
- Nkebiwe, P.M.; Stevens Lekfeldt, J.D.; Symanczik, S.; Thonar, C.; Mäder, P.; Bar-Tal, A.; Halpern, M.; Biró, B.; Bradáčová, K.; Caniullan, P.C.; et al. Effectiveness of Bio-Effectors on Maize, Wheat and Tomato Performance and Phosphorus Acquisition from Greenhouse to Field Scales in Europe and Israel: A Meta-Analysis. Front. Plant Sci. 2024, 15, 1333249. [Google Scholar] [CrossRef] [PubMed]
- Sible, C.N.; Seebauer, J.R.; Below, F.E. Plant Biostimulants: A Categorical Review, Their Implications for Row Crop Production, and Relation to Soil Health Indicators. Agronomy 2021, 11, 1297. [Google Scholar] [CrossRef]
- Wang, Y.; Zhang, X.; Xiao, X.; Heitman, J.; Horton, R.; Ren, T. An Empirical Calibration for Heat-Balance Sap-Flow Sensors in Maize. Agron. J. 2017, 109, 1122–1128. [Google Scholar]
- Zhao, L.; He, Z.; Zhao, W.; Yang, Q. Extensive Investigation of the Sap Flow of Maize Plants in an Oasis Farmland in the Middle Reach of the Heihe River, Northwest China. J. Plant Res. 2016, 129, 841–851. [Google Scholar] [CrossRef] [PubMed]
- Klimešová, J.; Středová, H.; Klimek-Kopyra, A.; Středa, T. Transpiration and Water Use Efficiency of Maize in Different Soil Moisture Conditions. Acta Hortic. Regiotect. 2021, 24, 105–109. [Google Scholar] [CrossRef]
- Rankoth, L.M.; Udawatta, R.P.; Gantzer, C.J.; Jose, S.; Nelson, K.A. Cover Crop Effects on Corn Plant Sap Flow Rates and Soil Water Dynamics. Crop Sci. 2019, 59, 2227–2236. [Google Scholar] [CrossRef]
- Li, S.; Kang, S.; Zhang, L.; Ortega-Farías, S.; Li, F.; Du, T.; Tong, L.; Wang, S.; Ingman, M.; Guo, W. Measuring and Modeling Maize Evapotranspiration under Plastic Film-Mulching Condition. J. Hydrol. 2013, 503, 153–168. [Google Scholar] [CrossRef]
- Wu, Y.; Du, T.; Ding, R.; Tong, L.; Li, S.; Wang, L. Multiple Methods to Partition Evapotranspiration in a Maize Field. J. Hydrometeorol. 2017, 18, 139–149. [Google Scholar] [CrossRef]
- Menefee, D.; Scott, R.L.; Abraha, M.; Alfieri, J.G.; Baker, J.; Browning, D.M.; Chen, J.; Gonet, J.; Johnson, J.M.F.; Miller, G.R.; et al. Unraveling the Effects of Management and Climate on Carbon Fluxes of U.S. Croplands Using the USDA Long-Term Agroecosystem (LTAR) Network. Agric. For. Meteorol. 2022, 326, 109154. [Google Scholar]
- Capurro, M.C.; Ham, J.M.; Kluitenberg, G.J.; Comas, L.; Andales, A.A. A Novel Sap Flow System to Measure Maize Transpiration Using a Heat Pulse Method. Agric. Water Manag. 2024, 301, 108963. [Google Scholar] [CrossRef]
- Nguyen, T.H.; Gaiser, T.; Vanderborght, J.; Schnepf, A.; Bauer, F.; Klotzsche, A.; Lärm, L.; Hüging, H.; Ewert, F. Responses of Field-Grown Maize to Different Soil Types, Water Regimes, and Contrasting Vapor Pressure Deficit. Biogeosciences 2024, 21, 5495–5515. [Google Scholar] [CrossRef]
- Zhu, P.; Burney, J. Untangling Irrigation Effects on Maize Water and Heat Stress Alleviation Using Satellite Data. Hydrol. Earth Syst. Sci. 2022, 26, 827–840. [Google Scholar] [CrossRef]
- Magyar, T.; Fehér, Z.; Buday-Bódi, E.; Tamás, J.; Nagy, A. Modeling of Soil Moisture and Water Fluxes in a Maize Field for the Optimization of Irrigation. Comput. Electron. Agric. 2023, 213, 108159. [Google Scholar] [CrossRef]
- Nagy, A.; Kiss, N.É.; Buday-Bódi, E.; Magyar, T.; Cavazza, F.; Gentile, S.L.; Abdullah, H.; Tamás, J.; Fehér, Z.Z. Precision Estimation of Crop Coefficient for Maize Cultivation Using High-Resolution Satellite Imagery to Enhance Evapotranspiration Assessment in Agriculture. Plants 2024, 13, 1212. [Google Scholar] [CrossRef] [PubMed]
- Gleason, S.M.; Wiggans, D.R.; Bliss, C.A.; Young, J.S.; Cooper, M.; Willi, K.R.; Comas, L.H. Embolized Stems Recover Overnight in Zea mays: The Role of Soil Water, Root Pressure, and Nighttime Transpiration. Front. Plant Sci. 2017, 8, 662. [Google Scholar] [CrossRef] [PubMed]
- Kis, A.; Szabó, P.; Pongrácz, R. Analysis of Detected and Future Drought Conditions—A Case Study for the Great Hungarian Plain. Theor. Appl. Climatol. 2025, 156, 303. [Google Scholar] [CrossRef]
- Hernádi, H.; Farkas, C.; Makó, A.; Máté, F. Climate Sensitivity of Soil Water Regime of Different Hungarian Chernozem Soil Subtypes. Biologia 2009, 64, 496–501. [Google Scholar]
- Berzsenyi, Z.; Lap, D.Q. Responses of Maize (Zea mays L.) Hybrids to Sowing Date, N Fertiliser and Plant Density in Different Years. Acta Agron. Hung. 2005, 53, 119–131. [Google Scholar] [CrossRef]
- Sakuratani, T. A Heat Balance Method for Measuring Water Flux in the Stem of Intact Plants. J. Agric. Meteorol. 1981, 37, 9–17. [Google Scholar] [CrossRef]
- Vandegehuchte, M.W.; Steppe, K. Sap-Flux Density Measurement Methods: Working Principles and Applicability. Funct. Plant Biol. 2013, 40, 213–223. [Google Scholar] [CrossRef] [PubMed]
- Senock, R.S.; Ham, J.M. Heat Balance Sap Flow Gauge for Small Diameter Stems. Plant Cell Environ. 1993, 16, 593–601. [Google Scholar] [CrossRef]
- Allen, R.G.; Pereira, L.S.; Raes, D.; Smith, M. Crop Evapotranspiration–Guidelines for Computing Crop Water Requirements; FAO Irrigation and Drainage Paper 56; FAO: Rome, Italy, 1998. [Google Scholar]
- Hargreaves, G.H.; Samani, Z.A. Reference Crop Evapotranspiration from Temperature. Appl. Eng. Agric. 1985, 1, 96–99. [Google Scholar] [CrossRef]
- Furlanetto, J.; Dal Ferro, N.; Longo, M.; Sartori, L.; Polese, R.; Caceffo, D.; Nicoli, L.; Morari, F. LAI Estimation through Remotely Sensed NDVI Following Hail Defoliation in Maize (Zea mays L.) Using Sentinel-2 and UAV Imagery. Precis. Agric. 2023, 24, 1355–1379. [Google Scholar] [CrossRef] [PubMed]
- Juhász, C.; Huzsvai, L.; Kovács, E.; Kovács, G.; Tuba, G.; Sinka, L.; Zsembeli, J. Carbon Dioxide Efflux of Bare Soil as a Function of Soil Temperature and Moisture Content under Weather Conditions of Warm, Temperate, Dry Climate Zone. Agronomy 2022, 12, 3050. [Google Scholar] [CrossRef]
- Kis, A.; Szabó, P.; Pongrácz, R. Spatial and Temporal Analysis of Drought-Related Climate Indices for Hungary for 1971–2100. HunGeoBull 2023, 72, 223–238. [Google Scholar] [CrossRef]
- Cammalleri, C.; Arias-Muñoz, C.; Barbosa, P.; De Jager, A.; Magni, D.; Masante, D.; Mazzeschi, M.; McCormick, N.; Naumann, G.; Spinoni, J.; et al. A Revision of the Combined Drought Indicator (CDI) Used in the European Drought Observatory (EDO). Nat. Hazards Earth Syst. Sci. 2021, 21, 481–495. [Google Scholar] [CrossRef]
- Spinoni, J.; Antofie, T.; Barbosa, P.; Bihari, Z.; Lakatos, M.; Szalai, S.; Szentimrey, T.; Vogt, J. An Overview of Drought Events in the Carpathian Region in 1961–2010. Adv. Sci. Res. 2013, 10, 21–32. [Google Scholar] [CrossRef]
- Lakatos, M.; Weidinger, T.; Hoffmann, L.; Bihari, Z.; Horváth, Á. Computation of Daily Penman–Monteith Reference Evapotranspiration in the Carpathian Region and Comparison with Thornthwaite Estimates. Adv. Sci. Res. 2020, 16, 251–259. [Google Scholar] [CrossRef]
- Bates, D.; Mächler, M.; Bolker, B.; Walker, S. Fitting Linear Mixed-Effects Models Using lme4. J. Stat. Softw. 2015, 67, 1–48. [Google Scholar] [CrossRef]
- Lenth, R.V.; Piaskowski, J. emmeans: Estimated Marginal Means, Aka Least-Squares Means; CRAN: Wien, Austria, 2017. [Google Scholar]
- Müllers, Y.; Postma, J.A.; Poorter, H.; Van Dusschoten, D. Stomatal Conductance Tracks Soil-to-Leaf Hydraulic Conductance in Faba Bean and Maize during Soil Drying. Plant Physiol. 2022, 190, 2279–2294. [Google Scholar] [CrossRef] [PubMed]
- Grossiord, C.; Buckley, T.N.; Cernusak, L.A.; Novick, K.A.; Poulter, B.; Siegwolf, R.T.W.; Sperry, J.S.; McDowell, N.G. Plant Responses to Rising Vapor Pressure Deficit. New Phytol. 2020, 226, 1550–1566. [Google Scholar] [CrossRef] [PubMed]
- Li, Y.; Zhang, P.; Sheng, W.; Zhang, Z.; Rose, R.J.; Song, Y. Securing Maize Reproductive Success under Drought Stress by Harnessing CO2 Fertilization for Greater Productivity. Front. Plant Sci. 2023, 14, 1221095. [Google Scholar] [CrossRef] [PubMed]
- Hurlbert, S.H. Pseudoreplication and the Design of Ecological Field Experiments. Ecol. Monogr. 1984, 54, 187–211. [Google Scholar] [CrossRef]
- Siphiwe, N.G.; Magyar, T.; Tamás, J.; Nagy, A. Modelling Soil Moisture Content with Hydrus 2D in a Continental Climate for Effective Maize Irrigation Planning. Agriculture 2024, 14, 1340. [Google Scholar] [CrossRef]

Disclaimer/Publisher’s Note: The statements, opinions and data contained in all publications are solely those of the individual author(s) and contributor(s) and not of MDPI and/or the editor(s). MDPI and/or the editor(s) disclaim responsibility for any injury to people or property resulting from any ideas, methods, instructions or products referred to in the content. |
© 2026 by the authors. Licensee MDPI, Basel, Switzerland. This article is an open access article distributed under the terms and conditions of the Creative Commons Attribution (CC BY) license.